UNITED STATES

SECURITIES AND EXCHANGE COMMISSION

Washington, D.C. 20549

FORM 10-K

10-K/A
(Amendment No. 1)
(Mark One)

ANNUAL REPORT PURSUANT TO SECTION 13 OR 15(d) OF THE SECURITIES EXCHANGE ACT OF 1934

FOR THE FISCAL YEAR ENDED December 31, 2023

For the fiscal year ended: December 31, 2022

OR

TRANSITION REPORT PURSUANT TO SECTION 13 OR 15(d) OF THE SECURITIES EXCHANGE ACT OF 1934

For the transition period fromCommission file number: to001-16577

Commission File Number 1-31565

NEW YORK COMMUNITY BANCORP, INC.

(Exact name of registrant as specified in its charter)

Delaware06-1377322

Delaware

06-1377322

(State or other jurisdiction

of incorporation or organization)

(I.R.S. Employer

Identification No.)

102 Duffy Avenue, Avenue, Hicksville,, New York11801

(Address of principal executive offices) (Zip code)

(Zip Code)

(516) 683-4100

(Registrant’s telephone number, including area code)code: (516) 683-4100

Securities
Shares registered pursuant to Section 12(b) of the Act:

Title of each class

Trading Symbol

Trading

Symbol(s)

Name of each exchange

on which registered

Common Stock,, $0.01 par value per share

NYCB

New York Stock Exchange

Bifurcated Option Note Unit SecuritiESSM

NYCB PU

New York Stock Exchange

Depositary Shares each representing a 1/40th40th interest in a share of Fixed-to-Floating Rate Series A Noncumulative Perpetual Preferred Stock

NYCB PA

New York Stock Exchange


Securities registered pursuant to Section 12(g) of the Act: None

Indicate by check mark if the registrant is a well-known seasoned issuer, as defined in Rule 405 of the Securities Act.Yes    Yes    No 


Indicate by check mark if the registrant is not required to file reports pursuant to Section 13 or Section 15(d) of the Act. Yes     No  ☒

Indicate by check mark whether the registrant (1) has filed all reports required to be filed by Section 13 or 15(d) of the Securities Exchange Act of 1934 during the preceding 12 months (or for such shorter period that the registrant was required to file such reports), and (2) has been subject to such filing requirements for the past 90 days. Yes   Yes      No  

Indicate by check mark whether the registrant has submitted electronically every Interactive Data File required to be submitted pursuant to Rule 405 of Regulation S-T (§232.405 of this chapter) during the preceding 12 months (or for such shorter period that the registrant was required to submit such files). Yes    Yes  ☒    No  

Indicate by check mark whether the registrant is a large accelerated filer, an accelerated filer, a non-accelerated filer, a smaller reporting company, or an emerging growth company. See the definitions of “large"large accelerated filer,” “accelerated" "accelerated filer,” “smaller" "smaller reporting company," and “emerging"emerging growth company”company" in Rule 12b-2 of the Exchange Act.

Large Accelerated Filer

Accelerated Filer

Non-Accelerated Filer

Smaller Reporting Company

Non-Accelerated Filer  

Emerging Growth Companygrowth company

If an emerging growth company, indicate by check mark if the registrant has elected not to use the extended transition period for complying with any new or revised financial accounting standards provided pursuant to Section 13(a) of the Exchange Act ☐Act.

 ☐.


Indicate by check mark whether the registrant has filed a report on and attestation to its management’smanagement's assessment of the effectiveness of its internal control over financial reporting under Section 404(b) of the Sarbanes-Oxley Act (15 U.S.C. 7262(b)) by the registered public accounting firm that prepared or issued its audit report.

If securities are registered pursuant to Section 12(b) of the Act, indicate by check mark whether the financial statements of the registrant included in the filingfiling reflect the correction of an error to previously issued financial statements.


Indicate by check mark whether any of those error corrections are restatements that required a recovery analysis of incentive-based compensation received by any of the registrant’s executive officersofficers during the relevant recovery period pursuant to §240.10D-1(b).


Indicate by check mark whether the registrant is a shell company (as defined in Rule 12b-2 of the Act).    Yes  ☐   No  

As of June 30, 2022,2023, the aggregate market value of the shares of common stock outstanding of the registrant was $wa4.2s $8.0 billion excluding 6,801,356 10,040,722 shares held by all directors and executive officers of the registrant. This figure is based on the closing price of the registrant’s common stock on June 30, 2022, $9.132023, $11.24 per share, as reported by the New York Stock Exchange.

The number of shares of the registrant’s common stock outstanding as of February 22, 2023March 11, 2024 was 797,921,126 shares.

682,901,266
DOCUMENTS INCORPORATED BY REFERENCE
shares.

Documents Incorporated by Reference

Portions of the definitive Proxy Statement for the Annual Meeting of Shareholders to be held on June 1, 2023May 17, 2024 are incorporated by reference into Part III.


EXPLANATORY NOTE


CROSS REFERENCE INDEX

Page

Cautionary Statement Regarding Forward-Looking Language

1

Glossary and Abbreviations

5

PART I

Item 1.

Business

9

Item 1A.

Risk Factors

26

Item 1B.

Unresolved Staff Comments

40

Item 2.

Properties

40

Item 3.

Legal Proceedings

41

Item 4.

Mine Safety Disclosures

41

PART II

Item 5.

Market for Registrant’s Common Equity, Related Stockholder Matters, and Issuer Purchases of Equity Securities

42

Item 6.

Reserved

44

Item 7.

Management’s Discussion and Analysis of Financial Condition and Results of Operations

45

Item 7A.

Quantitative and Qualitative Disclosures about Market Risk

72

Item 8.

Financial Statements and Supplementary Data

77

Item 9.

Changes in and Disagreements with Accountants on Accounting and Financial Disclosure

149

Item 9A.

Controls and Procedures

149

Item 9B.

Other Information

150

Item 9C.

Disclosure Regarding Foreign Jurisdictions that Prevent Inspections

150

PART III

Item 10.

Directors, Executive Officers, and Corporate Governance

151

Item 11.

Executive Compensation

151

Item 12.

Security Ownership of Certain Beneficial Owners and Management, and Related Stockholder Matters

151

Item 13.

Certain Relationships and Related Transactions, and Director Independence

152

Item 14.

Principal Accounting Fees and Services

152

PART IV

Item 15.

Exhibits and Financial Statement Schedules

153

Item 16.

Form 10-K Summary (None)

155

Signatures

156

Certifications


For the purpose of

New York Community Bancorp, Inc. (the “Company”) is filing this Amendment No. 1 (this “Amendment No. 1”) to its Annual Report on Form 10-K for the words “we,” “us,” “our,”fiscal year ended December 31, 2023 (the “Original Form 10-K”), filed with the Securities and Exchange Commission (the “SEC”) on March 14, 2024, solely to (i) amend Exhibits 31.1, 31.2 and 32.0, the “Company” are used to refer to New York Community Bancorp, Inc.certifications required under Sections 302 and our consolidated subsidiary, Flagstar Bank, N.A. (the “Bank”).

CAUTIONARY STATEMENT REGARDING FORWARD-LOOKING LANGUAGE

This report, like many written and oral communications presented by New York Community Bancorp, Inc. and our authorized officers, may contain certain forward-looking statements regarding our prospective performance and strategies within the meaning of Section 27A906 of the SecuritiesSarbanes-Oxley Act of 1933,2002, which were filed without conformed electronic signatures with the Original Form 10-K, to correct a typographical error and include the omitted conformed electronic signatures and (ii) amend the PCAOB identification number for KPMG LLP referenced in the index to Item 8A. There are no other changes to the Original Form 10-K.


Except as amended,described above, this Amendment No. 1 does not modify or update in any way the financial statements or disclosures made, or any exhibits included or incorporated by reference, in the Original Form 10-K and Section 21Edoes not reflect events occurring after the filing of the Securities Exchange ActOriginal Form 10-K.


NEW YORK COMMUNITY BANCORP, INC.
FORM 10-K
FOR THE FISCAL YEAR ENDED December 31, 2023
TABLE OF CONTENTS
ITEM 1.
ITEM 1A.
ITEM 1B.
ITEM 1C.
ITEM 2.
ITEM 3.
ITEM 4.
ITEM 5.
ITEM 6.
ITEM 7.
ITEM 7A.
ITEM 8.
ITEM 9.
ITEM 9A.
ITEM 9B.
ITEM 9C.
ITEM 10.
ITEM 11.
ITEM 12.
ITEM 13.
ITEM 14.
ITEM 15.
ITEM 16.

4


GLOSSARY OF ABBREVIATIONS AND ACRONYMS

The following list of 1934,abbreviations and acronyms are provided as amended. We intend such forward-looking statements toa tool for the reader and may be covered by the safe harbor provisions for forward-looking statements contained in the Private Securities Litigation Reform Act of 1995, and are includingused throughout this statement for purposes of said safe harbor provisions.

Forward-looking statements, which are based on certain assumptions and describe future plans, strategies, and expectations of the Company, are generally identified by use of the words “anticipate,” “believe,” “estimate,” “expect,” “intend,” “plan,” “project,” “seek,” “strive,” “try,” or future or conditional verbs such as “will,” “would,” “should,” “could,” “may,” or similar expressions. Although we believe that our plans, intentions, and expectations as reflected in these forward-looking statements are reasonable, we can give no assurance that they will be achieved or realized.

Our ability to predict results or the actual effects of our plans and strategies is inherently uncertain. Accordingly, actual results, performance, or achievements could differ materially from those contemplated, expressed, or implied by the forward-looking statements contained in this report.

There are a number of factors, many of which are beyond our control, that could cause actual conditions, events, or results to differ significantly from those described in our forward-looking statements. These factors include, but are not limited to:

general economic conditions, including higher inflation and its impacts, either nationally or in some or all of the areas in which we and our customers conduct our respective businesses;
conditions in the securities markets and real estate markets or the banking industry;
changes in real estate values, which could impact the quality of the assets securing the loans in our portfolio;
changes in interest rates, which may affect our net income, prepayment penalty income, and other future cash flows, or the market value of our assets, including our investment securities;
any uncertainty relating to the LIBOR transition process;
changes in the quality or composition of our loan or securities portfolios;
changes in our capital management policies, including those regarding business combinations, dividends, and share repurchases, among

others;
heightened regulatory focus on commercial real estate loan concentrations;
changes in competitive pressures among financial institutions or from non-financial institutions;
changes in deposit flows and wholesale borrowing facilities;
changes in the demand for deposit, loan, and investment products and other financial services in the markets we serve;
our timely development of new lines of business and competitive products or services in a changing environment, and the acceptance of such products or services by our customers;

1


our ability to obtain timely shareholder and regulatory approvals of any merger transactions or corporate restructurings we may propose, including timely obtaining regulatory approvals for our pending acquisition of Flagstar Bancorp, Inc.;
our ability to successfully integrate any assets, liabilities, customers, systems, and management personnel we may acquire into our operations, and our ability to realize related revenue synergies and cost savings within expected time frames,Report, including the pending acquisition of Flagstar Bancorp, Inc.;Consolidated Financial Statements and Notes:

TermDefinitionTermDefinition
ACLAllowance for Credit LossesFHLB-NYFederal Home Loan Bank of New York
ADCAcquisition, development, and construction loanFOMCFederal Open Market Committee
ALCOAsset and Liability Management CommitteeFRBFederal Reserve Board
AOCLAccumulated other comprehensive lossFRB-NYFederal Reserve Bank of New York
ASCAccounting Standards CodificationFTEsFull-time equivalent employees
ASUAccounting Standards UpdateGAAPU.S. generally accepted accounting principles
BaaSBanking as a ServiceGLBAThe Gramm Leach Bliley Act
BOLIBank-owned life insuranceGNMAGovernment National Mortgage Association
BPBasis point(s)GSEGovernment-sponsored enterprises
BTFPBank Term Funding ProgramHELOCHome Equity Line of Credit
C&ICommercial and industrial loanHELOANHome Equity Loan
CDsCertificates of depositHPIHousing Price Index
CECLCurrent Expected Credit LossLGGLoans with government guarantees
CFPBConsumer Financial Protection BureauLHFSLoans Held-for-Sale
CMOsCollateralized mortgage obligationsLIBORLondon Interbank Offered Rate
CMTConstant maturity treasury rateLTVLoan-to-value ratio
CPIConsumer Price IndexMBSMortgage-backed securities
CPRConstant prepayment rateMSRsMortgage servicing rights
CRACommunity Reinvestment ActNIMNet interest margin
CRECommercial real estate loanNOLNet operating loss
DIFDeposit Insurance FundNPAsNon-performing assets
DFADodd-Frank Wall Street Reform and Consumer Protection ActNPLsNon-performing loans
DSCRDebt service coverage ratioNPVNet Portfolio Value
EPSEarnings per common shareNYSENew York Stock Exchange
ERMEnterprise Risk ManagementOCCOffice of the Comptroller of the Currency
ESOPEmployee Stock Ownership PlanOREOOther real estate owned
EVEEconomic Value of Equity at RiskPAAPurchase accounting adjustments
Fannie MaeFederal National Mortgage AssociationPSAsPerformance-Based Restricted Stock Units
FASBFinancial Accounting Standards BoardROURight of use asset
FDI ActFederal Deposit Insurance ActRSAsRestricted Stock Awards
FDICFederal Deposit Insurance CorporationSBASmall Business Administration
FHAFederal Housing AdministrationSignatureSignature Bridge Bank, N.A.
FHFAFederal Housing Finance AgencySECU.S. Securities and Exchange Commission
FHLBFederal Home Loan BankSOFRSecured Overnight Financing Rate
Freddie MacFederal Home Loan Mortgage CorporationTDRTroubled debt restructurings

5


potential exposure to unknown or contingent liabilities of companies we have acquired, may acquire, or target for acquisition, including the pending acquisition of Flagstar Bancorp, Inc.;
the success of our previously announced investment in, and partnership with, Figure Technologies, Inc., a FinTech company focusing on payment and lending via blockchain technology;
GLOSSARY
the ability to invest effectively in new information technology systems and platforms;
changes in future allowance for credit losses requirements under relevant accounting and regulatory requirements;
the ability to pay future dividends at currently expected rates;
the ability to hire and retain key personnel;
the ability to attract new customers and retain existing ones in the manner anticipated;
changes in our customer base or in the financial or operating performances of our customers’ businesses;
any interruption in customer service due to circumstances beyond our control;
the outcome of pending or threatened litigation, or of matters before regulatory agencies, whether currently existing or commencing in the future;
environmental conditions that exist or may exist on properties owned by, leased by, or mortgaged to the Company;
any interruption or breach of security resulting in failures or disruptions in customer account management, general ledger, deposit, loan, or other systems;
operational issues stemming from, and/or capital spending necessitated by, the potential need to adapt to industry changes in information technology systems, on which we are highly dependent;
the ability to keep pace with, and implement on a timely basis, technological changes;
changes in legislation, regulation, policies, or administrative practices, whether by judicial, governmental, or legislative action, and other changes pertaining to banking, securities, taxation, rent regulation and housing (the New York Housing Stability and Tenant Protection Act of 2019), financial accounting and reporting, environmental protection, insurance, and the ability to comply with such changes in a timely manner;
changes in the monetary and fiscal policies of the U.S. Government, including policies of the U.S. Department of the Treasury and the Board of Governors of the Federal Reserve System;
changes in accounting principles, policies, practices, and guidelines;
changes in regulatory expectations relating to predictive models we use in connection with stress testing and other forecasting or in the assumptions on which such modeling and forecasting are predicated;
changes to federal, state, and local income tax laws;
changes in our credit ratings or in our ability to access the capital markets;
increases in our FDIC insurance premium;
legislative and regulatory initiatives related to climate change;

2


the potential impact to the Company from climate change, including higher regulatory compliance, increased expenses, operational changes, and reputational risks;
unforeseen or catastrophic events including natural disasters, war, terrorist activities, and the emergence of a pandemic;
the impacts related to or resulting from Russia’s military action in Ukraine, including the broader impacts to financial markets and the global macroeconomic and geopolitical environment;
the effects of COVID-19, which includes, but are not limited to, the length of time that the pandemic continues, the effectiveness and acceptance of the COVID-19 vaccination program, the potential imposition of further restrictions on business operations and/or travel or movement in the future, the remedial actions and stimulus measures adopted by federal, state, and local governments, the health of our employees and the inability of employees to work due to illness, quarantine, or government mandates, the business continuity plans of our customers and our vendors, the increased likelihood of cybersecurity risk, data breaches, or fraud due to employees working from home, the ability of our borrowers to continue to repay their loan obligations, the lack of property transactions and asset sales, potential impact on collateral values, and the effect of the pandemic on the general economy and businesses of our borrowers; and
other economic, competitive, governmental, regulatory, technological, and geopolitical factors affecting our operations, pricing, and services.

In addition, the timing and occurrence or non-occurrence of events may be subject to circumstances beyond our control.

Furthermore, on an ongoing basis, we evaluate opportunities to expand through mergers and acquisitions and opportunities for strategic combinations with other banking organizations. Our evaluation of such opportunities involves discussions with other parties, due diligence, and negotiations. As a result, we may decide to enter into definitive arrangements regarding such opportunities at any time.

In addition to the risks and challenges described above, these types of transactions involve a number of other risks and challenges, including:

the ability to successfully integrate branches and operations and to implement appropriate internal controls and regulatory functions relating to such activities;
the ability to limit the outflow of deposits, and to successfully retain and manage any loans;
the ability to attract new deposits, and to generate new interest-earning assets, in geographic areas that have not been previously served;
the success in deploying any liquidity arising from a transaction into assets bearing sufficiently high yields without incurring unacceptable credit or interest rate risk;
the ability to obtain cost savings and control incremental non-interest expense;
the ability to retain and attract appropriate personnel;
the ability to generate acceptable levels of net interest income and non-interest income, including fee income, from acquired operations;
the diversion of management’s attention from existing operations;
the ability to address an increase in working capital requirements; and
limitations on the ability to successfully reposition our post-merger balance sheet when deemed appropriate.

3


See Part I, Item 1A, “Risk Factors” in this annual report and in our other SEC filings for a further discussion of important risk factors that could cause actual results to differ materially from our forward-looking statements.

Readers should not place undue reliance on these forward-looking statements, which reflect our expectations only as of the date of this report. We do not assume any obligation to revise or update these forward-looking statements except as may be required by law.

4


GLOSSARY

BARGAIN PURCHASE GAIN


The amount by which the fair value of assets purchased exceeds the fair value of liabilities assumed and consideration given.

BASIS POINT

Throughout this filing, the year-over-year changes that occur in certain financial measures are reported in terms of basis points. Each basis point is equal to one hundredth of a percentage point, or 0.01 percent.

BOOK VALUE PER COMMON SHARE

Book value per common share refers to the amount of common stockholders’ equity attributable to each outstanding share of common stock, and is calculated by dividing total stockholders’ equity less preferred stock at the end of a period, by the number of shares outstanding at the same date.

BROKERED DEPOSITS

Refers to funds obtained, directly or indirectly, by or through deposit brokers that are then deposited into one or more deposit accounts at a bank.

CHARGE-OFF

CHARGE-OFF

Refers to the amount of a loan balance that has been written off against the allowance for credit losses.

COMMERCIAL REAL ESTATE LOAN

A mortgage loan secured by either an income-producing property owned by an investor and leased primarily for commercial purposes or, to a lesser extent, an owner-occupied building used for business purposes. The CRE loans in our portfolio are typically secured by either office buildings, retail shopping centers, light industrial centers with multiple tenants, or mixed-use properties.

COST OF FUNDS

The interest expense associated with interest-bearing liabilities, typically expressed as a ratio of interest expense to the average balance of interest-bearing liabilities for a given period.

CRE CONCENTRATION RATIO

Refers to the sum of multi-family, non-owner occupied CRE, and acquisition, development, and construction (“ADC”) loans divided by total risk-based capital.

DEBT SERVICE COVERAGE RATIO

An indication of a borrower’s ability to repay a loan, the DSCR generally measures the cash flows available to a borrower over the course of a year as a percentage of the annual interest and principal payments owed during that time.

DERIVATIVE

DERIVATIVE

A term used to define a broad base of financial instruments, including swaps, options, and futures contracts, whose value is based upon, or derived from, an underlying rate, price, or index (such as interest rates, foreign currency, commodities, or prices of other financial instruments such as stocks or bonds).

5


EFFICIENCY RATIO

Measures total operating expenses as a percentage of the sum of net interest income and non-interest income.


6


GOODWILL

Refers to the difference between the purchase price and the fair value of an acquired company’s assets, net of the liabilities assumed. Goodwill is reflected as an asset on the balance sheet and is tested at least annually for impairment.impairment or when triggering events are identified.

GOVERNMENT-SPONSORED ENTERPRISES

Refers to a group of financial services corporations that were created by the United States Congress to enhance the availability, and reduce the cost of, credit to certain targeted borrowing sectors, including home finance. The GSEs include, but are not limited to, the Federal National Mortgage Association (“Fannie Mae”), the Federal Home Loan Mortgage Corporation (“Freddie Mac”), and the Federal Home Loan Banks (the “FHLBs”).

GSE OBLIGATIONS

Refers to GSE mortgage-related securities (both certificates and collateralized mortgage obligations) and GSE debentures.

INTEREST RATE SENSITIVITY

Refers to the likelihood that the interest earned on assets and the interest paid on liabilities will change as a result of fluctuations in market interest rates.

INTEREST RATE SPREAD

The difference between the yield earned on average interest-earning assets and the cost of average interest-bearing liabilities.

LOAN-TO-VALUE RATIO

Measures the balance of a loan as a percentage of the appraised value of the underlying property.

MULTI-FAMILY LOAN

A mortgage loan secured by a rental or cooperative apartment building with more than four units.

NET INTEREST INCOME

The difference between the interest income generated by loans and securities and the interest expense produced by deposits and borrowed funds.

NET INTEREST MARGIN

Measures net interest income as a percentage of average interest-earning assets.

NON-ACCRUAL LOAN

A loan generally is classified as a “non-accrual” loan when it is 90 days or more past due or when it is deemed to be impaired because we no longer expect to collect all amounts due according to the contractual terms of the loan agreement. When a loan is placed on non-accrual status, we cease the accrual of interest owed, and previously accrued interest is reversed and charged against interest income. A loan generally is returned to accrual status when the loan is current and we have reasonable assurance that the loan will be fully collectible.

6


NON-PERFORMING LOANS AND ASSETS

Non-performing loans consist of non-accrual loans and loans that are 90 days or more past due and still accruing interest. Non-performing assets consist of non-performing loans, OREO and other repossessed assets.


7


OREO AND OTHER REPOSSESSED ASSETS

Includes real estate owned by the Company which was acquired either through foreclosure or default. Repossessed assets are similar, except they are not real estate-related assets.

RENT-REGULATED APARTMENTS

In New York City, where the vast majority of the properties securing our multi-family loans are located, the amount of rent that tenants may be charged on the apartments in certain buildings is restricted under rent-stabilization laws. Rent-stabilized apartments are generally located in buildings with six or more units that were built between February 1947 and January 1974. Rent-regulated apartments tend to be more affordable to live in because of the applicable regulations, and buildings with a preponderance of such rent-regulated apartments are therefore less likely to experience vacancies in times of economic adversity.

TROUBLED DEBT RESTRUCTURINGMODIFICATION

A loan for which the terms have been modified resulting in a concession, and for which the borrower is experiencing financial difficulties.

WHOLESALE BORROWINGS

Refers to advances drawn by the Bank against its line(s) of credit with the FHLBs, their repurchase agreements with the FHLBs and various brokerage firms, and federal funds purchased.

YIELD

YIELD

The interest income associated with interest-earning assets, typically expressed as a ratio of interest income to the average balance of interest-earning assets for a given period.

8


For the purpose of this Annual Report on Form 10-K, the words “we,” “us,” “our,” and the “Company” are used to refer to New York Community Bancorp, Inc. and our consolidated subsidiary, Flagstar Bank, N.A. (the “Bank”).

CAUTIONARY STATEMENT REGARDING FORWARD-LOOKING LANGUAGE
This report, like many written and oral communications presented by New York Community Bancorp, Inc. and our authorized officers, may contain certain forward-looking statements regarding our prospective performance and strategies within the meaning of Section 27A of the Securities Act of 1933, as amended, and Section 21E of the Securities Exchange Act of 1934, as amended. We intend such forward-looking statements to be covered by the safe harbor provisions for forward-looking statements contained in the Private Securities Litigation Reform Act of 1995, and are including this statement for purposes of said safe harbor provisions.

Forward-looking statements, which are based on certain assumptions and describe future plans, strategies, and expectations of the Company, are generally identified by use of the words “anticipate,” “believe,” “estimate,” “expect,” “intend,” “plan,” “project,” “seek,” “strive,” “try,” or future or conditional verbs such as “will,” “would,” “should,” “could,” “may,” or similar expressions. Although we believe that our plans, intentions, and expectations as reflected in these forward-looking statements are reasonable, we can give no assurance that they will be achieved or realized.

Our ability to predict results or the actual effects of our plans and strategies is inherently uncertain. Accordingly, actual results, performance, or achievements could differ materially from those contemplated, expressed, or implied by the forward-looking statements contained in this report.

There are a number of factors, many of which are beyond our control, that could cause actual conditions, events, or results to differ significantly from those described in our forward-looking statements. These factors include, but are not limited to:

general economic conditions, including higher inflation and its impacts, either nationally or in some or all of the areas in which we and our customers conduct our respective businesses;

7


LIST OF ABBREVIATIONS AND ACRONYMSconditions in the securities markets and real estate markets or the banking industry;

changes in real estate values, which could impact the quality of the assets securing the loans in our portfolio;
changes in interest rates, which may affect our net income, prepayment penalty income, and other future cash flows, or the market value of our assets, including our investment securities;
changes in the quality or composition of our loan or securities portfolios;
changes in our capital management policies, including those regarding business combinations, dividends, and share repurchases, among others;
heightened regulatory focus on commercial real estate and on commercial real estate loan concentrations;
changes in competitive pressures among financial institutions or from non-financial institutions;
changes in deposit flows and wholesale borrowing facilities;
changes in the demand for deposit, loan, and investment products and other financial services in the markets we serve;
our timely development of new lines of business and competitive products or services in a changing environment, and the acceptance of such products or services by our customers;
our ability to obtain timely stockholder and regulatory approvals of any merger transactions, capital raise transactions, corporate restructurings or other significant transactions we may propose;
our ability to successfully integrate any assets, liabilities, customers, systems, and management personnel we may acquire into our operations, and our ability to realize related synergies and cost savings within expected time frames, including those related to our recent acquisition of Flagstar Bancorp, Inc. and the purchase and assumption of certain assets and liabilities of Signature Bridge Bank;
changes in the estimated fair value of the assets or final settlement with the FDIC that we recorded in connection with the purchase, assumption and ongoing servicing of certain assets and liabilities of Signature Bridge Bank;
potential exposure to unknown or contingent liabilities of companies we have acquired, may acquire, or target for acquisition, including our recent acquisition of Flagstar Bancorp, Inc. and the purchase and assumption of certain assets and liabilities of Signature Bridge Bank;
the ability to invest effectively in new information technology systems and platforms;
the more stringent regulatory framework and prudential standards we are subject to, including with respect to reporting, capital stress testing, and liquidity risk management, as a result of our transition to a Category IV banking organization, and the expenses we will incur to develop policies, programs, and systems that comply with these enhanced standards;
changes in future allowance for credit losses requirements under relevant accounting and regulatory requirements;

9


the ability to pay future dividends, including as a result of the failure to receive any required regulatory approval to pay a dividend, or for any other reasons;
the ability to hire and retain key personnel and qualified members of our board of directors;
the ability to attract new customers and retain existing ones in the manner anticipated;
changes in our customer base or in the financial or operating performances of our customers’ businesses;
any interruption in customer service due to circumstances beyond our control;
the outcome of pending or threatened litigation, or of investigations or any other matters before regulatory agencies, whether currently existing or commencing in the future, including with respect to any litigation, investigation or other regulatory actions related to (i) the business practices of acquired companies, including our recent acquisition of Flagstar Bancorp, Inc. and the purchase and assumption of certain assets and liabilities of Signature Bridge Bank and (ii) the capital raise transaction we completed in March of 2024;
environmental conditions that exist or may exist on properties owned by, leased by, or mortgaged to the Company;
cybersecurity incidents, including any interruption or breach of security resulting in failures or disruptions in customer account management, general ledger, deposit, loan, or other systems managed either by us or third parties;
operational issues stemming from, and/or capital spending necessitated by, the potential need to adapt to industry changes in information technology systems, on which we are highly dependent;
the ability to keep pace with, and implement on a timely basis, technological changes;
changes in legislation, regulation, policies, guidance, or administrative practices, whether by judicial, governmental, or legislative action, and other changes pertaining to banking, securities, taxation, rent regulation and housing (the New York Housing Stability and Tenant Protection Act of 2019), financial accounting and reporting, environmental protection, insurance, and the ability to comply with such changes in a timely manner;
changes in the monetary and fiscal policies of the U.S. Government, including policies of the U.S. Department of the Treasury and the Board of Governors of the Federal Reserve System;
changes in accounting principles, policies, practices, and guidelines;
changes in regulatory expectations relating to predictive models we use in connection with stress testing and other forecasting or in the assumptions on which such modeling and forecasting are predicated;
changes to federal, state, and local income tax laws;
changes in our credit ratings or in our ability to access the capital markets;
increases in our FDIC insurance premium;
legislative and regulatory initiatives related to climate change;
the potential impact to the Company from climate change, including higher regulatory compliance, increased expenses, operational changes, and reputational risks;
unforeseen or catastrophic events including natural disasters, war, terrorist activities, and pandemics, epidemics, and other health emergencies;
the impacts related to or resulting from Russia’s military action in Ukraine and conflicts in the Middle East, including the broader impacts to financial markets and the global macroeconomic and geopolitical environment; and
other economic, competitive, governmental, regulatory, technological, and geopolitical factors affecting our operations, pricing, and services.

In addition, the timing and occurrence or non-occurrence of events may be subject to circumstances beyond our control.

Furthermore, on an ongoing basis, we evaluate opportunities to expand through mergers and acquisitions and opportunities for strategic combinations with other banking organizations. Our evaluation of such opportunities involves discussions with other parties, due diligence, and negotiations. As a result, we may decide to enter into definitive arrangements regarding such opportunities at any time.

In addition to the risks and challenges described above, these types of transactions involve a number of other risks and challenges, including:

the ability to successfully integrate branches and operations and to implement appropriate internal controls and regulatory functions relating to such activities;
the ability to limit the outflow of deposits, and to successfully retain and manage any loans;
the ability to attract new deposits, and to generate new interest-earning assets, in geographic areas that have not been previously served;
our ability to effectively manage liquidity, including our success in deploying any liquidity arising from a transaction into assets bearing sufficiently high yields without incurring unacceptable credit or interest rate risk;
the ability to obtain cost savings and control incremental non-interest expense;
the ability to retain and attract appropriate personnel;

10


the ability to generate acceptable levels of net interest income and non-interest income, including fee income, from acquired operations;
the diversion of management’s attention from existing operations;
the ability to address an increase in working capital requirements; and
limitations on the ability to successfully reposition our post-merger balance sheet when deemed appropriate.

See Part I, Item 1A, "Risk Factors", in this annual report and in our other SEC filings for a further discussion of important risk factors that could cause actual results to differ materially from our forward-looking statements.

Readers should not place undue reliance on these forward-looking statements, which reflect our expectations only as of the date of this report. We do not assume any obligation to revise or update these forward-looking statements except as may be required by law.

11


PART I

ACL—Allowance for Credit LossesItem 1.

Business

FHLB-NY—Federal Home Loan Bank of New York

ADC—Acquisition, development, and construction loan

FOAL—Fallout-Adjusted Locks

ALCO—Asset and Liability Management Committee

FOMC—Federal Open Market Committee

AMT—Alternative minimum tax

FRB—Federal Reserve Board

AOCL—Accumulated other comprehensive loss

FRB-NY—Federal Reserve Bank of New York

ASC—Accounting Standards Codification

Freddie Mac—Federal Home Loan Mortgage Corporation

ASU—Accounting Standards Update

FTEs—Full-time equivalent employees

BaaS—Banking as a Service

GAAP—U.S. generally accepted accounting principles

BOLI—Bank-owned life insurance

GLBA—The Gramm Leach Bliley Act

BP—Basis point(s)

GNMA—Government National Mortgage Association

CARES Act – Coronavirus Aid, Relief, and Economic Security Act

GSE—Government-sponsored enterprises

C&I—Commercial and industrial loan

HOLA—Home Owners Loan Act

CDs—Certificates of deposit

HPI—Housing Price Index

CECL—Current Expected Credit Loss

LGG - Loans with government guarantees

CFPB—Consumer Financial Protection Bureau

LHFS—Loans Held-for-Sale

CMOs—Collateralized mortgage obligations

LIBOR—London Interbank Offered Rate

CMT—Constant maturity treasury rate

LTV—Loan-to-value ratio

CPI—Consumer Price Index

MBS—Mortgage-backed securities

CPR—Constant prepayment rate

MSRs—Mortgage servicing rights

CRA—Community Reinvestment Act

NIM—Net interest margin

CRE—Commercial real estate loan

NOL—Net operating loss

DIF—Deposit Insurance Fund

NPAs—Non-performing assets

DFA—Dodd-Frank Wall Street Reform and Consumer Protection Act

NPLs—Non-performing loans

DSCR - Debt service coverage ratio

NPV—Net Portfolio Value

EAR—Earnings at Risk

NYSE—New York Stock Exchange

EPS—Earnings per common share

OCC—Office of the Comptroller of the Currency

ERM—Enterprise Risk Management

OFAC—Office of Foreign Assets Control

ESOP—Employee Stock Ownership Plan

OREO—Other real estate owned

EVE—Economic Value of Equity at Risk

OTTI—Other-than-temporary impairment

Fannie Mae—Federal National Mortgage Association

PAA - Purchase accounting adjustments

FASB—Financial Accounting Standards Board

PPP—Paycheck Protection Program administered by the Small Business Administration

FCA—the United Kingdom's Financial Conduct Authority

ROU—Right of use asset

FDI Act—Federal Deposit Insurance Act

SEC—U.S. Securities and Exchange Commission

FDIC—Federal Deposit Insurance Corporation

SIFI—Systemically Important Financial Institution

FHA—Federal Housing Administration

SOFR—Secured Overnight Financing Rate

FHFA—Federal Housing Finance Agency

TDR—Troubled debt restructurings

FHLB—Federal Home Loan Bank

TILA-RESPA—Truth in Lending ACT-Real Estate Settlement Procedures Act


General
8


PART I

ITEM 1. BUSINESS

General

New York Community Bancorp, Inc., (on a stand-alone basis, the “Parent Company” or, collectively with its subsidiaries, the “Company”) is the bank holding company for Flagstar Bank, N.A. (hereinafter referred to as the “Bank”). The Company went public in 1993 and has grown organically and through a series of accretive mergers and acquisitions, culminating in its recent acquisition of Flagstar Bancorp, Inc. (“Flagstar” or “Flagstar Bancorp”), which closed on December 1, 2022.acquisitions. Effective as of December 1, 2022, in connection with the Parent Company’s acquisition of Flagstar Bancorp, (i) Flagstar Bank, FSB converted to a national bank to be known as “Flagstar Bank, N.A.” and (ii) New York Community Bank was merged with and into Flagstar Bank N.A., with Flagstar Bank N.A. continuing as the surviving entity.

New York Community Bancorp, Inc. has market-leading positions in several national businesses, including multi-family lending, mortgage originations and servicing, and warehouse lending. The Company is the second-largest2nd largest multi-family portfolio lender in the country and the leading multi-family portfolio lender in the New York City market area, where it specializes in rent-regulated, non-luxury apartment buildings. Flagstar Mortgage is the 8th7th largest bank originator of residential mortgages for the 12-months ended December 31, 2022,2023, while we are the industry’s 6th5th largest sub-servicer of mortgage loans nationwide, servicing 1.4 million accounts with $346$382.2 billion in unpaid principal balances as of December 31, 2022.2023. Additionally, the Company is the 2nd largest mortgage warehouse lender nationally based on total commitments.

Online Information about the Company and the Bank

We serve our customers through our website: www.myNYCB.com.www.flagstar.com. In addition to providing our customers with 24-hour access to their accounts, and information regarding our products and services, hours of service, and locations, the website provides extensive information about the Company for the investment community. Earnings releases, dividend announcements, and other press releases are posted upon issuance to the Investor Relations portion of the website, which can be found at www.ir.myNYCB.com.

In addition, our filings with the SEC (including our annual report on Form 10-K; our quarterly reports on Form 10-Q; and our current reports on Form 8-K), and all amendments to those reports filed or furnished pursuant to Section 13(a) or 15(d) of the Securities Exchange Act of 1934, are available without charge, and are posted to the Investor Relations portion of our website. The website also provides information regarding our Board of Directors and management team, as well as certain Board Committee charters and our corporate governance policies. The content of our website shall not be deemed to be incorporated by reference into this Annual Report.

Our Market

Flagstar Bank, N.A. operates 395420 branches across nine states, including strong footholds in the Northeast and Midwest and has exposure to high growth markets in the Southeast and on the West Coast. Flagstar Mortgage operates nationally through a wholesale network of approximately 3,000 third-party mortgage originators. In addition, the Bank has 134 private banking teams located in over 10 cities in the metropolitan New York City region and on the West Coast, which serve the needs of high-net worth individuals and their businesses.

The market for the loans we produce varies, depending on the type of loan. For example, the vast majority of our multi-family loans are collateralized by rental apartment buildings in New York City, while the majority of the properties collateralizing our CRE and ADC loans are located in the Northeast and Midwest. Our specialty finance loans and leases are generally made to large corporate obligors that participate in stable industries nationwide and our warehouse loans are made to mortgage lenders across the country.

9


Competition for Deposits

We compete for deposits and customers by placing an emphasis on convenience and service and, from time to time, by offering specific products at competitive rates. In addition to our 395420 branches, we have 524 385 ATM locations that operate 24 hours a day.day. Our customers also have 24-hour access to their accounts through our mobile banking app, online through our website, www.myNYCB.comwww.flagstar.com, or through our bank-by-phone service. We also offer certain money market accounts, certificates of deposit and checking accounts through a dedicated website: www.myBankingDirect.com.


12


In addition to checking and savings accounts, retirement accounts, and CDs for both businesses and consumers, we offer a suite of cash management products to address the needs of small and mid-size businesses and professional associations. We also compete by complementing our broad selection of traditional banking products with an extensive menu of non-deposit investment products and insurance through a relationship with a third-party broker dealer and insurance agency.

Our ability to attract and retain deposits is not only a function of short-term interest rates and industry consolidation, but also the competitiveness of the rates being offered by other financial institutions within our marketplace, including credit unions, on-lineonline banks, and brokerage firms. Additionally, financial technology companies, also referred to as FinTechs, are providing nontraditional, but increasingly strong competition for deposits and customers.

Competition for deposits is also influenced by several internal factors, including the opportunity to assume or acquire deposits through business combinations; the cash flows produced through loan and securities repayments and sales; and the availability of attractively priced wholesale funds. In addition, the degree to which we seek to compete for deposits is influenced by the liquidity needed to fund our loan production and other outstanding commitments.

Competition for Commercial and Consumer Loans and Servicing

Our success as a lender is substantially tied to the economic health of the markets where we lend. Local economic conditions have a significant impact on loan demand, the value of the collateral securing our credits, and the ability of our borrowers to repay their loans.

The competition we face for loans also varies with the type of loan we are originating. In New York City, where the majority of the buildings collateralizing our multi-family loans are located, we compete for such loans on the basis of timely service and the expertise that stems from being a specialist in this lending niche. In addition to the money center, regional, and local banks we compete with in this market, we compete with insurance companies and other types of lenders. Certain of the banks we compete with sell the loans they produce to Fannie Mae and Freddie Mac.

Our ability to compete for CRE loans depends on the same factors that impact our ability to compete for multi-family credits, and the degree to which other CRE lenders choose to offer loan products similar to ours.

Competition for our specialty finance loans, which consist primarily of asset-based, equipment financing, and dealer floor plan loans, is driven by a variety of factors, including prevailing economic conditions and the level of interest rates. Moreover, since a majority of our customers in this category are mid-to-large size publicly traded companies, we also face competition for financing from the capital markets. In addition, the majority of specialty finance loans that we originate are sourced from larger financial institutions who have many customers for these loans. Some of these customers are larger and have more capital and liquidity than the Company.

While we continue to originate ADC and C&I loans for investment, such loans represent a small portion of our loan portfolio as compared to multi-family, CRE loans, and specialty finance loans.

From a lending perspective, we compete with many institutions including commercial banks, national mortgage lenders, local savings banks, financial technology companies, credit unions and commercial lenders offering mortgage loans and other consumer loans.

10


In servicing, we compete primarily against non-bank servicers. The subservicing market in which we operate is also highly competitive and we face competition related to subservicing pricing and service delivery. We compete by offering quality servicing, a robust risk and compliance infrastructure and a model where our mortgage business allows for recapture services to replenish loans for subservicing clients.

Monetary Policy

The Company and the Bank are affected by fiscal and monetary policies of the federal government, including those of the FRB which regulates the national money supply in order to mitigate recessionary and inflationary pressures. Among the techniques available to the FRB are engaging in open market transactions of U.S. Government securities, changing the discount rate and changing reserve requirements against bank deposits. These techniques are used in varying combinations to influence the overall growth of bank loans, investments, and deposits. Their use may also affect interest rates charged on loans and paid on deposits. The effect of government policies on the earnings of the Company and the Bank cannot be predicted.


13


Environmental Issues

We encounter certain environmental risks in our lending activities and other operations. The existence of hazardous materials may make it unattractive for a lender to foreclose on the properties securing its loans. In addition, under certain conditions, lenders may become liable for the costs of cleaning up hazardous materials found on such properties. We attempt to mitigate such environmental risks by requiring either that a borrower purchase environmental insurance or that an appropriate environmental site assessment be completed as part of our underwriting review on the initial granting of CRE and ADC loans, regardless of location, and of any out-of-state multi-family loans we may produce. Depending on the results of an assessment, appropriate measures are taken to address the identified risks. In addition, we order an updated environmental analysis prior to foreclosing on such properties, and typically hold foreclosed multi-family, CRE, and ADC properties in subsidiaries.

Our attention to environmental risks also applies to the properties and facilities that house our bank operations. Prior to acquiring a large-scale property, a Phase 1 Environmental Property Assessment is typically performed by a licensed professional engineer to determine the integrity of, and/or the potential risk associated with, the facility and the property on which it is built. Properties and facilities of a smaller scale are evaluated by qualified in-house assessors, as well as by industry experts in environmental testing and remediation. This two-pronged approach identifies potential risks associated with asbestos-containing material, above and underground storage tanks, radon, electrical transformers (which may contain PCBs), ground water flow, storm and sanitary discharge, and mold, among other environmental risks. These processes assist us in mitigating environmental risk by enabling us to identify and address potential issues, including by avoiding taking ownership or control of contaminated properties.

Subsidiary Activities

We conduct business primarily through our wholly-owned bank subsidiary, Flagstar Bank, N.A. The Bank has formed, or acquired through merger transactions, 3339 active subsidiary corporations.subsidiaries. Of these, 2126 are direct subsidiaries of the Bank and 1213 are subsidiaries of Bank-owned entities.

The 21Parent Company also has four direct subsidiaries of the(including Flagstar Bank, are:

Name

Jurisdiction of Organization

Purpose

100 Duffy Realty, LLC

New York

Owns a building containing back-office and a branch.

Beta Investments, Inc.

Delaware

Holding company for Omega Commercial Mortgage Corp. and Long Island Commercial Capital Corp.

BSR 1400 Corp.

New York

Organized to own interests in real estate.

Ferry Development Holding Company

Delaware

Formed to hold and manage investment portfolios for the Company.

NYCB Specialty Finance Company, LLC

Delaware

Originates asset-based, equipment financing, and dealer-floor plan loans.

11


NYB Realty Holding Company, LLC

New York

Holding company for subsidiaries owning an interest in real estate.

NYCB Insurance Agency, Inc.

New York

Sells non-deposit investment products.

Pacific Urban Renewal, Inc.

New Jersey

Owns a branch building.

Synergy Capital Investments, Inc.

New Jersey

Formed to hold and manage investment portfolios for the Company.

NYCB Mortgage Company, LLC

Delaware

Holding company for Walnut Realty Holding Company, LLC.

Woodhaven Investments, LLC

Delaware

Holding company for Ironbound Investment Company, LLC. and 1400 Corp.

Flagstar REO, LLC

Delaware

Formed to hold real estate from foreclosed loans

Flagstar Mortgage Securities, LLC

Delaware

Formed to hold mortgage loans sold into private securitizations

Flagstar Real Estate Holdings, Inc.

Michigan

Holding company for REIT investment in MSRs

REIT Holding Co #1, Inc.

Michigan

Holding company for REIT investments in mortgage loans

REIT Holding Co #2, Inc.

Michigan

Holding company for REIT investment in commercial real estate loans

Propshop Mortgage, LLC

Delaware

Joint venture mortgage company developing specialized mortgage technology

Flagstar Investment, LLC

Michigan

Formed to invest in low income housing investments

Flagstar Opportunities, LLC

Michigan

Formed to invest in low income housing investments

Grass Lake Insurance Agency, Inc.

Michigan

Licensed insurance agency

FSB-Optimum Investment Fund I LLC

Michigan

Formed to invest in businesses with New Markets Tax Credits

The 12 subsidiaries of Bank-owned entities are:

Name

Jurisdiction of Organization

Purpose

1400 Corp.

New York

Holding company for Roslyn Real Estate Asset Corp.

Ironbound Investment Company, LLC.

Florida

Organized for the purpose of investing in mortgage-related assets.

Long Island Commercial Capital Corporation

New York

A REIT organized for the purpose of investing in mortgage-related assets.

Omega Commercial Mortgage Corp.

Delaware

A REIT organized for the purpose of investing in mortgage-related assets.

Prospect Realty Holding Company, LLC

New York

Owns a back-office building.

Rational Real Estate II, LLC

New York

Formerly Owned a back-office building.

Roslyn Real Estate Asset Corp.

Delaware

A REIT organized for the purpose of investing in mortgage-related assets.

Walnut Realty Holding Company, LLC

Delaware

Owns two back-office buildings.

Long Lake REIT

Maryland

Formed to own excess servicing rights assets

Long Lake MSR, Inc.

Maryland

Licensed to own MSRs

REIT #1, Inc.

Michigan

A REIT organized for the purposes of investing in mortgage loans

REIT #2, Inc.

Michigan

A REIT organized for the purposes of investing in commercial real estate loans

N.A). NYB Realty Holding Company, LLC, a subsidiary of the Bank, owns interests in 10 additional active entities organized as indirect wholly-owned subsidiaries to own interests in various real estate properties.


The Parent Company owns special business trusts that were formed for the purpose of issuing capital and common securities and investing the proceeds thereof in the junior subordinated debentures issued by the Company.

12


See Note 12 “Borrowed- Borrowed Funds, in Item 8, “Financial Statements and Supplementary Data,” for a further discussion of the Company’s special business trusts. The Parent Company also has one non-banking subsidiary that was established in connection with the acquisition of Atlantic Bank of New York and two non-banking insurance subsidiaries that were acquired in connection with the Flagstar acquisition.


Human Capital Management

At December 31, 2022,2023, our workforce included 7,4978,766 employees. None of our employees are represented by a collective bargaining agreement and we believe our employee relations to be in good standing.

We believe our employees are among our most significant resources and that our employees are critical to our continued success. We focus significant attention on attracting and retaining talented and experienced individuals to manage and support our operations. We pay our employees competitively and offer a broad range of benefits, both of which we believe are competitive with our industry peers and with other firms in the locations in which we do business. Our employees receive salaries that are subject to annual review and periodic benchmarking. Our benefits program includes a 401(k) Plan with an employer matching contribution, healthcare and other insurance benefits, flexible spending accounts and paid time off. Many of our employees are also eligible to participate in the Company’s equity award program and the Company's annual incentive program.

We are proud to strive to maintain a diverse and inclusive workforce that reflects the demographics of the communities in which we do business. Our company recognizes that the talents of a diverse workforce are a key competitive advantage. To increase diversity within our talent pool, we work with key stakeholders in our business locations to deepen our understanding of the local labor market and better position the organization to recruit and retain talent within under-represented communities.

We strive to create and foster a supportive environment for all of our employees, and we are proud to share our business success with individuals whose cultural and personal differences support an innovative and productive workplace. Approximately two-thirds of our workforce is female and nearly half of our workforce have diverse ethnic backgrounds. Our policies and practices reflect our commitment to diversity and inclusion in the workplace.

14


A diverse workforce is critical to our long-term success. We strive to build and leverage a diverse, inclusive and engaged workforce that inspires all individuals to work together towards a common goal of superior business results by embracing the unique needs and objectives of our customers and community. We strive to achieve this by hiring great people who represent the talents, experiences, background and diversity of the communities we serve. Our commitment is reflected in the policies that govern our workforce, such as our Diversity Pledge and our Diversity, Equity and Inclusion Policy, and is evidenced in our recruiting strategies, diversity and inclusion training and Employee resource groups, which are key to our efforts. Our Employee resource groups provide our associates access to coaching, mentoring and professional development. As of December 31, 2022,2023, our efforts have been focused on the following eleven employee resource groups which we intend to expand across our recently combined Company: African American, Asian-Indian, Environmental, Hispanic/Latino, Interfaith, LGBTQ, Military Veterans, Native American, People with Disabilities, Women and Young Professionals.

Our management teams and all of our employees are expected to exhibit and promote honest, ethical and respectful conduct in the workplace. All of our employees must adhere to a code of conduct that sets standards for appropriate behavior and all employees are required to complete annual training that focuses on preventing, identifying, reporting and stopping any type of unlawful discrimination.

Federal, State, and Local Taxation

The Company is subject to federal, state, and local income taxes. See the discussion of "Income Taxes" in Note 2 "Summary- Summary of Significant Accounting Policies."Policies

13


Regulation and Supervision

The following is a brief summary of certain statutes and regulations that significantly affect the Company and its subsidiaries. A number of other statutes and regulations may affect the Company and the Bank but are not discussed in the following paragraphs.

General
General

The Bank is a national banking association, subject to federal regulation and oversight by the OCC. The activities of the Bank are limited to those specifically authorized under the National Bank Act and related interpretations of the OCC. The OCC has authority to bring an enforcement action against the Bank for unsafe or unsound banking practices, which could include limiting the Bank’s ability to conduct otherwise permissible activities, or imposing corrective capital or managerial requirements on the bank. We are also subject to regulation and examination by the FDIC, which insures the deposits of the Bank to the extent permitted by law and the requirements established by the Federal Reserve. The Bank is also subject to the supervision of the CFPB, which regulates the offering and provision of consumer financial products or services under federal consumer financial laws. The OCC, FDIC and the CFPB may take regulatory enforcement actions if we do not operate in accordance with applicable regulations, policies and directives. Proceedings may be instituted against us, or any "institution-affiliated party", such as a director, officer, employee, agent or controlling person, who engages in unsafe and unsound practices, including violations of applicable laws and regulations. The FDIC has additional authority to terminate insurance of accounts, if after notice and hearing, we are found to have engaged in unsafe and unsound practices, including violations of applicable laws and regulations. The federal system of regulation and supervision establishes a comprehensive framework of activities in which to operate and is primarily intended for the protection of depositors and the FDIC's DIF rather than our shareholders.


As a bank holding company, we are required to comply with the rules and regulations of the Federal Reserve. We are required to file certain reports, and we are subject to examination by, and the enforcement authority of, the Federal Reserve. Under the federal securities laws, we are also subject to the rules and regulations of the SEC.

Any change to laws and regulations, whether by the Regulatory Agencies or Congress, could have a materially adverse impact on our operations.


15


The Dodd-Frank Wall Street Reform and Consumer Protection Act

Enacted in July 2010, the DFA significantly changed the bank regulatory structure and will continue to affect, into the immediate future, the lending and investment activities and general operations of depository institutions and their holding companies. The DFA is complex and comprehensive legislation that impacts practically all aspects of a banking organization, and represents a significant overhaul of many aspects of the regulation of the financial services industry.


The New York Housing Stability and Tenant Protection Act of 2019

In 2019, the New York State Legislature passed the Housing Stability and Tenant Protection Act of 2019 impacting about one million rent-regulated apartment units. Among other things, the new legislation: (i) curtails rent increases from material capital improvements and Individual Apartment Improvements; (ii) all but eliminates the ability for apartments to exit rent regulation; (iii) does away with vacancy decontrol and high income deregulation; and (iv) repealed the 20 percent vacancy bonus. While it will take several years for its full impact to be known, the legislation generally limits a landlord’s ability to increase rents on rent-regulated apartments and makes it more difficult to convert rent regulated apartments to market rent apartments.

14


Capital Requirements

In 2013, the FRB and the FDIC approved revisions to their capital adequacy guidelines and prompt corrective action rules to implement the revised standards of the Basel Committee on Banking Supervision, commonly called Basel III, and to address relevant provisions of the DFA. Basel III generally refers to two consultative documents released by the Basel Committee on Banking Supervision in December 2009. The Basel III rules generally refer to the rules adopted by U.S. banking regulators in December 2010 to align U.S. bank capital requirements with Basel III and with the related loss absorbency rules they issued in January 2011, which include significant changes to bank capital, leverage, and liquidity requirements.

The Basel III rules include new risk-based capital and leverage ratios, which became effective January 1, 2015, and revised the definition of what constitutes “capital” for the purposes of calculating those ratios. Under Basel III, the Company and the Bank are required to maintain minimum capital in accordance with the following ratios: (i) a common equity tier 1 capital ratio of 4.5 percent; (ii) a tier 1 capital ratio of 6 percent (increased from 4 percent); (iii) a total capital ratio of 8 percent (unchanged from the prior rules); and (iv) a tier 1 leverage ratio of 4 percent.

In addition, the Basel III rules assign higher risk weights to certain assets, such as the 150 percent risk weighting assigned to exposures that are more than 90 days past due or are on non-accrual status, and to certain CRE facilities that finance the acquisition, development, or construction of real property. Basel III also eliminate the inclusion of certain instruments, such as trust preferred securities, from tier 1 capital. In addition, tier 2 capital is no longer limited to the amount of tier 1 capital included in total capital. Mortgage servicing rights, certain deferred tax assets, and investments in unconsolidated subsidiaries over designated percentages of common stock are required, subject to limitation, to be deducted from capital. Finally, tier 1 capital includes accumulated other comprehensive income, which includes all unrealized gains and losses on available-for-sale securities.

Basel III also established a “capital conservation buffer” (consisting entirely of common equity tier 1 capital) that is 2.5 percent above the new regulatory minimum capital requirements. This resulted in an increase in the minimum common equity tier 1, tier 1, and total capital ratios to 7.0 percent, 8.5 percent, and 10.5 percent, respectively. The capital conservation buffer is now at its fully phased-in level of 2.5 percent. An institution can be subject to limitations on paying dividends, engaging in share repurchases, and paying discretionary bonuses if its capital levels fall below these amounts. Basel III also establish a maximum percentage of eligible retained income that can be utilized for such capital distributions.

On September 17, 2019, the FRB, the FDIC, and the OCC issued a final rule designed to reduce regulatory burden by simplifying several requirements in the agencies’ regulatory capital rule. Most aspects of the rule apply only to banking organizations that are not subject to the “advanced approaches” in the capital rule, which are generally firms with less than $250$250.0 billion in total consolidated assets and less than $10$10.0 billion in total foreign exposure. The rule simplifies and clarifies a number of the more complex aspects of the existing capital rule. Specifically, the rule simplifies the capital treatment for certain mortgage servicing assets, certain deferred tax assets, investments in the capital instruments of unconsolidated financial institutions, and minority interests.


16


Prompt Corrective Regulatory Action

The Federal Deposit Insurance Corporation Improvement Act of 1991 (“FDICIA”) requires, among other things, that federal bank regulatory authorities take “prompt corrective action” with respect to institutions that do not meet minimum capital requirements. For such purposes, the law establishes five capital tiers: well capitalized, adequately capitalized, undercapitalized, significantly undercapitalized, and critically undercapitalized. The five capital tiers are described in more detail below. Under the prompt corrective action regulations, an institution that fails to remain “well capitalized” becomes subject to a series of restrictions that increase in severity as its capital condition weakens. Such restrictions may include a prohibition on capital distributions, restrictions on asset growth, or restrictions on the ability to receive regulatory approval of applications. The FDICIA also provides for enhanced supervision authority over undercapitalized institutions, including authority for the appointment of a conservator or receiver for the institution.

15


As a result of the Basel III rules, new definitions of the relevant measures for the five capital categories took effect on January 1, 2015. An institution is deemed to be “well capitalized” if it has a total risk-based capital ratio of 10 percent or greater, a tier 1 risk-based capital ratio of 8 percent or greater, a common equity tier 1 risk-based capital ratio of 6.5 percent or greater, and a tier 1 leverage ratio of 5 percent or greater, and is not subject to a regulatory order, agreement, or directive to meet and maintain a specific capital level for any capital measure.

An institution is deemed to be “adequately capitalized” if it has a total risk-based capital ratio of 8 percent or greater, a tier 1 risk-based capital ratio of 6 percent or greater, a common equity tier 1 risk-based capital ratio of 4.5 percent or greater, and a tier 1 leverage ratio of 4 percent or greater.

An institution is deemed to be “undercapitalized” if it has a total risk-based capital ratio of less than 8 percent, a tier 1 risk-based capital ratio of less than 6 percent, a common equity tier 1 risk-based capital ratio of less than 4.5 percent, or a tier 1 leverage ratio of less than 4 percent. An institution is deemed to be “significantly undercapitalized” if it has a total risk-based capital ratio of less than 6 percent, a tier 1 risk-based capital ratio of less than 4 percent, a common equity tier 1 risk-based capital ratio of less than 3 percent, or a tier 1 leverage ratio of less than 3 percent. An institution is deemed to be “critically undercapitalized” if it has a ratio of tangible equity (as defined in the regulations) to total assets that is equal to or less than 2 percent.

“Undercapitalized” institutions are subject to growth, capital distribution (including dividend), and other limitations, and are required to submit a capital restoration plan. An institution’s compliance with such a plan is required to be guaranteed by any company that controls the undercapitalized institution in an amount equal to the lesser of 5 percent of the bank’s total assets when deemed undercapitalized or the amount necessary to achieve the status of adequately capitalized. If an undercapitalized institution fails to submit an acceptable plan, it is treated as if it is “significantly undercapitalized.” Significantly undercapitalized institutions are subject to one or more additional restrictions including, but not limited to, an order by the FDIC to sell sufficient voting stock to become adequately capitalized; requirements to reduce total assets, cease receipt of deposits from correspondent banks, or dismiss directors or officers; and restrictions on interest rates paid on deposits, compensation of executive officers, and capital distributions by the parent holding company.

Beginning 60 days after becoming “critically undercapitalized,” critically undercapitalized institutions also may not make any payment of principal or interest on certain subordinated debt, extend credit for a highly leveraged transaction, or enter into any material transaction outside the ordinary course of business. In addition, subject to a narrow exception, the appointment of a receiver is required for a critically undercapitalized institution within 270 days after it obtains such status.

Failure to meet minimum capital requirements can initiate certain mandatory, and possibly additional discretionary, actions by regulators that could have a material effect on the Consolidated Financial Statements. For additional information, see the Capital section of the MD&A and Note 2117 - Capital. As of December 31, 2022,2023, each of the Bank’s capital ratios exceeded those required for an institution to be considered “well capitalized” under these regulations.


Enhanced Stress Testing and Prudential Standards

As a result of the Signature transaction, our total assets exceeded $100 billion and therefore we became classified as a Category IV banking organization under the rules issued by the federal banking agencies that tailor the application of enhanced prudential standards to large bank holding companies and the capital and liquidity rules to large bank holding companies and depository institutions under the Dodd-Frank Act and the Economic Growth, Regulatory Relief, and Consumer Protection Act. As a Category IV banking organization, we are subject to enhanced liquidity risk management requirements which include

17


reporting, liquidity stress testing, a liquidity buffer and resolution planning, subject to the applicable transition periods. If we were to meet or exceed certain other thresholds for asset size, we would become subject to additional requirements.

As a Category IV banking organization, we are subject to risk committee and risk management requirements, as well as capital planning, liquidity risk management, liquidity buffer and liquidity stress testing requirements.

Stress Testing for Category IV U.S. Banking Organizations

In 2019, the Board of Governors of the Federal Reserve System (the “Board”) finalized a framework that sorts large banking organizations into one of four categories of prudential standards based on their risk profiles (the “tailoring rule”). The most stringent prudential standards apply under Category I (defined as U.S. Global Systemically Important Banks and their depository institution subsidiaries), and the least stringent prudential standards apply under Category IV (defined as U.S. banking organizations with $100$100.0 billion or more but less than $250$250.0 billion in total assets and have less than $75$75.0 billion in cross-jurisdictional activity, weighted short-term wholesale funding, nonbank assets, or off-balance sheet exposure).

16


In January 2021, the Board finalized a rule to update capital planning requirements for large banks to be consistent with the tailoring rule. The Board's capital planning requirements for large banks help ensure they plan for and determine their capital needs under a range of different scenarios. The rule removes the company-run stress test requirement for banking organizations subject to Category IV standards. Therefore, banking organizations subject to Category IV standards are not required to calculate forward-looking projections of capital under scenarios provided by the Board.

The rule also aligns the frequency of the calculation of the stress capital buffer requirement with the frequency of the supervisory stress test (that is,(with both would occuroccurring every other year for banking organizations subject to Category IV standards). The rule allows a banking organization subject to Category IV standards to elect to participate in the supervisory stress test in a year in which the banking organization would not otherwise be subject to the supervisory stress test, and to receive an updated stress capital buffer requirement in that year.

Standards for Safety and Soundness

Federal law requires each federal banking agency to prescribe, for the depository institutions under its jurisdiction, standards that relate to, among other things, internal controls; information and audit systems; loan documentation; credit underwriting; the monitoring of interest rate risk; asset growth; compensation; fees and benefits; and such other operational and managerial standards as the agency deems appropriate. The federal banking agencies adopted final regulations and Interagency Guidelines Establishing Standards for Safety and Soundness (the “Guidelines”) to implement these safety and soundness standards. The Guidelines set forth the safety and soundness standards that the federal banking agencies use to identify and address problems at insured depository institutions before capital becomes impaired. If the appropriate federal banking agency determines that an institution fails to meet any standard prescribed by the Guidelines, the agency may require the institution to provide it with an acceptable plan to achieve compliance with the standard, as required by the Federal Deposit Insurance Act, as amended, (the “FDI Act”).

FDIC, OCC, and FRB Regulations

The discussion that follows pertains to FDIC, OCC, and FRB regulations other than those already discussed on the preceding pages.

Additional Regulations

The following pertains to regulations other than those already discussed on the preceding pages.

Real Estate Lending Standards

The FDIC and the other federal banking agencies have adopted regulations that prescribe standards for extensions of credit that (i) are secured by real estate, or (ii) are made for the purpose of financing construction or improvements on real estate. The FDIC regulations require each institution to establish and maintain written internal real estate lending standards that are consistent with safe and sound banking practices, and appropriate to the size of the institution and the nature and scope of its real estate lending activities. The standards also must be consistent with accompanying FDIC Guidelines, which include loan-to-value limitations for the different types of real estate loans. Institutions are also permitted to make a limited amount of loans that do not conform to the proposed loan-to-value limitations as long as such exceptions are reviewed and justified

18


appropriately. The FDIC Guidelines also list a number of lending situations in which exceptions to the loan-to-value standards are justified.

The FDIC, the OCC, and the FRB (collectively, the “Federal Banking Agencies”) also have issued joint guidance entitled “Concentrations in Commercial Real Estate Lending, Sound Risk Management Practices” (the “CRE Guidance”). The CRE Guidance, which addresses land development, construction, and certain multi-family loans, as well as CRE loans, does not establish specific lending limits but, rather, reinforces and enhances the Federal Banking Agencies’ existing regulations and guidelines for such lending and portfolio management. Specifically, the CRE Guidance provides that a bank has a concentration in CRE lending if (1) total reported loans for construction, land development, and other land represent 100 percent or more of total risk-based capital; or (2) total reported loans secured by multi-family properties, non-farm non-residential properties (excluding those that are owner-occupied), and loans for construction, land development, and other land represent 300 percent or more of total risk-based capital. If a concentration is present, management must employ heightened risk management practices that address key

17


elements, including board and management oversight and strategic planning, portfolio management, development of underwriting standards, risk assessment and monitoring through market analysis and stress testing, and maintenance of increased capital levels as needed to support the level of CRE lending.


On December 13, 2019, the Federal Banking Agencies issued a final rule, which became effective on April 1, 2020, to modify the agencies’ capital rules for high volatility CRE (“HVCRE”) exposures, as required by the EGRRCPA. The final rule revises the definition of HVCRE exposure to make it consistent with the statutory definition of the term included in Section 214 of the EGRRCPA, which excludes any loan made before January 1, 2015. The revised HVCRE exposure definition differs from the previous definition primarily in two ways. First, the previous definition applied to loans that financed ADC activities, whereas the new definition only applies to loans that “primarily” finance ADC activities and that are secured by land or improved real estate. This change excludes multipurpose credit facilities that primarily finance the purchase of equipment or other non-ADC activities. Second, the new definition permits the full appraised value of borrower-contributed land (less the total amount of any liens on the real property securing the HVCRE exposure) to count toward the 15 percent capital contribution of the real property’s appraised “as completed” value, which is one of the criteria for an exemption from the heightened risk weight. The final rule includes a grandfathering provision, which will provideprovides banking organizations with the option to maintain their current capital treatment for ADC loans originated on or after January 1, 2015, and before April 1, 2020. Banking organizations also will have the option to reevaluate any or all of their ADC loans originated on or after January 1, 2015, using the revised HVCRE exposure definition.

Dividend Limitations

The Parent Company is a separate legal entity from the Bank and must provide for its own liquidity. In addition to operating expenses and any share repurchases, the Parent Company is responsible for paying any dividends declared to the Company’s shareholders. As a Delaware corporation, the Parent Company is able to pay dividends either from surplus or, in case there is no surplus, from net profits for the fiscal year in which the dividend is declared and/or the preceding fiscal year.

Various legal restrictions limit the extent to which the Company’s subsidiary bank can supply funds to the Parent Company and its non-bank subsidiaries. The Bank would require the approval of the OCC if the dividends it declares in any calendar year were to exceed the total of its respective net profits for that year combined with its respective retained net profits for the preceding two calendar years, less any required transfer to paid-in capital. The term “net profits” is defined as net income for a given period less any dividends paid during that period. As a result of our acquisition of Flagstar, we are also required to seek regulatory approval from the OCC for the payment of any dividend to the Parent Company through at least the period ending November 1, 2024. In 2022,2023, dividends of $335$580 million were paid by the Bank to the Parent Company. At December 31, 2022, the Bank could have paid additional dividends of $615 million to the Parent Company without regulatory approval.

Investment Activities

National bank investment activities are governed by the National Bank Act and OCC regulations which, consistent with safe and sound banking practices, prescribe standards under which national banks may purchase, sell, deal in, underwrite, and hold securities. The types of investment activities that are permissible for national banks, and the calculation of limits for investments in such covered securities, are set forth in regulations promulgated by the OCC (12 CFR Part 1), as further described in the OCC’s Investment Securities Policy Statement (OCC Bulletin 1998-20). A national bank must adhere to safe and sound banking practices and the specific requirements of the OCC's regulations in conducting such investment activities. A bank must consider, as appropriate, the interest rate, credit, liquidity, price, foreign exchange, transaction, compliance, strategic, and reputation risks presented by a proposed activity, and the particular activities undertaken by the bank must be appropriate for that bank. If the OCC determines for safety and soundness reasons that a bank should calculate its investment limits more frequently than required by the OCC's Investment Securities regulations, the OCC may provide written notice to the bank

19


directing the bank to calculate its investment limitations at a more frequent interval, and the bank must thereafter calculate its investment limits at that interval until further notice from the OCC.

The GLBA and FDIC regulations also impose certain quantitative and qualitative restrictions on such activities and on a bank’s dealings with a subsidiary that engages in specified activities.

Enforcement

18


Enforcement

The FDICOCC has extensiveauthority to bring an enforcement action against the Bank for unsafe or unsound banking practices, which could include limiting the Bank’s ability to conduct otherwise permissible activities, or imposing corrective capital or managerial requirements on the bank. In addition, the Parent Company is subject to the enforcement authority over insured banks, includingof the Bank. ThisFederal Reserve. The enforcement authority of these regulatory agencies includes, among other things, the ability to assess civil money penalties, to issue cease and desist orders, and to remove directors and officers. In general, these enforcement actions may be initiated in response to violations of laws and regulations and unsafe or unsound practices.

Insurance of Deposit Accounts

The deposits of the Bank are insured up to applicable limits by the DIF. The maximum deposit insurance provided by the FDIC per account owner is $250,000 for all types of accounts.

Under the FDIC’s risk-based assessment system, insured institutions are assigned to one of four risk categories based upon supervisory evaluations, regulatory capital level, and certain other factors, with less risky institutions paying lower assessments based on the assigned risk levels. An institution’s assessment rate depends upon the category to which it is assigned and certain other factors. Assessment rates range from 1.5 to 40 basis points of the institution’s assessment base, which is calculated as average total assets minus average tangible equity. No institution may pay a dividend if in default of the federal deposit insurance assessment. Deposit insurance assessments are based on total average assets, excluding PPP loans, less average tangible common equity. The FDIC has authority to increase insurance assessments. Management cannot predict what insurance assessments rates will be in the future.

Insurance of deposits may be terminated by the FDIC upon a finding that an institution has engaged in unsafe or unsound practices, is in an unsafe or unsound condition to continue operations, or has violated any applicable law, regulation, rule, order, or condition imposed by the FDIC. Management does not know of any practice, condition, or violation that would lead to termination of the deposit insurance for the Bank.

On November 16, 2023, the FDIC published in the Federal Register its final rule that imposes special assessments to recover the loss to the Deposit Insurance Fund arising from the protection of uninsured depositors in connection with the systemic risk determination announced on March 12, 2023, following the closures of Silicon Valley Bank and Signature Bank. The assessment base for the special assessments is equal to an insured depository institution’s estimated uninsured deposits, reported as of December 31, 2022, adjusted to exclude the first $5 billion in estimated uninsured deposits from the insured depository institution, or for insured depository institutions that are part of a holding company with one or more subsidiary insured depository institutions, at the banking organization level. The final rule calls for the FDIC to collect special assessments at an annual rate of approximately 13.4 basis points, over eight quarterly assessment periods. Because the estimated loss pursuant to the systemic risk determination will be periodically adjusted, the FDIC retains the ability to cease collection early, extend the special assessment collection period one or more quarters beyond the initial eight-quarter collection period to collect the difference between actual or estimated losses and the amounts collected, and impose a final shortfall special assessment on a one-time basis after the receiverships for Silicon Valley Bank and Signature Bank terminate. The final rule set an effective date of April 1, 2024, with special assessments collected beginning with the first quarterly assessment period of 2024 (i.e., January 1 through March 31, 2024, with an invoice payment date of June 28, 2024).

In February 2024, we received notification from the FDIC that the estimated loss attributable to the protection of uninsured depositors at Silicon Valley Bank and Signature Bank is $20.4 billion, an increase of approximately $4.1 billion from the estimate of $16.3 billion described in the final rule. The FDIC plans to provide institutions subject to the special assessment an updated estimate of each institution’s quarterly and total special assessment expense with its first quarter 2024 special assessment invoice, to be released in June 2024.

We expect an increase in special assessment expense, which is not expected to be material, on or around June 2024 based on the FDIC’s modified loss estimate.


20


Holding Company Regulations

Federal Regulation. The Company is currently subject to examination, regulation, and periodic reporting under the BHCA, as administered by the FRB.

Acquisition, Activities and Change in Control.Control. The Company may only conduct, or acquire control of companies engaged in activities permissible for a bank holding company pursuant to the BHCA. Further, we generally are required to obtain Federal Reserve approval before acquiring direct or indirect ownership or control of any voting shares of another bank, bank holding company, savings associations or savings and loan holding company if we would own or control more than 5 percent of the outstanding shares of any class of voting securities of that entity. Additionally, we are prohibited from acquiring control of a depository institution that is not federally insured or retaining control for more than one year after the date that institution becomes uninsured.

We may not be acquired unless the transaction is approved by the Federal Reserve. In addition, the GLBA generally restricts a company from acquiring us if that company is engaged directly or indirectly in activities that are not permissible for a bank holding company or financial holding company.

Capital Requirements. The Company and the Bank are currently subject to the regulatory capital framework and guidelines reached by Basel III as adopted by the OCC and Federal Reserve. The OCC and Federal Reserve have risk-based capital adequacy guidelines intended to measure capital adequacy with regard to a banking organization’s balance sheet, including off-balance sheet exposures such as unused portions of loan commitments, letters of credit and recourse arrangements. Failure to meet minimum capital requirements can initiate certain mandatory, and possibly additional discretionary, actions by regulators that could have a material effect on the Consolidated Financial Statements. For additional information, see the Capital section of the MD&A and Note 2117 -Capital.


Holding Company Limitations on Capital Distributions. Our ability to make any capital distributions to our stockholders, including dividends and share repurchases, is subject to the oversight of the Federal Reserve and contingent upon their non-objection to such planned distributions which typically considers our capital adequacy, comprehensiveness and effectiveness of capital planning and the prudence of the proposed capital action.

19


Acquisition of the Holding Company

Federal Restrictions

Under the Federal Change in Bank Control Act (“CIBCA”), a notice must be submitted to the FRB if any person (including a company), or group acting in concert, seeks to acquire 10 percent or more of the Company’s shares of outstanding common stock, unless the FRB has found that the acquisition will not result in a change in control of the Company. Under the CIBCA, the FRB generally has 60 days within which to act on such notices, taking into consideration certain factors, including the financial and managerial resources of the acquirer; the convenience and needs of the communities served by the Company, the Bank; and the anti-trust effects of the acquisition. Under the BHCA, any company would be required to obtain approval from the FRB before it may obtain “control” of the Company within the meaning of the BHCA. Control generally is defined to mean the ownership or power to vote 25 percent or more of any class of voting securities of the Company, the ability to control in any manner the election of a majority of the Company’s directors, or the power to exercise a controlling influence over the management or policies of the Company. Under the BHCA, an existing bank holding company would be required to obtain the FRB’s approval before acquiring more than 5 percent of the Company’s voting stock. See “Holding Company Regulation” earlier in this report.

Banking Regulation

Limitation on Capital Distributions.Distributions. The OCC and FRB regulate all capital distributions made by the Bank, directly or indirectly, to the holding company, including dividend payments. An application to the OCC by the Bank may be required based on a number of factors including whether the Bank would not be at least adequately capitalized following the distribution or if the total amount of all capital distributions (including each proposed capital distribution) for the applicable calendar year exceeds net income for that year to date plus the retained net income for the preceding two years. As a result of our acquisition of Flagstar, we are required to seek regulatory approval from the OCC for the payment of any dividend to the Parent Company through at least the period ending November 1, 2024, which could restrict our ability to pay the common stock dividend.


21


Transactions with Affiliates

Under current federal law, transactions between depository institutions and their affiliates are governed by Sections 23A and 23B of the Federal Reserve Act and the FRB’s Regulation W promulgated thereunder. Generally, Section 23A limits the extent to which the institution or its subsidiaries may engage in “covered transactions” with any one affiliate to an amount equal to 10 percent of the institution’s capital stock and surplus, and contains an aggregate limit on all such transactions with all affiliates to an amount equal to 20 percent of such capital stock and surplus. Section 23A also establishes specific collateral requirements for loans or extensions of credit to, or guarantees or acceptances on letters of credit issued on behalf of, an affiliate. Section 23B requires that covered transactions and a broad list of other specified transactions be on terms substantially the same as, or at least as favorable to, the institution or its subsidiaries as similar transactions with non-affiliates.

The Sarbanes-Oxley Act of 2002 generally prohibits loans by the Company to its executive officers and directors. However, the Sarbanes-Oxley Act contains a specific exemption for loans made by an institution to its executive officers and directors in compliance with other federal banking laws. Section 22(h) of the Federal Reserve Act, and FRB Regulation O adopted thereunder, govern loans by a bank to directors, executive officers, and principal stockholders.

Community Reinvestment Act

Federal Regulation

Under the CRA, as implemented by OCC regulations, an institution has a continuing and affirmative obligation consistent with its safe and sound operation to help meet the credit needs of its entire community, including low and moderate income neighborhoods. The CRA generally does not establish specific lending requirements or programs for financial institutions, nor does it limit an institution’s discretion to develop the types of products and services that it believes are best suited to its particular community, consistent with the CRA. However, institutions are rated on their performance in meeting the needs of their communities. Performance is tested in three areas: (1) lending, to

20


evaluate the institution’s record of making loans in its assessment areas; (2) investment, to evaluate the institution’s record of investing in community development projects, affordable housing, and programs benefiting low- or moderate-income individuals and businesses; and (3) service, to evaluate the institution’s delivery of services through its branches, ATMs and other offices. The CRA requires each federal banking agency, in connection with its examination of a financial institution, to assess and assign one of four ratings to the institution’s record of meeting the credit needs of the community and to take such record into account in its evaluation of certain applications by the institution, including applications for charters, branches and other deposit facilities, relocations, mergers, consolidations, acquisitions of assets or assumptions of liabilities, and bank holding company and savings and loan holding company acquisitions. The CRA also requires that all institutions make public disclosure of their CRA ratings.


On October 24, 2023, the OCC, the FDIC and the Federal Reserve issued a final rule amending the agencies’ CRA regulations.

The final rule (i) encourages banks to expand access to credit, investment and banking services in low- and moderate-income communities, (ii) adapts to changes in the banking industry, including mobile and online banking, (iii) provides greater clarity and consistency in the application of CRA regulations and (iv) tailors CRA evaluations and data collection to bank size and type.Under the final rule, the agencies will evaluate bank performance across the varied activities they conduct and communities in which they operate so that the CRA continues to be an effective tool to address inequities in access to credit and financial services.The final rule also updates existing CRA regulations to evaluate lending outside traditional assessment areas generated by the growth of non-branch delivery systems, such as online and mobile banking, branchless banking, and hybrid models. In addition, the final rule implements a new metrics-based approach to evaluating bank retail lending and community development financing, using benchmarks based on peer and demographic data.Most of the final rule’s requirements will become effective beginning on January 1, 2026 and the remaining requirements, including the final rule’s data reporting requirements, will become effective on January 1, 2027.


22


Community Pledge Agreement with the National Community Reinvestment Coalition

On January 24, 2022, the Company and the National Community Reinvestment Coalition ("NCRC") announced the Company's commitment to provide $28$28.0 billion in loans, investments, and other financial support to communities and people of color, low- and moderate-income ("LMI") families and communities, and small businesses. The Company's Community Pledge Agreement was developed with NCRC and its members in conjunction with the Company's merger with Flagstar Bancorp, Inc. The agreement includes $22$22.0 billion in community lending and affordable housing commitments and $6$6.0 billion of residential mortgage originations to underserved and LMI borrowers, and in LMI and majority-minority neighborhoods over a five-year period. NYCBThe Company will also provide $542 million in loans to small businesses with less than $1 million in revenues and in LMI and majority-minority communities; $16.5 million in philanthropic support to nonprofit organizations that meet the needs of LMI and majority-minority communities and individuals; greater access to banking products and services; and the continuation of NYCB'sthe Company's responsible multi-family lending practices.

Bank Secrecy and Anti-Money Laundering

The Bank is subject to the Bank Secrecy Act (“BSA”) and other anti-money laundering laws and regulations, including the Uniting and Strengthening America by Providing Appropriate Tools Required to Intercept and Obstruct Terrorism Act, commonly referred to as the “USA PATRIOT Act” or the “Patriot Act”. The BSA requires all financial institutions to, among other things, establish a risk-based system of internal controls reasonably designed to prevent money laundering and the financing of terrorism. The BSA includes various record keeping and reporting requirements such as cash transaction and suspicious activity reporting as well as due diligence requirements. The Bank is also required to comply with the U.S. Treasury’s Office of Foreign Assets Control imposed economic sanctions that affect transactions with designated foreign countries, nationals, individuals, entities and others. The USA PATRIOT Act contains prohibitions against specified financial transactions and account relationships, as well as enhanced due diligence standards intended to prevent the use of the United States financial system for money laundering and terrorist financing activities. The Patriot Act requires banks and other depository institutions, brokers, dealers and certain other businesses involved in the transfer of money to establish anti-money laundering programs, including employee training and independent audit requirements meeting minimum standards specified by the Patriot Act, to follow standards for customer identification and maintenance of customer identification records, and to compare customer lists against lists of suspected terrorists, terrorist organizations and money launderers. The Patriot Act also requires federal bank regulators to evaluate the effectiveness of an applicant in combating money laundering in determining whether to approve a proposed bank acquisition.

We have developed and operate an enterprise-wide anti-money laundering program designed to enable us to comply with all applicable anti-money laundering and anti-terrorism financing laws and regulations. Our anti-money laundering program is also designed to prevent our products from being used to facilitate business in certain countries or territories, or with certain individuals or entities, including those on designated lists promulgated by the U.S. Department of the Treasury’s Office of Foreign Assets Controls and other U.S. and non-U.S. sanctions authorities. Our anti-money laundering and sanctions compliance programs include policies, procedures, reporting protocols, and internal controls designed to identify, monitor, manage, and mitigate the risk of money laundering and terrorist financing. These controls include procedures and processes to detect and report potentially suspicious transactions, perform consumer due diligence, respond to requests from law enforcement, and meet all recordkeeping and reporting requirements related to particular transactions involving currency or monetary instruments. Our programs are designed to address these legal and regulatory requirements and to assist in managing risk associated with money laundering and terrorist financing.

21


Office of Foreign Assets Control Regulation

The United States has imposed economic sanctions that affect transactions with designated foreign countries, foreign nationals, and others. These are typically known as the “OFAC” rules, based on their administration by the U.S. Treasury Department Office of Foreign Assets Control. The OFAC-administered sanctions targeting countries take many different forms. Generally, however, they contain one or more of the following elements: (i) restrictions on trade with, or investment in, a sanctioned country, including prohibitions against direct or indirect imports from, and exports to, a sanctioned country and prohibitions on “U.S. persons” engaging in financial transactions relating to making investments in, or providing investment-related advice or assistance to, a sanctioned country; and (ii) a blocking of assets in which the government or specially designated nationals of the sanctioned country have an interest, by prohibiting transfers of property subject to U.S. jurisdiction (including property in the possession or control of U.S. persons). Blocked assets (e.g., property and bank deposits) cannot be paid out, withdrawn, set off, or transferred in any manner without a license from OFAC. Failure to comply with these sanctions could have serious legal and reputational consequences.


23


Data Privacy

Federal and state law contains extensive consumer privacy protection provisions. The GLBA requires financial institutions to periodically disclose their privacy practices and policies relating to sharing such information and enable retail customers to opt out of the Company’s ability to share certain information with affiliates and non-affiliates for marketing and/or non-marketing purposes, or to contact customers with marketing offers. The GLBA also requires financial institutions to implement a comprehensive information security program that includes administrative, technical, and physical safeguards to ensure the security and confidentiality of customer records and information, and imposes certain limitations on the ability to share consumers’ nonpublic personal information with non-affiliated third-parties. Privacy requirements, including notice and opt out requirements, under the GLBA and the FCRA are enforced by the FTC and by the CFPB through UDAAP laws and regulations, and are a standard component of CFPB examinations. State entities also may initiate actions for alleged violations of privacy or security requirements under state law.

Furthermore, an increasing number of state, federal, and international jurisdictions have enacted, or are considering enacting, privacy laws, such as the California Consumer Privacy Act (“CCPA”), which became effective on January 1, 2020, and the EU General Data Protection Regulation (“GDPR”), which regulates the collection, control, sharing, disclosure and use and other processing of personal information of data subjects in the EU and the European Economic Area. The CCPA gives residents of California expanded rights to access and delete their personal information, opt out of certain personal information sharing, and receive detailed information about how their personal information is used, and also provides for civil penalties for violations and private rights of action for data breaches. Meanwhile, the GDPR provides data subjects with greater control over the collection and use of their personal information (such as the “right to be forgotten”) and has specific requirements relating to cross-border transfers of personal information to certain jurisdictions, including to the United States, with fines for noncompliance of up to the greater of 20 million euros or up to 4 percent of the annual global revenue of the noncompliant company. In addition, California approved a new privacy law in 2020, the California Privacy Rights Act (“CPRA”), which significantly modifies the CCPA, including by expanding consumers’ rights with respect to certain personal information and creating a new state agency to oversee implementation and enforcement efforts.

Cybersecurity

Cybersecurity

The Cybersecurity Information Sharing Act (the “CISA”) is intended to improve cybersecurity in the U.S. through sharing of information about security threats between the U.S. government and private sector organizations, including financial institutions such as the Company. The CISA also authorizes companies to monitor their own systems, notwithstanding any other provision of law, and allows companies to carry out defensive measures on their own systems from potential cyber-attacks.

Sarbanes-Oxley Act of 2002

The Sarbanes-Oxley Act of 2002 was enacted to address, among other things, corporate governance, auditing and accounting, executive compensation, and enhanced and timely disclosure of corporate information. As directed by the Sarbanes-Oxley Act, our Chief Executive Officer and Chief Financial Officer are required to certify that our quarterly and annual reports do not contain any untrue statement of a material fact. The rules adopted by the SEC

22


under the Sarbanes-Oxley Act have several requirements, including having those Officers certify that they are responsible for establishing, maintaining and regularly evaluating the effectiveness of our internal controls over financial reporting; that they have made certain disclosures to our auditors and the Audit Committee of the Board of Directors about our internal control over financial reporting; and they have included information in our quarterly and annual reports about their evaluation and whether there have been changes in our internal control over financial reporting or in other factors that could materially affect internal control over financial reporting.


Federal Home Loan Bank System

The Bank is a member of the FHLB-NY.FHLB-NY and FHLB-Indianapolis. As a member of the FHLB-NY, the Bank is required to acquire and hold shares of FHLB-NY capital stock. At December 31, 20222023 the Bank held $762$861 million of FHLB-NY stock and as a result of the Flagstar acquisition, $329 million of FHLB-Indianapolis shares.


24


Federal Securities Law

The Company’s common stock and certain other securities listed on the cover page of this report are registered with the SEC under the Securities Exchange Act of 1934, as amended (the “Exchange Act”). The Company is subject to the information and proxy solicitation requirements, insider trading restrictions, and other requirements under the Exchange Act.

Consumer Protection Regulations

The activities of the Company’s banking subsidiary, including its lending and deposit gathering activities, is subject to a variety of consumer laws and regulations designed to protect consumers. These laws and regulations mandate certain disclosure requirements, and regulate the manner in which financial institutions must deal with clients and monitor account activity when taking deposits from, making loans to, or engaging in other types of transactions with, such clients. Failure to comply with these laws and regulations could lead to substantial penalties, operating restrictions, and reputational damage to the financial institution.

Applicable consumer protection laws, and their implementing regulations, include, but may not be limited to, the DFA, Truth in Lending Act (Regulation Z), Truth in Savings Act (Regulation DD), Equal Credit Opportunity Act (Regulation B), Electronic Funds Transfer Act (Regulation E), Fair Housing Act, Home Mortgage Disclosure Act (Regulation C), Fair Debt Collection Practices Act (Regulation F), Fair Credit Reporting Act (Regulation V), as amended by the Fair and Accurate Credit Transactions Act, Expedited Funds Availability (Regulation CC), Reserve Requirements (Regulation D), Insider Transactions (Regulation O), Privacy of Consumer Information (Regulation P), Margin Stock Loans (Regulation U), Right To Financial Privacy Act, Flood Disaster Protection Act, Homeowners Protection Act, Servicemembers Civil Relief Act, Real Estate Settlement Procedures Act (Regulation X), Telephone Consumer Protection Act, CAN-SPAM Act, Children’s Online Privacy Protection Act, the Military Lending Act, and the Homeownership Counseling Act. Additionally, we are subject to Section 5 of the Federal Trade Commission Act, which prohibits unfair and deceptive acts or practices in or affecting commerce, and Section 1031 of the Dodd-Frank Act, which prohibits unfair, deceptive, or abusive acts or practices (“UDAAP”) in connection with any consumer financial product or serviceservice.

In addition, the Bank and its subsidiaries are subject to certain state laws and regulations designed to protect consumers. Many states have consumer protection laws analogous to, or in addition to, the federal laws listed above, such as usury laws, state debt collection practices laws, and requirements regarding loan disclosures and terms, credit discrimination, credit reporting, money transmission, recordkeeping, and unfair or deceptive business practices.

Certain states have adopted laws regulating and requiring licensing, registration, notice filing, or other approval for parties that engage in certain activity regarding consumer finance transactions. Furthermore, certain states and localities have adopted laws requiring licensing, registration, notice filing, or other approval for consumer debt collection or servicing, and/or purchasing or selling consumer loans. The licensing statutes vary from state to state and prescribe different requirements, including but not limited to: restrictions on loan origination and servicing practices (including limits on the type, amount, and manner of our fees), interest rate limits, disclosure requirements, periodic examination requirements, surety bond and minimum specified net worth requirements, periodic financial reporting requirements, notification requirements for changes in principal officers, stock ownership or corporate control, restrictions on advertising, and requirements that loan forms be submitted for review. We may also be subject

23


to supervision and examination by applicable state regulatory authorities in the jurisdictions in which we may offer consumer financial products or services.


Consumer Financial Protection Bureau

The Bank is subject to oversight by the CFPB within the Federal Reserve System. The CFPB was established under the DFA to implement and enforce rules and regulations under certain federal consumer protection laws with respect to the conduct of providers of certain consumer financial products and services. The CFPB has broad rulemaking authority for a wide range of consumer financial laws that apply to all banks, including, among other things, the authority to prohibit acts and practices that are deemed to be unfair, deceptive, or abusive. Abusive acts or practices are defined as those that (1) materially interfere with a consumer’s ability to understand a term or condition of a consumer financial product or service, or (2) take unreasonable advantage of a consumer’s (a) lack of understanding on the part of the consumer of the material risks, costs, or conditions of the product or service; (b) the inability of the consumer to protect his/her own interest in selecting or using a financial product or service; or (c) the reasonable reliance by the consumer on a financial institution to act in the interests of the consumer.

The CFPB has exclusive examination and primary enforcement authority with respect to compliance with federal consumer financial protection laws and regulations by institutions under its supervision and is authorized, individually or jointly

25


with the federal banking agencies, to conduct investigations to determine whether any person is, or has, engaged in conduct that violates such laws or regulations. The CFPB has the authority to investigate possible violations of federal consumer financial law, hold hearings, and commence civil litigation. The CFPB can issue cease-and-desist orders against banks and other entities that violate consumer financial laws. The CFPB also may institute a civil action against an entity in violation of federal consumer financial law in order to impose a civil penalty or an injunction. The CFPB has examination and enforcement authority over all banks with more than $10 billion in assets, as well as certain of their affiliates.

The CFPB is also authorized to collect fines and provide consumer restitution in the event of violations, engage in consumer financial education, track consumer complaints, request data and promote the availability of financial services to underserved consumers and communities. The CFPB is authorized to pursue administrative proceedings or litigation for violations of federal consumer financial laws. In these proceedings, the CFPB can obtain cease and desist orders (which can include orders for restitution or rescission of contracts, as well as other kinds of affirmative relief) and monetary penalties which, for 2022,2023, range from $6,323$6,813 per day for minor violations of federal consumer financial laws (including the CFPB’s own rules) to $31,616$34,065 per day for reckless violations and $1,264,622$1,362,567 per day for knowing violations. The CFPB monetary penalty amounts are adjusted annually for inflation. Also, where a company has violated Title X of the Dodd-Frank Act or CFPB regulations under Title X, the Dodd-Frank Act empowers state attorneys general and state regulators to bring civil actions for the kind of cease and desist orders available to the CFPB (but not for civil penalties).

In May 2022, the CFPB issued an Interpretive Rule to clarify the authority of states to enforce federal consumer financial protections laws under the Consumer Financial Protection Act of 2010 (“CFPA”). Specifically, the CFPB confirmed that (1) states can enforce the CFPA, including the provision making it unlawful for covered persons or service providers to violate any provision of federal consumer financial protection law; (2) the enforcement authority of states under section 1042 of the CFPA is generally not subject to certain limits applicable to the CFPB’s enforcement authority, such that States may be able to bring actions against a broader cross-section of companies than the CFPB; and (3) state attorneys general and regulators may bring (or continue to pursue) actions under their CFPA authority even if the CFPB is pursuing a concurrent action against the same entity. See CFPB Interpretive Rule regarding Section 1042 of the Consumer Financial Protection Act of 2010 (87 FR 31940, May 26, 2022).


Supervision and Regulation of Mortgage Banking Operations

Our mortgage banking business is subject to the rules and regulations of the U.S. Department of Housing and Urban Development (“HUD”), the Federal Housing Administration, the Veterans’ Administration (“VA”) and Fannie Mae and Freddie Mac with respect to originating, processing, selling and servicing mortgage loans. Those rules and regulations, among other things, prohibit discrimination and establish underwriting guidelines, which include provisions for inspections and appraisals, require credit reports on prospective borrowers, and fix maximum loan amounts. Lenders are required annually to submit audited financial statements to Fannie Mae, FHA and VA. Each of these regulatory entities has its

24


own financial requirements. We are also subject to examination by Fannie Mae, FHA and VA to assure compliance with the applicable regulations, policies and procedures. Mortgage origination activities are subject to, among others, the Equal Credit Opportunity Act, the Federal Truth-in-Lending Act, the Fair Housing Act, the Fair Credit Report Act, the National Flood Insurance Act and the Real Estate Settlement Procedures Act and related regulations that prohibit discrimination and require the disclosure of certain basic information to mortgagors concerning credit terms and settlement costs. Our mortgage banking operations are also affected by various state and local laws and regulations and the requirements of various private mortgage investors.


Enterprise Risk Management

The Company’s and the Bank’s Boards of Directors are actively engaged in the process of overseeing the efforts made by the Enterprise Risk Management department to identify, measure, monitor, mitigate, and report risk. The Company has established an ERM program that reinforces a strong risk culture to support sound risk management practices. The Board is responsible for the approval and oversight of the ERM program and framework.

ERM is responsible for setting and aligning the Company’s Risk Appetite Policy with the goals and objectives set forth in the budget, and the strategic and capital plans. Internal controls and ongoing monitoring processes capture and address heightened risks that threaten the Company’s ability to achieve our goals and objectives, including the recognition of safety and soundness concerns and consumer protection. Additionally, ERM monitors key risk indicators against the established risk warning levels and limits, as well as elevated risks identified by the Chief Risk Officer.


26


Recent Events

Declaration of Dividend on Common Shares

On January 24, 2023,30, 2024, our Board of Directors declared a quarterly cash dividend on the Company’s common stock $0.05 per share, which represented a reduction from the prior quarterly cash dividend of $0.17 per share. The dividend was payablepaid on February 16, 202328, 2024 to common stockholders of record as of February 6, 2023.14, 2024. On March 7, 2024, the Company announced that future quarterly cash dividends on shares of the Company’s common stock would be further reduced to $0.01 per share.

Equity Capital Raise

On March 7, 2024, we entered into separate investment agreements with (a) affiliates of funds managed by Liberty 77 Capital, L.P. (“Liberty

Mortgage Restructuring”), (b) affiliates of funds managed by Hudson Bay Capital Management, LP (“

Legacy Flagstar proactively rightsized its mortgage operation throughout 2022Hudson Bay”), (c) affiliates of funds managed by Reverence Capital Partners L.P. (“Reverence”), and (d) certain other investors (the “Other Investors” and, collectively with Liberty, Reverence and Hudson Bay, the “Investors”, and the investments agreements entered into with each of the Investors on March 7, 2024, collectively, the “Original Investment Agreements”). On March 11, 2024, NYCB entered into separate amendments to adjust for market conditions. The mortgage business is cyclical by naturethe Original Investment Agreements with Liberty (such agreement, as amended, the “Liberty Investment Agreement”), Hudson Bay (such agreements, as amended, the “Hudson Bay Investment Agreements”) and challenging conditions are expectedReverence (such agreement, as amended, the “Reverence Agreement” and, collectively with the Liberty Agreement, the Hudson Bay Agreements and the Original Investment Agreements of the Other Investors, the “Investment Agreements”).


Pursuant to continue throughout 2023. To better reflect demand and align to where our brand strength and familiarity lies, the distributed retail channel will reduce coverage by 69% and shift to a branch footprint only-model.

We expect that these actions will optimize our mortgage business and improve profitability duringInvestment Agreements, on March 11, 2024, the current mortgage down cycle, while still allowing us to participateInvestors invested an aggregate of approximately $1.05 billion in the upside onceCompany in exchange for the interest rate cycle becomes favorable. This allows us to maintainsale and issuance by the Company of (a) 76,630,965 shares of our common stock, at a retail presence withinpurchase price per share of $2.00, (b) 192,062 shares of a new series of our nine-state footprint, leveragespreferred stock, par value $0.01 per share, designated as Series B Noncumulative Convertible Preferred Stock (the “Series B Preferred Stock”), at a price per share of $2,000, each share of which is convertible into 1,000 shares of common stock (or, in certain limited circumstances, one share of Series C Preferred Stock (as defined below)), (c) 256,307 shares of a new series of our marketingpreferred stock, par value $0.01 per share, designated as Series C Noncumulative Convertible Preferred Stock (the “Series C Preferred Stock”, together with the Series B Preferred Stock, the “Preferred Stock”), at a price per share of $2,000, each share of which is convertible into 1,000 shares of common stock, and branding spend, and reduces risk. More importantly, it leaves our position within(d) warrants (the “Issued Warrants”), which may not be exercised until 180 days after issuance thereof, affording the mortgage industry intact. We remain oneholder thereof the right, until the seven-year anniversary of the largest bank originators,issuance of such Issued Warrant, to purchase for $2,500 per share, shares of a new class of non-voting, common-equivalent preferred stock of the 6th largest sub-servicerCompany (the “Series D NVCE Stock”), each share of Series D NVCE Stock is convertible into 1,000 shares of common stock (or, in certain limited circumstances, one share of Series C Preferred Stock), and all of which shares of Series D NVCE Stock, upon issuance, will represent the right (on an as converted basis) to receive 315,000,000 million shares of common stock.


On March 11, 2024, we entered into a Registration Rights Agreement with each Investor (the “Registration Rights Agreement”), pursuant to which we will provide customary registration rights to the Investors and their affiliates and certain permitted transferees with respect to, among other things, (a) the shares of our common stock purchased under the Investment Agreements, (b) shares of our common stock issued upon the conversion of shares of the Preferred Stock and exercise of the Issued Warrants purchased under the Investment Agreements, (c) in certain circumstances, the shares of Preferred Stock and (d) the Warrants. Under the Registration Rights Agreement, the Investors are entitled to customary shelf registration rights (which will initially be on a Form S-1) and customary piggyback registration rights, in each case, subject to certain limitations as set forth in the country,Registration Rights Agreement. Liberty and Reverence will additionally be entitled to request a certain number of marketed and unmarketed underwritten shelf takedowns and shall have the right to select the managing underwriter to administer any underwritten shelf takedowns provided the selection is reasonably acceptable to us.

The foregoing description of the Investment Agreements, the Registration Rights Agreement, the Issued Warrant, and the 2nd largest warehouse lender. Moreover, it allows us to continue to lendtransactions contemplated thereby are not complete and are qualified in all six channels and maintain our commitmenttheir entirety by reference to the correspondentfull text of the Investment Agreements, which are filed as Exhibits 10.18–20 to this Annual Report on Form 10-K, the Registration Rights Agreement, which is filed as Exhibit 10.21 to this Annual Report on Form 10-K, and broker business.the IssuedWarrant, which is filed as Exhibit 4.5 to this Annual Report on Form 10-K, and in each case incorporated by reference herein.

In connection with this capital raise, (i) Joseph Otting was appointed as President and Chief Executive Officer of the Company, effective as of April 1, 2024, (ii) Alessandro DiNello was named Non-Executive Chairman of the Company, effective as of April 1, 2024, (iii) the Board of Directors of the Company was reduced to ten members, and (iv) four new directors (Steven Mnuchin, Joseph Otting, Allen Puwalski and Milton Berlinski) were appointed to the Board.

Additionally, the Company announced on March 11, 2024 that it plans to submit to its stockholders a plan for the adoption and approval of at least a 1-3 reverse stock split of our common stock and to increase the number of authorized shares

27

25


of the Company's common stock to at least 1,700,000,000 (or at least 566,670,000 in the event of approval of the reverse stock split).

ITEM

Item 1A. RISK FACTORSRisk Factors

There are various risks and uncertainties that are inherent to our business. Primary among these are (1) interest rate risk, which arises from movements in interest rates; (2) credit risk, which arises from an obligor’s failure to meet the terms of any contract with a bank or to otherwise perform as agreed; (3) risks related to our financial statements; (4) liquidity and dividend risk, which arises from a bank’s inability to meet its obligations when they come due without incurring unacceptable losses;losses, and related risks regarding our ability to pay dividends; (5) legal/compliance risk, which arises from violations of, or non-conformance with, laws, rules, regulations, prescribed practices, or ethical standards; (6) financial and market risk, which arises from changes in the value of portfolios of financial instruments;instruments, as well as other matters that may dilute the value of our securities; (7) strategic risk, which is the risk of loss arising from the execution of our strategic initiatives and business strategies, including our acquisition and integration of other companies we acquire, as well as inadequate or failed internal processes, people, and systems;acquire; (8) operational risk, which arises from problems with service or product delivery; and (9) reputational risk, which arises from negative public opinion resulting in a significant decline in stockholder value.

Following is a discussion of the material risks and uncertainties that could have a material adverse impact on our financial condition, results of operations, and the value of our shares. The failure to properly identify, monitor, and mitigate any of the below referenced risks, could result in increased regulatory risk and could potentially have an adverse impact on the Company. Additional risks that are not currently known to us, or that we currently believe to be immaterial, also may have a material effect on our financial condition and results of operations. This reportAnnual Report on Form 10-K is qualified in its entirety by those risk factors.

Summary of Risk Factors

Interest Rate Risks
Changes in interest rates could reduce our net interest income and negatively impact the value of our loans, securities, and other assets and have a material adverse effect on our cash flows, financial condition, results of operations, and capital.


Credit Risks
Our allowance for credit losses might not be sufficient to cover our actual losses, which would adversely impact our financial condition and results of operations.
Our concentration in multi-family loans and CRE loans could expose us to increased lending risks and related loan losses.
Our New York State multi-family loan portfolio could be adversely impacted by changes in legislation or regulations.
Economic weakness in the New York City metropolitan region could have an adverse impact on our financial condition.

Financial Statements Risks
Our accounting estimates and risk management processes rely on analytical and forecasting models.
Impairment in the carrying value of other intangible assets could negatively impact our financial condition.
We may fail to maintain effective internal controls, which could impact the accuracy and timeliness of financial reporting.

Liquidity and Dividend Risks
Failure to maintain an adequate level of liquidity could result in an inability to fulfill our financial obligations and also could subject us to material reputational and compliance risk.
Reduction or elimination of our quarterly cash dividend could have an adverse impact on the market price of our stock.
The inability to receive dividends from our subsidiary bank could have a material adverse effect on our financial condition or results of operations, and our ability to maintain or increase the current level of cash dividends we pay to our stockholders.
If we were to defer payments on our trust preferred capital debt securities or were in default under the related indentures, we would be prohibited from paying dividends or distributions on our common stock.
Dividends on our Series A, B and C Preferred Stock are discretionary and noncumulative, and may not be paid if such payment will result in our failure to comply with all applicable laws and regulations.

28


Our Series A, B, and C Preferred Stocks have preferential rights over common stockholders, potentially impacting our liquidity and financial condition.

Legal/Compliance Risks
Inability to fulfill minimum capital requirements could limit our ability to conduct or expand our business, pay a dividend, or result in termination of our FDIC deposit insurance, and thus impact our financial condition, our results of operations, and the market value of our stock.
Our results of operations could be materially affected by restrictions on our operations imposed by bank regulators, changes in bank regulation, or by our ability to comply with certain existing laws, rules, and regulations governing our industry.
As a Category IV banking organization, we are subject to stringent regulations, including reporting, capital stress testing, and liquidity risk management and non-compliance could result in regulatory risks and restrictions on our activities.
Noncompliance with the Bank Secrecy Act and anti-money laundering statutes/regulations could result in material financial loss.
Failure to comply with OFAC regulations could result in legal and reputational risks.
Our enterprise risk management framework may not be effective in mitigating the risks to which we are subject.
If tax authorities determine that we did not adequately provide for our taxes, our income tax expense could be increased.
We are subject to numerous consumer protection laws, and failure to comply with these laws could lead to sanctions.
Legislative and regulatory focus on data privacy and risks can subject us to heightened scrutiny and reputational damage.

Financial and Market Risks
Declines in economic conditions could adversely affect the values of loans we originate and securities in which we invest.
Rising mortgage rates and adverse changes in mortgage market conditions could reduce mortgage revenue.
We are highly dependent on the Agencies to buy mortgage loans that we originate, and changes in these entities or in the manner or volume of loans they purchase or their current roles could adversely affect our business and financial condition.
Changes in the servicing, origination, or underwriting guidelines or criteria required by the Agencies could adversely affect our business, financial condition and results of operations.
Future sales or issuances of our common stock or other securities (including warrants) or the issuance of securities pursuant to the exercise of warrants issued by us may dilute existing holders of our common stock and other securities, decrease the value of our common stock and other securities and adversely affect the market price of our common stock and other securities.

Strategic Risks
Extensive competition for loans and deposits could adversely affect the expansion of our business and our financial condition.
Limitations on our ability to grow our loan portfolios could adversely affect our ability to generate interest income.
The inability to engage in merger transactions, or to realize the anticipated benefits of acquisitions in which we might engage, could adversely affect our ability to compete with other financial institutions and weaken our financial performance.
We may be exposed to challenges in combining the operations of acquired or merged businesses, including our recent Flagstar acquisition and Signature acquisition, into our operations, which may prevent us from achieving the expected benefits from our merger and acquisition activities.
The success of the Signature transaction will depend on a number of uncertain factors, including our decisions regarding the fair value of the assets acquired and the bargain purchase gain recorded on the transaction, which could materially and adversely affect our financial condition, results of operations and future prospects.

Operational Risks
Our stress testing processes rely on analytical and forecasting models that may prove to be inadequate or inaccurate, which could adversely affect the effectiveness of our strategic planning and our ability to pursue certain corporate goals.
The Company, entities that we have acquired, and certain of our service providers have experienced information technology security breaches and may be vulnerable to future security breaches, which have resulted in, and could result in, additional expenses, exposure to civil litigation, increased regulatory scrutiny, losses, and a loss of customers.

29


We rely on third parties to perform certain key business functions, which may expose us to further operational risk.
Failure to keep pace with technological changes could have a material adverse impact on our ability to compete for loans and deposits, and therefore on our financial condition and results of operations.
The inability to attract and retain key personnel could adversely impact our operations.
The transition to a new Chief Executive Officer will be critical to our success and our business may be adversely impacted if we do not successfully manage the transition process in a timely manner.
Our operations are dependent upon the soundness of other financial intermediaries and thus could expose us to systemic risk.
We may be terminated as a servicer or subservicer or incur costs or liabilities if we do not satisfy servicing obligations.
We may be required to repurchase mortgage loans, pay fees or indemnify buyers against losses.
We utilize third-party mortgage originators which subjects us to strategic, reputation, compliance and operational risk.
We are subject to various legal or regulatory investigations and proceedings.
We may be required to pay interest on mortgage escrow accounts under state law despite Federal preemption.
We could be exposed to fraud risks that affect our operations and reputation.

Reputational Risk
Damage to our reputation could significantly harm the business we engage in, our competitive position and growth prospects.
Increasing scrutiny from customers, regulators, investors, and other stakeholders with respect to our environmental, social, and governance practices may impose additional costs on us or expose us to new or additional risks.

Interest Rate Risks

Changes in interest rates could reduce our net interest income and negatively impact the value of our loans, securities, and other assets. This could have a material adverse effect on our cash flows, financial condition, results of operations, and capital.

The cost of our deposits and short-term wholesale borrowings is largely based on short-term interest rates, the level of which is driven by the FOMC of the FRB. However, the yields generated by our loans and securities are typically driven by intermediate-term interest rates, which are set by the bond market and generally vary from day to day. The level of our net interest income is therefore influenced by movements in such interest rates, and the pace at which such movements occur. If the interest rates on our interest-bearing liabilities increase at a faster pace than the interest rates on our interest-earning assets, the result could be a reduction in net interest income and, with it, a reduction in our earnings. Our net interest income and earnings would be similarly impacted were the interest rates on our interest-earning assets to decline more quickly than the interest rates on our interest-bearing liabilities. In addition, such changes in interest rates could affect our ability to originate loans and attract and retain deposits; the fair values of our securities and other financial assets; the fair values of our liabilities; and the average lives of our loan and securities portfolios. Changes in interest rates also could have an effect on loan refinancing activity, which, in turn, would impact the amount of prepayment income we receive on our multi-family and CRE loans. Because prepayment income is recorded as interest income, the extent to which it increases or decreases during any given period could have a significant impact on the level of net interest income and net income we generate during that time. Also, changes in interest rates could have an effect on the slope of the yield curve. If the yield curve were to invert or become flat, our net interest income and net interest margin could contract, adversely affecting our net income and cash flows, and the value of our assets. Moreover, higher inflation could lead to fluctuations in the value of our assets and liabilities and off-balance sheet exposures, and could result in lower equity market valuations of financial services companies.

26


Changes to and replacement of the LIBOR Benchmark Interest Rate may adversely affect our business, financial condition, and results of operations.

The Company has certain loans, interest rate swap agreements, investment securities, and debt obligations whose interest rate is indexed to LIBOR. In 2017, the FCA, which is responsible for regulating LIBOR, announced that the publication of LIBOR is not guaranteed beyond 2021. In December 2020, the administrator of LIBOR announced its intention to (i) cease the publication of the one-week and two-month U.S. dollar LIBOR after December 31, 2021, and (ii) cease the publication of all other tenors of U.S. dollar LIBOR (one, three, six, and 12-month LIBOR) after June 30, 2023, and on March 15, 2021, announced that it will permanently cease to publish most LIBOR settings beginning on January 1, 2022 and cease to publish the overnight, one-month, three-month, six-month, and 12-month U.S. dollar LIBOR settings on July 1, 2023. Accordingly, the FCA has stated that it does not intend to persuade or compel banks to submit to LIBOR after such respective dates. Until such time, however, FCA panel banks have agreed to continue to support LIBOR. In October 2021, the Federal bank regulatory agencies issued a Joint Statement on Managing the LIBOR Transition that offered their regulatory expectations and outlined potential supervisory and enforcement consequences for banks that fail to adequately plan for and implement the transition away from LIBOR. The failure to properly transition away from LIBOR may result in increased supervisory scrutiny. The implementation of a substitute index for the calculation of interest rates under the Company's loan agreements may result in disputes or litigation with counterparties over the appropriateness or comparability to LIBOR of the substitute index, which would have an adverse effect on the Company's results of operations. Even when robust fallback language is included, there can be no assurances that the replacement rate plus any spread adjustment will be economically equivalent to LIBOR, which could result in a lower interest rate being paid to the Company on such assets.

The Alternative Reference Rates Committee (a group of private-market participants convened by the FRB and the FRB-NY) has identified SOFR as the recommended alternative to LIBOR. The use of SOFR as a substitute for LIBOR is voluntary and may not be suitable for all market participants. SOFR is calculated and observed differently than LIBOR. Given the manner in which SOFR is calculated, it is likely to be lower than LIBOR and is less likely to correlate with the funding costs of financial institutions. Market practices related to SOFR calculation conventions continue to develop and may vary. Inconsistent calculation conventions among financial products may expose is to increased basic rate and resultant costs. Other alternatives to LIBOR also exist, but, because of the difference in how those alternatives are constructed, they may diverge significantly from LIBOR in a range of situations and market conditions.

Credit Risk

Our allowance for credit losses might not be sufficient to cover our actual losses, which would adversely impact our financial condition and results of operations.

In addition to mitigating credit risk through our underwriting processes, we attempt to mitigate such risk through the establishment of an allowance for credit losses. The process of determining whether or not the allowance is sufficient to cover potential credit losses is based on the current expected credit loss model or CECL. This methodology is described in detail under “Critical Accounting Estimates” in Item 7, “Management’s Discussion and Analysis of Financial Condition and Results of Operations” in this report. CECL may result in greater volatility in the level of the ACL, depending on various assumptions and factors used in this model. If the judgments and assumptions we make with regard to the allowance are incorrect, our allowance for losses on such loans might not be sufficient, and an additional provision for credit losses might need to be made. Depending on the amount of such loan loss provisions, the adverse impact on our earnings could be material. In addition,

30


growth in our loan portfolio may require us to increase the allowance for credit losses on such loans by making additional provisions, which would reduce our net income.

Furthermore, bank regulators have the authority to require us to make provisions for credit losses or otherwise recognize loan charge-offs following their periodic review of our loan portfolio, our underwriting procedures, and our allowance for losses on such loans. Any increase in the loan loss allowance or in loan charge-offs as required by such regulatory authorities could have a material adverse effect on our financial condition and results of operations.

Our concentration in multi-family loans and CRE loans could expose us to increased lending risks and related loan losses.

At December 31, 2022, $38.12023, $37.3 billion or 5544.0 percent of our total loans and leases, held for investment portfolio consisted of multi-family loans and $8.5$10.5 billion or 1212.4 percent consisted of CRE loans. These types of loans generally expose a lender to greater risk of non-payment and loss than one-to-four family residential mortgage loans because

27


repayment of the loans often depends on the successful operation of the properties and the sale of such properties securing the loans. Such loans typically involve larger loan balances to single borrowers or groups of related borrowers compared to one-to-four family residential loans. Also, many of our borrowers have more than one of these types of loans outstanding. Consequently, an adverse development with respect to one loan or one credit relationship can expose us to a significantly greater risk of loss compared to an adverse development with respect to a one-to-four family residential real estate loan. In addition, if loans that are collateralized by real estate become troubled and the value of the real estate has been significantly impaired, then we may not be able to recover the full contractual amount of principal and interest that we anticipated at the time we originated the loan, which could cause us to increase our provision for loan losses and adversely affect our operating results and financial condition.


The CRE loans we make are secured by income-producing properties such as office buildings, retail centers, mixed-use buildings, and multi-tenanted light industrial properties. At December 31, 2023, $3.4 billion, or 32.1 percent of our commercial real estate loan portfolio was secured by office buildings. We may incur future losses on commercial real estate loans due to declines in occupancy rates and rental rates in office buildings, which could occur as a result of less need for office space due to more people working from home or other factors.

Our New York State multi-family loan portfolio could be adversely impacted by changes in legislation or regulation which, in turn, could have a material adverse effect on our financial condition and results of operations.

On June 14, 2019, the New York State legislature passed the New York Housing Stability and Tenant Protection Act of 2019. This legislation represents the most extensive reform of New York State’s rent laws in several decades and generally limits a landlord’s ability to increase rents on rent regulated apartments and makes it more difficult to convert rent regulated apartments to market rate apartments. As a result, the value of the collateral located in New York State securing the Company’s multi-family loans or the future net operating income of such properties could potentially become impaired which, in turn, could have a material adverse effect on our financial condition and results of operations. To date, the Company has not experienced any material negative impacts as a result of this legislation.

Economic weakness in the New York City metropolitan region, where the majority of the properties collateralizing our multi-family, CRE, and ADC loans, and the majority of the businesses collateralizing our other C&I loans, are located could have an adverse impact on our financial condition and results of operations.

Our business depends significantly on general economic conditions in the New York City metropolitan region, where the majority of the buildings and properties securing the multi-family, CRE, and ADC loans we originate for investment and the businesses of the customers to whom we make our other C&I loans are located. Accordingly, the ability of our borrowers to repay their loans, and the value of the collateral securing such loans, may be significantly affected by economic conditions in this region, including changes in the local real estate market. A significant decline in general economic conditions caused by inflation, recession, unemployment, acts of terrorism, extreme weather, or other factors beyond our control, could therefore have an adverse effect on our financial condition and results of operations. In addition, because multi-family and CRE loans represent the majority of the loans in our portfolio, a decline in tenant occupancy or rents, due to such factors, or for other reasons, such as new legislation, could adversely impact the ability of our borrowers to repay their loans on a timely basis, which could have a negative impact on our net income. Furthermore, economic or market turmoil could occur in the near or long term. This could negatively affect our business, our financial condition, and our results of operations, as well as our ability to maintain or increase the level of cash dividends we currently pay to our stockholders.

31


Financial Statements Risk

Our accounting estimates and risk management processes rely on analytical and forecasting models.

The processes we use to estimate expected losses and to measure the fair value of financial instruments, as well as the processes used to estimate the effects of changing interest rates and other market measures on our financial condition and results of operations, depends upon the use of analytical and forecasting models. These models reflect assumptions that may not be accurate, particularly in times of market stress or other unforeseen circumstances. Even if these assumptions are adequate, the models may prove to be inadequate or inaccurate because of other flaws in their design or their implementation. If the models that we use for interest rate risk and asset-liability management are inadequate, we may incur increased or unexpected losses upon changes in market interest rates or other market measures. If the models that we use for determining our expected losses are inadequate, the allowance for loan losses may not be sufficient to support future charge-offs. If the models that we use to measure the fair value of financial instruments are inadequate, the fair value of such financial instruments may fluctuate unexpectedly or may not accurately reflect what we could realize upon sale or settlement of such financial instruments. Any such failure in our analytical or forecasting models could have a material adverse effect on our business, financial condition and results of operations.

28


Impairment in the carrying value of goodwill and other intangible assets could negatively impact our financial condition and results of operations.

At December 31, 2022, goodwill and2023, other intangible assets, primarily core deposit intangibles, totaled $2.7 billion. Goodwill and$625 million. We review our other intangible assets are reviewed for impairment at least annually or more frequently if events or changes in circumstances indicate that the carrying value may not be recoverable. A significant decline in expected future cash flows, a material change in interest rates, a significant adverse change in the business climate, slower growth rates, or a significant or sustained decline in the price of our common stockdeposits may necessitate taking additional charges in the future related to the impairment of goodwill and other intangible assets. The amount of any impairment charge could be significant and could have a material adverse impact on our financial condition and results of operations.

We may fail to maintain effective internal controls, which could impact the accuracy and timeliness of financial reporting.

We recognize the critical importance of maintaining effective internal controls over financial reporting to ensure accurate and timely financial reporting, prevent fraud, and maintain investor confidence. We have implemented a system of internal controls that is regularly reviewed and updated. However, there is a risk that we may fail to maintain an effective system of internal controls, which could impair our ability to report financial results accurately and in a timely manner. These risks include human error, misconduct, inadequate processes, fraud, data breaches, and non-compliance with laws and regulations. We also acknowledge the challenges posed by changes in processes, procedures, technologies, employee turnover, and labor shortages. We have identified certain material weaknesses described in Item 9A of this Annual Report on Form 10-K and may discover additional future material weaknesses or significant deficiencies, which could divert management attention and increase our expenses, in order to correct the weaknesses or deficiencies in our controls. A "material weakness" is a deficiency, or a combination of deficiencies, in internal controls over financial reporting such that there is a reasonable possibility that a material misstatement of our annual or interim financial statements would not be prevented or detected on a timely basis. Control weaknesses or failures could result in financial losses, reputational harm, loss of investor confidence, regulatory actions, and limitations on our business activities.

Liquidity and Dividend Risks

Failure to maintain an adequate level of liquidity could result in an inability to fulfill our financial obligations and also could subject us to material reputational and compliance risk.

Our primary sources of liquidity are the retail and institutional deposits we gather or acquire in connection with acquisitions, and the brokered deposits we accept; borrowed funds, primarily in the form of wholesale borrowings from the FHLB-NY and various Wall Street brokerage firms; cash flows generated through the repayment and sale of loans; and cash flows generated through the repayment and sale of securities. In addition, and depending on current market conditions, we have the ability to access the capital markets from time to time to generate additional liquidity. Deposit flows, calls of investment securities and wholesale borrowings, and the prepayment of loans and mortgage-related securities are strongly influenced by such external factors as the direction of interest rates, whether actual or perceived; local and national economic conditions; and competition for deposits and loans in the markets we serve. Deposit outflows can occur for a number of reasons, including clients seeking higher yields, clients with uninsured deposits may seek greater financial security or clients may simply prefer to do business with our competitors, or for other reasons. The withdrawal of more deposits than we anticipate could have an adverse impact on our profitability as this source of funding, if not replaced by similar deposit funding, would need to be

32


replaced with more expensive wholesale funding, the sale of interest-earning assets, other sources of funding, or a combination of the two.them all. The replacement of deposit funding with wholesale funding could cause our overall cost of funds to increase, which would reduce our net interest income and results of operations. A decline in interest-earning assets would also lower our net interest income and results of operations. As of December 31, 2023, approximately 35.9 percent of our total deposits of $81.5 billion were not FDIC-insured.

In addition, large-scale withdrawals of brokered or institutional deposits could require us to pay significantly higher interest rates on our retail deposits or on other wholesale funding sources, which would have an adverse impact on our net interest income and net income. Furthermore, changes to the FHLB-NY’s underwriting guidelines for wholesale borrowings or lending policies may limit or restrict our ability to borrow, and therefore could have a significant adverse impact on our liquidity. A decline in available funding could adversely impact our ability to originate loans, invest in securities, and meet our expenses, or to fulfill such obligations as repaying our borrowings or meeting deposit withdrawal demands. A downgradeDowngrades of the credit ratings of the Company and the Bank, such as those announced by certain credit rating agencies in both February and March 2024, could alsoresult in an acceleration in deposit outflows and additional collateral needs, which this far have been modest. They could adversely affect our access to liquidity and capital, and could significantly increase our cost of funds, trigger additional collateral or funding requirements, and decrease the number of investors and counterparties willing to lend to us or to purchase our securities. This could affect our growth, profitability, and financial condition, including our liquidity.

Reduction or elimination of our quarterly cash dividend could have an adverse impact on the market price of our common stock.

The holders of our common stock are only entitled to receive such dividends as our Board of Directors may declare out of funds available for such payments under applicable law and regulatory guidance, and, although we have historically declared cash dividends on our common stock, we are not required to do so. Furthermore, the payment of dividends falls under federal regulations that have grown more stringent in recent years. While we pay our quarterly cash dividend in compliance with current regulations, such regulations could change in the future. As a result of our acquisitions of Flagstar and Signature, we are required to seek regulatory approval from the OCC for the payment of any dividend to the Parent Company through at least the period ending November 1, 2024, which could restrict our ability to pay the common stock dividend. In the Company’s January 31, 2024 earnings release for the fourth quarter and year ended December 31, 2023, the Company announced that its Board of Directors reduced the Company’s quarterly cash dividend to $0.05 per common share to accelerate the building of capital to support our balance sheet as a Category IV banking organization. Following the issuance of that earnings release, the market price of our common stock experienced a decline. On March 7, 2024, the Company announced that future quarterly cash dividends on shares of the Company's common stock would be further reduced to $0.01 per share. Any further reduction or elimination of our common stock dividend in the future due to actions to build capital or the inability to receive required regulatory approvals, or for any other reason, could adversely affect the market price of our common stock.

The inability to receive dividends from our subsidiary bank could have a material adverse effect on our financial condition or results of operations, as well as our ability to maintain or increase the current level of cash dividends we pay to our stockholders.

The Parent Company (i.e., the company on an unconsolidated basis) is a separate and distinct legal entity from the Bank, and a substantial portion of the revenues the Parent Company receives consists of dividends from the Bank. These dividends are the primary funding source for the dividends we pay on our common stock and the interest and principal payments on our debt. Various federal and state laws and regulations limit the amount of dividends that a bank may pay to its parent company. In addition, our right to participate in a distribution of assets upon the liquidation or reorganization of a subsidiary may be subject to the prior claims of the subsidiary’s creditors. As a result of our acquisitions of Flagstar and Signature, we are required to seek regulatory approval from the OCC for the payment of any dividend to the Bancorp through at least the period ending November 1, 2024. If the Bank is unable to pay dividends to the Parent Company, we might not be able to service our debt, pay our obligations, or pay dividends on our common stock.

If we were to defer payments on our trust preferred capital debt securities or were in default under the related indentures, we would be prohibited from paying dividends or distributions on our common stock.

The terms of our outstanding trust preferred capital debt securities prohibit us from (1) declaring or paying any dividends or distributions on our capital stock, including our common stock; or (2) purchasing, acquiring, or making a liquidation payment on such stock, under the following circumstances: (a) if an event of default has occurred and is continuing under the applicable indenture; (b) if we are in default with respect to a payment under the guarantee of the related trust preferred securities; or (c) if we have given notice of our election to defer interest payments but the related deferral period has not yet

33


commenced, or a deferral period is continuing. In addition, without notice to, or consent from, the holders of our common stock, we may issue additional series of trust preferred capital debt securities with similar terms, or enter into other financing agreements, that limit our ability to pay dividends on our common stock.

29


Dividends on theour Series A Preferred Stock, Series B Preferred Stock and Series C Preferred Stock are discretionary and noncumulative, and may not be paid if such payment will result in our failure to comply with all applicable laws and regulations.

Dividends on theour Series A Preferred Stock, Series B Preferred Stock and Series C Preferred Stock are discretionary and noncumulative. If our Board of Directors (or any duly authorized committee of the Board) does not authorize and declare a dividend on (a) the Series A Preferred Stock for any dividend period, holders of the depositarydepository shares will not be entitled to receive any dividend for that dividend period, and the unpaid dividend will cease to accrue and be payable. Wepayable, or (b)Series B Preferred Stock and Series C Preferred Stock, the holders thereof will not be entitled to receive any dividend for that dividend period. For our Series A Preferred Stock, we have no obligation to pay dividends accrued for a dividend period after the dividend payment date for that period if our Board of Directors (or any duly authorized committee thereof) has not declared a dividend before the related dividend payment date, whether or not dividends on the Series A Preferred Stock or any other series of our preferred stock or our common stock are declared for any future dividend period. Dividends on our Series B Preferred Stock and Series C Preferred Stock are payable at a rate of 13 percent per annum, payable quarterly and in arrears. Additionally, under the FRB’s capital rules, dividends on the Series A Preferred Stock, Series B Preferred Stock and Series C Preferred Stock may only be paid out of our net income, retained earnings, or surplus related to other additional tier 1 capital instruments. If the non-payment of dividends on Series A Preferred Stock, Series B Preferred Stock and Series C Preferred Stock for any dividend period would cause the Company to fail to comply with any applicable law or regulation, or any agreement we may enter into with our regulators from time to time, then we would not be able to declare or pay a dividend for such dividend period. In such a case,

Our Series A Preferred Stock, Series B Preferred Stock and Series C Preferred Stock initially have rights, preferences and privileges that are not held by, and are preferential to the rights of, our common stockholders, which could adversely affect our liquidity and financial condition.

The holders of our Series A Preferred Stock, Series B Preferred Stock and Series C Preferred Stock initially have the depositary shares will not be entitledright to receive a payment on account of the distribution of assets on any dividend for that dividend period,voluntary or involuntary liquidation, dissolution or winding up of our business before any payment may be made to holders of our common stock. Following the satisfaction of the liquidation preference, the Series B Preferred Stock and Series C Preferred Stock participates with our common stock on an as-converted basis in a liquidation, dissolution or winding up of the unpaid dividend will ceaseCompany. Our obligations to accruethe holders of our Series A Preferred Stock, Series B Preferred Stock and be payable.Series C Preferred Stock could limit our ability to obtain additional financing, which could have an adverse effect on our financial condition. The preferential rights could also result in divergent interests between the holders of our common stock, Series A Preferred Stock, Series B Preferred Stock, Series C Preferred Stock and other classes of securities.

Legal/Compliance Risks

Inability to fulfill minimum capital requirements could limit our ability to conduct or expand our business, pay a dividend, or result in termination of our FDIC deposit insurance, and thus impact our financial condition, our results of operations, and the market value of our stock.

We are subject to the comprehensive, consolidated supervision and regulation set forth by the FRB.FRB and the OCC. Such regulation includes, among other matters, the level of leverage and risk-based capital ratios we are required to maintain. Depending on general economic conditions, changes in our capital position could have a materially adverse impact on our financial condition and risk profile, and also could limit our ability to grow through acquisitions or otherwise. Compliance with regulatory capital requirements may limit our ability to engage in operations that require the intensive use of capital and therefore could adversely affect our ability to maintain our current level of business or expand. Furthermore, it is possible that future regulatory changes could result in more stringent capital or liquidity requirements, including increases in the levels of regulatory capital we are required to maintain and changes in the way capital or liquidity is measured for regulatory purposes, either of which could adversely affect our business and our ability to expand. For example, federal banking regulations adopted under Basel III standards require bank holding companies and banks to undertake significant activities to demonstrate compliance with higher capital requirements. Any additional requirements to increase our capital ratios or liquidity could necessitate our liquidating certain assets, perhaps on terms that are unfavorable to us or that are contrary to our business plans. In addition, such requirements could also compel us to issue additional securities, thus diluting the value of our common stock. In addition, failure to meet established capital requirements could result in the FRB and/or OCC placing limitations or

34


conditions on our activities and further restricting the commencement of new activities. The failure to meet applicable capital guidelines could subject us to a variety of enforcement remedies available to the federal regulatory authorities, including limiting our ability to pay dividends; issuing a directive to increase our capital; and terminating our FDIC deposit insurance.

Our results of operations could be materially affected by the imposition of restrictions on our operations by bank regulators, further changes in bank regulation, or by our ability to comply with certain existing laws, rules, and regulations governing our industry.

We are subject to regulation, supervision, and examination by the following entities: (1) the OCC; (2) the FDIC; (3) the FRB-NY; and (4) the CFPB, as well as state licensing restrictions and limitations regarding certain consumer finance products. Such regulation and supervision govern the activities in which a bank holding company and its banking subsidiaries may engage, and are intended primarily for the protection of the DIF, the banking system in general, and bank customers, rather than for the benefit of a company’s stockholders. These regulatory authorities have extensive discretion in connection with their supervisory and enforcement activities, including with respect to the imposition of restrictions on the operation of a bank or a bank holding company, the imposition of significant fines, the ability to delay or deny merger or other regulatory applications, the payment of dividends, the classification of assets by a bank, and the adequacy of a bank’s allowance for loan losses, among other matters. Failure to comply (or to ensure that our agents and third-party service providers comply) with laws, regulations, or policies, including our failure to obtain any necessary state or local licenses, could result in enforcement actions or sanctions by regulatory agencies, civil money penalties, and/or reputational damage, which could have a material adverse effect on our business, financial

30


condition, or results of operations. Penalties for such violations may also include: revocation of licenses; fines and other monetary penalties; civil and criminal liability; substantially reduced payments by borrowers; modification of the original terms of loans, permanent forgiveness of debt, or inability to, directly or indirectly, collect all or a part of the principal of or interest on loans provided by the Bank. Changes in such regulation and supervision, or changes in regulation or enforcement by such authorities, whether in the form of policy, regulations, legislation, rules, orders, enforcement actions, ratings, or decisions, could have a material impact on the Company, our subsidiary bank and other affiliates, and our operations. In addition, failure of the Company or the Bank to comply with such regulations could have a material adverse effect on our earnings and capital. See “Regulation and Supervision” in Part I, Item 1, “Business” earlier in this filing for a detailed description of the federal, state, and local regulations to which the Company and the Bank are subject.


As a Category IV banking organization with over $100 billion in assets, we are subject to stringent regulations, including reporting, capital stress testing, and liquidity risk management. Non-compliance could result in regulatory risks and restrictions on our activities.

As a result of the Signature transaction, our total assets exceeded $100 billion and therefore we became classified as a Category IV banking organization under the rules issued by the federal banking agencies that tailor the application of enhanced prudential standards to large bank holding companies and the capital and liquidity rules to large bank holding companies and depository institutions under the Dodd-Frank Act and the Economic Growth, Regulatory Relief, and Consumer Protection Act. As a Category IV banking organization we are subject to enhanced liquidity risk management requirements which include reporting, liquidity stress testing, a liquidity buffer and resolution planning, subject to the applicable transition periods. If we were to meet or exceed certain other thresholds for asset size, we would become subject to additional requirements. Failure to meet these requirements could expose us to compliance risks, higher penalties, increased expectations, and limitations on our activities. As a Category IV banking organization, we are required to implement and maintain an adequate liquidity risk management and monitoring process to ensure compliance with these requirements, and our failure to ensure compliance may have adverse consequences on our operations, reputation and future profitability. We anticipate incurring significant expenses to develop policies, programs, and systems that comply with the enhanced standards applicable to us.

Noncompliance with the Bank Secrecy Act and other anti-money laundering statutes and regulations could result in material financial loss.

The BSA and the USA Patriot Act contain anti-money laundering and financial transparency provisions intended to detect and prevent the use of the U.S. financial system for money laundering and terrorist financing activities. The BSA, as amended by the USA Patriot Act, requires depository institutions to undertake activities including maintaining an anti-money laundering program, verifying the identity of clients, monitoring for and reporting suspicious transactions, reporting on cash transactions above a certain threshold, and responding to requests for information by regulatory authorities and law enforcement agencies. FINCEN, a unit of the U.S. Treasury Department that administers the BSA, is authorized to impose significant civil monetary penalties for violations of these requirements. If our BSA policies, procedures and systems are deemed to be deficient, or the BSA policies, procedures and systems of the financial institutions that we acquire in the future are deficient, we would be subject to reputational risk and potential liability, including fines and regulatory actions such as restrictions on our ability to pay

35


dividends and the necessity to obtain regulatory approvals to proceed with certain aspects of our business plan, including our acquisition plans, which would negatively impact our business, financial condition and results of operations.

Failure to comply with OFAC regulations could result in legal and reputational risks.

The United States has imposed economic sanctions that affect transactions with designated foreign countries, foreign nationals, and other potentially exposed persons. These are typically referred to as the "OFAC" rules, given their administration by the United States Treasury Department Office of Foreign Assets Control. Failure to comply with these sanctions could have serious legal and reputational consequences.

Our enterprise risk management framework may not be effective in mitigating the risks to which we are subject, based upon the size, scope, and complexity of the Company.

As a financial institution, we are subject to a number of risks, including interest rate, credit, liquidity, legal/compliance, market, strategic, operational, and reputational. Our ERM framework is designed to minimize the risks to which we are subject, as well as any losses stemming from such risks. Although we seek to identify, measure, monitor, report, and control our exposure to such risks, and employ a broad and diverse set of risk monitoring and mitigation techniques in the process, those techniques are inherently limited because they cannot anticipate the existence or development of risks that are currently unknown and unanticipated. For example, economic and market conditions, heightened legislative and regulatory scrutiny of the financial services industry, and increases in the overall complexity of our operations, among other developments, have resulted in the creation of a variety of risks that were previously unknown and unanticipated, highlighting the intrinsic limitations of our risk monitoring and mitigation techniques. As a result, the further development of previously unknown or unanticipated risks may result in our incurring losses in the future that could adversely impact our financial condition and results of operations. Furthermore, an ineffective ERM framework, as well as other risk factors, could result in a material increase in our FDIC insurance premiums.

If federal, state, or local tax authorities were to determine that we did not adequately provide for our taxes, our income tax expense could be increased, adversely affecting our earnings.

The amount of income taxes we are required to pay on our earnings is based on federal, state, and local legislation and regulations. We provide for current and deferred taxes in our financial statements, based on our results of operations, business activity, legal structure, interpretation of tax statutes, assessment of risk of adjustment upon audit, and application of financial accounting standards. We may take tax return filing positions for which the final determination of tax is uncertain, and our net income and earnings per share could be reduced if a federal, state, or local authority were to assess additional taxes that have not been provided for in our consolidated financial statements.

31


In addition, there can be no assurance that we will achieve our anticipated effective tax rate. Unanticipated changes in tax laws or related regulatory or judicial guidance, or an audit assessment that denies previously recognized tax benefits, could result in our recording tax expenses that materially reduce our net income.


We are subject to numerous laws designed to protect consumers, including the Community Reinvestment Act and fair lending laws, and failure to comply with these laws could lead to a wide variety of sanctions.

The CRA requires the Federal Reserve and OCC to assess our performance in meeting the credit needs of the communities we serve, including low- and moderate-income neighborhoods. If the Federal Reserve or OCC determines that we need to improve our performance or are in substantial non-compliance with CRA requirements, various adverse regulatory consequences may ensue. In addition, the Equal Credit Opportunity Act, the Fair Housing Act and other fair lending laws and regulations impose nondiscriminatory lending requirements on financial institutions. The CFPB, the U.S. Department of Justice and other federal agencies are responsible for enforcing these laws and regulations. The CFPB is also authorized to prescribe rules applicable to any covered person or service provider, identifying and prohibiting acts or practices that are “unfair, deceptive, or abusive” in connection with any transaction with a consumer for a consumer financial product or service, or the offering of a consumer financial product or service. A successful regulatory challenge to an institution’s performance under the CRA, fair lending laws or regulations, or consumer lending laws and regulations could result in a wide variety of sanctions, including damages and civil money penalties, injunctive relief, restrictions on mergers and acquisitions activity, restrictions on expansion, and restrictions on entering new business lines. Private parties may also have the ability to challenge an institution’s performance under fair lending laws in private class action litigation. Such actions could have a material adverse effect on our business, financial condition and results of operations. Additionally, state attorneys general have indicated that they intend to take a more active role in enforcing consumer protection laws, including through use of Dodd-Frank Act provisions that authorize state attorneys general to enforce certain provisions of federal consumer financial laws and obtain civil money

36


penalties and other relief available to the CFPB. If we become subject to such investigation, the required response could result in substantial costs and a diversion of the attention and resources of our management.

Legislative and regulatory focus on data privacy and risks can subject us to heightened scrutiny and reputational damage.

Data privacy and cybersecurity risks have become a subject of heightened legislative and regulatory focus in recent years. Federal bank regulatory agencies have proposed regulations to enhance cyber risk management standards, which would apply to us and our third-party service providers. These regulations focus on areas such as cyber risk governance, management of dependencies, incident response, cyber resilience, and situational awareness. State-level legislation and regulations have also been proposed or adopted, requiring notification to individuals in the event of a security breach of their personal data. Examples include the California Consumer Privacy Act (CCPA) and other state-level privacy, data protection, and data security laws and regulations. We collect, maintain, and use non-public personal information of our customers, clients, employees, and others. The sharing, use, disclosure, and protection of this information are governed by federal and state laws. Compliance with these laws is essential to protect the privacy of personal information and avoid potential liability and reputational damage. Failure to comply with privacy laws and regulations may expose us to fines, litigation, or regulatory enforcement actions. It may also require changes to our systems, business practices, or privacy policies, which could adversely impact our operating results. Privacy initiatives have imposed and will continue to impose additional operational burdens on us. These initiatives may limit our ability to pursue desirable business initiatives and increase the risks associated with any future use of personal data. New privacy and data protection initiatives, such as the CCPA, may require changes to policies, procedures, and technology for information security and data segregation. Non-compliance with these initiatives may make us more vulnerable to operational failures and subject to monetary penalties, litigation, or regulatory enforcement actions.

Financial and Market Risks

A decline in economic conditions could adversely affect the value of the loans we originate and the securities in which we invest.

Declines in real estate values and an increase in the financial stress on borrowers stemming from high unemployment or other adverse economic conditions, could negatively affect our borrowers and, in turn, the repayment of the loans in our portfolio. Deterioration in economic conditions also could subject us and our industry to increased regulatory scrutiny, and could result in an increase in loan delinquencies, an increase in problem assets and foreclosures, and a decline in the value of the collateral for our loans, which could reduce our customers’ borrowing power. Deterioration in local economic conditions could drive the level of loan losses beyond the level we have provided for in our loan loss allowance; this, in turn, could necessitate an increase in our provisions for loan losses, which would reduce our earnings and capital. Furthermore, declines in the value of our investment securities could result in our having to record losses based on the other-than-temporary impairment of securities, which would reduce our earnings and also could reduce our capital. In addition, continued economic weakness could reduce the demand for our products and services, which would adversely impact our liquidity and the revenues we produce.

Higher inflation could have a negative impact on our financial results and operations.

Inflation can negatively impact the Company by increasing our labor costs, through higher wages and higher interest rates, which may negatively affect the market value of securities on our balance sheet, higher interest expenses on our deposits, especially CDs, and a higher cost of our borrowings. Additionally, higher inflation levels could lead to higher oil and gas prices, which may negatively impact the net operating income on the properties which we lend on and could impair a borrower's ability to repay their mortgage.

Rising mortgage rates and adverse changes in mortgage market conditions could reduce mortgage revenue.

The residential real estate mortgage lending business is sensitive to changes in interest rates, especially long-term interest rates. Lower interest rates generally increase the volume of mortgage originations, while higher interest rates generally cause that volume to decrease. Therefore, our mortgage performance is typically correlated to fluctuations in interest rates, primarily the 10-year U.S. Treasury rate. Historically, mortgage origination volume and

32


sales for the Bank and for other financial institutions have risen and fallen in response to these and other factors. An increase in interest rates and/or a decrease in our mortgage production volume could have a materially adverse effect on our operating results. The 10-year U.S. Treasury rate was 3.883.97 percent at December 31, 2022,2023, and averaged 2.952.96 percent during 2022, 1512023, 101 basis points higher than average rates experienced during 2021.2022. The sustained higher rates experienced throughout 20222023 negatively impacted the mortgage market including our loan origination volume and refinancing activity. In addition to being affected by interest rates, the secondary mortgage markets are also subject to investor demand for residential mortgage loans and investor yield requirements for these loans. These conditions may fluctuate or worsen in the future. Adverse market conditions, including increased volatility, changes in interest rates and mortgage spreads and reduced market demand, could result in greater risk in retaining mortgage loans pending their sale to investors. A prolonged period of secondary market illiquidity may result in a reduction of our loan mortgage production volume and could have a materially adverse effect on our financial condition and results of operations.


Our mortgage origination business is also subject to the cyclical and seasonal trends of the real estate market. The cyclical nature of our industry could lead to periods of growth in the mortgage and real estate markets followed by periods of declines

37


and losses in such markets. Seasonal trends have historically reflected the general patterns of residential and commercial real estate sales, which typically peak in the spring and summer seasons. One of the primary influences on our mortgage business is the aggregate demand for mortgage loans, which is affected by prevailing interest rates, housing supply and demand, residential construction trends, and overall economic conditions. If we are unable to respond to the cyclical nature of our industry by appropriately adjusting our operations or relying on the strength of our other product offerings during cyclical downturns, our business, financial condition, and results of operations could be adversely affected. Additionally, the fair value of our MSRs is highly sensitive to changes in interest rates and changes in market implied interest rate volatility. Decreases in interest rates can trigger an increase in actual repayments and market expectation for higher levels of repayments in the future which have a negative impact on MSR fair value. Conversely, higher rates typically drive lower repayments which results in an increase in the MSR fair value. We utilize derivatives to manage the impact of changes in the fair value of the MSRs. We may have basis risk and our risk management strategies, which rely on assumptions or projections, may not adequately mitigate the impact of changes in interest rates, interest rate volatility, convexity, credit spreads, or prepayment speeds, and, as a result, the change in the fair value of MSRs may negatively impact earnings.

We are highly dependent on the Agencies to buy mortgage loans that we originate. Changes in these entities and changes in the manner or volume of loans they purchase or their current roles could adversely affect our business, financial condition and results of operations.

We generate mortgage revenues primarily from gains on the sale of single-family residential loans pursuant to programs currently offered by Fannie Mae, Freddie Mac, Ginnie Mae and other investors. These entities account for a substantial portion of the secondary market in residential mortgage loans. Any future changes in these programs, our eligibility to participate in such programs, their concentration limits with respect to loans purchased from us, the criteria for loans to be accepted or laws that significantly affect the activity of such entities could, in turn, result in a lower volume of corresponding loan originations or other administrative costs which may have a materially adverse effect on our results of operations or could cause us to take other actions that would be materially detrimental. Fannie Mae and Freddie Mac remain in conservatorship and a path forward for them to emerge from conservatorship is unclear. Their roles could be reduced, modified or eliminated as a result of regulatory actions and the nature of their guarantees could be limited or eliminated relative to historical measurements. The elimination or modification of the traditional roles of Fannie Mae or Freddie Mac could create additional competition in the market and significantly and adversely affect our business, financial condition and results of operations.

Changes in the servicing, origination, or underwriting guidelines or criteria required by the Agencies could adversely affect our business, financial condition and results of operations.

We are required to follow specific guidelines or criteria that impact the way we originate, underwrite or service loans. Guidelines include credit standards for mortgage loans, our staffing levels and other servicing practices, the servicing and ancillary fees that we may charge, modification standards and procedures, and the amount of non-reimbursable advances. We cannot negotiate these terms, which are subject to change at any time, with the Agencies. A significant change in these guidelines, which decreases the fees we charge or requires us to expend additional resources in providing mortgage services, could decrease our revenues or increase our costs, adversely affecting our business, financial condition, and results of operations. In addition, changes in the nature or extent of the guarantees

33


provided by Fannie Mae and Freddie Mac or the insurance provided by the FHA could also have broad adverse market implications. The fees that we are required to pay to the Agencies for these guarantees have changed significantly over time and any future increases in these fees would adversely affect our business, financial condition and results of operations.


Future sales or issuances of our common stock or other securities (including warrants) or the issuance of securities pursuant to the exercise of warrants issued by us may dilute existing holders of our common stock and other securities, decrease the value of our common stock and other securities and adversely affect the market price of our common stock and other securities.

During the fourth quarter of 2023, the Company took decisive actions to build capital, reinforce our balance sheet, strengthen our risk management processes, and better align the Company with relevant bank peers. We significantly built our reserve levels by recording a $552 million provision for loan losses, bringing our allowance for credit losses to $992 million at December 31, 2023, reflecting our actions to build reserves during the quarter to address weakness in the office sector, potential repricing risk in the multi-family portfolio and an increase in classified assets, which better aligns the Company with its relevant bank peers, including Category IV banks. We are also subject to regulatory capital requirements and regulatory changes could result in more stringent capital or liquidity requirements, including increases in the levels of regulatory capital we are required to maintain and changes in the way capital or liquidity is measured for regulatory purposes. Accordingly, we may seek to raise additional capital, including by pursuing or effecting additional issuances of our securities. Our ability to

38


raise additional capital (and the associated terms) depends on conditions in the capital markets, economic conditions, and a number of other factors, including investor perceptions regarding the financial services and banking industry, market conditions and governmental activities, and on our financial condition and performance.

On March 11, 2024, we completed an approximately $1.05 billion equity investment in the Company in connection with which we sold and issued (a) 76,630,965 shares of our common stock, at a purchase price per share of $2.00, (b) 192,062 shares of a new series of our preferred stock, par value $0.01 per share, designated as Series B Noncumulative Convertible Preferred Stock, at a price per share of $2,000, each share of which is convertible into 1,000 shares of common stock, (c) 256,307 shares of a new series of our preferred stock, par value $0.01 per share, designated as Series C Noncumulative Convertible Preferred Stock, at a price per share of $2,000, each share of which is convertible into 1,000 shares of common stock, and (d) warrants, which may not be exercised until 180 days after issuance thereof, affording the holder thereof the right, until the seven-year anniversary of the issuance of such warrant, to purchase for $2,500 per share, shares of a new class of non-voting, common-equivalent preferred stock of the Company, each share of which is convertible into 1,000 shares of common stock, and all of which shares of Series D NVCE Stock, upon issuance, will represent the right (on an as converted basis) to receive 315 million shares of common stock. Additionally, if the Company is not able to obtain certain approvals from our stockholders on or before September 9, 2024, then the Company will be required to issue to the investors in the March 2024 capital raise cash-settled warrants, which would become exercisable 60 days after their issuance if the such stockholder approvals still have not been obtained at such time, that provide the holder thereof the right, until the ten-year anniversary of the issuance of such warrant, to receive from the Company cash in an amount equal to (i) from issuance thereof until (and including) November 5, 2024, 160 percent of such holder’s investment in the Company in the March 2024 capital raise; (ii) on (and including) November 6, 2024 until (and including) January 4, 2025, 180 percent of such holder’s investment in the Company in the March 2024 capital raise; (iii) on (and including) January 5, 2025 until (and including) March 5, 2025, 200 percent of such holder’s investment in the Company in the March 2024 capital raise; and (iv) from and after March 6, 2025, 220 percent of such holder’s investment in the Company in the March 2024 capital raise, in each case, net of the exercise price (which is the amount of such holder’s investment in the Company in the March 2024 capital raise).

Our Board of Directors has the authority, in many situations, to issue additional shares of authorized but unissued stock (including securities convertible or exchangeable for stock) in public or private offerings without any vote of our shareholders. If, in the future, the Company is required or otherwise determines to raise additional capital (including through the issuance of additional securities), any such capital raise or issuance may dilute the percentage of ownership interest of existing shareholders, may dilute the per share book value of our common stock and may adversely affect the market price of our common stock and other securities. No assurance can be given that, in the future, the Company will be able to (i) raise any required capital or (ii) raise capital on terms that are beneficial to shareholders.

Strategic Risks

Extensive competition for loans and deposits could adversely affect our ability to expand our business, as well as our financial condition and results of operations.

Because our profitability stems from our ability to attract deposits and originate loans, our continued ability to compete for depositors and borrowers is critical to our success. Our success as a competitor depends on a number of factors, including our ability to develop, maintain, and build long-term relationships with our customers by providing them with convenience, in the form of multiple branch locations, extended hours of service, and access through alternative delivery channels; a broad and diverse selection of products and services; interest rates and service fees that compare favorably with those of our competitors; and skilled and knowledgeable personnel to assist our customers by addressing their financial needs. External factors that may impact our ability to compete include, among others, the entry of new lenders and depository institutions in our current markets and, with regard to lending, an increased focus on multi-family and CRE lending by existing competitors.

Limitations on our ability to grow our loan portfolios could adversely affect our ability to generate interest income, as well our financial condition and results of operations, perhaps materially.

Our portfolios of multi-family and CRE loans represent the largest portion of our asset mix (68(56 percent of total loans held for investment as of December 31, 2022)2023). Our leadership position in these markets has been instrumental to our production of solid earnings and our consistent record of exceptional asset quality. We monitor the ratio of our multi-family, CRE, and ADC loans (as defined in the CRE Guidance) to our total risk-based capital to ensure that we are infor compliance with regulatory guidance. Any inability to grow our multi-family and CRE loan portfolios, could negatively impact our ability to grow our earnings per share.


39


The inability to engage in merger transactions, or to realize the anticipated benefits of acquisitions in which we might engage, could adversely affect our ability to compete with other financial institutions and weaken our financial performance.

Our ability to engage in future mergers and acquisitions would dependdepends on our ability to identify suitable merger partners and acquisition opportunities, our ability to finance and complete negotiated transactions at acceptable prices and on acceptable terms, and our ability to obtain the necessary stockholder and regulatory approvals. If we are unable to engage in or complete a desired acquisition or merger transaction, our financial condition and results of operations could be adversely impacted. As acquisitions have been a significant source of deposits, the inability to complete a business combination could require that we increase the interest rates we pay on deposits in order to attract such funding through our current branch network, or that we increase our use of wholesale funds. Increasing our cost of funds could adversely impact our net interest income and our net income. Furthermore, the absence of acquisitions could impact our ability to fulfill our loan demand. In addition, mergers and acquisitions can lead to uncertainties about the future on the part of customers and employees. Such uncertainties could cause customers and others to consider changing their existing business relationships with the company to be acquired, and could cause its employees to accept positions with other companies before the merger occurs. As a result, the ability of a company to attract and retain customers, and to attract, retain, and motivate key personnel, prior to a merger’s completion could be impaired. Furthermore, no assurance can be given that acquired operations would not adversely affect our existing profitability; that we would be able to achieve results in the future similar to those achieved by our existing banking business; that we would be able to compete effectively in the market areas served by acquired branches; or that we would be able to manage any growth resulting from a transaction effectively. In particular, our ability to compete effectively in new markets would be dependent on our ability to understand those markets and their competitive dynamics, and our ability to retain certain key employees from the acquired institution who know those markets better than we do.

34


We may be exposed to challenges in combining the operations of acquired or merged businesses, including our recent Flagstar acquisition and Signature acquisition, into our operations, which may prevent us from achieving the expected benefits from our merger and acquisition activities.

We may not be able to fully achieve the strategic objectives and operating efficiencies that we anticipate in our merger and acquisition activities. Inherent uncertainties exist in integrating the operations of an acquired business. We may lose our customers or the customers of acquired entities as a result of the acquisition.acquisitions. We may also lose key personnel from the acquired entity as a result of an acquisition. We may not discover all known and unknown factors when examining a company for acquisition or merger during the due diligence period. These factors could produce unintended and unexpected consequences for us including, but not limited to, increased compliance and legal risks, including increased litigation or regulatory actions such as fines or restrictions related to the business practices or operations of the combined business. Undiscovered factors as a result of an acquisition or merger could bring civil, criminal, and financial liabilities against us, our management, and the management of those entities we acquire or merge with. In addition, if difficulties arise with respect to the integration process, we may incur higher integration expenses than anticipated and the economic benefits expected to result from the acquisition, including revenue growth and cost savings, might not occur or might not occur to the extent we expected. Failure to successfully integrate businesses that we acquire or merge with could have an adverse effect on our profitability, return on equity, return on assets, or our ability to implement our strategy, any of which in turn could have a material adverse effect on our business, financial condition and results of operations.

The inability to receive dividends fromsuccess of the Signature transaction will depend on a number of uncertain factors, including our subsidiary bankdecisions regarding the fair value of the assets acquired and the bargain purchase gain recorded on the transaction, which could have a material adverse effect onmaterially and adversely affect our financial condition, or results of operations as well as our ability to maintain or increaseand future prospects.

Our acquisition of certain assets of Signature Bank in March 2023 was an FDIC-assisted transaction and the current level of cash dividends we pay to our stockholders.

The Parent Company (i.e., the company on an unconsolidated basis) is a separate and distinct legal entity from the Bank, and a substantial portionexpedited nature of the revenuesFDIC-assisted transaction did not allow bidders the Parent Company receives consiststime and access to information customarily associated with preparing for and evaluating a negotiated transaction. As a result, fair value estimates we have made in connection with the Signature transaction may be inaccurate and subject to change, which could adversely impact our financial condition, results of dividendsoperations and future prospects. In addition, we may obtain additional information and evidence during the period of one year from March 20, 2023, the Bank. These dividends aredate we completed the primary funding source forSignature transaction, that may result in changes to the dividends we pay on our common stock and the interest and principal payments on our debt. Various federal and state laws and regulations limitestimated amounts recorded as of December 31, 2023, which could change the amount of dividends that a bank may paythe bargain purchase gain we have recorded. Adjustments to its parent company. In addition, our right to participate in a distribution of assets upon the liquidation or reorganization of a subsidiarythis gain may be subject torecorded based on additional information received after the prior claimsacquisition date that affect the measurement of the subsidiary’s creditors. As a resultassets acquired and liabilities assumed and any decrease in the amount of our acquisition of Flagstar, we are required to seek regulatory approval from the OCC for the payment of any dividend to the Bancorp through at least the period ending November 1, 2024. If the Bank is unable to pay dividends to the Parent Company, we might not be able to service our debt, pay our obligations, or pay dividends on our common stock.

Reduction or elimination of our quarterly cash dividend could have an adverse impact on the market price of our common stock.

Holders of our common stock are only entitled to receive such dividends as our Board of Directors may declare out of funds available for such payments under applicable law and regulatory guidance, and althoughbargain purchase gain we have historically declared cash dividends onrecorded could also adversely impact our common stock, we are not required to do so. Furthermore, the paymentfinancial condition, results of dividends falls under federal regulations that have grown more stringent in recent years. While we pay our quarterly cash dividend in compliance with current regulations, such regulations could change in the future. As a result of our acquisition of Flagstar, we are required to seek regulatory approval from the OCC for the payment of any dividend to the Parent Company through at least the period ending November 1, 2024, which could restrict our ability to pay the common stock dividend. Any reduction or elimination of our common stock dividend in theoperations and future could adversely affect the market price of our common stock.prospects.


40


Operational Risks

Our stress testing processes rely on analytical and forecasting models that may prove to be inadequate or inaccurate, which could adversely affect the effectiveness of our strategic planning and our ability to pursue certain corporate goals.

The processes we use to estimate the effects of changing interest rates, real estate values, and economic indicators such as unemployment on our financial condition and results of operations depend upon the use of analytical and forecasting models. These models reflect assumptions that may not be accurate, particularly in times of market stress or other unforeseen circumstances. Furthermore, even if our assumptions are accurate predictors of future

35


performance, the models they are based on may prove to be inadequate or inaccurate because of other flaws in their design or implementation. If the models we use in the process of managing our interest rate and other risks prove to be inadequate or inaccurate, we could incur increased or unexpected losses which, in turn, could adversely affect our earnings and capital. Additionally, failure by the Company to maintain compliance with strict capital, liquidity, and other stress test requirements under banking regulations could subject us to regulatory sanctions, including limitations on our ability to pay dividends.


Any failure, breach, or interruption in service involving our systems or those

The Company, entities that we have acquired, and certain of our service providers have experienced information technology security breaches and may be vulnerable to future security breaches. These incidents have resulted in, and could damage our reputation, cause losses, increase our expenses, and result in, additional expenses, exposure to civil litigation, increased regulatory scrutiny, losses, and a loss of customers, an increase in regulatory scrutiny, heightened cyber risk, or expose us to civil litigation and possibly financial liability, any of which could adversely impact our financial condition, results of operations, and the market price of our stock.

Communication and information systems are essential to the conduct of our business, as we use such systems, and those maintained and provided to us by third-party service providers, to manage our customer relationships, our general ledger, our deposits, and our loans. In addition, our operations rely on the secure processing, storage, and transmission of confidential and other information in our computer systems and networks. Although we, and entities we have acquired, take and have taken protective measures and endeavor to modify them as circumstances warrant, the security of our computer systems, software, and networks, as well as the security of the computer systems, software, and networks of certain of our service providers, have been, and may in the future be, vulnerable to breaches, unauthorized access, misuse, computer viruses, or other malicious code and cyber-attacks that have had and could have an impact on information security. With the rise and permeation of online and mobile banking, the financial services industry in particular faces substantial cybersecurity risk due to the type of sensitive information provided by customers. We, and our third-party service providers, have been and may in the future be subject to cybersecurity incidents, including those that involve the unauthorized access to customer information affecting other financial institutions and industry groups. Our systems and those of our third-party service providers and customers are under constant threat,regularly the subject of attempted attacks that are increasingly sophisticated, and it is possible that we or they could experience a significant event in the future that could adversely affect our business or operations. In addition, breaches of security have in the past and may in the future occur through intentional or unintentional acts by those having authorized or unauthorized access to our confidential or other information, or that of our customers, clients, or counterparties. If one or more ofCertain previously identified cyber incidents have resulted, and future such events were to occur,could result, in the breach of confidential and other information processed and stored in and transmitted through, our computer systems and networksnetworks. These events could potentially be jeopardized, or could otherwise cause interruptions or malfunctions in our operations or the operations of our customers, clients, or counterparties. Further, we may not know that an attack occurred until well after the event. Even after discovering an attempt or breach occurred, we may not know the extent of the impact of the attack for some period of time. This could cause us significant reputational damage or result in our experiencing significant losses.

While we diligently assess applicable regulatory and legislative developments affecting our business, laws and regulations relating to cybersecurity have been frequently changing, imposing new requirements on us. In light of these conditions, we face the potential for additional regulatory scrutiny that will lead to increasing compliance and technology expenses and, in some cases, possible limitations on the achievement of our plans for growth and other strategic objectives. We may also be required to expend significant additional resources to modify our protective measures or investigate and remediate vulnerabilities or other exposures arising from operational and security risks, including expenses for third-party expert consultants or outside counsel. We are currently subject to litigation regarding cyber incidents, and we also may be subject to future litigation and financial losses that either are not insured against or not fully covered through any insurance we maintain.maintain or any third-party indemnification or insurance. We believe that the impact of any previously identified cyber incidents, including those subject to ongoing investigation and remediation, will not have a material financial impact and we have cyber insurance in place.impact.

In addition, we routinely transmit and receive personal, confidential, and proprietary information by e-mail and other electronic means. We have discussed, and worked with our customers, clients, and counterparties to develop secure transmission capabilities, but we do not have, and may be unable to put in place, secure capabilities with all of these constituents, and we may not be able to ensure that these third parties have appropriate controls in place to protect the confidentiality of such information. We maintain disclosure controls and procedures to ensure we will timely and sufficiently

41


notify our investors of material cybersecurity risks and incidents, including the associated financial, legal, or reputational consequence of such an event, as well as reviewing and updating any prior disclosures relating to the risk or event. While we have established information security policies, procedures and procedures,controls, including an Incident Response Plan, to prevent or limit the impact of systems failures and interruptions, we may not be able to anticipate all possible security breaches that could affect our systems or information and there can be no assurance that such events will not occur or will be adequately prevented or mitigated by our policies, procedures and controls if they do.

The Company and the Bank rely on third parties to perform certain key business functions, which may expose us to further operational risk.

We outsource certain key aspects of our data processing to certain third-party providers. While we have selected these third-party providers carefully, we cannot control their actions. Our ability to deliver products and services to

36


our customers, to adequately process and account for our customers’ transactions, or otherwise conduct our business could be adversely impacted by any disruption in the services provided by these third parties; their failure to handle current or higher volumes of usage; or any difficulties we may encounter in communicating with them. Replacing these third-party providers also could entail significant delay and expense. Our third-party providers may be vulnerable to unauthorized access, computer viruses, phishing schemes, and other security breaches. Threats to information security also exist in the processing of customer information through various other third-party providers and their personnel. We may be required to expend significant additional resources to protect against the threat of such security breaches and computer viruses, or to alleviate problems caused by such security breaches or viruses. To the extent that the activities of our third-party providers or the activities of our customers involve the storage and transmission of confidential information, security breaches and viruses could expose us to claims, regulatory scrutiny, litigation, and other possible liabilities. These types of third-party relationships are subject to increasingly demanding regulatory requirements and oversight by federal bank regulators (such as the Federal Reserve Board, the Office of the Comptroller of the Currency, and the Federal Deposit Insurance Corporation) and the CFPB. As a result, if our regulators conclude that we have not exercised adequate oversight and control over vendors and subcontractors or other ongoing third-party business relationships or that such third-parties have not performed appropriately, we could be subject to enforcement actions, including civil money penalties or other administrative or judicial penalties or fines, as well as requirements for consumer remediation. In addition, the Company may not be adequately insured against all types of losses resulting from third-party failures, and our insurance coverage may be inadequate to cover all losses resulting from systems failures or other disruptions to our banking services.


Failure to keep pace with technological changes could have a material adverse impact on our ability to compete for loans and deposits, and therefore on our financial condition and results of operations.

Financial products and services have become increasingly technology-driven. Our ability to meet the needs of our customers competitively, and in a cost-efficient manner, is dependent on our ability to keep pace with technological advances and invest in new technology as it becomes available. Many of our competitors have greater resources than we do and may be better equipped to invest in and market new technology-driven products and services.

The inability to attract and retain key personnel could adversely impact our operations.

To a large degree, our success depends on our ability to attract and retain key personnel whose expertise, knowledge of our markets, and years of industry experience make them difficult to replace. Competition for skilled leaders in our industry can be intense, and we may not be able to hire or retain the people we would like to have working for us. The unexpected loss of services of one or more of our key personnel could have a material adverse impact on our business, given the specialized knowledge of such personnel and the difficulty of finding qualified replacements on a timely basis. Furthermore, our ability to attract and retain personnel with the skills and knowledge to support our business may require that we offer additional compensation and benefits that would reduce our earnings.

The transition to a new Chief Executive Officer will be critical to our success and our business may be adversely impacted if we do not successfully manage the transition process in a timely manner.

Our success depends, in part, on the effectiveness of our transition to our new CEO, Joseph M. Otting, on April 1, 2024. The new CEO will be critical to executing on and achieving our vision, strategic direction, culture, products, and technology. If we are unable to execute an orderly transition and successfully integrate the new CEO into our leadership team, our operations and financial conditions may be adversely affected.


42


Many aspects of our operations are dependent upon the soundness of other financial intermediaries and thus could expose us to systemic risk.

The soundness of many financial institutions may be closely interrelated as a result of relationships between them involving credit, trading, execution of transactions, and the like. As a result, concerns about, or a default or threatened default by, one institution could lead to significant market-wide liquidity and credit problems, losses, or defaults by other institutions. As such “systemic risk” may adversely affect the financial intermediaries with which we interact on a daily basis (such as clearing agencies, clearing houses, banks, and securities firms and exchanges), we could be adversely impacted as well.

We may be terminated as a servicer or subservicer or incur costs, liabilities, fines and other sanctions if we fail to satisfy our servicing obligations, including our obligations with respect to mortgage loan foreclosure actions.

At December 31, 2022,2023, we had relationships with 1210 owners of MSRs, excluding ourselves, for which we act as subservicer for the mortgage loans they own. Due to the limited number of relationships, discontinuation of existing agreements with those third parties or adverse changes in contractual terms could have a significant negative impact to our mortgage servicing revenue. The terms and conditions in which a master servicer may terminate subservicing contracts are broad and could be exercised at the discretion of the master servicer without requiring cause. Additionally, the master servicer directs the oversight of custodial deposits associated with serviced loans and, to the extent allowable, could choose to transfer the oversight of the Bank's custodial deposits to another depository

37


institution. Further, as servicer or subservicer of loans, we have certain contractual obligations, including foreclosing on defaulted mortgage loans or, to the extent applicable, considering alternatives to foreclosure. If we commit a material breach of our obligations as servicer, we may be subject to termination if the breach is not cured within a specified period of time following notice, causing us to lose servicing income.


We may be required to repurchase mortgage loans, pay fees or indemnify buyers against losses.

When selling mortgage loans, are sold by us, we makeprovide customary representations and warranties to purchasers, guarantors and insurers, including the Agencies, about the mortgage loans and the manner in which they were originated. Wholeregarding loan sale agreementsoriginations. Agreements may require us to repurchase or substituterepurchasing, substituting mortgage loans, or indemnify buyers against losses, in the event we breach these representations or warranties. In addition, we may be required to repurchase mortgage loans as a result of early payment default of the borrower or we may be required to pay fees. We may also be subject toface litigation relating to these representations and warranties which may result in significantassociated costs. With respect to loans that are originated through our broker or correspondent channels, the remedies we have available against the originating brokerbrokers or correspondent, if any, may not be as broad as the remedies available to purchasers, guarantors and insurers of mortgage loans against us. We also face further risk that the originating broker or correspondent, if any, may not have the financial capacity to perform remedies that otherwisecorrespondents may be available. Therefore, if a purchaser, guarantor or insurer enforces its remedies against us, we may not be able to recover losses from the originating broker or correspondent.limited, posing financial risk. If repurchase and indemnity demands increase, and such demands are valid claims, our liquidity, results of operations and financial condition may also be adversely affected. For certain investors and/or certain transactions, we may be contractually obligated to repurchase a mortgage loan or reimburse the investor for credit or other losses incurred on the loan as a remedy forAdditionally, servicing errors with respectmay lead to the loan. If we have increased repurchasereimbursement obligations, because of claims for which we did not satisfy our obligations, or increased loss severity on such repurchases, we may have a significant reduction to noninterest income or an increase to noninterest expense. We may incur significant costs if we are required to, or if we elect to, re-execute or re-file documents or take other action in our capacity as a servicer in connection with pending or completed foreclosures. We may incur litigation costs if the validity of alegal and document-related expenses from foreclosure action is challenged by a borrower. Any of these actions mayactions. These challenges could harm our reputation or negatively affect our servicing business and, as a result, our profitability.

The pipeline represents the UPB for loans the Agencies identified as potentially needing to be repurchased, and the estimated probable loss associated with these loans is included in our representation and warranty reserve. While we believe the level of the reserve to be appropriate, the reserve may not be adequate to cover losses for loans that we have sold or securitized for which we may be subsequently required to repurchase, pay fines or fees, or indemnify purchasers and insurers because of violations of customary representations and warranties. Additionally, the pipeline could increase substantially without warning. Our regulators, as part of their supervisory function, may review our representation and warranty reserve for losses and may recommend or require us to increase our reserve, based upon their judgment, which may differ from that of Management.

We utilize third-party mortgage originators which subjects us to strategic, reputation, compliance, and operational risk.

We utilize third-party mortgage originators, i.e. mortgage brokers and correspondent lenders, who are not our employees. These third parties originate mortgages or provide services to many different banks and other entities. Accordingly, they may have relationships with, or loyalties to, such banks and other parties that are different from those they have with or to us. Failure to maintain good relations with such third-party mortgage originators could have a negative impact on our market share which would negatively impact our results of operations. We rely on third-party mortgage originators to originate and document the mortgage loans we purchase or originate. While we perform due diligence on the mortgage companies with whom we do business as well as review the loan files and loan documents we purchase to attempt to detect any irregularities or legal noncompliance, we have less control over these originators than employees of the Bank. Due to regulatory scrutiny, our third-party mortgage originators could choose or be required to either reduce the scope of their business or exit the mortgage origination business altogether. The TILA-RESPA Integrated Disclosure Rule issued by the CFPB establishes comprehensive mortgage disclosure requirements for lenders and settlement agents in connection with most closed-end consumer credit transactions secured by real property. The rule requires certain disclosures to be provided to consumers in connection with applying for and closing on a mortgage loan. The rule also mandates the use of specific disclosure forms, timing of

43


communicating information to borrowers, and certain record keeping requirements. The ongoing administrative

38


burden and the system requirements associated with complying with these rules or potential changes to these rules could impact our mortgage volume and increase costs. These arrangements with third-party mortgage originators and the fees payable by us to such third parties could also be subject to future regulatory scrutiny and restrictions.


The Equal Credit Opportunity Act, The Consumer Protection Act and the Fair Housing Act prohibit discriminatory and other lending practices by lenders, including financial institutions. Mortgage and consumer lending practices raise compliance risks resulting from the detailed and complex nature of mortgage and consumer lending laws and regulations imposed by federal Regulatory Agencies as well as the relatively independent and diverse operating channels in which loans are originated. As we originate loans through various channels, we, and our third-party originators, are especially impacted by these laws and regulations and are required to implement appropriate policies and procedures to help ensure compliance with fair lending laws and regulations and to avoid lending practices that result in the disparate treatment of, or disparate impact to, borrowers across our various locations under multiple channels. Failure to comply with these laws and regulations, by us, or our third-party originators, could result in the Bank being liable for damages to individual borrowers, changes in business practices, or other imposed penalties.

We are subject to various legal or regulatory investigations and proceedings.

At any given time, we are involved with a number of legal and regulatory examinations as a part of the routine reviews conducted by regulators and other parties, which may involve banking, securities, consumer protection, employment, tort, and numerous other laws and regulations. Proceedings or actions brought against us may result in judgments, settlements, fines, penalties, injunctions, business improvement orders, consent orders, supervisory agreements, restrictions on our business activities, or other results adverse to us, which could materially and negatively affect our business. If such claims and other matters are not resolved in a manner favorable to us, they may result in significant financial liability and/or adversely affect the market perception of us and our products and services as well as impact customer demand for those products and services. Some of the laws and regulations to which we are subject may provide a private right of action that a consumer or class of consumers may pursue to enforce these laws and regulations. We have been, and may be in the future,are currently subject to stockholder class and derivative actions which could seek significant damages orand other relief.relief, and may be subject to similar actions in the future. Any financial liability or reputational damage could have a materially adverse effect on our business which could have a materially adverse effectand, in turn, on our financial condition and results of operations. Claims asserted against us can be highly complicated and slow to develop, making the outcome of such proceedings difficult to predict or estimate early in the process. As a participant in the financial services industry, it is likely that we will be exposed to a high level of litigation and regulatory scrutiny relating to our business and operations. Although we establish accruals for legal or regulatory proceedings when information related to the loss contingencies represented by those matters indicates both that a loss is probable and that the amount of loss can be reasonably estimated, we do not have accruals for all legal or regulatory proceedings where we face a risk of loss. Due to the inherent subjectivity of the assessments and unpredictability of the outcome of legal and regulatory proceedings, amounts accrued may not represent the ultimate loss to us from the legal and regulatory proceedings in question. As a result, our ultimate losses may be significantly higher than the amounts accrued for legal loss contingencies. For further information, see Note 1519 - Commitments and Contingencies and Commitments.Item 3 - Legal Proceedings.

We may be required to pay interest on certain mortgage escrow accounts in accordance with certain state laws despite the Federal preemption under the National Bank Act.

In 2018, the Ninth Circuit Federal Court of Appeals held that California state law requiring mortgage servicers to pay interest on certain mortgage escrow accounts was not, as a matter of law, preempted by the National Bank Act (Lusnak(Lusnak v. Bank of America)America). This ruling goes against the position that regulators, national banks, and other federally-chartered financial institutions have taken regarding the preemption of state-law mortgage escrow interest requirements. The opinion issued by the Ninth Circuit Federal Court of Appeals is legal precedent only in certain parts of the western United States. We are defending similar litigation in California, and are currently appealing a federal district court judgment against us in that case to the Ninth Circuit. We are arguing that the Lusnak case was wrongly decided; we believe our situation can be distinguished from Lusnak as a matter of law and California’s interest on escrow law should be preempted as a matter of fact. If the Ninth Circuit’s holding is more broadly adopted by other Federal Circuits, including those covering states that currently have enacted, or in the future may enact, statutes

39


requiring the payment of interest on escrow balances or if we would be required to retroactively credit interest on escrow funds, the Company’s earnings could be adversely affected.


44


We could be exposed to fraud risks that affect our operations and reputation.

We face significant risks related to fraud, which could result in financial loss, expensive litigation, and damage to our reputation. Our organization is exposed to various types of fraud, including fraud or theft by colleagues or outsiders and unauthorized transactions. We rely heavily on information provided by clients and third parties, and misrepresentations in this information can lead to funding loans that do not meet our expectations or on unfavorable terms. We bear the risk of loss associated with misrepresentations, and it can be challenging to recover any monetary losses suffered. We have implemented various controls and security measures, but the failure of any of these controls could result in a failure to detect or mitigate fraud risks in a timely manner. We are committed to ongoing investments and attention to combat fraud and enhance our security measures to protect against these risks.

Reputational Risk

Damage to our reputation could significantly harm the businesses we engage in, as well as our competitive position and prospects for growth.

Our ability to attract and retain investors, customers, clients, and employees could be adversely affected by damage to our reputation resulting from various sources, including employee misconduct, litigation, or regulatory outcomes; failure to deliver minimum standards of service and quality; compliance failures; unintentional disproportionate assessment of fees to customers of protected classes; unethical behavior; unintended disclosure of confidential information; and the activities of our clients, customers, and/or counterparties. Actions by the financial services industry in general, or by certain entities or individuals within it, also could have a significantly adverse impact on our reputation. Our actual or perceived failure to identify and address various issues also could give rise to reputational risk that could significantly harm us and our business prospects, including failure to properly address operational risks. These issues include legal and regulatory requirements; consumer protection, fair lending, and privacy issues; properly maintaining customer and associated personal information; record keeping; protecting against money laundering; sales and trading practices; and ethical issues.

Increasing scrutiny and evolving expectations from customers, regulators, investors, and other stakeholders with respect to our environmental, social, and governance practices may impose additional costs on us or expose us to new or additional risks.

Companies are facing increasing scrutiny from customers, regulators, investors, and other stakeholders related to their environmental, social, and governance ("ESG") practices and disclosure. Investor advocacy groups, investment funds, and influential investors are also increasingly focused on these practices, especially as they relate to the environment, health and safety, diversity, labor conditions, and human rights. Increased ESG-related compliance costs could result in increases to our overall operational costs. Failure to adapt to or comply with regulatory requirements or investor or stakeholder expectations and standards could negatively impact our reputation, ability to do business with certain partners, and our stock price. New government regulations could also result in new or more stringent forms of ESG oversight and expanding mandatory and voluntary reporting, diligence, and disclosure. Additionally, concerns over the long-term impacts of climate change have led and will continue to lead to governmental efforts around the world to mitigate those impacts. Investors, consumers, and businesses also may change their behavior on their own as a result of these concerns. The Company and its customers will need to respond to new laws and regulations as well as investor, consumer and business preferences resulting from climate change concerns. The Company and its customers may face cost increases, asset value reductions, and operating process changes, among other impacts. The impact on the Company’s customers will likely vary depending on their specific attributes, including reliance on or role in carbon intensive activities. In addition, the Company would face reductions in credit worthiness on the part of some customers or in the value of assets securing loans. Investors could determine not to invest in the Company’s securities due to various climate change related considerations. The Company’s efforts to take these risks into account in making lending and other decisions may not be effective in protecting the Company from the negative impact of new laws and regulations or changes in investor, consumer or business behavior.

Item 1B.Unresolved Staff Comments
ITEM 1B. UNRESOLVED STAFF COMMENTS
None.

Item 1C.Cybersecurity
None.
Risk Management and Strategy

45

ITEM 2. PROPERTIES

The importance of protecting against unauthorized access to or use of customer data that has been entrusted to us as part of the various services provided to our customers; as well as operational disruptions caused by cybersecurity events, is of paramount importance to us. The Bank relies upon a formalized Information/Cybersecurity Program (“ICP”) to ensure we are protecting the confidentiality, integrity and availability of confidential information. The ICP is approved by the Board of Directors or a Committee thereof annually, and is designed to identify reasonably foreseeable internal and external threats, assess the likelihood and potential damage these threats could cause, and assess the appropriateness of policies, standards and procedures used to identify and mitigate risk levels to within the documented risk appetite. The ICP has been designed to align with industry best practices, as well as Regulatory guidelines and laws; and leverages both the Secure Control and the National Institute of Standards and Technology Cybersecurity frameworks as its baselines.

The ICP incorporates formal policies and procedures to ensure established controls are subjected to testing and independent effective challenge, to provide for appropriate due diligence and ongoing oversight of third parties who have access to our confidential information and/or systems, and to provide information and cybersecurity training to our employee population to ensure awareness of risks facing the institution and latest techniques used by malicious actors. A key component of the training program is the performance of phishing and social engineering campaign, the result of which are used to gauge the training program’s effectiveness, as well as to identify employees that pose a potential higher level of phishing/social engineering susceptibility risk, with all such employees provided additional targeted training. The ICP also includes subject matter expert review of third-party servicing agreements to ensure provisions adequately protect the bank in the event of a cybersecurity event whenever the relationship involves sensitive customer information. Internal auditors and third-party security experts are relied upon to review and ensure that established controls are appropriately designed, effectively implemented, and operating as intended; with such reviews undertaken as part of the Bank’s internal audit and third-party penetration testing programs.

The information/cybersecurity risk management program relies upon a layered security model to protect against both internal and external threats; and is a component of the Bank’s formalized enterprise risk management program (“ERM Program”), which is reviewed and approved by the Board of Directors or Committee thereof at least annually. The ERM Program sets forth enterprise-wide operational practices to ensure consistency in the organizations approach to risk identification, documentation, measurement, management, and mitigation with all aspects of risk management documented within a centrally maintained risk management platform (“RMP”). A key aspect of the ERM Program is the risk and control self-assessment (“RCSA”) process, which is used to evaluate the mitigation effectiveness of implemented controls through an independent effective challenge program. Gaps or control weaknesses identified as part of the RCSA process require creation of issues and remediation strategies, both of which are formally documented within the RMP, where remediation efforts are managed and monitored from initial creation through ultimate completion of the respective work effort. Independent effective challenge has been embedded throughout this process and ensures that remediation efforts will, and have satisfactorily addressed the identified issue.

A formal Incident Response Plan (“Plan”) is maintained by the Information Security Department, and approved by the Board of Directors or designated Committee thereof at least annually. The Plan sets forth the Bank’s information/cybersecurity incident response framework, which has been designed to ensure a consistent, repeatable response to any actual or threatened cybersecurity incident (“Incident”). The framework sets forth the team structure utilized for the coordination, monitoring, oversight, and internal and external reporting in connection with any identified Incident; and delineates responsibilities for all team members involved in response activities, as well as guidance for all employees in connection with defining, discovering, reporting, investigating, containing, and recovering from an Incident. During the reporting period, we did not experience any cybersecurity risks or incidents that have materially or are reasonably likely to materially affect the Bank; including its business strategy, result of operations, or financial condition.

We believe that the impact of any previously identified cyber incidents, including those subject to ongoing investigation and remediation, will not have a material impact on the Company, including business strategy, results of operations or financial condition.

Governance

The Board of Directors, through its Risk Assessment (“RAC”) and Technology (“TEC”) Committees, (together the “Committees”) provides direction and oversight of both the enterprise risk management and information/cybersecurity risk management programs. The Committees meet monthly to review and discuss overall state, current developments, management and performance metrics, risk identification and mitigation status, and new initiatives associated with both the Enterprise Risk Management and Information/Cybersecurity Programs. The Committees rely upon various management level committees (e.g.

46


Enterprise Risk Management, Operational Risk Management, and Technology Management) for oversight and direct management of the overarching risk management framework, which includes the information/cybersecurity risk management program and direct reporting by the Chief Information Security Officer (“CISO”).

The CISO is responsible for administration, management, and oversight of the Information/Cybersecurity Program; and is supported by a team of individuals that possess various levels of educational and technical hands-on expertise to carry out daily responsibilities and to ensure the Program’s success and continued maturation. The CISO reports directly to the Chief Risk Officer, and has over 15 years of direct experience in designing, implementing, and maturing information and cybersecurity strategies within the financial sector. Prior to joining the Bank, the CISO served as a technology examiner for one of the three Federal banking regulatory agencies, with over ten years of experience performing technology examinations of financial institutions (“FI”) and FI service providers primarily within the New York metropolitan area.

Item 2.Properties

We own certain of our branch offices, as well as our headquarters on Long Island and certain other back-office buildings in New York, Ohio, Florida and Michigan. We also utilize other branch and back-office locations in those states, and in New Jersey, Arizona, California, Indiana, and Wisconsin under various lease and license agreements that expire at various times. (See Note 8 “Leases”- Leases in Item 8, “Financial Statements and Supplementary Data.”) We believe that our facilities are adequate to meet our present and immediately foreseeable needs.

Item 3.Legal Proceedings

40


The Company is involved in various legal actions arising in the ordinary course of its business. All such actions in the aggregate involve amounts that are believed by management to be immaterial to the financial condition and results of operations of the Company.

ITEM 4. MINE SAFETY DISCLOSURESThe Company and its President and Chief Executive Officer and Senior Executive Vice President and Chief Financial Officer have been named as defendants in a shareholder class action captioned

Not applicable.Lemm, Jr. v. New York Community Bancorp, Inc., et al., Case No. 1:24-cv-00903, filed on February 6, 2024 in the United States District Court for the Eastern District of New York. This action, which seeks unspecified compensatory damages to be proven at trial, alleges violations of the federal securities laws, including Sections 10(b) and 20(a) of the Securities Exchange Act of 1934 (the “Exchange Act”) and SEC Rule 10b-5, with respect to disclosures concerning the Company’s business, operations and prospects, particularly regarding the impact of the Flagstar and Signature transactions and the Bank’s commercial real estate loan portfolio and related matters, that were made in the Company’s public SEC filings and press releases during the period beginning on March 1, 2023 and ending on January 30, 2024. The Company intends to vigorously defend this action and any related actions.


41The Company and its President and Chief Executive Officer and Senior Executive Vice President and Chief Financial Officer have also been named as defendants in a second shareholder class action captioned

Miskey v. New York Community Bancorp, Inc., et al., Case No. 1:24-cv-01118, filed on February 13, 2024 in the United States District Court for the Eastern District of New York. This action also seeks unspecified compensatory damages to be proven at trial and alleges violations of the federal securities laws, including Sections 10(b) and 20(a) of the Exchange Act and SEC Rule 10b-5, with respect to disclosures concerning the Company’s business, operations and prospects, particularly regarding the impact of the Flagstar and Signature transactions and the Bank’s commercial real estate loan portfolio and related matters, that were made in the Company’s public SEC filings and press releases during the period beginning on March 1, 2023 and ending on February 5, 2024. The Company intends to vigorously defend this action and any related actions.

The Company’s President and Chief Executive Officer and Senior Executive Vice President and Chief Financial Officer, as well as all of the Company’s current directors, have also been named as defendants in a shareholder derivative action captioned Hauser v. Cangemi, et al., Case No. 1:24-cv-01207, filed on February 15, 2024 in the United States District Court for the Eastern District of New York. This action, which also names the Company as a nominal defendant and seeks unspecified compensatory damages and certain corporate governance and internal procedures reforms, alleges claims of breach of fiduciary duty, gross mismanagement, waste of corporate assets, unjust enrichment, aiding and abetting with respect to the director defendants, and violations of Sections 10(b) and 21D of the Exchange Act with respect to the officer defendants. The allegations in the complaint relate to disclosures concerning the Company’s business, operations and prospects, particularly regarding the impact of the Flagstar and Signature transactions and the Bank’s commercial real estate loan portfolio and related matters, that were made in the Company’s public SEC filings and press releases during the period beginning on March 1, 2023 and ending on January 31, 2024, as well as the defendants’ management of the Company during such period. The Company intends to vigorously defend this action and any related actions.


47


The outcome of the pending litigation described above is uncertain. There can be no assurance (i) that we will not incur material losses due to damages, penalties, costs and/or expenses as a result of such litigation, (ii) that the reserves we have established will be sufficient to cover such losses, or (iii) that such losses will not materially exceed such reserves and have a material impact on our financial condition or results of operations. The Company may incur significant legal expenses in defending the litigation described above during the pendency of these matters, and in connection with any other potential cases, including expenses for the potential reimbursement of legal fees of officers and directors under indemnification obligations.


Item 4.Mine Safety Disclosures

None.


48


PART II

Item 5.Market For the Registrant's Common Equity, Related Stockholder Matters, and Issuer Purchases

ITEM 5. MARKET FOR REGISTRANT’S COMMON EQUITY, RELATED STOCKHOLDER MATTERS, AND ISSUER PURCHASES OF EQUITY SECURITIES

The common stock of New York Community Bancorp, Inc. trades on the New York Stock Exchange (the “NYSE”) under the symbol “NYCB.”

At December 31, 2022,2023, the number of outstanding shares was 681,217,334722,066,370 and the number of registered owners was approximately 11,746. The latter figure does not include those investors whose shares were held for them by a bank or broker at that date.

Stock Performance Graph

The following graph compares the cumulative total return on the Company’s stock in the five years ended December 31, 20222023 with the cumulative total returns on a broad market index (the S&P Mid-Cap 400 Index) and a peer group index (the S&P U.S. BMI Banks Index) during the same time. The S&P Mid-Cap 400 Index was chosen as the broad market index in connection with the Company’s trading activity on the NYSE; the S&P U.S. BMI Banks Index currently is comprised of 302258 bank and thrift institutions, including the Company. S&P Global Market Intelligence provided us with the data for both indices.

The performance graph is being furnished solely to accompany this report pursuant to Item 201(e) of Regulation S-K, and is not being filed for purposes of Section 18 of the Securities Exchange Act of 1934, as amended, and is not to be incorporated by reference into any filing of the Company, whether made before or after the date hereof, regardless of any general incorporation language in such filing.

The cumulative total returns are based on the assumption that $100.00 was invested in each of the three investments on December 31, 20172018 and that all dividends paid since that date were reinvested. Such returns are based on historical results and are not intended to suggest future performance.


49

42


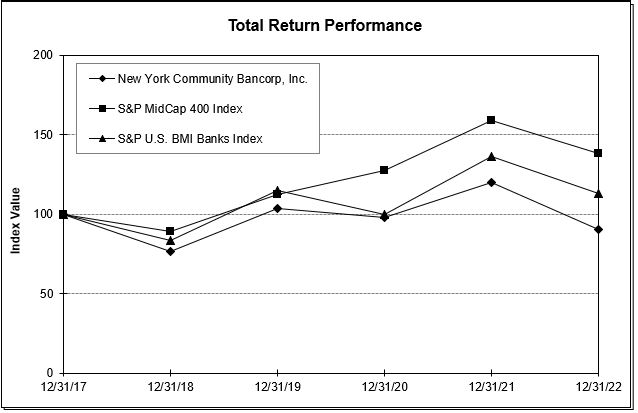
Comparison of 5-Year Cumulative Total Return

Among New York Community Bancorp, Inc.,

S&P Mid-Cap 400 Index, and S&P U.S. BMI Banks Index*

img86619456_0.jpgr

ASSUMES $100 INVESTED ON

CUMULATIVE TOTAL STOCKHOLDER RETURN
COMPARED WITH PERFORMANCE OF SELECTED INDICES
DECEMBER 31, 2017 AND DIVIDEND REINVESTED2018 THROUGH DECEMBER 31, 2023
1805
12/31/201812/31/201912/31/202012/31/202112/31/202212/31/2023
New York Community Bancorp, Inc.$100.00 $135.38 $127.51 $156.41 $118.03 $149.75 
S&P Mid-Cap 400 Index$100.00 $126.20 $143.44 $178.95 $155.58 $181.15 
S&P U.S. BMI Banks Index$100.00 $137.36 $119.83 $162.92 $135.13 $147.41 


12/31/2017


12/31/2018


12/31/2019


12/31/2020


12/31/2021


12/31/2022


New York Community Bancorp, Inc.


$

100.00


$

76.76


$

103.92


$

97.88


$

120.07


$

90.61


S&P Mid-Cap 400 Index


$

100.00


$

88.92


$

112.21


$

127.54


$

159.12


$

138.34


S&P U.S. BMI Banks Index


$

100.00


$

83.54


$

114.74


$

100.10


$

136.10


$

112.89


Share Repurchases

Shares Repurchased Pursuant to the Company’s Stock-Based Incentive Plans

Participants in the Company’s stock-based incentive plans may have shares of common stock withheld to fulfill the income tax obligations that arise in connection with their recent event exercise of stock options and the vesting of their stock awards. Shares that are withheld for this purpose are repurchased pursuant to the terms of the applicable stock-based incentive plan, rather than pursuant to the share repurchase program authorized by the Board of Directors, described below.

Shares Repurchased Pursuant to the Board of Directors’ Share Repurchase Authorization

On October 23, 2018, the Board of Directors authorized the repurchase of up to $300 million of the Company’s common stock. Under said authorization, shares may be repurchased on the open market or in privately negotiated transactions. As of December 31, 2022,2023, the Company has approximately $9 million remaining under this repurchase authorization.

43


50


Shares that are repurchased pursuant to the Board of Directors’ authorization, and those that are repurchased pursuant to the Company’s stock-based incentive plans, are held in our Treasury account and may be used for various corporate purposes, including, but not limited to, merger transactions and the vesting of restricted stock awards.

During the year December 31, 2022,2023, the Company repurchased $24$12 million or 2.31 million shares of its common stock:


(dollars in millions, except share data)
PeriodTotal Shares of Common Stock RepurchasedAverage Price Paid per Common ShareTotal AllocationTotal Shares of Common Stock Purchased as Part of Publicly Announced Plans or Programs
First Quarter 2023976,454 $9.33 $0
Second Quarter 2023190,177 10.3620
Third Quarter 202333,956 12.5000
Fourth Quarter 2023
October 1 - 31, 20231,525 10.29 0— 
November 1 - 30, 20234,897 9.34 — — 
December 1 - 31, 202350,526 9.92 — 
Total Fourth Quarter 202356,948 $16.57 — 
2023 Total1,257,535 $9.59 $12 — 

Item 6.Reserved

Item 7.Management's Discussion and Analysis of Financial Condition and Results of Operations


(dollars in millions, except per share data)
 
Period


Total Shares
of Common
Stock
Repurchased


Average Price
Paid per
Common
Share


Total
Allocation


Total Shares of Common Stock Purchased as Part of Publicly Announced Plans or Programs


First Quarter 2022


901,934


$


12.93


$


11


Second Quarter 2022


809,996


8.88


7


791,101


Third Quarter 2022


107,022


9.16


1


80,609


Fourth Quarter 2022


October 1-31, 2022


236


8.54


November 1-30, 2022


2,173


9.90


December 1-31, 2022


515,574


8.72


5


Total Fourth Quarter 2022


517,983


8.72


5


2022 Total


2,336,935


10.42


$


24


871,710


EXECUTIVE SUMMARY

At December 31, 2023, total assets were $114.1 billion, up $23.9 billion compared to December 31, 2022. Total deposits were $81.5 billion at December 31, 2023, up $22.8 billion from December 31, 2022. These year-to-date increases were primarily due to our March 20, 2023, assumption of a substantial amount of the deposits and certain identified liabilities and the acquisition of certain assets and lines of business of Signature Bridge Bank, from the FDIC as receiver for Signature Bridge Bank (the “Signature Transaction”). See Note 3 - Business Combinations to the Consolidated Financial Statements for further information regarding the Signature Transaction.
ITEM 6. RESERVED

44


ITEM 7. MANAGEMENT’S DISCUSSION AND ANALYSIS OF FINANCIAL CONDITION AND RESULTS OF OPERATIONS

For the purpose of this discussion and analysis, the words “we,” “us,” “our,” and the “Company” are used to refer to New York Community Bancorp, Inc. and our consolidated subsidiaries, including Flagstar Bank N.A. (the “Bank”). 45.755.3

EXECUTIVE SUMMARY

For the twelve monthsyear ended December 31, 2022,2023, net loss was $79 million as compared to net income wasof $650 million an increase of $54 million or 9 percent compared to the $596 million the Company reported for the twelve monthsyear ended December 31, 2021.2022. Net incomeloss available to common stockholders for the twelve monthsyear ended December 31, 20222023 was $112 million, compared to net income $617 million also up $54 million and 10 percent compared tofor the twelve monthsyear ended December 31, 2021. On a per share basis, this translates into diluted2022. Diluted (loss) earnings per share of $1.26 in full-year 2022, up 5 percenttotaled $(0.16) for the year ended December 31, 2023 compared to the $1.20 we reported in full-year 2021. In terms of profitability, our full-year 2022 results reflect a return on average assets of 1.01 percent compared to 1.04 percent in full-year 2021 and a return on average common stockholders' equity of 9.38 percent$1.26 for the full-year 2022 versus 8.75 percentyear ended December 31, 2022.


The net loss for 2023 primarily reflects a goodwill impairment of $2.4 billion recorded in the fourth quarter partially offset by a $2.1 billion bargain gain on the Signature Transaction. During the fourth quarter of 2023, management also took decisive actions to build capital, reinforce our balance sheet, strengthen our risk management processes, and better align ourselves with the relevant bank peers. We significantly built our reserve levels by recording a $552 million provision for loan losses, bringing our allowance for credit losses to $992 million at December 31, 2023, reflecting our actions to build reserves during the quarter to address weakness in the office sector, potential repricing risk in the multi-family portfolio and conditions leading to increases in classified assets, which better aligns the Company with its relevant bank peers, including Category IV banks. In addition, we added on-balance sheet liquidity as we prepare for the full-year 2021.enhanced prudential standards that apply to banks with $100 billion or more in total assets.

Loan Portfolio

At December 31, 2022,2023, total C&I loans and leases held for investment were $69.0$25.3 billion up $23.3 billion or 51 percent compared to $45.7 billion at December 31, 2021. Of the $23.3 billion in growth this year, the Flagstar acquisition contributed $17.2 billion in loans, net of PAA. During the year, multi-family loans increased $3.5 billion or 10 percent to $38.1 billion, while the CRE portfolio increased $3.6 billion or 52 percent to $10.5 billion. The increase in the CRE portfolio was due to the Flagstar acquisition, while the increase in multi-family loans was primarily the result of organic growth.

Our specialty finance portfolio increased $912 million or 26 percent to $4.4 billion at December 31, 2022. Total commitments for the specialty finance portfolio stood at $7.4$12.3 billion at December 31, 2022. The remainingmajority of the increase is attributable to the $9.9 billion of C&I loans acquired in the Signature Transaction along with continued growth through new originations.


51


The multi-family loan portfolio excluding specialty finance, totaled $7.9was $37.3 billion at year-end 2022December 31, 2023, down slightly compared to $526 million$38.1 billion at year-end 2021 due primarilyDecember 31, 2022. At December 31, 2023, multi-family loans represented 44 percent of total loans, compared to 55 percent at December 31, 2022, further demonstrating the reduction of our concentration in this asset class.

Commercial loans (commercial real estate and acquisition, development and construction loans) increased $2.9 billion at December 31, 2023 to $13.4 billion compared to $10.5 billion at December 31, 2022 largely attributable to the Flagstar acquisition.Signature Transaction and growth in our home builder finance portfolio.

One-to-four family residential loans held for investment totaled $6.1 billion at December 31, 2023, representing 7 percent of total loans compared to $5.8 billion or eight percent of total loans at December 31, 2022. Other loans totaled $2.7 billion at December 31, 2023 compared to $2.3 billion at December 31, 2022. The vast majorityother loan portfolio consists mostly of these loans were acquired in the Flagstar acquisition. Other loansHELOC and other consumer loans.

Loans held-for-sale at December 31, 2023 totaled $2.3$1.2 billion, up from $1.1 billion at December 31, 2022.

Deposit Base

Deposits at December 31, 2023 totaled $81.5 billion, up $22.8 billion compared to $58.7 billion at December 31, 2022 primarily driven by the Signature Transaction.

Our deposit base includes $29.3 billion of uninsured deposits at December 31, 2023, up $12.9 billion as compared to only $6 million at year-end 2021.December 31, 2022 largely due to the Signature Transaction. This represents 35.9 percent of our total deposits. These amounts were determined based on the same methodologies and assumptions used for regulatory reporting purposes and exclude internal accounts. At December 31, 2023 total liquidity (cash and cash equivalents, unpledged securities, and FHLB and FRB borrowing capacity) was $27.9 billion.

Net Interest Income

For the year ended December 31, 2023, net interest income totaled $3.1 billion, up $1.7 billion or 120 percent compared to the year ended December 31, 2022. The increase was dueprimarily the result of the Flagstar acquisition, which closed in late 2022, and the Signature transaction, which closed in late March of 2023.

For the year ended December 31, 2023, net interest margin was 2.99 percent, up sixty-four basis points compared to the year ended December 31, 2022. The year-over-year increase was primarily the result of a larger balance sheet driven by both the Flagstar acquisition and is mostly comprised of consumer loans.

Loans held for sale were $1.1 billion at December 31, 2022, resulting from the Flagstar acquisition. These loans consisted of one-to-four family residential mortgage loans pending sale for which we have elected the fair value option.

At December 31, 2022, multi-family loans represented 55 percent of total loans, compared to 76 percent at December 31, 2021, commercial loans (including specialty financeSignature transaction, and CRE loans) represented 33 percent compared to less than 25 percent at December 31, 2021, while residential loans represented 8 percent.

Deposit Base

Total deposits at December 31, 2022 were $58.7 billion, up $23.7 billion or 67 percent compared to $35.1 billion at December 31, 2021. Deposit growth was driven by the addition of $16.0 billion of deposits from the Flagstar acquisition and $7.6 billion growth in loan-related deposits and BaaS deposits. Non-interest-bearing deposits were $12.1 billion at December 31, 2022 and represented 21 percent of total deposits, compared to $4.5 billion, or 13 percent as of December 31, 2021. Excluding the impact of the Flagstar acquisition, deposits increased $7.6 billion or 22 percent during 2022. Loan-related deposits totaled $4.4 billion at December 31, 2022 up $389 million or 10 percent as compared to $4.0 billion at December 31, 2021.

45


In addition, our BaaS deposits totaled $11.5 billion at December 31, 2022, up $10.5 billion compared to $1.0 billion at December 31, 2021. Our BaaS deposits fall into three verticals: traditional BaaS, banking as a service for government agencies and states, which includes the U.S. Treasury's prepaid debit card program, and mortgage as a service, which caters to mortgage companies and consists primarily of escrow deposit accounts for principal, interest, and tax payments. The majority of the year-over-year growth was in the government banking as a service vertical and related to certain prepaid debit card programs.

Net Interest Income

During the twelve months ended December 31, 2022, our net interest income grew driven by our higher asset base. Net interest income for full-year 2022 was $1.4 billion, up $107 million or 8 percent compared to $1.3 billion for the twelve months ended December 31, 2021. Average interest-earning assets increased $7.0 billion or 13 percent over the course of the year to $59.3 billion primarily due to organic loan growth, and the Flagstar acquisition. The average yield increased 30 basis points to 3.53 percent. Average interest-bearing liabilities totaled $51.4 billion, up $6.2 billion or 14 percent, while the average cost of funds rose 47 basis points to 1.35 percent.

For the twelve months ended December 31, 2022, the NIM declined 12 basis points to 2.35 percent compared to 2.47 percent for the twelve months ended December 31, 2021 primarily driven byalong with the impact of higher interest rates on the liability sensitive balance sheet through November 30, 2022. With the Flagstar acquisition we remain slightly liability sensitive. See Item 7A, “Quantitative and Qualitative Disclosures About Market Risk,”. Prepayment income contributed eight basis pointsrates.


Asset Quality

At December 31, 2023, NPA to the full-year NIMtotal assets equaled 0.39 percent compared to 15 basis points during full-year 2021 as prepayments slowed due to rising interest rates.

Asset Quality

Asset quality remained strong during 2022 as increases in NPAs were substantially due to changes in asset mix related to the Flagstar acquisition and centered on non-performing one-to-four family residential and home equity loans. Total NPAs0.17 percent at December 31, 2022 were $153 millionwhile NPL to total loans equaled 0.51 percent compared to $41 million0.20 percent at December 31, 2021,2022. The increase in NPLs was primarily driven by NPLsa $125 million increase in multi-family loans and a $108 million in commercial real estate loans. Repossessed assets acquiredof $14 million were slightly higher compared to $12 million in the Flagstar acquisition. At December 31, 2022, NPAsprior year.


Recent Events

Declaration of Dividend on Common Shares

On January 30, 2024, the Company's Board of Directors declared a quarterly cash dividend of $0.05 per share on the Company's common stock. The dividend is payable on February 28, 2024 to total assets equaled 0.17 percent and NPLs to total loans were 0.20 percent, compared to 0.07 percent for both metrics at December 31, 2021.common stockholders of record as of February 14, 2024.

Appointment of Executive Chairman

On February 6, 2024, the Company appointed Alessandro (Sandro) DiNello as Executive Chairman, effective as of February 7, 2024.

In this capacity, Mr. DiNello serves as the most senior executive officer of the Company.


52


RESULTS OF OPERATIONS: 2022 AS COMPARED TO 2021OPERATIONS

Net Interest Income

Net interest income is our primary source of income. Its level is a function of the average balance of our interest-earning assets, the average balance of our interest-bearing liabilities, and the spread between the yield on such assets and the cost of such liabilities. These factors are influenced by both the pricing and mix of our interest-earning assets and our interest-bearing liabilities which, in turn, are impacted by various external factors, including the local economy, competition for loans and deposits, the monetary policy of the FOMC, and market interest rates.

The cost of our deposits and borrowed funds is largely based on short-term rates of interest, the level of which is partially impacted by the actions of the FOMC. The FOMC reduces, maintains, or increases the target federal funds rate (the rate at which banks borrow funds overnight from one another) as it deems necessary.

While the target federal funds rate generally impacts the cost of our short-term borrowings and deposits, the yields on our held-for-investment loans and other interest-earning assets are not as sensitive to intermediate-term market interest rates.

Another factor that impacts the yields on our interest-earning assets—and our net interest income—is the income generated by our multi-family and CRE loans and securities when they prepay. Since prepayment income is recorded as interest income, an increase or decrease in its level will also be reflected in the average yields (as applicable) on our loans, securities, and interest-earning assets, and therefore in our net interest income, our net interest rate spread, and our net interest margin.

46


It should be noted that the level of prepayment income on loans recorded in any given period depends on the volume of loans that refinance or prepay during that time. Such activity is largely dependent on such external factors as current market conditions, including real estate values, and the perceived or actual direction of market interest rates. This impact is most prevalent in our multi-family and CRE portfolios, and to a lesser extent in our C&I and ADC portfolios. In addition, while a decline in market interest rates may trigger an increase in refinancing and, therefore, prepayment income, so too may an increase in market interest rates. It is not unusual for borrowers to lock in lower interest rates when they expect, or see, that market interest rates are rising rather than risk refinancing later at a still higher interest rate. The impact of prepayments on the current quarter and year was minimal.

Year-over-Year Comparison

For the twelve monthsyear ended December 31, 2022,2023, net interest income totaled $1.4$3.1 billion, up $107 million$1.7 billion or 8120 percent compared to $1.4 billion for the twelve monthsyear ended December 31, 2021. 2022.The year-over-year improvementincrease was driven by an increaseprimarily the result of the Flagstar acquisition, which closed late last year, and the Signature Transaction, which closed in interest income partially offset by higher interest expense due to the rising rate environment.late March of this year.

Year-Over-Year Comparison

The following factors contributed to the year-over-year increase in net interest income:


Interest income on mortgage and other loans, net, totaled $1.8 billion, up $323 million compared to full-year 2021. Interest income also increased across all other categories with securities up $44 million and income on money market investments up $36 million compared to last year.
Interest income on mortgages and other loans net wasincreased $2.7 billion driven by a $6.2$32.5 billion or 1465.8 percent increase in average loan balances to $49.4$81.9 billion. This is due to organic loan growth throughoutprimarily driven by the yearDecember 2022 acquisition of Flagstar and the December acquisition of Flagstar. March 2023 Signature Transaction. Additionally, we had a 21177 basis point increase in the average loan yield to 3.74 percent from 3.535.5 percent in 2021the current year primarily due primarily to higher yields on acquired loans and the rising interest rate environment. Prepayments in 2023 were $9 million.

Interest income on securities was positively impactedincreased $244 million driven by a 34 bps149 basis point increase in the average yield to 2.694.2 percent from 2.352.7 percent along with a $823 million$3.2 billion or 1242.5 percent increase in the average securities balance to $7.4$10.6 billion. The increase was driven by higher rates on new purchase and higher yields on acquired Flagstar securities.

Interest-earning cash and cash equivalents were positively impacted byincreased $487 million reflecting a 130 bps367 basis point increase in the average yield to 1.475.1 percent driven by higher short termshort-term market rates while balances remained flat.and an increase in the average balance driven by the Signature Transaction and bolstering our on-balance sheet liquidity.

Interest expense on average interest-bearing deposits increased $269 million$1.4 billion to $383 million$1.8 billion during full-year 2022,the year ended December 31, 2023, driven by a 68206 basis point increase in the average cost of interest-bearing deposits due to rising interest rates and competition for deposits. Additionally, our averagerates. Average interest earning deposits grew $6.5$20.3 billion, or 2256.4 percent, to $36.0$56.3 billion. The balance growth primarily reflects the December acquisition of Flagstar as well as growth inand the Company’s loan-related deposits and BaaS deposits. Loan-related deposits totaled $4.4 billion at December 31, 2022 up $389 million or 10 percent from to $4.0 billion at December 31, 2021. Our BaaS deposits totaled $11.5 billion at December 31, 2022, as compared to $1.0 billion at December 31, 2021.March Signature Transaction.


53


Interest expense on borrowed funds increased $27$343 million or 9109.6 percent to $313$656 million driven by a 22162 basis point increase in rates partially offset byin addition to a $319 million$2.5 billion or 216.5 percent decline inincrease in the average balance to $15.4 billion, partially due to our shift to lower cost deposits.$17.9 billion.

Net Interest Margin

The Company’s net interest margin declined 12 basis points for the twelve months ended December 31, 2022, to 2.35 percent compared to 2.47 percent for the twelve months ended December 31, 2021. This decline was driven by our liability sensitive balance sheet in the rising rate environment. Prepayment income contributed eight basis points to the full-year net interest margin compared to 15 basis points during full-year 2021.

The following table sets forth certain information regarding our average balance sheet for the yearsperiods indicated, including the average yields on our interest-earning assets and the average costs of our interest-bearing liabilities. Average yields are calculated by dividing the interest income produced by the average balance of interest-earning assets. Average costs are calculated by dividing the interest expense produced by the average balance of interest-bearing liabilities. The average balances for the yearperiods are derived from average balances that are calculated daily. The average yields and costs include fees, as well as premiums and discounts (including mark-to-market adjustments from acquisitions), that are considered adjustments to such average yields and costs.


47


Net Interest Income Analysis


For the Years Ended December 31,


2022


2021


2020


Average


Average


Average


Average


Yield/


Average


Yield/


Average


Yield/


(dollars in millions)


Balance


Interest


Cost


Balance


Interest


Cost


Balance


Interest


Cost


ASSETS:


Interest-earning assets:


Mortgage and other loans and leases, net (1)

$


49,376


$


1,848


3.74


%


$

43,200


$

1,525


3.53

%


$

42,028


$

1,542


3.67

%

Securities (2)(3)


7,448


200


2.69


6,625


156


2.35


5,965


163


2.73


 Reverse repurchase agreements


460


15


3.24


430


4


1.05


20


0.32


Interest-earning cash and cash equivalents


1,988


29


1.47


2,016


4


0.17


1,088


3


0.27


Total interest-earning assets


59,272


2,092


3.53


52,271


1,689


3.23


49,101


1,708


3.48


Non-interest-earning assets


5,130


5,275


5,008


Total assets

$


64,402


$

57,546


$

54,109


LIABILITIES AND STOCKHOLDERS’ EQUITY:


Interest-bearing deposits:


Interest-bearing checking and money market
   accounts

$


17,910


$


226


1.26


%


$

12,829


$

31


0.24

%


$

10,965


$

57


0.52

%

Savings accounts


9,336


60


0.64


7,612


28


0.36


5,520


32


0.57


Certificates of deposit


8,772


97


1.11


9,094


55


0.60


12,412


217


1.75


Total interest-bearing deposits


36,018


383


1.06


29,535


114


0.38


28,897


306


1.06


Short term borrowed funds


2,408


56


2.32


2,343


8


0.34


2,319


16


0.70


Other borrowed funds


12,982


257


1.99


13,366


278


2.08


12,514


286


2.28


Total Borrowed funds


15,390


313


2.04


15,709


286


1.82


14,833


302


2.03


Total interest-bearing liabilities


51,408


696


1.35


45,244


400


0.88


43,730


608


1.39


Non-interest-bearing deposits


5,124


4,578


2,957


Other liabilities


787


790


714


Total liabilities


57,319


50,612


47,401


Stockholders’ equity


7,083


6,934


6,708


Total liabilities and stockholders’ equity

$


64,402


$

57,546


$

54,109


Net interest income/interest rate spread


$


1,396


2.17


%


$


1,289


2.35

%


$


1,100


2.09

%

Net interest margin


2.35


%


2.47

%


2.24

%

Ratio of interest-earning assets to interest-bearing
   liabilities


1.15x


1.16x


1.12x


For the Years Ended December 31,
202320222021
(dollars in millions)Average BalanceInterestAverage Yield/CostAverage BalanceInterestAverage Yield/CostAverage BalanceInterestAverage Yield/Cost
ASSETS:
Interest-earning assets:
Mortgage and other loans and leases , net (1)
$81,855 $4,509 5.51 %$49,376 $1,848 3.74 %$43,200 $1,525 3.53 %
Securities (2) (3)
10,6114444.18 %7,448 200 2.69 %6,625 156 2.35 %
Reverse repurchase agreements388225.77 %460 15 3.24 %430 1.05 %
Interest-earning cash and cash equivalents10,0255165.14 %1,988 29 1.47 %2,016 0.17 %
Total interest-earning assets$102,879 $5,491 5.34 %$59,272 $2,092 3.53 %$52,271 $1,689 3.23 %
Non-interest-earning assets7,6165,130 5,275 
Total assets$110,495 $64,402 $57,546 
LIABILITIES AND STOCKHOLDERS' EQUITY:
Interest-bearing deposits:
Interest-bearing checking and money market accounts$29,286 $943 3.22 %$17,910 $226 1.26 %$12,829 $31 0.24 %
Savings accounts9,9411691.70 %9,336 60 0.64 %7,612 28 0.36 %
Certificates of deposit17,0976463.78 %8,772 97 1.11 %9,094 55 0.60 %
Total interest-bearing deposits$56,324 $1,758 3.12 %$36,018 $383 1.06 %$29,535 $114 0.38 %
Short term borrowed funds7,2633054.20 %2,408 56 2.32 %2,343 0.34 %
Other borrowed funds10,6713513.29 %12,982 257 1.99 %13,366 278 2.08 %
Total borrowed funds$17,934 $656 3.66 %$15,390 $313 2.04 %$15,709 $286 1.82 %
Total interest-bearing liabilities$74,258 $2,414 3.25 %$51,408 $696 1.35 %$45,244 $400 0.88 %
Non-interest-bearing deposits21,5835,124 4,578 
Other liabilities4,073787 790 
Total liabilities$99,914 $57,319 $50,612 
Stockholders’ equity10,5817,083 6,934 
Total liabilities and stockholders’ equity$110,495 $64,402 $57,546 
Net interest income/interest rate spread$3,077 2.09 %$1,396 2.17 %$1,289 2.35 %
Net interest margin2.99 %2.35 %2.47 %
Ratio of interest-earning assets to interest-bearing liabilities1.39 x1.15 x1.16 x
(1)
Amounts are net of net deferred loan origination costs/(fees) and the allowances for loan losses and includeincludes loans held for sale and non-performing loans.
(2)
Amounts are at amortized cost.
(3)
Includes FHLB stock and FRB stock.

54


The following table presents the extent to which changes in interest rates and changes in the volume of interest-earning assets and interest-bearing liabilities affected our interest income and interest expense during the periods indicated. Information is provided in each category with respect to (i) the changes attributable to changes in volume (changes in volume multiplied by prior rate); (ii) the changes attributable to changes in rate (changes in rate multiplied by prior volume); and (iii) the net change. The changes attributable to the combined impact of volume and rate have been allocated proportionately to the changes due to volume and the changes due to rate.rate on each separate line.

For the Years Ended December 31,
2023 compared to Year Ended 2022
Increase/(Decrease) Due to:
2022 compared to Year Ended 2021
Increase/(Decrease) Due to:
(in millions)VolumeRateNetVolumeRateNet
INTEREST-EARNING ASSETS:
Mortgage and other loans and leases, net$1789 $872 $2661 $231 $92 $323 
Securities13200000011200000024400000022 22 44 
Reverse repurchase agreements-400000011000000700000010 11 
Interest Earning cash and cash equivalents41300000074000000487000000— 25 25 
Total interest-earnings assets2,327 1,0723,399 247 156 403 
INTEREST-BEARING LIABILITIES:
Interest-bearing checking and money market accounts366 351 717 64 131 195 
Savings accounts10 99 109 11 21 32 
Certificates of deposit315 234 549 (4)46 42 
Short term borrowed funds204 45 249 46 48 
Other borrowed funds(76)170 94 (8)(13)(21)
Total interest-bearing liabilities743 975 1,718 83 213 296 
Change in net interest income$1,584 $97 $1,681 $164 $(57)$107 

48


Rate/Volume Analysis


Year Ended


Year Ended


December 31, 2022


December 31, 2021


Compared to Year Ended


Compared to Year Ended


December 31, 2021


December 31, 2020


Increase/(Decrease)


Increase/(Decrease)


Due to


Due to


(in millions)


Volume


Rate


Net


Volume


Rate


Net


INTEREST-EARNING ASSETS:


Mortgage and other loans and leases, net


$

227


$

96


$

323


$

48


$

(65

)


$

(17

)

Securities


21


23


44


28


(35

)


(7

)

Reverse repurchase agreements


11


11


4


4


Interest Earning Cash & Cash Equivalent


25


25


1


1


Total


248


155


403


81


(100

)


(19

)

INTEREST-BEARING LIABILITIES:


Interest-bearing checking and money
   market accounts


$

17


$

178


$

195


$

12


$

(38

)


$

(26

)

Savings accounts


7


25


32


(148

)


144


(4

)

Certificates of deposit


(2

)


44


42


(47

)


(115

)


(162

)

Short Term Borrowed Funds


48


48


(8

)


(8

)

Other Borrowed Funds


(8

)


(13

)


(21

)


25


(33

)


(8

)

Totals


14


282


296


(158

)


(50

)


(208

)

Change in net interest income


$

234


$

(127

)


$

107


$

239


$

(50

)


$

189


In connection

For the year ended December 31, 2023, the net interest margin was 2.99 percent, up 64 basis points compared to the year ended December 31, 2022. The year-over-year increase was primarily the result of a larger balance sheet with loans at higher yields driven by both the Flagstar acquisition we have recorded certainand the Signature Transaction along with the impact of higher interest rates. Average interest-earning assets andincreased $43.6 billion, or 74 percent, on a year-over-year basis to $102.9 billion for the year ended December 31, 2023, while the average yield rose 181 basis points to 5.34 percent.

Average loan balances rose $32.5 billion, or 66 percent, to $81.9 billion while the average loan yield rose 177 basis points to 5.51 percent on a year-over-year basis. Average cash balances increased $8.0 billion to $10.0 billion, while the average yield rose to 5.14 percent from 1.47 percent. Average securities increased $3.2 billion, or 42 percent, to $10.6 billion, while the average yield improved to 4.18 percent from 2.69 percent.

Average interest-bearing liabilities at fair value. The following table provides information regardingincreased $22.9 billion, or 44 percent, to $74.3 billion while the discounts and premiums that are estimatedaverage cost increased to accrete3.25 percent from 1.35 percent. Average interest-bearing deposits rose $20.3 billion, or amortize into earnings in future periods using56 percent, while the estimated effective duration and methods shown below.average cost of deposits increased to 3.12 percent compared to 1.06 percent. Average borrowed funds increased $2.5 billion to $17.9 billion while the average cost rose to 3.66 percent from 2.04 percent. Average non-interest-bearing deposits rose $16.5 billion to $21.6 billion.

(dollars in millions)

Remaining fair value adjustment at December 31, 2022


Estimated effective duration

Amortization method

One-to-four family first mortgage

$

(295

)

4 years

Interest method

Commercial real estate


(5

)

2 years

Interest method

Commercial and industrial


(25

)

2 years

Interest method

Consumer and other


(136

)

3 years

Interest method

Core deposit and other intangibles


287


9 years

Sum of years digits and straight-line

Deposits


36


2 years

Interest method

Other borrowings


40


7 years

Interest method

Provision for Credit Losses

Comparison to Prior Year to Date

For the twelve months

The year ended December 31, 2022, the provision for credit losses totaled $133 million compared to $3 million for the twelve months ended December 31, 2021. The fourth-quarter and full-year2023 provision for credit losses was impacted by$833 million compared to $133 million for the year ended December 31, 2022. The 2023 provision primarily reflects an initial $132 million provision for credit losses for acquired loans and related commitments from the Signature Transaction and a net $483 million increase in ACL and unfunded commitment reserves which reflects our actions to build reserves during the fourth quarter to address weakness in the office sector, potential repricing risk in the multi-family portfolio and conditions leading to increases in classified assets. Lastly, the Company recorded a net $10 million provision related to net charge-offs on AFS securities.

Total net loan charge-offs amounted to $208 million, including $112 million for a co-operative loan, $40 million for a CRE loan, and $30 million for commercial loans, mainly from two C&I loans in the initial ACL measurementfourth quarter. The charged-off co-

55


operative loan was subsequently transferred to held-for-sale status. On February 29, the loan was sold, realizing a gain of non-PCD Flagstar acquired loans totaling $117 million.$26 million from its previously written-down fair value estimate. This gain on sale will be recognized in the first quarter of 2024. For additional information about our methodologiesa more detailed discussion and analysis of the total allowance for recording recoveries of, and provisions for, loancredit losses, see the discussion"Credit Quality" section of the loan loss allowance under “Critical Accounting Policies”this MD&A and the discussion of “Asset Quality” that appear earlier in this report."Note 7 - Allowance for Credit Losses on Loans and Leases".

Non-Interest Income

We generate non-interest income through a variety of sources, including—among others—fee income (in the form of retail deposit fees and charges on loans); income from our investment in BOLI; net return on our MSR asset; gainsnet gain on loan sales of securities;and securitizations, net loan administration income (including loan subservicing income); income from our investment in BOLI; and “other” sources, including the revenues produced through the sale of third-party investment products and loan subservicing.products.

The following table summarizes our non-interest income for the respective periods:

For the Years Ended December 31,
(in millions)202320222021
Bargain purchase gain$2,131 $159 $— 
Fee income1722723
Net return on mortgage servicing rights1036
Net gain on loan sales and securitizations895
Other68179
Bank-owned life insurance433229
Net loan administration income823
Net loss on securities(1)(2)
Total non-interest income$2,687 $247 $61 

49


For

Non-interest income increased $2.4 billion for the twelve monthsyear ended December 31, 2023 compared to the year ended December 31, 2022 non-interest income totaled $247 million, which includes aprimarily due to the bargain purchase gain of $159 million$2.1 billion related to the Flagstar acquisition. Non-interestSignature Transaction. Excluding bargain purchase gains, non-interest income increased an additional $27 million fromfor the year-endedyear ended December 31, 2021,2023 totaled $556 million as compared to $88 million for the year-endedyear ended December 31, 2022, a 44 percent increase due primarily to fee income generated in December from the Flagstar acquisition.

Non-Interest Income Analysis

The following table summarizes our sources of non-interest income:


For the Years Ended December 31,


(in millions)


2022


2021


2020


Fee income


$

27


$

23


$

22


BOLI income


32


29


32


Net (loss) gain on securities


(2

)


1


Net return on mortgage servicing rights


6


Net gain on loan sales


5


Loan administration income


3


Bargain purchase gain


159


Other income:


Third-party investment product sales


6


5


4


Other


11


4


2


Total other income


17


9


6


Total non-interest income


$

247


$

61


$

61


Non-Interest Expense

2022. For the twelve monthsyear ended December 31, 2023, net gains on loan sales, net return on mortgage servicing rights and net loan administration income totaled $274 million compared to $14 million for the year ended December 31, 2022, total non-interest expenses were $684 million, up $143 million or 26 percentall driven by a full year of the Flagstar acquisition. The two acquisitions also drove higher fee income, loan administration income and other income driven by mortgage and FDIC loan servicing along with a higher volume of customer based fees.


Non-Interest Expense

Non-interest expense increased $4.3 billion for the year ended December 31, 2023 compared to the twelve months ended December 31, 2021. Excluding the impact of merger-related expenses totaling $75 million and intangible asset amortization of $5 million, total operating expenses were $604 million compared to $518 million last year up $86 million or 17 percent. The increase was primarily due to one month of Flagstar in our results. The efficiency ratio for full-year 2022 was 40.72 percent compared to 38.36 percent for full-year 2021.

Income Tax Expense

Income tax expense includes federal, New York State, and New York City income taxes, as well as non-material income taxes from other jurisdictions where we operate our branches and/or conduct our mortgage banking business.

For the twelve months ended December 31, 2022, total income taxdriven by goodwill impairment in the fourth quarter totaling $2.4 billion. Additionally, merger related expenses increased $223 million due to the closing of the Signature transaction and ongoing integration costs. Excluding the goodwill impairment and merger related expenses, non-interest expense was $176 million and the effective tax rate was 21.36 percent compared to income tax expense of $210 million and an effective tax rate of 26.09 percent for the twelve monthsyear ended December 31, 2021. The year-over-year decline2023 totaled $2.2 billion as compared to $0.6 billion for the year ended December 31, 2022.


Total operating expenses for the year ended December 31, 2023 were up approximately $1.5 billion compared to the year ended December 31, 2022 primarily driven by a full-year of Flagstar activity and the Signature transaction, which closed in late March of 2023. Included in total operating expenses is a $49 million expense for the effectiveFDIC special assessment issued to certain banks nationally related to deposit insurance fund shortfalls, including the assessment issued by the FDIC in February 2024..

Income Tax Expense

For the year ended December 31, 2023, the Company reported a provision for income taxes of $29 million, compared to $176 million for the year ended December 31, 2022. Income tax rate primarily reflectsexpense for the non-taxability of certain merger-related items includingcurrent year was impacted by the bargain purchase gain. In addition,gain arising from the effective tax rate in 2021 was negatively impacted by $2 million of income tax expense related to the revaluation of deferred taxes related to a change in the New York State tax rate.Signature transaction.


56


RESULTS OF OPERATIONS: 20212022 AS COMPARED TO 20202021

The results of operations comparison of 20212022 compared to 20202021 can be found in the Company’s previously filed Annual Report on Form 10-K for the year-ended December 31, 20212022 under Item 7 “Management’s Discussion and Analysis of Financial Condition and Results of Operations”- Results of Operations: 20212022 As Compared to 2020.2021.

Signature Transaction - Certain Financial Information

In accordance with the guidance provided in Staff Accounting Bulletin Topic 1:K, “Financial Statements of Acquired Troubled Financial Institutions” (“SAB 1:K”) the Company has omitted certain financial information on the Signature Transaction required by Rule 3-05 of Regulation S-X and Article 11 of Regulation S-X. SAB 1:K provides relief from the requirements of Rule 3-05 and Article 11 of Regulation S-X under certain circumstances, including a transaction such as the Signature Transaction, in which the registrant engages in an acquisition of a troubled financial institution for which historical financial statements are not reasonably available or relevant and in which federal assistance is an essential and significant part of the transaction.
50


FINANCIAL CONDITION

Balance Sheet Summary

At

Total assets increased $23.9 billion to $114.1 billion as of December 31, 2023, compared to $90.1 billion at December 31, 2022 total assets were $90.1 billion, up $30.6 billion or 51 percent compared to December 31, 2021. The growth compared the prior period was primarily due to the Flagstar acquisitionSignature Transaction, which added $25.8closed on March 20, 2023, and organic growth.

The Company acquired approximately $11.7 billion of assets,loans, net of purchase accounting adjustments ("PAA"), $33.5 billion of deposits, net of PAA, whileand $2.1 billion of other liabilities related to the remaining growth was driven by growth in our lending portfolios.Signature Transaction.

Total loans and leases held for investment were $84.6 billion at December 31, 2023 compared to $69.0 billion at December 31, 2022 compared to $45.72022. The increase was driven by the aforementioned loans acquired from the Signature Transaction and organic loan growth.

The securities portfolio totaled $9.2 billion at December 31, 2021. The Flagstar acquisition added $18.02023, compared to $9.1 billion at December 31, 2022. As of loans held for investment, netDecember 31, 2023, the Company has no held-to-maturity securities portfolio and all of PAA. the Company’s securities were designated as “Available-for-Sale”, consistent with December 31, 2022.

Total loans held for sale were $1.3deposits grew $22.8 billion, or 39 percent to $81.5 billion at December 31, 2023 compared to $58.7 billion at December 31, 2022 all of which wereprimarily driven by the result ofdeposits assumed in the Flagstar acquisition.

AtSignature Transaction. Included in the December 31, 2022, total2023 balance are $247 million in non-interest-bearing custodial deposits were $58.7 billion comparedrelated to $35.1 billion at December 31, 2021. The acquisition of Flagstar added $16.0 billion in deposits, net of PAA. the Signature Transaction.


Wholesale borrowings at December 31, 2022 totaled2023 remained flat at $20.3 billion when compared to $15.9 billion at December 31, 2021. The acquisition of Flagstar added $6.4 billion of wholesale borrowings.2022.

Borrowed funds totaled $21.3 billion as of year-end 2022, up $4.8 billion or 29 percent compared to year-end 2021. The acquisition of Flagstar added $6.7 billion of borrowings, net of PAA. The net decline was due to lower cost deposit growth.

57


Loans Held for Investmentheld-for-investment


The following table summarizes the composition of our loan portfolio:

At December 31,
20232022
(in millions)AmountPercent of Loans Held for InvestmentAmountPercent of Loans Held for Investment
Mortgage Loans:
Multi-family$37,265 44.0 %$38,130 55.3 %
Commercial real estate10,47012.4 %8,52612.4 %
One-to-four family first mortgage6,0617.2 %5,8218.4 %
Acquisition, development, and construction2,9123.4 %1,9962.8 %
Total mortgage loans$56,708 67.0 %$54,473 78.9 %
Other Loans:
Commercial and industrial$25,254 29.9 %$12,276 17.8 %
Other loans2,6573.1 %2,2523.3 %
Total other loans held for investment$27,911 33.0 %$14,528 21.1 %
Total loans and leases held for investment$84,619 100.0 %$69,001 100.0 %
Allowance for credit losses on loans and leases(992)(393)
Total loans and leases held for investment, net$83,627 $68,608 
Loans held for sale1,1821,115
Total loans and leases, net$84,809 $69,723 

Loan Maturity and Repricing Analysis


At December 31,


2022


2021


(dollars in millions)

Amount


Percent of
Loans
Held for
Investment


Amount


Percent of
Loans
Held for
Investment


Mortgage Loans:


Multi-family

$

38,130


55.3

%

$

34,628


75.7

%

Commercial real estate


8,526


12.4


6,701


14.7


One-to-four family first mortgage


5,821


8.4


160


0.3


Acquisition, development, and
   construction


1,996


2.8


209


0.5


Total mortgage loans


54,473


78.9


41,698


91.2


Other Loans:


Commercial and industrial


12,276


17.8


4,034


8.8


Other loans


2,252


3.3


6


0.0


Total other loans held for investment


14,528


21.1


4,040


8.8


Total loans and leases held for investment

$

69,001


100.0


$

45,738


100.0


Allowance for credit losses on loans and leases


(393

)


(199

)


Total loans and leases held for investment, net

$

68,608


$

45,539


Loans held for sale, at fair value


1,115


Total loans and leases, net

$

69,723


$

45,539


The following table sets forth the maturity or period to repricing of our portfolio of loans held for investment at December 31, 2023. Loans that have adjustable rates are shown as being due in the period during which their interest rates are next subject to change.

(in millions)Multi- FamilyCommercial Real EstateOne-to- Four FamilyAcquisition, Development, and ConstructionOtherTotal Loans
Amount due:
Within one year$3,530 $1,233 $14 $1,049 $8,323 $14,149 
After one year:
One to five years28,419 7,946 54 1,775 14,973 53,167 
Over five years to fifteen years5,314 1,263 297 25 3,280 10,179 
Over fifteen years28 5,696 63 1,335 7,124 
Total due or repricing after one year33,735 9,237 6,047 1,863 19,588 70,470 
Total amounts due or repricing, gross$37,265 $10,470 $6,061 $2,912 $27,911 $84,619 
51


58


The following table sets forth, as of December 31, 2023, the dollar amount of all loans held for investment that are due after December 31, 2024, and indicates whether such loans have fixed or adjustable rates of interest:

(in millions)FixedAdjustableTotal
Mortgage Loans:
Multi-family$8,758 $24,977 $33,735 
Commercial real estate3,381 5,856 9,237 
One-to-four family first mortgage2,201 3,846 6,047 
Acquisition, development, and construction121 1,742 1,863 
Total mortgage loans14,461 36,421 50,882 
Other loans9,836 9,752 19,588 
Total loans$24,297 $46,173 $70,470 

The following table summarizes our production of loans held for investment:

For the Years Ended December 31,
20232022
(in millions)AmountPercent of TotalAmountPercent of Total
Mortgage Loan Originated for Investment:
   Multi-family$839 4.0 %$8,387 49.2 %
Commercial real estate1,0925.3 %1,0866.4 %
One-to-four family first mortgage3,73918.1 %3281.9 %
Acquisition, development, and construction1,5717.6 %1490.9 %
Total mortgage loans originated for investment$7,241 35.0 %$9,950 58.4 %
Other Loans Originated for Investment:
Specialty finance$7,326 35.4 %$6,001 35.2 %
Commercial and industrial4,94223.9 %1,0166.0 %
Other1,1785.7 %830.4 %
Total other loans originated for investment$13,446 65.0 %$7,100 41.6 %
Total loans originated for investment$20,687 100.0 %$17,050 100.0 %


For the Years Ended December 31,


2022


2021


(dollars in millions)


Amount


Percent
of Total


Amount


Percent
of Total


Mortgage Loan Originated for Investment:


Multi-family


$


8,387


49.2


%


$

8,256


62.9


%

Commercial real estate


1,086


6.4


893


6.8


One-to-four family first mortgage


328


1.9


168


1.3


Acquisition, development, and construction


149


0.9


119


0.9


Total mortgage loans originated for investment


9,950


58.4


9,436


71.9


Other Loans Originated for Investment:


Specialty finance


6,001


35.2


3,153


24.0


Commercial and industrial


1,016


6.0


536


4.1


Other


83


0.4


6


0.0


Total other loans originated for investment


7,100


41.6


3,695


28.1


Total loans originated for investment


$


17,050


100.0


%


$

13,131


100.0


%

Multi-Family Loans

Multi-family loans are our principal asset.

The multi-family loans we produce are primarily secured by non-luxury residential apartment buildings in New York City that feature rent-regulated units and below-market rents—a market we refer to as our “primary lending niche.” Consistent with our emphasis on multi-family lending,rents.

The multi-family loan originations represented $8.4portfolio was $37.3 billion or 49 percent, of the loans we produced for investment in 2022.

Atat December 31, 2023, down slightly compared to $38.1 billion at December 31, 2022 multi-family loans represented $38.1 billion, or 55 percent,due to a combination of total loans held for investment, reflecting a year-over-year increase of $3.5 billion, or 10 percent.higher interest rates and our loan diversification strategy.


The majority of our multi-family loans were secured by rental apartment buildings.

At December 31, 2022, $22.22023, $21.1 billion or 5857 percent of the Company’s total multi-family loan portfolio is secured by properties in New York State, and, therefore,of which $18.3 billion are subject to the new rent regulation laws.Of the $18.3 billion properties subject to rent regulation, approximately 38 percent are currently in an interest only period.The weighted average LTV of the NYSNew York State rent regulated multi-family portfolioportfolio was 57.1558 percent as of December 31, 2022,2023 as compared to a weighted average LTV of 60.4857 percent for the entire multi-family loan portfolio at that date.

December 31, 2022.


In addition to underwriting multi-family loans on the basis of the buildings’ income and condition, we consider the borrowers’ credit history, profitability, and building management expertise. Borrowers are required to present evidence of their ability to repay the loan from the buildings’ current rent rolls, their financial statements, and related documents.

While a percentage of our multi-family loans are ten-year fixed rate credits, the vast majority of our multi-family loans feature a term of ten or twelve years, with a fixed rate of interest for the first five or seven years of the loan, and an alternative

59


rate of interest in years six through ten or eight through twelve. The rate charged in the first five or seven years is generally based on intermediate-term interest rates plus a spread.

During the remaining years, the loan resets to an annually adjustable rate that is indexed to CME Term SOFR ,or Prime, plus a spread. Alternately, the borrower may opt for a fixed rate that is tied to the five-year fixed advance rate of the FHLB-NY, plus a spread. The fixed-rate option also requires the payment of one percentage point of the then-outstanding loan balance. In either case, the minimum rate at repricing is equivalent to the rate in the initial five-or seven-year term. As the rent roll increases, the typical property owner seeks to refinance the mortgage, and generally does so before the loan reprices in year six or eight.

Multi-family loans that refinance within the first five or seven years are typically subject to an established prepayment penalty schedule. Depending on the remaining term of the loan at the time of prepayment, the penalties normally range from five percentage points to one percentage point of the then-current loan balance. If a loan extends past the fifth or seventh year and the borrower selects the fixed-rate option, the prepayment penalties typically reset

52


to a range of five points to one point over years six through ten or eight through twelve. For example, a ten-year multi-family loan that prepays in year three would generally be expected to pay a prepayment penalty equal to three percentage points of the remaining principal balance. A twelve-year multi-family loan that prepays in year one or two would generally be expected to pay a penalty equal to five percentage points.


Because prepayment penalties assessed to the borrower are recorded as interest income, they are reflected in the average yields on our loans and interest-earning assets, our net interest rate spread and net interest margin, and the level of net interest income we record. No assumptions are involved in the recognition of prepayment income, as such income is recorded when the cash is received.

Our success as a multi-family lender partly reflects the solid relationships we have developed with the market’s leading mortgage brokers and generational direct relationships, who are familiar with our lending practices, our underwriting standards, and our long-standing practice of basing our loans on the cash flows produced by the properties. The process of producing such loans is generally four to six weeks in duration and, because the multi-family market is largely broker-driven, the expense incurred in sourcing such loans is substantially reduced.

We believe our underwriting quality of multi-family lending is distinctive. This reflects the nature of the buildings securing our loans, our underwriting process and standards, and the generally conservative LTV ratios our multi-family loans feature at origination. Historically, a relatively small percentage of the multi-family loans that have transitioned to non-performing status have resulted in actual losses, even when the credit cycle has taken a downward turn.

duration.

We primarily underwrite our multi-family loans based on the current cash flows produced by the collateral property, with a reliance on the “income” approach to appraising the properties, rather than the “sales” approach. We also consider a variety of other factors, including the physical condition of the underlying property; the net operating income of the mortgaged premises prior to debt service; the DSCR, which is the ratio of the property’s net operating income to its debt service; and the ratio of the loan amount to the appraised value (i.e., the LTV) of the property.

In addition to requiring a minimum DSCR of 120 percent on multi-family buildings at origination, we obtain a security interest in the personal property located on the premises, and an assignment of rents and leases. Our multi-family loans generally represent no more than 75 percent of the lower of the appraised value or the sales price of the underlying property, and typically feature an amortization period of 30 years. In addition, our multi-family loans may contain an initial interest-only period which typically does not exceed two years; however, these loans are underwritten on a fully amortizing basis. Exceptions to these levels are made to borrowers on a case by case basis and approved by the joint authority of credit and lending officers and when necessary, the Board Credit Committee of the Board.

Accordingly, while

We continue to monitor our loans held for investment portfolio and the related allowance for credit losses, particularly given the economic pressures facing the commercial real estate and multi-family lending niche has not been immune to downturns in the credit cycle, the limited number of losses we have recorded, even in adverse credit cycles, suggests that the multi-family loans we produce involve less credit risk than certain other types of loans.markets. In general, buildings that are subject to rent regulation have historically tended to be stable, with occupancy levels remaining more or less constant over time. Because the rents are typically below market and the buildings securing our loans are generally maintained in good condition, they have been more likely to retain their tenants in adverse economic times. In addition, we generally exclude any short-term property tax exemptions and abatement benefits the property owners receive when we underwrite our multi-family loans.


60

53


The following table presents a geographical analysis of the multi-family loans in our held-for-investment loan portfolio:

At December 31, 2023
Multi-Family Loans
(in millions)AmountPercent of Total
New York City:
Manhattan$6,893 18 %
Brooklyn5,840 16 %
Bronx3,619 10 %
Queens2,831 %
Staten Island133 — %
Total New York City$19,316 52 %
New Jersey5,064 14 %
Long Island509 %
Total Metro New York$24,889 67 %
Other New York State1,233 %
Pennsylvania3,682 10 %
Florida1,681 %
Ohio1,085 %
Arizona434 %
All other states4,261 11 %
Total$37,265 100 %


At December 31, 2022


Multi-Family Loans


(dollars in millions)


Amount


Percent
of Total


New York City:


Manhattan

$


7,330


19.23


%

Brooklyn


6,385


16.75


Bronx


3,715


9.74


Queens


2,889


7.58


Staten Island


126


0.33


Total New York City

$


20,445


53.63


%

New Jersey


5,107


13.39


Long Island


574


1.51


Total Metro New York

$


26,126


68.53


%

Other New York State


1,157


3.02


Pennsylvania


3,760


9.86


Florida


1,690


4.43


Ohio


1,006


2.64


Arizona


442


1.16


All other states


3,949


10.36


Total

$


38,130


100.00


%

Commercial Real Estate

At December 31, 2022,2023, CRE loans represented $8.5$10.5 billion, or 12 percent, of total loans held for investment, reflecting a year-over-year$2.0 billion increase of $1.8 billionwhen compared to $8.5 billion at December 31, 2021 primarily driven by2022. Approximately $1.9 billion of CRE loans were acquired in the Flagstar acquisition.Signature Transaction.

CRE loans represented $1.1 billion, or 65 percent, of the loans we originated in 2022,for the year ended December 31, 2023 as compared to $893 million,$1.1 billion, or 76 percent infor the prior year.year ended December 31, 2022.

The CRE loans we produce are secured by income-producing properties such as office buildings, retail centers, mixed-use buildings, and multi-tenanted light industrial properties. At December 31, 2022,2023, the largest concentration of CRE loans were secured by properties in the metro New York City area, referarea. Refer to the Geographical Analysis table included abovebelow for additional details.

Approximately $3.4 billion of the CRE portfolio are office properties with an average balance of approximately $10 million and located primarily in the New York metro area.

The terms of more than half of our CRE loans are similar to the terms of our multi-family credits which primarily feature a fixed rate of interest for the first five years of the loan that is generally based on intermediate-term interest rates plus a spread. In addition to customary fixed rate terms, we now also offer floating rates advances indexed to CME Term SOFR. These products are generally offered in combination with interest rate cap or swaps that provide borrowers with additional optionality to manage their interest rate risk. Following the initial fixed rate period, the loan resets to an adjustable interest rate that is indexed to CME Term SOFR or Prime, plus a spread. Alternately, the borrower may opt for a fixed rate that is tied to the five-year fixed advance rate of the FHLB-NY plus a spread. The fixed-rate option also requires the payment of an amount equal to one percentage point of the then-outstanding loan balance. In either case, the minimum rate at repricing is equivalent to the rate in the initial five- or seven-year term.

Prepayment penalties apply to certain of our CRE loans, as they do our multi-family credits.loans. Depending on the remaining term of the loan at the time of prepayment, the penalties normally range from five percentage points to one percentage point of the then-current loan balance.

61


If a loan extends past the fifth or seventh year and the borrower selects the fixed rate option, the prepayment penalties typically reset to a range of five points to one point over years six through ten or eight through twelve.

54


The repayment of loans secured by commercial real estate is often dependent on the successful operation and management of the underlying properties. To minimize our credit risk, we

We originate CRE loans in adherence with conservative underwriting standards, and require that such loans qualify on the basis of the property’s current income stream and DSCR. The approval of a loan alsoprimarily depends on the borrower’s credit history, profitability, and expertise in property management, and generally requires a minimum DSCR of 130 percent and a maximum LTV of 65 percent. In addition, the origination of CRE loans typically requires a security interest in the fixtures, equipment, and other personal property of the borrower and/or an assignment of the rents and/or leases. In addition, certain of our CRE loans may contain an interest-only period which typically does not exceed three years; however, these loans are underwritten on a fully amortizing basis.

The following table presents a geographical analysis of the CRE loans in our held-for-investment loan portfolio:

At December 31, 2023
Commercial Real Estate Loans
(in millions)AmountPercent of Total
New York$5,319 51 %
Michigan1,000 10 %
New Jersey580 %
Florida457 %
Texas105 %
Pennsylvania374 %
Ohio132 %
All other states2,503 24 %
Total$10,470 100 %


At December 31, 2022


Commercial Real Estate Loans


(dollars in millions)

Amount


Percent
of Total


New York

$


5,081


59.59


%

Michigan


1,039


12.19


New Jersey


560


6.57


Pennsylvania


328


3.85


Florida


255


2.99


Ohio


149


1.75


Arizona


73


0.86


All other states


1,041


12.20


Total

$


8,526


100.00


%

Acquisition, Development, and Construction Loans

At December 31, 2022,2023, our ADC loans represented $2.0$2.9 billion, or 3 percent, of total loans held for investment, reflecting a year-over-yearan increase of $1.8 billion$916 million compared to December 31, 2021 primarily driven by the Flagstar acquisition.2022.

Because ADC loans are generally considered to have a higher degree of credit risk, especially during a downturn in the credit cycle, borrowers are required to provide a guarantee of repayment and completion. In the twelve months ended December 31, 2022 and 2021, we did not recover any losses against guarantees. The risk of loss on an ADC loan is largely dependent upon the accuracy of the initial appraisal of the property’s value upon completion of construction; the developer’s experience; the estimated cost of construction, including interest; and the estimated time to complete and/or sell or lease such property.

When applicable, as a condition to closing an ADC loan, it is our practice to require that properties meet pre-sale or pre-lease requirements prior to funding.

C&I Loans


At December 31, 20222023 C&I loans totaled $12.3$25.3 billion or 1830 percent of total loans held-for-investment. Included in this portfolio is $3.5$5.1 billion in warehouse loans that allow mortgage lenders to fund the closing of residential mortgage loans.

The non-warehouse C&I loans we produce are primarily made to small and mid-size businesses and finance companies. Such loans are tailored to meet the specific needs of our borrowers, and include term loans, demand loans, revolving lines of credit, and, to a much lesser extent, loans that are partly guaranteed by the Small Business Administration.

A broad range of C&I loans, both collateralized and unsecured, are made available to businesses for working capital (including inventory and accounts receivable), business expansion, the purchase of machinery and equipment,

55


and other general corporate needs. In determining the term and structure of C&I loans, several factors are considered, including the purpose, the collateral, and the anticipated sources of repayment. C&I loans are typically secured by business assets and personal guarantees of the borrower, and include financial covenants to monitor the borrower’s financial stability.


62


Also included in our C&I portfolio is our national warehouse lending platform with relationship managers across the country. We offer warehouse lines of credit to other mortgage lenders which allow the lender to fund the closing of residential mortgage loans. Each extension, advance, or draw-down on the line is fully collateralized by residential mortgage loans and is paid off when the lender sells the loan to an outside investor or, in some instances, to the Bank.

Underlying mortgage loans are predominantly originated using the Agencies'agencies' underwriting standards. The guideline for debt to tangible net worth is 15 to 1. We have $3.5At December 31, 2023, we had $5.1 billion outstanding warehouse loans to other mortgage lenders and have relationships in place to lend up to $11.6 $11.8 billion at our discretion.

The interest rates on our C&I loans can be fixed or floating, with floating-rate loans being tied to SOFR, prime or some other market index, plus an applicable spread. Our floating-rate loans may or may not feature a floor rate of interest. The decision to require a floor on C&I loans depends on the level of competition we face for such loans from other institutions, the direction of market interest rates, and the profitability of our relationship with the borrower.

Specialty Finance

At December 31, 2022,2023, specialty finance loans and leases totaled $4.4$5.2 billion or 76 percent of total loans held for investment, up $912$769 million or 2617 percent compared to December 31, 2021.2022.


We produce our specialty finance loans and leases through a subsidiary that is staffed by a group of industry veterans with expertise in originating and underwriting senior securitized debt and equipment loans and leases. The subsidiary participates in syndicated loans that are brought to them, and equipment loans and leases that are assigned to them, by a select group of nationally recognized sources, and are generally made to large corporate obligors, many of which are publicly traded, carry investment grade or near-investment grade ratings, and participate in stable industries nationwide.

The specialty finance loans and leases we fund fall into three categories: asset-based lending, dealer floor-plan lending, and equipment loan and leaselease financing. Each of these credits is secured with a perfected first security interest in, or outright ownership of, the underlying collateral, and structured as senior debt or as a non-cancelable lease. As of December 31, 2022, 782023, 84 percent of specialty finance loan commitments outstanding are structured as floating rate obligations which will benefit in a rising rate environment. All floating rate obligations are being transitioned from LIBOR to an appropriate LIBOR replacement index in accordance with the regulatory guidance provided around LIBOR cessation.

During 2022,
As of December 31, 2023, the Company originated $6.0$7.3 billion of specialty finance loans and leases, representing 35 percent of total originations compared to $3.2$6.0 billion during 2021,for the same period in 2022, representing 2435 percent of total originations.

Since launching our specialty finance business in the third quarter of 2013, no losses have been recorded on any of the loans or leases in this portfolio.

One-to-Four Family Loans


At December 31, 2022,2023, one-to-four family loans represented $5.8$6.1 billion, including $1.1 billion$996 million of LGG, or 87 percent, of total loans held for investment. As of December 31, 2021 total2023, the repurchase liability on LGG loans was $456 million. As of December 31, 2022 one-to-four family loans totaled $160 million, with the increase being driven by the Flagstar acquisition.$5.8 billion. These loans include various types of conforming and non-conforming fixed and adjustable rate loans underwritten using Fannie Mae and Freddie Mac guidelines for the purpose of purchasing or refinancing owner occupied and second home properties. We typically hold certain mortgage loans in LHFI that do not qualify for sale to the Agencies and that have an acceptable yield and risk profile. The LTV requirements on our residential first mortgage loans vary depending on occupancy, property type, loan amount, and FICO scores. Loans with LTVs exceedingexceeding 80 percent are required to obtain mortgage insurance. As of December 31, 2022,2023, non-government guaranteed loans in this portfolio had an average current FICO scorescore of 743741 and an average LTV of 58 percent.53.

56


Substantially all LGG are insured or guaranteed by the FHA or the U.S. Department of Veterans Affairs. Nonperforming repurchased loans in this portfolio earn interest at a rate based upon the 10-year U.S. Treasury note rate from the time the underlying loan becomes 60 days delinquent until the loan is conveyed to HUD (if foreclosure timelines are met), which is not paid by the FHA until claimed. The Bank has a unilateral option to repurchase loans sold to GNMA if the loan is due, but unpaid, for three consecutive months (typically referred to as 90 days past due) and can recover losses through a claims process from the guarantor. These loans are recorded in loans held for investment and the liability to repurchase the loans is recorded in other liabilities on the Consolidated Statements of Condition. Certain loans within our portfolio may be subject to indemnifications and insurance limits which expose us to limited credit risk. We have reserved for these risks within other assets and as a component of our ACL on residential first mortgages.

63


As of December 31, 2022, LGG loans totaled $1.2 billion and the repurchase liability was $0.3 billion.

Other Loans

At December 31, 2022,2023, other loans totaled $2.3$2.7 billion and consisted primarily of home equity lines of credit, boat and recreational vehicle indirect lending, point of sale consumer loans and other consumer loans, including overdraft loans.

Our home equity portfolio includes HELOANs, second mortgage loans, and HELOCs. These loans are underwritten and priced in an effort to ensure credit quality and loan profitability. Our debt-to-income ratio on HELOANs and HELOCs is capped at 43 percent and 45 percent, respectively. We currently limit the maximum CLTV to 89.99 percent and FICO scores to a minimum of 700. SecondSecond mortgage loans and HELOANs are fixed rate loans and are available with terms up to 20 years. HELOC loans are primarily variable-rate loans that contain a 10-year interest only draw period followed by a 20-year amortizing period. As of December 31, 2022,2023, loans in this portfolio had an average current FICO score of 752.751.


As of December 31, 2022,2023, loans in our indirect portfolio had an average current FICO score of 750.743. Point of sale loans consist of unsecured consumer installment loans originated primarily for home improvement purposes throughthrough a third-party financial technology company who also provides us a level of credit loss protection.

Loans Held for Sale

At December 31, 2022, loans held for sale were $1.1 billion compared to zeroLoans held-for-sale at December 31, 2021 with the increase driven by the Flagstar acquisition.2023 totaled $1.2 billion, up from $1.1 billion at December 31, 2022. The Signature Transaction contributed $360 million of Small Business Administration ("SBA") loans to this increase. We classify loans as held for sale when we originate or purchase loans that we intend to sell. We have elected the fair value option for nearly all of this portfolio.portfolio, except the SBA loans. We estimate the fair value of mortgage loans based on quoted market prices for securities backed by similar types of loans, where available, or by discounting estimated cash flows using observable inputs inclusive of interest rates, prepayment speeds and loss assumptions for similar collateral.


Credit Quality

A loan generally is classified as a “non-accrual” loan when it is 90 days or more past due or when it is deemed to be impaired because we no longer expect to collect all amounts due according to the contractual terms of the loan agreement. When a loan is placed on non-accrual status, we cease the accrual of interest owed, and previously accrued interest is reversed and charged against interest income. At December 31, 2023 and December 31, 2022, all of our non-performing loans were non-accrual loans. A loan is generally returned to accrual status when the loan is current and we have reasonable assurance that the loan will be fully collectible.

We monitor non-accrual loans both within and beyond our primary lending area in the same manner. Monitoring loans generally involves inspecting and re-appraising the collateral properties; holding discussions with the principals and managing agents of the borrowing entities and retain legal counsel, as applicable; requesting financial, operating, and rent roll information; confirming that hazard insurance is in place or force-placing such insurance; monitoring tax payment status. advancing funds as needed; and seeking approval from the courts to appoint a receiver, when necessary to protect the Bank’s interests, including to collect rents, manage property operations, and ensure maintenance of the collateral properties.

It is our policy to order updated appraisals for all non-performing loans 90 days or more past due that are collateralized by multi-family buildings, CRE properties, or land, if the most recent appraisal on file for the property is more than one year old. Appraisals are ordered annually until such time as the loan becomes performing and is returned to accrual status. It is not our policy to obtain updated appraisals for performing loans. However, appraisals may be ordered for performing loans when a borrower requests an increase in the loan amount, a modification in loan terms, or an extension of a maturing loan.

Non-performing loans are reviewed regularly by management and discussed on a monthly basis with the Board Credit Committee, and the Board of Directors of the Bank, as applicable. In accordance with our charge-off policy, collateral-dependent non-performing loans are written down to their current appraised values, less certain transaction costs. Workout specialists from our Loan MaturityWorkout Unit actively pursue borrowers who are delinquent in repaying their loans in an effort to collect payment. In addition, outside counsel with experience in foreclosure proceedings are retained to institute such action with regard to such borrowers.

Properties and Repricing Analysis:other assets that are acquired through foreclosure are classified as repossessed assets, and are recorded at fair value at the date of acquisition, less the estimated cost of selling the property. Subsequent declines in the fair value of the assets are charged to earnings and are included in non-interest expense. It is our policy to require an appraisal and an

64


environmental assessment of properties classified as OREO before foreclosure, and to re-appraise the properties on an as-needed basis, and not less than annually, until they are sold. We dispose of such properties as quickly and prudently as possible, given current market conditions and the property’s condition.

To mitigate the potential for credit losses, we underwrite our loans in accordance with credit standards that we consider to be prudent. In the case of multi-family and CRE loans, we look first at the consistency of the cash flows being generated by the property to determine its economic value using the “income approach,” and then at the market value of the property that collateralizes the loan. The amount of the loan is then based on the lower of the two values, with the economic value more typically used.

The condition of the collateral property is another critical factor. Multi-family buildings and CRE properties are inspected from rooftop to basement as a prerequisite to approval. Furthermore, independent appraisers, whose appraisals are carefully reviewed by our experienced in-house appraisal officers and staff, perform appraisals on collateral properties.

In addition, we work with a select group of mortgage brokers who are familiar with our credit standards and whose track record with our lending officers is typically greater than ten years. Furthermore, in New York City, where the majority of the buildings securing our multi-family loans are located, the rents that tenants may be charged on certain apartments are typically restricted under certain rent-control or rent-stabilization laws. As a result, the rents that tenants pay for such apartments are generally lower than current market rents. Buildings with a preponderance of such rent-regulated apartments are less likely to experience vacancies in times of economic adversity.

To further manage our credit risk, our lending policies limit the amount of credit granted to any one borrower, and typically require minimum DSCRs of 120 percent for multi-family loans and 130 percent for CRE loans. At origination, we typically lend up to 75 percent of the appraised value on multi-family buildings and up to 65 percent on commercial properties. Exceptions to these DSCR and LTV limitations are minimal and approved by the joint authority of credit and lending officers and when necessary, the Board Credit Committee of the Board.

With regard to ADC loans, we typically lend up to 75 percent of the estimated as-completed market value of multi-family and residential tract projects; however, in the case of home construction loans to individuals, the limit is 80 percent. With respect to commercial construction loans, we typically lend up to 65 percent of the estimated as-completed market value of the property. Credit risk is also managed through the loan disbursement process. Loan proceeds are disbursed periodically in increments as construction progresses, and as warranted by inspection reports provided to us by our own lending officers and/or consulting engineers.

To minimize the risk involved in specialty finance lending and leasing, each of our credits is secured with a perfected first security interest or outright ownership in the underlying collateral, and structured as senior debt or as a non-cancellable lease. To further minimize the risk involved in specialty finance lending and leasing, we re-underwrite each transaction. In addition, we retain outside counsel to conduct a further review of the underlying documentation.

Other C&I loans generally represent loans to commercial businesses which meet certain desired client characteristics and credit standards.The credit standards for commercial borrowers are based on numerous criteria, including historical and projected financial information, strength of management, acceptable collateral, and market conditions and trends in the borrower’s industry.These loans are generally variable rate loans in which the interest rate fluctuates with a specified index rate.

The procedures we follow with respect to delinquent loans are generally consistent across all categories, with late charges assessed, and notices mailed to the borrower, at specified dates. We attempt to reach the borrower by telephone to ascertain the reasons for delinquency and the prospects for repayment. When contact is made with a borrower at any time prior to foreclosure or recovery against collateral property, we attempt to obtain full payment, and will consider a repayment schedule to avoid taking such action. Delinquencies are addressed by our Loan Workout Unit and every effort is made to collect rather than initiate foreclosure proceedings.

Fair values for all multi-family buildings, CRE properties, and land are determined based on the appraised value. If an appraisal is more than one year old and the loan is classified as either non-performing or as an accruing TDM, then an updated appraisal is required to determine fair value. Estimated disposition costs are deducted from the fair value of the property to determine estimated net realizable value. In the instance of an outdated appraisal on an impaired loan, we adjust the original appraisal by using a third-party index value to determine the extent of impairment until an updated appraisal is received.


65


Asset Quality Measures

The following table presents the Company's asset quality measures at the respective dates:

December 31, 2023December 31, 2022
Non-performing loans to total loans held for investment0.51 %0.20 %
Non-performing assets to total assets0.39 0.17 
Allowance for credit losses on loans and leases to non-performing loans231.51 278.87 
Allowance for credit losses on loans and leases to total loans held for investment1.17 0.57 

Non-Performing Loans Held

The following table presents our non-performing loans held for Investmentinvestment by loan type and the changes in the respective balances:

Change from
December 31, 2022
to
December 31, 2023
(in millions)December 31, 2023December 31, 2022Amount
Non-Performing Loans(1)(2):
Non-accrual mortgage loans:
Multi-family$138 $13 $125 
Commercial real estate128 20 108 
One-to-four family first mortgage95 92 
Acquisition, development, and construction$$— 
Total non-accrual mortgage loans$363 $125 238 
Commercial and industrial43 40 
Other non-accrual loans(3)
22 13 
Total non-performing loans$428 $141 287 
Repossessed assets14 12 
Total non-performing assets$442 $153 289 
(1)Excludes LGG that are insured by U.S government agencies.

(2)Unpaid principal balance.
(3)Includes home equity, consumer and other loans.

The following table sets forth the maturity or periodchanges in non-accrual loans for the year ended December 31, 2023:

(in millions)
Balance at December 31, 2022$141 
New non-accrual, including acquired from acquisition466 
Charge-offs(97)
Transferred to repossessed assets(3)
Loan payoffs, including dispositions and principal pay-downs(36)
Restored to performing status(43)
Balance at December 31, 2023$428 

At December 31, 2023 total non-accrual mortgage loans increased $238 million to repricing of our portfolio of$363 million, while commercial and industrial loans held for investmentincreased $40 million to $43 million and other non-accrual loans increased $9 million to $22 million compared to December 31, 2022.

At December 31, 2023, NPA to total assets equaled 0.39 percent compared to 0.17 percent at December 31, 2022 while NPL to total loans equaled 0.51 percent compared to 0.20 percent at December 31, 2022. Loans that have adjustable rates are shown as being dueThe increase in NPLs was primarily driven by a $125 million increase in multi-family loans and a $108 million in commercial real estate loans, primarily office. Repossessed assets of $14 million were slightly higher compared to $12 million in the period during which their interest ratesprior year.


66


Delinquencies

The following table presents our loans, 30 to 89 days past due by loan type and the changes in the respective balances:

Change from
December 31, 2023
to
December 31, 2022
(in millions)December 31, 2023December 31, 2022AmountPercent
Loans 30 to 89 Days Past Due(1):
Multi-family$121 $34 $87 256 %
Commercial real estate28 26 1300 %
One-to-four family first mortgage40 21 19 90 %
Acquisition, development, and construction— NM
Commercial and industrial37 35 1750 %
Other loans22 11 11 100 %
Total loans 30-89 days past due$250 $70 180 257 %
(1)Excludes LGG that are next subject to change.insured by U.S government agencies.

Allowance for Credit Losses

(in millions)


Multi-
Family


Commercial
Real
Estate


One-to-
Four
Family


Acquisition,
Development,
and
Construction


Other


Total
Loans


Amount due:


Within one year


$


4,399


$


1,878


$


122


$


1,363


$


8,960


$


16,722


After one year:


One to five years


22,746


5,394


523


620


3,563


32,846


Over five years to fifteen years


10,961


1,254


1,639


13


1,386


15,253


Over fifteen years


24


3,537


619


4,180


Total due or repricing after one year


33,731


6,648


5,699


633


5,568


52,279


Total amounts due or repricing, gross


$


38,130


$


8,526


$


5,821


$


1,996


$


14,528


$


69,001


57


The following table sets forth the allocation of the consolidated allowance for losses on loans, at each year-end:

At December 31,
202320222021
(dollars in millions)AmountPercent of Total Loans and LeasesAmountPercent of Total Loans and LeasesAmountPercent of Total Loans and Leases
Multi-family loans$307 44 %$178 55 %$159 76 %
Commercial real estate loans36612 4612 1715 
One-to-four family first mortgage loans48461— 
Acquisition, development, and construction loans36202— 
Commercial and industrial13230 — — 
Other loans10310321 20
Total loans$992 100 %$393 100 %$199 100 %
(1)Percentages represent the percentage of each loan and lease category to total loans and leases

The allowance for credit losses on loans and leases increased $599 million from December 31, 2022 to December 31, 2023. The day 1 impact of the Signature Transaction that closed on March 20, 2023 added $127 million to the reserve. The remaining net increase of approximately $472 million primarily reflects our actions to build reserves during the fourth quarter to address weakness in the office sector, potential repricing risk in the multi-family portfolio and conditions leading to increases in classified assets, which better aligns the Company with its relevant bank peers, including Category IV banks. The allowance for credit losses on loans and leases represented 232 percent of non-performing loans at December 31, 2023, as compared to 279 percent at the prior year-end.

Based on the acceleration of asset quality metric deterioration and collateral value trends observed during 4Q23, predominantly in office, management employed its judgment and qualitative reserves were increased to the higher end of the range as of December 31, 2022,2023. In applying this judgement, management also considered the dollar amountseverity of allemerging risks such as feedback from regulators, market information, the impact of potential internal loan review weaknesses on the identification of emerging risks, deterioration in collateral values or borrower financial statements, trends or indications of degradation in asset quality metrics such as problem loans, charge-offs and nonaccruals, and market indications.

Charge-offs

For the year ended December 31, 2023, our gross charge-offs were $223 million and net charge-offs were $208 million, compared to gross charge-offs of $7 million and net recoveries of $4 million over the same period in 2022.


67


The following table presents information on the Company's net charge-offs:
For the Years Ended December 31,
20232022
(in millions)
Charge-offs:
Multi-family$119 $
Commercial real estate56 
One-to-four family residential— 
Commercial and industrial30 — 
Other14 
Total charge-offs$223 $
Recoveries:
Commercial real estate— (4)
One-to-four family residential— — 
Commercial and industrial(11)(7)
Other(4)— 
Total recoveries$(15)$(11)
Net charge-offs (recoveries)$208 $(4)


68


The following table presents information on the Company's net charge-offs as compared to average loans held for investment that are due after December 31, 2023, and indicates whether such loans have fixed or adjustable rates of interest:outstanding:

For the Years Ended December 31,
(in millions)202320222021
Multi-family
Net charge-offs during the period$119 $$
Average amount outstanding$37,839 $36,292 $32,424 
Net charge-offs as a percentage of average loans0.31 %0.00 %0.00 %
Commercial real estate
Net charge-offs during the period$56 $— $
Average amount outstanding$9,905 $6,964 $5,489 
Net charge-offs as a percentage of average loans0.57 %0.00 %0.04 %
One-to-Four Family first mortgage
Net charge-offs during the period$$— $
Average amount outstanding$5,907 $516 $191 
Net charge-offs as a percentage of average loans0.06 %0.00 %0.52 %
Acquisition, Development and Construction
Net charge-offs during the period$— $— $— 
Average amount outstanding$2,530 $203 $152 
Net charge-offs as a percentage of average loans0.00 %0.00 %0.00 %
Commercial and Industrial Loans
Net charge-offs during the period$19 $(7)$— 
Average amount outstanding$21,460 $— $— 
Net charge-offs as a percentage of average loans0.09 %0.00 %0.00 %
Other Loans
Net charge-offs (recoveries) during the period$10 $(5)$(6)
Average amount outstanding$2,552 $5,401 $4,944 
Net charge-offs (recoveries) as a percentage of average loans0.38 %(0.09)%(0.12)%
Total loans
Net charge-offs (recoveries) during the period$208 $(4)$(2)
Average amount outstanding$80,193 $49,376 $43,200 
Net charge-offs (recoveries) as a percentage of average loans0.26 %(0.01)%0.00 %


Due after December 31, 2023


(in millions)


Fixed


Adjustable


Total


Mortgage Loans:


Multi-family


$


8,564


$


25,167


$


33,731


Commercial real estate


2,040


4,608


6,648


One-to-four family first mortgage


2,402


3,297


5,699


Acquisition, development, and construction


21


612


633


Total mortgage loans


13,027


33,684


46,711


Other loans


2,534


3,034


5,568


Total loans


$


15,561


$


36,718


$


52,279


Lending Authority

We maintain credit limits in compliance with regulatory requirements. Under regulatory guidance, the Bank may not make a loan or extend credit to a single or related group of borrowers in excess of 15 percent of Tier 1 plus Tier 2 capital and any portion of the ACL not included in Tier 2 capital. We have a tracking and reporting process to monitor lending concentration levels, and all new commercial real estate credit exposures to relationships that exceed $200 million and all other commercial credit exposures to relationships that exceed $100 million must be approved by the Board Credit Committee of the Board. Exceptions to these levels are made to strong borrowers on a case by case basis, with the approval of the Board Credit Committee of the Board. Relationships less than the aforementioned limits including those discussed throughout the loans held for investment section of this document, are approved by the joint authority of credit officers and lending officers. The Board Credit Committee has authority to direct changes in lending practices as they deem necessary or appropriate in order to address individual or aggregate risks, including regulatory considerations, and credit exposures in accordance with the Bank’s strategic objectives and risk appetites.


69


At December 31, 20222023 and 2021,December 31, 2022, the largest mortgage loan in our portfolio waswas a $329 million multi-family loan, which is collateralized by six properties located in Brooklyn, New York. As of the date of this report, the loan has been current since origination.
Securities

At December 31, 2022 and 2021, the largest mortgage loan in our portfolio was a $329 million multi-family loan, which is collateralized by six properties located in Brooklyn, New York. As of the date of this report, the loan has been current since origination.

Asset Quality

All asset quality information excludes LGG that are insured by U.S government agencies.

58


Delinquent and non-performing loans held for investment and Repossessed Assets

The following table presents our loans, 30 to 89 days past due by loan type and the changes in the respective balances:


Change from
December 31, 2021
to
December 31, 2022


(dollars in millions)


December 31,
2022


December 31,
2021


Amount


Percent


Loans 30-89 Days Past Due:


Multi-family


$

34


$

57


$

(23

)


-40

%


Commercial real estate


2


2


0


One-to-four family first mortgage


21


8


13


163


Acquisition, development, and construction


NM


Other loans


13


13


NM


Total loans 30-89 days past due


$

70


$

67


$

3


4

%


A loan generally is classified as a “non-accrual” loan when it is 90 days or more past due or when it is deemed to be impaired because we no longer expect to collect all amounts due according to the contractual terms of the loan agreement. When a loan is placed on non-accrual status, we cease the accrual of interest owed, and previously accrued interest is reversed and charged against interest income. At December 31, 2022 and 2021, all of our non-performing loans were non-accrual loans. A loan is generally returned to accrual status when the loan is current and we have reasonable assurance that the loan will be fully collectible.

We monitor non-accrual loans both within and beyond our primary lending area in the same manner. Monitoring loans generally involves inspecting and re-appraising the collateral properties; holding discussions with the principals and managing agents of the borrowing entities and retain legal counsel, as applicable; requesting financial, operating, and rent roll information; confirming that hazard insurance is in place or force-placing such insurance; monitoring tax payment status. advancing funds as needed; and seeking approval from the courts to appoint a receiver, when necessary to protect the Bank’s interests, including to collect rents, manage property operations, and ensure maintenance of the collateral properties.

It is our policy to order updated appraisals for all non-performing loans 90 days or more past due, irrespective of loan type, that are collateralized by multi-family buildings, CRE properties, or land, if the most recent appraisal on file for the property is more than one year old. Appraisals are ordered annually until such time as the loan becomes performing and is returned to accrual status. It is not our policy to obtain updated appraisals for performing loans. However, appraisals may be ordered for performing loans when a borrower requests an increase in the loan amount, a modification in loan terms, or an extension of a maturing loan.

59


The following table presents our non-performing loans by loan type and the changes in the respective balances:


Change from
December 31, 2021
to
December 31, 2022


(dollars in millions)


December 31,
2022


December 31,
2021


Amount


Percent


Non-Performing Loans:


Non-accrual mortgage loans:


Multi-family

$


13


$

10


$


3


30


%

Commercial real estate


20


16


4


25


One-to-four family first mortgage


92


1


91


9,100


Acquisition, development, and construction


Total non-accrual mortgage loans


125


27


98


363


Non-accrual other loans (1)


16


6


10


167


Total non-performing loans

$


141


$

33


$


108


327


(1)
Includes Commercial and Industrial, Home Equity, Consumer and other loans.

The following table sets forth the changes in non-performing loans over the twelve months ended December 31, 2022:

(in millions)

Balance at December 31, 2021

$

33

New non-accrual

39

Non-accrual acquired from acquisition

104

Charge-offs

(1

)

Transferred to repossessed assets

Loan payoffs, including dispositions and principal
   pay-downs

(32

)

Restored to performing status

(2

)

Balance at December 31, 2022

$

141

Total non-accrual mortgage loans increased $98 million to $125 million, while other non-accrual loans increased $10 million to $16 million compared to $6 million at December 31, 2021. Included the December 31, 2022 amountsecurities were non-accrual home equity loans of $9 million acquired in the Flagstar acquisition.

Total NPAs were $153 million$9.2 billion, or 0.178 percent, of total assets at December 31, 2022, up 273 percent or $112 million 2023, compared to $41 million or 0.07 percent of total assets at December 31, 2021, primarily driven by the Flagstar acquisition. Repossessed assets totaled $12 million, up $4 million compared to the balance at December 31, 2021. The Company’s repossessed assets includes repossessed taxi medallions of $4 million at December 31, 2022 compared to $5 million at December 31, 2021.

Non-performing loans are reviewed regularly by management and discussed on a monthly basis with the Board Credit Committee, and the Board of Directors of the Bank, as applicable. In accordance with our charge-off policy, collateral-dependent non-performing loans are written down to their current appraised values, less certain transaction costs. Workout specialists from our Loan Workout Unit actively pursue borrowers who are delinquent in repaying their loans in an effort to collect payment. In addition, outside counsel with experience in foreclosure proceedings are retained to institute such action with regard to such borrowers.

Properties and other assets that are acquired through foreclosure are classified as repossessed assets, and are recorded at fair value at the date of acquisition, less the estimated cost of selling the property. Subsequent declines in

60


the fair value of the assets are charged to earnings and are included in non-interest expense. It is our policy to require an appraisal and an environmental assessment of properties classified as OREO before foreclosure, and to re-appraise the properties on an as-needed basis, and not less than annually, until they are sold. We dispose of such properties as quickly and prudently as possible, given current market conditions and the property’s condition.

To mitigate the potential for credit losses, we underwrite our loans in accordance with credit standards that we consider to be prudent. In the case of multi-family and CRE loans, we look first at the consistency of the cash flows being generated by the property to determine its economic value using the “income approach,” and then at the market value of the property that collateralizes the loan. The amount of the loan is then based on the lower of the two values, with the economic value more typically used.

The condition of the collateral property is another critical factor. Multi-family buildings and CRE properties are inspected from rooftop to basement as a prerequisite to approval. Furthermore, independent appraisers, whose appraisals are carefully reviewed by our experienced in-house appraisal officers and staff, perform appraisals on collateral properties.

In addition, we work with a select group of mortgage brokers who are familiar with our credit standards and whose track record with our lending officers is typically greater than ten years. Furthermore, in New York City, where the majority of the buildings securing our multi-family loans are located, the rents that tenants may be charged on certain apartments are typically restricted under certain rent-control or rent-stabilization laws. As a result, the rents that tenants pay for such apartments are generally lower than current market rents. Buildings with a preponderance of such rent-regulated apartments are less likely to experience vacancies in times of economic adversity.

Reflecting the strength of the underlying collateral for these loans and the collateral structure, a relatively small percentage of our non-performing multi-family loans have resulted in losses over time.

To further manage our credit risk, our lending policies limit the amount of credit granted to any one borrower, and typically require minimum DSCRs of 120 percent for multi-family loans and 130 percent for CRE loans. Although we typically lend up to 75 percent of the appraised value on multi-family buildings and up to 65 percent on commercial properties, the average LTVs of such credits at origination were below those amounts at December 31, 2022. Exceptions to these LTV limitations are minimal and are reviewed on a case-by-case basis.

The repayment of loans secured by commercial real estate is often dependent on the successful operation and management of the underlying properties. To minimize our credit risk, we originate CRE loans in adherence with conservative underwriting standards, and require that such loans qualify on the basis of the property’s current income stream and DSCR. The approval of a CRE loan also depends on the borrower’s credit history, profitability, and expertise in property management. Given that our CRE loans are underwritten in accordance with underwriting standards that are similar to those applicable to our multi-family credits, the percentage of our non-performing CRE loans that have resulted in losses has been comparatively small over time.

Multi-family and CRE loans are generally originated at conservative LTVs and DSCRs, as previously stated. Low LTVs provide a greater likelihood of full recovery and reduce the possibility of incurring a severe loss on a credit; in many cases, they reduce the likelihood of the borrower “walking away” from the property. Although borrowers may default on loan payments, they have a greater incentive to protect their equity in the collateral property and to return their loans to performing status. Furthermore, in the case of multi-family loans, the cash flows generated by the properties are generally below-market and have significant value.

With regard to ADC loans, we typically lend up to 75 percent of the estimated as-completed market value of multi-family and residential tract projects; however, in the case of home construction loans to individuals, the limit is 80 percent. With respect to commercial construction loans, we typically lend up to 65 percent of the estimated as-completed market value of the property. Credit risk is also managed through the loan disbursement process. Loan proceeds are disbursed periodically in increments as construction progresses, and as warranted by inspection reports provided to us by our own lending officers and/or consulting engineers.

61


To minimize the risk involved in specialty finance lending and leasing, each of our credits is secured with a perfected first security interest or outright ownership in the underlying collateral, and structured as senior debt or as a non-cancellable lease. To further minimize the risk involved in specialty finance lending and leasing, we re-underwrite each transaction. In addition, we retain outside counsel to conduct a further review of the underlying documentation.

Other C&I loans generally represent loans to commercial businesses which meet certain desired client characteristics and credit standards. The credit standards for commercial borrowers are based on numerous criteria, including historical and projected financial information, strength of management, acceptable collateral, and market conditions and trends in the borrower’s industry. These loans are generally variable rate loans in which the interest rate fluctuates with a specified index rate.

The procedures we follow with respect to delinquent loans are generally consistent across all categories, with late charges assessed, and notices mailed to the borrower, at specified dates. We attempt to reach the borrower by telephone to ascertain the reasons for delinquency and the prospects for repayment. When contact is made with a borrower at any time prior to foreclosure or recovery against collateral property, we attempt to obtain full payment, and will consider a repayment schedule to avoid taking such action. Delinquencies are addressed by our Loan Workout Unit and every effort is made to collect rather than initiate foreclosure proceedings.

Fair values for all multi-family buildings, CRE properties, and land are determined based on the appraised value. If an appraisal is more than one year old and the loan is classified as either non-performing or as an accruing TDR, then an updated appraisal is required to determine fair value. Estimated disposition costs are deducted from the fair value of the property to determine estimated net realizable value. In the instance of an outdated appraisal on an impaired loan, we adjust the original appraisal by using a third-party index value to determine the extent of impairment until an updated appraisal is received.

While we strive to originate loans that will perform fully, adverse economic and market conditions, among other factors, can negatively impact a borrower’s ability to repay. Historically, our level of charge-offs has been relatively low in downward credit cycles, even when the volume of non-performing loans has increased. In 2022, we recorded a net recovery of $4 million, as compared to net recovery of $2 million in the previous year.

Partially reflecting the net recoveries noted above, and the provision of $133 million for the allowance for loan losses, the allowance for credit losses increased $194 million, equaling $393 million at December 31, 2022 from $199 million at December 31, 2021. The majority of the increase is related to the initial provision for credit losses of $117 million and the adjustment for PCD loans acquired in the Flagstar acquisition. The allowance for credit losses on loans and leases represented 278.87 percent of non-performing loans at December 31, 2022, as compared to 611.79 percent at the prior year-end.

Based upon all relevant and available information at the end of this December, management believes that the allowance for losses on loans was appropriate at that date.

Troubled Debt Restructurings

In an effort to proactively manage delinquent loans, we have selectively extended such concessions as rate reductions and extensions of maturity dates, as well as forbearance agreements, to certain borrowers who have experienced financial difficulty. In accordance with GAAP, we are required to account for such loan modifications or restructurings as TDRs.

The eligibility of a borrower for work-out concessions of any nature depends upon the facts and circumstances of each transaction, which may change from period to period, and involve management’s judgment regarding the likelihood that the concession will result in the maximum recovery for the Company.

Loans modified as TDRs are placed on non-accrual status until we determine that future collection of principal and interest is reasonably assured. This generally requires that the borrower demonstrate performance according to the restructured terms for at least six consecutive months.

62


At December 31, 2022, loans modified as TDRs totaled $44 million, including accruing loans of $16 million and non-accrual loans of $28 million. At the prior year-end, loans modified as TDRs totaled $29 million, including accruing loans of $16 million and non-accrual loans of $13 million.

Analysis of Troubled Debt Restructurings

The following table sets forth the changes in our TDRs over the twelve months ended December 31, 2022:

(in millions)


Accruing


Non-
Accrual


Total


Balance at December 31, 2021

$


16


$


13


$


29


New TDRs


19


19


Charge-offs


Transferred from performing


Loan payoffs, including dispositions and
   principal pay-downs


(4

)


(4

)

Balance at December 31, 2022

$


16


$


28


$


44


Loans on which concessions were made with respect to rate reductions and/or extensions of maturity dates totaled $38 million and $29 million, respectively, at December 31, 2022 and 2021; loans in connection with which forbearance agreements were reached amounted to $6 million and $0 million at the respective dates.

Based on the number of loans performing in accordance with their revised terms, at December 31, 2022, our success rate for restructured CRE loans was 100 percent, our success rate for one-to-four loans was 100 percent and our success rate for other loans was 35 percent.

On a limited basis, we may provide additional credit to a borrower after the loan has been placed on non-accrual status or modified as a TDR if, in management’s judgment, the value of the property after the additional loan funding is greater than the initial value of the property plus the additional loan funding amount. In 2022, no such additional credit was provided. Furthermore, the terms of our restructured loans typically would not restrict us from cancelling outstanding commitments for other credit facilities to a borrower in the event of non-payment of a restructured loan.

For additional information about our TDRs at December 31, 2022 and 2021, see the discussion of “Asset Quality” in Note 6, “Loans and Leases” in Item 8, “Financial Statements and Supplementary Data.”

Except for the non-accrual loans and TDRs disclosed in this filing, we did not have any potential problem loans at December 31, 2022 that would have caused management to have serious doubts as to the ability of a borrower to comply with present loan repayment terms and that would have resulted in such disclosure if that were the case.

Asset Quality Analysis

The following table presents information regarding our asset quality measures:


At or for the Years Ended December 31,


2022


2021


2020


Non-performing loans to total loans


0.20


%


0.07


%


0.09


Non-performing assets to total assets


0.17


0.07


0.08


Allowance for losses on loans to non-performing loans


278.87


611.79


513.55


Allowance for losses on loans to total loans


0.57


0.44


0.45


63


The following table presents information on the Company's net charge-offs as compared to average loans outstanding:


For the Year Ended


December 31,


(dollars in millions)

2022


2021


2020


Multi-family


     Net charge-offs (recoveries) during the period

$

1


$

1


$

(1

)

     Average amount outstanding

$

36,292


$

32,424


$

31,322


      Net charge-offs (recoveries) as a percentage of average loans


0.00

%


0.00

%


0.00

%


Commercial real estate


     Net charge-offs (recoveries) during the period

$

-


$

2


$

2


     Average amount outstanding

$

6,964


$

5,489


$

6,009


      Net charge-offs (recoveries) as a percentage of average loans


0.00

%


0.04

%


0.03

%


One-to-Four Family first mortgage


     Net charge-offs (recoveries) during the period

$

-


$

1


$

-


     Average amount outstanding

$

516


$

191


$

314


      Net charge-offs (recoveries) as a percentage of average loans


0.00

%


0.52

%


0.00

%


Acquisition, Development and Construction


     Net charge-offs (recoveries) during the period

$

-


$

-


$

-


     Average amount outstanding

$

203


$

152


$

116


      Net charge-offs (recoveries) as a percentage of average loans


0.00

%


0.00

%


0.00

%


Other Loans


     Net charge-offs (recoveries) during the period

$

(5

)

$

(6

)

$

18


     Average amount outstanding

$

5,401


$

4,944


$

4,267


      Net charge-offs (recoveries) as a percentage of average loans


-0.09

%


-0.12

%


0.42

%


Total loans


     Net charge-offs (recoveries) during the period

$

(4

)

$

(2

)

$

19


     Average amount outstanding

$

49,376


$

43,200


$

42,028


      Net charge-offs (recoveries) as a percentage of average loans


-0.01

%


0.00

%


0.04

%

The following table sets forth the allocation of the consolidated allowance for losses on loans, at each year-end:


2022


2021


2020


(dollars in millions)

Amount


Percent of
Loans in
Each
Category
to Total
Loans
Held
for
Investment


Amount


Percent of
Loans in
Each
Category
to Total
Loans
Held
for
Investment


Amount


Percent of
Loans in
Each
Category
to Total
Loans
Held
for
Investment


Multi-family loans

$

178


55.26

%


$

159


75.71

%


$

150


75

%

Commercial real estate loans


46


12.36


17


14.65


24


15.96


One-to-four family first mortgage loans


46


8.44


1


0.35


1


0.55


Acquisition, development, and construction loans


20


2.79


2


0.46


1


0.21


Other loans


103


21.05


20


8.83


18


8.00


Total loans

$

393


100.00

%


$

199


100.00

%


$

194


100.00

%

Each of the preceding allocations was based upon an estimate of various factors, as discussed in “Critical Accounting Estimates”, and a different allocation methodology may be deemed to be more appropriate in the future. In addition, it should be noted that the portion of the allowance for losses on loans allocated to each loan category does not represent the total amount available to absorb losses that may occur within that category, since the total loan loss allowance is available for the entire loan portfolio.

64


Securities

Total securities were $9.1 billion, or 10 percent of total assets at December 31, 2022 compared to $5.8 billion, or 10 percent of total assets at December 31, 2021.. At December 31, 20222023 and December 31, 2021,2022, all of our securities were designated as “Available-for-Sale”. At December 31, 2022, 152023, 12 percent of our portfolio are floating rate securities.


As of December 31, 2023, the net unrealized loss on securities available for sale, net of tax, was $581 million as compared to $626 million at December 31, 2022, reflecting the rising interest rate environment.

At December 31, 2022,2023, available-for-sale securities had an estimated weighted average life of 6six years. Included in the year-endquarter-end amount were mortgage-related securities of $4.8$6.6 billion and other debt securities of $4.3$2.6 billion.

At the prior year-end, available-for-sale securities were $5.8$9.1 billion, and had an estimated weighted average life of 6.9six years. Mortgage-related securities accounted for $2.8$4.8 billion of the year-end balance, with other debt securities accounting for the remaining $3.0$4.3 billion.

The investment policies of the Company and the Bank are established by the Board of Directors and implemented by the ALCO. ALCO meets monthly or on an as-needed basis to review the portfolios and specific capital market transactions. In addition, the securities portfolios and investment activities are reviewed monthly by the Board of Directors. Furthermore, the policy governing the investment portfolio activities is reviewed at least annually by the ALCO and ratified by the Board of Directors.

Our general investment strategy is to purchase liquid investments with various maturities to ensure that our overall interest rate risk position stays within the required limits of our investment policies. We generally limit our investments to GSE obligations and U.S. Treasury obligations. At December 31, 2022 and 2021, GSE obligations and U.S. Treasury obligations together represented 86 percent and 83 percent of total securities, respectively. The remainder of the portfolio at those dates was comprised of asset-backed securities, corporate bonds, foreign notes, capital trust notes, and municipal obligations.

The following table summarizes the weighted average yields of debt securities for the maturities indicated at December 31, 2022:


Mortgage-
Related
Securities


U.S.
Government
and GSE
Obligations


State,
County,
and
Municipal


Other
Debt
Securities
(2)


Available-for-Sale Debt
   Securities:
(1)


Due within one year


4.46


%


3.12


%


4.89


%


4.29


%

Due from one to five years


3.27


3.14


5.58


Due from five to ten years


3.05


1.53


3.72


5.09


Due after ten years


3.61


1.88


4.07


5.35


Total debt securities available for sale


3.58


2.42


3.91


5.32


2023:
Mortgage-
Related
Securities
U.S.
Government
and GSE
Obligations
State,
County,
and
Municipal
Other
Debt
Securities (2)
Available-for-Sale Debt Securities: (1)
Due within one year— %4.65 %— %— %
Due from one to five years3.33 5.42 — 5.53 
Due from five to ten years2.73 1.61 3.16 5.05 
Due after ten years4.18 — — 5.74 
Total debt securities available for sale4.09 2.27 3.16 5.56 
(1)
The weighted average yields are calculated by multiplying each carrying value by its yield and dividing the sum of these results by the total carrying values and are not presented on a tax-equivalent basis.
(2)
Includes corporate bonds, capital trust notes, foreign notes, and asset-backed securities.

Federal Reserve and Federal Home Loan Bank Stock

At December 31, 2023 the Company had $861 million and $329 million of FHLB-NY stock, at cost, and FHLB-Indianapolis stock, at cost, respectively. At December 31, 2022, the Company had $762 million and $329 million of FHLB-NY stock, at cost and FHLB-Indianapolis stock, at cost, respectively. At December 31, 2021, the Company had $734 million of FHLB-NY stock, at cost. The Company maintains an investment in FHLB-NY stock and, as a result of the Flagstar acquisition, FHLB-Indianapolis stock, partly in conjunction with its membership in the FHLB and partly related to its access to the FHLB funding it utilizes. In addition, at December 31, 2022, the Company had $176 million of Federal Reserve Bank stock, at cost. The Company had no Federal Reserve Bank stock,cost, of $203 million and $176 million at December 31, 2021.2023 and December 31, 2022, respectively.

65


Bank-Owned Life Insurance

BOLI is recorded at the total cash surrender value of the policies in the Consolidated Statements of Condition, and the income generated by the increase in the cash surrender value of the policies is recorded in “Non-interest income” in the Consolidated Statements of Income and Comprehensive Income. Reflecting an increase in the cash surrender value of the underlying policies, and $373 million acquired in the Flagstar acquisition our investment in BOLI at December 31, 2023 rose $377$19 million year-over-yearto$1.6 billion compared to $1.6 billion at December 31, 2022.


70


Goodwill


We record goodwill in our consolidated statements of condition in connection with certain of our business combinations. Goodwill, which is tested at least annually for impairment, refers to the difference between the purchase price and the fair value of an acquired company’s assets, net of the liabilities assumed.

For more information about the Company’s goodwill, see the discussion As of “Summary of Significant Accounting Policies” in the Footnote 2 of these consolidated statements.

Sources of Funds

The Parent Company has four primary funding sources for the payment of dividends, share repurchases, and other corporate uses: dividends paid to the Parent Company by the Bank; capital raised through the issuance of securities; funding raised through the issuance of debt instruments; and repayments of, and income from, investment securities.

On a consolidated basis, our funding primarily stems from a combination of the following sources: retail, institutional, and brokered deposits; borrowed funds, primarily in the form of wholesale borrowings; cash flows generated through the repayment and sale of loans; and cash flows generated through the repayment and sale of securities.

In 2022, loan repayments and sales generated cash flows of $10.7 billion, as compared to $10.4 billion in 2021.

In 2022, cash flows from the repayment of securities totaled $732 million, while the purchase of securities amounted to $2.2 billion for the year. By comparison, cash flows from the repayment of securities totaled $1.7 billion, in 2021, and were offset by the purchase of securities totaling $1.7 billion.

In 2022, the cash flows from loans and securities were primarily deployed into the production of multi-family loans held for investment, as well as held-for-investment CRE loans and specialty finance loans and leases.

Deposits

Our ability to retain and attract deposits depends on numerous factors, including customer satisfaction, the rates of interest we pay, the types of products we offer, and the attractiveness of their terms. From time to time, we have chosen not to compete actively for deposits, depending on our access to deposits through acquisitions, the availability of lower-cost funding sources, the impact of competition on pricing, and the need to fund our loan demand. The vast majority of our deposits are retail in nature (i.e., they are deposits we have gathered through our branches or through business combinations).

Total deposits increased $23.7 billion or 67 percent on a year-over-year basis to $58.7 billion. Deposit growth was driven by the addition of $16.0 billion of deposits from the Flagstar acquisition and $7.6 billion growth in loan-related deposits and BaaS deposits. Loan-related deposits totaled $4.4 billion at December 31, 2022 up $389 million or 10 percent relative to $4.0 billion at December 31, 2021. Our BaaS deposits totaled $11.5 billion at December 31, 2022, as compared to $1.0 billion at December 31, 2021. In addition,2023, the Company has institutional depositsidentified a triggering event and municipal deposits. Institutional deposits remained unchanged from the prior year end at $1.4 billion. Municipal deposits represented $488 million of total deposits atapplied a market approach using the end of this December,day stock price. We evaluated those conditions known and knowable by the Company and how a $263 million decrease frommarket participant would view the balance at December 31, 2021.

66


Depending on their availability and pricing relative to other funding sources, we also include brokered deposits in our deposit mix. Brokered deposits accounted for $5.1 billion of our deposits atcontrol premium as confirmed by the end of this December,subsequent confirming market evidence. This adjusted market capitalization was then compared to $5.7 billion at December 31, 2021. Brokered money market accounts represented $2.8 billionthe carrying value to determine the extent of total brokered deposits at December 31, 2022 and $2.9 billion at December 31, 2021; brokered interest-bearing checking accounts represented $1.0 billion and $1.6 billion, respectively, at the corresponding dates. At December 31, 2022, we had $1.3 billion of brokered CDs, comparedshortfall which was calculated to $1.2 billion at December 31, 2021.

The following table indicates the amount of time deposits, by account, that arebe in excess of the FDIC insurance limit (currently $250,000) by time remaining until maturity:


December 31,


(in millions)


2022


Portion of U.S. time deposits in excess of insurance limit


$

3,749


Time deposits otherwise uninsured with a maturity of:


3 months or less


$

969


Over 3 months through 6 months


604


Over 6 months through 12 months


1,269


Over 12 months


907


Total time deposits otherwise uninsured


$

3,749


Our uninsured deposits, on an unconsolidated basis, are the portiongoodwill balance. The Company’s assessment concluded that goodwill from historical transactions (2007 and prior) was fully impaired as of deposit accounts that exceed the FDIC insurance limit (currently $250,000), and were approximately $19.6 billion and $10.1 billion at December 31, 2022 and 2021, respectively. These amounts were estimated based on2023. As a result, the same methodologies and assumptions used for regulatory reporting purposes.

Borrowed Funds

The majority of our borrowed funds are wholesale borrowings (FHLB-NY and FHLB-Indianapolis advances) and, to a lesser extent, junior subordinated debentures and subordinated notes. At December 31, 2022, total borrowed funds increased $4.8 billion or 29 percent to $21.3 billion compared to the balance at December 31, 2021. The year-over-year increase was primarily driven by the amounts assumed in the Flagstar acquisition of $6.7 billion

Wholesale Borrowings

Wholesale borrowings totaled $20.3 billion and $15.9 billion, respectively, at December 31, 2022 and 2021, representing 23 percent of total assets at both dates. FHLB-NY and FHLB-Indianapolis advances accounted for $20.3 billionCompany recorded an impairment charge of the year-end 2022 balance, as compared to $15.1 billion at the prior year-end. Pursuant to blanket collateral agreements with the Bank, our FHLB-NY, FHLB-Indianapolis advances and overnight advances are secured by pledges of certain eligible collateral in the form of loans and securities. (For more information regarding our FHLB advances, see the discussion that appears earlier in this report regarding our membership and our ownership of stock in the FHLB-NY). At December 31, 2022 and 2021, $6.8 billion and $7.5 billion of our wholesale borrowings had callable features, respectively.

Included in wholesale borrowings at December 31, 2021, was $800 million of repurchase agreements. There were no repurchase agreements outstanding at December 31, 2022. Repurchase agreements are contracts for the sale of securities owned or borrowed by the Bank with an agreement to repurchase those securities at agreed-upon prices and dates.

Our repurchase agreements were primarily collateralized by GSE obligations, and may be entered into with the FHLB-NY or certain brokerage firms. The brokerage firms we utilize are subject to an ongoing internal financial review to ensure that we borrow funds only from those dealers whose financial strength will minimize the risk of loss due to default. In addition, a master repurchase agreement must be executed and on file for each of the brokerage firms we use.

We had no federal funds purchased at both December 31, 2022 and 2021.

67


Junior Subordinated Debentures

Junior subordinated debentures totaled $575 million, including $214 million assumed from the Flagstar acquisition, net of purchase accounting adjustments at December 31, 2022.

Subordinated Notes

At December 31, 2022, theentire goodwill balance of subordinated notes was $432 million, including $135 million assumed from the Flagstar acquisition, net of purchase accounting adjustments.$2.4 billion.


See Note 12, “Borrowed Funds,” in Item 8, “Financial Statements and Supplementary Data” for a further discussion of our wholesale borrowings, our junior subordinated debentures and subordinated debt.

Parent Company Liquidity
Liquidity, Contractual Obligations and Off-Balance Sheet Commitments, and Capital Position

Liquidity

We manage our liquidity to ensure that our cash flows are sufficient to support our operations, and to compensate for any temporary mismatches between sources and uses of funds caused by variable loan and deposit demand.

We monitor our liquidity daily to ensure that sufficient funds are available to meet our financial obligations. Our most liquid assets are cash and cash equivalents, which totaled $2.0 billion and $2.2 billion, respectively, at December 31, 2022 and 2021. As in the past, our loan and securities portfolios provided meaningful liquidity in 2022, with cash flows from the repayment and sale of loans totaling $10.7 billion and cash flows from the repayment and sale of securities totaling $960 million.

Additional liquidity stems from deposits and from our use of wholesale funding sources, including brokered deposits and wholesale borrowings. In addition, we have access to the Bank’s approved lines of credit with various counterparties, including the FHLB-NY. The availability of these wholesale funding sources is generally based on the amount of mortgage loan collateral available under a blanket lien we have pledged to the respective institutions and, to a lesser extent, the amount of available securities that may be pledged to collateralize our borrowings. At December 31, 2022, our available borrowing capacity with the FHLB-NY was $11.3 billion. In addition, the Bank had available-for-sale securities of $9.1 billion, of which, $8.6 billion is unpledged.

Furthermore, the Bank has agreements with the FRB-NY that enable it to access the discount window as a further means of enhancing their liquidity. In connection with these agreements, the Bank has pledged certain loans and securities to collateralize any funds they may borrow. The maximum amount the Bank could borrow from the FRB-NY was $1.0 billion. There were no borrowings against these lines of credit at December 31, 2022.

Our primary investing activity is loan production, and the volume of loans we originated for investment totaled $17.1 billion in 2022. During this time, the net cash used in investing activities totaled $6.3 billion; the net cash provided by our operating activities totaled $1.0 billion. Our financing activities provided net cash of $5.2 billion.

CDs due to mature or reprice in one year or less from December 31, 2022 totaled $9.2 billion, representing 74 percent of total CDs at that date. Our ability to attract and retain retail deposits, including CDs, depends on numerous factors, including, among others, the convenience of our branches and our other banking channels; our customers’ satisfaction with the service they receive; the rates of interest we offer; the types of products we feature; and the attractiveness of their terms.

Our decision to compete for deposits also depends on numerous factors, including, among others, our access to deposits through acquisitions, the availability of lower-cost funding sources, the impact of competition on pricing, and the need to fund our loan demand.

The Parent Company is a separate legal entity from the Bank and must provide for its own liquidity. At December 31, 2023 the Parent Company held cash and cash equivalents of $158 million. In addition to operating expenses, and any share repurchases, the Parent Company is responsible for paying any dividends declared to our common and preferred stockholders. As a Delaware corporation, the Parent Company is able to pay dividends either from surplus or, in case there is no surplus, from net profits for the fiscal year in which the dividend is declared and/or the preceding fiscal year.

68


The Parent Company is a separate legal entity fromhas three primary funding sources for the Bankpayment of dividends, share repurchases, and must provide for its own liquidity. In additionother corporate uses: dividends paid to operating expenses and any share repurchases, the Parent Company is responsible for paying any dividends declared toby the Company’s shareholders. As a Delaware corporation,Bank; capital raised through the Parent Company is able to pay dividends either from surplus or, in case there is no surplus, from net profits forissuance of equity; and funding raised through the fiscal year in which the dividend is declared and/or the preceding fiscal year.issuance of debt instruments.

Various legal restrictions limit the extent to which the Company’s subsidiary bank can supply funds to the Parent Company and its non-bank subsidiaries. The Bank would require the approval of the OCC if the dividends it declares in any calendar year were to exceed the total of its respective net profits for that year combined with its respective retained net profits for the preceding two calendar years, less any required transfer to paid-in capital. The term “net profits” is defined as net income for a given period less any dividends paid during that period. As a result of our acquisition of Flagstar, we are also required to seek regulatory approval from the OCC for the payment of any dividend to the Parent Company through at least the period ending November 1, 2024. In 2022,connection with receiving regulatory approval from the OCC for the Signature Transaction, the Bank has committed that (i) for a period of two years from the date of the Signature Transaction, it will not declare or pay any dividend without receiving a prior written determination of no supervisory objection from the OCC and (ii) it will not declare or pay dividends on the amount of retained earnings that represents any net bargain purchase gain that is subject to a conditional period that may be imposed by the OCC.In 2023, dividends of $335$580 million were paid by the Bank to the Parent Company.

At December 31, 2023, we believe the Company has sufficient liquidity and capital resources to meet its cash flow obligations over the next 12 months and for the foreseeable future.

Bank Liquidity

We manage our liquidity to ensure that our cash flows are sufficient to support our operations, and to compensate for any temporary mismatches between sources and uses of funds caused by variable loan and deposit demand.

We monitor our liquidity daily to ensure that sufficient funds are available to meet our financial obligations. The following table presents available sources of liquidity as of December 31, 2023:

(Dollars in millions)
Cash and cash equivalents$11,475 
Unencumbered investment securities6,300 
FHLB borrowing availability8,400 
Federal Reserve Bank borrowing availability through the discount window1,700 
Total Ready Liquidity$27,875 
On a consolidated basis, our funding primarily stems from a combination of the following sources: retail, institutional, and brokered deposits; borrowed funds, primarily in the form of wholesale borrowings; cash flows generated through the repayment and sale of loans; and cash flows generated through the repayment and sale of securities.

71


CDs due to mature or reprice in one year or less from December 31, 2023 totaled $17.3 billion, representing 80 percent of total CDs at that date. Our ability to attract and retain retail deposits, including CDs, depends on numerous factors, including, among others, the convenience of our branches and our other banking channels; our customers’ satisfaction with the service they receive; the rates of interest we offer; the types of products we feature; and the attractiveness of their terms.
Our decision to compete for deposits also depends on numerous factors, including, among others, our access to deposits through acquisitions, the availability of lower-cost funding sources, the impact of competition on pricing, and the need to fund our loan demand.

Deposits

Our ability to retain and attract deposits depends on numerous factors, including customer satisfaction, the rates of interest we pay, the types of products we offer, and the attractiveness of their terms. The vast majority of our deposits are retail in nature (i.e., they are deposits we have gathered through our branches or through business combinations).

Depending on their availability and pricing relative to other funding sources, we also include brokered deposits in our deposit mix. Brokered deposits accounted for $9.5 billion of our deposits at December 31, 2023, compared to $5.1 billionat December 31, 2022. Brokered money market accounts represented $1.3 billion of total brokered deposits at December 31, 2023 and $2.8 billion at December 31, 2022; brokered interest-bearing checking accounts represented $1.6 billion and $1.0 billion, respectively. At December 31, 2023, we had $6.6 billion of brokered CDs, compared to $1.3 billion at December 31, 2022.

Our uninsured deposits are the portion of deposit accounts that exceed the FDIC insurance limit (currently $250,000). These amounts were estimated based on the same methodologies and assumptions used for regulatory reporting purposes and excludes internal accounts. At December 31, 2023 our deposit base includes $29.3 billion of uninsured deposits, a net increase of $12.9 billion as compared to December 31, 2022 due to the Signature Transaction. This represents 36 percent of our total deposits.

The following table indicates the amount of time deposits, by account, that are in excess of the FDIC insurance limit (currently $250,000) by time remaining until maturity:

(in millions)December 31, 2023December 31, 2022
Portion of U.S. time deposits in excess of insurance limit$7,893 $3,749 
Time deposits otherwise uninsured with a maturity of:
3 months or less1,675 969 
Over 3 months through 6 months1,623 604 
Over 6 months through 12 months2,325 1,269 
Over 12 months2,271 907 
Total time deposits otherwise uninsured$7,894 $3,749 

Borrowed Funds

The majority of our borrowed funds are wholesale borrowings (FHLB-NY and FHLB-Indianapolis advances), Bank Term Funding Program of the FRB of New York and, to a lesser extent, junior subordinated debentures and subordinated notes. At December 31, 2023, total borrowed funds decreased $65 million to $21.3 billion compared to the balance at December 31, 2022.

Wholesale Borrowings

Wholesale borrowings totaled $20.3 billion at December 31, 2023 and 2022.

FHLB-NY and FHLB-Indianapolis advances accounted for $19.3 billion and $20.3 billion at December 31, 2023 and December 31, 2022, respectively. Pursuant to blanket collateral agreements with the Bank, could have paid additional dividendsour FHLB-NY, FHLB-Indianapolis advances and overnight advances are secured by pledges of $615certain eligible collateral in the form of loans and securities. At December 31, 2023 and December 31, 2022, $2.0 billion and $6.8 billion of our wholesale borrowings had callable features, respectively.


72


The Company’s wholesale borrowings also include the $1.0 billion drawn on the BTFP. The BTFP draw is secured by pledges of certain eligible collateral in the form of securities eligible for purchase by the Federal Reserve Banks in open market operations (for example, U.S. Treasuries, U.S. agency securities, and U.S. agency mortgage-backed securities).

We had no federal funds outstanding at December 31, 2023 and December 31, 2022.

Junior Subordinated Debentures

Junior subordinated debentures totaled $579 million at December 31, 2023 compared to $575 million at December 31, 2022.

Subordinated Notes

At December 31, 2023, the Parent Company without regulatory approval.balance of subordinated notes was $438 million compared to $432 million at December 31, 2022.

See Note 12 - Borrowed Funds,” in Item 8, “Financial Statements and Supplementary Data” for a further discussion of our wholesale borrowings, our junior subordinated debentures and subordinated debt.

Contractual Obligations and Off-Balance Sheet Commitments

In the normal course of business, we enter into a variety of contractual obligations in order to manage our assets and liabilities, fund loan growth, operate our branch network, and address our capital needs.

For example, we offer CDs with contractual terms to our customers, and borrow funds under contract from the FHLB-NY and various brokerage firms. These contractual obligations are reflected in the Consolidated Statements of Condition under “Deposits” and “Borrowed funds,” respectively. At December 31, 2022, we had CDs of $12.5 billion and long-term debt (defined as borrowed funds with an original maturity one year or more) of $13.8 billion.

We also are obligated under certain non-cancelable operating leases on the buildings and land we use in operating our branch network and in performing our back-office responsibilities. These obligations are included in the Consolidated Statements of Condition and totaled $122 million at December 31, 2022.

At December 31, 2022, we also hadinclude commitments to extend credit in the form of mortgage and other loan originations, as well as commercial, performance stand-by, and financial stand-by letters of credit, totaling $22.4 billion. credit.


These off-balance sheet commitments consist of agreements to extend credit, as long as there is no violation of any condition established in the contract under which the loan is made. Commitments generally have fixed expiration dates or other termination clauses and may require the payment of a fee.

The letters of credit we issue consist of performance stand-by, financial stand-by, and commercial letters of credit. Financial stand-by letters of credit primarily are issued for the benefit of other financial institutions, municipalities, or landlords on behalf of certain of our current borrowers, and obligate us to guarantee payment of a specified financial obligation.

Performance stand-by letters of credit are primarily issued for the benefit of local municipalities on behalf of certain of our borrowers. Performance letters of credit obligate us to make payments in the event that a specified third party fails to perform under non-financial contractual obligations. Commercial letters of credit act as a means of ensuring payment to a seller upon shipment of goods to a buyer. Although commercial

Such letters of credit are used to effect payment for domestic transactions, the majority are used to settle payments in international trade. Typically, such letters of credittypically require the presentation of documents that describe the commercial transaction, and provide evidence of shipment and the transfer of title. The fees we collectFees collected in connection with the issuance of letters of credit are included in “Fee income” in the Consolidated Statements of Income and Comprehensive Income.

Based upon our current liquidity position, we expect that our funding will be sufficient to fulfill these cash obligations and commitments when they are due both in the short term and long term.

For the year ended December 31, 2022,2023, we did not engage in any off-balance sheet transactions reasonably likelythat we expect to have a material effect on our financial condition, results of operations or cash flows.

At December 31, 2022,2023, we had no commitments to purchase securities.

Regulatory Capital
69


The Bank is subject to regulation, examination, and supervision by the OCC and the Federal Reserve (the “Regulators”). The Bank is also governed by numerous federal and state laws and regulations, including the FDIC Improvement Act of 1991, which established five categories of capital adequacy ranging from “well capitalized” to “critically undercapitalized.” Such classifications are used by the FDIC to determine various matters, including prompt corrective action and each institution’s FDIC deposit insurance premium assessments. Capital Positionamounts and classifications are also subject to the Regulators’ qualitative judgments about the components of capital and risk weightings, among other factors.

The quantitative measures established to ensure capital adequacy require that banks maintain minimum amounts and ratios of leverage capital to average assets and of common equity tier 1 capital, tier 1 capital, and total capital to risk-weighted

73

As reflected
assets (as such measures are defined in the following table,regulations). At December 31, 2023, our capital measures continued to exceed the minimum federal requirements for a bank holding company:company and for a bank. The following table sets forth our common equity tier 1, tier 1 risk-based, total risk-based, and leverage capital amounts and ratios on a consolidated basis and for the Bank on a stand-alone basis, as well as the respective minimum regulatory capital requirements, at that date:
The following tables present the actual capital amounts and ratios for the Company:

Risk-Based Capital
December 31, 2023Common Equity Tier 1Tier 1TotalLeverage Capital
(in millions)AmountRatioAmountRatioAmountRatioAmountRatio
Total capital$8,009 9.05 %$8,512 9.62 %$10,415 11.77 %$8,512 7.75 %
Minimum for capital adequacy purposes3,983 4.50 5,310 6.00 7,081 8.00 4,392 4.00 
Excess$4,026 4.55 %$3,202 3.62 %$3,334 3.77 %$4,120 3.75 %
December 31, 2022
Total capital$6,335 9.06 %$6,838 9.78 %$8,154 11.66 %$6,838 9.70 %
Minimum for capital adequacy purposes3,146 4.50 4,195 6.00 5,593 8.00 2,819 4.00 
Excess$3,189 4.56 %$2,643 3.78 %$2,561 3.66 %$4,019 5.70 %

The following tables present the actual capital amounts and ratios for the Bank:

At December 31, 2022


Actual


Minimum


(dollars in millions)


Amount


Ratio


Required
Ratio


Common equity tier 1 capital


$


6,335


9.06


%


4.50

%

Tier 1 risk-based capital


6,838


9.78


6.00


Total risk-based capital


8,154


11.66


8.00


Leverage capital


6,838


9.70


4.00


At December 31, 2021


Actual


Minimum


(dollars in millions)


Amount


Ratio


Required
Ratio


Common equity tier 1 capital


$


4,226


9.68


%


4.50

%

Tier 1 risk-based capital


4,729


10.83


6.00


Total risk-based capital


5,558


12.73


8.00


Leverage capital


4,729


8.46


4.00


Risk-Based Capital
December 31, 2023Common Equity Tier 1Tier 1TotalLeverage Capital
(dollars in millions)AmountRatioAmountRatioAmountRatioAmountRatio
Total capital$9,305 10.52 %$9,305 10.52 %$10,271 11.61 %$9,305 8.48 %
Minimum for capital adequacy purposes3,980 4.50 5,307 6.00 7,076 8.00 4,389 4.00 
Excess$5,325 6.02 %$3,998 4.52 %$3,195 3.61 %$4,916 4.48 %
December 31, 2022
Total capital$7,653 10.96 %$7,653 10.96 %$7,982 11.43 %$7,653 10.87 %
Minimum for capital adequacy purposes3,142 4.50 4,189 6.00 5,585 8.00 2,817 4.00 
Excess$4,511 6.46 %$3,464 4.96 %$2,397 3.43 %$4,836 6.87 %

At December 31, 2022,2023, our total risk-based capital ratio exceeded the minimum requirement for capital adequacy purposes by 377 basis points and the fully phased-in capital conservation buffer by 127 basis points.

The Bank also exceeded the minimum capital requirements to be categorized as “Well Capitalized.” To be categorized as well capitalized, a bank must maintain a minimum common equity tier 1 ratio of 6.50 percent; a minimum tier 1 risk-based capital ratio of 8 percent; a minimum total risk-based capital ratio of 10 percent; and a minimum leverage capital ratio of 5 percent.

On July 27, 2023, the Federal Banking Agencies, the FDIC, the Federal Reserve, and the OCC, released a notice of proposed rulemaking that would make significant amendments to the Basel III Capital Rules applicable to both the Company and the Bank. In general, the proposed rule would align the regulatory capital calculation methodology for Category III and IV banking organizations with the methodology applicable to Category I and II banking organizations. In addition to calculating risk-weighted assets under the current U.S. standardized approach, the proposal introduces a new “Expanded Risk-Based Approach,” including standardized approaches for credit risk, operational risk and credit valuation adjustment risk, as well as a new approach for market risk that would be based upon internal models and standardized supervisory models. If adopted as proposed, the Company would be required to calculate its risk-based capital ratios under both the current U.S. standardized approach and the Expanded Risk-Based Approach and would be subject to the lower of the two resulting ratios for each risk-based capital ratio. In addition, the proposal would require banking organizations to recognize most elements of AOCI in regulatory capital, including unrealized gains and losses on available-for-sale securities, and lower thresholds for deductions from CET1 capital for mortgage servicing assets and deferred tax assets, among other things. The proposal, if enacted, would have an effective date of July 1, 2025, with certain elements, such as the recognition of AOCI in regulatory capital and changes in risk-weighted assets calculated under the Expanded Risk-Based Approach, having a three-year phase-in period. We are in the process of evaluating this proposed rulemaking and assessing its potential impact on the Company and the Bank continued to exceedif adopted as proposed.


74


Reportable Segment and Reporting Unit

In 2023, our chief operating decision maker assessed performance and allocated resources at the levels required for classification as “well capitalized” institutions, as defined underconsolidated Company level. Following the Federal Deposit Insurance Corporation Improvement Actacquisition of 1991,Flagstar Bank, N.A. and as further discussed in Note 21, “Capital,” in Item 8, “Financial Statements and Supplementary Data.”

IMPACT OF INFLATION

The consolidated financial statements and notes thereto presented in this report have been prepared in accordance with GAAP, which requires thatclosing the Signature Transaction, we measure our financial condition and operating results in terms of historical dollars, without considering changesare currently in the relative purchasing powerprocess of money over time due to inflation. The impact of inflation is reflected inoperationalizing the increased cost of our operations. As a result, the impact of interest rates on our performance is greater than the impact of general levels of inflation. Interest rates do not necessarily move in the same direction, or to the same extent, as the prices of goods and services.

IMPACT OF RECENT ACCOUNTING PRONOUNCEMENTS

Recently Issued Accounting Standards

In March 2022, the FASB issued ASU No. 2022-02 - Financial Instruments - Credit Losses (Topic 326): Troubled Debt Restructurings and Vintage Disclosures. The amendments in this ASU eliminate TDR accounting for entities that have adopted ASU No. 2016-13, while enhancing disclosure requirements for certain loan modifications when a borrower is experiencing financial difficulty. The ASU also requires disclosure of current period gross write-offs by year of origination for financing receivables and net investment in leases. The adoption of this ASU is not expected to have a material impact on the Company’s Consolidated Statements of Condition, results of operations, or cash flows.

RECONCILIATIONS OF SHAREHOLDERS’ EQUITY, COMMON STOCKHOLDERS’ EQUITY, AND TANGIBLE COMMON SHAREHOLDERS’ EQUITY; TOTAL ASSETS AND TANGIBLE ASSETS; AND THE RELATED MEASURES

While stockholders’ equity, common stockholders’ equity, total assets, and book value per common share are financial measures that are recorded in accordance with U.S. GAAP, tangible common stockholders’ equity, tangible

70


assets, and tangible book value per common share are not. It is management’s belief that these non-GAAP measures should be disclosed in this report and others we issue for the following reasons:

1.
Tangible common stockholders’ equity is an important indication of the Company’s ability to grow organically and through business combinations, as well as its ability to pay dividends and to engage in various capital management strategies.
2.
Tangible book value per common share and the ratio of tangible common stockholders’ equity to tangible assets are among the capital measures considered by currentreporting – both historical and prospective investors, both independent of,– for our reportable segments and in comparison with, the Company’s peers.

Tangible common stockholders’ equity, tangible assets, and the related non-GAAP measures should not be considered in isolation or as a substitute for stockholders’ equity, common stockholders’ equity, total assets, or any other measure calculated in accordance with GAAP. Moreover, the manner inreporting units, which we calculate these non-GAAP measures may differ from that of other companies reporting non-GAAP measures with similar names.

Reconciliations of our stockholders’ equity, common stockholders’ equity, and tangible common stockholders’ equity; our total assets and tangible assets; and the related financial measures for the respective periods follow:


At or for the
Twelve Months Ended
December 31,


(dollars in millions)


2022


2021


Stockholders’ Equity


$

8,824


$

7,044


Less: Goodwill and other intangible assets


(2,713

)


(2,426

)

Preferred stock


(503

)


(503

)

Tangible common stockholders’ equity


$

5,608


$

4,115


Total Assets


$

90,144


$

59,527


Less: Goodwill and other intangible assets


(2,713

)


(2,426

)

Tangible assets


$

87,431


$

57,101


Common stockholders’ equity to total assets


9.23

%


10.99

%

Tangible common stockholders’ equity to
   tangible assets


6.41


7.21


Book value per common share


$

12.21


$

14.07


Tangible book value per common share


8.23


8.85


71


ITEM 7A. QUANTITATIVE AND QUALITATIVE DISCLOSURES ABOUT MARKET RISK

We manage our assets and liabilities to reduce our exposure to changes in market interest rates. The asset and liability management process has three primary objectives: to evaluate the interest rate risk inherent in certain balance sheet accounts; to determine the appropriate level of risk, given our business strategy, operating environment, capital and liquidity requirements, and performance objectives; and to manage that risk in a manner consistent with guidelines approved by the Boards of Directors of the Company and the Bank.

Market Risk

As a financial institution, we are focused on reducing our exposure to interest rate volatility, which represents our primary market risk. Changes in market interest rates represent the greatest challenge to our financial performance, as such changes can have a significant impact on the level of income and expense recorded on a large portion of our interest-earning assets and interest-bearing liabilities, and on the market value of all interest-earning assets, other than those possessing a short term to maturity. To reduce our exposure to changing rates, the Board of Directors and management monitor interest rate sensitivity on a regular or as needed basis so that adjustments to the asset and liability mix can be made when deemed appropriate.

The actual duration of held-for-investment mortgage loans and mortgage-related securities can be significantly impacted by changes in prepayment levels and market interest rates. The level of prepayments may, in turn, be impacted by a variety of factors, including the economy in the region where the underlying mortgages were originated; seasonal factors; demographic variables; and the assumability of the underlying mortgages. However, the factors with the most significant impact on prepayments are market interest rates and the availability of refinancing opportunities.

We managed our interest rate risk by taking the following actions: (1) We have continued to emphasize the origination and retention of intermediate-term assets, primarily in the form of multi-family and CRE loans; (2) We have continued the origination of certain C&I loans that feature floating interest rates; (3) Increased the focus on retaining low costs deposits; and (4) Obtained new low cost deposits as part of the banking-as-a-service initiative (5) The use of derivatives to manage our interest rate position.

LIBOR Transition Process and Phase Out

The Company has certain loans, interest rate swap agreements, investment securities, and debt obligations whose interest rate is indexed to LIBOR. In 2017, the FCA, which is responsible for regulating LIBOR, announced that the publication of LIBOR is not guaranteed beyond 2021. In December 2020, the administrator of LIBOR announced its intention to (i) cease the publication of the one-week and two-month U.S. dollar LIBOR after December 31, 2021, and (ii) cease the publication of all other tenors of U.S. dollar LIBOR (one, three, six, and 12-month LIBOR) after June 30, 2023, and on March 15, 2021, announced that it will permanently cease to publish most LIBOR settings beginning on January 1, 2022 and cease to publish the overnight, one-month, three-month, six-month, and 12-month U.S. dollar LIBOR settings on July 1, 2023. Accordingly, the FCA has stated that it does not intend to persuade or compel banks to submit to LIBOR after such respective dates. Until such time, however, FCA panel banks have agreed to continue to support LIBOR. In October 2021, the Federal bank regulatory agencies issued a Joint Statement on Managing the LIBOR Transition that offered their regulatory expectations and outlined potential supervisory and enforcement consequences for banks that fail to adequately plan for and implement the transition away from LIBOR. The failure to properly transition away from LIBOR may result in increased supervisory scrutiny. The implementationa change to either or both in future reporting periods.


Critical Accounting Estimates

Various elements of a substitute index for the calculation of interest rates under the Company's loan agreements may result in disputes or litigation with counterparties over the appropriateness or comparabilityour accounting policies, by their nature, are subject to LIBOR of the substitute index, which would have an adverse effect on the Company's results of operations. Even when robust fallback language is included, there can be no assurancesestimation techniques, valuation assumptions and other subjective assessments. Certain accounting policies that, the replacement rate plus any spread adjustment will be economically equivalent to LIBOR, which could result in a lower interest rate being paiddue to the Company on such assets.

The Alternative Reference Rates Committee (a groupjudgment, estimates and assumptions are critical to an understanding of private-market participants convened by the FRBour Consolidated Financial Statements and the FRB-NY) has identified SOFR asNotes, are described in Item 1. These policies relate to: (a) the recommended alternative to LIBOR. The use of SOFR as a substitute for LIBOR is voluntary and may not be suitable for all market participants. SOFR is calculated and observed differently than LIBOR. Given the manner in which SOFR is calculated, it is likely to be lower than LIBOR and is less likely to correlate with the funding costs of financial institutions. Market practices related to SOFR calculation conventions

72


continue to develop and may vary. Inconsistent calculation conventions among financial products may expose is to increased basic rate and resultant costs.

Other alternatives to LIBOR also exist, but, because of the difference in how those alternatives are constructed, they may diverge significantly from LIBOR in a range of situations and market conditions.

The Bank established a sub-committee of ALCO to address issues related to the phase out and transition from LIBOR. This sub-committee consists of personnel from various departments through the Bank including lending, loan administration, credit risk management, finance/treasury, including interest rate risk and liquidity management, information technology, and operations. The Company has LIBOR-based contracts that extend beyond June 30, 2023. The sub-committee has monitored the Bank’s LIBOR transition progress and substantially all contracts have been updated. In complying with industry requirements, the Bank has not offered new LIBOR-based products since December 31, 2021.

Interest Rate Sensitivity Analysis

Interest rate sensitivity is monitored through the use of a model that generates estimates of the change in our Economic Value of Equity over a range of interest rate scenarios. EVE is defined as the net present value of expected cash flows from assets, liabilities, and off-balance sheet contracts. The EVE ratio, under any interest rate scenario, is defined as the EVE in that scenario divided by the market value of assets in the same scenario. The model assumes estimated loan prepayment rates, reinvestment rates, and deposit decay rates.

Based on the information and assumptions in effect at December 31, 2022, the following table sets forth our EVE, assuming the changes in interest rates noted:

(dollars in millions)

Change in
Interest
Rates (in basis
points)


Market Value
of Assets


Market Value
of Liabilities


Economic
Value
of Equity


Net Change


Estimated
Percentage
Change in
Economic
Value of Equity


-200


$


90,388


$


79,644


$


10,744


$


95


0.89


%

-100


88,570


77,719


10,851


202


1.90


%

-


86,770


76,121


10,649


+100


85,050


74,725


10,325


(324

)


(3.04

)

%

+200


83,398


73,466


9,932


(717

)


(6.73

)

%

The net changes in EVE presented in the preceding table are within the parameters approved by the Boards of Directors of the Company and the Bank.

Modeling changes in EVE requires that certain assumptions be made which may or may not reflect the manner in which actual yields and costs respond to changes in market interest rates. In this regard, the EVE analysis presented above assumes that the compositiondetermination of our interest rate sensitive assetsACL, (b) fair value measurements and liabilities existing at(c) the beginningacquisition method of a period remains constant overaccounting. We believe the period being measured,judgment, estimates and also assumes that a particular change in interest rates is reflected uniformly across the yield curve, regardless of the duration to maturity or repricing of specific assets and liabilities. Furthermore, the model does not take into account the benefit of any strategic actions we may take to further reduce our exposure to interest rate risk. Accordingly, while the EVE analysis provides an indication of our interest rate risk exposure at a particular point in time, such measurements are not intended to, and do not, provide a precise forecast of the effect of changes in market interest rates on our net interest income, and may very well differ from actual results.

We also utilize an internal net interest income simulation to manage our sensitivity to interest rate risk. The
simulation incorporates various market-based assumptions regarding the impact of changing interest rates on future levels of our financial assets and liabilities. The
assumptions used in the net interest income simulation are inherently uncertain. Actual results may differ significantly from those presented in the following table, due to the frequency,

73


timing, and magnitudepreparation of changes in interest rates; changes in spreads between maturity and repricing categories; and prepayments, among other factors, coupled with any actions taken to counter the effects of any such changes

Based on the information and assumptions in effect at December 31, 2022, the following table reflects the estimated percentage change in future net interest income for the next twelve months, assuming the changes in interest rates noted:

Change in Interest Rates
(in basis points)
 (1)

Estimated Percentage Change in
Future Net Interest Income

-200 over one year

3.14

%

-100 over one year

1.70

%

+100 over one year

(2.81

)

%

+200 over one year

(4.93

)

%

(1)
In general, short- and long-term rates are assumed to increase in parallel instantaneously and then remain unchanged.

Future changes in our mix of assets and liabilities may result in greater changes to our gap, NPV, and/or net interest income simulation.

In the event that our EVE and net interest income sensitivities were to breach our internal policy limits, we would undertake the following actions to ensure that appropriate remedial measures were put in place:

In formulating appropriate strategies, the ALCO Committee would ascertain the primary causes of the variance from policy tolerances, the expected term of such conditions,Consolidated Financial Statements and the projected effect on capital and earnings.
Our ALCO Committee would informNotes are appropriate given the Boardfactual circumstances at the time. However, given the sensitivity of Directors of the variance, and present recommendations to the Board regarding proposed courses of action to restore conditions to within-policy tolerances.

Where temporary changes in market conditions or volume levels result in significant increases in risk, strategies may involve reducing open positions or employing other balance sheet management activities including the potential use of derivatives to reduce the risk exposure. Where variance from policy tolerances is triggered by more fundamental imbalances in the risk profiles of core loan and deposit products, a remedial strategy may involve restoring balance through natural hedges to the extent possible before employing synthetic hedging techniques. Other strategies might include:

Asset restructuring, involving sales of assets having higher risk profiles, or a gradual restructuring of the asset mix over time to affect the maturity or repricing schedule of assets;
Liability restructuring, whereby product offerings and pricing are altered or wholesale borrowings are employed to affect the maturity structure or repricing of liabilities;
Expansion or shrinkage of the balance sheet to correct imbalances in the repricing or maturity periods between assets and liabilities; and/or
Use or alteration of off-balance sheet positions, including interest rate swaps, caps, floors, options, and forward purchase or sales commitments.

In connection with our net interest income simulation modeling, we also evaluate the impact of changes in the slope of the yield curve. At December 31, 2022, our analysis indicated that a further inversion of the yield curve would be expected to result in a 4.80% decrease in net interest income; conversely, an immediate steepening of the yield curve would be expected to result in a 1.21% increase in net interest income.

Critical Accounting Estimates

The preparation of these financial statements requires management to make estimates that affect the reported amounts of assets and liabilitiesConsolidated Financial Statements and the reported amounts of income and expenses during the reporting periods. Actual results may differ from these estimates under varying conditions. On a quarterly basis, management evaluate its

74


estimates, particularly those that involve the most difficult, subjective or complex judgments and are often about matters that are inherently uncertain.

The judgments used by management in applyingNotes to these critical accounting policies, the use of other judgments, estimates may be influenced by adverse changes in the economic environment, which mayand assumptions could result in changes to futurematerial differences in our results of operations and/or financial results.condition.


Allowance for Credit Losses

The Company’s January 1, 2020, adoption of ASU No. 2016-13, “Measurement of Credit Losses on Financial Instruments,” resulted in a significant change to our methodology for estimating the allowance since December 31, 2019. ASU No. 2016-13 replaced the incurred loss methodology with an expected loss methodology that is referred to as the CECL methodology. The measurement of expected credit losses under CECL is applicable to financial assets measured at amortized cost, including loan receivables. It also applies to off-balance sheet exposures not accounted for as insurance and net investments in leases accounted for under ASC Topic 842. At December 31, 2019, the allowance for credit losses on loans and leases totaled $148 million. On January 1, 2020, the Company adopted the CECL methodology under ASU Topic 326 and recognized an increase in the allowance for credit losses on loans and leases of $2 million as a “Day 1” transition adjustment from changes in methodology, with a corresponding decrease in retained earnings. Separately, at December 31, 2019, the Company had an allowance for unfunded commitments of $1 million. Upon adoption, the Company recognized an increase in the allowance for unfunded commitments of $13 million as a “Day 1” transition adjustment with a corresponding decrease in retained earnings.

The allowance for credit losses on loans and leases is deducted fromrepresents our current estimate of the amortized cost basis of a financial asset or a group of financial assets so that the balance sheet reflects the net amount the Company expects to collect. Amortized cost is the unpaid loan balance, net of deferred fees and expenses, and includes negative escrow. Subsequent changes (favorable and unfavorable) in expectedlifetime credit losses are recognized immediately in net income as a credit loss expense or a reversal of credit loss expense.expected from our loan and lease portfolio and our unfunded lending commitments. Management estimates the allowance by projecting and multiplying together the probability-of-default, loss-given-default and exposure-at-default depending on economic parameters for each month of the remaining contractual term.term, as well as credit ratings for certain loans within the commercial and industrial portfolio. The loss drivers for certain loans in the commercial and industrial portfolio are derived using credit ratings. The economic forecast and the related economic parameters are developed using multiple economic forecast scenarios, including related weightings, over the reasonable and supportable forecast period. The economic forecast scenarios and related economic parameters are sourced from independent third parties. Economic parameters are developed using available information relating to past events, current conditions, and economic forecasts. The Company’s economic forecast period is 24 months, and afterwards reverts to a historical average loss rate on a straight line basis over a 12 month period. Historical credit loss experience over the historical loss observation period provides the basis for the estimation of expected credit losses, with qualitative adjustments made for differences in current loan-specific risk characteristics such as differenceslevels of and trends in delinquencies and performance of loans, levels of and trends in write-offs and recoveries collected, trends in volume and terms of loans, effects of any changes in reasonable and supportable economic forecasts, effects of any changes in risk selection and underwriting standards, portfolio mix, delinquency levels and terms, as well as forother changes in environmental conditions, such aslending policies, procedures, and practices, experience, ability, and depth of lending management and other relevant staff, available relevant information sources that support or contradict the registrant’s own forecast, effects of changes in legislation, regulation, policies, administrative practicesprepayment expectations or other relevant factors.factors affecting assessments of loan contractual term, industry conditions; and effects of changes in credit concentrations. Expected credit losses are estimated over the contractual term of the loans, adjusted for forecasted prepayments when appropriate. The contractual term excludes potential extensions or renewals. The methodology used in the estimation of the allowance for loancredit losses on loans and lease losses,leases, which is performed at least quarterly, is designed to be dynamic and responsive to changes in portfolio credit quality and forecasted economic conditions. Each quarter the Company reassesses the appropriateness of the economic forecasting period, the reversion period and historical mean at the portfolio segment level, considering any required adjustments for differences in underwriting standards, portfolio mix, and other relevant data shifts over time.mean.

The allowance for credit losses on loans and leases is measured on a collective (pool) basis when similar risk characteristics exist. The portfolio segment represents the level at which a systematic methodology is applied to estimate credit losses. Management believes the products within each of the entity’s portfolio segments exhibit similar risk characteristics. Smaller pools of homogenous financing receivables with homogeneous risk characteristics were modeled using the methodology selected for the portfolio segment. The macroeconomic data used in the quantitative models are based on a reasonable and supportable forecast period of 24 months. The Company leverages economic projections including property market and prepayment forecasts from established independent third parties to inform its loss drivers in the forecast. Beyond this forecast, period,as well as credit ratings for certain loans within the Company reverts to a historical average loss rate. This reversion to the historical average loss rate is performed on a straight-line basis over 12 months.commercial and industrial portfolio.

Loans that do not share risk characteristics are evaluated on an individual basis. These include loans that are inbasis, including nonaccrual status with balances above management determined materiality thresholds depending on loan class and also loans that are designated as TDR or “reasonably expected TDR” (criticized, classified, or maturing loans that will have a modification processed within the next three months).loans. If a loan is determined to be collateral dependent, or

75


meets the criteria to apply the collateral dependent practical expedient, expected credit losses are determined based on the fair value of the collateral at the reporting date, less costs to sell as appropriate.


The Company maintains an allowance for credit losses on off-balance sheet credit exposures. The Company estimates expected credit losses over the contractual period in which the Company is exposed to credit risk via a contractual obligation to extend credit, unless that obligation is unconditionally cancellable by the Company. The allowance for credit losses on off-balance sheet credit exposures is adjusted as a provision for credit losses expense. The estimate includes consideration of the

75


likelihood that funding will occur and an estimate of expected credit losses on commitments expected to be funded over their estimated life. The Company examined historical credit conversion factor (“CCF”) trends to estimate utilization rates, and chose an appropriate mean CCF based on both management judgment and quantitative analysis. Quantitative analysis involved examination of CCFs over a range of fund-up windows (between 12 and 36 months) and comparison of the mean CCF for each fund-up window with management judgment determining whether the highest mean CCF across fund-up windows made business sense. The Company applies the same standards and estimated loss rates to the credit exposures as to the related class of loans.

When applying this critical accounting estimate we incorporate several inputs and judgments that may be influenced by changes period to period. These include, but are not limited to changes in the economic environment and forecasts, changes in the credit profile and characteristics of the loan portfolio, property valuations and changes in prepayment assumptions which will result in provisions to or recoveries from the balance of the allowance for credit losses.assumptions.

While changes to the economic environment forecasts, and portfolio characteristics will change from period to period, portfolio prepayments are an integral assumption in estimating the allowance for credit losses on our commercial real estate portfolio (multi -family, CRE and ADC) which comprises 70.5%60 percent of the loan portfolio at December 31, 2022.2023. Portfolio prepayments are subject to estimation uncertainty and changes in this assumption could have a material impact to our estimation process. Prepayment assumptions are sensitive to interest rates and existing loan terms and determine the weighted average life of the commercial mortgage loan portfolio. Excluding other factors, as the weighted average life of the portfolio increases or decreases, so will the required amount of the allowance for credit losses on commercial real estate.

Valuation of Mortgage Servicing Rights

We purchase and originate mortgage loans for sale to the secondary market and often retain the right to service the loan at the time of sale upon which, a mortgage servicing right (MSR) is created. We have elected to report our MSR assets at fair value which is determined using an internal valuation model that utilizes an option-adjusted spread, constant prepayment rates, costs to service, and other assumptions. The assumptions used in the MSR valuation are unobservable in nature, involve a higher degree of judgment and are estimated based on our judgment regarding the value that market participants would assign to the asset. To corroborate this estimate, we obtain third-party valuations of the MSR portfolio on a quarterly basis from independent valuation services to assess the reasonableness of the fair value calculated by the internal valuation model.

For further information and sensitivity analysis regarding the valuation of the MSR asset, see Note 19, “Fair Value Measurements,"Note 9 - Mortgage Servicing Rights,” in Item 8. “Financial Statements and Supplementary Data."


Acquisition Method of Accounting

The acquisition method of accounting requires that acquired assets and liabilities in a business combination be recorded at their fair values as of the acquisition date. This method often involves estimates, all of which are inherently subjective. We have elected to hold the measurement period open to allow for potential adjustments for up to one year after the acquisition date, for new information that existed at the acquisition date but may not have been known or available at that time. For further information, refer to Note 3 "Business Combination"- Business Combinations in Item 8, "Financial Statements and Supplementary Data".

Goodwill

The Company evaluates goodwill for impairment at least annually or when triggering events are identified. We utilize a market approach to calculate the fair value of our single reporting unit, which considers how a market participant would view a control premium, complemented by an income approach if deemed necessary. The resulting value is then compared to our book value and any shortfalls would be recorded as an impairment.

As of December 31, 2023, the Company identified a triggering event and applied a market approach using the end of day stock price, control premium for completed bank acquisitions, and an adjustment for Company-specific risk considerations based on subsequent confirming market evidence. This adjusted market capitalization was then compared to the carrying value to determine the extent of any shortfall which was calculated to be in excess of the goodwill balance. The Company’s assessment concluded that goodwill from historical transactions (2007 and prior) was fully impaired as of December 31, 2023, as confirmed by the Company’s current market capitalization. As a result, the Company recorded an impairment charge of the entire goodwill balance of $2.4 billion. Refer to "Note 2 - Summary of Significant Accounting Policies" and "Note 16 - Intangible Assets" in Item 8, "Financial Statements and Supplementary Data" for the methodologies and assumptions used in the goodwill impairment analysis.


76


Item7A.Quantitative and Qualitative Disclosures about Market Risk

We manage our assets and liabilities to reduce our exposure to changes in market interest rates. The asset and liability management process has three primary objectives: to evaluate the interest rate risk inherent in certain balance sheet accounts; to determine the appropriate level of risk, given our business strategy, operating environment, capital and liquidity requirements, and performance objectives; and to manage that risk in a manner consistent with guidelines approved by the Boards of Directors of the Company and the Bank.

Market Risk

As a financial institution, we are focused on reducing our exposure to interest rate volatility, which represents our primary market risk. Changes in market interest rates represent the greatest challenge to our financial performance, as such changes can have a significant impact on the level of income and expense recorded on a large portion of our interest-earning assets and interest-bearing liabilities, and on the market value of all interest-earning assets, other than those possessing a short term to maturity. To reduce our exposure to changing rates, the Board of Directors and management monitor interest rate sensitivity on a regular or as needed basis so that adjustments to the asset and liability mix can be made when deemed appropriate.

The actual duration of held-for-investment mortgage loans and mortgage-related securities can be significantly impacted by changes in prepayment levels and market interest rates. The level of prepayments may, in turn, be impacted by a variety of factors, including the economy in the region where the underlying mortgages were originated; seasonal factors; demographic variables; and the assumability of the underlying mortgages. However, the factors with the most significant impact on prepayments are market interest rates and the availability of refinancing opportunities.

We managed our interest rate risk by taking the following actions: (1) Continue to increase the investments portfolio with an overall shorter duration profile; (2) The use of derivatives to manage our interest rate position; (3) Increased the focus on retaining and increasing our branch deposits base.

Interest Rate Sensitivity Analysis

Interest rate sensitivity is monitored through the use of a model that generates estimates of the change in our Economic Value of Equity (EVE) over a range of interest rate scenarios. EVE is defined as the net present value of expected cash flows from assets, liabilities, and off-balance sheet contracts. The EVE ratio, under any interest rate scenario, is defined as the EVE in that scenario divided by the market value of assets in the same scenario. The model assumes estimated loan and MBS prepayment rates, current market value spreads, and deposit decay rates and betas.

Based on the information and assumptions in effect at December 31, 2023, the following table sets forth our EVE, assuming the changes in interest rates noted:
Change in Interest Rates (in basis points)Estimated Percentage Change in Economic Value of Equity
-200 shock(2.39)%
-100 shock(1.31)%
+100 shock(0.28)%
+200 shock(1.44)%
    

ITEM 8. FINANCIAL STATEMENT
The net changes in EVE presented in the preceding table are within the parameters approved by the Boards of Directors of the Company and the Bank.

Accordingly, while the EVE analysis provides an indication of our interest rate risk exposure at a particular point in time, such measurements are not intended to, and do not, provide a precise forecast of the effect of changes in market interest rates on our net interest income, and may very well differ from actual results.

Interest Rate Risk is also monitored through the use of a model that generates Net Interest Income (NII) simulations over a range of interest rate scenarios.S AND SUPPLEMENTARY DATAModeling changes in NII requires that certain assumptions be made which may or may not reflect the manner in which actual yields and costs respond to changes in market interest rates. In this regard, the NII analysis presented below assumes that the composition of our interest rate sensitive assets and liabilities existing at the beginning of a period remains constant over the period being measured, and also assumes that a particular change in interest rates is reflected uniformly across the yield curve, regardless of the duration to maturity or repricing of specific assets and liabilities.

77


Furthermore, the model does not take into account the benefit of any strategic actions we may take to further reduce our exposure to interest rate risk. The assumptions used in the net interest income simulation are inherently uncertain. Actual results may differ significantly from those presented in the following table, due to the frequency, timing, and magnitude of changes in interest rates; changes in spreads between maturity and repricing categories; and prepayments, among other factors, coupled with any actions taken to counter the effects of any such changes.

Based on the information and assumptions in effect at December 31, 2023, the following table reflects the estimated percentage change in future net interest income for the next twelve months, assuming the changes in interest rates noted:

Change in Interest Rates (in basis points) (1)
Estimated Percentage Change in Future Net Interest Income
-200 shock(5.81)%
-100 shock(3.17)%
+100 shock3.24%
+200 shock6.40%

(1)In general, short- and long-term rates are assumed to increase in parallel instantaneously and then remain unchanged.


The net changes in NII presented in the preceding table are within the parameters approved by the Boards of Directors of the Company and the Bank.

Future changes in our mix of assets and liabilities may result in greater changes to our EVE, and/or NII simulations.

In the event that our EVE and net interest income sensitivities were to breach our internal policy limits, we would undertake the following actions to ensure that appropriate remedial measures were put in place:

In formulating appropriate strategies, the ALCO Committee would ascertain the primary causes of the variance from policy tolerances, the expected term of such conditions, and the projected effect on capital and earnings.

Our ALCO Committee would inform the Board of Directors of the variance, and present recommendations to the Board regarding proposed courses of action to restore conditions to within-policy tolerances.

Where temporary changes in market conditions or volume levels result in significant increases in risk, strategies may involve reducing open positions or employing other balance sheet management activities including the potential use of derivatives to reduce the risk exposure. Where variance from policy tolerances is triggered by more fundamental imbalances in the risk profiles of core loan and deposit products, a remedial strategy may involve restoring balance through natural hedges to the extent possible before employing synthetic hedging techniques. Other strategies might include:

Asset restructuring, involving sales of assets having higher risk profiles, or a gradual restructuring of the asset mix over time to affect the maturity or repricing schedule of assets;

Liability restructuring, whereby product offerings and pricing are altered or wholesale borrowings are employed to affect the maturity structure or repricing of liabilities;

Expansion or shrinkage of the balance sheet to correct imbalances in the repricing or maturity periods between assets and liabilities; and/or

Use or alteration of off-balance sheet positions, including interest rate swaps, caps, floors, options, and forward purchase or sales commitments.

In connection with our net interest income simulation modeling, we also evaluate the impact of changes in the slope of the yield curve. At December 31, 2023, our analysis indicated that a further inversion of the yield curve would be expected to result in a 2.1 increase in net interest income; conversely, an immediate steepening of the yield curve would be expected to result in a 2.4 percent decrease in net interest income. Both scenarios are derived from immediate changes to short-term rates.


78


ITEM 8.FINANCIAL STATEMENTS AND SUPPLEMENTARY DATA
Index to Consolidated Financial Statements and Notes thereto and other supplementary data begin on the following page.


79

77


NEW YORK COMMUNITY BANCORP, INC.

CONSOLIDATED STATEMENTS OF CONDITION


December 31,


(in millions, except share data)


2022


2021


ASSETS:


Cash and cash equivalents


$

2,032


$

2,211


Securities:


Debt securities available-for-sale ($434 and $1,168 pledged at
   December 31, 2022 and 2021, respectively)


9,060


5,780


Equity investments with readily determinable fair values, at fair value


14


16


Total securities


9,074


5,796


Loans held for sale, at fair value


1,115


Loans and leases held for investment, net of deferred loan fees and costs


69,001


45,738


Less: Allowance for credit losses on loans and leases


(393

)


(199

)

Total loans and leases held for investment, net


68,608


45,539


Federal Home Loan Bank and Federal Reserve Bank stock, at cost


1,267


734


Premises and equipment, net


491


270


Core deposit and other intangibles


287


Goodwill


2,426


2,426


Mortgage servicing rights


1,033


Bank-owned life insurance


1,561


1,184


Other assets


2,250


1,367


Total assets


$

90,144


$

59,527


LIABILITIES AND STOCKHOLDERS’ EQUITY:


Deposits:


Interest-bearing checking and money market accounts


$

22,511


$

13,209


Savings accounts


11,645


8,892


Certificates of deposit


12,510


8,424


Non-interest-bearing accounts


12,055


4,534


Total deposits


58,721


35,059


Borrowed funds:


Wholesale borrowings:


Federal Home Loan Bank advances


20,325


15,105


Repurchase agreements


800


Total wholesale borrowings


20,325


15,905


Junior subordinated debentures


575


361


Subordinated notes


432


296


Total borrowed funds


21,332


16,562


Other liabilities


1,267


862


Total liabilities


81,320


52,483


Stockholders’ equity:


Preferred stock at par $0.01 (5,000,000 shares authorized): Series A (515,000 shares
   issued and outstanding)


503


503


Common stock at par $0.01 (900,000,000 shares authorized; 705,429,386 and 490,439,070
   shares issued; and
681,217,334 and 465,015,643 shares outstanding, respectively)


7


5


Paid-in capital in excess of par


8,130


6,126


Retained earnings


1,041


741


Treasury stock, at cost (24,212,052 and 25,423,427 shares, respectively)


(237

)


(246

)

Accumulated other comprehensive loss, net of tax:


Net unrealized (loss) gain on securities available for sale, net of tax of $240 and
   $
17, respectively


(626

)


(45

)

Net unrealized loss on pension and post-retirement obligations, net of tax of $18
   and $
12 respectively


(46

)


(31

)

Net unrealized gain (loss) on cash flow hedges, net of tax of $(20) and $3, respectively


52


(9

)

Total accumulated other comprehensive loss, net of tax


(620

)


(85

)

Total stockholders’ equity


8,824


7,044


Total liabilities and stockholders’ equity


$

90,144


$

59,527


New York Community Bancorp, Inc.
Consolidated Statements of Condition
December 31, 2023December 31, 2022
(in millions, except per share data)
ASSETS:
Cash and cash equivalents$11,475 $2,032 
Securities:
Debt Securities available-for-sale ($2,822 and $434 pledged at December 31, 2023 and December 31, 2022, respectively)9,1459,060
Equity investments with readily determinable fair values, at fair value1414
Total securities9,1599,074
Loans held for sale ($902 and $1,115 measured at fair value, respectively)1,1821,115
Loans and leases held for investment, net of deferred loan fees and costs84,61969,001
Less: Allowance for credit losses on loans and leases(992)(393)
Total loans and leases held for investment, net83,62768,608
Federal Home Loan Bank stock and Federal Reserve Bank stock, at cost1,3921,267
Premises and equipment, net652491
Core deposit and other intangibles625287
Goodwill2,426
Mortgage servicing rights1,1111,033
Bank-owned life insurance1,5801,561
Other assets3,2542,250
Total assets$114,057 $90,144 
LIABILITIES AND STOCKHOLDERS' EQUITY:
Deposits:
Interest-bearing checking and money market accounts$30,700 $22,511 
Savings accounts8,77311,645
Certificates of deposit21,55412,510
Non-interest-bearing accounts20,49912,055
Total deposits81,52658,721
Borrowed funds:
Federal Home Loan Bank and Federal Reserve Bank advances20,25020,325
Junior subordinated debentures579575
Subordinated notes438432
Total borrowed funds21,26721,332
Other liabilities2,8971,267
Total liabilities105,69081,320
Stockholders' equity:
Preferred stock at par $0.01 (5,000,000 shares authorized): Series A (515,000 shares issued and outstanding)503503
Common stock at par 0.01 (900,000,000 shares authorized; 744,155,791 and 705,429,386
   shares issued; and 722,066,370 and 681,217,334 shares outstanding, respectively)
77
Paid-in capital in excess of par8,2318,130
Retained earnings4431,041
Treasury stock, at cost ($22,089,421 and 24,212,052 shares, respectively)(218)(237)
Accumulated other comprehensive loss, net of tax:
Net unrealized loss on securities available for sale, net of tax of $225 and $240, respectively(581)(626)
Net unrealized loss on pension and post-retirement obligations, net of tax of $12 and $18, respectively(28)(46)
Net unrealized gain on cash flow hedges, net of tax of $(6) and $(20), respectively1052
Total accumulated other comprehensive loss, net of tax(599)(620)
Total stockholders’ equity8,3678,824
Total liabilities and stockholders’ equity$114,057 $90,144 
See accompanying notes to the consolidated financial statements.


80

New York Community Bancorp, Inc.
Consolidated Statements of (Loss) Income and Comprehensive (Loss) Income
For the Years Ended December 31,
(in millions, except per share data)202320222021
INTEREST INCOME:
Loans and leases$4,509 $1,848 $1,525 
Securities and money market investments982 244 164 
Total interest income5,491 2,092 1,689 
INTEREST EXPENSE:
Interest-bearing checking and money market accounts943 226 31 
Savings accounts169 60 28 
Certificates of deposit646 97 55 
Borrowed funds656 313 286 
Total interest expense2,414 696 400 
Net interest income3,077 1,396 1,289 
Provision for credit losses833 133 
Net interest income after provision for credit loan losses2,244 1,263 1,286 
NON-INTEREST INCOME:
Fee income172 27 23 
Bank-owned life insurance43 32 29 
Net loss on securities(1)(2)— 
Net return on mortgage servicing rights103 — 
Net gain on loan sales and securitizations89 — 
Net loan administration income82 — 
Bargain purchase gain2,131 159 — 
Other68 17 
Total non-interest income2,687 247 61 
NON-INTEREST EXPENSE:
Operating expenses:
Compensation and benefits1,149 354 303 
Occupancy and equipment200 92 88 
General and administrative750 158 127 
Total operating expense2,099 604 518 
Intangible asset amortization126 — 
Merger-related and restructuring expenses330 75 23 
Goodwill impairment2,426 — — 
Total non-interest expense4,981 684 541 
(Loss) Income before income taxes(50)826 806 
Income tax expense29 176 210 
Net (loss) income$(79)$650 $596 
Preferred stock dividends333333
Net (loss) income available to common stockholders$(112)$617 $563 
Basic (loss) earnings per common share$(0.16)$1.26 $1.20 
Diluted (loss) earnings per common share$(0.16)$1.26 $1.20 
Net (loss) income$(79)$650 $596 
Other comprehensive gain (loss), net of tax:
Change in net unrealized loss on securities available for sale, net of tax of $(15); $223 and $42, respectively45 (581)(112)
Change in pension and post-retirement obligations, net of tax of $(5); $6 and $(8), respectively12 (17)23 
Change in net unrealized gain on cash flow hedges, net of tax of $(3); $(24) and $(2), respectively64 
Reclassification adjustment for defined benefit pension plan, net of tax of $(1); $— and $(2), respectively
Reclassification adjustment for net (loss) gain on cash flow hedges included in net income, net of tax $17; $1 and $(7), respectively(48)(3)18 
Total other comprehensive gain (loss), net of tax21 (535)(60)
Total comprehensive (loss) income, net of tax$(58)$115 $536 
78


NEW YORK COMMUNITY BANCORP, INC.

CONSOLIDATED STATEMENTS OF INCOME AND COMPREHENSIVE INCOME


Years Ended December 31,


(in millions, except per share data)


2022


2021


2020


INTEREST INCOME:


Loans and leases


$

1,848


$

1,525


$

1,542


Securities and money market investments


244


164


166


Total interest income


2,092


1,689


1,708


INTEREST EXPENSE:


Interest-bearing checking and money market accounts


226


31


57


Savings accounts


60


28


32


Certificates of deposit


97


55


217


Borrowed funds


313


286


302


Total interest expense


696


400


608


Net interest income


1,396


1,289


1,100


Provision for credit losses


133


3


62


Net interest income after provision for credit loan losses


1,263


1,286


1,038


NON-INTEREST INCOME:


Fee income


27


23


22


Bank-owned life insurance


32


29


32


Net (loss) gain on securities


(2

)


1


Net return on mortgage servicing rights


6


Net gain on loan sales


5


Loan administration income


3


Bargain purchase gain


159


Other


17


9


6


Total non-interest income


247


61


61


NON-INTEREST EXPENSE:


Operating expenses:


Compensation and benefits


354


303


301


Occupancy and equipment


92


88


86


General and administrative


158


127


124


Total operating expense


604


518


511


Intangible asset amortization


5


Merger-related expenses


75


23


Total non-interest expense


684


541


511


Income before income taxes


826


806


588


Income tax expense


176


210


77


Net income


$

650


$

596


$

511


Preferred stock dividends


33


33


33


Net income available to common stockholders


$

617


$

563


$

478


Basic earnings per common share


$

1.26


$

1.20


$

1.02


Diluted earnings per common share


$

1.26


$

1.20


$

1.02


Net income


$

650


$

596


$

511


Other comprehensive (loss) income, net of tax:


Change in net unrealized (loss) gain on securities available for sale,
   net of tax of $
223; $42; and $(16), respectively


(581

)


(112

)


42


Change in pension and post-retirement obligations, net of tax of
   $
6; $(8) and $2


(17

)


23


(5

)

Change in net unrealized gain (loss) on cash flow hedges, net of tax
   of $(
24); $(2) and $16, respectively


64


6


(42

)

Less: Reclassification adjustment for sales of available-for-sale
   securities, net of tax of $-; $-; and $-;, respectively


(1

)

Reclassification adjustment for defined benefit pension plan,
   net of tax of $
0; $(2) and $(2), respectively


2


5


5


Reclassification adjustment for net gain on cash flow hedges
   included in net income, net of tax $
1; $(7) and $(3), respectively


(3

)


18


8


Total other comprehensive (loss) income, net of tax


(535

)


(60

)


7


Total comprehensive income, net of tax


$

115


$

536


$

518


79


See accompanying notes to the consolidated financial statements.

80


NEW YORK COMMUNITY BANCORP, INC.

CONSOLIDATED STATEMENTS OF CHANGES IN STOCKHOLDERS’ EQUITY

(in millions, except share data)


Shares
Outstanding


Preferred
Stock (Par
Value:
$0.01)


Common
Stock (Par
Value:
$0.01)


Paid-in
Capital in
excess
of Par


Retained
Earnings


Treasury
Stock, at
Cost


Accumulated
Other
Comprehensive
Loss, Net
of Tax


Total
Stockholders’
Equity


Twelve Months Ended December 31, 2022


Balance at December 31, 2021


465,015,643


$

503


$

5


$

6,126


$

741


$

(246

)


$

(85

)


$

7,044


Issuance of common stock for business combination


214,990,316


2


2,008


2,010


Shares issued for restricted stock, net of forfeitures


3,548,310


(33

)


33


Compensation expense related to restricted stock awards


29


29


Net income


650


650


Dividends paid on common stock ($0.68)


(317

)


(317

)

Dividends paid on preferred stock ($63.76)


(33

)


(33

)

Purchase of common stock


(2,336,935

)


(24

)


(24

)

Other comprehensive income, net of tax


(535

)


(535

)

Balance at December 31, 2022


681,217,334


$

503


$

7


$

8,130


$

1,041


$

(237

)


$

(620

)


$

8,824


Twelve Months Ended December 31, 2021


Balance at December 31, 2020


463,901,808


$

503


$

5


$

6,123


$

494


$

(258

)


$

(25

)


$

6,842


Shares issued for restricted stock, net of forfeitures


2,515,942


(28

)


28


Compensation expense related to restricted stock awards


31


31


Net income


596


596


Dividends paid on common stock ($0.68)


(316

)


(316

)

Dividends paid on preferred stock ($63.76)


(33

)


(33

)

Purchase of common stock


(1,402,107

)


(16

)


(16

)

Other comprehensive loss, net of tax


(60

)


(60

)

Balance at December 31, 2021


465,015,643


$

503


$

5


$

6,126


$

741


$

(246

)


$

(85

)


$

7,044


Twelve Months Ended December 31, 2020


Balance at December 31, 2019


467,346,781


$

503


$

5


$

6,115


$

342


$

(220

)


$

(33

)


$

6,712


Opening retained earnings adjustment (1)


(10

)


(10

)

Adjusted balance, beginning of period


332


6,702


Shares issued for restricted stock, net of forfeitures


2,321,105


(22

)


22


Compensation expense related to restricted stock awards


30


30


Net income


511


511


Dividends paid on common stock ($0.68)


(316

)


(316

)

Dividends paid on preferred stock ($63.76)


(33

)


(33

)

Purchase of common stock


(5,766,078

)


0


(60

)


(60

)

Other comprehensive loss, net of tax


8


8


Balance at December 31, 2020


463,901,808


$

503


$

5


$

6,123


$

494


$

(258

)


$

(25

)


$

6,842


(1)
81

Amount represents a $10 million cumulative adjustment, net of tax, to retained earnings as of January 1, 2020, as a result of the adoption of ASU 2016-13, Financial Instruments - Credit Losses (Topic 326): Measurement of Credit Losses on Financial Instruments, which became effective January 1, 2020.


New York Community Bancorp, Inc.
Consolidated Statements of Changes in Stockholders' Equity

(in millions, except share data)Shares OutstandingPreferred Stock (Par Value: $0.01)Common Stock (Par Value: 0.01)Paid-in Capital in excess of ParRetained EarningsTreasury Stock, at CostAccumulated Other Comprehensive Loss, Net of TaxTotal Stockholders’ Equity
Year Ended December 31, 2023
Balance at December 31, 2022681,217,334$503 $$8,130 $1,041 $(237)$(620)$8,824 
Issuance and exercise of FDIC Equity appreciation instrument39,032,006— — 85 — — — 85 
Shares issued for restricted stock, net of forfeitures3,074,565— — (31)— 31 — — 
Compensation expense related to restricted stock awards— — — 47 — — — 47 
Net income— — — — (79)— — (79)
Dividends paid on common stock ($0.56)— — — — (486)— — (486)
Dividends paid on preferred stock ($63.76)— — — — (33)— — (33)
Purchase of common stock(1,257,535)— — — — (12)— (12)
Other comprehensive income, net of tax— — — — — — 21 21 
Balance at December 31, 2023722,066,370$503 $$8,231 $443 $(218)$(599)$8,367 
Year Ended December 31, 2022
Balance at December 31, 2021465,015,643$503 $$6,126 $741 $(246)$(85)$7,044 
Issuance and exercise of FDIC Equity appreciation instrument214,990,316— 2,008 — — — 2,010 
Shares issued for restricted stock, net of forfeitures3,548,310— — (33)— 33 — — 
Compensation expense related to restricted stock awards— — — 29 — — — 29 
Net income— — — — 650 — — 650 
Dividends paid on common stock ($0.68)— — — — (317)— — (317)
Dividends paid on preferred stock ($63.76)— — — — (33)— — (33)
Purchase of common stock(2,336,935)— — — — (24)— (24)
Other comprehensive loss, net of tax— — — — — — (535)(535)
Balance at December 31, 2022681,217,334$503 $$8,130 $1,041 $(237)$(620)$8,824 
Year Ended December 31, 2021
Balance at December 31, 2020463,901,808$503 $$6,123 $494 $(258)$(25)$6,842 
Shares issued for restricted stock, net of forfeitures2,515,942 — — (28)— 28 — — 
Compensation expense related to restricted stock awards— — — 31 — — — 31 
Net income— — — — 596 — — 596 
Dividends paid on common stock ($0.68)— — — — (316)— — (316)
Dividends paid on preferred stock ($63.76)— — — — (33)— — (33)
Purchase of common stock(1,402,107)— — — — (16)— (16)
Other comprehensive loss, net of tax— — — — — — (60)(60)
Balance at December 31, 2021465,015,643 $503 $$6,126 $741 $(246)$(85)$7,044 

See accompanying notes to the consolidated financial statements.

81


NEW YORK COMMUNITY BANCORP, INC.

CONSOLIDATED STATEMENTS OF CASH FLOWS


Years Ended December 31,


(in millions)


2022


2021


2020


CASH FLOWS FROM OPERATING ACTIVITIES:


Net income


$

650


$

596


$

511


Adjustments to reconcile net income to net cash provided by operating activities:


Provision for loan losses


133


3


62


Amortization of core deposit intangible


5


Depreciation


18


21


24


Amortization of discounts and premiums, net


(37

)


(5

)


11


Net (gain) loss on securities


2


(2

)

Net (gain) loss on sales of loans


(5

)


(1

)


Net gain on sales of fixed assets


(2

)


Gain on business acquisition


(159

)


Stock-based compensation


29


31


29


Deferred tax expense


(3

)


(13

)


219


Changes in operating assets and liabilities:


Decrease (increase) in other assets


348


(284

)


(411

)

(Decrease) increase in other liabilities


(100

)


(6

)


9


Purchases of securities held for trading


(75

)


(110

)


(15

)

Proceeds from sales of securities held for trading


75


110


15


Change in loans held for sale, net


147


(52

)


(119

)

Net cash provided by operating activities


1,026


290


334


CASH FLOWS FROM INVESTING ACTIVITIES:


Proceeds from repayment of securities available for sale


732


1,728


2,062


Proceeds from sales of securities available for sale


228


484


Purchase of securities available for sale


(2,242

)


(1,796

)


(2,514

)

Redemption of Federal Home Loan Bank stock


635


92


173


Purchases of Federal Home Loan Bank and Federal Reserve Bank stock


(839

)


(112

)


(239

)

Proceeds from bank-owned life insurance, net


16


12


12


Proceeds from sales of loans


37


3


Purchases of loans


(162

)


(161

)


(95

)

Other changes in loans, net


(5,019

)


(2,558

)


(912

)

(Purchases) dispositions of premises and equipment, net


(3

)


(4

)


1


Cash acquired in business acquisition


331


Net cash used in investing activities


(6,323

)


(2,762

)


(1,025

)

CASH FLOWS FROM FINANCING ACTIVITIES:


Net increase in deposits


7,662


2,622


780


Net increase in short-term borrowed funds


2,550


950


1,150


Proceeds from long-term borrowed funds


9,479


2,072


6,925


Repayments of long-term borrowed funds


(13,960

)


(2,544

)


(6,550

)

Net receipt of payments of loans serviced for others


(189

)


Cash dividends paid on common stock


(317

)


(316

)


(316

)

Cash dividends paid on preferred stock


(33

)


(33

)


(33

)

Treasury stock repurchased


(7

)


(50

)

Payments relating to treasury shares received for restricted stock award tax payments


(17

)


(16

)


(9

)

Net cash provided by financing activities


5,168


2,735


1,897


Net (decrease) increase in cash, cash equivalents, and restricted cash (3)


(129

)


263


1,206


Cash, cash equivalents, and restricted cash at beginning of year (3)


2,211


1,948


742


Cash, cash equivalents, and restricted cash at end of year (3)


$

2,082


$

2,211


$

1,948


Supplemental information:


Cash paid for interest


$

657


$

402


$

633


Cash paid for income taxes


17


471


118


Non-cash investing and financing activities:


Transfers to repossessed assets from loans


$


$

1


$

1


Securitization of residential mortgage loans to mortgage-backed securities
   available for sale


162


161


53


Transfer of loans from held for investment to held for sale


52


Transfer of loans from held for sale to held for investment


94


MSRs resulting from sale or securitization of loans


19


Shares issued for restricted stock awards


33


28


22


Business Combination:


Fair value of tangible assets acquired


24,449


Intangible assets


292


Mortgage Servicing Rights


1,012


Liabilities assumed


23,584


Common Stock issued in business combination


2,010


82


New York Community Bancorp, Inc.
Consolidated Statements of Cash Flows
For the Years Ended December 31,
(in millions)202320222021
CASH FLOWS FROM OPERATING ACTIVITIES:
Net (loss) income$(79)$650 $596 
Adjustments to reconcile net income to net cash provided by operating activities:
Provision for loan losses833 133 
Amortization of intangibles126 — 
Depreciation39 18 21 
Amortization of discounts and premiums, net221 (37)(5)
Net loss on securities— 
Net gain on sales of loans(89)(5)(1)
Net gain on sales of fixed assets— (2)— 
Gain on business acquisition(2,131)(159)— 
Goodwill Impairment2,426 — — 
Stock-based compensation47 29 31 
Deferred tax expense(187)(3)(13)
Changes in operating assets and liabilities:
(Increase) decrease in other assets(721)348 (284)
Decrease in other liabilities(255)(100)(6)
Purchases of securities held for trading(10)(75)(110)
Proceeds from sales of securities held for trading10 75 110 
Change in loans held for sale, net32 147 (52)
Net cash provided by operating activities263 1,026 290 
CASH FLOWS FROM INVESTING ACTIVITIES:
Proceeds from repayment of securities available for sale1,402 732 1,728 
Proceeds from sales of securities available for sale including loans that have been securitized1,858 228 — 
Purchase of securities available for sale(3,046)(2,242)(1,796)
Redemption of Federal Home Loan Bank stock1,501 635 92 
Purchases of Federal Home Loan Bank and Federal Reserve Bank stock(1,626)(839)(112)
Proceeds from bank-owned life insurance, net30 16 12 
Proceeds from sales of loans— — 37 
Purchases of loans— (162)(161)
Net proceeds from sales of MSR's50 — — 
Other changes in loans, net(4,331)(5,019)(2,558)
Purchases of premises and equipment, net(66)(3)(4)
Cash acquired in business acquisition24,901 331 — 
Net cash provided by (used in) investing activities20,673 (6,323)(2,762)
CASH FLOWS FROM FINANCING ACTIVITIES:
Net (decrease) increase in deposits(10,738)7,662 2,622 
Net (decrease) increase in short-term borrowed funds(550)2,550 950 
Proceeds from long-term borrowed funds19,850 9,479 2,072 
Repayments of long-term borrowed funds(19,374)(13,960)(2,544)
Net disbursement of payments of loans serviced for others(66)(189)— 
Cash dividends paid on common stock(486)(317)(316)
Cash dividends paid on preferred stock(33)(33)(33)
Treasury stock repurchased— (7)— 
Payments relating to treasury shares received for restricted stock award tax payments(12)(17)(16)
Net cash (used in) provided by financing activities(11,409)5,168 2,735 
Net increase (decrease) in cash, cash equivalents, and restricted cash (1)
9,527 (129)263 
Cash, cash equivalents, and restricted cash at beginning of year (1)
2,082 2,211 1,948 
Cash, cash equivalents, and restricted cash at end of year (1)
$11,609 $2,082 $2,211 

83


Supplemental information:
Cash paid for interest$2,290 $657 $402 
Cash paid for income taxes54 17 471 
Non-cash investing and financing activities:
Transfers to repossessed assets from loans$$— $
Securitization of loans to mortgage-backed securities available for sale222 162 161 
Transfer of loans from held for investment to held for sale163 — 52 
Transfer of loans from held for sale to held for investment— — 94 
MSRs resulting from sale or securitization of loans— 19 — 
Shares issued for restricted stock awards31 33 28 
Business Combinations:
Fair value of tangible assets acquired37,384 24,449 — 
Intangible assets464 292 — 
Mortgage servicing rights— 1,012 — 
Liabilities assumed35,632 23,584 — 
Common Stock issued in business combination— 2,010 — 
Issuance of FDIC Equity appreciation instrument85 — — 
(1)
For further information on restricted cash, see Note 142 - Derivatives and Hedging Activities.Summary of Significant Accounting Policies

See accompanying notes to the consolidated financial statements.

84

82


Note 1 - Description of Business, Organization and Basis of Presentation
NEW YORK COMMUNITY BANCORP, INC.

Organization
NOTES TO THE CONSOLIDATED FINANCIAL STATEMENTS

NOTE 1: ORGANIZATION AND BASIS OF PRESENTATION

Organization

New York Community Bancorp, Inc. (on a stand-alone basis, the “Parent Company” or, collectively with its subsidiaries, the “Company” or "we") was organized under Delaware law on July 20, 1993 and is the holding company for Flagstar Bank N.A. (hereinafter referred to as the “Bank”). The Company is headquartered in Hicksville, New York with regional headquarters in Troy, Michigan.


The Company is subject to regulation, examination and supervision by the Federal Reserve. The Bank is a National Association, subject to federal regulation and oversight by the OCC.

On November 23, 1993, the Company issued its initial offering of common stock (par value: $0.01$0.01 per share) at a price of $25.00$25.00 per share ($($0.93 per share on a split-adjusted basis, reflecting the impact of nine stock splits between 1994 and 2004)2004). The Company has grown organically and through a series of accretive mergers and acquisitions, culminating in its acquisition of Flagstar Bancorp, Inc., which closed on December 1, 2022.2022 and the Signature Transaction which closed on March 20, 2023.

Flagstar Bank, N.A. currently operates 395420 branches across ninetwelve states, including strong footholds in the Northeast and Midwest and exposure to markets in the Southeast and West Coast. Flagstar Mortgage operates nationally through a wholesale network of approximately 30003,600 third-party mortgage originators. Flagstar Bank N.A. also operates through eightnine local divisions, each with a history of service and strength: New York Community Bank, Queens County Savings Bank, Roslyn Savings Bank, Richmond County Savings Bank, Roosevelt Savings Bank, and Atlantic Bank in New York; Garden State Community Bank in New Jersey; Ohio Savings Bank in Ohio; and AmTrust Bank in Arizona and Florida.

Liquidity

On a consolidated basis, our funding primarily stems from a combination of the following sources: retail, institutional, and brokered deposits; borrowed funds, primarily in the form of wholesale borrowings; cash flows generated through the repayment and sale of loans; and cash flows generated through the repayment and sale of securities.
We manage our liquidity to ensure that our cash flows are sufficient to support our operations, to compensate for any temporary mismatches between sources and uses of funds caused by variable loan and deposit demand, and to ensure that sufficient funds are available to meet our financial obligations. See Note 22 - Subsequent Events for further information on our recent capital raise.

Basis of Presentation


The following is a description of the significant accounting and reporting policies that the Company and its subsidiaries follow in preparing and presenting their consolidated financial statements, which conform to U.S. generally accepted accounting principles and to general practices within the banking industry. The preparation of financial statements in conformity with GAAP requires the Company to make estimates and judgments that affect the reported amounts of assets and liabilities and the disclosure of contingent assets and liabilities at the date of the consolidated financial statements, and the reported amounts of revenues and expenses during the reporting period. Estimates that are used in connection with the determination of the allowance for credit losses, mortgage servicing rights, the Flagstar acquisition and the Flagstar acquisition.Signature Transaction.

The accompanying consolidated financial statements include the accounts of the Company and other entities in which the Company has a controlling financial interest. All inter-company accounts and transactions are eliminated in consolidation. The Company currently has certain unconsolidated subsidiaries in the form of wholly-owned statutory business trusts, which were formed to issue guaranteed capital securities. See Note 12 “Borrowed- Borrowed Funds for additional information regarding these trusts.

When necessary, certain reclassifications have been made to prior-year amounts to conform to the current-year presentation.

Loans


85


83


Effective January 1, 2023, the Company adopted the provisions of Accounting Standards Update (ASU) No. 2022-02, "Financial Instruments - Credit Losses (Topic 326): Troubled Debt Restructurings and Vintage Disclosures" (ASU 2022-02), which eliminated the accounting for troubled debt restructurings (TDRs) while expanding loan modification and vintage disclosure requirements. Under ASU 2022-02, the Corporation assesses all loan modifications to determine whether one is granted to a borrower experiencing financial difficulty, regardless of whether the modified loan terms include a concession. Modifications granted to borrowers experiencing financial difficulty may be in the form of an interest rate reduction, an other-than-insignificant payment delay, a term extension, principal forgiveness or a combination thereof (collectively referred to as Troubled Debt Modifications or TDMs).
Prior to the adoption of ASU 2022-02, the Company accounted for certain loan modifications and restructurings as TDRs. In general, a modification or restructuring of a loan constituted a TDR if the Company granted a concession to a borrower experiencing financial difficulty.

Adoption of New Accounting Standards

NOTE 2: SUMMARY OF SIGNIF
StandardDescriptionEffective Date
ASU 2022-02- Financial Instruments - Credit Losses (Topic 326): Troubled Debt Restructurings and Vintage Disclosures Issued March 2022ASU 2022-02 eliminates prior accounting guidance for TDRs, while enhancing disclosure requirements for certain loan refinancings and restructurings by creditors when a borrower is experiencing financial difficulty. The standard also requires that an entity disclose current-period gross charge-offs by year of origination for financing receivables and net investments in leases.
The Company adopted ASU 2022-02 effective January 1, 2023 using a modified retrospective transition approach for the amendments related to the recognition and measurement of TDRs. The impact of the adoption resulted in an immaterial change to the allowance for credit losses ("ACL"), thus no adjustment to retained earnings was recorded. Disclosures have been updated to reflect information on loan modifications given to borrowers experiencing financial difficulty as presented in Note 6. TDR disclosures are presented for comparative periods only and are not required to be updated in current periods. Additionally, the current year vintage disclosure included in Note 6 has been updated to reflect gross charge-offs by year of origination for the three months ended September 30, 2023.
ASU 2023-02 Investments - Equity Method and Joint Ventures (Topic 323): Accounting for Investments in Tax Credit Structures Using the Proportional Amortization Method Issued: March 2023ASU 2023-02 permits reporting entities to elect to account for their tax equity investments, regardless of the tax credit program from which the income tax credits are received, using the proportional amortization method if certain conditions are met.The Company adopted ASU 2023-02 effective January 1, 2023 and it did not have a significant impact on the Company's consolidated financial statements.

Note 2 - Summary of Significant Accounting Policies
ICANT ACCOUNTING POLICIES

Cash and Cash Equivalents and Restricted Cash


For cash flow reporting purposes, cash and cash equivalents include cash on hand, amounts due from banks, and money market investments, which include federal funds sold and reverse repurchase agreements.agreements, if any. At December 31, 20222023 and 2021,2022, the Company’s cash and cash equivalents totaled $2.0$11.5 billion and $2.2$2.0 billion, respectively. Included in cash and cash equivalents at those dates were $837 million$10.7 billion and $$837 million1.7 billion, , respectively, of interest-bearing deposits in other financial institutions, primarily consisting of balances due from the FRB-NY. There were no reverse repurchase agreements outstanding as of December 31, 2023 and $793 million of reverse repurchase agreements were outstanding at December 31, 2022. There were no federal funds sold outstanding at December 31, 20222023 or December 31, 2021. There was $793 million of reverse repurchase agreements outstanding at December 31, 2022. There was $406 million reverse repurchase agreements outstanding at December 31, 2021. Restricted cash totaled $50$134 million and $50 million at December 31, 2023 and December 31, 2022, respectively and includes cash that the Bank pledges as maintenance margin on centrally cleared derivatives and is included in other assets on the Consolidated Statements of Condition.


Debt Securities and Equity Investments with Readily Determinable Fair Values

The securities portfolio primarily consists of mortgage-related securities and, to a lesser extent, debt and equity securities. Securities that are classified as “available for sale” are carried at their estimated fair value, with any unrealized gains or losses, net of taxes, reported as accumulated other comprehensive income or loss in stockholders’ equity. Securities that the Company has the intent and ability to hold to maturity are classified as “held to maturity” and carried at amortized cost.

The fair values of our securities—and particularly our fixed-rate securities—are affected by changes in market interest rates and credit spreads. In general, as interest rates rise and/or credit spreads widen, the fair value of fixed-rate securities will decline. As interest rates fall and/or credit spreads tighten, the fair value of fixed-rate securities will rise.

86


The Company evaluates available-for-sale debt securities in unrealized loss positions at least quarterly to determine if an allowance for credit losses is required. Based on an evaluation of available information about past events, current conditions, and reasonable and supportable forecasts that are relevant to collectability, the Company has concluded that it expects to receive all contractual cash flows from each security held in its available-for-sale securities portfolio.

The Company first assesses whether (i) it intends to sell, or (ii) it is more likely than not that the Company will be required to sell the security before recovery of its amortized cost basis. If either of these criteria is met, any previously recognized allowances are charged off and the security’s amortized cost basis is written down to fair value through income. If neither of the aforementioned criteria are met, the Company evaluates whether the decline in fair value has resulted from credit losses or other factors. If this assessment indicates that a credit loss exists, the present value of cash flows expected to be collected from the security are compared to the amortized cost basis of the security. If the present value of cash flows expected to be collected is less than the amortized cost basis, a credit loss exists and an allowance for credit losses is recorded for the credit loss, limited by the amount that the fair value is less than the amortized cost basis. Any impairment that has not been recorded through an allowance for credit losses is recognized in other comprehensive income.

Management has made the accounting policy election to exclude accrued interest receivable on available-for-sale securities from the estimate of credit losses. Available-for-sale debt securities are placed on non-accrual status when the Company no longer expects to receive all contractual amounts due, which is generally at 90 days past due. Accrued interest receivable is reversed against interest income when a security is placed on non-accrual status.

Equity investments with readily determinable fair values are measured at fair value with changes in fair value recognized in net income.

Premiums and discounts on securities are amortized to expense and accreted to income over the remaining period to contractual maturity using the interest method, and are adjusted for anticipated prepayments. Dividend and interest income are recognized when earned. The cost of securities sold is based on the specific identification method.

84


Federal Home Loan Bank Stock


As a member of the FHLB-NY, the Company is required to hold shares of FHLB-NY stock, which is carried at cost. In addition, in connection with the Flagstar acquisition, the Company also holds shares of FHLB-Indianapolis stock, which is carried at cost. The Company’s holding requirement varies based on certain factors, including its outstanding borrowings from the FHLB-NY and FHLB-Indianapolis.

The Company conducts a periodic review and evaluation of its FHLB-NY stock to determine if any impairment exists. The factors considered in this process include, among others, significant deterioration in FHLB-NY earnings performance, credit rating, or asset quality; significant adverse changes in the regulatory or economic environment; and other factors that could raise significant concerns about the creditworthiness and the ability of the FHLB-NY to continue as a going concern.

Loans Held-for-Sale


The Company classifies loans as LHFS when we originate or purchase loans that we intend to sell. We have elected the fair value option for the majority of our LHFS. The Company estimates the fair value of mortgage loans based on quoted market prices for securities backed by similar types of loans, where available, or by discounting estimated cash flows using observable inputs inclusive of interest rates, prepayment speeds and loss assumptions for similar collateral. Changes in fair value are recorded to other noninterest income on the Consolidated Statements of Income and Comprehensive Income. LHFS that are recorded at the lower of cost or fair value may be carried at fair value on a nonrecurring basis when the fair value is less than cost. For further information, see Note 1918 - Fair Value Measurements.Measures

.


Loans that are transferred into the LHFS portfolio from the LHFI portfolio, due to a change in intent, are recorded at the lower of cost or fair value. Gains or losses recognized upon the sale of loans are determined using the specific identification method.


87


Loans Held for Investment

Loans and leases, net, are carried at unpaid principal balances, including unearned discounts, purchase accounting (i.e., acquisition-date fair value) adjustments, net deferred loan origination costs or fees, and the allowance for credit losses on loans and leases.

The Company recognizes interest income on loans using the interest method over the life of the loan. Accordingly, the Company defers certain loan origination and commitment fees, and certain loan origination costs, and amortizes the net fee or cost as an adjustment to the loan yield over the term of the related loan. When a loan is sold or repaid, the remaining net unamortized fee or cost is recognized in interest income.

Prepayment income on loans is recorded in interest income and only when cash is received. Accordingly, there are no assumptions involved in the recognition of prepayment income.

Two factors are considered in determining the amount of prepayment income: the prepayment penalty percentage set forth in the loan documents, and the principal balance of the loan at the time of prepayment. The volume of loans prepaying may vary from one period to another, often in connection with actual or perceived changes in the direction of market interest rates. When interest rates are declining, rising precipitously, or perceived to be on the verge of rising, prepayment income may increase as more borrowers opt to refinance and lock in current rates prior to further increases taking place.

A loan generally is classified as a “non-accrual” loan when it is 90 days or more past due or when it is deemed to be impaired because the Company no longer expects to collect all amounts due according to the contractual terms of the loan agreement. When a loan is placed on non-accrual status, management ceases the accrual of interest owed, and previously accrued interest is charged against interest income. A loan is generally returned to accrual status when the loan is current and management has reasonable assurance that the loan will be fully collectible. Interest income on non-accrual loans is recorded when received in cash.

85


Loans with Government Guarantees


The Company originates government guaranteed loans which are pooled and sold as Ginnie Mae MBS. Pursuant to Ginnie Mae servicing guidelines, the Company has the unilateral right to repurchase loans securitized in Ginnie Mae pools that are due, but unpaid, for three consecutive months. As a result, once the delinquency criteria have been met, and regardless of whether the repurchase option has been exercised, the Company accounts for the loans as if they had been repurchased. The Company recognizes the loans and corresponding liability as loans with government guarantees and loans with government guarantees repurchase options, respectively, in the Consolidated Statements of Condition. If the loan is repurchased, the liability is cash settled and the loan with government guarantee remains. Once repurchased, the Company works to cure the outstanding loans such that they are re-eligible for sale or may begin foreclosure and recover losses through a claims process with the government agency, as an approved lender.


Allowance for Credit Losses on Loans and Leases

The Company’s January 1, 2020, adoption of ASU No. 2016-13, “Measurement of Credit Losses on Financial Instruments,” resulted in a significant change to our methodology for estimating the allowance since December 31, 2019. ASU No. 2016-13 replaced the incurred loss methodology with an expected loss methodology that is referred to as the CECL methodology. The measurement of expected credit losses under CECL is applicable to financial assets measured at amortized cost, including loan receivables. It also applies to off-balance sheet exposures not accounted for as insurance and net investments in leases accounted for under ASC Topic 842.

The allowance for credit losses on loans and leases is deducted from the amortized cost basis of a financial asset or a group of financial assets so that the balance sheet reflects the net amount the Company expects to collect. Amortized cost is the unpaid loan balance, net of deferred fees and expenses, and includes negative escrow. Subsequent changes (favorable and unfavorable) in expected credit losses are recognized immediately in net income as a credit loss expense or a reversal of credit loss expense. Management estimates the allowance by projecting and multiplying together the probability-of-default, loss-given-defaultloss- given-default and exposure-at-default depending on economic parameters for each month of the remaining contractual term. Economicterm, as well as credit ratings for certain loans within the commercial and industrial portfolio. The Company loss drivers for certain loans in the commercial and industrial portfolio are derived using leverages economic projections including property market and prepayment forecasts from established independent third parties, as well as credit ratings for certain loans within the commercial and industrial portfolio, to inform its loss drivers in the forecast. The Company estimates the exposure-at-default using prepayment models which forecasts prepayments over the life of the loans and leases. The economic forecast and the related economic parameters are developed using available information relating to past events, current conditions, multiple economic forecasts scenarios, including related weightings, over the reasonable and economic forecasts.supportable forecast period and macroeconomic assumptions. The Company’s economic forecast scenarios and related economic parameters are sourced from independent third parties. The economic forecast reasonable and supportable period is 24 months, and afterwards the Company reverts to a historical average loss rate on a straight-line basis over a 12-month period. Historical credit loss experience over the historical loss observation period provides the basis for the estimation of expected credit losses, with qualitative factor adjustments made

88


for differences in current loan-specific risk characteristics such as differences in underwriting standards, portfolio mix, current collateral valuations, delinquency levels and terms, as well as for changes in environmental conditions, such as changes in legislation, regulation, policies, administrative practices or other relevant factors. Expected credit losses are estimated over the contractual term of the loans, adjusted for forecasted prepayments when appropriate. The contractual term excludes potential extensions or renewals. The methodology used in the estimation of the allowance for credit losses on loan and lease losses,leases, which is performed at least quarterly, is designed to be dynamic and responsive to changes in portfolio credit quality and forecasted economic conditions. Each quarter the Company reassesses the appropriateness of the economic forecasting period, the reversion period and historical mean at the portfolio segment level, considering any required adjustments for differences in underwriting standards, portfolio mix, and other relevant data shifts over time.

The allowance for credit losses on loans and leases is measured on a collective (pool) basis when similar risk characteristics exist. The portfolio segment represents the level at which a systematic methodology is applied to estimate credit losses. Management believes the products within each of the entity’s portfolio segments exhibit similar risk characteristics. Smaller pools of homogenous financing receivables with homogeneous risk characteristics were modeled using the methodology selected for the portfolio segment. The macroeconomic data used in the quantitative models are based on a reasonable and supportable forecast period of 24 months. The Company leverages economic projections including property market and prepayment forecasts from established independent third parties, as well as credit ratings for certain loans within the commercial and industrial portfolio, to inform its loss drivers in the forecast. Beyond this forecast period, the Company reverts to a historical average loss rate. This reversion to the historical average loss rate is performed on a straight-line basis over 12 months.

Loans that do not share risk characteristics are evaluated on an individual basis. These include loans that are in nonaccrual status with balances above management determined materiality thresholds depending on loan class and also loans that are designated as TDR or “reasonably expected TDR” (criticized, classified, or maturing loans that will have a modification processed within the next three months). If a loan is determined to be collateral dependent, or meets the criteria to apply the collateral dependent practical expedient, expected credit losses are determined based on the fair value of the collateral at the reporting date, less costs to sell as appropriate.

The Company maintains an allowance for credit losses on off-balance sheet credit exposures. At December 31, 20222023 and December 31, 2021,2022, the allowance for credit losses on off-balance sheet exposures was $23$52 million and $12$23 million, respectively. The Company estimates expected credit losses over the contractual period in which the Company is exposed to credit risk via a contractual obligation to extend credit, unless that obligation is unconditionally cancellable by the Company. The allowance for credit losses on

86


off-balance sheet credit exposures is adjusted as a provision for credit losses expense. The estimate includes consideration of the likelihood that funding will occur and an estimate of expected credit losses on commitments expected to be funded over their estimated life. The Company examined historical CCF trends to estimate utilization rates, and chose an appropriate mean CCF based on both management judgment and quantitative analysis. Quantitative analysis involved examination of CCFs over a range of fund-up windows (between 12 and 36 months) and comparison of the mean CCF for each fund-up window with management judgment determining whether the highest mean CCF across fund-up windows made business sense. The Company applies the same standards and estimated loss rates to the credit exposures as to the related class of loans.


When applying this critical accounting estimate, we incorporate several inputs and judgments that may be influenced by changes period to period. These include, but are not limited to changes in the economic environment and forecasts, changes in the credit profile and characteristics of the loan portfolio, and changes in prepayment assumptions which will result in provisions to or recoveries from the balance of the allowance for credit losses.

While changes to the economic environment forecasts and portfolio characteristics will change from period to period, portfolio prepayments are an integral assumption in estimating the allowance for credit losses on our commercial real estate (multi-family, CRE and ADC) portfolio which comprises 70.5%60 percent of the loan portfolio at December 31, 2022.2023. Portfolio prepayments are subject to estimation uncertainty and changes in this assumption could have a material impact to our estimation process. Prepayment assumptions are sensitive to interest rates and existing loan terms and determine the weighted average life of the commercial mortgage loan portfolio. Excluding other factors, as the weighted average life of the portfolio increases or decreases, so will the required amount of the allowance for credit losses on commercial real estate.


Goodwill

The Company adopted,evaluates goodwill for impairment at least annually or when triggering events are identified. We utilize a market approach to determine the fair value of our single reporting unit, which considers how a market participant would view a control premium, complemented by an income approach if deemed necessary. The resulting value is then compared to our book value and any shortfalls would be recorded as an impairment.


89


As of December 31, 2023, the Company identified a triggering event and applied a market approach using the end of day stock price, control premium for completed bank acquisitions, and an adjustment for Company-specific risk considerations based on a prospective basis, ASU No. 2017-04, Intangibles—Goodwillsubsequent confirming market evidence. This adjusted market capitalization was then compared to the carrying value to determine the extent of any shortfall which was calculated to be in excess of the goodwill balance. The Company’s assessment concluded that goodwill from historical transactions (2007 and Other (Topic 350): Simplifying the Test for Goodwill Impairment on January 1, 2020. The Company has significant intangible assets related to goodwill andprior) was fully impaired as of December 31, 2022,2023, as confirmed by the Company’s current market capitalization. As a result, the Company had goodwill of $2.4 billion. In connection with its acquisitions, the assets acquired and liabilities assumed are recorded at their estimated fair values. Goodwill represents the excess of the purchase price of its acquisitions over the fair value of identifiable net assets acquired, including other identified intangible assets. The Company tests goodwill for impairment at the reporting unit level. The Company has identified one reporting unit which is the same as its operating segment and reportable segment. If the Company changes its strategy or if market conditions shift, its judgments may change, which may result in adjustments to the recorded goodwill balance.

The Company performs its goodwill impairment test in the fourth quarter of each year, or more often if events or circumstances warrant. For annual goodwill impairment testing, the Company has the option to first perform a qualitative assessment to determine whether it is more likely than not that the fair value of a reporting unit is less than its carrying amount, including goodwill and other intangible assets. If the Company concludes that this is the case, it would compare the fair value the reporting unit with its carrying amount and recognize an impairment charge forof the amount by which the carrying amount exceeds the reporting unit’s fair value. The loss recognized, however, would not exceed the total amountentire goodwill balance of goodwill allocated to that reporting unit. Additionally, the Company would consider income tax effects from any tax deductible goodwill$2.4 billion. Additional information on the carrying amount of the reporting unit when measuringmethodologies and assumptions used in the goodwill impairment loss, if applicable. As of December 31, 2022, the Company’s goodwill was analysis can be found in Note 16 - Intangible Assets.


not impaired.

Mortgage Servicing Rights


The Company purchases and originates mortgage loans for sale to the secondary market and sell the loans on either a servicing-retained or servicing-released basis. If the Company retains the right to service the loan, an MSR is created at the time of sale which is recorded at fair value. The Company uses an internal valuation model that utilizes an option-adjusted spread, constant prepayment speeds, costs to service and other assumptions to determine the fair value of MSRs.

Management obtains third-party valuations of the MSR portfolio on a quarterly basis from independent valuation services to assess the reasonableness of the fair value calculated by our internal valuation model. Changes in the fair value of our MSRs are reported on the Consolidated Statements of Income and Comprehensive Income in net return on mortgage servicing. For further information, see Note 9 - Mortgage Servicing Rights and Note 1918 - Fair Value Measurements.Measures

.


Premises and Equipment, Net

Premises, furniture, fixtures, and equipment are carried at cost, less the accumulated depreciation computed on a straight-line basis over the estimated useful lives of the respective assets (generally 20 years for premises and three to ten years for furniture, fixtures,

87


and equipment). Leasehold improvements are carried at cost less the accumulated amortization computed on a straight-line basis over the shorter of the related lease term or the estimated useful life of the improvement.


Depreciation is included in “Occupancy and equipment expense” in the Consolidated Statements of Income and Comprehensive Income, and amounted to $18$39 million, $21$18 million, and $24$21 million, respectively, in the years ended December 31, 2023, 2022, 2021, and 2020.2021. Accumulated depreciation as of December 31, 2023 and December 31, 2022 was $526 million and $434 million. The estimated useful lives for the principal classes of assets are as follows:

Premises and EquipmentUseful Lives
Buildings30
Furniture, fixtures and equipment, and building improvements13.5
Leasehold improvements10
ATMs7


Bank-Owned Life Insurance

The Company has purchased life insurance policies on certain employees. These BOLI policies are recorded in the Consolidated Statements of Condition at their cash surrender value. Income from these policies and changes in the cash surrender value are recorded in “Non-interest income” in the Consolidated Statements of Income and Comprehensive Income. At December 31, 20222023 and 2021,2022, the Company’s investment in BOLI was $1.6 billion and $1.2 billion, respectively. The December 31, 2022 amount includes $373 million acquired in the Flagstar merger.$1.6 billion. The Company’s investment in BOLI generated income of $32$43 million, $29$32 million, and $32$29 million, respectively, during the years ended December 31, 2023, 2022, 2021, and 2020.2021.

Variable Interest Entities


An entity that has a controlling financial interest in a VIE is referred to as the primary beneficiary and consolidates the VIE. An entity is deemed to have a controlling financial interest and is the primary beneficiary of a VIE if it has both the power to direct the activities of the VIE that most significantly impact the VIE’s economic performance and an obligation to absorb losses or the right to receive benefits that could potentially be significant to the VIE. For further information, see Note 10 - Variable Interest Entities.Entities.


Repossessed Assets and OREO


90


Repossessed assets consist of any property or other assets acquired through, or in lieu of, foreclosure are sold or rented, and are recorded at fair value, less the estimated selling costs, at the date of acquisition. Following foreclosure, management periodically performs a valuation of the asset, and the assets are carried at the lower of the carrying amount or fair value, less the estimated selling costs. Expenses and revenues from operations and changes in valuation, if any, are included in “General and administrative expense” in the Consolidated Statements of Income and Comprehensive Income. At December 31, 2023, the Company had $5 million of OREO, $4 million of taxi medallions and $5 million of repossessed specialty equipment. At December 31, 2022, the Company had $8$8 million of OREO and $4$4 million of taxi medallions. At December 31, 2021, the Company had $

3 million of OREO and $5 million of taxi medallions.

Servicing Fee Income


Servicing fee income, late fees and ancillary fees received on loans for which the Company owns the MSR are included in net return on mortgage servicing rights on the Consolidated Statements of Income and Comprehensive Income. The fees are based on the outstanding principal and are recorded as income when earned. Subservicing fees, which are included in loan administration income on the Consolidated Statements of Income and Comprehensive Income, are based on a contractual monthly amount per loan including late fees and other ancillary income.


Income Taxes

Income tax expense consists of income taxes that are currently payable and deferred income taxes. Deferred income tax expense is determined by recognizing deferred tax assets and liabilities for future tax consequences attributable to temporary differences between the financial statement carrying amounts of existing assets and liabilities and their respective tax bases. Deferred tax assets and liabilities are measured using enacted tax rates that are expected to apply to taxable income in years in which those temporary differences are expected to be recovered or settled. The Company assesses the deferred tax assets and establishes a valuation allowance when realization of a deferred asset is not considered to be “more likely than not.” The Company considers its expectation of future taxable income in evaluating the need for a valuation allowance.

The Company estimates income taxes payable based on the amount it expects to owe the various tax authorities (i.e., federal, state, and local). Income taxes represent the net estimated amount due to, or to be received from, such tax authorities. In estimating income taxes, management assesses the relative merits and risks of the appropriate tax treatment of transactions, taking into account statutory, judicial, and regulatory guidance in the context of the Company’s tax position. In this process, management also relies on tax opinions, recent audits, and historical experience. Although the Company uses the best available information to record income taxes, underlying estimates and assumptions can change over time as a result of unanticipated events or circumstances such as changes in tax laws and judicial guidance influencing its overall tax position.

88


Derivative Instruments and Hedging Activities


The Company records all derivatives on the balance sheet at fair value. The accounting for changes in the fair value of derivatives depends on the intended use of the derivative, whether the Company has elected to designate a derivative in a hedging relationship and apply hedge accounting and whether the hedging relationship has satisfied the criteria necessary to apply hedge accounting. Derivatives designated and qualifying as a hedge of the exposure to changes in the fair value of an asset, liability, or firm commitment attributable to a particular risk, such as interest rate risk, are considered fair value hedges. Derivatives designated and qualifying as a hedge of the exposure to variability in expected future cash flows, or other types of forecasted transactions, are considered cash flow hedges. Hedge accounting generally provides for the matching of the timing of gain or loss recognition on the hedging instrument with the recognition of the changes in the fair value of the hedged asset or liability that are attributable to the hedged risk in a fair value hedge or the earnings effect of the hedged forecasted transactions in a cash flow hedge. The Company may enter into derivative contracts that are intended to economically hedge certain of its risks, even though hedge accounting does not apply or the Company elects not to apply hedge accounting.

The Company utilizes derivative instruments to manage the fair value changes in our MSRs, interest rate lock commitments and LHFS portfolio which are exposed to price and interest rate risk; facilitate asset/liability management; minimize the variability of future cash flows on long-term debt; and to meet the needs of our customers. All derivatives are recognized on the Consolidated Statements of Condition as other assets and liabilities, as applicable, at their estimated fair value.


The Company uses interest rate swaps, swaptions, futures and forward loan sale commitments to mitigate the impact of fluctuations in interest rates and interest rate volatility on the fair value of the MSRs. Changes in their fair value are reflected in current period earnings under the net return on mortgage servicing asset. These derivatives are valued based on quoted prices for similar assets in an active market with inputs that are observable.

91


The Company also enters into various derivative agreements with customers and correspondents in the form of interest rate lock commitments and forward purchase contracts which are commitments to originate or purchase mortgage loans whereby the interest rate on the loan is determined prior to funding and the customers have locked into that interest rate. The derivatives are valued using internal models that utilize market interest rates and other unobservable inputs. Changes in the fair value of these commitments due to fluctuations in interest rates are economically hedged through the use of forward loan sale commitments of MBS. The gains and losses arising from this derivative activity are reflected in current period earnings under the net gain on loan sales.

To assist customers in meeting their needs to manage interest rate risk, the Company enters into interest rate swap derivative contracts. To economically hedge this risk, the Company enters into offsetting derivative contracts to effectively eliminate the interest rate risk associated with these contracts.

For additional information regarding the accounting for derivatives, see Note 1415 - DerivativesDerivative and Hedging Activities and for additional information on recurring fair value disclosures, see Note 1918 - Fair Value Measurements.Measures

.


Representation and Warranty Reserve

When the Company sells mortgage loans into the secondary mortgage market, it makes customary representations and warranties to the purchasers about various characteristics of each loan. Upon the sale of a loan, the Company recognizes a liability for that guarantee at its fair value as a reduction of our net gain on loan sales. Subsequent to the sale, the liability is re-measured at fair value on an ongoing basis based upon an estimate of probable future losses. An estimate of the fair value of the guarantee associated with the mortgage loans is recorded in other liabilities in the Consolidated Statements of Condition, and was $10$12 million and $10 million at December 31, 2023 and December 31, 2022, as compared to $respectively2 million at December 31, 2021..


Stock-Based Compensation

Under the New York Community Bancorp, Inc. 2020 Omnibus Incentive Plan (the “2020 Incentive Plan”), which was approved by the Company’s shareholders at its Annual Meeting on June 3, 2020, shares are available for grant as restricted stock or other forms of related rights. At December 31, 2022,2023, the Company had 5,774,22916,143,893 shares available for grant under the 2020 Incentive Plan. In addition, the Company had 4,025,636 shares available for grant under the Flagstar Bancorp, Inc. 2016 Stock Award and Incentive Plan. Compensation cost related to restricted stock grants is recognized on a straight-line basis over the vesting period. For a more detailed discussion of the Company’s stock-based compensation, see Note 18, “Stock-Related Benefit14 - Stock-Related Benefits Plans.

Retirement Plans


The Company’s pension benefit obligations and post-retirement health and welfare benefit obligations, and the related costs, are calculated using actuarial concepts in accordance with GAAP. The measurement of such obligations and expenses requires that certain

89


assumptions be made regarding several factors, most notably including the discount rate and the expected rate of return on plan assets. The Company evaluates these assumptions on an annual basis. Other factors considered by the Company in its evaluation include retirement patterns and mortality rates.


Under GAAP, actuarial gains and losses, prior service costs or credits, and any remaining transition assets or obligations that have not been recognized under previous accounting standards must be recognized in AOCL until they are amortized as a component of net periodic benefit cost.


Earnings per Common Share (Basic and Diluted)

Basic EPS is computed by dividing the net income available to common shareholders by the weighted average number of common shares outstanding during the period. Diluted EPS is computed using the same method as basic EPS, however, the computation reflects the potential dilution that would occur if outstanding in-the-money stock options were exercised and converted into common stock.

Unvested stock-based compensation awards containing non-forfeitable rights to dividends paid on the Company’s common stock are considered participating securities, and therefore are included in the two-class method for calculating EPS. Under the two-class method, all earnings (distributed and undistributed) are allocated to common shares and participating securities based on their respective rights to receive dividends on the common stock. The Company grants restricted stock to certain employees under its stock-based compensation plan. Recipients receive cash dividends during the vesting periods of

92


these awards, including on the unvested portion of such awards. Since these dividends are non-forfeitable, the unvested awards are considered participating securities and therefore have earnings allocated to them.

90


The following table presents the Company’s computation of basic and diluted earnings per common share:


For the Years Ended December 31,
(in millions, except share and per share amounts)202320222021
Net (loss) income available to common stockholders$(112)$617 $563 
Less: Dividends paid on and earnings allocated to participating securities(5)(8)(7)
(Loss) earnings applicable to common stock$(117)$609 $556 
Weighted average common shares outstanding713,643,550483,603,395463,865,661
(Loss) basic earnings per common share$(0.16)$1.26 $1.20 
(Loss) earnings applicable to common stock$(117)$609 $556 
Weighted average common shares outstanding713,643,550483,603,395463,865,661
Potential dilutive common shares— 1,530,950767,058
Total shares for diluted (loss) earnings per common share computation713,643,550 485,134,345 464,632,719 
Diluted (loss) earnings per common share and common share equivalents$(0.16)$1.26 $1.20 
Note 3 - Business Combinations

Signature Bridge Bank


Years Ended December 31,


(in millions, except share and per share amounts)


2022


2021


2020


Net income available to common stockholders


$

617


$

563


$

478


Less: Dividends paid on and earnings allocated
   to participating securities


(8

)


(7

)


(6

)

Earnings applicable to common stock


$

609


$

556


$

472


Weighted average common shares outstanding


483,603,395


463,865,661


462,605,341


Basic earnings per common share


$

1.26


$

1.20


$

1.02


Earnings applicable to common stock


$

609


$

556


$

472


Weighted average common shares outstanding


483,603,395


463,865,661


462,605,341


Potential dilutive common shares


1,530,950


767,058


676,061


Total shares for diluted earnings per common
   share computation


485,134,345


464,632,719


463,281,402


Diluted earnings per common share and
   common share equivalents


$

1.26


$

1.20


$

1.02


ImpactOn March 20, 2023, the Company’s wholly owned bank subsidiary, Flagstar Bank N.A. (the “Bank”), entered into a Purchase and Assumption Agreement (the “Agreement”) with the Federal Deposit Insurance Corporation (“FDIC”), as receiver (the "FDIC Receiver") of Recent Accounting PronouncementsSignature Bridge Bank, N.A. (“Signature”) to acquire certain assets and assume certain liabilities of Signature (the “Signature Transaction”). Headquartered in New York, New York, Signature Bank was a full-service commercial bank that operated 29 branches in New York, seven branches in California, two branches in North Carolina, one branch in Connecticut, and one branch in Nevada. In connection with the Signature Transaction the Bank assumed all of Signature’s branches. The Bank acquired only certain parts of Signature it believes to be financially and strategically complementary that are intended to enhance the Company’s future growth.


Pursuant to the terms of the Agreement, the Company was not required to make a cash payment to the FDIC on March 20, 2023 as consideration for the acquired assets and assumed liabilities. As the Company and the FDIC remain engaged in ongoing discussions which may impact the assets and liabilities acquired or assumed by the Company in the Signature Transaction. Any items identified that affect the bargain gain are recorded in the period they are identified. The Company may be required to make a payment to the FDIC or the FDIC may be required to make a payment to the Company on the Settlement Date, which will be one year after March 20, 2023, or as agreed upon by the FDIC and the Company.

In addition, as part of the consideration for the Signature Transaction, the Company granted the FDIC equity appreciation rights in the common stock of the Company under an equity appreciation instrument (the "Equity Appreciation Instrument"). On March 31, 2023, the Company issued 39,032,006 shares of Company common stock to the FDIC pursuant to the Equity Appreciation Instrument. On May 19, 2023, the FDIC completed the secondary offering of those shares.
Recently Adopted Accounting Standards

The Company adopted ASU No. 2022-01—Derivativeshas determined that the Signature Transaction constitutes a business combination as defined by ASC 805, Business Combinations ("ASC 805"). ASC 805 establishes principles and Hedging (Topic 815): Fair Value Hedging-Portfolio Layer Methodrequirements as to how the acquirer of a business recognizes and measures in its financial statements the identifiable assets acquired, the liabilities assumed and any non-controlling interest in the first quarteracquiree. Accordingly, the assets acquired and liabilities assumed have been recorded based on their preliminary estimated fair values as of 2022 upon issuance. The amendments expandMarch 20, 2023, which have been adjusted through December 31, 2023 based on changes to those preliminary estimates.

Under the current last-of-layer methodAgreement, the Company is expected to provide certain services to the FDIC to assist the FDIC in its administration of hedge accounting that permits only one hedged layer to allow multiple hedged layers of a single closed portfolio. To reflect that expansion,certain assets and liabilities which were not assumed by the last-of-layer method is renamedCompany and which remain under the portfolio layer method. In addition, the amendments expand the scopecontrol of the portfolio layer methodFDIC (the “Interim Servicing”). The Interim Servicing includes activities related to the servicing of loan portfolios not acquired on behalf of the FDIC for a period of up to one year from the date of the Signature Transaction unless such loans are sold or transferred at an earlier time by the FDIC or until cancelled by the FDIC upon 60-days’ notice. The Interim Servicing

93


may include non-prepayable assets; specify eligible hedging instrumentsother ancillary services requested by the FDIC to assist in a single-layer hedge;their administration of the remaining assets and liabilities of Signature Bank. The FDIC will reimburse the Company for costs associated with the Interim Servicing based upon an agreed upon fee which approximates the cost to provide additional guidance onsuch services. As the accounting for and disclosure of hedge basis adjustments; specify how hedge basis adjustments should be considered when determining credit lossesFDIC intends to reimburse the Company for the costs to service the loans, neither a servicing asset nor servicing liability was recognized as part of the Signature Transaction.

The Company did not enter into a loss sharing arrangement with the FDIC in connection with the Signature Transaction.

As the Company finalizes its analysis of the assets acquired and liabilities assumed, there may be adjustments to the recorded carrying values. In many cases, the determination of the fair value of the assets acquired and liabilities assumed required management to make estimates about discount rates, future expected cash flows, market conditions and other future events that are highly subjective in nature and subject to change. While the Company believes that the information available on December 31, 2023, provided a reasonable basis for estimating fair value, the Company may obtain additional information and evidence during the measurement period that may result in changes to the estimated fair value amounts. Fair values subject to change include, but are not limited to, those related to loans and leases, certain deposits, intangibles, deferred tax assets and liabilities and certain other assets and other liabilities.

A summary of the preliminary net assets acquired and related estimated fair value adjustments resulting in the bargain purchase gain is as follows:

(in millions)March 20, 2023
(preliminary)
Net assets acquired before fair value adjustments$2,973 
  Fair value adjustments:
    Loans(727)
    Core deposit and other intangibles464 
    Certificates of deposit27 
    Other net assets and liabilities39 
    FDIC Equity Appreciation Instrument(85)
Deferred tax liability(690)
Bargain purchase gain on Signature Transaction, as initially reported2,001 
Measurement period adjustments, excluding taxes28 
Change in deferred tax liability102 
Bargain purchase gain on Signature Transaction, as adjusted$2,131 

In connection with the Signature Transaction, the Company recorded a bargain purchase gain, as adjusted, of approximately $2.1 billion during the year ended December 31, 2023, which is included in the closed portfolio. To date, the guidance has not had any impact onnon-interest income in the Company’s Consolidated Statement of Income and Comprehensive Income.

The bargain purchase gain represents the excess of the estimated fair value of the assets acquired (including cash payments received from the FDIC) over the estimated fair value of the liabilities assumed and is influenced significantly by the FDIC-assisted transaction process. Under the FDIC-assisted transaction process, only certain assets and liabilities are transferred to the acquirer and, depending on the nature and amount of the acquirers bid, the FDIC may be required to make a cash payment to the Company and the Company may be required to make a cash payment to the FDIC.

The assets acquired and liabilities assumed and consideration paid in the Signature Transaction were initially recorded at their estimated fair values based on management’s best estimates using information available at the date of the Signature Transaction, and are subject to adjustment for up to one year after the closing date of the Signature Transaction. The Company and the FDIC are engaged in ongoing discussions and settlement payments have been made that have impacted certain assets acquired or certain liabilities assumed by the Company on March 20, 2023 and are included as measurement period adjustments in the table below.

94


(in millions)Preliminary as Initially ReportedMeasurement Period AdjustmentsPreliminary as Adjusted
Purchase Price consideration$85 $85 
Fair value of assets acquired:
Cash & cash equivalents25,043 (142)24,901 
Loans held for sale232 232 
Loans held for investment:
Commercial and industrial10,102 (214)9,888 
Commercial real estate1,942 (262)1,680 
Consumer and other174 (1)173 
Total loans held for investment12,218 (477)11,741 
CDI and other intangible assets464 — 464 
Other assets679 (169)510 
Total assets acquired38,636 (788)37,848 
Fair value of liabilities assumed:
Deposits33,568 (61)33,507 
Other liabilities2,982 (857)2,125 
Total liabilities assumed36,550 (918)35,632 
Fair value of net identifiable assets2,086 130 2,216 
Bargain purchase gain$2,001 $130 $2,131 

During the year ended December 31, 2023, the Company recorded preliminary measurement period adjustments to adjust the estimated fair value of loans and leases acquired and adjust other assets and accrued expenses and other liabilities for balances ultimately retained by the FDIC. Additionally, $449 million of loans were returned to the FDIC in accordance with the purchase and sale agreement. The Company also recognized a net change in the deferred tax liability due to the measurement period adjustments and the secondary offering of shares completed by the FDIC.

The Company incurred $223 million in acquisition costs related to the Signature Transaction primarily for legal, advisory, and other professional services. These costs are recorded within Merger-related and restructuring expenses on the Consolidated Statements of Condition,Income and Comprehensive Income.

Fair Value of Assets Acquired and Liabilities Assumed

Fair value is defined as the price that would be received to sell an asset or paid to transfer a liability in an orderly transaction between market participants at the measurement date, reflecting assumptions that a market participant would use when pricing an asset or liability. In some cases, the estimation of fair values requires management to make estimates about discount rates, future expected cash flows, market conditions, and other future events that are highly subjective in nature and are subject to change. Described below are the methods used to determine the fair values of the significant assets acquired and liabilities assumed in the Signature Transaction.

Cash and Cash Equivalents

The estimated fair value of cash and cash equivalents approximates their stated face amounts, as these financial instruments are either due on demand or have short-term maturities.
Loans and leases

The fair value for loans was based on a discounted cash flow methodology that considered credit loss expectations, market interest rates and other market factors such as liquidity from the perspective of a market participant. Loans were grouped together according to similar characteristics and were treated in the aggregate when applying various valuation techniques. The probability of default, loss given default and prepayment assumptions were the key factors driving credit losses which were embedded into the estimated cash flows. These assumptions were informed by internal data on loan characteristics, historical loss experience, and current and forecasted economic conditions. The interest and liquidity component of the estimate was determined by discounting interest and principal cash flows through the expected life of each loan. The discount rates used for loans are based on current market rates for new originations of comparable loans and include adjustments for liquidity. The

95


discount rates do not include a factor for credit losses as that has been included as a reduction to the estimated cash flows. Acquired loans were marked to fair value and adjusted for any PCD gross up as of the date of the Signature Transaction.

Deposit Liabilities

The fair value of deposit liabilities with no stated maturity (i.e., non-interest-bearing and interest-bearing checking accounts) is equal to the carrying amounts payable on demand. The fair value of certificates of deposit represents contractual cash flows, discounted using interest rates currently offered on deposits with similar characteristics and remaining maturities.

Core Deposit Intangible

Core deposit intangible (“CDI”) is a measure of the value of non-interest-bearing and interest-bearing checking accounts, savings accounts, and money market accounts that are acquired in a business combination. The fair value of the CDI was determined using a discounted cashflow methodology which considered discount rate, customer attrition rates, and other relevant market assumptions. This method estimated the fair value by discounting the present value of the expected cost savings attributable to the core deposit funding, relative to an alternative source of funding. The CDI relating to the Signature Transaction will be amortized over an estimated useful life of 10 years using the sum of years digits depreciation method. The Company evaluates such identifiable intangibles for impairment when an indication of impairment exists. CDI does not significantly impact our liquidity or capital ratios.

PCD loans

Purchased loans that reflect a more than insignificant deterioration of credit from origination are considered PCD. For PCD loans and leases, the initial estimate of expected credit losses is recognized in the allowance for credit losses (“ACL”) on the date of acquisition using the same methodology as other loans and leases held-for-investment. The following table provides a summary of loans and leases purchased as part of the Signature Transaction with credit deterioration and the associated credit loss reserve at acquisition:

(in millions)Total
Par value (UPB)$583 
ACL at acquisition(13)
Non-credit (discount)(76)
Fair value$494 

Unaudited Pro Forma Information – Signature Transaction

The Company’s operating results for the year ended December 31, 2023 include the operating results of the acquired assets and assumed liabilities of Signature subsequent to the acquisition on March 20, 2023. Due to the use of multiple systems and integration of the operating activities into those of the Company, historical reporting for the former Signature operations is impracticable and thus disclosures of the revenue from the assets acquired and income before income taxes is impracticable for the period subsequent to acquisition.

Signature was only in operation from March 12, 2023 to March 20, 2023 and does not have historical financial information on which we could base pro forma information. Additionally, we did not acquire all assets or cash flows.assume all liabilities of Signature and the historical operations are not consistent with the transaction. Therefore, it is impracticable to provide pro forma information on revenues and earnings for the Signature Transaction in accordance with ASC 805-10-50-2.


96


Flagstar Bancorp, Inc.

NOTE 3: BUSINESS COMBINATION

On December 1, 2022, the Company closed the acquisition of Flagstar Bancorp, Inc. (“Flagstar Bancorp”Flagstar”) in an all-stock transaction.transaction (“Flagstar Transaction”). Flagstar was a savings and loan holding company headquartered in Troy, MI.

Pursuant to the terms of the Merger Agreement, each share of Flagstar Bancorp. common stock was converted into 4.0151 shares of the Company’s common shares at the effective time of the merger. In addition, the Company received approval from the Office of the Comptroller of the Currency (the “OCC”“OCC") to convert Flagstar Bank, FSB to a national bank to be known as Flagstar Bank, N.A., and to merge New York Community Bank into Flagstar Bank, N.A. with Flagstar Bank, N.A. being the surviving entity. Flagstar Bank, FSB, provided commercial, small business, and consumer banking services through 158 branches in Michigan, Indiana, California, Wisconsin, and Ohio. It also provided home loans through a wholesale network of brokers and correspondents in all 50 states. The acquisition of Flagstar added significant scale, geographic diversification, improved funding profile, and a broader product mix to the Company.

The acquisition of Flagstar has been accounted for as a business combination. The Company recorded the preliminary estimate of fair value based on initial valuations atof the assets acquired and liabilities assumed December 1, 2022. Due to the timing of the transaction closing date and the Company’s annual report on Form 10-K, these estimated fair values are considered preliminary as of December 31, 2022, andwhich was subject to adjustment for up to one year after December 1, 2022. WhileAs of December 31, 2023, the Company believes thatfinalized its review of the information available on December 1, 2022 provided a reasonable basis for estimating fair value, the Company expects that it may obtain additional information and evidence during the measurement

91


period that would result in changes to the estimated fair value amounts. Valuations subject to change include, but are not limited to, loans and leases, certain deposits, intangibles, deferred tax assets acquired and liabilities assumed, and certain other assets and other liabilities.

The Company’s results of operations for the year-ended December 31, 2022, include the results of operations of Flagstar on and after December 1, 2022. Results for periods prior to December 1, 2022, dodid not include the results of operations of Flagstar.record any material adjustments.


The following table provides a preliminaryan allocation of consideration paid for the fair value of assets acquired and liabilities and equity assumed from Flagstar as of December 1, 2022.


(in millions)

December 1, 2022

Purchase pricePrice consideration

$

2,010 

2,010

Fair value of assets acquired:

Cash & cash equivalents

331 

331

Securities

2,695 

2,695

Loans held for sale

1,257 

1,257

Loans held for investment:

One-to-four family first mortgage

5,438 

5,438

Commercial and industrial

3,891 
Commercial real estate

6,523 

3,891

  Commercial and industrial

6,523

Consumer and other

2,156 

2,156

Total loans held for investment

18,008 

18,008

CDI and other intangible assets

292 

292

Mortgage servicing rights

1,012 

1,012

Other assets

2,158 

2,158

Total assets acquired

25,753 

25,753

Fair value of liabilities assumed:

Deposits

15,995 

15,995

Borrowings

6,700 

6,700

Other liabilities

889 

889

Total liabilities assumed

23,584 

23,584

Fair value of net identifiable assets

2,169 

2,169

Bargain purchase gain

$

159 

159


In connection with the acquisition, the Company recorded a bargain purchase gain of approximately $$159 million.

159
The Company incurred $99 million in acquisition costs related to the Flagstar Transaction primarily for legal, advisory, and other professional services. These costs are recorded within Merger-related and restructuring expenses on the Consolidated Statements of Income and Comprehensive Income.
million.

92


97


Fair Value of Assets Acquired and Liabilities Assumed

Fair value is defined as the price that would be received to sell an asset or paid to transfer a liability in an orderly transaction between market participants at the measurement date, reflecting assumptions that a market participant would use when pricing an asset or liability. In some cases, the estimation of fair values requires management to make estimates about discount rates, future expected cash flows, market conditions, and other future events that are highly subjective in nature and are subject to change. Described below are the methods used to determine the fair values of the significant assets acquired and liabilities assumed in the Flagstar acquisition.

Cash and Cash Equivalents

The estimated fair valuesvalue of cash and cash equivalents approximateapproximates their stated face amounts, as these financial instruments are either due on demand or have short-term maturities.

Investment Securities and Federal Home Loan Bank Stock

Quoted market prices for the securities acquired were used to determine their fair values. If quoted market prices were not available for a specific security, then quoted prices for similar securities in active markets were used to estimate the fair value. The fair value of FHLB-Indianapolis stock is equivalent to the redemption amount.

Loans

Loans

Fair values for loans were based on a discounted cash flow methodology that considered credit loss expectations, market interest rates and other market factors such as liquidity from the perspective of a market participant. Loans were grouped together according to similar characteristics and were treated in the aggregate when applying various valuation techniques. The probability of default, loss given default and prepayment assumptions were the key factors driving credit losses which were embedded into the estimated cash flows. These assumptions were informed by internal data on loan characteristics, historical loss experience, and current and forecasted economic conditions. The interest and liquidity component of the estimate was determined by discounting interest and principal cash flows through the expected life of each loan. The discount rates used for loans are based on current market rates for new originations of comparable loans and include adjustments for liquidity. The discount rates do not include a factor for credit losses as that has been included as a reduction to the estimated cash flows. Acquired loans were marked to fair value and adjusted for any PCD gross up as of the merger date.

Core Deposit Intangible

CDI is a measure of the value of non-interest-bearing and interest-bearing checking accounts, savings accounts, and money market accounts that are acquired in a business combination. The fair value of the CDI stemming from any given business combination is based on the present value of the expected cost savings attributable to the core deposit funding, relative to an alternative source of funding. The CDI relating to the Flagstar acquisition will be amortized over an estimated useful life of 10 years using the sum of years digits depreciation method. The Company evaluates such identifiable intangibles for impairment when an indication of impairment exists.

Deposit Liabilities

The fair valuesvalue of deposit liabilities with no stated maturity (i.e., money market accounts, savings accounts, and non-interest-bearing and interest-bearing checking accounts) areis equal to the carrying amounts payable on demand. The fair valuesvalue of certificates of deposit representrepresents contractual cash flows, discounted using interest rates currently offered on deposits with similar characteristics and remaining maturities.

93


Borrowed Funds

The estimated fair value of borrowed funds is based on bid quotations received from securities dealers or the discounted value of contractual cash flows with interest rates currently in effect for borrowed funds with similar maturities.


98


PCD loans

Purchased loans that reflect a more-than-insignificantmore than insignificant deterioration of credit from origination are considered PCD. For PCD loans and leases, the initial estimate of expected credit losses is recognized in the ACL on the date of acquisition using the same methodology as other loans and leases held-for-investment. The following table provides a summary of loans and leases purchased as part of the Flagstar acquisition with credit deterioration and the associated credit loss reserve at acquisition:

(in millions)

Total

Par value (UPB)

$

1,950 

1,950

ACL at acquisition

(51)

(51

)

Non-credit (discount)

(33)

(33

)

Fair value

$

1,866 

1,866


Unaudited Pro Forma CombinedInformation

The Company’s results of operations for the year-ended December 31, 2022 and 2023 include the results of operations of Flagstar on and after December 1, 2022. Results for periods prior to December 1, 2022, do not include the results of Operationsoperations of Flagstar.

The following pro forma financial information presents the unaudited consolidated results of operations of the Company and Flagstar as if the MergerFlagstar Transaction occurred as of January 1, 2021 with pro forma adjustments. The pro forma adjustments give effect to any change in interest income due to the accretion of the net discounts from the fair value adjustments of acquired loans, any change in interest expense due to the estimated net premium from the fair value adjustments to acquired time deposits and other debt, and the amortization of intangibles had the deposits been acquired as of January 1, 2021. The pro forma amounts for the twelve monthsyears ended December 31, 2022 and 2021 do not reflect the anticipated cost savings that have not yet been realized. Merger related expensesAcquisition costs incurred by the Company during the twelve monthsyears ended December 31, 2022 and 2021 are reflected in the pro forma amounts. The pro forma information does not necessarily reflect the results of operations that would have occurred had the Company merged with Flagstar Transaction occurred at the beginning of 2021.


For the Years Ended December 31,
(unaudited)
(in millions)20222021
Net interest income$2,278 $2,208 
Non-interest income650 1,105 
Net income804 1,207 
Net income available to common stockholders$771 $1,174 


Twelve Months Ended


December 31,


(unaudited)


(in millions)


2022


2021


Net interest income

$


2,278


$


2,208


Non-interest income


650


1,105


Net income


804


1,207


Net income available to common stockholders


771


1,174


94


99


Note 4 - Accumulated Other Comprehensive Income

NOTE 4: RECLASSIFICATIONS OUT OF ACCUMULATED OTHER COMPREHENSIVE LOSS
The following table sets forth the components in accumulated other comprehensive income:

(in millions)

For the Twelve MonthsYear Ended December 31, 2022

Details about
Accumulated Other Comprehensive Loss

Amount
Reclassified
out of
Accumulated
Other
Comprehensive
Loss
(1)

Affected Line Item in the
Consolidated Statements of Income
and Comprehensive Income

Unrealized gains on available-for-sale
securities:

$

— 

-

Net gain on securities


-

Income tax expense

$

— 

-

Net gain on securities, net of tax

Unrealized gains on cash flow hedges:

$

65 

4

Interest expense

(17)

(1

)

Income tax benefit

$

48 

3

Net gain on cash flow hedges, net of tax

Amortization of defined benefit pension
plan items:

Past service liability

$

— 

-

Included in the computation of net periodic credit(2)

Actuarial losses

(7)

(2

)

Included in the computation of net periodic cost(2)

(7)

(2

)

Total before tax

1 

-

Income tax benefit

$

(6)

(2

)

Amortization of defined benefit pension plan items, net of tax

Total reclassifications for the period

$

42 

1

(1)
Amounts in parentheses indicate expense items.
(2)
See Note 17, “Employee20 - Employee Benefits for additional information.


100


95


Note 5 - Investment Securities

NOTE 5: SECURITIES

The following tables summarize the Company’s portfolio of debt securities available for sale and equity investments with readily determinable fair values:


December 31, 2022


(in millions)


Amortized
Cost


Gross
Unrealized
Gain


Gross
Unrealized
Loss


Fair
Value


Debt securities available-for-sale


Mortgage-Related Debt Securities:


GSE certificates


$


1,457


$


$


160


$


1,297


GSE CMOs


3,600


1


300


3,301


Private Label CMOs


185


6


191


Total mortgage-related debt securities


$


5,242


$


7


$


460


$


4,789


Other Debt Securities:


U. S. Treasury obligations


$


1,491


$


$


4


$


1,487


GSE debentures


1,749


351


1,398


Asset-backed securities (1)


375


14


361


Municipal bonds


30


30


Corporate bonds


913


2


30


885


Foreign notes


20


20


Capital trust notes


97


5


12


90


Total other debt securities


$


4,675


$


7


$


411


$


4,271


Total debt securities available for sale


$


9,917


$


14


$


871


$


9,060


Equity securities:


Mutual funds


16


2


14


Total equity securities


$


16


$


$


2


$


14


Total securities (2)


$


9,933


$


14


$


873


$


9,074


December 31, 2023
(in millions)Amortized CostGross Unrealized GainGross Unrealized LossFair Value
Debt securities available-for-sale
Mortgage-Related Debt Securities:
GSE certificates$1,366 $$146 $1,221 
GSE CMOs5,495 48 381 5,162 
Private Label CMOs174 180 
Total mortgage-related debt securities$7,035 $56 $528 $6,563 
Other Debt Securities:
U. S. Treasury obligations$198 $— $— $198 
GSE debentures1,899 291 1,609 
Asset-backed securities (1)
307 — 302 
Municipal bonds— — 
Corporate bonds365 — 22 343 
Foreign notes35 — 34 
Capital trust notes97 12 90 
Total other debt securities$2,907 $$331 $2,582 
Total debt securities available for sale$9,942 $62 $859 $9,145 
Equity securities:
Mutual funds$16 $— $$14 
Total equity securities$16 $— $$14 
Total securities (2)
$9,958 $62 $861 $9,159 
(1)
The underlying assets of the asset-backed securities are substantially guaranteed by the U.S. Government.
(2)
Excludes accrued interest receivable of $31$38 million included in other assets in the Consolidated Statements of Condition.

96


101


December 31, 2021


(in millions)


Amortized
Cost


Gross
Unrealized
Gain


Gross
Unrealized
Loss


Fair
Value


Debt securities available-for-sale


Mortgage-Related Debt Securities:


GSE certificates


1,102


20


15


$

1,107


GSE CMOs


1,717


11


45


1,683


Total mortgage-related debt securities


$

2,819


$

31


$

60


$

2,790


Other Debt Securities:


U. S. Treasury obligations


45


$


$


$

45


GSE debentures


1,524


1


45


1,480


Asset-backed securities (1)


479


3


3


479


Municipal bonds


25


25


Corporate bonds


821


18


1


838


Foreign Notes


25


1


26


Capital trust notes


96


8


7


97


Total other debt securities


$

3,015


$

31


$

56


$

2,990


Total other securities available for sale


$

5,834


$

62


$

116


$

5,780


Equity securities:


Mutual funds


16


16


Total equity securities


$

16


$


$


$

16


Total securities (2)


$

5,850


$

62


$

116


$

5,796


December 31, 2022
(in millions)Amortized CostGross Unrealized GainGross Unrealized LossFair Value
Debt securities available-for-sale
Mortgage-Related Debt Securities:
GSE certificates$1,457 $— $160 $1,297 
GSE CMOs3,600 300 3,301 
Private Label CMOs185 — 191 
Total mortgage-related debt securities$5,242 $$460 $4,789 
Other Debt Securities:
U. S. Treasury obligations$1,491 $— $$1,487 
GSE debentures1,749 — 351 1,398 
Asset-backed securities (1)
375 — 14 361 
Municipal bonds30 — — 30 
Corporate bonds913 30 885 
Foreign Notes20 — — 20 
Capital trust notes97 12 90 
Total other debt securities$4,675 $$411 $4,271 
Total other securities available for sale$9,917 $14 $871 $9,060 
Equity securities:
Mutual funds$16 $— $$14 
Total equity securities$16 $— $$14 
Total securities (2)
$9,933 $14 $873 $9,074 
(1)
The underlying assets of the asset-backed securities are substantially guaranteed by the U.S. Government.
(2)
Excludes accrued interest receivable of $15$31 million included in other assets in the Consolidated Statements of Condition.

At December 31, 2022,2023, the Company had $762$861 million and $$329 million329 million of FHLB-NY stock, at cost and FHLB-Indianapolis stock, at cost, respectively. At December 31, 2021,2022, the Company had $734$762 million and $329 million of FHLB-NY stock, at cost.cost and FHLB-Indianapolis stock, at cost, respectively. The Company maintains an investment in FHLB-NY stock partly in conjunction with its membership in the FHLB and partly related to its access to the FHLB funding it utilizes. In addition, at December 31, 2023 and December 31, 2022, the Company had $176$203 million and $176 million of Federal Reserve Bank stock, at cost. The Company had respectively.no
Federal Reserve Bank stock, at December 31, 2021.

The following table summarizes the gross proceeds, gross realized gains, and gross realized losses from the sale of available-for-sale securities during the years-ended:


December 31,
( in millions)202320222021
Gross proceeds$1,637 $228 $— 
Gross realized gains— — 
Gross realized losses(3)— — 


December 31,


(in millions)


2022


2021


2020


Gross proceeds


$

228


$


$

484


Gross realized gains


2


Gross realized losses


1


Net

There were no unrealized (loss) gainslosses on equity securities recognized in earnings for the years ended December 31, 2023. For the years ended December 31, 2022 and 2021 and 2020there were $(2) million, $0unrealized losses on equity securities of $2 million and $zero recognized in earnings, respectively.

1
million, respectively.


97


102


The following table summarizes, by contractual maturity, the amortized cost of securities at December 31, 2022:2023:


Mortgage-
Related
Securities


U.S.
Government
and GSE
Obligations


State,
County,
and
Municipal


Other
Debt
Securities
(1)


Fair
Value


(dollars in millions)


Available-for-Sale Debt
   Securities:


Due within one year


$


52


$


1,588


$


2


$


20


$


1,657


Due from one to five years


195


150


472


804


Due from five to ten years


277


1,177


18


509


1,656


Due after ten years


4,718


325


10


404


4,943


Total debt securities available
   for sale


$


5,242


$


3,240


$


30


$


1,405


$


9,060


Mortgage- Related SecuritiesU.S. Government and GSE ObligationsState, County, and Municipal
Other Debt Securities (1)
Fair Value
( in millions)
Available-for-Sale Debt Securities:
Due within one year$— $448 $— $— $446 
Due from one to five years178 50 — 353 560 
Due from five to ten years316 1,502 105 1,597 
Due after ten years6,541 96 — 345 6,542 
Total debt securities available for sale$7,035 $2,096 $$803 $9,145 
(1)
Includes corporate bonds, capital trust notes, foreign notes, and asset-backed securities.


The following table presents securities having a continuous unrealized loss position for less than twelve months and for twelve months or longer as of December 31, 2023:

Less than Twelve MonthsTwelve Months or LongerTotal
(in millions)Fair ValueUnrealized LossFair ValueUnrealized LossFair ValueUnrealized Loss
Temporarily Impaired Securities:
U. S. Treasury obligations$— $— $— $— $— $— 
U.S. Government agency and GSE obligations181 1,362 290 1,543 291 
GSE certificates312 843 141 1,155 146 
Private Label CMOs29 — — 29 
GSE CMOs1,835 77 1,312 304 3,147 381 
Asset-backed securities— — 228 228 
Municipal bonds— — — — 
Corporate bonds— — 343 22 343 22 
Foreign notes— — 
Capital trust notes— — 81 12 81 12 
Equity securities— — 14 14 
Total temporarily impaired securities$2,357 $84 $4,198 $777 $6,555 $861 

The following table presents securities having a continuous unrealized loss position for less than twelve months and for twelve months or longer as of December 31, 2022:

Less than Twelve MonthsTwelve Months or LongerTotal
(in millions)Fair ValueUnrealized LossFair ValueUnrealized LossFair ValueUnrealized Loss
Temporarily Impaired Securities:
U. S. Treasury obligations$1,487 $$— $— $1,487 $
U.S. Government agency and GSE obligations243 1,156 346 1,399 351 
GSE certificates871 46 420 114 1,291 160 
GSE CMOs2,219 36 925 264 3,144 300 
Asset-backed securities61 262 12 323 14 
Municipal bonds— — 16 — 
Corporate bonds698 27 97 795 30 
Foreign notes20 — — — 20 — 
Capital trust notes46 34 10 80 12 
Equity securities— 10 14 
Total temporarily impaired securities$5,658 $122 $2,911 $751 $8,569 $873 


Less than Twelve Months


Twelve Months or Longer


Total


(in millions)


Fair Value


Unrealized
Loss


Fair Value


Unrealized
Loss


Fair Value


Unrealized
Loss


Temporarily Impaired Securities:


U. S. Treasury obligations


$


1,487


$


4


$


$


$


1,487


$


4


U.S. Government agency and GSE obligations


243


5


1,156


346


1,399


351


GSE certificates


871


46


420


114


1,291


160


GSE CMOs


2,219


36


925


264


3,144


300


Asset-backed securities


61


2


262


12


323


14


Municipal bonds


9


7


16


Corporate bonds


698


27


97


4


795


30


Foreign notes


20


20


Capital trust notes


46


2


34


10


80


12


Equity securities


4


10


2


14


2


Total temporarily impaired
   securities


$


5,658


$


122


$


2,911


$


752


$


8,569


$


873


103


98


The following table presentsinvestment securities designated as having a continuous unrealized loss position for less than twelve months and for twelve months or longer as ofmore at December 31, 2021:


Less than Twelve Months


Twelve Months or Longer


Total


(in millions)


Fair Value


Unrealized
Loss


Fair Value


Unrealized
Loss


Fair Value


Unrealized
Loss


Temporarily Impaired Securities:


U. S. Treasury obligations


$

45


$


$


$


$

45


$


U.S. Government agency and GSE obligations


317


7


185


8


502


15


GSE certificates


846


28


293


17


1,139


45


GSE CMOs


491


8


926


37


1,417


45


Asset-backed securities


130


1


135


2


265


3


Municipal bonds


8


8


Corporate bonds


99


1


99


1


Foreign notes


5


5


Capital trust notes


37


7


37


7


Equity securities


12


12


Total temporarily impaired
   securities


$

1,846


$

44


$

1,683


$

72


$

3,529


$

116


2023 consisted of eighty-four agency collateralized mortgage obligations, six capital trusts note, eight asset-backed securities, twelve corporate bonds, thirty-seven US government agency bonds, three hundred two mortgage-backed securities, one mutual fund, one foreign debt, and one municipal bond . The investment securities designated as having a continuous loss position for twelve months or more at December 31, 2022 consisted of twenty three agency collateralized mortgage obligations, five capital trusts notes, seven asset-backed securities, two corporate bonds, thirty three US government agency bonds, one hundred thirty three mortgage-backed securities, one mutual fund, and one municipal bond. The investment securities designated as having a continuous loss position for twelve months or more at December 31, 2021 consisted of


four agency collateralized mortgage obligations, five capital trusts notes, four asset-backed securities, two corporate bonds, twenty US government agency bonds, twenty one mortgage-backed securities and one municipal bond.

The Company evaluates available-for-sale debt securities in unrealized loss positions at least quarterly to determine if an allowance for credit losses is required. Based on an evaluation of available information about past events, current conditions, and reasonable and supportable forecasts that are relevant to collectability, the Company has concluded that it expects to receive all contractual cash flows from each security held in its available-for-sale securities portfolio.

We firstalso assess whether (i) we intend to sell, or (ii) it is more likely than not that we will be required to sell the security before recovery of its amortized cost basis. If either of these criteria is met, any previously recognized allowances are charged off and the security’s amortized cost basis is written down to fair value through income. If neither of the aforementioned criteria are met, we evaluate whether the decline in fair value has resulted from credit losses or other factors. If this assessment indicates that a credit loss exists, the present value of cash flows expected to be collected from the security are compared to the amortized cost basis of the security. If the present value of cash flows expected to be collected is less than the amortized cost basis, a credit loss exists and an allowance for credit losses is recorded for the credit loss, limited by the amount that the fair value is less than the amortized cost basis. Any impairment that has not been recorded through an allowance for credit losses is recognized in other comprehensive income.


In the first quarter of 2023, the Company held a $20 million corporate bond in Signature Bank which was placed into receivership on March 12, 2023. We have taken a $20 million provision for credit loss and charged-off this security during the three months ended March 31, 2023.

None of the remaining unrealized losses identified as of December 31, 20222023 or December 31, 20212022 relates to the marketability of the securities or the issuers’ ability to honor redemption obligations. Rather, the unrealized losses relate to changes in interest rates relative to when the investment securities were purchased, and do not indicate credit-related impairment. Management based this conclusion on an analysis of each issuer including a detailed credit assessment of each issuer. The Company does not intend to sell, and it is not more likely than not that the Company will be required to sell the positions before the recovery of their amortized cost basis, which may be at maturity. As such, no allowance for credit losses was recordedremains with respect to debt securities as of or during the twelve months ended December 31, 2022.2023.

104

99


Note 6 - Loans and Leases

NOTE 6: LOANS AND LEASES

The following table sets forth, atCompany classifies loans that we have the dates indicated,intent and ability to hold for the composition of the loan and lease portfolio held for investment,foreseeable future or until maturity as LHFI. We report LHFI loans at their amortized cost, which includes the outstanding principal balance adjusted for any unamortized premiums, discounts, deferred fees and costs:unamortized fair value adjustments for acquired loans:


December 31, 2022


December 31, 2021


(dollars in millions)

Amount


Percent of
Loans
Held for
Investment


Amount


Percent of
Loans
Held for
Investment


Loans and Leases Held for Investment:


Mortgage Loans:


Multi-family

$

38,130


55.3


%

$

34,628


75.7


%

Commercial real estate


8,526


12.4


6,701


14.7


One-to-four family first mortgage


5,821


8.4


160


0.3


Acquisition, development, and construction


1,996


2.8


209


0.5


Total mortgage loans held for investment (1)


54,473


78.9


41,698


91.2


Other Loans:


Commercial and industrial


10,597


15.4


2,238


3.2


Lease financing, net of unearned income
   of $
85 and $95 respectively


1,679


2.4


1,796


3.9


Total commercial and industrial loans (2)


12,276


17.8


4,034


7.2


Other


2,252


3.3


6


0.0


Total other loans held for investment


14,528


21.1


4,040


7.2


Total loans and leases held for investment (1)

$

69,001


100.0


%

$

45,738


100.0


%

Allowance for credit losses on loans and leases


(393

)


(199

)


Total loans and leases held for investment, net

$

68,608


$

45,539


Loans held for sale, at fair value


1,115


Total loans and leases, net

$

69,723


$

45,539


December 31, 2023December 31, 2022
(dollars in millions)AmountPercent of
Loans
Held for
Investment
AmountPercent of
Loans
Held for
Investment
Loans and Leases Held for Investment:
Mortgage Loans:
Multi-family$37,265 44.0 %$38,130 55.3 %
Commercial real estate10,47012.4 %8,52612.4 %
One-to-four family first mortgage6,0617.2 %5,8218.4 %
Acquisition, development, and construction2,9123.4 %1,9962.8 %
Total mortgage loans held for investment (1)
$56,708 67.0 %$54,473 78.9 %
Other Loans:
Commercial and industrial22,06526.1 %10,59715.4 %
Lease financing, net of unearned income of $258 and $85, respectively3,1893.8 %1,6792.4 %
Total commercial and industrial loans (2)
25,25429.9 %12,27617.8 %
Other2,6573.1 %2,2523.3 %
Total other loans held for investment27,91133.0 %14,52821.1 %
Total loans and leases held for investment (1)
$84,619 100.0 %$69,001 100.0 %
Allowance for credit losses on loans and leases(992)(393)
Total loans and leases held for investment, net83,62768,608
Loans held for sale1,182 1,115
Total loans and leases, net$84,809 $69,723 
(1)
Excludes accrued interest receivable of $292$423 million and $199$292 million at December 31, 20222023 and December 31, 2021,2022, respectively, which is included in other assets in the Consolidated Statements of Condition.
(2)
Includes specialty finance loans and leases of $4.4$5.2 billion and $3.5$4.4 billion respectively, at December 31, 20222023 and December 31, 2021.

Loans and Leases2022, respectively.

Loans and Leases Held for Investment

The majority of the loans the Company originates for investment are multi-family loans, most of which are collateralized by non-luxury apartment buildings in New York City with rent-regulated units and below-market rents. In addition, the Company originates CRE loans, most of which are collateralized by income-producing properties such as office buildings, retail centers, mixed-use buildings, and multi-tenanted light industrial properties that are located in New York City and on Long Island.

To a lesser extent, the Company also originates ADC loans for investment. One-to-four family loans held for investment were originated through the Company’s former mortgage banking operation and primarily consisted of jumbo prime adjustable rate mortgages made to borrowers with a solid credit history.

ADC loans are primarily originated for multi-family and residential tract projects in New York City and on Long Island. C&I loans consist of asset-based loans, equipment loans and leases, and dealer floor-plan loans (together, specialty finance loans and leases) that generally are made to large corporate obligors, many of which are publicly traded, carry investment grade or near-investment grade ratings, and participate in stable industries nationwide; and other C&I loans that primarily are made to small and mid-size businesses in Metro New York. Other C&I loans are typically made for working capital, business expansion, and the purchase of machinery and equipment.

100


The repayment of multi-family and CRE loans generally depends on the income produced by the underlying properties which, in turn, depends on their successful operation and management. To mitigate the potential for credit losses, the Company underwrites its loans in accordance with credit standards it considers to be prudent, looking first at the consistency of the cash flows being produced by the underlying property. In addition, multi-family buildings, CRE properties, and ADC projects are inspected as a prerequisite to approval, and independent appraisers, whose appraisals are carefully reviewed by the Company’s in-house appraisers, perform appraisals on the collateral properties. In many cases, a second independent appraisal review is performed.

To further manage its credit risk, the Company’s lending policies limit the amount of credit granted to any one borrower and typically require conservative debt service coverage ratios and loan-to-value ratios. Nonetheless, the ability of the Company’s borrowers to repay these loans may be impacted by adverse conditions in the local real estate market, the local economy and changes in applicable laws and regulations. Accordingly, there can be no assurance that its underwriting policies will protect the Company from credit-related losses or delinquencies.

ADC loans typically involve a higher degree of credit risk than loans secured by improved or owner-occupied real estate. Accordingly, borrowers are required to provide a guarantee of repayment and completion, and loan proceeds are disbursed as construction progresses, as certified by in-house inspectors or third-party engineers. The Company seeks to minimize the credit risk on ADC loans by maintaining conservative lending policies and rigorous underwriting standards. However, if the estimate of value proves to be inaccurate, the cost of completion is greater than expected, or the length of time to complete and/or sell or lease the collateral property is greater than anticipated, the property could have a value upon completion that is insufficient to assure full repayment of the loan. This could have a material adverse effect on the quality of the ADC loan portfolio, and could result in losses or delinquencies. In addition, the Company utilizes the same stringent appraisal process for ADC loans as it does for its multi-family and CRE loans.

To minimize the risk involved in specialty finance lending and leasing, the Company participates in syndicated loans that are brought to it, and equipment loans and leases that are assigned to it, by a select group of nationally recognized sources who have had long-term relationships with its experienced lending officers. Each of these credits is secured with a perfected first security interest or outright ownership in the underlying collateral, and structured as senior debt or as a non-cancelable lease. To further minimize the risk involved in specialty finance lending and leasing, each transaction is re-underwritten. In addition, outside counsel is retained to conduct a further review of the underlying documentation.

To minimize the risks involved in other C&I lending, the Company underwrites such loans on the basis of the cash flows produced by the business; requires that such loans be collateralized by various business assets, including inventory, equipment, and accounts receivable, among others; and typically requires personal guarantees. However, the capacity of a borrower to repay such a C&I loan is substantially dependent on the degree to which the business is successful. In addition, the collateral underlying such loans may depreciate over time, may not be conducive to appraisal, or may fluctuate in value, based upon the results of operations of the business.

At December 31, 2022, one-to-four family loans represented $5.8 billion and as of December 31, 2021 one-to-four family loans totaled $160 million, with the increase being driven by the Flagstar acquisition. These loans include various types of conforming and non-conforming fixed and adjustable rate loans underwritten using Fannie Mae and Freddie Mac guidelines for the purpose of purchasing or refinancing owner occupied and second home properties.

At December 31, 2022, other loans totaled $2.3 billion and consisted primarily of home equity lines of credit, boat and recreational vehicle indirect lending, point of sale consumer loans and other consumer loans, including overdraft loans acquired in the Flagstar acquisition.

Included in loans held for investment at December 31, 2022 and December 31, 2021, were loans of $101 million and $6 million, respectively, to officers, directors, and their related interests and parties. There were no loans to principal shareholders at that date.

Loans with Government Guarantees

Substantially all LGG are insured or guaranteed by the FHA or the U.S. Department of Veterans Affairs. Nonperforming repurchased loans in this portfolio earn interest at a rate based upon the 10-year U.S. Treasury note rate from the time the underlying loan becomes 60 days delinquent until the loan is conveyed to HUD (if foreclosure timelines are met), which is not paid by the FHA until claimed. The Bank has a unilateral option to repurchase loans sold to GNMA if the loan is due, but unpaid, for three consecutive months (typically referred to as 90 days past due) and can recover losses through a claims process from the guarantor. These loans are recorded in loans held for investment and the liability to repurchase the loans is recorded in other liabilities on the Consolidated Statements of Condition. Certain loans within our portfolio may be subject to indemnifications and insurance limits which expose us to limited credit risk. As of December 31, 2022,2023, LGG loans totaled $1.2 billion$541 million and the repurchase liability was $$456 million.

0.3 billion.

101


Repossessed assets and the associated net claims related to government guaranteed loans are recorded in other assets and was $14 million 14 millionat December 31, 2023.

Loans Held-for-Sale

Loans held-for-sale at December 31, 2023 totaled $1.2 billion, up from $1.1 billion at December 31, 2022.

The

Loans Held-for-Sale

At December 31, 2022,Signature Transaction contributed $360 million in Small Business Administration ("SBA") loans held for sale were $1.1 billion compared to zero at December 31, 2021, with the increase driven by the Flagstar acquisition. The Company classifiesthis increase. We classify loans as held for sale when we originate or purchase loans that we intend to sell. The Company hasWe have elected the fair value option for nearly all of this portfolio. The Company estimatesportfolio, except the SBA loans. We estimate the fair value of mortgage loans based on quoted market prices for securities backed by similar types of loans, where available, or by discounting estimated cash flows using observable inputs inclusive of interest rates, prepayment speeds and loss assumptions for similar collateral. The majority of our mortgage loans originated as LHFS are ultimately sold into the secondary market on a whole loan basis or by securitizing the loans into agency, government, or private label MBS.


105


Asset Quality

All asset quality information excludes LGG that are insured by U.S government agencies.

A loan generally is classified as a non-accrual loan when it is 90 days or more past due or when it is deemed to be impaired because the Company no longer expects to collect all amounts due according to the contractual terms of the loan agreement. When a loan is placed on non-accrual status, management ceases the accrual of interest owed, and previously accrued interest is charged against interest income. A loan is generally returned to accrual status when the loan is current and management has reasonable assurance that the loan will be fully collectible. Interest income on non-accrual loans is recorded when received in cash. At December 31, 20222023 and December 31, 2021, all2022 we had no loans that were nonperforming and still accruing.

The following table presents information regarding the quality of our non-performingthe Company’s loans were non-accrual loans.held for investment at December 31, 2023:
(in millions)Loans 30-89 Days Past DueNon- Accrual LoansTotal Past Due Loans
Current Loans (2)
Total Loans Receivable
Multi-family$121 $138 $259 $37,006 $37,265 
Commercial real estate28 128 156 10,314 10,470 
One-to-four family first mortgage40 95 135 5,926 6,061 
Acquisition, development, and construction2,908 2,912 
Commercial and industrial(1)
37 43 80 25,174 25,254 
Other22 22 44 2,613 2,657 
Total$250 $428 $678 $83,941 $84,619 
(1)Includes lease financing receivables.

(2)Includes $207 million multi-family loans from one borrower that had a payment in the process of collection as of December 31, 2023 and subsequently settled on January 2, 2024.


The following table presents information regarding the quality of the Company’s loans held for investment at December 31, 2022:

(in millions)


Loans
 30-89
Days
Past Due


Non-
Accrual
Loans


Loans 90
Days or
More
Delinquent
and Still
Accruing
Interest


Total
Past Due
Loans


Current
Loans


Total
Loans
Receivable


Multi-family


$

34


$

13


$


$

47


$

38,083


$

38,130


Commercial real estate


2


20


22


8,504


8,526


One-to-four family first mortgage


21


92


113


5,708


5,821


Acquisition, development, and
   construction


1,996


1,996


Commercial and industrial(1)


7


7


12,269


12,276


Other


13


9


22


2,230


2,252


Total


$

70


$

141


$


$

211


$

68,790


$

69,001


(in millions)Loans 30-89 Days Past DueNon- Accrual LoansTotal Past Due LoansCurrent LoansTotal Loans Receivable
Multi-family$34 $13 $47 $38,083 $38,130 
Commercial real estate20 22 8,504 8,526 
One-to-four family first mortgage21 92 113 5,708 5,821 
Acquisition, development, and construction— — — 1,996 1,996 
Commercial and industrial(1)
12,271 12,276 
Other11 13 24 2,228 2,252 
Total$70 $141 $211 $68,790 $69,001 
(1)
Includes lease financing receivables, all of which were current.

102


The following table presents information regardingsummarizes the qualityCompany’s portfolio of the Company’s loans held for investment by credit quality indicator at December 31, 2021:

(in millions)


Loans
 30-89
Days
Past Due


Non-
Accrual
Loans


Loans 90
Days or
More
Delinquent
and Still
Accruing
Interest


Total
Past Due
Loans


Current
Loans


Total
Loans
Receivable


Multi-family


$

57


$

10


$


$

67


$

34,561


$

34,628


Commercial real estate


2


16


18


6,683


6,701


One-to-four family first mortgage


8


1


9


151


160


Acquisition, development, and
   construction


209


209


Commercial and industrial(1)


6


6


4,029


4,035


Other


5


5


Total


$

67


$

33


$


$

100


$

45,638


$

45,738


2023:
(1)
Includes lease financing receivables, all of which were current.
Mortgage LoansOther Loans
(in millions)Multi- FamilyCommercial Real EstateOne-to- Four FamilyAcquisition, Development, and ConstructionTotal Mortgage LoansCommercial and IndustrialOtherTotal Other Loans
Credit Quality Indicator:
Pass$34,170 $8,734 $5,328 $2,825 $51,057 $24,683 $2,634 $27,317 
Special mention768 367 — 57 1,192 335 — 335 
Substandard2,327 1,369 733 30 4,459 236 23 259 
Doubtful— — — — — — — — 
Total$37,265 $10,470 $6,061 $2,912 $56,708 $25,254 $2,657 $27,911 


106


The following table summarizes the Company’s portfolio of loans held for investment by credit quality indicator at December 31, 2022:


Mortgage Loans


Other Loans


(in millions)


Multi-
Family


Commercial
Real Estate


One-to-
Four
Family


Acquisition,
Development,
and
Construction


Total
Mortgage
Loans


Commercial
and
Industrial
(1)


Other


Total
Other
Loans


Credit Quality Indicator:


Pass


$

36,622


$

7,871


$

5,710


$

1,992


$

52,195


$

12,208


$

2,238


$

14,446


Special mention


864


230


8


4


1,106


18


18


Substandard


644


425


103


1,172


50


14


64


Doubtful


Total


$

38,130


$

8,526


$

5,821


$

1,996


$

54,473


$

12,276


$

2,252


$

14,528


(1)
Mortgage LoansOther Loans
(in millions)Multi- FamilyCommercial Real EstateOne-to- Four FamilyAcquisition, Development, and ConstructionTotal Mortgage LoansCommercial and IndustrialOtherTotal Other Loans
Credit Quality Indicator:
Pass$36,622 $7,871 $5,710 $1,992 $52,195 $12,208 $2,238 $14,446 
Special mention864 230 1,106 18 — 18 
Substandard644 425 103 — 1,172 50 14 64 
Total$38,130 $8,526 $5,821 $1,996 $54,473 $12,276 $2,252 $14,528 
Includes lease financing receivables, all of which were classified as Pass.

The following table summarizes the Company’s portfolio of loans held for investment by credit quality indicator at December 31, 2021:


Mortgage Loans


Other Loans


(in millions)


Multi-
Family


Commercial
Real Estate


One-to-
Four
Family


Acquisition,
Development,
and
Construction


Total
Mortgage
Loans


Commercial
and
Industrial
(1)


Other


Total
Other
Loans


Credit Quality Indicator:


Pass


$

33,035


$

5,876


$

137


$

204


$

39,252


$

3,987


$

6


$

3,993


Special mention


982


644


14


5


1,645


2


2


Substandard


611


181


9


801


45


45


Doubtful


Total


$

34,628


$

6,701


$

160


$

209


$

41,698


$

4,034


$

6


$

4,040


(1)
Includes lease financing receivables, all of which were classified as Pass.

The preceding classifications are the most current ones available and generally have been updated within the last twelve months. In addition, they follow regulatory guidelines and can generally be described as follows: pass loans are of satisfactory quality; special mention loans have potential weaknesses that deserve management’s close attention; substandard loans are inadequately protected by the current net worth and paying capacity of the borrower or of the collateral pledged (these loans have a well-defined weakness and

103


there is a possibility that the Company will sustain some loss); and doubtful loans, based on existing circumstances, have weaknesses that make collection or liquidation in full highly questionable and improbable. In addition, one-to-four family loans are classified based on the duration of the delinquency.

The following table presents, by credit quality indicator, loan class, and year of origination, the amortized cost basis of the Company’s loans and leases as of December 31, 2022:2023:

Vintage Year
(in millions)20232022202120202019Prior To 2019Revolving LoansRevolving Loans Converted to Term LoansTotal
Pass$2,532 $13,295 $10,308 $8,438 $4,725 $9,670 $1,981 $108 $51,057 
Special Mention— 217 69 407 144 341 14 — 1,192 
Substandard45 98 258 336 809 2,910 — 4,459 
Doubtful— — — — — — — — — 
Total mortgage loans$2,577 $13,610 $10,635 $9,181 $5,678 $12,921 $1,995 $111 $56,708 
Current-period gross write-offs— (112)— — (2)(64)— — (178)
Pass(1)
$9,709 $3,598 $1,936 $1,141 $911 $941 $8,757 $324 $27,317 
Special Mention182 17 18 102 — 335 
Substandard10 39 45 28 40 40 46 11 259 
Doubtful— — — — — — — — — 
Total other loans$9,720 $3,819 $1,998 $1,178 $957 $999 $8,905 $335 $27,911 
Current-period gross write-offs$(2)$(10)$(5)$(8)$(2)$(18)$— $— $(45)
Total$12,297 $17,429 $— $12,633 $10,359 $6,635 $13,920 $10,900 $446 $84,619 


Vintage Year


(in millions)
 Risk Rating Group


2022


2021


2020


2019


2018


Prior To
2018


Revolving
Loans


Revolving
Loans Converted to Term Loans


Total


Pass


$

12,817


$

10,925


$

9,121


$

5,519


$

4,301


$

8,055


$

1,452


$

5


$

52,195


Special Mention


15


103


244


293


451


1,106


Substandard


1


6


48


224


137


753


3


1,172


Total mortgage loans


$

12,818


$

10,946


$

9,272


$

5,987


$

4,731


$

9,259


$

1,452


$

8


$

54,473


Pass


5,415


964


637


727


180


266


6,209


46


14,444


Special Mention


12


7


19


Substandard


1


1


22


2


9


7


19


4


65


Total other loans


5,428


965


659


736


189


273


6,228


50


14,528


Total


$

18,246


$

11,911


$

9,931


$

6,723


$

4,920


$

9,532


$

7,680


$

58


$

69,001


When management determines that foreclosure is probable, for loans that are individually evaluated the expected credit losses are based on the fair value of the collateral adjusted for selling costs. When the borrower is experiencing financial difficulty at the reporting date and repayment is expected to be provided substantially through the operation or sale of the collateral, the collateral-dependent practical expedient has been elected and expected credit losses are based on the fair value of the collateral at the reporting date, adjusted for selling costs as appropriate. For CRE loans, collateral properties include office buildings, warehouse/distribution buildings, shopping centers, apartment buildings, residential and commercial tract development. The primary source of repayment on these loans is expected to come from the sale, permanent financing or lease of the real property collateral. CRE loans are impacted by fluctuations in collateral values, as well as the ability of the borrower to obtain permanent financing.

107


The following table summarizes the extent to which collateral secures the Company’s collateral-dependent loans held for investment by collateral type as of December 31, 2022:2023:

Collateral Type
(in millions)Real PropertyOther
Multi-family$253 $— 
Commercial real estate256 — 
One-to-four family first mortgage105 — 
Commercial and industrial— 120 
Total collateral-dependent loans held for investment$614 $120 


Collateral Type


(in millions)


Real
Property


Other


Multi-family


$

13


$


Commercial real estate


35


One-to-four family first mortgage


136


Acquisition, development, and construction


Commercial and industrial


3


Other


14


Total collateral-dependent loans held for investment


198


3


Other collateral type consists of taxi medallions, cash, accounts receivable and inventory.

There were no significant changes in the extent to which collateral secures the Company’s collateral-dependent financial assets during the twelve monthsyear ended December 31, 2022.2023.

At December 31, 20222023 and December 31, 2021,2022, the Company had $121$81 million and $121 million of residential mortgage loans in the process of foreclosure, respectively.

Included in loans held for investment at December 31, 2023 and December 31, 2022, were loans of $9 million and $101 million, respectively, to officers, directors, and their related interests and parties. There were no loans to principal shareholders at that date.

no
Modifications to Borrowers Experiencing Financial Difficulty
residential mortgage loans
Effective January 1, 2023, the Company adopted ASU 2022-02- Financial Instruments - Credit Losses (Topic 326): Troubled Debt Restructurings and Vintage Disclosures. For additional information on the adoption, refer to Note 1 - Description of Business, Organization and Basis of Presentation.

When borrowers are experiencing financial difficulty, the Company may make certain loan modifications as part of loss mitigation strategies to maximize expected payment. Modifications in the processform of foreclosure, respectively.principal forgiveness, an interest rate reduction, or an other-than-insignificant payment delay or a term extension that have occurred in the current reporting period to a borrower experiencing financial difficulty are disclosed along with the financial impact of the modifications.

104


The interest incomefollowing table summarizes the amortized cost basis of loans modified during the reporting period to borrowers experiencing financial difficulty, disaggregated by class of financing receivable and type of modification:


Amortized Cost
(dollars in millions)Interest Rate ReductionTerm ExtensionCombination - Interest Rate Reduction & Term ExtensionTotalPercent of Total Loan class
Year Ended December 31, 2023
Multi-family$122 $— $— $122 1.17 %
Commercial real estate102 — 103 0.98 %
One-to-four family first mortgage14 0.23 %
Commercial and Industrial— 19 21 0.08 %
Other Consumer$— $— $0.08 %
Total$227 $25 $10 $262 


108


The following table describes the financial effect of the modification made to borrowers experiencing financial difficulty:

Interest Rate ReductionTerm Extension
Weighted-average contractual interest rate
FromToWeighted-average Term (in years)
Year Ended December 31, 2023
Multi-family7.45 %6.02 %
Commercial real estate8.83 %4.56 %
One-to-four family first mortgage6.08 %4.79 %
Commercial and industrial8.44 %8.08 %0.58
Other Consumer9.09 %4.82 %

As of December 31, 2023, there were $4 million one-to-four family first mortgages that wouldwere modified for borrowers experiencing financial difficulty that received term extension and subsequently defaulted during the period and $4 million one-to-four family first mortgages that were combination modifications and subsequently defaulted during the period.

The performance of loans made to borrowers experiencing financial difficulty in which modifications were made is closely monitored to understand the effectiveness of modification efforts. Loans are considered to be in payment default at 90 or more days past due. The following table depicts the performance of loans that have been recorded undermodified during the original terms of non-accrual loans at the respective year-ends, and the interest income actually recorded on these loans in the respective years, is summarized below:reporting period:

December 31, 2023
(dollars in millions)Current30 - 89 Past Due90+ Past DueTotal
Commercial real estate— — 
One-to-four family first mortgage3811
Commercial and industrial39113
Other Consumer112
Total$$10 $$27 


December 31,


(in millions)


2022


2021


2020


Interest income that would have been recorded


$

3


$

3


$

5


Interest income actually recorded


(1

)


(1

)


(1

)

Interest income foregone


$

2


$

2


$

4


Troubled Debt Restructurings Prior to Adoption of ASU 2022-02

The

Prior to the adoption of ASU 2022-02, the Company is required to accountaccounted for certain loan modifications and restructurings as TDRs. In general, a modification or restructuring of a loan constitutesconstituted a TDR if the Company grantsgranted a concession to a borrower experiencing financial difficulty. A loan modified as a TDR was generally is placed on non-accrual status until the Company determinesdetermined that future collection of principal and interest is reasonably assured, which requires, among other things, that the borrower demonstrate performance according to the restructured terms for a period of at least six consecutive months. In determining the Company’s allowance for credit losses on loans and leases, reasonably expected TDRs were individually evaluated and consist of criticized, classified, or maturing loans that will have a modification processed within the next three months.

In an effort to proactively manage delinquent loans, the Company has selectively extended to certain borrowers concessions such as rate reductions, extension of maturity dates, and forbearance agreements. As of December 31, 2022, loans on which concessions were made with respect to rate reductions and/or extension of maturity dates amounted to $$44 million.

38 million.

The following table presents information regarding the Company’s TDRs:


December 31, 2022


December 31, 2021


(in millions)


Accruing


Non-
Accrual


Total


Accruing


Non-
Accrual


Total


Loan Category:


Multi-family


$


$


6


$


6


$


$


7


$


7


Commercial real estate


16


19


35


16


16


One-to-four family first mortgage


Acquisition, development, and
   construction


Commercial and industrial


3


3


6


6


Total


$


16


$


28


$


44


$


16


$


13


$


29


The eligibilityCompany's TDRs as of a borrower for work-out concessions of any nature depends upon the facts and circumstances of each loan, which may change from period to period, and involves judgment by Company personnel regarding the likelihood that the concession will result in the maximum recovery for the Company.December 31, 2022:


December 31, 2022
(dollars in millions)AccruingNon- AccrualTotal
Loan Category:
Multi-family$— $$
Commercial real estate161935

109

105


Commercial and industrial33
Total$16 $28 $44 

The financial effects of the Company’s TDRs are summarized as follows:


For the Twelve Months Ended December 31, 2022


Weighted Average
Interest Rate


(dollars in millions)


Number
of Loans


Pre-
Modification
Recorded
Investment


Post-
Modification
Recorded
Investment


Pre-
Modification


Post-
Modification


Charge-
off
Amount


Capitalized
Interest


Loan Category:


Commercial real estate


2


$

22


$

19


6.00


%

4.02

%

$

3


$


Total


2


$

22


$

19


$

3


$


For the Twelve Months Ended December 31, 2021


Weighted Average
Interest Rate


(dollars in millions)


Number
of Loans


Pre-
Modification
Recorded
Investment


Post-
Modification
Recorded
Investment


Pre-
Modification


Post-
Modification


Charge-
off
Amount


Capitalized
Interest


Loan Category:


Commercial real estate


2


$

4


$

4


6.00

%

3.55

%

$


$


Commercial and industrial


1


8


8


3.13


3.25


Total


3


$

12


$

12


$


For the Twelve Months Ended December 31, 2020


Weighted Average
Interest Rate


(dollars in millions)


Number
of Loans


Pre-
Modification
Recorded
Investment


Post-
Modification
Recorded
Investment


Pre-
Modification


Post-
Modification


Charge-
off
Amount


Capitalized
Interest


Loan Category:


One-to-four family first mortgage


1


$

15


$

15


8.00


%

3.50


%

$


$


Commercial and industrial


42


9


$

8


2.36


2.23


1


Total


43


$

24


$

23


$

1


$


At December 31, 2022 and December 31, 2021, no loans have been modified as TDR's that were in payment default duringfor the twelve months ended at that date. At December 31, 2020, C&I loans in the amount of $3 million that had been modified2022 are summarized as a TDR during the twelve months ended at that date was in prepayment default.follows:


Weighted Average Interest Rate
(dollars in millions)Number of LoansPre- Modification Recorded InvestmentPost- Modification Recorded InvestmentPre- ModificationPost- ModificationCharge- off AmountCapitalized Interest
Loan Category:
Commercial real estate2$22 $19 6.00 %4.02 %$$— 

The Company does not consider a payment to be in default when the loan is in forbearance, or otherwise granted a delay of payment, when the agreement to forebear or allow a delay of payment is part of a modification.

Subsequent to the modification, the loan is not considered to be in default until payment is contractually past due in accordance with the modified terms. However, the Company does consider a loan with multiple modifications or forbearance periods to be in default, and would also consider a loan to be in default if the borrower were in bankruptcy or if the loan were partially charged off subsequent to modification.

106


NOTE 7: ALLOWANCE FOR CREDIT LOSSES ON LOANS AND LEASES

Note 7 - Allowance for Credit Losses on Loans and Leases

Allowance for Credit Losses on Loans and Leases

The following table summarizes activity in the allowance for loan and leasecredit losses for the periods indicated:

For the Years Ended December 31,
20232022
(in millions)MortgageOtherTotalMortgageOtherTotal
Balance, beginning of period$290 $103 $393 $178 $21 $199 
Adjustment for Purchased PCD Loans1313213051
Charge-offs(178)(45)(223)(5)(2)(7)
Recoveries15154711
Provision for (recovery of) credit losses on loans and leases6441507949247139
Balance, end of period$756 $236 $992 $290 $103 $393 


Twelve Months Ended December 31,


2022


2021


(in millions)


Mortgage


Other


Total


Mortgage


Other


Total


Balance, beginning of period


$

178


$

21


$

199


$

176


$

18


$

194


Adjustment for Purchased PCD Loans


21


30


51


Charge-offs


(5

)


(2

)


(7

)


(6

)


(7

)


(13

)

Recoveries


4


7


11


2


13


15


Provision for (recovery of) credit
   losses on loans and leases


92


47


139


6


(3

)


3


Balance, end of period


$

290


$

103


$

393


$

178


$

21


$

199


At

As of December 31, 2022,2023, the allowance for credit losses on loans and leases totaled $393$992 million, up $194$599 million compared to December 31, 2021, driven primarily by the initial provision for credit losses and the adjustment for PCD loans acquired in the Flagstar acquisition. In addition, the increase was also driven by net recoveries of $4 million during the year 2022.

At December 31, 2022 and 2021, the allowance for unfunded commitments totaled $23 million and $12 million, respectively.

For the year ended December 31, 2022 the The increase in the allowance for credit losses on loans and leases was primarily driven by a combination of increased loan balances as a result of the Flagstar acquisition and changesan increase in reserves to address weakness in the macroeconomic environment bothoffice sector, potential repricing risk in the multifamily portfolio and an increase in classified assets. Also contributing to the increase in the allowance for credit losses on a spotloans and forecasted basis, specificallyleases was the inflationary pressures leading to sharp increases in interest rates and a slow-down of prepayment activity leading to longer weighted average lives on the balance sheet. In addition, theday 1 impact of the forecasted macroeconomic factors had resultant decreasesSignature Transaction that closed on market level factors in Property Prices onMarch 20, 2023, which added $141 million to the Multi-Family, Commercial Real Estatereserve.


As of December 31, 2023 and 1-4 Family loan portfolios reflectingDecember 31, 2022, the changing economic landscape.

allowance for unfunded commitments totaled $52 million and $23 million, respectively.

The Company charges off loans, or portions of loans, in the period that such loans, or portions thereof, are deemed uncollectible. The collectability of individual loans is determined through an assessment of the financial condition and repayment capacity of the borrower and/or through an estimate of the fair value of any underlying collateral. For non-real estate-related consumer credits, the following past-due time periods determine when charge-offs are typically recorded: (1) closed-end credits are charged off in the quarter that the loan becomes 120 days past due; (2) open-end credits are charged off in the quarter that the loan becomes 180 days past due; and (3) both closed-end and open-end credits are typically charged off in the quarter that the credit is 60 days past the date the Company received notification that the borrower has filed for bankruptcy.


110

107


The following table presents additional information about the Company’s nonaccrual loans at December 31, 2023:
(in millions)Recorded InvestmentRelated AllowanceInterest Income Recognized
Nonaccrual loans with no related allowance:
Multi-family$134 $— $
Commercial real estate532
One-to-four family first mortgage85
Acquisition, development, and construction
Other (includes C&I)22
Total nonaccrual loans with no related allowance$294 $— $
Nonaccrual loans with an allowance recorded:
Multi-family$$— $— 
Commercial real estate75173
One-to-four family first mortgage112
Acquisition, development, and construction
Other (includes C&I)4428
Total nonaccrual loans with an allowance recorded$134 $47 $
Total nonaccrual loans:
Multi-family$138 $— $
Commercial real estate128175
One-to-four family first mortgage962
Acquisition, development, and construction
Other (includes C&I)6628
Total nonaccrual loans$428 $47 $10 

The following table presents additional information about the Company’s nonaccrual loans at December 31, 2022:


(in millions)Recorded InvestmentRelated AllowanceInterest Income Recognized
Nonaccrual loans with no related allowance:
Multi-family$13 $— $— 
Commercial real estate191
One-to-four family first mortgage90
Other (includes C&I)3
Total nonaccrual loans with no related allowance$125 $— $
Nonaccrual loans with an allowance recorded:
Commercial real estate$$— $— 
One-to-four family first mortgage2
Other (includes C&I)1314
Total nonaccrual loans with an allowance recorded$16 $14 $— 
Total nonaccrual loans:
Multi-family$13 $— $— 
Commercial real estate201
One-to-four family first mortgage92
Other (includes C&I)1614
Total nonaccrual loans$141 $14 $

Note 8 - Leases

(in millions)


Recorded
Investment


Related
Allowance


Interest
Income
Recognized


Nonaccrual loans with no related allowance:


Multi-family


$

13


$


$


Commercial real estate


19


1


One-to-four family first mortgage


90


Acquisition, development, and construction


Other (includes C&I)


3


Total nonaccrual loans with no related allowance


$

125


$


$

1


Nonaccrual loans with an allowance recorded:


Multi-family


$


$


$


Commercial real estate


1


One-to-four family first mortgage


2


Acquisition, development, and construction


Other (includes C&I)


13


14


Total nonaccrual loans with an allowance recorded


$

16


$

14


$


Total nonaccrual loans:


Multi-family


$

13


$


$


Commercial real estate


20


1


One-to-four family first mortgage


92


Acquisition, development, and construction


Other (includes C&I)


16


14


Total nonaccrual loans


$

141


$

14


$

1


108


The following table presents additional information about the Company’s nonaccrual loans at December 31, 2021

(in millions)


Recorded
Investment


Related
Allowance


Interest
Income
Recognized


Nonaccrual loans with no related allowance:


Multi-family


$

9


$


$

1


Commercial real estate


14


One-to-four family first mortgage


Acquisition, development, and construction


Other


6


Total nonaccrual loans with no related allowance


$

29


$


$

1


Nonaccrual loans with an allowance recorded:


Multi-family


$

1


$


$


Commercial real estate


2


One-to-four family first mortgage


1


Acquisition, development, and construction


Other


Total nonaccrual loans with an allowance recorded


$

4


$


$


Total nonaccrual loans:


Multi-family


$

10


$


$

1


Commercial real estate


16


One-to-four family first mortgage


1


Acquisition, development, and construction


Other


6


Total nonaccrual loans


$

33


$


$

1


NOTE 8. LEASES

Lessor Arrangements

The Company is a lessor in the equipment finance business where it has executed direct financing leases (“lease finance receivables”). The Company produces lease finance receivables through a specialty finance subsidiary that participates in syndicated loans that are brought to them, and equipment loans and leases that are assigned to them, by a select group of

111


nationally recognized sources, and are generally made to large corporate obligors, many of which are publicly traded, carry investment grade or near-investment grade ratings, and participate in stable industries nationwide. Lease finance receivables are carried at the aggregate of lease payments receivable plus the estimated residual value of the leased assets and any initial direct costs incurred to originate these leases, less unearned income, which is accreted to interest income over the lease term using the interest method.

The standard leases are typically repayable on a level monthly basis with terms ranging from 24 to 120 months. At the end of the lease term, the lessee usually has the option to return the equipment, to renew the lease or purchase the equipment at the then fair market value (“FMV”) price. For leases with a FMV renewal/purchase option, the relevant residual value assumptions are based on the estimated value of the leased asset at the end of the lease term, including evaluation of key factors, such as, the estimated remaining useful life of the leased asset, its historical secondary market value including history of the lessee executing the FMV option, overall credit evaluation and return provisions. The Company acquires the leased asset at fair market value and provides funding to the respective lessee at acquisition cost, less any volume or trade discounts, as applicable. Therefore, there is generally no selling profit or loss to recognize or defer at inception of a lease.

The residual value component of a lease financing receivable represents the estimated fair value of the leased equipment at the end of the lease term. In establishing residual value estimates, the Company may rely on industry data, historical experience, and independent appraisals and, where appropriate, information regarding product life cycle, product upgrades and competing products. Upon expiration of a lease, residual assets are remarketed, resulting in either an extension of the lease by the lessee, a lease to a new customer or purchase of the residual asset by the lessee or another party. Impairment of residual values arises if the expected fair value is less than the carrying amount. The Company assesses its net investment in lease financing receivables (including residual values) for impairment on an annual basis with any impairment losses recognized in accordance with the impairment guidance for financial instruments. As such, net investment in lease financing receivables may be reduced by an allowance for credit losses with changes

109


recognized as provision expense. On certain lease financings, the Company obtains residual value insurance from third parties to manage and reduce the risk associated with the residual value of the leased assets. At December 31, 20222023 and December 31, 2021,2022, the carrying value of residual assets with third-party residual value insurance for at least a portion of the asset value was $32$280 million and $61$32 million, respectively.

The Company uses the interest rate implicit in the lease to determine the present value of its lease financing receivables.

The components of lease income were as follows:

(in millions)


For the
Twelve
Months
Ended
December 31,
2022


For the
Twelve
Months
Ended
December 31,
2021


Interest income on lease financing (1)


$

53


$

53


For the Years Ended December 31,
(in millions)202320222021
Interest income on lease financing (1)
$119 $53 $53 
(1)
Included in Interest Income – Loans and leases in the Consolidated Statements of Income and Comprehensive Income.

At December 31, 20222023 and December 31, 2021,2022, the carrying value of net investment in leases, excluding purchase accounting adjustments was $1.7$3.5 billion and $1.9$1.7 billion, respectively. The components of net investment in direct financing leases, including the carrying amount of the lease receivables, as well as the unguaranteed residual asset were as follows:

(in millions)December 31, 2023December 31, 2022
Net investment in the lease - lease payments receivable$3,187 $1,685 
Net investment in the lease - unguaranteed residual assets321 60 
Total lease payments$3,508 $1,745 


112


(in millions)


December 31,
2022


December 31,
2021

Net investment in the lease - lease payments receivable


$1,685


$1,790

Net investment in the lease - unguaranteed residual assets


60


75

Total lease payments


$1,745


$1,865

The following table presents the remaining maturity analysis of the undiscounted lease receivables, as well as the reconciliation to the total amount of receivables recognized in the Consolidated Statements of Condition:


(in millions)December 31, 2023
2024549 
2025602 
2026874 
2027521 
2028293 
Thereafter669 
Total lease payments$3,508 
Plus: deferred origination costs15 
Less: unearned income(258)
Less: purchase accounting adjustment$(76)
Total lease finance receivables, net$3,189 

(in millions)


December 31,
2022


2022


$


-


2023


52


2024


152


2025


396


2026


342


Thereafter


803


Total lease payments


1,745


Plus: deferred origination costs


19


Less: unearned income


(85

)

Total lease finance receivables, net


$


1,679


Lessee Arrangements

The Company has operating leases for corporate offices, branch locations, and certain equipment. These leases generally have terms of 20 years or less, determined based on the contractual maturity of the lease, and include periods covered by options to extend or terminate the lease when the Company is reasonably certain that it will exercise those options. For the vast majority of the Company’s leases, we are not reasonably certain we will exercise our options to renew to the end of all renewal option periods. The Company determines if an arrangement is a lease at inception. Operating leases are included in operating lease right-of-useother assets and operating leaseother liabilities in the Consolidated Statements of Condition.

110


ROU assets represent the Company’s right to use an underlying asset for the lease term and lease liabilities represent the obligation to make lease payments arising from the lease. Operating lease ROU assets and liabilities are recognized at commencement date based on the present value of lease payments over the lease term. As the vast majority of the leases do not provide an implicit rate, the incremental borrowing rate (FHLB borrowing rate) is used based on the information available at commencement date in determining the present value of lease payments. The implicit rate is used when readily determinable. The operating lease ROU asset is measured at cost, which includes the initial measurement of the lease liability, prepaid rent and initial direct costs incurred by the Company, less incentives received.

Variable costs such as the proportionate share of actual costs for utilities, common area maintenance, property taxes and insurance are not included in the lease liability and are recognized in the period in which they are incurred.

The components of lease expense were as follows:

For the Years Ended December 31,
(in millions)202320222021
Operating lease cost$86 $28 $27 
Total lease cost$86 $28 $27 

(in millions)


For the Twelve
Months Ended
December 31,
2022


For the Twelve
Months Ended
December 31,
2021


Operating lease cost


$

28


$

27


Sublease income


Total lease cost


$

28


$

27


Supplemental cash flow information related to the leases for the following periods:


(in millions)For the Years Ended December 31,
20232022
Cash paid for amounts included in the measurement of lease liabilities:
Operating cash flows from operating leases$64 $28 


(in millions)


For the Twelve
Months Ended
December 31,
2022


For the Twelve
Months Ended
December 31,
2021


Cash paid for amounts included in the measurement of lease liabilities:


Operating cash flows from operating leases


$

28


$

27


113


Supplemental balance sheet information related to the leases for the following periods:


(in millions, except lease term and discount rate)


December 31,
2022


December 31,
2021


Operating Leases:


Operating lease right-of-use assets (1)


$

119


$

249


Operating lease liabilities (2)


$

122


249


Weighted average remaining lease term


6 years


16 years


Weighted average discount rate %


3.85

%


3.05

%

(in millions, except lease term and discount rate)December 31, 2023December 31, 2022
Operating Leases:
Operating lease right-of-use assets (1)
$426 $119 
Operating lease liabilities (2)
$446 $122 
Weighted average remaining lease term11.2 years6 years
Weighted average discount rate percent4.71 %3.85 %
(1)
Included in Other assets in the Consolidated Statements of Condition.
(2)
Included in Other liabilities in the Consolidated Statements of Condition.


(in millions)
December 31, 2023
Maturities of lease liabilities:
202471 
202565 
202658 
202752 
202845 
Thereafter296 
Total lease payments$587 
Less: imputed interest$(141)
Total present value of lease liabilities$446 


Note 9 - Mortgage Servicing Rights
111


(in millions)
Maturities of lease liabilities:


December 31,
2022


2023


$


28


2024


25


2025


24


2026


19


2027


13


Thereafter


28


Total lease payments


137


Less: imputed interest


(15

)

Total present value of lease liabilities


$


122


NOTE 9: MORTGAGE SERVICING RIGHTS

The Company has investments in MSRs that result from the sale of loans to the secondary market for which we retain the servicing. The Company accounts for MSRs at their fair value. A primary risk associated with MSRs is the potential reduction in fair value as a result of higher than anticipated prepayments due to loan refinancing prompted, in part, by declining interest rates or government intervention. Conversely, these assets generally increase in value in a rising interest rate environment to the extent that prepayments are slower than anticipated. The Company utilizes derivatives as economic hedges to offset changes in the fair value of the MSRs resulting from the actual or anticipated changes in prepayments stemming from changing interest rate environments. There is also a risk of valuation decline due to higher than expected default rates, which we do not believe can be effectively managed using derivatives. For further information regarding the derivative instruments utilized to manage our MSR risks, see Note 1415 - Derivative and Hedging Activities.


Changes in the fair value of residential first mortgage MSRs were as follows:

(in millions)

For the MonthYear Ended December 31, 2023

2022

(in millions)

Balance at beginning of period December 1, 2022

$

1,033 

1,012

Additions from loans sold with servicing retained

208 

19

Reductions from sales

(51)

-

Decrease in MSR fair value due to pay-offs, pay-downs, run-off,, model changes, and other (1)

(80)

(8

)

Changes in estimates of fair value due to interest rate risk(1) (2)

1 

10

Fair value of MSRs at end of period

$

1,111 

1,033

(1)
Changes in fair value are included within net return on mortgage servicing rights on the Consolidated Statements of Income and Comprehensive Income.
(2)
Represents estimated MSR value change resulting primarily from market-driven changes which we manage through the use of derivatives.


114


The following table summarizes the hypothetical effect on the fair value of servicing rights using adverse changes of 10 percent and 20 percent to the weighted average of certain significant assumptions used in valuing these assets:


December 31, 2023
Fair Value
(dollars in millions)Actual10% adverse change20% adverse change
Option adjusted spread5.4 %$1,091 $1,072 
Constant prepayment rate7.9 %1,073 1,040 
Weighted average cost to service per loan$69 $1,100 $1,090 


December 31, 2022


Fair value


Actual


10% adverse change


20% adverse change


(dollars in millions)


Option adjusted spread


5.9

%

$


1,012


$


992


Constant prepayment rate


7.9

%


1,000


970


Weighted average cost to service per loan

$

68


1,023


1,013


December 31, 2022
Fair Value
(dollars in millions)Actual10% adverse change20% adverse change
Option adjusted spread5.9 %$1,012 $992 
Constant prepayment rate7.9 %1,000 970 
Weighted average cost to service per loan$68 $1,023 $1,013 

The sensitivity calculations above are hypothetical and should not be considered to be predictive of future performance. Changes in fair value based on adverse changes in assumptions generally cannot be extrapolated because the relationship of the change in

112


assumption to the change in fair value may not be linear. To isolate the effect of the specified change, the fair value shock analysis is consistent with the identified adverse change, while holding all other assumptions constant. In practice, a change in one assumption generally impacts other assumptions, which may either magnify or counteract the effect of the change. For further information on the fair value of MSRs.MSRs

, see Note 18 - Fair Value Measures.


Contractual servicing and subservicing fees, including late fees and other ancillary income are presented below. Contractual servicing fees are included within net return on mortgage servicing rights on the Consolidated Statements of Income and Comprehensive Income. Contractual subservicing fees including late fees and other ancillary income are included within loan administration income on the Consolidated Statements of Income and Comprehensive Income .Income. Subservicing fee income is recorded for fees earned on subserviced loans, net of third-party subservicing costs.

The following table summarizes income and fees associated with owned MSRs:


For the Month Ended December 31,

2022

(in millions)

Net return on mortgage servicing rights

Servicing fees, ancillary income and late fees (1)

$

20

Decrease in MSR fair value due to pay-offs, pay-downs, run-off, model changes and other

(8

)

Changes in fair value due to interest rate risk

10

Loss on MSR derivatives (2)

(16

)

Net transaction costs

-

Total return (loss) included in net return on mortgage servicing rights

$

6

(in millions)Year Ended December 31, 2023Month Ended December 31, 2022
Net return on mortgage servicing rights
Servicing fees, ancillary income and late fees (1)
$227 $20 
Decrease in MSR fair value due to pay-offs, pay-downs, run-off, model changes and other(80)(8)
Changes in fair value due to interest rate risk10 
Gain on MSR derivatives (2)
(47)(16)
Net transaction costs— 
Total return included in net return on mortgage servicing rights$103 $
(1)
Servicing fees are recorded on an accrual basis. Ancillary income and late fees are recorded on a cash basis.
(2)
Changes in the derivatives utilized as economic hedges to offset changes in fair value of the MSRs.

The following table summarizes income and fees associated with our mortgage loans subserviced for others:

For the Month Ended December 31,

2022

(in millions)

Loan administration income on mortgage loans subserviced

Servicing fees, ancillary income and late fees (1)

$

11

Charges on subserviced custodial balances (2)

(8

)

Other servicing charges

-

Total income on mortgage loans subserviced, included in loan administration

$

3

(1)
Servicing fees are recorded on an accrual basis. Ancillary income and late fees are recorded on a cash basis.
(2)Changes in the derivatives utilized as economic hedges to offset changes in fair value of the MSRs.


115


The following table summarizes income and fees associated with our mortgage loans subserviced for others:
(in millions)Year Ended December 31, 2023Year Ended December 31, 2022
Loan administration income on mortgage loans subserviced
Servicing fees, ancillary income and late fees (1)
$154 $11 
Charges on subserviced custodial balances (2)
(168)(8)
Other servicing charges(3)
Total (loss) income on mortgage loans subserviced, included in loan administration income$(17)$
(1)Servicing fees are recorded on an accrual basis. Ancillary income and late fees are recorded on a cash basis.
(2)
Charges on subserviced custodial balances represent interest due to MSR owner.

We also earned approximately $95 million in service fee income for loans being serviced for the FDIC related to the Signature transaction.

NOTE 10: VARIABLE INTEREST ENTITIES

Note 10 - Variable Interest Entities
We have no consolidated VIEs as of December 31, 20222023 and December 31, 2021.

2022.

In connection with our non-qualified mortgage securitization activities, we have retained a five percent interest in the investment securities of certain trusts ("other MBS") and are contracted as the subservicer of the underlying loans, compensated based on market rates, which constitutes a continuing involvement in these trusts. Although we have a variable interest in these securitization trusts, we are not their primary beneficiary due to the relative size of our investment in comparison to the total amount of securities issued by the VIE and our inability to direct activities that most significantly impact the VIE’s economic performance. As a result, we have not consolidated the assets and liabilities of the VIE in our Consolidated Statements of Condition. The Bank’s maximum exposure to loss is limited to our five percent retained interest in the investment securities that had a fair value of $191$180 million as of December 31, 20222023 as well as the standard representations and warranties made in conjunction with the loan transfers.

113


NOTE 11: DEPOSITS

Note 11 - Deposits

The following table sets forth the weighted average interest rates for each type of deposit at December 31, 20222023 and 2021:2022:

December 31,
20232022
(dollars in millions)AmountPercent of TotalWeighted Average Interest RateAmountPercent of TotalWeighted Average Interest Rate
Interest-bearing checking and money market accounts$30,700 37.66 %3.51 %$22,511 38.34 %2.66 %
Savings accounts8,773 10.76 %2.67 %11,645 19.83 %1.30 %
Certificates of deposit21,554 26.44 %4.42 %12,510 21.30 %2.04 %
Non-interest-bearing accounts20,499 25.14 %— %12,055 20.53 %— %
Total deposits$81,526 100.00 %2.79 %$58,721 100.00 %1.71 %


December 31,


2022


2021


(dollars in millions)

Amount


Percent
of Total


Weighted
Average
Interest
Rate


Amount


Percent
of Total


Weighted
Average
Interest
Rate


Interest-bearing checking and money
   market accounts

$

22,511


38.34

%


2.66

%


$

13,209


37.68

%


0.20

%

Savings accounts


11,645


19.83


1.30


8,892


25.36


0.35


Certificates of deposit


12,510


21.30


2.04


8,424


24.03


0.52


Non-interest-bearing accounts


12,055


20.53


4,534


12.93


Total deposits

$

58,721


100.00

%


1.71

%


$

35,059


100.00

%


0.29

%

At December 31, 2023 and 2022, the aggregate amount of time deposit accounts (including certificates of deposit) that meet or exceed the insured limit was $7.9 billion and 2021,$3.7 billion, respectively.

At December 31, 2023 and 2022, the aggregate amount of deposits that had been reclassified as loan balances (i.e., overdrafts) was $4$121 million and $2$4 million, respectively.

116


The scheduled maturities of certificates of deposit at December 31, 20222023 were as follows:


(in millions)

1 year or less

$

17,321 

9,247

More than 1 year through 2 years

3,879 

2,922

More than 2 years through 3 years

229 

298

More than 3 years through 4 years

142 

50

More than 4 years through 5 years

7 

24

Over 5 years

3 

5

Total CDs (1)

$

21,581 

12,546

(1) Excludes PAA.PAA

Included in total deposits at both December 31, 20222023 and 20212022 were brokered deposits of $5.1$9.5 billion and $5.7$5.1 billion with weighted average interest rates of .493.72 percent and .07.49 percent at the respective year-ends. Brokered money market accounts represented $2.8$1.3 billion and $3.0$2.8 billion of the December 31, 20222023 and 20212022 totals, and brokered interest-bearing checking accounts represented $1.0$1.6 billion and $1.5$1.0 billion, respectively. Brokered CDs represented $1.3$6.6 billion and $1.2$1.3 billion of brokered deposits at December 31, 2023 and 2022, and 2021, respectively.

Note 12 - Borrowed Funds

NOTE 12: BORROWED FUNDS

The following table summarizes the Company’s borrowed funds at December 31, 2022 and 2021:funds:


(in millions)December 31, 2023December 31, 2022
Wholesale borrowings:
FHLB advances$19,250 $20,325 
FRB term funding1,000 
Total wholesale borrowings$20,250 $20,325 
Junior subordinated debentures579 575
Subordinated notes438 432
Total borrowed funds$21,267 $21,332 


December 31,


(in millions)


2022


2021


Wholesale borrowings:


FHLB advances


$

20,325


$

15,105


Repurchase agreements


800


Total wholesale borrowings


$

20,325


$

15,905


Junior subordinated debentures


575


361


Subordinated notes


432


296


Total borrowed funds


$

21,332


$

16,562


Accrued interest on borrowed funds is included in “Other liabilities” in the Consolidated Statements of Condition and amounted to $37 $50 million and $18$37 million, respectively, at December 31, 2022 and 2021.2023, December 31, 2022.

114


FHLB Advances

The contractual maturities and the next call dates of FHLB advances outstanding at December 31, 20222023 were as follows:


Contractual Maturity


Earlier of Contractual
Maturity or Next Call Date


(dollars in millions)
Year


Amount


Weighted
Average
Interest
Rate
(1)


Amount


Weighted
Average
Interest
Rate
(1)


2023


$


10,325


3.51


%

$


15,325


3.26


%

2024


1,600


1.36


3,100


2.42


2025


250


3.50


2026


2027


2,650


3.77


1,250


3.87


2028


400


4.11


400


4.11


2029


200


1.61


2030


2031


2032


5,150


2.80


Total FHLB advances


$


20,325


3.19


$


20,325


3.19


Contractual MaturityEarlier of Contractual Maturity or Next Call Date
(dollars in millions) YearAmountWeighted Average Interest Rate (1)AmountWeighted Average Interest Rate (1)
20247,350 4.57 9,100 4.37 
20251,500 5.38 1,750 5.11 
20262,500 5.37 2,500 5.37 
20274,000 4.62 3,500 4.75 
20282,400 5.17 2,400 5.17 
20321,500 3.43 — — 
Total FHLB advances$19,250 $19,250 
(1)
Does not included the effect interest rate swap agreements.

FHLB advances include both straight fixed-rate advances and advances under the FHLB convertible advance program, which gives the FHLB the option of either calling the advance after an initial lock-out period of up to five years and quarterly thereafter until maturity, or a one-time call at the initial call date.

117


At December 31, 20222023 and 2021,2022, respectively, the Bank had unused lines of available credit with the FHLB-NY of up to $11.3$8.4 billion and $8.4$11.3 billion. The Company had $2.8 billion ofdid not have any overnight advances at December 31, 2022,2023 and no overnight advances$2.8 billion at December 31, 2021.2022. During the twelve monthsyear ended December 31, 2023, the average balance of overnight advances amounted to $624 million, with a weighted average interest rate of 5.08 percent. During the year ended December 31, 2022, the average balance of overnight advances amounted to $318$318 million, with a weighted average interest rate of 3.48 percent.

3.48 percent. During the twelve months ended December 31, 2021, the average balances of overnight advances amounted to $6 million, with weighted average interest rates of 0.36 percent.

Total FHLB advances generated interest expense of $251$564 million, $233$251 million and $246$233 million, in the years ended December 31, 2023, 2022, and 2021, and 2020, respectively.

Federal Reserve Bank (FRB) Term Funding Program

At December 31, 2023, the Company had $1.0 billion in outstanding borrowings under the FRB Term Funding program. There were no such borrowings outstanding during the years ended 2022 or 2021.
Repurchase Agreements

The Company had no outstanding repurchase agreements as of December 31, 2023 and 2022. As of December 31, 2021, the company had $

800 million of outstanding repurchase agreements.

The Company had no short-term repurchase agreements outstanding at December 31, 2022 or 2021.

At December 31, 2021, the2023 and 2022.

There was no accrued interest on repurchase agreements amounted to $2 million.at December 31, 2023. The interest expense on repurchase agreements was $14$14 million and $18 million for the yearyears ended December 31, 2022 and $18 million for each of the years ended December 31, 2021, and 2020.respectively.

Federal Funds Purchased

There were no federal funds purchased outstanding at December 31, 2022 or 2021.2023 and December 31, 2022.

In 20222023 and 2021,2022, respectively, the average balances of federal funds purchased were $466$196 million and $81$466 million, with weighted average interest rates of 1.655.01 percent and 0.091.65 percent. The interest expense produced by federal funds purchased was $8$10 million, $0$8 million and $1$0 million for the years ended December 31, 2023, 2022 and 2021, and 2020, respectively.

115


Junior Subordinated Debentures

At December 31, 20222023 and 2021,December 31, 2022, the Company had $608$609 million and $361$608 million, respectively, of outstanding junior subordinated deferrable interest debentures (“junior subordinated debentures”) held by statutory business trusts (the “Trusts”) that issued guaranteed capital securities.

The Trusts are accounted for as unconsolidated subsidiaries, in accordance with GAAP. The proceeds of each issuance were invested in a series of junior subordinated debentures of the Company and the underlying assets of each statutory business trust are the relevant debentures. The Company has fully and unconditionally guaranteed the obligations under each trust’s capital securities, to the extent set forth in a guarantee by the Company to each trust. The Trusts’ capital securities are each subject to mandatory redemption, in whole or in part, upon repayment of the debentures at their stated maturity or earlier redemption.excluding purchase accounting adjustments.


118


The following table presents contractual terms of the junior subordinated debentures outstanding at December 31, 2022:

Issuer

Interest Rate
of Capital
Securities
and
Debentures


Junior
Subordinated
Debentures
Amount
Outstanding


Capital
Securities
Amount
Outstanding


Date of
Original Issue


Stated
Maturity


(dollars in millions)


New York Community Capital Trust V (BONUSES Units) (1)


6.00

%


$


147


$


141


Nov. 4, 2002


Nov. 1, 2051

New York Community Capital Trust X (2)

6.37


124


120


Dec. 14, 2006


Dec. 15, 2036

PennFed Capital Trust III (2)

8.02


31


30


June 2, 2003


June 15, 2033

New York Community Capital Trust XI (2)

6.38


59


58


April 16, 2007


June 30, 2037

Flagstar Statutory Trust II (2)

7.97


26


25


Dec. 26, 2002


Dec. 26, 2032

Flagstar Statutory Trust III (2)

7.33


26


25


Feb. 19, 2003


April 7, 2033

Flagstar Statutory Trust IV (2)

7.98


26


25


Mar. 19, 2003


Mar 19, 2033

Flagstar Statutory Trust V (2)

6.08


26


25


Dec 29, 2004


Jan. 7, 2035

Flagstar Statutory Trust VI (2)

6.08


26


25


Mar. 30, 2005


April 7, 2035

Flagstar Statutory Trust VII (2)

6.52


51


50


Mar. 29, 2005


June 15, 2035

Flagstar Statutory Trust VIII (2)

5.58


25


24


Sept. 22, 2005


Oct. 7, 2035

Flagstar Statutory Trust IX (2)

6.22


25


24


June 28, 2007


Sept. 15, 2037

Flagstar Statutory Trust X (2)

7.27


16


16


Aug. 31, 2007


Sept 15, 2037

Total junior subordinated debentures


$


608


$


588


2023:
IssuerInterest Rate of Capital Securities and Debentures
Junior Subordinated Debentures Amount Outstanding (3)
Capital Securities Amount OutstandingDate of Original IssueStated Maturity
(dollars in millions)
New York Community Capital Trust V (BONUSES Units) (1)6.00$147 $141 Nov. 4, 2002Nov. 1, 2051
New York Community Capital Trust X (2)7.25124 120 Dec. 14, 2006Dec. 15, 2036
PennFed Capital Trust III (2)8.9031 30 June 2, 2003June 15, 2033
New York Community Capital Trust XI (2)7.2459 58 April 16, 2007June 30, 2037
Flagstar Statutory Trust II (2)8.8726 25 Dec. 26, 2002Dec. 26, 2032
Flagstar Statutory Trust III (2)8.9126 25 Feb. 19, 2003April 7, 2033
Flagstar Statutory Trust IV (2)8.8426 25 Mar. 19, 2003Mar 19, 2033
Flagstar Statutory Trust V (2)7.6626 25 Dec 29, 2004Jan. 7, 2035
Flagstar Statutory Trust VI (2)7.6626 25 Mar. 30, 2005April 7, 2035
Flagstar Statutory Trust VII (2)7.4051 50 Mar. 29, 2005June 15, 2035
Flagstar Statutory Trust VIII (2)7.1626 25 Sept. 22, 2005Oct. 7, 2035
Flagstar Statutory Trust IX (2)7.1026 25 June 28, 2007Sept. 15, 2037
Flagstar Statutory Trust X (2)8.1515 15 Aug. 31, 2007Sept 15, 2037
Total junior subordinated debentures (3)
$609 $589 
(1)
Callable subject to certain conditions as described in the prospectus filed with the SEC on November 4, 2002.
(2)
Callable at any time.
(3)Excludes Flagstar Acquisition fair value adjustments of $30 million.

The Bifurcated Option Note Unit SecuritiESSM (“BONUSES units”) included in the preceding table were issued by the Company on November 4, 2002 at a public offering price of $50.00$50.00 per share. Each of the 5,500,000 BONUSES units offered consisted of a capital security issued by New York Community Capital Trust V, a trust formed by the Company, and a warrant to purchase 2.4953 shares of the common stock of the Company (for a total of approximately 13.714 million common shares) at an effective exercise price of $20.04$20.04 per share. Each capital security has a maturity of 49 years,, with a coupon, or distribution rate, of 6.00 percent on the $50.00$50.00 per share liquidation amount. The warrants and capital securities were non-callable for five years from the date of issuance and were not called by the Company when the five-year period passed on November 4, 2007.

The gross proceeds of the BONUSES units totaled $275$275 million and were allocated between the capital security and the warrant comprising such units in proportion to their relative values at the time of issuance. The value assigned to the warrants, $92.4$92.4 million, was recorded as a component of additional “paid-in capital” in the Company’s Consolidated Statements of Condition. The value assigned to the capital security component was $182.6$182.6 million. The $92.4$92.4 million difference between the assigned value and the stated liquidation amount of the capital securities was treated as an original issue discount, and is being amortized to interest expense over the 49-year life of the capital securities on a level-yield basis. At December 31, 2022,2023, this discount totaled $64$64 million.

The other remaining trust preferred securities noted in the preceding table were formed for the purpose of issuing Company Obligated Mandatorily Redeemable Capital Securities of Subsidiary Trusts Holding Solely Junior Subordinated Debentures (collectively, the “Capital Securities”). Dividends on the Capital Securities are payable either quarterly or semi-annually and are deferrable, at the Company’s option, for up to five years. As of December 31, 2022,2023, all dividends were current.

116


Interest expense on junior subordinated debentures was $22$48 million, $18$22 million, and $19$18 million, respectively, for the years ended December 31, 2023, 2022, 2021, and 2020.2021.

119


Subordinated Notes

At December 31, 20222023 and 2021,December 31, 2022, the Company had a total of $432$438 million and $296$432 million subordinated notes outstanding; respectively, of fixed-to-floating rate subordinated notes outstanding:

Date of Original Issue


Stated Maturity


Interest Rate


Original Issue
Amount


(dollars in millions)


November 6, 2018


November 6, 2028 (1)


5.900

%


$

300


October 28, 2020


November 1, 2030 (2)


4.125

%


150


Date of Original IssueStated MaturityInterest RateOriginal Issue Amount
November 6, 2018November 6, 2028 (1)5.900%$300
October 28, 2020November 1, 2030 (2)4.125%$150
(1)
From and including the date of original issuance to, but excluding November 6, 2023, the Notes will bear interest at an initial rate of 5.90 percent per annum payable semi-annually. Unless redeemed, from and including November 6, 2023 to but excluding the maturity date, the interest rate will reset quarterly to an annual interest rate equal to the then-current three-month LIBORSOFR rate plus 278 basis point304.16 basis points payable quarterly.
(2)
From and including the date of original issuance, the Notes will bear interest at a fixed rate of 4.1254.13 percent through October 31, 2025, and a variable rate tied to SOFR thereafter until maturity. The Company has the option to redeem all or a part of the Notes beginning on November 1, 2025, and on any subsequent interest payment date.

The interest expense on subordinated notes amounted to $19 million for the year ended December 31, 2022

Note 13 - Federal, State, and $18 million for the years ended December 31, 2021, and 2020.

Local Taxes

NOTE 13: FEDERAL, STATE, AND LOCAL TAXES

The following table summarizes the components of the Company’s net deferred tax asset (liability) at December 31, 20222023 and 2021:2022

:


December 31,


(in millions)


2022


2021


Deferred Tax Assets:


Allowance for credit losses on loans and leases


$

102


$

55


Acquisition accounting and fair value adjustments on securities (including OTTI)


227


21


Acquisition accounting and fair value adjustments on loans


36


Capitalized loans costs


46


Compensation and related benefit obligations


23


17


Capitalized research and development costs


10


Net operating loss carryforwards


15


1


Other


18


15


Gross deferred tax assets


477


109


Valuation allowance


(5

)


Net deferred tax asset after valuation allowance


$

472


$

109


Deferred Tax Liabilities:


Leases


$

(328

)


$

(360

)

Mortgage servicing rights


(105

)


$


Premises and equipment


(18

)


(5

)

Prepaid pension cost


(29

)


(35

)

Fair value adjustments on loans


(81

)

Amortizable intangibles


(71

)


(3

)

Acquisition accounting and fair value adjustments on deposits


(9

)


Acquisition accounting and fair value adjustments on debt


(10

)


Other


(9

)


(9

)

Gross deferred tax liabilities


$

(579

)


$

(493

)

Net deferred tax liability


$

(107

)


$

(384

)

December 31,
(in millions)20232022
Deferred Tax Assets:
Allowance for credit losses on loans and leases$253 $102 
Acquisition accounting and fair value adjustments on securities (including OTTI)188227 
Acquisition accounting and fair value adjustments on loans36 
Capitalized loan costs46 
Right of Use Liability32— 
Compensation and related benefit obligations3023 
Capitalized research and development costs10 
Accrued Expenses19— 
Net operating loss carryforwards815 
Other2218 
Gross deferred tax assets552 477 
Valuation allowance(5)(5)
Net deferred tax asset after valuation allowance$547 $472 
Deferred Tax Liabilities:
Leases$(492)$(328)
Mortgage servicing rights(79)(105)
Premises and equipment(44)(18)
Prepaid pension cost(35)(29)
Fair value adjustments on loans(210)— 
Amortizable intangibles(127)(71)
Acquisition accounting and fair value adjustments on deposits(2)(9)
Right of Use Asset(32)— 
Deferred Loan fees(13)— 
Acquisition accounting and fair value adjustments on debt(9)(10)
Other(21)(9)
Gross deferred tax liabilities$(1,064)$(579)
Net deferred tax liability$(517)$(107)

117


The deferred tax liability represents the anticipated federal, state, and local tax expenses or benefits that are expected to be realized in future years upon the utilization of the underlying tax attributes comprising said balances. The net deferred tax liability is included in “Other liabilities” in the Consolidated Statements of Condition at December 31, 20222023 and 2021.2022.

120


The Company evaluates the need for a deferred tax asset valuation allowances based on a more likely than not standard. The Company’s evaluation is based on its history of reporting positive taxable income in all relevant tax jurisdictions, the length of time available to utilize the net operating loss carryforwards, and the recognition of taxable income in future periods from taxable temporary differences.

At December 31, 2023 and December 31, 2022, the Company had a state deferred tax asset for net operating losses (“NOL”) of $$8 million and $15 million, 15 million,respectively (net of federal tax impact) which includes total state net operating loss carryforwards of $o303f $185 million at December 31, 2022,2023, that expireexpire if unused in calendar years through 2033.2033. In connection with our ongoing assessment of deferred taxes, we analyzed each state net operating loss separately, determined the amount of net operating loss available and estimated the amount which we expected to expire unused. Based on that assessment, we recorded a valuation allowance of $$5 million at 5December 31, 2023 millionand 2022 to reduce the DTA to the amount which is more likely than not to be realized.

The following table summarizes the Company’s income tax expense for the years ended December 31, 2023, 2022 2021,, and 2020:2021:

December 31,
(in millions)202320222021
Federal – current$156 $147 $188 
State and local – current59 32 35 
Total current215 179 223 
Federal – deferred(137)(10)(28)
State and local – deferred(49)15 
Total deferred(186)(3)(13)
Income tax expense reported in net income29 176 210 
Income tax expense reported in stockholders’ equity related to:
Securities available-for-sale15 (223)(42)
Pension liability adjustments(6)10 
Cash flow hedge(14)23 
Total income taxes$36 $(30)$187 


December 31,


(in millions)


2022


2021


2020


Federal – current


$

147


$

188


$

(148

)

State and local – current


32


35


5


Total current


179


223


(143

)

Federal – deferred


(10

)


(28

)


190


State and local – deferred


7


15


29


Total deferred


(3

)


(13

)


219


Income tax expense reported in net income


176


210


77


Income tax expense reported in stockholders’ equity related to:


Securities available-for-sale


(223

)


(42

)


16


Pension liability adjustments


(6

)


10


Cash flow hedge


23


9


(13

)

Adoption of ASU 2016-13


(4

)

Total income taxes


$

(30

)


$

187


$

76


The following table presents a reconciliation of statutory federal income tax expense (benefit) to combined actual income tax expense (benefit) reported in net income for the years ended December 31, 2023, 2022 2021,, and 2020:


December 31,


(in millions)


2022


2021


2020


Statutory federal income tax at 21%


$

174


$

169


$

123


State and local income taxes, net of federal income tax effect


31


40


27


Effect of tax law changes


(73

)

Non-taxable bargain gain


(33

)


Non-deductible FDIC deposit insurance premiums


10


9


8


Effect of tax deductibility of ESOP


(3

)


(3

)


(3

)

Non-taxable income and expense of BOLI


(7

)


(6

)


(7

)

Non-deductible merger expenses


3


3


Non-deductible compensation expense


4


Federal tax credits


(1

)


(1

)

Adjustments relating to prior tax years


(1

)


(1

)


1


Other, net


(1

)


(1

)


2


Total income tax expense


$

176


$

210


$

77


118


GAAP requires that the impact of tax legislation be recognized in the period in which the law was enacted. The CARES Act was enacted on March 27, 2020 to provide relief related to the COVID-19 pandemic. The CARES Act includes many measures to assist companies including the allowance of net operating losses originating in 2018, 2019 or 2020 to be carried back 2021:

December 31,
(in millions)202320222021
Statutory federal income tax at 21%$(10)$174 $169 
State and local income taxes, net of federal income tax effect31 40 
Tax Exempt income$(6)$— $— 
Non-taxable bargain gain(447)(33)— 
Non-deductible goodwill impairment$509 $— $— 
Non-deductible FDIC deposit insurance premiums16 10 
Effect of tax deductibility of deferred compensation$(3)$(3)$(3)
Non-taxable income and expense of BOLI(9)(7)(6)
Non-deductible merger expenses$— $$
Non-deductible compensation expense— 
Federal tax credits$(31)$(1)$— 
Adjustments relating to prior tax years(1)(1)
Other, net(1)(1)(1)
Total income tax expense$29 $176 $210 
five years
. The Company recorded $68.4 million in tax benefits for the year ended December 31, 2020 relating to the enactment of the CARES Act.

The Company invests in affordable housing projects through limited partnerships that generate federal Low Income Housing Tax Credits. The balances of these investments, which are included in “Other assets” in the Consolidated Statements of Condition, were $372 million304 million and $76$304 million, respectively, at December 31, 20222023 and 2021,2022, and included commitments of $183$210 million and $34$183 million that are expected to be funded over the next 5 years. The Company elected to apply the proportional amortization method to these investments. Recognized in the determination of income tax (benefit) expense from operations for the years ended December 31, 2023, 2022, and 2021 and 2020 were $34 million11 million, $9, $11 million, and $8$9 million, respectively,

121


of affordable housing tax credits and other tax benefits, and an offsetting $10$30 million, $9$10 million, and $6$9 million, respectively, for the amortization of the related investments. No impairment losses were recognized in relation to these investments for the years ended December 31, 2023, 2022, 2021, and 2020.2021.


GAAP prescribes a recognition threshold and measurement attribute for use in connection with the obligation of a company to recognize, measure, present, and disclose in its financial statements uncertain tax positions that the Company has taken or expects to take on a tax return. As of December 31, 2023 and 2022, the Company had $42 million40 and $40 million of unrecognized gross tax benefits.benefits, respectively. Gross tax benefits do not reflect the federal tax effect associated with state tax amounts. The total amount of net unrecognized tax benefits at December 31, 2023 and 2022 that would have affected the effective tax rate, if recognized, was $32 million.$34 million a

nd $32 million, respectively.

Interest and penalties (if any) related to the underpayment of income taxes are classified as a component of income tax expense in the Consolidated Statements of Income and Comprehensive Income. During the years ended December 31, 2023, 2022, 2021, and 2020,2021, the Company recognized income tax expense attributed to interest and penalties of $8 million4 million, $4, $4 million, and $3$4 million, respectively. Accrued interest and penalties on tax liabilities were $26$34 million and $22$26 million, respectively, at December 31, 20222023 and 2021.2022.

The following table summarizes changes in the liability for unrecognized gross tax benefits for the years ended December 31, 2023, 2022 2021,, and 2020:2021

:


December 31,


(in millions)


2022


2021


2020


Uncertain tax positions at beginning of year


$

39


$

38


$

36


Additions for tax positions relating to current-year operations


1


2


1


Additions for tax positions relating to prior tax years


1


1


Subtractions for tax positions relating to prior tax years


(2

)


Uncertain tax positions at end of year


$

40


$

39


$

38


December 31,
(in millions)202320222021
Uncertain tax positions at beginning of year$40 $39 $38 
Additions for tax positions relating to current-year operations
Additions for tax positions relating to prior tax years— 
Subtractions for tax positions relating to prior tax years(1)— (2)
Uncertain tax positions at end of year$42 $40 $39 

The Company and its subsidiaries have filed tax returns in many states. The following are the more significant tax filings that are open for examination:

Federal tax filings for tax years 2019 through the present;
New York State tax filings for tax years 2010 through the present;
New York City tax filings for tax years 2011 through the present; and
New Jersey tax filings for tax years 20152018 through the present.

In addition to other state audits, the Company is currently under examination by the following taxing jurisdictions of significance to the Company:

Federal 2019
Federal 2019-2020
New York State for the tax years 2010 through 2016; and
New York City for the tax years 2011 and 2014.

It is reasonably possible that there will be developments within the next twelve months that would necessitate an adjustment to the balance of unrecognized tax benefits, including decreases of up to $21 million21 million due to completion of tax authorities’ exams and the expiration of statutes of limitations.

119


As a savings institution, theThe Bank is subject to a special federal tax provision regarding its frozen tax bad debt reserve. At December 31, 2022,2023, the Bank’s federal tax bad debt base-year reserve was $62 million62 million,, with a related federal deferred tax liability of $13 $13 million, which has not been recognized since the Bank does not expect that this reserve will become taxable in the foreseeable future. Events that would result in taxation of this reserve include redemptions of the Bank’s stock or certain excess distributions by the Bank to the Company.

NOTE 14. DERIVATIVE AND HEDGING ACTIVITIES


122


Note 14 - Stock-Related Benefits Plans

Stock Based Compensation

At December 31, 2023, the Company had a total of 16,143,893

shares available for grants as restricted stock, options, or other forms of related rights under the 2020 Incentive Plan, which includes the remaining shares available, converted at the merger conversion factor from the legacy Flagstar Bancorp, Inc. 2016 Stock Plan. The Company granted 9,995,495 shares of restricted stock, with an average fair value of $10.24 per share on the date of grant, during the year ended December 31, 2023.


The shares of restricted stock that were granted during the year ended December 31, 2023 and 2022, vest over a one to five years period. Compensation and benefits expense related to the RSAs grants is recognized on a straight-line basis over the vesting period and totaled $44 million, $25 million and $27 million for the years ended December 31, 2023, 2022 and 2021.

The following table provides a summary of activity with regard to restricted stock awards (RSAs):

Year Ended December 31, 2023
Number of SharesWeighted Average Grant Date Fair Value
Unvested at beginning of year9,576,602$10.92 
Granted9,995,49510.24 
Vested(3,105,582)10.99 
Forfeited(1,292,574)10.62 
Unvested at end of period15,173,941$10.49 


As of December 31, 2023, unrecognized compensation cost relating to unvested restricted stock totaled $119 million. This amount will be recognized over a remaining weighted average period of 2.7 years.
The following table provides a summary of activity with regard to Performance-Based Restricted Stock Units ("PSUs") in the year ended December 31, 2023:

Number of
Shares
Weighted
Average
Grant Date
Fair Value
Performance
Period
Expected
Vesting
Date
Outstanding at beginning of year794,984$10.73 
Granted566,6568.95 
Released(143,352)10.34 
Forfeited— 
Outstanding at end of period1,218,2889.95 January 1, 2022 - December 31, 2025March 31, 2023 - 2026

PSUs are subject to adjustment or forfeiture, based upon the achievement by the Company of certain performance standards. Compensation and benefits expense related to PSUs is recognized using the fair value as of the date the units were approved, on a straight-line basis over the vesting period and totaled $4 million, $3 million and $5 million for the for the years ended December 31, 2023, 2022 and 2021. As of December 31, 2023, unrecognized compensation cost relating to unvested restricted stock totaled $5 million. This amount will be recognized over a remaining weighted average period of 1.53 years. As of December 31, 2023, the Company believes it is probable that the performance conditions will be met.

Forfeitures of RSAs and PSUs are accounted for as they occur.
Note 15 - Derivative and Hedging Activities

The Company is exposed to certain risks arising from both its business operations and economic conditions. The Company principally manages its exposure to a wide variety of business and operational risks through management of its core business activities. The Company manages economic risks, including interest rate and liquidity risks, primarily by managing the amount, sources, and duration of its assets and liabilities and, the use of derivative financial instruments. Specifically, the Company enters into derivative financial instruments to manage exposures that arise from business activities that result in the payment of future known and uncertain cash amounts, the value of which are determined by interest rates.

123


Derivative financial instruments are recorded at fair value in other assets and other liabilities on the Consolidated Statements of Condition. The Company's policy is to present our derivative assets and derivative liabilities on the Consolidated Statement of Condition on a gross basis, even when provisions allowing for set-off are in place. However, for derivative contracts cleared through certain central clearing parties, variation margin payments are recognized as settlements. We are exposed to non-performance risk by the counterparties to our various derivative financial instruments. A majority of our derivatives are centrally cleared through a Central Counterparty Clearing House or consist of residential mortgage interest rate lock commitments further limiting our exposure to non-performance risk. We believe that the non-performance risk inherent in our remaining derivative contracts is minimal based on credit standards and the collateral provisions of the derivative agreements.

Derivatives not designated as hedging instruments. The Company maintains a derivative portfolio of interest rate swaps, foreign currency swaps, futures, swaptions and forward commitments used to manage exposure to changes in interest rates and MSR asset values and to meet the needs of customers. The Company also enters into interest rate lock commitments, which are commitments to originate mortgage loans whereby the interest rate on the loan is determined prior to funding and the customers have locked into that interest rate. Market risk on interest rate lock commitments and mortgage LHFS is managed using corresponding forward sale commitments and US Treasury futures. Changes in the fair value of derivatives not designated as hedging instruments are recognized on the Consolidated Statements of Income and Comprehensive Income.


Derivatives designated as hedging instruments.instruments. The Company has designated certain interest rate swaps as cash flow hedges on LIBOR and overnight SOFR-based variable interest payments on federal home loan bank advances. Changes in the fair value of derivatives designated as cash flow hedges are recorded in other comprehensive income on the Consolidated Statements of Condition and reclassified into interest expense in the same period in which the hedgehedged transaction is recognized in earnings. At December 31, 2022,2023, the Company had $52 $10 million (net-of-tax) of unrealized gains on derivatives classified as cash flow hedges recorded in accumulated other comprehensive loss. The Company had $9 $52 million (net-of-tax)(net-of-tax) of unrealized lossesgains on derivatives classified as cash flow hedges recorded in accumulated other comprehensive loss at December 31, 2021.2022.

Derivatives that are designated in hedging relationships are assessed for effectiveness using regression analysis at inception and qualitatively thereafter, unless regression analysis is deemed necessary. All designated hedge relationships were, and are expected to be, highly effective as of December 31, 2022.2023.

Fair Value of Hedges of Interest Rate Risk

The Company is exposed to changes in the fair value of certain of its fixed-rate assets due to changes in interest rates. The Company uses interest rate swaps to manage its exposure to changes in fair value on these instruments attributable to changes in the designated benchmark interest rate. Interest rate swaps designated as fair value hedges involve the payment of fixed-rate amounts to a counterparty in exchange for the Company receiving variable-rate payments over the life of the agreements without the exchange of the underlying notional amount. Such derivatives were used to hedge the changes in fair value of certain of its pools of prepayable fixed rate assets. For derivatives designated and that qualify as fair value hedges, the gain or loss on the derivative as well as the offsetting loss or gain on the hedged item attributable to the hedged risk are recognized in interest income.

The Company had entered into anhas interest rate swapswaps with a notional amountamounts of $2.0$2.0 billion to hedge certain real estate loans. Interestmulti-family loans using the portfolio layer method. For the year ended December 31, 2023, the floating rate received related to the net settlement of these interest rate swaps was greater than the fixed rate payments. As such, interest income from loans and lease receivables decreased by $6 million and $49 million forleases in the twelve months ended December 31,

120


2022 and 2021, respectively, related to a $2.0 billion of interest swaps designated in a fair value relationship related to certain real estate loans which matured in February 2022.

As of December 31, 2022 and 2021, the following amounts were recorded on the balance sheet related to cumulative basis adjustment for fair value hedges.

(in millions)


December 31, 2022


December 31, 2021


Line Item in the Consolidated Statements of
   Condition in which the Hedge Item is Included


Carrying
Amount of
the Hedged
Assets


Cumulative
Amount of
Fair Value
Hedging
Adjustments
Included in
the Carrying
Amount of
the Hedged
Assets


Carrying
Amount of
the Hedged
Assets


Cumulative
Amount of
Fair Value
Hedging
Adjustments
Included in
the Carrying
Amount of
the Hedged
Assets


Total loans and leases, net (1)


$


-


$


-


$


2,025


$


25


(1)
These amounts include the amortized cost basis of closed portfolios used to designate hedging relationships in which the hedged item is the last layer expected to be remaining at the end of the hedging relationship. Since the swap expired in February 2022, at December 31, 2022, the amortized cost basis of the closed portfolios used in these hedging relationships, the cumulative basis adjustments associated with these hedging relationships, and the amount of the designated hedged items, were zero.

The following table sets forth the effect of derivative instruments on theaccompanying Consolidated Statements of Income and Comprehensive Income was increased by $24 million for the periods indicated.year ended December 31, 2023 and decreased by $6 million for the year ended December 31, 2022, respectively.


The fair value basis adjustment on our hedged real estate loans is included in loans and leases held for investment on our Consolidated Statements of Condition. The carrying amount of our hedged loans was $6.1 billion at December 31, 2023

, of which unrealized gains of $9 million were due to the fair value hedge relationship. We have designated $2.0 billion of this portfolio of loans in a hedging relationship as of

(in millions)

For the Twelve
Months Ended
December 31, 2022


For the Twelve
Months Ended
December 31, 2021


Derivative – interest rate swap:


Interest income

$

25


$

48


Hedged item – loans:


Interest income

$

(25

)


$

(48

)

December 31, 2023

121.


124


The following table setstables set forth information regarding the Company’s derivative financial instruments at December 31, 2022.instruments:

December 31, 2023
Fair Value
(in millions)Notional AmountOther AssetsOther LiabilitiesExpiration Dates
Derivatives designated as cash flow hedging instruments:
Interest rate swaps on FHLB advances$5,500 $— $2025-2028
Total5,500 — 
Derivatives designated as fair value hedging instruments:
Interest rate swaps on multi-family loans held for investment$2,000 $— $2025-2027
Derivatives not designated as hedging instruments:
Assets
Mortgage-backed securities forwards$1,012 $11 $— 2024
Rate lock commitments1,490 12 — 2024
Interest rate swaps and swaptions5,431 115 — 2024-2041
Total$7,933 $138 $— 
Liabilities
Futures$2,235 $— $2024
Mortgage-backed securities forwards1,048 $— 32 2024
Rate lock commitments772024
Interest rate swaps and swaptions2,72059 2024-2054
Total derivatives not designated as hedging instruments$6,080 $— $95 

December 31, 2022
Fair Value
(in millions)Notional AmountOther AssetsOther LiabilitiesExpiration Date
Derivatives designated as cash flow hedging instruments:
Interest rate swaps$3,750 $$— 2023-2027
Total3,750 — 
Derivatives not designated as hedging instruments:
Assets
Futures$1,205 $$— 2023
Mortgage-backed securities forwards1,065362023
Rate lock commitments1,53992023
Interest rate swaps and swaptions7,5941822023-2032
Total$11,403 $229 $— 
Liabilities
Mortgage-backed securities forwards$739 $— $61 2023
Rate lock commitments527102023
Interest rate swaps and swaptions2,445652023-2053
Total derivatives not designated as hedging instruments$3,711 $— $136 


December 31, 2022


Fair Value


(in millions)


Notional
Amount


Other
Assets


Other
Liabilities


Derivatives designated as cash flow hedging instruments:


Interest rate swap


$

3,750


$

5


$


Total


$

3,750


$

5


$


Derivatives not designated as hedging instruments:


Assets


Futures


$

1,205


$

2


$


Mortgage-backed securities forwards


1,065


36


Rate lock commitments


1,539


9


Interest rate swaps and swaptions


7,594


182


Total


$

11,403


$

229


$


Liabilities


Mortgage-backed securities forwards


739


61


Rate lock commitments


527


10


Interest rate swaps and swaptions


2,445


65


Total derivatives not designated as hedging instruments


$

3,711


$


$

136


125


The following table presents the derivativederivatives subject to a master netting agreement, including the cash pledged as collateral:


December 31, 2022


Gross Amounts Not Offset in the Statements of Condition


(in millions)


Gross Amount


Gross Amounts Netted in the Statements of Condition


Net Amount Presented in the Statements of Condition


Financial Instruments


Cash Collateral Pledged (Received)


Derivatives designated hedging instruments:


Interest rate swaps on FHLB advances (1)


$

5


$


$

5


$

4


$

27


Derivatives not designated as hedging instruments:


Assets


Mortgage-backed securities forwards


$

36


$


$

36


$


$

(9

)

Interest rate swaptions


182


182


(36

)

Futures


2


2


1


Total derivative assets


$

220


$


$

220


$


$

(44

)

Liabilities


Mortgage-backed securities forwards


$

61


$


$

61


$


$

54


Interest rate swaps (2)


65


65


29


Total derivative liabilities


$

126


$


$

126


$


$

83


December 31, 2023
Gross Amounts Not Offset in the Statements of Condition
(in millions)Gross AmountGross Amounts Netted in the Statements of ConditionNet Amount Presented in the Statements of ConditionFinancial InstrumentsCash Collateral Pledged (Received)
Derivatives designated hedging instruments:
Interest rate swaps on FHLB advances$$— $$— $75 
Interest rate swaps on multi-family loans held for investment(1)
$$— $$— $27 
Derivatives not designated as hedging instruments:
Assets
Mortgage-backed securities forwards$11 $— $11 $— $(1)
Interest rate swaptions115 — 115 — (34)
Total derivative assets$126 $— $126 $— $(35)
Liabilities
Futures$$— $$— $
Mortgage-backed securities forwards32 — 32 — 57 
Interest rate swaps (1)
59 — 59 — 42 
Total derivative liabilities$92 $— $92 $— $102 
(1) Notional value of cash flow hedging instruments at December 31, 2021 $2.3 billion. Securities pledged at December 31, 2021 was $9 million.

(2) Variation margin pledged to, or received from, a Central Counterparty Clearing House to cover the prior days fair value of open positions is considered settlement of the derivative position for accounting purposes.


The following table presents the derivatives subject to a master netting agreement, including the cash pledged as collateral:
122


December 31, 2022
Gross Amounts Not Offset in the Statements of Condition
(in millions)Gross AmountGross Amounts Netted in the Statements of ConditionNet Amount Presented in the Statements of ConditionFinancial InstrumentsCash Collateral Pledged (Received)
Derivatives designated hedging instruments:
Interest rate swaps on FHLB advances$$— $$$27 
Derivatives not designated as hedging instruments:
Assets
Mortgage-backed securities forwards$36 $— $36 $— $(9)
Interest rate swaptions182 — 182 — (36)
Futures
Total derivative assets$220 $— $220 $— $(44)
Liabilities
Mortgage-backed securities forwards$61 $— $61 $— $54 
Interest rate swaps (1)
65 — 65 — 29 
Total derivative liabilities$126 $— $126 $— $83 
(1)

Variation margin pledged to, or received from, a Central Counterparty Clearing House to cover the prior days fair value of open positions is considered settlement of the derivative position for accounting purposes.


Cash Flow Hedges of Interest Rate Risk

The Company’s objectives in using interest rate derivatives are to add stability to interest expense and to manage its exposure to interest rate movements. Interest rate swaps designated as cash flow hedges involve the receipt of amounts subject to variability caused by changes in interest rates from a counterparty in exchange for the Company making fixed-rate payments over the life of the agreements without exchange of the underlying notional amount. Changes in the fair value of derivatives designated and that qualify as cash flow hedges are initially recorded in other comprehensive income and are subsequently reclassified into earnings in the period that the hedged transaction affects income.earnings.


126


Interest rate swaps with notional amounts totaling $3.8$5.5 billion and $2.3$3.8 billion as of December 31, 20222023 and December 31, 2021,2022, were designated as cash flow hedges of certain FHLB borrowings.

The following table presents the effect of the Company’s cash flow derivative instruments on AOCL for the year ending December 31, 2022 and 2021:AOCL:


For the Years Ended December 31,
(in millions)202320222021
Amount of gain (loss) recognized in AOCL$$88 $
Amount of reclassified from AOCL to interest expense$(65)$(4)$25 

(in millions)


For the Twelve
Months Ended
December 31, 2022


For the Twelve
Months Ended
December 31, 2021


Amount of gain recognized in AOCL


$

88


$

8


Amount of reclassified from AOCL to interest expense


(4

)


25


Amounts reported in AOCL related to derivatives will be reclassified to interest expense as interest payments are made on the Company’s variable-rate borrowings. During the next twelve months, the Company estimates that an additional $51interest expense reduction of $98 million willis expected to be reclassified to interest expense.out of AOCL.

Derivatives not Designated as Hedging Instruments

The following table presents the net gain (loss) recognized in income on derivativederivatives not designated as hedging instruments, net of the impact of offsetting positions:


For the Twelve
Months Ended
December 31, 2022


For the Twelve
Months Ended
December 31, 2021


(dollars in millions)


Derivatives not designated as hedging instruments

Location of Gain (Loss)


Futures

Net return on mortgage servicing rights

$

(1

)

$


Interest rate swaps and swaptions

Net return on mortgage servicing rights


(11

)


Mortgage-backed securities forwards

Net return on mortgage servicing rights


(4

)


Rate lock commitments and US Treasury futures

Net gain on loan sales


28


Forward commitments

Other noninterest income


(1

)


Interest rate swaps (1)

Other noninterest income


Total derivative (loss) gain


$

11


$


For the Years Ended December 31,
(dollars in millions)20232022
Derivatives not designated as hedging instrumentsLocation of Gain (Loss)
FuturesNet return on mortgage servicing rights$$(1)
Interest rate swaps and swaptionsNet return on mortgage servicing rights(34)(11)
Mortgage-backed securities forwardsNet return on mortgage servicing rights(15)(4)
Rate lock commitments and US Treasury futuresNet gain on loan sales28 
Forward commitmentsOther noninterest income— (1)
Interest rate swaps (1)
Other non-interest income(1)— 
Total derivative (loss) gain$(47)$11 
(1) Includes customer-initiated commercial interest rate swaps.


Note 16 - Intangible Assets

Goodwill

We record goodwill in our consolidated statements of condition in connection with certain of our business combinations. Goodwill, which is tested at least annually for impairment, refers to the difference between the purchase price and the fair value of an acquired company’s assets, net of the liabilities assumed. As of December 31, 2023, the Company identified a triggering event and applied a market approach using the end of day stock price. We evaluated those conditions known and knowable by the company and how a market participant would view the control premium as confirmed by the subsequent confirming market evidence. This adjusted market capitalization was then compared to the carrying value to determine the extent of the shortfall which was calculated to be in excess of the goodwill balance. The Company’s assessment concluded that goodwill from historical transactions (2007 and prior) was fully impaired as of December 31, 2023. As a result, the Company recorded an impairment charge of the entire goodwill balance of $2.4 billion.

Goodwill and related changes in the carrying amount during the year ended December 31, 2023 are as follows:

(in millions)Gross Carrying Amount
Balance at December 31, 2022$2,426 
Impairment(2,426)
Balance at December 31, 2023$— 


127


Finite-lived Intangible Assets

NOTE 15: COMMITMENTS AND CONTINGENCIES
As a result of the Signature Transaction, the Company recorded $464 million of core deposit intangible and other intangible assets that are amortizable.

At December 31, 2023, intangible assets consisted of the following:

December 31, 2023December 31, 2022
(in millions)Gross Carrying AmountAccumulated AmortizationNet Carrying ValueGross Carrying AmountAccumulated AmortizationNet Carrying Value
Core deposit intangible$700 $(113)$587 $250 $(4)$246 
Other intangible assets56(18)3842(1)41
Total other intangible assets$756 $(131)$625 $292 $(5)$287 

As of December 31, 2023 the weighted average amortization period for core deposit intangible and other intangible assets is 10 years and 5.1 years, respectively.

The estimated amortization expense of CDI and other intangible assets for the next five years is as follows:

(in millions)Amortization Expense
2024$132 
2025107 
202694 
202781 
202868 
Total$482 

Note 17 - Capital

The Bank is subject to regulation, examination, and supervision by the OCC and the Federal Reserve (the “Regulators”). The Bank is also governed by numerous federal and state laws and regulations, including the FDIC Improvement Act of 1991, which established five categories of capital adequacy ranging from “well capitalized” to “critically undercapitalized.” Such classifications are used by the FDIC to determine various matters, including prompt corrective action and each institution’s FDIC deposit insurance premium assessments. Capital amounts and classifications are also subject to the Regulators’ qualitative judgments about the components of capital and risk weightings, among other factors.

The quantitative measures established to ensure capital adequacy require that banks maintain minimum amounts and ratios of leverage capital to average assets and of common equity tier 1 capital, tier 1 capital, and total capital to risk-weighted assets (as such measures are defined in the regulations). At December 31, 2023, our capital measures continued to exceed the minimum federal requirements for a bank holding company and for a bank. The following tables sets forth our common equity tier 1, tier 1 risk-based, total risk-based, and leverage capital amounts and ratios on a consolidated basis and for the Bank on a stand-alone basis, as well as the respective minimum regulatory capital requirements, at that date:

The following table presents the actual capital amounts and ratios for the Company:

Risk-Based Capital
December 31, 2023Common Equity Tier 1Tier 1TotalLeverage Capital
(dollars in millions)AmountRatioAmountRatioAmountRatioAmountRatio
Total capital$8,009 9.05 %$8,512 9.62 %$10,415 11.77 %$8,512 7.75 %
Minimum for capital adequacy purposes3,983 4.50 5,310 6.00 7,081 8.00 4,392 4.00 
Excess$4,026 4.55 %$3,202 3.62 %$3,334 3.77 %$4,120 3.75 %
December 31, 2022
Total capital$6,335 9.06 %$6,838 9.78 %$8,154 11.66 %$6,838 9.70 %
Minimum for capital adequacy purposes3,146 4.50 4,195 6.00 5,593 8.00 2,819 4.00 
Excess$3,189 4.56 %$2,643 3.78 %$2,561 3.66 %$4,019 5.70 %

128


The following table presents the actual capital amounts and ratios for the Bank:

Risk-Based Capital
December 31, 2023Common Equity Tier 1Tier 1TotalLeverage Capital
(dollars in millions)AmountRatioAmountRatioAmountRatioAmountRatio
Total capital$9,305 10.52 %$9,305 10.52 %$10,271 11.61 %$9,305 8.48 %
Minimum for capital adequacy purposes3,980 4.50 5,307 6.00 7,076 8.00 4,389 4.00 
Excess$5,325 6.02 %$3,998 4.52 %$3,195 3.61 %$4,916 4.48 %
December 31, 2022
Total capital$7,653 10.96 %$7,653 10.96 %$7,982 11.43 %$7,653 10.87 %
Minimum for capital adequacy purposes3,142 4.50 4,189 6.00 5,585 8.00 2,817 4.00 
Excess$4,511 6.46 %$3,464 4.96 %$2,397 3.43 %$4,836 6.87 %

At December 31, 2023, our total risk-based capital ratio exceeded the minimum requirement for capital adequacy purposes by 377 basis points and the fully phased-in capital conservation buffer by 127 basis points.

The Bank also exceeded the minimum capital requirements to be categorized as “Well Capitalized.” To be categorized as well capitalized, a bank must maintain a minimum common equity tier 1 ratio of 6.50 percent; a minimum tier 1 risk-based capital ratio of 8 percent; a minimum total risk-based capital ratio of 10 percent; and a minimum leverage capital ratio of 5 percent.

Preferred Stock

On March 17, 2017, the Company issued 20,600,000 depositary shares, each representing a 1/40th interest in a share of the Company’s Fixed-to-Floating Rate Series A Noncumulative Perpetual Preferred Stock, par value $0.01 per share, with a liquidation preference of $1.00 per share (equivalent to $25 per depositary share). Dividends will accrue on the depositary shares at a fixed rate equal to 6.375 percent per annum until March 17, 2027, and a floating rate equal to Three-month LIBOR plus 382.1 basis points per annum beginning on March 17, 2027. Dividends will be payable in arrears on March 17, June 17, September 17, and December 17 of each year, which commenced on June 17, 2017.
Treasury Stock Repurchases

On October 23, 2018, the Board of Directors approved the repurchase of up to $300 million of the Company’s outstanding common stock. As of December 31, 2023, the Company has repurchased a total of 30 million shares at an average price of $9.61 or an aggregate purchase of $286 million. The Company had no repurchases during 2023. During the year ended December 31, 2022, the Company repurchased 871,710 shares, at a cost of $8 million.

Note 18 - Fair Value Measures

GAAP sets forth a definition of fair value, establishes a consistent framework for measuring fair value, and requires disclosure for each major asset and liability category measured at fair value on either a recurring or non-recurring basis. GAAP also clarifies that fair value is an “exit” price, representing the amount that would be received when selling an asset, or paid when transferring a liability, in an orderly transaction between market participants. Fair value is thus a market-based measurement that should be determined based on assumptions that market participants would use in pricing an asset or liability. As a basis for considering such assumptions, GAAP establishes a three-tier fair value hierarchy, which prioritizes the inputs used in measuring fair value as follows:

Level 1 – Inputs to the valuation methodology are quoted prices (unadjusted) for identical assets or liabilities in active markets.
Level 2 – Inputs to the valuation methodology include quoted prices for similar assets and liabilities in active markets, and inputs that are observable for the asset or liability, either directly or indirectly, for substantially the full term of the financial instrument.
Level 3 – Inputs to the valuation methodology are significant unobservable inputs that reflect a company’s own assumptions about the assumptions that market participants use in pricing an asset or liability.


129


A financial instrument’s categorization within this valuation hierarchy is based upon the lowest level of input that is significant to the fair value measurement.
The following tables present assets and liabilities that were measured at fair value on a recurring basis as of December 31, 2023 and December 31, 2022, and that were included in the Company’s Consolidated Statements of Condition at those dates:

December 31, 2023
(in millions)Quoted Prices in Active Markets for Identical Assets
(Level 1)
Significant Other Observable Inputs
(Level 2)
Significant Unobservable Inputs
(Level 3)
Netting AdjustmentsTotal Fair Value
Assets:
Mortgage-related Debt Securities Available for Sale:
GSE certificates$— $1,221 $— $— $1,221 
GSE CMOs— 5,162 — — 5,162 
Private Label CMOs— 148 32 — 180 
Total mortgage-related debt securities$— $6,531 $32 $— $6,563 
Other Debt Securities Available for Sale:
U. S. Treasury obligations$198 $— $— $— $198 
GSE debentures— 1,609 — — 1,609 
Asset-backed securities— 302 — — 302 
Municipal bonds— — — 
Corporate bonds— 343 — — 343 
Foreign notes— 34 — — 34 
Capital trust notes— 90 — — 90 
Total other debt securities$198 $2,384 $— $— $2,582 
Total debt securities available for sale$198 $8,915 $32 $— $9,145 
Equity securities:
Mutual funds and common stock— 14 — — 14 
Total equity securities— 14 — — 14 
Total securities$198 $8,929 $32 $— $9,159 
Loans held-for-sale
Residential first mortgage loans$— $770 $— $— $770 
Acquisition, development, and construction— 123 — — 123 
Commercial and industrial loans— — — — 
Derivative assets
Interest rate swaps and swaptions— 115 — — 115 
Futures— — — — — 
Rate lock commitments (fallout-adjusted)— — 12 — 12 
Mortgage-backed securities forwards— 11 — — 11 
Mortgage servicing rights— — 1,111 — 1,111 
Total assets at fair value$198 $9,957 $1,155 $— $11,310 
Derivative liabilities
Mortgage-backed securities forwards— 32 — — 32 
Futures— — — 
Interest rate swaps and swaptions— 59 — — 59 
Rate lock commitments (fallout-adjusted)— — — 
Total liabilities at fair value$— $92 $$— $95 


130


December 31, 2022
(in millions)Quoted Prices in Active Markets for Identical Assets
(Level 1)
Significant Other Observable Inputs
(Level 2)
Significant Unobservable Inputs
(Level 3)
Netting AdjustmentsTotal Fair Value
Assets:
Mortgage-related Debt Securities Available for Sale:
GSE certificates$— $1,297 $— $— $1,297 
GSE CMOs3,3013,301
Private Label CMOs191191
Total mortgage-related debt securities$— $4,789 $— $— $4,789 
Other Debt Securities Available for Sale:
U. S. Treasury obligations$1,487 $— $— $— $1,487 
GSE debentures1,3981,398
Asset-backed securities361361
Municipal bonds3030
Corporate bonds885885
Foreign notes2020
Capital trust notes9090
Total other debt securities$1,487 $2,784 $— $— $4,271 
Total debt securities available for sale$1,487 $7,573 $— $— $9,060 
Equity securities:
Mutual funds and common stock1414
Total equity securities1414
Total securities$1,487 $7,587 $— $— $9,074 
Loans held-for-sale
Residential first mortgage loans$— $1,115 $— $— $1,115 
Derivative assets
Interest rate swaps and swaptions— 182 — — 182 
Futures— — — 
Rate lock commitments (fallout-adjusted)— — — 
Mortgage-backed securities forwards— 36 — — 36 
Mortgage servicing rights— — 1,033 — 1,033 
Total assets at fair value$1,487 $8,922 $1,042 $— $11,451 
Derivative liabilities
Mortgage-backed securities forwards— 61 — — 61 
Interest rate swaps and swaptions— 65 — — 65 
Rate lock commitments (fallout-adjusted)— — 10 — 10 
Total liabilities at fair value$— $126 $10 $— $136 

The Company reviews and updates the fair value hierarchy classifications for its assets on a quarterly basis. Changes from one quarter to the next that are related to the observability of inputs for a fair value measurement may result in a reclassification from one hierarchy level to another.

A description of the methods and significant assumptions utilized in estimating the fair values of securities follows:

Where quoted prices are available in an active market, securities are classified within Level 1 of the valuation hierarchy. Level 1 securities include highly liquid government securities and exchange-traded securities.

If quoted market prices are not available for a specific security, then fair values are estimated by using pricing models. These pricing models primarily use market-based or independently sourced market parameters as inputs, including, but not limited to, yield curves, interest rates, equity or debt prices, and credit spreads. In addition to observable market information, models incorporate transaction details such as maturity and cash flow assumptions. Securities valued in this manner would generally be classified within Level 2 of the valuation hierarchy, and primarily include such instruments as mortgage-related and corporate debt securities.

131


Periodically, the Company uses fair values supplied by independent pricing services to corroborate the fair values derived from the pricing models. In addition, the Company reviews the fair values supplied by independent pricing services, as well as their underlying pricing methodologies, for reasonableness. The Company challenges pricing service valuations that appear to be unusual or unexpected.

While the Company believes its valuation methods are appropriate, and consistent with those of other market participants, the use of different methodologies or assumptions to determine the fair values of certain financial instruments could result in different estimates of fair values at a reporting date.

Fair Value Measurements Using Significant Unobservable Inputs

The following tables include a roll forward of the Consolidated Statements of Condition amounts (including the change in fair value) for financial instruments classified by us within Level 3 of the valuation hierarchy:

(dollars in millions)Balance at Beginning of YearTotal Gains / (Losses) Recorded in Earnings (1)Purchases / OriginationsSalesSettlementTransfers In (Out)Balance at End of Year
Year Ended December 31, 2023
Assets
Mortgage servicing rights (1)
$1,033 $(79)$208 $(51)$1,111 
Private Label CMOs— — — — — 32 32 
Rate lock commitments (net) (1)(2)
(1)(49)104 — — (45)
Totals$1,032 $(128)$312 $(51)$— $(13)$1,152 
(1)We utilized swaptions, futures, forward agency and loan sales and interest rate swaps to manage the risk associated with mortgage servicing rights and rate lock commitments. Gains and losses for individual lines do not reflect the effect of our risk management activities related to such Level 3 instruments.
(2)Rate lock commitments are reported on a fallout-adjusted basis. Transfers out of Level 3 represent the settlement value of the commitments that are transferred to LHFS, which are classified as Level 2 assets.

The following tables present the quantitative information about recurring Level 3 fair value financial instruments and the fair value measurements as of December 31, 2023:

Fair ValueValuation Technique
Unobservable Input (1)
Range
(Weighted Average)
(dollars in millions)
Assets
Mortgage servicing rights$1,111Discounted cash flowsOption adjusted spread5.0% - 21.7% 5.4%
Constant prepayment rate0.0% - 10.0% 7.9%
Weighted average cost to service per loan$65.0 - $90.0 $69.0
Private Label CMOs$32Discounted cash flowsConstant default rates0.10% - 0.30%
Weighted average life8.2 - 11.8
Rate lock commitments (net)$9Consensus pricingOrigination pull-through rate64.30%
(1)Unobservable inputs were weighted by their relative fair value of the instruments.

132


Assets Measured at Fair Value on a Non-Recurring Basis

Certain assets are measured at fair value on a non-recurring basis. Such instruments are subject to fair value adjustments under certain circumstances (e.g., when there is evidence of impairment). The following tables present assets that were measured at fair value on a non-recurring basis as of December 31, 2023 and December 31, 2022, and that were included in the Company’s Consolidated Statements of Condition at those dates:

Fair Value Measurements at December 31, 2023 Using
(in millions)Quoted Prices in Active Markets for Identical Assets (Level 1)Significant Other Observable Inputs (Level 2)Significant Unobservable Inputs (Level 3)Total Fair Value
Certain impaired loans (1)
$— $— $197 $197 
Other assets(2)
— — 50 50 
Total$— $— $247 $247 
(1)Represents the fair value of impaired loans, based on the value of the collateral.
(2)Represents the fair value of repossessed assets, based on the appraised value of the collateral subsequent to its initial classification as repossessed assets and equity securities without readily determinable fair values. These equity securities are classified as Level 3 due to the infrequency of the observable prices and/or the restrictions on the shares.

Fair Value Measurements at December 31, 2022 Using
(in millions)Quoted Prices in Active Markets for Identical Assets (Level 1)Significant Other Observable Inputs (Level 2)Significant Unobservable Inputs (Level 3)Total Fair Value
Certain impaired loans (1)
$— $— $28 $28 
Other assets(2)
— — 41 41 
Total$— $— $69 $69 
(1)Represents the fair value of impaired loans, based on the value of the collateral.
(2)Represents the fair value of repossessed assets, based on the appraised value of the collateral subsequent to its initial classification as repossessed assets and equity securities without readily determinable fair values. These equity securities are classified as Level 3 due to the infrequency of the observable prices and/or the restrictions on the shares.


The fair values of collateral-dependent impaired loans are determined using various valuation techniques, including consideration of appraised values and other pertinent real estate and other market data.

Other Fair Value Disclosures

For the disclosure of fair value information about the Company’s on- and off-balance sheet financial instruments, when available, quoted market prices are used as the measure of fair value. In cases where quoted market prices are not available, fair values are based on present-value estimates or other valuation techniques. Such fair values are significantly affected by the assumptions used, the timing of future cash flows, and the discount rate.

Because assumptions are inherently subjective in nature, estimated fair values cannot be substantiated by comparison to independent market quotes. Furthermore, in many cases, the estimated fair values provided would not necessarily be realized in an immediate sale or settlement of such instruments.

133


The following tables summarize the carrying values, estimated fair values, and fair value measurement levels of financial instruments that were not carried at fair value on the Company’s Consolidated Statements of Condition at December 31, 2023 and December 31, 2022:

December 31, 2023
Fair Value Measurement Using
(in millions)Carrying ValueEstimated Fair ValueQuoted Prices in Active Markets for Identical Assets (Level 1)Significant Other Observable Inputs (Level 2)Significant Unobservable Inputs (Level 3)
Financial Assets:
Cash and cash equivalents$11,475 $11,475 $11,475 $— $— 
FHLB and FRB stock (1)
$1,392 $1,392 $— $1,392 $— 
Loans and leases held for investment, net$83,627 $79,333 $— $— $79,333 
Financial Liabilities:
Deposits$81,526 $81,247 $59,972 (2)$21,275 (3)$— 
Borrowed funds$21,267 $21,082 $— $21,082 $— 
(1)Carrying value and estimated fair value are at cost.
(2)Interest-bearing checking and money market accounts, savings accounts, and non-interest-bearing accounts.
(3)Certificates of deposit.

December 31, 2022
Fair Value Measurement Using
(in millions)Carrying ValueEstimated Fair ValueQuoted Prices in Active Markets for Identical Assets (Level 1)Significant Other Observable Inputs (Level 2)Significant Unobservable Inputs (Level 3)
Financial Assets:
Cash and cash equivalents$2,032 $2,032 $2,032 $— $— 
FHLB and FRB stock (1)
$1,267 $1,267 $— $1,267 $— 
Loans and leases held for investment, net$68,608 $65,673 $— $— $65,673 
Financial Liabilities:
Deposits$58,721 $58,479 $46,211 (2)$12,268 (3)$— 
Borrowed funds$21,332 $21,231 $— $21,231 — 
(1)Carrying value and estimated fair value are at cost.
(2)Interest-bearing checking and money market accounts, savings accounts, and non-interest-bearing accounts.
(3)Certificates of deposit.

The methods and significant assumptions used to estimate fair values for the Company’s financial instruments follow:

Cash and Cash Equivalents

Cash and cash equivalents include cash and due from banks and federal funds sold. The estimated fair values of cash and cash equivalents are assumed to equal their carrying values, as these financial instruments are either due on demand or have short-term maturities.

Securities

If quoted market prices are not available for a specific security, then fair values are estimated by using pricing models, quoted prices of securities with similar characteristics, or discounted cash flows. These pricing models primarily use market-based or independently sourced market parameters as inputs, including, but not limited to, yield curves, interest rates, equity or debt prices, and credit spreads. In addition to observable market information, pricing models also incorporate transaction details such as maturities and cash flow assumptions.

Federal Home Loan Bank Stock

Ownership in equity securities of the FHLB is generally restricted and there is no established liquid market for their resale. The carrying amount approximates the fair value.

134


Loans and leases

The Company discloses the fair value of loans measured at amortized cost using an exit price notion. The Company determined the fair value on substantially all of its loans for disclosure purposes, on an individual loan basis. The discount rates reflect current market rates for loans with similar terms to borrowers having similar credit quality on an exit price basis. For those loans where a discounted cash flow technique was not considered reliable, the Company used a quoted market price for each individual loan.

MSRs

The significant unobservable inputs used in the fair value measurement of the MSRs are option adjusted spreads, prepayment rates and cost to service. Significant increases (decreases) in all three assumptions in isolation result in a significantly lower (higher) fair value measurement. Weighted average life (in years) is used to determine the change in fair value of MSRs. For December 31, 2023, the weighted average life (in years) for the entire portfolio was 6.83.

Rate lock commitments

The significant unobservable input used in the fair value measurement of the rate lock commitments is the pull through rate. The pull through rate is a statistical analysis of our actual rate lock fallout history to determine the sensitivity of the residential mortgage loan pipeline compared to interest rate changes and other deterministic values. New market prices are applied based on updated loan characteristics and new fallout ratios (i.e. the inverse of the pull through rate) are applied accordingly. Significant increases (decreases) in the pull through rate in isolation result in a significantly higher (lower) fair value measurement.

Deposits

The fair values of deposit liabilities with no stated maturity (i.e., interest-bearing checking and money market accounts, savings accounts, and non-interest-bearing accounts) are equal to the carrying amounts payable on demand. The fair values of CDs represent contractual cash flows, discounted using interest rates currently offered on deposits with similar characteristics and remaining maturities. These estimated fair values do not include the intangible value of core deposit relationships, which comprise a portion of the Company’s deposit base.

Borrowed Funds

The estimated fair value of borrowed funds is based either on bid quotations received from securities dealers or the discounted value of contractual cash flows with interest rates currently in effect for borrowed funds with similar maturities and structures.
Off-Balance Sheet Financial Instruments
The fair values of commitments to extend credit and unadvanced lines of credit are estimated based on an analysis of the interest rates and fees currently charged to enter into similar transactions, considering the remaining terms of the commitments and the creditworthiness of the potential borrowers. The estimated fair values of such off-balance sheet financial instruments were insignificant at December 31, 2023 and December 31, 2022.

Fair Value Option

We elected the fair value option for certain items as discussed throughout the Notes to the Consolidated Financial Statements to more closely align the accounting method with the underlying economic exposure. Interest income on LHFS is accrued on the principal outstanding primarily using the "simple-interest" method.
The following table reflects the change in fair value included in earnings of financial instruments for which the fair value option has been elected:
For the Years Ended December 31,
(dollars in millions)20232022
Assets
Loans held-for-sale
Net gain on loan sales$43 $

135


The following table reflects the difference between the aggregate fair value and aggregate remaining contractual principal balance outstanding for assets and liabilities for which the fair value option has been elected:

December 31, 2023
(dollars in millions)Unpaid Principal BalanceFair ValueFair Value Over / (Under) UPB
Assets:
Nonaccrual loans:
Loans held-for-sale$$$— 
Total non-accrual loans$$$— 
Other performing loans:
Loans held-for-sale$869 $894 $25 
Total other performing loans$869 $894 $25 
Total loans:
Loans held-for-sale$871 $896 $25 
Total loans$871 $896 $25 

December 31, 2022
(dollars in millions)Unpaid Principal BalanceFair ValueFair Value Over / (Under) UPB
Assets:
Other performing loans:
Loans held-for-sale$1,095 $1,115 $20 
Total other performing loans$1,095 $1,115 $20 
Total loans:
Loans held-for-sale$1,095 $1,115 $20 
Total loans$1,095 $1,115 $20 

Note 19 - Commitments and Contingencies

Pledged Assets

The Company pledges securities to serve as collateral for its repurchase agreements, among other purposes. AtWe had pledged investment securities of $2.8 billion and $434 million at December 31, 2022, the Company had pledged available for sale mortgage-related securities2023 and other debt securities with carrying values of $430 million and $4 million, respectively. At December 31, 2021, the Company had pledged available for sale mortgage-related securities and other debt securities with carrying values of $704 million and $464 million,2022, respectively. In addition, the Company had $44.5$43.1 billion and $33.9$44.5 billion of loans pledged to the FHLB-NY to serve as collateral for its wholesale borrowings at the respective year-ends.

123


Loan Commitments and Letters of Credit

At December 31, 2022 and 2021,

In the Company hadnormal course of business, we have various commitments to originate loans, including unused linesoutstanding which are not included on our Consolidated Statements of credit, of $21.8 billion and $2.8 billion, respectively.Financial Condition. The majority of the outstanding loan commitments at those dates were expected to close within 90 days. In addition, the Company had commitments to originate letters of credit totaling $

541 million and $291 million at December 31, 2022 and 2021.

The following table summarizes the Company’s off-balance sheet commitments to originate loans and letters of credit at December 31, 2022:credit:


December 31,
(in millions)20232022
Multi-family and commercial real estate$52 $216 
One-to-four family including interest rate locks1,694 2,066 
Acquisition, development, and construction3,926 3,539 
Warehouse loan commitments7,074 8,042 
Other loan commitments11,315 7,964 
Total loan commitments$24,061 $21,827 
Commercial, performance stand-by, and financial stand-by letters of credit915 541 
Total commitments$24,976 $22,368 

136


(in millions)

Multi-family and commercial real estate

$

216

One-to-four family including interest rate locks

2,066

Acquisition, development, and construction

3,539

Warehouse loan commitments

8,042

Other loan commitments

7,964

Total loan commitments

$

21,827

Commercial, performance stand-by, and financial stand-by letters of credit

541

Total commitments

$

22,368


Financial Guarantees

The Company provides guarantees and indemnifications to its customers to enable them to complete a variety of business transactions and to enhance their credit standings. These guarantees are recorded at their respective fair values in “Other liabilities” in the Consolidated Statements of Condition. The Company deems the fair value of the guarantees to equal the consideration received.

The following table summarizes the Company’s guarantees and indemnifications at December 31, 2022:2023:
(in millions)Expires Within One YearExpires After One YearTotal Outstanding AmountMaximum Potential Amount of Future Payments
Financial stand-by letters of credit$254 $288 $542 $639 
Performance stand-by letters of credit100 102 102 
Commercial letters of credit— 174 
Total letters of credit$357 $290 $647 $915 

(in millions)


Expires Within
One Year


Expires After
One Year


Total
Outstanding
Amount


Maximum
Potential
Amount of
Future Payments


Financial stand-by letters of credit


$


79


$


85


$


164


$


398


Performance stand-by letters of credit


108


11


119


118


Commercial letters of credit


10


1


11


25


Total letters of credit


$


197


$


97


$


294


$


541


The maximum potential amount of future payments represents the notional amounts that could be funded under the guarantees and indemnifications if there were a total default by the guaranteed parties or if indemnification provisions were triggered, as applicable, without consideration of possible recoveries under recourse provisions or from collateral held or pledged.

The Company collects fees upon the issuance of commercial and stand-by letters of credit. Stand-by letters of credit fees are initially recorded by the Company as a liability and are recognized as income periodically through the respective expiration dates. Fees for commercial letters of credit are collected and recognized as income at the time that they are issued and upon payment of each set of documents presented. In addition, the Company requires adequate collateral, typically in the form of cash, real property, and/or personal guarantees upon its issuance of irrevocable stand-by letters of credit. Commercial letters of credit are primarily secured by the goods being purchased in the underlying transaction and are also personally guaranteed by the owner(s) of the applicant company.

At December 31, 2022,2023, the Company had no commitments to purchase securities.

Legal Proceedings

The Company is involved in various legal actions arising in the ordinary course of its business.business, including stockholder class and derivative actions. All such actions in the aggregate involve amounts that are believed by management to be immaterial to the financial condition and results of operations of the Company.

124


NOTE 16: INTANGIBLE ASSETS

Goodwill The outcome of any pending litigation is presumeduncertain. There can be no assurance (i) that we will not incur material losses due to damages, penalties, costs and/or expenses as a result of such litigation, (ii) that the reserves we have an indefinite useful lifeestablished will be sufficient to cover such losses, or (iii) that such losses will not materially exceed such reserves and is tested for impairment athave a material impact on our financial condition or results of operations. The Company may incur significant legal expenses in defending the reporting unit level, at least once a year. There was no change in goodwilllitigation described above during the year ended December 31, 2022.

At December 31, 2022,pendency of these matters, and in connection with any other intangible assets consisted of the following:

(in millions)

Gross Carrying Amount


Accumulated Amortization


Net Carrying Value


Core deposit intangible

$


250


$


(4

)


$


246


Other intangible assets


42


(1

)


41


Total other intangible assets

$


292


$


(5

)


$


287


The estimated amortization expense of CDI and other intangible assetspotential cases, including expenses for the next five years is as follows:potential reimbursement of legal fees of officers and directors under indemnification obligations.


(in millions)

Amortization Expense


2023

$


59


2024


54


2025


38


2026


33


2027


29


Total

$


213


137


Note 20 - Employee Benefits

NOTE 17: EMPLOYEE BENEFITS

Retirement Plan

The New York Community Bancorp, Inc. Retirement Plan (the “Retirement Plan”) covers substantially all employees who had attained minimum age, service, and employment status requirements prior to the date when the individual plans were frozen by the banks of origin. Once frozen, the individual plans ceased to accrue additional benefits, service, and compensation factors, and became closed to employees who would otherwise have met eligibility requirements after the “freeze” date.

125


The following table sets forth certain information regarding the Retirement Plan as of the dates indicated:

December 31,
(in millions)20232022
Change in Benefit Obligation:
Benefit obligation at beginning of year$116 $158 
Interest cost
Actuarial gain(38)
Annuity payments(7)(7)
Settlements(1)(1)
Benefit obligation at end of year$115 $116 
Change in Plan Assets:
Fair value of assets at beginning of year$228 $283 
Actual return (loss) on plan assets33 (47)
Annuity payments(7)(7)
Settlements(1)(1)
Fair value of assets at end of year$253 $228 
Funded status (included in “Other assets”)$138 $112 
Changes recognized in other comprehensive income for the year ended December 31:
Amortization of actuarial loss$(7)$(2)
Net actuarial (gain) loss arising during the year(18)26 
Total recognized in other comprehensive income for the year (pre-tax)$(25)$24 
Accumulated other comprehensive loss (pre-tax) not yet recognized in net periodic benefit cost at December 31:
Actuarial loss, net$41 $66 
Total accumulated other comprehensive loss (pre-tax)$41 $66 


December 31,


(in millions)

2022


2021


Change in Benefit Obligation:


Benefit obligation at beginning of year

$

158


$

172


Interest cost


4


4


Actuarial gain


(38

)


(9

)

Annuity payments


(7

)


(6

)

Settlements


(1

)


(3

)

Benefit obligation at end of year

$

116


$

158


Change in Plan Assets:


Fair value of assets at beginning of year

$

283


$

261


Actual return (loss) on plan assets


(47

)


31


Annuity payments


(7

)


(6

)

Settlements


(1

)


(3

)

Fair value of assets at end of year

$

228


$

283


Funded status (included in “Other assets”)

$

112


$

125


Changes recognized in other comprehensive income for the year ended
   December 31:


Amortization of actuarial loss


(2

)


(7

)

Net actuarial (gain) loss arising during the year


26


(23

)

Total recognized in other comprehensive income for the year (pre-tax)

$

24


$

(30

)

Accumulated other comprehensive loss (pre-tax) not yet recognized
   in net periodic benefit cost at December 31:


Actuarial loss, net


66


43


Total accumulated other comprehensive loss (pre-tax)

$

66


$

43


In 2023, an estimated $72024 $3 million of unrecognized net actuarial loss for the Retirement Plan will be amortized from AOCL into net periodic benefit cost.cost, respectively. The comparable amount recognized as net periodic benefit costactuarial loss for the Retirement Plan in 20222023 was $2 million. No$7 million and no prior service cost was amortized in 2022 or 2021.2022. The discount rates used to determine the benefit obligation at December 31, 2023 and 2022 and 2021 were 4.94.7 percent and 2.64.9 percent, respectively.

The discount rate reflects rates at which the benefit obligation could be effectively settled. To determine this rate, the Company considers rates of return on high-quality fixed-income investments that are currently available and are expected to be available during the period until the pension benefits are paid. The expected future payments are discounted based on a portfolio of high-quality rated bonds (AA or better) for which the Company relies on the Financial Times Stock Exchange (“FTSE”) Pension Liability Index that is published as of the measurement date.

The components of net periodic pension (credit) expense were as follows for the years indicated:

Years Ended December 31,
(in millions)202320222021
Components of net periodic pension expense (credit):
Interest cost$$$
Expected return on plan assets(14)(16)(16)
Amortization of net actuarial loss
Net periodic pension credit$(2)$(10)$(5)


Years Ended December 31,


(in millions)


2022


2021


2020


Components of net periodic pension expense (credit):


Interest cost


$

4


$

4


$

5


Expected return on plan assets


(16

)


(16

)


(15

)

Amortization of net actuarial loss


2


7


7


Net periodic pension credit


$

(10

)


$

(5

)


$

(3

)

138


126


The following table indicates the weighted average assumptions used in determining the net periodic benefit cost for the years indicated:


Years Ended December 31,
202320222021
Discount rate4.9 %2.6 %2.2 %
Expected rate of return on plan assets6.3 6.0 6.3 


Years Ended December 31,


2022


2021


2020


Discount rate


2.6

%


2.2

%


3.0

%

Expected rate of return on plan assets


6.0


6.3


6.5


As of December 31, 2022, Retirement Plan assets were invested in two diversified investment portfolios of the Pentegra Retirement Trust (the “Trust”), a private placement investment fund.

The Company (in this context, the “Plan Sponsor”) chooses the specific asset allocationprimary long-term objective for the Retirement Plan within the parameters set forth in the Trust’s Investment Policy Statement. The long-term investment objectives areis to maintain the Retirement Plan’s assets at a level that will sufficiently cover future beneficiary obligations. A secondary long-term objective is to achieve long-term growth in assets. The Plan will be structured to include a volatility reducing component (the fixed income commitment) and a growth component (the equity commitment).

To achieve the Companies (in this context, the "Plan Sponsor") long-term investment objectives, the Trustee will invest the assets of the Plan Sponsor’sin a diversified combination of asset classes, investment strategies, and pooled vehicles. The asset allocation guidelines in the table below reflect the plan sponsor’s risk tolerance and long-term obligations,objectives for the Plan. These parameters will be reviewed on a regular basis and subject to generate a returnchange following discussions between the plan sponsor and the Trustee.

Initially, the following asset allocation targets and ranges will guide the Trustee in structuring the overall allocation in the Plan’s investment portfolio. The plan sponsor or the Trustee may amend these allocations to reflect the most appropriate standards consistent with changing circumstances. Any such fundamental amendments in strategy will be discussed between the
plan sponsor and the Trustee prior to implementation.

Based on those assets thatthe above considerations, the following asset allocation ranges will meet or exceedbe implemented:
Asset Allocation Parameters by Asset Class
EquityMinimumTargetMaximum
U.S. Large-Cap27%
U.S. Mid-Cap7%
U.S. Small-Cap7%
Non-U.S.14%
Total - Equity45%55%65%
Total - Fixed Income/Cash Equivalents35%45%55%

The parameters for each asset class provide the rate at whichTrustee with the latitude for managing the Plan Sponsor’s long-term obligationswithin a minimum and maximum range. The Trustee will grow.

have full discretion to buy, sell, invest and reinvest in these asset segments based on these guidelines which includes allowing the underlying investments to fluctuate within the stated policy ranges. The Retirement Plan allocates its assets in accordance with the following targets:

To hold 55 percent of its assets in equity securities via investment in the Trust’s Long-Term Growth—Equity (“LTGE”) Portfolio, a diversified portfolio that invests in a number of actively and passively managed equity mutual funds and collective trusts in order to gain exposure to both U.S. and non-U.S. equity markets;
To hold 44 percent of its assets in intermediate-term investment-grade bonds via investment in the Long-Term Growth—Fixed Income (“LTGFI”) Portfolio, a diversified portfolio that invests in a number of fixed-income mutual funds and collective investment trusts, primarily including intermediate-term bond funds with a focus on U.S. investment grade securities and opportunistic allocations to below-investment grade and non-U.S. investments; and
To hold 1 percent inwill maintain a cash equivalents portfoliocomponent (not to exceed 3 percent under normal circumstances) within the fixed income allocation for liquidity purposes.

In addition,

The Trustee will monitor the Retirement Plan holds Company shares, the value of which is approximately equal to 11 percentactual asset segment exposures of the Plan on a regular basis and, periodically, may adjust the asset allocation within the ranges set forth above as it deems appropriate. Periodic reallocation of assets that are held bywill be based on the Trust.

The LTGE and LTGFI portfolios are designed to provide long-term growth of equity and fixed-income assets with the objective of achieving an investment return in excessTrustee’s perception of the cost of funding the active life, deferred vesting, and all 30-year term and longer obligations of retired lives in the Trust. Risk and volatility are further managed in accordance with the distinct investment objectiveschanging risk/return opportunities of the Trust’s respective portfolios.asset classes.


139

127


The following table presents information about the fair value measurements of the investments held by the Retirement Plan as of December 31, 2022:2023:


(in millions)

Total


Quoted Prices
in Active
Markets for
Identical
Assets
(Level 1)


Significant Other
Observable Inputs
(Level 2)


Significant
Unobservable
Inputs
(Level 3)


Equity:


Large-cap value (1)

$


23


$


$


23


$


Large-cap growth (2)


17


17


Large-cap core (3)


13


13


Mid-cap value (4)


5


5


Mid-cap growth (5)


4


4


Mid-cap core (6)


5


5


Small-cap value (7)


3


3


Small-cap growth (8)


6


6


Small-cap core (9)


4


4


International equity (10)


30


30


Fixed Income Funds:


Fixed Income – U.S. Core (11)


65


65


Intermediate duration (12)


22


22


Equity Securities:


Company common stock


26


26


Cash Equivalents:


Money market *


5


1


4


$


228


$


27


$


201


$


* Includes cash equivalent investments in equity and fixed income strategies.

(in millions)TotalQuoted Prices in Active Markets for Identical Assets (Level 1)Significant Other Observable Inputs (Level 2)Significant Unobservable Inputs (Level 3)
Equity:
  Large-cap value (1)
$12 $12 $— $— 
  Large-cap growth (2)
22 22 — — 
  Large-cap core (3)
17 17 — — 
  Mid-cap core (4)
15 15 — — 
  Small-cap core (5)
16 16 — — 
  International growth (6)
18 18 — — 
  International value (7)
10 10 — — 
Fixed Income Funds:
  Intermediate - Core Plus (8)
98 98 — — 
Equity Securities:
  Company common stock31 31 — — 
Common/Collective Trusts-Equity:
  Large cap value (9)
13 — 13 — 
Cash Equivalents:
  Money market (10)
— 
$253 $240 $13 $— 
(1)This category consists of a mutual fund holding 100-160 stocks, designed to track and outperform the Russell 1000 Value Index.
(2)This category consists of two mutual funds which invest primarily in large-cap U.S. - based growth companies, one concentrating on long-term capital growth, the other in long-term capital appreciation and current income.
(3)This category contains large-cap stocks with above-average yield. The portfolio typically holds between 60 and 70 stocks.
(2)
This category seeks long-term capital appreciation by investing primarily in large growth companies based in the U.S.
(3)
This fund tracks the performance of the S&P 500 Index by purchasing the securities represented in the IndexIndex. The stocks are maintained in approximately the same weightings as the Index.
index.
(4)
This category employs an indexing investment approach designed to track the performancecontains stocks of the CRSP US Mid-Cap Value Index.
U.S. Mid Cap Index, a broadly diversified index of stocks of medium-size U.S. companies. The stocks are maintained.
(5)
This category employs an indexing investment approach designed to track the performance of the CRSP US Mid-Cap Growth Index.
(6)
This category seeks long-term capital appreciation through investment primarily in common stock of small-capitalization companies, with similar risk levels and characteristics to track the performance of the S&P Midcap 400Russell 2000 Index.
(7)(6)
This category consists of a selection of investments based onwith long-term growth potential located primarily in Europe, the Russell 2000 Value Index.Pacific Basin, and other developed and emerging markets.
(8)(7)
This category consists of a mutual fund invested in small cap growth companies along with a fund invested in a selection of investments based on the Russell 2000 Growth Index.
(9)
This category consists of a mutual fund investing in readily marketable securities of U.S. companies with market capitalizations within the smallest 10 percent of the market universe, or smaller than the 1000th largest US company.
(10)
This category invests primarily in medium to large well-established non-US companies in developed and emerging markets.companies. Under normal circumstances, at least 80 percent of total assets will be invested in equity securities, including common stocks, preferred stocks, and convertible securities.

128


(11)(8)
This category currently includes equal investments in threefour mutual funds, two of which usually hold at least 80 percent of fund assets in investment grade fixed income securities, seeking to outperform the Bloomberg Barclays USU.S. Aggregate Bond IndexIndex. Two of the funds hold at least 80 percent in investment grade fixed-income securities while maintaining a similar duration to that index. The thirdone other holds at least 65 percent; the fourth fund targets investments of 50 percent or more in mortgage-backed securities guaranteed by the US government and its agencies.
(12)(9)This category contains large-cap stocks with above-average yield. The portfolio typically holds between 60 and 70 stocks.
(10)This category consists of a mutualmoney market fund which invest in a diversified portfolio of high-quality bonds and other fixed income securities, including U.S. Government obligations, mortgage-related and asset backed securities, corporate and municipal bonds, CMOs, and other securities mostly rated A or better.is used for liquidity purposes.

Current Asset Allocation

The asset allocations for the Retirement Plan were as follows:
December 31,
20232022
Equity securities61 %60 %
Debt securities39 %38 %
Cash equivalents— %%
Total100 %100 %


At December 31,


2022


2021


Equity securities


60

%


62

%

Debt securities


38


36


Cash equivalents


2


2


Total


100

%


100

%

Determination of Long-Term Rate of Return

The long-term rate of return on Retirement Plan assets assumption was based on historical returns earned by equities and fixed income securities, and adjusted to reflect expectations of future returns as applied to the Retirement Plan’s target allocation of asset classes. Equities and fixed income securities were assumed to earn long-term rates of return in the ranges of 6 percent to 8 percent and 3 percent to 5 percent, respectively, with an assumed long-term inflation rate of 2.5 percent reflected within these ranges. When these overall return expectations are applied to the Retirement Plan’s target allocations, the result is an expected rate of return of 5 percent to 7 percent.

7
140

percent.

Expected Contributions

The Company does not expect to contribute to the Retirement Plan in 2022.

2023.

Expected Future Annuity Payments

The following annuity payments, which reflect expected future service, as appropriate, are expected to be paid by the Retirement Plan during the years indicated:

(in millions)
2024$
2025
2026
2027
2028
2029 and thereafter43 
Total$83 

(in millions)


2023

$


8


2024


8


2025


8


2026


8


2027


8


2028 and thereafter


42


Total

$


82


Qualified Savings Plan (401(k) Plan)

The Company maintains a defined contribution qualified savings plan in the form of a 401(k) plan in which all salaried employees are able to participate after one month of service and having attained age 21. The Company instituted a safe harbor matching contribution program during the year ended December 31, 2020, and accordingly, the Company matches a portion of employee 401(k) plan contributions. Such expense totaled $7$21 million and $6$7 million for the twelve monthsyear ended December 31, 20222023 and 2021,2022, respectively. Flagstar also maintains a defined contribution qualified savings plan in the form of a 401(k) plan in which certain employees are able to participate.

129


Post-Retirement Health and Welfare Benefits

The Company offers certain post-retirement benefits, including medical, dental, and life insurance (the “Health & Welfare Plan”) to retired employees, depending on age and years of service at the time of retirement. The costs of such benefits are accrued during the years that an employee renders the necessary service.

The Health & Welfare Plan is an unfunded plan and is not expected to hold assets for investment at any time. Any contributions made to the Health & Welfare Plan are used to immediately pay plan premiums and claims as they come due.

141


The following table sets forth certain information regarding the Health & Welfare Plan as of the dates indicated:


December 31,
(in millions)20232022
Change in benefit obligation:
Benefit obligation at beginning of year$$10 
Interest cost— 
Actuarial gain(2)
Premiums and claims paid(1)(1)
Benefit obligation at end of year$$
Change in plan assets:
Fair value of assets at beginning of year$— $— 
Employer contribution
Premiums and claims paid(1)(1)
Fair value of assets at end of year$— $— 
Funded status (included in “Other liabilities”)$(8)$(7)
Changes recognized in other comprehensive income for the year ended December 31:
Amortization of prior service cost— 
Amortization of actuarial gain— 
Net actuarial (gain) loss arising during the year(2)
Total recognized in other comprehensive income for the year (pre-tax)$$(2)
Accumulated other comprehensive (gain) loss (pre-tax) not yet recognized in net periodic benefit cost at December 31:
Prior service cost— 
Actuarial (gain) loss, net(1)(2)
Total accumulated other comprehensive income (pre-tax)$(1)$(2)


December 31,


(in millions)


2022


2021


Change in benefit obligation:


Benefit obligation at beginning of year


$


10


$

12


Interest cost


Actuarial gain


(2

)


(2

)

Premiums and claims paid


(1

)


Benefit obligation at end of year


$


7


10


Change in plan assets:


Fair value of assets at beginning of year


$


$


Employer contribution


1


Premiums and claims paid


(1

)


Fair value of assets at end of year


$


$


Funded status (included in “Other liabilities”)


$


(7

)


(10

)

Changes recognized in other comprehensive income for
   the year ended December 31:


Amortization of prior service cost


$


$


Amortization of actuarial gain


Net actuarial (gain) loss arising during the year


(2

)


(2

)

Total recognized in other comprehensive income for the year (pre-tax)


$


(2

)


$

(2

)

Accumulated other comprehensive (gain) loss (pre-tax) not yet recognized
   in net periodic benefit cost at December 31:


Prior service cost


$


$


Actuarial (gain) loss, net


(2

)


Total accumulated other comprehensive income (pre-tax)


$


(2

)


The discount rates used in the preceding table were 4.6 percent at December 31, 2023 and 4.8 percent at December 31, 2022 and 2022.2.3 percent at December 31, 2021.

The estimated net actuarial loss and the prior service liability that will be amortized from AOCL into net periodic benefit cost in 20232024 are $0 and $0,less than $1 million, respectively.

The net periodic benefit costs and all components thereof for the years-ended December 2022, 202131, 2023 and 20202022 were less than $1$1 million.


The following table presents the weighted average assumptions used in determining the net periodic benefit cost for the years indicated:

Years Ended December 31,
202320222021
Discount rate4.8%2.3%2.0%
Current medical trend rate6.56.56.5
Ultimate trend rate5.05.05.0
Year when ultimate trend rate will be reached202920282027


Years Ended December 31,


2022


2021


2020


Discount rate


2.3


%


2.0


%


2.9

%

Current medical trend rate


6.5


6.5


6.5


Ultimate trend rate


5.0


5.0


5.0


Year when ultimate trend rate will be reached


2028


2027


2026


130


Expected Contributions

The Company expects to contribute $1$1 million to the Health & Welfare Plan to pay premiums and claims in the fiscal year ending December 31, 2022.2023.


142


Expected Future Payments for Premiums and Claims

The following amounts are currently expected to be paid for premiums and claims during the years indicated under the Health & Welfare Plan:

(in millions)


2023

$


1


2024


1


2025


1


2026


1


2027


1


2028 and thereafter


2


Total

$


7


NOTE 18: STOCK-RELATED BENEFIT PLANS

Stock Based Compensation

At December 31, 2022, the Company had a total of 9,799,865 shares available for grants as restricted stock, options, or other forms of related rights under the 2020 Incentive Plan, which includes the remaining shares available, converted at the merger conversion factor from the legacy Flagstar Bancorp, Inc. 2016 Stock Plan. The Company granted 3,710,689 shares of restricted stock, with an average fair value of $11.23 per share on the date of grant, during the twelve months ended December 31, 2022.

During the years ended December 31, 2021 and 2020, the Company granted 3,131,949 shares and 2,421,345 shares, respectively, of restricted stock, which had average fair values of $11.20 and $11.61 per share on the respective grant dates. Compensation and benefits expense related to the restricted stock grants is recognized on a straight-line basis over the vesting period and totaled $25 million, $27 million, and $28 million, respectively, for the years ended December 31, 2022, 2021, and 2020.

The following table provides a summary of activity with regard to restricted stock awards:


For the Year Ended
December 31, 2022


Number of Shares


Weighted
Average
Grant Date
Fair Value


Unvested at beginning of year


6,950,335


$

11.68


Granted


3,710,689


11.23


Assumed in business acquisition (1)


1,904,025


9.35


Vested


(2,374,209

)


12.21


Forfeited


(614,238

)


11.56


Unvested at end of year


9,576,602


10.92


(1) Weighted-average per share represents the fair value per share on the acquisition date.


As of December 31, 2022, unrecognized compensation cost relating to unvested restricted stock totaled $74 million. This amount will be recognized over a remaining weighted average period of 2.5 years.

The following table provides a summary of activity with regard to Performance-Based Restricted Stock Units ("PSUs") in the twelve months ended December 31, 2022:

131


Number of
Shares


Weighted
Average
Grant Date
Fair Value


Performance
Period


Expected
Vesting
Date

Outstanding at beginning of year


834,612


$

11.44


Granted


473,211


10.09


Released


(176,090

)


11.42


Forfeited


(336,749

)


11.43


Outstanding at end of period


794,984


11.43


January 1, 2022 - December 31, 2024


March 31, 2023 - 2025

PSUs are subject to adjustment or forfeiture, based upon the achievement by the Company of certain performance standards. Compensation and benefits expense related to PSUs is recognized using the fair value as of the date the units were approved, on a straight-line basis over the vesting period and totaled $3 million, $5 million and $1 million for the twelve months ended December 31, 2022, 2021, and 2020, respectively. As of December 31, 2022, unrecognized compensation cost relating to unvested restricted stock totaled $4 million. This amount will be recognized over a remaining weighted average period of 1.6 years. As of December 31, 2022, the Company believes it is probable that the performance conditions will be met.

New York Community Bank Employee Stock Ownership Plan

On December 6, 2021, the ESOP was terminated with the assets in the ESOP merged into the employee’s 401(k) plan. After the merger of the ESOP into the 401(k) plan, the Company allocated $4 million into eligible participant’s accounts. For of the years ended December 31, 2021 and 2020, the Company recorded expense of $4 million.

Supplemental Executive Retirement Plan

The Bank had established a Supplemental Executive Retirement Plan (“SERP”), which provided additional unfunded, non-qualified benefits to certain participants in the ESOP in the form of Company common stock. The SERP was frozen in 1999 and subsequently fully distributed during the year ended December 31, 2022. Trust-held assets, consisting entirely of Company common stock, amounted to 1,006,186 at December 31, 2021, including shares purchased through dividend reinvestment. The cost of these shares was reflected as a reduction of paid-in capital in excess of par in the Consolidated Statements of Condition.

132


NOTE 19: FAIR VALUE MEASUREMENTS

GAAP sets forth a definition of fair value, establishes a consistent framework for measuring fair value, and requires disclosure for each major asset and liability category measured at fair value on either a recurring or non-recurring basis. GAAP also clarifies that fair value is an “exit” price, representing the amount that would be received when selling an asset, or paid when transferring a liability, in an orderly transaction between market participants. Fair value is thus a market-based measurement that should be determined based on assumptions that market participants would use in pricing an asset or liability. As a basis for considering such assumptions, GAAP establishes a three-tier fair value hierarchy, which prioritizes the inputs used in measuring fair value as follows:

Level 1 – Inputs to the valuation methodology are quoted prices (unadjusted) for identical assets or liabilities in active markets.

Level 2 – Inputs to the valuation methodology include quoted prices for similar assets and liabilities in active markets, and inputs that are observable for the asset or liability, either directly or indirectly, for substantially the full term of the financial instrument.
(in millions)
2024$
2025
2026
2027
2028
2029 and thereafter
Total$

Level 3 – Inputs to the valuation methodology are significant unobservable inputs that reflect a company’s own assumptions about the assumptions that market participants use in pricing an asset or liability.

A financial instrument’s categorization within this valuation hierarchy is based upon the lowest level of input that is significant to the fair value measurement.

133


The following tables present assets and liabilities that were measured at fair value on a recurring basis as of December 31, 2022 and 2021, and that were included in the Company’s Consolidated Statements of Condition at those dates:


Fair Value Measurements at December 31, 2022


(in millions)

Quoted
Prices in
Active
Markets for
Identical
Assets
(Level 1)


Significant
Other
Observable
Inputs
(Level 2)


Significant
Unobservable
Inputs
(Level 3)


Netting
Adjustments


Total
Fair
Value


Assets:


Mortgage-related Debt Securities
   Available for Sale:


GSE certificates

$


$

1,297


$


$


$

1,297


GSE CMOs


3,301


3,301


Private Label CMOs


191


191


Total mortgage-related debt securities

$


$

4,789


$


$


$

4,789


Other Debt Securities Available for Sale:


U. S. Treasury obligations

$

1,487


$


$


$


$

1,487


GSE debentures


1,398


1,398


Asset-backed securities


361


361


Municipal bonds


30


30


Corporate bonds


885


885


Foreign notes


20


20


Capital trust notes


90


90


Total other debt securities

$

1,487


$

2,784


$


$


$

4,271


Total debt securities available for sale

$

1,487


$

7,573


$


$


$

9,060


Equity securities:


Mutual funds and common stock


14


14


Total equity securities

$


$

14


$


$


$

14


Total securities

$

1,487


$

7,587


$


$


$

9,074


Loans held-for-sale


Residential first mortgage loans

$


$

1,115


$


$


$

1,115


Derivative assets


Interest rate swaps and swaptions


182


182


Futures


2


2


Rate lock commitments (fallout-adjusted)


9


9


Mortgage-backed securities forwards


36


36


Mortgage servicing rights


1,033


1,033


Total assets at fair value

$

1,487


$

8,922


$

1,042


$


$

11,451


Derivative liabilities


Mortgage-backed securities forwards


61


61


Interest rate swaps and swaptions


65


65


Rate lock commitments (fallout-adjusted)


10


10


Total liabilities at fair value

$


$

126


$

10


$


$

136


134


Fair Value Measurements at December 31, 2021


(in millions)

Quoted
Prices
in Active
Markets for
Identical
Assets
(Level 1)


Significant
Other
Observable
Inputs
(Level 2)


Significant
Unobservable
Inputs
(Level 3)


Netting
Adjustments


Total
Fair Value


Assets:


Mortgage-Related Debt Securities
   Available for Sale:


GSE certificates

$


$

1,107


$


$


$

1,107


GSE CMOs


1,683


1,683


Total mortgage-related debt securities

$


$

2,790


$


$


$

2,790


Other Debt Securities Available
   for Sale:


U.S. Treasury obligations

$

45


$


$


$


$

45


GSE debentures


1,480


1,480


Asset-backed securities


479


479


Municipal bonds


25


25


Corporate bonds


838


838


Foreign notes


26


26


Capital trust notes


97


97


Total other debt securities

$

45


$

2,945


$


$


$

2,990


Total debt securities available for sale

$

45


$

5,735


$


$


$

5,780


Equity securities:


Mutual funds and common stock


16


16


Total equity securities

$


$

16


$


$


$

16


Total securities

$

45


$

5,751


$


$


$

5,796


The Company reviews and updates the fair value hierarchy classifications for its assets on a quarterly basis. Changes from one quarter to the next that are related to the observability of inputs for a fair value measurement may result in a reclassification from one hierarchy level to another.

A description of the methods and significant assumptions utilized in estimating the fair values of securities follows:

Where quoted prices are available in an active market, securities are classified within Level 1 of the valuation hierarchy. Level 1 securities include highly liquid government securities and exchange-traded securities.

If quoted market prices are not available for a specific security, then fair values are estimated by using pricing models. These pricing models primarily use market-based or independently sourced market parameters as inputs, including, but not limited to, yield curves, interest rates, equity or debt prices, and credit spreads. In addition to observable market information, models incorporate transaction details such as maturity and cash flow assumptions. Securities valued in this manner would generally be classified within Level 2 of the valuation hierarchy, and primarily include such instruments as mortgage-related and corporate debt securities.

Periodically, the Company uses fair values supplied by independent pricing services to corroborate the fair values derived from the pricing models. In addition, the Company reviews the fair values supplied by independent pricing services, as well as their underlying pricing methodologies, for reasonableness. The Company challenges pricing service valuations that appear to be unusual or unexpected.

135


While the Company believes its valuation methods are appropriate, and consistent with those of other market participants, the use of different methodologies or assumptions to determine the fair values of certain financial instruments could result in different estimates of fair values at a reporting date.

Fair Value Measurements Using Significant Unobservable Inputs

The following tables include a roll forward of the Consolidated Statements of Condition amounts (including the change in fair value) for financial instruments classified by us within Level 3 of the valuation hierarchy:


Balance at Beginning of Year


Total Gains / (Losses) Recorded in Earnings (1)


Purchases / Originations


Sales


Settlement


Transfers In (Out)


Balance at End of Year


(dollars in millions)


Year-Ended December 31, 2022


Assets


Mortgage servicing rights (1)

$

1,012


$

2


$

19


$

1,033


Rate lock commitments (net) (1)(2)


21


(12

)


5


(15

)


(1

)

Totals

$

1,033


$

(10

)

$

24


$


$


$

(15

)

$

1,032


1.
We utilized swaptions, futures, forward agency and loan sales and interest rate swaps to manage the risk associated with mortgage servicing rights and rate lock commitments. Gains and losses for individual lines do not reflect the effect of our risk management activities related to such Level 3 instruments.
Note 21 - Parent Company-Only Financial Information
2.
Rate lock commitments are reported on a fallout-adjusted basis. Transfers out of Level 3 represent the settlement value of the commitments that are transferred to LHFS, which are classified as Level 2 assets.

The following tables present the quantitative information about recurring Level 3 fair value financial instruments and the fair value measurements as of December 31, 2022:


Fair Value


Valuation Technique

Unobservable Input

Range (Weighted Average)


(dollars in millions)


Assets


Option adjusted spread

5.3% - 21.6% (5.9%)

Mortgage servicing rights

$

1,033


Discounted cash flows

Constant prepayment rate

0% - 10.0% (7.9%)


Weighted average cost to service per loan

$65 - $90 ($68)

Rate lock commitments (net)

$

(1

)

Consensus pricing

Origination pull-through rate

76.41%

(1)
Unobservable inputs were weighted by their relative fair value of the instruments.

136


Assets Measured at Fair Value on a Non-Recurring Basis

Certain assets are measured at fair value on a non-recurring basis. Such instruments are subject to fair value adjustments under certain circumstances (e.g., when there is evidence of impairment). The following tables present assets that were measured at fair value on a non-recurring basis as of December 31, 2022 and 2021, and that were included in the Company’s Consolidated Statements of Condition at those dates:


Fair Value Measurements at December 31, 2022 Using


(in millions)


Quoted Prices
in Active
Markets for
Identical
Assets
(Level 1)


Significant
Other
Observable
Inputs
(Level 2)


Significant
Unobservable
Inputs
(Level 3)


Total Fair
Value


Certain loans (1)


$


$


$

28


$

28


Other assets(2)


41


41


Total


$


$


$

69


$

69


(1)
Represents the fair value of certain loans individually assessed for impairment, based on the value of the collateral.
(2)
Represents the fair value of repossessed assets, based on the appraised value of the collateral subsequent to its initial classification as repossessed assets and equity securities without readily determinable fair values. These equity securities are classified as Level 3 due to the infrequency of the observable prices and/or the restrictions on the shares.


Fair Value Measurements at December 31, 2021 Using


(in millions)


Quoted Prices
in Active
Markets for
Identical
Assets
(Level 1)


Significant
Other
Observable
Inputs
(Level 2)


Significant
Unobservable
Inputs
(Level 3)


Total Fair
Value


Certain impaired loans (1)


$


$


$

32


$

32


Other assets (2)


32


32


Total


$


$


$

64


$

64


(1)
Represents the fair value of impaired loans, based on the value of the collateral.
(2)
Represents the fair value of repossessed assets, based on the appraised value of the collateral subsequent to its initial classification as repossessed assets.

The fair values of collateral-dependent impaired loans are determined using various valuation techniques, including consideration of appraised values and other pertinent real estate and other market data.

Other Fair Value Disclosures

For the disclosure of fair value information about the Company’s on- and off-balance sheet financial instruments, when available, quoted market prices are used as the measure of fair value. In cases where quoted market prices are not available, fair values are based on present-value estimates or other valuation techniques. Such fair values are significantly affected by the assumptions used, the timing of future cash flows, and the discount rate.

Because assumptions are inherently subjective in nature, estimated fair values cannot be substantiated by comparison to independent market quotes. Furthermore, in many cases, the estimated fair values provided would not necessarily be realized in an immediate sale or settlement of such instruments.

137


The following tables summarize the carrying values, estimated fair values, and fair value measurement levels of financial instruments that were not carried at fair value on the Company’s Consolidated Statements of Condition at December 31, 2022 and 2021:


December 31, 2022


Fair Value Measurement Using


(in millions)


Carrying
Value


Estimated
Fair Value


Quoted Prices
in Active
Markets
for Identical
Assets
(Level 1)


Significant
Other
Observable
Inputs
(Level 2)


Significant
Unobservable
Inputs
(Level 3)


Financial Assets:


Cash and cash equivalents


$

2,032


$

2,032


$

2,032


$


$


FHLB and FRB stock (1)


1,267


1,267


1,267


Loans and leases held for investment, net


68,608


65,673


65,673


Financial Liabilities:


Deposits


$

58,721


$

58,479


$

46,211


(2)


$

12,268


(3)


$


Borrowed funds


21,332


21,231


21,231


(1)
Carrying value and estimated fair value are at cost.
(2)
Interest-bearing checking and money market accounts, savings accounts, and non-interest-bearing accounts.
(3)
Certificates of deposit.


December 31, 2021


Fair Value Measurement Using


(in millions)


Carrying
Value


Estimated
Fair Value


Quoted Prices
in Active
Markets
for Identical
Assets
(Level 1)


Significant
Other
Observable
Inputs
(Level 2)


Significant
Unobservable
Inputs
(Level 3)


Financial Assets:


Cash and cash equivalents


$

2,211


$

2,211


$

2,211


$


$


FHLB stock (1)


734


734


734


Loans and leases, net


45,539


44,748


44,748


Financial Liabilities:


Deposits


$

35,059


$

35,051


$

26,635


(2)


$

8,416


(3)


$


Borrowed funds


16,562


17,169


17,169


(1)
Carrying value and estimated fair value are at cost.
(2)
Interest-bearing checking and money market accounts, savings accounts, and non-interest-bearing accounts.
(3)
Certificates of deposit.

The methods and significant assumptions used to estimate fair values for the Company’s financial instruments follow:

Cash and Cash Equivalents

Cash and cash equivalents include cash and due from banks and federal funds sold. The estimated fair values of cash and cash equivalents are assumed to equal their carrying values, as these financial instruments are either due on demand or have short-term maturities.

Securities

If quoted market prices are not available for a specific security, then fair values are estimated by using pricing models, quoted prices of securities with similar characteristics, or discounted cash flows. These pricing models primarily use market-based or independently sourced market parameters as inputs, including, but not limited to, yield curves, interest rates, equity or debt prices, and credit spreads. In addition to observable market information, pricing models also incorporate transaction details such as maturities and cash flow assumptions.

138


Federal Home Loan Bank Stock

Ownership in equity securities of the FHLB is generally restricted and there is no established liquid market for their resale. The carrying amount approximates the fair value.

Loans

The Company discloses the fair value of loans measured at amortized cost using an exit price notion. The Company determined the fair value on substantially all of its loans for disclosure purposes, on an individual loan basis. The discount rates reflect current market rates for loans with similar terms to borrowers having similar credit quality on an exit price basis. The estimated fair values of non-performing mortgage and other loans are based on recent collateral appraisals. For those loans where a discounted cash flow technique was not considered reliable, the Company used a quoted market price for each individual loan.

MSRs

The significant unobservable inputs used in the fair value measurement of the MSRs are option adjusted spreads, prepayment rates and cost to service. Significant increases (decreases) in all three assumptions in isolation result in a significantly lower (higher) fair value measurement. Weighted average life (in years) is used to determine the change in fair value of MSRs. For December 31, 2022, the weighted average life (in years) for the entire MSR portfolio was 7.3.

Rate lock commitments

The significant unobservable input used in the fair value measurement of the rate lock commitments is the pull through rate. The pull through rate is a statistical analysis of our actual rate lock fallout history to determine the sensitivity of the residential mortgage loan pipeline compared to interest rate changes and other deterministic values. New market prices are applied based on updated loan characteristics and new fallout ratios (i.e. the inverse of the pull through rate) are applied accordingly. Significant increases (decreases) in the pull through rate in isolation result in a significantly higher (lower) fair value measurement.

Deposits

The fair values of deposit liabilities with no stated maturity (i.e., interest-bearing checking and money market accounts, savings accounts, and non-interest-bearing accounts) are equal to the carrying amounts payable on demand. The fair values of CDs represent contractual cash flows, discounted using interest rates currently offered on deposits with similar characteristics and remaining maturities. These estimated fair values do not include the intangible value of core deposit relationships, which comprise a portion of the Company’s deposit base.

Borrowed Funds

The estimated fair value of borrowed funds is based either on bid quotations received from securities dealers or the discounted value of contractual cash flows with interest rates currently in effect for borrowed funds with similar maturities and structures.

Off-Balance Sheet Financial Instruments

The fair values of commitments to extend credit and unadvanced lines of credit are estimated based on an analysis of the interest rates and fees currently charged to enter into similar transactions, considering the remaining terms of the commitments and the creditworthiness of the potential borrowers. The estimated fair values of such off-balance sheet financial instruments were insignificant at December 31, 2022 and 2021.

Fair Value Option

We elected the fair value option for certain items as discussed throughout the Notes to the Consolidated Financial Statements to more closely align the accounting method with the underlying economic exposure. Interest income on LHFS is accrued on the principal outstanding primarily using the "simple-interest" method.

139


The following table reflects the change in fair value included in earnings of financial instruments for which the fair value option has been elected:


Year-ended December 31,


2022


(dollars in millions)


Assets


Loans held-for-sale


Net gain on loan sales

$

8


The following table reflects the difference between the aggregate fair value and aggregate remaining contractual principal balance outstanding for assets and liabilities for which the fair value option has been elected:


December 31, 2022


(dollars in millions)

Unpaid Principal Balance


Fair Value


Fair Value Over / (Under) UPB


Assets:


Other performing loans


Loans held-for-sale

$

1,095


$

1,115


$

20


Total other performing loans


1,095


1,115


20


Total loans


Loans held-for-sale

$

1,095


$

1,115


$

20


Total loans

$

1,095


$

1,115


$

20


140


NOTE 20: PARENT COMPANY-ONLY FINANCIAL INFORMATION

The following tables present the condensed financial statements for New York Community Bancorp, Inc. (Parent Company only):

Condensed Statements of Condition

December 31,
(in millions)20232022
ASSETS:
Cash and cash equivalents$158 $121 
Investments in subsidiaries9,160 9,633 
Other assets80 85 
Total assets$9,398 $9,839 
LIABILITIES AND STOCKHOLDERS’ EQUITY:
Junior subordinated debentures$579 $575 
Subordinated notes438 432 
Other liabilities14 
Total liabilities$1,031 $1,015 
Stockholders’ equity$8,367 $8,824 
Total liabilities and stockholders’ equity$9,398 $9,839 


December 31,


(in millions)


2022


2021


ASSETS:


Cash and cash equivalents


$


121


139


Investments in subsidiaries


9,633


7,525


Other assets


85


48


Total assets


$


9,839


7,712


LIABILITIES AND STOCKHOLDERS’ EQUITY:


Junior subordinated debentures


$


575


361


Subordinated notes


432


296


Other liabilities


8


11


Total liabilities


1,015


668


Stockholders’ equity


8,824


7,044


Total liabilities and stockholders’ equity


$


9,839


7,712


Condensed Statements of Income


Years Ended December 31,
(in millions)202320222021
Dividends received from subsidiaries$580 $335 $380 
Other income160 
Gross income582 495 381 
Operating expenses108 55 50 
Income before income tax benefit and equity in undistributed
(loss) earnings of subsidiaries
474 440 331 
Income tax benefit25 14 14 
Income before equity in undistributed (loss) earnings of subsidiaries499 454 345 
Equity in undistributed (loss) earnings of subsidiaries(578)196 251 
Net (loss) income$(79)$650 $596 


Years Ended December 31,


(in millions)


2022


2021


2020


Dividends received from subsidiaries


$


335


$

4


$

380


Other income


160


1


1


Gross income


495


381


381


Operating expenses


55


50


52


Income before income tax benefit and equity in undistributed
   earnings of subsidiaries


440


331


329


Income tax benefit


14


14


14


Income before equity in undistributed earnings of subsidiaries


454


345


343


Equity in undistributed earnings of subsidiaries


196


251


168


Net income


$


650


$

596


$

511


143


141


Condensed Statements of Cash Flows


Years Ended December 31,
(in millions)202320222021
CASH FLOWS FROM OPERATING ACTIVITIES:
Net (loss) income$(79)$650 $596 
Change in other assets30 (3)(22)
Change in other liabilities(4)
Other, net65 (130)32 
Equity in undistributed (loss) earnings of subsidiaries578 (196)(251)
Net cash provided by operating activities$600 $317 $356 
CASH FLOWS FROM INVESTING ACTIVITIES:
Cash acquired in business acquisition— 34 — 
Change in receivable from subsidiaries, net(32)(3)
Net cash (used in) provided by investing activities$(32)$39 $(3)
CASH FLOWS FROM FINANCING ACTIVITIES:
Treasury stock repurchased(12)(24)(16)
Cash dividends paid on common and preferred stock(519)(350)(349)
Net cash used in financing activities(531)(374)(365)
Net increase (decrease) in cash and cash equivalents37 (18)(12)
Cash and cash equivalents at beginning of year121 139 151 
Cash and cash equivalents at end of year$158 $121 $139 

Note 22 - Subsequent Events


Years Ended December 31,


(in millions)


2022


2021


2020


CASH FLOWS FROM OPERATING ACTIVITIES:


Net income


$


650


$

596


$

511


Change in other assets


(3

)


(22

)


Change in other liabilities


(4

)


1


Other, net


(130

)


32


30


Equity in undistributed earnings of subsidiaries


(196

)


(251

)


(168

)

Net cash provided by operating activities


317


356


373


CASH FLOWS FROM INVESTING ACTIVITIES:


Cash acquired in business acquisition


34


Change in receivable from subsidiaries, net


5


(3

)


2


Net cash provided by (used in) investing activities


39


(3

)


2


CASH FLOWS FROM FINANCING ACTIVITIES:


Treasury stock repurchased


(24

)


(16

)


(59

)

Cash dividends paid on common and preferred stock


(350

)


(349

)


(348

)

Net cash used in financing activities


(374

)


(365

)


(407

)

Net decrease in cash and cash equivalents


(18

)


(12

)


(32

)

Cash and cash equivalents at beginning of year


139


151


183


Cash and cash equivalents at end of year


$


121


$


139


$


151


Loan Sales


On February 29, 2024, the Company sold the commercial co-operative loan classified as held for sale at a gain. Additionally, on March 13, 2024 the Company completed a sale of consumer loans with a net book value of $899 million. These two sales will be recorded in the quarter ended March 31, 2024 and will result in a net gain.
142


Equity Capital Raise

NOTE 21: CAPITAL

On March 7, 2024, we entered into separate investment agreements with affiliates of funds managed by Liberty and certain other investors. The Investors invested an aggregate of approximately $1.05 billion in the Company is subject to examination, regulation,in exchange for the sale and periodic reporting underissuance by the Bank Holding Company Act of 1956,(a) 76,630,965 shares of our common stock, at a purchase price per share of $2.00, (b) 192,062 shares of a new series of our preferred stock, par value $0.01 per share, designated as amended,Series B Preferred Stock, at a price per share of $2,000, each share of which is administered byconvertible into 1,000 shares of common stock (or, in certain limited circumstances, one share of Series C Preferred Stock), (c) 256,307 shares of a new series of our preferred stock, par value $0.01 per share, designated as Series C Preferred Stock, at a price per share of $2,000, each share of which is convertible into 1,000 shares of common stock, and (d) warrants affording the FRB. The FRB has adopted capital adequacy guidelines for bank holding companies (on a consolidated basis) that are substantially similar to thoseholder thereof the right, until the seven-year anniversary of the FDICissuance of such warrant, to purchase for the Bank.

The following tables present the regulatory capital ratios for the Company at December 31, 2022 and 2021, in comparison with the minimum amounts and ratios required by the FRB for capital adequacy purposes:


Risk-Based Capital


At December 31, 2022


Common Equity
Tier 1


Tier 1


Total


Leverage Capital


(dollars in millions)


Amount


Ratio


Amount


Ratio


Amount


Ratio


Amount


Ratio


Total capital


$

6,335


9.06


%

$

6,838


9.78


%

$

8,154


11.66


%

$

6,838


9.70


%

Minimum for capital
   adequacy purposes


3,146


4.50


4,195


6.00


5,593


8.00


2,819


4.00


Excess


$

3,189


4.56


%

$

2,643


3.78


%

$

2,561


3.66


%

$

4,019


5.70


%


Risk-Based Capital


At December 31, 2021


Common Equity
Tier 1


Tier 1


Total


Leverage Capital


(dollars in millions)


Amount


Ratio


Amount


Ratio


Amount


Ratio


Amount


Ratio


Total capital


$

4,226


9.68


%

$

4,729


10.83


%

$

5,558


12.73


%

$

4,729


8.46


%

Minimum for capital
   adequacy purposes


1,966


4.50


2,621


6.00


3,494


8.00


2,237


4.00


Excess


$

2,260


5.18


%

$

2,108


4.83


%

$

2,064


4.73


%

$

2,492


4.46


%

At December 31, 2022, our total risk-based capital ratio exceeded the minimum requirement for capital adequacy purposes by 366 basis points and the fully phased-in capital conservation buffer by 116 basis points.

The Bank$2,500 per share, shares of Series D NVCE Stock, each share of Series D NVCE Stock is subject to the provisions of the National Bank Act and other statutes governing national banks, as well as the rules and regulations of the OCC, CFPB, and FDIC (the “Regulators”). The Bank is also governed by numerous federal laws and regulations, including the FDIC Improvement Act of 1991, which established five categories of capital adequacy ranging from “well capitalized” to “critically undercapitalized.” Such classifications are used by the FDIC to determine various matters, including each institution’s FDIC deposit insurance premium assessments. Capital amounts and classifications are also subject to the Regulators’ qualitative judgments about the components of capital and risk weightings, among other factors.

The quantitative measures established to ensure capital adequacy require that banks maintain minimum amounts and ratios of leverage capital to average assets andconvertible into 1,000 shares of common equity tier 1 capital, tier 1 capital, and total capital to risk-weighted assets (as such measures are definedstock (or, in the regulations). At December 31, 2022, the Bank exceeded all the capital adequacy requirements to which they were subject.

As of December 31, 2022, the Company and the Bank are categorized as “well capitalized” under the regulatory framework for prompt corrective action. To be categorized as well capitalized, a bank must maintain a minimum common equity tier 1 risk-based capital ratio of 6.50 percent; a minimum tier 1 risk-based capital ratio of 8.00 percent; a minimum total risk-based capital ratio of 10.00 percent; and a minimum leverage capital ratio of 5.00 percent. In the opinion of management, no conditions or events have transpired since December 31, 2022 to change these capital adequacy classifications.

143


The following tables present the actual capital amounts and ratios for the Bank at December 31, 2022 and 2021 in comparison to the minimum amounts and ratios required for capital adequacy purposes.


Risk-Based Capital


At December 31, 2022


Common
Equity
Tier 1


Tier 1


Total


Leverage
Capital


(dollars in millions)


Amount


Ratio


Amount


Ratio


Amount


Ratio


Amount


Ratio


Total capital


$

7,653


10.96


%

$

7,653


10.96


%

$

7,982


11.43


%

$

7,653


10.87


%

Minimum for capital adequacy
   purposes


3,142


4.50


4,189


6.00


5,585


8.00


2,817


4.00


Excess


$

4,511


6.46


%

$

3,464


4.96


%

$

2,397


3.43


%

$

4,836


6.87


%


Risk-Based Capital


At December 31, 2021


Common
Equity
Tier 1


Tier 1


Total


Leverage
Capital


(dollars in millions)


Amount


Ratio


Amount


Ratio


Amount


Ratio


Amount


Ratio


Total capital


$

5,217


11.95


%

$

5,217


11.95


%

$

5,402


12.38


%

$

5,217


9.33


%

Minimum for capital adequacy
   purposes


1,964


4.50


2,619


6.00


3,491


8.00


2,236


4.00


Excess


$

3,253


7.45


%

$

2,598


5.95


%

$

1,911


4.38


%

$

2,981


5.33


%

Preferred Stock

On March 17, 2017, the Company issued 20,600,000 depositary shares, each representing a 1/40th interest in acertain limited circumstances, one share of Series C Preferred Stock), and all of which shares of Series D NVCE Stock, upon issuance, will represent the Company’s Fixed-to-Floating Rate Series A Noncumulative Perpetual Preferred Stock, par value $0.01 per share, with a liquidation preferenceright (on an as converted basis) to receive 315,000,000 shares of $1.000 per share (equivalent to $25 per depositary share). Dividends will accrue on the depositary shares at a fixed rate equal to 6.375 percent per annum until March 17, 2027, and a floating rate equal to Three-month LIBOR plus 382.1 basis points per annum beginningcommon stock. The transaction closed on March 17, 2027. 11, 2024.


Dividends will be payable in arrears on March 17, June 17, September 17, and December 17 of each year, which commenced on June 17, 2017
144


.

Treasury Stock Repurchases

On October 23, 2018, the Board of Directors approved the repurchase of up to $300 million of the Company’s outstanding common stock. As of December 31, 2022, the Company has repurchased a total of 30 million shares at an average price of $8.88 or an aggregate purchase of $286 million. During the year ended December 31, 2022, the Company repurchased 0.9 million shares, at a cost of $8 million. The Company had no repurchases during 2021.

144


Report of Independent Registered Public Accounting Firm

Report of Independent Registered Public Accounting Firm
To the Stockholders and Board of Directors

New York Community Bancorp, Inc.:

Opinion on the Consolidated Financial Statements

We have audited the accompanying consolidated statements of condition of New York Community Bancorp, Inc. and subsidiaries (the Company) as of December 31, 20222023 and 2021,2022, the related consolidated statements of (loss) income and comprehensive (loss) income, changes in stockholders’ equity, and cash flows for each of the years in the three-year period ended December 31, 2022,2023, and the related notes (collectively, the consolidated financial statements). In our opinion, the consolidated financial statements present fairly, in all material respects, the financial position of the Company as of December 31, 20222023 and 2021,2022, and the results of its operations and its cash flows for each of the years in the three-year period ended December 31, 2022,2023, in conformity with U.S. generally accepted accounting principles.

We also have audited, in accordance with the standards of the Public Company Accounting Oversight Board (United States) (PCAOB), the Company’s internal control over financial reporting as of December 31, 2022,2023, based on criteria established in Internal Control – Integrated Framework (2013) issued by the Committee of Sponsoring Organizations of the Treadway Commission, and our report dated March 1, 202314, 2024 expressed an unqualifiedadverse opinion on the effectiveness of the Company’s internal control over financial reporting.

Basis for Opinion

These consolidated financial statements are the responsibility of the Company’s management. Our responsibility is to express an opinion on these consolidated financial statements based on our audits. We are a public accounting firm registered with the PCAOB and are required to be independent with respect to the Company in accordance with the U.S. federal securities laws and the applicable rules and regulations of the Securities and Exchange Commission and the PCAOB.

We conducted our audits in accordance with the standards of the PCAOB. Those standards require that we plan and perform the audit to obtain reasonable assurance about whether the consolidated financial statements are free of material misstatement, whether due to error or fraud. Our audits included performing procedures to assess the risks of material misstatement of the consolidated financial statements, whether due to error or fraud, and performing procedures that respond to those risks. Such procedures included examining, on a test basis, evidence regarding the amounts and disclosures in the consolidated financial statements. Our audits also included evaluating the accounting principles used and significant estimates made by management, as well as evaluating the overall presentation of the consolidated financial statements. We believe that our audits provide a reasonable basis for our opinion.

Critical Audit Matters

The critical audit matters communicated below are matters arising from the current period audit of the consolidated financial statements that were communicated or required to be communicated to the audit committee and that: (1) relate to accounts or disclosures that are material to the consolidated financial statements and (2) involved our especially challenging, subjective, or complex judgments. The communication of critical audit matters does not alter in any way our opinion on the consolidated financial statements, taken as a whole, and we are not, by communicating the critical audit matters below, providing separate opinions on the critical audit matters or on the accounts or disclosures to which they relate.

Goodwill Impairment

As discussed in Notes 2 and 16 to the consolidated financial statements, the Company recorded an impairment charge of its entire goodwill balance of $2.4 billion as of December 31, 2023. The Company evaluates goodwill for impairment at least annually or when triggering events are identified. The Company utilizes a market approach to determine the fair value of its single reporting unit, which considers how a market participant would view a control premium, complemented by an income approach if deemed necessary. As of December 31, 2023, the Company identified a triggering event and applied a market approach using the end of day stock price, a control premium for recently completed bank acquisitions, and an adjustment for Company-specific risk considerations based on subsequent confirming market evidence. The adjusted market capitalization was then compared to the Company’s carrying value to determine the extent of any shortfall. The calculated shortfall was in excess of the goodwill balance as of December 31, 2023.


145


We identified the assessment of goodwill for impairment as a critical audit matter. A high degree of audit effort, including specialized skills and knowledge, and subjective and complex auditor judgment was involved in the evaluation of the market approach and significant unobservable assumptions which included the control premium and Company-specific risk considerations. There was also a high degree of subjectivity and potential for management bias related to the timing and magnitude of adjustments made to the key assumptions used in the valuation.

The following are the primary procedures we performed to address this critical audit matter. We evaluated the design and tested the operating effectiveness of certain internal controls related to the Company’s goodwill impairment analysis, including internal controls over the development of the market approach and the determination of the control premium and the impact of Company-specific risk considerations.

In addition, we involved valuation professionals with specialized skills and knowledge who assisted in:

evaluating the reasonableness of the valuation approach used for compliance with U.S. generally accepted accounting principles

evaluating the control premium assumption by comparing to data from recently completed peer bank acquisitions

evaluating the adjustment for Company-specific risk considerations based on confirming market evidence from events occurring after the measurement date.

Allowance for credit losses on loans and leases evaluated on a collective basis

As discussed in Notes 62 and 7 to the consolidated financial statements, the Company’s total allowance for credit losses (ACL) on loans and leases as of December 31, 20222023 was $393$992 million, a substantial portion of which is related to the legacy New York Community Bancorp, Inc.one-to-four family first mortgage, multi-family, commercial and industrial, specialty finance, and commercial real estate portfolio segments (legacy NYCB portfolios), and the acquired Flagstar Bancorp, Inc. one-to-four family first mortgage, commercial real estate, commercial and industrial, and acquisition, development and construction portfolio segments (acquired Flagstar portfolios). The allowance for credit losses on loans and leases for the legacy NYCB portfolios and acquired Flagstar portfolios is measured on a collective basis when similar risk characteristics exist (collective ACL). Management estimates the collective ACL by projecting and multiplying together the probability-of-default (PD), loss-given-default (LGD) and exposure-at-default depending on economic parameters for each month of the remaining contractual term. The loss drivers for certain loans within the commercial and industrial portfolio are derived using credit ratings. The Company estimates the exposure-at-default using prepayment methods and models which projectforecasts prepayments over the life of the loans. Economicloans and leases. The economic forecast and the related economic parameters are developed using available information relating to past events, current conditions,multiple economic forecasts, and macroeconomic assumptions. Economic parameters are forecast scenarios, including related weightings, over athe reasonable and supportable forecast period. After the reasonable and supportable forecast period, the Company reverts to a historical average loss rate on a straight line basis.straight-line basis over 12 months. Historical credit loss experience over the historical loss observation period provides the basis for the estimation of expected credit losses,

145


with qualitative factor adjustments made for differences in current loan-specific risk characteristics as well as for changes in environmental conditions.

We identified the assessment of the collective ACL for the legacy NYCB portfolios and the acquired Flagstar portfolios as a critical audit matter. A high degree of audit effort, including specialized skills and knowledge, and subjective and complex auditor judgment was involved in the assessment due to significant measurement uncertainty. Specifically, the assessment encompassed the evaluation of the collective ACL methodology, including the methods and models used to estimate the PD, LGD, and prepayments and their significant assumptions. Such significant assumptions included portfolio segmentation, the selection of the multiple economic forecasts and macroeconomic assumptions,forecast scenarios including related weightings, economic parameters, credit ratings, the reasonable and supportable forecast period, the reversion period and the historical loss observation periods.period. The assessment also included the evaluation of the qualitative factor adjustments and their significant assumptions for differences in loan-specific risk characteristics and changes in environmental factors.conditions. The assessment also included an evaluation of the conceptual soundness and performance of the PD, LGD, and prepaymentsprepayment models. In addition, auditor judgment was required to evaluate the sufficiency of audit evidence obtained.

The following are the primary procedures we performed to address this critical audit matter. We evaluated the design and tested the operating effectiveness of certain internal controls related to the Company’s measurement of the collective ACL estimate, for the legacy NYCB portfolios, including controls over the:

development of the collective ACL methodology

continued use and appropriateness of changes made tothe PD, LGD, and prepayment models

performance monitoring of the PD, LGD, and prepayment models


146


identification and determination of the significant assumptions used in the PD, LGD, and prepayment models

development of the qualitative factor adjustments, including the significant assumptions used in the measurement of the qualitative factors

performance monitoring of the PD, LGD, and prepayment models and
analysis of the collective ACL results, trends, and ratios.

We evaluated the Company’s process to develop the collective ACL estimate for both the legacy NYCB portfolios and the acquired Flagstar portfolios by testing certain sources of data, factors, and assumptions that the Company used, and considered the relevance and reliability of such data, factors, and assumptions. In addition, we involved credit risk and valuation professionals with specialized skills and knowledge, who assisted in:

evaluating the Company’s collective ACL methodology for compliance with U.S. generally accepted accounting principles

evaluating judgments made by the Company relative to the assessment and performance testing of the PD, LGD, and prepayment models by comparing them to relevant Company-specific metrics and trends and the applicable industry and regulatory practices

assessing the conceptual soundness and performance of the PD, LGD, and prepayment models by inspecting the model documentation to determine whether the models are suitable for their intended use

evaluating the selection of the multiple economic forecasts,forecast scenarios including the weighting of the scenarios,related weightings, and underlying macroeconomic assumptionseconomic parameters by comparing itthem to the Company’s business environment and relevant industry practices

evaluating the length of the reasonable and supportable forecast period, the reversion period and the historical loss observation periods by comparing them to specific portfolio risk characteristics and trends

testing individual credit ratings for a selection of certain borrower relationships by evaluating the financial performance of the borrower, sources of repayment, and any relevant guarantees or underlying collateral

determining whether the loan portfolio is segmented by similar risk characteristics by comparing to the Company’s business environment and relevant industry practices andpractice

evaluating the methodology used to develop the qualitative factorsfactor adjustments and their significant assumptions and the effect of those factorsadjustments on the allowance for credit losses on loans and leasescollective ACL compared with relevant credit risk factors, current collateral valuations, and consistency with credit trends and identified limitations of the underlying quantitative models.

We also assessed the sufficiency of the audit evidence obtained related to the collective ACL estimate for both the legacy NYCB portfolios and the acquired Flagstar portfolios by evaluating the:

determination of cumulative results of the audit procedures

146


qualitative aspects of the Company’s accounting practices

potential bias in the accounting estimate.

Fair value measurements of acquired loans and mortgage servicing rights in the acquisition of Flagstar Bancorp, Inc.core deposit intangible asset

As discussed in NotesNote 3 and 9 to the consolidated financial statements, the Company acquired Flagstar Bancorp, Inc.certain assets and assumed certain liabilities of Signature Bridge Bank, N.A. on December 1, 2022.March 20, 2023. The Company accounted for this transaction as a business combination with the assets acquired and liabilities assumed being measured based on their estimated fair values. As part of the acquisition, the Company acquired loans and mortgage servicing rights (MSRs)established a core deposit intangible (CDI) asset with a fair value of $18.0$12.0 billion and $1.0 billion,$464 million, respectively. As of December 31, 2022, the fair value of the MSRs was $1.0 billion with any changes in fair value recognized in earnings. The fair value of acquired loans was based on a discounted cash flow methodology which incorporated discount rates, prepayment rates, probability of default and loss given default rates, and other market assumptions. The fair value of MSRsthe CDI asset was measured using a discounted cash flow methodology which utilized option-adjusted spreads, constant prepayment speeds, costs to service,discount rates, customer attrition rates, and other market assumptions.

We identified the assessment of the fair value measurements of acquired loans and MSRsthe CDI asset at the acquisition date and the MSRs as of December 31, 2022 as a critical audit matter. A high degree of audit effort, including specialized skills and knowledge, and subjective and complex

147


auditor judgment was involved in the assessment of the fair value measurements due to significant measurement uncertainty. Specifically, the assessment of the fair value measurements involved an evaluation of the valuation methodologies and certain subjective assumptions,significant assumptions: including discount rates, prepayment rates, probability of default and loss given default rates for acquired loansloans; and option-adjusted spreads, constant prepaymentdiscount rates and cost to servicecustomer attrition rates for MSRs.the CDI asset.

The following are the primary procedures we performed to address this critical audit matter. We evaluated the design and tested the operating effectiveness of certain internal controls related to the Company’s fair value measurements of acquired loans and MSRsthe CDI asset at the date of acquisition.acquisition date. This included controls related to the (1) determination of certain subjectivesignificant assumptions used in the discounted cash flow methodologymethodologies for acquired loans and MSRs,the CDI asset, and (2) assessment of the overall fair value measurement for acquired loans and (3) assessment of the overall fair value measurement, including comparisons of the fair value to independent appraisals, for MSRs.CDI asset. We evaluated the Company’s process to determine the estimated fair value of acquired loans and MSRsthe CDI asset at the acquisition date and the fair value of MSRs as of December 31, 2022, by testing certain sources of data and subjective assumptions that the Company used and considered the relevance and reliability of such data and subjective assumptions. In addition, we involved valuation professionals with specialized skills and knowledge, who assisted in:

evaluating the Company’s valuationfair value methodologies for compliance with U.S. generally accepted accounting principles

assessing the Company’s estimate of fair value of acquired loans by developing independent ranges of fair values, using market participant derived discount rates, prepayment rates, and probability of default and loss given default rates, and comparing them to the Company’s estimate of fair value and

evaluating the discount rates and customer attrition rates by comparing the information used to develop such assumptions to market data and deposit activity observed subsequent to the acquisition date.

Fair value measurement of mortgage servicing rights

As discussed in Notes 9 and 18 to the consolidated financial statements, the Company’s mortgage servicing rights (MSRs) as of December 31, 2023 was $1.1 billion. The Company purchases and originates mortgage loans for sale to the secondary market and sells certain of these loans on a servicing-retained basis. For these loans, the Company recognizes a MSR at the time of sale which is recorded at fair value. The Company uses an internal valuation model which utilizes an option-adjusted spread, constant prepayment rate, costs to service and other assumptions to determine the fair value of the MSRs. The Company obtains independent third-party valuations of the estimated fair value of MSRs on a quarterly basis to assess the reasonableness of the Company’s internal fair value estimate.

We identified the assessment of the fair value measurement of MSRs as a critical audit matter. A high degree of audit effort, including specialized skills and knowledge, and subjective and complex auditor judgment was involved in the assessment of the internal valuation model and significant unobservable assumptions, which included option-adjusted spread and constant prepayment rate. There was also a high degree of subjectivity and potential for management bias related to the timing and magnitude of adjustments made to the significant assumptions used in the valuation.

The following are the primary procedures we performed to address this critical audit matter. We evaluated the design and tested the operating effectiveness of certain internal controls related to the Company’s fair value measurement of MSRs. This included controls related to:

assessment of the internal valuation model

evaluation of certain significant assumptions used in estimating the fair value

comparison of the MSR fair value to independent valuations.

We evaluated the Company’s process to determine the estimated fair value of MSRs by testing certain sources of data and subjective assumptions that the Company used and considered the relevance and reliability of such data and subjective assumptions. In addition, we involved valuation professionals with specialized skills and knowledge, who assisted in:

evaluating the design of the internal valuation model used to estimate the MSR fair value in accordance with relevant U.S. generally accepted accounting principles


148


assessing option-adjusted spreads, constant prepayment rates, and cost to serviceevaluating the significant assumptions, relatedincluding the timing of any significant updates made to the MSRs fair value estimate by comparingassumptions during the year, based on an analysis of backtesting results and a comparison of significant assumptions to external market and industry data as well as available data fromfor comparable entities and independent appraisals.third-party valuations.

img86619456_1.jpg 

We have served as the Company’s auditor since 1993.

/s/ KPMG LLP

We have served as the Company’s auditor since 1993.
New York, New York

March 1, 202314, 2024


147


149


Report of Independent Registered Public Accounting Firm

To the Stockholders and Board of Directors

New York Community Bancorp, Inc.:

Opinion on Internal Control Over Financial Reporting

We have audited New York Community Bancorp, Inc. and subsidiaries' (the Company) internal control over financial reporting as of December 31, 2022,2023, based on criteria established in Internal Control – Integrated Framework (2013) issued by the Committee of Sponsoring Organizations of the Treadway Commission. In our opinion, because of the effect of the material weaknesses, described below, on the achievement of the objectives of the control criteria, the Company has not maintained in all material respects, effective internal control over financial reporting as of December 31, 2022,2023, based on criteria established in Internal Control – Integrated Framework (2013) issued by the Committee of Sponsoring Organizations of the Treadway Commission.

We also have audited, in accordance with the standards of the Public Company Accounting Oversight Board (United States) (PCAOB), the consolidated statements of condition of the Company as of December 31, 20222023 and 2021,2022, the related consolidated statements of (loss) income and comprehensive (loss) income, changes in stockholders’ equity, and cash flows for each of the years in the three-year period ended December 31, 2022,2023, and the related notes (collectively, the consolidated financial statements), and our report dated March 1, 202314, 2024 expressed an unqualified opinion on those consolidated financial statements.

A material weakness is a deficiency, or a combination of deficiencies, in internal control over financial reporting, such that there is a reasonable possibility that a material misstatement of the company’s annual or interim financial statements will not be prevented or detected on a timely basis. Material weaknesses related to the following have been identified and included in management’s assessment:

the Company's Board of Directors did not exercise sufficient oversight responsibilities, which led to the Company lacking a sufficient complement of qualified leadership resources to conduct effective risk assessment and monitoring activities,

the Company lacked effective periodic risk assessment processes to identify and timely respond to emerging risks in certain financial reporting processes and related internal controls, including internal loan review, that were responsive to changes in the business operations and regulatory and economic environments in which the Company operates,

the Company’s recurring monitoring activities over process level control activities, including internal loan review, were not operating effectively, and

the Company did not sufficiently maintain effective control activities related to internal loan review. Specifically, the Company’s internal loan review processes lacked an appropriate framework to ensure that ratings were consistently accurate, timely, and appropriately challenged. These ineffective controls impact the Company’s ability to accurately disclose loan rating classifications, identify problem loans, and ultimately the recognition of the allowance for credit losses on loans and leases.

The material weaknesses were considered in determining the nature, timing, and extent of audit tests applied in our audit of the 2023 consolidated financial statements, and this report does not affect our report on those consolidated financial statements.

The Company acquired Flagstar Bancorp, Inc.Signature Bridge Bank, N.A. during 2022,2023, and management excluded from its assessment of the effectiveness of the Company’s internal control over financial reporting as of December 31, 2022, Flagstar Bancorp, Inc.2023, Signature Bridge Bank, N.A.’s internal control over financial reporting associated with total acquired assets of approximately $25.8$38 billion and total revenues associated with the acquired assets and liabilities assumed of approximately $132 million$1 billion included in the consolidated financial statements of the Company as of and for the year ended December 31, 2022.2023. Our audit of internal control over financial reporting of the Company also excluded an evaluation of the internal control over financial reporting of Flagstar Bancorp, Inc.Signature Bridge Bank, N.A.


150


Basis for Opinion

The Company’s management is responsible for maintaining effective internal control over financial reporting and for its assessment of the effectiveness of internal control over financial reporting, included in the accompanying Management's Report on Internal Control over Financial Reporting. Our responsibility is to express an opinion on the Company’s internal control over financial reporting based on our audit. We are a public accounting firm registered with the PCAOB and are required to be independent with respect to the Company in accordance with the U.S. federal securities laws and the applicable rules and regulations of the Securities and Exchange Commission and the PCAOB.

We conducted our audit in accordance with the standards of the PCAOB. Those standards require that we plan and perform the audit to obtain reasonable assurance about whether effective internal control over financial reporting was maintained in all material respects. Our audit of internal control over financial reporting included obtaining an understanding of internal control over financial reporting, assessing the risk that a material weakness exists, and testing and evaluating the design and operating effectiveness of internal control based on the assessed risk. Our audit also included performing such other procedures as we considered necessary in the circumstances. We believe that our audit provides a reasonable basis for our opinion.

Definition and Limitations of Internal Control Over Financial Reporting

A company’s internal control over financial reporting is a process designed to provide reasonable assurance regarding the reliability of financial reporting and the preparation of financial statements for external purposes in accordance with generally accepted accounting principles. A company’s internal control over financial reporting includes those policies and procedures that (1) pertain to the maintenance of records that, in reasonable detail, accurately and fairly reflect the transactions and dispositions of the assets of the company; (2) provide reasonable assurance that transactions are recorded as necessary to permit preparation of financial statements in accordance with generally accepted accounting principles, and that receipts and expenditures of the company are being made only in accordance with authorizations of management and directors of the company; and (3) provide reasonable assurance regarding prevention or timely detection of unauthorized acquisition, use, or disposition of the company’s assets that could have a material effect on the financial statements.

Because of its inherent limitations, internal control over financial reporting may not prevent or detect misstatements. Also, projections of any evaluation of effectiveness to future periods are subject to the risk that controls may become inadequate because of changes in conditions, or that the degree of compliance with the policies or procedures may deteriorate.

img86619456_2.jpg 

/s/KPMG LLP

New York, New York

March 1, 202314, 2024


148

151


Item 9.Changes in and Disagreement with Accountants on Accounting and Financial Disclosures
ITEM 9. CHANGES IN AND DISAGREEMENTS WITH ACCOUNTANTS ON ACCOUNTING AND FINANCIAL DISCLOSURE
None.

Item 9A.Controls and Procedures
None.

ITEM 9A. CONTROLS AND PROCEDURES

(a) Evaluation of Disclosure Controls and Procedures

Under the supervision, and with the participation, of our Chief Executive Officer and Chief Financial Officer, our management evaluated the effectiveness of the design and operation of the Company’s disclosure controls and procedures pursuant to Rule 13a-15(b), as adopted by the Securities and Exchange Commission (the “SEC”) under the Securities Exchange Act of 1934 (the “Exchange Act”). Based upon that evaluation, the Chief Executive Officer and Chief Financial Officer concluded that the Company’s disclosure controls and procedures were not effective as of the end of the period covered by this annual report.report because of the material weaknesses in internal control over financial reporting described below. Notwithstanding the material weaknesses, based on additional analyses and other procedures performed, management concluded that the financial statements included in this report fairly present in all material respects our financial position, results of operations, capital position, and cash flows for the periods presented in conformity with GAAP.

Disclosure

Per Rules 13a-15(e) and 15d-15(e), disclosure controls and procedures are the controls and other procedures that are designed to ensure that information required to be disclosed in the reports that the Company files or submits under the Exchange Act is recorded, processed, summarized, and reported within the time periods specified in the SEC’s rules and forms. Disclosure controls and procedures include, without limitation, controls and procedures designed to ensure that information required to be disclosed in the reports that the Company files or submits under the Exchange Act is accumulated and communicated to management, including the Chief Executive Officer and Chief Financial Officer, or persons performing similar functions, as appropriate, to allow timely decisions regarding required disclosure.

(b) Management’s Report on Internal Control over Financial Reporting

Management of the Company is responsible for establishing and maintaining adequate internal control over financial reporting.reporting (as defined in Rules 13a-15(f) and 15d-15(f) of the Exchange Act). Our system of internal control is designed under the supervision of management, including our Chief Executive Officer and Chief Financial Officer, to provide reasonable assurance regarding the reliability of our financial reporting and the preparation of the Company’s financial statements for external reporting purposes in accordance with U.S. generally accepted accounting principles (“GAAP”).

Our internal control over financial reporting includes policies and procedures that pertain to the maintenance of records that, in reasonable detail, accurately and fairly reflect transactions and dispositions of assets;assets of the Company; provide reasonable assurances that transactions are recorded as necessary to permit preparation of financial statements in accordance with GAAP, and that receipts and expenditures are made only in accordance with the authorization of management and the Boards of Directors of the Company and the Bank; and provide reasonable assurance regarding prevention or timely detection of unauthorized acquisition, use, or disposition of the Company’s assets that could have a material effect on our financial statements.

Because of its inherent limitations, internal control over financial reporting may not prevent or detect misstatements. ProjectionsAlso, projections of any evaluation of effectiveness to future periods are subject to the risk that the controls may become inadequate because of changes in conditions or that the degree of compliance with policies and procedures may deteriorate.

The Company acquired certain assets and assumed certain liabilities of Flagstar BancorpSignature Bridge Bank, N.A. on December 1, 2022.March 20, 2023. The scope of management’s assessment of the effectiveness of the Company’s internal controlscontrol over financial reporting as of December 31, 2022,2023, excludes the internal control over financial reporting associated with total acquired assets of approximately $25.8$38 billion and total revenues associated with the acquired assets and liabilities assumed of approximately $132 million$1 billion included in the consolidated financial statements of the Company as of and for the year ended December 31, 2022.2023.

As of December 31, 2022,2023, management assessed the effectiveness of the Company’s internal control over financial reporting based upon the framework established in Internal Control—Integrated Framework (2013) issued by the Committee of Sponsoring Organizations of the Treadway Commission (“COSO”). A material weakness (as defined in Rule 12b-2 under the Exchange Act) is a deficiency or combination of deficiencies, in internal control over financial reporting such that there is a reasonable possibility that a material misstatement in our annual or interim financial statements will not be prevented or detected on a timely basis.

152


Based upon itson this assessment, because of the following material weaknesses, management concluded that the Company’sCompany did not maintain effective internal control over financial reporting as of December 31, 2022 was2023.

Control environment – Our Board of Directors did not exercise sufficient oversight responsibilities, which led to us lacking a sufficient complement of qualified leadership resources to conduct effective using this criteria.risk assessment and monitoring activities.

Risk assessment – We lacked effective periodic risk assessment processes to identify and timely respond to emerging risks in certain financial reporting processes and related internal controls, including internal loan review, that were responsive to changes in the business operations and regulatory and economic environments in which the Company operates.

The effectiveness
Monitoring – Our recurring monitoring activities over process level control activities, including internal loan review, were not operating effectively.

Control activities – We did not sufficiently maintain effective control activities related to internal loan review. Specifically, our internal loan review processes lacked an appropriate framework to ensure that ratings were consistently accurate, timely, and appropriately challenged. These ineffective controls impact the Company’s ability to accurately disclose loan rating classifications, identify problem loans, and ultimately the recognition of the Company’sallowance for credit losses on loans and leases.

These control deficiencies create a reasonable possibility that a material misstatement to the consolidated financial statements will not be prevented or detected on a timely basis, and therefore we concluded that the deficiencies represent material weaknesses in our internal control over financial reporting and our internal control over financial reporting was not effective as of December 31, 2022 has been audited by KPMG LLP, an2023.

The Company’s independent registered public accounting firm, thatKPMG LLP, which audited the Company’s2023 consolidated financial statements as of and for the year ended December 31, 2022, as stated in their report, included in Item 8 on the preceding page, which expressesthis Form 10-K, has expressed an unqualifiedadverse opinion on the effectiveness of the Company’s internal control over financial reporting. KPMG LLP’s report appears on page 144 of this Annual Report on Form 10-K.

Remediation Status of Reported Material Weaknesses

The Company is currently working to remediate the material weaknesses described above, including assessing the need for additional remediation steps and implementing additional measures to remediate the underlying causes that gave rise to the material weaknesses. The Company is committed to maintaining a strong internal control environment and to ensuring that proper oversight and a consistent tone is communicated throughout the organization. The Company expects that existing deficiencies will be remediated through implementation of processes and controls designed to ensure strict compliance with U.S. GAAP.

Specifically, we are in the process of strengthening our internal control over financial reporting as follows:

Appointed several new members to the Board of December 31, 2022.Directors with extensive experience as financial experts in our industry and backgrounds in risk management. Additionally, several members of the Board of Directors resigned.

Appointed a new Chief Risk Officer and Chief Audit Executive, both of whom have large bank experience. We are in the process of identifying and appointing a new Director of Loan Review who has prior large bank commercial loan experience.

149

Increasing the frequency and nature of reporting from our internal loan review team and first line business units to the Board Risk Committee to support the Board's risk oversight role.

Expanding the use of independent credit analysis and reducing the Company's reliance on tools and analysis prepared by our lines of business.

Improving the internal loan review team's ability to independently challenge risk rating scorecard model methodologies and results.

Assessing the adequacy of staffing levels and expertise within the internal loan review program, taking into account, among other things, the size, complexity, and risk profile of the Company's loan portfolio.


153


Providing additional risk rating process training for all internal loan review employees.

We have enhanced our control environment, risk assessment and monitoring activities by addressing our Board composition and key members of executive management, including the Chief Risk Officer and Chief Audit Executive. Progress has been made on our remedial actions, but we are still in the process of developing and implementing enhanced processes, procedures and controls related to internal loan review. We believe our actions will be effective in remediating the material weaknesses, and we continue to devote significant time and attention to these efforts. In addition, the material weaknesses will not be considered remediated until the applicable remedial processes, procedures and controls have been in place for a sufficient period of time and management has concluded, through testing, that these controls are effective.

(c) Changes in Internal Control over Financial Reporting

The Company is working to integrate FlagstarSignature into its overall internal control over financial reporting processes. Except for changes made in connection with this integration of Flagstar,Signature, and the material weaknesses in internal control over financial reporting noted above, there have not been any changes in the Company’s internal control over financial reporting (as such term is defined in Rules 13a-15(f) and 15d-15(f) under the Exchange Act) during the fiscal quarter to which this report relates that have materially affected, or are reasonably likely to materially affect, the Company’s internal control over financial reporting.

Item 9B.Other Information

During the fourth quarter ended December 31, 2023, none of our directors or officers informed us of the adoption or termination of a “Rule 10b5-1 trading arrangement or “non-Rule 10b5-1 trading arrangement,” as those terms are defined in Item 408 of Regulation S-K.
Item 9C.Disclosure Regarding Foreign Jurisdictions that Prevent Inspections
ITEM 9B. OTHER INFORMATION
None.

None.
154


ITEM 9C. DISCLOSURE REGARDING FOREIGN JURISDICTIONS THAT PREVENT INSPECTIONS

Not applicable

150


PART III

Item 10.Directors, Executive Officers of the Registrant and Corporate Governance

III

ITEM 10. DIRECTORS, EXECUTIVE OFFICERS, AND CORPORATE GOVERNANCE

Information regarding our directors, executive officers, and corporate governance appears in our Proxy Statement for the Annual Meeting of Shareholders to be held on June 1, 2023for fiscal year 2024 (hereafter referred to as our “2023“2024 Proxy Statement”) under the captions “Information with Respect to Nominees, Continuing Directors, and Executive Officers,” “Section 16(a) Beneficial Ownership Reporting Compliance,” “Meetings and Committees of the Board of Directors,” and “Corporate Governance,” and is incorporated herein by this reference.

A copy of our Code of Business Conduct and Ethics, which applies to our Chief Executive Officer, Chief Operating Officer, Chief Financial Officer, and Chief Accounting Officer as officers of the Company, and all other senior financial officers of the Company designated by the Chief Executive Officer from time to time, is available on the Investor Relations portion of our website: www.myNYCB.com and will be provided, without charge, upon written request to the Chief Corporate Governance Officer and Corporate Secretary at 102 Duffy Avenue, Hicksville, NY 11801.

Item 11.Executive Compensation

ITEM 11. EXECUTIVE COMPENSATION

Information regarding executive compensation appears in our 20232024 Proxy Statement under the captions “Compensation Committee Report,” “Compensation Committee Interlocks and Insider Participation,” “Compensation Discussion and Analysis,” “Executive Compensation and Related Information,” and “Director Compensation,” and is incorporated herein by this reference.

Item 12.Security Ownership of Certain Beneficial Owners and Management and Related Stockholder Matters

ITEM 12. SECURITY OWNERSHIP OF CERTAIN BENEFICIAL OWNERS AND MANAGEMENT, AND RELATED STOCKHOLDER MATTERS

The following table provides information regarding the Company’s equity compensation plans at December 31, 2022:2023:


Plan Category

Number of
Securities to Be
Issued Upon
Exercise

Weighted Average
Exercise Price (1)
Number of securities to beSecurities
issued upon exercise of
outstanding options,
warrants, and rights

Weighted-average
exercise price of
outstanding options,
warrants, and rights

Number of securities
remaining available
Remaining Available
for future issuanceFuture Issuance
under equityUnder Equity
compensation plans
(excluding securities
reflected
in column (a))
Compensation Plans

Plan category

(a)

(b)

(c)

Equity compensation plans
approved by security holders

$

16,143,893 

9,799,865

Equity compensation plans not
approved by security holders

— 

Total

— 

$

16,143,893 

9,799,865


Information relating to the security ownership of certain beneficial owners and management appears in our 20232024 Proxy Statement under the captions “Security Ownership of Certain Beneficial Owners” and “Information with Respect to Nominees, Continuing Directors, and Executive Officers.”

Item 13.Certain Relationship and Related Transactions, and Director Independence

151


Information regarding certain relationships and related transactions, and director independence, appears in our 20232024 Proxy Statement under the captions “Transactions with Certain Related Persons” and “Corporate Governance,” respectively, and is incorporated herein by this reference.

Item 14.Principal Accounting Fees and Services

ITEM 14. PRINCIPAL ACCOUNTING FEES AND SERVICES

Our independent registered public accounting firm is KPMG LLP,, New York, New York,, Auditor Firm ID: 185.

185.

Information regarding principal accounting fees and services appears in our 20232024 Proxy Statement under the caption “Audit and Non-Audit Fees,” and is incorporated herein by this reference.


155

152


PART IV

Item 15.Exhibits, Financial Statement Schedules
PART
IV

ITEM 15. EXHIBITS AND FINANCIAL STATEMENT SCHEDULES

(a) Documents Filed as Part of this Report

1. Financial Statements

The following are incorporated by reference from Item 8 hereof:

Reports of Independent Registered Public Accounting Firm;
Consolidated Statements of Condition at December 31, 20212023 and 2022;
Consolidated Statements of Income and Comprehensive Income for each of the years in the three-year period ended December 31, 2022;
2023;
Consolidated Statements of Changes in Stockholders’ Equity for each of the years in the three-year period ended December 31, 2022;
2023;
Consolidated Statements of Cash Flows for each of the years in the three-year period ended December 31, 2022;2023; and
Notes to the Consolidated Financial Statements.

The following are incorporated by reference from Item 9A hereof:

Management’s Report on Internal Control over Financial Reporting; and
Changes in Internal Control over Financial Reporting.

2. Financial Statement Schedules

Financial statement schedules have been omitted because they are not applicable or because the required information is provided in the Consolidated Financial Statements or Notes thereto.

3. Exhibits Required by Securities and Exchange Commission Regulation S-K

The following exhibits are filed as part of this Form 10-K, and this list includes the Exhibit Index.

Exhibit No.

2.1

  2.1

Agreement and Plan of Merger, dated as of April 24, 2021, by and among New York Community Bancorp, Inc., 615 Corp., a wholly-owned subsidiary of New York Community Bancorp, Inc. and Flagstar Bancorp, Inc.* Inc.(1) (1)

2.2

  2.2

Amendment No. 1 to the Agreement and Plan of Merger, dated April 26, 2022, by and among New York Community Bancorp, Inc., 615 Corp., and Flagstar Bancorp, Inc.*(2)

2.3

  2.3

Amendment No. 2 to the Agreement and Plan of Merger, dated October 27, 2022, by and among New York Community Bancorp, Inc., 615 Corp. and Flagstar Bancorp, Inc.* (3)

2.4

(4)

2.5

3.1

Amended and Restated Certificate of Incorporation (4)(5)

3.2

  3.2

Certificates of Amendment of Amended and Restated Certificate of Incorporation (5)(6)

3.3

  3.3

Certificate of Amendment of Amended and Restated Certificate of Incorporation (6)(7)

3.4

  3.4

Certificate of Designations of the Registrant with respect to the Series A Preferred Stock, dated March 16, 2017, filed with the Secretary of State of the State of Delaware and effective March 16, 2017 (7)(8)

3.5

Certificate of Designations of the Registrant with respect to Series B Noncumulative Convertible Preferred Stock, dated March 11, 2024, filed with the Secretary of State of the State of Delaware and effective March 11, 2024 (9)

  3.53.6

Certificate of Designations of the Registrant with respect to Series C Noncumulative Convertible Preferred Stock, dated March 11, 2024, filed with the Secretary of State of the State of Delaware and effective March 11, 2024

(10)
3.7

Certificate of Designations of the Registrant with respect to Series D Non-Voting Common Equivalent Stock, dated March 11, 2024, filed with the Secretary of State of the State of Delaware and effective March 11, 2024 (11)
3.8

4.1

  4.1

Specimen Stock Certificate (9)(10)

4.2

  4.2

Deposit Agreement, dated as of March 16, 2017, by and among the Registrant, Computershare, Inc, and Computershare Trust Company, N.A., as joint depositary, and the holders from time to time of the depositary receipts described therein (10)(11)

4.3

  4.3

Form of certificate representing the Series A Preferred Stock (10)(11)

153

156


4.4

  4.4

Form of depositary receipt representing the Depositary Shares (10)(11)

4.5

Form of warrant agreement for shares of Series D Non-Voting Common Equivalent Stock (14)

4.5

Description of securities registered pursuant to Section 12 of the Securities and Exchange Act of 1934 (11)(12)

4.6

  4.6

Registrant will furnish, upon request, copies of all instruments defining the rights of holders of long-term debt instruments of the registrant and its consolidated subsidiaries.

10.1

Form of Employment Agreement between New York Community Bancorp, Inc. Robert Wann, Thomas R. Cangemi,and John J. Pinto and R. Patrick Quinn** (12) (13)

10.2(P)

Form of Change in Control Agreements among the Company, the Bank, and Certain Officers**Officers (13)(14)

10.3(P)

Form of Queens County Savings Bank Outside Directors’ Consultation and Retirement Plan**Plan (13)(14)

10.4(P)

Supplemental Benefit Plan of Queens County Savings Bank**Bank (14)(15)

10.5(P)

Excess Retirement Benefits Plan of Queens County Savings Bank**Bank (13)(14)

10.6(P)

Queens County Savings Bank Directors’ Deferred Fee Stock Unit Plan**Plan (13)(14)

10.7

New York Community Bancorp, Inc. Management Incentive Compensation Plan** (15)(16)

10.8

New York Community Bancorp, Inc. 2012 Stock Incentive Plan** (16)(17)

10.9

Underwriting Agreement, dated November 1, 2018, by and among the Registrant and Goldman Sachs & Co., Sandler O’Neill & Partners, L.P., Credit Suisse Securities (USA) LLC, Jeffries LLC, and Merrill Lynch, Pierce, Fenner & Smith Incorporated, as representatives of the several underwriters listed therein (17)

10.10

New York Community Bancorp, Inc., 2020 Omnibus Incentive Plan** Plan (18)

10.11

Letter Agreement, dated as of April 24, 2021, by and between New York Community Bancorp, Inc. and Thomas Cangemi** (1)

10.12

Employment Agreement between New York Community Bancorp, Inc. and John T. Adams** Adams (19)

10.12

10.13

Amended and Restated Non-Competition and Non-Solicitation Agreement, dated November 28, 2022, by and between Flagstar Bancorp, Inc. (New York Community Bancorp, Inc. as Successor Company) and Alessandro DiNello** DiNello(20)

10.13

10.14

Flagstar Bancorp, Inc. 2016 Stock Award and Incentive Plan (as assumed by New York Community Bancorp, Inc. effective December 1, 2022)** (21)

10.14

10.15

Employment Agreement between New York Community Bancorp, Inc. and Reginald E. Davis** (attached hereto)Davis (22)

10.15

10.16

Employment Agreement between New York Community Bancorp, Inc. and Lee M. Smith** (attached hereto)Smith (22)

10.16

(23)

21.010.17

Subsidiaries information incorporated herein by reference to Part I, “Subsidiaries”(23)

10.18

(9)

22.010.19

10.20

10.21
21Subsidiaries of the Registrant (previously filed)
22

23

23.0

Consent of KPMG LLP, dated March 1, 202314, 2024 (attached hereto)

31.1

Rule 13a-14(a) Certification of Chief Executive Officer of the Company in accordance with Section 302 of the Sarbanes-Oxley Act of 2002 (attached hereto)

31.2

Rule 13a-14(a) Certification of Chief Financial Officer of the Company in accordance with Section 302 of the Sarbanes-Oxley Act of 2002 (attached hereto)

32

32.0

Section 1350 Certifications of the Chief Executive Officer and Chief Financial Officer of the Company in accordance with Section 906 of the Sarbanes-Oxley Act of 2002 (attached hereto)

97

New York Community Bancorp, Inc. Clawback Policy (previously filed)

101101.INS

The following materials fromXBRL Instance Document – the Company’s Annual Report on Form 10-K forinstance document does not appear in the year ended December 31, 2022, formatted inInteractive Data File because XBRL tags are embedded within the Inline XBRL (Extensible Business Reporting Language): (i) the Consolidated Statements of Condition, (ii) the Consolidated Statements of Income and Comprehensive Income, (iii) the Consolidated Statements of Changes in Stockholders’ Equity, (iv) the Consolidated Statements of Cash Flows, and (v) the Notes to the Consolidated Financial Statements.

document.

101.SCH

Inline XBRL Taxonomy Extension Schema Document.

101.CAL

Inline XBRL Taxonomy Extension Calculation Linkbase Document.
101.DEFInline XBRL Taxonomy Extension Definition Linkbase Document.
101.LABInline XBRL Taxonomy Extension Label Linkbase Document.
101.PREInline XBRL Taxonomy Extension Presentation Linkbase Document.
104

Cover Page Interactive Date File (formatted in Inline XBRL and contained in Exhibit 101)


*Pursuant to Item 601(b)(2) of Regulation S-K, certain schedules and similar attachments have been omitted. The

registrant hereby agrees to furnish a copy of any omitted schedule or similar attachment to the SEC upon request.


** Management plan or compensation plan arrangement.

(1)

154


(1) Incorporated by reference to Exhibits to the Company's Form 8-K filed with the Securities and Exchange Commission on April 27, 2021 (File

No. 1-31565)


157


(2)
Incorporated by reference to Exhibits to the Company's Form 8-K filed with the Securities and Exchange Commission on April 27, 2022 (File
No. 1-31565)
(3)
Incorporated by reference to Exhibits to the Company’s Form 8-K filed with the Securities and Exchange Commission on October 28, 2022 (File No. 1-31565)
(4)Incorporated by reference to Exhibits filed with the Company’s Form 10-Q for the quarterly period ended March 31, 2023 (File No. 1-31565)
(5)Incorporated by reference to Exhibits filed with the Company’s Form 10-Q for the quarterly period ended March 31, 2001 (File No. 0-22278)
1-31565)
(5)(6)
Incorporated by reference to Exhibits filed with the Company’s Form 10-K for the year ended December 31, 2003 (File No. 1-31565)
(6)(7)
Incorporated by reference to Exhibits to the Company’s Form 8-K filed with the Securities and Exchange Commission on April 27, 2016 (File No. 1-31565)
(7)(8)
Incorporated herein by reference to Exhibit 3.4 of the Registrant’s Registration Statement on Form 8-A (File No. 333-210919), as filed with the Securities and Exchange Commission on March 16, 2017
(8)(9)
Incorporated herein by reference to Exhibit 3.2 filed withExhibits to the Company’sRegistrant’s Current Report on Form 8-K (File No. 1-31565), as filed with the Securities and Exchange Commission on December 1, 2022 (File No. 1-31565)
March 14, 2024
(9)(10)
Incorporated by reference to Exhibits filed with the Company’s Form 10-Q for the quarterly period ended September 30, 2017 (File No. 1-31565)
(10)(11)
Incorporated by reference to Exhibits filed with the Company’s Form 8-K filed with the Securities and Exchange Commission on March 17, 2017 (File No. 1-31565)
(11)(12)
Incorporated by reference to Exhibits filed with the Company’s Form 10-K for the year ended December 31, 2019 (File No. 1-31565)
(12)(13)
Incorporated by reference to Exhibits filed with the Company’s Form 8-K filed with the Securities and Exchange Commission on March 9, 2006 (File No. 1-31565)
(13)(14)
Incorporated by reference to Exhibits filed with the Company’s Registration Statement filed on Form S-1, Registration No. 33-66852
(14)(15)
Incorporated by reference to Exhibits filed with the 1995 Proxy Statement for the Annual Meeting of Shareholders held on April 19, 1995 (File No. 0-22278)
(15)(16)
Incorporated by reference to Exhibits filed with the 2006 Proxy Statement for the Annual Meeting of Shareholders held on June 7, 2006 (File No. 1-31565)
(16)(17)
Incorporated by reference to Exhibits filed with the 2012 Proxy Statement for the Annual Meeting of Shareholders held on June 7, 2012 (File No. 1-31565)
(17)
Incorporated by reference to Exhibits filed with the Company’s Form 8-K filed with the Securities and Exchange Commission on November 6, 2018 (File No. 1-31565)
(18)
Incorporated by reference to Exhibits filed with the Company’s Registration Statement filed on Form S-8 filed, Registration No. 333-241023
(19)
Incorporated by reference to Exhibits filed with the Company’s Form 10-Q for the quarterly period ended March 31, 2022 (File No. 001-31565)
(20)
Incorporated by reference to Exhibits filed with the Company’s Form 8-K filed with the Securities and Exchange Commission on December 1, 2022 (File No. 1-31565)
(21)
Incorporated by reference to Exhibit 10.1 to Flagstar Bancorp, Inc.’s Form 10-Q filed with the Securities and Exchange Commission on November 6, 2015 (File No. 1-16577)
(22)Incorporated by reference to Exhibits filed with the Company’s Form 10-K for the year ended December 31, 2022 (File No. 1-31565)
(23)Incorporated by reference to Exhibits to the Company’s Current Report on Form 8-K (File No. 1-31565), as filed with the Securities and Exchange Commission on March 8, 2024
(24)Incorporated by reference to Exhibits filed with the Company’s Form 10-K for the year ended December 31, 2021 (File No. 1-31565)


Item 16.Form 10-K Summary

None.


158


SIGNATURES

ITEM 16. FORM 10-K SUMMARY

None.

155


SIGNATURES

Pursuant to the requirements of Section 13 or 15(d) of the Securities Exchange Act of 1934, the registrant has duly caused this report to be signed on its behalf by the undersigned, thereunto duly authorized.

DATE:

March 1, 2023

14, 2024

New York Community Bancorp, Inc.

(Registrant)

/s/ Alessandro P. DiNello

/s/ Thomas R. Cangemi

Alessandro P. DiNello

Thomas R. Cangemi

President and Chief Executive Officer

(Principal Executive Officer)

Pursuant to the requirements of the Securities Exchange Act of 1934, this report has been signed below by the following persons on behalf of the registrant and in the capacities and on the dates indicated.

/s/ Thomas R. Cangemi

3/1/23

/s/ John J. Pinto

3/1/23

Thomas R. Cangemi

John J. Pinto

President, Chief Executive Officer, and Director

Senior Executive Vice President and Chief Financial Officer

(Principal Executive Officer)

(Principal Financial Officer and Principal Accounting Officer)

/s/ Alessandro P. DiNello

3/1/23

/s/ Hanif W. Dahya

3/1/23

Alessandro P. DiNello

Hanif W. Dahya

Non-Executive Chairman

Presiding Director

/s/ James R. Carpenter

3/1/23

/s/ Leslie D. Dunn

3/1/23

James R. Carpenter

Leslie D. Dunn

Director

Director

/s/ Toan C. Huynh

3/1/23

/s/ Marshall Lux

3/1/23

Toan C. Huynh

Marshall Lux

Director

Director

/s/ Lawrence Rosano, Jr

3/1/23

/s/ Ronald A. Rosenfeld

3/1/23

Lawrence Rosano, Jr.

Ronald A. Rosenfeld

Director

Director

/s/ Lawrence J. Savarese

3/1/23

/s/ Peter Schoels

3/1/23

Lawrence J. Savarese

Peter Schoels

Director

Director

/s/ David L. Treadwell

3/1/23

/s/ Robert Wann

3/1/23

David L. Treadwell

Robert Wann

Director

Director

/s/ Jennifer R. Whip

3/1/23

Jennifer R. Whip

Director


156


159