UNITED STATES
SECURITIES AND EXCHANGE COMMISSION
Washington, D.C. 20549
_______________________________________________________________________
FORM 10-K
_______________________________________________________________________
(Mark One)
☒ | ANNUAL REPORT PURSUANT TO SECTION 13 OR 15(d) OF THE SECURITIES EXCHANGE ACT OF 1934 |
For the fiscal year ended December 31 2022, 2023
OR
☐ | TRANSITION REPORT PURSUANT TO SECTION 13 OR 15(d) OF THE SECURITIES EXCHANGE ACT OF 1934 |
Commission File Number 814-01481
_______________________________________________________________________
MSD Investment Corp.
(Exact name of Registrant as specified in its Charter)
_______________________________________________________________________
Maryland | 87-4195402 | |
(State or other jurisdiction of | (I.R.S. Employer | |
One Vanderbilt Avenue, 26th Floor | 10017 | |
(Address of principal executive offices) | (Zip Code) |
212-303-4728212-303-4728
(Registrant’s telephone number, including area code)
_______________________________________________________________________
Securities registered pursuant to Section 12(b) of the Act:
Title of each class | Trading | Name of each exchange | ||
None | None | None |
Securities registered pursuant to Section 12(g) of the Act: Common Stock, $0.001 par value per share
Indicate by check mark if the registrant is a well-known seasoned issuer, as defined in Rule 405 of the Securities Act. YES ☐ NONo ☒
Indicate by check mark if the registrant is not required to file reports pursuant to Section 13 or Section 15(d) of the Act. YES ☐ NONo ☒
Indicate by check mark whether the Registrant: (1) has filed all reports required to be filed by Section 13 or 15(d) of the Securities Exchange Act of 1934 during the preceding 12 months (or for such shorter period that the Registrant was required to file such reports), and (2) has been subject to such filing requirements for the past 90 days. YESYes ☒ NO ☐
Indicate by check mark whether the Registrant has submitted electronically every Interactive Data File required to be submitted pursuant to Rule 405 of Regulation S-T (§232.405 of this chapter) during the preceding 12 months (or for such shorter period that the Registrant was required to submit such files). YES ☐Yes ☒ NO ☐
Indicate by check mark whether the Registrant is a large accelerated filer, an accelerated filer, a non-accelerated filer, smaller reporting company, or an emerging growth company. See the definition of “large accelerated filer,” “accelerated filer,” “smaller reporting company" and “emerging growth company” in Rule 12b-2 of the Exchange Act:
Large accelerated filer | ☐ | Accelerated filer | ☐ | |
Non-accelerated filer | ☒ | Smaller reporting company | ☐ | |
Emerging growth company | ☒ |
If an emerging growth company, indicate by check mark if the registrant has elected not to use the extended transition period for complying with any new or revised financial accounting standards provided pursuant to Section 13(a) of the Exchange Act. ☐
If securities are registered pursuant to Section 12(b) of the Act, indicate by check mark whether the financial statements of the registrant included in the filing reflect the correction of an error to previously issued financial statements. ☐
Indicate by check mark whether any of those error corrections are restatements that required a recovery analysis of incentive-based compensation received by any of the registrant’s executive officers during the relevant recovery period pursuant to §240.10D-1(b). ☐
Indicate by check mark whether the Registrant is a shell company (as defined in Rule 12b-2 of the Act). YES ☐ NO ☒
As of March 22, 2024, there was no established market for the registrant’s common stock. The number of shares of Registrant’s Common Stock, $0.001 par value per share, outstanding as of March 23, 202322, 2024 was 24,728,04340,279,212.
Documents Incorporated by Reference
Portions of the registrant’s definitive proxy statement relating to the registrant’s 2024 annual meeting of shareholders (the “2024 Proxy Statement”), to be filed with the Securities and Exchange Commission within 120 days after the end of the fiscal year covered by this Annual Report on Form 10-K are incorporated by reference into Part III of this Form 10-K as indicated herein.
Table of Contents
Page | ||
PART I | ||
Item 1. | 2 | |
Item 1A. | 12 | |
Item 1B. |
| |
Item |
| |
Item |
| |
Item |
| |
| 27 | |
PART II. | ||
Item |
| |
Item 6. |
| |
Item 7. | Management’s Discussion and Analysis of Financial Condition and Results of Operations |
|
Item 7A. |
| |
Item 8. |
| |
Report of Independent Registered Public Accounting Firm (PCAOB ID No. |
| |
| ||
| ||
| ||
| ||
Consolidated |
| |
| ||
Item 9. | Changes in and Disagreements with Accountants on Accounting and Financial Disclosure |
|
Item 9A. |
| |
Item 9B. |
| |
Item 9C. | Disclosure Regarding Foreign Jurisdictions that Prevent Inspections |
|
PART III. | ||
Item 10. |
| |
Item 11. |
| |
Item 12. |
| |
Item 13. | Certain Relationships and Related Transactions, and Director Independence |
|
Item 14. |
| |
PART IV. | ||
Item 15. |
| |
Item 16. |
| |
i
CERTAIN DEFINITIONS
CAUTIONARY STATEMENT REGARDING FORWARD-LOOKING STATEMENTS
This report contains forward-looking statements that involve substantial risks and uncertainties. Such statements involve known and unknown risks, uncertainties and other factors and undue reliance should not be placed thereon. These forward-looking statements are not historical facts, but rather are based on current expectations, estimates and projections about MSD Investment Corp. (together, with its consolidated subsidiaries, the “Company,” “we,” “us” or “our”), our current and prospective portfolio investments, our industry, our beliefs and opinions, and our assumptions. Words such as “anticipates,” “expects,” “intends,” “plans,” “will,” “may,” “continue,” “believes,” “seeks,” “estimates,” “would,” “could,” “should,” “targets,” “projects,” “outlook,” “potential,” “predicts” and variations of these words and similar expressions are intended to identify forward-looking statements. These statements are not guarantees of future performance and are subject to risks, uncertainties and other factors, some of which are beyond our control and difficult to predict and could cause actual results to differ materially from those expressed or forecasted in the forward-looking statements, including without limitation:
Although we believe that the assumptions on which these forward-looking statements are based are reasonable, any of those assumptions could prove to be inaccurate, and as a result, the forward-looking statements based on those assumptions also could be inaccurate. In light of these and other uncertainties, the inclusion of a projection or forward-looking statement in this report should not be regarded as a representation by us that our plans and objectives will be achieved. These risks and uncertainties include those described or identified in the section entitled “Item“Item 1A. Risk Factors”Factors” and elsewhere in this report. These forward-looking statements apply only as of the date of this report. We do not undertake any obligation to update or revise any forward-looking statements or any other information contained herein, except as required by applicable law. The safe harbor provisions of Section 21E of the Securities Exchange Act of 1934, as amended (the “Exchange Act”), which preclude civil liability for certain forward-looking statements, do not apply to the forward-looking statements in this report because we are an investment company.
1
PART I.
Item 1. Business.
General
We are a closed-end, externally managed, non-diversified management investment company that has elected to be regulated as a business development company (“BDC”) under the Investment Company Act of 1940, as amended (together with the rules and regulations promulgated thereunder, the “1940 Act”). We were established as a Delaware limited liability company on February 18, 2021, and converted to MSD Investment, LLC, a Maryland limited liability company, on October 22, 2021. Prior to the Conversion (as defined below), the Company entered into purchase agreements with three affiliated entities (MSD Credit Opportunities Fund, L.P., MSD Credit Opportunities Master Fund, L.P., and SOF Investments II, L.P. (collectively, the “Funds”)) pursuant to which the Company agreed to acquire from the Funds certain investment assets (or participation interests therein pending re-documentation of the Portfolio in the name of the Company) (the “Portfolio”) for an aggregate cash purchase price equal to the fair value of such assets, plus accrued but unpaid interest as of the closing date, less any principal payments received between signing of the purchase agreements and the closing of the transactions contemplated thereby. The closing of the purchase of the Portfolio by the Company occurred on December 21, 2021. As consideration for the Portfolio, the Company paid the Funds an aggregate purchase price of $656.5 million. On December 28, 2021, the Company filed Articles of Conversion (and related Articles of Incorporation) with the Maryland Department of Assessments and Taxation in order to convert the Company from a Maryland limited liability company to a Maryland corporation named “MSD Investment Corp.” (the “Conversion”). In accordance with the Articles of Conversion and Maryland law, the Conversion became effective as of 12:01 a.m. on January 1, 2022 and, as result of the Conversion, each unit representing a portion of the membership interests of the Company prior to the effective time of the Conversion was automatically converted into one share of common stock, par value $0.001 per share, of the Company.
On January 1, 2023, the Adviser completed a previously announced business combination with BDT & Company Holdings, L.P. (the “Transaction”), and its subsidiaries, which includes BDT Capital Partners, LLC (“BDT Capital”), an SEC-registered investment adviser, and BDT & MSD Partners, LLC, an SEC registered broker-dealer and member of the Financial Industry Regulatory Authority (“FINRA”). Upon the closing of the Transaction, BDT & Company Holdings, L.P. was renamed BDT & MSD Holdings, L.P. (“BDT”) and BDT, and its subsidiaries, became affiliates of the Adviser and the Company. BDT, together with BDT Capital, MSD and their affiliated entities, are collectively referred to as “BDT & MSD.”
As a non-diversified investment company within the meaning of the 1940 Act, we will not be limited by the 1940 Act with respect to the proportion of our assets that we may invest in securities of a single issuer, excluding limitations on investments in other investment companies.
In addition, we have elected, and intend to qualify annually thereafter, to be treated for U.S. federal income tax purposes as a regulated investment company (“RIC”) under Subchapter M of the Internal Revenue Code of 1986, as amended (together with the rules and regulations promulgated thereunder, the “Code”).
The Adviser and the Administrator — MSD Partners, L.P.
MSD Partners, L.P. (the “The Adviser”), a Delaware limited partnership, serves as the investment adviser of the Company. The Adviser is registered as an investment adviser with the SEC pursuant to the Investment Advisers Act.Act of 1940, as amended (the “Advisers Act”). The Adviser provides certain investment advisory and management services to the Company pursuant to an investment advisory agreement (the “Advisory Agreement”).
On October 19, 2022,between the Company and the Adviser, entered into a definitive business combination agreement with BDT & Company Holdings, L.P. pursuant to which the two companies agreed to combine their respective businesses to create an advisory and investment firm that will seek to serve the needs of family- and founder-led business owners and strategic, long-term investors.dated January 1, 2023 (the “Advisory Agreement”).
MSD Partners, L.P., in its capacityThe Administrator serves as the administrator of the Company (the “Administrator”) serves as theCompany’s administrator pursuant to an “Administration Agreement” between the Company and the Administrator.Administrator, dated January 1, 2023. The Administrator may retain a sub-administrator to provide certain administrative services to the Company and enter in a sub-administration agreement.
Advisory Agreement
The Adviser is responsible for the overall management of the Company’s business and activities pursuant to the Advisory Agreement. The Adviser will manage the Company’s loans and day-to-day operations, subject at all times to the terms and conditions set forth in the Advisory Agreement and such further limitations or parameters as may be imposed from time to time by our Board. Under the Advisory Agreement, the Adviser has contractual responsibilities to the Company, including to provide the Company with a management team (whether our Adviser’s own employees or individuals for which our Adviser has contracted with other parties to provide services to its clients), who will be our executive officers, and members of the Investment Committee. The Adviser will use its commercially reasonable efforts to perform its duties under the Advisory Agreement.
Compensation of the Adviser
Management Fee. Pursuant to the Advisory Agreement, the Company will pay to the Adviser an annual management fee (the “Management Fee”), payable quarterly in arrears. Management Fees for any partial month or quarter will be appropriately prorated and adjusted for any share issuances or repurchases during the relevant month or quarter. The Management Fee shall be calculated as follows:
2
2
Incentive Fee. Pursuant to the Advisory Agreement, the Company will pay to the Adviser an incentive fee (the “Incentive Fee”).
The Incentive Fee consists of two components that are independent of each other with the result that one component may be payable even if the other is not. A portion of the Incentive fee is based on the Company’s income (the “Income-Based Fee”) and a portion is based on the Company’s capital gains (the “Capital Gains Fee”), each is described below.
The calculation of the Income-Based Fee for each quarter is as follows:
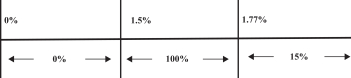
A. No Income-Based Fee shall be payable to the Adviser in any calendar quarter in which the Company’s aggregate Pre-Incentive Fee Net Investment Income does not exceed the Hurdle Amount;
B. 100% of the Company’s aggregate Pre-Incentive Fee Net Investment Income, if any, that exceeds the Hurdle Amount but is less than or equal to an amount (the “Catch-Up Amount”) determined on a quarterly basis by multiplying 1.77% (7.06% annualized) by the Company’s net asset value at the beginning of each applicable calendar quarter. The Catch-Up Amount is intended to provide the Adviser with an incentive fee of 15% on all of the Company’s Pre-Incentive Fee Net Investment Income when the Company’s Pre-Incentive Fee Net Investment Income reaches the Catch-Up Amount for any calendar quarter; and
C. For any quarter in which the Company’s aggregate Pre-Incentive Fee Net Investment Income exceeds the Catch-Up Amount, the Income-Based Fee shall equal 15% of the amount of the Company’s Pre-Incentive Fee Net Investment Income for such quarter, as the Hurdle Amount and Catch-Up Amount will have been achieved.
“Pre-Incentive Fee Net Investment Income” shall mean interest income, dividend income and any other income (including any other fees such as commitment, origination, structuring, diligence and consulting fees or other fees that the Company receives from portfolio companies but excluding fees for providing managerial assistance) accrued during the calendar quarter, minus operating expenses for the quarter (including the Management Fee, any expenses payable under the Administration Agreement, and any interest expense and dividends paid on any outstanding preferred stock, but excluding the Incentive Fee). In addition, “Pre-Incentive Fee Net Investment Income” shall include, in the case of investments with a deferred interest feature such as market discount, original issue discount (“OID”), debt instruments with payment-in-kind (“PIK”) interest, preferred stock with PIK dividends and zero-coupon securities, accrued income that the Company has not yet received in cash. For avoidance of doubt, Pre-Incentive Fee Net Investment Income does not include any realized capital gains, realized capital losses or unrealized capital appreciation or depreciation.
Examples of the quarterly incentive fee calculation are annexed to the Advisory Agreement. Such examples are included for illustrative purposes only and are not considered part of the Advisory Agreement. The fees payable under the Advisory Agreement for any partial period will be appropriately prorated.
Both the calculation of the Management Fee and the Income-Based Fee will be appropriately adjusted for any capital calls done by the Company during the quarter (based on the actual number of days elapsed relative to the total number of days in such calendar quarter).
For purposes of computing the Income-Based Fee and the Capital Gains Fee, the calculation methodology will look through derivative financial instruments or swaps as if the Company owned the reference assets directly, in the manner described above. With respect to the calculation of quarterly Pre-Incentive Fee Net Investment Income for purposes of calculating the Income-Based Fee, net interest, if any, associated with a derivative or swap (which is defined as the difference between (i) the interest income and transaction fees received in respect of the reference assets of the derivative or swap and (ii) all interest and other expenses paid by us to the derivative or swap counterparty) will be included in calculating the Income-Based Fee. The notional value of any such derivatives or swaps is not used for these purposes. With respect to the calculation of the Capital Gains Fee, realized gains and realized losses on the disposition of any reference assets, as well as unrealized depreciation on reference assets retained in the derivative or swap, will be included on a cumulative basis in calculating the Capital Gains Fee.
The following is a graphical representation of the quarterly calculation of the Incentive Fee:
3
3
Administration Agreement
Pursuant to the Administration Agreement, the Administrator will furnish the Company with office facilities and equipment and provides clerical, bookkeeping, recordkeeping and other administrative services at such facilities. The Administrator will perform, or oversee the performance of, our required administrative services, which include, among other things, assisting the Company with the preparation of the financial records that the Company is required to maintain and with the preparation of reports to shareholders and reports filed with the SEC. The Administrator will also assist the Company in determining and publishing our net asset value (“NAV”), overseeing the preparation and filing of tax returns, printing and disseminating reports to shareholders and generally overseeing the payment of expenses and the performance of administrative and professional services rendered to the Company by others. At the request of the Adviser, the Administrator will also provide (or cause to be provided) managerial assistance on the Company’s behalf to those portfolio companies that have accepted the Company’s offer to provide such assistance.
The Board
The business and affairs of the Company are managed under the direction and oversight of the Board. The Board consists of four members, three of whom are not “interested persons,” as defined in Section 2(a)(19) of the 1940 Act, of the Company or the Adviser (each an “Independent Directors.Director”). The Board appoints the officers of the Company, who serve at the discretion of the Board. The responsibilities of the Board include quarterly oversight of the valuation of the Company’s assets, corporate governance activities, oversight of the Company’s operations, financing arrangements, investment activities, and risk management.
The Board reviews risk management processes at both regular and special board meetings throughout the year, consulting with appropriate representatives of the Adviser as necessary and periodically requesting the production of risk management reports or presentations. The goal of the Board’s risk oversight function is to ensure that the risks associated with the Company’s investment activities are accurately identified, thoroughly investigated and responsibly addressed. Investors should note, however, that the Board’s oversight function cannot eliminate all risks or ensure that particular events do not adversely affect the value of the Company’s investments.
The Board has established an Audit Committee, a Pricing Committee and a Nominating and Corporate Governance Committee.
Employees
We do not currently have any employees and do not expect to have any employees in the future. Services necessary for our business are provided by individuals who are employees of the Adviser or its affiliates, pursuant to the terms of the Advisory Agreement and the Administration Agreement. Our day-to-day investment operations are managed by the Adviser. The services necessary for the origination and administration of our investment portfolio will be provided by investment professionals employed by the Adviser or its affiliates.
Investment Strategy
Investment Objective
The Company’s investment objective is to maximize dividend yields by investing in a broad range of portfolio companies, primarily investing in senior secured loans and notes where we believe the probability of losses are limited. The Advisor expects to execute this strategy by continuing its long history of leveraging its network to source and diligence what we believe to be attractive opportunities across a broad range of industries. The strategy will be executed by a team of experienced investment professionals who have more than a 20-year history of successfully deploying capital in both liquid and illiquid opportunities. The Company may invest in non-U.S. investments, convertible securities, structured investments (including junior and equity tranches) and real estate on a limited basis, if at all.
The portfolio will be comprised primarily of senior secured loans and notes sourced in both the private and more broadly syndicated markets. While the Company will focus primarily on investing in senior secured loans, it has a flexible mandate that allows it to invest across the capital structure, including, first and second lien debt, notes, bonds, preferred and mezzanine securities and, on a limited basis, equities. First-lien debt may include traditional first-lien senior secured loans or unitranche loans that combine the characteristics of traditional first lien senior secured loans with second lien and subordinated loans. Unitranche loans are often a potentially attractive way to mitigate downside risk because of their seniority in the capital structure, while potentially realizing higher returns by providing more leverage than would be typical for traditional first lien senior secured debt.
The Company will source opportunities by leveragingthrough industry relationships as well as BDT & MSD’s broad networkadvisory capabilities and reputation. MSDreferrals from its network. The Adviser invests across a wide range of industries and asset classes and has an extensive network that spans most industries.
The Company’s strategy will be principally executed by the Adviser’s credit team (the “Credit Team”), led by senior investment professionals with an average of 2527 years of experience in sourcing and investing, and 1518 years working together as a team. The senior investment professionals of the Company have demonstrated investment expertise throughout the lifecycle of credit markets. As a consequence, the Company is well positioned to invest across a wide array of industries and opportunities. The team has a highly disciplined, fundamental, research-intensive approach to investing, where downside risk assessment is central to each investment decision.
4
Target Investment Criteria
The Company focuses on sourcing opportunities in businesses that tend to exhibit some or all of the following characteristics:
4
The industry composition of investments at fair value as of December 31, 20222023 and December 31, 20212022 was as follows:
|
| December 31, 2022 |
|
| December 31, 2021 |
|
|
| December 31, 2023 |
|
| December 31, 2022 |
| ||||||
Aerospace & Defense |
|
| 7.04 |
| % |
|
| 2.99 |
| % |
|
| 6.06 | % |
|
| 7.04 | % | |
Automobile |
|
| 0.20 |
|
|
| 0.52 |
|
|
|
| 0.05 |
|
|
| 0.20 |
| ||
Banking, Finance, Insurance & Real Estate |
|
| 4.81 |
|
|
| — |
| |||||||||||
Beverage, Food & Tobacco |
|
| 1.92 |
|
|
| — |
|
|
|
| 0.97 |
|
|
| 1.92 |
| ||
Capital Equipment |
|
| 5.16 |
|
|
| — |
|
|
|
| 5.26 |
|
|
| 5.16 |
| ||
Chemicals, Plastics & Rubber |
|
| 3.91 |
|
|
| 6.29 |
|
|
|
| 1.88 |
|
|
| 3.91 |
| ||
Consumer goods: Durable |
|
| 1.80 |
|
|
| — |
| |||||||||||
Consumer goods: Non-durable |
|
| 5.47 |
|
|
| 7.22 |
|
|
|
| 2.79 |
|
|
| 5.47 |
| ||
Energy: Oil & Gas |
|
| 7.03 |
|
|
| 14.59 |
|
|
|
| 3.50 |
|
|
| 7.03 |
| ||
Healthcare & Pharmaceuticals |
|
| 9.01 |
|
|
| 1.85 |
|
|
|
| 8.87 |
|
|
| 9.01 |
| ||
High Tech Industries |
|
| 3.39 |
|
|
| — |
|
|
|
| 3.59 |
|
|
| 3.39 |
| ||
Hotel, Gaming & Leisure |
|
| 6.58 |
|
|
| 2.36 |
|
|
|
| 10.14 |
|
|
| 6.58 |
| ||
Media: Advertising, Printing & Publishing |
|
| 4.60 |
|
|
| 6.69 |
|
|
|
| 3.33 |
|
|
| 4.60 |
| ||
Media: Diversified & Production |
|
| 9.21 |
|
|
| 10.62 |
|
|
|
| 3.48 |
|
|
| 9.21 |
| ||
Metals & Mining |
|
| 0.32 |
|
|
| — |
|
|
|
| — |
|
|
| 0.32 |
| ||
Retail |
|
| 2.33 |
|
|
| 3.67 |
|
|
|
| 7.60 |
|
|
| 2.33 |
| ||
Services: Business |
|
| 12.90 |
|
|
| 10.85 |
|
|
|
| 12.82 |
|
|
| 12.90 |
| ||
Services: Consumer |
|
| 16.62 |
|
|
| 14.01 |
|
|
|
| 7.16 |
|
|
| 16.62 |
| ||
Telecommunications |
|
| 2.14 |
|
|
| 5.27 |
|
|
|
| 8.33 |
|
|
| 2.14 |
| ||
Transportation: Cargo |
|
| 2.94 |
|
|
| — |
| |||||||||||
Transportation: Consumer |
|
| — |
|
|
| 5.23 |
|
|
|
| 3.56 |
|
|
| — |
| ||
Wholesale |
|
| 2.17 |
|
|
| 7.84 |
|
|
|
| 1.06 |
|
|
| 2.17 |
| ||
Total |
|
| 100.00 |
| % |
|
| 100.00 |
| % |
|
| 100.00 | % |
|
| 100.00 | % | |
Target Portfolio Characteristics
The Company aims to construct a unique and diversified portfolio comprised of senior secured loans, which may include “covenant-lite” loans (as defined below), to deliver high current yield with a compelling risk-reward profile. The portfolio may deviate from these long-term portfolio targets at various points in time due to market conditions and available investment opportunities.
5
There are no restrictions on the credit quality of the investments that the Company may make. Securities in which the Company may invest may be deemed by rating companies to have substantial vulnerability to default in payment of interest and/or principal. Other securities may be unrated. Lower-rated and unrated securities in which the Company may invest have large uncertainties or major risk exposures to adverse conditions, and are considered to be predominantly speculative. Generally, such securities offer a higher return potential than higher-rated securities, but involve greater volatility of price and greater risk of loss of income and principal.
Types of Principal Investments
First Lien Senior Secured Loans. These loans are generally the most senior financing in the capital structure, supported by first-priority liens on all or substantially all of the Portfolio Company’s collateral. First lien senior secured loans generally allow the borrower to defer the majority of principal repayments
5
to the end of the loan term, and as a result there is a risk of loss if the borrower is unable to pay the lump sum or refinance the principal amount owed at maturity. In some instances we may structure these loans to provide for loan amortization of varying amounts over the loan term, excess cash flow sweeps, and sweeps on proceeds from asset sales.
Unitranche Loans. These loans are also generally characterized by being the most senior financing in the capital structure, supported by first-priority liens on all or substantially all of the Portfolio Company’s collateral. These loans differ from First Lien Senior Secured Loans in that they generally provide incremental proceeds to the borrower (beyond what a typical First Lien Senior Secured Loan would provide). In return, lenders generally receive a higher return on these loans. Unitranche loans generally allow the borrower to defer the majority of principal repayments to the end of the loan term, and as a result there is a risk of loss if the borrower is unable to pay the lump sum or refinance the principal amount owed at maturity. In some instances, we may structure these loans to provide for loan amortization of varying amounts over the loan term, excess cash flow sweeps, and sweeps on proceeds from asset sales.
Second Lien Loans. These loans are generally characterized by a second-out position in the capital structure, supported by second-priority liens on all or substantially all of the Portfolio Company’s collateral. Once all first lien loans have been repaid, remaining proceeds generally accrue to paying back the second lien loans before repayment of any other liabilities.
Preferred Investments. In a limited number of cases, the Company may make preferred investments in Portfolio Companies where we believe there is attractive downside protection relative to the opportunity to achieve higher rates of return. Returns may come in the form of a fixed rate of interest, or in the form of capital appreciation through a conversion feature. These investments are typically structured in a senior position to common equity and may impose restrictions on the Portfolio Company meant to protect our downside.
Equity Investments. In a limited number of cases, the Company may make equity investments in Portfolio Companies where we believe the potential returns are attractive and there is significant potential to enhance the overall yield to our investors.
The composition of the Company’s investment portfolio at amortized cost and fair value as of December 31, 2023 and December 31, 2022 was as follows:
|
| December 31, 2022 |
|
| December 31, 2021 |
|
|
| December 31, 2023 |
|
| December 31, 2022 |
| |||||||||||||||||||||||||||||||||||||
|
| Amortized Cost |
|
| Fair Value |
|
| % of Total Investments at Fair Value |
|
| Amortized Cost |
|
| Fair Value |
|
| % of Total Investments at Fair Value |
|
|
| Amortized Cost |
|
| Fair Value |
|
| % of Total Investments at Fair Value |
|
| Amortized Cost |
|
| Fair Value |
|
| % of Total Investments at Fair Value |
| |||||||||||||
First lien debt |
| $ | 774,611 |
|
| $ | 748,545 |
|
|
| 76.25 |
| % |
| $ | 484,704 |
|
| $ | 486,044 |
|
|
| 70.20 |
| % |
| $ | 1,942,665 |
|
| $ | 1,942,843 |
|
|
| 88.43 | % |
| $ | 774,611 |
|
| $ | 748,545 |
|
|
| 76.25 | % |
Second lien debt |
|
| 227,937 |
|
|
| 210,926 |
|
|
| 21.48 |
|
|
| 144,892 |
|
|
| 145,396 |
|
|
| 21.00 |
|
|
|
| 234,306 |
|
|
| 226,318 |
|
|
| 10.30 |
|
|
| 227,937 |
|
|
| 210,926 |
|
|
| 21.48 |
| |
Unsecured debt |
|
| — |
|
|
| — |
|
|
| 0.00 |
|
|
| 36,093 |
|
|
| 36,220 |
|
|
| 5.23 |
|
| |||||||||||||||||||||||||
Preferred equity |
|
| 28,519 |
|
|
| 22,267 |
|
|
| 2.27 |
|
|
| 25,043 |
|
|
| 24,697 |
|
|
| 3.57 |
|
|
|
| 31,846 |
|
|
| 27,892 |
|
|
| 1.27 |
|
|
| 28,519 |
|
|
| 22,267 |
|
|
| 2.27 |
| |
Total investments |
| $ | 1,031,067 |
|
| $ | 981,738 |
|
|
| 100.00 |
| % |
| $ | 690,732 |
|
| $ | 692,357 |
|
|
| 100.00 |
| % |
| $ | 2,208,817 |
|
| $ | 2,197,053 |
|
|
| 100.00 | % |
| $ | 1,031,067 |
|
| $ | 981,738 |
|
|
| 100.00 | % |
BDT & MSD Advantage
We believe the Company is uniquely positioned to generate compelling risk-adjust returns in its target market for the following reasons:
6
6
Investment Process
Origination / Pre-Screen. The Credit Team will source opportunities through the teamTeam's and broader BDT & MSD’s network of relationships with families and founders, companies, brokers, and private equity firms. We believe these relationships and the brand that BDT & MSD has built enables usthem to maximize deal flow, engage in a highly selective investment process, and provide the Company the opportunity to construct a well- diversifiedwell-diversified portfolio. In this stage, we screen forAs opportunities that fit our Target Investment Criteria. The process begins withare sourced, the investment team, reviewingwhich is generally composed of a Portfolio Manager, and other team members, as applicable, (the “Investment Team”), reviews the offering memorandum and other high-level information. The team leverages its existing knowledge base,information and works withscreens the deal to determine if it fits BDT & MSD’s target investment criteria, taking into consideration economic terms and structure. In addition, the Team engages other BDT & MSD investment teams (e.g., private equity, real estate, growth equity, etc.) to understand any work that has previously been performed in evaluating similar businesses or the relevantrespective industry. In this stage, the team also discusses high level economic terms and structure. The screening process concludes with a discussion among the team to decideCredit Team’s investment committee whether to proceed with the opportunity. If the decision is madeThe Credit Team considers sponsor track record and reputation when deciding whether to pursue the opportunity, our team will begin evaluating the credit in detail.an investment.
Credit Evaluation. Once the decision has been made to move forward with an investment opportunity, a team of investment professionals will begin the formal due diligence process. This may include signing a confidentiality agreement or non-disclosure agreement to gain access to relevant financial and operational data for the underlying company. The investment team, which is generally composed of a Portfolio Manager, and two other team members (the “Investment Team”), may attend meetings or phone calls with the prospective company’s management team, review historical audits, review forecasted financialsfinancial information and third-party diligence reports, conduct independent research, engage experts in the relevant industry, and perform an analysis of base case and downside scenarios. The teamInvestment Team also contacts BDT & MSD’s legal department to discuss the transaction, and gain insight into key issues that might be relevant in evaluating the credit and negotiating the terms. Throughout this process, the Investment Team and the portfolio managers communicate on a regular basis to discuss any diligence findings that materially alter the initial thesis. If we do not find a material issue in ourthe underwriting process, and we are selected by the counterparty, we will move to the documentation stage.
Documentation. Once we move to definitive documentation, we engage our internal team of lawyers who – along with select third-party counsel, where applicable, with relevant sector expertise – work closely with the deal team to ensure that the documents reflect the Company’s agreement with the borrower.
Investment Monitoring. Once an investment has closed, the teamInvestment Team that completed the underwriting will generally remain in charge of monitoring the investment. We take an active approach to monitoring all of our investments, including quarterly calls with management, updating internal financial and operational performance tracking, and evaluating comparable companies’ performance to benchmark the performance of our underlying portfolio companies. We hold weekly meetings with the Credit Team to discuss our portfolio companies, and we hold weekly meetings with the entire firm where we discuss macroeconomic news that may impact our individual portfolio companies.
Exit Strategies / Refinancing. While we generally expect to exit most investments through the refinancing or repayment of our debt, we may also engage in secondary market sales of investments.
Risk Ratings
We monitor the operational and financial trends of our portfolio companies on at least a quarterly basis. We attempt to identify any developments in the underlying company or industry that may alter any material element of our original investment thesis. We discuss each position at least once quarterly to ensure the Investment Team, and the portfolio managers, are apprised of any material developments and to determine any required portfolio management actions.
We utilize an investment rating system to monitor the credit profile of our underlying portfolio companies. We use a five-level ratingsrating scale to classify individual investments.
7
The following table shows the investment rankings of the debt investments in our portfolio as of December 31, 2023 and December 31, 2022:
|
| As of December 31, 2022 |
|
| As of December 31, 2023 |
|
| As of December 31, 2022 |
| ||||||||||||||||||||||||||||
Risk Rating |
| Fair Value |
|
| % of Portfolio |
|
|
| # of Investments |
|
| Fair Value |
|
| % of Portfolio |
|
| # of Investments |
|
| Fair Value |
|
| % of Portfolio |
|
| # of Investments |
| |||||||||
1 |
| $ | — |
|
|
| 0.0 |
| % |
|
| — |
|
| $ | — |
|
|
| 0.0 | % |
|
| — |
|
| $ | — |
|
|
| 0.0 | % |
|
| — |
|
2 |
|
| 116,109 |
|
|
| 11.8 |
|
|
| 7 |
|
|
| 70,386 |
|
|
| 3.2 |
|
|
| 2 |
|
|
| 116,109 |
|
|
| 11.8 |
|
|
| 7 |
| |
3 |
|
| 859,792 |
|
|
| 87.6 |
|
|
| 44 |
|
|
| 2,123,142 |
|
|
| 96.7 |
|
|
| 89 |
|
|
| 859,792 |
|
|
| 87.6 |
|
|
| 44 |
| |
4 |
|
| 5,837 |
|
|
| 0.6 |
|
|
| 2 |
|
|
| 1,096 |
|
|
| 0.0 |
|
|
| 1 |
|
|
| 5,837 |
|
|
| 0.6 |
|
|
| 2 |
| |
5 |
|
| — |
|
|
| 0.0 |
|
|
| — |
|
|
| 2,429 |
|
|
| 0.1 |
|
|
| 1 |
|
|
| — |
|
|
| 0.0 |
|
|
| — |
| |
|
| $ | 981,738 |
|
|
| 100.0 |
| % |
|
| 53 |
|
| $ | 2,197,053 |
|
|
| 100.0 | % |
|
| 93 |
|
| $ | 981,738 |
|
|
| 100.0 | % |
|
| 53 |
|
Emerging Growth Company
We are an emerging growth company as defined in the JOBS Act and we are eligible to take advantage of certain specified reduced disclosure and other requirements that are otherwise generally applicable to public companies that are not “emerging growth companies” including, but not limited to, not being required to comply with the auditor attestation requirements of Section 404 of the Sarbanes-Oxley Act of 2002 (the “Sarbanes-Oxley Act”). We expect to remain
7
an emerging growth company for up to five years following the completion of our initial public offering (“IPO”) or until the earliest of (i) the last day of the first fiscal year in which our annual gross revenues equals or exceeds $1.235 billion, (ii) December 31 of the fiscal year that we become a “large accelerated filer” as defined in Rule 12b-2 under the 1934Exchange Act which would occur if the market value of our common stock that is held by non-affiliates exceeds $700.0 million as of the last business day of our most recently completed second fiscal quarter and we have been publicly reporting for at least 12 months or (iii) the date on which we have issued more than $1.0 billion in non-convertible debt securities during the preceding three-year period. In addition, we will take advantage of the extended transition period provided in Section 7(a)(2)(B) of the Securities Act of 1933, as amended (the “1933 Act”) for complying with new or revised accounting standards.
The Private Offering
Common Stock
Pursuant to a private offering, we are offering shares of our common stock to “accredited investors” as defined in Rule 501(a) of Regulation D promulgated under the 1933 Act in reliance on exemptions from the registration requirements of the 1933 Act (the “Private Offering”). There will be no limit on the number of shares or the amount of capital raised in connection with the Private Offering. Each investor will make a capital commitment to purchase shares of our common stock pursuant to a subscription agreement entered into with us. At each closing in the Private Offering, investors will be required to purchase additional shares up to the amount of their respective unfunded capital commitments. As discussed above, the The first closing date took place on December 21, 2021 (“Initial Closing Date of the Private Offering occurred during the fourth quarter of 2021. Subsequent Closings”). Additional closings are expected to occur from time to time as determined by the Company.Company, and the final such closing will occur no later than the fifth anniversary of the Initial Closing Date, subject to a one-year extension at the discretion of the Board.
Series A Preferred Stock
On November 29, 2023, the Company issued 250 shares of its 12.0% Series A Cumulative Preferred Stock (the “Series A Preferred Stock”) for an aggregate offering price of $750,000. Each individual investor in the offering was entitled to purchase only one share of Series A Preferred Stock. Each holder of Series A Preferred Shares is entitled to a liquidation preference of $3,000.00 per share (the “Liquidation Value”), plus additional amounts as set forth in the Articles Supplementary to the Company’s Articles of Incorporation Relating to the 12.0% Series A Cumulative Preferred Stock. With respect to distributions, including the payment of dividends and distribution of the Company’s assets upon dissolution, liquidation, or winding up, the Series A Preferred Stock will be senior to all other classes and series of the Company’s common shares, whether such class or series is now existing or is created in the future, to the extent of the aggregate Liquidation Value and all accrued but unpaid dividends and any applicable redemption premium on the Series A Preferred Stock. Holders of shares of the Series A Preferred Stock will not, however, participate in any appreciation in the value of the Company.
Dividends on each share of Series A Preferred Stock will accrue on a daily basis at the rate of 12% per annum of the sum of the Liquidation Value thereof plus all accumulated and unpaid dividends thereon, from and including the date of issuance to and including the earlier of (1) the date of any liquidation, dissolution, or winding up of the Company or (2) the date on which such Series A Preferred Share is redeemed. Dividends will accrue whether or not they have been authorized or declared, whether or not the Company has earnings, and whether or not there are funds legally available for payment of dividends.
The outstanding shares of Series A Preferred Stock are subject to redemption at any time, upon the approval of the Board, by notice of such redemption on a date selected by the Company for such redemption (the “Redemption Date”). If the Company elects to cause the redemption of the Series A Preferred Stock, each share of Series A Preferred Stock will be redeemed for a price, payable in cash on the Redemption Date, equal to 100% of such share’s Liquidation Value, plus all accrued and unpaid dividends to the Redemption Date, plus a redemption premium as follows: (1) if the redemption date occurs prior to the second anniversary of the date on which the Preferred Shares were originally issued, a redemption premium of $300; and (2) thereafter, no redemption premium. From and after the close of business on the Redemption Date, all dividends on the outstanding shares of Series A Preferred Stock will cease to accrue, such shares will no longer be deemed to be outstanding, and all rights of the holders of such shares (except the right to receive the redemption price for such shares from the Company) will cease.
Regulation as a Business Development Company
The following discussion is a general summary of the material prohibitions and descriptions governing BDCs generally. It does not purport to be a complete description of all of the laws and regulations affecting BDCs.
Qualifying Assets. Under the 1940 Act, a BDC may not acquire any asset other than assets of the type listed in Section 55(a) of the 1940 Act, which are referred to as “qualifying assets,” unless, at the time the acquisition is made, qualifying assets represent at least 70% of the company’s total assets. The principal categories of qualifying assets relevant to the Company’s business are any of the following:
8
In addition, a BDC must be operated for the purpose of making investments in the types of securities described in (1), (2) or (3) above.
8
Significant Managerial Assistance. A BDC must have been organized and have its principal place of business in the United States and must be operated for the purpose of making investments in the types of securities described above. A BDC must also offer to make available to the issuer of the qualifying assets significant managerial assistance; except that, where the BDC purchases such securities in conjunction with one or more other persons acting together, one of the other persons in the group may make available such managerial assistance. Making available significant managerial assistance means, among other things, any arrangement whereby the BDC, through its directors, officers or employees, offers to provide and, if accepted, does so provide, significant guidance and counsel concerning the management, operations or business objectives and policies of a portfolio company through monitoring of portfolio company operations, selective participation in board and management meetings, consulting with and advising a portfolio company’s officers or other organizational or financial guidance. The Administrator or its affiliate provides such services on our behalf to portfolio companies that accept our offer of managerial assistance.
Temporary Investments. Pending investment in other types of qualifying assets, as described above, the Company’s investments can consist of cash, cash equivalents, U.S. government securities or high qualityhigh-quality debt securities maturing in one year or less from the time of investment, which are referred to herein, collectively, as temporary investments, so that 70% of the Company’s assets would be qualifying assets.
Issuance of Warrants, Options or Rights. Under the 1940 Act, a BDC is subject to restrictions on the issuance, terms and amount of warrants, options or rights to purchase shares of stock that it may have outstanding at any time. In particular, the amount of shares that would result from the conversion or exercise of all outstanding warrants, options or rights to purchase shares cannot exceed 25% of the BDC’s total outstanding shares.
Senior Securities; Asset Coverage Ratio. The Company is generally permitted, under specified conditions, to issue multiple classes of indebtedness and one class of stock senior to our Shares if our asset coverage, as defined in the 1940 Act, is at least equal to 150% (i.e., we can borrow $2 for every $1 of equity), if certain requirements are met. In connection with the organization of the Company, the Board and the Company’s initial shareholder authorized the Company to adopt the 150% Asset Coverage Ratio.asset coverage ratio.
In addition, while certain types of senior securities remain outstanding, the Company will be required to make provisions to prohibit the payment of any dividend distribution to our shareholders or the repurchase of such shares unless we meet the applicable Asset Coverage Ratioasset coverage ratio at the time of the dividend distribution or repurchase. The Company will also be permitted to borrow amounts up to 5% of the value of our total assets for temporary purposes, which borrowings would not be considered senior securities. The Company’s borrowings, whether for temporary purposes or otherwise, are subject to the asset coverage requirements of section 61(a)(1) of the 1940 Act.
Code of Ethics. The Company and the Adviser arehave each subject toadopted a code of ethics pursuant to Rule 17j-1 under the 1940 Act and Rule 204A-1 under the Advisers Act, respectively, that establishes procedures for personal investments and restricts certain personal securities transactions by the Company’s officers and the Adviser’s employees. The Company has also adopted a separate code of ethics pursuant to Rule 17j-1 under the 1940 Act that establishes procedures for personal investments and restricts certain personal securities transactions by the Company’s independent directors. Individuals subject to these codes are permitted to invest in securities for their personal investment accounts, including securities that may be purchased or held by the Company, so long as such investments are made in accordance with such code’s requirements. You may obtain copies of these codes of ethics by e-mailing our Adviser at legal&compliance@msdpartners.com, compliance@bdtmsd.com,
9
or by writing to our Adviser at Investor Relations investorrelations@msdpartners.com .IR@bdtmsd.com. The code of ethics is also available on the EDGAR database on the SEC’s Internet site at http://www.sec.gov. You may also obtain copies of the code of ethics, after paying a duplicating fee, by electronic request at the following email address: publicinfo@sec.gov.
Affiliated Transactions. The Company may be prohibited under the 1940 Act from conducting certain transactions with its affiliates without the prior approval of our independent directors and, in some cases, the prior approval of the SEC.
The Company expects to co-invest on a concurrent basis with other affiliates of the Company and the Adviser, unless doing so would be impermissible under existing regulatory guidance, applicable regulations, the terms of any exemptive relief granted to the Company and its affiliates, and the allocation procedures of MSD. On February 16, 2022, the Adviser, the Company, and certain other funds and accounts sponsored or managed by the Adviser and/or its affiliates were granted an order (the “Order”), which was amended on August 31, 2022, that permits the Company to co-invest in portfolio companies with certain funds and entities managed by the Adviser or its affiliates in certain negotiated transactions where co-investing would otherwise be prohibited under the 1940 Act, subject to the conditions of the Order. The Company believes that the ability to co-invest with similar investment structures and accounts sponsored or managed by the Adviser and its affiliates will provide additional investment opportunities and the ability to achieve greater diversification. Pursuant to the Order, we are permitted to co-invest with our affiliates if a ‘‘required majority’’ (as defined in Section 57(o) of the 1940 Act) of our directors who are not “interested persons” (as defined in Section 2(a)(19) of the 1940 Act) of the Company make certain conclusions in connection with a co-investment transaction, including, but not limited to, that (1) the terms of the potential co-investment transaction, including the consideration to be paid, are reasonable and fair to us and our shareholders and do not involve overreaching in respect of us or our shareholders on the part of any person concerned, and (2) the potential co-investment transaction is consistent with the interests of our shareholders and is consistent with our then-current investment objective and strategies. The Board will regularly review the allocation policy of MSD.
Other. The Company will be periodically examined by the SEC for compliance with the 1940 Act, and be subject to the periodic reporting and related requirements of the 1934Exchange Act.
The Company is also required to provide and maintain a bond issued by a reputable fidelity insurance company to insure against larceny and embezzlement. Furthermore, as a BDC, the Company is prohibited from protecting any director or officer against any liability to shareholders arising from willful misfeasance, bad faith, gross negligence or reckless disregard of the duties involved in the conduct of such person’s office.
The Company is also required to designate a chief compliance officer and to adopt and implement written policies and procedures reasonably designed to prevent violation of the federal securities laws and to review these policies and procedures annually for their adequacy and the effectiveness of their implementation.
The Company is not permitted to change the nature of its business so as to cease to be, or to withdraw our election as, a BDC unless approved by a majority of its outstanding voting securities. A majority of the outstanding voting securities of a company is defined under the 1940 Act as the lesser of: (i) 67% or more of such company’s shares present at a meeting if more than 50% of the outstanding shares of such company are present or represented by proxy, or (ii) more than 50% of the outstanding shares of such company.
9
Proxy Voting Policies and Procedure
We have delegated our proxy voting responsibility to the Adviser. A summary of the Proxy Voting Policies and Procedures of our adviser are set forth below. The guidelines are reviewed periodically by the Adviser and our non-interested directors, and, accordingly, are subject to change.
As an investment adviser registered under the Advisers Act, the Adviser has a fiduciary duty to act solely in the best interests of its clients. As part of this duty, it recognizes that it must vote for securities held by its clients in a timely manner free of conflicts of interest. These policies and procedures for voting proxies for investment advisory clients are intended to comply with Section 206 of, and Rule 206(4)-6 under, the Advisers Act.
The Adviser votes proxies relating to our portfolio securities in the best interest of Shareholders. The Adviser reviews on a case-by-case basis each proposal submitted for a proxy vote to determine its impact on our investments. Although it generally votes against proposals that may have a negative impact on our investments, it may vote for such a proposal if there exists compelling long-term reasons to do so. The proxy voting decisions of the Adviser are made by the senior investment professionals who are responsible for monitoring each of our investments. To ensure that our vote is not the product of a conflict of interest, it requires that: (i) anyone involved in the decision making process disclose to a managing member of the Adviser any potential conflict that he or she is aware of and any contact that he or she has had with any interested party regarding a proxy vote; and (ii) employees involved in the decision making process or vote administration are prohibited from revealing how we intend to vote on a proposal in order to reduce any attempted influence from interested parties.
You may obtain information about how we voted proxies by making a written request for proxy voting information to: MSD Investment Corp., One Vanderbilt Avenue, 26th Floor, New York, NY 10022-5910.
Privacy Policy
We are committed to maintaining the privacy of our Shareholders and to safeguarding their non-public personal information. The following information is provided to help you understand what personal information we may have access to, how we protect that information and why, in certain cases, we may share information with select other parties.
Generally, we do not receive any non-public personal information relating to our Shareholders, although certain non-public personal information of our Shareholders may become available to us. We do not disclose any non-public personal information about our Shareholders or former shareholders to anyone, except as permitted by law or as is necessary in order to service Shareholder accounts (for example, through a transfer agent or third-party administrator).
We restrict access to non-public personal information about our Shareholders to employees of our investment adviser and its affiliates with a legitimate business need for the information. We maintain physical, electronic and procedural safeguards designed to protect the non-public personal information of our Shareholders.
Reporting Obligations
10
We will furnish our Shareholders with annual reports containing audited financial statements, quarterly reports, and such other periodic reports as we determine to be appropriate or as may be required by law. We are filing this Registration Statement with the SEC voluntarily with the intention of establishing the Company as a reporting company under the Exchange Act. Upon the effectiveness of this Registration Statement, we will be required to comply with all periodic reporting, proxy solicitation and other applicable requirements under the Exchange Act. The SEC maintains an Internet site that contains reports, proxy and information statements and other information filed electronically by us with the SEC, which are available on the SEC’s website at http://www.sec.gov. Copies of these reports, proxy and information statements and other information may be obtained, after paying a duplicating fee, by electronic request at the following e-mail address: publicinfo@sec.gov
Taxation as a Regulated Investment Company
We have elected, and intend to qualify annually thereafter, to be treated as a RIC for U.S. federal income tax purposes under Subchapter M of the Code. As a RIC, we generally will not be subject to U.S. federal income tax on any net ordinary income or capital gains that we timely distribute to our shareholders as dividends. Rather, dividends distributed by us generally will be taxable to our shareholders, and any net operating losses, foreign tax credits and other tax attributes of ours generally will not pass through to our shareholders, subject to certain exceptions and special rules for certain items such as net capital gains and qualified dividend income recognized by us.
To qualify as a RIC, we must, among other things, meet certain source-of-income and asset diversification requirements (as described below). In addition, to be eligible to be taxed as a RIC, we must timely distribute to our shareholders, for each taxable year, at least 90.0% of our “investment company taxable income,” which is generally our net ordinary income plus the excess of realized net short-term capital gains over realized net long-term capital losses (the “Annual Distribution Requirement”). The following discussion assumes that we qualify as a RIC and have satisfied the Annual Distribution Requirement.
If the Company:
then we will not be subject to U.S. federal income tax on the portion of our income that is timely distributed (or is deemed to be timely distributed) to our shareholders. If we fail to qualify as a RIC, we will be subject to U.S. federal income tax at regular corporate rates on our income and capital gains not distributed (or deemed distributed) to our shareholders.
We will be subject to a 4.0% nondeductible U.S. federal excise tax on certain undistributed income unless we distribute in a timely manner each calendar year an amount at least equal to the sum of (1) 98.0% of our net ordinary income for each calendar year, (2) 98.2% of our capital gain net income for the one-year period ending October 31 in that calendar year and (3) any ordinary income and net capital gain that we recognized in preceding years, but were not distributed during such years and on which we did not pay U.S. federal income tax (the “Excise Tax Avoidance Requirement”). While we intend to make distributions to our shareholders in each taxable year that will be sufficient to avoid any U.S. federal excise tax on our earnings, there can be no assurance that we will be successful in entirely avoiding this tax.
10
In order to qualify as a RIC for U.S. federal income tax purposes, we must, among other things:
For U.S. federal income tax purposes, the Company may be required to include in our taxable income certain amounts that we have not yet received in cash. For example, if the Company holds debt obligations that are treated under applicable tax rules as having original issue discount (such as debt instruments with PIK interest or, in certain cases, increasing interest rates or issued with warrants), it must include in its taxable income in each year the portion of the original issue discount that accrues over the life of the obligation, regardless of whether cash representing such income is received by the Company in the same taxable year. The Company may also have to include in its taxable income other amounts that it has not yet received in cash, such as accruals on a contingent payment debt instrument or deferred loan origination fees that are paid after origination of the loan or are paid in non-cash compensation such as warrants or stock. Because original issue discount or other amounts accrued will be included in the Company’s investment company taxable income for the year of accrual and before the Company receives any corresponding cash payments, it may be required to make a distribution to shareholders in order to satisfy the Annual Distribution Requirement, even though it would not have received any corresponding cash payment.
Accordingly, to enable us to satisfy the Annual Distribution Requirement, we may need to sell some of our assets at times and/or at prices that we would not consider advantageous, we may need to raise additional equity or debt capital or we may need to forego new investment opportunities or otherwise take actions that are disadvantageous to our business (or be unable to take actions that are advantageous to our business). If we are unable to obtain cash from other sources to enable us to satisfy the Annual Distribution Requirement, we may fail to qualify for the U.S. federal income tax benefits allowable to RICs and, thus, become subject to U.S. federal income tax at corporate rates (and any applicable state and local taxes).
We may be prevented by financial covenants contained in our debt financing agreements, if any, from making distributions to our Shareholders. In addition, under the 1940 Act, we are generally not permitted to make distributions to our Shareholders while our debt obligations and other senior securities are
11
outstanding unless certain ‘‘asset coverage’’ tests are met. Limits on distributions to our Shareholders may prevent us from satisfying the Annual Distribution Requirement and, therefore, may jeopardize our qualification for taxation as a RIC or subject us to the 4.0% U.S. federal excise tax.
Although the Company does not presently expect to do so, we may borrow funds and sell assets in order to make distributions to our shareholders that are sufficient for us to satisfy the Annual Distribution Requirement. However, the Company’s ability to dispose of assets may be limited by (i) the illiquid nature of its portfolio and/or (ii) other requirements relating to its status as a RIC, including the Diversification Tests. If the Company disposes of assets in order to meet the Annual Distribution Requirement or the Excise Tax Avoidance Requirement, it may make such dispositions at times that, from an investment standpoint, are not advantageous. If the Company is unable to obtain cash from other sources to satisfy the Annual Distribution Requirement, it may fail to qualify for tax treatment as a RIC and become subject to tax as an ordinary corporation.
Certain of the Company’s investment practices may be subject to special and complex U.S. federal income tax provisions that may, among other things: (i) disallow, suspend or otherwise limit the allowance of certain losses or deductions; (ii) convert lower taxed long-term capital gain into higher taxed short-term capital gain or ordinary income; (iii) convert an ordinary loss or a deduction into a capital loss (the deductibility of which is more limited); (iv) cause the Company to recognize income or gain without a corresponding receipt of cash; (v) adversely affect the time as to when a purchase or sale of securities is deemed to occur; (vi) adversely alter the characterization of certain complex financial transactions; and (vii) produce income that will not be qualifying income for purposes of the 90% Income Test described above. The Company will monitor its transactions and may make certain tax decisions in order to mitigate the potential adverse effect of these provisions.
A RIC is limited in its ability to deduct expenses in excess of its “investment company taxable income” (which is, generally, ordinary income plus the excess of net short-term capital gains over net long-term capital losses). If Company expenses in a given year exceed investment company taxable income, the Company would experience a net operating loss for that year. However, a RIC is not permitted to carry forward net operating losses to subsequent years. In addition, expenses can be used only to offset investment company taxable income, not net capital gain. Due to these limits on the deductibility of expenses, the Company may, for tax purposes, have aggregate taxable income for several years that it is required to distribute and that is taxable to shareholders even if such income is greater than the aggregate net income it actually earned during those years. Such required distributions may be made from cash assets or by liquidation of investments, if necessary. The Company may realize gains or losses from such liquidations. In the event the Company realizes net capital gains from such transactions, a shareholder may receive a larger capital gain distribution than it would have received in the absence of such transactions.
Failure to Qualify as a RIC
If we fail to qualify for treatment as a RIC, we will be subject to U.S. federal income tax on all of our taxable income at regular corporate rates (and also will be subject to any applicable state and local taxes), regardless of whether we make any distributions to our shareholders. If we have qualified as RIC and then we subsequently fail to satisfy the 90% Income Test or the Diversification Tests for any taxable year or quarter of such taxable year, we may nevertheless continue to qualify as a RIC for such year if certain relief provisions of the Code apply (which may, among other things, require us to pay certain U.S. federal income taxes at corporate rates or to dispose of certain assets). If we fail to qualify for treatment as a RIC and such relief provisions do not apply to us, we will be subject
11
to U.S. federal income tax on all of our taxable income at regular corporate rates (and also will be subject to any applicable state and local taxes), regardless of whether we make any distributions to our shareholders. In any taxable year that we do not qualify as a RIC, distributions would not be required and, if distributions were made, any such distributions would be taxable to our shareholders as ordinary dividend income to the extent of our current and accumulated earnings and profits. Subject to certain limitations under the Code, any such distributions would be eligible for the 20.0% maximum rate applicable to non-corporate taxpayers, and corporate distributees would be eligible for the dividends-received deduction. Distributions in excess of our current and accumulated earnings and profits would be treated first as a return of capital to the extent of the shareholder’s adjusted tax basis, and any remaining distributions would be treated as a capital gain. The term “return of capital” merely means distributions in excess of our earnings and as such may constitute a return on an investor's individual investments and does not mean a return on capital.
Subject to a limited exception applicable to RICs that qualified as such under Subchapter M of the Code for at least one year prior to disqualification and that requalify as a RIC no later than the second year following the non-qualifying year, we could be subject to tax on any unrealized net built-in gains in the assets held by us during the period in which we failed to qualify as a RIC that are recognized during the five-year period after our requalification as a RIC, unless we made a special election to pay U.S. federal income tax at corporate rates on such built-in gain at the time of our qualification or requalification as a RIC.
Item 1A. Risk Factors.
Investing in our common stock involves significant risks. An investor should consider, among other factors, the risk factors set forth below, which are subject to (or, if applicable, modified by) the requirements and obligations described in the Subscription Agreement before making a decision to purchase our common stock. Additional risks and uncertainties not presently known to us or not presently deemed material by us may also impair our operations and performance. If any of the following events occur, our business, financial condition, results of operations and cash flows could be materially and adversely affected.
Summary of Principal Risk Factors
The following is a summary of the principal risks that you should carefully consider before investing in our securities.
We are subject to risks related to our business and structure, including, but not limited to, the following:
12
We are subject to risks related to an investment in our Shares, including, but not limited to, the following:
We are subject to risks related to our investments, including, but not limited to, the following:
12
We are subject to risks related to the economy, including, but not limited to, the following:
We are subject to risks related to our Adviser and its affiliates, including, but not limited to, the following:
We are subject to risks related to U.S. federal income tax including, but not limited to, the following:
13
Risks Related to Our Business and Structure
We have a limited operating history as a BDC.
We commenced operations as a private fund exempt from registration pursuant to Section 3(c)(7) of the 1940 Act on February 18, 2021, and elected to be treatedregulated as a BDC on December 29, 2021. Accordingly, we have a limited operating history as a BDC and have and will continue to rely upon the investment experience of the personnel of our Adviser for our success. There can be no assurance that we will achieve the results achieved by firms with similar strategies managed by MSD or its affiliates. Past performance should not be relied upon as an indication of future results. Moreover, we are subject to all of the business risks and uncertainties associated with any new business, including the risk that we will not achieve our investment objectives and that the value of an investor’s investment could decline substantially, or that the investor will suffer a complete loss of its investment in us.
The Adviser and the members of the management team have no prior experience managing a BDC, and the investment philosophy and techniques used by the Adviser to manage a BDC may differ from the investment philosophy and techniques previously employed by the Adviser, its affiliates, and the members of the management team in identifying and managing past investments. In addition, the 1940 Act and the Code impose numerous constraints on the operations of BDCs and RICs that do not apply to the other types of investment vehicles. For example, under the 1940 Act, BDCs are required to invest at least 70% of their total assets primarily in securities of qualifying U.S. private companies or thinly traded public companies, cash, cash equivalents, U.S. government securities and other high-quality debt investments that mature in one year or less from the time of investment. The Adviser’s and the members of the management team’s limited experience in managing a portfolio of assets under such constraints may hinder their respective ability to take advantage of attractive investment opportunities and, as a result, achieve our investment objectives.
Our ability to achieve our investment objective depends on our Adviser’s ability to manage and support our investment process. If our Adviser were to lose a significant number of its key professionals, fail to attract or retain talent, or terminate the Investment Advisory Agreement, our ability to achieve our investment objective could be significantly harmed.
We do not have any employees, and we have no internal management capacity other than our appointed executive officers. Accordingly, we are dependent upon the investment expertise, skill and network of business contacts of our Adviser to actively manage our investment portfolio and to achieve our investment objective. Our Adviser will evaluate, negotiate, execute, monitor, and service our investments. Our success will depend to a significant extent on the continued service and coordination of our Adviser, including its key professionals, to identify, analyze, invest in, finance, and monitor companies that meet our investment criteria. Our Adviser’s capabilities in structuring the investment process, and providing competent, attentive and efficient services to us depend on the involvement of investment professionals of adequate number and sophistication to match the corresponding flow of transactions. To achieve our investment objective, our Adviser may need to retain, hire, train, supervise, and manage new investment professionals to participate in our investment selection and monitoring process. Our Adviser may not be able to find qualified investment professionals in a timely manner or at all. Any failure to do so could have a material
13
adverse effect on our business, financial condition and results of operations. The departure of a significant number of key professionals from our Adviser could have a material adverse effect on our ability to achieve our investment objective.
In addition to the above dependencies, the Adviser’s investment professionals are actively involved in managing the investment decisions of other funds, as well as investment decisions of other clients of MSD. Accordingly, these investment professionals will have demands on their time for the investment, monitoring and other functions of other funds and other clients advised by the Adviser. See “Risks Related to our Adviser and its Affiliates -- We may compete for capital and investment opportunities with other entities managed by our Adviser or its affiliates, subjecting our Adviser to certain conflicts of interest.” There can be no assurance that the Adviser’s investment professionals will continue to be associated with the Adviser throughout ourthe Company’s life, and the failure to attract or retain such investment professionals could have a material adverse effect on us and our Shareholders, including, for example, by limiting the Adviser’s ability to pursue particular investment strategies discussed herein. Competition in the financial services industry for qualified employees is intense, and there is no guarantee that the talents of the Adviser’s investment professionals could be replaced. Our continued ability to effectively manage our portfolio depends on the Adviser’s ability to attract new employees and to retain and motivate its existing employees.
We rely on a substantial number of personnel of BDT & MSD, counterparties and other service providers. Accordingly, risks associated with errors of such personnel are inherent in our business and operations. Further, misconduct by such personnel could cause significant losses. MSD employee misconduct may include binding us to transactions that exceed authorized limits or present unacceptable risks and unauthorized trading activities or concealing unsuccessful trading activities (which, in either case, may result in unknown and unmanaged risks or losses). Losses could also result from misconduct by such personnel, including, without limitation, failing to recognize trades and misappropriating assets. In addition, such personnel may improperly use or disclose confidential information. Any misconduct by such personnel could result in litigation or serious financial harm to us, including limiting our business prospects or our future marketing activities. Although the Adviser and its affiliates will adopt measures to prevent and detect employee misconduct and to transact with reliable counterparties and third party providers, such measures may not be effective in all cases.
Finally, the Investment Advisory Agreement has a termination provision that allows the agreement to be terminated by us on 60 days’ notice, without penalty, by the vote of a majority of our Board, or by a majority of directors.the holders of our outstanding voting securities, on 60 days’ notice, without penalty. Furthermore, the Investment Advisory Agreement automatically terminates in the event of its assignment, as defined in the 1940 Act, by the Adviser. If the Adviser resigns or is terminated, or if we do not obtain the requisite approvals of shareholders and our Board to approve an agreement with the Adviser after an assignment, we may not be able to find a new investment adviser or hire internal management with similar expertise and ability to provide the same or equivalent services on acceptable terms prior to the termination of the Investment Advisory Agreement, or at all. If we are unable to do so quickly, our operations are likely to experience a disruption and costs under any new agreements that we enter into could increase. Our financial condition, business and results of operations, as well as our ability to meet our payment obligations under our indebtedness and pay distributions, are likely to be adversely affected, and the value of our common stock may decline.
We borrow money, which magnifies the potential for gain or loss and may increase the risk of investing in us.
The use of leverage magnifies the potential for gain or loss on amounts invested. The use of leverage is generally considered a speculative investment technique and increases the risks associated with investing in our securities. However, we have in the future intend to borrow from, and may in the future issue debt securities to, banks, insurance companies and other lenders. Lenders of these funds will have fixed dollar claims on our assets that are superior to the claims of common Shareholders, and we would expect such lenders to seek recovery against its assets in the event of a default. We may pledge up to 100% of our assets and may grant a security interest in all of our assets under the terms of any debt instruments we may enter into with lenders. In addition, under the terms of a
14
Credit Facility and any borrowing facility or other debt instrument that we may enter into, we are likely to be required to use the net proceeds of any investments that we sell to repay a portion of the amount borrowed under such facility or instrument before applying such net proceeds to any other uses. If the value of our assets decreases, leveraging would cause NAV to decline more sharply than it otherwise would have had we not leveraged, thereby magnifying losses or eliminating our stake in a leveraged investment. Similarly, any decrease in our revenue or income will cause our net income to decline more sharply than it would have had we not borrowed. Such a decline would also negatively affect our ability to make dividend payments on its common stock or preferred stock. Our ability to service any debt will depend largely on its financial performance and will be subject to prevailing economic conditions and competitive pressures.
We are required to meet a coverage ratio of total assets to total borrowings and other senior securities of at least 150%. As a BDC, we are generally required to meet a coverage ratio of total assets to total borrowings and other senior securities, which include all of our borrowings and any preferred stock that it may issue in the future, of at least 200%. If this ratio declines below 150%, we will not be able to incur additional debt and could be required to sell a portion of our investments to repay some debt when it is otherwise disadvantageous to do so. This could have a material adverse effect on our operations, and we may not be able to make distributions. The amount of leverage that we employ will depend on the Adviser’s and the Board’s assessment of the market and other factors at the time of any proposed borrowing. We cannot ensure that we will be able to obtain credit at all or on terms acceptable to us.
Finally, a Credit Facility will, and any future debt facilities may, impose financial and operating covenants that restrict our business activities, including limitations that hinder our ability to finance additional loans and investments or to make the distributions required to maintain our qualification as a RIC under the Code.
Defaults under our current borrowings or any future borrowing facility or notes may adversely affect our business, financial condition, results of operations and cash flows.
The Company intends to enterhas entered into one or moremultiple Credit Facilities, followingincluding through SPV I, the completionCompany’s wholly-owned subsidiary, which entered into a senior secured revolving credit facility with Deutsche Bank AG, New York Branch (the “SPV I Facility”); through SPV II, the Company’s wholly-owned subsidiary, which entered into a loan and security agreement with Citizens Bank N.A as lender and administrative agent, the Company as collateral manager, the other lenders party thereto, U.S. Bank Trust Company, National Association as collateral agent, and U.S. Bank National Association as account bank and collateral custodian (the “SPV II Facility”); a senior secured revolving credit facility with Bank of this offering.America, N.A. (the “Subscription Facility”); and a term debt securitization (the “2023 Debt Securitization”). The closing of a Credit Facility is contingent on a number of conditions including, without limitation, the closing of this offering and the negotiation and execution of definitive documents relating to such Credit Facility. If the Company is successful in securing a Credit Facility, theThe Company intends to use borrowings under sucheach Credit Facility to make additional investments and for other general corporate purposes. However, thereThere can be no assurance that the Company will be able to close aany additional Credit FacilityFacilities or obtain other financing.financing in the future.
In the event the Company defaults under a Credit Facility or any other future borrowing facility, the Company’s business could be adversely affected as the Company may be forced to sell a portion of its investments quickly and prematurely at what may be disadvantageous prices in order to meet outstanding payment obligations and/or support working capital requirements under such Credit Facility or such future borrowing facility, any of which would have a material adverse effect on the Company’s business, financial condition, results of operations and cash flows. In addition, following any such default, the agent for the lenders under the relevant Credit Facility or such future borrowing facility could assume control of the disposition of any or all of the Company’s assets, including
14
the selection of such assets to be disposed and the timing of such disposition, which would have a material adverse effect on the Company’s business, financial condition, results of operations and cash flows. As part of certain Credit Facilities, the right to make capital calls of Shareholders may be pledged as collateral to the lender, which will be able to call for capital contributions upon the occurrence of an event of default under such Credit Facility. To the extent such an event of default does occur, Shareholders could therefore be required to fund any shortfall up to their remaining capital commitments, without regard to the underlying value of their investment.
We are exposedsubject to risks associated with changes in interest rates, including the decommissioning of LIBOR and the implementation of alternatives to LIBOR, such as SOFR.2023 Debt Securitization.
Because we may borrow money to make investments, our net investment income will depend, in part, upon the difference between the rate at which we borrow funds and the rate at which we invest those funds. As a result we can offer no assurance that a significant change in market interest rates will not have a material adverse effect onof our net investment income. A reduction indebt securitization, including the interest rates on new investments relative to interest rates on current investments could have an adverse impact on our net investment income. However, an increase in interest rates could decrease the value of any investments we hold which earn fixed interest rates and also could increase our interest expense, thereby decreasing our net income. Also, an increase in interest rates available to investors could make an investment in our common stock less attractive if2023 Debt Securitization, we are not able to increase our distribution rate, which could reduce the value of our common stock. Further, rising interest rates could also adversely affect our performance if such increases cause our borrowing costs to rise at a rate in excess of the rate that our investments yield.
In 2022, the U.S. Federal Reserve began raising short-term interest rates and is expected to further increase the federal funds rate in 2023. In periods of rising interest rates, to the extent we borrow money subject to a variety of risks, including those set forth below. We use the term “debt securitization” to describe a form of secured borrowing under which an operating company (sometimes referred to as an “originator” or “sponsor”) acquires or originates loans or other assets that earn income, whether on a one-time or recurring basis (collectively, “income producing assets”), and borrows money on a non-recourse basis against a legally separate pool of loans or other income producing assets. In a typical debt securitization, the originator transfers the loans or income producing assets to a single-purpose, bankruptcy-remote subsidiary (also referred to as a “special purpose entity”), which is established solely for the purpose of holding loans and income producing assets and issuing debt secured by these income producing assets. The special purpose entity completes the borrowing through the issuance of notes secured by the loans or other assets. The special purpose entity may issue the notes in the capital markets to a variety of investors, including banks, non-bank financial institutions and other investors. In our debt securitization, institutional investors purchase certain notes issued by our indirect, wholly-owned subsidiary, in private placements. Pursuant to a collateral management agreement governing our debt securitization, we may incur liability as the collateral manager to our indirect, wholly-owned subsidiary. Additionally, as collateral manager to our indirect, wholly-owned subsidiary, we manage multiple tranches of debt associated with the debt securitization. We also hold equity in the debt securitization, and this first loss position may create a more concentrated risk of loss compared to our overall portfolio.
Refinancing Risk
We cannot assure you that the Company’s business will generate sufficient cash flow from operations or that future borrowings will be available to the Company under existing Credit Facilities or otherwise in an amount sufficient to enable the Company to pay its indebtedness or to fund other liquidity needs. We may need to refinance all or a portion of the Company’s indebtedness on or before it matures, including the Credit Facilities. However, we cannot assure shareholders that the Company will be able to refinance any of its indebtedness on commercially reasonable terms or at all. If we cannot service the Company’s indebtedness, we may have to take actions such as selling assets or seeking additional equity. We cannot assure shareholders that any such actions, if necessary, could be effected on commercially reasonable terms or at all, or on terms that would not be disadvantageous to our shareholders or on terms that would not require us to breach the terms and conditions of the Company’s existing or future debt agreements.
The alternative reference rates that have replaced LIBOR in our credit arrangements and other financial instruments may not yield the same or similar economic results as LIBOR over the life of such transactions.
15
LIBOR, the London Interbank Offered Rate, is an index rate that historically was widely used in lending transactions and was a common reference rate for setting the floating interest rate our cost of funds would increase, which could reduce our net investment income. Further, rising interest rates could also adversely affect our performance if we hold investments with floating interest rates, subject to specified minimum interest rates (such as aon private loans. LIBOR floor), while atwas typically the same time engagingreference rate used in borrowings subject to floating interest rates not subject to such minimums. In such a scenario, rising interest rates may increase our interest expense, even though our interest income from investments is not increasing in a corresponding manner as a result of such minimum interest rates.
If general interest rates rise, there is a risk that the portfolio companies in which we hold floating rate securities will be unable to pay escalating interest amounts, which could result in a default under their loan documents with us. Rising interest rates could also cause portfolio companies to shift cash from other productive uses to the payment of interest, which may have a material adverse effect on their business and operations and could, over time, lead to increased defaults. In addition, rising interest rates may increase pressure on us to provide fixed ratefloating-rate loans extended to our portfolio companies, which could adversely affect our net investment income, as increases in our cost of borrowed funds would not be accompanied by increased interest income from such fixed-rate investments.companies.
The elimination ofICE Benchmark Administration (“IBA”) (the entity that is responsible for calculating LIBOR) ceased providing overnight, one, three, six and twelve months USD LIBOR or any other changes or reforms to the determination or supervision of LIBOR could have an adverse impacttenors on the market for or value of any LIBOR-linked securities, loans, and other financial obligations or extensions of credit held by or due to us or on our overall financial condition or results of operations. In addition, while the majority of our portfolio company debt investments are based on the Prime rate and not LIBOR, in connection with the cessation of LIBOR, we may need to renegotiate credit agreements extending beyond 2021 with our portfolio companies that utilize LIBOR, if any, to provide for an alternative reference rate, to the extent they do not already provide for as much upon the cessation of LIBOR, which may have an adverse effect on our overall financial condition or results of operations. Furthermore, our borrowings under the KeyBank Credit Facility generally bear interest at a rate related to LIBOR, but its terms provide for the replacement of LIBOR with SOFR no later than July 1, 2023 or the date that the FCA permanently or indefinitely ceases to provide LIBOR rates, if earlier.June 30, 2023. In addition, the transitionUnited Kingdom’s Financial Conduct Authority (“FCA”), which oversees the IBA, now prohibits entities supervised by the FCA from using LIBORs, including USD LIBOR, to SOFR or other alternative reference rates may also introduce operational risksexcept in our accounting, financial reporting, loan servicing, liability management and other aspects of our business.very limited circumstances.
In December 2022, the FASB issued an update to Topic 848 - officially pushing back the sunset date for LIBOR transition from December 31, 2022, to December 31, 2024. The U.S. Federal Reserve, in conjunction with the Alternative Reference Rates Committee, a steering committee comprised of large U.S. financial institutions, has recommended replacing U.S.-dollar LIBOR withUnited States, the Secured Overnight Financing Rate (“SOFR”) is the preferred alternative rate for LIBOR. SOFR is a measure of the cost of borrowing cash overnight, collateralized by U.S. Treasury securities, and is based on directly observable U.S. Treasury-backed repurchase transactions. SOFR is published by the Federal Reserve Bank of New York each U.S. Government Securities Business Day, for transactions made on the immediately preceding US. Government Securities Business Day. Alternative reference rates that may replace LIBOR, including SOFR for USD transactions, may not yield the same or similar economic results as LIBOR over the lives of such transactions.
Substantially all of our loans that referenced LIBOR have been amended to reference the forward-looking term rate published by CME GroupBenchmark Administration Limited based on the secured overnight financing rate (“CME Term SOFR”). CME Term SOFR rates are forward-looking rates that are derived by compounding projected overnight SOFR rates over one, three, and six months taking into account the values of multiple consecutive, executed, one-month and three-month CME Group traded SOFR futures contracts and, in some cases, over-the-counter SOFR Overnight Indexed Swaps as an index calculated by short-term repurchase agreements, backed by Treasury securities. It is unknown whether aindicator of CME Term SOFR reference rate values. CME Term SOFR and the inputs on which it is based are derived from SOFR. Since CME Term SOFR is a relatively new market rate, there will attainlikely be no established trading market acceptance as a replacement for LIBOR. Wecredit agreements or other financial instruments when they are assessingissued, and an established market may never develop or may not be liquid. Market terms for instruments referencing CME Term SOFR rates may be lower than those of later-issued CME Term SOFR indexed instruments. Similarly, if CME Term SOFR does not prove to be widely used, the impacttrading price of a transition from LIBOR; however, we cannot reasonably estimate the impactinstruments referencing CME Term SOFR may be lower than those of the transition at this time.instruments indexed to indices that are more widely used.
The requirement that we invest a sufficient portion of our assets in qualifying assets could preclude us from investing in accordance with our current business strategy; conversely, the failure to invest a sufficient portion of our assets in qualifying assets could result in our failure to maintain our status as a BDC.
As a BDC, we may not acquire any assets other than “qualifying assets” unless, at the time of and after giving effect to such acquisition, at least 70% of our total assets are qualifying assets. We believe that most of the investments that we may acquire in the future will constitute qualifying assets. However, we may be precluded from investing in what we believe are attractive investments if such investments are not qualifying assets for purposes of the 1940 Act. If we do not invest a sufficient portion of our assets in qualifying assets, we could violate the 1940 Act provisions applicable to BDCs. As a result of such violation, specific rules under the 1940 Act could prevent us, for example, from making follow-on investments in existing portfolio companies which could result in the dilution of our position or could require us to dispose of investments at inappropriate times in order to come into compliance with the 1940 Act. If we need to dispose of investments quickly, it could be difficult to dispose of such investments on favorable terms. We may not be able to find a buyer for such investments and, even if we do find a buyer, we may have to sell the investments at a substantial loss. Any such outcomes would have a material adverse effect on our business, financial condition, results of operations, and cash flows.
Regulations governing our operation as a BDC and RIC affect our ability to raise capital and the way in which we raise additional capital or borrow for investment purposes, which may have a negative effect on our growth. As a BDC, the necessity of raising additional capital may expose us to risks, including risks associated with leverage.
The Company will not generally be able to issue and sell its Common Stock at a price below its then-current net asset value per share. Pursuant to Section 23 of the 1940 Act, the Company is required to determine the net asset value of its shares within 48 hours prior to the sale of its shares. The Company may, however, sell Common Stock, or warrants, options or rights to acquire the Company’s Common Stock, at a price below the then-current net asset value per share of the Company’s Common Stock if the Board determines that such sale is in the Company’s best interests, and if Shareholders approve such sale. In any such case, the price at which the Company’s securities are to be issued and sold may not be less than a price that, in the determination of the Board,Valuation Designee (as defined below), closely approximates the marketfair value of such securities (less any distributing commission or discount). If the Company raises additional funds by issuing Common
15
Stock or senior securities convertible into, or exchangeable for, its Common Stock, then the percentage ownership of Shareholders at that time will decrease, and Shareholders may experience dilution.
The credit markets are volatile and the availability of, and commercially reasonable terms associated with, indebtedness may be difficult to ascertain. Because of this, there can be no assurance that the Company will be able to obtain indebtedness or that indebtedness will be accessible by the Company at any time. If indebtedness is available to the Company, there can be no assurance that such indebtedness will be on terms favorable to the Company and/or terms comparable to terms obtained by competitors, including with respect to interest rates. The terms of any indebtedness are expected to vary based on the counterparty, timing, size, market interest rates, other fees and costs, duration, advance rates, eligible investments, ability to borrow in currencies other than the U.S. dollar and Investor creditworthiness and composition. Moreover, market conditions or other factors may cause or permit the amount of leverage employed by the Company to fluctuate over their life. Furthermore, the Company may seek to obtain indebtedness on an investment-by-investment basis and leverage may not be available or may be available on less desirable terms in connection with particular investments.
Regulations governing our ownership of loans, as well as uncertainty surrounding such regulation, may affect our ability to invest efficiently, which could negatively impact our business and results of operations.
Certain state laws, public policy and general principles of equity relating to the protection of consumers, unfair and deceptive practices and debt collection practices may apply to the servicing and collection of principal and/or interest on the loans owned by or otherwise underlying the Company’s investments.
The loans may also be subject to U.S. federal laws, including:
16
Violations of certain provisions of these U.S. federal laws may limit the ability of the applicable loan servicer to collect all or part of the principal of or interest on the loans. In addition, violations of certain provisions of these U.S. federal laws could subject the Company to damages and administrative enforcement and could result in the borrowers rescinding such loans against either the Company or subsequent holders of such loans.
Owning loans involves the collection of numerous accounts and compliance with various U.S. federal, state and local laws that regulate consumer lending. Owners of loans and servicers may be subject from time to time to various types of claims, legal actions (including class action lawsuits), investigations, subpoenas and inquiries in the course of their business. It is impossible to predict the outcome of any particular actions, investigations or inquiries or the resulting legal and financial liability. If any such proceeding were determined adversely to the Company or any of its affiliates or any other servicer and were to have a material adverse effect on its financial condition, the ability of such servicer to service the loans could be impaired.
The Company may purchase loans that either are subject to regulatory scrutiny or are so new that no clear legal guidelines have been established with respect to the regulation and compliance of such businesses with existing laws, rules and regulations. Therefore, there will be little or no legal authority or precedent governing the practices of the sellers of those loans or, in fact, of the status of those loans. While the Adviser believes that each loan purchased by the Company will be in compliance with applicable laws, rules and regulations, in many cases it might not be possible for the Company to be certain that this is the case or that the loans otherwise will not be subject to regulatory or civil challenge. Moreover, although the Adviser will seek to ensure that borrowers operate their businesses in accordance with applicable law, there can be no assurance that each such business will continue to be so operated or that the law will remain constant or that government regulators or civil litigants will not challenge the legality of the business operations of the borrowers subject to the loans purchased by the Company.
We are subject to risks related to corporate social responsibilityresponsibility.
Our business faces increasing public scrutiny related to environmental, social and governance (“ESG”) activities. ESG issues, including those related to climate change and sustainability, may have an adverse effect on our business, financial condition and results of operations and damage our reputation. Companies across all industries are facing increasing scrutiny relating to their ESG policies. Investor advocacy groups, certain institutional investors, investment funds, lenders, regulators, and other market participants are increasingly focused on ESG practices and in recent years have placed increasing importance on the implications and social cost of their investments. The increased focus and activism related to ESG and similar matters may hinder access to capital, as investors and lenders may decide to reallocate capital or to not commit capital as a result of their assessment of a company’s ESG practices. Companies which do not adapt to or comply with investor, lender or other industry shareholder expectations and standards, which are evolving, or which are perceived to have not responded appropriately to the growing concern for ESG issues, regardless of whether there is a legal requirement to do so, may suffer from reputational damage and the business, financial condition, and/or stock price of such a company could be materially and adversely affected.
We may face increasing pressures from investors, lenders and other market participants, who are increasingly focused on climate change, to prioritize sustainable energy practices, reduce our carbon footprint and promote sustainability. As a result, we may be required to implement more stringent ESG procedures or standards so that our existing and future investors and lenders remain invested in us and make further investments in us. If we do not meet these standards, our business and/or our ability to access capital could be harmed.
Additionally, certain investors and lenders may exclude companies, such as us, from their investing portfolios altogether due to environmental, social and governanceESG factors. These limitations in both the debt and equity capital markets may affect our ability to grow as our plans for growth may include accessing the equity and debt capital markets. If those markets are unavailable, or if we are unable to access alternative means of financing on acceptable terms, or at all, we may be unable to implement our business strategy, which would have a material adverse effect on our financial condition and results of operations and impair our ability to service our then indebtedness. Further, it is likely that we will incur additional costs and require additional resources to monitor, report and comply with wide ranging ESG requirements.any actual or proposed regulations. The occurrence of any of the foregoing could have a material adverse effect on our business and financial condition. We
16
risk damage to our brand and reputation if we fail to act responsibly in a number of areas, such as environmental stewardship, corporate governance and transparency and considering ESG factors in our investment processes. Adverse incidents with respect to ESG activities could impact the value of our brand, the cost of our operations and relationships with investors, all of which could adversely affect our business and results of operations. Additionally, new regulatory initiatives related to ESG could adversely affect our business.
We operate in a highly competitive market for investment opportunities, which could reduce returns and result in losses.
Our competitors include both existing and newly formed equity and debt focused public and private funds, other BDCs, investment banks, venture-oriented commercial banks, commercial financing companies and, to the extent they provide an alternative form of financing, private equity and hedge funds. Many of our competitors are substantially larger and have considerably greater financial, technical and marketing resources than us. For example, some competitors may have a lower cost of capital and access to funding sources (including deposits) that are not available to us. In addition, some of our competitors may have higher risk tolerances or different risk assessments than we have. Furthermore, many of our competitors are not subject to the regulatory restrictions that the 1940 Act imposes on us as a BDC or to the distribution and other requirements we must satisfy to maintain our ability to be subject to tax treatment as a RIC. These characteristics could allow our competitors to consider a wider variety of investments, establish more relationships and offer better pricing and more flexible structuring than we are able to offer.
The competitive pressures we face may have a material adverse effect on our financial condition, results of operations and cash flows. We believe that some competitors may make loans with rates that are comparable or lower than our rates. We may lose some investment opportunities if we do not match our competitors’ pricing, terms and structure. However, if we match our competitors’ pricing, terms and structure, we may experience decreased net interest income, lower yields and increased risk of credit loss. As a result of this competition, we may not be able to take advantage of attractive investment opportunities from time to time, and we may not be able to identify and make investments that are consistent with our investment objective.
17
In addition, we believe a significant part of our competitive advantage stems from the fact that the market for investments in small, fast-growing, private companies is underserved by traditional commercial banks and other financing sources. A significant increase in the number and/or the size of our competitors in this target market could force us to accept less attractive investment terms.
We are subject to litigation risk associated with our business operations.
Should we need to collect on a defaulted loan, litigation could result. There is a high cost associated with any litigation and the results of litigation are always uncertain. Even before litigation is commenced, we could experience substantial costs in trying to collect on defaulted investments, such as legal fees, collection agency fees, or discounts related to the assignment of a defaulted loan to a third party. Our investment activities may further subject us to the risks and costs of becoming involved in litigation with third parties due to, among other reasons, the fact that different investor groups may have qualitatively different, and frequently conflicting, interests with respect to certain investments. The risk of litigation with third parties will be elevated in situations where we exercise control or significant influence over an issuer’s direction, including where we own or are otherwise affiliated with a loan servicer or originator, as loan originators are routinely involved in legal proceedings concerning matters that arise in the ordinary course of their business and, on occasion, are the subject of regulatory actions by state and federal regulators. Such proceedings or actions may adversely affect such companies’ financial results. Furthermore, we may be required to pay legal fees, settlement costs, damages, penalties or other charges, any or all of which could materially adversely affect us and our investments.
We are subject to cybersecurity risks.
The Company depends on the Adviser to develop and implement appropriate systems for the Company’s activities. The Company relies extensively on computer programs and systems (and may rely on new systems and technology in the future) for various purposes including, without limitation, to trade, clear and settle securities transactions, to evaluate certain securities based on real-time trading information, to monitor its portfolio and net capital, and to generate risk management and other reports that are critical to oversight of the Company’s activities. In addition, certain of the Company’s and the Adviser’s operations interface will be dependent on systems operated by third parties, including its prime brokers, the Administrator, market counterparties and their sub-custodians and other service providers, and the Company or Adviser may not be in a position to verify the risks or reliability of such third-party systems. These programs or systems may be subject to certain defects, failures or interruptions, including, but not limited to, those caused by computer “worms”, viruses and power failures. Any such defect or failure could have a material adverse effect on the Company. For example, such failures could cause settlement of trades to fail, lead to inaccurate accounting, recording or processing of trades, and cause inaccurate reports, which may affect the Company’s ability to monitor its investment portfolio and its risks.
As part of its business, the Adviser processes, stores and transmits large amounts of electronic information, including information relating to the transactions of the Company and personally identifiable information of the Shareholders. Similarly, service providers of the Adviser, the Company, especially the Administrator, may process, store and transmit such information. The Adviser has procedures and systems in place that it believes are reasonably designed to protect such information and prevent data loss and security breaches. However, such measures cannot provide absolute security. The techniques used to obtain unauthorized access to data, disable or degrade service, or sabotage systems change frequently and may be difficult to detect for long periods of time. Hardware or software acquired from third parties may contain defects in design or manufacture or other problems that could unexpectedly compromise information security. Network connected services provided by third parties to the Adviser may be susceptible to compromise, leading to a breach of the Adviser’s network. The Adviser’s systems or facilities may be susceptible to employee error or malfeasance, government surveillance, or other security threats. On-lineOnline services provided by the Adviser to the Shareholders may also be susceptible to compromise. Breach of the Adviser’s information systems may cause information relating to the transactions of the Company and personally identifiable information of the Shareholders to be lost or improperly accessed, used or disclosed.
The service providers of the Adviser, and the Company, isare subject to the same electronic information security threats as the Adviser. If a service provider fails to adopt or adhere to adequate data security policies, or in the event of a breach of its networks, information relating to the transactions of the Company and personally identifiable information of the Shareholders may be lost or improperly accessed, used or disclosed.
The loss or improper access, use or disclosure of the Adviser’s or the Company’s proprietary information may cause the Adviser or the Company to suffer, among other things, financial loss, the disruption of their business, liability to third parties, regulatory intervention or reputational damage. Any of the foregoing events could have a material adverse effect on the Company and in turn the Company and the Shareholders’ investments therein.
The majority of the Company’s shares are held and controlled by one entity.
17
While shares of the Company are held by a number of entities, a substantial percentage of shares are held and controlled by entities with the same ultimate beneficial owner. As a result, the voting power of thisthe Company is highly concentrated. Unless and until the Company’s share ownership becomes more diversified, any matters brought before the Company’s shareholders will likely be controlled by the vote of the controlling entities. To the extent an individual shareholder’s interests differ from those of the controlling entities with respect to any matter brought before the shareholders for a vote, such shareholder’s vote will likely not be sufficient to change the outcome of the vote.
Risks Related to an Investment in Our Shares
A shareholder’s interest in us will be diluted if we issue additional shares, which could reduce the overall value of an investment in us.
Our shareholders do not have preemptive rights to purchase any shares we issue in the future. Our charter authorizes us to issue up to 100 million shares of common stock. Pursuant to our charter, a majority of our entire Board may amend our charter to increase the number of shares of common stock we may issue without shareholder approval. Our Board may elect to sell additional shares in the future or issue equity interests in private offerings. To the extent we issue additional equity interests at or below net asset value, your percentage ownership interest in us may be diluted. In addition, depending upon the terms and pricing of any additional offerings and the value of our investments, you may also experience dilution in the book value and fair value of your shares.
Under the 1940 Act, we generally are prohibited from issuing or selling our common stock at a price below then-current net asset value per share, which may be a disadvantage as compared with other companies. We may, however, sell our common stock, or warrants, options, or rights to acquire our common stock, at a price below the then-current current net asset value of our common stock if our Board and independent directors determine that such sale is in our best interests and the best interests of our shareholders, and our shareholders, including a majority of those shareholders that are not affiliated with us, approve such sale. In any such case, the price at which our securities are to be issued and sold may not be less than a price that, in the determination of our Board, closely
18
approximates the fair value of such securities (less any distributing commission or discount). If we raise additional funds by issuing common stock or senior securities convertible into, or exchangeable for, our common stock, then the percentage ownership of our shareholders at that time will decrease and you will experience dilution.
Certain provisions of our charter and actions of our Board could deter takeover attempts and have an adverse impact on the value of shares of our common stock.
Our charter, as well as certain statutory and regulatory requirements, contain certain provisions that may have the effect of discouraging a third party from attempting to acquire us. Our Board is divided into three classes of directors serving staggered three-year terms, which could prevent shareholders from removing a majority of directors in any given election. Our Board may, without shareholder action, authorize the issuance of shares in one or more classes or series, including shares of preferred stock; and our Board may, without shareholder action, amend our charter to increase the number of shares of our common stock, of any class or series, that we will have authority to issue. These anti-takeover provisions may inhibit a change of control in circumstances that could give the holders of shares of our common stock the opportunity to realize a premium over the value of shares of our common stock.
Investing in our securities involves a high degree of risk.
The investments we make in accordance with our investment objective may result in a higher amount of risk than alternative investment options, including volatility or loss of principal. Our investments in portfolio companies may be highly speculative and aggressive and, therefore, an investment in our common stock may not be suitable for someone with lower risk tolerance.
Risks Related to Our Preferred Stock
The issuance of preferred stock, such as the Series A Preferred Stock, with dividend or conversion rights, liquidation preferences or other economic terms favorable to the holders of preferred stock could make an investment in shares of Common Stock less attractive. In addition, the dividends on any preferred stock we issue must be cumulative. Payment of dividends and repayment of the liquidation preference of preferred stock must take preference over any distributions or other payments to holders of Common Stock, and holders of preferred stock are not subject to any of our expenses or losses and are not entitled to participate in any income or appreciation in excess of their stated preference (other than convertible preferred stock that converts into shares of Common Stock). In addition, under the 1940 Act, preferred stock constitutes a “senior security” for purposes of the 150% asset coverage test.
Risks Related to Our Investments
Our investments in portfolio companies may be risky, and we could lose all or part of our investments.
All investments risk the loss of capital. No guarantee or representation is made that an investment in the Company’s programCompany will be successful. The Company’s investment program will involve, without limitation, risks associated with limited diversification, use of leverage, credit deterioration and default risks, systems risks and other risks inherent in the Company’s activities. Certain investment techniques of the Company can, in certain circumstances, substantially increase the impact of adverse market movements to which the Company may be subject. In addition, the Company’s investments may be materially affected by conditions in the financial markets and overall economic conditions occurring globally and in particular countries or markets where the Company invests its assets.
The Company’s methods of minimizing such risks may not accurately predict future risk exposures. Risk management techniques are based in part on the observation of historical market behavior, which may not predict market divergences that are larger than historical indicators. Also, information used to manage risks may not be accurate, complete or current, and such information may be misinterpreted.
Our strategy focuses primarily on originating and making loans to, and making debt and equity investments in, U.S. middle market companies, with a focus on originated transactions sourced through the networks of our Adviser. Short transaction closing timeframes associated with originated transactions coupled with added tax or accounting structuring complexity and international transactions may result in higher risk in comparison to non-originated transactions.
Most debt securities in which we intend to invest will not be rated by any rating agency and, if they were rated, they would be rated as below investment grade quality and are commonly referred to as “high yield” or “junk.” Debt securities rated below investment grade quality are generally regarded as having predominantly speculative characteristics and may carry a greater risk with respect to a borrower’s capacity to pay interest and repay principal. In addition, some of the loans in which we may invest may be “covenant-lite” loans. We use the term “covenant-lite” loans to refer generally to loans that do not have a complete set of financial maintenance covenants. Generally, “covenant-lite” loans provide borrower companies more freedom to negatively impact lenders because their covenants are incurrence-based, which means they are only tested and can only be breached following an affirmative action of the borrower, rather than by a deterioration in the borrower’s financial condition. Accordingly, to the extent we invest in “covenant-lite” loans, we may have fewer rights against a borrower and may have a greater risk of loss on such investments as compared to investments in or exposure to loans with financial maintenance covenants.
Our investment portfolio is recorded at fair value as determined in good faith in accordance with procedures established by our Board and, as a result, there is and will be uncertainty as to the value of our portfolio investments.
Many of our Portfolio Investments take the form of securities that are not publicly traded. The fair value of loans, securities and other investments that are not publicly traded may not be readily determinable and are valued at fair value as determined in good faith by the Board,Valuation Designee, including to reflect significant events affecting the value of our investments. Most, if not all, of our investments (other than cash and cash equivalents) will be classified as Level 3 assets under
18
Topic 820 of the U.S. Financial Accounting Standards Board’s (“FASB”) Accounting Standards Codification, as amended, Fair Value MeasurementsMeasurement and Disclosures (“ASC Topic 820”). This means that our portfolio valuations will be based on unobservable inputs and our assumptions about how market participants would price the asset or liability in question. Inputs into the determination of fair value of our Portfolio Investments require significant management judgment or estimation. Even if observable market data are available, such information may be the result of consensus pricing information or broker quotes, which include a disclaimer that the broker would not be held to such a price in an actual transaction. The non-binding nature of consensus pricing and/or quotes accompanied by disclaimers materially reduces the reliability of such information. We have retained the services of one or more independent service providers to review the valuation of these loans and securities. The types of factors that may be taken into account in determining the fair value of Portfolio Investments generally include, as appropriate, comparison to publicly-traded securities including such factors as yield, maturity and measures of credit quality, the enterprise value of a portfolio company, the nature and realizable value of any collateral, the portfolio company’s ability to make payments and its earnings and discounted cash flow, the markets in which the portfolio company does business, and other relevant factors. Because such valuations, and particularly valuations of private securities and private companies, are inherently
19
uncertain, may fluctuate over short periods of time, and may be based on estimates, determinations of fair value may differ materially from the values that would have been used if a ready market for these loans and securities existed. Our net asset value could be adversely affected if determinations regarding the fair value of our investments were materially higher than the values that we ultimately realize upon the disposal of such loans and securities. In addition, the method of calculating the Management Fee (and the Incentive Compensation) may result in conflicts of interest between the Adviser, on the one hand, and Shareholders on the other hand, with respect to the valuation of investments. See “Risks Related to our Adviser and its Affiliates – Our fee structure may create incentives for our Adviser to make speculative investments or use substantial leverage.”
A lack of liquidity in our investments may adversely affect us.
Certain securities or obligations held by the Company may have terms longer than the term of the Company and certain loans may have grace periods of several years. Furthermore, the Company may, in connection with collateral held by it, acquire non-marketable common or preferred equity securities and other illiquid assets with equity participation features, which, to the extent that they have value at all, will likely not have realizable value for a significant period of time. Accordingly, certain investments may need to be disposed of upon dissolution of the Company for less than their potential value.
The lack of liquidity in the Company’s investments may materially and adversely affect the Company’s value. As the Company primarily invests in loans to private companies, substantially all of their investments are less liquid than publicly traded securities and may be subject to contractual, statutory or regulatory prohibitions on disposition. While the Adviser anticipates that the Company will hold a significant portion of such investments until realization, should the Adviser determine it to be advisable to earlier dispose of any such investments, the Company may have difficulty doing so and in certain cases may only be able to sell such investments at substantial discounts to face value.
Inflation may adversely affect the business, results of operations and financial condition of our portfolio companies.
Certain of our portfolio companies may be impacted by inflation. If such portfolio companies are unable to pass any increases in their costs along to their customers, it could adversely affect their results and impact their ability to pay interest and principal on our loans. In addition, any projected future decreases in our portfolio companies’ operating results due to inflation could adversely impact the fair value of those investments. Any decreases in the fair value of our investments could result in future unrealized losses and therefore reduce our net assets resulting from operations.
Additionally,We are exposed to risks associated with changes in interest rates, including the current rising interest rate environment.
Since March 2022, the Federal Reserve has raised, andbeen rapidly raising interest rates. Although the Federal Reserve left its benchmark rates steady in the fourth quarter of 2023, it has indicated its intentthat additional rate increases in the future may be necessary to continue raising, certain benchmark interest rates in an effort to combat inflation. There ismitigate inflationary pressures and there can be no guaranteeassurance that the actions taken by the Federal Reserve will not make upwards adjustments to the federal funds rate in the future. However, there are reports that the Federal Reserve may begin to cut the benchmark rates in 2024. An increase in interest rates could decrease the value of any investments we hold which earn fixed interest rates and also could increase our interest expense, thereby decreasing our net income. Also, an increase in interest rates available to investors could make an investment in shares of our common stock less attractive if we are not able to increase our distribution rate, which could reduce or eliminate inflation.the value of our common stock. Further, rising interest rates could also adversely affect our performance if such increases cause our borrowing costs to rise at a rate in excess of the rate that our investments yield. It is possible that the Federal Reserve's tightening cycle could also result in a recession in the United States, which could have a material adverse effect on our business, results of operations and financial condition.
Defaults by our portfolio companies could jeopardize a portfolio company’s ability to meet its obligations under the debt or equity investments that we hold, which could harm our operating results.
Although the Company intends primarily to invest in loans and other debt instruments or obligations secured by collateral, the Company may be exposed to losses resulting from default and foreclosure of any such loans or interests in loans in which it has invested. Therefore, the value of underlying collateral, the creditworthiness of borrowers and the priority of liens are each of great importance in determining the value of the Company’s investments. No guarantee can be made regarding the adequacy of the protection of the Company’s security in the loans or other debt instruments in which it invests. Moreover, in the event of foreclosure, the Company or an affiliate thereof may assume direct ownership of any assets collateralizing such foreclosed loans. The liquidation proceeds upon the sale of such assets may not satisfy the entire outstanding balance of principal and interest on such foreclosed loans, resulting in a loss to the Company. Any costs or delays involved in the effectuation of loan foreclosures or liquidation of the assets collateralizing such foreclosed loans will further reduce proceeds associated therewith and, consequently, increase possible losses to the Company. In addition, no assurances can be made that borrowers or third parties will not assert claims in connection with foreclosure proceedings or otherwise, or that such claims will not interfere with the enforcement of the Company’s rights.
Under certain circumstances, collateral securing an investment may be released without the consent of the Company. Moreover, the Company’s security interest (with respect to investments in secured debt) may be unperfected for a variety of reasons, including the failure to make required filings by lenders and, as a result, the Company may not have priority over other creditors as anticipated. First priorityFirst-priority lien investments made by the Company may, in certain cases, provide a first priorityfirst-priority lien over some, but not all, of the assets of the relevant borrower. The Company may also invest in second-lien debt, high-yield securities, marketable and nonmarketable common and preferred equity securities and other unsecured instruments each of which involves a higher degree of risk than senior first-lien secured debt, including the re-use and subsequent loss of collateral by the borrower. Furthermore, the Company’s right to payment and its security interest, if any, may be subordinated to the payment rights and security interests of senior lenders (with respect to some or all of the assets of an issuer in which the Company invests). Certain of these investments may have an interest-only payment schedule, with the principal amount remaining outstanding and at risk until the maturity of the investment. In such cases, the ability of the issuer to repay the principal in respect of the Company’s investment may be dependent upon a liquidity event or the long-term success of the company, the occurrence of which is uncertain.
In addition, issuers in which the Company invests could present a high degree of business and credit risk. Issuers in which the Company invests could deteriorate as a result of, among other factors, an adverse development in their businesses, a change in the competitive environment or the occurrence, continuation or worsening of any economic and financial market downturns and dislocations. As a result, issuers that the Company expected to be stable or improve may operate, or expect to operate, at a loss or have significant variations in operating results, may require substantial additional capital to support their operations or maintain their competitive position, or may otherwise have a weak financial condition or be experiencing financial distress.
19
The terms of any derivative hedging arrangements entered into by the Company may provide that related collateral given to, or received by, the Company may be pledged, lent, re-hypothecated or otherwise re-used by the collateral taker for its own purposes. If collateral received by the Company is reinvested or
20
otherwise reused, the Company is exposed to the risk of loss on that investment. Should such a loss occur, the value of the collateral will be reduced and the Company will have less protection if the counterparty defaults. Similarly, if the counterparty reinvests or otherwise re-uses collateral received from the Company and suffers a loss as a result, it may not be in a position to return that collateral to the Company should the relevant transaction complete, be unwound or otherwise terminate and the Company is exposed to the risk of loss of the amount of collateral provided to the counterparty.
We generally will not control the business operations of our portfolio companies and, due to the illiquid nature of our holdings in our portfolio companies, we may not be able to dispose of our interest in our portfolio companies.
The Company will invest in debt instruments and equity securities of companies that they doit does not control. Such investments will be subject to the risk that the issuer may make business, financial or management decisions with which the Company does not agree or that the majority stakeholders or the management of the issuer may take risks or otherwise act in a manner that does not serve the Company’s interests. In addition, the Company may share control over certain investments with co-investors, which may make it more difficult for the Company to implement its investment approach or exit the investment when it otherwise would. The occurrence of any of the foregoing could have a material adverse effect on the Company and in turn the Company and the Shareholders’ investments therein.
International investments create additional risks.
The Company may invest in financial instruments of non-U.S. entities and governments. Investing in the financial instruments of entities and governments outside of the United States involves certain considerations not usually associated with investing in financial instruments of U.S. entities or the U.S. government, including political and economic considerations, such as greater risks of expropriation, nationalization, confiscatory or other taxation, imposition of withholding or other taxes on interest, dividends, capital gains or other income or gross sale or disposition proceeds, limitations on the removal of assets and general social, political and economic instability; the relatively small size of the securities markets in such countries and the low volume of trading, resulting in potential lack of liquidity and in price volatility; the evolving and unsophisticated laws and regulations applicable to the securities and financial services industries of certain countries; fluctuations in the rate of exchange between currencies and costs associated with currency conversion; and certain government policies that may restrict the Company’s investment opportunities. In addition, accounting and financial reporting standards that prevail outside of the United States generally are not as high as U.S. standards and, consequently, less information is typically available concerning companies located outside of the United States than for those located in the United States. As a result, the Company may be unable to structure its transactions to achieve the intended results or to mitigate all risks associated with such markets. It may also be difficult to enforce the Company’s rights in such markets.
The Company may, on an opportunistic basis, invest in the securities of companies in various foreign emerging markets. Investments in foreign emerging markets involve certain unique risks, including risks of volatility in those markets, governmental intervention in those markets and cross-shareholdings in companies in certain countries. There is also generally less publicly available information about foreign companies than about U.S. companies, and foreign companies are subject to accounting, auditing and financial reporting standards and requirements different from those applicable to U.S. companies. The value of companies in foreign emerging markets may be affected by political, economic, financial and social factors in those countries, or global regions, including changes in government, economic and fiscal policies and currency exchange laws. Companies in foreign emerging markets may be subject to heightened risks, including risks of relatively unstable governments, nationalization of businesses, restrictions on foreign ownership, prohibitions on the repatriation of assets and less protection of property rights. The economies of countries in emerging markets may be based on only a few industries, be highly vulnerable to changes in local or global trade conditions and suffer from extreme and volatile debt burdens or inflation rates. Moreover, the economies in such countries may differ unfavorably from the economy in the United States in such respects as growth of gross national product, rate of inflation, capital reinvestment, resources and self-sufficiency.
Finally, we may, on an opportunistic basis, invest in loans, secured debt or other investments that are denominated in a currency other than the U.S. dollar. In such an event, the prices of such investments will be determined with reference to currencies other than the U.S. dollar but the Company will value its securities and other assets in U.S. dollars. To the extent that the Company makes investments that are denominated in a currency other than the U.S. dollar, the Company generally expects to hedge its foreign currency exposure. However, to the extent that the Company’s foreign currency exposure is not hedged, the value of the Company’s assets will fluctuate with U.S. dollar exchange rates as well as the price changes of the Company’s investments. Among the factors that may affect currency values are trade balances, the level of short-term interest rates, differences in relative values of similar assets in different currencies, long-term opportunities for investment and capital appreciation, and political developments. An increase in the value of the U.S. dollar compared to the other currencies in which the Company makes its investments will reduce the effect of increases and magnify the effect of decreases in the prices of the Company’s investments in foreign markets. As a result, the Company could realize a net loss on an investment, even if there were a gain on the underlying investment before currency losses were taken into account.
Our portfolio may be focused on a limited number of portfolio companies or industries, which will subject us to a risk of significant loss if any of these companies defaults on its obligations under any of its debt instruments or if there is a downturn in a particular industry.
We are classified as a non-diversified investment company within the meaning of the 1940 Act, which means that we are not limited by the 1940 Act with respect to the proportion of our assets that we may invest in securities of a single issuer, excluding limitations on investments in other investment companies. To the extent that we assume large positions in the securities of a small number of issuers or industries, our net asset value may fluctuate to a greater extent than that of a diversified investment company as a result of changes in the financial condition or the market’s assessment of the issuer. Unfavorable performance by a small number of Portfolio Investments could adversely affect the aggregate returns realized by Shareholders. We expect to invest in a number of Portfolio Investments, but such number may be insufficient to afford adequate diversification againstto mitigate the risk that an insufficient number of Portfolio Investments in which we invest may yield a return.
2021
The Company may also be more susceptible to any single economic or regulatory occurrence than a diversified investment company. In addition, the aggregate returns the Company realizes may be significantly adversely affected if a small number of investments perform poorly or if the Company needs to write down the value of any one investment. Additionally, a downturn in any particular industry in which the Company is invested could significantly affect the Company’s aggregate returns.
Because the Company may invest significant amounts of the Company’s available capital in a single investment, any single loss may have a significant adverse impact on the Company’s capital. While the Company will generally focus on borrowers who are U.S. SMBs, the Adviser may determine whether companies meet the foregoing criteria in its sole discretion. In addition, except as may be provided by the requirement to invest at least 70% of its assets in qualifying investments and as may be necessary to qualify as a RIC, the Company is not restricted in its ability to invest in companies of any size or in any geographical location, and may from time to time or over time invest in companies of any size or in any geographical location. The Company’s performance may be adversely affected by industry or region-specific factors. Although the Adviser attempts to identify, monitor and manage significant risks, these efforts do not take all risks into account and there can be no assurance that these efforts will be effective. Many risk management techniques are based on observed historical market behavior, but future market behavior may be entirely different. Any inadequacy or failure in the Adviser’s risk management efforts could result in material losses for the Company.
Our ability to enter into transactions involving derivatives and unfunded commitment transactions may be limited
In 2020, the SEC adopted Rule 18f-4 under the 1940 Act, which relates to the use of derivatives and other transactions that create future payment or delivery obligations by BDCs (and other funds that are registered investment companies). Under Rule 18f-4, for which compliance was required beginning in August 2022, BDCs that use derivatives are subject to a value-at-risk leverage limit, certain derivatives risk management program and testing requirements and requirements related to board reporting. These new requirements apply unless the BDC qualifies as a “limited derivatives user,” as defined in Rule 18f-4. A BDC that enters into reverse repurchase agreements or similar financing transactions could either (i) comply with the asset coverage requirements of Section 18, as modified by Section 61 of the 1940 Act, when engaging in reverse repurchase agreements or (ii) choose to treat such agreements as derivatives transactions under Rule 18f-4. In addition, under Rule 18f-4, a BDC may enter into an unfunded commitment agreement that is not a derivatives transaction, such as an agreement to provide financing to a portfolio company, if the BDC has a reasonable belief, at the time it enters into such an agreement, that it will have sufficient cash and cash equivalents to meet its obligations with respect to all of its unfunded commitment agreements, in each case as it becomes due. If the BDC cannot meet this requirement, it is required to treat the unfunded commitment as a derivatives transaction subject to the aforementioned requirements of Rule 18f-4. Collectively, these requirements may limit our ability to use derivatives and/or enter into certain other financial contracts. We qualify as a “limited derivatives user,” and as a result the requirements applicable to us under Rule 18f-4 may limit our ability to use derivatives and enter into certain other financial contracts. However, if we fail to qualify as a limited derivatives user and become subject to the additional requirements under Rule 18f-4, compliance with such requirements may increase cost of doing business, which could have a material adverse effect on our business, financial condition, results of operations, and cash flows.
Risks Relating to Hedging Transactions.
We may seek to hedge against interest rate and currency exchange rate fluctuations and credit risk by using structured financial instruments such as futures, options, swaps and forward contracts, subject to the requirements of the 1940 Act. Use of structured financial instruments for hedging purposes may present significant risks, including the risk of loss of the amounts invested. Defaults by the other party to a hedging transaction can result in losses in the hedging transaction. Hedging activities also involve the risk of an imperfect correlation between the hedging instrument and the asset being hedged, which could result in losses both on the hedging transaction and on the instrument being hedged. Use of hedging activities may not prevent significant losses and could increase our losses. Further, hedging transactions may reduce cash available to pay distributions to our shareholders.
The success of our hedging strategy will depend on our ability to correctly identify appropriate exposures for hedging. Unanticipated changes in currency exchange rates or other exposures that we might hedge may result in poorer overall investment performance than if we had not engaged in any such hedging transactions. In addition, the degree of correlation between price movements of the instruments used in a hedging strategy and price movements in the portfolio positions being hedged may vary, as may the time period in which the hedge is effective relative to the time period of the related exposure. Also, where a put or call option on a particular security is purchased to hedge against price movements in a related security, the price of the put or call option may move more or less than the price of the related security. If restrictions on exercise were imposed, we might be unable to exercise an option we had purchased. If we were unable to close out an option that we had purchased on a security, it would have to exercise the option in order to realize any profit or the option may expire worthless.
Risks Related to the Economy
The capital markets are currently in a period of disruption and economic uncertainty. Such market conditions have materially and adversely affected debt and equity capital markets, which have had, and may continue to have, a negative impact on our business and operations.
The U.S. capital markets have experienced extreme volatility and disruption since the emergence of the COVID-19 pandemic, as evidenced by the volatility in global stock markets as a result of, among other things, uncertainty surrounding the pandemic and the fluctuating price of commodities such as oil. Despite actions of the U.S. federal government and foreign governments, these events have contributed to unpredictable general economic conditions that are materially and adversely impacting the broader financial and credit markets and reducing the availability of debt and equity capital for the market as a whole. These conditions could continue for a prolonged period of time or worsen in the future.
GivenU.S. capital markets have experienced extreme volatility and disruption following the global outbreak of COVID-19 that began in December 2019, the conflict between Russia and Ukraine that began in late February 2022 and the ongoing and dynamic nature ofwar in the circumstances, it is difficult to predict the full impact ofMiddle East. Even after the COVID-19 pandemic subsided, the U.S. economy, as well as most other major economies, have continued to experience unpredictable economic conditions, and we anticipate our businesses would be materially and adversely affected by any prolonged economic downturn or recession in the United States and other major markets. In addition, disruptions in the capital markets have increased the spread between the yields realized on our business. The extent of such impact will depend on future developments, which are highly uncertain, including the duration or reoccurrence of any potential business or supply chain disruption, the durationrisk-free and severityhigher risk securities, resulting in illiquidity in parts of the COVID-19 pandemic and the actions taken by governments and their citizens to contain the COVID-19 pandemic or treat its impact.capital markets. As the result of the current market conditions, caused in part by the COVID-19 pandemic, and the related adverse local and national economic consequences, we could be subject to any of the following risks, any of which could have a material, adverse effect on our business, financial condition, liquidity, and results of operations:
22
The COVID-19 pandemic is ongoing as of the filing date of this Annual Report, and its extended duration may have further adverse impacts on us and our portfolio companies after December 31, 2022.
Global economic, political and market conditions may adversely affect our business, financial condition and results of operations, including our revenue growth and profitability.
The current worldwide financial markets situation, as well as various social and political tensions in the United States and around the world (including wars and other forms of conflict, terrorist acts, security operations and catastrophic events such as fires, floods, earthquakes, tornadoes, hurricanes and global health epidemics), may contribute to increased market volatility, may have long term effects on the United States and worldwide financial markets, and may cause economic uncertainties or deterioration in the United States and worldwide. For example, the COVID-19 pandemic continues to adversely impact global commercial activity and has contributed to significant volatility in financial markets. We monitor developments and seek to manage our investments in a manner consistent with achieving our investment objective, but there can be no assurance that we will be successful in doing so. See “—Political, social
Russian Invasion of Ukraine and Conflict in the Middle East
Russia’s invasion of Ukraine, the current conflict in the Middle East, and corresponding events, have had, and could continue to have, severe adverse effects on regional and global economic uncertainty,markets. Following Russia’s actions, various governments, including uncertainty relatedthe United States, have issued broad-ranging economic sanctions against Russia, including, among other actions, a prohibition on doing business with certain Russian companies, large financial institutions, officials and oligarchs; a commitment by certain countries and the European Union to remove selected Russian banks from the COVID-19 pandemic, may create and/or exacerbate risks.”
On August 16, 2022,Society for Worldwide Interbank Financial Telecommunications, the Biden Administration enactedelectronic banking network that connects banks globally; and restrictive measures to prevent the Inflation Reduction Act of 2022, which modifies key aspectsRussian Central Bank from undermining the impact of the Code, including by creating an alternative minimum tax on certain large corporationssanctions. The current sanctions and an excise tax on stock repurchases by certain corporations. We are currently assessing the potential for future sanctions, and other actions, and Russia’s retaliatory responses to those sanctions and actions, may continue to adversely impact the Russian economy and may result in the further decline of these legislative changes. Any newthe value and liquidity of Russian securities, a continued weakening of the ruble, exchange closures and may have other adverse consequences on the Russian economy that could impact the value of Russian investments and impair the ability of a client to buy, sell, receive, or changed laws or regulationsdeliver those securities. In addition, the escalating conflict in the Middle East could cause further volatility and uncertainty in global economic markets. Moreover, those events have, a materialand could continue to have, an adverse effect on our business,global markets’ performance and politicalliquidity, thereby negatively affecting the value of a client’s investments beyond any direct exposure to Russian or Middle Eastern issuers. The duration of ongoing hostilities and the vast array of sanctions and related events cannot be predicted. Those events present material uncertainty and risk with respect to markets globally and the performance of a client and its investments or operations could increase regulatory uncertaintybe negatively impacted.
Financial Institution Risk; Distress Events
An investment in the near term.Company is subject to the risk that one of the Company’s banks, brokers, hedging counterparties, lenders or other custodians of some or all of the Company’s assets (each, a “Financial Institution”) fails to perform its obligations or experiences insolvency, closure, receivership or other financial distress or difficulty, similar to that experienced by Silicon Valley Bank and Signature Bank in March 2023 (each, a “Distress Event”). Distress Events can be caused by factors including eroding market sentiment, significant withdrawals, fraud, malfeasance, poor performance or accounting irregularities. In the event a Financial Institution experiences a Distress Event, the Company may not be able to access deposits, borrowing facilities or other services for an extended period of time or ever. Although assets held by regulated Financial Institutions in the United States frequently are insured up to stated balance amounts by organizations such as the Federal Deposit Insurance Corporation (“FDIC”), in the case of banks, or the Securities Investor Protection Corporation (“SIPC”), in the case of certain broker-dealers, amounts in excess of the relevant insurance are subject to risk of loss, and any non-U.S. Financial Institutions that are not subject to similar regimes pose increased risk of loss. In the event of a failure of a banking institution, access to the Company’s bank accounts could be restricted and FDIC protection may not be available for balances in excess of amounts insured by the FDIC (and similar considerations may apply to banking institutions in other jurisdictions not subject to FDIC protection). In such instances, the Company may not recover such excess, uninsured amounts and instead, would only have an unsecured claim against the banking institution and participate pro rata with other unsecured creditors in the residual value of the banking institution’s assets. Investors could also be similarly affected and unable to fund capital calls, further delaying or deferring new investments. In addition, the Company may not be able to identify all potential solvency or stress concerns with respect to a banking institution or to transfer assets from one bank to another in a timely manner in the event a banking institution comes under stress or fails. Although in recent years governmental intervention has resulted in additional protections for depositors, there can be no assurance that governmental intervention will be successful or avoid the risk of loss, substantial delays or negative impact on banking or brokerage conditions or markets.
Economic recessions or downturns could impair our portfolio companies and harm our operating results.
Many of our portfolio companies may be susceptible to economic slowdowns or recessions and may be unable to repay our debt investments during these periods. In particular, in past periods of instability, the financial services sector was negatively impacted by significant write-offs as the value of the assets held by financial firms declined, impairing their capital positions and abilities to lend and invest. In addition, continued uncertainty surrounding the negotiation
21
of trade deals between the United Kingdom and the European Union following the United Kingdom’s exit from the European Union and uncertainty between the United States and other countries, including China and Russia, with respect to trade policies, treaties, sanctions, and tariffs, among other factors, have caused disruption in the global markets. There can be no assurance that market conditions will not worsen in the future.
23
In an economic downturn, we may have non-performing assets or non-performing assets may increase, and the value of our portfolio is likely to decrease during these periods. Adverse economic conditions may also decrease the value of any collateral securing our loans. A severe recession may further decrease the value of such collateral and result in losses of value in our portfolio and a decrease in our revenues, net income, assets and net worth. Unfavorable economic conditions also could increase our funding costs, limit our access to the capital markets or result in a decision by lenders not to extend credit to us on terms we deem acceptable. These events could prevent us from increasing investments and harm our operating results.
The occurrence of recessionary conditions and/or negative developments in the domestic and international credit markets may significantly affect the markets in which we do business, the value of our investments, and our ongoing operations, costs and profitability. Any such unfavorable economic conditions, including rising interest rates, may also increase our funding costs, limit our access to capital markets or negatively impact our ability to obtain financing, particularly from the debt markets. In addition, any future financial market uncertainty could lead to financial market disruptions and could further impact our ability to obtain financing.
These events could limit our investment originations, limit our ability to grow and negatively impact our operating results and financial condition.
Risks Related to our Adviser and its Affiliates
The Adviser and its affiliates may face conflicts of interest, which could result in increased risk-taking by us.
The Adviser will be subject to a variety of actual or perceived conflicts of interest in making investments on behalf of the Company. For example, the Adviser may be subject to conflicts relating to its selection of brokers on behalf of the Company. Portfolio transactions for the Company are allocated to brokers on the basis of best execution and in consideration of a broker’s ability to effect the transactions, its facilities, reliability and financial responsibility and the provision or payment by the broker of the costs of research and research-related services. However, brokers may provide other services that are beneficial to the Adviser, but not necessarily beneficial to the Company, including, without limitations, capital introduction, marketing assistance, consulting with respect to technology, operations, equipment and office space, commitment to capital, access to company management, access to deal flow and other services or items. Such services and items may influence the Adviser’s selection of brokers.
Our fee structure may create incentives for our Adviser to make speculative investments or use substantial leverage.
The Adviser and its affiliates will receive substantial fees from us in return for their services. These fees may include certain incentive fees based on the amount of appreciation of our investments. These fees could influence the advice provided to us. Generally, the more equity we sell in public offerings and the greater the risk assumed by us with respect to our investments, including through the use of leverage, the greater the potential for growth in our assets and profits, and, correlatively, the fees payable by us to our Adviser. These compensation arrangements could affect our Adviser’s or its affiliates’ judgment with respect to public offerings of equity, incurrence of debt, and investments made by us, which allow our Adviser to earn increased asset management fees.
We may compete for capital and investment opportunities with other entities managed by our Adviser or its affiliates, subjecting our Adviser to certain conflicts of interest.
The 1940 Act prohibits or restricts the Company’s ability to engage in certain principal transactions and joint transactions with certain “close affiliates” and “remote affiliates.” For example, the Company is prohibited from buying or selling any security from or to any person who owns more than 25% of its voting securities or certain of that person’s affiliates (each is a “close affiliate”“close affiliate”), or entering into prohibited joint transactions with such persons, absent the prior approval of the SEC. The Company considers the Adviser and its affiliates, to be “close affiliates” for such purposes. The Company is prohibited under the 1940 Act from participating in certain principal transactions and joint transactions with a “remote affiliate” without the prior approval of the Independent Directors. Any person that owns, directly or indirectly, 5% or more of the Company’s outstanding voting securities will be a “remote affiliate” for purposes of the 1940 Act, and the Company is generally prohibited from buying or selling any security from or to such affiliate without the prior approval of the Independent Directors.
The Company may, however, invest alongside the Adviser’s investment funds, accounts and investment vehicles in certain circumstances where doing so is consistent with the Company’s investment strategy as well as applicable law and SEC staff interpretations. For example, the Company may invest alongside such investment funds, accounts and investment vehicles consistent with guidance promulgated by the SEC staff to purchase interests in a single class of privately placed securities so long as certain conditions are met, including that the Adviser, acting on the Company’s behalf and on behalf of such investment funds, accounts and investment vehicles, negotiates no term other than price. The Company may also invest alongside the Adviser’s investment funds, accounts and investment vehicles as otherwise permissible under regulatory guidance, applicable regulations and the Adviser’s allocation policy. An exemptive order was issued by the SEC on February 16, 2022 (the “Order”, which was amended on August 31, 2022) to the Company and certain of its affiliates. The Order permits the Company, subject to certain terms and conditions, to participate in certain co-investment transactions with funds and accounts managed by the Adviser that otherwise would be prohibited under either or both of Section 17(d) and 57(a)(4) of the 1940 Act and Rule 17d-1 thereunder, in accordance with the conditions to the Order. The Order permits the Company to co-invest the Adviser’s investment funds, accounts and investment vehicles in the Adviser’s originated loan transactions under certain enumerated conditions if the Board determines that it would be advantageous for the Company to co-invest with investment funds, accounts and investment vehicles managed by the Adviser in a manner consistent with the Company’s investment objectives, positions, policies, strategies and restrictions as well as regulatory requirements and other pertinent factors.
The Company’s allocation policy provides that allocations among the Company and investment funds, accounts and investment vehicles managed by the Adviser and its affiliates will generally be made in a manner deemed to be fair and equitable over time which does not favor one client or group of clients, taking into consideration such factors as legal, regulatory and tax considerations, availability of capital for investment by the account, liquidity concerns and such other factors as deemed under the particular circumstances to be relevant in making the investment allocation determination as determined, in the Company’s case, by the Adviser as well as the terms of the Company’s governing documents and those of such investment funds, accounts and investment vehicles. It is the Company’s policy to base its determinations on such factors as: the amount of cash on-hand, existing commitments and reserves, if any, the Company’s targeted leverage level, the Company’s targeted asset mix and diversification requirements and other investment policies and restrictions set by the Board or imposed by applicable laws, rules, regulations or interpretations. The Company expects that these allocation determinations will be made similarly for investment funds,
22
accounts and investment vehicles managed by the Adviser. However, the Company can offer no assurance that investment opportunities will be allocated to the Company fairly or equitably in the short-term or over time.
24
In situations where co-investment with investment funds, accounts and investment vehicles managed by the Adviser is not permitted or appropriate, such as when there is an opportunity to invest in different securities of the same issuer or where the different investments could be expected to result in a conflict between the Company’s interests and those of the Adviser’s clients, subject to the limitations described in the preceding paragraph, the Adviser will need to decide which client will proceed with the investment. Moreover, except in certain limited circumstances as permitted by the 1940 Act, such as when the only term being negotiated is price, the Company will be unable to invest in any issuer in which an investment fund, account or investment vehicle managed by the Adviser has previously invested. Similar restrictions limit the Company’s ability to transact business with its officers or directors or their affiliates. These restrictions will limit the scope of investment opportunities that would otherwise be available to the Company. If the Company is prohibited by applicable law from investing alongside the Adviser’s investment funds, accounts and investment vehicles with respect to an investment opportunity, the Company will not participate in such investment opportunity.
We may be obligated to pay our Adviser incentive fees even if we incur a net loss due to a decline in the value of our portfolio and even if our earned interest income is not payable in cash.
The Investment Advisory Agreement entitles our Adviser to receive an incentive fee based on our pre-incentive fee net investment income regardless of any capital losses. In such case, we may be required to pay our Adviser an incentive fee for a fiscal quarter even if there is a decline in the value of our portfolio or if we incur a net loss for that quarter.
Any incentive fee payable by us that relates to the pre-incentive fee net investment income may be computed and paid on income that may include interest that has been accrued but not yet received or interest in the form of securities received rather than cash (“payment-in-kind” or “PIK” income). PIK income will be included in the pre-incentive fee net investment income used to calculate the incentive fee to our Adviser even though we do not receive the income in the form of cash. If a portfolio company defaults on a loan that is structured to provide accrued interest income, it is possible that accrued interest income previously included in the calculation of the incentive fee will become uncollectible. Our Adviser is not obligated to reimburse us for any part of the incentive fee it received that was based on accrued interest income that we never receive as a result of a subsequent default.
The quarterly incentive fee on income is recognized and paid without regard to: (i) the trend of pre-incentive fee net investment income as a percent of adjusted capital over multiple quarters in arrears which may in fact be consistently less than the quarterly preferred return, or (ii) the net income or net loss in the current calendar quarter, the current year or any combination of prior periods.
For federal income tax purposes, we may be required to recognize taxable income in some circumstances in which we do not receive a corresponding payment in cash and to make distributions with respect to such income to maintain our tax treatment as a RIC and/or minimize corporate-level U.S. federal income or excise tax. Under such circumstances, we may have difficulty meeting the Annual Distribution Requirement necessary to maintain RIC tax treatment under the Code. This difficulty in making the required distribution may be amplified to the extent that we are required to pay the incentive fee on income with respect to such accrued income. As a result, we may have to sell some of our investments at times and/or at prices we would not consider advantageous, raise additional debt or equity capital, or forgo new investment opportunities for this purpose. If we are not able to obtain cash from other sources, we may fail to qualify for RIC tax treatment and thus become subject to corporate-level U.S. federal income tax.
Our ability to enter into transactions with our affiliates is restricted.
The Company generally will be prohibited under the 1940 Act from participating in certain transactions with its affiliates without prior approval of the Independent Directors of the Company and, in some cases, the SEC. Any person that owns, directly or indirectly, 5% or more of the Company’s outstanding voting securities is an affiliate of the Company for purposes of the 1940 Act, and the Company generally will be prohibited from buying or selling any security from or to such affiliate, absent the prior approval of the Independent Directors. The 1940 Act also prohibits certain “joint” transactions with certain of the Company’s affiliates, which could include investments in the same issuers (whether at the same or different times), without prior approval of the Independent Directors and, in some cases, the SEC. If a person acquires more than 25% of the Company’s voting securities, the Company will be prohibited from buying or selling any security from or to such person or certain of that person’s affiliates, or entering into prohibited joint transactions with such persons, absent the prior approval of the SEC. Similar restrictions limit the Company’s ability to transact business with the Company’s officers or directors or their affiliates. These prohibitions will affect the manner in which investment opportunities are allocated between the Company and other funds managed by MSD or its affiliates. Most importantly, the Company generally will be prohibited from co-investing with other BDT & MSD Accounts or affiliates of the Adviser in MSD-originated loans and financings unless the Company co-invests in accordance with the applicable regulatory guidance or has obtained an exemptive order from the SEC permitting such co-investment activities. Accordingly, while the Adviser intends to allocate suitable opportunities among the Company and other BDT & MSD Accounts or affiliates of the Adviser based on the principles described above, the prohibition on co-investing with affiliates could significantly limit the scope of investment opportunities available to the Company. In particular, the decision by MSD to allocate an opportunity to one or more BDT & MSD Accounts or to an affiliate of the Adviser, or the existence of a prior co-investment structure, might cause the Company to forgo an investment opportunity that it otherwise would have made. Similarly, the Company generally may be limited in its ability to invest in an issuer in which a BDT & MSD Account or affiliate of the Adviser had previously invested. The Company may in certain circumstances also be required to sell, transfer or otherwise reorganize assets in which the Company has invested with BDT & MSD Accounts or affiliates of the Adviser at times that the Company may not consider advantageous.
An exemptive order was issued by the SEC on February 16, 2022 (the “Order”) to the Company and certain of its affiliates, which was amended on August 31, 2022. The Order permits the Company, subject to certain terms and conditions, to participate in certain co-investment transactions with funds and accounts managed by the Adviser that otherwise would be prohibited under either or both of Section 17(d) and 57(a)(4) of the 1940 Act and Rule 17d-1 thereunder, in accordance with the conditions to the Order.
Risks Related to U.S. Federal Income Tax
We will be subject to corporate-level U.S. federal income tax if we are unable to maintain qualification as a RIC under Subchapter M of the Code.
23
To maintain RIC tax treatment under the Code, we must meet the following minimum annual distribution, income source and asset diversification requirements. See “Item 1. Business — Certain U.S. Federal Income Tax Considerations.”
The Annual Distribution Requirement for a RIC will be satisfied if we distribute to our shareholders on an annual basis at least 90% of our “investment company taxable income,” which is generally our net ordinary income plus the excess, if any, of realized net short termshort-term capital gains over realized net long termlong-term capital losses. In addition, a RIC may, in certain cases, satisfy the Annual Distribution Requirement by distributing dividends relating to a taxable year after the
25
close of such taxable year under the “spillback dividend” provisions of Subchapter M. We would be taxed, at regular corporate rates, on retained income and/or gains, including any short termshort-term capital gains or long termlong-term capital gains. We also must make distributions to satisfy an additional Excise Tax Avoidance Requirement in order to avoid a 4% excise tax on certain undistributed income. Because we may use debt financing, we are subject to (i) an asset coverage ratio requirement under the 1940 Act and may, in the future, be subject to (ii) certain financial covenants under loan and credit agreements that could, under certain circumstances, restrict us from making distributions necessary to satisfy the distribution requirements. If we are unable to obtain cash from other sources, or choose or are required to retain a portion of our taxable income or gains, we could (1) be required to pay excise taxes and (2) fail to qualify for RIC tax treatment, and thus become subject to corporate level income tax on our taxable income (including gains).
The income source requirement will be satisfied if we obtain at least 90% of our annual income from dividends, interest, payments with respect to loans of certain securities, gains from the sale of stock or other securities or foreign currencies, net income from certain "qualified publicly traded partnerships," or other income derived from the business of investing in stock or securities.
The asset diversification requirement will be satisfied if we meet certain asset diversification requirements at the end of each quarter of our taxable year. Specifically, at least 50% of the value of our assets must consist of cash, cash equivalents (including receivables), U.S. government securities, securities of other RICs, and other acceptable securities if such securities of any one issuer do not represent more than 5% of the value of our assets or more than 10% of the outstanding voting securities of the issuer; and no more than 25% of the value of our assets can be invested in the securities, other than U.S. government securities or securities of other RICs, of one issuer, the securities, other than the securities of other RICs of two or more issuers that are controlled, as determined under applicable Code rules, by us and that are engaged in the same or similar or related trades or businesses or the securities of certain “qualified publicly traded partnerships.” Failure to meet these requirements may result in our having to dispose of certain investments quickly in order to prevent the loss of RIC status. Because most of our investments will be in private companies, and therefore will be relatively illiquid, any such dispositions could be made at disadvantageous prices and could result in substantial losses.
If we fail to qualify for or maintain RIC tax treatment for any reason and are subject to U.S. federal income tax at corporate rates, the resulting corporate taxes could substantially reduce our net assets, the amount of income available for distribution, and the amount of our distributions.
We may invest in certain debt and equity investments through taxable subsidiaries and the net taxable income of these taxable subsidiaries will be subject to U.S. federal and state corporate income taxes. We may invest in certain foreign debt and equity investments which could be subject to foreign taxes (such as income tax, withholding, and value added taxes).
We may have difficulty paying our required distributions if we recognize income before, or without, receiving cash representing such income.
For U.S. federal income tax purposes, we may be required to recognize taxable income in circumstances in which we do not receive a corresponding payment in cash. For example, since we will likely hold debt obligations that are treated under applicable tax rules as having OID (such as debt instruments with PIK, secondary market purchases of debt securities at a discount to par, interest or, in certain cases, increasing interest rates or debt instruments that were issued with warrants), we must include in income each year a portion of the OID that accrues over the life of the obligation, regardless of whether cash representing such income is received by us in the same taxable year. We may also have to include in income other amounts that we have not yet received in cash, such as unrealized appreciation for foreign currency forward contracts and deferred loan origination fees that are paid after origination of the loan or are paid in non-cash compensation such as warrants or stock. Furthermore, we may invest in non-U.S. corporations (or other non-U.S. entities treated as corporations for U.S. federal income tax purposes) that could be treated under the Code and U.S. Treasury regulations as “passive foreign investment companies” and/or “controlled foreign corporations.” The rules relating to investment in these types of non-U.S. entities are designed to ensure that U.S. taxpayers are either, in effect, taxed currently (or on an accelerated basis with respect to corporate-level events) or taxed at increased tax rates at distribution or disposition. In certain circumstances this could require us to recognize income where we do not receive a corresponding payment in cash.
Unrealized appreciation on derivatives, such as foreign currency forward contracts, may be included in taxable income while the receipt of cash may occur in a subsequent period when the related contract expires. Any unrealized depreciation on investments that the foreign currency forward contracts are designed to hedge are not currently deductible for tax purposes. This can result in increased taxable income whereby we may not have sufficient cash to pay distributions or we may opt to retain such taxable income and pay a 4% excise tax. In such cases we could still rely upon the “spillback provisions” to maintain RIC tax treatment.
We anticipate that a portion of our income may constitute OID or other income required to be included in taxable income prior to receipt of cash. Further, we may elect to amortize market discounts with respect to debt securities acquired in the secondary market and include such amounts in our taxable income in the current year, instead of upon disposition, as an election not to do so would limit our ability to deduct interest expenses for tax purposes. Because any OID or other amounts accrued will be included in our investment company taxable income for the year of the accrual, we may be required to make a distribution to our shareholders in order to satisfy the Annual Distribution Requirement, even if we will not have received any corresponding cash amount. As a result, we may have difficulty meeting the Annual Distribution Requirement necessary to maintain RIC tax treatment under the Code. We may have to sell some of our investments at times and/or at prices we would not consider advantageous, raise additional debt or equity capital, make a partial share distribution, or forgo new investment opportunities for this purpose. If we are not able to obtain cash from other sources, and choose not to make a qualifying share distribution, we may fail to qualify for RIC tax treatment and thus become subject to U.S. federal income tax at corporate rates.
Tax laws may change over time and such changes could adversely affect our business and financial condition.
From time to time, legislation has been proposed that, if enacted into law, would make significant changes to U.S. federal and state income tax laws, including (i) the elimination of the immediate deduction for intangible drilling and development costs, (ii) changes to a depletion allowance for oil and natural gas properties, (iii) the implementation of a carbon tax, (iv) an extension of the amortization period for certain geological and geophysical expenditures, (v) changes to tax rates, and (vi) the introduction of a minimum tax. While these specific changes were not included in recent legislation such as the Inflation
24
Reduction Act of 2022, no accurate prediction can be made as to whether any such legislative changes will be proposed or enacted in the future or, if enacted, what the specific provisions or the effective date of any such legislation would be. The elimination of U.S. federal tax deductions, as well as any other changes to or the imposition of new federal, state, local or non-U.S. taxes (including the imposition of, or increases in production, severance or similar taxes) could adversely affect our business and financial condition.
26
On August 16, 2022, the Biden Administration enacted the Inflation Reduction Act of 2022, which modifies key aspects of the Code, including by creating an alternative minimum tax on certain large corporations and an excise tax on stock repurchases by certain corporations. We are currently assessing the potential impact of these legislative changes. Any new or changed laws or regulations could have a material adverse effect on our business, and political uncertainty could increase regulatory uncertainty in the near term.
Item 1B. Unresolved Staff Comments.
None.
Item 1C. Cybersecurity.
Risk Management and Strategy
We rely on the cybersecurity policies and procedures implemented by BDT & MSD. BDT & MSD have processes in place for assessing, identifying, and managing material risks from potential unauthorized occurrences on or through our electronic information systems that could adversely affect the confidentiality, integrity, or availability of our information systems or the information residing on those systems. These include a wide variety of controls, processes, systems, and tools that are designed to prevent, detect, or mitigate data loss, theft, misuse, unauthorized access, or other security incidents or vulnerabilities affecting our data. Pursuant to BDT & MSD’s Information Security Policy, the BDT &MSD Chief Technology Officer (“CTO”) is responsible for the oversight and implementation of the Information Security Policy. At times BDT & MSD may also engage assessors, consultants, auditors, or other third parties to assist with assessing, identifying, and managing cybersecurity risks.
BDT & MSD use processes to oversee and identify material risks from cybersecurity threats, including those associated with the use of third-party service providers. Additionally, BDT & MSD use systems and processes designed to reduce the impact of a security incident at a third-party service provider. As part of its risk management process, BDT & MSD also maintain an incident response plan that is utilized when cybersecurity incidents impacting us are detected. BDT & MSD also require that all employees, including employees of BDT & MSD complete interactive security awareness training on an annual basis.
Material Impact of Cybersecurity Risks
As of the date of this report, we are not aware of any material risks from cybersecurity threats that have materially affected or are reasonably likely to materially affect the Company, including our business strategy, results of operations, or financial condition. However, future incidents could have a material impact on our business.
Governance
Our cybersecurity risks and associated mitigations are evaluated by our management and BDT & MSD as needed, but no less frequently than annually. The BDT & MSD CTO periodically reports to our board of directors on developments to the information security and cybersecurity risks we face. Reports include, among other things, an overview of BDT & MSD’s controls and procedures related to assessing, identifying, and managing risks related to cybersecurity threats, oversight of third-party service providers and related cybersecurity threats, and management’s evaluation of cybersecurity risks material to us.
Item 2. Properties.
We do not own any real estate or other physical properties materially important to our operation. Our corporate headquarters are located at One Vanderbilt Avenue, 26th Floor New York, New York 10017, and will beare provided for by the Administrator in accordance with the terms of our Administration Agreement. We believe that our office facilities are suitable and adequate for our business as it is contemplated to be conducted.
Item 3. Legal Proceedings.
Neither we nor the Adviser are currently subject to any material legal proceedings, nor, to our knowledge, are any material legal proceedingproceedings threatened against us or them. From time to time, we and/or the Adviser may be a party to certain legal proceedings in the ordinary course of business, including proceedings relating to the enforcement of our rights under contracts with our portfolio companies. Our business is also subject to extensive regulation, which may result in regulatory proceedings against us. While the outcome of these legal or regulatory proceedings cannot be predicted with certainty, we do not expect that these proceedings will have a material effect upon our financial condition or results of operations.
Item 4. Mine Safety Disclosures.
Not applicable.
PART II.
Item 5. Market for Registrant’s Common Equity, Related ShareholderStockholder Matters and Issuer Purchases of Equity Securities.
Market Information
Our shares of common stock, par value $0.001 per share, of the Company (“Shares,” each a “Share,” and a holder thereof a “Shareholder”) will be offered and sold in transactions exempt from registration under the 1933 Act under Section 4(a)(2) and Regulation D.D thereunder. There is no public market for our Shares currently, nor can we give any assurance that one will develop.
Because sharesShares are being acquired by investors in transactions “not involving a public offering,” they are “restricted securities” and may be required to be held indefinitely Our Shares may not be sold, transferred, assigned, pledged or otherwise disposed of unless (i) the Adviser’s consent is granted, and (ii) the shares are registered under applicable securities laws or specifically exempted from registration (in which case the Shareholder may, at our option, be required to provide us with a legal opinion, in form and substance satisfactory to us, that registration is not required). Accordingly, an investor must be willing to bear the economic risk of investment in the shares until we are liquidated. No sale, transfer, assignment, pledge or other disposition, whether voluntary or involuntary, of the shares may be made except by registration of the transfer on our books. Each transferee will be required to execute an instrument agreeing to be bound by these restrictions and the other restrictions imposed on the shares and to execute such other instruments or certifications as are reasonably required by us.
27
On November 29, 2023, the Company issued 250 shares of its 12.0% Series A Cumulative Preferred Stock (the “Series A Preferred Stock”). The Series A Preferred Stock was offered and sold in transactions exempt from registration under the 1933 Act under Section 4(a)(2) and Regulation D thereunder. There is no public market for our Series A Preferred Stock.
Holders
As of March 23, 202322, 2024 there were 219416 shareholders of our common stock.stock and 250 holders of Series A Preferred Stock.
Determinations in Connection with our Offerings
In connection with each offeringthe Private Offering of our Shares, to the extent we do not have Shareholder approval to sell below NAV, our Board or an authorized committee thereof will be required to make a good faith determination that we are not selling our Shares at a price below the then current net asset value of our Shares at the time at which the sale is made. Our Board or an authorized committee thereof will consider the following factors, among others, in making such determination:
These processes and procedures are part of our compliance policies and procedures. Records will be made contemporaneously with all determinations described in this section and these records will be maintained with other records we are required to maintain under the 1940 Act.
Distribution Policy
Because we intend to maintain our ability to be subject to taxstatus as a RIC for U.S. federal income tax purposes, we intend to distribute at least 90% of our annual taxable income to our Shareholders. To the extent our taxable earnings fall below the total amount of our paid distributions for any given fiscal year, a portion of those paid distributions may be deemed to be a tax return of capital to our Shareholders. The timing and amount of our distributions, if any, is determined by our Board. Any distributions
25
to shareholders are declared out of assets legally available for distribution. See Note 9. Net Assets for the history of distributions declared for the years ended December 31, 2021, December 31, 2022 and December 31, 2022.2023.
Distribution Reinvestment Plan
We have adopted a distribution reinvestment plan pursuant to which Shareholders may elect to have their distributions automatically reinvested in additional shares of the Company’s common stock, rather than receiving distributions. As a result, if the Board authorizes, and the Company declares a distribution, then Shareholders who have opted into the Company’s distribution reinvestment plan will have their distribution automatically reinvested in additional shares of the Company rather than receiving the distribution in cash. Any fractional share of the Company’s common stock otherwise issuable to a participant in the distribution reinvestment plan will instead be paid in cash.
No action will be required on the part of a registered Shareholder to receive his, her, or its dividend in cash. A registered shareholder that wishes to participate in the distribution reinvestment plan must notify U.S. Bank Global Fund Services in writing no later than ten calendar days prior to the record date for any dividend or other distribution and such election will remain in place until the Shareholder notifies U.S. Bank Global Fund Services otherwise.
Item 6. Reserved
2628
Item 7. Management’s Discussion and Analysis of Financial Condition and Results of Operations.
The following discussion should be read in conjunction with our audited consolidated financial statements and related notes and other financial information appearing elsewhere in this Annual Report on Form 10-K. In addition to historical information, the following discussion and other parts of this Annual Report on Form 10-K contain forward-looking information that involves risks and uncertainties.
Please see “Risk Factors” and “Special Note Regarding Forward-Looking Statements” for a discussion of the uncertainties, risks and assumptions associated with these statements.
Overview
We were established as a Delaware limited liability company on February 18, 2021, and converted to MSD Investment, LLC, a Maryland limited liability company, on October 22, 2021. On December 1, 2021, the Company entered into purchase agreements with the Funds pursuant to which the Company agreed to acquire the Initial Portfolio for an aggregate cash purchase price equal to the fair value of such assets, plus accrued but unpaid interest as of the closing date, less any principal payments received between signing of the purchase agreements and the closing of the transactions contemplated thereby. The closing of the purchase of the Initial Portfolio by the Company occurred on December 21, 2021. As consideration for the Portfolio, the Company paid the Funds an aggregate purchase price of $656.5 million. On December 28, 2021, the Company filed Articles of Conversion (and related Articles of Incorporation) with the Maryland Department of Assessments and Taxation in order to effectuate the Corporate Conversion. In accordance with the Articles of Conversion and Maryland law, the Corporate Conversion became effective as of 12:01 a.m. on January 1, 2022 and, as result of the Corporate Conversion, each share representing a portion of the membership interests of the Company prior to the effective time of the Corporate Conversion was automatically converted into one share of common stock, par value $0.001 per share, of the Company. In connection with the Corporate Conversion the Company changed its name from “MSD Investment, LLC” to “MSD Investment Corp.” On December 29, 2021, the Company filed a Form N-54A to elect to be treatedregulated as a BDC under the 1940 Act.
We have elected to be treated as a RIC for U.S. federal income tax purposes under Subchapter M of the Code for the fiscal year ending December 31, 20222023 for U.S. federal income tax purposes. As a BDC and a RIC, we will be required to comply with certain regulatory requirements.
The Company’s investment objective is to invest in a broad range of portfolio companies, primarily through senior secured loans and notes where we believe the probability of losses are limited and the opportunity to generate attractive risk adjusted returns is maximized. The Adviser (as defined below) expects to execute this strategy by continuing its long history of leveraging its network to source and diligence what it believes to be attractive opportunities across a broad range of industries. The strategy will be executed by a team of experienced investment professionals who have more than a 20-year history of successfully deploying capital in both liquid and illiquid investments.
Recent COVID-19 Developments
We have been closely monitoring, and will continue to monitor, the impact of the COVID-19 pandemic (including new variants of COVID-19) on all aspects of our business, including how it will impact our portfolio companies, employees, due diligence and underwriting processes, and financial markets. Given the continued fluidity of the pandemic, we cannot estimate the long-term impact of COVID-19 on our business, future results of operations, financial position or cash flows at this time. Further, the operational and financial performance of the portfolio companies in which we make investments may be significantly impacted by COVID-19, which may in turn impact the valuation of our investments. The COVID-19 pandemic and preventative measures taken to contain or mitigate its spread have caused, and are continuing to cause, business shutdowns, cancellations of events and restrictions on travel, significant reductions in demand for certain goods and services, reductions in business activity and financial transactions, supply chain disruptions, labor difficulties and shortages, commodity inflation and elements of economic and financial market instability in the United States and globally. Such effects will likely continue for the duration of the pandemic, which is uncertain, and for some period thereafter.
Russian Invasion of Ukraine
Russia’s invasion of Ukraine, and corresponding events in late February 2022, have had, and could continue to have, severe adverse effects on regional and global economic markets. Following Russia’s actions, various governments, including the United States, have issued broad-ranging economic sanctions against Russia, including, among other actions, a prohibition on doing business with certain Russian companies, large financial institutions, officials and oligarchs; a commitment by certain countries and the European Union to remove selected Russian banks from the Society for Worldwide Interbank Financial Telecommunications, the electronic banking network that connects banks globally; and restrictive measures to prevent the Russian Central Bank from undermining the impact of the sanctions. The current sanctions and the potential for future sanctions, and other actions, and Russia’s retaliatory responses to those sanctions and actions, may continue to adversely impact the Russian economy and may result in the further decline of the value and liquidity of Russian securities, a continued weakening of the ruble, exchange closures and may have other adverse consequences on the Russian economy that could impact the value of Russian investments and impair the ability of the Company to buy, sell, receive, or deliver those securities. Moreover, those events have, and could continue to have, an adverse effect on global markets’ performance and liquidity, thereby negatively affecting the value of the Company’s investments beyond any direct exposure to Russian issuers. The duration of ongoing hostilities and the vast array of sanctions and related events cannot be predicted. Those events present material uncertainty and risk with respect to markets globally and the performance of the Company and its investments or operations could be negatively impacted.
Economic Developments
Economic activity has continued to accelerate across sectors and regions. Nonetheless, we have observed and continue to observe supply chain interruptions, labor resource shortages, commodity inflation, rising interest rates, economic sanctions in response to international conflicts and instances of geopolitical, economic and financial market instability in the United States and abroad. One or more of these factors may contribute to increased market volatility and may have long- and short-term effects in the United States and worldwide financial markets.
27
Financial and Operating Highlights
The following table presents financial and operating highlights (i) as of December 31, 20222023 and December 31, 20212022 and (ii) for the yearyears ended December 31, 2023 and December 31, 2022 and for the period ended December 31, 2021:
| For the Year Ended December 31, 2022 |
|
| For the Period Ended December 31, 2021 (1) |
| ||
Average net assets | $ | 365,431 |
|
| $ | 301,998 |
|
Average borrowings | $ | 482,333 |
|
| $ | 410,000 |
|
Cost of investments purchased | $ | 585,382 |
|
| $ | 692,134 |
|
Sales of investments | $ | 77,659 |
|
| $ | — |
|
Principal repayments | $ | 185,213 |
|
| $ | 2,454 |
|
Net investment income | $ | 39,352 |
|
| $ | 294 |
|
Net realized gains (losses) | $ | 3,523 |
|
| $ | 79 |
|
Net change in unrealized appreciation (depreciation) | $ | (51,283 | ) |
| $ | 1,625 |
|
Net increase (decrease) in net assets resulting from operations | $ | (8,408 | ) |
| $ | 1,998 |
|
Net investment income per share - basic and diluted | $ | 2.70 |
|
| $ | 0.02 |
|
Earnings per share - basic and diluted | $ | (0.58 | ) |
| $ | 0.17 |
|
|
| As of |
| |||||
|
| December 31, 2023 |
|
| December 31, 2022 |
| ||
Total assets |
| $ | 2,316,063 |
|
| $ | 1,047,077 |
|
Investments in portfolio companies, at fair value |
| $ | 2,197,053 |
|
| $ | 981,738 |
|
Borrowings |
| $ | 1,148,025 |
|
| $ | 537,000 |
|
Net assets |
| $ | 937,586 |
|
| $ | 481,846 |
|
Net asset value per share |
| $ | 23.26 |
|
| $ | 21.78 |
|
Leverage ratio (borrowings / total assets) |
|
| 49.6 | % |
|
| 51.3 | % |
| For the Year Ended December 31, 2023 |
|
| For the Year Ended December 31, 2022 |
|
| For the Period Ended December 31, 2021 (1) |
| |||
Average net assets | $ | 695,339 |
|
| $ | 365,431 |
|
| $ | 301,998 |
|
Average borrowings | $ | 804,401 |
|
| $ | 482,333 |
|
| $ | 410,000 |
|
Cost of investments purchased | $ | 1,550,830 |
|
| $ | 585,382 |
|
| $ | 692,134 |
|
Sales of investments | $ | 78,128 |
|
| $ | 77,659 |
|
| $ | — |
|
Principal repayments | $ | 319,913 |
|
| $ | 185,213 |
|
| $ | 2,454 |
|
Net investment income | $ | 96,142 |
|
| $ | 39,352 |
|
| $ | 294 |
|
Net realized gains (losses) | $ | 2,439 |
|
| $ | 3,523 |
|
| $ | 79 |
|
Net change in unrealized appreciation (depreciation) | $ | 37,095 |
|
| $ | (51,283 | ) |
| $ | 1,625 |
|
Net increase (decrease) in net assets resulting from operations | $ | 135,676 |
|
| $ | (8,408 | ) |
| $ | 1,998 |
|
Net investment income per share - basic and diluted | $ | 3.23 |
|
| $ | 2.70 |
|
| $ | 0.02 |
|
Earnings per share - basic and diluted | $ | 4.56 |
|
| $ | (0.58 | ) |
| $ | 0.17 |
|
29
Portfolio and Investment Activity for the yearyears ended December 31, 20222023 and for the period ended December 31, 20212022
The following table presents our portfolio company activity for the yearyears ended December 31, 20222023 and for the period ended December 31, 2021:2022:
|
| For the Year Ended December 31, 2022 |
|
| For the Period Ended December 31, 2021 (1) |
| ||
Portfolio companies at beginning of period |
|
| 30 |
|
|
| — |
|
Number of added portfolio companies |
|
| 20 |
|
|
| 30 |
|
Number of exited portfolio companies |
|
| (9 | ) |
|
| — |
|
Portfolio companies at period end |
|
| 41 |
|
|
| 30 |
|
|
|
|
|
|
|
| ||
Number of debt investments period end |
|
| 52 |
|
|
| 34 |
|
Number of preferred equity investments at period end |
|
| 1 |
|
|
| 1 |
|
| For the Year Ended December 31, 2023 |
|
| For the Year Ended December 31, 2022 |
| |||
Portfolio companies at beginning of period |
|
| 41 |
|
|
| 30 |
|
Number of added portfolio companies |
|
| 31 |
|
|
| 20 |
|
Number of exited portfolio companies |
|
| (11 | ) |
|
| (9 | ) |
Portfolio companies at period end |
|
| 61 |
|
|
| 41 |
|
|
|
|
|
|
| |||
Number of debt investments period end |
|
| 90 |
|
|
| 52 |
|
Number of preferred equity investments at period end |
|
| 3 |
|
|
| 1 |
|
The following table presents a roll-forward of all investment purchase, sale and repayment activity and changes in fair value, within our investment portfolio for the yearyears ended December 31, 20222023 and for the period ended December 31, 20212022:
| Year Ended December 31, 2022 |
| Year Ended December 31, 2023 |
| ||||||||||||||||||||||||||||||||||
| First Lien Debt |
|
| Second Lien Debt |
|
| Unsecured Debt |
|
| Preferred Equity |
|
| Total Investments |
| First Lien Debt |
|
| Second Lien Debt |
|
| Unsecured Debt |
|
| Preferred Equity |
|
| Total Investments |
| ||||||||||
Fair value, beginning of year | $ | 486,044 |
|
| $ | 145,396 |
|
| $ | 36,220 |
|
| $ | 24,697 |
|
| $ | 692,357 |
| $ | 748,545 |
|
| $ | 210,926 |
|
| $ | — |
|
| $ | 22,267 |
|
| $ | 981,738 |
|
Purchase of investments |
| 467,393 |
|
|
| 117,989 |
|
|
| — |
|
|
| — |
|
|
| 585,382 |
|
| 1,544,425 |
|
|
| 5,807 |
|
|
| — |
|
|
| 598 |
|
|
| 1,550,830 |
|
Proceeds from principal repayments and sales of investments |
| (188,494 | ) |
|
| (37,763 | ) |
|
| (36,616 | ) |
|
| — |
|
|
| (262,873 | ) |
| (397,729 | ) |
|
| (100 | ) |
|
| — |
|
|
| (214 | ) |
|
| (398,043 | ) |
Other changes in fair value (1) |
| (16,398 | ) |
|
| (14,696 | ) |
|
| 396 |
|
|
| (2,430 | ) |
|
| (33,128 | ) |
| 47,600 |
|
|
| 9,687 |
|
|
| — |
|
|
| 5,241 |
|
|
| 62,528 |
|
Fair value, end of year | $ | 748,545 |
|
| $ | 210,926 |
|
| $ | — |
|
| $ | 22,267 |
|
| $ | 981,738 |
| $ | 1,942,841 |
|
| $ | 226,320 |
|
| $ | — |
|
| $ | 27,892 |
|
| $ | 2,197,053 |
|
| Period Ended December 31, 2021 (1) |
| |||||||||||||||||
| First Lien Debt |
|
| Second Lien Debt |
|
| Unsecured Debt |
|
| Preferred Equity |
|
| Total Investments |
| |||||
Fair value, beginning of period | $ | — |
|
| $ | — |
|
| $ | — |
|
| $ | — |
|
| $ | — |
|
Purchase of investments |
| 486,890 |
|
|
| 144,970 |
|
|
| 36,120 |
|
|
| 24,233 |
|
|
| 692,213 |
|
Proceeds from principal repayments and sales of investments |
| (2,336 | ) |
|
| (118 | ) |
|
| — |
|
|
| — |
|
|
| (2,454 | ) |
Other changes in fair value (2) |
| 1,490 |
|
|
| 544 |
|
|
| 100 |
|
|
| 464 |
|
|
| 2,598 |
|
Fair value, end of period | $ | 486,044 |
|
| $ | 145,396 |
|
| $ | 36,220 |
|
| $ | 24,697 |
|
| $ | 692,357 |
|
28
| Year Ended December 31, 2022 |
| |||||||||||||||||
| First Lien Debt |
|
| Second Lien Debt |
|
| Unsecured Debt |
|
| Preferred Equity |
|
| Total Investments |
| |||||
Fair value, beginning of year | $ | 486,044 |
|
| $ | 145,396 |
|
| $ | 36,220 |
|
| $ | 24,697 |
|
| $ | 692,357 |
|
Purchase of investments |
| 467,393 |
|
|
| 117,989 |
|
|
| — |
|
|
| — |
|
|
| 585,382 |
|
Proceeds from principal repayments and sales of investments |
| (188,494 | ) |
|
| (37,763 | ) |
|
| (36,616 | ) |
|
| — |
|
|
| (262,873 | ) |
Other changes in fair value (1) |
| (16,398 | ) |
|
| (14,696 | ) |
|
| 396 |
|
|
| (2,430 | ) |
|
| (33,128 | ) |
Fair value, end of year | $ | 748,545 |
|
| $ | 210,926 |
|
| $ | — |
|
| $ | 22,267 |
|
| $ | 981,738 |
|
30
The following table presents selected information regarding our investment portfolio as of December 31, 20222023 and December 31, 2021:2022:
| As of | As of | ||||||||||||||||
| December 31, 2022 |
| December 31, 2021 | December 31, 2023 |
| December 31, 2022 | ||||||||||||
Investments: |
|
|
|
|
|
|
|
|
|
|
|
| ||||||
Number of portfolio companies |
| 41 |
|
|
| 30 |
|
|
| 61 |
|
|
| 41 |
|
| ||
Number of investments |
| 53 |
|
|
| 35 |
|
|
| 93 |
|
|
| 53 |
|
| ||
Average investment at fair value | $ | 18,523 |
|
| $ | 19,782 |
|
| $ | 23,624 |
|
| $ | 18,523 |
|
| ||
Average cost of debt investments as a percentage of par (1) |
| 97.88 |
| % |
|
| 98.15 |
| % |
| 97.18 |
| % |
|
| 97.88 |
| % |
Debt investments on non-accrual status as a percent of amortized cost of total debt investments |
| 1.10 |
| % |
|
| 0.00 |
| % |
| 0.51 |
| % |
|
| 1.10 |
| % |
Debt investments on non-accrual status as a percent of fair value of total debt investments |
| 0.40 |
| % |
|
| 0.00 |
| % |
| 0.11 |
| % |
|
| 0.40 |
| % |
Number of debt investments on non-accrual status |
| 1 |
|
|
| — |
|
|
| 1 |
|
|
| 1 |
|
| ||
Weighted Average Net Debt Through Tranche | 4.6x |
|
| 4.1x |
|
| ||||||||||||
Weighted Average Interest Rate Coverage | 3.5x |
|
| 2.3x |
|
| ||||||||||||
Percentage of Sponsored Investments |
| 83.20 |
| % |
|
| 64.85 |
| % | |||||||||
Weighted Average EBITDA (mm) (2) (3) |
| 245.3 |
|
|
| 249.2 |
|
| ||||||||||
Median EBITDA (mm) (2) (3) |
| 187.2 |
|
|
| 95.4 |
|
| ||||||||||
Weighted average net debt through tranche (2) | 4.1x |
|
| 4.6x |
|
| ||||||||||||
Weighted average interest rate coverage (2) | 3.1x |
|
| 3.5x |
|
| ||||||||||||
Percentage of sponsored investments |
| 83.65 |
| % |
|
| 83.20 |
| % | |||||||||
|
|
|
|
|
|
|
|
|
|
|
|
| ||||||
Floating interest rate debt investments: |
|
|
|
|
|
|
|
|
|
|
|
| ||||||
Percent of debt portfolio (2) |
| 87.7 |
| % |
|
| 80.9 |
| % | |||||||||
Percent of debt portfolio (4) |
| 96.3 |
| % |
|
| 87.7 |
| % | |||||||||
Weighted average interest rate floors |
| 0.70 |
| % |
|
| 0.62 |
| % |
| 0.73 |
| % |
|
| 0.70 |
| % |
Weighted average coupon spread to base interest rate |
| 674 |
| bps |
|
| 681 |
| bps |
| 626 |
| bps |
|
| 674 |
| bps |
Weighted average effective yield on floating rate debt investments at amortized cost (3) |
| 11.68 |
| % |
|
| 8.19 |
| % | |||||||||
Weighted average effective yield on floating rate debt investments at amortized cost (5) |
| 12.85 |
| % |
|
| 11.68 |
| % | |||||||||
|
|
|
|
|
|
|
|
|
|
|
|
| ||||||
Fixed interest debt investments: |
|
|
|
|
|
| ||||||||||||
Percent of debt portfolio (2) |
| 12.3 |
| % |
|
| 19.1 |
| % | |||||||||
Fixed interest debt investments: (6) |
|
|
|
|
|
| ||||||||||||
Percent of debt portfolio (4) |
| 3.7 |
| % |
|
| 12.3 |
| % | |||||||||
Weighted average coupon rate |
| 9.43 |
| % |
|
| 9.56 |
| % |
| 8.94 |
| % |
|
| 9.43 |
| % |
Weighted average effective yield on fixed rate debt investments at amortized cost (3) |
| 10.38 |
| % |
|
| 9.02 |
| % | |||||||||
Weighted average effective yield on fixed rate debt investments at amortized cost (5) |
| 9.89 |
| % |
|
| 10.38 |
| % | |||||||||
|
|
|
|
|
|
|
|
|
|
|
|
| ||||||
Other Metrics: |
|
|
|
|
|
| ||||||||||||
Weighted average years to maturity on debt investments (4) |
| 4.23 |
| years |
|
| 6.85 |
| years | |||||||||
Weighted average effective yield on the portfolio at amortized cost (3) |
| 11.54 |
| % |
|
| 8.53 |
| % | |||||||||
Other metrics: |
|
|
|
|
|
| ||||||||||||
Weighted average years to maturity on debt investments |
| 4.12 |
| years |
|
| 4.23 |
| years | |||||||||
Weighted average effective yield on the portfolio at amortized cost (5) (6) |
| 12.74 |
| % |
|
| 11.54 |
| % | |||||||||
The following table presents the maturity schedule of our funded debt investments based on their principal amount as of:of December 31, 2023 and December 31, 2022:
|
| December 31, 2022 |
|
| December 31, 2021 |
|
|
| December 31, 2023 |
|
| December 31, 2022 |
|
| ||||||||||||||||||||||
Maturity Year |
| Principal Amount |
|
| Percentage of Debt Portfolio |
|
|
| Principal Amount |
|
| Percentage of Debt Portfolio |
|
|
| Principal Amount |
|
| Percentage of Debt Portfolio |
|
|
| Principal Amount |
|
| Percentage of Debt Portfolio |
|
| ||||||||
2023 |
| $ | 15,109 |
|
|
| 1.5 |
| % |
| $ | 51,223 |
|
|
| 7.6 |
| % |
| $ | 12,853 |
|
|
| 0.6 |
| % |
| $ | 15,109 |
|
|
| 1.5 |
| % |
2024 |
|
| 72,098 |
|
|
| 7.0 |
|
|
|
| 153,485 |
|
|
| 22.5 |
|
|
| $ | 43,560 |
|
|
| 1.9 |
|
|
|
| 72,098 |
|
|
| 7.0 |
|
|
2025 |
|
| 238,222 |
|
|
| 23.3 |
|
|
|
| 150,967 |
|
|
| 22.2 |
|
|
| $ | 196,430 |
|
|
| 8.8 |
|
|
|
| 238,222 |
|
|
| 23.3 |
|
|
2026 |
|
| 135,865 |
|
|
| 13.3 |
|
|
|
| 129,930 |
|
|
| 19.2 |
|
|
| $ | 570,903 |
|
|
| 25.5 |
|
|
|
| 135,865 |
|
|
| 13.3 |
|
|
2027 |
|
| 72,435 |
|
|
| 7.1 |
|
|
|
| 88,694 |
|
|
| 13.1 |
|
|
| $ | 114,536 |
|
|
| 5.1 |
|
|
|
| 72,435 |
|
|
| 7.1 |
|
|
2028 |
|
| 259,567 |
|
|
| 25.3 |
|
|
|
| 30,190 |
|
|
| 4.5 |
|
|
| $ | 491,877 |
|
|
| 22.0 |
|
|
|
| 259,567 |
|
|
| 25.3 |
|
|
2029 |
|
| 195,923 |
|
|
| 19.1 |
|
|
|
| 73,750 |
|
|
| 10.9 |
|
|
| $ | 361,356 |
|
|
| 16.1 |
|
|
|
| 195,923 |
|
|
| 19.1 |
|
|
2030 |
|
| 35,000 |
|
|
| 3.4 |
|
|
|
| — |
|
|
| — |
|
|
| $ | 448,518 |
|
|
| 20.0 |
|
|
|
| 35,000 |
|
|
| 3.4 |
|
|
|
| $ | 1,024,219 |
|
|
| 100.0 |
| % |
| $ | 678,239 |
|
|
| 100.0 |
| % |
| $ | 2,240,033 |
|
|
| 100.0 |
| % |
| $ | 1,024,219 |
|
|
| 100.0 |
| % |
We utilize an investment rating system to monitor the credit profile of our underlying portfolio companies. We use a five-level ratings scale to classify individual investments.
31
29
The following tables show the investment rankings of the debt investments in our portfolio as of December 31, 20222023 and December 31, 2021:2022:
|
| As of December 31, 2022 |
|
| As of December 31, 2023 |
|
| As of December 31, 2022 |
| ||||||||||||||||||||||||||||
Risk Rating |
| Fair Value |
|
| % of Portfolio |
|
|
| # of Investments |
|
| Fair Value |
|
| % of Portfolio |
|
| # of Investments |
|
| Fair Value |
|
| % of Portfolio |
|
| # of Investments |
| |||||||||
1 |
| $ | — |
|
|
| 0.0 |
| % |
|
| — |
|
| $ | — |
|
|
| 0.0 | % |
|
| — |
|
| $ | — |
|
|
| 0.0 | % |
|
| — |
|
2 |
|
| 116,109 |
|
|
| 11.8 |
|
|
| 7 |
|
|
| 70,386 |
|
|
| 3.2 |
|
|
| 2 |
|
|
| 116,109 |
|
|
| 11.8 |
|
|
| 7 |
| |
3 |
|
| 859,792 |
|
|
| 87.6 |
|
|
| 44 |
|
|
| 2,123,142 |
|
|
| 96.7 |
|
|
| 89 |
|
|
| 859,792 |
|
|
| 87.6 |
|
|
| 44 |
| |
4 |
|
| 5,837 |
|
|
| 0.6 |
|
|
| 2 |
|
|
| 1,096 |
|
|
| 0.0 |
|
|
| 1 |
|
|
| 5,837 |
|
|
| 0.6 |
|
|
| 2 |
| |
5 |
|
| — |
|
|
| 0.0 |
|
|
| — |
|
|
| 2,429 |
|
|
| 0.1 |
|
|
| 1 |
|
|
| — |
|
|
| 0.0 |
|
|
| — |
| |
|
| $ | 981,738 |
|
|
| 100.0 |
| % |
|
| 53 |
|
| $ | 2,197,053 |
|
|
| 100.0 | % |
|
| 93 |
|
| $ | 981,738 |
|
|
| 100.0 | % |
|
| 53 |
|
|
| As of December 31, 2021 |
| ||||||||||
Risk Rating |
| Fair Value |
|
| % of Portfolio |
|
|
| # of Investments |
| |||
1 |
| $ | — |
|
|
| 0.0 |
| % |
|
| — |
|
2 |
|
| — |
|
|
| 0.0 |
|
|
|
| — |
|
3 |
|
| 692,357 |
|
|
| 100.0 |
|
|
|
| 35 |
|
4 |
|
| — |
|
|
| 0.0 |
|
|
|
| — |
|
5 |
|
| — |
|
|
| 0.0 |
|
|
|
| — |
|
|
| $ | 692,357 |
|
|
| 100.0 |
| % |
|
| 35 |
|
Results of Operations
Revenues
We generate revenues primarily in the form of interest on the debt securities of portfolio companies that we acquire and hold for investment purposes. Our investments in debt securities generally have expected maturities of two to eight years, although we have no lower or upper constraint on maturity, and typically earn interest at floating and fixed interest rates. Interest on our debt securities is generally payable to us monthly, quarterly or semi-annually. The outstanding principal amount of our debt securities and any accrued but unpaid interest will generally become due at the respective maturity dates. In addition, we may generate revenue in the form of dividends from preferred and common equity investments, amortization of original issue discount, prepayment fees, commitment fees, origination fees and fees for providing significant managerial assistance.
Operating Expenses
Our primary operating expenses include a management fee and, depending on our operating results, a performance-based incentive fee, interest expense, administrative services, custodian and accounting services and other third-party professional services fees and expenses. The management and performance-based incentive fees compensate the Adviser for its services in identifying, evaluating, negotiating, closing and monitoring our investments.
Operating Results for the yearyears ended December 31, 2023 and December 31, 2022 and for the period ended December 31, 2021 are presented below:
| For the Year Ended December 31, 2022 |
|
| For the Period Ended December 31, 2021 (1) |
| For the Year Ended December 31, 2023 |
|
| For the Year Ended December 31, 2022 |
|
| For the Period Ended December 31, 2021 (1) |
| |||||
Total investment income | $ | 80,568 |
|
| $ | 1,739 |
| $ | 196,724 |
|
| $ | 80,568 |
|
| $ | 1,739 |
|
Total expenses |
| 41,216 |
|
|
| 1,445 |
|
| 100,582 |
|
|
| 41,216 |
|
|
| 1,445 |
|
Net investment income |
| 39,352 |
|
|
| 294 |
|
| 96,142 |
|
|
| 39,352 |
|
|
| 294 |
|
Net realized gain (loss) |
| 3,523 |
|
|
| 79 |
|
| 2,439 |
|
|
| 3,523 |
|
|
| 79 |
|
Net change in unrealized appreciation (depreciation) |
| (51,283 | ) |
|
| 1,625 |
|
| 37,095 |
|
|
| (51,283 | ) |
|
| 1,625 |
|
Net increase (decrease) in net assets resulting from operations | $ | (8,408 | ) |
| $ | 1,998 |
| $ | 135,676 |
|
| $ | (8,408 | ) |
| $ | 1,998 |
|
Investment Income
Investment income consisted of the following components for the yearyears ended December 31, 2023 and December 31, 2022 and for the period ended December 31, 2021:
|
| For the Year Ended December 31, 2022 |
|
| For the Period Ended December 31, 2021 (1) |
| For the Year Ended December 31, 2023 |
|
| For the Year Ended December 31, 2022 |
|
| For the Period Ended December 31, 2021 (1) |
| |||||
Interest income on debt securities |
|
|
|
|
|
|
|
|
|
|
| ||||||||
Cash interest |
| $ | 63,517 |
|
| $ | 1,439 |
| $ | 168,360 |
|
| $ | 63,517 |
|
| $ | 1,439 |
|
PIK interest |
|
| 9,064 |
|
|
| 79 |
|
| 12,365 |
|
|
| 9,064 |
|
|
| 79 |
|
Net accretion/amortization of discounts/premiums |
|
| 4,198 |
|
|
| 79 |
|
| 7,760 |
|
|
| 4,198 |
|
|
| 79 |
|
Total interest on debt securities |
|
| 76,779 |
|
|
| 1,597 |
|
| 188,485 |
|
|
| 76,779 |
|
|
| 1,597 |
|
Dividend income |
| 1,040 |
|
|
| — |
|
|
| — |
| ||||||||
PIK dividend |
|
| 3,488 |
|
|
| 98 |
|
| 2,945 |
|
|
| 3,488 |
|
|
| 98 |
|
Total interest and dividend income |
|
| 80,267 |
|
|
| 1,695 |
|
| 192,470 |
|
|
| 80,267 |
|
|
| 1,695 |
|
Other income |
|
| 301 |
|
|
| 44 |
|
| 4,254 |
|
|
| 301 |
|
|
| 44 |
|
Total investment income |
| $ | 80,568 |
|
| $ | 1,739 |
| $ | 196,724 |
|
| $ | 80,568 |
|
| $ | 1,739 |
|
Average investments at cost (2) |
| $ | 834,940 |
|
| $ | 671,913 |
| $ | 1,563,695 |
|
| $ | 834,940 |
|
| $ | 671,913 |
|
Income return (3) |
|
| 9.61 | % |
|
| 0.25 | % |
| 12.31 | % |
|
| 9.61 | % |
|
| 0.25 | % |
3032
Operating Expenses
Our operating expenses can be categorized into fixed operating expenses, variable operating expenses and performance-dependent expenses. Fixed operating expenses are generally static period over period. Variable expenses are calculated based on fund metrics such as total assets, net assets or total borrowings. Performance-dependent expenses fluctuate independent of our size.
The table below shows a breakdown of our operating expenses for the yearyears ended December 31, 2023 and December 31, 2022 and for the period ended December 31, 2021:
|
| For the Year Ended December 31, 2022 |
|
| For the Period Ended December 31, 2021 (1) |
|
| For the Year Ended December 31, 2023 |
|
| For the Year Ended December 31, 2022 |
|
| For the Period Ended December 31, 2021 (1) |
| |||||
Fixed Operating Expenses |
|
|
|
|
|
|
|
|
|
|
|
| ||||||||
Professional fees (2) |
| $ | 1,023 |
|
| $ | 336 |
|
| $ | 2,087 |
|
| $ | 1,023 |
|
| $ | 336 |
|
Board of directors' fees |
|
| 290 |
|
|
| 11 |
|
|
| 310 |
|
|
| 290 |
|
|
| 11 |
|
General and other expenses |
|
| 90 |
|
|
| 77 |
|
|
| 422 |
|
|
| 90 |
|
|
| 77 |
|
Organization and offering costs (3) |
|
| 434 |
|
|
| 121 |
|
|
| 21 |
|
|
| 434 |
|
|
| 121 |
|
Total fixed operating expenses |
|
| 1,837 |
|
|
| 545 |
|
|
| 2,840 |
|
|
| 1,837 |
|
|
| 545 |
|
|
|
|
|
|
|
|
|
|
|
|
|
| ||||||||
Variable operating expenses: |
|
|
|
|
|
|
|
|
|
|
|
| ||||||||
Interest expense (4) |
|
| 24,152 |
|
|
| 388 |
|
|
| 66,206 |
|
|
| 24,152 |
|
|
| 388 |
|
Management fees |
|
| 6,327 |
|
|
| 155 |
|
|
| 11,535 |
|
|
| 6,327 |
|
|
| 155 |
|
Administrative expense (5) |
|
| 1,958 |
|
|
| 26 |
|
|
| 2,551 |
|
|
| 1,958 |
|
|
| 26 |
|
Custody expense |
|
| 246 |
|
|
| 19 |
|
|
| 401 |
|
|
| 246 |
|
|
| 19 |
|
Transfer agency fees |
|
| 52 |
|
|
| — |
|
|
| 99 |
|
|
| 52 |
|
|
| — |
|
Total variable operating expenses |
|
| 32,735 |
|
|
| 588 |
|
|
| 80,792 |
|
|
| 32,735 |
|
|
| 588 |
|
|
|
|
|
|
|
|
|
|
|
|
|
| ||||||||
Performance-dependent expenses: |
|
|
|
|
|
|
|
|
|
|
|
| ||||||||
Income based incentive fee |
|
| 6,900 |
|
|
| 56 |
|
|
| 16,950 |
|
|
| 6,900 |
|
|
| 56 |
|
Capital gains incentive fee |
|
| (256 | ) |
|
| 256 |
|
|
| — |
|
|
| (256 | ) |
|
| 256 |
|
Total performance-dependent expenses |
|
| 6,644 |
|
|
| 312 |
|
|
| 16,950 |
|
|
| 6,644 |
|
|
| 312 |
|
|
|
|
|
|
|
|
|
|
|
|
|
|
|
|
| |||||
Total expenses |
| $ | 41,216 |
|
| $ | 1,445 |
|
| $ | 100,582 |
|
| $ | 41,216 |
|
| $ | 1,445 |
|
Net Realized and Unrealized Gains
For the year ended December 31, 2023 our net realized gain was $2.4 million and our net change in unrealized appreciation was $37.1 million. For the year ended December 31, 2022 our net realized gain was $3.5 million and our net change in unrealized depreciation was $51.3 million. For the period ended December 31, 2021 our net realized gain was $0.1 million and our net change in unrealized appreciation was $1.6 million.
The following table presents the significant drivers of realized gains (losses) of non-controlled/non-affiliated investments for the year ended December 31, 2022:
Investments |
| For the Year Ended December 31, 2022 |
| |
Kaman Corp. |
| $ | 2,631 |
|
Murchison Oil and Gas - Last Out Term Loan |
|
| 944 |
|
Vistajet Malta Finance PLC |
|
| 604 |
|
Guitar Center Inc. |
|
| (885 | ) |
Mallinckrodt International Financing SA |
|
| (1,230 | ) |
Other |
|
| (79 | ) |
Realized gains (losses) of non-controlled/non-affiliated investments |
| $ | 1,985 |
|
Critical Accounting Policies and Estimates
The preparation of financial statements and related disclosures in conformity with accounting principles generally accepted in the United States ("GAAP") requires management to make estimates and assumptions that affect the reported amounts of assets and liabilities, disclosure of contingent assets and liabilities at the date of the financial statements, and revenues and expenses during the periods reported. Actual results could materially differ from those estimates. The Company’s comprehensive accounting policies are described more fully in Note 2. Significant Accounting Policies in the accompanying consolidated financial statements. We have identified “Basis of Presentation”, “Valuation of Investments”, and “Revenue Recognition” within Note 2 as critical accounting policies.
Valuation of Portfolio Investments and Net Asset Value of Shares
ThePursuant to Rule 2a-5 under the 1940 Act, the Board withhas designated the assistanceAdviser as the Company's valuation designee (the “Valuation Designee”) to determine the fair value of the Audit Committee, and in some cases an independentCompany's investments that do not have readily available market quotations, which became effective for the fiscal quarter ended September 30, 2023. Pursuant to the Company’s valuation firm,policy approved by the Board, the Valuation Designee will determine the fair value of the Company’s assets on at least a quarterly basis, in accordance with ASCAccounting Standards Codification Topic 820.820, Fair Value Measurement. The audit committee of the Board (the “Audit Committee”) is comprised of directors who are not “interested persons,” as defined in Section 2(a)(19) of the 1940 Act, of the Company or the Adviser (each an “Independent Directors.Director”).
31
Under procedures established by the Board, the Company intends to value investments for which market quotations are readily available at such market quotations. Assets listed on an exchange will be valued at their last sales prices as reported to the consolidated quotation service at 4:00 p.m. eastern time on the date of determination. If no such sales of such securities occurred, such securities will be valued at the bid price as reported by an independent, third-party pricing service on the date of determination. Debt and equity securities that are not publicly traded or whose market prices are not readily available will be valued at fair
33
value. Such determination of fair values may involve subjective judgments and estimates. The CompanyValuation Designee will also engage independent valuation providers to assist in the valuation of each investment that constitutes a material portion of the Company’s portfolio and that does not have a readily available market quotation at least once annually. With respect to unquoted securities, the Adviser, together with any independent valuation advisers and the Audit Committee will recommend fair values to the Board for their ultimate determination. Elements that could be used to determine the fair value of an investment include, among other measures, discounted cash flow models, comparisons of financial ratios of peer companies that are public and other factors. The types of factors that may be considered in determining the fair values of investments include, but are not limited to, the nature and realizable value of any collateral, the portfolio company’s ability to make payments and its earnings. The CompanyValuation Designee may appoint additional or different independent valuation firms in the future.
When an external event such as a purchase transaction, public offering or subsequent equity sale occurs with respect to a fair-valued portfolio company or comparable company, the BoardValuation Designee will use the pricing indicated by the external event to corroborate and/or assist the Company in the valuation of such portfolio company. Because the Company expects that there will not be readily available market quotations for many of the investments in its portfolio, the Company expects to value many of its investments at fair value as determined in good faith by the boardValuation Designee, subject to the oversight of directorsthe Board, using a documented valuation policy and a consistently applied valuation process. Due to the inherent uncertainty of determining the fair value of investments that do not have a readily available market value,quotation, the fair value of the Company’s investments may differ significantly from the values that would have been used had readily available market quotations existed for such investments, and the differences could be material.
On a quarterly basis, with respect to investments for which market quotations are not readily available, the Adviser will undertake a multi-step valuation process each quarter, as described below:
All values assigned to securities and other assets by the board of directorsValuation Designee will be binding on all Company investors. When pricing of the Company’s Shares is necessary outside of the normal quarterly process, the Adviser will, among other things, review whether, to its knowledge, significant events have occurred since the last quarterly valuation which might affect the fair value of any of the Company’s portfolio securities.
The ranges of unobservable inputs used in the fair value measurement of our investments classified as Level 3 fair valued as of December 31, 20222023 and December 31, 2021,2022, respectively, are presented in Note 6. Fair Value Measurements in the accompanying consolidated financial statements.
In addition to impacting the fair value recorded for our investments on our consolidated statement of assets and liabilities, had we used different key unobservable inputs to determine the fair value of our investments, amounts recorded in our consolidated statement of operations, including the net change in unrealized appreciation and depreciation on investments, management and performance-based incentive fees would also be impacted. The table below outlines the impact on our results of a 5% increase in the fair value of our Level 3 investments for the yearyears ended December 31, 2023, December 31, 2022 and for the period ended December 31, 2021:
|
| For the Year Ended December 31, 2022 |
|
| For the Period Ended December 31, 2021 (1) |
| ||
Fair value of level 3 investments at the end of the period |
| $ | 712,113 |
|
| $ | 427,306 |
|
Fair value assuming a 5% increase in value |
|
| 747,719 |
|
|
| 448,671 |
|
|
|
|
|
|
|
| ||
Increase in unrealized appreciation |
|
| 35,606 |
|
|
| 21,365 |
|
(Increase) in management fees |
|
| (67 | ) |
|
| (5 | ) |
(Increase) in capital gains incentive fees (2) |
|
| (5,340 | ) |
|
| (3,205 | ) |
Increase in net assets resulting from operations |
| $ | 30,199 |
|
| $ | 18,155 |
|
|
|
|
|
|
|
| ||
Weighted average shares outstanding |
|
| 14,575,572 |
|
|
| 12,000,000 |
|
Shares outstanding at the end of the period |
|
| 22,126,135 |
|
|
| 12,000,000 |
|
|
|
|
|
|
|
| ||
Increase in earnings per share |
| $ | 2.07 |
|
| $ | 1.51 |
|
Increase in net assets per share |
| $ | 1.36 |
|
| $ | 1.51 |
|
|
| For The Year Ended December 31, 2023 |
|
| For The Year Ended December 31, 2022 |
| For The Period Ended December 31, 2021 (1) |
| |||
Fair value of level 3 investments at the end of the period |
| $ | 1,358,932 |
|
| $ | 712,113 |
| $ | 427,306 |
|
Fair value assuming a 5% increase in value |
|
| 1,426,879 |
|
|
| 747,719 |
|
| 448,671 |
|
|
|
|
|
|
|
|
| ||||
Increase in unrealized appreciation |
|
| 67,947 |
|
|
| 35,606 |
|
| 21,365 |
|
(Increase) in management fees |
|
| (510 | ) |
|
| (67 | ) |
| (5 | ) |
(Increase) in capital gains incentive fees (2) |
|
| (10,192 | ) |
|
| (5,340 | ) |
| (3,205 | ) |
Increase in net assets resulting from operations |
| $ | 57,245 |
|
| $ | 30,199 |
| $ | 18,155 |
|
|
|
|
|
|
|
|
| ||||
Weighted average shares outstanding |
|
| 29,738,420 |
|
|
| 14,575,572 |
|
| 12,000,000 |
|
Shares outstanding at the end of the period |
|
| 40,279,212 |
|
|
| 22,126,135 |
|
| 12,000,000 |
|
|
|
|
|
|
|
|
| ||||
Increase in earnings per share |
| $ | 1.92 |
|
| $ | 2.07 |
| $ | 1.51 |
|
Increase in net assets per share |
| $ | 1.42 |
|
| $ | 1.36 |
| $ | 1.51 |
|
Determination of Net Asset Value
32
The BoardValuation Designee will determine the net asset value (”NAV”) of the sharesShares at least quarterly. The NAV per share is equal to the value of the Company’s total assets minus its liabilities and the liquidation value of any preferred shares outstanding divided by the total number of shares outstanding. Additionally, in connection with each offering of shares, to the extent the Company does not have Shareholder approval to sell below NAV, the BoardValuation
34
Designee or an authorized committee thereof will be required to make a good faith determination that the Company is not selling shares at a price below the then current NAV of the shares at the time at which the sale is made.
The value of investments for which recent market quotations are readily available will be the market price. The BoardValuation Designee will be responsible for determining the fair value of the portfolio investments for which market pricesquotations are not readily available in good faith, and in such other instances where portfolio investments require a fair value determination. Because the Company expects that there typically will not be a readily available market pricequotation for its target portfolio investments, the Company expects that the value of most of its portfolio investments will be their fair value as determined by the BoardValuation Designee consistent with a documented valuation policy and consistently applied valuation process. In making these determinations, the BoardValuation Designee will receive input from the Adviser, an independent valuation firm and the Audit Committee.
Hedging
The Company may enter into currency hedging contracts, interest rate hedging agreements such as futures, options, swaps and forward contracts, and credit hedging contracts, such as credit default swaps. As of December 31, 20222023 the Company had entered into foreign currency forward contracts in order to hedge its economic exposure to certain foreign currencies in which its investments were denominated (see Note 5. Derivative Instruments). However, no assurance can be given that such hedging transactions will be effective.
Financial Condition, Liquidity and Capital Resources
Our primary sources of cash and cash equivalents may include: (i) the sale of our Shares, (ii) borrowings under various financing arrangements, (iii) cash flows from interest, dividends and transaction fees earned from investment in portfolio companies and (iv) principal repayments and sale proceeds from our investments.
Our primary uses of cash will be for (i) investments in portfolio companies and other investments to comply with certain portfolio diversification requirements, (ii) the cost of operations (including payingfees payable to MSD in its capacity as the Adviser)Adviser and the Administrator), (iii) debt service of any borrowings, and (iv) cash distributions to our Shareholders.
Liquidity
The tables below present a summary of our liquidity position as of December 31, 20222023 and December 31, 2021:2022:
|
| December 31, 2022 |
|
| December 31, 2021 |
|
| December 31, 2023 |
|
| December 31, 2022 |
| ||||
Cash and cash equivalents |
| $ | 36,616 |
|
| $ | 12,203 |
|
| $ | 98,606 |
|
| $ | 36,616 |
|
Unused borrowing capacity |
|
| 148,000 |
|
|
| 190,000 |
|
|
| 422,000 |
|
|
| 148,000 |
|
Principal receivable |
|
| 16,523 |
|
|
| 2,454 |
|
|
| — |
|
|
| 16,523 |
|
Unfunded investment commitments (1) |
|
| (25,253 | ) |
|
| (19,136 | ) |
|
| (207,625 | ) |
|
| (25,253 | ) |
Undrawn capital commitments (2) |
|
| 619,690 |
|
|
| 562,663 |
| ||||||||
Other net working capital |
|
| (26,339 | ) |
|
| (403 | ) |
|
| (224,415 | ) |
|
| (26,339 | ) |
|
| $ | 149,547 |
|
| $ | 185,118 |
|
| $ | 708,256 |
|
| $ | 712,210 |
|
Capital Resources
We may from time to time enter into additional credit facilities and borrowing arrangements to increase the amount of our borrowings as our called equity capital increases. Accordingly, we cannot predict with certainty what terms any such financing would have or the costs we would incur in connection with any such financing arrangements. We are currently required to maintain a minimum asset coverage ratio (total assets-to-senior securities) of 150% under the 1940 Act.Act if certain conditions are met.
The table below summarizes certain financing obligations that are expected to have an impact on our liquidity and cash flow in specified future interval periods:
|
| Payments Due by Period |
| |||||||||||||||||
|
| Total |
|
| Less than |
|
| 1-3 years |
|
| 3-5 years |
|
| After 5 years |
| |||||
SPV I Facility |
| $ | 392,000 |
|
| $ | — |
|
| $ | — |
|
| $ | 392,000 |
|
| $ | — |
|
Subscription Facility |
|
| 145,000 |
|
|
| 145,000 |
|
|
| — |
|
|
| — |
|
|
| — |
|
Total Contractual Obligations |
| $ | 537,000 |
|
| $ | 145,000 |
|
| $ | — |
|
| $ | 392,000 |
|
| $ | — |
|
|
| Payments Due by Period |
| |||||||||||||||||
|
| Total |
|
| Less than |
|
| 1-3 years |
|
| 3-5 years |
|
| After 5 years |
| |||||
SPV I facility |
| $ | 378,000 |
|
| $ | — |
|
| $ | — |
|
| $ | 378,000 |
|
| $ | — |
|
SPV II facility |
|
| 295,000 |
|
|
| — |
|
|
| — |
|
|
| 295,000 |
|
|
| — |
|
Collateralized loan obligations |
|
| 390,000 |
|
|
| — |
|
|
| — |
|
|
| — |
|
|
| 390,000 |
|
Subscription facility |
|
| 35,000 |
|
|
| 35,000 |
|
|
| — |
|
|
| — |
|
|
| — |
|
Loan repurchase obligations |
|
| 50,025 |
|
|
| 50,025 |
|
|
| — |
|
|
| — |
|
|
| — |
|
Total contractual obligations |
| $ | 1,148,025 |
|
| $ | 85,025 |
|
| $ | — |
|
| $ | 673,000 |
|
| $ | 390,000 |
|
Item 7A. Quantitative and Qualitative Disclosures About Market Risk.
Valuation Risk
We have invested, and plan to continue to invest, primarily in illiquid debt and equity securities of private companies. Most of our investments will not have a readily available market price, and therefore, we will value these investments at fair value as determined in good faith by our Board, based on, among other things, the input of the Adviser, our Audit Committee and independent third-party valuation firm(s) engaged at the direction of the Board, and in accordance
35
with our valuation policy. There is no single standard for determining fair value. As a result, determining fair value requires that judgment be applied to the specific facts and circumstances of each portfolio investment while employing a consistently applied valuation process for the types of investments we make. If
33
we were required to liquidate a portfolio investment in a forced or liquidation sale, we may realize amounts that are different from the amounts presented and such differences could be material.
Interest Rate Risk
We will be subject to financial market risks, including changes in interest rates. As of December 31, 2022, 87.7%2023, 96.3% of our debt investments (85.7%(95.0% of our total investments), or $841.8 million$2.09 billion measured at fair value, are subject to floating interest rates. Additionally, both of the SPV I Facility, the SPV II Facility, the collateralized loan obligations, and the Subscription Facility are alsoall subject to floating interest rates. A rise in the general level of interest rates can be expected to lead to (i) higher interest income from our floating rate debt investments, (ii) value declines for fixed interest rate investments we may hold and (iii) higher interest expense in connection with our credit facilities. Since the majority of our investments consist of floating rating investments, an increase in interest rates could also make it more difficult for borrowers to repay their loans, and a rise in interest rates may also make it easier for the Adviser to meet or exceed the quarterly threshold for Income-Based Fee as described in Note 3. Agreements and Related Party Transactions.
Since March 2022, the Federal Reserve has been rapidly raising interest rates. In a rising interest rate environment, our cost of funds would increase, which could reduce our net investment income if there is not a corresponding increase in interest income generated by our investment portfolio. It is possible that the Federal Reserve's tightening cycle could result the United States into a recession, which would likely decrease interest rates. A prolonged reduction in interest rates will reduce our gross investment income and could result in a decrease in our net investment income if such decreases in base rates, such as SOFR and other alternate rates, are not offset by corresponding increases in the spread over such base rate that we earn on any portfolio investments, a decrease in our operating expenses, or a decrease in the interest rate associated with our borrowings
The following table estimates the potential changes in net cash flow generated from interest income and expenses, should interest rates increase by 100, 200 or 300 basis points, or decrease by 100 or 200 basis points. Interest income is calculated as revenue from interest generated from our portfolio of investments held on December 31, 2022.2023. Interest expense is calculated based on the terms of the Financing Facility, using the outstanding balance as of December 31, 2022.2023. The base interest rate case assumes the rates on our portfolio investments remain unchanged from the actual effective interest rates as of December 31, 2022.2023. These hypothetical calculations are based on a model of the investments in our portfolio, held as of December 31, 2022,2023, and are only adjusted for assumed changes in the underlying base interest rates. Actual results could differ significantly from those estimated in the table.
Change in Interest Rates |
| Interest |
|
| Interest |
|
| Net |
|
| Interest |
|
| Interest |
|
| Net |
| ||||||
Up 300 basis points |
| $ | 28,882 |
|
| $ | (17,274 | ) |
| $ | 11,608 |
|
| $ | 63,630 |
|
| $ | (34,200 | ) |
| $ | 29,430 |
|
Up 200 basis points |
|
| 19,998 |
|
|
| (11,904 | ) |
|
| 8,094 |
|
|
| 42,221 |
|
|
| (22,720 | ) |
|
| 19,501 |
|
Up 100 basis points |
|
| 11,115 |
|
|
| (6,534 | ) |
|
| 4,581 |
|
|
| 20,812 |
|
|
| (11,240 | ) |
|
| 9,572 |
|
Down 100 basis points |
|
| (6,652 | ) |
|
| 4,206 |
|
|
| (2,446 | ) |
|
| (22,005 | ) |
|
| 11,721 |
|
|
| (10,284 | ) |
Down 200 basis points |
|
| (15,535 | ) |
|
| 9,576 |
|
|
| (5,959 | ) |
|
| (43,414 | ) |
|
| 23,201 |
|
|
| (20,213 | ) |
Currency Risk
From time to time, we may make investments that are denominated in a foreign currency. These investments are translated into U.S. dollars at each balance sheet date, exposing us to movements in foreign exchange rates. We have employed and may continue to employ hedging techniques to minimize these risks, but we cannot assure you that such strategies will be effective or without risk to us. We may seek to utilize instruments such as, but not limited to, forward contracts to seek to hedge against fluctuations in the relative values of our portfolio positions from changes in currency exchange rates. We also have the ability to borrow in certain foreign currencies under our credit facilities. Instead of entering into a foreign currency forward contract in connection with loans or other investments we have made that are denominated in a foreign currency, we may borrow in that currency to establish a natural hedge against our loan or investment. To the extent the loan or investment is based on a floating rate other than a rate under which we can borrow under our credit facilities, we may seek to utilize interest rate derivatives to hedge our exposure to changes in the associated rate.
3436
Item 8. Consolidated Financial Statements and Supplementary Data.
Report of Independent Registered Public Accounting Firm
To the shareholders and the Board of Directors of MSD Investment Corp.
Opinion on the Consolidated Financial Statements and Consolidated Financial Highlights
We have audited the accompanying consolidated statementstatements of assets and liabilities of MSD Investment Corp. and subsidiarysubsidiaries (the "Company""Company"), including the consolidated schedules of investments, as of December 31, 20222023 and 2021,2022, the related consolidated statements of operations, changes in net assets, cash flows, and the consolidated financial highlights (in Note 12) for the yearyears ended December 31, 2023 and 2022, and for the period from December 21, 2021 (commencement of operations) to December 31, 2021, and the related notes (collectively referred to as the “financial“financial statements and financial highlights”highlights”). In our opinion, the financial statements and financial highlights present fairly, in all material respects, the consolidated financial position of the Company as of December 31, 20222023 and 2021,2022, and the results of its operations, changes in its net assets, its cash flows, and the financial highlights for the yearyears ended December 31, 2023 and 2022, and for the period from December 21, 2021 (commencement of operations) to December 31, 2021, in conformity with accounting principles generally accepted in the United States of America.
Basis for Opinion
These financial statements and financial highlights are the responsibility of the Company's management. Our responsibility is to express an opinion on the Company's financial statements and financial highlights based on our audits. We are a public accounting firm registered with the Public Company Accounting Oversight Board (United States) (PCAOB) and are required to be independent with respect to the Company in accordance with the U.S. federal securities laws and the applicable rules and regulations of the Securities and Exchange Commission and the PCAOB.
We conducted our audits in accordance with the standards of the PCAOB. Those standards require that we plan and perform the audit to obtain reasonable assurance about whether the financial statements and financial highlights are free of material misstatement, whether due to error or fraud. The Company is not required to have, nor were we engaged to perform, an audit of its internal control over financial reporting. As part of our audits we are required to obtain an understanding of internal control over financial reporting but not for the purpose of expressing an opinion on the effectiveness of the Company’s internal control over financial reporting. Accordingly, we express no such opinion.
Our audits included performing procedures to assess the risks of material misstatement of the financial statements and financial highlights, whether due to error or fraud, and performing procedures that respond to those risks. Such procedures included examining, on a test basis, evidence regarding the amounts and disclosures in the financial statements and financial highlights. Our audits also included evaluating the accounting principles used and significant estimates made by management, as well as evaluating the overall presentation of the financial statements and financial highlights. Our procedures included confirmation of investments owned as of December 31, 20222023 and 2021,2022, by correspondence with the custodian, loan agents, and borrowers; when replies were not received, we performed other auditing procedures. We believe that our audits provide a reasonable basis for our opinion.
/s/ Deloitte & Touche LLP
New York, New York
March 23, 202322, 2024
We have served as the Company’s auditor since 2021.
3537
MSD Investment Corp.
Consolidated Statements of Assets and Liabilities
(in thousands, except share and per share amounts)
| December 31, 2022 |
|
| December 31, 2021 |
| |||||||||
|
|
|
|
|
| December 31, 2023 |
|
| December 31, 2022 |
| ||||
ASSETS |
|
|
|
|
|
|
|
| ||||||
Non-controlled/non-affiliated investments, at fair value (1) | $ | 981,738 |
|
| $ | 692,357 |
| $ | 2,197,053 |
|
| $ | 981,738 |
|
Cash and cash equivalents |
| 36,616 |
|
|
| 12,203 |
|
| 98,606 |
|
|
| 36,616 |
|
Restricted cash |
| 4,320 |
|
|
| — |
|
| — |
|
|
| 4,320 |
|
Interest receivable |
| 6,803 |
|
|
| 3,970 |
| |||||||
Interest and dividends receivable |
| 19,276 |
|
|
| 6,803 |
| |||||||
Principal receivable |
| 16,523 |
|
|
| 2,454 |
|
| — |
|
|
| 16,523 |
|
Prepaid expenses and other assets |
| 1,077 |
|
|
| 308 |
|
| 1,128 |
|
|
| 1,077 |
|
Total assets | $ | 1,047,077 |
|
| $ | 711,292 |
| $ | 2,316,063 |
|
| $ | 1,047,077 |
|
|
|
|
|
|
|
|
|
| ||||||
LIABILITIES |
|
|
|
|
|
|
|
| ||||||
SPV I facility | $ | 392,000 |
|
| $ | 220,000 |
| $ | 378,000 |
|
| $ | 392,000 |
|
SPV II facility |
| 295,000 |
|
|
| — |
| |||||||
Collateralized loan obligations |
| 390,000 |
|
|
| — |
| |||||||
Subscription facility |
| 145,000 |
|
|
| 190,000 |
|
| 35,000 |
|
|
| 145,000 |
|
Loan repurchase obligations |
| 50,025 |
|
|
| — |
| |||||||
Deferred financing costs net of accumulated amortization |
| (4,911 | ) |
|
| (5,079 | ) |
| (13,239 | ) |
|
| (4,911 | ) |
Total debt, net of financing costs |
| 532,089 |
|
|
| 404,921 |
|
| 1,134,786 |
|
|
| 532,089 |
|
Payable for investments purchased |
| 24,729 |
|
|
| — |
|
| 214,584 |
|
|
| 24,729 |
|
Interest payable |
| 6,157 |
|
|
| 341 |
|
| 17,800 |
|
|
| 6,157 |
|
Financing costs payable |
| 1,194 |
|
|
| 2,736 |
| |||||||
Accrued professional fees |
| 350 |
|
|
| 336 |
| |||||||
Income based incentive fee payable |
| 5,123 |
|
|
| 59 |
| |||||||
Management fees payable |
| 3,784 |
|
|
| 83 |
| |||||||
Unrealized depreciation on forward contracts |
| 336 |
|
|
| — |
|
| 797 |
|
|
| 336 |
|
Accrued expenses and other liabilities |
| 234 |
|
|
| 122 |
|
| 608 |
|
|
| 234 |
|
Management fees payable |
| 83 |
|
|
| 155 |
| |||||||
Income based incentive fee payable |
| 59 |
|
|
| 56 |
| |||||||
Due to affiliates |
| — |
|
|
| 371 |
|
| 449 |
|
|
| — |
|
Capital gains incentive fee payable |
| — |
|
|
| 256 |
| |||||||
Accrued professional fees |
| 432 |
|
|
| 350 |
| |||||||
Financing costs payable |
| 114 |
|
|
| 1,194 |
| |||||||
Total liabilities | $ | 565,231 |
|
| $ | 409,294 |
| $ | 1,378,477 |
|
| $ | 565,231 |
|
Commitments and contingencies (Note 8) |
|
|
|
|
|
|
|
| ||||||
|
|
|
|
| ||||||||||
NET ASSETS |
|
|
|
|
|
|
|
| ||||||
Common stock, par value $0.001 (100,000,000 shares authorized, 22,126,135 and 12,000,000 shares issued and outstanding, respectively) | $ | 22 |
|
| $ | 12 |
| |||||||
Preferred Stock, par value $0.001 (250 shares authorized and outstanding) (2) | $ | — |
|
| $ | — |
| |||||||
Paid-in capital in excess of par value of Preferred Stock |
| 750 |
|
|
| — |
| |||||||
Common stock, par value $0.001 (100,000,000 shares authorized, 40,279,212 and 22,126,135 shares issued and outstanding, respectively) |
| 40 |
|
|
| 22 |
| |||||||
Paid-in capital in excess of par value |
| 535,300 |
|
|
| 299,988 |
|
| 952,139 |
|
|
| 535,300 |
|
Distributable earnings (accumulated losses) |
| (53,476 | ) |
|
| 1,998 |
|
| (15,343 | ) |
|
| (53,476 | ) |
Total net assets | $ | 481,846 |
|
| $ | 301,998 |
| $ | 937,586 |
|
| $ | 481,846 |
|
Net asset value per share | $ | 21.78 |
|
| $ | 25.17 |
| |||||||
Net asset value per common share | $ | 23.26 |
|
| $ | 21.78 |
| |||||||
The accompanying notes are an integral part of these consolidated financial statements.
3638
MSD Investment Corp.
Consolidated Statement of Operations
(in thousands, except share and per share amounts)
|
|
|
| |||||||||||||||
| For the Year Ended December 31, 2022 |
|
| For the Period Ended December 31, 2021 (1) |
| For the Year Ended December 31, 2023 |
|
| For the Year Ended December 31, 2022 |
|
| For the Period Ended December 31, 2021 (1) |
| |||||
Investment income: |
|
|
|
|
|
|
|
|
|
| ||||||||
From non-controlled/non-affiliated investments: |
|
|
|
|
|
|
|
|
|
| ||||||||
Interest income | $ | 67,715 |
|
| $ | 1,518 |
| $ | 176,120 |
|
| $ | 67,715 |
|
| $ | 1,518 |
|
Dividend income |
| 1,040 |
|
|
| — |
|
|
| — |
| |||||||
Payment-in-kind interest income |
| 9,064 |
|
|
| 98 |
|
| 12,365 |
|
|
| 9,064 |
|
|
| 98 |
|
Payment-in-kind dividend income |
| 3,488 |
|
|
| 79 |
|
| 2,945 |
|
|
| 3,488 |
|
|
| 79 |
|
Other income |
| 301 |
|
|
| 44 |
|
| 4,254 |
|
|
| 301 |
|
|
| 44 |
|
Total investment income |
| 80,568 |
|
|
| 1,739 |
|
| 196,724 |
|
|
| 80,568 |
|
|
| 1,739 |
|
Expenses: |
|
|
|
|
|
|
|
|
|
| ||||||||
Interest expense |
| 24,152 |
|
|
| 388 |
|
| 66,206 |
|
|
| 24,152 |
|
|
| 388 |
|
Income based incentive fee |
| 6,900 |
|
|
| 56 |
|
| 16,950 |
|
|
| 6,900 |
|
|
| 56 |
|
Management fees |
| 6,327 |
|
|
| 155 |
|
| 11,535 |
|
|
| 6,327 |
|
|
| 155 |
|
Administration expense |
| 1,958 |
|
|
| 26 |
|
| 2,551 |
|
|
| 1,958 |
|
|
| 26 |
|
Professional fees |
| 1,023 |
|
|
| 336 |
|
| 2,087 |
|
|
| 1,023 |
|
|
| 336 |
|
General and other expenses |
| 422 |
|
|
| 90 |
|
|
| 77 |
| |||||||
Custody expense |
| 401 |
|
|
| 246 |
|
|
| 19 |
| |||||||
Board of directors’ fee |
| 310 |
|
|
| 290 |
|
|
| 11 |
| |||||||
Transfer agency fees |
| 99 |
|
|
| 52 |
|
|
| — |
| |||||||
Organization and offering costs |
| 434 |
|
|
| 121 |
|
| 21 |
|
|
| 434 |
|
|
| 121 |
|
Board of directors’ fee |
| 290 |
|
|
| 11 |
| |||||||||||
Custody expense |
| 246 |
|
|
| 19 |
| |||||||||||
General and other expenses |
| 90 |
|
|
| 77 |
| |||||||||||
Transfer agency fees |
| 52 |
|
|
| — |
| |||||||||||
Capital gains incentive fee |
| (256 | ) |
|
| 256 |
|
| — |
|
|
| (256 | ) |
|
| 256 |
|
Total expenses |
| 41,216 |
|
|
| 1,445 |
|
| 100,582 |
|
|
| 41,216 |
|
|
| 1,445 |
|
Net investment income (loss) |
| 39,352 |
|
|
| 294 |
| |||||||||||
Net investment income |
| 96,142 |
|
|
| 39,352 |
|
|
| 294 |
| |||||||
|
|
|
|
|
|
|
|
|
|
| ||||||||
Realized and unrealized gain (loss): |
|
|
|
|
|
|
|
|
|
| ||||||||
Net realized gains (losses): |
|
|
|
|
|
|
|
|
|
| ||||||||
Non-controlled/non-affiliated investments |
| 1,985 |
|
|
| 79 |
|
| 4,842 |
|
|
| 1,985 |
|
|
| 79 |
|
Foreign currency forward contracts |
| 1,653 |
|
|
| — |
|
| (2,076 | ) |
|
| 1,653 |
|
|
| — |
|
Foreign currency transactions |
| (115 | ) |
|
| — |
|
| (327 | ) |
|
| (115 | ) |
|
| — |
|
Net realized gain (loss) |
| 3,523 |
|
|
| 79 |
|
| 2,439 |
|
|
| 3,523 |
|
|
| 79 |
|
Net change in unrealized appreciation (depreciation): |
|
|
|
|
|
|
|
|
|
| ||||||||
Non-controlled/non-affiliated investments |
| (50,953 | ) |
|
| 1,625 |
|
| 37,565 |
|
|
| (50,953 | ) |
|
| 1,625 |
|
Foreign currency forward contracts |
| (336 | ) |
|
| — |
|
| (461 | ) |
|
| (336 | ) |
|
| — |
|
Foreign currency transactions |
| 6 |
|
|
| — |
|
| (9 | ) |
|
| 6 |
|
|
| — |
|
Net change in unrealized appreciation (depreciation) |
| (51,283 | ) |
|
| 1,625 |
|
| 37,095 |
|
|
| (51,283 | ) |
|
| 1,625 |
|
Net realized and unrealized gain (loss) |
| (47,760 | ) |
|
| 1,704 |
|
| 39,534 |
|
|
| (47,760 | ) |
|
| 1,704 |
|
Net increase (decrease) in net assets resulting from operations | $ | (8,408 | ) |
| $ | 1,998 |
| $ | 135,676 |
|
| $ | (8,408 | ) |
| $ | 1,998 |
|
|
|
|
|
|
|
|
|
|
|
| ||||||||
Per share information - basic and diluted |
|
|
|
| ||||||||||||||
Preferred stock dividends |
| (8 | ) |
|
| — |
|
|
| — |
| |||||||
Net increase (decrease) in net assets resulting from operations applicable to common shareholders | $ | 135,668 |
|
| $ | (8,408 | ) |
| $ | 1,998 |
| |||||||
|
|
|
|
|
|
| ||||||||||||
Per share information - basic and diluted: |
|
|
|
|
|
|
| |||||||||||
Net investment income (loss) per share (basic and diluted) | $ | 2.70 |
|
| $ | 0.02 |
| $ | 3.23 |
|
| $ | 2.70 |
|
| $ | 0.02 |
|
Earnings per share (basic and diluted) | $ | (0.58 | ) |
| $ | 0.17 |
| $ | 4.56 |
|
| $ | (0.58 | ) |
| $ | 0.17 |
|
Distributions declared per share | $ | 2.88 |
|
| $ | — |
| $ | 3.09 |
|
| $ | 2.88 |
|
| $ | — |
|
Weighted average shares outstanding (basic and diluted) |
| 14,575,572 |
|
|
| 12,000,000 |
|
| 29,738,420 |
|
|
| 14,575,572 |
|
|
| 12,000,000 |
|
The accompanying notes are an integral part of these consolidated financial statements.
3739
MSD Investment Corp.
Consolidated Statement of Changes in Net Assets
(in thousands, except shares)
|
|
|
|
|
|
| Accumulated Earnings |
|
|
|
|
|
|
|
|
|
|
|
|
|
| Accumulated Earnings |
|
|
| |||||||||||||||||||||
| Common Shares |
|
| Paid-in-Capital in |
| (Loss), net of |
| Total |
| Preferred Shares |
|
| Common Shares |
|
| Paid-in-Capital in |
| (Loss), net of |
| Total |
| |||||||||||||||||||||||||
| Shares |
|
| Par Value |
|
| Excess of Par Value |
|
| Distributions |
|
| Net Assets |
| Shares |
|
| Par Value |
|
| Shares |
|
| Par Value |
|
| Excess of Par Value |
|
| Distributions |
|
| Net Assets |
| ||||||||||||
Balance, December 21, 2021 (1) |
| — |
|
| $ | — |
|
| $ | — |
|
| $ | — |
|
| $ | — |
|
| — |
|
| $ | — |
|
|
| — |
|
| $ | — |
|
| $ | — |
|
| $ | — |
|
| $ | — |
|
Operations: |
|
|
|
|
|
|
|
|
|
|
|
|
|
|
|
|
|
|
|
|
|
|
|
|
|
|
|
|
|
|
|
|
|
| ||||||||||||
Net investment income |
| — |
|
|
| — |
|
|
| — |
|
|
| 294 |
|
|
| 294 |
|
| — |
|
|
| — |
|
|
| — |
|
|
| — |
|
|
| — |
|
|
| 294 |
|
|
| 294 |
|
Net realized gain |
| — |
|
|
| — |
|
|
| — |
|
|
| 79 |
|
|
| 79 |
|
| — |
|
|
| — |
|
|
| — |
|
|
| — |
|
|
| — |
|
|
| 79 |
|
|
| 79 |
|
Net unrealized appreciation |
| — |
|
|
| — |
|
|
| — |
|
|
| 1,625 |
|
|
| 1,625 |
|
| — |
|
|
| — |
|
|
| — |
|
|
| — |
|
|
| — |
|
|
| 1,625 |
|
|
| 1,625 |
|
Net increase (decrease) in net assets resulting from shareholder distributions |
| — |
|
|
| — |
|
|
| — |
|
|
| 1,998 |
|
|
| 1,998 |
|
| — |
|
|
| — |
|
|
| — |
|
|
| — |
|
|
| — |
|
|
| 1,998 |
|
|
| 1,998 |
|
Capital Share Transactions: |
| — |
|
|
|
|
|
|
|
|
|
|
|
|
|
|
|
| — |
|
|
|
|
|
|
|
|
|
| |||||||||||||||||
Issuance of units |
| 12,000,000 |
|
|
| 12 |
|
|
| 299,988 |
|
|
| — |
|
|
| 300,000 |
| |||||||||||||||||||||||||||
Issuance of common shares |
| — |
|
|
| — |
|
|
| 12,000,000 |
|
|
| 12 |
|
|
| 299,988 |
|
|
| — |
|
|
| 300,000 |
| |||||||||||||||||||
Net increase (decrease) for the period |
| 12,000,000 |
|
|
| 12 |
|
|
| 299,988 |
|
|
| 1,998 |
|
|
| 301,998 |
|
| — |
|
|
| — |
|
|
| 12,000,000 |
|
|
| 12 |
|
|
| 299,988 |
|
|
| 1,998 |
|
|
| 301,998 |
|
Balance, December 31, 2021 (2) |
| 12,000,000 |
|
| $ | 12 |
|
| $ | 299,988 |
|
| $ | 1,998 |
|
| $ | 301,998 |
|
|
|
|
|
|
|
| 12,000,000 |
|
| $ | 12 |
|
| $ | 299,988 |
|
| $ | 1,998 |
|
| $ | 301,998 |
| ||
Operations: |
|
|
|
|
|
|
|
|
|
|
|
|
|
|
|
|
|
|
|
|
|
|
|
|
|
|
|
|
|
|
|
|
|
| ||||||||||||
Net investment income |
| — |
|
|
| — |
|
|
| — |
|
|
| 39,352 |
|
|
| 39,352 |
|
| — |
|
|
| — |
|
|
| — |
|
|
| — |
|
|
| — |
|
|
| 39,352 |
|
|
| 39,352 |
|
Net realized gain (loss) |
| — |
|
|
| — |
|
|
| — |
|
|
| 3,523 |
|
|
| 3,523 |
|
| — |
|
|
| — |
|
|
| — |
|
|
| — |
|
|
| — |
|
|
| 3,523 |
|
|
| 3,523 |
|
Net change in unrealized appreciation (depreciation) |
| — |
|
|
| — |
|
|
| — |
|
|
| (51,283 | ) |
|
| (51,283 | ) |
| — |
|
|
| — |
|
|
| — |
|
|
| — |
|
|
| — |
|
|
| (51,283 | ) |
|
| (51,283 | ) |
Net increase (decrease) in net assets resulting from operations |
| — |
|
|
| — |
|
|
| — |
|
|
| (8,408 | ) |
|
| (8,408 | ) |
| — |
|
|
| — |
|
|
| — |
|
|
| — |
|
|
| — |
|
|
| (8,408 | ) |
|
| (8,408 | ) |
Shareholder distributions: |
|
|
|
|
|
|
|
|
|
|
|
|
|
|
|
|
|
|
|
|
|
|
|
|
|
|
|
|
|
|
|
|
|
| ||||||||||||
Distributions to shareholders |
| — |
|
|
| — |
|
|
| — |
|
|
| (44,967 | ) |
|
| (44,967 | ) |
| — |
|
|
| — |
|
|
| — |
|
|
| — |
|
|
| — |
|
|
| (44,967 | ) |
|
| (44,967 | ) |
Net increase (decrease) in net assets resulting from shareholder distributions |
| — |
|
|
| — |
|
|
| — |
|
|
| (44,967 | ) |
|
| (44,967 | ) |
| — |
|
|
| — |
|
|
| — |
|
|
| — |
|
|
| — |
|
|
| (44,967 | ) |
|
| (44,967 | ) |
Capital Share Transactions: |
|
|
|
|
|
|
|
|
|
|
|
|
|
|
|
|
|
|
|
|
|
|
|
|
|
|
|
|
|
|
|
|
|
| ||||||||||||
Common shares issued from reinvestment of distributions |
| 1,838,162 |
|
|
| 2 |
|
|
| 43,221 |
|
|
| — |
|
|
| 43,223 |
|
| — |
|
|
| — |
|
|
| 1,838,162 |
|
|
| 2 |
|
|
| 43,221 |
|
|
| — |
|
|
| 43,223 |
|
Issuance of shares |
| 8,287,973 |
|
|
| 8 |
|
|
| 189,992 |
|
|
| — |
|
|
| 190,000 |
| |||||||||||||||||||||||||||
Issuance of common shares |
| — |
|
|
| — |
|
|
| 8,287,973 |
|
|
| 8 |
|
|
| 189,992 |
|
|
| — |
|
|
| 190,000 |
| |||||||||||||||||||
Tax reclassification of shareholders' equity in accordance with generally accepted accounting principles |
| — |
|
|
| — |
|
|
| 2,099 |
|
|
| (2,099 | ) |
|
| — |
|
| — |
|
|
| — |
|
|
| — |
|
|
| — |
|
|
| 2,099 |
|
|
| (2,099 | ) |
|
| — |
|
Net increase (decrease) for the year |
| 10,126,135 |
|
|
| 10 |
|
|
| 235,312 |
|
|
| (55,474 | ) |
|
| 179,848 |
|
|
|
|
|
|
|
| 10,126,135 |
|
|
| 10 |
|
|
| 235,312 |
|
|
| (55,474 | ) |
|
| 179,848 |
| ||
Balance, December 31, 2022 |
| 22,126,135 |
|
| $ | 22 |
|
| $ | 535,300 |
|
| $ | (53,476 | ) |
| $ | 481,846 |
|
|
|
|
|
|
|
| 22,126,135 |
|
| $ | 22 |
|
| $ | 535,300 |
|
| $ | (53,476 | ) |
| $ | 481,846 |
| ||
Operations: |
|
|
|
|
|
|
|
|
|
|
|
|
|
|
|
|
|
|
|
| ||||||||||||||||||||||||||
Net investment income |
| — |
|
|
| — |
|
|
| — |
|
|
| — |
|
|
| — |
|
|
| 96,142 |
|
|
| 96,142 |
| |||||||||||||||||||
Net realized gain (loss) |
| — |
|
|
| — |
|
|
| — |
|
|
| — |
|
|
| — |
|
|
| 2,439 |
|
|
| 2,439 |
| |||||||||||||||||||
Net change in unrealized appreciation (depreciation) |
| — |
|
|
| — |
|
|
| — |
|
|
| — |
|
|
| — |
|
|
| 37,095 |
|
|
| 37,095 |
| |||||||||||||||||||
Net increase (decrease) in net assets resulting from operations |
| — |
|
|
| — |
|
|
| — |
|
|
| — |
|
|
| — |
|
|
| 135,676 |
|
|
| 135,676 |
| |||||||||||||||||||
Shareholder distributions: |
|
|
|
|
|
|
|
|
|
|
|
|
|
|
|
|
|
|
|
| ||||||||||||||||||||||||||
Distributions to shareholders |
| — |
|
|
| — |
|
|
| — |
|
|
| — |
|
|
| — |
|
|
| (96,770 | ) |
|
| (96,770 | ) | |||||||||||||||||||
Net increase (decrease) in net assets resulting from shareholder distributions |
| — |
|
|
| — |
|
|
| — |
|
|
| — |
|
|
| — |
|
|
| (96,770 | ) |
|
| (96,770 | ) | |||||||||||||||||||
Capital Share Transactions: |
|
|
|
|
|
|
|
|
|
|
|
|
|
|
|
|
|
|
|
| ||||||||||||||||||||||||||
Common shares issued from reinvestment of distributions |
| — |
|
|
| — |
|
|
| 3,568,598 |
|
|
| 3 |
|
|
| 81,081 |
|
|
| — |
|
|
| 81,084 |
| |||||||||||||||||||
Issuance of preferred shares (3) |
| 250 |
|
|
| — |
|
|
| — |
|
|
| — |
|
|
| 750 |
|
|
| — |
|
|
| 750 |
| |||||||||||||||||||
Issuance of common shares |
| — |
|
|
| — |
|
|
| 14,584,479 |
|
|
| 15 |
|
|
| 334,985 |
|
|
| — |
|
|
| 335,000 |
| |||||||||||||||||||
Tax reclassification of shareholders' equity in accordance with generally accepted accounting principles |
| — |
|
|
| — |
|
|
| — |
|
|
| — |
|
|
| 773 |
|
|
| (773 | ) |
|
| — |
| |||||||||||||||||||
Net increase (decrease) for the year |
| 250 |
|
|
| — |
|
|
| 18,153,077 |
|
|
| 18 |
|
|
| 417,589 |
|
|
| 38,133 |
|
|
| 455,740 |
| |||||||||||||||||||
Balance, December 31, 2023 |
| 250 |
|
| $ | — |
|
|
| 40,279,212 |
|
| $ | 40 |
|
| $ | 952,889 |
|
| $ | (15,343 | ) |
| $ | 937,586 |
| |||||||||||||||||||
The accompanying notes are an integral part of these consolidated financial statements.
3840
MSD Investment Corp.
Consolidated Statement of Cash Flows
(in thousands, except shares)
|
| For the Year Ended December 31, 2022 |
|
| For the Period Ended December 31, 2021(1) |
| For the Year Ended December 31, 2023 |
|
| For the Year Ended December 31, 2022 |
|
| For the Year Ended December 31, 2021 (1) |
| |||||
Cash flow from operating activities |
|
|
|
|
|
|
|
|
|
|
|
|
| ||||||
Net increase (decrease) in net assets resulting from operations |
| $ | (8,408 | ) |
| $ | 1,998 |
| $ | 135,676 |
|
| $ | (8,408 | ) |
| $ | 1,998 |
|
Adjustments to reconcile net increase (decrease) in net assets resulting from operations to net cash used in operating activities: |
|
|
|
|
|
|
|
|
|
|
| ||||||||
Accrued interest and dividends received in-kind |
|
| (11,642 | ) |
|
| (887 | ) |
| (12,365 | ) |
|
| (11,642 | ) |
|
| (887 | ) |
Net accretion of discount and amortization of premium |
|
| (4,198 | ) |
|
| (86 | ) |
| (7,754 | ) |
|
| (4,198 | ) |
|
| (86 | ) |
Proceeds from sale of investments and principal repayments |
|
| 262,873 |
|
|
| 2,454 |
|
| 398,041 |
|
|
| 262,873 |
|
|
| 2,454 |
|
Purchases of investments |
|
| (585,382 | ) |
|
| (681,483 | ) |
| (1,550,830 | ) |
|
| (585,382 | ) |
|
| (681,483 | ) |
Net realized (gains) losses on investments |
|
| (1,985 | ) |
|
| (79 | ) |
| (4,842 | ) |
|
| (1,985 | ) |
|
| (79 | ) |
Net change in unrealized (appreciation) depreciation on investments |
|
| 50,953 |
|
|
| (1,625 | ) |
| (37,565 | ) |
|
| 50,953 |
|
|
| (1,625 | ) |
Net receipt of settlement of derivatives |
|
| 1,653 |
|
|
| — |
|
| (2,076 | ) |
|
| 1,653 |
|
|
| — |
|
Net realized (gains) losses on derivatives |
|
| (1,653 | ) |
|
| — |
|
| 2,076 |
|
|
| (1,653 | ) |
|
| — |
|
Net change in unrealized (appreciation) depreciation on foreign currency forward contracts |
|
| 336 |
|
|
| — |
|
| 461 |
|
|
| 336 |
|
|
| — |
|
Amortization of deferred financing costs |
|
| 1,541 |
|
|
| 48 |
|
| 2,117 |
|
|
| 1,541 |
|
|
| 48 |
|
(Increase) decrease in operating assets: |
|
|
|
|
|
|
|
|
|
|
| ||||||||
Interest receivable |
|
| (2,833 | ) |
|
| (3,970 | ) | |||||||||||
Interest and dividends receivable |
| (12,473 | ) |
|
| (2,833 | ) |
|
| (3,970 | ) | ||||||||
Principal receivable |
|
| (14,069 | ) |
|
| (2,454 | ) |
| 16,523 |
|
|
| (14,069 | ) |
|
| (2,454 | ) |
Prepaid expenses and other assets |
|
| (769 | ) |
|
| (308 | ) |
| (51 | ) |
|
| (769 | ) |
|
| (308 | ) |
Increase (decrease) in operating liabilities: |
|
|
|
|
|
|
|
|
|
|
|
|
| ||||||
Due to affiliates |
|
| (371 | ) |
|
| 371 |
|
| 449 |
|
|
| (371 | ) |
|
| 371 |
|
Payable for investments purchased |
|
| 24,729 |
|
|
| — |
|
| 189,855 |
|
|
| 24,729 |
|
|
| — |
|
Management fees payable |
|
| (72 | ) |
|
| 155 |
|
| 3,701 |
|
|
| (72 | ) |
|
| 155 |
|
Income based incentive fee payable |
|
| 3 |
|
|
| 56 |
|
| 5,064 |
|
|
| 3 |
|
|
| 56 |
|
Capital gains incentive fee payable |
|
| (256 | ) |
|
| 256 |
|
| — |
|
|
| (256 | ) |
|
| 256 |
|
Interest payable |
|
| 5,816 |
|
|
| 341 |
|
| 11,643 |
|
|
| 5,816 |
|
|
| 341 |
|
Accrued professional fees |
|
| 14 |
|
|
| 336 |
|
| 82 |
|
|
| 14 |
|
|
| 336 |
|
Accrued expenses and other liabilities |
|
| 112 |
|
|
| 122 |
|
| 374 |
|
|
| 112 |
|
|
| 122 |
|
Net cash provided (used in) by operating activities |
|
| (283,608 | ) |
|
| (684,755 | ) |
| (861,894 | ) |
|
| (283,608 | ) |
|
| (684,755 | ) |
Cash flow from financing activities |
|
|
|
|
|
|
|
|
|
|
|
|
| ||||||
Proceeds from issuance of shares |
|
| 190,000 |
|
|
| 289,349 |
| |||||||||||
Proceeds from issuance of common shares |
| 335,000 |
|
|
| 190,000 |
|
|
| 289,349 |
| ||||||||
Proceeds from repurchase obligations |
| 313,841 |
|
|
| — |
|
|
| — |
| ||||||||
Repayment of repurchase obligations |
| (263,816 | ) |
|
| — |
|
|
| — |
| ||||||||
Debt borrowings |
|
| 327,000 |
|
|
| 410,000 |
|
| 1,270,000 |
|
|
| 327,000 |
|
|
| 410,000 |
|
Debt repayments |
|
| (200,000 | ) |
|
| — |
|
| (709,000 | ) |
|
| (200,000 | ) |
|
| — |
|
Distributions paid |
|
| (1,744 | ) |
|
| — |
|
| (15,678 | ) |
|
| (1,744 | ) |
|
| — |
|
Deferred financing costs paid |
|
| (2,915 | ) |
|
| (2,391 | ) |
| (11,525 | ) |
|
| (2,915 | ) |
|
| (2,391 | ) |
Proceeds from issuance of preferred shares, net of underwriting costs |
| 750 |
|
|
| — |
|
|
| — |
| ||||||||
Preferred dividends paid |
| (8 | ) |
|
| — |
|
|
| — |
| ||||||||
Net cash provided by (used in) financing activities |
|
| 312,341 |
|
|
| 696,958 |
|
| 919,564 |
|
|
| 312,341 |
|
|
| 696,958 |
|
Net increase in cash, cash equivalents, and restricted cash |
|
| 28,733 |
|
|
| 12,203 |
|
| 57,670 |
|
|
| 28,733 |
|
|
| 12,203 |
|
Cash, cash equivalents, and restricted cash, beginning of period |
|
| 12,203 |
|
|
| — |
|
| 40,936 |
|
|
| 12,203 |
|
|
| — |
|
Cash, cash equivalents, and restricted cash, end of period |
| $ | 40,936 |
|
| $ | 12,203 |
| $ | 98,606 |
|
| $ | 40,936 |
|
| $ | 12,203 |
|
Reconciliation of cash, cash equivalents, and restricted cash |
|
|
|
|
|
|
|
|
|
|
| ||||||||
Cash and cash equivalents |
| $ | 36,616 |
|
| $ | 12,203 |
| $ | 98,606 |
|
| $ | 36,616 |
|
| $ | 12,203 |
|
Restricted cash |
| $ | 4,320 |
|
| $ | — |
| $ | — |
|
| $ | 4,320 |
|
| $ | — |
|
Total cash, cash equivalents, and restricted cash |
| $ | 40,936 |
|
| $ | 12,203 |
| $ | 98,606 |
|
| $ | 40,936 |
|
| $ | 12,203 |
|
Supplemental disclosure of cash flow information and non-cash financing activities |
|
|
|
|
|
|
|
|
|
|
| ||||||||
Cash paid for interest |
| $ | 16,796 |
|
| $ | — |
| $ | 36,625 |
|
| $ | 16,796 |
|
| $ | — |
|
Reinvestment of shareholder distributions |
| $ | 43,223 |
|
| $ | — |
| $ | 81,084 |
|
| $ | 43,223 |
|
| $ | — |
|
Financing cost payable |
| $ | 54 |
|
| $ | 2,736 |
| |||||||||||
Incremental financing cost payable | $ | 114 |
|
| $ | 54 |
|
| $ | 2,736 |
| ||||||||
Contribution in exchange for share issuance |
| $ | — |
|
| $ | 10,651 |
| $ | — |
|
| $ | — |
|
| $ | 10,651 |
|
Offering cost payable |
| $ | — |
|
| $ | 258 |
| $ | — |
|
| $ | — |
|
| $ | 258 |
|
The accompanying notes are an integral part of these consolidated financial statements.
3941
MSD Investment Corp.
Consolidated Schedule of Investments
December 31, 20222023
(in thousands, except shares)
Investments (1)(2)(3) | Footnotes |
| Reference Rate and Spread (4) |
| Interest Rate Floor |
| Interest Rate (5) |
| Maturity Date |
| Par Amount / Shares (6) |
|
| Cost (7) |
|
| Fair Value |
|
| Percentage of Net Assets |
|
| Footnotes |
| Reference Rate and Spread (4) |
| Interest Rate Floor |
| Interest Rate (5) |
| Maturity Date |
| Par Amount / Shares (6) |
|
| Cost (7) |
|
| Fair Value |
|
| Percentage of Net Assets |
|
| ||||||||
Investments - non-controlled/non-affiliated |
|
|
|
|
|
|
|
|
|
|
|
|
|
|
|
|
|
|
|
|
|
|
|
|
|
|
|
|
|
|
|
|
|
|
|
|
|
|
|
| ||||||||||||
First Lien Debt |
|
|
|
|
|
|
|
|
|
|
|
|
|
|
|
|
|
|
|
|
|
|
|
|
|
|
|
|
|
|
|
|
|
|
|
| ||||||||||||||||
Aerospace & Defense |
|
|
|
|
|
|
|
|
|
|
|
|
|
|
|
|
|
|
|
|
|
|
|
|
|
| ||||||||||||||||||||||||||
Chromalloy Holdings LLC | (8) |
| S + 7.00% |
| 1.00% |
| 11.32% |
| 11/23/2028 |
|
| 50,000 |
|
| $ | 48,025 |
|
| $ | 48,027 |
|
|
| 9.97 |
| % | (8) |
| S + 7.00% |
| 1.00% |
| 12.37% |
| 11/23/2028 |
|
| 49,500 |
|
| $ | 47,794 |
|
| $ | 47,873 |
|
|
| 5.11 |
| % |
Chromalloy Holdings LLC - Revolving Credit Facility | (8)(9)(12) |
| S + 7.00% |
| 1.00% |
| 11.32% |
| 11/23/2027 |
|
| — |
|
|
| (181 | ) |
|
| (182 | ) |
|
| (0.04 | ) |
| (8)(9)(12) |
| S + 7.00% |
| 1.00% |
| 12.33% |
| 11/23/2027 |
|
| — |
|
|
| (144 | ) |
|
| (152 | ) |
|
| (0.02 | ) |
|
Frontgrade Technologies Inc. | (8)(15) |
| S + 6.75% |
| 0.75% |
| 12.10% |
| 1/9/2030 |
|
| 9,779 |
|
|
| 9,592 |
|
|
| 9,557 |
|
|
| 1.02 |
|
| ||||||||||||||||||||||||||
Frontgrade Technologies Inc. | (8)(15) |
| S + 6.75% |
| 0.75% |
| 12.10% |
| 1/9/2030 |
|
| 50,369 |
|
|
| 49,046 |
|
|
| 49,223 |
|
|
| 5.25 |
|
| ||||||||||||||||||||||||||
Frontgrade Technologies Inc. - Revolving Credit Facility | (8)(9)(12)(15) |
| S + 6.75% |
| 0.75% |
| 12.08% |
| 1/9/2028 |
|
| — |
|
|
| (162 | ) |
|
| (164 | ) |
|
| (0.02 | ) |
| ||||||||||||||||||||||||||
Systems Planning and Analysis, Inc. | (8)(15) |
| S + 6.15% |
| 1.00% |
| 10.94% |
| 8/16/2027 |
|
| 10,823 |
|
|
| 10,637 |
|
|
| 10,433 |
|
|
| 2.17 |
|
| (8) |
| S + 6.15% |
| 1.00% |
| 11.33% |
| 8/16/2027 |
|
| 10,713 |
|
|
| 10,562 |
|
|
| 10,595 |
|
|
| 1.13 |
|
|
Systems Planning and Analysis, Inc. - Delayed Draw Term Loan | (8)(12) |
| S + 6.15% |
| 0.00% |
| 11.33% |
| 8/16/2027 |
|
| 5,522 |
|
|
| 5,423 |
|
|
| 5,457 |
|
|
| 0.58 |
|
| ||||||||||||||||||||||||||
Systems Planning and Analysis, Inc. - Revolving Credit Facility | (8)(9)(12)(15) |
| S + 6.15% |
| 1.00% |
| 10.74% |
| 8/16/2027 |
|
| — |
|
|
| (51 | ) |
|
| (113 | ) |
|
| (0.02 | ) |
| (8)(9)(12) |
| S + 6.15% |
| 1.00% |
| 11.31% |
| 8/16/2027 |
|
| — |
|
|
| (40 | ) |
|
| (34 | ) |
|
| (0.00 | ) |
|
Systems Planning and Analysis, Inc. - Delayed Draw Term Loan | (8)(9)(12)(15) |
| S + 6.15% |
| 0.00% |
| 10.94% |
| 8/16/2027 |
|
| 2,011 |
|
|
| 1,956 |
|
|
| 1,805 |
|
|
| 0.37 |
|
| ||||||||||||||||||||||||||
The Nordam Group Inc. |
| L + 5.50% |
| 0.00% |
| 9.94% |
| 4/9/2026 |
|
| 11,767 |
|
|
| 10,491 |
|
|
| 9,119 |
|
|
| 1.89 |
|
|
| S + 5.60% |
| 0.00% |
| 10.96% |
| 4/9/2026 |
|
| 11,644 |
|
|
| 10,705 |
|
|
| 10,643 |
|
|
| 1.14 |
|
| ||
|
|
|
|
|
|
|
|
|
|
|
|
| 70,877 |
|
|
| 69,089 |
|
|
| 14.34 |
|
|
|
|
|
|
|
|
|
|
|
|
|
| 132,776 |
|
|
| 132,998 |
|
|
| 14.19 |
|
| ||||||
Automobile |
|
|
|
|
|
|
|
|
|
|
|
|
|
|
|
|
|
|
|
|
|
|
|
|
|
|
|
|
|
|
|
|
|
| ||||||||||||||||||
McLaren Finance PLC | UK(10)(11) |
| N/A |
| N/A |
| 7.50% |
| 8/1/2026 |
|
| 2,689 |
|
|
| 2,717 |
|
|
| 1,984 |
|
|
| 0.41 |
|
| UK(10)(11) |
| N/A |
| N/A |
| 7.50% |
| 8/1/2026 |
|
| 1,258 |
|
|
| 1,268 |
|
|
| 1,096 |
|
|
| 0.12 |
|
|
Banking, Finance, Insurance & Real Estate |
|
|
|
|
|
|
|
|
|
|
|
|
|
|
|
|
|
| ||||||||||||||||||||||||||||||||||
Accession Risk Management - Delayed Draw Term Loan | (8)(9)(12) |
| S + 6.00% |
| 0.75% |
| 11.43% |
| 11/1/2029 |
|
| 8,982 |
|
|
| 8,325 |
|
|
| 8,276 |
|
|
| 0.88 |
|
| ||||||||||||||||||||||||||
Foundation Risk Partners - Delayed Draw Term Loan | (8)(9)(12) |
| S + 5.60% |
| 0.75% |
| 10.93% |
| 10/29/2028 |
|
| — |
|
|
| (428 | ) |
|
| (435 | ) |
|
| (0.05 | ) |
| ||||||||||||||||||||||||||
Highgate Hotels, L.P. | (8) |
| S + 5.50% |
| 1.00% |
| 10.84% |
| 11/5/2029 |
|
| 100,000 |
|
|
| 98,085 |
|
|
| 98,027 |
|
|
| 10.47 |
|
| ||||||||||||||||||||||||||
Highgate Hotels, L.P. - Revolving Credit Facility | (8)(9)(12) |
| S + 5.50% |
| 1.00% |
| 10.85% |
| 10/26/2029 |
|
| — |
|
|
| (243 | ) |
|
| (247 | ) |
|
| (0.03 | ) |
| ||||||||||||||||||||||||||
|
|
|
|
|
|
|
|
|
|
|
|
| 105,739 |
|
|
| 105,621 |
|
|
| 11.27 |
|
| |||||||||||||||||||||||||||||
Beverage, Food & Tobacco |
|
|
|
|
|
|
|
|
|
|
|
|
|
|
|
|
|
|
|
|
|
|
|
|
|
|
|
|
|
|
|
|
|
|
|
| ||||||||||||||||
LJ Perimeter Buyer, Inc. | (8) |
| S + 6.65% |
| 1.00% |
| 10.74% |
| 10/31/2028 |
|
| 19,462 |
|
|
| 18,888 |
|
|
| 18,902 |
|
|
| 3.92 |
|
| (8) |
| S + 6.65% |
| 1.00% |
| 12.03% |
| 10/31/2028 |
|
| 19,316 |
|
|
| 18,819 |
|
|
| 18,965 |
|
|
| 2.02 |
|
|
LJ Perimeter Buyer, Inc. - Delayed Draw Term Loan | (8)(9)(12) |
| S + 6.65% |
| 1.00% |
| 11.24% |
| 10/31/2028 |
|
| — |
|
|
| (78 | ) |
|
| (76 | ) |
|
| (0.01 | ) |
| (8)(9)(12) |
| S + 6.65% |
| 1.00% |
| 12.03% |
| 10/31/2028 |
|
| 2,483 |
|
|
| 2,393 |
|
|
| 2,428 |
|
|
| 0.26 |
|
|
|
|
|
|
|
|
|
|
|
|
|
|
| 18,810 |
|
|
| 18,826 |
|
|
| 3.91 |
|
|
|
|
|
|
|
|
|
|
|
|
|
| 21,212 |
|
|
| 21,393 |
|
|
| 2.28 |
|
| ||||||
Capital Equipment |
|
|
|
|
|
|
|
|
|
|
|
|
|
|
|
|
|
|
|
|
|
|
|
|
|
|
|
|
|
|
|
|
|
| ||||||||||||||||||
Circor International, Inc. | (8) |
| S + 6.00% |
| 1.00% |
| 11.40% |
| 10/18/2030 |
|
| 67,241 |
|
|
| 65,911 |
|
|
| 65,809 |
|
|
| 7.02 |
|
| ||||||||||||||||||||||||||
Circor International, Inc. - Revolving Credit Facility | (8)(9)(12) |
| S + 6.00% |
| 1.00% |
| 11.35% |
| 10/18/2029 |
|
| — |
|
|
| (150 | ) |
|
| (165 | ) |
|
| (0.02 | ) |
| ||||||||||||||||||||||||||
Faraday Buyer, LLC | (8) |
| S + 7.00% |
| 1.00% |
| 11.32% |
| 10/10/2028 |
|
| 34,833 |
|
|
| 33,812 |
|
|
| 33,817 |
|
|
| 7.02 |
|
| (8) |
| S + 6.00% |
| 1.00% |
| 11.33% |
| 10/11/2028 |
|
| 33,559 |
|
|
| 32,893 |
|
|
| 32,897 |
|
|
| 3.51 |
|
|
Faraday Buyer, LLC - Delayed Draw Term Loan | (8)(9)(12) |
| S + 7.00% |
| 1.00% |
| 11.32% |
| 10/11/2028 |
|
| — |
|
|
| (44 | ) |
|
| (45 | ) |
|
| (0.01 | ) |
| (8)(9)(12) |
| S + 6.00% |
| 1.00% |
| 11.33% |
| 10/11/2028 |
|
| — |
|
|
| (33 | ) |
|
| (34 | ) |
|
| (0.00 | ) |
|
Trillium FlowControl | LU(8)(10)(11) |
| S + 5.61% |
| 1.00% |
| 9.94% |
| 6/28/2026 |
|
| 17,910 |
|
|
| 17,744 |
|
|
| 16,919 |
|
|
| 3.51 |
|
| LU(8)(10)(11) |
| S + 5.76% |
| 1.00% |
| 11.11% |
| 6/28/2026 |
|
| 17,730 |
|
|
| 17,613 |
|
|
| 17,102 |
|
|
| 1.82 |
|
|
|
|
|
|
|
|
|
|
|
|
|
|
| 51,512 |
|
|
| 50,691 |
|
|
| 10.52 |
|
|
|
|
|
|
|
|
|
|
|
|
|
| 116,234 |
|
|
| 115,609 |
|
|
| 12.33 |
|
| ||||||
Chemicals, Plastics & Rubber |
|
|
|
|
|
|
|
|
|
|
|
|
|
|
|
|
|
|
|
|
|
|
|
|
|
|
|
|
|
|
|
|
|
| ||||||||||||||||||
Dubois Chemicals Group Inc. | (8) |
| S + 4.50% |
| 0.00% |
| 8.92% |
| 9/30/2026 |
|
| 2,754 |
|
|
| 2,745 |
|
|
| 2,588 |
|
|
| 0.53 |
|
|
| S + 4.60% |
| 0.00% |
| 9.96% |
| 9/30/2026 |
|
| 2,725 |
|
|
| 2,720 |
|
|
| 2,702 |
|
|
| 0.29 |
|
| |
Hexion Holdings Corporation |
| S + 4.65% |
| 0.50% |
| 8.93% |
| 3/15/2029 |
|
| 9,950 |
|
|
| 9,224 |
|
|
| 8,517 |
|
|
| 1.77 |
|
|
| S + 4.65% |
| 0.50% |
| 10.02% |
| 3/15/2029 |
|
| 9,850 |
|
|
| 9,219 |
|
|
| 9,444 |
|
|
| 1.01 |
|
| ||
|
|
|
|
|
|
|
|
|
|
|
|
| 11,969 |
|
|
| 11,105 |
|
|
| 2.30 |
|
|
|
|
|
|
|
|
|
|
|
|
|
| 11,939 |
|
|
| 12,146 |
|
|
| 1.30 |
|
| ||||||
Energy: Oil & Gas |
|
|
|
|
|
|
|
|
|
|
|
|
|
|
|
|
| |||||||||||||||||||||||||||||||||||
CITGO Holdings Inc. | (9) |
| N/A |
| N/A |
| 9.25% |
| 8/1/2024 |
|
| 26,051 |
|
|
| 25,640 |
|
|
| 26,155 |
|
|
| 5.43 |
|
| ||||||||||||||||||||||||||
CITGO Petroleum Corp. |
| N/A |
| N/A |
| 6.38% |
| 6/15/2026 |
|
| 2,121 |
|
|
| 2,156 |
|
|
| 2,036 |
|
|
| 0.42 |
|
| |||||||||||||||||||||||||||
Saturn Oil and Gas Inc. | CN(8)(10)(11) |
| C + 11.50% |
| 1.00% |
| 16.36% |
| 7/6/2025 |
|
| CAD 56,817 |
|
|
| 43,486 |
|
|
| 40,861 |
|
|
| 8.48 |
|
| ||||||||||||||||||||||||||
Consumer Goods: Durable |
|
|
|
|
|
|
|
|
|
|
|
|
|
|
|
|
|
| ||||||||||||||||||||||||||||||||||
Mattress Firm, Inc. |
| L + 4.25% |
| 0.75% |
| 9.95% |
| 9/25/2028 |
|
| 1,319 |
|
|
| 1,262 |
|
|
| 1,306 |
|
|
| 0.14 |
|
| |||||||||||||||||||||||||||
Parfums Holding Company, Inc. | (9) |
| S + 6.26% |
| 1.50% |
| 11.61% |
| 6/30/2026 |
|
| 24,842 |
|
|
| 24,278 |
|
|
| 24,309 |
|
|
| 2.59 |
|
| ||||||||||||||||||||||||||
Victra Finance Corp. |
| S + 7.25% |
| 0.75% |
| 12.60% |
| 3/31/2029 |
|
| 14,310 |
|
|
| 14,013 |
|
|
| 13,934 |
|
|
| 1.49 |
|
| |||||||||||||||||||||||||||
Victra Finance Corp. - Corporate Bond | (9) |
| N/A |
| N/A |
| 7.75% |
| 2/15/2026 |
|
| 100 |
|
|
| 91 |
|
|
| 96 |
|
|
| 0.01 |
|
| ||||||||||||||||||||||||||
|
|
|
|
|
|
|
|
|
|
|
|
| 71,282 |
|
|
| 69,052 |
|
|
| 14.33 |
|
|
|
|
|
|
|
|
|
|
|
|
|
| 39,644 |
|
|
| 39,645 |
|
|
| 4.23 |
|
| ||||||
Healthcare & Pharmaceuticals |
|
|
|
|
|
|
|
|
|
|
|
|
|
|
|
|
| |||||||||||||||||||||||||||||||||||
Bayer Environmental Services |
| S + 4.38% |
| 0.50% |
| 7.97% |
| 8/4/2029 |
|
| 20,000 |
|
|
| 18,422 |
|
|
| 18,185 |
|
|
| 3.77 |
|
| |||||||||||||||||||||||||||
Charlotte Buyer, Inc. |
| S + 5.25% |
| 0.00% |
| 9.53% |
| 2/11/2028 |
|
| 33,333 |
|
|
| 31,119 |
|
|
| 31,514 |
|
|
| 6.54 |
|
| |||||||||||||||||||||||||||
Mallinckrodt International Financing SA | LU(10)(11) |
| L + 5.25% |
| 0.75% |
| 9.99% |
| 9/30/2027 |
|
| 2,676 |
|
|
| 2,525 |
|
|
| 2,012 |
|
|
| 0.42 |
|
| ||||||||||||||||||||||||||
Natural Partners, Inc. | (8) |
| L + 6.00% |
| 1.00% |
| 9.57% |
| 3/15/2028 |
|
| 38,149 |
|
|
| 37,481 |
|
|
| 36,874 |
|
|
| 7.65 |
|
| ||||||||||||||||||||||||||
Natural Partners, Inc. - Revolving Credit Facility | (8)(9)(12) |
| L + 6.00% |
| 1.00% |
| 11.14% |
| 3/15/2028 |
|
| — |
|
|
| (48 | ) |
|
| (94 | ) |
|
| (0.02 | ) |
| ||||||||||||||||||||||||||
|
|
|
|
| 89,499 |
|
|
| 88,491 |
|
|
| 18.36 |
|
| |||||||||||||||||||||||||||||||||||||
High Tech Industries |
|
|
|
|
|
|
|
|
|
|
|
|
|
|
|
|
| |||||||||||||||||||||||||||||||||||
Watchguard Technologies, Inc. |
| S + 5.25% |
| 0.75% |
| 9.57% |
| 7/2/2029 |
|
| 34,913 |
|
|
| 32,717 |
|
|
| 33,272 |
|
|
| 6.91 |
|
| |||||||||||||||||||||||||||
Hotel, Gaming & Leisure |
|
|
|
|
|
|
|
|
|
|
|
|
|
|
|
|
| |||||||||||||||||||||||||||||||||||
Chuck E. Cheese |
| N/A |
| N/A |
| 6.75% |
| 5/1/2026 |
|
| 17,534 |
|
|
| 16,385 |
|
|
| 16,263 |
|
|
| 3.38 |
|
| |||||||||||||||||||||||||||
TouchTunes | (8) |
| S + 5.25% |
| 0.50% |
| 8.98% |
| 4/2/2029 |
|
| 29,925 |
|
|
| 29,644 |
|
|
| 29,102 |
|
|
| 6.04 |
|
| ||||||||||||||||||||||||||
Viad Corp. | (11) |
| L + 5.00% |
| 0.50% |
| 9.38% |
| 7/30/2028 |
|
| 4,369 |
|
|
| 4,359 |
|
|
| 4,107 |
|
|
| 0.85 |
|
| ||||||||||||||||||||||||||
|
|
|
|
|
|
|
|
|
|
|
|
| 50,388 |
|
|
| 49,472 |
|
|
| 10.27 |
|
| |||||||||||||||||||||||||||||
40
42
MSD Investment Corp.
Consolidated Schedule of Investments - (Continued)
December 31, 20222023
(in thousands, except shares)
Investments (1)(2)(3) | Footnotes |
| Reference Rate and Spread (4) |
| Interest Rate Floor |
| Interest Rate (5) |
| Maturity Date |
| Par Amount / Shares (6) |
|
| Cost (7) |
|
| Fair Value |
|
| Percentage of Net Assets |
|
| ||||
Media: Advertising, Printing & Publishing |
|
|
|
|
|
|
|
|
|
|
|
|
|
|
|
|
|
|
|
|
|
| ||||
Patientpoint Network Solutions, LLC | (8) |
| S + 7.26% |
| 1.00% |
| 11.84% |
| 3/7/2025 |
|
| 31,931 |
|
|
| 31,397 |
|
|
| 31,183 |
|
|
| 6.47 |
|
|
Real Betis Balompie SAD - Participation Interest | ES(8)(10)(11) |
| N/A |
| N/A |
| 7.00% |
| 6/5/2025 |
|
| 13,000 |
|
|
| 14,764 |
|
|
| 13,917 |
|
|
| 2.89 |
|
|
|
|
|
|
|
|
|
|
|
|
|
|
|
|
| 46,161 |
|
|
| 45,100 |
|
|
| 9.36 |
|
| |
Media: Diversified & Production |
|
|
|
|
|
|
|
|
|
|
|
|
|
|
|
|
|
|
|
|
|
| ||||
FilmRise Acquisitions, LLC | (8)(9) |
| N/A |
| N/A |
| 13.50% |
| 9/17/2025 |
|
| 18,086 |
|
|
| 18,094 |
|
|
| 18,043 |
|
|
| 3.75 |
|
|
Getty Images Inc. | (8) |
| L + 4.50% |
| 0.00% |
| 8.94% |
| 2/19/2026 |
|
| 18,902 |
|
|
| 18,841 |
|
|
| 18,855 |
|
|
| 3.91 |
|
|
Candle Media Co Ltd | (8) |
| L + 6.00% |
| 0.75% |
| 10.38% (Incl 4.00% PIK) |
| 6/18/2027 |
|
| 41,687 |
|
|
| 40,994 |
|
|
| 39,217 |
|
|
| 8.14 |
|
|
Candle Media Co Ltd - Delayed Draw Term Loan | (8)(9)(12) |
| L + 6.00% |
| 0.75% |
| 10.38% (Incl 4.00% PIK) |
| 6/18/2027 |
|
| 15,239 |
|
|
| 14,998 |
|
|
| 14,273 |
|
|
| 2.96 |
|
|
|
|
|
|
|
|
|
|
|
|
|
|
|
|
| 92,927 |
|
|
| 90,388 |
|
|
| 18.76 |
|
| |
Metals & Mining |
|
|
|
|
|
|
|
|
|
|
|
|
|
|
|
|
|
|
|
|
|
| ||||
Conuma Coal Resources LTD | CN(9)(10)(11) |
| N/A |
| N/A |
| 10.00% |
| 5/1/2023 |
|
| 3,181 |
|
|
| 3,180 |
|
|
| 3,153 |
|
|
| 0.65 |
|
|
Retail |
|
|
|
|
|
|
|
|
|
|
|
|
|
|
|
|
|
|
|
|
|
| ||||
Xponential Fitness LLC | (8)(11) |
| L + 6.50% |
| 1.00% |
| 10.67% |
| 2/28/2025 |
|
| 22,759 |
|
|
| 22,563 |
|
|
| 22,873 |
|
|
| 4.75 |
|
|
Services: Business |
|
|
|
|
|
|
|
|
|
|
|
|
|
|
|
|
|
|
|
|
|
| ||||
Muine Gall, LLC | (8)(9)(11) |
| L + 7.00% |
| 0.50% |
| 12.15% PIK |
| 9/21/2024 |
|
| 46,047 |
|
|
| 46,063 |
|
|
| 46,308 |
|
|
| 9.61 |
|
|
Travelport Finance (Luxembourg) S.A.R.L. | LU(10)(11) |
| S + 8.75% |
| 1.00% |
| 13.48% (Incl 7.25% PIK) |
| 2/28/2025 |
|
| 31,346 |
|
|
| 31,036 |
|
|
| 31,342 |
|
|
| 6.50 |
|
|
|
|
|
|
|
|
|
|
|
|
|
|
|
|
| 77,099 |
|
|
| 77,650 |
|
|
| 16.11 |
|
| |
Services: Consumer |
|
|
|
|
|
|
|
|
|
|
|
|
|
|
|
|
|
|
|
|
|
| ||||
CSC Serviceworks | (9) |
| L + 4.00% |
| 0.75% |
| 8.39% |
| 3/4/2028 |
|
| 222 |
|
|
| 201 |
|
|
| 186 |
|
|
| 0.04 |
|
|
Spring Education Group Inc. |
|
| L + 4.00% |
| 0.00% |
| 8.73% |
| 7/30/2025 |
|
| 46,750 |
|
|
| 44,890 |
|
|
| 45,540 |
|
|
| 9.45 |
|
|
Vision Purchaser Corp. | (8) |
| S + 6.40% |
| 1.00% |
| 10.98% |
| 6/10/2025 |
|
| 28,946 |
|
|
| 28,530 |
|
|
| 26,989 |
|
|
| 5.60 |
|
|
Vision Purchaser Corp. - Incremental Term Loan | (8) |
| S + 6.40% |
| 1.00% |
| 10.98% |
| 6/10/2025 |
|
| 2,523 |
|
|
| 2,484 |
|
|
| 2,353 |
|
|
| 0.49 |
|
|
|
|
|
|
|
|
|
|
|
|
|
|
|
|
| 76,105 |
|
|
| 75,068 |
|
|
| 15.58 |
|
| |
Telecommunications |
|
|
|
|
|
|
|
|
|
|
|
|
|
|
|
|
|
|
|
|
|
| ||||
Innovate Corp. | (11) |
| N/A |
| N/A |
| 8.50% |
| 2/1/2026 |
|
| 24,000 |
|
|
| 24,050 |
|
|
| 17,148 |
|
|
| 3.56 |
|
|
Ligado Networks LLC | (9)(13) |
| N/A |
| N/A |
| 15.50% PIK |
| 11/1/2023 |
|
| 11,928 |
|
|
| 11,071 |
|
|
| 3,853 |
|
|
| 0.80 |
|
|
|
|
|
|
|
|
|
|
|
|
|
|
|
|
| 35,121 |
|
|
| 21,001 |
|
|
| 4.36 |
|
| |
Wholesale |
|
|
|
|
|
|
|
|
|
|
|
|
|
|
|
|
|
|
|
|
|
| ||||
FleetPride Inc. | (8) |
| L + 4.50% |
| 0.00% |
| 8.88% |
| 2/4/2026 |
|
| 21,710 |
|
|
| 21,684 |
|
|
| 21,330 |
|
|
| 4.43 |
|
|
|
|
|
|
|
|
|
|
|
|
|
|
|
|
| 21,684 |
|
|
| 21,330 |
|
|
| 4.43 |
|
| |
Total First Lien Debt |
|
|
|
|
|
|
|
|
|
|
|
|
|
| 774,611 |
|
|
| 748,545 |
|
|
| 155.35 |
| % | |
Investments (1)(2)(3) | Footnotes |
| Reference Rate and Spread (4) |
| Interest Rate Floor |
| Interest Rate (5) |
| Maturity Date |
| Par Amount / Shares (6) |
|
| Cost (7) |
|
| Fair Value |
|
| Percentage of Net Assets |
|
| ||||
First Lien Debt (continued) |
|
|
|
|
|
|
|
|
|
|
|
|
|
|
|
|
|
|
|
|
|
| ||||
Energy: Oil & Gas |
|
|
|
|
|
|
|
|
|
|
|
|
|
|
|
|
|
|
|
|
|
| ||||
CITGO Petroleum Corp. |
|
| N/A |
| N/A |
| 6.38% |
| 6/15/2026 |
|
| 2,121 |
|
|
| 2,146 |
|
|
| 2,113 |
|
|
| 0.22 |
|
|
Saturn Oil and Gas Inc. | CN(8)(10)(11) |
| C + 11.50% |
| 1.00% |
| 16.94% |
| 2/28/2026 |
|
| CAD 101,548 |
|
|
| 74,803 |
|
|
| 74,817 |
|
|
| 7.98 |
|
|
|
|
|
|
|
|
|
|
|
|
|
|
|
|
| 76,949 |
|
|
| 76,930 |
|
|
| 8.20 |
|
| |
Healthcare & Pharmaceuticals |
|
|
|
|
|
|
|
|
|
|
|
|
|
|
|
|
|
|
|
|
|
| ||||
Bayer Environmental Services |
|
| S + 4.38% |
| 0.50% |
| 9.77% |
| 10/4/2029 |
|
| 19,800 |
|
|
| 18,404 |
|
|
| 19,489 |
|
|
| 2.08 |
|
|
Charlotte Buyer, Inc. |
|
| S + 5.25% |
| 0.00% |
| 10.61% |
| 2/11/2028 |
|
| 57,937 |
|
|
| 55,591 |
|
|
| 58,122 |
|
|
| 6.20 |
|
|
Natural Partners, Inc. | (8) |
| S + 4.65% |
| 1.00% |
| 10.04% |
| 11/29/2027 |
|
| 37,765 |
|
|
| 37,224 |
|
|
| 37,239 |
|
|
| 3.97 |
|
|
Natural Partners, Inc. - Revolving Credit Facility | (8)(9)(12) |
| S + 4.65% |
| 1.00% |
| 9.98% |
| 11/29/2027 |
|
| — |
|
|
| (39 | ) |
|
| (39 | ) |
|
| (0.00 | ) |
|
PetVet Care Centers | (8) |
| S + 6.00% |
| 0.75% |
| 11.36% |
| 11/15/2030 |
|
| 53,523 |
|
|
| 52,466 |
|
|
| 52,465 |
|
|
| 5.60 |
|
|
PetVet Care Centers - Delayed Draw Term Loan | (8)(9)(12) |
| S + 6.00% |
| 0.75% |
| 11.35% |
| 11/15/2030 |
|
| — |
|
|
| (67 | ) |
|
| (68 | ) |
|
| (0.01 | ) |
|
PetVet Care Centers - Revolving Credit Facility | (8)(9)(12) |
| S + 6.00% |
| 0.75% |
| 11.35% |
| 11/15/2029 |
|
| — |
|
|
| (137 | ) |
|
| (138 | ) |
|
| (0.01 | ) |
|
Press Ganey Holdings - 2022 Term Loan | (9) |
| S + 3.85% |
| 0.75% |
| 9.20% |
| 7/25/2026 |
|
| 4,118 |
|
|
| 3,937 |
|
|
| 4,062 |
|
|
| 0.43 |
|
|
Press Ganey Holdings |
|
| S + 3.61% |
| 0.00% |
| 8.97% |
| 7/24/2026 |
|
| 9,072 |
|
|
| 8,562 |
|
|
| 8,963 |
|
|
| 0.96 |
|
|
Press Ganey Holdings - Incremental Term Loan |
|
| S + 3.86% |
| 0.75% |
| 9.22% |
| 7/25/2026 |
|
| 14,870 |
|
|
| 14,282 |
|
|
| 14,647 |
|
|
| 1.56 |
|
|
|
|
|
|
|
|
|
|
|
|
|
|
|
|
| 190,223 |
|
|
| 194,742 |
|
|
| 20.78 |
|
| |
High Tech Industries |
|
|
|
|
|
|
|
|
|
|
|
|
|
|
|
|
|
|
|
|
|
| ||||
Inmar, Inc. |
|
| S + 5.50% |
| 1.00% |
| 10.86% |
| 5/1/2026 |
|
| 39,800 |
|
|
| 38,615 |
|
|
| 39,236 |
|
|
| 4.19 |
|
|
Watchguard Technologies, Inc. |
|
| S + 5.25% |
| 0.75% |
| 10.61% |
| 7/2/2029 |
|
| 41,603 |
|
|
| 39,243 |
|
|
| 39,705 |
|
|
| 4.24 |
|
|
|
|
|
|
|
|
|
|
|
|
|
|
|
|
| 77,858 |
|
|
| 78,941 |
|
|
| 8.43 |
|
| |
Hotel, Gaming & Leisure |
|
|
|
|
|
|
|
|
|
|
|
|
|
|
|
|
|
|
|
|
|
| ||||
Chuck E. Cheese |
|
| N/A |
| N/A |
| 6.75% |
| 5/1/2026 |
|
| 17,534 |
|
|
| 16,693 |
|
|
| 17,111 |
|
|
| 1.83 |
|
|
ClubCorp Holdings Inc. | (9) |
| S + 5.26% |
| 0.00% |
| 10.61% |
| 9/18/2026 |
|
| 81,447 |
|
|
| 77,787 |
|
|
| 78,342 |
|
|
| 8.36 |
|
|
Sandlot Baseball Borrower Co. | (8) |
| S + 5.75% |
| 1.00% |
| 11.10% |
| 12/27/2028 |
|
| 66,667 |
|
|
| 65,334 |
|
|
| 65,333 |
|
|
| 6.97 |
|
|
Sandlot Baseball Borrower Co. - Delayed Draw Term Loan | (8)(9)(12) |
| S + 5.75% |
| 1.00% |
| 11.08% |
| 12/27/2028 |
|
| — |
|
|
| 2 |
|
|
| — |
|
|
| — |
|
|
TouchTunes |
|
| S + 5.00% |
| 0.50% |
| 10.35% |
| 4/2/2029 |
|
| 37,604 |
|
|
| 37,282 |
|
|
| 37,237 |
|
|
| 3.97 |
|
|
Viad Corp. | (11) |
| S + 5.11% |
| 0.50% |
| 10.47% |
| 7/30/2028 |
|
| 3,550 |
|
|
| 3,545 |
|
|
| 3,528 |
|
|
| 0.38 |
|
|
|
|
|
|
|
|
|
|
|
|
|
|
|
|
| 200,643 |
|
|
| 201,551 |
|
|
| 21.51 |
|
| |
Media: Advertising, Printing & Publishing |
|
|
|
|
|
|
|
|
|
|
|
|
|
|
|
|
|
|
|
|
|
| ||||
Clear Channel Outdoor | (11) |
| S + 3.76% |
| 0.00% |
| 9.14% |
| 8/21/2026 |
|
| 4,671 |
|
|
| 4,479 |
|
|
| 4,616 |
|
|
| 0.50 |
|
|
Emerald Exhibitions | (11) |
| S + 5.10% |
| 0.00% |
| 10.46% |
| 5/22/2026 |
|
| 49,750 |
|
|
| 48,430 |
|
|
| 49,949 |
|
|
| 5.33 |
|
|
Sheffield United F.C. | UK(8)(9)(10)(11) |
| N/A |
| N/A |
| 13.07% |
| 7/22/2026 |
|
| 14,704 |
|
|
| 18,200 |
|
|
| 18,668 |
|
|
| 1.99 |
|
|
|
|
|
|
|
|
|
|
|
|
|
|
|
|
| 71,109 |
|
|
| 73,233 |
|
|
| 7.82 |
|
| |
Media: Diversified & Production |
|
|
|
|
|
|
|
|
|
|
|
|
|
|
|
|
|
|
|
|
|
| ||||
Getty Images Inc. | (11) |
| S + 4.60% |
| 0.00% |
| 9.95% |
| 2/19/2026 |
|
| 17,516 |
|
|
| 17,481 |
|
|
| 17,578 |
|
|
| 1.86 |
|
|
Candle Media Co Ltd | (8) |
| S + 6.10% |
| 0.75% |
| 11.47% |
| 6/18/2027 |
|
| 43,368 |
|
|
| 42,803 |
|
|
| 42,131 |
|
|
| 4.49 |
|
|
Candle Media Co Ltd -Delayed Draw Term Loan | (8) |
| S + 6.10% |
| 0.75% |
| 11.47% |
| 6/18/2027 |
|
| 17,169 |
|
|
| 16,964 |
|
|
| 16,679 |
|
|
| 1.78 |
|
|
|
|
|
|
|
|
|
|
|
|
|
|
|
|
| 77,248 |
|
|
| 76,388 |
|
|
| 8.13 |
|
| |
Retail |
|
|
|
|
|
|
|
|
|
|
|
|
|
|
|
|
|
|
|
|
|
| ||||
Xponential Fitness LLC | (8)(11) |
| S + 6.76% |
| 1.00% |
| 12.14% |
| 2/28/2025 |
|
| 68,273 |
|
|
| 67,265 |
|
|
| 68,273 |
|
|
| 7.28 |
|
|
MED ParentCo, LP |
|
| S + 4.36% |
| 0.00% |
| 9.72% |
| 8/31/2026 |
|
| 99,739 |
|
|
| 95,446 |
|
|
| 98,606 |
|
|
| 10.52 |
|
|
|
|
|
|
|
|
|
|
|
|
|
|
|
|
| 162,711 |
|
|
| 166,879 |
|
|
| 17.80 |
|
| |
4143
MSD Investment Corp.
Consolidated Schedule of Investments - (Continued)
December 31, 20222023
(in thousands, except shares)
Investments (1)(2)(3) | Footnotes |
| Reference Rate and Spread (4) |
| Interest Rate Floor |
| Interest Rate (5) |
| Maturity Date |
| Par Amount / Shares (6) |
|
| Cost (7) |
|
| Fair Value |
|
| Percentage of Net Assets |
|
| ||||
Second Lien Debt |
|
|
|
|
|
|
|
|
|
|
|
|
|
|
|
|
|
|
|
|
|
| ||||
Chemicals, Plastics & Rubber |
|
|
|
|
|
|
|
|
|
|
|
|
|
|
|
|
|
|
|
|
|
| ||||
Hexion Holdings Corporation | (8)(9) |
| S + 7.54% |
| 0.50% |
| 11.86% |
| 3/15/2030 |
|
| 35,000 |
|
|
| 34,091 |
|
|
| 27,300 |
|
|
| 5.67 |
|
|
Consumer goods: Non-durable |
|
|
|
|
|
|
|
|
|
|
|
|
|
|
|
|
|
|
|
|
|
| ||||
Protective Industrial Products Inc. | (8) |
| L + 8.25% |
| 1.00% |
| 12.63% |
| 12/30/2028 |
|
| 34,199 |
|
|
| 33,415 |
|
|
| 31,471 |
|
|
| 6.53 |
|
|
Hotel, Gaming & Leisure |
|
|
|
|
|
|
|
|
|
|
|
|
|
|
|
|
|
|
|
|
|
| ||||
Mohegan Gaming & Entertainment | (9) |
| N/A |
| N/A |
| 8.00% |
| 2/1/2026 |
|
| 16,378 |
|
|
| 16,473 |
|
|
| 15,150 |
|
|
| 3.14 |
|
|
Services: Business |
|
|
|
|
|
|
|
|
|
|
|
|
|
|
|
|
|
|
|
|
|
| ||||
DISA Holdings Corp. | (8) |
| S + 10.00% |
| 0.75% |
| 14.32% |
| 3/9/2029 |
|
| 14,641 |
|
|
| 14,207 |
|
|
| 14,207 |
|
|
| 2.95 |
|
|
DISA Holdings Corp. - Delayed Draw Term Loan | (8)(9) |
| S + 10.00% |
| 0.75% |
| 14.22% |
| 3/9/2029 |
|
| 2,745 |
|
|
| 2,666 |
|
|
| 2,664 |
|
|
| 0.55 |
|
|
Trace3 Inc. | (8)(9) |
| L + 7.50% |
| 0.50% |
| 10.56% |
| 10/8/2029 |
|
| 33,750 |
|
|
| 32,914 |
|
|
| 32,068 |
|
|
| 6.65 |
|
|
|
|
|
|
|
|
|
|
|
|
|
|
|
|
| 49,787 |
|
|
| 48,939 |
|
|
| 10.15 |
|
| |
Services: Consumer |
|
|
|
|
|
|
|
|
|
|
|
|
|
|
|
|
|
|
|
|
|
| ||||
Midwest Veterinary Partners LLC | (8)(9) |
| L + 7.50% |
| 0.75% |
| 11.88% |
| 4/26/2029 |
|
| 50,000 |
|
|
| 50,042 |
|
|
| 47,027 |
|
|
| 9.76 |
|
|
Southern Veterinary Partners LLC | (8)(9) |
| S + 7.85% |
| 1.00% |
| 12.17% |
| 10/5/2028 |
|
| 45,000 |
|
|
| 44,038 |
|
|
| 40,950 |
|
|
| 8.50 |
|
|
Spring Education Group Inc. | (9) |
| L + 8.25% |
| 0.00% |
| 13.02% |
| 7/30/2026 |
|
| 100 |
|
|
| 91 |
|
|
| 89 |
|
|
| 0.02 |
|
|
|
|
|
|
|
|
|
|
|
|
|
|
|
|
| 94,171 |
|
|
| 88,066 |
|
|
| 18.28 |
|
| |
Total Second Lien Debt |
|
|
|
|
|
|
|
|
|
|
|
|
|
| 227,937 |
|
|
| 210,926 |
|
|
| 43.77 |
| % | |
Preferred Equity |
|
|
|
|
|
|
|
|
|
|
|
|
|
|
|
|
|
|
|
|
|
| ||||
Consumer goods: Non-durable |
|
|
|
|
|
|
|
|
|
|
|
|
|
|
|
|
|
|
|
|
|
| ||||
Protective Industrial Products Inc. - Series A Preferred | (8)(9) |
|
|
|
|
| 13.00% PIK |
|
|
|
| 29 |
|
|
| 28,519 |
|
|
| 22,267 |
|
|
| 4.62 |
|
|
Total Preferred Equity |
|
|
|
|
|
|
|
|
|
|
|
|
|
| 28,519 |
|
|
| 22,267 |
|
|
| 4.62 |
|
| |
Total Investments - non-controlled/non-affiliated |
|
|
|
|
|
|
|
|
|
|
|
|
| $ | 1,031,067 |
|
| $ | 981,738 |
|
|
| 203.74 |
| % | |
Cash and Cash Equivalents |
|
|
|
|
|
|
|
|
|
|
|
|
|
|
|
|
|
|
|
|
|
| ||||
Cash and Cash Equivalents | (14) |
|
|
|
|
|
|
|
|
|
|
|
| $ | 36,616 |
|
| $ | 36,616 |
|
|
| 7.60 |
| % | |
Total Cash and Cash Equivalents |
|
|
|
|
|
|
|
|
|
|
|
|
|
| 36,616 |
|
|
| 36,616 |
|
|
| 7.60 |
|
| |
Total Portfolio Investments, Cash and Cash Equivalents |
|
|
|
|
|
|
|
|
|
|
|
|
| $ | 1,067,683 |
|
| $ | 1,018,354 |
|
|
| 211.34 |
| % | |
December 31, 2022 |
| |||||||||||||||||||||
Derivative Counterparty |
| Settlement Date |
| Amount Purchased |
|
| Amount Sold |
|
| Amortized Cost |
|
| Fair Value |
|
| % of Net Assets |
| |||||
Foreign Currency Forward Contracts |
|
|
|
|
|
|
|
|
|
|
|
|
|
|
|
|
| |||||
Goldman Sachs International |
| March 15, 2023 |
| $ | 13,574 |
|
| € | 12,688 |
|
|
| — |
|
| $ | (78 | ) |
|
| 0.0 | % |
Goldman Sachs International |
| March 15, 2023 |
| $ | 43,460 |
|
|
| CAD 59,121 |
|
|
| — |
|
| $ | (252 | ) |
|
| -0.1 | % |
Goldman Sachs International |
| March 15, 2023 |
|
| CAD 3,151 |
|
| $ | 2,336 |
|
|
| — |
|
| $ | (6 | ) |
|
| 0.0 | % |
|
|
|
|
|
|
|
|
|
|
|
|
| $ | (336 | ) |
|
| -0.1 | % | |||
Investments (1)(2)(3) | Footnotes |
| Reference Rate and Spread (4) |
| Interest Rate Floor |
| Interest Rate (5) |
| Maturity Date |
| Par Amount / Shares (6) |
|
| Cost (7) |
|
| Fair Value |
|
| Percentage of Net Assets |
|
| ||||
First Lien Debt (continued) |
|
|
|
|
|
|
|
|
|
|
|
|
|
|
|
|
|
|
|
|
|
| ||||
Services: Business |
|
|
|
|
|
|
|
|
|
|
|
|
|
|
|
|
|
|
|
|
|
| ||||
AVSC Holding Corporation |
|
| S + 3.65% |
| 1.00% |
| 8.96% |
| 3/1/2025 |
|
| 16,168 |
|
|
| 15,281 |
|
|
| 15,799 |
|
|
| 1.69 |
|
|
BDO USA, P.C. | (8) |
| S + 6.00% |
| 2.00% |
| 11.36% |
| 8/31/2028 |
|
| 66,319 |
|
|
| 65,047 |
|
|
| 65,060 |
|
|
| 6.94 |
|
|
Momentive Global | (8) |
| S + 7.00% |
| 1.00% |
| 12.38% |
| 5/31/2030 |
|
| 63,964 |
|
|
| 62,731 |
|
|
| 63,197 |
|
|
| 6.74 |
|
|
Momentive Global - Revolving Credit Facility | (8)(9)(12) |
| S + 7.00% |
| 1.00% |
| 12.35% |
| 5/31/2029 |
|
| — |
|
|
| (103 | ) |
|
| (69 | ) |
|
| (0.01 | ) |
|
Travelport Finance (Luxembourg) S.A.R.L. | LU(10)(11) |
| S + 8.26% |
| 1.00% |
| 13.61% (6.61% PIK) |
| 9/30/2028 |
|
| 52,878 |
|
|
| 52,491 |
|
|
| 51,043 |
|
|
| 5.43 |
|
|
Wood Mackenzie, Inc. | (8) |
| S + 6.75% |
| 0.75% |
| 12.13% |
| 2/1/2030 |
|
| 36,759 |
|
|
| 35,760 |
|
|
| 36,402 |
|
|
| 3.88 |
|
|
Wood Mackenzie, Inc. - Revolving Credit Facility | (8)(9)(12) |
| S + 6.75% |
| 0.75% |
| 12.08% |
| 2/1/2028 |
|
| — |
|
|
| (73 | ) |
|
| (29 | ) |
|
| (0.00 | ) |
|
|
|
|
|
|
|
|
|
|
|
|
|
|
|
| 231,134 |
|
|
| 231,403 |
|
|
| 24.67 |
|
| |
Services: Consumer |
|
|
|
|
|
|
|
|
|
|
|
|
|
|
|
|
|
|
|
|
|
| ||||
CSC Serviceworks | (9) |
| S + 4.26% |
| 0.75% |
| 9.62% |
| 3/4/2028 |
|
| 220 |
|
|
| 202 |
|
|
| 192 |
|
|
| 0.02 |
|
|
Equinox Holdings, Inc. | (9) |
| S + 3.00% |
| 1.00% |
| 8.61% |
| 3/8/2024 |
|
| 35,976 |
|
|
| 34,994 |
|
|
| 35,111 |
|
|
| 3.74 |
|
|
Vision Purchaser Corp. | (8) |
| S + 6.40% |
| 1.00% |
| 11.75% |
| 6/10/2025 |
|
| 28,645 |
|
|
| 28,389 |
|
|
| 27,914 |
|
|
| 2.98 |
|
|
Vision Purchaser Corp. - Incremental Term Loan | (8) |
| S + 6.40% |
| 1.00% |
| 11.75% |
| 6/10/2025 |
|
| 2,498 |
|
|
| 2,473 |
|
|
| 2,434 |
|
|
| 0.26 |
|
|
|
|
|
|
|
|
|
|
|
|
|
|
|
|
| 66,058 |
|
|
| 65,651 |
|
|
| 7.00 |
|
| |
Transportation: Cargo |
|
|
|
|
|
|
|
|
|
|
|
|
|
|
|
|
|
|
|
|
|
| ||||
Boasso Global | (8) |
| S + 6.75% |
| 0.75% |
| 12.11% |
| 7/3/2028 |
|
| 58,930 |
|
|
| 57,326 |
|
|
| 57,415 |
|
|
| 6.12 |
|
|
Boasso Global - Delayed Draw Term Loan | (8)(9)(12) |
| S + 6.75% |
| 0.75% |
| 12.11% |
| 10/3/2024 |
|
| 7,585 |
|
|
| 7,363 |
|
|
| 7,371 |
|
|
| 0.79 |
|
|
Boasso Global - Revolving Credit Facility | (8)(9)(12) |
| S + 6.75% |
| 0.75% |
| 12.08% |
| 7/1/2026 |
|
| — |
|
|
| (144 | ) |
|
| (161 | ) |
|
| (0.02 | ) |
|
|
|
|
|
|
|
|
|
|
|
|
|
|
|
| 64,545 |
|
|
| 64,625 |
|
|
| 6.89 |
|
| |
Transportation: Consumer |
|
|
|
|
|
|
|
|
|
|
|
|
|
|
|
|
|
|
|
|
|
| ||||
Virgin Atlantic | UK(8)(9)(10)(11) |
| S + 3.25% |
| 0.00% |
| 8.91% |
| 11/17/2026 |
|
| 29,931 |
|
|
| 28,359 |
|
|
| 28,507 |
|
|
| 3.04 |
|
|
Beacon Mobility Corp. | (8)(9) |
| S + 8.60% |
| 0.00% |
| 14.08% PIK |
| 12/31/2025 |
|
| 50,185 |
|
|
| 48,903 |
|
|
| 48,895 |
|
|
| 5.22 |
|
|
Beacon Mobility Corp. - Delayed Draw Term Loan | (8)(9)(12) |
| S + 8.60% |
| 0.00% |
| 13.98% |
| 12/31/2025 |
|
| 829 |
|
|
| 792 |
|
|
| 793 |
|
|
| 0.08 |
|
|
|
|
|
|
|
|
|
|
|
|
|
|
|
|
| 78,054 |
|
|
| 78,195 |
|
|
| 8.34 |
|
| |
Telecommunications |
|
|
|
|
|
|
|
|
|
|
|
|
|
|
|
|
|
|
|
|
|
| ||||
FirstLight Fiber - Initial Term Loan |
|
| S + 3.61% |
| 0.00% |
| 8.97% |
| 7/23/2025 |
|
| 14,331 |
|
|
| 13,886 |
|
|
| 14,080 |
|
|
| 1.50 |
|
|
FirstLight Fiber - 2023 Incremental Term Loan | (8) |
| S + 4.11% |
| 0.00% |
| 9.47% |
| 7/23/2025 |
|
| 15,500 |
|
|
| 15,367 |
|
|
| 15,490 |
|
|
| 1.65 |
|
|
Innovate Corp. | (11) |
| N/A |
| N/A |
| 8.50% |
| 2/1/2026 |
|
| 24,000 |
|
|
| 24,035 |
|
|
| 18,375 |
|
|
| 1.96 |
|
|
Ligado Networks LLC | (9)(13) |
| N/A |
| N/A |
| 15.50% PIK |
| 11/1/2023 |
|
| 12,853 |
|
|
| 11,071 |
|
|
| 2,429 |
|
|
| 0.26 |
|
|
Maxar Technologies Inc. | (8) |
| S + 7.25% |
| 1.00% |
| 12.60% |
| 5/3/2030 |
|
| 82,006 |
|
|
| 79,697 |
|
|
| 79,777 |
|
|
| 8.51 |
|
|
Maxar Technologies Inc. - Revolving Credit Facility | (8)(9)(12) |
| S + 7.25% |
| 1.00% |
| 12.60% |
| 5/3/2029 |
|
| 4,202 |
|
|
| 3,861 |
|
|
| 3,854 |
|
|
| 0.41 |
|
|
ViaSat, Inc. | (11) |
| S + 4.61% |
| 0.50% |
| 9.96% |
| 5/30/2030 |
|
| 49,875 |
|
|
| 46,460 |
|
|
| 48,815 |
|
|
| 5.21 |
|
|
|
|
|
|
|
|
|
|
|
|
|
|
|
|
| 194,377 |
|
|
| 182,820 |
|
|
| 19.50 |
|
| |
Wholesale |
|
|
|
|
|
|
|
|
|
|
|
|
|
|
|
|
|
|
|
|
|
| ||||
DFS Holdings Company, Inc. | (8) |
| S + 7.10% |
| 0.75% |
| 12.46% |
| 1/31/2029 |
|
| 21,988 |
|
|
| 21,406 |
|
|
| 21,436 |
|
|
| 2.29 |
|
|
DFS Holdings Company, Inc. - Delayed Draw Term Loan | (8)(9)(12) |
| S + 7.10% |
| 0.75% |
| 12.46% |
| 1/31/2029 |
|
| 1,611 |
|
|
| 1,538 |
|
|
| 1,541 |
|
|
| 0.16 |
|
|
|
|
|
|
|
|
|
|
|
|
|
|
|
|
| 22,944 |
|
|
| 22,977 |
|
|
| 2.45 |
|
| |
Total First Lien Debt |
|
|
|
|
|
|
|
|
|
|
|
|
|
| 1,942,665 |
|
|
| 1,942,843 |
|
|
| 207.25 |
| % | |
44
MSD Investment Corp.
Consolidated Schedule of Investments - (Continued)
December 31, 2023
(in thousands, except shares)
Investments (1)(2)(3) | Footnotes |
| Reference Rate and Spread (4) |
| Interest Rate Floor |
| Interest Rate (5) |
| Maturity Date |
| Par Amount / Shares (6) |
|
| Cost (7) |
|
| Fair Value |
|
| Percentage of Net Assets |
|
| ||||
Second Lien Debt |
|
|
|
|
|
|
|
|
|
|
|
|
|
|
|
|
|
|
|
|
|
| ||||
Chemicals, Plastics & Rubber |
|
|
|
|
|
|
|
|
|
|
|
|
|
|
|
|
|
|
|
|
|
| ||||
Hexion Holdings Corporation | (9) |
| S + 7.54% |
| 0.50% |
| 12.89% |
| 3/15/2030 |
|
| 35,000 |
|
|
| 34,174 |
|
|
| 29,269 |
|
|
| 3.12 |
|
|
Consumer goods: Non-durable |
|
|
|
|
|
|
|
|
|
|
|
|
|
|
|
|
|
|
|
|
|
| ||||
Protective Industrial Products Inc. | (8) |
| S + 8.36% |
| 1.00% |
| 13.72% |
| 12/30/2028 |
|
| 34,199 |
|
|
| 33,512 |
|
|
| 33,626 |
|
|
| 3.59 |
|
|
Hotel, Gaming & Leisure |
|
|
|
|
|
|
|
|
|
|
|
|
|
|
|
|
|
|
|
|
|
| ||||
Mohegan Gaming & Entertainment | (9) |
| N/A |
| N/A |
| 8.00% |
| 2/1/2026 |
|
| 22,550 |
|
|
| 22,165 |
|
|
| 21,282 |
|
|
| 2.27 |
|
|
Services: Business |
|
|
|
|
|
|
|
|
|
|
|
|
|
|
|
|
|
|
|
|
|
| ||||
DISA Holdings Corp. | (8) |
| S + 10.00% |
| 0.75% |
| 15.36% (Incl 2.00% PIK) |
| 3/9/2029 |
|
| 14,869 |
|
|
| 14,477 |
|
|
| 14,554 |
|
|
| 1.55 |
|
|
DISA Holdings Corp. - Delayed Draw Term Loan | (8)(9) |
| S + 10.00% |
| 0.75% |
| 15.36% (Incl 2.00% PIK) |
| 3/9/2029 |
|
| 2,788 |
|
|
| 2,717 |
|
|
| 2,729 |
|
|
| 0.29 |
|
|
Trace3 Inc. | (8) |
| L + 7.76% |
| 0.50% |
| 13.17% |
| 10/8/2029 |
|
| 33,750 |
|
|
| 32,995 |
|
|
| 33,080 |
|
|
| 3.53 |
|
|
|
|
|
|
|
|
|
|
|
|
|
|
|
|
| 50,189 |
|
|
| 50,363 |
|
|
| 5.37 |
|
| |
Services: Consumer |
|
|
|
|
|
|
|
|
|
|
|
|
|
|
|
|
|
|
|
|
|
| ||||
Midwest Veterinary Partners LLC | (8) |
| S + 7.60% |
| 0.75% |
| 12.96% |
| 4/26/2029 |
|
| 50,000 |
|
|
| 50,011 |
|
|
| 46,886 |
|
|
| 5.00 |
|
|
Southern Veterinary Partners LLC |
|
| S + 7.85% |
| 1.00% |
| 13.21% |
| 10/5/2028 |
|
| 45,000 |
|
|
| 44,157 |
|
|
| 44,794 |
|
|
| 4.78 |
|
|
|
|
|
|
|
|
|
|
|
|
|
|
|
|
| 94,168 |
|
|
| 91,680 |
|
|
| 9.78 |
|
| |
Telecommunications |
|
|
|
|
|
|
|
|
|
|
|
|
|
|
|
|
|
|
|
|
|
| ||||
FirstLight Fiber - 2nd Lien Term Loan | (9) |
| S + 7.61% |
| 0.00% |
| 12.97% |
| 7/23/2026 |
|
| 100 |
|
|
| 98 |
|
|
| 98 |
|
|
| 0.01 |
|
|
Total Second Lien Debt |
|
|
|
|
|
|
|
|
|
|
|
|
|
| 234,306 |
|
|
| 226,318 |
|
|
| 24.14 |
| % | |
Preferred Equity |
|
|
|
|
|
|
|
|
|
|
|
|
|
|
|
|
|
|
|
|
|
| ||||
Banking, Finance, Insurance & Real Estate |
|
|
|
|
|
|
|
|
|
|
|
|
|
|
|
|
|
|
|
|
|
| ||||
Accession Risk Management - Preferred Stock | (8)(9) |
|
|
|
|
| 13.25% PIK |
|
|
|
| 105 |
|
|
| 102 |
|
|
| 102 |
|
|
| 0.01 |
|
|
Consumer goods: Non-durable |
|
|
|
|
|
|
|
|
|
|
|
|
|
|
|
|
|
|
|
|
|
| ||||
Protective Industrial Products Inc. - Series A Preferred | (8)(9) |
|
|
|
|
| 13.00% PIK |
|
|
|
| 31,597 |
|
|
| 31,469 |
|
|
| 27,600 |
|
|
| 2.94 |
|
|
Retail |
|
|
|
|
|
|
|
|
|
|
|
|
|
|
|
|
|
|
|
|
|
| ||||
Xponential Fitness LLC - Series A Preferred Stock | (8)(9)(11) |
|
|
|
|
| 6.50% |
| 7/27/2031 |
|
| 187 |
|
|
| 275 |
|
|
| 190 |
|
|
| 0.02 |
|
|
Total Preferred Equity |
|
|
|
|
|
|
|
|
|
|
|
|
|
| 31,846 |
|
|
| 27,892 |
|
|
| 2.97 |
|
| |
Total Investments - non-controlled/non-affiliated |
|
|
|
|
|
|
|
|
|
|
|
|
| $ | 2,208,817 |
|
| $ | 2,197,053 |
|
|
| 234.35 |
| % | |
Cash and Cash Equivalents |
|
|
|
|
|
|
|
|
|
|
|
|
|
|
|
|
|
|
|
|
|
| ||||
Cash and Cash Equivalents | (14) |
|
|
|
|
|
|
|
|
|
|
|
| $ | 98,606 |
|
| $ | 98,606 |
|
|
| 10.52 |
|
| |
Total Cash and Cash Equivalents |
|
|
|
|
|
|
|
|
|
|
|
|
|
| 98,606 |
|
|
| 98,606 |
|
|
| 10.52 |
|
| |
Total Portfolio Investments, Cash and Cash Equivalents |
|
|
|
|
|
|
|
|
|
|
|
|
| $ | 2,307,423 |
|
| $ | 2,295,659 |
|
|
| 244.87 |
| % | |
45
MSD Investment Corp.
Consolidated Schedule of Investments - (Continued)
December 31, 2023
(in thousands, except shares)
December 31, 2023 |
| |||||||||||||||||
Derivative Counterparty |
| Settlement Date |
| Amount Purchased |
|
| Amount Sold |
|
| Fair Value |
|
| % of Net Assets |
| ||||
Foreign Currency Forward Contracts |
|
|
|
|
|
|
|
|
|
|
|
|
|
| ||||
Macquarie |
| March 20, 2024 |
| $ | 76,165 |
|
|
| CAD 101,611 |
|
| $ | (663 | ) |
|
| (0.1 | )% |
Macquarie |
| March 20, 2024 |
| $ | 18,870 |
|
|
| GBP 14,904 |
|
| $ | (134 | ) |
|
| (0.0 | )% |
|
|
|
|
|
|
|
|
|
| $ | (797 | ) |
|
| (0.1 | )% | ||
42
46
December 31, 2023 | December 31, 2023 |
| ||||||||||||||||||||||
Investments—non-controlled/non-affiliated |
| Commitment Type |
| Commitment |
| Unfunded |
|
| Fair |
|
| Commitment Type |
| Commitment |
| Unfunded |
|
| Fair |
| ||||
First and Second Lien Debt |
|
|
|
|
|
|
|
| ||||||||||||||||
Candle Media Co Ltd |
| Delayed Draw |
| 6/18/2027 |
| $ | 1,280 |
|
| $ | (63 | ) | ||||||||||||
First Lien Debt |
|
|
|
|
|
|
|
| ||||||||||||||||
Accession Risk Management |
| Delayed Draw |
| 11/1/2029 |
| $ | 40,719 |
|
| $ | (578 | ) | ||||||||||||
Beacon Mobility Corp. |
| Delayed Draw |
| 12/31/2025 |
|
| 592 |
|
|
| (15 | ) | ||||||||||||
Boasso Global |
| Delayed Draw |
| 10/3/2024 |
|
| 1,750 |
|
|
| (19 | ) | ||||||||||||
Boasso Global |
| Revolver |
| 7/1/2026 |
|
| 6,250 |
|
|
| (161 | ) | ||||||||||||
Chromalloy Holdings LLC |
| Revolver |
| 11/23/2027 |
|
| 4,615 |
|
|
| (182 | ) |
| Revolver |
| 11/23/2027 |
|
| 4,615 |
|
|
| (152 | ) |
Circor International, Inc. |
| Revolver |
| 10/18/2029 |
|
| 7,759 |
|
|
| (165 | ) | ||||||||||||
DFS Holding Company |
| Delayed Draw |
| 1/31/2029 |
|
| 3,000 |
|
|
| (30 | ) | ||||||||||||
Faraday Buyer, LLC |
| Delayed Draw |
| 10/11/2028 |
|
| 3,167 |
|
|
| (45 | ) |
| Delayed Draw |
| 10/11/2028 |
|
| 3,514 |
|
|
| (34 | ) |
Foundation Risk Partners |
| Delayed Draw |
| 10/29/2028 |
|
| 45,000 |
|
|
| (435 | ) | ||||||||||||
Frontgrade Technologies Inc. |
| Revolver |
| 1/9/2028 |
|
| 7,211 |
|
|
| (164 | ) | ||||||||||||
Highgate Hotels, L.P. |
| Revolver |
| 10/26/2029 |
|
| 12,500 |
|
|
| (247 | ) | ||||||||||||
LJ Perimeter Buyer, Inc |
| Delayed Draw |
| 10/31/2028 |
|
| 5,538 |
|
|
| (76 | ) |
| Delayed Draw |
| 10/31/2028 |
|
| 3,042 |
|
|
| (10 | ) |
Maxar Technologies Inc. |
| Revolver |
| 5/3/2029 |
|
| 8,587 |
|
|
| (233 | ) | ||||||||||||
Momentive Global |
| Revolver |
| 5/31/2029 |
|
| 5,714 |
|
|
| (69 | ) | ||||||||||||
Natural Partners, Inc. |
| Revolver |
| 3/15/2028 |
|
| 2,813 |
|
|
| (94 | ) |
| Revolver |
| 11/29/2027 |
|
| 2,813 |
|
|
| (39 | ) |
Systems Planning and Analysis, Inc. (fka Management Consulting & Research LLC) |
| Delayed Draw |
| 8/16/2027 |
|
| 4,704 |
|
|
| (134 | ) | ||||||||||||
Systems Planning and Analysis, Inc. (fka Management Consulting & Research LLC) |
| Revolver |
| 8/16/2027 |
|
| 3,136 |
|
|
| (113 | ) | ||||||||||||
PetVet Care Centers |
| Delayed Draw |
| 11/15/2030 |
|
| 6,981 |
|
|
| (68 | ) | ||||||||||||
PetVet Care Centers |
| Revolver |
| 11/15/2029 |
|
| 6,981 |
|
|
| (138 | ) | ||||||||||||
Sandlot Baseball Borrower Co. |
| Delayed Draw |
| 12/27/2028 |
|
| 33,333 |
|
|
| — |
| ||||||||||||
Systems Planning and Analysis, Inc. |
| Delayed Draw |
| 8/16/2027 |
|
| 1,165 |
|
|
| (4 | ) | ||||||||||||
Systems Planning and Analysis, Inc. |
| Revolver |
| 8/16/2027 |
|
| 3,136 |
|
|
| (34 | ) | ||||||||||||
Wood Mackenzie, Inc. |
| Revolver |
| 2/1/2028 |
|
| 2,963 |
|
|
| (29 | ) | ||||||||||||
Total Unfunded Commitments |
|
|
| $ | 25,253 |
|
| $ | (707 | ) |
|
|
| $ | 207,625 |
|
| $ | (2,624 | ) | ||||
The accompanying notes are an integral part of these consolidated financial statements.
4347
MSD Investment Corp.
Consolidated Schedule of Investments
December 31, 20212022
(in thousands, except shares)
Investments (1)(2)(3) | Footnotes |
| Reference Rate |
| Interest Rate Floor |
| Interest Rate (5) |
| Maturity |
| Par |
|
| Cost (7) |
|
| Fair |
|
| Percentage |
|
| ||||
Investments - non-controlled/non-affiliated |
|
|
|
|
|
|
|
|
|
|
|
|
|
|
|
|
|
|
|
|
|
| ||||
First Lien Debt |
|
|
|
|
|
|
|
|
|
|
|
|
|
|
|
|
|
|
|
|
|
| ||||
Aerospace & Defense |
|
|
|
|
|
|
|
|
|
|
|
|
|
|
|
|
|
|
|
|
|
| ||||
Management Consulting & Research LLC | (8) |
| L + 6.00% |
| 1.00% |
| 7.00% |
| 8/16/2027 |
| $ | 10,932 |
|
| $ | 10,714 |
|
| $ | 10,720 |
|
|
| 3.55 |
| % |
Management Consulting & Research LLC - Revolving Credit Facility | (8)(9)(12) |
| L + 6.00% |
| 1.00% |
| 7.00% |
| 8/16/2027 |
|
| — |
|
|
| (62 | ) |
|
| (61 | ) |
|
| (0.02 | ) |
|
The Nordam Group Inc. |
|
| L + 5.00% |
| 0.00% |
| 5.63% |
| 4/9/2026 |
|
| 11,889 |
|
|
| 10,293 |
|
|
| 10,076 |
|
|
| 3.34 |
|
|
|
|
|
|
|
|
|
|
|
|
|
|
|
|
| 20,945 |
|
|
| 20,735 |
|
|
| 6.87 |
|
| |
Automobile |
|
|
|
|
|
|
|
|
|
|
|
|
|
|
|
|
|
|
|
|
|
| ||||
McLaren Finance PLC - Secured Bond | UK(10)(11) |
| N/A |
| N/A |
| 7.50% |
| 8/1/2026 |
|
| 3,565 |
|
|
| 3,611 |
|
|
| 3,610 |
|
|
| 1.20 |
|
|
Chemicals, Plastics & Rubber |
|
|
|
|
|
|
|
|
|
|
|
|
|
|
|
|
|
|
|
|
|
| ||||
Dubois Chemicals Group Inc. | (8) |
| L + 4.50% |
| 0.00% |
| 4.60% |
| 9/30/2026 |
|
| 2,782 |
|
|
| 2,771 |
|
|
| 2,775 |
|
|
| 0.92 |
|
|
Kaman Corp. | (8) |
| L + 5.00% |
| 0.00% |
| 5.10% |
| 8/26/2026 |
|
| 5,700 |
|
|
| 5,672 |
|
|
| 5,671 |
|
|
| 1.88 |
|
|
|
|
|
|
|
|
|
|
|
|
|
|
|
|
| 8,443 |
|
|
| 8,446 |
|
|
| 2.80 |
|
| |
Energy: Oil & Gas |
|
|
|
|
|
|
|
|
|
|
|
|
|
|
|
|
|
|
|
|
|
| ||||
CITGO Holdings Inc. | (9) |
| N/A |
| N/A |
| 9.25% |
| 8/1/2024 |
|
| 26,051 |
|
|
| 25,408 |
|
|
| 26,209 |
|
|
| 8.68 |
|
|
CITGO Petroleum Corp. |
|
| N/A |
| N/A |
| 6.38% |
| 6/15/2026 |
|
| 2,121 |
|
|
| 2,164 |
|
|
| 2,155 |
|
|
| 0.71 |
|
|
Murchison Oil and Gas - First Out Term Loan | (8) |
| L + 9.00% |
| 2.00% |
| 11.00% |
| 10/26/2023 |
|
| 2,682 |
|
|
| 2,746 |
|
|
| 2,682 |
|
|
| 0.89 |
|
|
Murchison Oil and Gas - Last Out Term Loan | (8) |
| L + 8.00% |
| 2.00% |
| 10.00% |
| 10/26/2023 |
|
| 38,333 |
|
|
| 37,059 |
|
|
| 37,060 |
|
|
| 12.27 |
|
|
Saturn Oil and Gas Inc. | CN(8)(10)(11) |
| C + 11.50% |
| 1.00% |
| 12.50% |
| 6/7/2024 |
|
| CAD 42,630 |
|
|
| 32,515 |
|
|
| 32,905 |
|
|
| 10.90 |
|
|
|
|
|
|
|
|
|
|
|
|
|
|
|
|
| 99,892 |
|
|
| 101,011 |
|
|
| 33.45 |
|
| |
Healthcare & Pharmaceuticals |
|
|
|
|
|
|
|
|
|
|
|
|
|
|
|
|
|
|
|
|
|
| ||||
Mallinckrodt International Financing SA | LU(10)(11) |
| L + 5.25% |
| 0.75% |
| 6.00% |
| 9/24/2024 |
|
| 13,720 |
|
|
| 12,859 |
|
|
| 12,814 |
|
|
| 4.24 |
|
|
Hotel, Gaming & Leisure |
|
|
|
|
|
|
|
|
|
|
|
|
|
|
|
|
|
|
|
|
|
| ||||
Viad Corp. | (11) |
| L + 5.00% |
| 0.50% |
| 5.50% |
| 7/30/2028 |
|
| 4,413 |
|
|
| 4,402 |
|
|
| 4,399 |
|
|
| 1.46 |
|
|
Media: Advertising, Printing & Publishing |
|
|
|
|
|
|
|
|
|
|
|
|
|
|
|
|
|
|
|
|
|
| ||||
Patientpoint Network Solutions, LLC | (8) |
| L + 7.00% |
| 1.00% |
| 8.00% |
| 3/7/2025 |
|
| 32,256 |
|
|
| 31,507 |
|
|
| 31,520 |
|
|
| 10.44 |
|
|
Real Betis Balompie SAD - Participation Interest | ES(8)(10)(11) |
| N/A |
| N/A |
| 7.00% |
| 6/5/2025 |
| € | 13,000 |
|
|
| 14,772 |
|
|
| 14,798 |
|
|
| 4.90 |
|
|
|
|
|
|
|
|
|
|
|
|
|
|
|
|
| 46,279 |
|
|
| 46,318 |
|
|
| 15.34 |
|
| |
Media: Diversified & Production |
|
|
|
|
|
|
|
|
|
|
|
|
|
|
|
|
|
|
|
|
|
| ||||
Getty Images Inc. |
|
| L + 4.50% |
| 0.00% |
| 4.63% |
| 2/19/2026 |
|
| 34,456 |
|
|
| 34,301 |
|
|
| 34,463 |
|
|
| 11.41 |
|
|
Candle Media Co Ltd | (8) |
| L + 6.00% |
| 0.75% |
| 6.75% |
| 6/18/2027 |
|
| 40,000 |
|
|
| 39,202 |
|
|
| 39,200 |
|
|
| 12.98 |
|
|
Candle Media Co Ltd - Delayed Draw Term Loan | (8)(9)(12) |
| L + 6.00% |
| 0.00% |
| 6.75% |
| 6/18/2027 |
|
| — |
|
|
| (159 | ) |
|
| (160 | ) |
|
| (0.05 | ) |
|
|
|
|
|
|
|
|
|
|
|
|
|
|
|
| 73,344 |
|
|
| 73,503 |
|
|
| 24.34 |
|
| |
Retail |
|
|
|
|
|
|
|
|
|
|
|
|
|
|
|
|
|
|
|
|
|
| ||||
Guitar Center Inc. |
|
| N/A |
| N/A |
| 8.50% |
| 1/15/2026 |
|
| 4,066 |
|
|
| 4,309 |
|
|
| 4,362 |
|
|
| 1.44 |
|
|
Xponential Fitness LLC | (8)(11) |
| L + 6.50% |
| 1.00% |
| 7.50% |
| 2/28/2025 |
|
| 21,241 |
|
|
| 20,995 |
|
|
| 21,019 |
|
|
| 6.96 |
|
|
|
|
|
|
|
|
|
|
|
|
|
|
|
|
| 25,304 |
|
|
| 25,381 |
|
|
| 8.40 |
|
| |
Services: Business |
|
|
|
|
|
|
|
|
|
|
|
|
|
|
|
|
|
|
|
|
|
| ||||
Muine Gall, LLC | (8)(9)(11) |
| N/A |
| N/A |
| 7.50% PIK |
| 9/21/2024 |
|
| 42,244 |
|
|
| 42,261 |
|
|
| 42,297 |
|
|
| 14.01 |
|
|
Investments (1)(2)(3) | Footnotes |
| Reference Rate and Spread (4) |
| Interest Rate Floor |
| Interest Rate (5) |
| Maturity Date |
| Par Amount / Shares (6) |
|
| Cost (7) |
|
| Fair Value |
|
| Percentage of Net Assets |
|
| ||||
Investments - non-controlled/non-affiliated |
|
|
|
|
|
|
|
|
|
|
|
|
|
|
|
|
|
|
|
|
|
| ||||
First Lien Debt |
|
|
|
|
|
|
|
|
|
|
|
|
|
|
|
|
|
|
|
|
|
| ||||
Aerospace & Defense |
|
|
|
|
|
|
|
|
|
|
|
|
|
|
|
|
|
|
|
|
|
| ||||
Chromalloy Holdings LLC | (8) |
| S + 7.00% |
| 1.00% |
| 11.32% |
| 11/23/2028 |
|
| 50,000 |
|
| $ | 48,025 |
|
| $ | 48,027 |
|
|
| 9.97 |
| % |
Chromalloy Holdings LLC - Revolving Credit Facility | (8)(9)(12) |
| S + 7.00% |
| 1.00% |
| 11.32% |
| 11/23/2027 |
|
| — |
|
|
| (181 | ) |
|
| (182 | ) |
|
| (0.04 | ) |
|
Systems Planning and Analysis, Inc. | (8)(15) |
| S + 6.15% |
| 1.00% |
| 10.94% |
| 8/16/2027 |
|
| 10,823 |
|
|
| 10,637 |
|
|
| 10,433 |
|
|
| 2.17 |
|
|
Systems Planning and Analysis, Inc. - Revolving Credit Facility | (8)(9)(12)(15) |
| S + 6.15% |
| 1.00% |
| 10.74% |
| 8/16/2027 |
|
| — |
|
|
| (51 | ) |
|
| (113 | ) |
|
| (0.02 | ) |
|
Systems Planning and Analysis, Inc. - Delayed Draw Term Loan | (8)(9)(12)(15) |
| S + 6.15% |
| 0.00% |
| 10.94% |
| 8/16/2027 |
|
| 2,011 |
|
|
| 1,956 |
|
|
| 1,805 |
|
|
| 0.37 |
|
|
The Nordam Group Inc. |
|
| L + 5.50% |
| 0.00% |
| 9.94% |
| 4/9/2026 |
|
| 11,767 |
|
|
| 10,491 |
|
|
| 9,119 |
|
|
| 1.89 |
|
|
|
|
|
|
|
|
|
|
|
|
|
|
|
|
| 70,877 |
|
|
| 69,089 |
|
|
| 14.34 |
|
| |
Automobile |
|
|
|
|
|
|
|
|
|
|
|
|
|
|
|
|
|
|
|
|
|
| ||||
McLaren Finance PLC | UK(10)(11) |
| N/A |
| N/A |
| 7.50% |
| 8/1/2026 |
|
| 2,689 |
|
|
| 2,717 |
|
|
| 1,984 |
|
|
| 0.41 |
|
|
Beverage, Food & Tobacco |
|
|
|
|
|
|
|
|
|
|
|
|
|
|
|
|
|
|
|
|
|
| ||||
LJ Perimeter Buyer, Inc. | (8) |
| S + 6.65% |
| 1.00% |
| 10.74% |
| 10/31/2028 |
|
| 19,462 |
|
|
| 18,888 |
|
|
| 18,902 |
|
|
| 3.92 |
|
|
LJ Perimeter Buyer, Inc. - Delayed Draw Term Loan | (8)(9)(12) |
| S + 6.65% |
| 1.00% |
| 11.24% |
| 10/31/2028 |
|
| — |
|
|
| (78 | ) |
|
| (76 | ) |
|
| (0.01 | ) |
|
|
|
|
|
|
|
|
|
|
|
|
|
|
|
| 18,810 |
|
|
| 18,826 |
|
|
| 3.91 |
|
| |
Capital Equipment |
|
|
|
|
|
|
|
|
|
|
|
|
|
|
|
|
|
|
|
|
|
| ||||
Faraday Buyer, LLC | (8) |
| S + 7.00% |
| 1.00% |
| 11.32% |
| 10/10/2028 |
|
| 34,833 |
|
|
| 33,812 |
|
|
| 33,817 |
|
|
| 7.02 |
|
|
Faraday Buyer, LLC - Delayed Draw Term Loan | (8)(9)(12) |
| S + 7.00% |
| 1.00% |
| 11.32% |
| 10/11/2028 |
|
| — |
|
|
| (44 | ) |
|
| (45 | ) |
|
| (0.01 | ) |
|
Trillium FlowControl | LU(8)(10)(11) |
| S + 5.61% |
| 1.00% |
| 9.94% |
| 6/28/2026 |
|
| 17,910 |
|
|
| 17,744 |
|
|
| 16,919 |
|
|
| 3.51 |
|
|
|
|
|
|
|
|
|
|
|
|
|
|
|
|
| 51,512 |
|
|
| 50,691 |
|
|
| 10.52 |
|
| |
Chemicals, Plastics & Rubber |
|
|
|
|
|
|
|
|
|
|
|
|
|
|
|
|
|
|
|
|
|
| ||||
Dubois Chemicals Group Inc. | (8) |
| S + 4.50% |
| 0.00% |
| 8.92% |
| 9/30/2026 |
|
| 2,754 |
|
|
| 2,745 |
|
|
| 2,588 |
|
|
| 0.53 |
|
|
Hexion Holdings Corporation |
|
| S + 4.65% |
| 0.50% |
| 8.93% |
| 3/15/2029 |
|
| 9,950 |
|
|
| 9,224 |
|
|
| 8,517 |
|
|
| 1.77 |
|
|
|
|
|
|
|
|
|
|
|
|
|
|
|
|
| 11,969 |
|
|
| 11,105 |
|
|
| 2.30 |
|
| |
Energy: Oil & Gas |
|
|
|
|
|
|
|
|
|
|
|
|
|
|
|
|
|
|
|
|
|
| ||||
CITGO Holdings Inc. | (9) |
| N/A |
| N/A |
| 9.25% |
| 8/1/2024 |
|
| 26,051 |
|
|
| 25,640 |
|
|
| 26,155 |
|
|
| 5.43 |
|
|
CITGO Petroleum Corp. |
|
| N/A |
| N/A |
| 6.38% |
| 6/15/2026 |
|
| 2,121 |
|
|
| 2,156 |
|
|
| 2,036 |
|
|
| 0.42 |
|
|
Saturn Oil and Gas Inc. | CN(8)(10)(11) |
| C + 11.50% |
| 1.00% |
| 16.36% |
| 7/6/2025 |
|
| CAD 56,817 |
|
|
| 43,486 |
|
|
| 40,861 |
|
|
| 8.48 |
|
|
|
|
|
|
|
|
|
|
|
|
|
|
|
|
| 71,282 |
|
|
| 69,052 |
|
|
| 14.33 |
|
| |
Healthcare & Pharmaceuticals |
|
|
|
|
|
|
|
|
|
|
|
|
|
|
|
|
|
|
|
|
|
| ||||
Bayer Environmental Services |
|
| S + 4.38% |
| 0.50% |
| 7.97% |
| 8/4/2029 |
|
| 20,000 |
|
|
| 18,422 |
|
|
| 18,185 |
|
|
| 3.77 |
|
|
Charlotte Buyer, Inc. |
|
| S + 5.25% |
| 0.00% |
| 9.53% |
| 2/11/2028 |
|
| 33,333 |
|
|
| 31,119 |
|
|
| 31,514 |
|
|
| 6.54 |
|
|
Mallinckrodt International Financing SA | LU(10)(11) |
| L + 5.25% |
| 0.75% |
| 9.99% |
| 9/30/2027 |
|
| 2,676 |
|
|
| 2,525 |
|
|
| 2,012 |
|
|
| 0.42 |
|
|
Natural Partners, Inc. | (8) |
| L + 6.00% |
| 1.00% |
| 9.57% |
| 3/15/2028 |
|
| 38,149 |
|
|
| 37,481 |
|
|
| 36,874 |
|
|
| 7.65 |
|
|
Natural Partners, Inc. - Revolving Credit Facility | (8)(9)(12) |
| L + 6.00% |
| 1.00% |
| 11.14% |
| 3/15/2028 |
|
| — |
|
|
| (48 | ) |
|
| (94 | ) |
|
| (0.02 | ) |
|
|
|
|
|
|
|
|
|
|
|
|
|
|
|
| 89,499 |
|
|
| 88,491 |
|
|
| 18.36 |
|
| |
High Tech Industries |
|
|
|
|
|
|
|
|
|
|
|
|
|
|
|
|
|
|
|
|
|
| ||||
Watchguard Technologies, Inc. |
|
| S + 5.25% |
| 0.75% |
| 9.57% |
| 7/2/2029 |
|
| 34,913 |
|
|
| 32,717 |
|
|
| 33,272 |
|
|
| 6.91 |
|
|
Hotel, Gaming & Leisure |
|
|
|
|
|
|
|
|
|
|
|
|
|
|
|
|
|
|
|
|
|
| ||||
Chuck E. Cheese |
|
| N/A |
| N/A |
| 6.75% |
| 5/1/2026 |
|
| 17,534 |
|
|
| 16,385 |
|
|
| 16,263 |
|
|
| 3.38 |
|
|
TouchTunes | (8) |
| S + 5.25% |
| 0.50% |
| 8.98% |
| 4/2/2029 |
|
| 29,925 |
|
|
| 29,644 |
|
|
| 29,102 |
|
|
| 6.04 |
|
|
Viad Corp. | (11) |
| L + 5.00% |
| 0.50% |
| 9.38% |
| 7/30/2028 |
|
| 4,369 |
|
|
| 4,359 |
|
|
| 4,107 |
|
|
| 0.85 |
|
|
|
|
|
|
|
|
|
|
|
|
|
|
|
|
| 50,388 |
|
|
| 49,472 |
|
|
| 10.27 |
|
| |
48
44
MSD Investment Corp.
Consolidated Schedule of Investments - (Continued)
December 31, 20212022
(in thousands, except shares)
Investments (1)(2)(3) | Footnotes |
| Reference Rate |
| Interest Rate Floor |
| Interest Rate (5) |
| Maturity |
| Par |
|
| Cost (7) |
|
| Fair |
|
| Percentage |
|
| ||||
First Lien Debt (continued) |
|
|
|
|
|
|
|
|
|
|
|
|
|
|
|
|
|
|
|
|
|
| ||||
Services: Consumer |
|
|
|
|
|
|
|
|
|
|
|
|
|
|
|
|
|
|
|
|
|
| ||||
Spring Education Group Inc. |
|
| L + 4.25% |
| 0.00% |
| 4.47% |
| 7/30/2025 |
|
| 29,059 |
|
|
| 27,815 |
|
|
| 27,997 |
|
|
| 9.27 |
|
|
Vision Purchaser Corp. | (8) |
| L + 6.25% |
| 1.50% |
| 7.75% |
| 6/10/2025 |
|
| 29,247 |
|
|
| 28,679 |
|
|
| 28,735 |
|
|
| 9.51 |
|
|
|
|
|
|
|
|
|
|
|
|
|
|
|
|
| 56,494 |
|
|
| 56,732 |
|
|
| 18.78 |
|
| |
Telecommunications |
|
|
|
|
|
|
|
|
|
|
|
|
|
|
|
|
|
|
|
|
|
| ||||
Innovate Corp. | (11) |
| N/A |
| N/A |
| 8.50% |
| 2/1/2026 |
|
| 24,000 |
|
|
| 24,060 |
|
|
| 24,144 |
|
|
| 7.99 |
|
|
Intelsat Jackson Holdings SA | LU(10)(11) |
| N/A |
| N/A |
| 8.63% |
| 1/2/2024 |
|
| 4,000 |
|
|
| 4,007 |
|
|
| 3,992 |
|
|
| 1.32 |
|
|
Ligado Networks LLC | (9) |
| N/A |
| N/A |
| 15.50% PIK |
| 11/1/2023 |
|
| 10,208 |
|
|
| 8,660 |
|
|
| 8,373 |
|
|
| 2.77 |
|
|
|
|
|
|
|
|
|
|
|
|
|
|
|
|
| 36,727 |
|
|
| 36,509 |
|
|
| 12.08 |
|
| |
Wholesale |
|
|
|
|
|
|
|
|
|
|
|
|
|
|
|
|
|
|
|
|
|
| ||||
Dealer Tire LLC |
|
| L + 4.25% |
| 0.00% |
| 4.35% |
| 12/12/2025 |
|
| 24,376 |
|
|
| 24,224 |
|
|
| 24,339 |
|
|
| 8.06 |
|
|
FleetPride Inc. |
|
| L + 4.50% |
| 0.00% |
| 4.60% |
| 2/4/2026 |
|
| 29,974 |
|
|
| 29,919 |
|
|
| 29,950 |
|
|
| 9.92 |
|
|
|
|
|
|
|
|
|
|
|
|
|
|
|
|
| 54,143 |
|
|
| 54,289 |
|
|
| 17.98 |
|
| |
Total First Lien Debt |
|
|
|
|
|
|
|
|
|
|
|
|
|
| 484,704 |
|
|
| 486,044 |
|
|
| 160.95 |
| % | |
Second Lien Debt |
|
|
|
|
|
|
|
|
|
|
|
|
|
|
|
|
|
|
|
|
|
| ||||
Chemicals, Plastics and Rubber |
|
|
|
|
|
|
|
|
|
|
|
|
|
|
|
|
|
|
|
|
|
| ||||
Kaman Corp. | (8)(9) |
| L + 9.00% |
| 0.00% |
| 9.13% |
| 8/13/2027 |
|
| 37,763 |
|
|
| 35,130 |
|
|
| 35,119 |
|
| 11.63 |
|
| |
Consumer goods: Non-durable |
|
|
|
|
|
|
|
|
|
|
|
|
|
|
|
|
|
|
|
|
|
| ||||
Protective Industrial Products Inc. | (8) |
| L + 8.25% |
| 1.00% |
| 9.25% |
| 12/30/2028 |
|
| 25,777 |
|
|
| 25,136 |
|
|
| 25,293 |
|
|
| 8.38 |
|
|
Hotel, Gaming & Leisure |
|
|
|
|
|
|
|
|
|
|
|
|
|
|
|
|
|
|
|
|
|
| ||||
Mohegan Gaming & Entertainment | (9) |
| N/A |
| N/A |
| 8.00% |
| 2/1/2026 |
|
| 11,378 |
|
|
| 11,605 |
|
|
| 11,947 |
|
|
| 3.96 |
|
|
Services: Business |
|
|
|
|
|
|
|
|
|
|
|
|
|
|
|
|
|
|
|
|
|
| ||||
Trace3 Inc. | (8)(9) |
| L + 7.50% |
| 0.50% |
| 8.00% |
| 10/6/2029 |
|
| 33,750 |
|
|
| 32,835 |
|
|
| 32,842 |
|
|
| 10.87 |
|
|
Services: Consumer |
|
|
|
|
|
|
|
|
|
|
|
|
|
|
|
|
|
|
|
|
|
| ||||
Midwest Veterinary Partners LLC | (8) |
| L + 7.50% |
| 0.75% |
| 8.25% |
| 4/26/2029 |
|
| 40,000 |
|
|
| 40,186 |
|
|
| 40,195 |
|
|
| 13.31 |
|
|
Total Second Lien Debt |
|
|
|
|
|
|
|
|
|
|
|
|
|
| 144,892 |
|
|
| 145,396 |
|
|
| 48.15 |
| % | |
Unsecured Debt |
|
|
|
|
|
|
|
|
|
|
|
|
|
|
|
|
|
|
|
|
|
| ||||
Transportation: Consumer |
|
|
|
|
|
|
|
|
|
|
|
|
|
|
|
|
|
|
|
|
|
| ||||
Vistajet Malta Finance PLC | (9)(11) |
| N/A |
| N/A |
| 10.50% |
| 6/1/2024 |
|
| 33,757 |
|
|
| 36,093 |
|
|
| 36,220 |
|
|
| 11.99 |
|
|
Total Unsecured Debt |
|
|
|
|
|
|
|
|
|
|
|
|
|
| 36,093 |
|
|
| 36,220 |
|
|
| 11.99 |
| % | |
Preferred Equity |
|
|
|
|
|
|
|
|
|
|
|
|
|
|
|
|
|
|
|
|
|
| ||||
Consumer goods: Non-durable |
|
|
|
|
|
|
|
|
|
|
|
|
|
|
|
|
|
|
|
|
|
| ||||
Protective Industrial Products Inc. - Series A Preferred | (8)(9) |
|
|
|
|
| 13.00% PIK |
|
|
|
| 25,171 |
|
|
| 25,043 |
|
|
| 24,697 |
|
|
| 8.18 |
|
|
Total Preferred Equity |
|
|
|
|
|
|
|
|
|
|
|
|
|
| 25,043 |
|
|
| 24,697 |
|
|
| 8.18 |
|
| |
Total Investments - non-controlled/non-affiliated |
|
|
|
|
|
|
|
|
|
|
|
|
| $ | 690,732 |
|
| $ | 692,357 |
|
|
| 229.27 |
| % | |
Cash and Cash Equivalents |
|
|
|
|
|
|
|
|
|
|
|
|
|
|
|
|
|
|
|
|
|
| ||||
Cash and Cash Equivalents | (13) |
|
|
|
|
|
|
|
|
|
|
|
|
| 12,203 |
|
|
| 12,203 |
|
|
| 4.04 |
|
| |
Total Cash and Cash Equivalents |
|
|
|
|
|
|
|
|
|
|
|
|
|
| 12,203 |
|
|
| 12,203 |
|
|
| 4.04 |
|
| |
Total Portfolio Investments, Cash and Cash Equivalents |
|
|
|
|
|
|
|
|
|
|
|
|
| $ | 702,935 |
|
| $ | 704,560 |
|
|
| 233.31 |
| % | |
Investments (1)(2)(3) | Footnotes |
| Reference Rate and Spread (4) |
| Interest Rate Floor |
| Interest Rate (5) |
| Maturity Date |
| Par Amount / Shares (6) |
|
| Cost (7) |
|
| Fair Value |
|
| Percentage of Net Assets |
|
| ||||
Media: Advertising, Printing & Publishing |
|
|
|
|
|
|
|
|
|
|
|
|
|
|
|
|
|
|
|
|
|
| ||||
Patientpoint Network Solutions, LLC | (8) |
| S + 7.26% |
| 1.00% |
| 11.84% |
| 3/7/2025 |
|
| 31,931 |
|
|
| 31,397 |
|
|
| 31,183 |
|
|
| 6.47 |
|
|
Real Betis Balompie SAD - Participation Interest | ES(8)(10)(11) |
| N/A |
| N/A |
| 7.00% |
| 6/5/2025 |
|
| 13,000 |
|
|
| 14,764 |
|
|
| 13,917 |
|
|
| 2.89 |
|
|
|
|
|
|
|
|
|
|
|
|
|
|
|
|
| 46,161 |
|
|
| 45,100 |
|
|
| 9.36 |
|
| |
Media: Diversified & Production |
|
|
|
|
|
|
|
|
|
|
|
|
|
|
|
|
|
|
|
|
|
| ||||
FilmRise Acquisitions, LLC | (8)(9) |
| N/A |
| N/A |
| 13.50% |
| 9/17/2025 |
|
| 18,086 |
|
|
| 18,094 |
|
|
| 18,043 |
|
|
| 3.75 |
|
|
Getty Images Inc. | (8) |
| L + 4.50% |
| 0.00% |
| 8.94% |
| 2/19/2026 |
|
| 18,902 |
|
|
| 18,841 |
|
|
| 18,855 |
|
|
| 3.91 |
|
|
Candle Media Co Ltd | (8) |
| L + 6.00% |
| 0.75% |
| 10.38% (Incl 4.00% PIK) |
| 6/18/2027 |
|
| 41,687 |
|
|
| 40,994 |
|
|
| 39,217 |
|
|
| 8.14 |
|
|
Candle Media Co Ltd - Delayed Draw Term Loan | (8)(9)(12) |
| L + 6.00% |
| 0.75% |
| 10.38% (Incl 4.00% PIK) |
| 6/18/2027 |
|
| 15,239 |
|
|
| 14,998 |
|
|
| 14,273 |
|
|
| 2.96 |
|
|
|
|
|
|
|
|
|
|
|
|
|
|
|
|
| 92,927 |
|
|
| 90,388 |
|
|
| 18.76 |
|
| |
Metals & Mining |
|
|
|
|
|
|
|
|
|
|
|
|
|
|
|
|
|
|
|
|
|
| ||||
Conuma Coal Resources LTD | CN(9)(10)(11) |
| N/A |
| N/A |
| 10.00% |
| 5/1/2023 |
|
| 3,181 |
|
|
| 3,180 |
|
|
| 3,153 |
|
|
| 0.65 |
|
|
Retail |
|
|
|
|
|
|
|
|
|
|
|
|
|
|
|
|
|
|
|
|
|
| ||||
Xponential Fitness LLC | (8)(11) |
| L + 6.50% |
| 1.00% |
| 10.67% |
| 2/28/2025 |
|
| 22,759 |
|
|
| 22,563 |
|
|
| 22,873 |
|
|
| 4.75 |
|
|
Services: Business |
|
|
|
|
|
|
|
|
|
|
|
|
|
|
|
|
|
|
|
|
|
| ||||
Muine Gall, LLC | (8)(9)(11) |
| L + 7.00% |
| 0.50% |
| 12.15% PIK |
| 9/21/2024 |
|
| 46,047 |
|
|
| 46,063 |
|
|
| 46,308 |
|
|
| 9.61 |
|
|
Travelport Finance (Luxembourg) S.A.R.L. | LU(10)(11) |
| S + 8.75% |
| 1.00% |
| 13.48% (Incl 7.25% PIK) |
| 2/28/2025 |
|
| 31,346 |
|
|
| 31,036 |
|
|
| 31,342 |
|
|
| 6.50 |
|
|
|
|
|
|
|
|
|
|
|
|
|
|
|
|
| 77,099 |
|
|
| 77,650 |
|
|
| 16.11 |
|
| |
Services: Consumer |
|
|
|
|
|
|
|
|
|
|
|
|
|
|
|
|
|
|
|
|
|
| ||||
CSC Serviceworks | (9) |
| L + 4.00% |
| 0.75% |
| 8.39% |
| 3/4/2028 |
|
| 222 |
|
|
| 201 |
|
|
| 186 |
|
|
| 0.04 |
|
|
Spring Education Group Inc. |
|
| L + 4.00% |
| 0.00% |
| 8.73% |
| 7/30/2025 |
|
| 46,750 |
|
|
| 44,890 |
|
|
| 45,540 |
|
|
| 9.45 |
|
|
Vision Purchaser Corp. | (8) |
| S + 6.40% |
| 1.00% |
| 10.98% |
| 6/10/2025 |
|
| 28,946 |
|
|
| 28,530 |
|
|
| 26,989 |
|
|
| 5.60 |
|
|
Vision Purchaser Corp. - Incremental Term Loan | (8) |
| S + 6.40% |
| 1.00% |
| 10.98% |
| 6/10/2025 |
|
| 2,523 |
|
|
| 2,484 |
|
|
| 2,353 |
|
|
| 0.49 |
|
|
|
|
|
|
|
|
|
|
|
|
|
|
|
|
| 76,105 |
|
|
| 75,068 |
|
|
| 15.58 |
|
| |
Telecommunications |
|
|
|
|
|
|
|
|
|
|
|
|
|
|
|
|
|
|
|
|
|
| ||||
Innovate Corp. | (11) |
| N/A |
| N/A |
| 8.50% |
| 2/1/2026 |
|
| 24,000 |
|
|
| 24,050 |
|
|
| 17,148 |
|
|
| 3.56 |
|
|
Ligado Networks LLC | (9)(13) |
| N/A |
| N/A |
| 15.50% PIK |
| 11/1/2023 |
|
| 11,928 |
|
|
| 11,071 |
|
|
| 3,853 |
|
|
| 0.80 |
|
|
|
|
|
|
|
|
|
|
|
|
|
|
|
|
| 35,121 |
|
|
| 21,001 |
|
|
| 4.36 |
|
| |
Wholesale |
|
|
|
|
|
|
|
|
|
|
|
|
|
|
|
|
|
|
|
|
|
| ||||
FleetPride Inc. | (8) |
| L + 4.50% |
| 0.00% |
| 8.88% |
| 2/4/2026 |
|
| 21,710 |
|
|
| 21,684 |
|
|
| 21,330 |
|
|
| 4.43 |
|
|
|
|
|
|
|
|
|
|
|
|
|
|
|
|
| 21,684 |
|
|
| 21,330 |
|
|
| 4.43 |
|
| |
Total First Lien Debt |
|
|
|
|
|
|
|
|
|
|
|
|
|
| 774,611 |
|
|
| 748,545 |
|
|
| 155.35 |
| % | |
49
45
MSD Investment Corp.
Consolidated Schedule of Investments - (Continued)
December 31, 20212022
(in thousands, except shares)
Investments (1)(2)(3) | Footnotes |
| Reference Rate and Spread (4) |
| Interest Rate Floor |
| Interest Rate (5) |
| Maturity Date |
| Par Amount / Shares (6) |
|
| Cost (7) |
|
| Fair Value |
|
| Percentage of Net Assets |
|
| ||||
Second Lien Debt |
|
|
|
|
|
|
|
|
|
|
|
|
|
|
|
|
|
|
|
|
|
| ||||
Chemicals, Plastics & Rubber |
|
|
|
|
|
|
|
|
|
|
|
|
|
|
|
|
|
|
|
|
|
| ||||
Hexion Holdings Corporation | (8)(9) |
| S + 7.54% |
| 0.50% |
| 11.86% |
| 3/15/2030 |
|
| 35,000 |
|
|
| 34,091 |
|
|
| 27,300 |
|
|
| 5.67 |
|
|
Consumer goods: Non-durable |
|
|
|
|
|
|
|
|
|
|
|
|
|
|
|
|
|
|
|
|
|
| ||||
Protective Industrial Products Inc. | (8) |
| L + 8.25% |
| 1.00% |
| 12.63% |
| 12/30/2028 |
|
| 34,199 |
|
|
| 33,415 |
|
|
| 31,471 |
|
|
| 6.53 |
|
|
Hotel, Gaming & Leisure |
|
|
|
|
|
|
|
|
|
|
|
|
|
|
|
|
|
|
|
|
|
| ||||
Mohegan Gaming & Entertainment | (9) |
| N/A |
| N/A |
| 8.00% |
| 2/1/2026 |
|
| 16,378 |
|
|
| 16,473 |
|
|
| 15,150 |
|
|
| 3.14 |
|
|
Services: Business |
|
|
|
|
|
|
|
|
|
|
|
|
|
|
|
|
|
|
|
|
|
| ||||
DISA Holdings Corp. | (8) |
| S + 10.00% |
| 0.75% |
| 14.32% |
| 3/9/2029 |
|
| 14,641 |
|
|
| 14,207 |
|
|
| 14,207 |
|
|
| 2.95 |
|
|
DISA Holdings Corp. - Delayed Draw Term Loan | (8)(9) |
| S + 10.00% |
| 0.75% |
| 14.22% |
| 3/9/2029 |
|
| 2,745 |
|
|
| 2,666 |
|
|
| 2,664 |
|
|
| 0.55 |
|
|
Trace3 Inc. | (8)(9) |
| L + 7.50% |
| 0.50% |
| 10.56% |
| 10/8/2029 |
|
| 33,750 |
|
|
| 32,914 |
|
|
| 32,068 |
|
|
| 6.65 |
|
|
|
|
|
|
|
|
|
|
|
|
|
|
|
|
| 49,787 |
|
|
| 48,939 |
|
|
| 10.15 |
|
| |
Services: Consumer |
|
|
|
|
|
|
|
|
|
|
|
|
|
|
|
|
|
|
|
|
|
| ||||
Midwest Veterinary Partners LLC | (8)(9) |
| L + 7.50% |
| 0.75% |
| 11.88% |
| 4/26/2029 |
|
| 50,000 |
|
|
| 50,042 |
|
|
| 47,027 |
|
|
| 9.76 |
|
|
Southern Veterinary Partners LLC | (8)(9) |
| S + 7.85% |
| 1.00% |
| 12.17% |
| 10/5/2028 |
|
| 45,000 |
|
|
| 44,038 |
|
|
| 40,950 |
|
|
| 8.50 |
|
|
Spring Education Group Inc. | (9) |
| L + 8.25% |
| 0.00% |
| 13.02% |
| 7/30/2026 |
|
| 100 |
|
|
| 91 |
|
|
| 89 |
|
|
| 0.02 |
|
|
|
|
|
|
|
|
|
|
|
|
|
|
|
|
| 94,171 |
|
|
| 88,066 |
|
|
| 18.28 |
|
| |
Total Second Lien Debt |
|
|
|
|
|
|
|
|
|
|
|
|
|
| 227,937 |
|
|
| 210,926 |
|
|
| 43.77 |
| % | |
Preferred Equity |
|
|
|
|
|
|
|
|
|
|
|
|
|
|
|
|
|
|
|
|
|
| ||||
Consumer goods: Non-durable |
|
|
|
|
|
|
|
|
|
|
|
|
|
|
|
|
|
|
|
|
|
| ||||
Protective Industrial Products Inc. - Series A Preferred | (8)(9) |
|
|
|
|
| 13.00% PIK |
|
|
|
| 28,646 |
|
|
| 28,519 |
|
|
| 22,267 |
|
|
| 4.62 |
|
|
Total Preferred Equity |
|
|
|
|
|
|
|
|
|
|
|
|
|
| 28,519 |
|
|
| 22,267 |
|
|
| 4.62 |
|
| |
Total Investments - non-controlled/non-affiliated |
|
|
|
|
|
|
|
|
|
|
|
|
| $ | 1,031,067 |
|
| $ | 981,738 |
|
|
| 203.74 |
| % | |
Cash and Cash Equivalents |
|
|
|
|
|
|
|
|
|
|
|
|
|
|
|
|
|
|
|
|
|
| ||||
Cash and Cash Equivalents | (14) |
|
|
|
|
|
|
|
|
|
|
|
| $ | 36,616 |
|
| $ | 36,616 |
|
|
| 7.60 |
| % | |
Total Cash and Cash Equivalents |
|
|
|
|
|
|
|
|
|
|
|
|
|
| 36,616 |
|
|
| 36,616 |
|
|
| 7.60 |
|
| |
Total Portfolio Investments, Cash and Cash Equivalents |
|
|
|
|
|
|
|
|
|
|
|
|
| $ | 1,067,683 |
|
| $ | 1,018,354 |
|
|
| 211.34 |
| % | |
December 31, 2022 |
| |||||||||||||||||
Derivative Counterparty |
| Settlement Date |
| Amount Purchased |
|
| Amount Sold |
|
| Fair Value |
|
| % of Net Assets |
| ||||
Foreign Currency Forward Contracts |
|
|
|
|
|
|
|
|
|
|
|
|
|
| ||||
Goldman Sachs International |
| March 15, 2023 |
| $ | 13,574 |
|
| € | 12,688 |
|
| $ | (78 | ) |
|
| 0.0 | % |
Goldman Sachs International |
| March 15, 2023 |
| $ | 43,460 |
|
|
| CAD 59,121 |
|
| $ | (252 | ) |
|
| (0.1 | )% |
Goldman Sachs International |
| March 15, 2023 |
|
| CAD 3,151 |
|
| $ | 2,336 |
|
| $ | (6 | ) |
|
| 0.0 | % |
|
|
|
|
|
|
|
|
|
| $ | (336 | ) |
|
| (0.1 | )% | ||
50
Investments—non-controlled/non-affiliated |
| Commitment Type |
| Commitment |
| Unfunded |
|
| Fair |
| ||
First and Second Lien Debt |
|
|
|
|
|
|
|
|
|
| ||
Candle Media Co Ltd. |
| Delayed Draw |
| 6/18/2027 |
| $ | 16,000 |
|
| $ | (160 | ) |
Management Consulting & Research LLC |
| Revolver |
| 8/16/2027 |
|
| 3,136 |
|
|
| (61 | ) |
Total Unfunded Commitments |
|
|
|
|
| $ | 19,136 |
|
| $ | (221 | ) |
Investments—non-controlled/non-affiliated |
| Commitment Type |
| Commitment |
| Unfunded |
|
| Fair |
| ||
First Lien Debt |
|
|
|
|
|
|
|
|
|
| ||
Candle Media Co Ltd |
| Delayed Draw |
| 6/18/2027 |
| $ | 1,280 |
|
| $ | (63 | ) |
Chromalloy Holdings LLC |
| Revolver |
| 11/23/2027 |
|
| 4,615 |
|
|
| (182 | ) |
Faraday Buyer, LLC |
| Delayed Draw |
| 10/11/2028 |
|
| 3,167 |
|
|
| (45 | ) |
LJ Perimeter Buyer, Inc |
| Delayed Draw |
| 10/31/2028 |
|
| 5,538 |
|
|
| (76 | ) |
Natural Partners, Inc. |
| Revolver |
| 3/15/2028 |
|
| 2,813 |
|
|
| (94 | ) |
Systems Planning and Analysis, Inc. (fka Management Consulting & Research LLC) |
| Delayed Draw |
| 8/16/2027 |
|
| 4,704 |
|
|
| (134 | ) |
Systems Planning and Analysis, Inc. (fka Management Consulting & Research LLC) |
| Revolver |
| 8/16/2027 |
|
| 3,136 |
|
|
| (113 | ) |
Total Unfunded Commitments |
|
|
|
|
| $ | 25,253 |
|
| $ | (707 | ) |
The accompanying notes are an integral part of these consolidated financial statements.
4651
MSD Investment Corp.
Notes to Consolidated Financial Statements
(in thousands, except share/per share data, percentages and as otherwise noted)
Note 1. Organization
MSD Investment Corp. (together with its consolidated subsidiary,subsidiaries, the “Company”), was originally established as a Delaware limited liability company on February 18, 2021, converted to a Maryland limited liability company named MSD Investment, LLC on October 22, 2021 and converted into a Maryland corporation (the “Corporate Conversion”) effective January 1, 2022, pursuant to the Articles of Conversion filed on December 28, 2021. In connection with the Corporate Conversion the Company changed its name from “MSD Investment, LLC” to “MSD Investment Corp.” As a result of the Corporate Conversion, the issued and outstanding equity interests of MSD Investment, LLC were converted into a corresponding number of shares of common stock, par value $0.001$0.001 per share, of the Company (“(the “Shares,” and each a “Share”), and each holder of equity interests of MSD Investment, LLC became a shareholder of the Company (collectively the “Shareholders”). The Company is structured as an externally managed, non-diversified closed-end investment company. On December 29, 2021, the Company elected to be regulated as a business development company (“BDC”) under the Investment Company Act of 1940, as amended (the “1940 Act”). In addition, the Company has elected, and intends to qualify annually, to be treated for U.S. federal income tax purposes, as a regulated investment company (“RIC”), as defined under Subchapter M of the Internal Revenue Code of 1986, as amended (the “Code”).
On January 1, 2023, MSD Partners, L.P., a Delaware limited partnership (“MSD”) completed a previously announced business combination with BDT & Company Holdings, L.P. (the “Transaction”), and its subsidiaries, which includes BDT Capital Partners, LLC (“BDT Capital”), an SEC-registered investment adviser, and BDT & MSD Partners, LLC, an SEC registered broker-dealer and member of the Financial Industry Regulatory Authority (“FINRA”). Upon the closing of the Transaction, BDT & Company Holdings, L.P. was renamed BDT & MSD Holdings, L.P. (“BDT”) and BDT, and its subsidiaries, became affiliates of the Adviser (as defined below) and the Company. BDT, together with BDT Capital, MSD and their affiliated entities, are collectively referred to as “BDT & MSD.”
The Company’s investment objective is to invest in a broad range of portfolio companies, primarily through senior secured loans and notes where we believe the probability of losses are limited and the opportunity to generate attractive risk adjusted returns is maximized. The Adviser (as defined below) expects to execute this strategy by continuing its long history of leveraging its network to source and diligence what it believes to be attractive opportunities across a broad range of industries. The strategy will be executed by a team of experienced investment professionals who have more than a 20-year history of successfully deploying capital in both liquid and illiquid investments.
TheOn November 24, 2021, the Company has entered into an investment advisory agreement (the “OriginalAdvisory Agreement”) with MSD Partners, L.P., a Delaware limited partnership (the(in its capacity as the Company’s investment adviser, the “Adviser”) under which the Adviser providesprovided certain investment advisory and management services to the Company. Additionally, the company haspreviously entered into an administrative services agreement (the “OriginalAdministration Agreement”) with MSD Partners, L.P. (in thisits capacity as the Company’s administrator, the “Administrator” and, collectively in its role as the Adviser “MSD”) under which the Administrator providesprovided certain administrative and other services necessary for the Company to operate.
On October 19, 2022,Effective January 1, 2023, the AdviserCompany entered into a definitive business combinationnew investment advisory agreement with BDT & Company Holdings, L.P. (“BDT(the “Advisory Agreement”), by and between the Company and the Adviser, and a new administrative agreement (the “Administration Agreement” and together with the Original Advisory Agreement, the “New Agreements”), by and between the Company and the Administrator. The terms of the New Agreements are substantially identical to those of the Original Advisory Agreement and Original Administrative Agreement, except that the reimbursement required to be made to the Administrator by the Company pursuant to which the two companies agreed to combine their respective businesses to create an advisory and investment firmAdministration Agreement will be capped such that the amounts will seek to servenot exceed 0.15% of total gross assets of the needs of family- and founder-led business owners and strategic, long-term investors.Company in any one calendar year.
MSD BDC SPV I, LLC (“SPV I”) is a Delaware limited liability company formed on June 14, 2021 and commenced operations on December 21, 2021, the date the first investment transaction closed. MSD BDC SPV I’sII, LLC (“SPV II”) is a Delaware limited liability company formed on January 4, 2023 and commenced operations on March 31, 2023. MSD BDC CLO I, LLC (“CLO I” and together with SPV I, and SPV II, the “SPVs” ) is a Delaware limited liability company formed on August 18, 2023 and commenced operations on November 15, 2023. The SPV’s investment objectives are the same as the Company. SPV I is aCompany’s. The SPV’s are wholly owned subsidiarysubsidiaries of the Company and isare consolidated in these consolidated financial statements, in accordance with the Company’s consolidation policy discussed in Note 22. Significant Account Policies.
The Company may from time to time conduct a private offering (each a “Private Offering”) of its common shares of beneficial interestShares (i) to accredited investors, as defined in Regulation D under the Securities Act of 1933, as amended (the “1933 Act”), and (ii) in the case of Shares sold outside the United States, to persons that are not “U.S. persons,” as defined in Regulation S under the 1933 Act, in reliance on exemptions from the registration requirements of the 1933 Act. At each closing of the Private Offering, each investor makes a capital commitment (“Capital Commitments”) to purchase Shares of the beneficial interest of the Company pursuant to a subscription agreement entered into with the Company. Investors are required to fund drawdowns to purchase the Company’s Shares up to the amount of their Capital Commitments on an as-needed basis each time the Company delivers a notice to investors.
The first closing date of a Private Offering (the “Initial Closing Date”) took place on December 21, 2021. Additional closings are expected to occur from time to time as determined by the Company (each, a “Subsequent Closing”), and the final such closing (the “Final Closing”) will occur no later than the fifth anniversary of the Initial Closing Date, subject to a one-year extension at the discretion of the Board of Directors of the Company (the “Board”) (the “Commitment Period”). The proceeds received at the Initial Closing Date of the sale of Shares hereunder were used to acquire the initial portfolio of the Company from several funds managed by the Adviser or its affiliates prior to the Corporate Conversion. Following the Initial Closing Date, proceeds from the sale of Shares were used to acquire investments in accordance with the Company’s investment guidelines and for other permitted purposes.
On November 29, 2023, the Company issued 250 shares of its 12.0% Series A Cumulative Preferred Stock (the “Series A Preferred Stock”) for an aggregate offering price of $0.75 million. Each individual investor in the offering was entitled to purchase only one share of Series A Preferred Stock. Each holder of Series A Preferred Shares is entitled to a liquidation preference of $3,000.00 per share (the “Liquidation Value”), plus additional amounts as set forth in the Articles Supplementary to the Company’s Articles of Incorporation Relating to the 12.0% Series A Cumulative Preferred Stock. With respect to distributions, including the payment of dividends and distribution of the Company’s assets upon dissolution, liquidation, or winding up, the Series A Preferred Stock will be senior to all other classes and series of the Company’s common shares, whether such class or series is now existing or is created in the future, to
52
the extent of the aggregate Liquidation Value and all accrued but unpaid dividends and any applicable redemption premium on the Series A Preferred Stock. Holders of shares of the Series A Preferred Stock will not, however, participate in any appreciation in the value of the Company. See “Part I. Item 1. Business — The Private Offering, Series A Preferred Stock” in this Annual Report on Form 10-K.
Note 2. Significant Accounting Policies
Basis of Presentation
Management has determined that the Company meets the definition of an investment company and adheres to the accounting and reporting guidance in Accounting Standards Codification (“ASC”) Topic 946, Financial Services – Investment Companies (“ASC 946”) issued by the Financial Accounting Standards Board (“FASB”). Accounting principles generally accepted in the United States of America (“U.S. GAAP”) for an investment company requires investments to be recorded at fair value.
The accompanying consolidated financial statements and related financial information have been prepared in accordance with U.S. GAAP and pursuant to the requirements for reporting on Form 10-K and Regulation S-X under the 1933 Act.
Use of Estimates
The preparation of consolidated financial statements in conformity with U.S. GAAP requires management to make estimates and assumptions that affect (i) the reported amounts of assets and liabilities at the date of the financial statements, (ii) the reported amounts of income and expenses during the reportedreporting period and (iii) disclosure of contingent assets and liabilities at the date of the consolidated financial statements. Actual results could differ materially from those estimates under different assumptions and conditions.
47
Basis of Consolidation
As provided under ASC 946, the Company will not consolidate its investment in a company other than an investment company subsidiary or a controlled operating company whose business consists of providing services to the Company. Accordingly, the Company consolidatedconsolidates the results of its wholly-owned subsidiary.subsidiaries. All intercompany balances and transactions have been eliminated.
Cash and Cash Equivalents
Cash and cash equivalents consist of demand deposits and highly liquid investments, such as money market funds, with original maturities of 90 days or less. Cash and cash equivalents are carried at cost, which approximates fair value. The Company deposits its cash and cash equivalents with financial institutions and, at times, these deposits may exceed the Federal Deposit Insurance Corporation insured limit.
Restricted Cash
Restricted cash consists of cash collateral that hashad been pledged to cover obligations of the Company according to its derivative contracts and demand deposits held at Goldman Sachs International.International, in addition to cash funded to escrow for prefunding deals. Management believes the credit risk related to its demand deposits is minimal.
Investments
Investments
Investment transactions are recorded on the trade date. Realized gains or losses are measured by the difference between the net proceeds received from a sale or paydown and the amortized cost basis of the investment using the specific identification method without regard to unrealized gains or losses previously recognized, and include investments charged off during the period, net of recoveries. The net change in unrealized gains or losses primarily reflects the change in investment values, including the reversal of previously recorded unrealized gains or losses with respect to investments realized during the period.
Valuation of Investments
The Company measures the value of its investments in accordance with ASC Topic 820, Fair Value Measurement and Disclosures (“ASC 820”). Fair value is the price that would be received to sell an asset or paid to transfer a liability in an orderly transaction between market participants at the measurement date. Market participants are defined as buyers and sellers in the principal or most advantageous market (which may be a hypothetical market) that are independent, knowledgeable and willing and able to transact. In accordance with ASC 820, the Company considers its principal market to be the market that has the greatest volume and level of activity.
ASC 820 defines hierarchical levels of fair value that prioritize and rank the level of observability of inputs used in determination of fair value. These levels are summarized below:
53
In certain cases, the inputs used to measure fair value may fall within different levels of the fair value hierarchy. In such cases, an investment’s level within the fair value hierarchy is based on the lowest level of input that is significant to the fair value measurement. Depending on the relative liquidity in the markets for certain investments, the Company may transfer investments to Level 3 if it determines that observable quoted prices, obtained directly or indirectly, are severely limited, or not available, or otherwise not reliable. Transfers between levels, if any, are recognized at the beginning of the quarter in which the transfer occurs. The Company’s assessment of the significance of a particular input to the fair value measurement requires judgment, and the consideration of factors specific to the investment.
Under procedures established by the Board, the Company intends to value investments for which market quotations are readily available at such market quotations. Assets listed on an exchange will be valued at their last sales prices as reported to the consolidated quotation service at 4:00 p.m. eastern timeEastern Time on the date of determination. If no such sales of such securities occurred, such securities will be valued at the bid price as reported by an independent, third-party pricing service on the date of determination. Debt and equity securities that are not publicly traded or whose market prices are not readily available will be valued at fair value as determined by the Adviser as the Company's valuation designee (in such capacity, the “Valuation Designee”), subject to the oversight and approvaloverall supervision of the Board. Such determination of fair values may involve subjective judgments and estimates, although the Company will also engage independent valuation providers to review the valuation of each investment that constitutes a material portion of the Company’s portfolio and that does not have a readily available market quotation at least once annually. With respect to unquoted securities, the Adviser,Valuation Designee, together with any independent valuation advisers, and subject to the oversight of the Board, will fair value each investment considering, among other measures, discounted cash flow models, comparisons of financial ratios of peer companies that are public and other factors. The types of factors that may be considered in determining the fair values of investments include, but are not limited to, the nature and realizable value of any collateral, the portfolio company’s ability to make payments and its earnings. The Company intends to retain one or more independent providers of financial advisory services to assist the AdviserValuation Designee and the Board by performing certain third-party valuation services. The Company may appoint additional or different third-party valuation firms in the future.
When an external event such as a purchase transaction, public offering or subsequent equity sale occurs with respect to a fair-valued portfolio company or comparable company, the BoardValuation Designee will use the pricing indicated by the external event to corroborate and/or assist the Company in the valuation of such portfolio company. Because the Company expects that there will not be readily available market quotations for many of the investments in its portfolio, the Company
48
expects to value many of its investments at fair value as determined in good faith by the board of directorsValuation Designee using a documented valuation policy and a consistently applied valuation process. Due to the inherent uncertainty of determining the fair value of investments that do not have a readily available market value,quotation, the fair value of the Company’s investments may differ significantly from the values that would have been used had readily available market quotations existed for such investments, and the differences could be material.
On a quarterly basis, with respect to investments for which market quotations are not readily available, the AdviserValuation Designee will undertake a multi-step valuation process, as described below:
The Company utilizes several valuation techniques that use unobservable pricing inputs and assumptions in determining the fair value of its Level 3 investments. The valuation techniques, as well as the key unobservable inputs that have a significant impact on the Company’s investments classified and valued as Level 3 in the valuation hierarchy, are described in Note 6. Fair Value Measurements. The unobservable inputs and assumptions may differ by asset and in the application of the Company's valuation methodologies. The reported fair value estimates could vary materially if the Company had chosen to incorporate different unobservable inputs and assumptions.
All values assigned to investments by the procedures established by the Board will be binding on all Company investors. When pricing of the Company’s Shares is necessary outside of the normal quarterly process, the Adviser will, among other things, review whether, to its knowledge, significant events have occurred since the last quarterly valuation which might affect the fair value of any of the Company's portfolio investments.
The determination of fair value involves subjective judgementsjudgments and estimates. Due to the inherent uncertainty of determining the fair value of portfolio investments that do not have a readily available market value,quotation, the fair value of investments may differ materially from the values that would have been determined had a readily available market valuequotation existed for such investments. Further, such investments are generally less liquid than publicly traded securities. If the Company was required to liquidate a portfolio investment that does not have a readily available market valuequotation in a forced or liquidation sale, the Company could realize significantly less value than the value recorded by the Company.
Securities and Exchange Commission (“SEC”) Disclosure Update and Simplification
In December 2020, theThe SEC adopted a new rule providing a framework for fund valuation practices. New Rule 2a-5 under the 1940 Act (“Rule 2a-5”) establishesestablished requirements for determining fair value in good faith for purposes of the 1940 Act. Rule 2a-5 will permitpermits (but does not require) boards, subject to board oversight and certain other conditions, to designate certain parties to perform fair value determinations. Rule 2a-5 also defines when market quotations are “readily available” for purposes of the 1940 Act and the threshold for determining whether a fund must determine the fair value of a security. The SEC also adopted new Rule 31a-4 under the 1940 Act (“Rule 31a-4”), which provides the recordkeeping requirements associated with fair value determinations. Finally,On August 3, 2023, the SEC is rescinding previously issued guidance on related issues, including the role of the board in determining fair value and the accounting and auditing of fund investments. Rule 2a-5 and Rule 31a-4 became effective on March 8, 2021, and had a compliance date of September 8, 2022. While our Board has not elected to designate the Adviser as the valuation designee,
54
Company’s Valuation Designee, which became effective for the quarter ended September 30, 2023. The Company has adopted certain revisions to its valuation policies and procedures in order to comply with the applicable requirements of Rule 2a-5 and Rule 31a-4.
Receivables/Payables From Investments Sold/Purchased
Receivables/payables from investments sold/purchased consist of amounts receivable or payable by the Company for transactions that have not settled at the reporting date.
Foreign Currency Transactions
Amounts denominated in foreign currencies are translated into U.S. dollars on the following basis: (i) investments and other assets and liabilities denominated in foreign currencies are translated into U.S. dollars based upon currency exchange rates effective on the last business day of the period; and (ii) purchases and sales of investments, borrowings and repayments of such borrowings, income, and expenses denominated in foreign currencies are translated into U.S. dollars based upon currency exchange rates prevailing on the transaction dates.
The Company includes net changes in fair values on investments held resulting from foreign exchange rate fluctuations in translation of assets and liabilities in foreign currencies on the consolidated statementsConsolidated Statements of operations,Operations, if any. Foreign security and currency translations may involve certain considerations and risks not typically associated with investing in U.S. companies and U.S. government securities. These risks include, but are not limited to, currency fluctuations and revaluations and future adverse political, social and economic developments, which could cause investments in foreign markets to be less liquid and prices more volatile than those of comparable U.S. companies or U.S. government securities.
Derivative Instruments
Derivative instruments solely consist of foreign currency forward contracts. All derivative instruments as assets or liabilities are recognized at fair value in the consolidated financial statements. Foreign currency forward contracts are not designated as hedging instruments, and as a result, changes in fair value through net change in unrealized appreciation (depreciation) on foreign currency forward contracts are presented in the consolidated statementsConsolidated Statements of operations.
49
Operations. Realized gains and losses that occur upon the cash settlement of the foreign currency forward contracts are included in net realized gains (losses) on foreign currency forward contracts on the consolidated statementsConsolidated Statements of operations.Operations.
Revenue Recognition
Interest Income
Interest income is recorded on an accrual basis and includes the accretion of discounts and amortizationsamortization of premiums. Discounts from and premiums to par value on debt investments purchased are accreted/amortized into interest income over the life of the respective security using the effective interest method. The amortized cost of debt investments represents the original cost, including loan origination fees and upfront fees received that are deemed to be an adjustment to yield, adjusted for the accretion of discounts and amortization of premiums, if any. Upon prepayment of a loan or debt security, any prepayment premiums are recorded as interest income in the current period.
The Company has investments in its portfolio that contain PIK provisions. PIK represents interest that is accrued and recorded at the contractual rates, increases the loan principal on the respective capitalization dates, and is generally due at maturity. Such income is included in interest income in the consolidated statementConsolidated Statement of operations.Operations. If at any point the Company believes PIK is not expected to be realized, the investment generating PIK will be placed on non-accrual status. When a PIK investment is placed on non-accrual status, the accrued, uncapitalized income is generally reversed through interest income. To maintain the Company’s status as a RIC after the Corporate Conversion, this non-cash source of income must be paid out to shareholders in the form of dividends, even though the Company has not yet collected cash.
If the portfolio company's valuation indicates the value of the PIK security is not sufficient to cover the contractual PIK interest, the Company will not accrue additional PIK interest income and will record an allowance for any accrued PIK interest receivable as a reduction of interest income in the period the Company determines it is not collectible.
Debt investments are generally placed on non-accrual status when interest payments are at least 90 days past due or there is reasonable doubt that principal or interest will be collected. Accrued interest is generally reversed when a loan is placed on non-accrual status. Additionally, any original issue discount and market discount are no longer accreted to interest income as of the date the loan is placed on non-accrual status. Interest payments received on non-accrual loans may be recognized as income or applied to principal depending upon management’s judgment regarding collectability. Non-accrual loans are restored to accrual status when past due principal and interest is paid current and, in management’s judgment, are likely to remain current. Management may make exceptions to this treatment and determine to not place a loan on non-accrual status if the loan has sufficient collateral value and is in the process of collection.
Dividend Income
Dividend income on preferred equity securities is recorded on thean accrual basis to the extent that such amounts are payable by the portfolio company and are expected to be collected. Dividend income on common equity securities is recorded on the record date for private portfolio companies or on the ex-dividend date for publicly-traded portfolio companies.
Other Income
The Company may receive various fees in the ordinary course of business such as structuring, consent, waiver, amendment, syndication fees as well as fees for managerial assistance rendered by the Company to the portfolio companies. Such fees are recognized as income when earned or the services are rendered.
Organization Expenses and Offering Expenses
Costs associated with the organization of the Company were expensed on the Company's consolidated statement of operations as incurred. These expenses consist primarily of legal fees and other costs of forming and organizing the Company.
55
Costs associated with the offering of the Company’s Shares, and any additional expenses for other offerings, are capitalized and included in prepaid expenses and other assets on the consolidated statement of assets and liabilities and amortized over a twelve-month period beginning with the commencement of operations or the point in time when the cost was incurred if after the commencement of operations. These expenses consist primarily of legal fees and other costs incurred in connection with the Company’s Private Offering of its Shares.
Deferred Financing Costs and Debt Issuance Costs
Deferred financing and debt issuance costs represent fees and other direct incremental costs incurred in connection with the Company’s borrowings. These expenses are deferred and amortized into interest expense over the life of the related debt instrument using the straight-line method. Debt issuance costs are presented in the consolidated statement of assets and liabilities as a direct deduction of the debt liability to which the costs pertain.
Income Taxes
The Company has elected to be regulated as a BDC under the 1940 Act. The Company has elected, and intends to electqualify annually, to be treated for U.S. federal income tax purposes as a RIC under the Code. So long as the Company maintains its statustax treatment as a RIC, it generally will not pay corporate-levelbe subject to U.S. federal income taxes on any ordinary income or capital gains that it distributes at least annually to its shareholders as dividends. Rather, any tax liability related to income earned and distributed by the Company would represent obligations of the Company’s investors and would not be reflected in the consolidated financial statements of the Company.
To qualify for and maintain qualification as a RIC, the Company must, among other things, meet certain source-of-income and asset diversification requirements. In addition, to qualify for RIC tax treatment, the Company must distribute to its shareholders, for each taxable year, at least 90% of the sum of (i) its “investment company taxable income” for that year (without regard to the deduction for dividends paid), which is generally its ordinary income plus the excess, if any, of its realized net short-term capital gains over its realized net long-term capital losses and (ii) its net tax-exempt income.
The Company is generally subject to a 4% nondeductible federal excise tax if it does not distribute to its shareholders in a timely manner in each taxable year an amount at least equal to the sum of (i) 98% of its ordinary income for the calendar year, (ii) 98.2% of capital gain net income (both long-term and short-term) for the one-year period ending October 31 in that calendar year and (iii) any income realized, but not distributed, in prior years.
50
The Company follows ASC 740, Income Taxes (“ASC 740”). ASC 740 provides guidance for how uncertain tax positions should be recognized, measured, presented and disclosed in the financial statements. ASC 740 requires the Company to evaluate tax positions taken or expected to be taken in the course of preparing its consolidated financial statements to determine whether the tax positions are “more-likely-than-not” to be sustained by the applicable tax authority. Tax positions not deemed to meet the “more-likely-than-not” threshold are reserved and recorded as a tax benefit or expense in the current year. All penalties and interest associated with income taxes are included in income tax expense. Conclusions regarding tax positions are subject to review and may be adjusted at a later date based on factors including, but not limited to, on-going analyses of tax laws, regulations and interpretations thereof.
The Company’s tax returns are subject to tax examination by major taxing authorities for a period of three years from when they are filed. The Company is additionally not aware of any tax positions for which it is reasonably possible that the total amounts of unrecognized tax benefits will change materially in the next twelve months. As a result, no income tax liability or expense has been recorded on the accompanying consolidated financial statements as of both December 31, 20222023 and December 31, 2021.2022. The Company recognizes interest and penalties, if any, related to unrecognized tax benefits as income tax expense on the consolidated statement of operations. During the year ended December 31, 2022,2023, the Company did notnot incur any interest or penalties.
Prior to the Corporate Conversion, the Company was treated as a partnership for U.S. federal income tax purposes and incurred no U.S. federal, state, city, or foreign income tax liability on income earned during that period. Instead, each partner reported his or her share of the Company's income, capital gain/(loss) and credit on his or her own tax return. Consequently, no provision for income taxes had been recorded in the consolidated financial statements.
Distributions
Distributions
To the extent that the Company has taxable income available, the Company intends to make quarterly distributions to its Shareholders. Distributions to Shareholders are recorded on the record date. All distributions will be paid at the discretion of the Board and will depend on the Company's earnings, financial condition, maintenance of the Company's tax treatment as a RIC, compliance with applicable BDC regulations and such other factors as the Board may deem relevant from time to time.
Recent Accounting Pronouncements
In March 2020, the FASB issued Accounting Standards Update 2020-04 (“ASU 2020-04”) “Reference Rate Reform (Topic 848): Facilitation of the Effects of Reference Rate Reform on Financial Reporting.” This accounting update provides optional accounting relief to entities with contracts, hedge accounting relationships or other transactions that reference the LIBOR or other interest rate benchmarks for which the referenced rate is expected to be discontinued or replaced. This optional relief generally allows for contract modifications solely related to the replacement of the reference rate to be accounted for as a continuation of the existing contract instead of as an extinguishment of the contract, and would therefore not trigger certain accounting impacts that would otherwise be required. The optional relief can be applied beginning January 1, 2020 and ending December 31, 2022.
In January 2021, the FASB issued Accounting Standards Update 2021-01 (“ASU 2021-01”), Reference Rate Reform (Topic 848), which expanded the scope of Topic 848 to include derivative instruments impacted by discounting transition. On March 12, 2020, the FASB issued Accounting Standards Update 2020-04 (“ASU 2020-04”) to ease the potential burden in accounting for reference rate reform. ASU 2020-04 and ASU 2021-01 are effective for all entities through December 31, 2022. On December 21, 2022, the FASB issued Accounting Standards Update 2022-06 (”ASU 2022-06“) to defer the sunset date of ASC 848 until December 31, 2024. The expedients and exceptions provided by the amendments do not apply to contract modifications and hedging relationships entered into or evaluated after December 31, 2024, except for hedging transactions as of December 31, 2024, that an entity has elected certain optional expedients for and that are retained through the end of the hedging relationship. The Company has evaluated and will continue to evaluate the adoption of ASU 2020-04, 2021-01 and 2021-012022-06 and determined it has no material impact on its consolidated financial statements at this time.
56
Initial Portfolio Acquisition
Commencing on the Initial Closing Date and concluding prior to the Company's election to be regulated as a BDC, the Company completed its purchase of a portfolio of investments (the “Initial Portfolio”) pursuant to agreements entered into with several funds managed by the Adviser (the “Initial Portfolio Acquisition”). Subsequent to the Initial Portfolio Acquisition the Company elected to be regulated as a BDC.
Investment Advisory Agreement
On November 24, 2021, the Company entered into the Original Advisory Agreement with the Adviser, pursuantAdviser. Effective January 1, 2023, the Company entered into the Advisory Agreement. The terms of the Advisory Agreement are substantially identical to whichthose of the Original Advisory Agreement. Pursuant to the Advisory Agreement the Adviser managesis responsible for managing the investment and reinvestment of the assets of the Company, subject to the supervision of the Board, in accordance with the investment objective, policies and restrictions that are set forth in the Company’s registration statement on a day-to-day basis.Form 10. The Adviser is also responsible for originating prospective investments, conducting research and due diligence investigations on potential investments, analyzing investment opportunities, negotiating and structuring the Company’s investments and monitoring its investments and portfolio companies on an ongoing basis. For its services, the Adviser is entitled to receive a base management fee and an incentive fee as set forth in the Advisory Agreement.
The Advisory Agreement may be terminated at any time, without the payment of any penalty upon 60 days' written notice, by the vote of a majority of the Board, or by a majority of the holders of our outstanding voting securities, in accordance with the requirements of the 1940 Act, or by the Adviser. Additionally, the Advisory Agreement will automatically terminate in event of an assignment.assignment as defined in the 1940 Act. Unless earlier terminated, the Advisory Agreement will remain in effect for a period of two years from November 24, 2021January 1, 2023 and will remain in effect year to year thereafter if approved annually (i) by a majority of the Board who are not “interested persons” according toas defined in section 2(a)(19) of the 1940 Act (each an “Independent Director”) and (ii) the Board or the holders of a majority of the Company's outstanding voting securities.
From time to time, the Adviser may pay amounts owed by the Company to third-party providers of goods and services, and the Company will subsequently reimburse the Adviser for such amounts paid on its behalf. Amounts payable to the Adviser are settled in the normal course of business without formal payment termsterms.
The Company pays the Adviser a fee for its services under the Advisory Agreement consisting of two components: a management fee (the “Management Fee”) and an incentive fee (the “Incentive Fee”). The cost of both the Management Fee and the Incentive Fee will ultimately be borne by the Shareholders.
Management Fee
The Management Fee is payable quarterly in arrears and shall be calculated as follows:
51
For purposes of the Advisory Agreement, gross assets means the Company’s total assets determined on a consolidated basis in accordance with U.S. GAAP, including assets purchased with borrowed amounts. For avoidance of a doubt total assets does not include any undrawn Capital Commitments. For the first calendar quarter in which the Company had operations, gross assets were measured as the average of gross assets at the Initial Drawdown Date and at the end of such first calendar quarter. The Management Fee will be appropriately adjusted for any share issuances or repurchases during the applicable period. If an Exchange Listing occurs on a date other than the first day of a calendar quarter, the management fee will be calculated for such calendar quarter at a weighted rate calculated based on the fee rates applicable before and after the Exchange Listing based on the number of days in such calendar quarter before and after the Exchange Listing.
Incentive Fees
The incentive fee consists of two components that are determined independently of each other, with the result that one component may be payable even if the other is not. One component is based on income (the “Income-Based Fee”) and the other component is based on capital gains (the “Capital Gains Fee”), each as described below:
The Company pays the Income-Based Fee with respect to the pre-incentive fee net investment income in each calendar quarter as follows:
57
These calculations are prorated for any period of less than three months and adjusted for any share issuances or repurchases during the relevant quarter.
The Capital Gains Fee will be determined and payable in arrears as of the end of each calendar year in an amount equal to 15%15% of realized capital gains, if any, on a cumulative basis from inception through the end of each calendar year, computed net of all realized capital losses and unrealized capital depreciation on a cumulative basis, less the aggregate amount of any previously paid capital gain incentive fees as calculated in accordance with U.S. GAAP. The Company will accrue, but will not pay, a capital gains incentive fee with respect to unrealized appreciation because a capital gains incentive fee would be owed to the Adviser if the Company were to sell the relevant investment and realize a capital gain.
Administration Agreement
On November 24, 2021, the Company entered into the Original Administration Agreement with the Administrator. Effective January 1, 2023, the Company entered into the Advisory Agreement. Under the terms of the Administration Agreement, the Administrator provides, or oversees the performance of, administrative and compliance services, including, but not limited to, maintaining financial records, overseeing the calculation of NAV, compliance monitoring (including diligence and oversight of the Company’s other service providers), preparing reports to Shareholders and reports filed with the United States SEC, preparing materials and coordinating meetings of the Board, managing the payment of expenses and the performance of administrative and professional services rendered by others and providing office space, equipment and office services. The Administrator may also offer to provide, on the Company’s behalf, managerial assistance to the Company’s portfolio companies. The terms of the Administration Agreement are substantially similar to the Original Administration Agreement, except that the reimbursements required to be made to the Administrator by the Company will be capped such that the amounts will not exceed an amount of 0.15% of the total gross assets of the Company in any one calendar year. Under the Administration Agreement, the Administrator furnishes the Company with office facilities and equipment and provides clerical, bookkeeping, recordkeeping and other administrative services at such facilities.
The Administration Agreement may be terminated at any time, without the payment of any penalty upon 60 days' written notice, by a vote of the outstanding voting securities of the Company, by the vote of a majority of the Board, or by the Administrator. Unless earlier terminated, the Investment AdvisoryAdministration Agreement will remain in effect for a period of two years from November 24, 2021January 1, 2023 and will remain in effect year to year thereafter if approved annually (i) by a majority of the Independent Directors and (ii) the Board or the holders of a majority of the Company's outstanding voting securities.securities
For providing these services, the Company will reimburse the Administrator for its costs, expenses and allocable portion of overhead (including rent, office equipment and utilities) and other expenses incurred by the Administrator in performing its administrative obligations under the Administration Agreement, including but not limited to: (i) the Company’s chief compliance officer, chief financial officer and their respective staffs; (ii) investor relations, legal, information technology, operations and other non-investment professionals at the Administrator that perform duties for the Company; and (iii) any internal audit group personnel of MSD or any of its affiliates.affiliates, subject to the limitations described in the Administration Agreement.
Co-Investment Transactions Exemptive Relief
The Company was granted an SEC exemptive order which grants the Company exemptive relief permitting the Company subject to the satisfaction of specific conditions and requirements, to co-invest in privately negotiated investment transactions with certain affiliates of the Adviser.
License Agreement
The Company has entered into a license agreement (the “License Agreement”), pursuant to which the Adviser has granted the Company a non-exclusive license to use the name “MSD.” Under the License Agreement, the Company has a right to use the MSD name for so long as the Adviser or one of its affiliates remains the Company’s investment adviser. Other than with respect to this limited license, the Company will have no legal right to the “MSD” name or logo.
52
The following table presents the related party fees, expenses and transactions for the yearyears ended December 31, 2023 and December 31, 2022 and for the period ended December 31, 2021:
Related Party |
| Source Agreement & Description | For the Year Ended December 31, 2022 |
|
| For the Period Ended December 31, 2021 (1) |
|
| Source Agreement & Description | For the Year Ended December 31, 2023 |
|
| For the Year Ended December 31, 2022 |
|
| For the Period Ended December 31, 2021 (1) |
| |||||
|
| Consolidated statement of operations: |
|
|
|
|
|
| Consolidated statement of operations: |
|
|
|
|
|
|
| ||||||
Adviser |
| Advisory Agreement - management fees | $ | 6,327 |
|
| $ | 155 |
|
| Advisory Agreement - management fees | $ | 11,535 |
|
| $ | 6,327 |
|
| $ | 155 |
|
Adviser |
| Advisory Agreement - income based incentive fee |
| 6,900 |
|
|
| 56 |
|
| Advisory Agreement - income based incentive fee |
| 16,950 |
|
|
| 6,900 |
|
|
| 56 |
|
Adviser |
| Advisory Agreement - board of directors' fees |
| 290 |
|
|
| 11 |
|
| Advisory Agreement - board of directors' fees |
| 310 |
|
|
| 290 |
|
|
| 11 |
|
Adviser |
| Advisory Agreement - capital gains incentive fee |
| (256 | ) |
|
| 256 |
|
| Advisory Agreement - capital gains incentive fee |
| — |
|
|
| (256 | ) |
|
| 256 |
|
Administrator |
| Administration Agreement - Administrative expense |
| 1,571 |
|
|
| — |
|
| Administration Agreement - administration expense |
| 1,862 |
|
|
| 1,571 |
|
|
| — |
|
Note 4. Investments
The composition of the Company’s investment portfolio at amortized cost and fair value as of December 31, 20222023 and December 31, 20212022 was as follows:
|
| December 31, 2022 |
|
| December 31, 2021 |
|
|
| December 31, 2023 |
|
| December 31, 2022 |
| |||||||||||||||||||||||||||||||||||||
|
| Amortized Cost |
|
| Fair Value |
|
| % of Total Investments at Fair Value |
|
| Amortized Cost |
|
| Fair Value |
|
| % of Total Investments at Fair Value |
|
|
| Amortized Cost |
|
| Fair Value |
|
| % of Total Investments at Fair Value |
|
| Amortized Cost |
|
| Fair Value |
|
| % of Total Investments at Fair Value |
| |||||||||||||
First lien debt |
| $ | 774,611 |
|
| $ | 748,545 |
|
|
| 76.25 |
| % |
| $ | 484,704 |
|
| $ | 486,044 |
|
|
| 70.20 |
| % |
| $ | 1,942,665 |
|
| $ | 1,942,843 |
|
|
| 88.43 | % |
| $ | 774,611 |
|
| $ | 748,545 |
|
|
| 76.25 | % |
Second lien debt |
|
| 227,937 |
|
|
| 210,926 |
|
|
| 21.48 |
|
|
| 144,892 |
|
|
| 145,396 |
|
|
| 21.00 |
|
|
|
| 234,306 |
|
|
| 226,318 |
|
|
| 10.30 |
|
|
| 227,937 |
|
|
| 210,926 |
|
|
| 21.48 |
| |
Unsecured debt |
|
| — |
|
|
| — |
|
|
| 0.00 |
|
|
| 36,093 |
|
|
| 36,220 |
|
|
| 5.23 |
|
| |||||||||||||||||||||||||
Preferred equity |
|
| 28,519 |
|
|
| 22,267 |
|
|
| 2.27 |
|
|
| 25,043 |
|
|
| 24,697 |
|
|
| 3.57 |
|
|
|
| 31,846 |
|
|
| 27,892 |
|
|
| 1.27 |
|
|
| 28,519 |
|
|
| 22,267 |
|
|
| 2.27 |
| |
Total investments |
| $ | 1,031,067 |
|
| $ | 981,738 |
|
|
| 100.00 |
| % |
| $ | 690,732 |
|
| $ | 692,357 |
|
|
| 100.00 |
| % |
| $ | 2,208,817 |
|
| $ | 2,197,053 |
|
|
| 100.00 | % |
| $ | 1,031,067 |
|
| $ | 981,738 |
|
|
| 100.00 | % |
58
The industry composition of investments at fair value as of December 31, 20222023 and December 31, 20212022 was as follows:
|
| December 31, 2022 |
|
| December 31, 2021 |
|
|
| December 31, 2023 |
|
| December 31, 2022 |
| ||||||
Aerospace & Defense |
|
| 7.04 |
| % |
|
| 2.99 |
| % |
|
| 6.06 | % |
|
| 7.04 | % | |
Automobile |
|
| 0.20 |
|
|
| 0.52 |
|
|
|
| 0.05 |
|
|
| 0.20 |
| ||
Banking, Finance, Insurance & Real Estate |
|
| 4.81 |
|
|
| — |
| |||||||||||
Beverage, Food & Tobacco |
|
| 1.92 |
|
|
| — |
|
|
|
| 0.97 |
|
|
| 1.92 |
| ||
Capital Equipment |
|
| 5.16 |
|
|
| — |
|
|
|
| 5.26 |
|
|
| 5.16 |
| ||
Chemicals, Plastics & Rubber |
|
| 3.91 |
|
|
| 6.29 |
|
|
|
| 1.88 |
|
|
| 3.91 |
| ||
Consumer goods: Durable |
|
| 1.80 |
|
|
| — |
| |||||||||||
Consumer goods: Non-durable |
|
| 5.47 |
|
|
| 7.22 |
|
|
|
| 2.79 |
|
|
| 5.47 |
| ||
Energy: Oil & Gas |
|
| 7.03 |
|
|
| 14.59 |
|
|
|
| 3.50 |
|
|
| 7.03 |
| ||
Healthcare & Pharmaceuticals |
|
| 9.01 |
|
|
| 1.85 |
|
|
|
| 8.87 |
|
|
| 9.01 |
| ||
High Tech Industries |
|
| 3.39 |
|
|
| — |
|
|
|
| 3.59 |
|
|
| 3.39 |
| ||
Hotel, Gaming & Leisure |
|
| 6.58 |
|
|
| 2.36 |
|
|
|
| 10.14 |
|
|
| 6.58 |
| ||
Media: Advertising, Printing & Publishing |
|
| 4.60 |
|
|
| 6.69 |
|
|
|
| 3.33 |
|
|
| 4.60 |
| ||
Media: Diversified & Production |
|
| 9.21 |
|
|
| 10.62 |
|
|
|
| 3.48 |
|
|
| 9.21 |
| ||
Metals & Mining |
|
| 0.32 |
|
|
| — |
|
|
|
| — |
|
|
| 0.32 |
| ||
Retail |
|
| 2.33 |
|
|
| 3.67 |
|
|
|
| 7.60 |
|
|
| 2.33 |
| ||
Services: Business |
|
| 12.90 |
|
|
| 10.85 |
|
|
|
| 12.82 |
|
|
| 12.90 |
| ||
Services: Consumer |
|
| 16.62 |
|
|
| 14.01 |
|
|
|
| 7.16 |
|
|
| 16.62 |
| ||
Telecommunications |
|
| 2.14 |
|
|
| 5.27 |
|
|
|
| 8.33 |
|
|
| 2.14 |
| ||
Transportation: Cargo |
|
| 2.94 |
|
|
| — |
| |||||||||||
Transportation: Consumer |
|
| — |
|
|
| 5.23 |
|
|
|
| 3.56 |
|
|
| — |
| ||
Wholesale |
|
| 2.17 |
|
|
| 7.84 |
|
|
|
| 1.06 |
|
|
| 2.17 |
| ||
Total |
|
| 100.00 |
| % |
|
| 100.00 |
| % |
|
| 100.00 | % |
|
| 100.00 | % | |
53
The geographic composition of investments at cost and fair value as of December 31, 20222023 and December 31, 20212022 was as follows:
|
| December 31, 2023 |
| |||||||||||||
|
| Amortized Cost |
|
| Fair Value |
|
| % of Total Investments at Fair Value |
|
| Fair Value as % of Net Assets |
| ||||
United States |
| $ | 2,016,083 |
|
| $ | 2,005,820 |
|
|
| 91.30 | % |
|
| 213.95 | % |
Canada |
|
| 74,803 |
|
|
| 74,817 |
|
|
| 3.40 |
|
|
| 7.98 |
|
Luxembourg |
|
| 70,104 |
|
|
| 68,145 |
|
|
| 3.10 |
|
|
| 7.27 |
|
United Kingdom |
|
| 47,827 |
|
|
| 48,271 |
|
|
| 2.20 |
|
|
| 5.15 |
|
Total |
| $ | 2,208,817 |
|
| $ | 2,197,053 |
|
|
| 100.00 | % |
|
| 234.35 | % |
| December 31, 2022 |
| ||||||||||||||
| Amortized Cost |
|
| Fair Value |
|
| % of Total Investments at Fair Value |
|
| Fair Value as % of Net Assets |
| |||||
United States |
| $ | 915,615 |
|
| $ | 871,550 |
|
|
| 88.78 | % |
|
| 180.88 | % |
Canada |
|
| 46,666 |
|
|
| 44,014 |
|
|
| 4.48 |
|
|
| 9.13 |
|
Luxembourg |
|
| 51,305 |
|
|
| 50,273 |
|
|
| 5.12 |
|
|
| 10.43 |
|
Spain |
|
| 14,764 |
|
|
| 13,917 |
|
|
| 1.42 |
|
|
| 2.89 |
|
United Kingdom |
|
| 2,717 |
|
|
| 1,984 |
|
|
| 0.20 |
|
|
| 0.41 |
|
Total |
| $ | 1,031,067 |
|
| $ | 981,738 |
|
|
| 100.00 | % |
|
| 203.74 | % |
As of both December 31, 2023 and December 31, 2022, one loan in the portfolio was on non-accrual status.
|
| December 31, 2021 |
|
| |||||||||||||
|
| Amortized Cost |
|
| Fair Value |
|
| % of Total Investments at Fair Value |
|
| Fair Value as % of Net Assets |
|
| ||||
United States |
| $ | 622,968 |
|
| $ | 624,238 |
|
|
| 90.16 |
| % |
| 206.71 |
| % |
Canada |
|
| 32,515 |
|
|
| 32,905 |
|
|
| 4.75 |
|
|
| 10.90 |
|
|
Luxembourg |
|
| 16,866 |
|
|
| 16,806 |
|
|
| 2.43 |
|
|
| 5.56 |
|
|
Spain |
|
| 14,772 |
|
|
| 14,798 |
|
|
| 2.14 |
|
|
| 4.90 |
|
|
United Kingdom |
|
| 3,611 |
|
|
| 3,610 |
|
|
| 0.52 |
|
|
| 1.20 |
|
|
Total |
| $ | 690,732 |
|
| $ | 692,357 |
|
|
| 100.00 |
| % |
| 229.27 |
| % |
As of December 31, 2022 and December 31, 2021, one and zero loans in the portfolio were on non-accrual status, respectively.
As of December 31, 2022,2023, on a fair value basis, approximately 87.7%96.3% of our performing debt investments bore interest at a floating rate and approximately 12.3%3.7% of our performing debt investments bore interest at a fixed rate.
As of December 31, 2021,2022, on a fair value basis, approximately 80.9%87.7% of our performing debt investments bore interest at a floating rate and approximately 19.1%12.3% of our performing debt investments bore interest at a fixed rate.
Note 5. Derivative Instruments
The Company may enter into foreign currency forward contracts from time to time to facilitate the settlement of purchases and sales of investments denominated in foreign currencies and to economically hedge the impact that an adverse change in foreign exchange rates would have on the value of investments
59
denominated in foreign currencies. A foreign currency forward contract is a commitment to purchase or sell a foreign currency at a future date at a negotiated forward rate. These contracts are marked-to-market by recognizing the difference between the contract forward exchange rate and the forward market exchange rate on the last day of the period presented as unrealized appreciation or depreciation. Realized gains or losses are recognized when forward contracts are settled. Risks arise as a result of the potential inability of the counterparties to meet the terms of their contracts; we attempt to limit counterparty risk by only dealing with well-known counterparties and those that it believeswe believe have the financial resources to honor their obligations. The foreign currency forward contracts open at the end of the period are generally indicative of the volume of activity during the period.
The following tables present the open foreign currency forward contracts as of December 31, 2023 and December 31, 2022:
December 31, 2022 |
| |||||||||||||||||||||||||||||||||||||||||||
December 31, 2023 | December 31, 2023 |
| ||||||||||||||||||||||||||||||||||||||||||
Foreign Currency |
| Settlement Date |
| Statement Location |
| Counterparty |
| Amount Transacted |
|
| Notional Value at Settlement |
|
| Notional Value at Period End |
|
| Fair Value |
|
| Settlement Date |
| Statement of Assets and Liabilities Location |
| Counterparty |
| Amount Transacted |
|
| Notional Value at Settlement |
|
| Notional Value at Period End |
|
| Fair Value |
| ||||||||
EUR |
| March 15, 2023 |
| Unrealized depreciation on foreign currency forward contracts |
| Goldman Sachs International |
| € | 12,688 |
|
| $ | 13,574 |
|
| $ | 13,652 |
|
| $ | (78 | ) | ||||||||||||||||||||||
CAD |
| March 15, 2023 |
| Unrealized depreciation on foreign currency forward contracts |
| Goldman Sachs International |
|
| CAD 59,121 |
|
|
| 43,460 |
|
|
| 43,712 |
|
|
| (252 | ) |
| March 20, 2024 |
| Unrealized depreciation on foreign currency forward contracts |
| Macquarie |
|
| CAD 101,611 |
|
| $ | 76,165 |
|
| $ | 76,828 |
|
| $ | (663 | ) |
CAD |
| March 15, 2023 |
| Unrealized depreciation on foreign currency forward contracts |
| Goldman Sachs International |
|
| CAD (3,151) |
|
|
| (2,336 | ) |
|
| (2,330 | ) |
|
| (6 | ) | ||||||||||||||||||||||
GBP |
| March 20, 2024 |
| Unrealized depreciation on foreign currency forward contracts |
| Macquarie |
|
| GBP 14,904 |
|
| $ | 18,870 |
|
| $ | 19,004 |
|
| $ | (134 | ) | ||||||||||||||||||||||
Total |
|
|
| $ | 54,698 |
|
| $ | 55,034 |
|
| $ | (336 | ) |
|
|
| $ | 95,034 |
|
| $ | 95,831 |
|
| $ | (797 | ) | ||||||||||||||||
December 31, 2022 |
| |||||||||||||||||||||
Foreign Currency |
| Settlement Date |
| Statement of Assets and Liabilities Location |
| Counterparty |
| Amount Transacted |
|
| Notional Value at Settlement |
|
| Notional Value at Period End |
|
| Fair Value |
| ||||
EUR |
| March 15, 2023 |
| Unrealized depreciation on foreign currency forward contracts |
| Goldman Sachs International |
| € | 12,688 |
|
| $ | 13,574 |
|
| $ | 13,652 |
|
| $ | (78 | ) |
CAD |
| March 15, 2023 |
| Unrealized depreciation on foreign currency forward contracts |
| Goldman Sachs International |
|
| CAD 59,121 |
|
|
| 43,460 |
|
|
| 43,712 |
|
|
| (252 | ) |
CAD |
| March 15, 2023 |
| Unrealized depreciation on foreign currency forward contracts |
| Goldman Sachs International |
|
| CAD (3,151) |
|
|
| (2,336 | ) |
|
| (2,330 | ) |
|
| (6 | ) |
Total |
|
|
|
|
|
|
|
|
|
| $ | 54,698 |
|
| $ | 55,034 |
|
| $ | (336 | ) | |
The following table presents the net realized and unrealized gains and losses on derivative instruments recorded for the yearyears ended December 31, 2023 and December 31, 2022 and for the period ended December 31, 2021:
54
|
| Statement Location |
| For the Year Ended December 31, 2022 |
|
| For the Period Ended December 31, 2021 (1) |
|
| Statement of Operations Location |
| For the Year Ended December 31, 2023 |
|
| For the Year Ended December 31, 2022 |
|
| For the Period Ended December 31, 2021 (1) |
| |||||
Net realized gains (losses) |
|
|
|
|
|
|
|
|
|
|
|
| ||||||||||||
Foreign currency forward contracts |
| Net realized gains (losses) on foreign currency forward contracts |
| $ | 1,653 |
|
| $ | — |
|
| Net realized gains (losses) on foreign currency forward contracts |
| $ | (2,076 | ) |
| $ | 1,653 |
|
| $ | — |
|
Net change in unrealized appreciation (depreciation) |
|
|
|
|
|
|
|
|
|
|
|
| ||||||||||||
Foreign currency forward contracts |
| Net change in unrealized appreciation (depreciation) on foreign currency forward contracts |
| $ | (336 | ) |
| $ | — |
|
| Net change in unrealized appreciation (depreciation) on foreign currency forward contracts |
|
| (461 | ) |
|
| (336 | ) |
|
| — |
|
Net realized and unrealized gains on foreign currency forward contracts |
| $ | 1,317 |
|
| $ | — |
|
| $ | (2,537 | ) |
| $ | 1,317 |
|
| $ | — |
| ||||
For derivatives traded under an International Swaps and Derivatives Association Master Agreement ("ISDA Master Agreement"), the collateral requirements are typically calculated by netting the mark-to-market amount for each transaction under such agreement and comparing that amount to the value of any collateral currently pledged by the Company or the counterparty. Cash collateral that has been pledged, if any, to cover obligations of the Company and cash collateral received from the counterparty, if any, is reported on the consolidated statements of assets and liabilities as collateral deposits (received) for foreign currency forward contracts. Generally, the amount of collateral due from or to a party has to exceed a minimum transfer amount threshold before a transfer is required. To the extent amounts due to the Company from a counterparty are not fully collateralized, the Company bears the risk of loss from counterparty non-performance.
The following table presents the derivative assets and liabilities by counterparty, net of amounts available for offset under a master netting agreement or similar arrangement, and net of related collateral received for assets or pledged for liabilities as of December 31, 2023 and December 31, 2022:
As of |
| Counterparty |
| Gross Derivative Assets in Statement of Assets and Liabilities |
|
| Gross Derivative Liabilities in Statement of Assets and Liabilities |
|
| Collateral Pledged (1) |
|
| Net position of Derivative Assets, Liabilities and Pledged Collateral |
| ||||
December 31, 2022 |
| Goldman Sachs International |
| $ | — |
|
| $ | (336 | ) |
| $ | 336 |
|
| $ | — |
|
60
As of |
| Counterparty |
| Gross Derivative Assets in Consolidated Statement of Assets and Liabilities |
|
| Gross Derivative Liabilities in Consolidated Statement of Assets and Liabilities |
|
| Collateral Pledged (1) |
|
| Net position of Derivative Assets, Liabilities and Pledged Collateral |
| ||||
December 31, 2023 |
| Macquarie |
| $ | — |
|
| $ | (797 | ) |
| $ | — |
|
| $ | (797 | ) |
As of |
| Counterparty |
| Gross Derivative Assets in Consolidated Statement of Assets and Liabilities |
|
| Gross Derivative Liabilities in Consolidated Statement of Assets and Liabilities |
|
| Collateral Pledged (1) |
|
| Net position of Derivative Assets, Liabilities and Pledged Collateral |
| ||||
December 31, 2022 |
| Goldman Sachs International |
| $ | — |
|
| $ | (336 | ) |
| $ | 336 |
|
| $ | — |
|
Note 6. Fair Value Measurements
The following tables present the fair value hierarchy of financial instruments, as of December 31, 20222023 and December 31, 2021,2022, according to the fair value hierarchy as described in Note 2. Significant Accounting Policies:
|
| December 31, 2022 |
|
|
| December 31, 2023 |
| |||||||||||||||||||||||||||||
|
| Level 1 |
|
| Level 2 |
|
| Level 3 |
|
| Total |
|
|
| Level 1 |
|
| Level 2 |
|
| Level 3 |
|
| Total |
| |||||||||||
First lien debt |
| $ | — |
|
| $ | 254,386 |
|
| $ | 494,159 |
|
| $ | 748,545 |
|
|
| $ | — |
|
| $ | 742,678 |
|
| $ | 1,200,165 |
|
| $ | 1,942,843 |
| |||
Second lien debt |
|
| — |
|
|
| 15,239 |
|
|
| 195,687 |
|
|
| 210,926 |
|
|
|
| — |
|
|
| 95,443 |
|
|
| 130,875 |
|
|
| 226,318 |
| |||
Preferred equity |
|
| — |
|
|
| — |
|
|
| 22,267 |
|
|
| 22,267 |
|
|
|
| — |
|
|
| — |
|
|
| 27,892 |
|
|
| 27,892 |
| |||
Cash and cash equivalents |
|
| 36,616 |
|
|
| — |
|
|
| — |
|
|
| 36,616 |
|
|
|
| 98,606 |
|
|
| — |
|
|
| — |
|
|
| 98,606 |
| |||
Total Portfolio Investments, Cash and Cash Equivalents |
| $ | 36,616 |
|
| $ | 269,625 |
|
| $ | 712,113 |
|
| $ | 1,018,354 |
|
|
| $ | 98,606 |
|
| $ | 838,121 |
|
| $ | 1,358,932 |
|
| $ | 2,295,659 |
| |||
Percentage of Total |
|
| 3.60 |
| % |
|
| 26.48 |
| % |
|
| 69.93 |
| % |
|
| 100.00 |
| % | ||||||||||||||||
Percentage of total |
|
| 4.30 | % |
|
| 36.51 | % |
|
| 59.20 | % |
|
| 100.00 | % | ||||||||||||||||||||
Foreign currency forward contracts |
| $ | — |
|
| $ | (336 | ) |
| $ | — |
|
| $ | — |
|
|
| $ | — |
|
| $ | (797 | ) |
| $ | — |
|
| $ | (797 | ) | |||
|
| December 31, 2021 |
|
|
| December 31, 2022 |
| |||||||||||||||||||||||||||||
|
| Level 1 |
|
| Level 2 |
|
| Level 3 |
|
| Total |
|
|
| Level 1 |
|
| Level 2 |
|
| Level 3 |
|
| Total |
| |||||||||||
First lien debt |
| $ | — |
|
| $ | 216,884 |
|
| $ | 269,162 |
|
| $ | 486,046 |
|
|
| $ | — |
|
| $ | 254,386 |
|
| $ | 494,159 |
|
| $ | 748,545 |
| |||
Second lien debt |
|
| — |
|
|
| 11,947 |
|
|
| 133,447 |
|
|
| 145,394 |
|
|
|
| — |
|
|
| 15,239 |
|
|
| 195,687 |
|
|
| 210,926 |
| |||
Unsecured debt |
|
| — |
|
|
| 36,220 |
|
|
| — |
|
|
| 36,220 |
|
| |||||||||||||||||||
Preferred equity |
|
| — |
|
|
| — |
|
|
| 24,697 |
|
|
| 24,697 |
|
|
|
| — |
|
|
| — |
|
|
| 22,267 |
|
|
| 22,267 |
| |||
Cash and cash equivalents |
|
| 12,203 |
|
|
| — |
|
|
| — |
|
|
| 12,203 |
|
|
|
| 36,616 |
|
|
| — |
|
|
| — |
|
|
| 36,616 |
| |||
Total Portfolio Investments, Cash and Cash Equivalents |
| $ | 12,203 |
|
| $ | 265,051 |
|
| $ | 427,306 |
|
| $ | 704,560 |
|
|
| $ | 36,616 |
|
| $ | 269,625 |
|
| $ | 712,113 |
|
| $ | 1,018,354 |
| |||
Percentage of Total |
|
| 1.73 |
| % |
|
| 37.62 |
| % |
|
| 60.65 |
| % |
|
| 100.00 |
| % | ||||||||||||||||
Percentage of total |
|
| 3.60 | % |
|
| 26.48 | % |
|
| 69.93 | % |
|
| 100.00 | % | ||||||||||||||||||||
Foreign currency forward contracts |
| $ | — |
|
| $ | (336 | ) |
| $ | — |
|
| $ | (336 | ) | ||||||||||||||||||||
The following tables present changes in the fair value of financial instruments for which Level 3 inputs were used to determine the fair value for the years ended December 31, 2023 and December 31, 2022:
| For the Year Ended December 31, 2023 |
| |||||||||||||
| First Lien Debt |
|
| Second Lien Debt |
|
| Preferred Equity |
|
| Total Investments |
| ||||
Fair value, beginning of year | $ | 494,159 |
|
| $ | 195,687 |
|
| $ | 22,267 |
|
| $ | 712,113 |
|
Purchase of investments (including PIK) |
| 994,735 |
|
|
| 271 |
|
|
| 3,554 |
|
|
| 998,560 |
|
Proceeds from principal repayments and sales of investments |
| (233,133 | ) |
|
| — |
|
|
| (214 | ) |
|
| (233,347 | ) |
Amortization of premium/accretion of discount, net |
| 4,003 |
|
|
| 198 |
|
|
| (13 | ) |
|
| 4,188 |
|
Net realized gain (loss) on investments |
| 1,644 |
|
|
| — |
|
|
| (1 | ) |
|
| 1,643 |
|
Net change in unrealized appreciation (depreciation) on investments |
| 10,633 |
|
|
| 2,970 |
|
|
| 2,299 |
|
|
| 15,902 |
|
Transfers out of Level 3 (1) |
| (71,876 | ) |
|
| (68,250 | ) |
|
| — |
|
|
| (140,126 | ) |
Transfers to Level 3 |
| — |
|
|
| — |
|
|
| — |
|
|
| — |
|
Fair value, end of year | $ | 1,200,165 |
|
| $ | 130,876 |
|
| $ | 27,892 |
|
| $ | 1,358,933 |
|
Net change in unrealized appreciation (depreciation) on non-controlled/non-affiliated company investments still held at December 31, 2023 | $ | 9,768 |
|
| $ | 2,970 |
|
| $ | 2,299 |
|
| $ | 15,037 |
|
61
55
| For the Year Ended December 31, 2022 |
| For the Year Ended December 31, 2022 |
| ||||||||||||||||||||||||||
| First Lien Debt |
|
| Second Lien Debt |
|
| Preferred Equity |
|
| Total |
| First Lien Debt |
|
| Second Lien Debt |
|
| Preferred Equity |
|
| Total Investments |
| ||||||||
Fair value, beginning of period | $ | 269,162 |
|
| $ | 133,447 |
|
| $ | 24,697 |
|
| $ | 427,306 |
| |||||||||||||||
Fair value, beginning of year | $ | 269,162 |
|
| $ | 133,447 |
|
| $ | 24,697 |
|
| $ | 427,306 |
| |||||||||||||||
Purchase of investments (including PIK) |
| 277,478 |
|
|
| 113,001 |
|
|
| 3,475 |
|
|
| 393,954 |
|
| 277,478 |
|
|
| 113,001 |
|
|
| 3,475 |
|
|
| 393,954 |
|
Proceeds from principal repayments and sales of investments |
| (108,329 | ) |
|
| (37,763 | ) |
|
| — |
|
|
| (146,092 | ) |
| (108,329 | ) |
|
| (37,763 | ) |
|
| — |
|
|
| (146,092 | ) |
Amortization of premium/accretion of discount, net |
| 1,712 |
|
|
| 214 |
|
|
| 1 |
|
|
| 1,927 |
|
| 1,712 |
|
|
| 214 |
|
|
| 1 |
|
|
| 1,927 |
|
Net realized gain (loss) on investments |
| 677 |
|
|
| 2,630 |
|
|
| — |
|
|
| 3,307 |
|
| 677 |
|
|
| 2,630 |
|
|
| — |
|
|
| 3,307 |
|
Net change in unrealized appreciation (depreciation) on investments |
| (10,954 | ) |
|
| (15,842 | ) |
|
| (5,906 | ) |
|
| (32,702 | ) |
| (10,954 | ) |
|
| (15,842 | ) |
|
| (5,906 | ) |
|
| (32,702 | ) |
Transfers out of Level 3 (1) |
| — |
|
|
| — |
|
|
| — |
|
|
| — |
|
| — |
|
|
| — |
|
|
| — |
|
|
| — |
|
Transfers to Level 3 (2) |
| 64,413 |
|
|
| — |
|
|
| — |
|
|
| 64,413 |
|
| 64,413 |
|
|
| — |
|
|
| — |
|
|
| 64,413 |
|
Fair value, end of year | $ | 494,159 |
|
| $ | 195,687 |
|
| $ | 22,267 |
|
| $ | 712,113 |
| $ | 494,159 |
|
| $ | 195,687 |
|
| $ | 22,267 |
|
| $ | 712,113 |
|
Net change in unrealized appreciation (depreciation) on non-controlled/non-affiliated company investments still held at December 31, 2022 | $ | (11,016 | ) |
| $ | (15,853 | ) |
| $ | (5,906 | ) |
| $ | (32,775 | ) | |||||||||||||||
Net change in unrealized depreciation on non-controlled/non-affiliated company investments still held at December 31, 2022 |
| (11,016 | ) |
|
| (15,853 | ) |
|
| (5,906 | ) |
|
| (32,775 | ) | |||||||||||||||
| For the Period Ended December 31, 2021 (1) |
| |||||||||||||
| First Lien Debt |
|
| Second Lien Debt |
|
| Preferred Equity |
|
| Total |
| ||||
Fair value, beginning of period | $ | — |
|
| $ | — |
|
| $ | — |
|
| $ | — |
|
Purchase of investments (including PIK) |
| 270,631 |
|
|
| 133,275 |
|
|
| 25,043 |
|
|
| 428,949 |
|
Proceeds from principal repayments and sales of investments |
| (2,073 | ) |
|
| — |
|
|
| — |
|
|
| (2,073 | ) |
Amortization of premium/accretion of discount, net |
| 44 |
|
|
| 15 |
|
|
| 1 |
|
|
| 60 |
|
Net realized gain (loss) on investments |
| 68 |
|
|
| — |
|
|
| — |
|
|
| 68 |
|
Net change in unrealized appreciation (depreciation) on investments |
| 492 |
|
|
| 157 |
|
|
| (347 | ) |
|
| 302 |
|
Fair value, end of period | $ | 269,162 |
|
| $ | 133,447 |
|
| $ | 24,697 |
|
| $ | 427,306 |
|
Net change in unrealized appreciation (depreciation) on non-controlled/non-affiliated company investments still held at December 31, 2021 | $ | 468 |
|
| $ | 181 |
|
| $ | (347 | ) |
| $ | 302 |
|
The Company generally employs the Income Based Approach (as described below) to estimate the fair value of the investment. Additionally, the Company may employ the Market Based Approach (as described below) to assess the total enterprise value of the portfolio company or any applicable collateral, in order to evaluate coverage of the Company’s debt investment.
Income Based Approach: The Company may use a discounted cash flow analysis to estimate the fair value of the investment, specifically the yield method. Projected cash flows represent the relevant investment’s contractual interest, fee and principal payments plus the assumption of full principal recovery at the investment’s expected maturity date. These cash flows are discounted at a rate that is calibrated to the initial transaction and monitored over time to adjust for changes in observed market spreads and yields since the issuance of the investment as well as changes in company specific factors. Significant increases or decreases in the discount rate would result in a decrease or increase in the fair value measurement.
Market Based Approach: The Company may estimate the total enterprise value of each portfolio company by utilizing cash flow (typically EBITDA or revenue, or the relevant industry metric) multiples of publicly traded comparable companies and comparable transactions. The Company considers numerous factors when selecting the appropriate companies whose trading multiples are used to value its portfolio companies. These factors include, but are not limited to, the type of organization, similarity to the business being valued, and relevant risk factors, as well as size, profitability and growth expectations. The Company may apply an average of various relevant comparable company multiples to the portfolio company’s latest twelve month EBITDA, revenue or other applicable metric to calculate the enterprise value of the portfolio company. The Company may also consider projected multiples in the assessment if applicable.
The following tables present quantitative information about the significant unobservable inputs of the Company’s Level 3 financial instruments as of December 31, 20222023 and December 31, 2021,2022, respectively. The tables are not intended to be all-inclusive, but instead capture the significant unobservable inputs relevant to the Company’s determination of fair value.
|
| December 31, 2022 |
|
| December 31, 2023 |
| ||||||||||||||||||||||||||||||||||
|
|
|
|
|
|
|
|
| Range |
|
|
|
|
|
|
|
|
|
|
|
| Range |
|
|
|
| ||||||||||||||
|
| Fair Value |
|
| Valuation Technique |
| Unobservable Input (1) |
| Low |
|
| High |
|
| Weighted Average (2) |
|
| Fair Value |
|
| Valuation Technique |
| Unobservable Input (1) |
| Low |
|
| High |
|
| Weighted Average (2) |
| ||||||||
First lien debt |
| $ | 408,366 |
|
| Market Yield Analysis |
| Market Yield Discount Rates |
|
| 10.48 | % |
|
| 24.98 | % |
|
| 14.09 | % |
| $ | 1,126,991 |
|
| Market Yield Analysis |
| Market Yield Discount Rates |
|
| 9.31 | % |
|
| 25.00 | % |
|
| 12.11 | % |
|
|
| 13,917 |
|
| Recent Transaction |
| Transaction Price |
|
| 100.00 |
|
|
| 100.00 |
|
|
| 100.00 |
|
|
| 73,174 |
|
| Recent Transaction |
| Transaction Price |
|
| 98.00 | % |
|
| 98.58 | % |
|
| 98.07 | % |
|
|
| 422,283 |
|
|
|
|
|
|
|
|
|
|
|
| 1,200,165 |
|
|
|
|
|
|
|
|
|
| ||||||||||||||
Second lien debt |
|
| 127,437 |
|
| Market Yield Analysis |
| Market Yield Discount Rates |
|
| 13.24 | % |
|
| 15.87 | % |
|
| 14.49 | % |
|
| 130,876 |
|
| Market Yield Analysis |
| Market Yield Discount Rates |
|
| 12.01 | % |
|
| 14.97 | % |
|
| 13.40 | % |
|
|
| 127,437 |
|
|
|
|
|
|
|
|
|
|
|
| 130,876 |
|
|
|
|
|
|
|
|
|
| ||||||||||||||
Preferred equity |
|
| 22,267 |
|
| Market Yield Analysis |
| Market Yield Discount Rates |
|
| 17.11 | % |
|
| 20.52 | % |
|
| 18.81 | % |
|
| 27,892 |
|
| Market Yield Analysis |
| Market Yield Discount Rates |
|
| 9.42 | % |
|
| 19.78 | % |
|
| 17.01 | % |
|
|
|
|
| Black-Scholes |
| Volatility |
|
| 34.90 | % |
|
| 34.90 | % |
|
| 34.90 | % | |||||||||||||||||||||
Total |
| $ | 571,987 |
|
|
|
|
|
|
|
|
|
|
| $ | 1,358,933 |
|
|
|
|
|
|
|
|
|
| ||||||||||||||
5662
|
| December 31, 2021 |
| |||||||||||||||||
|
|
|
|
|
|
|
|
| Range |
|
|
|
| |||||||
|
| Fair Value |
|
| Valuation Technique |
| Unobservable Input (1) |
| Low |
|
| High |
|
| Weighted Average (2) |
| ||||
First lien debt |
| $ | 221,516 |
|
| Market Yield Analysis |
| Market Yield Discount Rates |
|
| 7.25 | % |
|
| 17.25 | % |
|
| 10.90 | % |
|
|
| 39,200 |
|
| Recent Transaction |
| Transaction Price |
|
| 98.00 |
|
|
| 98.00 |
|
|
| 98.00 |
|
|
|
| 260,716 |
|
|
|
|
|
|
|
|
|
|
|
|
|
| |||
Second lien debt |
|
| 98,328 |
|
| Market Yield Analysis |
| Market Yield Discount Rates |
|
| 9.08 | % |
|
| 9.96 | % |
|
| 9.40 | % |
Preferred equity |
|
| 24,697 |
|
| Market Yield Analysis |
| Market Yield Discount Rates |
|
| 14.20 | % |
|
| 14.20 | % |
|
| 14.20 | % |
Total |
| $ | 383,741 |
|
|
|
|
|
|
|
|
|
|
|
|
|
| |||
| December 31, 2022 |
| ||||||||||||||||||
|
|
|
|
|
|
|
| Range |
|
|
|
| ||||||||
| Fair Value |
|
| Valuation Technique |
| Unobservable Input (1) |
| Low |
|
| High |
|
| Weighted Average (2) |
| |||||
First lien debt |
| $ | 408,366 |
|
| Market Yield Analysis |
| Market Yield Discount Rates |
|
| 10.48 | % |
|
| 24.98 | % |
|
| 14.09 | % |
|
| 13,917 |
|
| Recent Transaction |
| Transaction Price |
|
| 100.00 |
|
|
| 100.00 |
|
|
| 100.00 |
| |
|
| 422,283 |
|
|
|
|
|
|
|
|
|
|
|
|
|
| ||||
Second lien debt |
|
| 127,437 |
|
| Market Yield Analysis |
| Market Yield Discount Rates |
|
| 13.24 | % |
|
| 15.87 | % |
|
| 14.49 | % |
|
|
| 127,437 |
|
|
|
|
|
|
|
|
|
|
|
|
|
| |||
Preferred equity |
|
| 22,267 |
|
| Market Yield Analysis |
| Market Yield Discount Rates |
|
| 17.11 | % |
|
| 20.52 | % |
|
| 18.81 | % |
Total |
| $ | 571,987 |
|
|
|
|
|
|
|
|
|
|
|
|
|
| |||
Financial Instruments Disclosed, But Not Carried at Fair Value
Debt
The fair value of the Company’s credit facilities,Credit Facilities, which would be categorized as Level 3 within the fair value hierarchy, as of both December 31, 20222023 and December 31, 2021,2022, respectively, approximates their carrying value as the credit facilities have variable interest based on selected short-term rates.
Other
The carrying amounts of the Company’s assets and liabilities, other than investments at fair value and debt, approximate fair value. These financial instruments are categorized as Level 3 within the hierarchy.
Note 7. Borrowings
In accordance with the 1940 Act, with certain limitations, the Company is allowed to borrow amounts such that its asset coverage, as defined in the 1940 Act, is at least 150% after such borrowing.
The Company’s outstanding debt obligations as of December 31, 20222023 and December 31, 20212022 were as follows:
|
| December 31, 2022 | ||||||||||||||||
|
| Aggregate |
|
| Outstanding |
|
| Carrying |
|
| Unused |
|
| Maturity Date | ||||
SPV I Facility |
| $ | 485,000 |
|
| $ | 392,000 |
|
| $ | 387,590 |
|
| $ | 93,000 |
|
| 12/21/2026 |
Subscription Facility |
|
| 200,000 |
|
|
| 145,000 |
|
|
| 144,499 |
|
|
| 55,000 |
|
| 12/21/2023 |
Total |
| $ | 685,000 |
|
| $ | 537,000 |
|
| $ | 532,089 |
|
| $ | 148,000 |
|
|
|
| December 31, 2023 | |||||||||||||||||
| Aggregate |
|
| Outstanding |
|
| Carrying |
|
| Unused |
|
| Maturity Date | |||||
SPV I facility |
| $ | 485,000 |
|
| $ | 378,000 |
|
| $ | 374,700 |
|
| $ | 107,000 |
|
| 12/21/2026 |
SPV II facility |
|
| 445,000 |
|
|
| 295,000 |
|
|
| 289,349 |
|
|
| 150,000 |
|
| 8/15/2028 |
Collateralized loan obligations |
|
| 390,000 |
|
|
| 390,000 |
|
|
| 386,393 |
|
|
| — |
|
| 11/15/2035 |
Subscription facility |
|
| 200,000 |
|
|
| 35,000 |
|
|
| 34,319 |
|
|
| 165,000 |
|
| 12/18/2024 |
Loan repurchase obligations |
|
| 50,025 |
|
|
| 50,025 |
|
|
| 50,025 |
|
|
| — |
|
| Various (3) |
Total |
| $ | 1,570,025 |
|
| $ | 1,148,025 |
|
| $ | 1,134,786 |
|
| $ | 422,000 |
|
|
|
|
| December 31, 2021 | ||||||||||||||||
|
| Aggregate |
|
| Outstanding |
|
| Carrying |
|
| Unused |
|
| Maturity Date | ||||
SPV I Facility |
| $ | 400,000 |
|
| $ | 220,000 |
|
| $ | 215,590 |
|
| $ | 180,000 |
|
| 12/21/2026 |
Subscription Facility |
|
| 200,000 |
|
|
| 190,000 |
|
|
| 189,331 |
|
|
| 10,000 |
|
| 12/21/2022 |
Total |
| $ | 600,000 |
|
| $ | 410,000 |
|
| $ | 404,921 |
|
| $ | 190,000 |
|
|
|
| December 31, 2022 | |||||||||||||||||
| Aggregate |
|
| Outstanding |
|
| Carrying |
|
| Unused |
|
| Maturity Date | |||||
SPV I facility |
| $ | 485,000 |
|
| $ | 392,000 |
|
| $ | 387,590 |
|
| $ | 93,000 |
|
| 12/21/2026 |
Subscription facility |
|
| 200,000 |
|
|
| 145,000 |
|
|
| 144,499 |
|
|
| 55,000 |
|
| 12/21/2023 |
Total |
| $ | 685,000 |
|
| $ | 537,000 |
|
| $ | 532,089 |
|
| $ | 148,000 |
|
|
|
5763
The components of interest expense for the year ended December 31, 2023 and December 31, 2022 and for the period ended December 31, 2021 were as follows:
|
| For the Year Ended December 31, 2022 |
|
| For the Period Ended December 31, 2021 (1) |
|
| For the Year Ended December 31, 2023 |
|
| For the Year Ended December 31, 2022 |
|
| For the Period Ended December 31, 2021 (1) |
| |||||
Stated interest expense |
| $ | 21,119 |
|
| $ | 282 |
|
| $ | 62,243 |
|
| $ | 21,119 |
|
| $ | 282 |
|
Unused/undrawn fees |
|
| 466 |
|
|
| 28 |
|
|
| 624 |
|
|
| 466 |
|
|
| 28 |
|
Administration fees |
|
| 1,026 |
|
|
| 30 |
|
|
| 1,222 |
|
|
| 1,026 |
|
|
| 30 |
|
Amortization of deferred financing costs |
|
| 1,541 |
|
|
| 48 |
|
|
| 2,117 |
|
|
| 1,541 |
|
|
| 48 |
|
Total interest expense |
| $ | 24,152 |
|
| $ | 388 |
|
| $ | 66,206 |
|
| $ | 24,152 |
|
| $ | 388 |
|
Average borrowings |
| $ | 482,333 |
|
| $ | 410,000 |
|
| $ | 804,401 |
|
| $ | 482,333 |
|
| $ | 410,000 |
|
|
|
|
|
|
|
|
|
|
|
|
|
| ||||||||
Weighted average interest rate (2) |
|
| 4.69 | % |
|
| 2.71 | % |
|
| 7.97 | % |
|
| 4.69 | % |
|
| 2.71 | % |
Amortization of financing costs |
|
| 0.32 | % |
|
| 0.38 | % |
|
| 0.26 | % |
|
| 0.32 | % |
|
| 0.38 | % |
Total borrowing costs |
|
| 5.01 | % |
|
| 3.09 | % |
|
| 8.23 | % |
|
| 5.01 | % |
|
| 3.09 | % |
Description of the Company's Credit Facilities
SPV I Facility
On December 21, 2021, SPV I, the Company’s wholly-owned subsidiary, entered into a senior secured revolving credit facility with Deutsche Bank AG, New York Branch (“DB”) (the “SPV I Facility”), which was subsequently amended on November 21, 2022 and December 16, 2022.2022 (the “SPV I Facility”). DB serves as facility agent, U.S. Bank National Association, serves as collateral agent and collateral custodian and the Company serves as servicer under the SPV I Facility.
As of the amendment on November 21, 2022 amendment advances under the SPV I Facility bear interest at a per annum rate equal to the three-month SOFR in effect, plus the applicable margin of 2.41%2.41% per annum, inclusive of a credit spread adjustment (“CSA”) of 0.26%0.26%, with a SOFR floor of 0.25%0.25%. SPV I pays a commitment fee of 0.25%0.25% per annum (or 0.50% per annum if borrowings are less than 75% of the commitment amount)amount) on the average daily unused amount of the financing commitments until the third anniversary of the SPV I Facility. Additionally, SPV I pays DB an administrative agent fee 0.25%of 0.25% of the total commitment amount for serving as facility agent.
Prior to the amendment on November 21, 2022, amendment, Advances under the SPV I Facility bore interest at a per annum rate equal to the three-month LIBOR in effect, plus the applicable margin of 2.15%2.15% per annum with a LIBOR floor of 0.25%0.25%. The commitment fee and the administrative agent fee were unchanged.
TheIn connection with the amendment on December 16, 2022, the maximum commitment amount of the SPV I Facility which was $400increased from $400 million as of December 31, 2021 increased to $485 million as of December 16, 2022.$485 million. Proceeds from borrowings under the SPV I Facility may be used to fund portfolio investments by SPV I. The period during which SPV I may make borrowings under the SPV I Facility expires on December 31, 2024 and the SPV I Facility is scheduled to mature on December 21, 2026.2026.
As of both December 31, 2023 and December 31, 2022, respectively, the Company was in compliance with all covenants associated with the SPV I Facility.
SPV II Facility
On August 15, 2023, the Company’s wholly-owned subsidiary, SPV II, entered into a Loan and Security Agreement (together with the exhibits and schedules thereto, the “Loan and Security Agreement”) with Citizens Bank N.A as lender and administrative agent, the Company as collateral manager, the other lenders party thereto, U.S. Bank Trust Company, National Association as collateral agent, and U.S. Bank National Association as account bank and collateral custodian (the “SPV II Facility”), which was subsequently amended on September 8, 2023.
Advances under the SPV II Facility bear interest at a per annum rate equal to SOFR in effect, plus an applicable margin of 2.75% per annum with a SOFR floor of 0.00%. SPV II pays a commitment fee of 0.25% per annum (or 0.50% per annum if borrowings are less than 75% of the commitment amount) on the average daily unused amount of the financing commitments until the third anniversary of the SPV II Facility.
In connection with the September 8, 2023 amendment, the maximum commitment amount of the SPV II Facility increased from $370 million to $445 million. Proceeds from borrowings under the SPV II Facility may be used to fund portfolio investments by SPV II. The period during which SPV II may make borrowings under the SPV II Facility expires on August 15, 2026 and the SPV II Facility is scheduled to mature on August 15, 2028.
As of December 31, 2023, the Company was in compliance with all covenants associated with the SPV II Facility.
Subscription Facility
On December 21, 2021, the Company entered into a senior secured revolving credit facility (the “Subscription Facility”) with Bank of America, N.A. (“BAML”), which was subsequently amended on December 21, 2023 (the “Subscription Facility”). BAML serves as administrative agent and lender.
The Subscription Facility provides for secured borrowings of up to $200$200 million. The maximum principal amount is subject to availability under the Subscription Facility, which is based on certain of the Company’s unfunded investor equity capital commitments, and restrictions imposed on borrowings under the 1940 Act. The Subscription Facility provides for the issuance of letters of credit on behalf of the Company in an aggregate face amount not to exceed $40$40 million. Proceeds from the borrowings under the Subscription Facility may be used for general corporate purposes of the Company and its subsidiaries in the ordinary course of business. On December 21, 2022 theThe Subscription Facility’s maturity date was extended from December 21, 20222023 toDecember 18, 2024 in connection with the December 21, 2023.2023 amendment.
Advances64
As of the amendment on December 21, 2023 advances under the Subscription Facility generally bear interest at a per annum rate equal to the one-month SOFR in effect, plus the applicable margin of 2.50% per annum. The Company pays a commitment fee of 0.35% per annum on the average daily unused amount of the financing commitments.
Prior to the amendment on December 31, 2023, advances under the Subscription Facility bore interest at a per annum rate equal to the daily Bloomberg Short-Term Bank Yield Index (“BSBY”) rate in effect, plus the applicable margin of 2.00%2.00% per annum. The Company payspaid a commitment fee of 0.25%0.25% per annum on the average daily unused amount of the financing commitments.
As of both December 31, 20222023 and December 31, 2021,2022, respectively, the Company is in compliance with all covenants associated with boththe Subscription Facility.
Repurchase Obligations
In order to finance certain investment transactions, the Company may, from time to time, enter into repurchase agreements with Macquarie Bank Limited (“Macquarie”), whereby the Company sells to Macquarie an investment that it holds and concurrently enters into an agreement to repurchase the same investment at an agreed-upon price at a future date, not to exceed 90-days from the date it was sold (the “Macquarie Transaction”).
In accordance with ASC Topic 860, Transfers and Servicing, these Macquarie Transactions meet the criteria for secured borrowings. Accordingly, the investment financed by the Macquarie Transaction remains on the Company’s Statements of Assets and Liabilities as an asset, and the Company records a liability to reflect its credit facilities.repurchase obligation to Macquarie (the “Repurchase Obligation”). The Repurchase Obligation is secured by the respective investment that is the subject of the repurchase agreement.
As of December 31, 2023, the Company had outstanding Repurchase Obligations of $50.0 million associated with repurchase agreements that were entered into on November 3, and 14, 2023. Such Repurchase Obligations are collateralized by a portion of the Company’s term loan holdings in Highgate Hotels, L.P. and PetVet Care Centers. Interest under these Repurchase Obligations is calculated at the inception of each repurchase agreement, as the 3 month SOFR rate in effect, plus the applicable margin of 3.50%. As of December 31, 2023, the remaining contractual maturities of the repurchase agreements were between 32-43 days. The Company had no outstanding Repurchase Obligations as of December 31, 2022.
2023 Debt Securitization
On November 15, 2023 (the “Closing Date”), the Company completed an approximate $600 million term debt securitization (the “2023 Debt Securitization”). Term debt securitization is also known as a collateralized loan obligation and is a form of secured financing incurred by the Company.
The notes offered in the 2023 Debt Securitization (the “Notes”) were issued by MSD BDC CLO I, LLC (the “Issuer”), a wholly-owned, consolidated subsidiary of the Company pursuant to an Indenture, dated the Closing Date, between the Issuer and U.S. Bank Trust Company, National Association, as trustee (the “Indenture”). The 2023 Notes consist of $336 million of Class A Notes, which bear interest at a rate per annum equal to SOFR in effect, plus an applicable margin of 2.70%; $54 million of Class B Notes, which bear interest at SOFR plus an applicable margin of 3.65%; $36 million of Class C Notes, which bear interest at SOFR plus an applicable margin of 4.00%; and approximately $163.6 million of Preferred Shares, which do not bear interest. The Company directly retained all of the Class C Notes and all of the Preferred Shares of the 2023 Debt Securitization at par in exchange for the Company’s sale and contribution to the Issuer of the initial closing date portfolio. Both the Class C Notes and Preferred Shares are eliminated in consolidation.
The Notes are backed by a diversified portfolio of senior secured and second lien loans (the “Collateral Obligations”). The initial portfolio will consist of Collateral Obligations acquired by the Issuer on the Closing Date from the Company pursuant to a Master Transfer Agreement, dated as of the Closing Date, among the Company, as seller, and the Issuer, as purchaser (the "Master Transfer Agreement"). Certain of the Collateral Obligations transferred to the Issuer pursuant to the Master Transfer Agreement were acquired by the Company from SPV I pursuant to the Master Participation Agreement, dated as of the Closing Date, among the Company, as purchaser and the SPV I Facility, as seller. The Notes mature on October 15, 2035.
The Notes are the secured obligation of the Issuer. The Notes have not been, and will not be, registered under the 1933 Act, or any state “blue sky” laws and may not be offered or sold in the United States absent registration with the SEC or applicable exemption from registration.
The Adviser serves as collateral manager to the Issuer under a collateral management agreement (the “Collateral Management Agreement”). However, for so long as the Company holds any Preferred Shares the Collateral Management Fees, which, for the avoidance of doubt, shall include any Base Management Fee, Subordinated Management Fee, and Incentive Management Fee (as each such term is defined in the Collateral Management Agreement), shall be $0.
Note 8. Commitments and Contingencies
Portfolio Company Commitments
The amounts associated with unfunded commitments to provide funds to portfolio companies are not recorded in the Company’s consolidated statementstatements of assets and liabilities. Since these commitments and the associated amounts may expire without being drawn upon, the total commitment amount does not necessarily represent a future cash requirement. As of December 31, 20222023 and December 31, 2021,2022, the Company’s unfunded commitments consisted of the following:
5865
December 31, 2022 |
| |||||||||||
Investments—non-controlled/non-affiliated |
| Commitment Type |
| Commitment |
| Unfunded |
|
| Fair |
| ||
First and Second Lien Debt |
|
|
|
|
|
|
|
|
|
| ||
Candle Media Co Ltd |
| Delayed Draw |
| 6/18/2027 |
| $ | 1,280 |
|
| $ | (63 | ) |
Chromalloy Holdings LLC |
| Revolver |
| 11/23/2027 |
|
| 4,615 |
|
|
| (182 | ) |
Faraday Buyer, LLC |
| Delayed Draw |
| 10/11/2028 |
|
| 3,167 |
|
|
| (45 | ) |
LJ Perimeter Buyer, Inc |
| Delayed Draw |
| 10/31/2028 |
|
| 5,538 |
|
|
| (76 | ) |
Natural Partners, Inc. |
| Revolver |
| 3/15/2028 |
|
| 2,813 |
|
|
| (94 | ) |
Systems Planning and Analysis, Inc. (fka Management Consulting & Research LLC) |
| Delayed Draw |
| 8/16/2027 |
|
| 4,704 |
|
|
| (134 | ) |
Systems Planning and Analysis, Inc. (fka Management Consulting & Research LLC) |
| Revolver |
| 8/16/2027 |
|
| 3,136 |
|
|
| (113 | ) |
Total Unfunded Commitments |
|
|
|
|
| $ | 25,253 |
|
| $ | (707 | ) |
December 31, 2023 |
| |||||||||||
Investments—non-controlled/non-affiliated |
| Commitment Type |
| Commitment |
| Unfunded |
|
| Fair |
| ||
First Lien Debt |
|
|
|
|
|
|
|
|
|
| ||
Accession Risk Management |
| Delayed Draw |
| 11/1/2029 |
| $ | 40,719 |
|
| $ | (578 | ) |
Beacon Mobility Corp. |
| Delayed Draw |
| 12/31/2025 |
|
| 592 |
|
|
| (15 | ) |
Boasso Global |
| Delayed Draw |
| 10/3/2024 |
|
| 1,750 |
|
|
| (19 | ) |
Boasso Global |
| Revolver |
| 7/1/2026 |
|
| 6,250 |
|
|
| (161 | ) |
Chromalloy Holdings LLC |
| Revolver |
| 11/23/2027 |
|
| 4,615 |
|
|
| (152 | ) |
Circor International, Inc. |
| Revolver |
| 10/18/2029 |
|
| 7,759 |
|
|
| (165 | ) |
DFS Holding Company |
| Delayed Draw |
| 1/31/2029 |
|
| 3,000 |
|
|
| (30 | ) |
Faraday Buyer, LLC |
| Delayed Draw |
| 10/11/2028 |
|
| 3,514 |
|
|
| (34 | ) |
Foundation Risk Partners |
| Delayed Draw |
| 10/29/2028 |
|
| 45,000 |
|
|
| (435 | ) |
Frontgrade Technologies Inc. |
| Revolver |
| 1/9/2028 |
|
| 7,211 |
|
|
| (164 | ) |
Highgate Hotels, L.P. |
| Revolver |
| 10/26/2029 |
|
| 12,500 |
|
|
| (247 | ) |
LJ Perimeter Buyer, Inc |
| Delayed Draw |
| 10/31/2028 |
|
| 3,042 |
|
|
| (10 | ) |
Maxar Technologies Inc. |
| Revolver |
| 5/3/2029 |
|
| 8,587 |
|
|
| (233 | ) |
Momentive Global |
| Revolver |
| 5/31/2029 |
|
| 5,714 |
|
|
| (69 | ) |
Natural Partners, Inc. |
| Revolver |
| 11/29/2027 |
|
| 2,813 |
|
|
| (39 | ) |
PetVet Care Centers |
| Delayed Draw |
| 11/15/2030 |
|
| 6,981 |
|
|
| (68 | ) |
PetVet Care Centers |
| Revolver |
| 11/15/2029 |
|
| 6,981 |
|
|
| (138 | ) |
Sandlot Baseball Borrower Co. |
| Delayed Draw |
| 12/27/2028 |
|
| 33,333 |
|
|
| — |
|
Systems Planning and Analysis, Inc. |
| Delayed Draw |
| 8/16/2027 |
|
| 1,165 |
|
|
| (4 | ) |
Systems Planning and Analysis, Inc. |
| Revolver |
| 8/16/2027 |
|
| 3,136 |
|
|
| (34 | ) |
Wood Mackenzie, Inc. |
| Revolver |
| 2/1/2028 |
|
| 2,963 |
|
|
| (29 | ) |
Total Unfunded Commitments |
|
|
|
|
| $ | 207,625 |
|
| $ | (2,624 | ) |
December 31, 2021 |
| |||||||||||
Investments—non-controlled/non-affiliated |
| Commitment Type |
| Commitment |
| Unfunded |
|
| Fair |
| ||
First and Second Lien Debt |
|
|
|
|
|
|
|
|
|
| ||
Candle Media Co Ltd. |
| Delayed Draw |
| 6/18/2027 |
| $ | 16,000 |
|
| $ | (160 | ) |
Management Consulting & Research LLC |
| Revolver |
| 8/16/2027 |
|
| 3,136 |
|
|
| (61 | ) |
Total Unfunded Commitments |
|
|
|
|
| $ | 19,136 |
|
| $ | (221 | ) |
December 31, 2022 |
| |||||||||||
Investments—non-controlled/non-affiliated |
| Commitment Type |
| Commitment |
| Unfunded |
|
| Fair |
| ||
First Lien Debt |
|
|
|
|
|
|
|
|
|
| ||
Candle Media Co Ltd |
| Delayed Draw |
| 6/18/2027 |
| $ | 1,280 |
|
| $ | (63 | ) |
Chromalloy Holdings LLC |
| Revolver |
| 11/23/2027 |
|
| 4,615 |
|
|
| (182 | ) |
Faraday Buyer, LLC |
| Delayed Draw |
| 10/11/2028 |
|
| 3,167 |
|
|
| (45 | ) |
LJ Perimeter Buyer, Inc |
| Delayed Draw |
| 10/31/2028 |
|
| 5,538 |
|
|
| (76 | ) |
Natural Partners, Inc. |
| Revolver |
| 3/15/2028 |
|
| 2,813 |
|
|
| (94 | ) |
Systems Planning and Analysis, Inc. (fka Management Consulting & Research LLC) |
| Delayed Draw |
| 8/16/2027 |
|
| 4,704 |
|
|
| (134 | ) |
Systems Planning and Analysis, Inc. (fka Management Consulting & Research LLC) |
| Revolver |
| 8/16/2027 |
|
| 3,136 |
|
|
| (113 | ) |
Total Unfunded Commitments |
|
|
|
|
| $ | 25,253 |
|
| $ | (707 | ) |
Other Commitments and Contingencies
From time to time, the Company may become a party to certain legal proceedings incidental to the normal course of its business. At both December 31, 20222023 and December 31, 2021,2022, management was not aware of any pending or threatened material litigation.
Note 9. Net Assets
Subscriptions and Drawdowns
In connection with its formation, the Company has the authority to issue up to 100 million shares. Through its Private Offerings the Company will from time to time enter into subscription agreements (the “Subscription Agreements”) with investors. Under the terms of the Subscription Agreements, investors are required to fund drawdowns to purchase the Company’s Shares up to the amount of their respective Capital Commitment on an as-needed basis each time the Company delivers a drawdown notice. As of December 31, 2022,2023, the Company had received Capital Commitments totaling approximately $1.1$1.4 billion ($562.6619.7 million remaining undrawn), all of which were from affiliates of the Adviser..
The following table summarizes the total shares issued and proceeds received related to the Company’s capital drawdowns delivered pursuant to the Subscription Agreements for the year endedas of December 31, 2022:2023:
Share Issuance Date |
| Number of |
|
| Aggregate |
|
| Number of |
|
| Aggregate |
| ||||
December 21, 2021 |
|
| 12,000,000 |
|
| $ | 299,988 |
|
|
| 12,000,000 |
|
| $ | 299,988 |
|
June 23, 2022 |
|
| 2,509,410 |
|
| $ | 60,000 |
|
|
| 2,509,410 |
|
| $ | 60,000 |
|
September 21, 2022 |
|
| 2,787,307 |
|
| $ | 65,000 |
|
|
| 2,787,307 |
|
| $ | 65,000 |
|
December 29, 2022 |
|
| 2,991,256 |
|
| $ | 65,000 |
|
|
| 2,991,256 |
|
| $ | 65,000 |
|
March 8, 2023 |
|
| 2,601,909 |
|
| $ | 60,000 |
| ||||||||
April 21, 2023 |
|
| 4,446,421 |
|
| $ | 100,000 |
| ||||||||
August 8, 2023 |
|
| 3,225,807 |
|
| $ | 75,000 |
| ||||||||
December 29, 2023 |
|
| 4,310,345 |
|
| $ | 100,000 |
| ||||||||
Total |
|
| 20,287,973 |
|
| $ | 489,988 |
|
|
| 34,872,455 |
|
| $ | 824,988 |
|
66
Distributions
As of December 31, 2022,2023, the Company had declared the following distributions:
|
| Regular |
|
| Special |
|
| Per Share |
|
|
|
|
| Regular |
|
| Special |
|
| Per Share |
|
|
|
| ||||||||||||||||
Date Declared |
| Record Date |
| Payment Date |
| Distribution |
|
| Distribution |
|
| Amount |
|
| Total Amount |
|
| Record Date |
| Payment Date |
| Distribution |
|
| Distribution |
|
| Amount |
|
| Total Amount |
| ||||||||
For Calendar Year 2023 |
|
|
|
|
|
|
|
|
|
|
|
|
|
|
|
| ||||||||||||||||||||||||
March 13, 2023 |
| March 29, 2023 |
| April 17, 2023 |
| $ | 0.65 |
|
| $ | — |
|
| $ | 0.65 |
|
| $ | 16,073 |
| ||||||||||||||||||||
June 21, 2023 |
| June 21, 2023 |
| June 28, 2023 |
| $ | 0.65 |
|
| $ | — |
|
| $ | 0.65 |
|
| $ | 19,378 |
| ||||||||||||||||||||
August 3, 2023 |
| August 4, 2023 |
| September 28, 2023 |
| $ | — |
|
| $ | 0.03 |
|
| $ | 0.03 |
|
| $ | 917 |
| ||||||||||||||||||||
August 3, 2023 |
| September 15, 2023 |
| September 28, 2023 |
| $ | 0.65 |
|
| $ | — |
|
| $ | 0.65 |
|
| $ | 21,965 |
| ||||||||||||||||||||
November 3, 2023 |
| December 15, 2023 |
| December 28, 2023 |
| $ | 0.65 |
|
| $ | 0.11 |
|
| $ | 0.76 |
|
| $ | 26,312 |
| ||||||||||||||||||||
December 20, 2023 |
| December 20, 2023 |
| December 28, 2023 |
| $ | — |
|
| $ | 0.35 |
|
| $ | 0.35 |
|
| $ | 12,117 |
| ||||||||||||||||||||
|
|
|
|
|
|
|
|
|
|
|
| $ | 3.09 |
|
| $ | 96,762 |
| ||||||||||||||||||||||
For Calendar Year 2022 |
|
|
|
|
|
|
|
|
|
|
|
|
|
|
|
| ||||||||||||||||||||||||
March 30, 2022 |
| March 31, 2022 |
| April 15, 2022 |
| $ | 0.57 |
|
| $ | 0.03 |
|
| $ | 0.60 |
|
| $ | 7,200 |
|
| March 31, 2022 |
| April 15, 2022 |
| $ | 0.57 |
|
| $ | 0.03 |
|
| $ | 0.60 |
|
| $ | 7,200 |
|
June 28, 2022 |
| June 29, 2022 |
| July 15, 2022 |
| $ | 0.57 |
|
| $ | 0.06 |
|
| $ | 0.63 |
|
| $ | 9,321 |
|
| June 29, 2022 |
| July 15, 2022 |
| $ | 0.57 |
|
| $ | 0.06 |
|
| $ | 0.63 |
|
| $ | 9,321 |
|
September 20, 2022 |
| September 20, 2022 |
| October 17, 2022 |
| $ | 0.57 |
|
| $ | — |
|
| $ | 0.57 |
|
| $ | 8,646 |
|
| September 20, 2022 |
| October 17, 2022 |
| $ | 0.57 |
|
| $ | — |
|
| $ | 0.57 |
|
| $ | 8,646 |
|
December 29, 2022 |
| December 29, 2022 |
| December 30, 2022 |
| $ | 0.65 |
|
| $ | 0.43 |
|
| $ | 1.08 |
|
| $ | 19,800 |
|
| December 29, 2022 |
| December 30, 2022 |
| $ | 0.65 |
|
| $ | 0.43 |
|
| $ | 1.08 |
|
| $ | 19,800 |
|
Total distributions |
|
|
|
|
|
|
|
|
| $ | 2.88 |
|
| $ | 44,967 |
| ||||||||||||||||||||||||
|
|
|
|
|
|
|
|
|
| $ | 2.88 |
|
| $ | 44,967 |
| ||||||||||||||||||||||||
Dividend Reinvestment
The Company has adopted a dividend reinvestment plan (“DRP”), pursuant to which it reinvests all cash dividends declared by the Board on behalf of its Shareholders who elected not to receive their dividends in cash. Shareholders who have opted into the Company’s DRP will have their cash distributions automatically reinvested in additional sharesShares as described below, rather than receiving the cash dividend or other distribution. A participating Shareholder will receive an amount of sharesShares equal to the amount of the distribution on that participant’s sharesShares divided by the most recent net asset value (“NAV”) per shareShare that is available on the date such distribution was paid. Shareholders who receive distributions in the form of sharesShares will generally be subject to the same U.S. federal, state and local tax consequences as if they received cash distributions; however, since their cash distributions will be reinvested, those Shareholders will not
59
receive cash with which to pay any applicable taxes. The Company intends to use newly issued sharesShares to implement the plan. Shares issued under the dividend reinvestment planDRP will not reduce outstanding Capital Commitments.
The following table summarizes the DRP sharesShares issued to shareholders who have “opted in” to the DRP during the year ended December 31, 20222023 and the value of such sharesShares as of the payment dates:
Payment Date |
| DRP Shares Value |
|
| DRP Shares Issued |
|
| DRP Shares Value |
|
| DRP Shares Issued |
| ||||
April 15, 2022 |
| $ | 7,200 |
|
|
| 286,055 |
|
| $ | 7,200 |
|
|
| 286,055 |
|
July 15, 2022 |
| $ | 9,321 |
|
|
| 373,593 |
|
| $ | 9,321 |
|
|
| 373,593 |
|
October 17, 2022 |
| $ | 8,646 |
|
|
| 377,076 |
|
| $ | 8,646 |
|
|
| 377,076 |
|
December 30, 2022 |
| $ | 18,056 |
|
|
| 801,437 |
|
| $ | 18,056 |
|
|
| 801,437 |
|
April 17, 2023 |
| $ | 13,892 |
|
|
| 637,800 |
| ||||||||
June 28, 2023 |
| $ | 16,789 |
|
|
| 754,571 |
| ||||||||
September 28, 2023 |
| $ | 18,945 |
|
|
| 828,460 |
| ||||||||
December 28, 2023 |
| $ | 31,456 |
|
|
| 1,347,765 |
| ||||||||
|
| $ | 43,223 |
|
|
| 1,838,161 |
|
| $ | 124,305 |
|
|
| 5,406,757 |
|
Note 10. Earnings Per Share
The following table sets forth the computation of basic and diluted earnings per shareShare during the yearyears ended December 31, 2023 and December 31, 2022 and for the period ended December 31, 2021:
|
| For the Year Ended December 31, 2022 |
|
| For the Period Ended December 31, 2021 (1) |
| ||
Net increase in net assets resulting from operations |
| $ | (8,408 | ) |
| $ | 1,998 |
|
Weighted average shares outstanding |
|
| 14,575,572 |
|
|
| 12,000,000 |
|
Earnings per share |
| $ | (0.58 | ) |
| $ | 0.17 |
|
|
| For the Year Ended December 31, 2023 |
|
| For the Year Ended December 31, 2022 |
|
| For the Period Ended December 31, 2021 (1) |
| |||
Net increase in net assets resulting from operations attributable to holders of Common Stock |
| $ | 135,676 |
|
| $ | (8,408 | ) |
| $ | 1,998 |
|
Weighted average shares outstanding |
|
| 29,738,420 |
|
|
| 14,575,572 |
|
|
| 12,000,000 |
|
Earnings per common share |
| $ | 4.56 |
|
| $ | (0.58 | ) |
| $ | 0.17 |
|
Note 11. Taxable/Distributable Income
Prior to January 1, 2022 the Company was setup as a partnership. Taxable information displayed below is for the period commencing after the Company converted to a Corporation.67
The tax character of distributions for the yearyears ended December 31, 2023 and December 31, 2022 waswere as follows:
|
| December 31, 2022 |
|
| December 31, 2023 |
|
| December 31, 2022 |
| |||
Ordinary income (including net short-term capital gains) |
| $ | 44,965 |
|
| $ | 94,428 |
|
| $ | 44,965 |
|
Capital gains |
|
| — |
|
|
| 2,342 |
|
|
| — |
|
Return of capital |
|
| 2 |
|
|
| — |
|
|
| 2 |
|
Total taxable distributions |
| $ | 44,967 |
|
| $ | 96,770 |
|
| $ | 44,967 |
|
The components of Accumulated Earnings (Losses) on a tax basis for the yearyears ended December 31, 2023 and December 31, 2022 were as follows:
|
| December 31, 2022 |
|
| December 31, 2023 |
|
| December 31, 2022 |
| |||
Undistributed ordinary income - net |
| $ | — |
|
| $ | — |
|
| $ | — |
|
Undistributed long-term capital gains |
|
| — |
|
|
| — |
|
|
| — |
|
Total undistributed earnings |
|
| — |
|
|
| — |
|
|
| — |
|
Capital loss carryforward |
|
| — |
|
|
| — |
|
|
| — |
|
Unrealized earnings (losses) - net |
|
| (51,283 | ) |
|
| (13,859 | ) |
|
| (51,283 | ) |
Timing differences |
|
| (2,193 | ) |
|
| (1,484 | ) |
|
| (2,193 | ) |
Total accumulated earnings (losses) - net |
| $ | (53,476 | ) |
| $ | (15,343 | ) |
| $ | (53,476 | ) |
For the yearyears ended December 31, 2023 and December 31, 2022 the Company made the following reclassifications of permanent book to tax basis differences:
|
| December 31, 2022 |
|
| December 31, 2023 |
|
| December 31, 2022 |
| |||
Paid-in capital in excess of par value |
| $ | 2,099 |
|
| $ | 773 |
|
| $ | 2,099 |
|
Net distributable earnings (accumulated losses) |
| $ | (2,099 | ) |
| $ | (773 | ) |
| $ | (2,099 | ) |
The following table reconciles net decrease in net assets resulting from operations to total taxable income and gains available for distributions for the yearyears ended December 31, 2023 and December 31, 2022:
|
| December 31, 2022 |
|
| December 31, 2023 |
|
| December 31, 2022 |
| |||
Net increase (decrease) in net assets resulting from operations |
| $ | (8,408 | ) |
| $ | 135,676 |
|
| $ | (8,408 | ) |
Net change in unrealized appreciation (depreciation) |
|
| 51,283 |
|
|
| (37,095 | ) |
|
| 51,283 |
|
Unearned performance-based incentive fee on unrealized gains |
|
| (256 | ) |
|
| — |
|
|
| (256 | ) |
Basis adjustment for corporate conversion |
|
| (249 | ) |
|
| (795 | ) |
|
| (249 | ) |
Post October loss deferral |
|
| 2,533 |
|
|
| (1,043 | ) |
|
| 2,533 |
|
Other book-tax differences |
|
| 64 |
|
|
| 27 |
|
|
| 64 |
|
Total taxable distributions |
| $ | 44,967 |
|
| $ | 96,770 |
|
| $ | 44,967 |
|
60
The Company’s aggregate unrealized appreciation and depreciation on investments based on cost for U.S. federal income tax purposes for the yearyears ended December 31, 2023 and December 31, 2022 were as follows:
|
| December 31, 2022 |
|
| December 31, 2023 |
|
| December 31, 2022 |
| |||
Tax cost |
| $ | 1,031,935 |
|
| $ | 2,209,358 |
|
| $ | 1,031,935 |
|
Gross unrealized appreciation |
|
| 2,320 |
|
|
| 19,035 |
|
|
| 2,320 |
|
Gross unrealized depreciation |
|
| (52,517 | ) |
|
| (31,340 | ) |
|
| (52,517 | ) |
Net unrealized investment appreciation (depreciation) on investments |
| $ | 981,738 |
| ||||||||
Investments at Fair Value |
| $ | 2,197,053 |
|
| $ | 981,738 |
| ||||
The difference between GAAP-basis tax basis unrealized gains (losses) on our investments is attributable primarily to wash sales,tax basis significant modifications and a step-up in the cost basis of our investments that happened during the corporate conversion. The net mark to market gains (losses)tax unrealized appreciation (depreciation) on investments is $(12.3) million and $(50.2) million as of December 31, 2023, and December 31, 2022, respectively.
foreign currency contracts.
Tax Information (unaudited)
During the year ended December 31, 2022,2023, the Company designated approximately 73%80.4% of its distributions from net investment income as interested related dividends pursuant to Section 871(k) of the Code.
During the year ended December 31, 20222023, the Company designated 95%94.3% of the dividends paid from net investment company taxable income as Section 163(j) Interest Dividends.
Pursuant to Section 852 of the Internal Revenue Code, the Company designated $0,$2.3 million, as capital gain dividends paid during the year ended December 31, 20222023.
During the year ended December 31, 20222023, the Company designated $2.8$0.6 million as short-term capital gain dividends pursuant to Section 871(k) of the Internal Revenue Code.
68
Note 12. Financial Highlights
The following are the financial highlights for the year ended December 31, 2023 and December 31, 2022 and for the period ended December 31, 2021:
|
| Year Ended December 31, 2022 |
|
| Period Ended December 31, 2021 (1) |
|
|
| Year Ended December 31, 2023 |
| Year Ended December 31, 2022 |
| Period Ended December 31, 2021 (1) |
| ||||||||||
Per Share Data: |
|
|
|
|
|
|
|
|
|
|
|
|
|
|
| |||||||||
Net assets, beginning of period |
| $ |
| 25.17 |
|
| $ |
| — |
|
|
| $ |
| 21.78 |
| $ |
| 25.17 |
| $ |
| — |
|
Net investment income (2) |
|
| 2.70 |
|
|
|
| 0.02 |
|
|
|
| 3.23 |
|
|
| 2.70 |
|
|
| 0.02 |
| ||
Net realized gain (loss) (2) |
|
| 0.24 |
|
|
|
| 0.01 |
|
|
|
| 0.08 |
|
|
| 0.24 |
|
|
| 0.01 |
| ||
Net change in unrealized appreciation (depreciation) (3) |
|
|
| (3.52 | ) |
|
|
| 0.14 |
|
|
|
|
| 1.28 |
|
|
| (3.52 | ) |
|
| 0.14 |
|
Net increase in net assets resulting from operations |
|
| (0.58 | ) |
|
|
| 0.17 |
|
|
|
| 4.59 |
|
|
| (0.58 | ) |
|
| 0.17 |
| ||
Distributions declared from net investment income (4) |
|
| (2.88 | ) |
|
| — |
|
|
|
| (3.09 | ) |
|
| (2.88 | ) |
|
| — |
| |||
Issuance of shares |
|
|
| 0.07 |
|
|
|
| 25.00 |
|
|
|
| — |
|
|
| — |
|
|
| 25.00 |
| |
Issuance of shares in connection with our DRP program |
|
|
| (0.02 | ) |
|
| 0.07 |
|
|
| — |
| |||||||||||
Total increase (decrease) in net assets |
|
|
| (3.39 | ) |
|
|
| 25.17 |
|
|
|
|
| 1.48 |
|
|
| (3.39 | ) |
|
| 25.17 |
|
Net assets, end of period |
| $ |
| 21.78 |
|
| $ |
| 25.17 |
|
|
| $ |
| 23.26 |
| $ |
| 21.78 |
| $ |
| 25.17 |
|
Shares outstanding, end of period |
|
| 22,126,135 |
|
|
|
| 12,000,000 |
|
|
|
| 40,279,212 |
|
|
| 22,126,135 |
|
|
| 12,000,000 |
| ||
Total return based on NAV (5) |
|
| (2.46 | ) | % |
|
| 0.68 |
| % |
|
| 22.10 | % |
|
| (2.46 | )% |
|
| 0.68 | % | ||
Ratios: |
|
|
|
|
|
|
|
|
|
|
|
|
|
|
|
| ||||||||
Expenses to average net assets (6) |
|
| 11.28 |
| % |
|
| 11.74 |
| % |
|
| 14.47 | % |
|
| 11.28 | % |
|
| 11.74 | % | ||
Net investment income to average net assets (6) |
|
| 10.77 |
| % |
|
| 6.71 |
| % |
|
| 13.83 | % |
|
| 10.77 | % |
|
| 6.71 | % | ||
Portfolio turnover rate (7) |
|
| 32.49 |
| % |
|
| 0.36 |
| % |
|
| 25.93 | % |
|
| 32.49 | % |
|
| 0.36 | % | ||
Supplemental Data: |
|
|
|
|
|
|
|
|
|
|
|
|
|
|
|
| ||||||||
Net assets, end of period |
| $ |
| 481,846 |
|
| $ |
| 301,998 |
|
|
| $ |
| 937,586 |
| $ |
| 481,846 |
| $ |
| 301,998 |
|
Total capital commitments, end of period |
| $ |
| 1,052,600 |
|
| $ |
| 800,000 |
|
|
| $ |
| 1,444,678 |
| $ |
| 1,052,600 |
| $ |
| 800,000 |
|
Ratios of total contributed capital to total committed capital, end of period |
|
| 46.55 |
| % |
|
| 37.50 |
| % |
|
| 57.11 | % |
|
| 46.55 | % |
|
| 37.50 | % | ||
Average debt outstanding |
| $ |
| 482,333 |
|
| $ |
| 410,000 |
|
|
| $ |
| 804,401 |
| $ |
| 482,333 |
| $ |
| 410,000 |
|
Asset coverage ratio (8) |
|
| 189.7 |
| % |
|
| 173.7 |
| % |
|
| 181.7 | % |
|
| 189.7 | % |
|
| 173.7 | % | ||
Note 13. Subsequent Events
On January 1, 2023,The Company’s management evaluated subsequent events through the Adviser completeddate of March 22, 2024, the previously announced business combination with BDT & Company Holdings, L.P. (the “Transaction”), and its subsidiaries, which includes BDT Capital Partners, LLC (“BDT Capital”), a SEC-registered investment adviser, and BDT & MSD Partners, LLC, a SECdate that the consolidated financial statements were issued.
61
registered broker-dealer and member of the Financial Industry Regulatory Authority (”FINRA”). Upon the closing of the Transaction, BDT & Company Holdings, L.P. was renamed BDT & MSD Holdings, L.P. (“BDT”) and BDT, and its subsidiaries, became affiliates of the Adviser and the Company.
Subsequent to December 31, 2022,2023, the Company invested in the senior secured loans of Cobham Holdings Inc., Wood Mackenzie,Cook & Boardman Group, Alteryx Inc., and DFS Holding Company, Inc.Hotel Equities Group, LLC,
Item 9. Changes in and Disagreements with Accountants on Accounting and Financial Disclosure
None.
Item 9A. Controls and Procedures.
In accordance with Rules 13a-15(b) and 15d-15(b) of the Exchange Act, we, under the supervision and with the participation of our Chief Executive Officer and Chief Financial Officer, carried out an evaluation of the effectiveness of our disclosure controls and procedures (as defined in Rule 13a-15(e) and Rule 15d-15(e) of the Exchange Act) as of the end of the period covered by this Annual Report on Form 10-K and determined that our disclosure controls and procedures are effective as of the end of the period covered by the Annual Report on Form 10-K.
Our management is responsible for establishing and maintaining adequate internal control over financial reporting (as defined in Rules 13a-15(f) and 15d-15(f) of the Exchange Act). The Company’s internal control over financial reporting is a process designed under the supervision of its Chief Executive Officer (Principal Executive Officer) and Chief Financial Officer (Principal Financial Officer) and effected by the Company’s board of directors, management and other personnel, to provide reasonable assurance regarding the reliability of financial reporting and the preparation of its consolidated financial statements for external reporting purposes in accordance with U.S. generally accepted accounting principles.
69
The Company’s internal control over financial reporting includes policies and procedures that: (i) pertain to the maintenance of records that, in reasonable detail, accurately and fairly reflect transactions and dispositions of the Company’s assets; (ii) provide reasonable assurance that transactions are recorded as necessary to permit preparation of consolidated financial statements in accordance with U.S. generally accepted accounting principles, and that receipts and expenditures of the Company are being made only in accordance with authorizations of management and the directors; and (iii) provide reasonable assurance regarding prevention or timely detection of unauthorized acquisition, use or disposition of the Company’s assets that could have a material effect on its consolidated financial statements.
Because of its inherent limitations, internal control over financial reporting may not prevent or detect misstatements. In addition, projections of any evaluation of effectiveness to future periods are subject to the risk that controls may become inadequate because of changes in conditions, or that the degree of compliance with the policies or procedures may deteriorate.
Management (with the participation of our Chief Executive Officer and Chief Financial Officer) conducted an evaluation of the effectiveness of the Company’s internal control over financial reporting as of December 31, 2023 based on the framework established in Internal Control-Integrated Framework (2013) issued by the Committee of Sponsoring Organizations of the Treadway Commission. Based on this assessment, management concluded that the Company’s internal control over financial reporting as of December 31, 2023 was effective.
This annual report does not include a report of management’s assessment regarding internal control over financial reporting or an attestation report of the Company’s registered public accounting firm due to a transition period established by rules of the SEC for newly public companies.
There have been no changes in our internal control over financial reporting (as defined in Rules 13a-15(f) and 15d-15(f) under the Exchange Act) that occurred during the year ended December 31, 20222023 that have materially affected, or are reasonably likely to materially affect, our internal control over financial reporting.
Item 9B. Other Information.
Item 9C. Disclosure Regarding Foreign Jurisdictions that Prevent Inspections. Part III. We will file a definitive Proxy Statement for our 2024 Annual Meeting of Stockholders with the SEC, pursuant to Regulation 14A, within 120 days after the end of our fiscal year-end, which was December 31, 2023. Accordingly, information required by Part III has been omitted under General Instruction G(3) to Form 10-K. Only those sections of our definitive Proxy Statement that specifically address the items set forth herein are incorporated by reference herein. Item 10. Directors, Executive Officers and Corporate Governance. Information in response to this item is incorporated by reference to our Proxy Statement relating to our Information relating to our and the Adviser’s codes of ethics, which apply to, among others, our Chief Executive Officer and Chief Financial Officer, is included in “Part 1, Item 1. Business-Regulation as a Business Development Company-Code of Ethics” of this Form 10-K. Item 11. Executive Compensation. Information in response to this item is incorporated by reference from our Proxy Statement relating to our Item 12. Security Ownership of Certain Beneficial Owners and Management and Related Stockholder Matters. Information in response to this item is incorporated by reference from our Proxy Statement relating to our Item 13. Certain Relationships and Related Transactions, and Director Independence. Information in response to this item is incorporated by reference from our Proxy Statement relating to our Item 14. Principal Accountant Fees and Services. Information in response to this item is incorporated by reference from our Proxy Statement relating to our Part IV. Item 15. Exhibits and Consolidated Financial Statement Schedules. Exhibit Description of Exhibits 3.1 3.2 10.1 10.2 10.3 10.4 10.5 10.6 10.7 10.8 10.9 10.10 10.11 10.12 10.14 10.15 10.16 10.17 10.18 14.1 21.1 31.1 72 31.2 32.1 32.2 101.INS Inline XBRL Instance Document 101.SCH Inline XBRL Taxonomy Extension Schema Inline XBRL Taxonomy Extension Calculation Linkbase Inline XBRL Taxonomy Extension Definition Linkbase Inline XBRL Taxonomy Extension Label Linkbase Inline XBRL Taxonomy Extension Presentation Linkbase Cover page formatted as Inline XBRL and contained in Exhibit 101 * Filed herewith. Item 16. Form 10-K Summary. None. SIGNATURES Pursuant to the requirements of the Securities Exchange Act of 1934, as amended, the registrant has duly caused this report to be signed on its behalf by the undersigned thereunto duly authorized. MSD Investment Corp. Date: March /s/ Robert Platek Robert Platek Chief Executive Officer Date: March /s/ Brian S. Williams Brian S. Williams Chief Financial Officer & Treasurer Pursuant to the requirements of the Securities Exchange Act of 1934, this report has been signed below by the following persons on behalf of the registrant and in the capacities and on the dates indicated. Signature Title Date /s/ Robert Platek March Robert Platek Chief Executive Officer /s/ Brian S. Williams March Brian S. Williams Chief Financial Officer & Treasurer /s/ James Chapman March James Chapman Director /s/ Joseph Branch March Joseph Branch Director /s/ Louisa Rodriguez March Louisa Rodriguez DirectorOn November 11, 2022,a)None.b)For the fiscal quarter ended December 31, 2023, neither the Company and U.S. Bank National Association (the “Custodian”) nor any director or officer has entered into or terminated any (i) contract, instruction or written plan for the first amendmentpurchase or sale of securities intended to satisfy the custody agreement (the “First Amendment to the Custody Agreement”). The terms andaffirmative defense conditions of Rule 10b5-1(c) under the First AmendmentExchange Act or (ii) any non-Rule 10b5-1 trading arrangement.
We have adopted insider trading policies and procedures governing the purchase, sale, and disposition of our securities by our officers and directors that are reasonably designed to the Custody Agreement are substantially identical to those of the custody agreement previously entered into by the Companypromote compliance with insider trading laws, rules and the Custodian on December 9, 2021 (the “Custody Agreement”), except for the Company’s name, due to the Company’s conversion to Maryland corporation, and Section 8.1 of the First Amendment to the Custody Agreement regarding fees. The Board approved the First Amendment to the Custody Agreement on November 8, 2022.regulations.The foregoing description of the First Amendment to the Custody Agreement is a summary only and is qualified in its entirety by reference to the text of the First Amendment to the Custody Agreement, which is filed as Exhibit 10.5 hereto and is incorporated herein by reference.None.Not applicable.627020232024 annual meeting of stockholders. The Proxy Statement will be filed with the SEC within 120 days after the end of the fiscal year covered by this Form 10-K pursuant to Regulation 14A under the Exchange Act.20232024 annual meeting of stockholders.20232024 annual meeting of stockholders.20232024 annual meeting of stockholders.20232024 annual meeting of stockholders.6371
Number4.13.310.14.131.110.136473657423, 202322, 202423, 202322, 202423, 202322, 202423, 202322, 202423, 202322, 202423, 202322, 202423, 202322, 20246675