UNITED STATES
SECURITIES AND EXCHANGE COMMISSION
Washington, D.C. 20549
FORM 10-K
x ANNUAL REPORT PURSUANT TO SECTION 13 OR 15(d) OF THE SECURITIES EXCHANGE ACT OF 1934
For the fiscal year ended December 31, 20062007
OR
OR
¨o TRANSITION REPORT PURSUANT TO SECTION 13 OR 15(d) OF THE SECURITIES EXCHANGE ACT OF 1934
For the transition period from to_________to___________
Commission file number 0-23486
Commission file number 0-23486
NN, INC.
(Exact name of registrant as specified in its charter)
Delaware
| Delaware | | 62-1096725 | |
(State
| (State or other jurisdiction of incorporation or rganization)organization) | | (I.R.S. (I.R.S. Employer Identification No.)
|
2000 Waters Edge Drive
| |
| | | | |
| 2000 Waters Edge Drive | | 37604 | |
| Johnson City, Tennessee | 37604
| (Zip Code) | |
| (Address of principal executive offices) | (Zip Code)
| | |
Registrant’sRegistrant's telephone number, including area code: (423) 743-9151
Securities registered pursuant to Section 12(b) of the Act:
| Title of each class |
| Name of each exchange on which registered | |
| Common Stock, par value $.01 | | The NASDAQ Stock Market LLC | |
Securities registered pursuant to Section 12(g) of the Act:
None
None
(Title of class)
Indicate by check mark if the registrant is a well-known seasoned issuer, as defined in Rule 405 of the Securities Act.
Yes ¨ No x
Indicate by check mark if the registrant is not required to file reports pursuant to Section 13 or Section 15(d) of the Act.
Yes ¨ No x
Indicate by check mark whether the registrant (1) has filed all reports required to be filed by Section 13 or 15(d) of the Securities and Exchange Act of 1934 during the preceding 12 months (or for such shorter period that the registrant was required to file such reports), and (2) has been subject to such filing requirements for the past 90 days.
Yes x No ¨
Indicate by check mark if disclosure of delinquent filers pursuant to Item 405 of Regulation S-K is not contained herein, and will not be contained, to the best of registrant’sregistrant's knowledge, in definitive proxy or information statements incorporated by reference in Part III of this Form 10-K or any amendment to this Form 10-K. x
Indicate by check mark whether the registrant is a large accelerated filer, an accelerated filer, a non-accelerated filer or a non-accelerated filer.smaller reporting company. See definition of “large accelerated filer,” “accelerated filerfiler” and large accelerated filer”“smaller reporting company” in Rule 12b-2 of the Exchange Act. (Check one):
Large accelerated filer ¨ Accelerated filer x Non-accelerated filer ¨ Smaller reporting Company ¨
Indicate by check mark whether the registrant is a shell company (as defined in Rule 12b-2 of the Act). Yes ¨No x
The aggregate market value of the voting stock held by non-affiliates of the registrant at June 30, 2006,2007, based on the closing price on the NASDAQ Stock Market LLC on that date was approximately $184,144,653.$176,899,780.
The number of shares of the registrant’sregistrant's common stock outstanding on March 12, 2007 2008 was 16,854,616.15,854,643.
DOCUMENTS INCORPORATED BY REFERENCE
Portions of the Proxy Statement with respect to the 20072008 Annual Meeting of Stockholders are incorporated by reference in Part III of this Form 10-K.
Part
PART I
NN, Inc. manufactureshas three operating segments, the Metal Bearing Components Segment, the Plastic and suppliesRubber Components Segment, and the Precision Metal Components Segment. Within the Metal Bearing Components Segment, we manufacture and supply high precision bearing components, consisting of balls, cylindrical rollers, tapered rollers, seals, and plastic and metal retainers, for leading bearing manufacturers on a global basis. We are a leading independent manufacturer of precision steel bearing balls and rollers for the North American, European and EuropeanAsian markets. Our core business is the manufacture and saleIn 2007, Metal Bearing Components accounted for 72% of high quality, precision ball and roller bearing components including steel balls and rollers. In 2006, salestotal NN, Inc. sales. Sales of balls and rollers accounted for approximately 78%66% of the Company’sour total net sales with 58% and 20%48% of sales from balls and rollers, respectively.18% of sales from rollers. Sales of metal bearing retainers accounted for 6% of net sales and sales of precision molded plastic and rubber parts accounted for the remaining 16%.sales. See Note 13 of the Notes to Consolidated Financial Statements. In 1998, we began implementing a strategic plan designed to position us as a worldwide manufacturer and supplier of a broad line of bearing components and other precision plastic components. Through a series of acquisitions executed as part of that plan, we have built upon our strong core ball business and expanded our bearing component product offering. Today, we offer among the industry’s most complete line of commercially available bearing components. We emphasize engineered products that take advantage of our competencies in product design and tight tolerance manufacturing processes. Our bearing customers use our components in fully assembled ball and roller bearings, which serve a wide variety of industrial applications in the transportation, electrical, agricultural, construction, machinery, mining and aerospace markets. As used in this Annual Report on Form 10-K, the terms “NN”, “the Company”, “we”, “our”, or “us” mean NN, Inc. and its subsidiaries.
Within the Plastic and Rubber Components Segment, we manufacture high precision rubber seals and plastic retainers for leading bearing manufacturers on a global basis. In the fourth quarteraddition, we manufacture specialized plastic products including automotive components, electronic instrument cases and precision electronic connectors. We also manufacture rubber seals for use in various industrial applications. In 2007, plastics products accounted for 7% of 2005,net sales and rubber seals accounted for 5% of net sales.
In 2006, we developed a new five-year strategic business plan driven by perceived slower growth in the metal bearing components market and a need to create diversification in served customers and end markets. NN began to execute on this strategya new five year strategic business plan to leverage our competencies in 2006.precision metal products by creating an adjacent platform to bearing components which would broaden our reach into attractive end markets. As part of this new strategy, on November 30, 2006, we added a precision metal components product linePrecision Metal Components Segment through the acquisition of Whirlaway Corporation (“Whirlaway”) (see(See Note 2 of the Notes to Consolidated Financial Statements).Statements.) Whirlaway is a high precision metal components and assemblies manufacturer that supplies customers serving the air conditioning, appliance, automotive, commercial refrigeration and diesel engine industries. ThisOur entry into the precision metal components market is part of our new strategy to serve markets and customers we view as adjacent to bearing components that utilize our core manufacturing competencies. Management views this new product line as a new segment entitled "Precision Metal Components" and has retained Whirlaway management to run the segment.These products accounted for 16% of net sales in 2007.
For managerial and financial analysis purposes, management viewsThe three business segments are composed of the Company’s operation in three reporting segments: thefollowing manufacturing operations of Erwin, Tennessee and Mountain City, Tennessee, our plant in China, the European facilities of Kilkenny, Ireland; Eltmann, Germany; Pinerolo, Italy; Veenendaal, The Netherlands and Kysucke Nove Mesto, Slovakia (“operations:
Metal Bearing Components Segment”), the operations of Industrial Molding Corporation (“IMC”) and The Delta Rubber Company (“Delta”) (collectively “PlasticSegment
| · | Erwin, Tennessee Ball and Roller Plant (“Erwin Plant”) |
| · | Mountain City, Tennessee Ball Plant (“Mountain City Plant”) |
| · | Kilkenny, Ireland Ball Plant (“Kilkenny Plant”) |
| · | Eltmann, Germany Ball Plant (“Eltmann Plant”) |
| · | Pinerolo, Italy Ball Plant (“Pinerolo Plant”) |
| · | Veenendaal, The Netherlands Roller and Stamped Metal Parts Plant (“Veenendaal Plant”) |
| · | Kysucke Nove Mesto, Slovakia Ball Plant (“Kysucke Plant”) |
| · | Kunshan, China Ball Plant (“Kunshan Plant”) |
Plastic and Rubber Components Segment”), and beginning November 30, 2006, the operations of WhirlawaySegment
| · | Delta Rubber Company, Danielson, Connecticut Rubber Seal Plant (“Danielson Plant”) |
| · | Industrial Molding Corporation, Inc. Lubbock, Texas Plastic Injection Molding Plant (“Lubbock Plant”) |
Precision Metal Components Segment”). Segment
| · | Whirlaway Corporation, Wellington, Ohio Metal Components Plant 1 (“Wellington Plant 1”) |
| · | Whirlaway Corporation, Wellington, Ohio Metal Components Plant 2 (“Wellington Plant 2”) |
| · | Whirlaway Corporation, Hamilton, Ohio Metal Components Plant (“Hamilton Plant”) |
| · | Whirlaway Corporation, Tempe, Arizona Metal Components Plant, formerly known as Triumph LLC (“Tempe Plant”) |
Financial information about the segments is set forth in Note 13 of the Notes to Consolidated Financial Statements.
Recent Developments
On November 30, 2006, we purchased 100% of the stock of Whirlaway Corporation from its sole shareholder for approximately $45.6$43.0 million. Whirlaway manufactures precision metal components for the automotive and industrial end markets. Whirlaway operates three manufacturing plants in Ohio and one in Arizona.
In January 2007, we entered into a two year suppliersupply agreement with Schaeffler Group, (INA)our second largest customer, effective as of July 1, 2006 that replaced the agreement that expired on June 30, 2006.
In February 2006, we reached an informal agreement in principle to extend our supply agreementMay 2007, a new multi-year contract was signed with AB SKF, (“SKF”) until the end of 2006. The agreement would have expired on July 31, 2006. SKF is a global bearing manufacturer and our largest customer. We are currentlycustomer, to supply precision balls in discussionsEurope with SKFterms retroactive to formally extend the agreement through the end of 2009January 1, 2007 and expect conclusion during the first half of 2007.effective until December 31, 2009.
On October 7, 2005, we entered into an agreement with SNR Roulements (“SNR”) to purchase SNR’s entire internal precision ball producing equipment for approximately 5.2 million Euros ($6.2 million). SNR a division of Renault SA, France, is a global bearing manufacturer and supplier to the automotive, industrial and aerospace industries. As part of the transaction, we received a three -yearthree-year supply agreement for the present business existing at the time of the acquisition (approximately $8.0 million)million in annual revenue) and a five-year supply agreement to provide SNR with its annual ball requirements of theits former in-house production of approximately(approximately $9.0 million. The product will be supplied from our European existing precision ball operations.million in annual revenue).
During 2004, we formed a wholly owned subsidiary, NN Precision Bearing Products Company Co., Ltd, (“NN Asia)”. This subsidiary, which began production of precision balls during the fourth quarter of 2005, is located in the Kunshan Economic and Technology Development Zone, Jiangsu, The People’s Republic of China and is a component of our strategy to globally expand our manufacturing base. The costs incurred as a result of this start-up are included in our Metal Bearing Components Segment during the years ended December 31, 2005 and 2004.
Corporate Information
NN, originally organized in October 1980, is incorporated in Delaware. Our principal executive offices are located at 2000 Waters Edge Drive, Johnson City, Tennessee, and our telephone number is (423) 743-9151. Our web site address is www.nnbr.com. Information contained on our web site is not part of this Annual Report. Our annual report on Form 10-K, quarterly reports on Form 10-Q, current reports on Form 8-K and related amendments thereto are available via a link to “SEC.gov” on our web site under “Investor Relations.”
Products
Metal Bearing Components Segment
Precision Steel Balls. At our Metal Bearing Components Segment facilities, we manufacture and sell high quality, precision steel balls in sizes ranging in diameter from 5/32 of an inch (3.969mm) to 2 ½ inches.inches (63.5mm). We produce and sell balls in grades ranging from grade 3 to grade 1000, according to international standards endorsed by the American Bearing Manufacturers Association. The grade number for a ball, in addition to defining allowable dimensional variation within production batches, indicates the degree of spherical precision of the ball; for example, grade 3 balls are manufactured to within three-millionths of an inch of roundness. Our steel balls are used primarily by manufacturers of anti-friction bearings where precise spherical, tolerance and surface finish accuracies are required. At the domestic locations, sales of steel balls accounted for approximately 80%77%, 87%,80% and 86%87% of net sales in 2007, 2006, 2005, and 20042005 respectively. At the European locations, sales of steel balls accounted for approximately 67%65%, 65%67%, and 68%65% of net sales in 2007, 2006 2005 and 2004,2005, respectively.
Steel Rollers. We manufacture tapered rollers at our Veenendaal Plant and cylindrical rollers at our Erwin Tennessee facility. Cylindrical rollers are normally defined by the combination of diameter and length.Plant. Most cylindrical rollers are made to specific customer requirements for diameter and length, so there is very little overlap of common cylindrical rollers matching two or more customers’ needs. The Company has experienced minimal roller product returns and does not have any customer acceptance clauses. Rollers are an alternative rolling element used instead of balls in anti-friction bearings that typically have heavier loading or different speed requirements. Our roller products are used primarily for applications similar to those of our precision steel ball product lines,line, plus certain non-bearing applications such as hydraulic pumps and motors. Cylindrical rollers accounted for approximately 4%, 4%, and 3% of net sales in each year of 2007, 2006, and 2005, and 2004, respectively. We manufacture tapered rollers at our Veenendaal, The Netherlands facility. These taperedTapered rollers are used in tapered roller bearings that are used in a variety of applications including automotive gearbox applications, automotive wheel bearings and a wide variety of industrial applications. Tapered rollers accounted for approximately 16%14%, 16% and 14%16% of net sales in 2007, 2006 2005 and 2004,2005, respectively.
Bearing Seals. AtMetal Retainers. We manufacture and sell precision metal retainers for ball and roller bearings used in a wide variety of industrial applications. Retainers are used to separate and space the rolling elements (balls or rollers) within a fully assembled bearing. We manufacture metal retainers at our Veenendaal Plant.
Plastic and Rubber Components Segment’sSegment
Bearing Seals. At our Danielson Connecticut facilities,Plant, we manufacture and sell a wide range of precision bearing seals produced through a variety of compression and injection molding processes and adhesion technologies to create rubber-to-metal bonded bearing seals. The seals are used in applications for automotive, industrial, agricultural, mining and aerospace markets.
Plastic Retainers.We manufacture and sell precision metal and plastic retainers for ball and roller bearings used in a wide variety of industrial applications. Retainers are used to separate and space the rolling elements (balls or rollers) within a fully assembled bearing. We manufacture plastic retainers at our Lubbock Texas facilities and metal retainers at our Veenendaal, The Netherlands facility.Plant.
Precision Plastic Components. Components. At our Plastic and Rubber Components Segment’s Lubbock Texas facilities,Plant, we also manufacture and sell a wide range of specialized plastic products including automotive under-the-hood components, electronic instrument cases and precision electronic connectors and lenses, as well as a variety of other specialized parts.
Precision Metal Components Segment
Precision Metal Components. Beginning with the purchase of Whirlaway Corporation on November 30, 2006, we began to sell a wide range of precision metal components. These components are manufactured at the three Whirlaway plants in Ohio and theone plant in Arizona. The precision metal components offered include fluid control components, fluid control assemblies, shafts, and other precision metal parts. The components are used in the following end markets: automotive brake/chassis, thermal air conditioning systems, commercial refrigeration, automotive engine, diesel engine fuel systems, other automotive, and other industrial applications.
Research and Development.
The amounts spent on research and development activities by us during each of the last three fiscal years are not material. Amounts spent areWe expensed amounts as incurred.
Customers
Our bearing component products are supplied primarily to bearing manufacturers for use in a broad range of industrial applications, including transportation, electrical, agricultural, construction, machinery, mining and aerospace. Additionally, we supply precision metal, rubber, and plastic components to automotive and industrial companies that are not used in bearing assemblies. We supply over 400approximately 500 customers; however, our top 10 customers account for approximately 81%75% of our revenue. Only twoone of these customers, SKF, and Schaeffler Group (INA), had sales levels that were 10% or greater of total net sales. In 2006, 30%2007, 33% of our products were sold to customers in North America, 59%51% to customers in Europe, and the remaining 11%16% to customers located throughout the rest of the world, primarily Asia.Asia and Latin America. Sales to various U.S. and foreign divisions of SKF accounted for approximately 46%40% of net sales in 2006 and sales to Schaeffler Group (INA) accounted for approximately 11% of net sales in 2006. None of our other customers accounted for more than 10% of our net sales in 2006.2007.
Certain customers have contracted to purchase all or a majority of their bearing component requirements from us, although only a few are contractually obligated to purchase any specific amounts. Certain agreements are in effect with some of our largest customers, which provide for targeted, annual price adjustmentsprices that may be offset by material cost fluctuations. We ordinarily ship our products directly to customers within 60 days, and in some cases, during the same calendar month, of the date on which a sales order is placed. Accordingly, we generally have an insignificant amount of open (backlog) orders from customers at month end. At the U.S. operations of our Metal Bearings Component Segment, we maintain a computerized, bar coded inventory management system with many of our major customers that enables us to determine on a day-to-day basis the amount of these components remaining in a customer’s inventory. When such inventories fall below certain levels, shipment of additional product is automatically triggered.shipped.
In 2006, the original six-year supply agreements for precision steel balls with SKF and Schaeffler Group (INA) expired. Prior to 2006, Schaeffler Group (INA) decided to in-source approximately one third of annual volume to its internal ball manufacturing facility in Germany, which during 2005 and 2006 resulted in a $9.0 million reduction in sales to Schaeffler Group (INA), or about 20% of our business with Schaeffler Group (INA). In January 2007, we entered into a new two-year agreement with Schaeffler Group (INA) effective as of July 1, 2006 providing for sales levels consistent with the indicated reduction in sales. A2006. In May 2007, a new multi-year formal agreementcontract was signed with SKF has not yet been signed. Into supply precision balls in Europe we continue to sell to SKF under an informal agreement matching thewith terms of the expired agreement. A new contract is still being negotiated and expected to be finalized in the first half of 2007, the terms of which will be retroactiveretroactively applied to January 1, 2007.2007 and effective until December 31, 2009.
In 2003, Veenendaalwe entered into a five-year supply agreement with SKF providing for the purchase of steel rollers and metal retainers manufactured at our Veenendaal facilityPlant in amounts and at prices that are subject to adjustment on an annual basis. The agreement contains provisions obligating Veenendaalus to maintain specified quality standards and comply with various ordering and delivery procedures, as well as other customary provisions. This agreement expires during 2008.2008 and we are in the process of negotiating a new multi-year agreement with SKF covering tapered rollers and metal retainers.
During 2006,2007, the Metal Bearing Components Segment sold products to more than 350approximately 400 customers located in 33 different countries. Approximately 88%89% of the net sales in 20062007 were to customers outside the United States. Approximately 71% of net sales in 20062007 were to customers within Europe. Sales to the top ten customers accounted for approximately 88%82% of the net sales in 2006.2007. Sales to SKF and Schaeffler Group (INA) accounted for approximately 55% and 13% of net sales of the segment in 2006, respectively. Sales to SKF and Schaeffler Group (INA) in Europe are made pursuant to the terms of supply agreements.2007.
During 2006,2007, the Plastic and Rubber Components Segment sold its products to over 70 customers located principally in 10 different countries.North America. Approximately 23%22% of the Plastic and Rubber Components SegmentSegment’s net sales were to customers outside the United States, almost all to customers in Mexico and Canada. Sales to the Segment’s top ten customers accounted for approximately 74% of the Segment’s net sales in 2007.
During 2007, the Precision Metal Components Segment sold its products to 16 customers located in 7 countries. Approximately 95% of all sales were to customers located within the United States. Sales to the segment’s top ten customers accounted for approximately 76%88% of the segment’s net sales in 2006.2007.
In both the foreign and domestic markets, the Companywe principally sells itssell our products directly to manufacturers and doesdo not sell significant amounts through distributors or dealers.
See Note 13 of the Notes to Consolidated Financial Statements and “Management’s"Management's Discussion and Analysis of Financial Condition and Results of Operations -- Results of Operations”Operations" for additional segmentSegment financial information.
The following table presents a breakdown of our net sales for fiscal years 2007, 2006 2005 and 2004:2005:
(In Thousands) | | 2007 | 2006 | 2005 |
| | 2006 | 2005 | 2004 | |
| | | |
| Metal Bearing Components Segment | $272,299 | $ 263,485 | $ 252,365 | $ 303,059 | $ 272,299 | $ 263,485 |
| Percentage of Total Sales | 82.4% | 82.0% | 83.0% | 72.0% | 82.4% | 82.0% |
| | | |
| Precision Metal Components Segment | 4,722 | -- | -- | 67,384 | 4,722 | -- |
| Percentage of Total Sales | 1.4% | -- | -- | 16.0% | 1.4% | -- |
| | | |
| Plastic and Rubber Components Segment | 53,304 | 57,902 | 51,724 | 50,851 | 53,304 | 57,902 |
| Percentage of Total Sales | 16.2% | 18.0% | 17.0% | 12.0% | 16.2% | 18.0% |
| | | |
| Total | $ 330,325 | $ 321,387 | $ 304,089 | $ 421,294 | $ 330,325 | $ 321,387 |
| | | |
Percentage of Total Sales | 100% | 100% |
The increase in value of Euro denominated sales resulted in net sales increasing $19.6 million in 2007 and $1.6 million in 2006 when converted to U.S. Dollars.
The Precision Metal Components Segment contains only one month of revenue in 2006. Based on pro-forma results, 2006 revenues would have been $77,713 or 19% of the total pro-forma sales. (See Note 2 of the Notes to Consolidated Financial Statements)
Sales and Marketing
A primary emphasis of our marketing strategy is to expand key customer relationships by offering high quality, high precision products with the value of a single supply chain partner for a wide variety of components. As a result, we have progressed toward integrating our sales organization on a global basis across all of our product lines. Within the Metal BearingsBearing Components Segment, our global sales organization includes eleven11 direct sales and fourteen15 customer service representatives. Due to the technical nature of many of our products, our engineers and manufacturing management personnel also provide technical sales support functions, while internal sales employees handle customer orders and other general sales support activities. For the Precision Metal Components Segment, the current sales structure consists of utilizing manufacturers’ representatives at key accounts supported by senior segment management and engineering involvement.
Ourbearing component Metal Bearing Component Segment marketing strategy focuses on increasing our outsourcing relationships with global bearing manufacturers that maintain captive bearing component manufacturing operations. Our marketing strategy for our precision plastic productsthe Plastic and precision metal componentsRubber Components Segment and the Precision Metal Components Segment is to offer custom manufactured, high quality, precision parts to niche markets with high value-added characteristics at competitive price levels. This strategy focuses on relationships with key customers that require the production of technically difficult parts and assemblies, enabling us to take advantage of our strengths in custom product development, tool design, and precision molding and machining processes.
Our arrangements with our domestic customers typically provide that payments are due within 30 days following the date of shipment of goods. With respect to foreign customers of our domestic business, payments generally are due within 90 to 120 days following the date of shipment in order to allow for additional freight time and customs clearance. For some customers that participate in our inventory management program, sales are recorded when the customer uses the product. See “Business"Business -- Customers”Customers" and “Management’s"Management's Discussion and Analysis of Financial Condition and Results of Operations -- Liquidity and Capital Resources.”"
Manufacturing Process
We have become a leading independent bearing component manufacturer through exceptional service and high quality manufacturing processes and are recognized throughout the industry as a low-cost producer. Because our ball and roller manufacturing processes incorporate the use of standardized tooling, load sizes, and process technology, we are able to produce large volumes of products while maintaining high quality standards.
The key to our low-cost, high quality production of seals and retainers is the incorporation of customized engineering into our manufacturing processes, metal to rubber bonding competency and experience with a broad range of engineered resins. This design process includes the testing and quality assessment of each product.
TheWithin the precision metal components industry continues to be challenged by rapid globalization. Our company iswe are well positioned in the marketplacemarket place by virtue of our focus on critical components and assemblies for highly engineered mechanical systems used in various durable goods.
Employees
As of December 31, 2006,2007, we employed a total of 2,2492,223 full-time employees. Our Metal Bearing Components Segment employed 282 workers283 in the U.S., 951 workers975 in Europe, and 54 workers80 in China, our Plastic and Rubber Components Segment employed 381 workers, and343, all in the U.S., our Precision Metal Components Segment employed 534, all in the U.S. In addition, there were 98 employees at the Company’sour corporate headquarters. Additionally on November 30, 2006, we added 572 full-time employees with the acquisition of Whirlaway. Of our total employment, 16%17% are management/staff employees and 84%83% are production employees. We believe we are able to attract and retain high quality employees because of our quality reputation, technical expertise, history of financial and operating stability, attractive employee benefit programs, and our progressive, employee-friendly working environment. The employees in the Eltmann Germany,Plant, Pinerolo Italy,Plant and Veenendaal The Netherlands plantsPlant are unionized. We have stronggood labor relations, and the Company haswe have never experienced any significant involuntary work stoppages. We consider our relations with our employees worldwide to be excellent.
We are currently in negotiationssigned a new agreement with the union representatives of our workers at our Eltmann Germany facilityPlant for significant contract revisions including loweringnew wage rates and increasingincreased working hours worked per week. We expect the negotiations to be complete in 2007.during February 2008.
Competition
The precision ball and roller and metal retainer industryMetal Bearing Components Segment of our business is intensely competitive. Our primary domestic competitor is Hoover Precision Products, Inc., a wholly owned USU.S. subsidiary of Tsubakimoto Precision Products Co. Ltd. Our primary foreign competitors are Amatsuji Steel Ball Manufacturing Company, Ltd. (Japan), a wholly owed division of NSK, and Tsubakimoto Precision Products Co. Ltd (Japan) and Jingsu General Ball and Roller (China.)(China).
We believe that competition within the precision ball, roller and metal retainer marketsMetal Bearing Components Segment is based principally on quality, price and the ability to consistently meet customer delivery requirements. Management believes that our competitive strengths are our precision manufacturing capabilities, our wide product assortment, offering capabilities, our reputation for consistent quality and reliability, and the productivity of our workforce.
The markets for the Plastic and Rubber Components Segment’s products are also intensely competitive. Since the plastic injection molding industry is currently very fragmented, IMCwe must compete with numerous companies in each of its marketing segments. Many of these companies have substantially greater financial resources than we do and many currently offer competing products nationally and internationally. IMC’sOur primary competitor in the plastic bearing retainer segment is Nakanishi Manufacturing Corporation. Domestically, Nypro, Inc. and Key Plastics are among the main competitors in the automotive market.
We believe that competition within the plastic injection molding industry is based principally on quality, price, design capabilities and speed of responsiveness and delivery. Management believes that IMC’sour competitive strengths are product development, tool design, fabrication, and tight tolerance molding processes. With these strengths, IMC haswe have built itsour reputation in the marketplace as a quality producer of technically difficult products.
While intensely competitive, the markets for Delta’sour rubber seal products are less fragmented than IMC’s.its plastic injection molding products. The bearing seal market is comprised of approximately six major competitors that range from small privately held companies to Fortune 500large global enterprises. Bearing seal manufacturers compete on design, service, quality and price. Delta’sOur primary competitors in the United StatesU.S. bearing seal market are Freudenburg-NOK, Chicago Rawhide Industries (an SKF subsidiary), Trostel, and Uchiyama.
In the Precision Metal Components Segment market, internal production of components by our customers can impact our business as the customers weigh the risk of outsourcing strategically critical components or producing them in-house. Our primary competitors are Linamar (Canada), Stanadyne, A. Berger, C&A Tool, American Turned Products Autocam and FCMP.Autocam. We generally win new business on the basis of our technical competence and our proven track record of successful product development.
Raw Materials
The primary raw material used in our core ball and roller business of the Metal Bearing Components Segment is 52100 Steel, which is high quality chromium steel. During 2006,2007, approximately 90% of the steel used by the segment was 52100 Steel in rod and wire form. Our other steel requirements include metal strips,strip, chrome rod and wire, and type S2 rock bit steel.
The Metal Bearing Components Segment locations purchase substantially all of their 52100 Steel requirements from mills in Europe and Japan and all of their metal stripsstrip requirements from European mills and traders. The principal suppliers of 52100 Steel in the U.S. are Daido Steel Inc. (America), Kobe Steel, America, Lucchini USA Inc. (affiliate of Ascometal France) and Ohio Star Forge Co. The principal supplier of 52100 Steel in Europe is Ascometal France (See Note 16 of the Notes to Consolidated Financial Statements), while the principal supplier of metal stripsstrip is Thyssen. Our other steel requirements are purchased principally from foreign steel manufacturers. There are a limited number of suppliers of the 52100 Steel that we use. We believe that if any of our current suppliers were unable to supply 52100 Steel to us, we would be able to obtain our 52100 Steel requirements from alternate sources. We are unable, however, to provide assurances that we would not face higher costs or production interruptions as a result of obtaining 52100 Steel from alternate sources.
We purchase steel on the basis of price and, more significantly, composition and quality. The pricing arrangements with our suppliers are typically subject to adjustment every three to six months in the U.S. and contractually adjusted on an annual basis within the European locations.locations for the base steel price and quarterly for surcharge adjustments for precision steel balls. In general, we do not enter into written supply agreements with suppliers or commit to maintain minimum monthly purchases of steel except for the supply arrangements between Ascometal and our Metal Bearing Components Segment (see Note 16 of the Notes to Consolidated Financial Statements).
Because 52100 Steel is principally produced by foreign manufacturers, the Company’sour operating results would be negatively affected in the event that the U.S. or European governments impose any significant quotas, tariffs or other duties or restrictions on the import of such steel, if the U.S. dollarDollar decreases in value relative to foreign currencies or if supplies available to us would significantly decrease. The relatively weak USU.S. Dollar is a factor for steel price increases since the suppliers’suppliers' base currencies are the Euro and Japanese Yen.
The price of steel stabilized during 2006. Previously our business wasMetal Bearing Components Segment is affected by upward price pressure on steel principally due to general increases in global demand and, more recently, due to China’s increased consumption of steel. This had thehas an impact of increasing steel prices we paidpay in procuring our steel in the form of higher unit prices and scrap surcharges. Our contracts with key customers allow us to pass a majority of thealong steel price increases on to those customers. However, for our European locations, material price changes are typically passed along with price adjustments in January of the following year. Starting in 2007, scrap surcharge inflation, a component of raw material cost, can be passed through quarterly. Until increases can be passed through to our customers, income from operations, net income and cash flow from operations can be adversely affected.as incurred.
For the Plastic and Rubber Components Segment, we base purchase decisions on price, quality and service. Generally, we do not enter into written supply contracts with our suppliers or commit to maintain minimum monthly purchases of resins.resins or rubber compounds. The pricing arrangements with our suppliers typically can be adjusted at anytime.
The primary raw materials used by IMCthe Plastic and Rubber Components Segment are engineering resins. Injectionengineered resins, injection grade nylon is utilized in bearing retainers, gears, automotive and other industrial products.proprietary rubber compounds. We purchase substantially all of our resin requirements from domestic manufacturers and suppliers. The majority of these suppliers are international companies with resin manufacutringmanufacturing facilities located throughout the world.
Delta uses We use certified vendors to provide a custom mix of proprietary rubber compounds. DeltaThis Segment also procures metal stampings from several domestic suppliers.
The Precision Metal Components Segment produces products from a wide variety of metals in various forms from various sources. Basic types include HRS, CRS,hot rolled steel, cold rolled steel, (both carbon and alloy) Stainless, Extruded Aluminum, Diecast Aluminum, Graystainless, extruded aluminum, diecast aluminum, gray and Ductile Iron Castings,ductile iron castings, and mechanical tubing. Some material is purchased directly under customer global contracts, some is consigned by the customer, and some is purchased directly from a mill.
Patents, Trademarks and Licenses
We do not own any U.S. or foreign patents, trademarks or licenses that are material to our business. We do rely on certain data and processes, including trade secrets and know-how, and the success of our business depends, to some extent, on such information remaining confidential. Each executive officer is subject to a non-competition and confidentiality agreement that seeks to protect this information.
Seasonal Nature of Business
Historically, due to a substantial portion of sales to European customers, seasonality has been a factor for our business in that some European customers typically reduce their production activities during the month of August.
Environmental Compliance
Our operations and products are subject to extensive federal, state and local regulatory requirements both domestically and abroad relating to pollution control and protection of the environment. We maintain a compliance program to assist in preventing and, if necessary, correcting environmental problems. TheIn the Metal Bearing Components Segment plants inthe Eltmann Germany;Plant, Kilkenny Ireland;Plant, and Pinerolo ItalyPlant are ISO 14000 certified and received the EPD (Environmental Product Declaration.) The Veenendaal The Netherlands plantPlant is also ISO 14000 certified. Based on information compiled to date, management believes that our current operations are in substantial compliance with applicable environmental laws and regulations, the violation of which would have a material adverse effect on our business and financial condition. The Company hasWe have assessed conditional asset retirement obligations and have found them to be immaterial to the consolidated financial statements. There can be no assurance,We cannot assure you, however, that currently unknown matters, new laws and regulations, or stricter interpretations of existing laws and regulations will not materially affect our business or operations in the future. More specifically, although we believe that we dispose of wastes in material compliance with applicable environmental laws and regulations, there can be no assurancewe cannot assure you that we will not incur significant liabilities in the future in connection with the clean-up of waste disposal sites. The Company maintainsWe maintain long-term environmental insurance covering the four manufacturing locations purchased with the Whirlaway acquisition.
Executive Officers of the Registrant
Our executive officers are:
Name | Age | Position |
| | | |
| Roderick R. Baty | 5354 | Chairman of the Board, Chief Executive Officer President and DirectorPresident |
| Frank T. Gentry, III | 5152 | Vice President -– General Manager U.S. Ball and Roller Division |
| Robert R. Sams | 4950 | Vice President -– Sales |
| James H. Dorton | 5051 | Vice President -– Corporate Development and Chief Financial Officer |
| William C. Kelly, Jr. | 4849 | Vice President -– Chief Administrative Officer, Secretary, and Treasurer |
| Nicola Trombetti | 4647 | Vice President -– Managing Director of NN Europe |
| Thomas G. Zupan | 5152 | Vice President -– President of Whirlaway Corporation |
David M. GilsonJames Anderson | 4243 | Vice President - Global Marketing |
James Anderson | 42 | Vice President -– Plastic and Rubber DivisionComponents and Precision Metal Components Divisions |
Set forth below is certain additional information with respect to each of our executive officers.
Roderick R. Baty was elected Chairman of the Board in September 2001 and continues to serve as Chief Executive Officer and President. He has served as President and Chief Executive Officer since July 1997. He joined NN in July 1995 as Vice President and Chief Financial Officer and was elected to the Board of Directors in 1995. Prior to joining NN, Mr. Baty served as President and Chief Operating Officer of Hoover Precision Products from 1990 until January 1995, and as Vice President and General Manager of Hoover Group from 1985 to 1990.
Frank T. Gentry, III, was appointed Vice President -– General Manager U.S. Ball and Roller Division in August 1995. Mr. Gentry joined NN in 1981 and held various manufacturing management positions within NN from 1981 to August 1995.
Robert R. Sams joined NN in 1996 as Plant Manager of the Mountain City, Tennessee facility. In 1997, Mr. Sams served as Managing Director of the Kilkenny facility and in 1999 was elected to the position of Vice President -– Sales. Prior to joining NN, Mr. Sams held various positions with Hoover Precision Products from 1980 to 1994 and as Vice President of Production for Blum, Inc. from 1994 to 1996.
James H. Dorton joined NN as Vice President of Corporate Development and Chief Financial Officer in June 2005. Prior to joining NN, Mr. Dorton served as Executive Vice President and Chief Financial Officer of Specialty Foods Group, Inc. from 2003 to 2004, Vice President Corporate Development and Strategy and Vice President -– Treasurer of Bowater Incorporated from 1996 to 2002 and as Treasurer of Intergraph Corporation from 1989 to 1996. Mr. Dorton is a Certified Public Accountant.
William C. Kelly, Jr. was named Vice President and Chief Administrative Officer in June 2005. In March 2003, Mr. Kelly was elected to serve as Chief Administrative Officer. In March 1999, he was elected Secretary of NN and still serves in that capacity as well as that of Treasurer. In February 1995, Mr. Kelly was elected Treasurer and Assistant Secretary. He joined NN in 1993 as Assistant Treasurer and Manager of Investor Relations. In July 1994, Mr. Kelly was elected to serve as NN’s Chief Accounting Officer, and served in that capacity through March 2003. Prior to joining NN, Mr. Kelly served from 1988 to 1993 as a Staff Accountant and as a Senior Auditor with the accounting firm of Price Waterhouse, LLP.
Nicola Trombetti was elected NN Europe Managing Director in June 2004 and was elected a Corporate Vice President in June 2005. Prior to being named NN Europe Managing Director he was Vice President and Director of Operations, NN Europe. He joined NN in September 2000 as Pinerolo Italy Plant Manager. Prior to joining NN Europe, Mr. Trombetti was Plant Director for Tekfor - Neumaier GmbH Group, a European-based steel component manufacturer for the auto industry. From 1996 to 1999 he was Manufacturing Manager and Plant Manager for SKF Group. He also spent seven years as a manufacturing manager for Pininfarina, an Italian-based car design, engineering, development and manufacturing company.
Thomas G. Zupan co-founded Whirlaway Corporation in 1973 with his father and began his career as a toolmaker. He gained further experience in every line business function including Engineering, Production Operations, Quality Assurance, H/R, Sales, Material Control, IS, and Finance as the company grew from owner operator to professionally managed. In 1991, Mr. Zupan became CEO and sole shareholder of Whirlaway Corporation.Whirlaway. Upon the sale of Whirlaway Corporation to NN November 30, 2006 Mr. Zupan was appointed Vice President - President of Whirlaway Corporation.
David M. Gilson joined NN in October 2006 as Vice President-Global Marketing. Prior to joining NN, Mr. Gilson held a variety of management positions for Ashland Specialty Chemical Company, a division of Ashland Inc. These positions included Business Manager, Ashland Chemical de Mexico, from 2000 until 2003, and Global Marketing Manager, from 2003 to 2006.
JamesJames. O. Anderson was appointed Vice President - PlasticsPresident-Plastics and Rubber Division in October 2006. In November, 2007, Mr. Anderson received additional responsibility for the Precision Metal Components Division in addition to the Plastic and Rubber Components Division. Mr. Anderson joined NN in January 2005 and served as the General Manager of Industrial Molding Corporation in Lubbock, Texas. Prior to joining NN, Mr. Anderson served for six years in the U. S.U.S. Army as an artillery officer and worked in various manufacturing roles with Dana Corporation and Accuma Corporation from 1996 to 2005.
Item 1A. Risk Factors
Cautionary Statements for Purposes of the “Safe Harbor”"Safe Harbor" Provisions of the Private Securities Litigation Reform Act of 1995
The Company wishesWe wish to caution readers that this report contains, and our future filings, by the Company, press releases and oral statements made by the Company’sour authorized representatives may contain, forward-looking statements that involve certain risks and uncertainties. Readers can identify these forward-looking statements by the use of such verbs as expects, anticipates, believes or similar verbs or conjugations of such verbs. The Company’sOur actual results could differ materially from those expressed in such forward-looking statements due to important factors bearing on the Company’sour business, many of which already have been discussed in this filing and in the Company’sour prior filings. The differences could be caused by a number of factors or combination of factors including, but not limited to, the risk factors described below.
You should carefully consider the following risks and uncertainties, and all other information contained in or incorporated by reference in this annual report on Form 10-K, before making an investment in our common stock. Any of the following risks could have a material adverse effect on our business, financial condition or operating results. In such case, the trading price of our common stock could decline and you may lose all or part of your investment.
The demand for our products is cyclical, which could adversely impact our revenues.
The end markets for fully assembled bearings and other industrial and automotive components are cyclical and tend to decline in response to overall declines in industrial and automotive production. As a result, the market for bearing components and precision metal, plastic, and rubber products is also cyclical and impacted by overall levels of industrial and automotive production. Our sales in the past have been negatively affected, and in the future will be negatively affected, by adverse conditions in the industrial and/or automotive production sectors of the economy or by adverse global or national economic conditions generally.
We depend on a very limited number of foreign sources for our primary raw material and are subject to risks of shortages and price fluctuation.
The steel that we use to manufacture precision balls and rollersour metal bearing components is of an extremely high quality and is available from a limited number of producers on a global basis. Due to quality constraints in the U.S. steel industry, we obtain substantially all of the steel used in our U.S. operations from overseas suppliers. In addition, we obtain most of the steel used in our European operations from a single European source. If we had to obtain steel from sources other than our current suppliers we could face higher prices and transportation costs, increased duties or taxes, and shortages of steel. Problems in obtaining steel, and particularly 52100 chrome steel, in the quantities that we require and on commercially reasonable terms, could increase our costs, adversely impacting our ability to operate our business efficiently and have a material adverse effect on our revenues and operating and financial results.
Increases in the market demand for steel can have the impact of increasing scrap surcharges we pay in procuring our steel in the form of higher unit prices and could adversely impact the availability of steel. Our contracts with key customers allow us to pass a majority of thealong steel price increases on to those customers. However, by contract, material price changes in any given year at our European operations are typically passed along with price adjustments in January of the following year. Until the current increases can be passed through to our customers, income from operations, net income and cash flow from operations can be adversely affected.as incurred.
We depend heavily on a relatively limited number of customers, and the loss of any major customer would have a material adverse effect on our business.
Sales to various U.S. and foreign divisions of SKF, which is one of the largest bearing manufacturers in the world, accounted for approximately 46%40% of consolidated net sales in 2006, and sales to Schaeffler Group (INA) accounted for approximately 11% of consolidated net sales in 2006. During 2006, our ten largest customers accounted for approximately 81% of our consolidated net sales.2007. No other customers accounted for more than 10% of sales. During 2007, our ten largest customers accounted for approximately 75% of our consolidated net sales. The loss of all or a substantial portion of sales to these customers would cause us to lose a substantial portion of our revenue and would lower our operating profit margin and cash flows from operations.
We operate in and sell products to customers outside the U.S. and are subject to several related risks.
Because we obtain a majority of our raw materials from overseas suppliers, actively participate in overseas manufacturing operations and sell to a large number of international customers, we face risks associated with the following:
| · | high tax rates that discourage the repatriation of funds to the U.S.; |
| · | the imposition of import or other duties or taxes; and |
| · | unstable governments or legal systems in countries in which our suppliers, manufacturing operations, and customers are located. |
We do not have a hedging program in place associated with consolidating the operating results of our foreign businesses into U.S. dollars.Dollars. An increase in the value of the U.S. dollarDollar and/or the Euro relative to other currencies may adversely affect our ability to compete with our foreign-based competitors for international, as well as domestic, sales. Also, a decline in the value of the Euro relative to the U.S. dollarDollar will negatively impact our consolidated financial results, which are denominated in U.S. dollars.Dollars.
In addition, due to the typical slower summer manufacturing season in Europe, we expect that revenues in the third fiscal quarter of each year will reflect lower sales than in the other quarters of the year.
Failure of our product could result in a product recall
The majority of our products go into bearings used in the automotive industry and other critical industrial manufacturing applications. A failure of our components could lead to a product recall. If a recall were to happen as a result of our components failing, we could bear a substantial part of the cost of correction. In addition to the cost of fixing the parts affected by the component, a recall could result in the loss of a portion of or all of customers’ business. To partially mitigate this risk, we carry some product recall insurance and have invested heavily in TS16949 and QS9000 quality programs.
The costs and difficulties of integrating acquired business could impede our future growth.
We cannot assure you that any future acquisition will enhance our financial performance. Acquiring companies involves inherent risk in the areas of environmental and legal issues, information technology, cultural and regulatory matters, product/supplier issues, and financial risk. Our ability to effectively integrate any future acquisitions will depend on, among other things, the adequacy of our implementation plans, the ability of our management to oversee and operate effectively the combined operations and our ability to achieve desired operating efficiencies and sales goals. The integration of any acquired businesses might cause us to incur unforeseen costs, which would lower our profit margin and future earnings and would prevent us from realizing the expected benefits of these acquisitions.
We may not be able to continue to make the acquisitions necessary for us to realize our future growth strategy.
Acquiring businesses that complement or expand our operations has been and continues to be an important element of our business strategy. This strategy calls for growth through acquisitions constituting the majority of our future growth objectives, with the remainder resulting from internal growth and increased market penetration. For recent acquisitions see Note 2 of the Notes to Consolidated Financial Statements. We cannot assure you that we will be successful in identifying attractive acquisition candidates or completing acquisitions on favorable terms in the future. In addition, we may borrow funds to acquire other businesses, increasing our interest expense and debt levels. Our inability to acquire businesses, or to operate them profitably once acquired, could have a material adverse effect on our business, financial position, results of operations and cash flows.
Our growth strategy depends in part on outsourcing, and if the industry trend toward outsourcing does not continue, our business could be adversely affected.
Our growth strategy depends in part on major bearing manufacturers continuing to outsource components, and expanding the number of components being outsourced. This requires manufacturers to depart significantly from their traditional methods of operations. If major bearing manufacturers do not continue to expand outsourcing efforts or determine to reduce their use of outsourcing, our ability to grow our business could be materially adversely affected.
Our market is highly competitive and many of our competitors have significant advantages that could adversely affect our business.
The global markets for bearing components, precision metal and precision plastic parts are highly competitive, with a majority of production represented by the captive production operations of certain large bearing manufacturers and the balance represented by independent manufacturers. Captive manufacturers make components for internal use and for sale to third parties. All of the captive manufacturers, and many independent manufacturers, are significantly larger and have greater resources than do we. Our competitors are continuously exploring and implementing improvements in technology and manufacturing processes in order to improve product quality, and our ability to remain competitive will depend, among other things, on whether we are able to keep pace with such quality improvements in a cost effective manner.
The production capacity we have added over the last several years has at times resulted in our having more capacity than we need, causing our operating costs to be higher than expected.
We have expanded our metal bearing components production facilities and capacity over the last several years. Our metal bearing component production facilities have not always operated at full capacity, and from time to time our results of operations have been adversely affected by the under-utilization of our production facilities. Under-utilization or inefficient utilization of our production facilities could be a risk in the future. We have recently undertaken steps to address a portion of the capacity risk. See Note 3 of the Notes to the Consolidated Financial Statements.
The price of our common stock may be volatile.
The market price of our common stock could be subject to significant fluctuations and may decline. Among the factors that could affect our stock price are:
| · | our operating and financial performance and prospects; |
11
| · | quarterly variations in the rate of growth of our financial indicators, such as earnings per share, net income and revenues; |
domestic and international economic, legal and regulatory factors unrelated to our performance; and
The| · | changes in revenue or earnings estimates or publication of research reports by analysts; |
| · | loss of any member of our senior management team; |
| · | speculation in the press or investment community; |
| · | strategic actions by us or our competitors, such as acquisitions or restructurings; |
| · | sales of our common stock by stockholders; |
| · | general market conditions; |
| · | domestic and international economic, legal and regulatory factors unrelated to our performance; and |
| · | loss of a major customer. |
The stock markets in general have experienced extreme volatility that has often been unrelated to the operating performance of particular companies. These broad market fluctuations may adversely affect the trading price of our common stock. In addition, due to the market capitalization of our stock (less than $200 million), our stock tends to be more volatile than large capitalization stocks that comprise the Dow Jones Industrial Average or Standard and Poor’s 500 Index.
Provisions in our charter documents and Delaware law may inhibit a takeover, which could adversely affect the value of our common stock.
Our certificate of incorporation and bylaws, as well as Delaware corporate law, contain provisions that could delay or prevent a change of control or changes in our management that a stockholder might consider favorable and may prevent you from receiving a takeover premium for your shares. These provisions include, for example, a classified board of directors and the authorization of our board of directors to issue up to 5,000,000 preferred shares without a stockholder vote. In addition, our restated certificate of incorporation provides that stockholders may not call a special meeting.
We are a Delaware corporation subject to the provisions of Section 203 of the Delaware General Corporation Law, an anti-takeover law. Generally, this statute prohibits a publicly-held Delaware corporation from engaging in a business combination with an interested stockholder for a period of three years after the date of the transaction in which such person became an interested stockholder, unless the business combination is approved in a prescribed manner. A business combination includes a merger, asset sale or other transaction resulting in a financial benefit to the stockholder. We anticipate that the provisions of Section 203 may encourage parties interested in acquiring us to negotiate in advance with our board of directors, because the stockholder approval requirement would be avoided if a majority of the directors then in office approve either the business combination or the transaction that results in the stockholder becoming an interested stockholder.
These provisions apply even if the offer may be considered beneficial by some of our stockholders. If a change of control or change in management is delayed or prevented, the market price of our common stock could decline.
Item 1B. Unresolved Staff Comments
None
Item 2. Properties
Metal Bearing Components
The Metal Bearing Components Segment has eight manufacturing locations aroundplants for each of the world. The segment has two manufacturing facilities locatedcompany's segments are listed below. In addition, the company leases a portion of a small office building in Erwin,Johnson City, Tennessee and Mountain City, Tennessee. The Erwin and Mountain City plants currently have approximately 125,000 and 86,500 square feet of manufacturing space, respectively. The Erwin plant is located on a 12 acre tract of land owned by the Company and the Mountain City plant is located on an eight acre tract of land owned by the Company.which serves as our corporate headquarters.
| Metal Bearing Components Segment | | |
| | | |
| Manufacturing Operation | Country | Sq. Feet | Owned or Leased |
| Erwin Plant | U.S.A. | 125,000 | Owned |
| Mountain City Plant | U.S.A. | 86,400 | Owned |
| Kilkenny Plant | Ireland | 125,000 | Owned |
| Eltmann Plant | Germany | 175,000 | Leased |
| Pinerolo Plant | Italy | 330,000 | Owned |
| Kysucke Plant | Slovakia | 135,000 | Owned |
| Veenendaal Plant | The Netherlands | 159,000 | Owned |
| Kunshan Plant | China | 110,000 | Leased |
The Metal Bearing Components Segment has five manufacturing facilities in Europe. These are located in Kilkenny, Ireland; Eltmann Germany; Pinerolo, Italy and Kysucke Nove Mesto, Slovakia and Veenendaal, The Netherlands. The facilities currently have approximately 125,000, 175,000, 330,000, 135,000, and 159,000 square feet of manufacturing space, respectively. All of the facilities are owned by the Company, except for the Eltmann facility whichPlant is leased from the Schaeffler Group, (INA).
which is also a customer. The production facility in the People's Republic of ChinaKunshan Plant lease is leased and accounted for as a capital lease. The Company haslease and we have an option to purchase the facility at various points in the future. The facility has approximately 110,000 square feet of production and office space and is located on approximately 5 acres.
| Plastic and Rubber Components Segment | | |
| | | |
| Manufacturing Operation | Country | Sq. Feet | Owned or Leased |
| Danielson Plant | U.S.A. | 50,000 | Owned |
| Lubbock Plant | U.S.A. | 228,000 | Owned |
| Precision Metal Components Segment | | |
| | | |
| Manufacturing Operation | Country | Sq. Feet | Owned or Leased |
| Wellington Plant 1 | U.S.A. | 86,000 | Leased |
| Wellington Plant 2 | U.S.A. | 132,000 | Leased |
| Hamilton Plant | U.S.A. | 19,000 | Owned |
| Tempe Plant | U.S.A. | 140,000 | Leased |
Plastics and Rubber Components
IMC manufacturesThe Wellington Plants are leased from a wide range of plastic molded products through two facilities located in Lubbock, Texas. The Slaton facility, located on a six and one half acre tract of land ownedcompany controlled by the Company, contains approximately 193,000 square feetformer owner of manufacturing, warehouse and office space. The Cedar facilityWhirlaway Corporation, who is situated on a two and one half acre tractcurrently an officer of land which is also owned by the Company and contains approximately 35,000 square feet of manufacturing and warehouse space.NN, Inc.
Delta’s operations are located in two facilities on a 12 acre site in Danielson, Connecticut, owned by the Company. The two facilities encompass over 50,000 square feet of rubber seal manufacturing and administrative functions.
Precision Metal Components
Whirlaway operates at four locations, three in Ohio and one in Arizona. Two of the Ohio plants are in Wellington, Ohio with 86,000 square feet on 8 acres and 132,000 square feet on 10 acres. The other Ohio plant is in the Cincinnati area and has 19,000 square feet on 2 acres. The Arizona plant is in Tempe with 140,000 square feet on 8 acres. All of the locations are leased except for the Cincinnati location which is owned. For more information, please see “Management’s"Management's Discussion and Analysis of Financial Condition and Results of Operations -- Liquidity and Capital Resources.”"
On March 20, 2006, we, as well as numerous other parties, received correspondence from the Environmental Protection Agency (“EPA”) requesting information regarding a former waste recycling vendor which we previously used by us.used. The vendor has since ceased operations and the EPA is investigating the clean up of the site or sites used by the vendor. We have contributed to an escrow fund along with 42 other potentially responsible parties for the purpose of investigating and addressing the environmental issues at the facility. Our contribution to the account was twenty-three thousand dollars. A Remedial Investigation and Risk Assessment report funded by the escrow fund was submitted to the EPA in December 2007. As of the date of this report, we do not know whether we have any liability beyond the contribution to the escrow account mentioned earlier, related to this vendor’s actions, or estimatable range for any potential liability. We believe our contribution to the remediation of the site, if any, would be approximately 1.083% or less of the volume of waste sent to the facility and we assert that our waste was non-hazardous.
On June 20, 2007, we, as well as numerous other parties, received correspondence from the New York State Department of Environmental Conservation notifying us that we have been named as a potentially responsible party for the potential clean up of a former waste recycling facility. As of the date of this report, we estimate our maximum exposure to be ten thousand dollars. The maximum exposure is based on the amount of gallons we sent to the waste facility multiplied by the proposed charge per gallon as determined by the potentially responsible parties.
All other legal matters are of an ordinary and routine nature and are incidental to the operations of the Company.our operations. Management believes that such proceedings should not, individually or in the aggregate, have a material adverse effect on the Company’sour business or financial condition or on the results of operations.
No matters were submitted for a vote of stockholders during the fourth quarter of 2006.
Part II2007.
Part II
Item 5. Market for the Registrant's Common Equity, Related Stockholder Matters and Issuer Purchases of Equity Securities
Since our initial public offering in 1994, ourthe common stock has been traded on The NASDAQ Stock Market LLC (NASDAQ)(“NASDAQ”) under the trading symbol “NNBR.” Prior to such time there was no established market for ourthe common stock. As of March 13, 2007,12, 2008, there were approximately 2,5002,100 holders of our common stock.the Common Stock.
The following table sets forth the high and low closing sales prices of the common stock, as reported by NASDAQ, and the dividends paid per share on the common stock during each calendar quarter of 20062007 and 2005.2006.
| | Close Price | | | Close Price | |
| | | High | Low | Dividend |
| 2007 | | |
| First Quarter | | $ 13.27 | $ 11.40 | $ 0.08 |
| Second Quarter | | 12.78 | 11.65 | 0.08 |
| Third Quarter | | 12.51 | 9.00 | 0.08 |
| Fourth Quarter | | 10.67 | 8.07 | 0.08 |
| | High | | Low | | Dividend | |
2006 | | | | | | |
| First Quarter | $ 13.12 | | $ 10.77 | | $ 0.08 | $ 13.12 | $ 10.77 | $ 0.08 |
Second Quarter | 13.53 | | 11.92 | | 0.08 | 13.53 | 11.92 | 0.08 |
Third Quarter | 13.29 | | 11.11 | | 0.08 | 13.29 | 11.11 | 0.08 |
Fourth Quarter | 12.76 | | 10.55 | | 0.08 | 12.76 | 10.55 | 0.08 |
| | | | | | | |
2005 | | | | | | |
First Quarter | $ 13.01 | | $ 10.70 | | $ 0.08 | |
Second Quarter | 13.12 | | 11.62 | | 0.08 | |
Third Quarter | 13.58 | | 11.38 | | 0.08 | |
Fourth Quarter | 11.96 | | 9.87 | | 0.08 | |
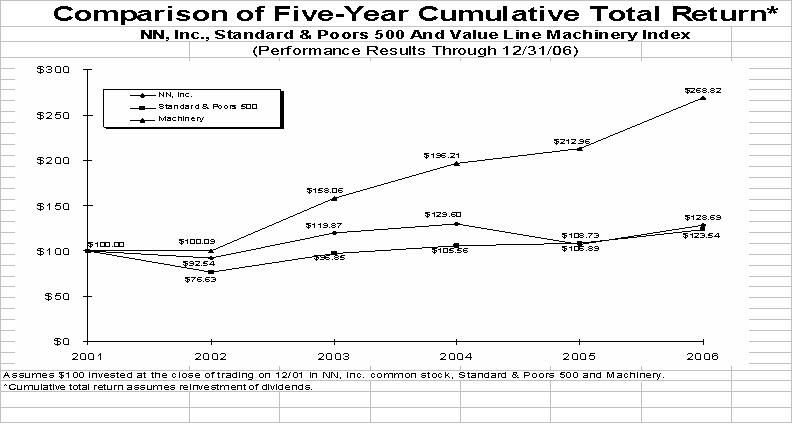
The following graph compares the cumulative total shareholder return on our common stock (consisting of stock price performance and reinvested dividends) from December 31, 20012002 with the cumulative total return (assuming reinvestment of all dividends) of (i) the Value Line Machinery Industry Stock Index ("Machinery ")(“Machinery”) and (ii) the Standard & Poor'sPoor’s 500 Stock Index, for the period December 31, 20012002 through December 31, 2006.2007. The Machinery index is an industry index comprised of 49 companies engaged in manufacturing of machinery and machine parts, a list of which is available from the company. The comparison assumes $100 was invested in our common stock and in each of the foregoing indices on December 31, 2001.2002. We cannot assure you that the performance of the common stock will continue in the future with the same or similar trend depicted on the graph.
| | Cumulative Return |
| | 12/31/2002 | 12/31/2003 | 12/31/2004 | 12/31/2005 | 12/31/2006 |
| NN, Inc. | 92.54 | 119.87 | 129.60 | 108.73 | 128.69 |
| Standard & Poors 500 | 76.63 | 96.85 | 105.56 | 106.89 | 123.54 |
| Machinery | 100.09 | 158.06 | 196.21 | 212.96 | 268.82 |
Comparison of Five-Year Cumulative Total Return*
NN, Inc., Standard & Poors 500 and Value Line Machinery Index
(Performance Results Through 12/31/07)
 Assumes $100 invested at the close of trading on December 31, 2002 in NN, Inc. common stock, Standard & Poors 500 and Value Line Machinery Index.
*Cumulative total return assumes reinvestment of dividends.
| | Cumulative Return |
| | 12/31/2003 | 12/31/2004 | 12/31/2005 | 12/31/2006 | 12/31/2007 |
| NN, Inc. | 129.54 | 140.06 | 115.51 | 139.07 | 108.57 |
| Standard & Poors 500 | 126.38 | 137.75 | 141.88 | 161.20 | 166.89 |
| Machinery | 157.91 | 196.03 | 212.77 | 268.57 | 382.73 |
The declaration and payment of dividends are subject to the sole discretion of our Board of Directors and depend upon our profitability, financial condition, capital needs, future prospects and other factors deemed relevant by the Board of Directors. The terms of our revolving credit facility restrict the payment of dividends by prohibiting us from declaring or paying any dividend if an event of default exists at the time of, or would occur as a result of, such declaration or payment. Additionally, the terms of our revolving credit facility restrict the declaration and payment of dividends in excess of certain amounts specified in the credit agreement in any fiscal year. For further description of our revolving credit facility, see “Management’s Discussion and Analysis of Financial Condition and Results of Operations – Liquidity and Capital Resources” below.
During the fourth quarter of 2006,2007, we repurchased 249,199699,838 shares of our common stock at a total cost of $2.7$6.6 million under our publicly announced $10$25 million repurchase plan authorized by the Board of Directors.
Issuer Purchases of Equity Securities |
Period | (a) Total Number of Shares (or Units) Purchased | (b) Average Price Paid per Share (or Unit) including commissions | (c) Total Number of Shares (or Units) Purchased as Part of Publicly Announced Plans or Programs | (d) Maximum Number (or Approximate Dollar Value) of Shares that May Yet Be Purchased Under the Plans or Programs |
| October 1 - October 31 | -- | -- | -- | $7,466,064 |
| November 1- November 30 | 217,961 | $10.97 | 217,961 | $5,073,962 |
| December 1 - December 31 | 31,238 | $11.17 | 31,238 | $4,724,854 |
Issuer Purchases of Equity Securities In the Fourth Quarter 2007 |
| Period | (a) Total Number of Shares (or Units) Purchased | (b) Average Price Paid per Share (or Unit) including commissions | (c) Total Number of Shares (or Units) Purchased as Part of Publicly Announced Plans or Programs | (d) Maximum Number (or Approximate Dollar Value) of Shares that May Yet Be Purchased Under the Plans or Programs |
| October 1 – October 31 | 216,684 | $10.06 | 216,684 | $21,816,042 |
| November 1 – November 30 | 233,319 | $ 9.24 | 233,319 | $19,660,332 |
| December 1 – December 31 | 249,835 | $ 8.87 | 249,835 | $17,444,402 |
For the full year of 2007, we repurchased 1,008,439 shares for a total amount of $9.7 million at an average price of $9.64 including commissions.
See Part III, Item 12 - "Security– “Security Ownership of Certain Beneficial Owners and Management and Related Stockholder Matters"Matters” of this 20062007 Annual Report on Form 10-K for information required by Item 201 (d) of regulation S-K.
The following selected financial data has been derived from the audited financial statements of the Company are qualified by reference to andCompany. The selected financial data should be read in conjunction with the consolidated financial statements and the Notes thereto included as Item 8. The data set forth below as of December 31, 2006, 2005, 2004, and 2003 and for the periods then ended has been derived from the consolidated financial statements of the Company which have been audited by PricewaterhouseCoopers LLP, an independent registered public accounting firm, whose report thereon is included as part of Item 8. The data below as of December 31, 2002 and for the period then ended has been derived from the consolidated financial statements of the Company, which have been audited by KPMG LLP, an independent registered public accounting firm. These historical results are not necessarily indicative of the results to be expected in the future. See “Management’s Discussion and Analysis of Financial Condition and Results of Operations.”
(In Thousands, Except Per Share Data)
| | Year ended December 31,
|
Operations” and the audited consolidated financial statements, including notes thereto.
| | 2006 | 2005 | 2004 | 2003 | 2002 |
Statement of Income Data: | | | | | |
| Net sales | $ 330,325 | $ 321,387 | $ 304,089 | $ 253,462 | $ 192,856 |
| Cost of products sold (exclusive of depreciation shown separately below) | 257,703 | 248,828 | 240,580 | 195,658 | 144,274 |
| Selling, general and administrative expenses | 30,008 | 29,073 | 29,755 | 21,700 | 17,134 |
| Depreciation and amortization | 17,492 | 16,331 | 16,133 | 13,691 | 11,212 |
| (Gain) loss on disposal of assets | (705) | (391) | 856 | (147) | (25) |
| Restructuring and impairment costs (income) | (65) | (342) | 2,398 | 2,490 | 1,277 |
| Income from operations | 25,892 | 27,888 | 14,367 | 20,070 | 18,984 |
| Interest expense | 3,983 | 3,777 | 4,029 | 3,392 | 2,451 |
| Other (income) loss | (1,048) | (653) | (853) | 99 | (462) |
| Income before provision for income taxes | 22,957 | 24,764 | 11,191 | 16,579 | 16,995 |
| Provision for income taxes | 8,522 | 9,752 | 4,089 | 5,726 | 6,457 |
Minority interest in income of consolidated Subsidiary | -- | -- | -- | 675 | 2,778 |
| Net income | $ 14,435 | $ 15,012 | $ 7,102 | $ 10,178 | $ 7,760 |
| | | | | | |
| Basic income per share: | | | | | |
| Net income | $ 0.84 | $ 0.88 | $ 0.42 | $ 0.64 | $ 0. 51 |
| | | | | | |
| Diluted income per share: | | | | | |
| Net income | $ 0.83 | $ 0.87 | $ 0.41 | $ 0.62 | $ 0.49 |
| | | | | | |
| Dividends declared | $ 0.32 | $ 0.32 | $ 0.32 | $ 0.32 | $ 0.32 |
Weighted average number of shares outstanding - Basic | 17,125 | 17,004 | 16,728 | 15,973 | 15,343 |
Weighted average number of shares outstanding - Diluted | 17,351 | 17,193 | 17,151 | 16,379 | 15,714 |
(In Thousands, Except Per Share Data) | 2006 | | 2005 | | 2004 | | 2003 | | 2002 |
Balance Sheet Data: | | | | | | | | | |
| Current assets | $ 125,864 | | $ 105,950 | | $ 108,440 | | $ 89,901 | | $ 61,412 |
| Current liabilities | 74,869 | | 64,839 | | 74,431 | | 64,176 | | 40,234 |
| Total assets | 342,701 | | 269,655 | | 288,342 | | 267,899 | | 195,215 |
| Long-term debt | 80,711 | | 57,900 | | 67,510 | | 69,752 | | 46,135 |
| Stockholders’ equity | 133,169 | | 116,074 | | 115,140 | | 106,468 | | 77,908 |
| (In Thousands, Except Per Share Data) | Year ended December 31, |
| | 2007 | 2006 | 2005 | 2004 | 2003 |
| Statement of Income Data: | | | | | |
| Net sales | $ 421,294 | $ 330,325 | $ 321,387 | $ 304,089 | $ 253,462 |
| Cost of products sold (exclusive of depreciation shown separately below) | 337,024 | 257,703 | 248,828 | 240,580 | 195,658 |
| Selling, general and administrative expenses | 36,473 | 30,008 | 29,073 | 29,755 | 21,700 |
| Depreciation and amortization | 22,996 | 17,492 | 16,331 | 16,133 | 13,691 |
| (Gain) loss on disposal of assets | (71) | (705) | (391) | 856 | (147) |
| Restructuring and impairment charges (income) | 13,636 | (65) | (342) | 2,398 | 2,490 |
| Income from operations | 11,236 | 25,892 | 27,888 | 14,367 | 20,070 |
| Interest expense | 6,373 | 3,983 | 3,777 | 4,029 | 3,392 |
| Other (income) expense | (386) | (1,048) | (653) | (853) | 99 |
| Income before provision for income taxes | 5,249 | 22,957 | 24,764 | 11,191 | 16,579 |
| Provision for income taxes | 6,422 | 8,522 | 9,752 | 4,089 | 5,726 |
Minority interest in income of consolidated subsidiary | -- | -- | -- | -- | 675 |
| Net income (loss) | $ (1,173) | $ 14,435 | $ 15,012 | $ 7,102 | $ 10,178 |
| | | | | | |
| Basic income per share: | | | | | |
| Net income (loss) | $ (0.07) | $ 0.84 | $ 0.88 | $ 0.42 | $ 0.64 |
| | | | | | |
| Diluted income per share: | | | | | |
| Net income (loss) | $ (0.07) | $ 0.83 | $ 0.87 | $ 0.41 | $ 0.62 |
| | | | | | |
| Dividends declared | $ 0.32 | $ 0.32 | $ 0.32 | $ 0.32 | $ 0.32 |
Weighted average number of shares outstanding - Basic | 16,749 | 17,125 | 17,004 | 16,728 | 15,973 |
Weighted average number of shares outstanding – Diluted | 16,749 | 17,351 | 17,193 | 17,151 | 16,379 |
| | As of December 31, |
| (In Thousands, Except Per Share Data) | 2007 | 2006 | 2005 | 2004 | 2003 |
| Balance Sheet Data: | | | | | |
| Current assets | $ 138,024 | $ 125,864 | $ 105,950 | $ 108,440 | $ 89,901 |
| Current liabilities | 84,256 | 74,869 | 64,839 | 74,431 | 64,176 |
| Total assets | 350,078 | 342,701 | 269,655 | 288,342 | 267,899 |
| Long-term debt | 100,193 | 80,711 | 57,900 | 67,510 | 69,752 |
| Stockholders' equity | 130,043 | 133,169 | 116,074 | 115,140 | 106,468 |
For the year ended December 31, 2007, Whirlaway added $62,662 in sales; $53,515 in cost of products sold (exclusive of depreciation and amortization); $4,106 in selling, general and administrative expenses; $3,991 in depreciation and amortization; $2,406 in interest expense and $852 in net loss.
For the year ended December 31, 2006, Whirlaway added $4,722 in sales; $4,706 in cost of products sold (exclusive of depreciation and amortization); $363 in selling, general and administrative expenses; $345 in depreciation and amortization; $240 in interest expense and $598 in net loss.
On November 30, 2006, we purchased 100% of the stock of Whirlaway Corporation and incorporated theirits assets and liabilities into our consolidated financial statements. TheIncluded in the December 31, 2006 balance sheet data are acquired total current assets of $19,276, assets of $55,673 and current liabilities acquired were 19,276; 55,673; and 7,475, respectively.of $7,475. In addition, we incurred third party debt of $24,700 million related to the acquisition.
During 2004, we formed a wholly-owned subsidiary, NN Precision Bearing Products Company, LTD. This subsidiary, which began production of precision balls during the fourth quarter of 2005, is located in the Kunshan Economic and Technology Development Zone, Jiangsu, The People’s Republic of China.
On October 9, 2003, we acquired certain assets comprised of land, building and machinery and equipment of the precision ball operations of KLF -– Gulickaren (“KLF”), based in Kysucke Nove Mesto, Slovakia.
On May 2, 2003, we acquired 100% of the tapered roller and metal cage manufacturing operations of SKF in Veenendaal, The Netherlands.
On May 2, 2003, we acquired the 23% interest in NN Europe, held by SKF. Upon consummation of this transaction, we became the sole owner of NN Europe.
On December 20, 2002, we completed the purchase of the 23% interest in NN Europe held by INA. As a result of this transaction, we own 77% of the shares of NN Europe.
Item 7.
| Management’s Discussion and Analysis of Financial Condition and Results of Operations
|
The following discussion should be read in conjunction with, and is qualified in its entirety by, the Consolidated Financial Statements and the Notes thereto and Selected Financial Data included elsewhere in this Form 10-K. Historical operating results and percentage relationships among any amounts included in the Consolidated Financial Statements are not necessarily indicative of trends in operating results for any future period.
See Item 1A. “Risk Factors” for a discussion of risk factors that could materially impact the Company’sour actual results.
Overview and Management Focus
Our strategy and management focus is based upon the following long-term objectives:
| · | Growth by taking over the in-house production of bearing components from our global customers, providing a competitive and attractive outsourcing alternative |
Captive growth, providing a competitive and attractive alternative to the operations of our global customers
| · | Creation of a new precision metal components platform |
Creation of a new precision metal components platform| · | Global expansion of our manufacturing base to better address the global requirements of our customers |
Global expansion of our manufacturing base to better address the global requirements of our customers
Management generally focuses on these trends and relevant market indicators:
Global industrial growth and economics
Global automotive production rates
Costs subject to the global inflationary environment, including, but not limited to:
| · | §Global industrial growth and economics |
| · | Global automotive production rates |
| · | Costs subject to the global inflationary environment, including, but not limited to: |
| §o | Wages and benefits, including health care costs |
| · | Currency and exchange rate movements and trends |
| · | Interest rate levels and expectations |
Management generally focuses on the following key indicators of operating performance:
Sales growth
Cost of products sold levelsSelling, general and administrative expense levels
Net income| · | Cost of products sold levels |
Cash flow from operations and capital spending
Customer service reliability| · | Selling, general and administrative expense levels |
External and internal quality indicators
| · | Cash flow from operations and capital spending |
| · | Customer service reliability |
| · | External and internal quality indicators |
Since our formation in 1980, we have grown primarily through the acquisition of in-house component manufacturing operations of domestic and international bearing manufacturers resulting in increased sales of high precision balls and rollers for bearing applications. Management believes that our core business sales growth since our formation has been due to our ability to capitalize on opportunities in global markets and provide precision products at competitive prices, as well as our emphasis on product quality and customer service.
In 1998, we recognized changing dynamics in the marketplace, and as a result, began implementing an extensive long-term growth strategy building upon our core business and leveraging our inherent strengths to better serve our global customer base. As part of this strategy, we sought to augment our intrinsic growth with complementary acquisitions that fit specific criteria.
On July 4, 1999, we acquired substantially all of the assets of Earsley Capital Corporation, formerly known as Industrial Molding Corporation for consideration of approximately $30.0 million. Formed in 1947, IMC provides full-service design and manufacture of plastic injection molded components to the bearing, automotive, electronic, leisure and consumer markets with an emphasis on value-added products that take advantage of its capabilities in product development, tool design and tight tolerance molding processes. IMC operates twoone manufacturing facilitiesfacility in Lubbock, Texas.Texas and is part of the Plastic and Rubber Components Segment.
On July 31, 2000, we formed a majority owned stand-alone company in Europe, NN Europe ApS (“NN Europe”), for the manufacture and sale of chrome steel balls used for ball bearings and other products. As a result of this transaction, we owned 54% of NN Europe. SKF and INA respectively each owned 23% of NN Europe. As part of the transaction, NN Europe acquired the ball factories located in Pinerolo, Italy (previously owned by SKF), Eltmann, Germany (previously owned by INA), and Kilkenny, Ireland (previously owned by the Company). Acquisition financing of approximately 31.5 million Euros (approximately $29.7 million) was drawn at closing, and the credit facility provided for additional working capital expenditure financing. In connection with this transaction, total equity, specifically additional paid in capital, increased by 10.0 million Euros ($9.3 million) to reflect the increase in our proportionate interest in NN Europe as related to our 54%. We have always consolidated NN Europe due to our majority ownership and have accounted for the acquisitions of the Pinerolo, Italy and Eltmann, Germany ball factories in a manner similar to the purchase method of accounting. On December 20, 2002 we completed the purchase of the 23% interest held by INA. We paid approximately 13.4 million Euros ($13.8 million) for INA/FAG’s interest in NN Europe. The excess of the purchase price paid to INA for its 23% interest over fair value of INA’s 23% interest in the net assets of NN Europe of approximately $1.5 million has been allocated to goodwill. On May 2, 2003 we acquired the 23% interest in NN Europe held by SKF. We paid approximately 13.8 million Euros ($15.6 million) for SKF’s interest in NN Europe. The excessNN Europe is a part of the purchase price paid to SKF for its 23% interest over the fair value of SKF’s 23% interest in the net assets of NN Europe of approximately $2.1 million was allocated to goodwill.Metal Bearing Components Segment.
On February 16, 2001, we completed the acquisition of all of the outstanding stock of The Delta Rubber Company, a Connecticut corporation (“Delta”), for $22.5 million in cash. Delta provides high quality engineered bearing seals and other precision-molded rubber products to original equipment manufacturers. Delta operates twoone manufacturing facilitiesfacility in Danielson, Connecticut.Connecticut and is part of the Plastic and Rubber Components Segment.
On September 11, 2001, we announced the closing of our Walterboro, South Carolina ball manufacturing facility effective December 2001. The closing was made as part of our strategy to redistribute our global production in order to better utilize capacity and serve the needs of our worldwide customers. The precision ball production of the Walterboro facility has been fully absorbed by our remaining U.S. Metal Bearing Components Segment manufacturing facilities located in Erwin and Mountain City, Tennessee. In 2002 and 2001 we recorded before tax charges associated with the closing of $1.3 million and $1.9 million, respectively. In 2001, this amount includes a $1.1 million before-tax charge for the recording of impairment on our manufacturing facility located in Walterboro, South Carolina and $0.8 million related to employee severance costs. In 2002, this amount includes a $0.6 million before-tax charge for the recording of an additional impairment on the facility, a $0.6 million before-tax charge for the recording of impairment on the machinery and equipment and a $0.1 million charge related to employee severance costs. There were no impairment charges related to these assets recorded in 2003. The land and building assets were sold during the fourth quarter of 2004. As a result, we recorded a loss on disposal of assets of approximately $0.8 million which has been recorded as a loss on disposal of assets, a component of income from operations. Additionally, during the fourth quarter of 2004, we recorded an impairment charge of approximately $0.1 million related to certain remaining machinery and equipment assets of this facility. This amount was recorded as a component of restructuring and impairment costs. The financial results of this operation have been reflected in the Metal Bearing Components in the years ended December 31, 2004 and 2003. See Note 12 of the Notes to Consolidated Financial Statements.
Effective December 21, 2001, we sold our minority interest in Jiangsu General Ball & Roller Company, LTD, a Chinese ball and roller manufacturer located in Rugao City, Jiangsu Province, China. To effect the transaction, we sold our 50% ownership in NN General, LLC, which owns a 60% interest in the Jiangsu joint venture to our partner, General Bearing Corporation for cash of $0.6 million and notes of $3.3 million.
On May 2, 2003, we acquired 100% of the tapered roller and metal cage manufacturing operations of SKF in Veenendaal, The Netherlands.Netherlands (the Veenendaal Plant). The results of Veenendaal’s operations have been included in the consolidated financial statements since that date. We paid consideration of approximately 23.0 million Euros ($25.7 million) and incurred other costs of approximately $1.0 million, for the Veenendaal net assets acquired from SKF. The Veenendaal operation manufactures rollers for tapered roller bearings and metal cages for both tapered roller and spherical roller bearings allowing us to expand our bearing component offering. The financial results of the Veenendaal operation are included in ourthe Metal Bearing Components Segment.
On October 9, 2003, we acquired certain assets comprised of land, building and machinery and equipment of the precision ball operations of KLF -– Gulickaren (“KLF”), based in Kysucke Nove Mesto, Slovakia. We paid consideration of approximately 1.7 million Euros ($2.0 million). The assets are being utilized by our wholly-owned subsidiary NN Slovakia based in Kysucke Nove Mesto, Slovakia, which began production in 2004. The financial results of the operationsoperation are included in our Metal Bearing Components Segment.
During 2004, we formed a wholly-owned subsidiary, NN Precision Bearing Products Company, Ltd.Ltd (the Kunshan Plant). This subsidiary began production of precision balls during the fourth quarter of 2005, and is located in the Kunshan Economic and Technology Development Zone, Jiangsu, The People’s Republic of China and is a component of our strategy to globally expand our manufacturing base.
On October 7, 2005, we entered into an agreement with SNR Roulements (“SNR”) to purchase SNR’s entire internal precision ball producing equipment for approximately 5.2 million Euros ($6.2 million). SNR, a division This operation is included in the financial results of Renault SA, France, is a global bearing manufacturer and supplier to the automotive, industrial and aerospace industries. As part of the transaction, we received a three-year supply agreement for the present business (approximately $8.0 million) and a five-year supply agreement to provide SNR with its annual ball requirements of the former in-house production of approximately $9.0 million. The product will be supplied from Metal Bearing Components Segment existing precision ball operations. In December 2005, we started to acquire the precision ball producing equipment of SNR, from its manufacturing facility in Annecy, France.Segment.
In the fourth quarter of 2005,2006, we developedbegan to execute on a new five year strategic business plan drivento leverage our competencies in precision metal products by perceived slower growth in the metalcreating an adjacent platform to bearing components market and a need to create diversification in served customers andwhich would broaden our reach into attractive end markets.
Consistent with our new strategy, on November 30, 2006, we purchased 100% of the shares of Whirlaway Corporation (“Whirlaway”) from the sole shareholder for $45.6$43.0 million. Whirlaway is a high precision metal component and fluid control assembly manufacturer that supplies customers serving the air conditioning, appliance, automotive, commercial refrigeration, and diesel engine industries. Whirlaway produces highly engineered fluid control components and assemblies, shafts, and prismatic machined parts. Whirlaway has three locations in Ohio and through its wholly-owned subsidiary, Triumph, LLC, one location in Tempe, Arizona.
The implementation and successful execution of this acquisition strategy to date has allowed the Companyus to expand itsour global presence and positions the Companyus for continued global growth and expansion into core served markets.
Our significant accounting policies, including the assumptions and judgment underlying them, are disclosed in Note 1 of the Notes to Consolidated Financial Statements. These policies have been consistently applied in all material respects and address such matters as revenue recognition, inventory valuation, asset impairment recognition, business combination accounting and pension and post-retirement benefits. Due to the estimation processes involved, management considers the following summarized accounting policies and their application to be critical to understanding the Company’sour business operations, financial condition and results of operations. There can be no assuranceWe cannot assure you that actual results will not significantly differ from the estimates used in these critical accounting policies.
Revenue Recognition. The Company recognizes revenues based on the stated shipping terms with the customer and the Company recognizes revenue when these terms are satisfied and the risks of ownership are transferred to the customer. The Company has an inventory management program for certain major Metal Bearing Components Segment customers whereby revenue is recognized when products are used by the customer from consigned stock, rather than at the time of shipment. Under both circumstances, revenue is recognized when persuasive evidence of an arrangement exists, delivery has occurred, the sellers’ price is determinable and collectibilitycollectability is reasonably assured.
Accounts Receivable. Accounts receivable are recorded upon recognition of a sale of goods and ownership and risk of loss is assumed by the customer. Substantially all of the Company’s accounts receivable is due primarily from the core served markets: bearing manufacturers, automotive industry, electronics, industrial, agricultural and aerospace. The Company experiencedrecorded $0.5 million, $0.3 million, and $0.3 million of bad debt expense during 2007, 2006 and 2005 and $0 during 2004.2005. In establishing allowances for doubtful accounts, the Company performs credit evaluations of its customers, considering numerous inputs when available including the customers’ financial position, past payment history, relevant industry trends, cash flows, management capability, historical loss experience and economic conditions and prospects. Accounts receivable are written off or reserves established when considered to be uncollectible or at risk of being uncollectible. While management believes that adequate allowances for doubtful accounts have been provided in the Consolidated Financial Statements, it is possible that the Company could experience additional unexpected credit losses.
Inventories. Inventories. Inventories are stated at the lower of cost or market. Cost is determined using the first-in, first-out method. The Company’s inventories are not generally subject to obsolescence due to spoilage or expiring product life cycles. The Company assesses inventory obsolescence routinely and records a reserve when inventory items are deemed non recoverable in future periods. The Company operates generally as a make-to-order business; however, the Company also stocks products for certain customers in order to meet delivery schedules. While management believes that adequate write-downs for inventory obsolescence have been made in the Consolidated Financial Statements, the Company could experience additional inventory write-downs in the future.
Acquisitions and Acquired Intangibles. For new acquisitions, the Company uses estimates, assumptions and appraisals to allocate the purchase price to the assets acquired and to determine the amount of goodwill. These estimates are based on market analyses and comparisons to similar assets. Annual tests are required to be performed to assess whether recorded goodwill is impaired. The annual tests require management to make estimates and assumptions with regard to the future operations of its reporting units, and the expected cash flows that they will generate. These estimates and assumptions therefore impact the recorded value of assets acquired in a business combination, including goodwill, and whether or not there is any subsequent impairment of the recorded goodwill and the amount of such impairment.
Income Taxes. taxes. Income taxes are accounted for under the asset and liability method. Deferred tax assets and liabilities are recognized for the future tax consequences attributable to differences between the financial statement carrying amounts of existing assets and liabilities and their respective tax bases and operating loss and tax credit carry forwards. Deferred tax assets and liabilities are measured using enacted tax rates expected to apply to taxable income in the years in which those temporary differences are expected to be recovered or settled. The effect on deferred tax assets and liabilities of a change in tax rates is recognized in income in the period that includes the enactment date. The Company has three locations that are currently incurring net operating losses. Management has currently recognizedplaced full valuation allowances against the deferred tax assets from these net operating losses as managment believes these potential tax benefits will be ultimately realized. However, should profitability not improve as expected, management may need to record valuation allowances against these deferred tax assets in the future.losses. (See Note 14 of the Notes to Consolidated Financial Statements).Statements.)
Impairment of Long-Lived Assets. The Company’s long-lived assets include property, plant and equipment. The recoverability of the long-term assets is dependent on the performance of the companies which the Company has acquired, as well as volatility inherent in the external markets for these acquisitions. In assessing potential impairment for these assets the Company will consider these factors as well as forecasted financial performance. For assets held for sale, appraisals are relied upon to assess the fair market value of those assets. Future adverse changes in market conditions or adverse operating results of the underlying assets could result in the Company having to record additional impairment charges not previously recognized.
Pension Obligations. The Company uses several assumptions in determining its periodic pension and post-retirement expense and obligations which are included in the Consolidated Financial Statements. These assumptions include determining an appropriate discount rate, rate of compensationbenefit increase as well as the remaining service period of active employees.
The following table sets forth for the periods indicated selected financial data and the percentage of the Company’sour net sales represented by each income statement line item presented.
| As a Percentage of Net Sales
Year ended December 31,
|
| | As a Percentage of Net Sales Year ended December 31, |
| | 2007 | 2006 | 2005 |
| Net sales | 100.0% | 100.0% | 100.0% |
| Cost of product sold (exclusive of depreciation shown separately below) | 80.0 | 78.0 | 77.4 |
| Selling, general and administrative expenses | 8.7 | 9.1 | 9.0 |
| Depreciation and amortization | 5.4 | 5.3 | 5.1 |
| Gain on disposal of assets | 0.0 | (0.2) | (0.1) |
| Restructuring and impairment charges (income) | 3.2 | -- | (0.1) |
| Income from operations | 2.7 | 7.8 | 8.7 |
| Interest expense | 1.5 | 1.2 | 1.2 |
| Other income | (0.0) | (0.4) | (0.2) |
| Income before provision for income taxes | 1.2% | 7.0 | 7.7 |
| Provision for income taxes | 1.5% | 2.6 | 3.0 |
| Net income (loss) | (0.3%) | 4.4% | 4.7% |
| | 2006 | 2005 | 2004 |
| Net sales | 100.0% | 100.0% | 100.0% |
| Cost of product sold (exclusive of depreciation shown separately below) | 78.0 | 77.4 | 79.0 |
| Selling, general and administrative expenses | 9.1 | 9.0 | 9.8 |
| Depreciation and amortization | 5.3 | 5.1 | 5.3 |
| (Gain) loss on disposal of assets | (0.2) | (0.1) | 0.3 |
| Restructuring and impairment costs | -- | (0.1) | 0.8 |
| Income from operations | 7.8 | 8.7 | 4.8 |
| Interest expense | 1.2 | 1.2 | 1.3 |
| Other income | (0.4) | (0.2) | (0.2) |
| Income before provision for income taxes | 7.0 | 7.7 | 3.7 |
| Provision for income taxes | 2.6 | 3.0 | 1.4 |
| Net income | 4.4% | 4.7% | 2.3% |
Off Balance Sheet Arrangements
We have operating lease commitments for machinery, office equipment, vehicles, manufacturing and office space which expire on varying dates. The following is a schedule by year of future minimum lease payments as of December 31, 20062007 under operating leases that have initial or remaining non-cancelable lease terms in excess of one year (in thousands).
Year ended December 31, |
| 2007 | | $ 3,890 |
| 2008 | | 3,632 |
| 2009 | | 3,076 |
| 2010 | | 2,626 |
| 2011 | | 2,327 |
| Thereafter | | 8,593 |
| | | |
Total minimum lease payments | | $ 24,144 |
21
| Year ended December 31, |
| 2008 | $4,333 |
| 2009 | 3,437 |
| 2010 | 2,823 |
| 2011 | 2,420 |
| 2012 | 1,170 |
| Thereafter | 9,131 |
| Total minimum lease payments | $ 23,314 |
Sales Concentration
Sales to various U.S. and foreign divisions of SKF, which is one of the largest bearing manufacturers in the world, accounted for approximately 46%40% of consolidated net sales in 2006, and sales to Schaeffler Group (INA) accounted for approximately 11% of consolidated net sales in 2006.2007. During 2006,2007, our ten largest customers accounted for approximately 81%75% of our consolidated net sales. None of our other customers individually accounted for more than 10% of our consolidated net sales for 2006.2007. The loss of all or a substantial portion of sales to these customers would cause us to lose a substantial portion of our revenue and would lowerhave a corresponding negative impact on our operating profit margin anddue to operation leverage these customers provide. This could lead to sales volumes not being high enough to cover our current cost structure or provide adequate operating cash flows from operations.flows. Due to a limit on the amount of excess bearing component capacity it would be difficult for any of our top ten customers to move a substantial portion of the product we supply in a short period of time.
Prior to 2006, Schaeffler Group (INA) decided to in-source approximately one-third of annual volume to its internal ball manufacturing facility in Germany, which in 2005 and 2006 resulted in a $9.0 million or 20% reduction in sales. This represented approximately 30% of the existing Schaeffler Group (INA) business at that time. We negotiated a two-year supply agreement effective July 1, 2006 with Schaeffler Group (INA) for the remaining business.that expires June 30, 2008. In addition, we are in process of negotiatingMay 2007, a new long term agreement with SKF to replace the onemulti-year contract for precision balls that expired July 31, 2006 andin Europe was informally extended to December 2006. A new multi-year contract is expected to be signed with SKF with terms being retroactive to January 1, 2007 and effective until December 31, 2009.
Year Ended December 31, 2007 Compared to the Year Ended December 31, 2006.
OVERALL RESULTS
| (In Thousands of Dollars) | Consolidated NN, Inc. |
| | 2007 | 2006 | Change |
| Net sales | $ 421,294 | $ 330,325 | $ 90,969 |
Cost of products sold (exclusive of depreciation and amortization shown separately below) | 337,024 | 257,703 | 79,321 |
| Selling, general, and administrative | 36,473 | 30,008 | 6,465 |
| Depreciation and amortization | 22,996 | 17,492 | 5,504 |
| Restructuring and impairment charges (income) | 13,636 | (65) | 13,701 |
| Interest expense, net | 6,373 | 3,983 | 2,390 |
| Gain on disposal of assets | (71) | (705) | 634 |
| Other income, net | | | |
| Income before provision for income taxes | 5,249 | 22,957 | (17,708) |
| Provision for income taxes | | | |
| Net income (loss) | | | |
Net Sales. Sales have increased due to the addition of the Precision Metal Components Segment with the acquisition of Whirlaway ($62.7 million) and due to appreciation in value of Euro denominated sales relative to the U.S. Dollar ($19.6 million). In addition, sales have increased due to the pass through of raw material inflation to customers ($5.5 million) and due to higher volume to existing customers primarily at our European operations ($8.5 million). Partially offsetting these increases are price decreases given to several large customers in agreement with contractual terms ($3.4 million) and unfavorable customer, product, and currency mix to existing customers ($1.9 million).
Cost of Products Sold (exclusive of depreciation and amortization). Cost of products sold increased primarily due to the addition of the Precision Metal Components Segment on November 30, 2006 ($53.5 million) and due to the increase in value of Euro denominated costs relative to the U.S. Dollar ($15.7 million). In addition, raw material, labor and utility inflation increased ($11.1 million) and costs increased related to higher sales volume primarily at our European operations ($7.8 million). Offsetting these increases were favorable mix impacts to cost of products sold ($0.4 million) and the impact of projects focused on reducing cost of manufacturing ($8.4 million).
Selling, General and Administrative Expenses. The selling, general and administrative (“SG&A”) expense increase was primarily due to the addition of the Precision Metal Components Segment on November 30, 2006 ($4.1 million). In addition, SG&A expense increased due to the appreciation in the value of Euro denominated expenses relative to the U.S. Dollar ($1.3 million). Finally, the total was higher due to increased stock compensation expense ($0.3 million), from higher spending on consulting and professional fees ($0.3 million), higher travel and salary cost ($0.3 million) and additional bad debt expense ($0.2 million).
Depreciation and Amortization. These costs were higher due to the acquisition of the Precision Metal Components Segment ($4.0 million) and due to the increase in the value of Euro based depreciation and amortization relative to the U.S. Dollar ($1.0 million).
Interest expense. Interest expense was primarily higher due to the additional debt assumed to acquire the Precision Metal Components Segment on November 30, 2006 ($2.4 million).
Gain on disposal of assets. In 2006, we incurred a gain from the sale of excess land at our Pinerolo Plant facility ($1.8 million) partially offset by a loss on disposal of excess equipment at the same facility ($1.1 million).
Restructuring and Impairment Charges. We have begun to take steps to appropriately adjust our cost structure and align our plant capacity in our Metal Bearing Components Segment. This will include restructuring at the European operations of the Metal Bearing Components Segment as we adjust our global precision ball manufacturing capacity to take better advantage of favorable cost structures at our two newest plants the Kysucke Plant and the Kunshan Plant. As a result of this restructuring, certain goodwill and fixed assets in our European operations are now considered impaired. As a result, during the second quarter of 2007, we recorded approximately $13.3 million ($12.6 million after-tax) of non-cash impairment costs. These costs include the write-down of certain excess production equipment and the impairment of goodwill to levels supported by projected cash flows after the restructuring.
Provision for income taxes. The 2007 effective tax rate was 122%, versus the effective tax rate in 2006 of 37%. The effective tax rate in 2007 was much higher than normal due to the impact of the impairment charges taken during 2007, which carried significant valuation allowances against the related tax benefits, resulting in the high effective rate for 2007. Factoring out the impairment impacts in 2007, our effective tax rate would have been approximately 38%. There were two other significant offsetting items affecting 2007 tax expense. During the fourth quarter the deferred tax liabilities at our Italian operation of the Metal Bearing Components Segment were lowered due to enacted reductions in the Italian statutory tax rates which decreased tax expense by $1.0 million. Offsetting this reduction was a $0.8 million increase in tax expense related to recording a full valuation allowance on a deferred tax asset for tax loss carry forwards at a location still incurring losses. The 2006 effective rate is lower than the historical effective rate due to the favorable 19% tax rate on the gain from sale of land at our Pinerolo Plant.
RESULTS BY SEGMENT
METAL BEARING COMPONENTS SEGMENT
| (In Thousands of Dollars) | Year Ended December 31, |
| | 2007 | 2006 | Change |
| Net sales | $ 303,059 | $ 272,299 | $ 30,760 |
| Segment net income, excluding restructuring and impairment charges, net of tax | 18,443 | 18,331 | 112 |
| Restructuring and impairment charges, net of tax | (13,485) | -- | (13,485) |
| Segment net income | $ 4,958 | $ 18,331 | $ (13,373) |
The sales increase at the Metal Bearing Components Segment was primarily due to the positive impacts from the rise in value of Euro based sales relative to the U.S. Dollar ($19.6 million). Additionally, the Metal Bearing Components Segment experienced higher volume with existing European customers for tapered rollers and metal bearing retainers ($12.4 million) and increases related to the pass through of raw material inflation to customers ($4.5 million). These increases were partially offset by unfavorable product and currency mix to existing customers ($1.9 million) and due to contractual price decreases to certain large customers ($3.8 million).
The major negative factors affecting the segment net income, excluding restructuring and impairment charges, net of tax, a non-GAAP accounting measure, were price decreases given to certain customers under contractual terms in 2007 ($2.4 million, net of tax) and unfavorable customer, currency, and product mix, ($1.0 million, net of tax). Additionally, there was a gain on the sale of land, net of loss on disposal of machinery, at our Pinerolo Plant in the first quarter of 2006 ($0.8 million, net of tax) and gains on favorable foreign exchange impacts from the appreciation of the Slovakian Koruna during 2006 ($0.7 million, net of tax) that did not repeat in 2007.
Offsetting the negative impacts stated above were cost reduction projects that more than offset utility and labor inflation ($1.4 million, net of tax). Raw material cost inflation was offset by price increases under contractual terms to certain customers, resulting in little impact on segment profit. Additionally, Euro denominated profits were favorably impacted by the appreciation in the value of the Euro against the U.S. Dollar ($1.5 million, net of tax). The effect from higher sales volumes in Europe increased 2007 segment net income ($1.4 million, net of tax). Finally, the favorable impact of reducing deferred tax liabilities of our Italian operation of this segment due to the 5.9% reduction in the Italian statutory tax rates increased segment net income in 2007 ($1.0 million).
PRECISION METAL COMPONENTS SEGMENT
| (In Thousands of Dollars) | | Year Ended December 31, |
| | | 2007 | 2006 | Change |
| Net sales | | $ 67,384 | $ 4,722 | $ 62,662 |
| | | | | |
| Segment net loss | | $ (1,450) | $ (598) | $ (852) |
The Precision Metal Components Segment was formed on November 30, 2006 by the purchase of Whirlaway Corporation. Therefore, only one month of operations of the segment was included in the financial statements for the year ended December 31, 2006.
The second and be effectivethird quarters of 2007 were suppressed due to low demand for customers that serve U.S. heavy truck and HVAC equipment markets. The demand in the heavy truck and HVAC markets was low during this period due to large amounts of purchases made in the fourth quarter of 2006 ahead of required environmental changes to these products on January 1, 2007.
PLASTIC AND RUBBER COMPONENTS SEGMENT
| (In Thousands of Dollars) | Year Ended December 31, |
| | 2007 | 2006 | Change |
| Net sales | $ 50,851 | $ 53,304 | $ (2,453) |
| | | | |
| Segment net income | $ 2,242 | $ 2,695 | $ (453) |
Revenues in the Plastic and Rubber Components Segment were down due to lower sales volume to the automotive market and to certain specialty non-automotive customers ($3.6 million). Partially offsetting the volume decreases were benefits from raw material inflation pass through ($1.2 million).
Net income was negatively affected by the volume decreases in sales ($1.0 million, after tax). Partially offsetting the volume impacts were cost reduction projects net of inflation ($0.6 million, after tax). The increases in sales from raw material pass through were offset by raw material inflation.
Year ended December 31, 2006 compared to the year ended December 31, 2005
Overall Results
| | 2006 NN, Inc. before Acquisition | Whirlaway December 2006 | Consolidated 2006 | Consolidated 2005 | Change |
| Net sales | $ 325,603 | $ 4,722 | $ 330,325 | $ 321,387 | $ 8,938 |
| Cost of products sold | 252,997 | 4,706 | 257,703 | 248,828 | 8,875 |
| Selling, general and administrative expense | 29,645 | 363 | 30,008 | 29,073 | 935 |
| Depreciation and amortization | 17,147 | 345 | 17,492 | 16,331 | 1,161 |
| Restructuring and Impairment | (65) | -- | (65) | (342) | 277 |
| Gain on sale of fixed assets | (705) | -- | (705) | (391) | (314) |
| Interest | 3,743 | 240 | 3,983 | 3,777 | 206 |
| Other (income) loss | (1,050) | 2 | (1,048) | (653) | (395) |
| Pre-tax income (loss) | 23,891 | (934) | 22,957 | 24,764 | (1,807) |
| Taxes | 8,858 | (336) | 8,522 | 9,752 | (1,230) |
| Net income (loss) | $ 15,033 | $ (598) | $ 14,435 | $ 15,012 | $ (577) |
| | Consolidated 2006 | Consolidated 2005 | Change |
| Net sales | $ 330,325 | $ 321,387 | $ 8,938 |
| Cost of products sold | 257,703 | 248,828 | 8,875 |
| Selling, general and administrative expense | 30,008 | 29,073 | 935 |
| Depreciation and amortization | 17,492 | 16,331 | 1,161 |
| Restructuring and impairment | (65) | (342) | 277 |
| Gain on sale of fixed assets | (705) | (391) | (314) |
| Interest | 3,983 | 3,777 | 206 |
| Other (income) loss | (1,048) | (653) | (395) |
| Pre-tax income (loss) | 22,957 | 24,764 | (1,807) |
| Taxes | 8,522 | 9,752 | (1,230) |
| Net income (loss) | $ 14,435 | $ 15,012 | $ (577) |
The table above includes the results of the traditional segments of NN, Inc., Metal Bearing Components Segment and Plastic and Rubber Components Segment, plus one month of operations of Whirlaway Corporation.Whirlaway. Whirlaway was acquired November 30, 2006 and operations from December 1 to December 31, 2006 are included in the consolidation of NN, Inc.
The month of December 2006 results of Whirlaway are not indicative of normalized annual operations. December is normally a low volume month as many of Whirlaway’s customers shut down over the holidays. Additionally, the cost of products sold includes the elimination of the required step-up valuation of inventory to sales value recorded as part of purchase accounting under SFAS 141 of $0.6 million. When recorded in the opening balance sheet as of November 30, 2006, this step-up valuation represented the profit to be earned on the inventory purchased.
As for the traditionaltwo existing segments of NN, overall net income was unchanged from the prior year at $15.0 million. Sales increases from passing on raw material inflation were offset by raw material inflation having little impact on net income. Increases in selling, general and administrative cost and depreciation and amortization were offset by foreign exchange gains from the appreciation of Slovakia Koruna, the gain on sale of excess land at our Pinerolo plant, and an overall lower effective tax rate.
Sales were up due to price increases from passing through to customers the impact of raw material inflation. Sales were also up to a lesser extent from positive currency translation of Euro-denominated sales. These increases were partially offset by volume losses to two long-term customers and the unfavorable effect of product mix. In one case, the volume loss was due to the customer’s strategic decision to begin to manufacturer certain products for themselves. In the other case, the volume loss was due to a downturn in the USU.S. automotive market. These volume losses were partially offset by volume gains at newer customers.
Cost of products sold increased primarily due to inflation in material cost, labor, and energy. In addition, cost of products sold increased due to the ongoingon going start-up of our China and Slovakian manufacturing facilities. Both of these facilities are not yet operating at optimum capacity as expansion is ongoing and should be complete at both locations in 2007. Offsetting a majority of these increases are savings from our Level 3 program and other cost reduction initiatives. As mentioned above, a majority of the raw material inflation is offset by raw material pass-through to customers. These sales increases offset material inflation and do not improve net income.
Selling, general and administrative costs are higher due primarily to the effectsrecording of expensing stock optionsoption expense as a result of the adoption of SFAS 123(R). The depreciation and amortization cost are higher in 2006 due to starting depreciation on the fixed assets placed in service with the operations of China and Slovakia and the amortization of the customer intangibles acquired in 2006 related to the SNR equipment purchase. In 2006, we had a gain related to the disposal of excess land and building of $1.8 million which was partially offset by a loss on disposal of excess equipment of $1.1 million at our Pinerolo facility. In 2005,we had a gain from the sale of excess land at the Veenendaal manufacturing facility. Finally, the corporate tax rate was lower in 2006 due to a larger portion of the profit in Europe coming from lower tax cost countries, the reduction in tax rate in the Netherlands, from the gain on sale of land being taxed at a lower capital gains rate, and the recognition of certain deferred tax assets.
RESULTS BY SEGMENT
METAL BEARING COMPONENTS SEGMENT
(In Thousands of Dollars) | | | | |
| | | 2006 | 2005 | Change | |
| | | | | 2006 | 2005 | Change |
| Net sales | | $ 272,299 | $ 263,485 | $ 8,814 | | $ 272,299 | $ 263,485 | $ 8,814 |
| | | | | |
| Segment profit | | $ 18,331 | $ 18,725 | $ (394) | |
| Segment net income | | | $ 18,331 | $ 18,725 | $ (394) |
The revenue increase in the Metal Bearing Components Segment was primarily due to price increases related to raw material inflation pass-through to customers ($8.9 million), and to a lesser extent, the positive impact of a stronger Euro ($1.6 million). Planned reductions in sales from existing customers were more than offset by increased sales to new customers resulting in a net volume increase ($2.6 million). Price decreases to existing customers and a less favorable mix of bearing products sold had a negative impact ($4.3 million).
The negative impacts to segment profit after tax were from the price decreases and unfavorable product mix ($2.2 million). In addition, both our China and Slovakia operations continue to have operational inefficiencies due to transitioning in production and product lines, and each location not running at optimal capacity ($2.1 million). Finally, depreciation and amortization expense was higher due to depreciation and amortization of machinery in China and Slovakia and contract intangibles from the SNR machinery purchase ($0.7 million).
Mostly offsetting these negative impacts were the sales price increases from passing through raw material cost inflation to customers and cost reduction initiatives more than offsetting material, labor, and utility inflation ($2.8 million). In addition, the net volume increases added $0.7 million to segment profit. The gain from the sale of land at Pinerolo, net of machinery disposals, added $0.5 million. Finally, favorable foreign exchange impacts from the appreciation of the Slovakia Koruna and Euro favorably impacted segment profit by $0.7 million.
PRECISION METAL COMPONENTS SEGMENT
(In Thousands of Dollars) | | | | |
| | | 2006 | 2005 | Change | |
| | | | | | | 2006 | 2005 | Change |
| Net sales | | $ 4,722 | $ -- | $ 4,722 | | $ 4,722 | $ -- | $ 4,722 |
| | | | | | | | | |
| Segment loss | | $ (598) | $ -- | $ (598) | |
| Segment net loss | | | $ (598) | $ -- | $ (598) |
The Precision Metal Components Segment was added on November 30, 2006 with the purchase of Whirlaway. Therefore the segment'ssegment’s results are only for one month ending December 31, 2006.
The month of December 2006 results of Whirlaway are not indicative of normalized annual operations. December is normally a low volume month as many of Whirlaway'sWhirlaway’s customers shut down over the holidays. Additionally, the cost of products sold includes the elimination of the step-up of inventory to sales value recorded as part of purchase accounting under SFAS 141. When recorded in the opening balance sheet as of December 1, 2006, this step-up represented the profit to be earned on the inventory purchased.
Based on pro-forma results, 2006 and 2005 revenues for the Precision Metal Components Segment would have been $77,713 andcompared with $71,862, respectively.
PLASTICS AND RUBBER COMPONENTS SEGMENT
(In Thousands of Dollars) | (In Thousands of Dollars) | | (In Thousands of Dollars) | |
| | | 2006 | 2005 | Change | |
| | | | | | | 2006 | 2005 | Change |
| Net sales | | $ 53,304 | $ 57,902 | $ (4,598) | | $ 53,304 | $ 57,902 | $ (4,598) |
| | | | | | | | | |
| Segment profit | | $ 2,695 | $ 1,673 | $ 1,022 | |
| Segment net income | | | $ 2,695 | $ 1,673 | $ 1,022 |
Sales at the Plastics and Rubber Components Segment were down $4.6 million primarily due to lower sales volume to one large customer resulting from the downturn in the U.S. automotive market ($6.2 million) partially offset by targeted price increases in the plastics portion of the segment ($1.7 million).
The increase in segment profit, after tax, at the Plastics and Rubber Components Segment was due to the price increases ($1.1 million) and to cost saving initiatives in the areas of material usage, labor efficiency, and overhead cost ($1.6 million). These increases were partially offset by raw material and utilities inflation ($0.2 million) and the impact, net of cost of products sold, of reductions in sales volume ($1.5 million.)million).
Year ended December 31, 2005 compared to the year ended December 31, 2004
Overall Results
| | NN, Inc. |
| | 2005 | 2004 | Change |
| Net sales | $321,387 | $304,089 | $17,298 |
| Cost of products sold | 248,828 | 240,580 | 8,248 |
| Selling, general and administrative expense | 29,073 | 29,755 | (682) |
| Depreciation and amortization | 16,331 | 16,133 | 198 |
| Restructuring and Impairment | (342) | 2,398 | (2,740) |
| (Gain) loss on sale of fixed assets | (391) | 856 | (1,247) |
| Interest | 3,777 | 4,029 | (252) |
| Other (income) loss | (653) | (853) | 200 |
| Pre-tax income (loss) | 24,764 | 11,191 | 13,573 |
| Taxes | 9,752 | 4,089 | 5,663 |
| Net income (loss) | $15,012 | $7,102 | $7,910 |
Net sales. Overall sales increased $17.3 million, or 6%, due to price increases from the pass through to customers of raw material inflation of $11.4 million, from new market share and volume gains of $4.6 million and favorable foreign currency exchange of $1.3 million.
Cost of products sold (exclusive of depreciation reported separately below). Cost of products sold increased by $8.3 million, or 3%, due to the sales volume increase offset by improvements in manufacturing efficiency. The cost reductions from the Level 3 program (the Company’s cost reduction and quality improvement initiative) and other cost reduction projects account for this difference.
Selling, general and administrative expenses. Selling, general and administrative expenses decreased by $0.7 million, or 2%. Overall SG&A cost are down due to lower spending on Sarbanes-Oxley compliance ("SOX 404") , severance costs, legal, consulting and computer maintenance costs, partially offset by an increase in the NN Asia startup costs.
Depreciation and amortization. Overall depreciation increased $0.2 million, or 1%, due primarily to higher depreciation cost resulting from the investment of fixed assets in Slovakia in late 2004 and 2005.
(Gain) loss on disposal of assets. In 2005, the Metal Bearing Components Segment had a gain of $0.4 million principally from the sale of excess land at our Veenendaal manufacturing facility. In 2004, the segment had a loss of $0.8 million related to the sale of the idle Walterboro, South Carolina land and building assets.
Restructuring and impairment costs. In 2004, the Metal Bearing Components Segment incurred $2.3 million of restructuring costs related to severance cost for approximately 83 employees at our Eltmann, Germany ball production facility. In 2005, we determined that a portion of the Eltmann restructuring charges would not be incurred as expected, creating a benefit of $0.3 million.
Interest expense. Interest expense decreased due to a reduction of our European debt of approximately $16.4 million dollars. This reduction was partially offset by increased interest cost due to higher borrowings and increased interest rates on our variable-rate debt.
Net income. Net income increased $7.9 million or 111% in 2005 compared with 2004 due primarily to higher revenue resulting from price increases from the pass through to customers of raw material price changes, growth with existing customers and new customers.
RESULTS BY SEGMENT
METAL BEARING COMPONENTS SEGMENT
(In Thousands of Dollars) | | |
| | | 2005 | 2004 | Change |
| | | | | |
| Net sales | | $ 263,485 | $ 252,365 | $ 11,120 |
| | | | | |
| Segment Profit | | $ 18,725 | $ 9,517 | $ 9,208 |
Sales increased in the Metal Bearing Components Segment due to price increases related to the pass through to customers of raw material inflation of $9.9 million and favorable foreign currency exchange of $1.3 million.
The increase in segment profit, after tax, is due primarily to price increases from passing through raw material inflation ($6.1 million) and reductions in variable costs due to Level 3 savings, savings from Eltmann restructuring, and other cost reduction initiatives ($4.2 million) more than offsetting inflation ($5.8 million).
Additionally there was a positive impact in restructuring cost of $1.7 million. In 2004, we incurred $1.5 million of restructuring costs related to severance cost for approximately 83 employees at our Eltmann, Germany ball production facility. In 2005, we determined that a portion of the Eltmann restructuring charges would not be incurred as expected, creating a benefit of $0.2 million.
In 2005, the Metal Bearing Components Segment had a gain of $0.3 million principally from the sale of excess land at our Veenendaal manufacturing facility. In 2004, the segment had a loss of $0.5 million related to the sale of the idle Walterboro, South Carolina land and building assets.
Finally, Metal Bearing Components Segment income, net of tax, increased due to selling, general and administrative expense savings in the areas of professional fees related to SOX 404 compliance, reductions in consulting costs, net of tax, and reductions in computer maintenance cost, partially offset by higher startup cost at NN Asia and the impact of a reserve for potentially uncollectible receivables of Delphi Corporation due to bankruptcy filing ($0.9 million). Additionally, interest cost was lower ($0.7 million) due to repayment of segment debt and depreciation expense increased ($0.1 million) due primarily to higher depreciation cost resulting from the investment of fixed assets in Slovakia in late 2004 and 2005.
PLASTICS AND RUBBER COMPONENTS SEGMENT
(In Thousands of Dollars) | |
| | | 2005 | 2004 | Change |
| | | | | |
| Net sales | | $ 57,902 | $ 51,724 | $ 6,178 |
| | | | | |
| Segment Profit | | $ 1,673 | $ 1,724 | $ (51) |
Sales at the Plastic and Rubber Components Segment increased $4.6 million due to market share gains and volume gains from existing business and $1.5 million due to price increases in the second half of 2005.
The decrease in the Plastic and Rubber Components Segment profit, after tax, is due to $2.0 million in raw material, wage and energy
inflation offset by $0.9 million benefit due to sales volume increases and decreases in cost of products sold of $1.0 million due to savings from Level 3 and other cost reduction initiatives.
Liquidity and Capital Resources
On September 21, 2006, the Companywe entered into a five-year $90.0 million revolving credit facility maturing in September 2011 with KeyBankKey Bank as administrative agent. This facility can bewas increased to a maximum availability of $120.0$135.0 million under certain conditions specified in the agreement.on May 30, 2007. The credit facility provides the Companyus the ability to borrow in US dollarsU.S. Dollars at LIBOR plus an applicable margin of .60% to .925%..925% or Euros at EURIBOR plus an applicable margin of .60% to .925%..925%. The facility has a $10.0 million swing line feature to meet short term cash flow needs.needs with an interest rate equal to the prime lending rate. Any borrowings under this swing line are considered short term. Costs associated with entering into the revolving credit facility werecapitalizedwere capitalized and will be amortized into interest expense over the life of the facility. As of December 31, 2006, $5112007, $0.6 million of net capitalized loan origination cost was on the balance sheet within other assets and the gross costs were presented in the Financing Activities section of the Statement of Cash Flows. This credit facility replaced our prior $90.0 million credit facility with AmSouth Bank as administrative agent. The loan agreement contains customary financial and non-financial covenants specifying that we must maintain certain liquidity measures. The loan agreement also contains customary restrictions on, among other things, additional indebtedness, liens on our assets, sales or transfers of assets, investments, restricted payments (including payment of dividends and stock repurchases), issuance of equity securities, and merger, acquisition and other fundamental changes in the Company’sour business. The credit agreement is collateralized by the pledge of stock of certain foreign and domestic subsidiaries and guarantees of certain domestic subsidiaries. At December 31, 2006,2007, we have $50.5$64.5 million of availability under the $90.0$135.0 million facility. Subsequent to year end, $18.6 million of the credit facility was used to pay off a note payable to a related party.
On April 26, 2004 we issued $40.0 million aggregate principal amount of senior notes in a private placement (the “$40 million notes”).placement. These notes bear interest at a fixed rate of 4.89% and mature on April 26, 2014. Interest is paid semi-annually. As of December 31, 2006,2007, $40.0 million remained outstanding. Annual principal payments of approximately $5.7 million begin on April 26, 2008 and extend through the date of maturity. The agreement contains customary financial and non-financial covenants. Such covenants specify that we must maintain certain liquidity measures. The agreement also contains customary restrictions on, among other things, additional indebtedness, liens on our assets, sales or transfers of assets, investments, restricted payments (including payment of dividends and stock repurchases), issuance of equity securities, and mergers, acquisitions and other fundamental changes in our business. The notes are collateralized by the pledge of stock of certain foreign subsidiaries. We incurred $0.8As of December 31, 2007, we had recorded $0.5 million of related costsnet capitalized loan origination cost as a result of issuing these notes which have been recorded as a component of other non-current assets andwhich are being amortized over the term of the notes.
We were in compliance with all covenants related to the $90.0$135.0 million credit facility and the $40.0 million senior notes as of December 31, 2006.2007. See Note 8 of the Notes to Consolidated Financial Statements.
On October 27, 2004, we completed the sale of our idle warehouse in Kilkenny, Ireland for approximately 1.6 million Euros ($2.0 million), net of selling costs incurred. As a result of this transaction, we recorded a loss on disposal of assets of approximately 0.1 million Euro ($0.1 million) during the fourth quarter of 2004, which was recorded as a component of loss on disposal of assets. Prior to the sale, this asset was classified as a component of property, plant and equipment, net.
In December 2005, we generated approximately $0.8 million in proceeds from sale of excess land at our Veenendaal The Netherlands facility.Plant. This transaction resulted in recording a gain of approximately $0.4 million.
In January 2006, we generated approximately $2.8 million in proceeds from sale of excess land at our Pinerolo, Italy facility. The transaction resulted in a net after tax gain of $1.4 million.
To date, cash generated by foreign subsidiaries has been used mostlyprimarily for general purposes including investments in property, plant and equipment and prepayment of the former Euro term loan. No dividends have beenIn 2007, a $5.0 million dividend, on earnings for which U.S. Federal tax was previously paid, was declared orand paid to us by thea foreign subsidiaries that may have beensubsidiary. These funds were used by the Company to permanently pay down our domestic credit facilities.debt. Remaining undistributed foreign earnings are deemed to be permanently reinvested. During 2006, a European subsidiary repaid an $8.0 million loan with the parent company. These funds were used to repay part of our domestic credit facilities.
The Company’sOur arrangements with itsour domestic customers typically provide that payments are due within 30 days following the date of the Company’sour shipment of goods, while arrangements with foreign customers of our domestic business (other than foreign customers that have entered into an inventory management program with the Company)us) generally provide that payments are due within 90 or 120 days following the date of shipment. Under the Metal Bearing Components Segment’s inventory management program with certain European customers, payments typically are due within 30 days after the customer uses the product. The Company’sOur arrangement with its European customers regarding due dates vary from 30 to 90 days following date of sale with an average of approximately 50 days outstanding. The Company’sOur sales and receivables can be influenced by seasonality due to the Company’sour relative percentage of European business coupled with many foreign customers ceasing production during the month of August. For information concerning the Company’sour quarterly results of operations for the years ended December 31, 20062007 and 2005,2006, see Note 17 of the Notes to Consolidated Financial Statements.
The Company billsWe invoice and receivesreceive payment from somemany of itsour customers in Euro as well as other currencies. In 2006,2007, the fluctuation of the Euro against the U.S. dollarDollar positively impacted sales and income. As a result of these sales, the Company’sour foreign exchange transaction and translation risk has increased. Various strategies to manage this risk are available to management including producing and selling in local currencies and hedging programs. As of December 31, 2006,2007, no currency hedges were in place. In addition, a strengthening of the U.S. dollarDollar and/or Euro against foreign currencies could impair theour ability of the Company to compete with international competitors for foreign as well as domestic sales.
Sales to various U.S. and foreign divisions of SKF, which is one of the largest bearing manufacturers in the world, accounted for approximately 40% of consolidated net sales in 2007. During 2007, our ten largest customers accounted for approximately 75% of our consolidated net sales. None of our other customers individually accounted for more than 10% of our consolidated net sales for 2007. The loss of all or a substantial portion of sales to these customers would cause us to lose a substantial portion of our revenue and have a corresponding negative impact on our operating profit margin due to operation leverage these customers provide. This could lead to sales volumes not being high enough to cover our current cost structure or provide adequate operating cash flows. Due to a limit on the amount of excess bearing component capacity it would be difficult for any of our top ten customers to move a substantial portion of the product we supply in a short period of time. Working capital, which consists principally of accounts receivable and inventories offset by accounts payable, was $53.8 million at December 31, 2007 as compared to $51.0 million at December 31, 2006 as compared to $41.1 million at December 31, 2005.2006. Working capital increased by $10.8 million due to the acquisition of Whirlaway on November 30, 2006. Additionally, working capital increased by $1.3$1.8 million due to Euro denominated assets and liabilities increasing in value relative to the dollar.U.S. Dollar. The following comments have factored out the effects of foreign exchange. Inventory was reducedincreased by $3.2 million in line with overall company goals and accounts receivable increased $0.8$6.1 million due to timing of purchases of raw steel and production of certain finished goods being made ahead of orders. Accounts receivable decreased $1.0 million due to timing of certain customer payments and an increase in allowance for doubtful accounts reserves partially offset by higher sales volume in the fourth quarter of 20062007 versus the fourth quarter of 2005. In addition,2006. Additionally, the receipt of $2.5accounts payable balance decreased $5.0 million from pay-off2006, as the prior year balance included certain one-time payables that were not in the balance at 2007 and payments to certain vendors were made before year end in 2007 versus after year end in 2006. Finally, the current portion of a note receivable reduced working capital.long term debt was $11.0 million higher in 2007 due to the higher usage of short terms borrowings and reclassification of the first annual installment of the private placement notes due in 2008. The ratio of current assets to current liabilities increased from 1.63:decreased to 1.64:1 at December 31, 2005 to2007 from 1.68:1 at December 31, 2006.
Cash flow from operations totaled $21.6 million in 2007, $33.0 million in 2006 compared withand $30.0 million in 20052005. The decrease in cash flow provided by operations is due to inventories having increased in 2007 and $31.6accounts payable having decreased in 2007, as discussed above.
Total assets and current assets increased approximately $17.9 million in 2004.and approximately $6.9 million, respectively, from the December 31, 2006 balance due to appreciation of Euro denominated assets relative to the U.S. Dollar. Factoring out the foreign exchange effects, current assets were higher due to increased inventory balances as mentioned above and property, plant and equipment was lower due to certain fixed assets being impaired ($3.4 million) and from full year capital spending having been lower than depreciation ($1.8 million).
Total liabilities and current liabilities increased approximately $7.4 million and approximately $5.1 million, respectively, from the December 31, 2006 balance due to appreciation of Euro denominated liabilities relative to the U.S. Dollar. Factoring out the foreign exchange effects, accounts payable was $5.0 million lower as discussed above and our short term debt increased by $11.0 million as discussed above.
During 2006,the second quarter, we recorded approximately $13.4 million ($12.7 million after-tax) of non-cash impairment charges. These charges included the write-down to estimated fair market value of certain excess production equipment and the full impairment of goodwill at one location to levels supported by projected cash flows after the restructuring. These charges did not require the use of any of our existing cash flows from operations or available credit lines.
During 2007, we spent $19.3approximately $18.9 million on capital expenditures. Of this amount, we spent $6.7approximately $7.2 million related to geographic expansion of our manufacuturingmanufacturing base $1.8 million to acquire the remaining machinery under the SNR agreement, and $10.8approximately $11.7 million related primarily to cost reduction, equipment andupgrades, process upgrades, andor replacements. During 2007,2008, we plan to spend approximately $19.0$18.5 million on capital expenditures. Of this amount, $11.3$3.5 million will be related primarily to equipment and process upgrades and replacements, and approximately $7.7$7.6 million will be principally related to geographic expansion of our manufacturing base.base and approximately $7.4 million will be related to cost improvement initiatives. We intend to finance these activities with cash generated from operations and funds available under our credit facilities. The Company believesWe believe that funds generated from operations and borrowings will be sufficient to finance the Company’sour working capital needs, projected capital expenditure requirements, common stock repurchase plan and dividend payments through December 2007.31, 2008.
The table below sets forth certainsome of the Company’sour contractual obligations and commercial commitments as of December 31, 20062007 (in thousands):
Certain Contractual Obligations | Payments Due by Period | Payments Due by Period |
Total | Less than 1 year | 1-3 years | 3-5 years | After 5 years | Total | Less than 1 year | 1-3 years | 3-5 years | After 5 years |
| Long-term debt | $ 100,199 | $ 851 | $ 12,510 | $ 69,694 | $ 17,144 | |
| Long-term debt including current portion | | $ 112,044 | $ 11,851 | $ 11,735 | $ 77,028 | $ 11,430 |
| Expected interest payments | 26,565 | 5,618 | 10,516 | 9,243 | 1,188 | 20,707 | 5,702 | 10,145 | 4,348 | 512 |
| Operating leases | 24,144 | 3,890 | 6,707 | 4,953 | 8,594 | 23,314 | 4,333 | 6,260 | 3,590 | 9,131 |
| Capital leases (1) | 4,202 | 224 | 448 | 448 | 3,082 | 4,406 | 248 | 496 | 496 | 3,166 |
| Expected pension contributions and benefit payments | 1,976 | 112 | 284 | 359 | 1,221 | 2,046 | 125 | 282 | 334 | 1,305 |
| Other long-term obligations (2) | 120,000 | 40,000 | 80,000 | -- | 106,600 | 53,300 | 53,300 | -- | -- |
| Total contractual cash obligations | $ 277,086 | $ 50,695 | $ 110,465 | $ 84,697 | $ 31,229 | $ 269,117 | $ 75,559 | $ 82,218 | $ 85,796 | $ 25,544 |
____________________
We have approximately $1.7 million in unrecognized tax benefits and related penalties and interest accrued within the liabilities section of our balance sheet. We are unsure when or if at all these amounts might be paid to U.S. and/or foreign taxing authorities. Accordingly these amounts have been excluded from the table above. See Note 14 in the Notes to Consolidated Financial Statements for additional details.
(1) On June 1, 2004, our wholly owned subsidiary, NN Precision Bearing Products Company Ltd, entered into a twenty year lease agreement with Kunshan Tian Li Steel Structure Co. LTD for the lease of land and building in the Kunshan Economic and Technology Development Zone, Jiangsu, The People’s Republic of China. The lease is cancelable by the Companyus in the fifth, ninth, and fourteenth year. The building was newly constructed and we began usage ofusing the leased property during the fourth quarter of 2005. The agreement is accounted for as a capital lease. The capitalCapital leases line in the table above reflects the undiscounted future minimum lease payments as of October 1, 2005, the date the Companywe began to use the property. No other amounts are included in capitalCapital leases above.
(2) Other Long-Term Obligations consistconsists of steel purchase commitments at our European operations.operations (See Note 16 of the Notes to Consolidated Financial Statements.)
We currently have operations in Ireland, Germany, Italy and The Netherlands, all of which are Euro participating countries, and in Slovakia which joined the European Union in May 2004 and is expected to adopt the Euro as its functional currency within several years. Each of our European facilities sellssell product to customers in many of the Euro participating countries. The Euro has been adopted as the functional currency at all locations in Europe, except Slovakia whose functional currency is the Slovak Koruna. The functional currency of NN Asia is the Chinese Yuan.
Our net sales historically have been seasonal in nature, becausedue to a significant portion of our sales arebeing to European customers that cease or significantly slow production during the month of August. For information concerning our quarterly results of operations for the years ended December 31, 20062007 and 2005,2006, see Note 17 of the Notes to Consolidated Financial Statements.
WhileThe cost base of our operations have nothas been materially affected by steel inflation during recent years, but due to the ability to pass on this steel inflation to our customers the overall financial impact has been minimized. The prices for 52100 Steel, engineered resins and other raw materials purchased by uswhich we purchase are subject to material change. Our typical pricing arrangements with steel suppliers are subject to adjustment every six months. We typically reserve the right to increase product prices periodically in the event of increases in itsour raw material costs. In the past, we have been able to minimize the impact on our operations resulting from the 52100 Steel price fluctuations by taking such measures. However, at our European operations, by contract, material price changes in any given year are passed along with price adjustments in January of the following year and beginning in 2007 scrap surcharges, a component of material cost, will be passed through quarterly.
In July 2006, the FASB issued Interpretation No. 48 (“FIN 48”), “Accounting for Uncertainty in Income Taxes—an Interpretation of SFAS 109 “Accounting for Income Taxes”. FIN 48 prescribes a comprehensive model for how a company should recognize, measure, present, and disclose in its financial statements uncertain tax positions that a company has taken or expects to take on a tax return. Under FIN 48, the financial statements will reflect expected future tax consequences of such positions presuming the taxing authorities’ full knowledge of the position and all relevant facts, but without considering time values. FIN 48 also revises disclosure requirements and introduces a prescriptive, annual, tabular roll-forward of the unrecognized tax benefits. FIN 48 is effective for fiscal years beginning after December 15, 2006. We will adopt FIN 48 on January 1, 2007. We have evaluated the impact of adopting this standard on our consolidated financial position and results of operations and concluded the impact of the adoption will not have a material effect.
In September 2006, the FASB issued SFAS No. 157, “Fair Value Measurements” (SFAS 157), which provides guidance on how to measure assets and liabilities atthat use fair value. SFAS 157 will apply whenever another USU.S. GAAP standard requires (or permits) assets or liabilities to be measured at fair value but does not expand the use of fair value to any new circumstances. This standard also will require additional disclosures in both annual and quarterly reports. SFAS 157 will be effective for financial statements issued for fiscal years beginning after November 15, 2007. However, on December 14, 2007, the FASB issued and will be adopted by us beginningon February 14, 2008, approved, FASB Staff Position FAS 157-2 (“FSP FAS 157-2”) which would delay the effective date of SFAS No. 157 for all non financial assets and non financial liabilities, except those that are recognized or disclosed at fair value in the financial statements on a recurring basis (at least annually). The FSP partially defers the effective date of SFAS No. 157 to fiscal years beginning after November 15, 2008. Effective for first quarter of 2008.2008, the Company plans to adopt SFAS No. 157 except as it applies to those non financial assets and liabilities as noted in FSP FAS 157-2. We are currently evaluating the potential impact this standard may have on our consolidated financial position and results of operations, but do not believe the impact of the adoption will be material.have a material effect.
In September 2006, the SEC staff issued Staff Accounting Bulletin (SAB) No. 108, “Considering the Effects of Prior Year Misstatements when Quantifying Misstatements in Current Year Financial Statements” (“SAB 108”). SAB 108 was issued in order to eliminate the diversity of practice in how public companies quantify misstatements of financial statements, including misstatements that were not material to prior years’ financial statements. We will initially apply the provisions of SAB 108 in connection with the preparation of our annual financial statements for the year ending December 31, 2006. We have evaluated the potential impact SAB 108 may have on our financial position and results of operations and do not believe the impact of the application of this guidance will be material.
In September 2006, the FASB issued SFAS No. 158, “Employers’ Accounting for Defined Benefit Pension and Other Postretirement Plans, an amendment of FASB Statements No. 87, 88, 106 and 132(R)” (SFAS 158). Part of this Statement will be effective as of December 31, 2006, and requires companies that have defined benefit pension plans and other postretirement benefit plans to recognize the funded status of those plans on the balance sheet on a prospective basis from the effective date. The funded status of these plans is determined as of the plans’ measurement dates and represents the differences between the amount of the obligations owed to participants under each plan (including the effects of future salary increases for define benefit plans) and the fair value of each plan’s assets dedicated to paying those obligations. To record the funded status of those plans, unrecognized prior service costs and net actuarial losses experienced by the plans will be recorded in the Other Comprehensive Income (OCI) section of shareholders’ equity on the balance sheet. The Company recognized the funded status of our defined benefit plan, covering our Eltmann, Germany facility, and provided required disclosures for the fiscal year ended December 31, 2006. The impact was not material to our consolidated financial position.
In February, 2007, the FASB issued SFAS No. 159, “The"The Fair Value Option for Financial Assets and Financial Liabilities—Including an amendment of FASB Statement No. 115.”" SFAS No. 159 permits companies to choose to measure many financial instruments and certain other items at fair value at specified election dates. Upon adoption, an entity mustshall report unrealized gains and losses on items for which the fair value option has been elected in earnings at each subsequent reporting date. Most of the provisions apply only to entities that elect the fair value option. However, the amendment to SFAS No. 115, “Accounting"Accounting for Certain Investments in Debt and Equity Securities,”" applies to all entities with available for sale and trading securities. SFAS No. 159 will be effective as of the beginning of an entity’sentity's first fiscal year that begins after November 15, 2007. The Company isWe are currently evaluating the effect SFAS No. 159 will have on its consolidated financial position, liquidity, or results of operations.
European RestructuringIn December 2007, the FASB issued SFAS No. 141 (revised 2007), "Business Combinations" ("SFAS No. 141R"), which establishes principles and requirements for the acquirer in a business combination, including recognition and measurement in the financial statements of the identifiable assets acquired, the liabilities assumed, and any non-controlling interest in the acquiree. SFAS 141R also provides guidance for the recognition and measurement of goodwill acquired in the business combination and for disclosure to enable financial statement users to evaluate the nature and financial effects of the business combination. This Statement replaces SFAS No. 141, "Business Combinations" ("SFAS No. 141"). While SFAS No. 141R retains the fundamental requirements in SFAS No. 141 that the acquisition method of accounting be used for all business combinations and for an acquirer to be identified for each business combination, it also improves the comparability of the information about business combinations provided in financial reports. In addition, SFAS No. 141R defines the acquirer as the entity that obtains control of one or more businesses in the business combination and establishes the acquisition date as the date that the acquirer achieves control. This Statement applies prospectively to business combinations for which the acquisition date is on or after the beginning of the first annual reporting period beginning on or after December 15, 2008.
As previously mentioned, in 2004, we restructured our Eltmann, Germany ball production facility and incurred $2.3 million of restructuring costs related to severance cost for approximately 84 employees. European Restructuring
In 2006, we entered into negotiations with representatives of the Eltmann employeesemployees’ works council. The negotiations seekWe signed an agreement with the union representatives of our workers at this facility for significant wage reductionscontract revisions including new wages rates and changes in work rules. These negotiations are progressing as ofincreasing hours worked per week during February 2008.
In 2007, we began the date of this report and are expected to be concluded during 2007. However, if a satisfactory agreement cannot be reached, we may beginprocess to shift production to lower cost faciltiies,facilities, thereby incurring costs for the production shifts and necessitating further restructuring at the Eltmann facility, which could includePlant, including actions leading to a significant downsizing or even closurethat location. Due to the agreement reached with the workers in February 2008, we postponed the downsizing of the facility. If this were to occur, we would experience significant cash restructuring costs and impariment charges for tangible and intangible assets.location. In addition, such a restructuringin the second quarter of 2007, we incurred non-cash impairment charges related to restructuring. See Note 3 of the Notes to Consolidated Financial Statements.
At this time, it is possible additional cash and non-cash charges might cause assetsbe incurred to reduce or eliminate the work force at other European plants to become impaired. We do not believe that such action is probable at this time.the Eltmann plant in the future.
Item 7A.Quantitative and Qualitative Disclosures About Market Risk
We are exposed to changes in financial market conditions in the normal course of our business due to our use of certain financial instruments as well as transacting in various foreign currencies. To mitigate our exposure to these market risks, we have established policies, procedures and internal processes governing our management of financial market risks. We are exposed to changes in interest rates primarily as a result of our borrowing activities. At December 31, 2006,2007, these borrowings included $40.0 million aggregate principal amount of fixed rate senior notes and a new $90our $135 million revolving credit facility which was used to maintain liquidity, fund our business operations, and fund acquisitions. At December 31, 2006,2007, we had $40.0 million of fixed rate senior notes outstanding and $39.5$70.5 million outstanding under the variable rate revolving credit facilities. At December 31, 2006,2007, a one-percent increase in the interest rate charged on our outstanding variable rate borrowings would result in interest expense increasing annually by approximately $0.4$0.7 million. The nature and amount of our borrowings may vary as a result of future business requirements, market conditions and other factors.
Translation of our operating cash flows denominated in foreign currencies is impacted by changes in foreign exchange rates. Our Metal Bearing Component Segment billsinvoices and receives payment in currencies other than the U.S. dollarDollar including the Euro. In 2006,2007, the fluctuation of the Euro against the U.S. dollarDollar positively impacted assets, revenue and income. To help reduce exposure to foreign currency fluctuation, management has incurred debt in Euros in the past and has, from time to time, used foreign currency hedges to hedge currency exposures when these exposures meet certain discretionary levels. We did not use any significant currency hedges in 2006,2007, nor did we hold a position in any foreign currency hedging instruments as of December 31, 2006.2007.
Item 8.Financial Statements and Supplementary Data
Index to Financial Statements
Financial Statements Page
Report of Independent Registered Public Accounting Firm .................................................................................................................................................. 34
Consolidated Balance Sheets at December 31, 2007 and 2006................................................................................................................................................ 35
Consolidated Statements of Income (Loss) and Comprehensive Income
for the years ended December 31, 2006, 2005 and 2004 . . . . . . . . . . . . . . . . . . . . . . . . . . 31
Consolidated Balance Sheets at December 31,2007, 2006 and 2005. . . . . . . . . . . . . . . . . . . . . . . . . . . . . . . . . . . . . . . . . . . . . . . . . . . . . . . . . . . . . . . . . . . . . . . . . . . . 332005........................................................................................................................................................... 36
Consolidated Statements of Income and Comprehensive Income for the years ended December 31, 2006, 2005 and 2004 . . . . . . . . . . . . . . . . . . . . . . . 34
Consolidated Statements of Changes in Stockholders’ Equity for the
years ended December 31, 2007, 2006 and 2005 and 2004 . . . . . . . . . . . . . . . . . . . . . . . . . . 35...................................................................................................................................................................... 37
Consolidated Statements of Cash Flows for the years ended
December 31, 2007, 2006 and 2005 and 2004 . . . . . . . . . . . . . . . . . . . . . . . . . . . . . . . . . . . . . . . . . . . . 36............................................................................................................................................................................................ 38
Notes to Consolidated Financial Statements . . . . . . . . . . . . . . . . . . . . . . . . . . . . . . . . . . . . . . . . . . . . . . . . . . . . . . . . . . . . . . . . . . . . . . . . . . . . . . . . . . . . . . . 37......................................................................................................................................................................... 39
Report of Independent Registered Public Accounting Firm
To the Board of Directors and Stockholders of NN, Inc
ToBoard of Directors of NN, Inc.:
We have completed integrated audits of NN, Inc.’s 2006 consolidated financial statements and of its internal control over financial reporting as of December 31, 2006, in accordance with the standards of the Public Company Accounting Oversight Board (United States). Our opinions, based on our audits, are presented below.
Consolidated financial statements
In our opinion, the consolidated financial statements listed in the accompanying index appearing under Item 8, present fairly, in all material respects, the financial position of NN, Inc.Inc and its subsidiaries at December 31, 20062007 and 2005,2006 and, the results of their operations and their cash flows for each of the three years in the period ended December 31, 20062007 in conformity with accounting principles generally accepted in the United States of America. TheseAlso in our opinion, the Company did not maintain, in all material respects, effective internal control over financial reporting as of December 31, 2007, based on criteria established in Internal Control - Integrated Framework issued by the Committee of Sponsoring Organizations of the Treadway Commission (COSO) because a material weakness in internal control over financial reporting related to ineffective controls over the accounting for the impairment of long-lived assets existed as of that date. A material weakness is a deficiency, or a combination of deficiencies, in internal control over financial reporting, such that there is a reasonable possibility that a material misstatement of the annual or interim financial statements arewill not be prevented or detected on a timely basis. The material weakness referred to above is described in the responsibilityaccompanying Management's Report on Internal Control over Financial Reporting appearing under Item 9A. We considered this material weakness in determining the nature, timing, and extent of audit tests applied in our audit of the December 31, 2007 consolidated financial statements, and our opinion regarding the effectiveness of the Company’s management.internal control over financial reporting does not affect our opinion on those consolidated financial statements. The Company's management is responsible for these financial statements, for maintaining effective internal control over financial reporting and for its assessment of the effectiveness of internal control over financial reporting included in management's report referred to above. Our responsibility is to express an opinionopinions on these financial statements, and on the Company's internal control over financial reporting based on our integrated audits. We conducted our audits of these statements in accordance with the standards of the Public Company Accounting Oversight Board (United States). Those standards require that we plan and perform the auditaudits to obtain reasonable assurance about whether the financial statements are free of material misstatement. An auditmisstatement and whether effective internal control over financial reporting was maintained in all material respects. Our audits of the financial statements includesincluded examining, on a test basis, evidence supporting the amounts and disclosures in the financial statements, assessing the accounting principles used and significant estimates made by management, and evaluating the overall financial statement presentation. Our audit of internal control over financial reporting included obtaining an understanding of internal control over financial reporting, assessing the risk that a material weakness exists, and testing and evaluating the design and operating effectiveness of internal control based on the assessed risk. Our audits also included performing such other procedures as we considered necessary in the circumstances. We believe that our audits provide a reasonable basis for our opinion.opinions.
As discussed in Note 9 to the consolidated financial statements, the Company changed the manner in which it accounts for defined benefit pension plans effective December 31, 2006. As discussed in NoteNotes 1 and 10 to the consolidated financial statements, the Company changed the manner in which it accounts for share-based compensation as of January 1, 2006.
Internal control over As discussed in Note 9 to the consolidated financial reporting
Also, in our opinion, management’s assessment, included in Management's Report on Internal Control Over Financial Reporting appearing under Item 9A, thatstatements, the Company maintainedchanged the manner in which it accounts for defined benefit plans effective internal control overDecember 31, 2006. As discussed in Note 14 to the consolidated financial reportingstatements, the Company changed the manner in which it accounts for uncertain tax positions as of December 31, 2006 based on criteria established in Internal Control - Integrated Framework issued by the Committee of Sponsoring Organizations of the Treadway Commission (COSO), is fairly stated, in all material respects, based on those criteria. Furthermore, in our opinion, the Company maintained, in all material respects, effective internal control over financial reporting as of December 31, 2006, based on criteria established in Internal Control - Integrated Framework issued by the COSO. The Company’s management is responsible for maintaining effective internal control over financial reporting and for its assessment of the effectiveness of internal control over financial reporting. Our responsibility is to express opinions on management’s assessment and on the effectiveness of the Company’s internal control over financial
reporting based on our audit. We conducted our audit of internal control over financial reporting in accordance with the standards of the Public Company Accounting Oversight Board (United States). Those standards require that we plan and perform the audit to obtain reasonable assurance about whether effective internal control over financial reporting was maintained in all material respects. An audit of internal control over financial reporting includes obtaining an understanding of internal control over financial reporting, evaluating management’s assessment, testing and evaluating the design and operating effectiveness of internal control, and performing such other procedures as we consider necessary in the circumstances. We believe that our audit provides a reasonable basis for our opinions.January 1, 2007.
A company’s internal control over financial reporting is a process designed to provide reasonable assurance regarding the reliability of financial reporting and the preparation of financial statements for external purposes in accordance with generally accepted accounting principles. A company’s internal control over financial reporting includes those policies and procedures that (i) pertain to the maintenance of records that, in reasonable detail, accurately and fairly reflect the transactions and dispositions of the assets of the company; (ii) provide reasonable assurance that transactions are recorded as necessary to permit preparation of financial statements in accordance with generally accepted accounting principles, and that receipts and expenditures of the company are being made only in accordance with authorizations of management and directors of the company; and (iii) provide reasonable assurance regarding prevention or timely detection of unauthorized acquisition, use, or disposition of the company’s assets that could have a material effect on the financial statements.
Because of its inherent limitations, internal control over financial reporting may not prevent or detect misstatements. Also, projections of any evaluation of effectiveness to future periods are subject to the risk that controls may become inadequate because of changes in conditions, or that the degree of compliance with the policies or procedures may deteriorate.
PricewaterhouseCoopers LLP
Charlotte, North Carolina
March 15, 2007
NN, Inc.
|
Consolidated Balance Sheets
|
December 31, 2006 and 2005
|
(In thousands, except per share data)
|
17, 2008
Assets | 2006 | 2005 |
| Current assets: | | |
Cash and cash equivalents | $ 11,681 | $ 10,856 |
Accounts receivable, net | 63,442 | 47,297 |
Inventories, net | 43,538 | 38,096 |
Income tax receivable | -- | 1,237 |
Other current assets | 6,004 | 7,655 |
Current deferred tax asset | 1,199 | 809 |
Total current assets | 125,864 | 105,950 |
| | | |
| Property, plant and equipment, net | 156,447 | 118,829 |
| Assets held for sale | -- | 1,072 |
| Goodwill, net | 46,147 | 41,648 |
| Intangible assets, net | 10,131 | -- |
| Non current deferred tax assets | 2,117 | -- |
| Other non-current assets | 1,995 | 2,156 |
| Total assets | $ 342,701 | $ 269,655 |
| | | |
Liabilities and Stockholders’ Equity | | |
| Current liabilities: | | |
Accounts payable | $ 52,576 | $ 41,660 |
Accrued salaries, wages and benefits | 13,519 | 12,407 |
Income taxes | 94 | 2,093 |
Current maturities of long-term debt | 851 | 4,668 |
Current portion of obligation under capital lease | 224 | 224 |
Other liabilities | 7,605 | 3,704 |
Current deferred tax liabilities | -- | 83 |
Total current liabilities | 74,869 | 64,839 |
| | | |
| Non-current deferred tax liability | 16,334 | 15,128 |
| Long-term debt | 80,711 | 57,900 |
| Related party debt | 21,305 | |
| Accrued pension | 13,187 | 11,783 |
| Obligation under capital lease | 1,713 | 1,685 |
| Other non-current liabilities | 1,413 | 2,246 |
| Total liabilities | 209,532 | 153,581 |
| | | |
| Commitments and Contingencies (Note 16) | -- | -- |
| | | |
| Stockholders’ equity: | | |
| Common stock - $0.01 par value, authorized 45,000 shares, issued and outstanding 16,842 shares in 2006 and 17,206 shares in 2005 | 169 | 172 |
Additional paid-in capital | 53,473 | 57,754 |
| Additional paid-in capital - unearned compensation | -- | (467) |
Retained earnings | 64,178 | 55,218 |
Accumulated other comprehensive income | 15,349 | 3,397 |
Total stockholders’ equity | 133,169 | 116,074 |
| Total liabilities and stockholders’ equity | $ 342,701 | $ 269,655 |
See accompanying notes to consolidated financial statements
NN, Inc.
|
Consolidated Statements of Income and Comprehensive Income
|
Years ended December 31, 2006, 2005 and 2004
|
(In thousands, except per share data)
|
| | 2006 | 2005 | 2004 |
| | | | |
| Net sales | $ 330,325 | $ 321,387 | $ 304,089 |
| Cost of products sold (exclusive of depreciation shown separately below) | 257,703 | 248,828 | 240,580 |
| Selling, general and administrative | 30,008 | 29,073 | 29,755 |
| Depreciation and amortization | 17,492 | 16,331 | 16,133 |
| (Gain) loss on disposal of assets | (705) | (391) | 856 |
| Restructuring and impairment costs (income) | (65) | (342) | 2,398 |
| Income from operations | 25,892 | 27,888 | 14,367 |
| | | | |
| Interest expense | 3,983 | 3,777 | 4,029 |
| Other income | (1,048) | (653) | (853) |
| Income before provision for income taxes | 22,957 | 24,764 | 11,191 |
| Provision for income taxes | 8,522 | 9,752 | 4,089 |
| Net income | $ 14,435 | $ 15,012 | $ 7,102 |
| | | | |
| Other comprehensive income (loss): | | | |
Additional minimum pension liability, net of tax | -- | (580) | (200) |
Unrealized holding gain (loss) on securities, net of tax | -- | (73) | 73 |
Foreign currency translation | 12,265 | (11,823) | 6,591 |
Comprehensive income | $ 26,700 | $ 2,536 | $ 13,566 |
| | | | |
| Basic income per share: | | | |
Net income | $ 0.84 | $ 0.88 | $ 0.42 |
Weighted average shares outstanding | 17,125 | 17,004 | 16,728 |
| | | | |
| Diluted income per share: | | | |
Net income | $0.83 | $ 0.87 | $ 0.41 |
Weighted average shares outstanding | 17,351 | 17,193 | 17,151 |
| Cash dividends per common share | $ 0.32 | $ 0.32 | $ 0.32 |
See accompanying notes to consolidated financial statements
NN, Inc. |
|
| December 31, 2007 and 2006 |
| (In thousands, except per share data) |
| Assets | | 2007 | | | 2006 | |
| Current assets: | | | | | | |
Cash and cash equivalents | | $ | 13,029 | | | $ | 11,681 | |
Accounts receivable, net | | | 65,566 | | | | 63,442 | |
Inventories, net | | | 51,821 | | | | 43,538 | |
Other current assets | | | 6,263 | | | | 6,004 | |
Current deferred tax asset | | | 1,345 | | | | 1,199 | |
Total current assets | | | 138,024 | | | | 125,864 | |
| | | | | | | | | |
| Property, plant and equipment, net | | | 161,008 | | | | 156,447 | |
| Goodwill, net | | | 39,471 | | | | 46,147 | |
| Intangible assets, net | | | 9,279 | | | | 10,131 | |
| Non current deferred tax assets | | | 322 | | | | 2,117 | |
| Other non-current assets | | | 1,974 | | | | 1,995 | |
| Total assets | | $ | 350,078 | | | $ | 342,701 | |
| | | | | | | | | |
| Liabilities and Stockholders’ Equity | | | | | | | | |
| Current liabilities: | | | | | | | | |
Accounts payable | | $ | 51,124 | | | $ | 52,576 | |
Accrued salaries, wages and benefits | | | 15,087 | | | | 13,519 | |
Income taxes | | | 144 | | | | 94 | |
Current maturities of long-term debt | | | 11,851 | | | | 851 | |
Current portion of obligation under capital lease | | | 249 | | | | 224 | |
Other liabilities | | | 5,801 | | | | 7,605 | |
Total current liabilities | | | 84,256 | | | | 74,869 | |
| | | | | | | | | |
| Non-current deferred tax liability | | | 18,682 | | | | 16,334 | |
| Long-term debt | | | 100,193 | | | | 80,711 | |
| Related party debt | | | -- | | | | 21,305 | |
| Accrued pension | | | 13,498 | | | | 13,187 | |
| Obligation under capital lease | | | 1,792 | | | | 1,713 | |
| Other non-current liabilities | | | 1,614 | | | | 1,413 | |
| Total liabilities | | | 220,035 | | | | 209,532 | |
| | | | | | | | | |
| Commitments and Contingencies (Note 16) | | | | | | | | |
| | | | | | | | | |
| Stockholders’ equity: | | | | | | | | |
Common stock - $0.01 par value, authorized 45,000 shares, issued and outstanding 15,855 in 2007 and 16,842 shares in 2006 | | | 159 | | | | 169 | |
Additional paid-in capital | | | 45,032 | | | | 53,473 | |
Retained earnings | | | 57,083 | | | | 64,178 | |
Accumulated other comprehensive income | | | 27,769 | | | | 15,349 | |
Total stockholders’ equity | | | 130,043 | | | | 133,169 | |
| Total liabilities and stockholders’ equity | | $ | 350,078 | | | $ | 342,701 | |
See accompanying notes to consolidated financial statements
| NN, Inc. |
|
| Years ended December 31, 2007, 2006 and 2005 |
| (In thousands, except per share data) |
| | | | | | | | | | |
| | | | | | | | | | |
| Net sales | | $ | 421,294 | | | $ | 330,325 | | | $ | 321,387 | |
| Cost of products sold (exclusive of depreciation shown separately below) | | | 337,024 | | | | 257,703 | | | | 248,828 | |
| Selling, general and administrative | | | 36,473 | | | | 30,008 | | | | 29,073 | |
| Depreciation and amortization | | | 22,996 | | | | 17,492 | | | | 16,331 | |
| Gain on disposal of assets | | | (71 | ) | | | (705 | ) | | | (391 | ) |
| Restructuring and impairment charges (income) | | | 13,636 | | | | (65 | ) | | | (342 | ) |
| Income from operations | | | 11,236 | | | | 25,892 | | | | 27,888 | |
| | | | | | | | | | | | | |
| Interest expense | | | 6,373 | | | | 3,983 | | | | 3,777 | |
| Other income | | | (386 | ) | | | (1,048 | ) | | | (653 | ) |
| Income before provision for income taxes | | | 5,249 | | | | 22,957 | | | | 24,764 | |
| Provision for income taxes | | | 6,422 | | | | 8,522 | | | | 9,752 | |
| Net income (loss) | | $ | (1,173 | ) | | $ | 14,435 | | | $ | 15,012 | |
| | | | | | | | | | | | | |
| Other comprehensive income: | | | | | | | | | | | | |
Unrealized holding loss on securities, net of tax | | | -- | | | | -- | | | | (73 | ) |
Actuarial gain recognized in change of projected benefit obligation (net of tax $248) | | | 656 | | | | -- | | | | -- | |
Foreign currency translation | | | 11,764 | | | | 12,265 | | | | (11,823 | ) |
Comprehensive income | | | 11,247 | | | $ | 26,700 | | | $ | 3,116 | |
| | | | | | | | | | | | | |
| Basic income (loss) per share: | | | | | | | | | | | | |
Net income (loss) | | $ | (0.07 | ) | | $ | 0.84 | | | $ | 0.88 | |
Weighted average shares outstanding | | | 16,749 | | | | 17,125 | | | | 17,004 | |
| | | | | | | | | | | | | |
| Diluted income (loss) per share: | | | | | | | | | | | | |
Net income (loss) | | $ | (0.07 | ) | | $ | 0.83 | | | $ | 0.87 | |
Weighted average shares outstanding | | | 16,749 | | | | 17,351 | | | | 17,193 | |
| Cash dividends per common share | | $ | 0.32 | | | $ | 0.32 | | | $ | 0.32 | |
See accompanying notes to consolidated financial statements
| NN, Inc. |
| Consolidated Statements of Changes in Stockholders’ Equity |
Years ended December 31, 2007, 2006 2005 and 2004 2005 |
(In thousands) |
|
(Thousands of Dollars and Shares) | Common Stock Number
of Par
Shares Value
| Additional paid in capital | Additional paid in capital unearned compen- sation | Additional paid in capital unearned compen-sationRetained
Earnings | RetainedAccumulated
EarningsOther
Comprehensive Income | Accumulated
Other
Comprehen-sive
Income
Total |
| Number of Shares | Total
Par Value |
| Balance, December 31, 2003 | 16,712 | $ 168 | $ 52,960 | $-- | $ 43,931 | $ 9,409 | $106,468 | |
| | Shares issued | 65 | -- | 463 | -- | -- | 463 | |
| | Net income | -- | -- | -- | 7,102 | -- | 7,102 | |
| | Dividends declared | -- | -- | -- | (5,357) | -- | (5,357) | |
| | Additional minimum pension liability (net of tax $120) | -- | -- | -- | -- | (200) | (200) | |
| | Unrealized holding gain (net of tax $41) | -- | -- | -- | -- | 73 | 73 | |
| | Cumulative translation gain | -- | -- | -- | -- | 6,591 | 6,591 | |
| | | | | | | | |
| | | | | | | | |
| Balance, December 31, 2004 | Balance, December 31, 2004 | 16,777 | $168 | $53,423 | $-- | $45,676 | $15,873 | $115,140 | | | 16,777 | | | $ | 168 | | | $ | 53,423 | | | $ | -- | | | $ | 45,676 | | | $ | 15,873 | | | $ | 115,140 | |
| | Shares issued | 376 | 4 | 3,658 | -- | -- | 3,662 | |
| | Issuance of restricted stock | 53 | -- | 673 | (673) | | -- | |
| | Amortization of restricted stock award | -- | -- | 206 | -- | 206 | |
| | Net income | -- | -- | -- | 15,012 | -- | 15,012 | |
| | Dividends declared | -- | -- | -- | (5,470) | -- | (5,470) | |
| | Additional minimum pension liability (net of tax $326) | -- | -- | -- | -- | (580) | (580) | |
| | Unrealized holding loss (net of tax $41) | -- | -- | -- | -- | (73) | (73) | |
| Shares issued | | | | 376 | | | | 4 | | | | 3,658 | | | | -- | | | | -- | | | | -- | | | | 3,662 | |
| Issuance of restricted stock | | | | 53 | | | | -- | | | | 673 | | | | (673 | ) | | | | | | | | | | | -- | |
Amortization of restricted stock award | | | | -- | | | | -- | | | | -- | | | | 206 | | | | -- | | | | -- | | | | 206 | |
| Net income | | | | -- | | | | -- | | | | -- | | | | -- | | | | 15,012 | | | | -- | | | | 15,012 | |
| Dividends declared | | | | -- | | | | -- | | | | -- | | | | -- | | | | (5,470 | ) | | | -- | | | | (5,470 | ) |
Additional minimum pension liability (net of tax $326) | | | | -- | | | | -- | | | | -- | | | | -- | | | | -- | | | | (580 | ) | | | (580 | ) |
Unrealized holding loss (net of tax $41) | | | | -- | | | | -- | | | | -- | | | | -- | | | | -- | | | | (73 | ) | | | (73 | ) |
| Cumulative translation loss | | | | -- | | | | -- | | | | -- | | | | -- | | | | -- | | | | (11,823 | ) | | | (11,823 | ) |
| | Cumulative translation loss | -- | -- | -- | -- | (11,823) | (11,823) | | | | | | | | | | | | | | | | | | | | | | | | | | | | |
| | | | | | | | | | | | | | | | | | | | | | | | | | | | | | | | | | | |
| Balance, December 31, 2005 | Balance, December 31, 2005 | 17,206 | $ 172 | $ 57,754 | ($467) | $ 55,218 | $ 3,397 | $ 116,074 | | | 17,206 | | | $ | 172 | | | $ | 57,754 | | | $ | (467 | ) | | $ | 55,218 | | | $ | 3,397 | | | $ | 116,074 | |
| | Reclassification of unearned compensation | -- | (467) | 467 | -- | -- | |
| | Shares issued | 99 | 1 | 983 | -- | -- | 984 | |
| | Repurchase of outstanding shares | (463) | (4) | (5,269) | -- | -- | (5,273) | |
| | Elimination of variable stock option liability | -- | 8 | -- | -- | 8 | |
| | Net income | -- | -- | -- | 14,435 | -- | 14,435 | |
| | Amortization of restricted stock award | -- | 283 | -- | -- | 283 | |
| | Stock option expense | -- | 181 | -- | -- | 181 | |
| | Dividends declared | -- | -- | -- | (5,475) | -- | (5,475) | |
| | Elimination of additional minimum pension liability (net of tax of $46) | -- | | -- | | | 80 | 80 | |
Reclassification of unearned compensation | | | | -- | | | | -- | | | | (467 | ) | | | 467 | | | | -- | | | | -- | | | | -- | |
| Shares issued | | | | 99 | | | | 1 | | | | 983 | | | | -- | | | | -- | | | | -- | | | | 984 | |
Repurchase of outstanding shares | | | | (463 | ) | | | (4 | ) | | | (5,269 | ) | | | -- | | | | -- | | | | -- | | | | (5,273 | ) |
Elimination of variable stock option liability | | | | -- | | | | -- | | | | 8 | | | | -- | | | | -- | | | | -- | | | | 8 | |
| Net income | | | | -- | | | | -- | | | | -- | | | | -- | | | | 14,435 | | | | -- | | | | 14,435 | |
Amortization of restricted stock award | | | | -- | | | | -- | | | | 283 | | | | -- | | | | -- | | | | -- | | | | 283 | |
| Stock option expense | | | | -- | | | | -- | | | | 181 | | | | -- | | | | -- | | | | -- | | | | 181 | |
| Dividends declared | | | | -- | | | | -- | | | | -- | | | | -- | | | | (5,475 | ) | | | -- | | | | (5,475 | ) |
Elimination of additional minimum pension liability (net of tax of $46) | | | | -- | | | | -- | | | | -- | | | | -- | | | | -- | | | | 80 | | | | 80 | |
Adjustment to initially apply FAS 158 and record unrecognized net losses that have not been recognized as a component of pension income (net of tax $224) | | | | -- | | | | -- | | | | -- | | | | -- | | | | -- | | | | (393 | ) | | | (393 | ) |
| Cumulative translation gain | | | | -- | | | | -- | | | | -- | | | | -- | | | | -- | | | | 12,265 | | | | 12,265 | |
| | Adjustment to initially apply FAS 158 and record unrecognized net losses that have not been recognized as a component of pension income (net of tax $224) | | -- | | -- | -- | (393) | (393) | | | | | | | | | | | | | | | | | | | | | | | | | | | | |
| | Cumulative translation gain | -- | -- | -- | -- | 12,265 | 12,265 | | | | | | | | | | | | | | | | | | | | | | | | | | | | |
| Balance, December 31, 2006 | Balance, December 31, 2006 | 16,842 | $ 169 | $ 53,473 | $ -- | $ 64,178 | $ 15,349 | $ 133,169 | | | 16,842 | | | $ | 169 | | | $ | 53,473 | | | $ | -- | | | $ | 64,178 | | | $ | 15,349 | | | $ | 133,169 | |
| | | | | | | | | | | | | | | | | | | | | | | | | | | | | | |
| Shares issued | | | | 24 | | | | -- | | | | 292 | | | | -- | | | | -- | | | | -- | | | | 292 | |
| Net loss | | | | -- | | | | -- | | | | -- | | | | -- | | | | (1,173 | ) | | | -- | | | | (1,173 | ) |
Amortization of restricted stock awards | | | | -- | | | | -- | | | | 309 | | | | -- | | | | -- | | | | -- | | | | 309 | |
Forfeiture of restricted stock | | | | (3 | ) | | | -- | | | | -- | | | | -- | | | | -- | | | | -- | | | | -- | |
Repurchase of outstanding shares | | | | (1,008 | ) | | | (10 | ) | | | (9,712 | ) | | | -- | | | | -- | | | | -- | | | | (9,722 | ) |
| Stock option expense | | | | -- | | | | -- | | | | 670 | | | | -- | | | | -- | | | | -- | | | | 670 | |
| Dividends declared | | | | -- | | | | -- | | | | -- | | | | -- | | | | (5,322 | ) | | | -- | | | | (5,322 | ) |
Cumulative effect of adoption of FIN 48 | | | | -- | | | | -- | | | | -- | | | | -- | | | | (600 | ) | | | -- | | | | (600 | ) |
Actuarial gain recognized in change of projected benefit obligation (net of tax $248) | | | | -- | | | | -- | | | | -- | | | | -- | | | | -- | | | | 656 | | | | 656 | |
| Cumulative translation gain | | | | -- | | | | -- | | | | -- | | | | -- | | | | -- | | | | 11,764 | | | | 11,764 | |
| Balance, December 31, 2007 | | | | 15,855 | | | $ | 159 | | | $ | 45,032 | | | | -- | | | $ | 57,083 | | | $ | 27,769 | | | $ | 130,043 | |
See accompanying notes to consolidated financial statements
NN, Inc. |
Consolidated Statements of Cash Flows |
Years Ended December 31, 2006, 2005 and 2004 |
(In Thousands) |
| | 2006 | 2005 | 2004 |
Cash flows from operating activities: | | | |
| Net Income | $ 14,435 | $ 15,012 | $ 7,102 |
| Adjustments to reconcile net income to net cash provided by operating activities: | | | |
| Depreciation and amortization | 17,492 | 16,331 | 16,133 |
| Amortization and write-off of debt issue costs | 460 | 246 | 480 |
| (Gain) loss on disposals of property, plant and equipment | (705) | (391) | 856 |
| Allowance for doubtful accounts | 311 | 287 | 22 |
Compensation expense from issuance of restricted stock and incentive stock options | 464 | 206 | -- |
| Deferred income taxes (income) expense | (1,384) | (674) | 3,254 |
| Capitalized interest | (204) | -- | -- |
| (Gain) of sale of stock investment | -- | (73) | -- |
| Restructuring and impairment costs (income) | (65) | (342) | 2,398 |
| Changes in operating assets and liabilities: | | | |
| Accounts receivable | (759) | 216 | (8,123) |
| Inventories | 3,221 | (5,134) | 2,059 |
| Income tax receivable | (956) | 1,465 | (2,878) |
| Other current assets | (188) | (1,033) | 111 |
| Other assets | 920 | 105 | (799) |
| Accounts payable | 2,308 | 1,176 | 9,782 |
| Other liabilities | (2,347) | 2,618 | 1,175 |
| Net cash provided by operating activities | 33,003 | 30,015 | 31,572 |
Cash flows from investing activities: | | |
| Cash paid to acquire business, net of cash received | (25,025) | -- | -- |
| Acquisition of property, plant and equipment | (19,282) | (16,729) | (12,162) |
| Principal received from note receivable | 2,505 | 200 | 200 |
| Proceeds from disposals of property, plant and equipment | 3,550 | 968 | 2,342 |
| Proceeds from sale of investment | -- | 198 | -- |
| Acquisition of intangible asset | (1,846) | (605) | -- |
Net cash used by investing activities | (40,098) | (15,968) | (9,620) |
Cash flows from financing activities: | | |
| Proceeds from long-term debt | 47,188 | -- | 40,000 |
| Debt issue costs paid | (536) | (64) | (839) |
| Proceeds from Bank overdrafts | 784 | 120 | -- |
| Repayment of long-term debt | (30,556) | (9,922) | (49,408) |
| Proceeds (repayment) of short-term debt | 266 | -- | (2,000) |
| Proceeds from issuance of stock and exercise of stock options | 984 | 2,806 | 463 |
| Cash dividends paid | (5,475) | (5,470) | (5,357) |
| Other financing activity | (23) | (8) | -- |
| Repurchase of common stock | (5,273) | -- | -- |
| Net cash provided (used) by financing activities | 7,359 | (12,538) | (17,141) |
| Effect of exchange rate changes on cash flows | 561 | (1,425) | 983 |
| Net change in cash and cash equivalents | 825 | 84 | 5,794 |
| Cash and cash equivalents at beginning of period | 10,856 | 10,772 | 4,978 |
| Cash and cash equivalents at end of period | $ 11,681 | $ 10,856 | $ 10,772 |
Supplemental schedule of non-cash investing and financing activities: | | |
Incurred note payable to former owner as part of consideration for acquiring a business | $ 21,305 | $ -- | $ -- |
| Stock option exercise tax benefit ($856 in 2005), restricted stock expense ($283 in 2006, $673 in 2005) and stock option expense ($181 in 2006) included in stockholders’ equity | $ 464 | $ 1,529 | $ -- |
Obtained land and building by entering into capital lease obligation | | | $ -- |
Cash paid for interest and income taxes was as follows: | | |
| Interest | $ 3,353 | $ 3,440 | $ 3,318 |
| Income taxes | $ 11,911 | $ 6,066 | $ 4,887 |
Years Ended December 31, 2007, 2006 and 2005
(In thousands)
| | | 2007 | | | 2006 | | | 2005 | |
| Cash flows from operating activities: | | | | | | | | | |
| Net Income (loss) | | $ | (1,173 | ) | | $ | 14,435 | | | $ | 15,012 | |
| Adjustments to reconcile net income (loss) to net cash provided by operating activities: | | | | | | | | | | | | |
| Depreciation and amortization | | | 22,996 | | | | 17,492 | | | | 16,331 | |
| Amortization and write-off of debt issue costs | | | 219 | | | | 460 | | | | 246 | |
| Gain on disposals of property, plant and equipment | | | (71 | ) | | | (705 | ) | | | (391 | ) |
| Allowance for doubtful accounts | | | 496 | | | | 311 | | | | 287 | |
| Compensation expense from issuance of restricted stock and incentive stock options | | | 979 | | | | 464 | | | | 206 | |
| Deferred income tax benefit | | | (1,183 | ) | | | (1,384 | ) | | | (674 | ) |
| Capitalized interest and non cash interest expense | | | 66 | | | | (204 | ) | | | -- | |
| (Gain) on sale of stock investment | | | -- | | | | -- | | | | (73 | ) |
| Restructuring and impairment charges (income) | | | 13,636 | | | | (65 | ) | | | (342 | ) |
| Changes in operating assets and liabilities, net of effect of acquisitions: | | | | | | | | | | | | |
| Accounts receivable | | | (837 | ) | | | (759 | ) | | | 216 | |
| Inventories | | | (5,974 | ) | | | 3,221 | | | | (5,134 | ) |
| Income tax receivable | | | -- | | | | (956 | ) | | | 1,465 | |
| Other current assets | | | 260 | | | | (188 | ) | | | (1,033 | ) |
| Other assets | | | 801 | | | | 920 | | | | 105 | |
| Accounts payable | | | (5,533 | ) | | | 2,308 | | | | 1,176 | |
| Other liabilities | | | (3,088 | ) | | | (2,347 | ) | | | 2,618 | |
| Net cash provided by operating activities | | | 21,594 | | | | 33,003 | | | | 30,015 | |
| | | | | | | | | | | | | |
| Cash flows from investing activities: | | | | | | | | | | | | |
| Cash paid to acquire business, net of cash received | | | (94 | ) | | | (25,025 | ) | | | -- | |
| Acquisition of property, plant and equipment | | | (18,856 | ) | | | (19,282 | ) | | | (16,729 | ) |
| Principal received from note receivable | | | -- | | | | 2,505 | | | | 200 | |
| Proceeds from disposals of property, plant and equipment | | | 74 | | | | 3,550 | | | | 968 | |
| Proceeds from sale of investment | | | -- | | | | -- | | | | 198 | |
| Acquisition of intangible asset | | | (173 | ) | | | (1,846 | ) | | | (605 | ) |
| Net cash used by investing activities | | | (19,049 | ) | | | (40,098 | ) | | | (15,968 | ) |
| | | | | | | | | | | | | |
| Cash flows from financing activities: | | | | | | | | | | | | |
| Proceeds from long-term debt | | | 26,400 | | | | 47,188 | | | | -- | |
| Debt issue costs paid | | | (251 | ) | | | (536 | ) | | | (64 | ) |
| Proceeds from bank overdrafts | | | 612 | | | | 784 | | | | 120 | |
| Repayment of long-term debt | | | -- | | | | (30,556 | ) | | | (9,922 | ) |
| Proceeds (repayment) of short-term debt | | | 4,610 | | | | 266 | | | | -- | |
| Proceeds from issuance of stock and exercise of stock options | | | 292 | | | | 984 | | | | 2,806 | |
| Cash dividends paid | | | (5,322 | ) | | | (5,475 | ) | | | (5,470 | ) |
| Other financing activity | | | (38 | ) | | | (23 | ) | | | (8 | ) |
| Payment of related party debt | | | (18,638 | ) | | | -- | | | | -- | |
| Repurchase of common stock | | | (9,722 | ) | | | (5,273 | ) | | | -- | |
| Net cash provided (used) by financing activities | | | (2,057 | ) | | | 7,359 | | | | (12,538 | ) |
| | | | | | | | | | | | | |
| Effect of exchange rate changes on cash flows | | | 860 | | | | 561 | | | | (1,425 | ) |
| Net change in cash and cash equivalents | | | 1,348 | | | | 825 | | | | 84 | |
| Cash and cash equivalents at beginning of period | | | 11,681 | | | | 10,856 | | | | 10,772 | |
| Cash and cash equivalents at end of period | | $ | 13,029 | | | $ | 11,681 | | | $ | 10,856 | |
| | | | | | | | | | | | | |
| Supplemental schedule of non-cash investing and financing activities: | | | | | | | | | | | | |
| Incurred note payable to former owner as part of consideration for acquiring a business | | | -- | | | $ | 21,305 | | | $ | -- | |
| Stock option exercise tax benefit ($856 in 2005), restricted stock expense ($309 in 2007, $283 in 2006 and $673 in 2005) and stock option expense ($670 in 2007 and $181 in 2006) included in stockholders’ equity | | $ | 979 | | | $ | 464 | | | $ | 1,529 | |
| Obtained land and building by entering into capital lease obligation | | | -- | | | | -- | | | $ | 1,917 | |
| Reduced note payable to customer with offsetting reduction to accounts receivable ($1,390) and an increase to interest expense ($186) | | $ | 1,204 | | | | -- | | | | -- | |
Adjusted the goodwill balance related to Whirlaway acquisition for final fair value of assets and liabilities acquired. | | $ | 1,828 | | | | -- | | | | -- | |
| Increase in unrecognized tax benefits upon the adoption of FIN 48 charged to beginning retained earnings | | $ | 600 | | | | -- | | | | -- | |
| | | | | | | | | | | | | |
| Cash paid for interest and income taxes was as follows: | | | | | | | | | | | | |
| Interest | | $ | 6,174 | | | $ | 3,353 | | | $ | 3,440 | |
| Income taxes | | $ | 8,404 | | | $ | 11,911 | | | $ | 6,066 | |
See accompanying notes to consolidated financial statements
NN, Inc.
Notes to Consolidated Financial Statements
December 31, 2007, 2006 2005 and 20042005
(In thousands, except per share data)
(a) (a) Description of Business
NN, Inc. (the “Company”) is a manufacturer of precision balls, cylindrical and tapered rollers, bearing retainers, plastic injection molded products, precision bearing seals and beginning December 1, 2006, precision metal components. The Company’s balls, rollers, retainers, and bearing seals are used primarily in the domestic and international anti-friction bearing industry. The Company’s plastic injection molded products are used in the bearing, automotive, instrumentation and fiber optic industries. The precision metal components products are used in automotive, diesel engine, refrigeration, and heating and cooling industries.
The Metal Bearing Components Segment is comprised of two manufacturing facilities located in the eastern United States, our operation in The People’s Republic of China, and manufacturing facilities located in Kilkenny, Ireland; Eltmann, Germany; Pinerolo, Italy; Veenendaal, The Netherlands and Kysucke Nove Mesto, Slovakia. The Plastic and Rubber Components Segment consists of Industrial Molding Corporation, acquired in July 1999 and Delta Rubber, acquired in February 2001. IMC has two production facilities in Texas and Delta Rubber has two production facilities in Connecticut. The Precision Metal Components Segment consists of Whirlaway Corporation which has four plants located in Ohio and Arizona. Whirlaway was acquired on November 30, 2006. All of the Company’s segments sell to foreign and domestic customers.
(b)Cash and Cash Equivalents
The Company considers all highly liquid investments with an original maturity of three months or less as cash equivalents.
(c) (c) InventoriesInventories
Inventories are stated at the lower of cost or market. Actual costs are evaluated and do not exceed the lower of cost or market. Cost is determined using the first-in, first-out method. The Company accounts for inventory under a full absorption method, and accordingly, our inventory carrying value includes cost elements of material, labor and overhead. Effective January 1, 2006, we adopted SFAS 151 “Inventory Cost” andOur policy is to expense abnormal amounts of idle facility expense, freight, handling cost, and waste. In addition, we allocatedallocate fixed production overheads based on the normal capacity of our facilities.
Inventories also include tools, molds and dies in progress that the Company is producing and will ultimately sell to its customers. This activity is principally related to our Plastic and Rubber Components and Precision Metal Components Segments. These inventories are carried at the lower of cost or market.
(d) (d) Property, Plant and Equipment
Property, plant and equipment are stated at cost less accumulated depreciation. Assets held for sale are stated at lower of depreciated cost or fair market value less estimated selling costs. Expenditures for maintenance and repairs are charged to expense as incurred. Major renewals and betterments are capitalized. When a major property item is retired, its cost and related accumulated depreciation are removed from the property accounts and any gain or loss is recorded in the statement of income. The Company reviews the carrying values of long-lived assets for impairment whenever events or changes in circumstances indicate the carrying amount of an asset may not be recoverable. During the years ended December 31, 2007, 2006 2005 and 2004,2005, the Company recorded an impairment chargecharges of $0,$3,320, $0 and $108, respectively.$0, respectively (See Note 3 for further details). Property, plant and equipment includes tools, molds and dies principally used in our Plastic and Rubber Components and Precision Metal Components Segments that are the property of the Company.
NN, Inc.
Notes to Consolidated Financial Statements
December 31, 2006, 2005 and 2004
(In thousands, except per share data)
Depreciation is provided principally on the straight-line method over the estimated useful lives of the depreciable assets for financial reporting purposes. Accelerated depreciation methods are used for income tax purposes. We capitalize incremental interest cost related to certain large capital expenditure projects in compliance with SFAS No. 34 "Capitlization“Capitalization of Interest Cost."” The amount capitalized is the portion of interest cost incurred during the acquisition period of these assets.
(e) (e) Revenue Recognition
The Company recognizes revenues based on the stated shipping terms with the customer and the Company recognizes revenue when these terms are satisfied and the risks of ownership are transferred to the customer. The Company has an inventory management program for certain Metal Bearing Components Segment customers whereby revenue is recognized when products are used by the customer from consigned stock, rather than at the time of shipment. Under both circumstances, revenue is recognized when persuasive evidence of an arrangement exists, delivery has occurred, the sellers’ price is determinable and collectibilitycollectability is reasonably assured.
NN, Inc.
Notes to Consolidated Financial Statements
December 31, 2007, 2006 and 2005
(In thousands, except per share data)
(f) Accounts ReceivableReceivable.
Accounts receivable are recorded upon recognition of a sale of goods and ownership and risk of loss is assumed by the customer. Substantially all of the Company’s accounts receivable is due primarily from the core served markets: bearing manufacturers, automotive industry, electronics, industrial, agricultural and aerospace. The Company experienced $0.3$0.5 million, $0.3 million, and $0$0.3 million of bad debt expense during 2007, 2006 2005 and 2004,2005, respectively. In establishing allowances for doubtful accounts, the Company performs credit evaluations of its customers, considering numerous inputs when available including the customers’ financial position, past payment history, relevant industry trends, cash flows, management capability, historical loss experience and economic conditions and prospects. Accounts receivable are written off or reserves established when considered to be uncollectible or at risk of being uncollectible.
(g) (g) Income Taxes
Income taxes are accounted for under the asset and liability method. Deferred tax assets and liabilities are recognized for the future tax consequences attributable to differences between the financial statement carrying amounts of existing assets and liabilities and their respective tax bases and operating loss and tax credit carry forwards. Deferred tax assets and liabilities are measured using enacted tax rates expected to apply to taxable income in the years in which those temporary differences are expected to be recovered or settled. The effect on deferred tax assets and liabilities of a change in tax rates is recognized in income in the period that includes the enactment date.
(h)Net Income Per Common Share
Basic earnings per share reflect reported earnings divided by the weighted average number of common shares outstanding. Diluted earnings per share include the effect of dilutive stock options, unvested restricted stock, and the respective tax benefits.
(i)Stock Incentive Plan
Prior to January 1, 2006, the Company applied the intrinsic value-based method of accounting prescribed by Accounting Principles Board (“APB”) Opinion No. 25, “Accounting for Stock Issued to Employees,” and related interpretations including Financial Accounting Standards Board (FASB) Interpretation No. 44, “Accounting for Certain Transactions Involving Stock Compensation (an interpretation of APB Opinion No. 25)” issued in March 2000, to account for its fixed plan stock options. Under this method, compensation expense was recorded on the date of grant only if the current market price of the underlying stock exceeded the exercise price. The Company also applied the provision of APB Opinion No. 25 to its variable stock options. For 2005, and 2004, we elected to continue accounting for our stock option compensation plan using the intrinsic value based method under APB Opinion No. 25 and did not record compensation expense for stock options for each of the two yearsyear ended December 31, 2005 and 2004 except as related to stock options accounted for under the variable method of accounting and for restricted stock awards.
NN, Inc.
Notes to Consolidated Financial Statements
December 31, 2006, 2005 and 2004
(In thousands, except per share data)
Effective January 1, 2006, the Company adopted SFAS 123(R) under the modified prospective method. From that date onward, the Company is accounting for new awards and awards modified under this new standard. Any options issued henceforth will be expensed based on the fair value of the options at the grant date. As of December 31, 2005, the Company did not have any unvested stock options due to an accelerated vesting program implemented in December 2005. As such, this statement only impacted the Company for its outstanding restricted stock and stock option and restricted stock awards issued subsequent to January 1, 2006. The cost of the options and restricted stock awards will be expensed as compensation expense over the vesting periods based on the fair value at the grant date. (See Note 10)
NN, Inc.
Notes to Consolidated Financial Statements
December 31, 2007, 2006 and 2005
(In thousands, except per share data)
The Company accounts for restricted stock awards by recognizing compensation expense ratably over the vesting period as specified in the award. Compensation expense to be recognized is based on the stock price at date of grant.
(j)Principles of Consolidation
The Company’s consolidated financial statements include the accounts of NN, Inc. and subsidiaries in which the Company owns more than 50% voting interest. All of the Company’s subsidiaries are 100% owned and all are included in the consolidated financial statements for the years end December 31, 2007, 2006, 2005, and 2004. Unconsolidated subsidiaries and investments where ownership is between 20% and 50% are accounted for under the equity method.2005. All significant inter-company profits, transactions, and balances have been eliminated in consolidation.
(k)Foreign Currency Translation
Assets and liabilities of the Company’s foreign subsidiaries are translated at current exchange rates, while revenue, costs and expenses are translated at average rates prevailing during each reporting period. Translation adjustments arising from the translation of foreign subsidiary financial statements are reported as a component of other comprehensive income and are accumulated with other comprehensive earnings as a separate component of shareholdersincome within shareholders’ equity.
(l) Goodwill and Other Indefinite Lived Intangible Assets
Goodwill: The Company recognizes the excess of the purchase price of an acquired entity over the fair value of the net identifiable assets as goodwill. Goodwill is tested for impairment on an annual basis as of October 1 and between annual tests in certain circumstances. Impairment losses are recognized whenever the implied fair value of goodwill is less than its carrying value. Goodwill is not amortized.
Other Acquired Intangibles: (m) Long Lived Intangible Assets
The Company recognizes an acquired intangible asset apart from goodwill whenever the asset arises from contractual or other legal rights, or whenever it is capable of being divided or separated from the acquired entity or sold, transferred, licensed, rented, or exchanged, whether individually or in combination with a related contract, asset or liability. An intangible asset other than goodwill is amortized over its estimated useful life unless that life is determined to be indefinite. The Company reviews the lives of intangible assets each reporting period and, if necessary, recognizes impairment losses if the carrying amount of an intangible asset is not recoverable from expected future cash flows and its carrying amount exceeds its fair value.
NN, Inc.
Notes to Consolidated Financial Statements
December 31, 2006, 2005 and 2004
(In thousands, except per share data)
(m)(n) Impairment of Long-Lived Assets and Long-Lived Assets to Be Disposed Of
The Company accounts for long-lived assets in accordance with the provisions of SFAS No. 144, “Accounting for the Impairment of or Disposal of Long-Lived Assets.” Assets to be held and used are tested for recoverability when indications of impairment are evident. If the reviewed carrying value of the asset is not recoverable based on underlyingestimated undiscounted cash flows related to specific groups of acquired long-lived assets,the asset or asset group, the asset is written down to the lesser of recoverable value or carryingfair value. Assets held for sale are carried at the lesser of carrying value or fair value less costs of disposal. The fair value of impaired assets is generally determined with the assistance of independent appraisals and valuations.
(n) (o) Use of Estimates in the Preparation of Financial Statements
The preparation of financial statements in conformity with accounting principles generally accepted in the United States requires management to make estimates and assumptions that affect the reported amounts of assets and liabilities and disclosure of contingent assets and liabilities at the date of the financial statements and the reported amounts of revenues and expenses during the reporting period. Actual results could differ from those estimates.
NN, Inc.
Notes to Consolidated Financial Statements
December 31, 2007, 2006 and 2005
(In thousands, except per share data)
(o)(p) Recently Issued Accounting Standards
In July 2006, the FASB issued Interpretation No. 48 (“FIN 48”), “Accounting for Uncertainty in Income Taxes—an Interpretation of SFAS 109 “Accounting for Income Taxes”. FIN 48 prescribes a comprehensive model for how a company should recognize, measure, present, and disclose in its financial statements uncertain tax positions that a company has taken or expects to take on a tax return. Under FIN 48, the financial statements will reflect expected future tax consequences of such positions presuming the taxing authorities’ full knowledge of the position and all relevant facts, but without considering time values. FIN 48 also revises disclosure requirements and introduces a prescriptive, annual, tabular roll-forward of the unrecognized tax benefits. FIN 48 is effective for fiscal years beginning after December 15, 2006. We will adopt FIN 48 January 1, 2007. We have evaluated the impact of adopting this standard on our consolidated financial position and results of operations and concluded the impact of the adoption will not have a material effect.
In September 2006, the FASB issued SFAS No. 157, “Fair Value Measurements” (SFAS 157), which provides guidance on how to measure assets and liabilities that use fair value. SFAS 157 will apply whenever another USU.S. GAAP standard requires (or permits) assets or liabilities to be measured at fair value but does not expand the use of fair value to any new circumstances. This standard also will require additional disclosures in both annual and quarterly reports. SFAS 157 will be effective for financial statements issued for fiscal years beginning after November 15, 2007. However, on December 14, 2007, the FASB issued, and will be adopted by us beginningon February 14, 2008 approved, FASB Staff Position FAS 157-2 (“FSP FAS 157-2”) which would delay the effective date of SFAS No. 157 for all non financial assets and non financial liabilities, except those that are recognized or disclosed at fair value in the financial statements on a recurring basis (at least annually). The FSP partially defers the effective date of SFAS No. 157 to fiscal years beginning after November 15, 2008. Effective for first quarter of 2008. We have evaluated2008, the Company plans to adopt SFAS No. 157 except as it applies to those non financial assets and liabilities as noted in FSP FAS 157-2. The Company is currently evaluating the potential impact of adopting this standard may have on our consolidated financial position and results of operations, and conductedbut do not believe the impact of of the adoption will not have a material effect.
In September 2006, the SEC staff issued Staff Accounting Bulletin (SAB) No. 108, “Considering the Effects of Prior Year Misstatements when Quantifying Misstatements in Current Year Financial Statements” (“SAB 108”). SAB 108 was issued in order to eliminate the diversity of practice in how public companies quantify misstatements of financial statements, including misstatements that were not material to prior years’ financial statements. We have applied the provisions of SAB 108 in connection with the preparation of our annual financial statements for the year ending December 31, 2006 and the adoption of SAB 108 did not have a material impact on our financial position and results of operations.
NN, Inc.
Notes to Consolidated Financial Statements
December 31, 2006, 2005 and 2004
(In thousands, except per share data)
In September 2006, the FASB issued SFAS No. 158, “Employers’ Accounting for Defined Benefit Pension and Other Postretirement Plans, an amendment of FASB Statements No. 87, 88, 106 and 132(R)” (SFAS 158). Part of this Statement will be effective as of December 31, 2006, and requires companies that have defined benefit pension plans and other postretirement benefit plans to recognize the funded status of those plans on the balance sheet on a prospective basis from the effective date. The funded status of these plans is determined as of the plans’ measurement dates and represents the differences between the amount of the obligations owed to participants under each plan (including the effects of future salary increases for define benefit plans) and the fair value of each plan’s assets dedicated to paying those obligations. To record the funded status of those plans, unrecognized prior service costs and net actuarial losses experienced by the plans will be recorded in the Other Comprehensive Income (OCI) section of shareholders’ equity on the balance sheet. The Company recognized the funded status of our defined benefit plan, covering our Eltmann, Germany facility, and provided required disclosures for fiscal years ended December 31, 2006. The impact was not material to our consolidated financial position. Adoption of this statement also requires the Company to change its measurement date to match the end of its fiscal year on or before December 31, 2008. The Company plans to change its measurement date by 2008 in order to comply to this provision.
In February, 2007, the FASB issued SFAS No. 159, “The"The Fair Value Option for Financial Assets and Financial Liabilities—Including an amendment of FASB Statement No. 115.”" SFAS No. 159 permits companies to choose to measure many financial instruments and certain other items at fair value at specified election dates. Upon adoption, an entity shall report unrealized gains and losses on items for which the fair value option has been elected in earnings at each subsequent reporting date. Most of the provisions apply only to entities that elect the fair value option. However, the amendment to SFAS No. 115, “Accounting"Accounting for Certain Investments in Debt and Equity Securities,”" applies to all entities with available for sale and trading securities. SFAS No. 159 will be effective as of the beginning of an entity’sentity's first fiscal year that begins after November 15, 2007. The Company is currently evaluating the effect SFAS No. 159 will have on its consolidated financial position, liquidity, or results of operations.
In December 2007, the FASB issued SFAS No. 141 (revised 2007), "Business Combinations" ("SFAS No. 141R"), which establishes principles and requirements for the acquirer in a business combination, including recognition and measurement in the financial statements of the identifiable assets acquired, the liabilities assumed, and any non-controlling interest in the acquiree. SFAS 141R also provides guidance for the recognition and measurement of goodwill acquired in the business combination and for disclosure to enable financial statement users to evaluate the nature and financial effects of the business combination. This Statement replaces SFAS No. 141, "Business Combinations" ("SFAS No. 141"). While SFAS No. 141R retains the fundamental requirements in SFAS No. 141 that the acquisition method of accounting be used for all business combinations and for an acquirer to be identified for each business combination, it also improves the comparability of the information about business combinations provided in financial reports. In addition, SFAS No. 141R defines the acquirer as the entity that obtains control of one or more businesses in the business combination and establishes the acquisition date as the date that the acquirer achieves control. This Statement applies prospectively to business combinations for which the acquisition date is on or after the beginning of the first annual reporting period beginning on or after December 15, 2008. 2) Acquisitions, Purchase of Minority Interest and New Businesses
Whirlaway Acquisition
Whirlaway Acquisition
On November 30, 2006, we purchased 100% of the common shares of Whirlaway Corporation (“Whirlaway”) from the sole shareholder for $24,337 in cash and a note payable, duepaid in 2007, to the former owner for $21,305.$18,638. In addition, we incurred fees of $825 from third parties as part of the purchase of $730.purchase. The results of Whirlaway’s operations have been consolidated with NN, Inc. since the date of acquisition.
Whirlaway is a high precision metal component and fluid control assembly manufacturer that supplies customers serving the air conditioning, appliance, automotive, commercial refrigeration, and diesel engine industries. Whirlaway produces highly engineered fluid control components and assemblies, shafts, and prismatic machined parts. Whirlaway has three locations in Ohio
NN, Inc.
Notes to Consolidated Financial Statements
December 31, 2007, 2006 and through its wholly-owned subsidiary, Triumph, LLC (“Triumph”), one location in Tempe, Arizona.2005
(In thousands, except per share data)
The acquisition of Whirlaway represents a first step in our efforts to create a precision metal components platform. The acquisition provides a base from which to create a profitable precision metal components business of significant size and scale over the next several years, consistent with our strategic business plan.
The following table summarized the estimatedfinal fair values of assets acquired and liabilities assumed at date of acquisition. We are
| At November 30, 2006 | | Preliminary Balances December 31, 2006 | | | Adjustments during Year Ended December 31, 2007 | | | Final Balances December 31, 2007 | |
| Current assets | | $ | 19,276 | | | | -- | | | $ | 19,276 | |
| Property, plant, and equipment | | | 25,837 | | | | -- | | | | 25,837 | |
| Other assets | | | 128 | | | | -- | | | | 128 | |
| Intangible assets subject to amortization | | | 7,180 | | | | -- | | | | 7,180 | |
| Intangible assets not subject to amortization | | | 900 | | | | -- | | | | 900 | |
| Goodwill | | | 2,352 | | | | 1,922 | | | | 4,274 | |
Total assets acquired | | | 55,673 | | | | 1,922 | | | | 57,595 | |
| Current liabilities | | | 7,475 | | | | (229 | ) | | | 7,246 | |
| Other long-term liabilities | | | 222 | | | | 4,048 | | | | 4,270 | |
| Long term debt | | | 1,604 | | | | 675 | | | | 2,279 | |
Total liabilities assumed | | | 9,301 | | | | 4,494 | | | | 13,795 | |
Net assets acquired | | | 46,372 | | | | (2,572 | ) | | $ | 43,800 | |
During 2007, the following adjustments were made to the fair values of assets acquired and liabilities assumed as preliminarily reported for the year ended December 31, 2006. A deferred tax liability of $4,048 was added due to the difference in the processtax and book basis of finalizing third party valuations of certain tangiblethe property, plant and intangible assets. We expectequipment. The long-term debt balance was increased by $676 to adjust to the discounted value at November 30, 2006. The accounts payable balance was reduced by $229 as this processbalance was overstated at November 30, 2006. The net assets acquired were reduced by $2,667 to eliminate a tax indemnity to the former owner that was initially recorded but subsequently determined not to be complete inrequired. Finally, the first halfnet assets acquired increased by $94 for acquisition related legal fees paid subsequent to December 31, 2006. The net impact of 2007all of these changes totaled $1,922 and plan to disclose the final allocation within our quarterly report on Form 10-Q during 2007.increased goodwill from that originally reported.
NN, Inc.
Notes to Consolidated Financial Statements
December 31, 2007, 2006 2005 and 20042005
(In thousands, except per share data)
At November 30, 2006
| |
Current assets | $ 19,276 |
Property, plant, and equipment | 25,837 |
Other assets | 128 |
Intangible assets subject to amortization | 7,180 |
Intangible assets not subject to amortization | 900 |
Goodwill | 2,352 |
Total assets acquired
| 55,673 |
Current liabilities | 7,475 |
Other long-term liabilities | 222 |
Long term debt | 1,604 |
Total liabilities assumed
| 9,301 |
Net asset acquired
| $ 46,372 |
The intangible assets not subject to amortization are trade names that have indefinite lives. The intangible assets subject to amortization are customer contractsrelationship intangible asset of $6,900, a covenant not to compete of $150, and a lease interest favorable to market of $130. The intangible assets subject to amortization have a weighted average life of approximately 1910 years. Based on the Company'sCompany’s analysis, all of the goodwill and intangible assets will be deductible and amortized over 15 years for federal tax.
The following unaudited pro-forma financial information shows the revenue, net income, and earnings per share for the years ended December 31, 2006 and 2005, as though the acquisition of Whirlaway occurred at the beginning of each respective fiscal year. This pro-forma information has been adjusted for the effects of purchase accounting on the assets and liabilities acquired. These adjustments include amortization and depreciation based on allocated values of assets acquired, interest expense based on new debt incurred in acquisition, and recognizing the tax impacts of each adjustment.
| | December 31, 2006 | December 31, 2005 | | December 31, 2006 | | | December 31, 2005 | |
| Revenues | $ 403,316 | $ 393,249 | | $ | 403,316 | | | $ | 393,249 | |
| Net income | $ 15,848 | $ 13,529 | | $ | 15,848 | | | $ | 13,529 | |
| Earnings per share basic | $ 0.93 | $ 0.80 | | $ | 0.93 | | | $ | 0.80 | |
| Earnings per share fully diluted | $ 0.91 | $ 0.79 | | $ | 0.91 | | | $ | 0.79 | |
The pro-forma financial results of Whirlaway in 2005 were dilutive due to abnormal operational inefficiencies at Triumph from the transitioning of products from Whirlaway and the integration of production processes. The operations of Triumph and Whirlaway were profitable in 2006.
Others
On October 7, 2005, we entered into an agreement with SNR Roulements (“SNR”) to purchase all of SNR’s internal precision ball producing equipment for approximately 5,166 Euros ($6,200). As part of the agreement, we entered into a three-year supply agreement for the present business (about $8.0 million) and a five-year supply agreement to provide SNR with its annual ball requirements of the former in-house production for approximately $9.0 million. As of December 31, 2006, the Company has2007, we have purchased approximately $5,867all of the total $6,200 million of equipment and intangibles. Ofintangibles related to this $5,867 purchased, approximately $3,536acquisition. Approximately $3,710 has been recorded as tangible fixed assets based on a third party appraisal, and approximately $2,331 related to the supply agreement$2,502 has been recorded as an intangible asset within Intangible assets, net and is being amortized over the life of the agreement.
During 2004, we formed a wholly-owned subsidiary, NN Precision Bearing Products Company, Ltd, (“NN Asia)”Asia”). This subsidiary, which began precision ball production during the fourth quarter of 2005, is located in the Kunshan Economic and Technology Development Zone, Jiangsu, The People’s Republic of China and is a component of our strategy to globally expand our manufacturing base. The start-upstart–up costs incurred in 2005 and 2004 of approximately $1,102 and $481, respectively, were expensed as incurred.
3) Restructuring and Impairment Charges
Metal Bearing Components Segment Restructuring, Impairment and Other Cost Reduction Actions
On July 25, 2007, we announced several actions intended to improve corporate financial performance that resulted in the recognition of certain restructuring, impairment and other non-recurring charges. The most significant action is a restructuring of the European precision ball plants operations of the Metal Bearing Components Segment of the Company. As we have increased capacity at our two newest ball plants in China and Slovakia, we now need to align our capacity across our worldwide system of six ball plants, both in assets currently in service and in production assets that have been held in reserve. Earlier in July 2007, management made a decision that reducing output at four of the six ball plants would be the best financial and logistical solution to align capacity. Management believed that reducing capacity at that time would necessitate changes in employment levels resulting in certain costs and charges, as well as a reduction in cash flow from each of the plants. Since the reporting value of tangible and intangible assets must be supported by cash flow from the operations, the changes resulted in reduction in value of certain tangible and intangible assets at the affected ball plants.
NN, Inc.
Notes to Consolidated Financial Statements
December 31, 2007, 2006 2005 and 20042005
(In thousands, except per share data)
3)Restructuring and Impairment Charges
During the second quarter of 2007, we recorded approximately $13,336 ($12,624 after-tax) of non-cash impairment costs. These charges include the write-down to estimated fair market value of certain excess production equipment of $3,320 ($3,212 after tax) and the full impairment of goodwill at one European reporting unit of $10,016 ($9,412 after tax) to levels supported by projected cash flows after the restructuring. These impairments were calculated using present value of expected future cash flows methods pursuant to SFAS 142 for the goodwill and estimates of fair value pursuant to SFAS 144 for the fixed assets.
During the third quarter of 2007, we recorded approximately $1,272 ($1,196 after tax) of cash restructuring charges and approximately $90 ($66 after tax) of non-cash impairment charges related to the write-down to estimated fair value of certain excess production equipment as part of the Metal Bearings Components Segment restructuring. The $1,272 charge was for severance booked in accordance with SFAS 146, which was to be paid out upon completion of the required legal notification period which was approximately one year. The majority of the severance was for one time termination benefits of 19 production employees at our Eltmann Germany RestructuringPlant.
During the fourth quarter of 2004,2007, the Company’sGerman workers counsel approached management with an unsolicited offer to increase working hours and lower wages if management would reconsider the involuntary termination order. Although management considered its notice final and irrevocable, the workers’ offer was compelling, and management agreed to consider it. Management presented the workers’ offer to the NN Europe subsidiary announcedBoard of Directors and it directed management to agree to the contract as presented. On February 13, 2008, we signed a reduction in staffing at its Eltmann, Germany ball production facility. This restructuring affected 84 employeesnew agreement with the German workers and was completed during 2006. The Company recorded restructuring charges during 2004 of approximately 1,700 Eurorescinded the layoff order. Therefore, $1,062 ($2,290) related to severance costs of approximately $2,115 and other related charges of approximately $175. The workforce reduction was a result1,062 after tax) of the Company’s continuing strategy of rationalizing its global manufacturing capacity and transfer of production principally to its facility in Kysucke Nove Mesto, Slovakia and other facilities. The charges were recorded in restructuring and impairment costs, a component of income from operations.
The following summarizes the 2006 and 2005 restructuring chargesseverance charge related to the 19 production employees no longer meets the requirements of SFAS 146 for a restructuring at the Company’s Eltmann, Germany facility:
| | Reserve Balance at 1/01/06 | Adjustment to Reserve | Paid in 2006 | Currency Impacts | Reserve Balance at 12/31/06 |
| Severance and other employee costs | $ 845 | $ (65) | $ (516) | $ 45 | $ 309 |
| Total | $ 845 | $ (65) | $ (516) | $ 45 | $ 309 |
| | | | | | |
| Reserve Balance at 1/01/05 | Adjustment to Reserve | Paid in 2005 | Currency Impacts | Reserve Balance at 12/31/05 |
Severance and other employee costs | $ 2,290 | $ (342) | $ (884) | $ (219) | $ 845 |
| Total | $ 2,290 | $ (342) | $ (884) | $ (219) | $ 845 |
We expect to pay the remaining amount reserved during 2007.
Walterboro, South Carolina Plant Closing
By December 2001, the closure of our Walterboro, South Carolina ball manufacturing facilityaccrual and was substantially completed. The land, building, and equipment assets with a recorded book value of $1,805 were held for sale at December 31, 2003. In arriving at the carrying value of the assets held for sale, we utilized independent, third party fair value appraisals and valuations. The land and building assets were sold at a loss duringreversed in the fourth quarter of 2004. As a result, we recorded a loss of approximately $750 which has been recorded as a loss on disposal of assets, a component of income from operations. Additionally, during the fourth quarter of 2004, we recorded an impairment charge of approximately $108 related to certain remaining machinery and equipment assets of this facility. This amount was recorded as a component of restructuring and impairment costs.2007.
4) Notes Receivable
4)Notes Receivable
Effective December 21, 2001, the Company sold its 50% ownership in NN General, LLC to its partner, General Bearing Corporation for cash of $622 and notes of $3,305. The note was due in annual installments of $200 with the balance of $2,505 due on December 21, 2006. The note was paid in full by General Bearing Corporation in December 2006. Interest income on this note of $164
$129, and
$86$129 was recorded during 2006
2005, and
2004,2005, respectively, and has been included as a component of other income in the accompanying consolidated statement of income. Payments totaling $2,669 and $329 were received during 2006 and 2005, respectively which included $2,505 and $200 of principal and $164 and $129 of interest payments, respectively.
NN, Inc.
Notes to Consolidated Financial Statements
December 31, 2007, 2006 2005 and 20042005
(In thousands, except per share data)
5) Accounts Receivable and Sales Concentrations
| | | December 31, |
| | | | |
| | 2006 | 2005 | 2004 | | |
| Trade | $ 64,720 | $ 48,416 | $ 53,331 | $ 66,978 | $ 64,443 |
| Less - Allowance for doubtful accounts | 1,278 | 1,119 | 1,734 | |
| Less - allowance for doubtful accounts | | | |
| | | | |
| Accounts receivable, net | $63,442 | $ 47,297 | $ 51,597 | $65,566 | $63,442 |
Activity in the allowance for doubtful accounts is as follows:
Description | Balance at beginning of year | Additions | Write-offs | Currency Impacts | Reserve acquired in acquisition | Balance at end of year | Balance at beginning of year | | | | Additions due to acquisition | | |
| | | | | | | | | | | | |
December 31, 2004 | | | | | | | |
| December 31, 2007 | | | | | | | |
| Allowance for doubtful accounts | | $ 1,001 | $ 496 | $ (102) | $ 17 | $ -- | $ 1,412 |
| | | | | | | | |
| December 31, 2006 | | | | | | |
| Allowance for doubtful accounts | $ 1,755 | $ 14 | $ (43) | $ 8 | $ -- | $ 1,734 | $ 1,119 | $ 311 | $ (818) | $ 10 | $ 379 | $ 1,001 |
| | | | | | | | | | | | |
December 31, 2005 | | | | | | | | | | |
| Allowance for doubtful accounts | $ 1,734 | $ 287 | $ (871) | $ (31) | $ -- | $ 1,119 | $ 1,734 | $ 287 | $ (871) | $ (31) | $ -- | $ 1,119 |
| | | | | | | |
December 31, 2006 | | | | | | |
| Allowance for doubtful accounts | $ 1,119 | $ 311 | $ (818) | $ 10 | $ 656 | $ 1,278 | |
For the years ended December 31, 2007, 2006 2005 and 2004,2005, sales to SKF amounted to $169,765, $150,841 $151,175 and $145,534,$151,175, respectively, or 45.6%40.3%, 47.0%,45.6% and 47.9%47.0%, of consolidated revenues, respectively. For the years ended December 31, 2006 2005 and 2004,2005, sales to Schaeffler Group (INA) amounted to $37,283 $41,399, and $41,693,$41,399, respectively or 11.3%, and 12.9%, and 13.7% of consolidated revenues, respectively. None of the Company'sCompany’s other customers accounted for more than 10% of our net sales in 2007, 2006 2005 or 2004.2005. SKF was the only customer with an Accounts Receivable concentration in excess of 10%. This outstanding balance as of December 31, 2007 and 2006 was $23,535 and 2005 was $23,403, and $16,151 respectively. All revenues and receivablereceivables related to SKF and INASchaeffler Group (INA) are in the Metal Bearing Components and Plastics and Rubber Components segments.Segments.
6)Inventories
| | December 31, |
| | 2006 | 2005 |
| Raw materials | $11,828 | $ 10,153 |
| Work in process | 10,427 | 5,845 |
| Finished goods | 23,596 | 23,587 |
| Less-inventory reserve | (2,313) | (1,489) |
| | | |
| Inventories, net | $ 43,538 | $ 38,096 |
NN, Inc.
Notes to Consolidated Financial Statements
December 31, 2006, 2005 and 2004
(In thousands, except per share data)
| | December 31, |
| | 2007 | 2006 |
| Raw materials | $ 15,076 | $ 11,828 |
| Work in process | 9,808 | 10,427 |
| Finished goods | 28,925 | 23,596 |
| Less-inventory reserve | (1,988) | (2,313) |
| | | |
| Inventories, net | $ 51,821 | $ 43,538 |
Inventory on consignment at customers’ sites at December 31, 2007 and 2006 was approximately $5,702 and $4,554, respectively.
NN, Inc.
Notes to Consolidated Financial Statements
December 31, 2007, 2006 and 2005 was approximately $4,554 and $4,669, respectively.
(In thousands, except per share data)
7)Property, Plant and Equipment
| | | December 31, | | December 31, |
| | Estimated Useful Life | 2006 | 2005 | Estimated Useful Life | 2007 | 2006 |
| Land owned | | $ 7,020 | $ 6,431 | | $ 7,975 | $ 7,020 |
| Land under capital lease | | 422 | 408 | | 452 | 422 |
| Buildings and improvements owned | 15-40 years | 39,072 | 31,093 | 15-40 years | 42,976 | 39,072 |
| Buildings under capital leases | 20 years | 1,564 | 1,490 | |
| Building under capital lease | | 20 years | 1,671 | 1,564 |
| Machinery and equipment | 3-12 years | 209,493 | 166,555 | 3-12 years | 235,062 | 209,493 |
| Construction in process | | 12,764 | 10,597 | | 15,002 | 12,764 |
| | | | | | | |
| | | 270,335 | 216,574 | | 303,138 | 270,335 |
| Less - accumulated depreciation | | 113,888 | 97,745 | | 142,130 | 113,888 |
| | | | | | | |
| Property, plant and equipment, net | | $ 156,447 | $ 118,829 | | $ 161,008 | $ 156,447 |
Fixed assets at certain European operations of the Metal Bearing Components Segment were impaired as a result of the Metal Bearing Components Segment restructuring (see Note 3.) The total reduction in fixed assets from the impairment charge was $3,410 and was reported in the restructuring and impairment charges of the Consolidated Statements of Income.
On November 30, 2006, we added $25,837 in fixed assets with the purchase of Whirlaway. (See Note 2).
During January 2006, we completed the sale of excess land and two small buildings at NN Europe'sthe Pinerolo plantPlant with a net book value of $1,013. The proceeds from the sale were $2,804, resulting in a pre-tax gain of $1,791. In addition, the Pinerolo plant disposed of excess machinery in the first quarter of 2006 with a net book value of $1,087 resulting in a pre-tax loss of $1,062.
In December 2005, we sold excess land at our Veenendaal, The Netherlands division. Prior to the sale, this asset was classified as a component of property, plant and equipment, net. The land had a book value at the time of sale of $383. The proceeds of the sale were $815, which resulted in a gain on disposal of assets of $432.
NN, Inc.
Notes to Consolidated Financial Statements
December 31, 2007, 2006 2005 and 20042005
(In thousands, except per share data)
There were no short term loans outstanding at December 31, 2006 and 2005.
Long-term debt at December 31, 20062007 and 20052006 consisted of the following:
| | 2006 | 2005 |
| Borrowings under our $90,000 revolving credit facility bearing interest at a floating rate equal to LIBOR (5.36% at December 31, 2006) plus an applicable margin of 0.60 to 0.925, expiring September 20, 2011 | $ 39,466 | $ -- |
| | | |
| Borrowings under our $30,000 revolving credit facility bearing interest at a floating rate equal to LIBOR plus an applicable margin of 1.25 to 2.0, originally expiring on June 30, 2007 and retired on September 21, 2006 | -- | $ 17,900 |
| | | |
| Borrowings under our 26,300 Euro term loan expiring on May 1, 2008, bearing interest at a floating rate equal to Euro LIBOR plus an applicable margin of 1.25 to 2.0 payable in quarterly installments of Euro 1,314 beginning July 1, 2003 through April 1, 2008. Paid in full and retired on September 21, 2006 | -- | 4,668 |
| | | |
| Borrowings under our $40,000 aggregate principal amount of senior notes bearing interest at a fixed rate of 4.89% maturing on April 26, 2014. Annual principal payments of $5,714 begin on April 26, 2008 and extend through the date of maturity. | 40,000 | 40,000 |
| | | |
| Long term note payable with customer related to acquiring equipment from customer as part of long term supply agreement. Note carries a 0% rate of interest. Interest on this note has been imputed at a rate of 5.41%. Note is paid down by applying a fixed amount per piece purchased by customer. | 2,096 | -- |
| | |
| Total long-term debt | 81,562 | 62,568 |
| | | |
| Less current maturities of long-term debt | 851 | 4,668 |
| | | |
| Long-term debt, excluding current maturities of long-term debt | $ 80,711 | $ 57,900 |
| | 2007 | 2006 |
| Borrowings under our $135,000 revolving credit facility bearing interest at a floating rate equal to LIBOR (4.60% at December 31, 2007) plus an applicable margin of 0.60 to 0.925, expiring September 20, 2011 | $ 70, 476 | $ 39,466 |
| | | |
| Borrowings under our $40,000 aggregate principal amount of senior notes bearing interest at a fixed rate of 4.89% maturing on April 26, 2014. Annual principal payments of $5,714 begin on April 26, 2008 and extend through the date of maturity. | 40,000 | 40,000 |
| | | |
| Long-term note payable with customer related to acquiring equipment from customer as part of long-term supply agreement. Note carries a 0% rate of interest. Interest on this note has been imputed at a rate of 5.41%. Note is reduced by applying a fixed amount per piece purchased by customer. | 1,568 | 2,096 |
| Total long-term debt | 112,044 | 81,562 |
| | | |
| Less current maturities of long-term debt | 11,851 | 851 |
| | | |
| Long-term debt, excluding current maturities | $ 100,193 | $ 80,711 |
On September 21, 2006, the Companywe entered into a five-year $90.0 million$90,000 revolving credit facility maturing in September 2011 with Key Bank as the administrative agent. ThisOn May 30, 2007, we entered into an agreement to amend our $90,000 credit facility can be increased to a maximum of $120.0 million under certain conditions specifiedincrease the total commitment from $90,000 to $135,000. Other than the increase in the agreement. total commitment, the other terms of the credit facility remained substantially the same. In July 2007, we amended the $135,000 credit facility to amend the definitions of certain components of the financial covenant calculations to exclude the negative impacts of non-cash restructuring and impairment charges. We incurred $184 of costs related to these amendments which have been capitalized.
The $135,000 credit facility provides the Company the ability to borrow in US dollarsU.S. Dollars at LIBOR plus an applicable margin of .60% to .925% or Euros at EURIBOR plus an applicable margin of .60% to .925%to.925%. The facility has a $10.0 million$10,000 swing line feature to meet short term cash flow needs. Any borrowings under this swing line are considered short term. Costs associated with entering into the revolving credit facility were capitalized and will be amortized into interest expense over the life of the facility. As of December 31, 2006, $5112007, $627 of net capitalized loan origination cost was on the balance sheet within other non-current assets and the gross amount was presented in the Financing Activities section of the Statement of Cash Flows. This new credit facility replaced our prior $90.0 million credit facility with AmSouth Bank as administrative agent. The loan agreement contains customary financial and non-financial covenants specifying that we must maintain certain liquidity measures. The loan agreement also contains customary restrictions on, among other things, additional indebtedness, liens on our assets, sales or transfers of assets, investments, restricted payments (including payment of dividends and stock repurchases), issuance of equity securities, and merger, acquisition and other fundamental changes in the Company’s business. The credit agreement is collateralized by the pledge of stock of certain foreign and domestic subsidiaries and guarantees of certain domestic subsidiaries.
NN, Inc.
Notes to Consolidated Financial Statements
December 31, 2006, 2005 and 2004
(In thousands, except per share data)
The $4,668 under the Euro term loan classified as current portion of long-term debt at December 31, 2005 was repaid in the first quarter of 2006. The borrowings under the 26,300 Euro term loan have all been repaid and the facility was replaced with the new facility discussed above. Capitalized loan costs related to the former facility amounting to $228 were written off during 2006.
On April 26, 2004, we issued $40,000 aggregate principal amount of senior notes in a private placement (the “$40 million notes”).placement. These notes bear interest at a fixed rate of 4.89% and mature on April 26, 2014. Interest is paid semi-annually. As of December 31, 2006,2007, $40.0 million remained outstanding. Annual principal payments of approximately $5,714 begin on April 26, 2008 and extend through the date of maturity. The agreement contains customary financial and non-financial covenants. Such covenants specify that we must maintain certain liquidity measures. The agreement also contains customary restrictions on, among other things, additional indebtedness, liens on our assets, sales or transfers of assets, investments, restricted payments (including payment of dividends and stock repurchases), issuance of equity securities, and mergers, acquisitions and other fundamental changes in our business. The notes are collateralized by the pledge of stock of certain foreign subsidiaries. The net equity of certain Metal Bearing Components Segment subsidiaries that have pledged their stock as collateral was $74,231 as of December 31, 2006. We incurred $845 of related costs as a result of issuing these notes which have been recorded as a component of other non-current assets and are being amortized over the term of the notes. The unamortized balance at December 31, 2007 was $535.
NN, Inc.
Notes to Consolidated Financial Statements
December 31, 2007, 2006 was $620.and 2005
(In thousands, except per share data)
We werebelieve we are in compliance with all covenants related to the new $90.0$135.0 million credit facility and the $40.0 million senior notes as of December 31, 2006.2007. The table below summarizes the various financial covenants of the two agreements:
| Financial Covenants | Required Ratio | Actual Ratio |
| Fixed charge coverage ratio | Not less than 2.00 to 1.00 | 2.29 to 1.00 |
| Funded debt to EBITDA | Not to exceed 2.50 to 1.00 | 2.37 to 1.00 |
Funded indebtedness to capitalization ratio | Not to exceed 0.55 to 1.00 | 0.47 to 1.00 |
| Interest and rent expense coverage ratio | No less than 3.00 to 1.00 | 4.69 to 1.00 |
| Capital expenditures | Not to exceed 150% of prior year depreciation | Capital expenditures 114% of prior year depreciation |
| Minimum net worth | No less than $79,500 | $130,043 |
The aggregate maturities of long-term debt including current portion for each of the five years subsequent to December 31, 20062007 are as follows:
| 2007 | $ 851 | |
| 2008 | 6,269 | $ 11,851 |
| 2009 | 6,241 | 6,021 |
| 2010 | 6,143 | 5,714 |
| 2011 | 44,914 | 71,314 |
| 2012 | | 5,714 |
| Thereafter | 17,144 | 11,430 |
| Total | $ 81,562 | $ 112,044 |
On June 1, 2004, our wholly owned subsidiary, NN Asia, entered into a twenty year lease agreement with Kunshan Tian Li Steel Structure Co. LTD for the lease of land and building (approximately 110,000 square feet) in the Kunshan Economic and Technology Development Zone, Jiangsu, The People’s Republic of China. The building was newly constructed and we began usage of the leased property October 1, 2005. The agreement satisfied the requirements of a capital lease at June 1, 2004 and we recorded the lease as a capital lease in our consolidated financial statements effective October 1, 2005. The fair value of the land and building are estimated to be approximately $408 and $1,509, respectively and undiscounted annual lease payments of approximately $224 (approximately $4,482 aggregate non-discounted lease payments over the twenty year term). The lease is cancelable after the fifth, ninth, and fourteenth years without payment or penalty by the Company. In addition, after the end of year five we can buy the land for its ascribed fair value and the building for actual cost less depreciation.
NN, Inc.
Notes to Consolidated Financial Statements
December 31, 2006, 2005 and 2004
(In thousands, except per share data)
Below are the minimum future lease payments under the capital lease together with the present value of the net minimum lease payments as of December 31, 2006:2007:
Year ended December 31 |
| 2007 | $ 224 |
| 2008 | 224 |
| 2009 | 224 |
| 2010 | 224 |
| 2011 | 224 |
| Thereafter | 3,082 |
| Total minimum lease payments | 4,202 |
| Less interest included in payments above | (2,324) |
| Present value of minimum lease payments at 12/31/06 | $ 1,878 |
NN, Inc.
Notes to Consolidated Financial Statements
December 31, 2007, 2006 and 2005
(In thousands, except per share data)
| Year ended December 31 |
| 2008 | $ 248 |
| 2009 | 248 |
| 2010 | 248 |
| 2011 | 248 |
| 2012 | 248 |
| Thereafter | 3,166 |
| Total minimum lease payments | 4,406 |
| Less interest included in payments above | (2,365) |
| Present value of minimum lease payments at 12/31/07 | $ 2,041 |
9) Employee Benefit Plans
We have one defined contribution 401(k) profit sharing plan covering substantially all U.S. employees of the Metal Bearing Components and PlasticPlastics and Rubber Components segments.Segments. All employees are eligible for the plan on the first day of the month following their employment date. A participant may elect to contribute between 1% and 60% of their compensation to the plan, subject to Internal Revenue Service (“IRS”) dollar limitations. Participants age 50 and older may defer an additional amount up to the applicable IRS Catch Up Provision Limit. The Company provides a matching contribution which is determined on an individual, participating company basis. Currently, the matching contribution for U.S. employees of the Metal Bearing Components Segment is the greater of five hundred dollars or 50% of the first 4% of compensation contributed. The matching contribution for IMC employees is 25% of the first 6% of compensation contributed and the matching contribution for Delta employees is 50% of the first 6% of compensation contributed. The matching contribution for Precision Metal Components Segment employees is 25% of the first 5% of compensation contributed. All participants are immediately vested at 100%. Contributions by the Company for the Metal Bearing Components Segment were $171, $146, and $139 in 2007, 2006, and $134 in 2006, 2005, and 2004, respectively. Contributions by the Company for the Plastic and Rubber Components Segment were $123, $110, and $128 in 2007, 2006 and $1332005, respectively. On November 30, 2006, we assumed Whirlaway's defined contribution 401(k) plan. Contributions by the Company for the Precision Metal Components Segment employees were $121 in 2006, 20052007. All employees are eligible for the plan six months after joining the company and 2004, respectively.matching contributions vest over four years.
The Company has a defined benefit pension plan covering its Eltmann Germany facility employees.Plant. The benefits are based on the expected years of service. The plan is unfunded.
For the yearyears ended December 31, 2007 and 2006, we accounted for the Eltmann plan under SFAS 158. The impact of this adoption for the year ended December 31, 2006 was to increase the Pension Liability by $491, to increase accumulated other comprehensive income by $313 (net of $178 in taxes) and increase non-current deferred tax asset by $178.
NN, Inc.
Notes to Consolidated Financial Statements
December 31, 2006, 2005 and 2004
(In thousands, except per share data)
Following is a summary of the funded status and changes in the projected benefit obligation for the defined benefit pension plan during 2007 and 2006:
NN, Inc.
Notes to Consolidated Financial Statements
December 31, 2007, 2006 and 2005:2005
(In thousands, except per share data)
| | 2007 | | 2006 |
| Reconciliation of Funded Status: | | | |
| Benefit obligation | $ (4,947) | | $ (5,167) |
| Fair value of plan assets | -- | | -- |
| Funded status | $ (4,947) | | $ (5,167) |
| | | | |
| Net amount recognized under accrued pension | $ (4,947) | | $ (5,167) |
| | 2006 | | 2005 |
Reconciliation of Funded Status: | | | |
| Benefit obligation | $ (5,167) | | $ (5,616) |
| Fair value of plan assets | -- | | -- |
| Funded status | $ (5,167) | | (5,616) |
| Unrecognized net actuarial loss | -- | | 1,668 |
| Additional minimum liability | -- | | (1,191) |
| Net amount recognized under Accrued Pension | $ (5,167) | | $ (5,139) |
| | | | |
Items not yet recognized as a component of net periodic pension cost: | | | |
Unrecognized net actuarial loss | $ 618 | | $ 1,191 |
| Items not yet recognized as a component of net periodic pension cost: | | | |
Unrecognized net actuarial (gain) loss | $ (221) | | $ 618 |
| | 2006 | | 2005 | 2007 | | 2006 |
Change in projected benefit obligation: | | | | | | |
| Benefit obligation at beginning of year | $ 5,616 | | $ 4,957 | $5,167 | | $ 5,616 |
| Service cost | -- | | 110 | -- | | -- |
| Interest cost | 218 | | 230 | 239 | | 218 |
| Benefits paid | (84) | | (60) | (115) | | (84) |
| Effect of currency translation | 597 | | (647) | 560 | | 597 |
| Curtailment gain | (1,147) | | -- | -- | | (1,147) |
| Actuarial (gain) loss | (33) | | 1,026 | |
| Actuarial gain | | (904) | | (33) |
| | | | | | | |
| Benefit obligation at December 31 | $ 5,167 | | $ 5,616 | $ 4,947 | | $ 5,167 |
| | 2006 | | 2005 | 2007 | | 2006 |
Weighted-average assumptions as of December 31: | | | | | | |
| Discount rate | 4.5% | | 4.25% | 5.65% | | 4.5% |
| Rate of compensation increase | 0% - 1.5% | | 1.5% - 2.5% | 0% - 1.5% | | 0% - 1.5% |
| Measurement date | 10/31/06 | | 10/31/05 | 10/31/07 | | 10/31/06 |
In determining the pension discount rate to be used for the Company’s German defined benefit plan, the Company utilizes the German Federal Reserve Bank yield curve for high quality corporate bonds with maturities that are consistent with the projected future benefit obligations of the plan.plan
During the year ended December 31, 2006, the Planplan benefits were curtailed by not allowing new employees to join the plan and by eliminating any effects of future wage increases. The net effect was to decrease the benefit obligation and the unrecognized net loss by $1,147. The rate of compensation increase of 1.5% only applies to current retirees.retirees during the years ended December 31, 2007 and 2006.
The expected pension benefit payments for the next ten fiscal years are as follows:
| | | Pension Benefits | Pension Benefits |
| 2007 | | $ 112 | |
| 2008 | | 134 | 125 | |
| 2009 | | 150 | 136 | |
| 2010 | | 173 | 146 | |
| 2011 | | 186 | 150 | |
| 2012-2016 | | 1,221 | |
| 2012 | | 184 | |
| 2013-2017 | | 1,305 | |
NN, Inc.
Notes to Consolidated Financial Statements
December 31, 2007, 2006 2005 and 20042005
(In thousands, except per share data)
| | 2006 | | 2005 | | 2004 |
| | | | | | |
Components of net periodic benefit cost: | | | | | |
| Service cost | $ -- | | $ 110 | | $ 119 |
| Interest cost on projected benefit obligation | 218 | | 230 | | 242 |
| Amortization of net loss | 8 | | 11 | | 9 |
| | | | | | |
| Net periodic pension benefit cost | $ 226 | | $ 351 | | $ 370 |
| | 2006 | | 2005 | | 2004 |
| | | | | | |
Amounts Recognized in Accumulated Other Comprehensive Income: | | | | | |
| Period Actuarial (gain) loss | $ (33) | | $ 1,026 | | $ 136 |
| | | | | | |
| Curtailment gain | 1,147 | | -- | | -- |
| FAS 158 adoption Impact | (491) | | -- | | -- |
| | | | | | |
| Net periodic pension (benefit) cost | $ (623) | | $ 1,026 | | $ 136 |
| | 2007 | | 2006 | | 2005 |
| | | | | | |
| Components of net periodic benefit cost: | | | | | |
| Service cost | $ -- | | $ -- | | $ 110 |
| Interest cost on projected benefit obligation | 239 | | 218 | | 230 |
| Amortization of net loss | 6 | | 8 | | 11 |
| | | | | | |
| Net periodic pension benefit cost | $ 245 | | $ 226 | | $ 351 |
| | 2007 | | 2006 | | 2005 |
| | | | | | |
| Amounts Recognized in Accumulated Other Comprehensive Income: | | | | | |
| Period actuarial (gain) loss | $ (904) | | $ (33) | | $ 1,026 |
| | | | | | |
| Curtailment gain | -- | | 1,147 | | -- |
| FAS 158 adoption impact | -- | | (491) | | -- |
| | | | | | |
| Net periodic pension (benefit) cost | $ (904) | | $ (623) | | $ 1,026 |
The amount of actuarial lossgain expected to be a component of net pension cost in 20072008 is $6.$0.
We do not expect to make any contributions to the plan in 20072008 or thereafter in excess of the pension benefit payments listed above.
Severance Indemnity
In accordance with Italian law, the Company has an unfunded severance plan under which all employees are entitled to receive severance indemnities (Trattamento di Fine Rapporto or “TFR”) upon termination of their employment.
TheEffective January 1, 2007, the amount payable is based on salary paid and increases in cost of living.is remitted to a pension fund managed by a third party. The severance indemnities paid to the pension fund accrue approximately at the rate of 1/13.5 of the gross salaries paid during the year,year. The balance remaining is for the indemnities accrued as of December 31, 2006 and areis revalued applying a cost of living factor established by the Italian Government. The amounts accrued become payable upon termination of the individual employee, for any reason, e.g., retirement, dismissal or reduction in work force. Employees are fully vested in TFR benefits after their first year of service. The amounts shown in the table below represent the actual liability at December 31, 20062007 and 20052006 reported under Accrued Pension.accrued pension.
The following table details the changes in Italian severance indemnity for the years ended December 31, 20062007 and 2005:2006:
| | 2006 | | 2005 | 2007 | 2006 |
| Beginning balance | $(6,644) | | $(7,503) | $ (8,020) | $ (6,644) |
| Amounts accrued | (1,036) | | (983) | (707) | (1,036) |
| Payments to employees | 320 | | 718 | 406 | 320 |
| Payments to pension funds | 130 | | 120 | 601 | 130 |
| Tax prepayments | -- | | 19 | |
| Foreign Exchange | (790) | | 985 | |
| Ending Balance | $(8,020) | | $(6,644) | |
| Foreign exchange | | (831) | (790) |
| Ending balance | | $ (8,551) | $ (8,020) |
NN, Inc.
Notes to Consolidated Financial Statements
December 31, 2007, 2006 and 2005
(In thousands, except per share data)
On January 1, 2006, the Company adopted SFAS No. 123(R) “Share-Based Payment.” SFAS No. 123(R) replacesreplaced SFAS No. 123 “Accounting for Stock-Based Compensation” and supersedessuperseded Accounting Principles Board Opinion (“APB”) No. 25 “Accounting for Stock Issued to Employees” and amendsamended SFAS No. 95 “Statement of Cash Flows.” Prior to adoption of SFAS No. 123(R) the Company followed the disclosure-only requirements of SFAS No. 123 and continued to account for stock compensation under the requirements of APB No. 25.
The Company adopted SFAS No. 123(R) using the modified prospective method that requiresrequired compensation expense of all employee and non-employee director share-based compensation awards to be recognized in the financial statements based upon their fair value over the requisite service or vesting period for all new awards granted after the effective date and for all awards granted prior to the effective date of SFAS No. 123(R) that remain unvested on the effective date. Under the requirements of APB No. 25, the Company was required to recognize compensation cost only for stock option awards granted at a price lower than the market price at the date of grant. Effective with adoption of SFAS No. 123(R), compensation expense related to stock option awards is recognized in the financial statements at the fair value of the award. The Company accounts for restricted share awards by recognizing the fair value of the awarded stock at the grant date as compensation expense over the vesting period, less anticipated forfeitures.
In accordance with implementation requirements of SFAS No. 123(R) under the modified prospective method, the Company did not restate prior fiscal periods and is required to continue the same disclosure only requirements of SFAS No. 123 for comparative purposes until all periods reported are comparable on the same basis. The following table illustrates the reported net earnings for 2005 and 2004 and pro-forma net earnings for 2005 and 2004 including the effects of expensing stock options and the related assumptions used. During the year ended December 31, 2005 there was 267 options granted.
| | | Year ended December 31, |
| (In Thousands, Except per Share Data) | | 2005 | | 2004 |
| Net income - as reported | | $ 15,012 | | $ 7,102 |
| Stock based compensation (income) expense, net of income tax, included in net income as reported | | (182) | | 27 |
| Stock based compensation costs, net of income tax, that would have been included in net income if the fair value method had been applied | | (860) | | (494) |
| Net income pro-forma | | $ 13,970 | | $ 6,635 |
| | | | | |
| Basic earnings per share - as reported | | $ 0.88 | | $ 0.42 |
| Stock based compensation (income) expense, net of income tax, included in net income as reported | | (0.01) | | -- |
| Stock based compensation costs, net of income tax, that would have been included in net income if the fair value method had been applied | | (0.05) | | (0.02) |
| Basic earnings per share - pro-forma | | $ 0.82 | | $ 0.40 |
| | | | | |
| Earnings per share-assuming dilution - as reported | | $ 0.87 | | $ 0.41 |
| Stock based compensation (income) expense, net of income tax, included in net income as reported | | (0.01) | | -- |
| Stock based compensation costs, net of income tax, that would have been included in net income if the fair value method had been applied | | (0.05) | | (0.02) |
| Earnings per share - assuming dilution-pro-forma | | $ 0.81 | | $ 0.39 |
| | Year ended December 31, |
| (In Thousands, Except per Share Data) | | 2005 |
| Net income – as reported | | $ 15,012 |
| Stock based compensation (income) expense, net of income tax, included in net income as reported | | (182) |
| Stock based compensation costs, net of income tax, that would have been included in net income if the fair value method had been applied | | (860) |
| Net income –pro-forma | | $ 13,970 |
| | |
| Basic earnings per share – as reported | | $ 0.88 |
| Stock based compensation (income) expense, net of income tax, included in net income as reported | | (0.01) |
| Stock based compensation costs, net of income tax, that would have been included in net income if the fair value method had been applied | | (0.05) |
| Basic earnings per share – pro-forma | | $ 0.82 |
| | |
| Earnings per share-assuming dilution – as reported | | $ 0.87 |
| Stock based compensation (income) expense, net of income tax, included in net income as reported | | (0.01) |
| Stock based compensation costs, net of income tax, that would have been included in net income if the fair value method had been applied | | (0.05) |
| Earnings per share – assuming dilution-pro-forma | | $ 0.81 |
NN, Inc.
Notes to Consolidated Financial Statements
December 31, 2007, 2006 2005 and 20042005
(In thousands, except per share data)
| Term | Vesting Period |
| Risk free rate | 4.35% and 3.25% for 2005 and 2004, respectively |
| Dividend yield | 3.02% and 2.42% annually for 2005 and 2004, respectively |
| Expected volatility | 44.6% and 48.4% for 2005 and 2004, respectively |
In the yearyears ended December 31, 2007 and 2006, approximately $981 and $464 of compensation expense was recognized in selling, general and administrative expense for all share-based awards. The cost recognized in the years ended December 31, 2007 and 2006 related to thestock options was $670 and $181, related to restricted stock awards was $283. The compensation expense recognized$83 and $283, and related to stock options $181. The impact on net income of all stock based compensation expense in the year ended December 31, 2006our long-term incentive plan was approximately $362, net of tax benefits of $102.$226 and $0, respectively.
Stock Option Awards
Option awards are typically granted to non-employee directors and key employees on an annual basis. A single option grant is typically awarded to eligible employees and non-employee directors in the third quarter of each year if and when granted by the Compensation Committee of the Board of Directors and occasional individual grants are awarded to eligible employees throughout the year.employees. All employee and non-employee directors are awarded options at an exercise price equal to the closing price of the Company’sCompany's stock on the date of grant. The term life of options is ten years with vesting periods of generally three years for key employees and one year for non-employee directors. The fair value of options cannot be determined by market value as our options are not traded in an open market. Accordingly, a financial pricing model is utilized to determine fair value. The Company utilizes the Black Scholes model which relies on certain assumptions to estimate an option’soption's fair value.
During 2007 and 2006, the Company granted 192 and 172 options, respectively, to certain key employees and non-employee directors. The weighted average grant date fair value of the options granted during the years ended December 31, 2007 and 2006 was $ 4.32 and $4.30. The number of options available for future issuance under the current plan is 808.585. Upon exercise of stock options, new shares of the Company'sCompany’s stock are issued. The weighted -averageaverage assumptions relevant to determining the fair value at the dates of grant are below:
Term | 6 years |
Risk free interest rate | 4.90% |
Dividend yield | 2.81% |
Expected volatility | 43.63% |
Expected forfeiture rate | 6.20% |
| | | |
| Term | 6 years | 6 years |
| Risk free interest rate | 4.75% | 4 .90% |
| Dividend yield | 2.66% | 2.81% |
| Expected volatility | 41.23% | 43.63% |
| Expected forfeiture rate | 6.20%, 0% | 6.20%, 0% |
The expected volatility rate is derived from actual Company common stock historical volatility over the same time period as the expected term. The volatility rate is derived by mathematical formula utilizing daily closing price data.
The expected dividend yield is derived by mathematical formula which uses the expected Company annual dividends over the expected term divided by the fair market value of the Company’sCompany's common stock at the grant date.
The average risk-free interest rate is derived from United States Department of Treasury published interest rates of daily yield curves for the same time period as the expected term.
The forfeiture rate is determined from examining the historical pre-vesting forfeiture patterns of past option issuances to key employees andemployees. The forfeiture rate is estimated to be 0% for non-employee directors. While the forfeiture rate is not an input of the Black Scholes model for determining the fair value of the options, it is an important determinant of stock option compensation expense to be recorded.
NN, Inc.
Notes to Consolidated Financial Statements
December 31, 2007, 2006 and 2005
(In thousands, except per share data)
The term is derived from using the “Simplified Method” of determining stock option terms as described under the Securities and Exchange Commissions Staff Accounting Bulletin 107. Prior to the adoption of SFAS 123 (R), the option term used was equal to the vesting period of 3 years.
NN, Inc.
Notes to Consolidated Financial Statements
December 31, 2006, 2005 and 2004
(In thousands, except per share data)
The following table provides a reconciliation of option activity for the year ended December 31, 2006:2007:
Options | | Shares ('000) | | Weighted-Average Exercise Price | | Weighted-Average Remaining Contractual Term | | Aggregate Intrinsic Value ($000) | Shares (‘000) | Weighted-Average Exercise Price | Weighted-Average Remaining Contractual Term | Aggregate Intrinsic Value ($000) |
| Outstanding at January 1, 2006 | | 1,403 | | $ 9.56 | | | | | |
| Outstanding at January 1, 2007 | | 1,452 | $ 9.81 | | |
| Granted | | 172 | | 11.52 | | | | | 192 | 12.05 | | |
| Exercised | | (99) | | 8.59 | | | | | (26) | 10.95 | | |
| Forfeited or expired | | (24) | | 12.62 | | | | | (88) | 12.37 | | |
| Outstanding at December 31, 2006 | | 1,452 | | $ 9.81 | | 6.12 | | $ 3,805 (1) | |
| Exercisable at December 31, 2006 | | 1,280 | | $ 9.58 | | 5.64 | | $ 3,648 (1) | |
| Outstanding at December 31, 2007 | | 1,530 | $ 9.93 | 5.51 | $ (772) |
| Exercisable at December 31, 2007 | | 1,265 | $ 9.52 | 4.69 | $ (124) |
(1) Intrinsic value is the amount by which the December 31, 2007 market price of the stock ($12.43) exceeds9.42) is less than the exercise price of the options outstanding at December 31, 2006.2007.
At December 31, 2005, all outstanding options were fully vested and no compensation expense was incurred from these options. There were 172, 267, and 438 options granted, respectively during the years ended December 31, 2006, 2005 and 2004. The weighted average grant date fair value of the options granted during the year ended December 31, 2006 was $4.30. As of December 31, 2007 and 2006, there was approximately $556 and $476, respectively, of unrecognized compensation cost to be recognized over approximately threetwo years.
Cash proceeds from the exercise of options in the year ended December 31, 2007, 2006, and 2005 totaled approximately $984. During$292, $984 and $2,806. For the years ended December 31, 20052007 and 2004, the Company received $2,806 and $463, respectively, in cash proceeds from the exercise of stock options. For the year ended December 31, 2006, proceeds from stock options were presented inclusive of tax benefits of $8 and $133, respectively, in the Financing Activities section of the Consolidated Statements of Cash Flows. The total intrinsic value of options exercised during the years ended December 31, 2007, 2006 and 2005 was $23, $421, and 2004 was $421, $1,846, and 772, respectively.
Restricted Stock Awards
In addition to stock option awards, the Company has restricted stock awards, the first grant of which was in July 2005. The Company’s policy for issuing restricted shares is similar to that described under “Stock Option Awards”.Awards.” The recognized compensation costs before tax for these restricted stock awards in the years ended December 31, 2007, 2006, and 2005 were approximately $83, $283 and $206, respectively. The unrecognized compensation cost before tax for these awards at December 31, 2007, 2006 and 2005 total approximately $32, $159 and $467, respectively, to be recognized over approximately one, one, and two years, respectively. During the yearyears ended December 31, 2007 and 2006, the Company experienced a forfeiture raterates of 6% and 4%, respectively, of the awards granted. Below is a summary of the status of the restricted shares as of December 31, 20062007 and changes during the year ended December 31, 2006:2007:
Non-vested Shares | Shares ('000) | Weighted-Average Grant-Date Fair Value | Shares (‘000) | Weighted- Average Grant- Date Fair Value |
| Non-vested at January 1, 2006 | 53 | $ 12.70 | |
| Non-vested at January 1, 2007 | | 33 | $ 12.70 |
| Granted | -- | -- | -- | -- |
| Vested | (18) | 12.70 | (15) | 12.70 |
| Forfeited | (2) | 12.70 | (3) | 12.70 |
| Non-vested at September 30, 2006 | 33 | $ 12.70 | |
| Non-vested at December 31, 2007 | | 15 | $ 12.70 |
NN, Inc.
Notes to Consolidated Financial Statements
December 31, 2007, 2006 and 2005
(In thousands, except per share data)
Long-Term Incentive Plan
On June 29, 2007, the Company granted certain directors and other key employees an award of 151,500 performance units pursuant to the NN, Inc. 2005 Incentive Plan. Each unit is equal to one share of NN common stock. The award entitles the grantee to earn in a range from 90% to 150% of the total number of units based upon achieving earnings per share and return on capital employed targets over a defined performance cycle. The value of the performance units is based on the grant date fair value of one share of NN common stock or $11.80 per unit. The performance period is fiscal years 2007, 2008 and 2009 and the shares vest on December 31, 2009. There was $226 of compensation expense recognized during the year ended December 31, 2007 related to these performance units and $905 of unrecognized compensation cost, before tax to be recognized over approximately two years.
11) Goodwill, , netNet
We completed our annual goodwill impairment review during the fourth quarter of 2007, 2006, 2005 and 2004.2005. In performing the impairment reviews for 2007, 2006, and 2005 the Company estimated the fair values of the reporting units from discounting each segments’ projected future cash flows. In 2004,During the Company estimatedsecond quarter, we recorded $10,016 in impairment charges within the fair valuesMetal Bearing Component Segment related to the restructuring of the reporting units by using a method that incorporated valuations derived from EBITDA multiples based upon market multiples and recent capital market transactions and also incorporated valuations determined by each segment’s discounted future cash flows.Metal Bearing Segment (See Note 3 for further details). As of October 1, 20062007 and 2005,2006, the annual review dates, there was no impairment to the remaining goodwill balances as the fair values of the reporting units exceeded their carrying values of the reporting units.
The changes in the carrying amount of goodwill for the years ended December 31, 20062007 and 20052006 are as follows:
(In thousands) | Plastic and Rubber Components Segment | Metal Bearing Components Segment | Precision Metal Components Segment | Total | Plastic and Rubber Components Segment | Metal Bearing Components Segment | Precision Metal Components Segment | Total |
| | | | | |
| Balance as of January 1, 2005 | $ 25,755 | $ 18,702 | $ -- | $ 44,457 | |
| Goodwill acquired | -- | -- | -- | |
| Impairment losses | -- | -- | -- | |
| Currency impacts | -- | (2,809) | -- | (2,809) | |
| | $ 25,755 | $ 15,893 | -- | $ 41,648 | | | |
| Balance as of January 1, 2006 | | | | $ 25,755 | $ 15,893 | $ -- | $ 41,648 |
| Goodwill acquired | -- | 2,352 | 2,352 | -- | 2,352 | 2,352 |
| Impairment losses | -- | -- | -- | |
| Currency impacts | -- | 2,147 | -- | 2,147 | -- | 2,147 | -- | 2,147 |
| Balance as of December 31, 2006 | $ 25,755 | $ 18,040 | $ 2,352 | $ 46,147 | $ 25,755 | $ 18,040 | $ 2,352 | $ 46,147 |
| | | | | |
| Balance as of January 1, 2007 | | $ 25,755 | $ 18,040 | $ 2,352 | $ 46,147 |
Adjustments to purchase price allocation | | -- | 1,922 | 1,922 |
| Impairment write down | | -- | (10,016) | -- | (10,016) |
| Currency impacts | | -- | 1,418 | -- | 1,418 |
| Balance as of December 31, 2007 | | $ 25,755 | $ 9,442 | $ 4,274 | $ 39,471 |
The adjustments to purchase price allocation under the Precision Metal Components Segment related to changes made to the acquired assets and liabilities of Whirlaway during the finalization of the purchase price allocation in 2007 (See Note 2 for further details).
NN, Inc.
Notes to Consolidated Financial Statements
December 31, 2007, 2006 and 2005
(In thousands, except per share data)
12) Intangible Assets, Net
The changes in the carrying amount of intangible assets,Intangible Assets, net for the years ended December 31, 20062007 and 20052006 are as follows:
Intangible assets subject to amortization, net of amortization
(In Thousands) | Precision Metal Components Segment | Metal Bearing Components Segment | Total | Precision Metal Components Segment | Metal Bearing Components Segment | Total |
| Balance as of January 1, 2005 | $ -- | $ -- | $ -- | |
| Acquisition of Intangibles | -- | 476 | 476 | |
| | | | | |
| Balance as of January 1, 2006 | | $ -- | $ 474 | $ 474 |
| Acquisition of intangibles | | 7,180 | 1,855 | 9,035 |
| Amortization | -- | -- | -- | (39) | (402) | (441) |
| Currency impacts | -- | (2) | (2) | -- | 163 | 163 |
| Balance as of December 31, 2005 | $ -- | $ 474 | $ 474 | |
| Balance as of December 31, 2006 | | $ 7,141 | $ 2,090 | $ 9,231 |
| | | | | |
| Balance as of January 1, 2007 | | $ 7,141 | $ 2,090 | $ 9,231 |
| Acquisition of intangibles | | -- | 173 | 173 |
| Amortization | | (657) | (558) | (1,215) |
| Currency impacts | | -- | 190 | 190 |
| Balance as of December 31, 2007 | | $ 6,484 | $ 1,895 | $ 8,379 |
| Balance as of January 1, 2006 | $ -- | $ 474 | $ 474 |
| Acquisition of Intangibles | 7,180 | 1,855 | 9,035 |
| Amortization | (39) | (402) | (441) |
| Currency impacts | -- | 163 | 163 |
| Balance as of December 31, 2006 | $ 7,141 | $ 2,090 | $ 9,231 |
NN, Inc.
Notes to Consolidated Financial Statements
December 31, 2006, 2005 and 2004
(In thousands, except per share data)
The intangible asset within the Metal Bearing Components Segment is a contract intangible related to the SNR purchase agreement and related supply agreement (See Note 2).2.) This intangible asset is subject to amortization over approximately 5 years and amortization expense will approximate $500 for each of the five years. For the year ended December 31, 2006,2007, the amortization expense totaled $558 and accumulated amortization totaled $402.$960.
The intangible assets within the Precision Metal Components segment were acquired on November 30, 2006 with the purchase of Whirlaway (See Note 2).2.) The majority of the value is a customer contractrelationship intangible estimated to be worthwith a fair value of $6,900. ThisAs of July 1, 2007, this intangible asset has an estimated useful life of 2010 years and $29$528 of amortization expense was recorded in 2006.2007. Prior to July 1, 2007, the useful live was estimated to be 20 years. The remaining balance is made up of a covenant not to compete of $150 and a favorable leasehold interest $130. These items are amortizable over 2 and 2.5 years, respectively, and $6$75 and $4$54 in amortization expense was recorded in 2006.2007. The accumulated amortization related to all of these intangible assets at December 31, 20062007 is $39.$696.
In addition, as part of the Whirlaway acquisition we acquired an intangible asset not subject to amortization of $900 related to the value of the trade names of Whirlaway. This intangible asset has an indefinite life and as such is not amortized but is subject to amortization.an annual impairment test.
The Company determined its reportable segments under the provisions of SFAS No. 131, “Disclosures about Segments of an Enterprise and Related Information”.Information.” During the fourth quarter of 2006, the Company changed its operational structure and strategic focus such that the operations are now managed in three reportable segments. The core steel ball and roller business is managed as one reportable segment as the operations have become more fully inter-related and integrated. A new segment entitled "Precision“Precision Metal Components"Components” has been established as a result of the Whirlaway acquisition. During 2006, the Company has integrated a new information system that enables the Company to report non-segment specific costs, including corporate expenses, as reconciling items from segment financial statements to the total Company financial statements. We have restated the yearsyear ended December 31, 2005 and 2004 to conform to the current segment reporting.
NN, Inc.
Notes to Consolidated Financial Statements
December 31, 2007, 2006 and 2005
(In thousands, except per share data)
The Company’s three reportable segments are based on differences in product lines. The three segments of the Companylines and are defined as the follows:
Metal Bearing Components Segment the
·Erwin Plant
·Mountain City Plant
·Kilkenny Plant
·Eltmann Plant
·Pinerolo Plant
·Veenendaal Plant
·Kysucke Plant
·Kunshan Plant
Plastic and Rubber Components Segment and the
·Danielson Plant
·Lubbock Plant
Precision Metal Components Segment. The Metal Bearing Components Segment is comprised of two manufacturing facilities in the eastern United States, manufacturing facilities located in Europe, namely, Kilkenny, Ireland; Eltmann, Germany; Pinerolo, Italy; Veenendaal, The Netherlands; and Kysucke Nove Mesto, Slovakia and our facility in China.
·Wellington Plant 1
·Wellington Plant 2
·Hamilton Plant
·Tempe Plant
All of the facilities in the Metal Bearing Components Segment are engaged in the production of precision balls, rollers, and metal retainers and automotive specialty products used primarily in the bearing industry. The Plastic and Rubber Components Segment is comprised of four facilities: two located in Lubbock, Texas, which represents the IMC business acquired in July 1999, and two facilities located in Danielson, Connecticut, which represents the Delta Rubber business acquired in February 2001. These facilities are engaged in the production of plastic injection molded products for the bearing, automotive, instrumentation and fiber optic markets and precision rubber bearing seals for the bearing, automotive, industrial, agricultural, and aerospace markets. The Precision Metal Components Segment is comprised of four facilities: three in Ohio and one in Arizona. These facilities are engaged in the production of highly engineered fluid control components and assemblies, shafts, and prismatic machined parts for the air conditioning, appliance, automotive, commercial refrigeration, and diesel engine industries.
The accounting policies of the segments are the same as those described in the summary of significant accounting policies. The Company evaluates segment performance based on profit or loss from operationssegment net income after income taxes. The Company accounts for inter-segment sales and transfers at current market prices. The Company did not have any individually material inter-segment transactions during 2007, 2006, or 2005.
NN, Inc.
Notes to Consolidated Financial Statements
December 31, 2007, 2006 2005 and 20042005
(In thousands, except per share data)
| | | Metal Bearing Components Segment | Precision Metal Components Segment | Plastic and Rubber Components Segment | All Other | Total |
December 31, 2007 | | December 31, 2007 | | | | |
| Net sales | | $ 303,059 | $ 67,384 | $ 50,851 | $ -- | $ 421,294 |
| Interest expense | | 67 | 2,646 | 960 | 2,700 | 6,373 |
| Depreciation and amortization | | 16,393 | 4,337 | 2,262 | 4 | 22,996 |
| Income tax expense (benefit) | | 9,452 | (820) | 1,255 | (3,465) | 6,422 |
| Segment net income (loss) | | 4,958 | (1,450) | 2,242 | (6,923) | (1,173) |
| Segment assets | | 238,276 | 53,422 | 51,997 | 6,383 | 350,078 |
| Expenditures for long- lived assets | | 15,634 | 1,541 | 1,681 | -- | 18,856 |
| | Metal Bearing Components Segment | Precision Metal Components Segment | Plastic and Rubber Components Segment | All Other | Total | | | | |
December 31, 2006 | | | | | | | | |
| Net sales | $272,299 | $ 4,722 | $ 53,304 | $ -- | $ 330,325 | $ 272,299 | $ 4,722 | $ 53,304 | $ -- | $ 330,325 |
| Interest expense | 45 | 240 | 960 | 2,738 | 3,983 | 45 | 240 | 960 | 2,738 | 3,983 |
| Depreciation & amortization | 14,783 | 345 | 2,324 | 40 | 17,492 | |
| Depreciation and amortization | | 14,783 | 345 | 2,324 | 40 | 17,492 |
| Income tax expense (benefit) | 10,681 | (336) | 1,547 | (3,370) | 8,522 | 10,681 | (336) | 1,547 | (3,370) | 8,522 |
| Segment profit (loss) | 18,331 | (598) | 2,695 | (5,993) | 14,435 | |
| Segment net income (loss) | | 18,331 | (598) | 2,695 | (5,993) | 14,435 |
| Segment assets | 233,051 | 53,535 | 51,836 | 4,279 | 342,701 | 233,051 | 53,535 | 51,836 | 4,279 | 342,701 |
| Expenditures for long- lived assets | 18,479 | 30 | 773 | -- | 19,282 | 18,479 | 30 | 773 | -- | 19,282 |
| | | | | | | | | |
December 31, 2005 | December 31, 2005 | | | | | December 31, 2005 | | | | |
| Net sales | $ 263,485 | $ -- | $ 57,902 | $ -- | $ 321,387 | $ 263,485 | $ -- | $ 57,902 | $ -- | $ 321,387 |
| Interest expense | 504 | -- | 966 | 2,307 | 3,777 | 504 | -- | 966 | 2,307 | 3,777 |
| Depreciation & amortization | 13,850 | -- | 2,481 | -- | 16,331 | |
| Depreciation and amortization | | 13,850 | -- | 2,481 | -- | 16,331 |
| Income tax expense (benefit) | 11,546 | -- | 975 | (2,769) | 9,752 | 11,546 | -- | 975 | (2,769) | 9,752 |
| Segment profit (loss) | 18,725 | -- | 1,673 | (5,386) | 15,012 | |
| Segment net income (loss) | | 18,725 | -- | 1,673 | (5,386) | 15,012 |
| Segment assets | 207,128 | -- | 55,741 | 6,786 | 269,655 | 207,128 | -- | 55,741 | 6,786 | 269,655 |
| Expenditures for long- lived assets | 16,003 | -- | 726 | -- | 16,729 | 16,003 | -- | 726 | -- | 16,729 |
| | | | | | |
December 31, 2004 | | | | | |
| Net sales | $ 252,365 | $ -- | $ 51,724 | $ -- | $ 304,089 | |
| Interest expense | 1,770 | -- | 967 | 1,292 | 4,029 | |
| Depreciation & amortization | 13,555 | -- | 2,578 | -- | 16,133 | |
| Income tax expense (benefit) | 8,019 | -- | (1,600) | (2,330) | 4,089 | |
| Segment profit (loss) | 9,517 | -- | 1,724 | (4,139) | 7,102 | |
| Segment assets | 221,332 | -- | 60,249 | 6,761 | 288,342 | |
| Expenditures for long- lived assets | 11,259 | -- | 903 | -- | 12,162 | |
Due to the large number of countries in which the Company sellswe sell our products, sales to external customers and long-lived assets utilized by the Companyus are reported in the following geographical regions:
| | | December 31, 2006 | | December 31, 2005 | | December 31, 2004 | December 31, 2007 | December 31, 2006 | December 31, 2005 |
| | | Sales | | Long-lived assets | | Sales | | Long-lived assets | | Sales | | Long-lived assets | Sales | Long-lived assets | Sales | Long-lived assets | Sales | Long-lived assets |
| | | | | | | | | | | | | | | | |
| United States | | $ 77,526 | | $ 54,617 | | $77,763 | | $31,821 | | $74,228 | | $ 34,945 | $ 137,140 | $ 51,363 | $ 77,526 | $ 54,617 | $ 77,763 | $ 31,821 |
| | | | | | | | | | | | | | | |
| Europe | | 194,359 | | 94,369 | | 185,786 | | 81,348 | | 181,224 | | 96,224 | 215,209 | 97,238 | 194,359 | 94,369 | 185,786 | 81,348 |
| | | | | | | | | | | | | | | |
| Asia | | 24,119 | | 7,461 | | 19,689 | | 5,660 | | 18,763 | | -- | 31,879 | 12,407 | 24,119 | 7,461 | 19,689 | 5,660 |
| | | | | | | | | | | | | | | |
| Canada | | 8,028 | | -- | | 8,835 | | -- | | 9,040 | | -- | 5,089 | -- | 8,028 | -- | 8,835 | -- |
| | | | | | | | | | | | | | | |
| Mexico | | 13,164 | | -- | | 12,223 | | -- | | 15,642 | | -- | 15,065 | -- | 13,164 | -- | 12,223 | -- |
| | | | | | | | | | | | | | | |
| South America/Other | | 13,129 | | -- | | 17,091 | | -- | | 5,192 | | -- | 16,912 | -- | 13,129 | -- | 17,091 | -- |
| | | | | | | | | | | | | | | |
| All foreign countries | | 252,799 | | 101,830 | | 243,624 | | 87,008 | | 229,861 | | 96,224 | 284,154 | 109,645 | 252,799 | 101,830 | 243,624 | 87,008 |
| | | | | | | | | | | | | | | |
| Total | | $ 330,325 | | $ 156,447 | | $ 321,387 | | $ 118,829 | | $ 304,089 | | $ 131,169 | $ 421,294 | $ 161,008 | $ 330,325 | $ 156,447 | $ 321,387 | $ 118,829 |
NN, Inc.
Notes to Consolidated Financial Statements
December 31, 2007, 2006 2005 and 20042005
(In thousands, except per share data)
Income before provision for income taxes for the years ended December 31, 2007, 2006 and 2005 and 2004 werewas as follows:
| | | Year ended December 31, |
| | | Year ended December 31, | 2007 | 2006 | 2005 |
| | | 2006 | | 2005 | | 2004 | |
| Income before provision for income taxes: | | | | | | | |
| United States | | $ 3,735 | | $ 6,227 | | $ (182) | $ 630 | $ 3,735 | $ 6,227 |
| Foreign | | 19,222 | | 18,537 | | 11,373 | 4,619 | 19,222 | 18,537 |
| Total | | $ 22,957 | | $ 24,764 | | $ 11,191 | $ 5,249 | $ 22,957 | $ 24,764 |
Total income tax expense (benefit) for the years ended December 31, 2007, 2006, 2005, and 20042005 were as follows:
| | Year ended December 31, |
| | 2007 | 2006 | 2005 |
| Current: | | | |
| U.S. Federal | $ -- | $ 3,035 | $ 2,815 |
| State | (18) | 201 | (78) |
| Non-U.S. | 7,623 | 6,670 | 7,689 |
| Total current expense | $ 7,605 | $ 9,906 | $ 10,426 |
| | 2006 | | 2005 | | 2004 | | |
| | | | | | | | |
| Current: | | | | | | | |
| Deferred: | | | |
| U.S. Federal | $ 3,035 | | $ 2,815 | | $ (2,785) | | $ 176 | $ (3,388) | $ (609) |
| State | 201 | | (78) | | 88 | | 271 | 17 | 303 |
| Valuation allowance | | 5,082 | 1,581 | -- |
| Non-U.S. | 6,670 | | 7,689 | | 3,532 | | (6,712) | 406 | (368) |
| Total current expense | $ 9,906 | | $ 10,426 | | $ 835 | | |
| Total deferred expense (income) | | (1,183) | (1,384) | (674) |
| | | | |
| Total expense | | $ 6,422 | $ 8,522 | $ 9,752 |
| Deferred: | | | | | | |
| U.S. Federal | $ (3,388) | | $ (609) | | $ 2,285 | |
| State | 17 | | 303 | | (46) | |
| Valuation allowance | 1,581 | | -- | | -- | |
| Non-U.S. | 406 | | (368) | | 1,015 | |
| Total deferred expense (income) | (1,384) | | (674) | | 3,254 | |
| | | | | | | |
| Total expense | $ 8,522 | | $ 9,752 | | $ 4,089 | |
NN, Inc.
Notes to Consolidated Financial Statements
December 31, 2006, 2005 and 2004
(In thousands, except per share data)
A reconciliation of taxes based on the U.S. federal statutory rate of 35%34%, 34%,35% and 34% for the years ended December 31, 2007, 2006, 2005, and 20042005 is summarized as follows:
| | | Year ended December 31, |
| | | Year ended December 31, | 2007 | 2006 | 2005 |
| | | 2006 | | 2005 | | 2004 | |
| Income taxes at the federal statutory rate | | $ 8,034 | | $ 8,420 | | $ 3,805 | $ 1,785 | $ 8,034 | $ 8,420 |
| Lowering of U.S. effective rate from 35% to 34% | | (314) | 219 | -- |
| Impact of incentive stock options | | 228 | 63 | -- |
| Increase in valuation allowance | | 5,082 | -- |
| Reduction in net deferred tax liabilities in Italy due to lowering of statutory tax rates | | (1,050) | -- |
| State income taxes, net of federal benefit | | 143 | | 225 | | 42 | (12) | 143 | 225 |
| Non-US earnings taxed at different rates | | 353 | | 1,019 | | 562 | |
| Non-U.S. earnings taxed at different rates | | 390 | 353 | 1,019 |
| Other, net | | (8) | | 88 | | (320) | 313 | (290) | 88 |
| | | | | | | | |
| | | $ 8,522 | | $ 9,752 | | $ 4,089 | $ 6,422 | $ 8,522 | $ 9,752 |
NN, Inc.
Notes to Consolidated Financial Statements
December 31, 2007, 2006 and 2005
(In thousands, except per share data)
The tax effects of the temporary differences are as follows:
| | | Year ended December 31, |
| | | 2007 | 2006 |
| | | 2006 | | 2005 | | |
| Deferred income tax liability | | | | | | |
| Tax in excess of book depreciation | | $ 11,073 | | $ 11,723 | | $ 13,199 | $ 11,073 |
| Duty drawback receivable | | -- | | 70 | | |
| Goodwill | | 6,902 | | 5,109 | | 4,969 | 6,902 |
| Flow through loss from pass through entity | | -- | | 729 | | |
| Allowance for bad debts | | -- | | 5 | | 86 | -- |
| Other deferred tax liabilities | | 291 | | 351 | | 428 | 291 |
| | | | | | | | |
| Gross deferred income tax liability | | 18,266 | | 17,987 | | 18,682 | 18,266 |
| | | | | | | |
| Deferred income tax assets | | | | | | |
| Inventories | | 508 | | 557 | | 385 | 508 |
| Allowance for bad debts | | 16 | | -- | | -- | 16 |
| Pension/personnel accruals | | 485 | | 1,014 | | |
| Pension/Personnel accruals | | 986 | 485 |
| Environmental provision | | 408 | | -- | | 441 | 408 |
| Net operating loss carry forwards | | 912 | | 1,188 | | |
| Net operating loss carryforwards | | 3,149 | 912 |
| Foreign tax credits | | 1,842 | | 460 | | 3,244 | 3,423 |
| Other deferred tax assets | | 1,077 | | 366 | | 125 | 1,077 |
| Gross deferred income tax assets | | 5,248 | | 3,585 | | 8,330 | 6,829 |
| | | | | | | |
| Valuation allowance on deferred tax assets | | (6,663) | (1,581) |
| Net deferred income tax assets | | 1,667 | 5,248 |
| | | |
| Net deferred income tax liability | | $ 13,018 | | $ 14,402 | | $ 17,015 | $ 13,018 |
The net operating loss carry forwards are composed of net operating losses in Germany, Slovakia, and China for which full valuation allowances have not been recorded as of December 31, 2006,2007, as it is management'smanagement’s judgment that allthe resulting tax benefits are not realizable. According to German law, there are not any time limitations on carrying forward the $1,338$7,785 in net operating losses of our German subsidiary. Slovakian net operating losses of $41, $901, $641, $236 and $236$1,054 expire in 2008, 2009, 2010, 2011, and 2011,2012, respectively. The China net operating losses of $88, $814, $2,163 and $2,163$2,037 expire in 2009, 2010, 2011, and 2011, respectively.2012, respectively and have a effective tax rate of 0% as these losses will be applied to income during our tax holiday once profitability is achieved.
The foreign tax credits shown above are reported netrelate to profits of a valuation reserve based on an estimate ofcertain foreign subsidiaries that were taxed as deemed dividends. These credits represent the amountforeign taxes paid by these subsidiaries at higher effective rates that canwill be utilized byused to offset future foreign source income. A valuation allowance was placed against these credits based on estimates of future foreign source income to be generated that these credits can be used to offset. The gross amountvaluation allowance with be periodically reviewed as our estimates of thefuture foreign source income are amended based on actual foreign source income recognized in our tax credits are $3,423returns and the valuation reserve is $1,581.future changes in foreign source income.
NN, Inc.
Notes to Consolidated Financial Statements
December 31, 2006, 2005 and 2004
(In thousands, except per share data)
AlthoughAs realization of deferred tax assets is not assured, management has placed valuation allowances against deferred tax assets it believes thatare not recoverable. For the remainder management believes it is more likely than not that all of thethose net deferred tax assets presented above will be realized. However, the amount of the deferred tax assets considered realizable could be reduced based on changing conditions.
As of December 31, 2006, all of the Company’sCompany's foreign earnings have been previously taxed in the U.S. due to the application of IRC Sec. 956. Accordingly, no deferred taxes have been provided for undistributed earnings. The Company expects to reinvest future earnings indefinitely in operations and expansions outside the U.S. and does not expect such earnings to become subject to U.S. taxation in the foreseeable future. If such earnings were distributed beyond the amount for which taxes have been provided, foreign tax credits would substantially offset any incremental U.S. tax liability. A deferred tax liability will be recognized when the Company expects that it will recover these undistributed earnings in a taxable manner, such as through the receipt of dividends or sale of the investments. It is not practicable to determine the U.S. income tax liability, if any, that would be payable if such earnings, were not reinvested indefinitely.
NN, Inc.
Notes to Consolidated Financial Statements
December 31, 2007, 2006 and 2005
(In thousands, except per share data)
The Company adopted the provisions of FIN 48 on January 1, 2007. As a result of the implementation of FIN 48, the Company recognized a $600 increase in our income tax liabilities and a corresponding reduction in beginning retained earnings.
As of the date of adoption, the total unrecognized benefits were approximately $879, all of which, if recognized, would affect the effective tax rate. A reconciliation of the beginning and ending amounts of unrecognized tax benefits, excluding interest and penalties is as follows:
| Balance at January 1, 2007 | $ 879 |
| Additions based on tax positions related to the current year | -- |
| Additions for tax positions of prior years | 386 |
| Reductions for tax positions of prior years | (220) |
| Settlements | -- |
| Balance at December 31, 2007 | $ 1,045 |
As of December 31, 2006,2007, the $1,045 of unrecognized tax benefits would, if recognized, impact the Company’s effective tax rate.
Interest and penalties related to federal, state, and foreign income tax matters are recorded as a component of the provision for income taxes in our statements of income. As of January 1, 2007, we had accrued $609 in both U.S. and foreign interest and penalties. During 2007, we accrued an additional $48 in foreign interest and penalties resulting in an accrued balance of $657of interest and penalties as of December 31, 2007.
The Company or its subsidiaries file income tax returns in the U.S. federal jurisdiction, and in various states and foreign jurisdictions. With few exceptions, the Company hasis no longer subject to federal, state and local income tax examinations by tax authorities for years before 2003. The Company is no longer subject to non-U.S. income tax examinations within various European Union countries for years before 2002. We do not provided taxes on unremitted foreign earnings from certain foreign affiliates that are intendedforesee any changes to be indefinitely reinvested in finance operations and expansion outsideour unrecognized tax benefits within the United States. If such earnings were distributed beyond the amount for which taxes have been provided, foreign tax credits would substantially offset any incremental U.S. tax liability.next twelve months.
| | | Year ended December 31, | Year ended December 31, |
| | | 2006 | | 2005 | | 2004 | 2007 | 2006 | 2005 |
| Net income | | $ 14,435 | | $ 15,012 | | $ 7,102 | |
| | | |
| Net income (loss) | | $ (1,173) | $ 14,435 | $ 15,012 |
| | | | | | | | |
| Weighted average shares outstanding | | 17,125 | | 17,004 | | 16,728 | 16,749 | 17,125 | 17,004 |
| Effective of dilutive stock options | | 226 | | 189 | | 423 | -- | 226 | 189 |
| | | | | | | | |
| Dilutive shares outstanding | | 17,351 | | 17,193 | | 17,151 | 16,749 | 17,351 | 17,193 |
| | | | | | | | |
| Basic net income per share | | $ 0.84 | | $ 0.88 | | $ 0.42 | $ (0.07) | $ 0.84 | $ 0.88 |
| | | | | | | | |
| Diluted net income per share | | $ 0.83 | | $ 0.87 | | $ 0.41 | $ (0.07) | $ 0.83 | $ 0.87 |
NN, Inc.
Notes to Consolidated Financial Statements
December 31, 2007, 2006 and 2005
(In thousands, except per share data)
Excluded from the shares outstanding for the years ended December 31, 2007, 2006, and 2005 were 821, 301 and 344 anti-dilutive options, respectively, which had an exercise priceprices of $11.29 to $12.62 for the year ended December 31, 2007 and $12.62 per share duringfor the years ended December 31, 2006 and 2005. In addition in 2006, there were 172 options that were anti-dilutive due to the large amount of unrecognized compensation expense associated with these options.
NN, Inc.
Notes to Consolidated Financial Statements
December 31, 2006, 2005 and 2004
(In thousands, except per share data)
The Company has operating lease commitments for machinery, office equipment, vehicles, manufacturing and office space which expire on varying dates. Rent expense for 2007, 2006, and 2005 was $4,908, $2,617, and 2004 was $2,617, $2,422, and $3,203, respectively. The following is a schedule by year of future minimum lease payments as of December 31, 20062007 under operating leases that have initial or remaining noncancelablenon cancelable lease terms in excess of one year.
& #160; Year ended December 31, | |
| 2007 | | $ 3,890 | |
| Year ended December 31, | | Year ended December 31, |
| | | |
| 2008 | | 3,632 | $ 4,333 |
| 2009 | | 3,076 | 3,437 |
| 2010 | | 2,626 | 2,823 |
| 2011 | | 2,327 | 2,420 |
| 2012 | | 1,170 |
| Thereafter | | 8,593 | 9,131 |
| | | | |
| Total minimum lease payments | | $ 24,144 | $ 23,314 |
The Kilkenny operationPlant of the Metal Bearing Components Segment has received certain grants from the Ireland government. These grants are based upon the Kilkenny Ireland facilityPlant hiring and retention of certain employment levels by the measurement date. At December 31, 2006,2007, actual employment levels are less than those required by certain grant covenants. During 2003,The potential impact to the grant agreement measurement date was amended to extend the measurement date. The Company anticipates that, if necessary, the grant agreement measurement date and /or employment level thresholds would again be adjusted. Effects of this not occurring areis estimated not to be material toapproximately $370. However, management believes as long as we maintain our operations in Ireland at current levels there is a remote chance this amount will ever be demanded by the consolidated financial statements.Irish government. As of December 31, 20062007 and 20052006, the grant obligation is recorded as a component of other non-current liabilities in the amount of $405$374 and $423,$405, respectively.
The Metal Bearing Components Segment is finalizinghas a supply contract with Ascometal France (“Ascometal”) for the purchase of steel in Europe that covers the years 2007, 2008 and 2009. The contract will automatically renew annually unless formal notice is sent by either party one year in advance. The percentage of steel purchased for European operations granted to Ascometal under the contract is 70% or approximately $40,000.$53,300. The contract, among other things, stipulates that Ascometal achieve certain performance targets related to quality, reliability and service and the percentage granted can be reduced if those targets are not met by the vendor. The contract provisions include annual price adjustments based upon published indexes in addition to annual productivity improvement factor multiples.indexes. In 2006,2007, we purchased approximately $39,360$47,800 under a similar contract that expired on December 31, 2005 and that automatically renewed for 2006.the contract.
On March 20, 2006, we, as well as numerous other parties, received correspondence from the Environmental Protection Agency ("EPA"(“EPA”) requesting information regarding a former waste recycling vendor previously used by us. The vendor has since ceased operations and the EPA is investigating the clean up of the site or sites used by the vendor. The Company has contributed to an escrow fund along with 42 other potentially responsible parties for the purpose of investigating and addressing the environmental issues at the facility. The Company’s contribution to the account was $23. A Remedial Investigation and Risk Assessment report funded by the escrow fund was submitted to the EPA in December 2007. As of the date of this report, we do not know whether we have any liability beyond the contribution to the escrow account mentioned earlier, related to this vendor'svendor’s actions, or the estimatable range for any potential liability. The Company believes its contribution to the remediation of the site, if any, would be approximately 1.083% or less of the volume of waste sent to the facility and the Company asserts that its waste was non-hazardous.
NN, Inc.
Notes to Consolidated Financial Statements
December 31, 2007, 2006 2005 and 20042005
(In thousands, except per share data)
On June 20, 2007, we, as well as numerous other parties, received correspondence from the New York State Department of Environmental Conservation notifying us that we have been named as a potentially responsible party for the potential clean up of a former waste recycling facility. As of the date of this report, we estimate our maximum exposure to be ten thousand dollars. The maximum exposure is based on the amount of gallons we sent to the waste facility multiplied by the proposed charge per gallon as determined by the potentially responsible parties.
The following summarizes the unaudited quarterly results of operations for the years ended December 31, 20062007 and 2005.2006.
| | | Year ended December 31, 2007 |
| | Year ended December 31, 2006 | March 31 | June 30 | Sept. 30 | Dec. 31 |
| | March 31 | | June 30 | | Sept. 30 | | Dec. 31 | | |
| Net sales | $ 86,017 | | $ 83,554 | | $ 74,870 | | $ 85,884 | $ 107,944 | $ 107,302 | $ 99,021 | $ 107,027 |
| Income from operations | 8,905 | | 7,157 | | 4,807 | | 5,023 | |
| Net income | 5,262 | | 3,453 | | 2,633 | | 3,087 | |
| Basic net income per share | 0.31 | | 0.20 | | 0.15 | | 0.18 | |
| Dilutive net income per share | 0.30 | | 0.20 | | 0.15 | | 0.18 | |
| Income (loss) from operations | | 7,920 | (7,173) | 3,212 | 7,277 |
| Net income (loss) | | 3,755 | (10,365) | 398 | 5,039 |
| Basic net income (loss) per share | | 0.22 | (0.62) | 0.02 | 0.31 |
| Dilutive net income (loss) per share | | 0.22 | (0.62) | 0.02 | 0.31 |
| Weighted average shares outstanding: | | | | | | | | | |
| Basic number of shares | 17,152 | | 17,157 | | 17,105 | | 16,941 | 16,813 | 16,815 | 16,765 | 16,159 |
| Effect of dilutive stock options | 224 | | 212 | | 234 | | 200 | 220 | -- | 139 | 121 |
| | | | | | | | | | |
| Diluted number of shares | 17,376 | | 17,369 | | 17,339 | | 17,141 | 17,033 | 16,815 | 16,904 | 16,280 |
| Year ended December 31, 2005
|
| | Year ended December 31, 2006 |
| | | | | |
| | March 31 | June 30 | Sept. 30 | Dec. 31 |
| | | | | |
| Net sales | $ 86,017 | $ 83,554 | $ 74,870 | $ 85,884 |
| Income from operations | 8,905 | 7,157 | 4,807 | 5,023 |
| Net income | 5,262 | 3,453 | 2,633 | 3,087 |
| Basic net income per share | 0.31 | 0.20 | 0.15 | 0.18 |
| Dilutive net income per share | 0.30 | 0.20 | 0.15 | 0.18 |
| Weighted average shares outstanding: | | | | |
| Basic number of shares | 17,152 | 17,157 | 17,105 | 16,941 |
| Effect of dilutive stock options | 224 | 212 | 234 | 200 |
| | | | | |
| Diluted number of shares | 17,376 | 17,369 | 17,339 | 17,141 |
| | March 31 | | June 30 | | Sept. 30 | | Dec. 31 |
| Net sales | $ 86,715 | | $ 83,787 | | $ 74,998 | | $ 75,887 |
| Income from operations | 7,387 | | 6,353 | | 5,643 | | 8,505 |
| Net income | 4,023 | | 3,312 | | 2,557 | | 5,120 |
| Basic net income per share | 0.24 | | 0.20 | | 0.15 | | 0.30 |
| Dilutive net income per share | 0.23 | | 0.19 | | 0.15 | | 0.30 |
Weighted average shares outstanding: | | | | | | | |
| Basic number of shares | 16,889 | | 16,971 | | 17,191 | | 17,206 |
| Effect of dilutive stock options | 372 | | 357 | | 331 | | 141 |
| | | | | | | | |
| Diluted number of shares | 17,261 | | 17,328 | | 17,522 | | 17,347 |
NN, Inc.
Notes to Consolidated Financial Statements
December 31, 2007, 2006 and 2005
(In thousands, except per share data)
The third quarter of 2007 included an accrual of $1,272 ($1,196 after tax) for cash restructuring charges related to the Metal Bearing Components Segment restructuring (See Note 3). During the fourth quarter of 2007, $1,062 $(1,062 after tax) of these restructuring charges was reversed.
The second quarter of 2007 included $13,366 ($12,623 after tax) in non-cash charges within our Metal Bearing Components Segment related to impairment of goodwill and fixed assets to levels supported by projected cash flows after restructuring activity within the segment (See Note 3).
The fourth quarter of 2006 included one month of Whirlaway Corporation with sales of $4,722 and a net loss of $598 due primarily to one time purchase accounting adjustments of $385, net of tax, resulting from increasing the inventory value from cost to fair value.
The first quarter results in 2006 include a net gain resulting from a $770 after-tax gain on the sales of excess land less a loss on disposal of excess machinery at ourthe Pinerolo Italy facility. Plant.
Fourth quarter results in 2005 include a pre-tax gain on the sale of excess land at our Veenendaal, The Netherlands facility of $432. This transaction resulted in an after-tax gain of approximately $295.
NN, Inc.
18) Notes to Consolidated Financial Statements
December 31, 2006, 2005 and 2004
(In thousands, except per share data)
Management believes the fair value of financial instruments approximate their carrying value due to the short maturity of these instruments or in the case of the Company’s variable rate debt, due to the variable interest rates. The fair value of the Company’s fixed rate long-term borrowings are estimated using a discounted cash flow analysis based on the Company’s current incremental borrowing rates for similar types of borrowing arrangements. The carrying amounts and fair values of the Company's long-term debt are as follows:
The carrying amounts and fair values of the Company’s long-term debt are as follows:in the table below:
| | | December 31, 2007 | December 31, 2006 |
| | December 31, 2006 | | December 31, 2005 | Carrying Amount | Fair Value | Carrying Amount | Fair Value |
| | Carrying Amount | | Fair Value | | Carrying Amount | | Fair Value | | |
| Variable rate long-term debt | $39,466 | | $39,466 | | $ 17,900 | | $ 17,900 | $ 70,476 | $ 70,476 | $ 39,466 |
| Fixed rate long-term debt | 42,096 | | 39,941 | | 40,000 | | 38,739 | 41,568 | 40,222 | 42,096 | 39,941 |
At December 31, 20062007 and 2005 ,2006, the Company has included inadded to accumulated other comprehensive income unrealized income due to foreign currency translation of $15,743$11,764 and $4,121.$15,743. Income taxes on the foreign currency translation adjustment in other comprehensive income were not recognized because the earnings are intended to be indefinitely reinvested in those operations.
Also included inadded to accumulated other comprehensive income as of December 31, 20052007 was additional minimuman actuarial gain of from our pension liability, cost, net of tax of $724.$656. Included in accumulated other comprehensive income as of December 31, 2006 was an adjustment to initially apply SFAS 158 and record the unrecognized actuarialnet loss that has not been recognized as a component of pension income of $394, net of tax.tax . The additional minimum liability that made up a portion of the 2005 balance was eliminated first by the plan curtailment and then eliminated under adoption of SFAS 158. (See Note 9)
20)Common Stock Repurchase
During the first quarter of 2006, the Company'sCompany’s Board of Directors authorized a stock repurchase program under which the Company iswas authorized to repurchase up to $10 million in common stock of the Company, during the subsequent 18 months in the open market or in private transactions, in accordance with applicable laws and regulations. This amount represented approximately 5% of the Company'sCompany’s outstanding stock at the date of authorization. During the year ended December 31, 2006,2007, the Company repurchased 463under this program approximately 211 shares at an approximate average cost of $11.39$10.26 a share for a total of $5,273. These$2,166. This program expired September 13, 2007 with a total of approximately 674 shares have been retiredbeing purchased totaling $7,441.
NN, Inc.
Notes to Consolidated Financial Statements
December 31, 2007, 2006 and were recorded as2005
(In thousands, except per share data)
In August 2007, a new share repurchase program was established for a period of one year beginning on September 13, 2007, and the amount approved for purchase, from this date until the expiration of the program, was $25 million worth of shares to be purchased in the open market from time to time in accordance with applicable laws and market regulations. During the year ended December 31, 2007, the Company repurchased approximately 797 shares under this program at an offset to additional paid in capital.average cost of $9.53 per share for a total of $7,556.
The total of all share repurchases during the year ended December 31, 2007 was approximately 1,008 shares for $9,722.
21) Related Party Transactions
With the acquisition of Whirlaway on November 30, 2006, the Company incurred a $21,305 note payable to the former shareholder of Whirlaway who is now an employeeofficer of the Company. The Company remitted $18,638 to the former sole shareholder of Whirlaway to partially repay the related party note payable. The remainder was related to a tax indemnity that was initially recorded but subsequently eliminated from the purchase price and note payable with a corresponding reduction to goodwill. Additionally, on November 30, 2006, the Company entered into operating leases covering two of the Whirlaway manufacturing facilities with a company owedowned by the former shareholder of Whirlaway who is now an employeeofficer of the Company. The terms of the leases are at prevailing market rates for the rental market in which the facilities are located.company. The rent payments in 2007 and 2006 to this related party were $644 and $50. The total future rent payments will be $3,217$2,576 over 54 years or $644 per year.
22) Subsequent Events.
Subsequent to the year ended December 31, 2006, the Company remitted $18,638 to the former shareholder of Whirlaway to partially pay-off the related party note payable. The payment was financed under our $90 million credit facility.
In January 2007, we entered into a two-year supply agreement with Schaeffler Group (INA) effective as of July 1, 2006 that replaced the agreement that expired on June 30, 2006.
NN, Inc.
Notes to Consolidated Financial Statements
December 31, 2007, 2006 2005 and 20042005
(In thousands, except per share data)
Item 9. Changes in and Disagreements with Accountants on Accounting and Financial Disclosure
None.
Conclusion Regarding the Effectiveness of Disclosure Controls and Procedures
UnderThe Company's management, under the supervision and with the participation of the Company’s management, including its Chief Executive Officer and Chief Financial Officer, the Company conducted an evaluation of itsthe effectiveness of the design and operation of the Company's disclosure controls and procedures and internal control over financial reporting as such term is defined under Rule l3a-15(e) promulgated under the Securities Exchange Act of 1934, as amended (the “Exchange Act”"Exchange Act"). Based on this evaluation, the Chief Executive Officer and the Chief Financial Officer concluded that the Company’sCompany's disclosure controls and procedures were not effective as of December 31, 2006,2007, the end of the period covered by this annual report.report on Form 10-K, due to the existence of the material weakness described below.
Management’sManagement's Report on Internal Control Over Financial Reporting
The management of NN, Inc. is responsible for establishing and maintaining adequate internal control over financial reporting, as such term is defined in Exchange Act Rule 13a-15(f). UnderManagement, under the supervision and with the participation of management, including the Company’s Chief Executive Officer and Chief Financial Officer, conducted an evaluation of the effectiveness of the Company’sCompany's internal control over financial reporting was conducted based on the framework in Internal Control- Integrated Framework issued by the Committee of Sponsoring Organizations of the Treadway Commission (“COSO”("COSO"). Based on thatits evaluation, under the framework in Internal Control- Integrated Framework issued by the COSO, the Company’s management concluded that the Company’sCompany's internal control over financial reporting was not effective as of December 31, 2006.2007 due to the existence of a material weakness discussed below.
A material weakness is a deficiency, or a combination of deficiencies, in internal control over financial reporting, such that there is a reasonable possibility that a material misstatement of the annual or interim financial statements will not be prevented or detected on a timely basis.
Management’s assessment of the effectiveness of the Company’sThe following material weakness was identified in our internal control over financial reporting as of December 31, 20062007. The Company did not maintain effective controls over the accounting for the impairment of customer intangible assets. Specifically, the Company did not maintain effective controls to ensure that when circumstances indicate the carrying value of intangible assets may not be recoverable these assets are appropriately grouped at the lowest level for which identifiable cash flows are largely independent of the cash flows of other assets and liabilities in accordance with generally accepted accounting principles. This control deficiency resulted in the restatement of the interim consolidated financial statements for the second and third quarters of 2007 affecting depreciation and amortization expense, restructuring and impairment charges and intangible assets and other assets. Further, this control deficiency could result in misstatements of the aforementioned accounts that would result in a material misstatement of the annual or interim consolidated financial statements that would not be prevented or detected.
The effectiveness of our internal control over financial reporting as of December 31, 2007 has been audited by PricewaterhouseCoopers LLP, an independent registered public accounting firm, as stated in their report which is included herein.appears under item 8 of this filing.
Remediation of Material Weakness
Item 9B.Management has determined that, as of the date of this filing, the material weakness in our internal control over financial reporting with respect to accounting for the impairment of customer intangible assets has been remediated. Management's remediation efforts focused on applying a correct interpretation of SFAS 144, Accounting for the Impairment or Disposal of Long-Lived Assets, Other Informationin evaluating whether the Company's intangible assets are impaired.
NoneChanges in Internal Control over Financial Reporting
There were no changes in the Company's internal control over financial reporting during the quarter ended December 31, 2007 that have materially affected, or are reasonably likely to materially affect, the Company's internal control over financial reporting.
NN, Inc.
Notes to Consolidated Financial Statements
December 31, 2007, 2006 and 2005
(In thousands, except per share data)
Part IIIItem 9B. Other Information
None
Item 10.Part III
| Directors and Executive Officers of the Registrant
|
The information required by this item of Form 10-K concerning the Company’sCompany's directors is contained in the sections entitled “Information"Information about the Directors”Directors" and “Beneficial"Beneficial Ownership of Common Stock”Stock" of the Company’sCompany's definitive Proxy Statement to be filed with the Securities and Exchange Commission within 120 days after December 31, 2006,2007, in accordance with General Instruction G to Form 10-K, is hereby incorporated herein by reference.
Code of Ethics. Our Code of Ethics (the “Code”) was approved by our Board on November 6, 2003. The Code is applicable to all officers, directors and employees. The Code is posted on our website at http://www.nnbr.com. We will satisfy any disclosure requirements under Item 10 of Form 8-K regarding an amendment to, or waiver from, any provision of the Code with respect to our principal executive officer, principal financial officer, principal accounting officer and persons performing similar functions by disclosing the nature of such amendment or waiver on our website or in a report on Form 8-K.
The information required by Item 402 of Regulation S-K is contained in the sections entitled “Information"Information about the Directors -- Compensation of Directors”Directors" and “Executive Compensation”"Executive Compensation" of the Company’sCompany's definitive Proxy Statement and, in accordance with General Instruction G to Form 10-K, is hereby incorporated herein by reference.
Item 12.
| Item 12. Security Ownership of Certain Beneficial Owners and Management and Related Stockholder Matters |
The information required by Items 201(d) and 403 of Regulation S-K is contained in the section entitled “Beneficial"Beneficial Ownership of Common Stock”Stock" of the Company’sCompany's definitive Proxy Statement and, in accordance with General Instruction G to Form 10-K, is hereby incorporated herein by reference.
Information required by Item 201 (d) of Regulations S-K concerning the Company’s equity compensation plans is set forth in the table below:
Table of Equity Compensation Plan Information
(In (in thousands)
| Plan Category | Number of securities to be issued upon exercise of outstanding options, warrants and rights (a) | Weighted -average exercise price of outstanding options, warrants and rights (b) | Number of securities remaining available for future issuance under equity compensation plans (excluding securities reflected in column (a)) (c) | Number of securities to be issued upon exercise of outstanding options, warrants and rights (a) | Weighted –average exercise price of outstanding options, warrants and rights (b) | Number of securities remaining available for future issuance under equity compensation plans (excluding securities reflected in column (a)) (c) |
Equity compensation plans approved by security holders | 1,452 | $9.81 | 808 | 1,651 | $10.08 | 564 |
Equity compensation plans not approved by security holders | -- | -- | -- | -- | -- | -- |
| Total | 1,452 | $9.81 | 808 | 1,651 | $10.08 | 564 |
Item 13.
| Certain Relationships and Related Transactions
|
With the acquisition of Whirlaway on November 30, 2006, wencurredthe company incurred a $21.3 million short-term note payable to the former shareholder of Whirlaway, Thomas Zupan, who is now Vice President -– President of Whirlaway Corporation. As of December 31, 2007 the Company has fully satisfied this note. During 2007, we paid $18.6 million to Mr. Zupan and $2.7 million was determined to be not required and the note payable was reduced by thus amount. Additionally, on November 30, 2006, wethe company entered into operating leases covering two of the Whirlaway manufacturing facilities with a company owed by Mr. Zupan. The terms of the leases are at prevailing market rates for the rental market in which the facilities are located. The rent payments in 2007 and 2006 to this related party were $ 0.6 million and $0.1 million. The total future rent payments as of December 31, 2007 will be $3.2$2.6 million over 54 years or approximately $0.6 million per year.
Item 14.
| Principal Accounting Fees and Services
|
Information regarding director independence is contained in a section entitled “Information about the Directors” of the Company’s definitive Proxy Statement and, in accordance with General Instruction G to Form 10-K, is hereby incorporated herein by reference.
Information required by this item of Form 10-K concerning the Company’s Accounting’ Feesaccounting fees and Servicesservices is contained in the section entitled “Fees Paid to Independent Registered Public Accounting Firm” of the Company’s definitive Proxy Statement and, in accordance with General Instruction G to Form 10-K, is hereby incorporated herein by reference.
Part IV
Item 15. Part IV
| Exhibits, Financial Statement Schedules
|
(a) List of Documents Filed as Part of this Report
1. Financial Statements
The financial statements of the Company filed as part of this Annual Report on Form 10-K begins on the following pages hereof:
Page
Report of Independent Registered Public Accounting Firm for the years ended December 31, 2006, 2005, and 2004............................................................. 31....................................................................................................................................... 34
Consolidated Balance Sheets at December 31, 20062007 and 2005...........................................................................................................................................................332006.................................................................................................................................... 35
Consolidated Statements of Income and Comprehensive Income for the years ended December 31, 2007, 2006, and 2005 and 2004.....................................................34........................... 36
Consolidated Statements of Changes in Stockholders’ Equity for the years ended December 31, 2007, 2006, and 2005 and 2004......................................................... 35................................ 37
Consolidated Statements of Cash Flows for the years ended December 31, 2007, 2006, and 2005 and 2004.............................................................................................. 36..................................................................... 38
Notes to Consolidated Financial Statements.......................................................................................................................................................................................37Statements ............................................................................................................................................................. 39
2. Financial Statement Schedules
Not applicable.applicable
3. See Index to Exhibits (attached hereto)
(b) Exhibits: See Index to Exhibits (attached hereto).
The Company will provide without charge to any person, upon the written request of such person, a copy of any of the Exhibits to this Form 10-K.
(c) Not Applicable
Pursuant to the requirements of Section 13 or 15(d) of the Securities Exchange Act of 1934, the registrant has duly caused this report to be signed on its behalf by the undersigned, thereunto duly authorized.
By: //s/ Roderick R. Baty
Roderick R. Baty
Chairman of the Board,
Chief Executive Officer and President
Dated: March 15, 200717, 2008
Pursuant to the requirements of the Securities Exchange Act of 1934, this report has been signed below by the following persons on behalf of the Registrant and in the capacities and on the date indicated.
Name and Signature | Title | Date |
/s/ RODERICK R. BATY | Chairman of the Board, Chief Executive Officer and President | March 15, 2007 |
| /s/ roderick r. baty | March 17, 2008 | |
| Roderick R. Baty | |
| | | |
/s/ JAMES H. DORTONjames h. dorton | Vice President-Corporate Development and Chief Financial Officer | March 15, 200717, 2008 |
| James H. Dorton | |
| | | |
/s/ WILLIAM C. KELLY, JR.william c. kelly jr. | Vice President-Chief Administrative Officer, Secretary and Treasurer | March 15, 200717, 2008 |
| William C. Kelly, Jr. | |
| | | |
/s/ G. RONALD MORRISThomas c. burwell, Jr. | Corporate Controller | March 17, 2008 |
| Thomas C. Burwell, Jr. | | |
| | |
| /s/ g. ronald morris | Director | March 15, 200717, 2008 |
| G. Ronald Morris |
| | | |
/s/ MICHAEL E. WERNERmichael e. werner | Director | March 15, 200717, 2008 |
| Michael E. Werner |
| | | |
/s/ STEVEN T. WARSHAWsteven t. warshaw | Director | March 15, 200717, 2008 |
| Steven T. Warshaw |
| | | |
/s/ RICHARD G. FANELLIrichard g. fanelli | Director | March 15, 200717, 2008 |
| Richard G. Fanelli |
| | | |
/s/ ROBERT M. AIKEN, JR.robert m. aiken, jr. | Director | March 15, 200717, 2008 |
| Robert M. Aiken, Jr. |
| | 2.1 | Asset Purchase Agreement dated April 14, 2003 among SKF Holding Maatschappij Holland B.V., SKF B.V., NN, Inc. and NN Netherlands B.V. (incorporated by reference to Exhibit 2.1 of Form 8-K filed on May 16, 2003). |
| | |
| 3.1 | Restated Certificate of Incorporation of the CompanyCmopany (incorporated by reference to Exhibit 3.1 of the Company’sCompany's Registration Statement No. 333-89950 on Form S-3 filed June 6, 2002). |
| | |
| 3.2 | Restated By-Laws of the Company (incorporated by reference to Exhibit 3.2 of the Company’sCompany's Registration Statement No. 333-89950 on Form S-3 filed June 6, 2002) |
| | |
| 4.1 | The specimen stock certificate representing the Company’sCompany's Common Stock, par value $0.01 per share (incorporated by reference to Exhibit 4.1 of the Company’sCompany's Registration Statement No. 333-89950 on Form S-3 filed June 6, 2002) |
| | |
| 4.2 | Article IV, Article V (Sections 3 through 6), Article VI (Section 2) and Article VII (Sections 1 and 3) of the Restated Certificate of Incorporation of the Company (included in Exhibit 3.1) |
| | |
| 4.3 | Article II (Sections 7 and 12), Article III (Sections 2 and 15) and Article VI of the Restated By-Laws of the Company (included in Exhibit 3.2) |
| | |
| 10.1 | NN, Inc. Stock Incentive Plan and Form of Incentive Stock Option Agreement pursuant to the Plan (incorporated by reference to Exhibit 10.1 of the Company’s Registration Statement No. 333-89950 on Form S-3/A filed July 15, 2002)* |
| | |
| 10.2 | Amendment No. 1 to the NN, Inc. Stock Incentive Plan (incorporated by reference to Exhibit 4.6 of the Company’s Registration Statement No. 333-50934 on Form S-8 filed on November 30, 2000)* |
| |
| 10.3 | Amendment No. 2 to the NN, Inc. Stock Incentive Plan (incorporated by reference to Exhibit 4.7 of the Company’s Registration Statement No. 333-69588 on Form S-8 filed on September 18, 2001)* |
| |
| 10.4 | Amendment No. 3 to NN, Inc. Stock Incentive Plan as ratified by the shareholders on May 15, 2003 amending the Plan to permit the issuance of awards under the Plan to directors of the Company (incorporated by reference to Exhlibit 10-1 of the Company's Quarterly Report on Form 10-Q filed August 14, 2003)* |
| | |
| 10.5 | Form of Indemnification Agreement (incorporated by reference to Exhibit 10.6 of the Company’s Registration Statement No. 333-89950 on Form S-3/A filed July 15, 2002) |
| | |
| 10.6 | Form of Stock Option Agreement, dated December 7, 1998, between the Company and the non-employee directors of the Company (incorporated by reference to Exhibit 10.15 of the Company’s Annual Report on Form 10-K filed March 31, 1999)* |
| | |
| 10.7 | Elective Deferred Compensation Plan, dated February 26, 1999 (incorporated by reference to Exhibit 10.16 of the Company’s Annual Report on Form 10-K filed March 31, 1999)* |
| |
| 10.8 | NN, Inc. 2005 Stock Incentive Plan (incorporated by reference to the Company’sCompany's Form S-8 filed December 16, 2005)* |
| | |
| 10.9 | Executive Employment Agreement, dated August 21, 2006, between the Company and Roderick R. Baty (incorporated by reference to the Company’sCompany's Form 8-K filed August 24, 2006)* |
| |
| 10.10 | Executive Employment Agreement, dated August 21, 2006, between the Company and James H. Dorton (incorporated by reference to the Company’sCompany's Form 8-K filed August 24, 2006)* |
| |
| 10.11 | Executive Employment Agreement, dated August 21, 2006, between the Company and Nicola Trombetti (incorporated by reference to the Company’sCompany's Form 8-K filed August 24, 2006)* |
| |
| 10.12 | Executive Employment Agreement, dated August 21, 2006, between the Company and Thomas McKown (incorporated by reference to the Company’sCompany's Form 8-K filed August 24, 2006)* |
| |
| 10.13 | Executive Employment Agreement, dated August 21, 2006, between the Company and James Anderson (incorporated by reference to the Company’sCompany's Form 8-K filed August 24, 2006)* |
| |
| 10.14 | Executive Employment Agreement, dated August 21, 2006, between the Company and David M. Gilson (incorporated by reference to the Company’sCompany's Form 8-K filed October 3, 2006)* |
| |
| 10.15 | Executive Employment Agreement, dated August 21, 2006, between the Company and Thomas G. Zupan (incorporated by reference to the Company’sCompany's Form 8-K filed December 6, 2006)* |
| | |
| 10.16 | Executive Employment Agreement, dated August 21, 2006, between the Company and Frank T. Gentry (incorporated by reference to Company’sCompany's Current Report on Form 8-K filed August 24, 2006)* |
| | |
| 10.17 | Executive Employment Agreement, dated August 21, 2006, between the Company and Robert R. Sams (incorporated by reference to the Company’sCompany's Current Report on Form 8-K filed August 21, 2006)* |
| | |
| 10.18 | Executive Employment Agreement dated August 21, 2006, between the Company and William C. Kelly, Jr. (incorporated by reference to the Company’sCompany's Current Report on Form 8-K filed August 24, 2006)* |
| | |
| 10.19 | NN Euroball, ApS Shareholder Agreement dated April 6, 2000 among NN, Inc., AB SKF and FAG Kugelfischer Georg Shafer AGShaferAG (incorporated by reference to Exhibit 10.26 of the Company’sCompany's Annual Report on Form 10-K filed March 29, 2002) |
| | |
| 10.20 | Frame Supply Agreement between Euroball S.p.A., Kugelfertigung Eltmann GmbH, NN Euroball Ireland Ltd. and Ascometal effective January 1, 2002 (We have omitted certain information from the Agreement and filed it separately with the Securities and Exchange Commission pursuant to our request for confidential treatment under Rule 24b-2. We have identified the omitted confidential information by the following statement, “Confidential"Confidential portions of material have been omitted and filed separately with the Securities and Exchange Commission,”" as indicated throughout the document with an asterisk in brackets ([*])) (incorporated by reference to Exhibit 10.26 of the Company’sCompany's Annual Report on Form 10-K filed March 31, 2003) |
| | |
| 10.21 | Supply Agreement between NN Euroball ApS and AB SKF dated April 6, 2000. (We have omitted certain information from the Agreement and filed it separately with the Securities and Exchange Commission pursuant to our request for confidential treatment under Rule 24b-2. We have identified the omitted confidential information by the following statement, “Confidential"Confidential portions of material have been omitted and filed separately with the Securities and Exchange Commission, “" as indicated throughout the document with a n asterisk in brackets([*]) (incorporated by reference to Exhibit 10.3 of the Company’sCompany's Quarterly Report on Form 10-Q filed August 14, 2003) |
| | |
| 10.22 | Global Supply Agreement among NN, Inc., NN Netherlands B.V. and SKF Holding Maatschappij Holland B.V. dated April 14, 2003. (We have omitted certain information from the Agreement and filed it separately with the Securities and Exchange Commission pursuant to our request for confidential treatment under Rule 24b-2. We have identified the omitted confidential information by the following statement, “Confidential"Confidential portions of material have been omitted and filed separately with the Securities and Exchange Commission, “" as indicated throughout the document with a n asterisk in brackets([*])(incorporated by reference to Exhibit 10.4 of the Company’sCompany's Quarterly Report on Form 10-Q filed August 14, 2003) |
| | |
| 10.23 | Note Purchase Agreement dated April 22, 2004 among NN, Inc. as the Borrower and its Subsidiary Guarantors and the Prudential Insurance Company of America as Agent for the Purchase. (incorporated by reference to Exhibit 10.28 of the Company’sCompany's Annual Report on Form 10-K filed March 16, 2005) |
| |
| 10.24 | First Amendment to Note Purchase Agreement dated as of September 1, 2006, among NN, Inc. and The Prudential Insurance and Annuity Company, American Bankers Life Assurance Company of Florida, Inc., Farmers New World Life Insurance Company and Times Insurance Company (incorporated by reference to the Company’sCompany's Form 8-K filed September 27, 2006)* |
| |
| | 10.25 | Credit Agreement dated as of September 1, 2006 among NN, Inc., and the Lenders as named therein, KeyBank National Association as Lead Arranger, Book Runner and Administrative Agent, and AmSouth Bank, as Swing Line Lender (incorporated by reference to the Company’sCompany's Current Report on Form 8-K filed September 27, 2006) |
| 10.26 | Stock Purchase Agreement as of November 30, 2006, by and among NN, Inc. and Whirlaway Corp. and Thomas G. Zupan (incorporated by reference to the Company’s Form 8-K filed December 6, 2006)* |
21.1List of Subsidiaries of the Company.
23.1Consent of PricewaterhouseCoopers LLP, Independent Registered Public Accounting Firm
31.1Certification of Chief Executive Officer pursuant to Section 302 of Sarbanes-Oxley Act
31.2Certification of Chief Financial Officer pursuant to Section 302 of Sarbanes-Oxley Act
32.1Certification of Chief Executive Officer pursuant to Section 906 of Sarbanes-Oxley Act
32.2Certification of Chief Financial Officer pursuant to Section 906 of Sarbanes-Oxley Act
______________
*Management contract or compensatory plan or arrangement.