| ☒ | ANNUAL REPORT PURSUANT TO SECTION 13 OR 15(d) OF THE SECURITIES EXCHANGE ACT OF 1934 | ||||
For the fiscal year ended December 31, 2018
2020
| ☐ | TRANSITION REPORT PURSUANT TO SECTION 13 OR 15(d) OF THE SECURITIES EXCHANGE ACT OF 1934 | ||||
For the transition period from ______to ______
Commission File Number 1-12709

Tompkins Financial Corporation
(Exact name of registrant as specified in its charter)
| New York | 16-1482357 | |||||||
| (State or other jurisdiction of incorporation or organization) | (I.R.S. Employer Identification No.) | |||||||
118 E. Seneca Street, P.O. Box 460, Ithaca, NY
(Address of principal executive offices)
14851
(Zip Code)
Registrant’s telephone number, including area code: (888) 503-5753
Securities registered pursuant to Section 12(b) of the Act:
| Title of each class | Trading Symbol(s) | Name of each exchange on which registered | ||||||||
| Common Stock ($.10 Par Value Per Share) | TMP | NYSE American | ||||||||
Securities registered pursuant to Section 12(g) of the Act: None
Indicate by check mark if the registrant is a well-known seasoned issuer, as defined in Rule 405 of Securities Act. Yes ☐ No ☒.☒.
Indicate by check mark if the registrant is not required to file reports pursuant to Section 13 or Section 15(d) of the Act. Yes ☐ No ☒.☒.
Indicate by check mark whether the registrant: (1) has filed all reports required to be filed by Section 13 or 15(d) of the Securities Exchange Act of 1934 during the preceding 12 months (or for such shorter period that the registrant was required to file such reports) and (2) has been subject to such filing requirements for the past 90 days. Yes ☒ No ☐.☐.
Indicate by check mark whether the registrant has submitted electronically every Interactive Data File required to be submitted pursuant to Rule 405 of Regulation S-T (S232.405 of this chapter) during the preceding 12 months (or for such shorter period that the registrant was required to submit such files). Yes ☒ No ☐.
Indicate by check mark whether the registrant is a large accelerated filer, an accelerated filer, a nonaccelerated filer, a smaller reporting company, or an emerging growth company. See the definitions of "large accelerated filer", "accelerated filer", "nonaccelerated filer", "smaller reporting company", and "emerging growth company" in Rule 12b-2 of the Exchange Act.
| Large Accelerated Filer | ☒ | Accelerated Filer | ☐ | Nonaccelerated Filer | ☐ | Smaller Reporting Company | ☐ | Emerging Growth Company | ☐ | ||||||||||||||||||||
If an emerging growth company, indicate by check mark if the registrant has elected not to use the extended transition period for complying with any new or revised financial accounting standards provided pursuant to Section 13(a) of the Exchange Act. ☐
Indicate by check mark whether the registrant has filed a report on and attestation to its management's assessment of the effectiveness of its internal control over financial reporting under Section 404(b) of the Sarbanes-Oxley Act (15 U.S.C. 7262(b))by the registered public accounting firm that prepared or issued its audit report. ☒
Indicate by check mark whether the registrant is a shell company (as defined in Rule 12b-2 of the Exchange Act). Yes ☐ No ☒.☒.
The aggregate market value of the registrant’s common stock held by non-affiliates was $1.05 billion$780.7 million on June 30, 2018,2020, based on the closing sales price of a share of the registrant’s common stock, $.10 par value (the “Common Stock”), as reported on the NYSE American, on such date.
The number of shares of the registrant’s Common Stock outstanding as of February 22, 2019,18, 2021, was 15,316,20114,979,825 shares.
DOCUMENTS INCORPORATED BY REFERENCE
Portions of the registrant’s definitive Proxy Statement relating to its 20192021 Annual Meeting of stockholders, to be held on May 7, 2019,11, 2021, are incorporated by reference into Part III of this Form 10-K where indicated.
TOMPKINS FINANCIAL CORPORATION
Annual Report on Form 10-K
For the Fiscal Year Ended December 31, 20182020
Table of Contents
| Page | ||||||||
PART I
Item 1A. Risk Factors
Our Company's success is dependent on management's ability to identify and manage the risks inherent in our financial services business. These risks include credit risk, market risk, liquidity risk, operational risk, model risk, compliance and legal risk, and strategic and reputation risk. We list below the material risk factors we face. Any of these risks could result in a material adverse impact on our business, operating results, financial condition, liquidity, and cash flow, or may cause our results to vary materially from recent results, or from the results implied by any forward-looking statements made by us.
Risks Related to the COVID-19 Pandemic.
The ongoing COVID-19 pandemic and measures intended to prevent its spread have had, and likely will continue to have, a material adverse effect on our business, financial condition, liquidity, and results of operations. The nature and extent of such effects will depend on future developments, which are highly uncertain and are difficult to predict.
A novel coronavirus (COVID-19) was first reported in December 2019, and, in March 2020, the World Health Organization declared it a pandemic. On March 12, 2020, the President of the United States declared the COVID-19 outbreak in the United States a national emergency. The COVID-19 pandemic has caused significant economic stress in the United States and in the geographic markets that we serve. While distribution of a COVID-19 vaccine is underway in the U.S. and business and travel restrictions have partially eased within the primary geographic markets we serve, rates of transmission have fluctuated both nationally and in our geographic market. The extent to which COVID-19 and measures taken in response thereto impact our business, results of operations and financial condition will depend on future developments, which are highly uncertain and are difficult to predict. COVID-19, and governmental/regulatory measures taken in response thereto, have had and are likely to continue to have a material adverse impact on our results of operations and financial condition.
The COVID-19 pandemic, and the actions taken by federal, state and local authorities in response thereto, have resulted, and will likely continue to result in, an unprecedented slow-down in economic activity, including the following:
•As a result of the COVID-19 pandemic, the national unemployment rate and unemployment rates in our geographic markets dramatically increased during the first half of 2020, and while they have decreased from their peak levels, they are expected to remain elevated typical levels for the foreseeable future.
•Stock markets generally, and bank stocks in particular, have significantly fluctuated in value.
•The Federal Reserve Board has reduced the benchmark federal funds rate to a target range of 0% to 0.25%, and the yields on 10 and 30-year treasury notes remain at historic lows.
•Various state governments and federal agencies are requiring lenders to offer loan payment deferrals, forbearance and other relief to certain borrowers (e.g., waiving late payment and other fees) under certain circumstances.
•Business and travel restrictions, including within the geographic markets that we serve, have negatively impacted our customers.
Certain industries have been particularly hard-hit, including the travel and hospitality industry, the restaurant industry and the retail industry. Finally, the spread of the coronavirus has caused us to modify our business practices, including employee travel, employee work locations, and cancellation of physical participation in meetings, events and conferences. We may take further actions as may be required by government authorities or that we determine are in the best interest of our employees, customers and business partners.
As a result of the COVID-19 pandemic and the related adverse local and national economic consequences, we could be subject to the following risks, any of which could have a material, adverse effect on our business, financial condition, liquidity, and results of operations:
•demand for our products and services could decline, making it difficult to grow assets and income;
•if the economy is unable to fully reopen, and high levels of unemployment continue for an extended period of time; loan delinquencies, problem assets, and foreclosures may increase, resulting in increased charges and reduced income;
•collateral for loans, especially real estate, may decline in value, which could cause credit losses to increase;
•we may face a decline in the value of our goodwill and other intangible assets;
•our allowance for credit losses may have to be increased if borrowers experience financial difficulties beyond forbearance periods, which will adversely affect our net income;
•until business and travel restrictions are lifted and consumers resume pre-pandemic travel and leisure activities, our customers, particularly those in the travel and hospitality industries, may continue to face financial stress, which has
1
increased, and may continue to increase the level of provision for credit losses, nonperforming assets, net charge-offs and allowance for credit losses;
•our profitability could be negatively impacted if borrowers repay deferred amounts and/or resume scheduled payments under terms which are less profitable than originally agreed, all of which may be further impacted by new, changed, or extended government/regulatory expectations or requirements;
•the net worth and liquidity of loan guarantors may decline, impairing their ability to honor commitments to us;
•the decline in the Federal Reserve Board’s target federal funds rate may cause the yield on our assets to decline to a greater extent than the decline in our cost of interest-bearing liabilities, reducing our net interest margin and spread and thereby reducing our net income;
•a material decrease in net income or a net loss over several quarters could result in a decrease in the rate of our quarterly cash dividend;
•our wealth management and trust revenues may continue to fluctuate with continuing market turmoil;
•a prolonged weakness in economic conditions resulting in a reduction of future projected earnings could result in our recording a valuation allowance against our current outstanding deferred tax assets;
•our cybersecurity and fraud risks may increase due to our transition of a large portion of our workforce to a remote work environment;
•the unavailability of a third party vendor, whom we rely on for certain services, could cause a lapse in a critical service; and
•Federal Deposit Insurance Corporation premiums may increase if the agency experiences additional resolution costs.
Moreover, our future success and profitability substantially depends on the management skills of our executive officers and directors, many of whom have held officer and director positions with us for many years. The unanticipated loss or unavailability of key employees due to the outbreak could harm our ability to operate our business or execute our business strategy. We may not be successful in finding and integrating suitable successors in the event of key employee loss or unavailability.
Given the ongoing and dynamic nature of the circumstances, it is difficult to predict the full impact of the COVID-19 outbreak on our business. The extent of such impact will depend on future developments, which are highly uncertain, including the scope and duration of the pandemic and the successfulness of efforts to abate it; the continued effectiveness of our business continuity plan; the direct and indirect impact of the pandemic on our employees, customers, clients, counterparties and service providers, as well as other market participants; and actions taken by governmental authorities and other third parties in response to the pandemic, including when, how and to what extent the economy may be fully reopened.
Risks Related to the Company’s Business
The Company is subject to increased business risk because the Company has a significant concentration of commercial real estate and commercial business loans, repayment of which is often dependent on the cash flows of the borrower.
The Company offers different types of commercial loans to a variety of businesses, and we believe commercial loans will continue to comprise a significant concentration of our loan portfolio in 2021 and beyond. Real estate lending is generally considered to be collateral-based lending with loan amounts based on predetermined loan-to-collateral values. As such, declines in real estate valuations in the Company’s market area would lower the value of the collateral securing these loans. Additionally, the Company has experienced, and expects to continue experiencing, increased competition in commercial real estate lending. This increased competition may inhibit the Company's ability to generate additional commercial real estate loans or maintain its current inventory of commercial real estate loans. The Company’s commercial business loans are made based primarily on the cash flow and creditworthiness of the borrower and secondarily on the underlying collateral provided by the borrower, with liquidation of the underlying real estate collateral being viewed as the primary source of repayment in the event of borrower default. The borrowers’ cash flow may be difficult to predict, and collateral securing these loans may fluctuate in value. Although commercial business loans are often collateralized by equipment, inventory, accounts receivable, or other business assets, the liquidation of collateral in the event of default is often an insufficient source of repayment. As of December 31, 2020, commercial and commercial real estate loans totaled $3.7 billion or 71.2% of total loans.
The Company’s agricultural loans are often dependent upon the health of the agricultural industry in the location of the borrower, and the ability of the borrower to repay may be affected by many factors outside of the borrower’s control.
As part of the Company’s commercial business lending activities, the Company originates agricultural loans, consisting of agricultural real estate loans and agricultural operating loans. As of December 31, 2020, $296.4 million or 5.6% of the Company’s total loan portfolio consisted of agriculturally-related loans, including $201.9 million in agricultural real estate loans and $94.5 million in agricultural operating loans. Payments on agricultural loans are dependent on the profitable operation
2
or management of the related farm property. The success of the farm may be affected by many factors outside the control of the borrower, including adverse weather conditions that prevent the planting of a crop or limit crop yields (such as hail, drought and floods), loss of livestock due to disease or other factors, declines in market prices for agricultural products and the impact of governmental regulations and subsidies (including changes in price supports and environmental regulations). Many farms are dependent upon a limited number of key individuals whose injury or death may significantly affect the successful operation of the farm. If the cash flow from a farming operation is diminished, the borrower’s ability to repay the loan may be impaired. While agricultural operating loans are generally secured by a blanket lien on the farm’s operating assets, any repossessed collateral in respect of a defaulted loan may not provide an adequate source of repayment of the outstanding balance.
Additionally, the profitable operation or management of the related farm properties, and the value thereof, is impacted by changes in U.S. government trade policies. In 2018, 2019, and 2020, the U.S. government implemented tariffs on certain products, and certain countries or entities, such as Mexico, Canada, China and the European Union, have issued or continue to threaten retaliatory tariffs against products from the United States, including agricultural products. Tariffs, retaliatory tariffs or other trade restrictions on products and materials that farm properties related to our agriculturally-related loans import or export could cause the costs of such farm operations and management to increase, could cause the price of products from such farm operations to increase, could cause demand for such products to decrease and could cause the margins on such products to decrease. Such potential adverse effects on related farm property operations and management could reduce the related farm properties’ revenues, financial results and ability to service debt, which, in turn, could adversely affect our financial condition and results of operations. In addition, to the extent changes in the political environment have a negative impact on us or on the markets in which we operate, our business, results of operations and financial condition could be materially and adversely impacted in the future.
Declines in asset values may result in impairment charges and may adversely affect the value of the Company’s results of operations, financial condition and cash flows.
A majority of the Company’s investment portfolio is comprised of securities which are collateralized by residential mortgages. These residential mortgage-backed securities include securities of U.S. government agencies, U.S. government-sponsored entities, and private-label collateralized mortgage obligations. The Company’s securities portfolio also includes obligations of U.S. government-sponsored entities, obligations of states and political subdivisions thereof, U.S. corporate debt securities and equity securities. A more detailed discussion of the investment portfolio, including types of securities held, the carrying and fair values, and contractual maturities is provided in the Notes to Consolidated Financial Statements in Part II, Item 8 of this Report. Gains or losses on these instruments may have a direct impact on the results of operations, including higher or lower income and earnings, unless we adequately hedge our positions. The fair value of investments may be affected by factors other than the underlying performance of the issuer or composition of the obligations themselves, such as rating downgrades, adverse changes in the business climate, a lack of liquidity for resale of certain investment securities and changes in interest rates. For example, decreases in interest rates and increases in mortgage prepayment speeds, which are influenced by interest rates and other factors, could adversely impact the value of our securities collateralized by residential mortgages, causing a significant acceleration of purchase premium amortization on our mortgage portfolio because a decline in long-term interest rates shortens the expected lives of the securities. Conversely, increases in interest rates may result in a decrease in residential mortgage loan originations and mortgage prepayment speeds, directly impacting the value of these securities collateralized by residential mortgages. Management evaluates investment securities for expected credit losses impairment at least on a quarterly basis, and more frequently when economic or market concerns warrant such evaluation.Any impairment that is not credit related is recognized in other comprehensive income, net of applicable taxes.Credit-related impairment is recognized as an allowance for credit losses on the statement of condition, limited to the amount by which the amortized cost basis exceeds the fair value, with a corresponding adjustment to earnings.
A decline in the value of our goodwill and other intangible assets could adversely affect our financial condition and results of operations.
As of December 31, 2020, the Company had $97.4 million of goodwill and other intangible assets. The Company is required to test its goodwill and intangible assets for impairment on a periodic basis. A significant decline in the Company’s expected future cash flows, a significant adverse change in business climate, slower growth rates or a significant and sustained decline in the price of the Company’s common stock, may necessitate our taking charges in the future related to the impairment of the Company’s goodwill and intangible assets. If we make an impairment determination in a future reporting period, the Company’s earnings and the book value of these intangible assets would be reduced by the amount of the impairment. Further, a goodwill impairment charge could significantly restrict the ability of our banking subsidiaries to make dividend payments to us without prior regulatory approval, which could have a material adverse effect on our financial condition and results of operations.
3
Changes in accounting standards could materially impact our financial statements.
Periodically, the Financial Accounting Standards Board (“FASB”) and the SEC change the financial accounting and reporting standards that govern the preparation of our financial statements. These changes can materially impact how we record and report our financial condition and results of operations.
In June 2016, the FASB issued Accounting Standards Update (“ASU”) 2016-13, Measurement of Credit Losses on Financial Instruments. ASU 2016-13, effective for the Company as of January 1, 2020, substantially changes the accounting for credit losses on loans, leases and other financial assets held by banks, financial institutions and other organizations. The new standard requires the recognition of credit losses on loans, leases and other financial assets based on an entity's current estimate of expected losses over the lifetime of each loan, lease or other financial asset, referred to as the Current Expected Credit Loss ("CECL") model, as opposed to the existing "incurred loss" model, which required recognition of losses on loans, leases and other financial assets only when those losses were "probable." In December 2018, the bank regulatory agencies approved a final rule modifying the agencies' regulatory capital rules and providing an option to phase in over a period of three years the day-one regulatory capital effects of adoption of the CECL model.
The Company adopted ASU 2016-13 effective January 1, 2020, and recorded a net increase to retained earnings of $1.7 million upon adoption. The transition adjustment includes a decrease in the allowance for credit losses ("ACL") on loans of $2.5 million, and an increase in the ACL on off-balance sheet credit exposures of $0.4 million, net of the corresponding decrease in deferred tax assets of $0.4 million. At December 31, 2020, the Company's ACL totaled $51.7 million, up from $39.9 million at December 31, 2019, driven by provision expenses calculated under the new accounting guidance. The first quarter of 2020 included a provision expense of $16.3 million driven by the impact of the economic restrictions/shutdowns related to COVID-19 on economic forecasts and other model assumptions relied upon by management in determining the allowance, as well as normal adjustments for loan growth and changing loan portfolio mix.
The determination of the ACL in future periods under the CECL model depend significantly upon the Company's assumptions and judgments with respect to a variety of factors, including the performance of the loan and lease portfolio, the weighted-average remaining lives of different classifications of loans and leases within the loan and lease portfolio, and current and forecasted economic conditions, as well as changes in the rate of growth in the loan and lease portfolio and changes in the composition of the loan and lease portfolio. As under the existing incurred loss model, if the Company's assumptions and judgments regarding such matters prove to be inaccurate, its allowance for credit losses might not be sufficient, and additional provisions for credit losses might need to be made. Depending on the amount of such provisions for credit losses, the adverse impact on the Company's earnings could be material.
The Company may be adversely affected by the soundness of other financial institutions.
Financial services institutions are interrelated as a result of trading, clearing, counterparty or other relationships. The Company has exposure to many different industries and counterparties, and routinely executes transactions with counterparties in the financial services industry. The most important counterparty for the Company, in terms of liquidity, is the Federal Home Loan Bank of New York (“FHLBNY”). The Company also has a relationship with the Federal Home Loan Bank of Pittsburgh (“FHLBPITT”). The Company uses FHLBNY as its primary source of overnight funds and also has long-term advances and repurchase agreements with FHLBNY. The Company has placed sufficient collateral in the form of commercial and residential real estate loans at FHLBNY. In addition, the Company is required to hold stock in FHLBNY and FHLBPITT. The amount of borrowed funds and repurchase agreements with the FHLBNY and FHLBPITT, and the amount of FHLBNY and FHLBPITT stock held by the Company, at its most recent fiscal year-end are discussed in Part II, Item 8 of this Report on Form 10-K.
There are 11 branches of the FHLB, including New York and Pittsburgh. The FHLBNY and the FHLBPITT are jointly and severally liable along with the other Federal Home Loan Banks for the consolidated obligations issued on behalf of the Federal Home Loan Banks through the Office of Finance. Dividends on, redemption of, or repurchase of shares of the FHLBNY’s or FHLBPITT’s capital stock cannot occur unless the principal and interest due on all consolidated obligations have been paid in full. If another Federal Home Loan Bank were to default on its obligation to pay principal or interest on any consolidated obligations, the Federal Home Loan Finance Agency (the “Finance Agency”) may allocate the outstanding liability among one or more of the remaining Federal Home Loan Banks on a pro rata basis or on any other basis the Finance Agency may determine. As a result, the FHLBNY’s or FHLBPITT’s ability to pay dividends on, to redeem, or to repurchase shares of capital stock could be affected by the financial condition of one or more of the other Federal Home Loan Banks. Any such adverse effects on the FHLBNY or FHLBPITT could adversely affect our liquidity, the value of our investment in FHLBNY or FHLBPITT common stock, and could negatively impact our results of operations.
4
Systemic weakness in the FHLB could result in higher costs of FHLB borrowings, reduced value of FHLB stock, and increased demand for alternative sources of liquidity that are more expensive, such as brokered time deposits, the discount window at the Federal Reserve, or lines of credit with correspondent banks. Any of these scenarios could adversely affect our liquidity, the value of our investment in FHLB common stock and our financial condition.
The Company relies on cash dividends from its subsidiaries to fund its operations, and payment of those dividends could be discontinued at any time.
The Company is a financial holding company whose principal assets and sources of income are its wholly-owned subsidiaries. The Company is a separate and distinct legal entity from its subsidiaries, and therefore the Company relies primarily on dividends from these banking and other subsidiaries to meet its obligations and to provide funds for the payment of dividends to the Company’s shareholders, to the extent declared by the Company’s board of directors. Various federal and state laws and regulations limit the amount of dividends that a bank may pay to its parent company and impose regulatory capital and liquidity requirements on the Company and its banking subsidiaries. Further, as a holding company, the Company’s right to participate in a distribution of assets upon the liquidation or reorganization of a subsidiary is subject to the prior claims of the subsidiary’s creditors (including, in the case of the Company’s banking subsidiaries, the banks’ depositors). If the Company were unable to receive dividends from its subsidiaries it would materially and adversely affects the Company’s liquidity and its ability to service its debt, pay its other obligations, or pay cash dividends on its common stock.
The Company’s business may be adversely affected by general economic conditions in local and national markets, the possibility of the economy’s return to recessionary conditions and the possibility of further turmoil or volatility in the financial markets.
General economic conditions impact the banking and financial services industry. The U.S. and global economies have experienced volatility in recent years and may continue to do so for the foreseeable future. There can be no assurance that economic conditions will not deteriorate. Unfavorable or uncertain economic conditions can be caused by many macro and micro factors, including declines in economic growth, business activity or investor or business confidence, limitations on the availability or increases in the cost of credit and capital, increases in inflation or interest rates, the timing and impact of changing governmental policies and other factors. The Company is particularly affected by U.S domestic economic conditions, including U.S. interest rates, the unemployment rate, housing prices, the level of consumer confidence, changes in consumer spending, the number of personal bankruptcies and other factors. A decline in U.S. domestic business and economic conditions, without rapid recovery, could have adverse effects on our business, including the following:
•consumer and business confidence levels could be lowered and cause declines in credit usage, adverse changes in payment patterns, decreases in demand for loans or other financial products and services and decreases in deposits or investments in accounts with Company;
•the Company’s ability to assess the creditworthiness of its customers may be impaired if the models and approaches the Company uses to select, manage and underwrite its customers become less predictive of future behaviors;
•demand for and income received from the Company's fee-based services, including investment services and insurance commissions and fees, could decline, the cost to the Company to provide any or all products and services could increase, and the levels of assets under management could materially impact revenues from our trust and wealth management businesses; and
•the credit quality or value of loans and other assets or collateral securing loans may decrease.
Our business is concentrated in and largely dependent upon the continued growth and welfare of the general geographic markets in which we operate.
Our operations are heavily concentrated in the New York State and, to a lesser extent, Pennsylvania and, as a result, our financial condition, results of operations and cash flows are significantly impacted by changes in the economic conditions in those areas. Therefore, the Company’s financial performance generally, and in particular, the ability of borrowers to pay interest on and repay the principal of outstanding loans and the value of collateral securing these loans, is highly dependent upon the business environment in the markets where the Company operates, particularly New York State and Pennsylvania. Our success depends to a significant extent upon the business activity, population, income levels, deposits and real estate activity in these markets. Although our clients’ business and financial interests may extend well beyond these markets, adverse economic conditions that affect these markets could disproportionately reduce our growth rate, affect the ability of our clients to repay their loans to us, affect the value of collateral underlying loans and generally affect our financial condition and results of operations. Because of our geographic concentration, we are less able than other regional or national financial institutions to
5
diversify our credit risks across multiple markets. For additional information on our market area, see Part I, Item 1, “Business” of this Report on Form 10-K.
Our insurance agency subsidiary’s commission revenues are based on premiums set by insurers and any decreases in these premium rates could adversely affect our operations and revenues.
Our insurance agency subsidiary, Tompkins Insurance, derives the bulk of its revenue from commissions paid by insurance underwriters on the sale of insurance products to clients. Tompkins Insurance does not determine the insurance premiums on which its commissions are based. Insurance premiums are cyclical in nature and may vary widely based on market conditions. As a result, insurance brokerage revenues and profitability can be volatile. Revenue from insurance commissions and fees could be negatively affected by fluctuations in insurance premiums and other factors beyond the Company’s control, including changes in laws and regulations impacting the healthcare and insurance markets. In addition, there have been and may continue to be various trends in the insurance industry toward alternative insurance markets including, among other things, increased use of self-insurance, captives, and risk retention groups. Even if Tompkins Insurance is able to participate in these activities, it is unlikely to realize revenues and profitability as favorable as those realized from our traditional brokerage activities. We cannot predict the timing or extent of future changes in premiums and thus commissions. As a result, we cannot predict the effect that future premium rates will have on our operations. Decreases in premium rates could adversely affect our operations and revenues.
The Company’s business and financial performance are impacted significantly by market interest rates and movements in those rates. The monetary, tax and other policies of governmental agencies, including the Federal Reserve, have a significant impact on interest rates and overall financial market performance over which the Company has no control and which the Company may not be able to anticipate adequately.
As a result of the high percentage of the Company’s assets and liabilities that are in the form of interest-bearing or interest-related instruments, changes in interest rates, in the shape of the yield curve or in spreads between different market interest rates, can have a material effect on the Company’s business and profitability and the value of the Company’s assets and liabilities. For example, changes in interest rates or interest rate spreads may:
•affect the difference between the interest that the Company earns on assets and the interest that the Company pays on liabilities, which impacts the Company's overall net interest income and profitability.
•adversely affect the ability of borrowers to meet obligations under variable or adjustable rate loans and other debt instruments, which in turn, affects the Company's loss rates on those assets.
•decrease the demand for interest rate-based products and services, including loans and deposits.
•affect prepayment rates on the Company's loans and securities, which could adversely affect the Company's earnings, financial condition and cash flow.
The monetary, tax and other policies of the Federal government and its agencies, including the Federal Reserve, have a significant impact on interest rates and overall financial market performance. These governmental policies can thus affect the activities and results of operations of banking organizations such as the Company. An important function of the Federal Reserve is to regulate the national supply of bank credit and certain interest rates. The actions of the Federal Reserve influence the rates of interest that the Company charges on loans and that the Company pays on borrowings and interest-bearing deposits and can also affect the value of the Company’s on-balance sheet and off-balance sheet financial instruments. Also, due to the impact on rates for short-term funding, the Federal Reserve’s policies influence, to a significant extent, the Company’s cost of such funding. The Company cannot predict the nature or timing of future changes in monetary, tax and other policies or the effect that they may have on the Company’s business activities, financial condition and results of operations.
For information about how the Company manages its interest rate risk, refer to Part II, Item 7A, “Quantitative and Qualitative Disclosures About Market Risk” of this Report.
The Company may be adversely impacted by the transition from LIBOR as a reference rate.
In 2017, the United Kingdom’s Financial Conduct Authority announced that after 2021 it would no longer compel banks to submit the rates required to calculate the London Interbank Offered Rate (“LIBOR”). In November 2020, the administrator of LIBOR announced it will consult on its intention to extend the retirement date of certain offered rates whereby the publication of the one week and two month LIBOR offered rates will cease after December 31, 2021, but the publication of the remaining LIBOR offered rates will continue until June 30, 2023. Given consumer protection, litigation, and reputation risks, the bank regulatory agencies have indicated that entering into new contracts that use LIBOR as a reference rate after December 31, 2021, would create safety and soundness risks and that they will examine bank practices accordingly. Therefore, the agencies
6
encouraged banks to cease entering into new contracts that use LIBOR as a reference rate as soon as practicable and in any event by December 31, 2021.
It is not possible to predict what rate or rates may become accepted alternatives to LIBOR, or what the effect of any such changes in views or alternatives may be on the markets for LIBOR-indexed financial instruments. In particular, regulators, industry groups and certain committees (e.g., the Alternative Reference Rates Committee) have, among other things, published recommended fall-back language for LIBOR-linked financial instruments, identified recommended alternatives for certain LIBOR rates (e.g., AMERIBOR or the Secured Overnight Financing Rate as the recommended alternative to U.S. Dollar LIBOR), and proposed implementations of the recommended alternatives in floating rate instruments. At this time, it is not possible to predict whether these specific recommendations and proposals will be broadly accepted, whether they will continue to evolve, and what the effect of their implementation may be on the markets for floating-rate financial instruments.
The Company has loans, borrowings and other financial instruments with attributes that are either directly or indirectly dependent on LIBOR. The transition from LIBOR could create costs and additional risk. Uncertainty as to the nature of alternative reference rates and as to potential changes or other reforms to LIBOR may adversely affect LIBOR rates and the value of LIBOR-based loans, and securities in our portfolio. If LIBOR rates are no longer available, and we are required to implement substitute indices for the calculation of interest rates under our loan agreements with our borrowers, we may experience significant expenses in effecting the transition, and may be subject to disputes or litigation with customers and creditors over the appropriateness or comparability to LIBOR of the substitute indices, which could have an adverse effect on our results of operations. Further, since proposed alternative rates are calculated differently, payments under contracts referencing new rates will differ from those referencing LIBOR. Although we are currently unable to assess what the ultimate impact of the transition from LIBOR will be, failure to adequately manage the transition could have an adverse effect on our business, financial condition and results of operations.
Our funding sources may prove insufficient to replace deposits and support our future growth.
We must maintain sufficient cash flow and liquid assets to satisfy current and future financial obligations, including demand for loans and deposit withdrawals, funding operating costs, and for other corporate purposes. As a part of our liquidity management, we use a number of funding sources in addition to core deposit growth and repayments and maturities of loans and investments. As we continue to grow, we are likely to become more dependent on these sources, which may include various short-term and long-term wholesale borrowings, including Federal funds purchased and securities sold under agreements to repurchase, brokered certificates of deposit, proceeds from the sale of loans, and borrowings from the FHLBNY and FHLBPITT and others. We also maintain available lines of credit with the FHLBNY and FHLBPITT that are secured by loans. Adverse operating results or changes in industry conditions could make it difficult or impossible for us to access these additional funding sources and could make our existing funds more volatile. Our financial flexibility could be materially constrained if we are unable to maintain access to funding or if adequate financing is not available to accommodate future growth at acceptable interest rates. If we are required to rely more heavily on more expensive funding sources to support future growth, our revenues may not increase proportionately to cover our costs. In that case, our operating margins and profitability would be adversely affected. Further, the volatility inherent in some of these funding sources, particularly including brokered deposits, may increase our exposure to liquidity risk. Any interruption in these sources of liquidity when needed could adversely affect our results of operations, financial condition, cash flow or regulatory capital levels. In addition, reduced liquidity could result from circumstances beyond our control, such as general market disruptions or operational problems that affect us or third parties. Management’s efforts to closely monitor our liquidity position for compliance with internal policies may not be successful or sufficient to deal with dramatic or unanticipated reductions in liquidity.
The Company is or may become involved in lawsuits, legal proceedings, information-gathering requests, and investigations by governmental agencies or other parties that may lead to adverse consequences.
The Company’s primary business of financial services involves substantial risk of legal liability. The Company and its subsidiaries are, from time to time, named or threatened to be named as defendants in various lawsuits arising from their respective business activities, including activities of companies they have acquired. In addition, from time to time, the Company is, or may become, the subject of governmental and self-regulatory agency information-gathering requests, reviews, investigations and proceedings and other forms of regulatory inquiry, including by bank regulatory agencies, the SEC and law enforcement authorities. The results of such proceedings could lead to delays in or prohibition to acquire other companies, significant penalties, including monetary penalties, damages, adverse judgments, settlements, fines, injunctions, restrictions on the way in which the Company conducts its business, or reputational harm.
7
Although the Company establishes accruals for legal proceedings when information related to the loss contingencies represented by those matters indicates both that a loss is probable and that the amount of loss can be reasonably estimated, the Company does not have accruals for all legal proceedings where it faces a risk of loss. In addition, due to the inherent subjectivity of the assessments and unpredictability of the outcome of legal proceedings, amounts accrued may not represent the ultimate loss to the Company from the legal proceedings in question. Thus, the Company’s ultimate losses may be higher than the amounts accrued for legal loss contingencies, which could adversely affect the Company’s financial condition and results of operations.
The Company operates in a highly regulated environment and may be adversely impacted by current or future laws and regulations due to increased compliance costs, potential fines for noncompliance, and restrictions on our ability to offer products or buy or sell businesses.
The Company is subject to extensive state and federal laws and regulations, supervision and legislation that affect how it conducts its business. The majority of these laws and regulations are for the protection of consumers, depositors and the deposit insurance funds. The regulations influence such things as the Company’s lending practices, capital structure, investment practices, and dividend policy. The Dodd-Frank Act, which established the CFPB, and enacted other reforms, has had, and will continue to have, a significant effect on the entire financial services industry. Compliance with these regulations and other initiatives negatively impacts revenue and increases the cost of doing business on an ongoing basis. New regulatory requirements or changes to existing requirements could necessitate changes to the Company’s businesses, result in increased compliance costs and affect the profitability of such businesses. Refer to “Supervision and Regulation” in Part I, Item 1 - “Business” of this Report on Form 10‑K for additional information on material laws and regulations impacting the Company’s business.
Additionally, banking regulators are authorized to take supervisory actions that may restrict or limit a financial institution's activities. Regulatory restrictions on our activities could adversely affect our costs and revenues, and may impair our ability to execute our strategic plans. In addition, if our regulators identify a compliance failure, we may be assessed a fine, prohibited from completing a strategic acquisition or divestiture, or subject to other actions imposed by the regulatory authorities. The recent regulatory activity and increased scrutiny have resulted, and may continue to result, in increases in our costs of doing business, and could result in decreased revenues and net income, reduce our ability to effectively compete to attract and retain customers, or make it less attractive for us to continue providing certain products and services. Any future changes in federal or state law and regulations, as well as the interpretations and implementations, or modifications or repeals, of such laws and regulations, could have a material adverse effect on our business, financial condition or results of operations.
The Company could be subject to environmental risks and associated costs on real estate properties owned by the Company, real estate properties that collateralize the Company’s loans or real estate properties that the Company obtains title to.
The Company owns various properties used in the operation of its business. In addition, from time to time, the Company forecloses on properties or may be deemed to become involved in the management of its borrowers’ properties. The Company could be subject to environmental liabilities imposed by applicable federal and state laws with respect to any of these properties. For example, we may be held liable to a government entity or to third parties for property damage, personal injury, investigation and clean-up costs incurred by these parties in connection with environmental contamination, or may be required to clean up hazardous or toxic substances, or chemical releases, at a property, or may be subject to common law claims by third parties for damages and costs resulting from environmental contamination emanating from the property. Additionally, a significant portion of our loan portfolio at December 31, 2020 was secured by real estate and, if the real estate securing our assets is subject to environmental liability, our collateral position may be substantially weakened. Any such environmental liabilities imposed on the Company could have a material adverse impact on the Company's financial condition or results of operations.
The Company may be exposed to regulatory sanctions or liability if we do not timely detect and report money laundering or other illegal activities.
We are required to comply with anti-money laundering and anti-terrorism laws. These laws and regulations require us, among things, to enact policies and procedures to confirm the identity of our customers, and to report suspicious transactions to regulatory agencies. These laws and regulations are complex and require costly, sophisticated monitoring systems and qualified personnel. The policies and procedures that we have adopted in order to detect and prevent such illegal transactions may not be successful in eliminating all instances of such transactions. To the extent we fail to fully comply with applicable laws and regulations, we face the possibility of fines or other penalties, such as restrictions on our business activities, and we may also
8
suffer reputational harm, all of which could have a material adverse effect on our business, results of operations and financial condition. Refer to “Supervision and Regulation” in Part I, Item 1 - “Business” of this Report on Form 10‑K for additional information on anti-money laundering and anti-terrorism laws impacting the Company’s business.
We will be subject to heightened regulatory requirements if we exceed $10 billion in total consolidated assets.
Based on our historical growth rates and current size, it is possible that our total assets could exceed $10 billion dollars in the future. Our total consolidated assets on December 31, 2020 were $7.6 billion. The Dodd-Frank Act and its implementing regulations impose enhanced supervisory requirements on bank holding companies with more than $10 billion in total consolidated assets.
In addition to the additional regulatory requirements that we will become subject to upon crossing this asset threshold, federal financial regulators may require the Company to, or the Company may proactively, take actions to prepare for compliance with such increased regulations before we exceed $10 billion in total consolidated assets. We may, therefore, incur significant compliance costs in an effort to ensure compliance before we reach $10 billion in total consolidated assets. These additional compliance costs, if they occur, may adversely affect our business, results of operations and financial condition.
The Company may be adversely affected by fraud.
As a financial institution, the Company is inherently exposed to operational risk in the form of theft and other fraudulent activity by employees, customers and other third parties targeting the Company and/or the Company’s customers or data. Such activity may take many forms, including check fraud, electronic fraud, wire fraud, phishing, social engineering and other dishonest acts. Although the Company devotes substantial resources to maintaining effective policies and internal controls to identify and prevent such incidents, given the increasing sophistication of possible perpetrators, the Company may experience financial losses or reputational harm as a result of fraud. Fraudulent activity could have a material adverse effect on the Company’s business, financial condition and results of operations.
Our business requires the collection and retention of large volumes of sensitive data, which is subject to extensive regulation and oversight and exposes our business to additional risks.
In our ordinary course of business, we collect and retain large volumes of customer data, including personally identifiable information in various information systems that we maintain and in those maintained by third parties with whom we contract to provide data services. We also maintain important internal Company data such as personally identifiable information about our employees and information relating to our operations. Our customers and employees have been, and will continue to be, targeted by cybersecurity threats attempting to misappropriate passwords, bank account information or other personal information. Our attempts to mitigate these threats may not be successful as cybercrimes are complex and continue to evolve. Publicized information concerning security and cyber-related problems could cause us to incur reputational harm and discourage our customers from using our electronic or web-based applications or solutions, which could harm their utility as a means of conducting commercial transactions.
Even the most well protected information, networks, systems and facilities remain potentially vulnerable because the techniques used in breach attempts or other disruptions are constantly evolving and generally are not recognized until launched against a target, and in some cases are designed not to be detected and, in fact, may not be detected. Accordingly, we may be unable to anticipate these techniques or to implement adequate security barriers or other preventative measures. A security breach or other significant disruption of our information systems or those related to our customers, merchants and our third party vendors, including as a result of cyber-attacks, could (i) disrupt the proper functioning of our internal, or our third-party vendors’, networks and systems and therefore our operations and/or those of certain of our customers; (ii) result in the unauthorized access to, and destruction, loss, theft, misappropriation or release of confidential, sensitive or otherwise valuable information of ours or our customers; (iii) result in a violation of applicable privacy, data breach and other laws, subjecting us to additional regulatory scrutiny and expose the us to civil litigation, governmental fines and possible financial liability; (iv) require significant management attention and resources to remedy the damages that result; or (v) harm our reputation or cause a decrease in the number of customers that choose to do business with us. The occurrence of any of the foregoing could have a material adverse effect on our business, financial condition and results of operations.
A breach of information or other technological security, including as a result of cyber-attacks, could have a material adverse effect on our business, financial condition and results of operations.
In the ordinary course of business we rely on electronic communications and information systems, both internal and provided by external third parties, to conduct our operations and to store, process, and/or transmit sensitive data on a variety of
9
computing platforms and networks and over the Internet. We cannot be certain that all of our systems, or third-party systems upon which we rely, are free from vulnerability to attack or other technological difficulties or failures. Information security breaches and cybersecurity-related incidents may include attempts to access information, including customer and company information, malicious code, computer viruses, phishing, denial of service attacks and other means of intrusion that could result in unauthorized access, misuse, loss or destruction of data (including confidential customer or employee information), account takeovers, unavailability of service or other events. These types of threats may derive from human error, fraud or malice on the part of external or internal parties, or may result from accidental technological failure. Further, to access our products and services our customers may use computers and mobile devices that are beyond our security control systems. If information security is breached or difficulties or failures occur, despite the controls we and our third party vendors have instituted, information may be lost or misappropriated, resulting in financial loss or costs, reputational harm or damages and litigation, regulatory investigation costs or remediation costs to us or others. While we maintain specific “cyber” insurance coverage, which would apply in the event of many breach scenarios, the amount of coverage may not be adequate in any particular case. Furthermore, because cyber threat scenarios are inherently difficult to predict and can take many forms, some breaches may not be covered under our cyber insurance coverage. Any of these consequences could have a material adverse effect on our financial condition and results of operations.
The risk of a security breach or disruption, particularly through cyber-attack or cyber intrusion, has significantly increased, in part due to the expansion of new technologies, the increased use of the Internet and mobile services and the increased intensity and sophistication of attempted attacks and intrusions from around the world. The threat from cyber-attacks is severe, attacks are sophisticated and increasing in volume, and attackers respond rapidly to changes in defensive measures. Our systems and those of our customers and third-party service providers are under constant threat and it is possible that we could experience a significant event in the future. Our technologies, systems, networks and software, and those of other financial institutions have been, and are likely to continue to be, the target of cybersecurity threats and attacks, which may range from uncoordinated individual attempts to sophisticated and targeted measures directed at us. Risks and exposures related to cybersecurity attacks are expected to remain high for the foreseeable future due to the rapidly evolving nature and sophistication of these threats as well as the expanding use of Internet banking, mobile banking and other technology-based products and services by us and our customers. As cyber threats continue to evolve, we may be required to expend significant additional resources to modify our protective measures or to investigate and remediate any information security vulnerabilities.
The Company is subject to risks presented by acquisitions, which, if realized, could negatively affect our results of operations and financial condition.
The Company’s strategic initiatives include diversification within its markets, growth of its fee-based businesses, and growth internally and through acquisitions of financial institutions, branches, and financial services businesses. As such, the Company has acquired, and from time to time considers acquiring, banks, thrift institutions, branch offices of banks or thrift institutions, or other businesses within markets currently served by the Company or in other locations that would complement the Company’s business or its geographic reach. In the second quarter of 2019, the Company's insurance subsidiary, Tompkins Insurance, acquired a small insurance agency, The Cali Agency, which was folded into Tompkins Insurance. Any future acquisitions will be accompanied by the risks commonly encountered in acquisitions. These risks include: the difficulty of integrating operations and personnel, the potential disruption of our ongoing business, the inability of management to realize or maximize anticipated financial and strategic positions, increased operating costs, the inability to maintain uniform standards, controls, procedures and policies, the difficulty and cost of obtaining adequate financing, the potential for litigation risk, the potential loss of members of a key executive management group, the potential reputational damage and the impairment of relationships with employees and customers as a result of changes in ownership and management. Further, the asset quality or other financial characteristics of an acquired company may deteriorate after the acquisition agreement is signed or after the acquisition closes. We cannot provide any assurance that we will be successful in overcoming these risks or any other problems encountered in connection with acquisitions and any of these risks, if realized, could have an adverse effect on our results of operations and financial condition.
The Company's operations may be adversely affected if its external vendors do not perform as expected or if its access to third-party services is interrupted.
The Company relies on certain external vendors to provide products and services necessary to maintain the day-to-day operations of the Company. Some of the products and services provided by vendors include key components of our business infrastructure including data processing and storage and internet connections and network access, among other products and services. Accordingly, the Company’s operations are exposed to the risk that these vendors will not perform in accordance with the contracted arrangements or under service level agreements. The failure of an external vendor to perform in accordance with the contracted arrangements or under service level agreements, because of changes in the vendor’s organizational structure, financial condition, support for existing products and services or strategic focus or for any other reason, could disrupt the
10
Company’s operations. If we are unable to find alternative sources for our vendors’ services and products quickly and cost-effectively, the failures of our vendors could have a material adverse impact on the Company’s business and, in turn, the Company’s financial condition and results of operations.
Additionally, our information technology and telecommunications systems interface with and depend on third-party systems, we could experience service denials if demand for such services exceeds capacity or such third-party systems fail or experience interruptions. If sustained or repeated, a system failure or service denial could result in a deterioration of our ability to process new and renewal loans, gather deposits and provide customer service, compromise our ability to operate effectively, damage our reputation, result in a loss of customer business and subject us to additional regulatory scrutiny and possible financial liability, any of which could have a material adverse effect on our financial condition and results of operations.
Risks Associated with the Company’s Common Stock
The Company’s stock price may be volatile.
The Company’s stock price can fluctuate widely in response to a variety of factors, including: actual or anticipated variations in our operating results; recommendations by securities analysts; significant acquisitions or business combinations; operating and stock price performance of other companies that investors deem comparable to Tompkins; new technology used, or services offered by our competitors; news reports relating to trends, concerns and other issues in the financial services industry; and changes in government regulations. Other factors, including general market fluctuations, industry-wide factors and economic and general political conditions and events, including foreign and national governmental policy decisions, terrorist attacks, pandemics, economic slowdowns or recessions, interest rate changes, credit loss trends or currency fluctuations, may adversely affect the Company’s stock price even though they do not directly pertain to the Company’s operating results. The economic impact of the COVID-19 pandemic has caused and may continue to cause the Company's stock price to decline and fluctuate.
The trading volume in our common stock is less than that of larger financial services companies, which may adversely affect the price of our common stock.
The Company’s common stock is traded on the NYSE American. The trading volume in the Company’s common stock is less than that of larger financial services companies. A public trading market having the desired characteristics of depth, liquidity and orderliness depends on the presence in the marketplace of willing buyers and sellers of our common stock at any given time. This presence depends on the individual decisions of investors and general economic and market conditions over which we have no control. Given the lower trading volume of the Company’s common stock, significant sales of our common stock, or the expectation of these sales, could cause our stock price to fall.
An investment in our common stock is not an insured deposit.
The Company’s common stock is not a bank deposit and, therefore, is not insured against loss by the FDIC, any other deposit insurance fund or by any other public or private entity. Investment in the Company’s common stock is inherently risky for the reasons described in this “Risk Factors” section and is subject to the same market forces that affect the price of common stock in any company. As a result, if you acquire the Company’s common stock, you may lose some or all of your investment.
We may not pay, or may reduce, the dividends paid on our common stock.
Holders of Tompkins’ common stock are only entitled to receive such dividends as its board of directors may declare out of funds legally available for such payments. While Tompkins has a long history of paying dividends on its common stock, Tompkins is not required to pay dividends on its common stock and could reduce or eliminate its common stock dividend in the future. This could adversely affect the market price of Tompkins’ common stock. Also, Tompkins is a bank holding company, and its ability to declare and pay dividends is dependent on certain federal regulatory considerations, including the guidelines of the Federal Reserve regarding capital adequacy and dividends. See “Supervision and Regulation” for a description of certain material limitations on the Company’s ability to pay dividends to shareholders.
11
General Risks
As an organization focused on building comprehensive relationships with clients, employees and the communities we serve, our reputation is critical to our business, and damage to it could have a material adverse effect on our business and prospects.
Our success as a Company relies on maintaining the value of our brand and our good reputation with our current and potential customers and employees. Through our branding, we communicate to the market about our Company and our product and service offerings. Maintaining a positive reputation is critical to our attracting and retaining clients and employees. Accordingly, reputational damage would likely have a materially adverse impact on our business prospects and our ability to execute on our business strategy. Harm to our reputation can arise from many sources, including regulatory actions or fines, improperly handled conflicts of interest, operating system failures or security breaches, customer complaints, litigation, actual or perceived employee misconduct, misconduct by our outsourced service providers or other counterparties, or other unethical or improper behavior conducted by our Company or affiliated service providers or other counterparties could all cause harm to our reputation, impair our ability to attract and retain customers, make it more difficult or expensive to obtain external funding and have other adverse effects on our business, results of operations and financial condition. Negative publicity regarding us or any of our subsidiaries, whether or not accurate, may damage our reputation, which could have a material adverse effect on our assets, business, prospects, financial condition and results of operations.
We continually encounter technological changes and the failure to understand and adapt to these changes could hurt our business.
The financial services industry is continually undergoing rapid technological changes with frequent introductions of new technology-driven products and services which increase efficiency and enable financial institutions to serve customers better and to reduce costs. The Company’s future success depends, in part, upon its ability to leverage technology to increase our operational efficiency as well as address the current and evolving needs of our customers. However, our competitors may have greater resources to invest in technological improvements, we may not always have capital levels which are sufficient to support a robust investment in our technology infrastructure or we may not be able to effectively implement new technology-driven products and services or be successful in marketing these products and services to our customers. Failure to successfully keep pace with technological changes affecting the financial services industry could have a material adverse effect on the Company’s business and, in turn, the Company’s financial condition and results of operations.
Our success depends on our ability to offer our customers an evolving suite of products and services, and we may not be able to effectively manage the risks inherent in the development of financial products and services.
We continually monitor our suite of products and services, and prioritize new offerings based on our determination of customer demand, within regulatory parameters for financial products. We may invest significant time and resources in new products which become obsolete, or do not generate the revenues we had anticipated, or which are ultimately deemed unacceptable by regulatory authorities. As we expand the range and complexity of our products and services, we are exposed to increasingly complex risks, including potential fraud, and our employees and risk management systems may not be adequate to mitigate such risks effectively. Our failure to effectively identify and manage these risks and uncertainties could have a material adverse effect on our business.
Our future success is dependent on our ability to compete effectively in a highly competitive industry and market areas.
Competition for commercial banking and other financial services is strong in the Company’s market areas. In one or more aspects of its business, the Company’s subsidiaries compete with other commercial banks, savings and loan associations, credit unions, finance companies, Internet-based financial services companies, mutual funds, insurance companies, brokerage and investment banking companies, and other financial intermediaries. In addition, a number of out-of-state financial intermediaries have opened production offices, or otherwise solicit deposits, or have announced plans to do so in the Company’s market areas. Some of these competitors have substantially greater resources and lending capabilities than the Company and may offer services that the Company does not currently provide. In addition, many of the Company’s non-bank competitors are not subject to the same extensive Federal regulations that govern financial holding companies and Federally-insured banks. The financial services industry could become even more competitive as a result of legislative, regulatory and technological changes and continued consolidation. Additionally, technology has lowered barriers to entry and made it possible for non-banks to offer products and services traditionally provided by banks, such as automatic transfer and automatic payment systems. Failure to compete effectively to attract new and retain current customers could adversely affect our growth and profitability, which could have a materially adverse effect on our business, financial condition and results of operations.
12
Item 1. Business
The disclosures set forth in this Item 1. Business are qualified by the section captioned “Forward-Looking Statements” in Item 7. Management’s Discussion and Analysis of Financial Condition and Results of Operations of this Report and other cautionary statements set forth elsewhere in this Report.
General
Tompkins Financial Corporation (“Tompkins” or the “Company”) is headquartered in Ithaca, New York and is registered as a Financial Holding Company with the Federal Reserve Board under the Bank Holding Company Act of 1956, as amended. The Company is a locally oriented, community-based financial services organization that offers a full array of products and services, including commercial and consumer banking, leasing, trust and investment management, financial planning and wealth management, and insurance.At December 31, 2018,2020, the Company’s subsidiaries included: four wholly-owned banking subsidiaries, Tompkins Trust Company (the “Trust Company”), The Bank of Castile (DBA Tompkins Bank of Castile), Mahopac Bank (DBA Tompkins Mahopac Bank), VIST Bank (DBA Tompkins VIST Bank); and a wholly-owned insurance agency subsidiary, Tompkins Insurance Agencies, Inc. (“Tompkins Insurance”). The Trust Company provides a full array of trust and investment services under the Tompkins Financial Advisors brand, including investment management, trust and estate, financial and tax planning as well as life, disability and long-term care insurance services. The Company’s principal offices are located at 118 E. Seneca St., P.O. Box 460, Ithaca, New York, 14850, and its telephone number is (888) 503-5753. The Company’s common stock is traded on the NYSE American under the symbol “TMP.”
Tompkins was organized in 1995, under the laws of the State of New York, as a bank holding company for the Trust Company, a commercial bank that has operated in Ithaca, New York and surrounding communities since 1836.
The Tompkins strategy centers around its core values and a commitment to delivering long-term value to our clients, communities, and shareholders. To achieve this,A key strategic initiative for the Company hasis a variety of strategic initiatives focused on delivering high quality products and services; a continual focus on improving operational effectiveness, investing in our people through talent managementresponsible and development, maintaining appropriate risk management programs, and delivering profitablesustainable growth, across all of our business lines. The Company's growth strategy includesincluding initiatives to grow organically through our current businesses, as well as through possible acquisitions of financial institutions, branches, and financial services businesses. As such, the Company has acquired, and from time to time considers acquiring, banks, thrift institutions, branch offices of banks or thrift institutions, or other businesses that would complement the Company’s business or its geographic reach. The Company generally targets merger or acquisition partners that are culturally similar and have experienced management and possess either significant market presence or have potential for improved profitability through financial management, economies of scale and expanded services. The Company has pursued acquisition opportunities in the past, and continues to review new opportunities.
The Company also has defined strategic initiatives around digital delivery of services to meet the changing needs of client expectations, while maintaining our commitment to excellence in the delivery of personal service when self-serve options are unable to meet the needs of our clients. Our strategy includes a focus on building a scalable foundation based on a continuous improvement approach necessary for our long term success. This foundation will include investments in automation, analytics and security to drive ongoing consistency, efficiency, and security in our operations. We also recognize the need to develop and acquire talent that is well prepared to succeed in our changing industry. Initiatives in this area include a corporate entity, legally separate and distinct from its affiliates, bank holding companiesfocus on characteristics such as Tompkins are generally required to act as a source of financial strength for their banking subsidiaries. Tompkins’ principal source of income is dividends from its subsidiaries. There are certain regulatory restrictions on the extent to which these subsidiaries can pay dividends or otherwise supply funds to Tompkins. See the section “Supervisioncollaboration, innovation and Regulation” for further details.agility, while also promoting and embracing diversity, inclusion and belonging in our workforce.
Narrative Description of Business
The Company has identified three business segments, consisting of banking, insurance and wealth management.
Banking services consist primarily of attracting deposits from the areas served by the Company’s 4four banking subsidiaries’ 6664 banking offices (46(44 offices in New York and 20 offices in Pennsylvania), and using those deposits to originate a variety of commercial loans, agricultural loans, consumer loans, real estate loans, and leases in those same areas. The Company’s lending function is managed within the guidelines of a comprehensive Board-approved lending policy. Policies and procedures are reviewed on a regular basis. Reporting systems are in place to provide management with ongoing information related to loan production, loan quality, concentrations of credit, loan delinquencies and nonperforming and potential problem loans. The Company has an independent third party loan review process that reviews and validates the risk identification and assessment made by the lenders and credit personnel. The results of these reviews are presented to the Board of Directors of each of the Company’s banking subsidiaries, and the Company’s Audit Committee.
13
The Company’s principal expenses are interest on deposits, interest on borrowings, and operating and general administrative expenses, as well as provisions for loan and lease losses.credit loss expenses. Funding sources, other than deposits, include borrowings, securities sold under agreements to repurchase, and cash flow from lending and investing activities. The Company’s principal source of revenue is interest income on loans and securities.
The Company maintains a portfolio of securities such as obligations of U.S. government agencies and U.S. government sponsored entities, obligations of states and political subdivisions thereof, and equity securities. Management typically invests in securities with short to intermediate average lives in order to better match the interest rate sensitivities of its assets and liabilities. Investment decisions are made within policy guidelines established by the Company’s Board of Directors. The investment policy is based on the asset/liability management goals of the Company, and is monitored by the Company’s Asset/Liability Management Committee. The intent of the policy is to establish a portfolio of high quality diversified securities, which optimizes net interest income within safety and liquidity limits deemed acceptable by the Asset/Liability Management Committee.
The Company has operated its insurance agency subsidiary, Tompkins Insurance Agencies Inc., since 2001. Insurance services include property and casualty insurance, employee benefit consulting, life, long-term care and disability insurance. Tompkins Insurance is headquartered in Batavia, New York. Over the years, Tompkins Insurance has acquired smaller insurance agencies in the market areas served by the Company’s banking subsidiaries and successfully consolidated them into Tompkins Insurance. Tompkins Insurance offers services to customers of the Company’s banking subsidiaries by sharing offices with Tompkins Bank of Castile, the Trust Company, and Tompkins VIST Bank. In addition to these shared offices, Tompkins Insurance has five stand-alone offices in Western New York, and one stand-alone office in Tompkins County, New York.
Wealth management services consist of investment management, trust and estate, financial and tax planning as well as life, disability and long-term care insurance services. Wealth management services are provided under the trade name Tompkins Financial Advisors. Tompkins Financial Advisors has office locations, and services are available, within all four of the Company’s subsidiary banks.
Subsidiaries
The Company operates four banking subsidiaries, and an insurance agency subsidiary. In addition, the Company also owns 100% of the common stock of Sleepy Hollow Capital Trust I, Leesport Capital Trust II and Madison Statutory Trust I. The Company’s banking subsidiaries operate 6664 offices, including 2 limited-service offices, with 4644 banking offices located in New York and 20 banking offices located in southeastern Pennsylvania. The decision to operate as four locally managed community banks reflects management’s commitment to community banking as a business strategy. For Tompkins, personal delivery of high quality services, a commitment to the communities in which we operate, and the convergence of a single-source financial service provider characterize management’s community banking approach. The combined resources of the Tompkins organization provide increased capacity for growth and the greater capital resources necessary to make investments in technology and services. Tompkins has a comprehensive suite of products and services in the markets served by all four banking subsidiaries. These services include trust and investment services, insurance, leasing, card services, Internet banking, and remote deposit services.
Tompkins Trust Company (the “Trust Company”)
The Trust Company is a New York State-chartered commercial bank that has operated in Ithaca, New York and surrounding communities since 1836. The Trust Company provides wealth management services through Tompkins Financial Advisors (“TFA”), a division of Tompkins Trust Company. The Trust Company operates 14 banking offices, including one limited-service banking office in Tompkins County, in New York. The Trust Company’s largest market area is Tompkins County, which has a population of approximately 105,000.102,000. Education plays a significant role in the Tompkins County economy with Cornell University and Ithaca College being two of the county’s major employers. The Trust Company has a full-service office in Cortland, New York and a full-service office in Auburn, New York. Both of these offices are located in counties contiguous to Tompkins County. The Trust Company also has a full service branch in Fayetteville, New York which is located in Onondaga County. As of December 31, 2018,2020, the Trust Company had total assets of $2.1$2.4 billion, total loans of $1.3$1.5 billion and total deposits of $1.6$2.0 billion.
Tompkins Bank of Castile
Tompkins Bank of Castile is a New York State-chartered commercial bank and conducts its operations through its 1816 banking offices, in towns situated in and around the areas commonly known as the Genesee Valley region of New York State. The main business office for Tompkins Bank of Castile is located in Batavia, New York and is shared with Tompkins Insurance. Tompkins Bank of Castile serves a six-county market, much of which is rural in nature, but also includes Monroe County (population approximately 748,000)742,000), where the city of Rochester is located, and Erie County (population 923,000)approximately
14
918,000) located near Buffalo, New York. The population of the counties served by Tompkins Bank of Castile, other than Monroe and Erie, , is approximately 206,000. In 2018, Tompkins Bank of Castile opened a banking office in Amherst, New York, which is in Erie County and located near Buffalo, New York.201,000. As of December 31, 2018,2020, Tompkins Bank of Castile had total assets of $1.5$1.8 billion, total loans of $1.2$1.3 billion and total deposits of $1.2$1.6 billion.
Tompkins Mahopac Bank
Tompkins Mahopac Bank is a New York State-chartered commercial bank that operates 14 banking offices. The 14 banking offices include 5 full-service offices in Putnam County, New York, 3 full-service offices in Dutchess County, New York, and 6 full-service offices in Westchester County, New York. Putnam County has a population of approximately 99,00098,000 and is about 60 miles north of Manhattan. Dutchess County has a population of approximately 294,000, and Westchester County has a population of approximately 975,000.968,000. As of December 31, 2018,2020, Tompkins Mahopac Bank had total assets of $1.4$1.5 billion, total loans of $1.0$1.1 billion and total deposits of $1.0$1.3 billion.
Tompkins VIST Bank
Tompkins VIST Bank is a full service Pennsylvania State-charted commercial bank that operates 20 banking offices in Pennsylvania, including one limited-service office. The 20 banking offices include 12 offices in Berks County, 5 offices in Montgomery County, 1 office in Philadelphia County, 1 office in Delaware County and 1 office in Schuylkill County. The population of the counties served by Tompkins VIST Bank is PhiladelphiaPhiladelphia: 1.6 million, Montgomery 823,000, Delaware 563,000, Berks 415,000Montgomery: 835,000, Delaware: 568,000, Berks: 421,000 and Schuylkill 144,000.Schuylkill: 141,000. The main office is located in Wyomissing, Pennsylvania. As of December 31, 2018,2020, Tompkins VIST Bank had total assets of $1.7$2.0 billion, total loans of $1.4 billion and total deposits of $1.2$1.6 billion.
Tompkins Insurance Agencies, Inc. ("Tompkins Insurance")
Tompkins Insurance is headquartered in Batavia, New York. Insurance services include property and casualty insurance, employee benefit consulting, and life, long-term care and disability insurance. Over the past 17 years, Tompkins Insurance has acquired smaller insurance agencies in the market areas serviced by the Company's banking subsidiaries and successfully consolidated them into Tompkins Insurance. Tompkins Insurance offers services to customers of the Company's banking subsidiaries by sharing offices with Tompkins Bank of Castile, Trust Company, and Tompkins VIST Bank. In addition to these shared offices, Tompkins Insurance has five stand-alone offices in Western New York, and one stand-alone office in Tompkins County.York.
Leesport Capital Trust II
Leesport Capital Trust II, a Delaware statutory business trust, was formed in 2002 and issued $10.0 million of mandatory redeemable capital securities carrying a floating interest rate of three-month LIBOR plus 3.45%. The Company assumed the rights and obligations of VIST Financial Corporation ("VIST Financial") pertaining to the Leesport Capital Trust II through the Company’s acquisition of VIST Financial in 2012.
Madison Statutory Trust I
Madison Statutory Trust I, a Connecticut statutory business trust formed in 2003, issued $5.0 million of mandatory redeemable capital securities carrying a floating interest rate of three-month LIBOR plus 3.10%. VIST Financial assumed Madison Statutory Trust I pursuant to the purchase of Madison Bancshares Group, Ltd in 2004. The Company assumed the rights and obligations of VIST Financial pertaining to the Madison Statutory Trust I through the Company’s acquisition of VIST Financial in 2012.
For additional details on the above capital trusts refer to “Note 10 - Trust Preferred Debentures” in the Notes to Consolidated Financial Statements in Part II, Item 8. of this Report.
Competition
Competition for commercial banking and other financial services is strong in the Company’s market areas. In one or more aspects of its business, the Company’s subsidiaries compete with other commercial banks, savings and loan associations, credit unions, finance companies, Internet-based financial services companies, mutual funds, insurance companies, brokerage and investment banking companies, and other financial intermediaries. Some of these competitors have substantially greater resources and lending capabilities and may offer services that the Company does not currently provide. In addition, many of the Company’s non-bank competitors are not subject to the same extensive Federal regulations that govern financial holding companies and Federally-insured banks.
Competition among financial institutions is based upon interest rates offered on deposit accounts, interest rates charged on loans and other credit and service charges, the quality and scope of the services rendered, the convenience of facilities and services, and, in the case of loans to commercial borrowers, relative lending limits. Management believes that a community-based
15
financial organization is better positioned to establish personalized financial relationships with both commercial customers and individual households. The Company’s community commitment and involvement in its primary market areas, as well as its commitment to quality and personalized financial services, are factors that contribute to the Company’s competitiveness. Management believes that each of the Company’s subsidiary banks can compete successfully in its primary market areas by making prudent lending decisions quickly and more efficiently than its competitors, without compromising asset quality or profitability. In addition, the Company focuses on providing unparalleled customer service, which includes offering a strong suite of products and services.services, including products that are accessible to our customers through digital means. Although management feels that this business model has caused the Company to grow its customer base in recent years and allows it to compete effectively in the markets it serves, we cannot assure you that such factors will result in future success.
Supervision and Regulation
Regulatory Agencies
As a registered financial holding company, the Company is regulated under the Bank Holding Company Act of 1956 as amended (“BHC Act”), and is subject to examination and comprehensive regulation by the Federal Reserve Board (“FRB”). The Company is also subject to the jurisdiction of the Securities and Exchange Commission (“SEC”) and is subject to disclosure and regulatory requirements under the Securities Act of 1933, as amended (the “Securities Act”), and the Securities Exchange Act of 1934, as amended (the “Exchange Act”). The Company's activities are also subject to regulation under the Federal Reserve Act, the Federal Deposit Insurance Act, the Dodd-Frank Act, the Truth-in-Lending Act (which governs disclosures of credit terms to consumer borrowers), the Truth-in-Savings Act, the Equal Credit Opportunity Act, the Fair Credit Reporting Act (which governs the manner in which consumer debts may be collected by collection agencies), the Home Mortgage Disclosure Act (which requires financial institutions to provide certain information about home mortgage and refinanced loans), the Servicemembers Civil Relief Act, Section 5 of the Federal Trade Commission Act (which prohibits unfair or deceptive acts and practices in or affecting commerce), the Real Estate Settlement Procedures Act, and the Electronic Funds Transfer Act, as well as other federal, state and local laws. The Company’s common stock is traded on the NYSE American under the Symbol “TMP” and as a result the Company is subject to the rules of the NYSE American for listed companies.
The Company’s banking subsidiaries are subject to examination and comprehensive regulation by various regulatory authorities, including the Federal Deposit Insurance Corporation (“FDIC”), the New York State Department of Financial Services (“NYSDFS”), and the Pennsylvania Department of Banking and Securities (“PDBS”). Each of these agencies issues regulations and requires the filing of reports describing the activities and financial condition of the entities under its jurisdiction. Likewise, such agencies conduct examinations on a recurring basis to evaluate the safety and soundness of the institutions, and to test compliance with various regulatory requirements, including: consumer protection, privacy, fair lending, the Community Reinvestment Act, the Bank Secrecy Act, sales of non-deposit investments, electronic data processing, and trust department activities.
The Company’s insurance subsidiary is subject to examination and regulation by the NYSDFS and the Pennsylvania Insurance Department.
The Company’s wealth management subsidiary is subject to examination and regulation by various regulatory agencies, including the SEC and the Financial Industry Regulatory Authority (“FINRA”).agencies. The trust division of Tompkins Trust Company is subject to examination and comprehensive regulation by the FDIC and NYSDFS.
Federal Home Loan Bank System
The Company’s banking subsidiaries are also members of the Federal Home Loan Bank (“FHLB”), which provides a central credit facility primarily for member institutions for home mortgage and neighborhood lending. The Company’s banking subsidiaries are subject to the rules and requirements of the FHLB, including the requirement to acquire and hold shares of capital stock in the FHLB in an amount at least equal to the sum of 0.35% of the aggregate principal amount of its unpaid residential mortgage loans and similar obligations at the beginning of each year, up to a maximum of $25.0 million. The Company’s banking subsidiaries were in compliance with FHLB rules and requirements as of December 31, 2018.2020.
Regulatory Reform
The enactment of the Dodd-Frank Wall Street Reform and Consumer Protection Act of 2010 (the “Dodd-Frank Act”) placed U.S. banks and financial services firms under enhanced regulation and oversight. While many provisions of the Dodd- FrankDodd-Frank Act are currently effective, certain provisions of the legislation are still subject to further rulemaking, guidance and interpretation by the federal regulatory agencies. The Dodd-Frank Act was amended on May 24, 2018, when the President signedIn addition, the Economic Growth, Regulatory Relief, and Consumer Protection Act (“EGRRCPA”) into law. The EGRRCPA, which was enacted on May 24, 2018, amended certain provisions of the Dodd-Frank ActAct. Key provisions of EGRRCPA and provided targeted modifications to other post-financial-crisis regulatory requirements. In addition, the legislation establishes new consumer protections and amends various securities-related and investment company-related requirements. Some EGRRCPA provisions were immediately effective, some have later-specified effective dates and still others are open-ended and subject to implementation by federal regulatory agency rule-making. EGRRCPA includes a variety of provisionsits implementing regulations that are likely to affectimpact the Company, including the following:include:
16
–A simplified capital rule change which directs federal banking agencies to adopt rules that exemptexempts "qualifying community banks"--banks with assets of less than $10 billion--that exceed the “community bank leverage ratio” from all risk-based capital requirements, including Basel III, and deems such banks "well capitalized" for purposes of federal "prompt corrective action" capital standards. This exemption is not effective until federal banking agencies establishTo qualify for the framework and elect to adopt the simplifying changes, a community bank must have less than $10 billion in total consolidated assets, limited amounts of off-balance-sheet exposures and trading assets and liabilities, and a leverage ratio (a ratio of tangible equity to average consolidated assets) of between 8% and 10%.greater than nine percent. The Company was,has elected not to adopt exemption from risk based capital requirements as of December 31, 2018, a qualifying community bank.
While EGRRCPA does and will continue to improveimproves regulatory conditions for the Company, many provisions of the Dodd-Frank Act and its implementing regulations remain effective and will continue to result in additional operating and compliance costs that could have a material adverse effect on our business, financial condition and results of operation. In addition, the EGRRCPA requires the enactment of a number of implementing regulations, the details of which may change how this law ultimately impacts the Company. Further, it is possible that the current climate of regulatory reform will lead to new legislation in addition to or supplementing the Dodd-Frank Act and EGRRCPA which may subject the Company to additional or expanded regulation. The effects of any potential new legislation are unknown and difficult to predict at this time.
Debit-Card Interchange Fees
FRB regulations mandated by the Dodd-Frank Act limit interchange fees on debit cards to a maximum of 21 cents per transaction plus 5 basis points of the transaction amount. Issuers that, together with their affiliates, have less than $10 billion in assets, such as the Company, are exempt from the debit card interchange fee standards. However, FRB regulations prohibit all card issuers, including the Company and its banking subsidiaries, from restricting the number of networks over which electronic debit transactions may be processed to fewer than two unaffiliated networks, or inhibiting a merchant's ability to direct the routing of the electronic debit transaction over any network that the card issuer has enabled to process them.
Volcker Rule
The Dodd-Frank Act required the federal financial regulatory agencies to adopt rules that prohibit banks and their affiliates from engaging in proprietary trading and investing in and sponsoring certain unregistered investment companies (defined as hedge funds and private equity funds). The statutory provision is commonly called the “Volcker Rule.” As of December 31, 2018,2020, the Company had outstanding investments of approximately $600,000less than $100,000 in covered funds (the "Legacy Investments"), which we would have been required to divest no later than July 2022 per our agreement with the FRB. However, under the newly-enacted EGRRCPA, the Company, as a financial institution with less than $10 billion in total consolidated assets, isare exempt from meetingthe divestiture requirements of the Volcker Rule's proprietary trading requirements. Therefore, no further Volcker Rule divestitures are required unless the Company crosses the $10 billion in total assetsasset threshold.
Federal Bank Holding Company Regulation
We are a bank holding company subject to regulation under the BHC Act and the examination and reporting requirements of the FRB. In general, the BHC Act limits the business of bank holding companies to banking, managing or controlling banks and other activities that the FRB has determined to be so closely related to banking as to be a proper incident thereto. In addition, we qualified for the status of and elected to be a financial holding company under the BHC Act and therefore may engage in any activity, or acquire and retain the shares of a company engaged in any activity, that is either (i) financial in nature or incidental to such financial activity (as determined by the FRB in consultation with the Secretary of the Treasury) or (ii) complementary to a financial activity and does not pose a substantial risk to the safety and soundness of depository institutions or the financial system generally (as solely determined by the FRB), without prior approval of the FRB.
If a bank holding company seeks to engage in the broader range of activities permitted under the BHC Act for financial holding companies, as we do, (i) the bank holding company and all of its depository institution subsidiaries must be “well-capitalized” and “well-managed,” as defined in the FRB's Regulation Y and (ii) it must file a declaration with the FRB that it elects to be a “financial holding company.” If we cease to meet these requirements, the Company will not be in compliance with the BHC Act’s requirements and the FRB may impose limitations or conditions on the conduct of its activities to encourage compliance. If the Company does not return to compliance within 180 days, the FRB may require divestiture of our depository institutions, among other potential penalties and limitations. To maintain financial holding company status, a financial holding company and all of its depository institution subsidiaries must be “well capitalized” and “well managed.” A depository institution subsidiary is considered to be “well capitalized” if it satisfies the requirements for this status discussed in the section captioned “Capital
17
Adequacy and Prompt Corrective Action,” below. A depository institution subsidiary is considered “well managed” if it received a composite rating and management rating of at least “satisfactory” in its most recent examination. A financial holding company’s status will also depend upon it maintaining its status as “well capitalized” and “well managed” under applicable FRB regulations. If a financial holding company ceases to meet these capital and management requirements, the FRB’s regulations provide that the financial holding company must enter into an agreement with the FRB to comply with all applicable capital and management requirements. Until the financial holding company returns to compliance, the FRB may impose limitations or conditions on the conduct of its activities, and the company may not commence any of the broader financial activities permissible for financial holding companies or acquire a company engaged in such financial activities without prior approval of the FRB. If the company does not return to compliance within 180 days, the FRB may require divestiture of the holding company’s depository institutions. Bank holding companies and banks must also be “well-capitalized” and “well-managed” in order to acquire banks located outside their home state.
In order for a financial holding company to commence any new activity permitted by the BHC Act or to acquire a company engaged in any new activity permitted by the BHC Act, each insured depository institution subsidiary of the financial holding company must have received a rating of at least “satisfactory” in its most recent examination under the Community Reinvestment Act (“CRA”). See the section captioned “Community Reinvestment Act”, below.
The FRB has the power to order any bank holding company or its subsidiaries to terminate any activity or to terminate its ownership or control of any subsidiary when the FRB has reasonable grounds to believe that continuation of such activity or such ownership or control constitutes a serious risk to the financial soundness, safety or stability of any bank subsidiary of the bank holding company.
Share Repurchases and Dividends
Under FRB regulations, the Company may not, without providing prior notice to the FRB, purchase or redeem its own common stock if the gross consideration for the purchase or redemption, combined with the net consideration paid for all such purchases or redemptions during the preceding twelve months, is equal to ten percent or more of the Company’s consolidated net worth.
FRB regulations provide that dividends shall not be paid except out of current earnings and unless the prospective rate of earnings retention by the Company appears consistent with its capital needs, asset quality, and overall financial condition. Tompkins’ primary source of funds to pay dividends on its common stock is dividends from its subsidiary banks. The subsidiary banks are subject to regulations that limit the dividends that they may pay to Tompkins. Member banks may not declare or pay a dividend during the current calendar year that exceeds the sum of the bank's net income during the current calendar year and the retained net income of the prior two calendar years, unless approved by the pertinent regulatory agencies.
Transactions with Affiliates and Other Related Parties
There are Federal laws and regulations that govern transactions between the Company’s non-bank subsidiaries and its banking subsidiaries, including Sections 23A and 23B of the Federal Reserve Act and related regulations. These laws establish certain quantitative limits and other prudent requirements for loans, purchases of assets, and certain other transactions between a member bank and its affiliates. In general, transactions between the Company’s banking subsidiaries and its non-bank subsidiaries must be on terms and conditions, including credit standards, that are substantially the same or at least as favorable to the banking subsidiaries as those prevailing at the time for comparable transactions involving non-affiliated companies. The Dodd-Frank Act significantly expanded the coverage and scope of the limitations on affiliate transactions within a banking organization.
The Company’s authority to extend credit to its directors, executive officers and 10% shareholders, as well as to entities controlled by such persons, is governed by the requirements of Sections 22(g) and 22(h) of the Federal Reserve Act and Regulation O as promulgated by the FRB. Among other things, these provisions require that extensions of credit to insiders (i) be made on terms that are substantially the same as, and follow credit underwriting procedures that are not less stringent than, those prevailing for comparable transactions with unaffiliated persons and that do not involve more than the normal risk of repayment or present other unfavorable features; and (ii) not exceed certain limitations on the amount of credit extended to such persons, individually and in the aggregate, which limits are based, in part, on the amount of the Bank’s capital. In addition, extensions of credit in excess of certain limits must be approved by the Bank’s board of directors.
Mergers and Acquisitions
The BHC Act, the Bank Merger Act, the Change in Bank Control Act and other federal and state statutes regulate acquisitions of interests in commercial banks. The BHC Act requires the prior approval of the FRB for the direct or indirect acquisition by a bank holding company of more than 5.0% of the voting shares of a commercial bank or its parent holding company and for a person, other than a bank holding company, to acquire 25% or more of any class of voting securities of a bank or bank holding
18
company. Under the Bank Merger Act, the prior approval of the FRB or other appropriate bank regulatory authority is required for a member bank to merge with another bank or purchase the assets or assume the deposits of another bank. In reviewing applications seeking approval of merger and acquisition transactions, the bank regulatory authorities will consider, among other things, the competitive effect and public benefits of the transactions, the capital position of the combined organization, the risks to the stability of the U.S. banking or financial system, the applicant’s performance record under the CRA (see the section captioned “Community Reinvestment Act” included elsewhere in this item) and fair housing laws and the effectiveness of the subject organizations in combating money laundering activities.
Source of Strength Doctrine
The Dodd-Frank Act requires bank holding companies to act as a source of financial and managerial strength to their subsidiary banks. Under this requirement, Tompkins is expected to commit resources to support its banking subsidiaries, including at times when it may not be advantageous for Tompkins to do so. Any capital loans by a bank holding company to any of its subsidiary banks are subordinated in right of payment to deposits and to certain other indebtedness of such subsidiary banks. In the event of a bank holding company’s bankruptcy, any commitment by the bank holding company to a federal bank regulatory agency to maintain the capital of a subsidiary bank will be assumed by the bankruptcy trustee and entitled to priority of payment.
Liability of Commonly Controlled Institutions
FDIC-insured depository institutions can be held liable for any loss incurred, or reasonably expected to be incurred, by the FDIC due to the default of an FDIC-insured depository institution controlled by the same bank holding company, or for any assistance provided by the FDIC to an FDIC-insured depository institution controlled by the same bank holding company that is in danger of default. “Default” means generally the appointment of a conservator or receiver. “In danger of default” means generally the existence of certain conditions indicating that default is likely to occur in the absence of regulatory assistance.
Capital Adequacy and Prompt Corrective Action
The Basel III Capital Rules were implemented by the FRB in 2013, became effective for Tompkins on January 1, 2015 and were subject to a phase-in period that concluded on January 1, 2019.
The Basel III Capital Rules, among other things, (i) introduced a new capital measure called “Common Equity Tier 1” (“CET1”), (ii) specified that Tier 1 capital consists of CET1 and “Additional Tier 1 capital” instruments meeting specified requirements, (iii) defined CET1 narrowly by requiring that most deductions/adjustments to regulatory capital measures be made to CET1 and not to the other components of capital and (iv) expanded the scope of the deductions/adjustments as compared to existing regulations.
| Basel III Capital- Timeline & Transition Period | |||||
| Phase-in Schedule | |||||
| Full Phase-in | |||||
| Ratio | 2015 | 2016 | 2017 | 2018 | 2019 |
| Minimum Tier 1 Leverage Capital Ratio | 4.0% | 4.0% | 4.0% | 4.0% | 4.0% |
| Minimum Common Equity Tier 1 Risk-based Capital Ratio | 4.5% | 4.5% | 4.5% | 4.5% | 4.5% |
| Minimum Tier 1 Risk-based Capital Ratio | 6.0% | 6.0% | 6.0% | 6.0% | 6.0% |
| Minimum Total Risk-based Capital Ratio | 8.0% | 8.0% | 8.0% | 8.0% | 8.0% |
| Buffer | |||||
| Capital Conservation Buffer | 0.00% | 0.625% | 1.25% | 1.875% | 2.50% |
| Minimum Common Equity Tier 1 Plus Capital Conservation Buffer | 4.5% | 5.125% | 5.75% | 6.375% | 7.00% |
| Minimum Tier 1 Capital Plus Capital Conservation Buffer | 6.0% | 6.625% | 7.25% | 7.875% | 8.50% |
| Minimum Total Capital Plus Capital Conservation Buffer | 8.0% | 8.625% | 9.25% | 9.875% | 10.50% |
| Deductions / Adjustments | |||||
| Phase-in of certain deductions and adjustments | 40% | 60% | 80% | 100% | |
Under Basel III, the Company is required to maintain a “capital conservation buffer” above the minimum risk-based capital requirements. The capital conservation buffer, fully phased in on January 1, 2019, is 2.5%. At December 31, 2018,2020, the Company complied with the capital conservation buffer requirement.
As fully phased in on January 1, 2019, the Basel III Capital Rules require Tompkins to maintain (i) a minimum ratio of CET1 to risk-weighted assets of at least 4.5%, plus a 2.5% capital conservation buffer (which when fully phased in, effectively results(resulting in a minimum ratio of CET1 to risk-weighted assets of at least 7.0%), (ii) a minimum ratio of Tier 1 capital to risk- weighted assets of at least 6.0%, plus the capital conservation buffer (which when fully phased-in, effectively results(resulting in a minimum Tier 1 capital ratio of 8.5%), (iii) a minimum ratio of Total capital (that is, Tier 1 plus Tier 2) to risk-weighted assets of at least 8.0%, plus the capital conservation buffer (which when fully phased in, effectively results(resulting in a minimum total capital ratio of 10.5%), and (iv) a minimum leverage ratio of 4.0%, calculated as the ratio of Tier 1 capital to average assets. If we have a ratio of CET1Banking institutions that fail to risk-weighted assets abovemeet the effective minimum but belowratios once the conservation buffer (or below the combined capital conservation buffer and countercyclical capital buffer, when the latter is applied), wetaken into account, as detailed above, will facebe subject to constraints on capital distributions, including dividends equityand share repurchases, and compensation basedcertain discretionary executive compensation. The severity of the constraints depends on the amount of the shortfall.shortfall and the institution’s “eligible retained income” (that is, the greater of (i) net income for the preceding four quarters, net of distributions and associated tax effects not reflected in net income and (ii) average net income over the preceding four quarters).
The Basel III Capital Rules also provide for a “countercyclical capital buffer” that is applicable to only certain covered institutions and is not expected to apply to Tompkins for the foreseeable future.
The Basel III Capital Rules imposed stricter regulatory capital deductions from and adjustments to capital, with most deductions and adjustments taken against CET1 capital. These include, for example, the requirement that (i) mortgage servicing assets, net of associated deferred tax liabilities; (ii) deferred tax assets, which cannot be realized through net operating loss carrybacks, net
of any relative valuation allowances and net of deferred tax liabilities; and (iii) significant investments (i.e. 10% or greater ownership) in unconsolidated financial institutions be deducted from CET1 to the extent that any one such category exceeds 10% of CET1 or all such categories in the aggregate exceed 15% of CET1. Implementation of the deductions and other
19
adjustments to CET1 began on January 1, 2015. The deductions were phased-in over a four-year period, beginning on January 1, 2015 and concluding on January 1, 2019.
Under the Basel III Capital Rules, the effect of certain accumulated other comprehensive items are not excluded, which could result in significant variations in the level of capital depending upon the impact of interest rate fluctuations on the fair value of the Company’s securities portfolio. Contained within the rule was a one-time option to permanently opt-out of the inclusion of accumulated other comprehensive income in the capital calculation based upon asset size. Tompkins decided to opt out of this requirement in January 2015.
The Basel III Capital Rules also required the phase-out of certain hybrid securities, such as trust preferred securities, as Tier 1 capital of bank holding companies. However, because the trust preferred securities held by Tompkins were issued prior to May 19, 2010, and because Tompkins’ total consolidated assets were less than $15.0 billion as of December 31, 2009, these trust preferred securities are permanently grandfathered under the final rule and may continue to be included as Tier 1 capital.
In addition, the Basel III Capital Rules provide more advantageous risk weights for derivatives and repurchase-style transactions cleared through a qualifying central counterparty and increase the scope of eligible guarantors and eligible collateral for purposes of credit risk mitigation.
The Standardized Approach Proposal expands the risk-weighting categories from the current four Basel I-derived categories (0%, 20%, 50% and 100%) to a much larger and more risk-sensitive number of categories, depending on the nature of the assets, generally ranging from 0% for U.S. government and agency securities, to 600% for certain equity exposures, and resulting in higher risk weights for a variety of asset categories, including many residential mortgages and certain commercial real estate loans. Specifics include, among other things:
– Applying a 150% risk weight instead of a 100% risk weight for certain high volatility commercial real estate acquisition, development and construction loans.
– For residential mortgage exposures, the current approach of a 50% risk weight for high-quality seasoned mortgages and a 100% risk-weight for all other mortgages is replaced with a risk weight of between 35% and 200% depending upon the mortgage’s loan-to-value ratio and whether the mortgage is a “category 1” or “category 2” residential mortgage exposure (based on eight criteria that include the term, use of negative amortization, balloon payments and certain rate increases).
– Assigning a 150% risk weight to exposures (other than residential mortgage exposures) that are 90 days past due.
– Providing for a 20% credit conversion factor for the unused portion of a commitment with an original maturity of one year or less that is not unconditionally cancellable (currently set at 0%).
– Providing for a risk weight, generally not less than 20% with certain exceptions, for securities lending transactions based on the risk weight category of the underlying collateral securing the transaction.
– Providing for a 100% risk weight for claims on securities firms.
– Eliminating the current 50% cap on the risk weight for OTC derivatives.
In February 2019, the federal bank regulatory agencies issued a final rule (the “2019 CECL Rule”) that revised certain capital regulations to account for changes to credit loss accounting under U.S. GAAP. The 2019 CECL Rule included a transition option that allows banking organizations to phase in, over a three-year period, the day-one adverse effects of adopting a new accounting standard related to the measurement of current expected credit losses (“CECL”) on their regulatory capital ratios (three-year transition option). In March 2020, the federal bank regulatory agencies issued an interim final rule that maintains the three-year transition option of the 2019 CECL Rule and also provides banking organizations that were required under U.S. GAAP (as of January 2020) to implement CECL before the end of 2020 the option to delay for two years an estimate of the effect of CECL on regulatory capital, relative to the incurred loss methodology’s effect on regulatory capital, followed by a three-year transition period (five-year transition option). We elected to adopt the five-year transition option. Accordingly, a CECL transitional amount totaling $1.6 million has been added back to CET1 as of December 31, 2020. The CECL transitional amount includes a $2.0 million decrease related to the cumulative effect of adopting CECL and a $3.6 million increase related to the estimated incremental effect of CECL since adoption.
Section 38 of the Federal Deposit Insurance Act (“FDIA”) requires federal banking agencies to take “prompt corrective action” (“PCA”) should an insured depository institutions fail to meet certain capital adequacy standards. If an insured depository institution is classified in one of the undercapitalized categories, it is required to submit a capital restoration plan to the appropriate federal banking agency and the holding company must guarantee the performance of that plan. Based upon its
20
capital levels, a bank that is classified as well- capitalized, adequately capitalized or undercapitalized, may be treated as though it were in the next lower capital category if the appropriate federal banking agency, after notice and opportunity for hearing, determines that an unsafe or unsound condition or an unsafe or unsound practice, warrants such treatment.
With respect to the Company’s banking subsidiaries, the Basel III Capital Rules revised the PCA regulations, by: (i) introducing a CET1 ratio requirement at each PCA category (other than critically undercapitalized), with the required CET1 ratio being 6.5% for well-capitalized status; (ii) increasing the minimum Tier 1 capital ratio requirement for each category, with the minimum Tier 1 capital ratio for well-capitalized status being 8% (as compared to 6%); and (iii) eliminating the provision that permitted a bank with a composite supervisory rating of 1 and a 3% leverage ratio to be considered adequately capitalized. The Basel III Capital Rules did not change the total risk- basedrisk-based capital requirement for any PCA category. Additionally, Bank holding companies and insured depository institutions may also be subject to potential enforcement actions of varying levels of severity for unsafe or
unsound practices in conducting their business or for violation of any law, rule, regulation, condition imposed in writing by federal banking agencies or term of a written agreement with such agency. The Company is in compliance, and management believes that the Company will continue to be in compliance, with the targeted capital ratios as such requirements are phased in.
For further information concerning the regulatory capital requirements, actual capital amounts and the ratios of Tompkins and its bank subsidiaries, see the discussion in “Note 20 - Regulations and Supervision” in Notes to Consolidated Financial Statements in Part II, Item 8. of this Report.
Deposit Insurance
Substantially all of the deposits of the Company’s banking subsidiaries are insured up to applicable limits by the Deposit Insurance Fund (“DIF”) of the FDIC and are subject to deposit insurance assessments to maintain the DIF. The Dodd-Frank Act permanently increased the maximum amount of deposit insurance to $250,000 per deposit category, per depositor, per institution retroactive to January 1, 2008.
The Company’s banking subsidiaries pay deposit insurance premiums to the FDIC based on assessment rates established by the FDIC. The assessment rates are based upon asset size and other risks the institution poses to the Deposit Insurance Fund, or DIF. Under this assessment system, risk is defined and measured using an institution’s supervisory ratings with other risk measures, including financial ratios. The current total base assessment rates on an annualized basis range from 1.5 basis points
In October 2010, the FDIC adopted a new Restoration Plan for certain “well-capitalized,” “well-managed” banks, with the highest ratings,DIF to 40 basis points for institutions posingensure that the most risk to the DIF. The FDIC may raise or lower these assessment rates on a quarterly basis based on various factors to achieve afund reserve ratio which the Dodd-Frank Act has mandated to be no less than 1.35 percent of insured deposits. In 2011, the FDIC redefined the deposit insurance assessment base to equal average consolidated total assets minus average tangible equityreached 1.35% by September 30, 2020, as required by the Dodd-Frank Act. On April 26, 2016, the FDIC adopted a rule amending pricing for deposit insurance for institutions with less than $10 billion in assets effective the quarter after the fund reserve ratio reached 1.15%. The fund reserve ratio reached 1.15% effective as of June 30, 2016. The Dodd-Frank Act required the FDIC to offset the effect of increasing the reserve ratio on insured depository institutions with total consolidated assets of less than $10 billion. In September 2018, the reserve ratio reached 1.36%, at which time banks with assets of less than $10 billion were awarded assessment credits for their portion of their assessments that contributed to the growth in the reserve ratio from 1.15% to 1.35%. When the reserve ratio reached 1.40% in June 2019, the FDIC applied these credits to assessment invoices for banks with assets of less than $10 billion. In 2019 and 2020, the Company's subsidiary banks applied credits of $1.5 million and $121,000, respectively, in the aggregate, to offset deposit insurance expense.
On June 26, 2020, the FDIC adopted a Final Rule to mitigate the effect on deposit insurance assessments resulting from an insured institution’s participation as a lender in the Paycheck Protection Program (PPP), the Paycheck Protection Program Liquidity Facility (PPPLF), and the Money Market Mutual Fund Liquidity Facility (MMLF). The regulation provides adjustments to remove the effects of participating in PPP, PPPLF, and MMLF on the assessment rate calculation, and an offset to assessments attributable to the MMLF and PPP assessment base increases. In 2020, the Company's subsidiary banks applied $71,000 of these credits to offset deposit insurance expense.
Under the FDIA, the FDIC may terminate deposit insurance upon a finding that the institution has engaged in unsafe and unsound practices, is in an unsafe or unsound condition to continue operations or has violated any applicable law, regulation, rule, order or condition imposed by the FDIC.
FDIC insurance expense totaled $2.4 million, $773,000 and $2.6 million $2.5 millionin 2020, 2019 and $3.0 million2018, respectively. The increase in expense between 2020 and 2019 and the decrease in expense between 2019 and 2018 2017 and 2016, respectively. FDIC insurance expense includeswas due to the deposit insurance assessments, and Financing Corporation (“FICO”) assessments related to outstanding FICO bonds. FICO is a mixed-ownership government corporation established by the Competitive Equality Banking Actcredits mentioned above, which were recognized mainly in 2019.
21
Depositor Preference
The FDIA provides that, in the event of the “liquidation or other resolution” of an insured depository institution, such as the Company’s subsidiary banks, the claims of depositors of the institution, including the claims of the FDIC, as subrogee of the insured depositors, and certain claims for administrative expenses of the FDIC as receiver, will have priority over other general unsecured claims against the institution. If an insured depository institution fails, insured and uninsured depositors, along with the FDIC, will have priority in payment ahead of unsecured, non-deposit creditors, including the parent bank holding company, with respect to any extensions of credit they have made to such insured depository institutions.
Community Reinvestment Act
The CRA and the regulations issued thereunder are intended to encourage banks to help meet the credit needs of their entire service area, including low and moderate income neighborhoods, consistent with the safe and sound operations of such banks. These regulations also provide for regulatory assessment of a bank’s record in meeting the needs of its service area when considering applications to establish branches, merger applications and applications to acquire the assets and assume the liabilities of another bank. As of December 31, 2018,2020, the Company’s subsidiary banks all had ratings of satisfactory or better.
In April 2018, the U.S. Department of Treasury issued a memorandum to the federal banking regulators with recommended changes to the CRA’s implementing regulations to reduce their complexity and associated burden on banks. In December 2019, the OCC and FDIC issued a notice of proposed rulemaking intended to (i) clarify which activities qualify for CRA credit; (ii) update where activities count for CRA credit; (iii) create a more transparent and objective method for measuring CRA performance; and (iv) provide for more transparent, consistent, and timely CRA-related data collection, recordkeeping, and reporting. However, the Federal Reserve did not join the proposed rulemaking. In May 2020, the OCC issued its final CRA rule, effective October 1, 2020. The FDIC has not finalized the revisions to its CRA rule. In September 2020, the Federal Reserve Board issued an Advance Notice of Proposed Rulemaking (“ANPR”) that invites public comment on an approach to modernize the regulations that implement the CRA by strengthening, clarifying, and tailoring them to reflect the current banking landscape and better meet the core purpose of the CRA. The ANPR seeks feedback on ways to evaluate how banks meet the needs of low- and moderate-income communities and address in equities in credit access. As such, we will continue to evaluate the impact of any changes to the regulations implementing the CRA and their impact on our financial condition, results of operations, and/or liquidity, which cannot be predicted at this time. The Company will continue to evaluate the impact of any changes to the regulations implementing the CRA.
Federal Securities Laws
The common stock of the Company is registered with the SEC under the Securities Exchange Act of 1934, as amended (the “Exchange Act”). Therefore, the Company is subject to the reporting, information disclosure, proxy solicitation and other requirements imposed on public companies by the SEC under the Exchange Act. Additionally, Company insiders are subject to security trading limitations and are required to file insider ownership reports with the SEC. The SEC and NYSE American have adopted regulations under the Sarbanes-Oxley Act of 2002 (“Sarbanes-Oxley”) and the Dodd-Frank Act that apply to the Company as an exchange-traded, public company, which seek to improve corporate governance, accounting, and reporting requirements, provide enhanced penalties for financial reporting improprieties and improve the reliability of disclosures in SEC filings. For example, the Sarbanes-Oxley requirements include: (1) requirements for audit committees, including independence and financial expertise; (2) certification of financial statements by the chief executive officer and chief financial officer of the reporting company;
(3) standards for auditors and regulation of audits; (4) disclosure and reporting requirements for the reporting company and directors and executive officers; and (5) a range of civil and criminal penalties for fraud and other violations of securities laws.
Anti-Money Laundering and the USA Patriot Act
The Uniting and Strengthening America by Providing Appropriate Tools Required to Intercept and Obstruct Terrorism Act of 2001 (“USA Patriot Act”), the Bank Secrecy Act, the Money Laundering Control Act, and other federal laws, collectively impose obligations on all financial institutions, including the Company, to implement policies, procedures and controls which are reasonably designed to detect and report instances of money laundering and the financing of terrorism. Failure of a financial institution to maintain and implement adequate programs to combat money laundering and terrorist financing, or to comply with all of the relevant laws or regulations, could have serious legal and reputational consequences for the institution, including causing applicable bank regulatory authorities not to approve merger or acquisition transactions when regulatory approval is required or to prohibit such transactions even if approval is not required.
The Anti-Money Laundering Act of 2020 (“AMLA”), which amends the Bank Secrecy Act of 1970 (“BSA”), was enacted in January 2021. The AMLA is intended to be a comprehensive reform and modernization to U.S. bank secrecy and anti-money laundering laws. Among other things, it codifies a risk-based approach to anti-money laundering compliance for financial institutions; requires the development of standards for evaluating technology and internal processes for BSA compliance; and
22
expands enforcement- and investigation-related authority, including increasing available sanctions for certain BSA violations and instituting BSA whistleblower incentives and protections.
Financial Privacy
The Gramm-Leach-Bliley Act of 1999 (“GLBA”) requires that financial institutions implement comprehensive written information security programs that include administrative, technical and physical safeguards designed to protect consumer information. Under the GLBA, federal banking regulators adopted rules that limit the ability of banks and other financial institutions to disclose non-public information about consumers to non-affiliated third parties. These limitations require disclosure of privacy policies and certain security breaches to consumers and, in some circumstances, allow consumers to prevent disclosure of certain personal information to a non-affiliated third party. These provisions affect, among other things, how consumer information is transmitted through diversified financial companies and conveyed to outside vendors.
Office of Foreign Assets Control Regulation
The United States has imposed economic sanctions that affect transactions with designated foreign countries, nationals and others. These are known as the “OFAC” rules based on their administration by the U.S. Treasury Department Office of Foreign Assets Control (“OFAC”). The OFAC-administered sanctions take many forms. Generally, however, they contain one or more of the following elements: (i) restrictions on trade with or investment in a sanctioned country, including prohibitions against direct or indirect imports from and exports to a sanctioned country and prohibitions on “U.S. persons” engaging in financial transactions relating to making investments in, or providing investment-related advice or assistance to, a sanctioned country; and (ii) a blocking of assets in which the government or specially designated nationals of the sanctioned country have an interest, by prohibiting transfers of property subject to a U.S. jurisdiction (including property in the possession or control of U.S. persons). Blocked assets (e.g., property and bank deposits) cannot be paid out, withdrawn, set off or transferred in any manner without a license from OFAC. Failure to comply with these sanctions could have serious legal and reputational consequences.
Consumer Protection Laws
In connection with their lending and leasing activities, the Company’s banking subsidiaries are subject to a number of federal and state laws designed to protect borrowers and promote lending. These laws include the Equal Credit Opportunity Act, the Fair Credit Reporting Act, the Fair and Accurate Credit Transaction Act of 2003, Electronic Funds Transfer Act, the Expedited Funds Availability Act, the Truth in Lending Act, the Truth in Savings Act, the Home Mortgage Disclosure Act, and the Real Estate Settlement Procedures Act, and similar laws at the state level. The Company’s failure to comply with any of the consumer financial laws can result in civil actions, regulatory enforcement action by the federal banking agencies and the U.S. Department of Justice.
Additionally, the Dodd-Frank Act established a new Bureau of Consumer Financial Protection (“CFPB”) with broad powers to supervise and enforce consumer protection laws. The CFPB has broad rule-making authority for a wide range of consumer protection laws that apply to all banks and savings institutions, including the authority to prohibit “unfair, deceptive or abusive” acts and practices. The CFPB has examination and enforcement authority over all banks and savings institutions with more than $10 billion in assets. The Company and its subsidiaries are required to comply with the rules of the CFPB; however, these rules are generally enforced by our primary regulators, the FRB and the FDIC.
Cybersecurity
The BankCompany is also subject to data security standards and privacy and data breach notice requirements as established by federal and state regulators. Federal banking agencies, through the Federal Financial Institutions Examination Council, have adopted guidelines to encourage financial institutions to address cybersecurity risks and identify, assess and mitigate these risks, both internally and at critical third party service providers. For example, federal banking regulators have highlighted that financial institutions should establish several lines of defense and design their risk management processes to address the risk posed by compromised customer credentials. Further, financial institutions are expected to maintain sufficient business continuity planning processes designed to facilitate a recovery, resumption and maintenance of the institution’s operations after a cyber-attack.
In December 2020, the federal banking agencies issued a Notice of Proposed Rulemaking that would require banking organizations to notify their primary regulator within 36 hours of becoming aware of a “computer-security incident” or a “notification incident.” The Notice of Proposed Rulemaking also would require specific and immediate notifications by bank service providers that become aware of similar incidents.
Additionally, the Company must comply with a NYSDFS rule entitled “Cybersecurity Requirements for Financial Services Companies,” which became effective March 1, 2017, subject to a full phase-in over the following two years, concluding in
23
2019. This NYSDFS rule requires financial services companies, including Tompkins, to maintain a maintain a cybersecurity program designed to protect the confidentiality, integrity and availability of the company’s information systems, establish cybersecurity policies and procedures, identify persons responsible for implementing and enforcing the cybersecurity program and cybersecurity policies and procedures, and conduct periodic risk assessments of its information systems. See Item 1A. Risk Factors for a further discussion of risks related to cybersecurity.
Incentive Compensation
The Dodd-Frank Act required the federal bank regulatory agencies and the SEC to establish joint regulations or guidelines prohibiting incentive-based payment arrangements at specified regulated entities, such as the Company, having at least $1 billion in total assets that encourage inappropriate risks by providing an executive officer, employee, director or principal shareholder with excessive compensation, fees, or benefits or that could lead to material financial loss to the entity. In addition, these regulators must establish regulations or guidelines requiring enhanced disclosure to regulators of incentive-based compensation arrangements. The agencies proposed such regulations in May 2016.2016, which have not been finalized. If these or other regulations are adopted in a form similar to that initially proposed, they will impose limitations on the manner in which the Company may structure compensation for its executives. Given the uncertainty at this time whether or when a final rule will be adopted, management cannot determine the potential impact on the Company.
Additionally, the FRB, OCC and FDIC have issued comprehensive final guidance on incentive compensation policies intended to ensure that the incentive compensation policies of banking organizations do not undermine the safety and soundness of such organizations by encouraging excessive risk-taking. The guidance, which covers all employees that have the ability to materially affect the risk profile of an organization, either individually or as part of a group, is based upon the key principles that a banking organization’s incentive compensation arrangements should (i) provide incentives that do not encourage risk-taking beyond the organization’s ability to effectively identify and manage risks, (ii) be compatible with effective internal controls and risk management, and (iii) be supported by strong corporate governance, including active and effective oversight by the organization’s board of directors. Management believes the current and past compensation practices of the Company do not encourage excessive risk taking or undermine the safety and soundness of the organization.
The FRB reviews, as part of the regular, risk-focused examination process, the incentive compensation arrangements of banking organizations, such as the Company, that are not “large, complex banking organizations.” The findings of the supervisory initiatives are included in reports of examination and deficiencies can lead to limitations on the Company’s abilities and even enforcement actions.
The Company is also subject to the NYSDFS rule “Guidance on Incentive Compensation Arrangements,” which directs all New York state regulated banks (including the Trust Company, Tompkins Bank of Castile, and Tompkins Mahopac Bank) to ensure that any employee incentive arrangements do not encourage inappropriate risk-taking or improper sales practices. Under this guidance, incentive compensation based on employee performance indicators may only be paid if the bank has effective risk management, oversight and control systems in place. We believe the Company is compliant with all state and federal regulation regarding incentive compensation
Other LegislativeGovernmental Initiatives
From time to time, various legislative and regulatory initiatives are introduced in Congress and state legislatures, as well as by regulatory authorities. These initiatives may include proposals to expand or contract the powers of bank holding companies and depository institutions, proposals to change the financial institution regulatory environment, or proposals that affect public companies generally. Such legislation could change banking laws and the operating environment of Tompkins in substantial, but unpredictable ways. We cannot predict whether any such legislation will be enacted, and, if enacted, the effect that it, or any implementing regulations would have on our financial condition or results of operations.
As described in Item 7. Management’s Discussion and Analysis of Financial Condition and Results of Operations - COVID-19 Pandemic and Recent Events, federal, state and local governments have taken a variety of actions in response to the COVID-19 Pandemic, including the Coronavirus Aid, Relief and Economic Security Act (the "CARES Act") and the Consolidated Appropriations Act, 2021 and the rules and regulations promulgated thereunder. Among other impacts on the Company, these actions require lenders to offer loan payment deferrals, forbearance and other relief to certain borrowers (e.g., waiving late payment and other fees), under certain circumstances. These actions also affected the accounting treatment of certain loan modifications made for borrowers experiencing financial hardship as a result of the COVID-19 Pandemic.
Employees and Human Capital
At Tompkins Financial, our culture is underpinned by our core values, including “a commitment to our employees.” As of December 31, 2018,2020, the Company had 1,0351,084 total employees, approximately 116which included 978 full-time employees and 106 part-time and temporary employees. Of the Company’s total employees, 855 are employed by one of whom were part-time.our four subsidiary banks, 61 employees
24
are in our wealth management subsidiary (Tompkins Financial Advisors), and 168 employees are in our insurance subsidiary (Tompkins Insurance Agencies). Our entire organization relies on our Shared Services division, which provides administrative and operational support to all of our subsidiaries. Because our Shared Services division is part of Tompkins Trust Company, the employees of this division are included in bank employee count listed above. No employees are covered by a collective bargaining agreement, and the Company believes its employee relations are excellent.
The success and growth of our business is largely dependent on our ability to attract, develop, and retain qualified employees at all levels of our organization.
A key component of our recruitment and retention strategy is to offer employees at all levels the opportunity to participate in the Company’s success. The Company maintains a robust Profit Sharing plan for all employees who meet minimum service requirements. As of December 31, 2020, 74% of all employees received a profit sharing contribution during 2020. We also offer incentive and/or equity compensation plans or programs to employees at many levels of our Company and, as of December 31, 2020, 56% of all employees had an opportunity to earn supplemental compensation reflective of their position and overall contributions towards the Company’s strategic objectives.
To support the development of our employees, we provide a variety of resources to help them grow in their current roles and build new skills. We utilize internally developed training programs and customized corporate training engagements to encourage employees at all levels of our organization to engage with different learning opportunities. We also host a series of leadership and professional development programs to invest in the continued growth of our current and future leaders and key contributors. We converted many of these programs to virtual learning as part of our business continuity efforts, beginning in 2020.
The Company strives to promote a culture of diversity, inclusion and belonging. We created our enterprise-wide Diversity, Inclusion & Belonging team whose objective is to create an inclusive work environment by focusing on initiatives and events that recognize and engage our employees, and which strengthen our employees’ sense of belonging within our organization. Our Diversity, Inclusion & Belonging team recommends educational/training opportunities, celebrates cultural events, and sends representatives to support other employee engagement initiatives.
In response to the COVID-19 pandemic, the Company took swift action to ensure business continuity, and to support the well-being of our employees. We established a Pandemic Response Team led by our Chief Risk Officer and our Director of Human Resources. With support from our information technology team, the Pandemic Response Team oversaw the rapid shift to a remote work environment for the majority of our employees. In addition, the Company implemented a variety of operational practices designed to decrease the risk of COVID-19 spread among our on-site team members and our customers. A more detailed description of the Company’s pandemic-response efforts on behalf of our employees and our customers appears under the heading, “Management’s Discussion and Analysis of Financial Condition and Results of Operations - COVID-19 Pandemic and Recent Events.”
Available Information
The Company maintains a website at www.tompkinsfinancial.com. The Company makes available free of charge through its website its annual reports on Form 10-K, quarterly reports on Form 10-Q, current reports on Form 8-K, its proxy statements related to its shareholders’ meetings, and amendments to these reports or statements, filed or furnished pursuant to Section 13(a) or 15(d) of the Exchange Act, as soon as reasonably practicable after the Company electronically files such material with, or furnishes such material to, the SEC. Copies of these reports are also available at no charge to any person who requests them, with such requests directed to Tompkins Financial Corporation, Investor Relations Department, 118 E. Seneca St., P.O. Box 460, Ithaca, New York 14850, telephone no. (888) 503-5753. The SEC maintains an Internet website that contains reports, proxy and information statements and other information regarding issuers that file electronically with the SEC, including material filed by the Company, at www.sec.gov. The information contained on the Company's website is provided for the information of the reader and it is not intended to be active links. The Company is not including the information contained on the Company’s website as a part of, or incorporating it by reference into, this Annual Report on Form 10-K, or into any other report filed with or furnished to the SEC by the Company.
Item 1B. Unresolved Staff Comments
None.
Item 2. Properties
25
The Company’s executive offices are located at 118 East Seneca Street in Ithaca. Our new headquarters was completed at this location in the second quarter of 2018, resulting in the consolidation of some staff and operations into a single location; and enabling the Company to sell two previously-owned buildings in Ithaca, New York.
The Company’s banking subsidiaries have 6664 branch offices, of which 34 are owned and 3230 are leased at market rents. The Company’s insurance subsidiary has 5 stand-alone offices, of which 3 are owned by the Company and 2 are leased at market rents. The Company’s wealth management and financial planning division has 2 offices which are leased at a market rent, and shares other locations with the Company’s other subsidiaries. Management believes the current facilities are suitable for their present and intended purposes. For additional information about the Company’s facilities, including rental expenses, see “Note 6 Premises and Equipment” in Notes to Consolidated Financial Statements in Part II, Item 8. of this Report.
Item 3. Legal Proceedings
The Company is subject to various claims and legal actions that arise in the ordinary course of conducting business. ManagementAs of December 31, 2020, management, after consultation with legal counsel, does not expectanticipate that the aggregate ultimate dispositionliability arising out of these matterslitigation pending or threatened against the Company or its subsidiaries will be material to have a material adverse impact on the Company’s consolidated financial statements.position. On at least a quarterly basis, the Company assesses its liabilities and contingencies in connection with such legal proceedings. Although the Company does not believe that the outcome of pending litigation will be material to the Company’s consolidated financial position, it cannot rule out the possibility that such outcomes will be material to the consolidated results of operations for a particular reporting period in the future.
Item 4. Mine Safety Disclosures
Not applicableapplicable.
Information About Our Executive Officers of the Registrant
The information concerning the Company’s executive officers is provided below as of March 1, 2019.2021.
| Name | Age | Title | Year Joined Company | ||||||||
| Stephen S. Romaine | President and CEO | January 2000 | |||||||||
| David S. Boyce | Executive Vice President | January 2001 | |||||||||
| Francis M. Fetsko | Executive Vice President, COO, CFO and Treasurer | October 1996 | |||||||||
| Alyssa H. Fontaine | Executive Vice President & General Counsel | January 2016 | |||||||||
| Scott L. Gruber | Executive Vice President | April 2013 | |||||||||
| Gregory J. Hartz | Executive Vice President | August 2002 | |||||||||
| Brian A. Howard | Executive Vice President | July 2016 | |||||||||
| Gerald J. Klein, Jr. | Executive Vice President | January 2000 | |||||||||
| John M. McKenna | Executive Vice President | April 2009 | |||||||||
| Susan M. Valenti | Executive Vice President of Corporate Marketing | March 2012 | |||||||||
| Steven W. Cribbs | Senior Vice President, Chief Risk Officer | June 2018 | |||||||||
| Bonita N. Lindberg | Senior Vice President, Director of Human Resources | December 2015 | |||||||||
Business Experience of the Executive Officers:
Stephen S. Romaine was appointed President and Chief Executive Officer of the Company effective January 1, 2007. From 2003 through 2006, he served as President and Chief Executive Officer of Mahopac Bank. Mr. Romaine currently serves on the board of the Federal Home Loan Bank of New York and the New York Bankers Association.
David S. Boyce has been employed by the Company since January 2001 and was promoted to Executive Vice President in April 2004. He was appointed President and Chief Executive Officer of Tompkins Insurance Agencies in 2002. He has been employed by Tompkins Insurance Agencies and a predecessor company to Tompkins Insurance Agencies for 2931 years.
Francis M. Fetsko has been employed by the Company since 1996, and has served as Chief Financial Officer since December 2000. He also serves as the Chief Financial Officer for the Company’s four banking subsidiaries. In July 2003, he was promoted to Executive Vice President and he assumed the additional role of Chief Operating Officer in April 2012.
26
Alyssa H. Fontaine joined the Company in January 2016 as Executive Vice President and General Counsel. She had previously been a partner in the corporate/securities practice group of Harris Beach PLLC, a regional law firm which she joined in 2006. Ms. Fontaine serves on the American Bankers Association General Counsels Committee.
Scott L. Gruber has been employed by the Company since April 2013 and was appointed President & COO of VIST Bank and Executive Vice President of the Company effective April 30, 2013. He was appointed President & CEO of VIST Bank effective January 1, 2014. Before joining VIST Bank, Mr. Gruber spent 16 years at National Penn Bank, most recently as Group Executive Vice President, where he led the Corporate Banking team.
Gregory J. Hartz has been employed by the Company since 2002 and was appointed President and Chief Executive Officer of Tompkins Trust Company and Executive Vice President of the Company effective January 1, 2007. Mr. Hartz is past Chair of the Independent Bankers Association of New York State.
Brian A. Howard has been employed by the Company since July 2016 and was appointed President of Tompkins Financial Advisors and Executive Vice President of the Company effective July 25, 2016. Prior to joining Tompkins, he served as a Senior Vice President, Market Manager for Key Bank covering the Central New York region from May 2012 to July 2016, where he oversaw the bank’s full service wealth management division for high net worth clients.
Gerald J. Klein, Jr. has been employed by the Company since 2000 and was appointed President and Chief Executive Officer of Mahopac Bank and Executive Vice President of the Company effective January 1, 2007. Mr. Klein currently serves on the Board of the Independent Bankers Association of New York (IBANYS) and is as a member of the Community Depository Institutions Advisory Council of the Federal Reserve Bank of NY.
John M. McKenna has been employed by the Company since April 2009. He was appointed President and CEO of The Bank of Castile effective January 1, 2015. From 2009 to 2014, Mr. McKenna was a senior vice president at The Bank of Castile, concentrating in commercial lending. Mr. McKenna currently servespreviously served on the New York Bankers Association Political Action Committee (NYBA PAC).
Susan M. Valenti joined Tompkins in March of 2012 as Senior Vice President, Corporate Marketing. She was promoted to Executive Vice President of the Company in June 2014.
Steven W. Cribbs joined Tompkins in June 2018 as Senior Vice President, Chief Risk Officer. Prior to joining Tompkins, Mr. Cribbs served as Director of Enterprise Risk Management at Customers Bancorp, Inc. from 2016 to 2018 and Senior Vice President and Chief Risk Officer at Metro Bancorp, Inc. from 2012 to 2016.
Bonita N. Lindberg joined Tompkins in December 2015 as Senior Vice President, Director of Human Resources. Before joining the Company, Ms. Lindberg served as Director of Human Resources at Cortland Regional Medical Center (2014 - 2015); prior to that she served as the Director of Organizational Development at Albany International Corporation. Ms. Lindberg serves on the HR Conference Committee for New York Bankers Association.
27
PART II
Item 5. Market for Registrant’s Common Equity, Related Stockholder Matters and Issuer Purchases of Equity Securities
Market Price and Dividend Information
The Company’s common stock is traded under the symbol “TMP” on the NYSE American.
While the Company has a long history of paying cash dividends on shares of its common stock, the Company's ability to pay dividends is generally limited to earnings from the prior year, although retained earnings and dividends from its subsidiaries may also be used to pay dividends under certain circumstances. The Company's primary source of funds to pay for shareholder dividends is receipt of dividends from its subsidiaries. Future dividend payments to the Company by its subsidiaries will be dependent on a number of factors, including earnings and the financial condition of each subsidiary, and are subject to regulatory limitations discussed in "Supervision and Regulation" in Part I, Item 1 of this Report.
The following table reflects all Company repurchases, including those made pursuant to publicly announced plans or programs, during the quarter ended December 31, 2018.2020.
| Issuer Purchases of Equity Securities | ||||||||||||
| Total Number of Shares Purchased | Average Price Paid Per Share | Total Number of Shares Purchased as Part of Publicly Announced Plans or Programs | Maximum Number (or Approximate Dollar Value) of Shares that May Yet Be Purchased Under the Plans or Programs | |||||||||
| Period | (a) | (b) | (c) | (d) | ||||||||
| October 1, 2018 through | ||||||||||||
| October 31, 2018 | 2,741 | $ | 75.20 | 1,483 | 398,517 | |||||||
| November 1, 2018 through | ||||||||||||
| November 30, 2018 | 13,826 | $ | 76.64 | 1,500 | 397,017 | |||||||
| December 1, 2018 through | ||||||||||||
| December 31, 2018 | 14,000 | $ | 73.30 | 14,000 | 383,017 | |||||||
| Total | 30,567 | $ | 74.98 | 16,983 | 383,017 | |||||||
| Issuer Purchases of Equity Securities | |||||||||||||||||||||||
| Total Number of Shares Purchased | Average Price Paid Per Share | Total Number of Shares Purchased as Part of Publicly Announced Plans or Programs | Maximum Number (or Approximate Dollar Value) of Shares that May Yet Be Purchased Under the Plans or Programs | ||||||||||||||||||||
| Period | (a) | (b) | (c) | (d) | |||||||||||||||||||
| October 1, 2020 through | |||||||||||||||||||||||
| October 31, 2020 | 2,232 | $ | 58.72 | 0 | 328,712 | ||||||||||||||||||
| November 1, 2020 through | |||||||||||||||||||||||
| November 30, 2020 | 36,854 | $ | 62.94 | 14,000 | 314,712 | ||||||||||||||||||
| December 1, 2020 through | |||||||||||||||||||||||
| December 31, 2020 | 42,402 | $ | 68.66 | 42,402 | 272,310 | ||||||||||||||||||
| Total | 81,488 | $ | 65.80 | 56,402 | 272,310 | ||||||||||||||||||
Included above are 1,2582,232 shares purchased in October 2018,2020, at an average cost of $78.92,$58.72, and 547749 shares purchased in November 2018,2020, at an average cost of $78.35,$63.52, by the trustee of the rabbi trust established by the Company under the Company’s Stock Retainer Plan For Eligible Directors of Tompkins Financial Corporation and Participating Subsidiaries, which were part of the director deferred compensation under that plan. In addition, the table includes 11,77922,105 shares delivered to the Company in November 20182020 at an average cost of $77.02$62.85 to satisfy mandatory tax withholding requirements upon vesting of restricted stock under the Company's 2009 and 2019 Equity Plan.Plans.
On July 19, 2018, the Company’s Board of Directors authorized a share repurchase plan (the “2018 Repurchase Plan”) for the Company to repurchase up to 400,000 shares of the Company’s common stock. Purchases may be madestock over the 24 months following adoption of the plan. The repurchase program could be suspended, modified or terminated by the Board of Directors at any time for any reason. Under the 2018 Repurchase Plan, the Company repurchased 393,004 shares through December 31, 2019, at an average cost of $79.15.
On January 30, 2020, the Company’s Board of Directors authorized a share repurchase plan (the “2020 Repurchase Plan”) for the repurchase of up to 400,000 shares of the Company’s common stock over the 24 months following adoption of the plan. As with the 2018 Repurchase Plan, shares may be repurchased from time to time under the 2020 Repurchase Plan in open market transactions at prevailing market prices, in privately negotiated transactions, or by other means in accordance with federal securities laws, and the repurchase program may be suspended, modified or terminated by the Board of Directors at any time for any reason. This plan replaced the Company's 400,000 share plan announced on July 21, 2016 which expired in July 2018. Under the current plan,2020 Repurchase Plan, the Company repurchased 16,983127,690 shares through December 31, 2018,2020, at an average cost of $73.17.$73.72.
28
Recent Sales of Unregistered Securities
None.
Performance Graph
The following graph compares the Company’s cumulative total stockholder return over the five-year period from December 31, 20132015 through December 31, 2018,2020, with (1) the total return for the NASDAQ Composite and (2) the total return for SNL Bank Index. The graph assumes $100.00 was invested on December 31, 2013,2015, in the Company’s common stock and the comparison groups and assumes the reinvestment of all cash dividends prior to any tax effect and retention of all stock dividends.
In accordance with and to the extent permitted by applicable law or regulation, the information set forth below under the heading “Performance Graph” shall not be incorporated by reference into any future filing under the Securities Act or Exchange Act and shall not be deemed to be “soliciting material” or to be “filed” with the SEC under the Securities Act or the Exchange Act, except to the extent that the Company specifically requests that such information be treated as soliciting material or specifically incorporates it by reference into such filings. The performance graph represents past performance and should not be considered an indication of future performance.
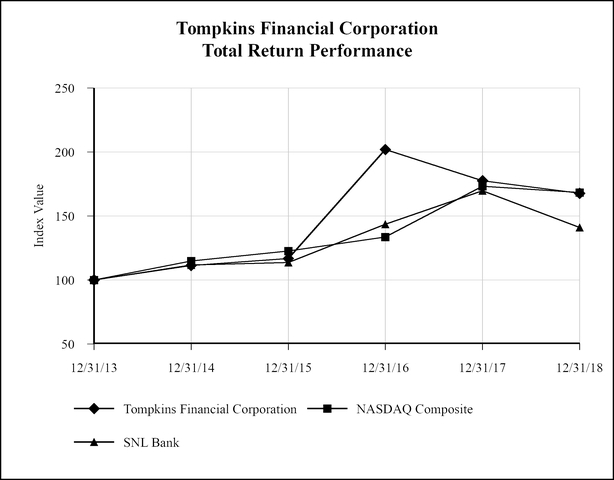
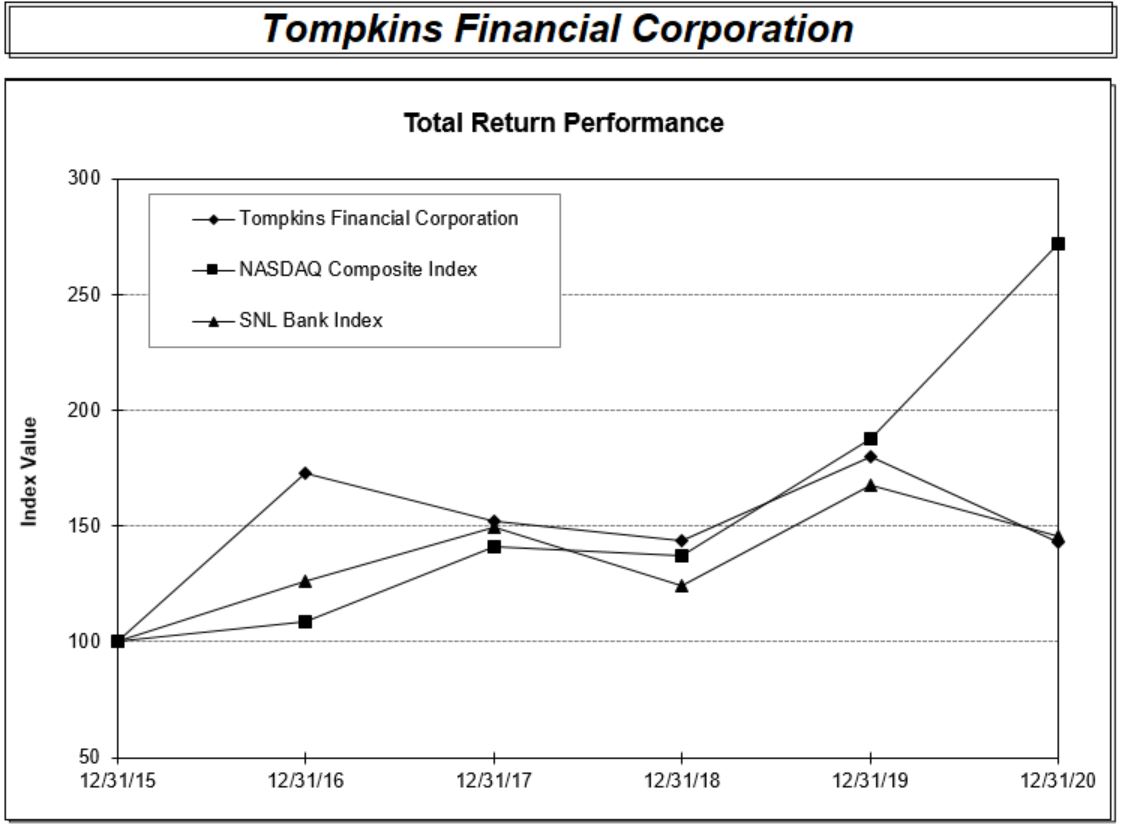
| Period Ending | ||||||||||||||||||||
| Index | 12/31/15 | 12/31/16 | 12/31/17 | 12/31/18 | 12/31/19 | 12/31/20 | ||||||||||||||
| Tompkins Financial Corporation | 100.00 | 172.99 | 152.11 | 143.69 | 179.65 | 143.03 | ||||||||||||||
| NASDAQ Composite | 100.00 | 108.87 | 141.13 | 137.12 | 187.44 | 271.64 | ||||||||||||||
| SNL Bank | 100.00 | 126.35 | 149.21 | 124.00 | 167.93 | 145.49 | ||||||||||||||
29
| Period Ending | ||||||
| Index | 12/31/13 | 12/31/14 | 12/31/15 | 12/31/16 | 12/31/17 | 12/31/18 |
| Tompkins Financial Corporation | 100.00 | 111.35 | 116.71 | 201.90 | 177.53 | 167.70 |
| NASDAQ Composite | 100.00 | 114.75 | 122.74 | 133.62 | 173.22 | 168.30 |
| SNL Bank | 100.00 | 111.79 | 113.69 | 143.65 | 169.64 | 140.98 |
Item 6. Selected Financial Data
The following consolidated selected financial data is taken from the Company’s audited financial statements as of and for the five years ended December 31, 2018.2020. The following selected financial data should be read in conjunction with the consolidated financial statements and the notes thereto in Part II, Item 8. of this Report. All of the Company’s acquisitions during the five year period were accounted for using the purchase method. Accordingly, the operating results of the acquired companies are included in the Company’s results of operations since their respective acquisition dates.
| Year ended December 31, | |||||||||||||||||||||||||||||
| (In thousands, except per share data) | 2020 | 2019 | 2018 | 2017 | 2016 | ||||||||||||||||||||||||
| FINANCIAL STATEMENT HIGHLIGHTS | |||||||||||||||||||||||||||||
| Assets | $ | 7,622,171 | $ | 6,725,623 | $ | 6,758,436 | $ | 6,648,290 | $ | 6,236,756 | |||||||||||||||||||
| Total loans | 5,260,327 | 4,917,550 | 4,833,939 | 4,669,120 | 4,258,033 | ||||||||||||||||||||||||
| Deposits | 6,437,752 | 5,212,921 | 4,888,959 | 4,837,807 | 4,625,139 | ||||||||||||||||||||||||
| Other borrowings | 265,000 | 658,100 | 1,076,075 | 1,071,742 | 884,815 | ||||||||||||||||||||||||
| Total equity | 717,689 | 663,054 | 620,871 | 576,202 | 549,405 | ||||||||||||||||||||||||
| Interest and dividend income | 254,330 | 261,378 | 251,592 | 226,764 | 202,739 | ||||||||||||||||||||||||
| Interest expense | 28,991 | 50,750 | 39,792 | 25,460 | 22,103 | ||||||||||||||||||||||||
| Net interest income | 225,339 | 210,628 | 211,800 | 201,304 | 180,636 | ||||||||||||||||||||||||
| Provision for credit loss expense | 16,151 | 1,366 | 3,942 | 4,161 | 4,321 | ||||||||||||||||||||||||
| Net gains (losses) on securities transactions | 443 | 645 | (466) | (407) | 926 | ||||||||||||||||||||||||
| Net income attributable to Tompkins Financial Corporation | 77,588 | 81,718 | 82,308 | 52,494 | 59,340 | ||||||||||||||||||||||||
| PER SHARE INFORMATION | |||||||||||||||||||||||||||||
| Basic earnings per share | 5.22 | 5.39 | 5.39 | 3.46 | 3.94 | ||||||||||||||||||||||||
| Diluted earnings per share | 5.20 | 5.37 | 5.35 | 3.43 | 3.91 | ||||||||||||||||||||||||
Adjusted diluted earnings per share1 | 5.24 | 5.37 | 5.33 | 4.42 | 3.91 | ||||||||||||||||||||||||
| Cash dividends per share | 2.10 | 2.02 | 1.94 | 1.82 | 1.77 | ||||||||||||||||||||||||
| Common equity per share | 47.98 | 44.17 | 40.45 | 37.65 | 36.20 | ||||||||||||||||||||||||
| SELECTED RATIOS | |||||||||||||||||||||||||||||
| Return on average assets | 1.05 | % | 1.22 | % | 1.23 | % | 0.82 | % | 1.01 | % | |||||||||||||||||||
| Return on average equity | 11.09 | % | 12.55 | % | 13.93 | % | 9.09 | % | 10.85 | % | |||||||||||||||||||
| Average shareholders’ equity to average assets | 9.51 | % | 9.75 | % | 8.83 | % | 9.04 | % | 9.28 | % | |||||||||||||||||||
| Dividend payout ratio | 40.23 | % | 37.48 | % | 35.99 | % | 52.60 | % | 44.92 | % | |||||||||||||||||||
| OTHER SELECTED DATA (in whole numbers, unless otherwise noted) | |||||||||||||||||||||||||||||
| Employees (average full-time equivalent) | 1,057 | 1,047 | 1,035 | 1,041 | 1,019 | ||||||||||||||||||||||||
| Banking offices | 64 | 64 | 66 | 65 | 66 | ||||||||||||||||||||||||
| Bank access centers (ATMs) | 85 | 87 | 83 | 84 | 85 | ||||||||||||||||||||||||
| Trust and investment services assets under management, or custody (In thousands) | $ | 4,447,019 | $ | 4,062,325 | $ | 3,806,274 | $ | 4,017,363 | $ | 3,941,484 | |||||||||||||||||||
1Adjusted diluted earnings per share reflects adjustments made for certain nonrecurring items. Adjustments for nonrecurring items in 2020 included a $673,000 loss on the write-down of real estate pending sale ($0.04 per share). Adjustments in 2018 included a $2.2 million gain on sale of real estate and a $1.9 million write-down of impaired leases ($0.02 per share). Adjustments in 2017 included a $14.9 million ($0.99 per share) one-time non-cash write-down of net deferred tax assets related to the Tax Cuts and Jobs Act of 2017. There were no adjustments in 2019 and 2016. Adjusted diluted earnings per share is a non-GAAP measure. Please see the discussion below under “Management's Discussion and Analysis of Financial Condition and Results of Operations" - "Non-GAAP Disclosure” for an explanation of why management believes this non-GAAP financial measure is useful and a reconciliation to diluted earnings per share.
30
| Year ended December 31, | |||||||||||||||||||
| (in thousands except per share data) | 2018 | 2017 | 2016 | 2015 | 2014 | ||||||||||||||
| FINANCIAL STATEMENT HIGHLIGHTS | |||||||||||||||||||
| Assets | $ | 6,758,436 | $ | 6,648,290 | $ | 6,236,756 | $ | 5,689,995 | $ | 5,269,561 | |||||||||
| Total loans | 4,833,939 | 4,669,120 | 4,258,033 | 3,772,042 | 3,393,288 | ||||||||||||||
| Deposits | 4,888,959 | 4,837,807 | 4,625,139 | 4,395,306 | 4,169,154 | ||||||||||||||
| Other borrowings | 1,076,075 | 1,071,742 | 884,815 | 536,285 | 356,541 | ||||||||||||||
| Total equity | 620,871 | 576,202 | 549,405 | 516,466 | 489,583 | ||||||||||||||
| Interest and dividend income | 251,592 | 226,764 | 202,739 | 188,746 | 184,493 | ||||||||||||||
| Interest expense | 39,792 | 25,460 | 22,103 | 20,365 | 20,683 | ||||||||||||||
| Net interest income | 211,800 | 201,304 | 180,636 | 168,381 | 163,810 | ||||||||||||||
| Provision for loan and lease losses | 3,942 | 4,161 | 4,321 | 2,945 | 2,306 | ||||||||||||||
| Net (losses) gains on securities transactions | (466 | ) | (407 | ) | 926 | 1,108 | 391 | ||||||||||||
| Net income attributable to Tompkins | |||||||||||||||||||
| Financial Corporation | 82,308 | 52,494 | 59,340 | 58,421 | 52,041 | ||||||||||||||
| PER SHARE INFORMATION | |||||||||||||||||||
| Basic earnings per share | 5.39 | 3.46 | 3.94 | 3.91 | 3.51 | ||||||||||||||
| Diluted earnings per share | 5.35 | 3.43 | 3.91 | 3.87 | 3.48 | ||||||||||||||
Adjusted diluted earnings per share1 | 5.33 | 4.42 | 3.91 | 3.63 | 3.48 | ||||||||||||||
| Cash dividends per share | 1.94 | 1.82 | 1.77 | 1.70 | 1.62 | ||||||||||||||
| Common equity per share | 40.45 | 37.65 | 36.20 | 34.38 | 32.77 | ||||||||||||||
| SELECTED RATIOS | |||||||||||||||||||
| Return on average assets | 1.23 | % | 0.82 | % | 1.01 | % | 1.07 | % | 1.03 | % | |||||||||
| Return on average equity | 13.93 | % | 9.09 | % | 10.85 | % | 11.51 | % | 10.76 | % | |||||||||
| Average shareholders’ equity to average assets | 8.83 | % | 9.04 | % | 9.28 | % | 9.31 | % | 9.54 | % | |||||||||
| Dividend payout ratio | 35.99 | % | 52.60 | % | 44.92 | % | 43.48 | % | 46.15 | % | |||||||||
| OTHER SELECTED DATA (in whole numbers, unless otherwise noted) | |||||||||||||||||||
| Employees (average full-time equivalent) | 1,035 | 1,041 | 1,019 | 998 | 1,000 | ||||||||||||||
| Banking offices | 66 | 65 | 66 | 63 | 65 | ||||||||||||||
| Bank access centers (ATMs) | 83 | 84 | 85 | 85 | 85 | ||||||||||||||
| Trust and investment services assets under management, or custody (in thousands) | $ | 3,806,274 | $ | 4,017,363 | $ | 3,941,484 | $ | 3,852,972 | $ | 3,761,972 | |||||||||
Item 7. Management’s Discussion and Analysis of Financial Condition and Results of Operations
The following analysis is intended to provide the reader with a further understanding of the consolidated financial condition and results of operations of the Company and its operating subsidiaries for the periods shown. This Management’s Discussion and Analysis of Financial Condition and Results of Operations should be read in conjunction with other sections of this Report on Form 10-K, including Part I, “Item 1. Business,” Part II, “Item 6. Selected Financial Data,” and Part II, “Item 8. Financial Statements and Supplementary Data.”
Tompkins Financial Corporation (“Tompkins” or the “Company”) is headquartered in Ithaca, New York and is registered as a Financial Holding Company with the Federal Reserve Board under the Bank Holding Company Act of 1956, as amended. The Company is a locally oriented, community-based financial services organization that offers a full array of products and services, including commercial and consumer banking, leasing, trust and investment management, financial planning and wealth management, and insurance and brokerage services.At December 31, 2018,2020, the Company’s subsidiaries included: four wholly-owned banking subsidiaries, Tompkins Trust Company (the “Trust Company”), The Bank of Castile (DBA Tompkins Bank of Castile), Mahopac Bank (DBA Tompkins Mahopac Bank), VIST Bank (DBA Tompkins VIST Bank); and a wholly-owned insurance agency subsidiary, Tompkins Insurance Agencies, Inc. (“Tompkins Insurance”). The trust division of the Trust Company provides a full array of trust and investment services, under the Tompkins Financial Advisors brand, including investment management, trust and estate, financial and tax planning as well as life, disability and long-term care insurance services. The Company’s principal offices are located at 118 E. Seneca Street, P.O. Box 460, Ithaca, NY,, 14850, and its telephone number is (888) 503-5753.503-5753. The Company’s common stock is traded on the NYSE American under the Symbol “TMP.”
Forward-Looking Statements
This Annual Report on Form 10-K contains "forward-looking statements" within the meaning of the Private Securities Litigation Reform Act of 1995. The statements contained in this Report that are not statements of historical fact may include forward-looking statements that involve a number of risks and uncertainties. Forward-looking statements may be identified by use of such words as "may", "will", "estimate", "intend", "continue", "believe", "expect", "plan", or "anticipate", and other similar words. Examples of forward-looking statements may include statements regarding;regarding the asset quality of the Company's loan portfolios; the level of the Company's allowance for loancredit losses; whether, when and how borrowers will repay deferred amounts and resume scheduled payments; the sufficiency of liquidity sources; the Company's exposure to changes in interest rates;rates, and to new, changed, or extended government/regulatory expectations; the impact of changes in accounting standards; the likelihood that deferred tax assets will be realized and trends, plans, prospects, growth and strategies. Forward-looking statements are made based on management’s expectations and beliefs concerning future events impacting the Company and are subject to certain uncertainties and factors relating to the Company’s operations and economic environment, all of which are difficult to predict and many of which are beyond the control of the Company, that could cause actual results of the Company to differ materially from those expressed and/or implied by forward-looking statements. The following factors, in addition to those listed as Risk Factors in Item 1A are among those that could cause actual results to differ materially from the forward-looking statements: changes in general economic, market and regulatory conditions; the severity and duration of the COVID-19 outbreak and the impact of the outbreak (including the government’s response to the outbreak) on economic and financial markets, potential regulatory actions, and modifications to our operations, products, and services relating thereto; disruptions in our and our customers’ operations and loss of revenue due to pandemics, epidemics, widespread health emergencies, government-imposed travel/business restrictions, or outbreaks of infectious diseases such as the COVID-19, and the associated adverse impact on our financial position, liquidity, and our customers’ abilities or willingness to repay their obligations to us or willingness to obtain financial services products from the Company; a decision to amend or modify the terms under which our customers are obligated to repay amounts owed to us; the development of an interest rate environment that may adversely affect the Company’s interest rate spread, other income or cash flow anticipated from the Company’s operations, investment and/or lending activities; changes in laws and regulations affecting banks, bank holding companies and/or financial holding companies, such as the Dodd-Frank Act and Basel III and the Economic Growth, Regulatory Relief, and Consumer Protection Act; legislative and regulatory changes in response to COVID-19 with which we and our subsidiaries must comply, including the Coronavirus Aid, Relief and Economic Security Act (the "CARES Act") and the Consolidated Appropriations Act, 2021 and the rules and regulations promulgated thereunder, and federal, state and local government mandates; technological developments and changes; the ability to continue to introduce competitive new products and services on a timely, cost-effective basis; governmental and public policy changes, including environmental regulation; reliance on large customers; uncertainties arising from national and global events, including the potential impact of widespread protests, civil unrest, and political uncertainty on the economy and the financial services industry; and financial resources in the amounts, at the times and on the terms required to support the Company’s future businesses.
31
Critical Accounting Policies
The accounting and reporting policies followed by the Company conform, in all material respects, to U.S. generally accepted accounting principles ("GAAP") and to general practices within the financial services industry. In the course of normal business activity, management must select and apply many accounting policies and methodologies and make estimates and assumptions that lead to the financial results presented in the Company’s consolidated financial statements and accompanying notes. There are uncertainties inherent in making these estimates and assumptions, which could materially affect ourthe Company’s results of operations and financial position.
Management considers accounting estimates to be critical to reported financial results if (i) the accounting estimates require management to make assumptions about matters that are highly uncertain, and (ii) different estimates that management reasonably could have used for the accounting estimate in the current period, or changes in the accounting estimate that are reasonably likely to occur from period to period, could have a material impact on the Company’s consolidated financial statements. Management considers the accounting policies relating to the allowance for loan and leasecredit losses (“allowance”, or “ACL”), and the review of the securities
portfolio for other-than-temporary impairment to be critical accounting policies because of the uncertainty and subjectivity involved in these policies and the material effect that estimates related to these areas can have on the Company’s results of operations.
The Company’s methodology for estimating the allowance considers available relevant information about the collectability of cash flows, including information about past events, current "incurred loss" modelconditions, and reasonable and supportable forecasts. Refer to “Allowance for recognizing credit losses with an "expected loss" model referred to as the Current Expected Credit Loss ("CECL") model. ASU 2016-13 will become effectiveLosses” below, "Note 4 - Allowance for the Company for fiscal years beginning after December 15, 2019 and for interim periods within those fiscal years. Under the CECL model, we will be required to present certain financial assets carried at amortized cost at the net amount expected to be collected. Accordingly, the Company’s management anticipates that this significant accounting rule adjustment will materially affect how we determine our allowance for loan and lease losses as well as our accounting for investment securities. For additional information on the CECL model’s anticipated impact on our business and accounting practices, see Part I, Item 1A, “Risk Factors” of this Report on Form 10-KCredit Losses", and "Note 1 – Summary of Significant Accounting Policies" in Notes to Consolidated Financial Statements included in Part II, Item 8 of this Form 10-K.
For information on the Company's significant accounting policies and to gain a bettergreater understanding of how the Company’s financial performance is reported.
COVID-19 Pandemic and Recent Events
The COVID-19 global pandemic presented health and economic challenges on an unprecedented scale in 2020. During the year, the Company focused on the health and well-being of its workforce, meeting its clients' needs, and supporting its communities. The Company has designated a Pandemic Planning Committee, which includes key individuals across the Company as well as members of Senior Management, to oversee the Company’s response to COVID-19, and has implemented a number of risk mitigation measures designed to protect our employees and customers while maintaining services for our customers and community. These measures included restrictions on business travel, establishment of a remote work environment for most non-customer facing employees, and social distancing restrictions for those employees working at our offices and branch locations. In July 2020, we began initiating the reopening of our offices and reinstatement of branch services, and the return of our workforce, but as of December 31, 2020, approximately 85% of our noncustomer facing employees continued to work remotely. To promote the health and well-being of the Company's workforce, customers, and visitors as we reopen, we implemented several new social distancing protocols and other protective measures, such as temperature screenings, distribution of personal protective equipment, and workforce self-certifications.
Tompkins continues to offer assistance to its customers affected by the COVID-19 pandemic by implementing a payment deferral program to assist both consumer and business borrowers that may be experiencing financial hardship due to COVID-19. Our standard program allows for the deferral of loan payments for up to 90 days. In certain cases, and where required by applicable law or regulations, we extend additional deferrals or other accommodations. Weekly deferral requests for the month of December 2020 were down 98.5% from peak levels the Company experienced in late March 2020. As of December 31, 2020, total loans impacted by COVID-19 that continued in a deferral status amounted to approximately $212.2 million, representing 4.0% of total loans. Loans to finance hotels and motels comprise approximately 53.0% of total loans that continue in deferral status. Of the loans that had come out of the deferral program as of December 31, 2020, about 94.4% had made at least one payment and 0.13% were more than 30 days delinquent. We expect that loans that are currently in deferral will continue to accrue interest during the deferral period unless otherwise classified as nonperforming. The provisions of the CARES Act and interagency guidance issued by Federal banking regulators provided clarification related to modifications and deferral programs to assist borrowers who are negatively impacted by the COVID-19 national emergency. Under the CARES Act, a modification deemed to be COVID-19 related is not considered to be a troubled debt restructuring ("TDR") if the loan was not more than 30 days past due as of December 31, 2019 and the deferral was executed between March 1, 2020 and the
32
earlier of 60 days after the date of termination of the COVID-19 national emergency or December 31, 2020. The Consolidated Appropriations Act, 2021 extended the termination of these provisions to the earlier of 60 days after the COVID-19 national emergency date or January 1, 2022. The Federal banking regulators issued similar guidance. In accordance with the CARES Act, the Consolidated Appropriations Act, 2021, and the interagency guidance, the Company is not designating eligible loan modifications and deferrals resulting from the impacts of COVID-19 as TDRs.
Management continues to monitor credit conditions carefully at the individual borrower level, as well as by industry segment, in order to be responsive to changing credit conditions. The table below lists certain larger industry concentrations within our loan portfolio and the percentage of each segment that are currently in a deferral status.
| Deferral Credit Concentrations | ||||||||||||||
| (In thousands) | As of December 31, 2020 | |||||||||||||
| Description | Portfolio Balance ($) | Concentration* | Deferral Balance ($) | Percent of Loans Currently in Deferral Status | ||||||||||
| Lessors of Residential Buildings and Dwellings | $ | 520,793 | 16.1 | % | $ | 490 | 0.1 | % | ||||||
| Hotels and Motels | 191,690 | 5.9 | % | 101,496 | 52.9 | % | ||||||||
| Dairy Cattle and Milk Production | 194,050 | 6.0 | % | 0 | 0 | |||||||||
| Health Care and Social Assistance | 156,693 | 4.8 | % | 0 | 0 | |||||||||
| Lessors of Other Real Estate Property | 123,835 | 3.8 | % | 8,678 | 7.0 | % | ||||||||
| $ | 2,176,729 | $ | 171,934 | |||||||||||
| *Concentration is defined as outstanding loan balances as a percent of total commercial and commercial real estate | ||||||||||||||
The Company is also participating in the U.S. Small Business Administration (“SBA”) Paycheck Protection Program (“PPP”). Borrowers with loan balances which are not forgiven are obligated to repay such balances over a 2-year term at a rate of 1% interest, with principal and interest payments deferred for the first six months. The SBA has announced that, under limited circumstances described in the current SBA guidance, fees will not be paid, even if the participating lender has approved and processed the PPP loan. The Company began accepting applications for PPP loans on April 3, 2020, and approved and funded 2,998 loans totaling approximately $465.6 million during the second quarter of 2020. The Company received approximately $14.5 million of fees related to the PPP loans funded. The fees are amortized as interest income over the life of the loan and recognized net of origination costs. The Company recognized net loan fees of $9.2 million in 2020 related to the PPP loans. This program provides borrower guarantees for lenders, and envisions a certain amount of loan forgiveness for loan recipients who properly utilize funds, all in accordance with the rules and regulations established by the SBA for the PPP. At December 31, 2020, the Company had submitted 1,484 loans totaling $244.0 million to the SBA for forgiveness under the terms of the PPP program. Approximately 1,212 of those loans, totaling $171.1 million, had been forgiven by the SBA as of December 31, 2020. On January 11, 2021, the SBA reactivated the PPP. The Company's banking subsidiaries have originated additional PPP loans through the PPP, which is currently scheduled to extend through March 31, 2021. As of February 21, 2021 the Company had submitted 1,341 PPP loan applications totaling $171.0 million under the 2021 PPP authorization.
As of December 31, 2020, the Company's nonperforming assets represented 0.60% of total assets, up from 0.44% at September 30, 2020, and 0.47% at December 31, 2019. Special Mention loans totaled $121.3 million at the end of the fourth quarter of 2020, in line with the quarter ended September 30, 2020, and up compared to the $29.8 million reported for the fourth quarter of 2019. Total Substandard loans increased during the quarter to $68.6 million at December 31, 2020, compared to $45.4 million at September 30, 2020, and $60.5 million at December 31, 2019. The increases in nonperforming loans and leases and Substandard loans were mainly related to the downgrades of credit in the loan portfolio related to the hospitality industry. Included in the nonperforming and Substandard loans and leases are 17 loans totaling $17.8 million, that are currently in deferral status.
Results of Operations
(Comparison of December 31, 2020 and 2019 results)
General
The Company reported diluted earnings per share of $5.20 in 2020, compared to diluted earnings per share of $5.37 in 2019. Net income for the year ended December 31, 2020, was $77.6 million, a decrease of 5.1% compared to $81.7 million in 2019.
33
In addition to earnings per share, key performance measurements for the Company include return on average shareholders’ equity (ROE) and return on average assets (ROA). ROE was 13.93%11.09% in 2018,2020, compared to 9.09%12.55% in 2017,2019, while ROA was 1.23%1.05% in 20182020 and 0.82%1.22% in 2017.2019. Tompkins’ 2020 ROE and ROA at September 30, 2018 (the most recent date for whichcompared favorably with peer data is publicly available) were in the 81st percentileratios of 8.40% for ROE and the 54th percentile0.88% for ROA, as of its peer group.September 30, 2020. The peer group data is derived from the FRB's "Bank Holding Company Performance Report", which covers banks and bank holding companies with assets between $3.0 billion and $10.0 billion as of September 30, 20182020 (the most recent report available). Although the peer group data is presented based upon financial information that is one fiscal quarter behind the financial information included in this report, the Company believes that it is relevant to include certain peer group information for comparison to current quarterperiod numbers.
| Reconciliation of Net Operating Income/Adjusted Diluted Earnings Per Share (Non-GAAP) to Net Income and Earnings Per Share | |||||||||||||||
| For the year ended | |||||||||||||||
| December 31, | |||||||||||||||
| (in thousands, except per share data) | 2018 | 2017 | 2016 | 2015 | 2014 | ||||||||||
| Net income attributable to Tompkins Financial Corporation | $ | 82,308 | $ | 52,494 | $ | 59,340 | $ | 58,421 | $ | 52,041 | |||||
| Less: dividends and undistributed earnings allocated to unvested stock awards | (1,315 | ) | (818 | ) | (912 | ) | (834 | ) | (503 | ) | |||||
| Net income available to common shareholders (GAAP) | 80,993 | 51,676 | 58,428 | 57,587 | 51,538 | ||||||||||
| Diluted earnings per share (GAAP) | 5.35 | 3.43 | 3.91 | 3.87 | 3.48 | ||||||||||
| Adjustments for non-operating income and expense: | |||||||||||||||
| Gain on pension plan curtailment, net of tax | 0 | 0 | 0 | (3,602 | ) | 0 | |||||||||
| Gain on sale of real estate, net of tax | (2,227 | ) | 0 | 0 | 0 | 0 | |||||||||
| Write-down of impaired leases, net of tax | 1,915 | 0 | 0 | 0 | 0 | ||||||||||
| Remeasurement of deferred taxes | 0 | 14,944 | 0 | 0 | 0 | ||||||||||
| Total adjustments | (312 | ) | 14,944 | 0 | (3,602 | ) | 0 | ||||||||
| Net operating income available to common shareholders (Non-GAAP) | 80,681 | 66,620 | 58,428 | 53,985 | 51,538 | ||||||||||
| Adjusted diluted earnings per share (Non-GAAP) | 5.33 | 4.42 | 3.91 | 3.63 | 3.48 | ||||||||||
| Operating Return on Average Tangible Common Equity (Non-GAAP) | |||||||
| For the year ended | |||||||
| December 31, | |||||||
| (in thousands, except per share data) | 2018 | 2017 | |||||
| Net operating income available to common shareholders (Non-GAAP) | $ | 80,681 | $ | 66,620 | |||
| Amortization of intangibles, net of tax | 1,337 | 1,159 | |||||
| Adjusted net operating income available to common shareholders (Non-GAAP) | 82,018 | 67,779 | |||||
| Average Tompkins Financial Corporation shareholders’ common equity | 589,475 | 575,958 | |||||
Average goodwill and intangibles 1 | 99,999 | 101,583 | |||||
| Average Tompkins financial Corporation shareholders’ tangible common equity (Non-GAAP) | 489,476 | 474,375 | |||||
| Adjusted operating return on average shareholders’ tangible common equity (Non-GAAP) | 16.76 | % | 14.29 | % | |||
| Reconciliation of Tangible Common Equity Per Share (Non-GAAP) to Shareholders' Common Equity Per Share | |||||
| As of December 31, | |||||
| (in thousands, except per share data) | 2018 | 2017 | |||
| Tompkins Financial Corporations Shareholders' common equity | 619,459 | 574,780 | |||
Goodwill and intangibles 1 | 99,106 | 100,887 | |||
| Tangible common equity (Non-GAAP) | 520,353 | 473,893 | |||
| Common equity per share | 40.45 | 37.65 | |||
| Tangible common equity per share (Non-GAAP) | 33.98 | 31.04 | |||
Segment Reporting
The Company operates in three business segments: banking, insurance and wealth management. Insurance is comprised of property and casualty insurance services and employee benefit consulting operated under the Tompkins Insurance Agencies, Inc. subsidiary. Wealth management activities include the results of the Company’s trust, financial planning, and wealth management services provided by Tompkins Financial Advisors, a division of the Trust Company. All other activities are considered banking. For additional financial information on the Company’s segments, refer to “Note 2223 – Segment and Related Information” in the Notes to Consolidated Financial Statements in Part II, Item 8. of this Report.
Banking Segment
The banking segment reported net income of $74.9$69.3 million for the year ended December 31, 2018,2020, representing a $27.9$5.2 million or 59.3% increase7.0%, decrease compared to 2017. Banking segment earnings in 2018 and 2017 were significantly impacted by the Tax Cuts and Jobs Act of 2017. Due to this legislation, a one-time, $14.9 million write-down was recorded for the remeasurement of net deferred tax assets and is reflected in the banking segment’s results of operations for the fourth quarter of 2017 as an additional charge to income tax expense. The legislation also decreased the Federal statutory tax rate from 35% in 2017 to 21% in 2018.2019. Net interest income increased $10.5$14.7 million or 5.2%7.0% in 20182020 compared to 2017, due primarily2019. Contributing to loan growth,the increase from 2019 were lower funding costs and an increase in average loan yields.earning assets, which were partially offset by lower asset yield. Interest income increased $24.8decreased $7.0 million or 10.9%2.7% compared to 2017,2019, while interest expense increased $14.3decreased $21.8 million or 56.3%42.9%.
The provision for loan and lease lossescredit loss expense was $3.9$16.2 million in 2018,2020, compared to $4.2$1.4 million in the prior year. The loan growth rate for 2018 was 3.5% compared to 12.8% for 2017, contributingfirst quarter of 2020 included provision expense of $16.3 million related to the year-over-year decreaseimpact of the economic conditions due to COVID-19 on economic forecasts and other model assumptions relied upon by management in provision expense.determining the allowance, and reflects the calculation of the allowance for credit losses in accordance with ASU 2016-13. For additional information, see the section titled "The Allowance for Credit Losses" below.
Noninterest income in the banking segment of $31.7$26.0 million in 2018 increased2020 decreased by $6.2$3.0 million or 24.5%10.5% when compared to 2017.2019. The increasenegative variance compared to the prior year was mainly in noninterest incomefee based services and was largely a result of a decrease in transactions attributable to the economic impact of pandemic-related travel and business restrictions, which reduced card services and the related service charge income. Card services fees and deposit fees in 2020 were down 12.0% and 24.1%, respectively, from prior year. This decrease was partially offset by gains on sales of residential loans, which were up $1.8 million over 2019, and the increase was mainly due to gain on sale of fixed assets (up $2.9 million), collection of fees and nonaccrual interest on a loan that was charged off in 2010 (up $2.5 million), card services income (up $594,000), net gain on salehigher volume of loans (up $408,000)sold and other fee income (up $281,000). These were partially offset by a decrease in BOLI (down $378,000).higher premiums paid on sold loans.
Noninterest expenses increased by $9.3expense of $148.7 million for the year ended December 31, 2020, was up $3.6 million or 6.9% compared to 2017.2.5% from 2019. The increase wasincreases were mainly attributed to an increaseincreases in salary and wages and employee benefits reflecting normal annual merit and incentive adjustmentsincreases, premium pay for employees required to be on-site during pandemic-related business restrictions, and higher health insurance costsexpense over the comparable periods in the prior year. Noninterest expenses for the year write-downsended December 31, 2020, included $1.0 million in off-balance sheet exposures calculated due to changes in methodology in accordance with the adoption of $2.3 million on leases on space vacated in 2018 following completion of the Company's new headquarters in 2018, total technology expense (up $1.8 million), and professional fees and consulting (up $2.8 million). The increase in technology and professional fees primarily relates to investments in strengthening the Company's compliance and information security infrastructure.ASU 2016-13.
Insurance Segment
The insurance segment reported net income of $3.2$4.4 million, up 11.9%$198,000 or 4.7% when compared to 2017. The increase in net income is mainly a result of the decrease in the Federal statutory tax rate in 2018 described above. Net income before tax decreased by $269,000 or 5.8%,2019, as a 2.2%$429,000 or 1.4% increase in noninterest revenue was only partially offset by a 3.8%0.1% increase in expenses. The increase in revenue included $384,000 or 1.9% of organic growth in property and casualty commissions and a $167,000 or 5.5% increase in contingency revenue over 2019. Health and voluntary benefits grew by $105,000 or 1.4%, while life, financial services and other revenue was $212,000 or 40.2% less than 2019; 2019 benefited from the new business of one large relationship in 2019.
Increases in expenses, was mainly attributed to an increase in salary andsalaries, wages and employee benefits reflecting normal annual merit and incentive adjustments andalong with higher health insurance costs, respectively, over the prior year. Noninterest income increased $654,000, or 2.2%, when compared to 2017, reflecting increaseswere mainly offset by reductions in all business lines (personal, commercial,items such as auto, travel, entertainment and life and health). Revenues for 2017 included a non-recurring gain on the salemarketing that were affected by COVID-19 pandemic.
34
Wealth Management Segment
The wealth management segment reported net income of $4.2$4.0 million for the year ended December 31, 2018,2020, an increase of $1.6$0.9 million or 62.0%29.0% compared to 2017.2019. Noninterest income of $18.0$18.1 million increased $1.7$1.1 million or 10.1%6.6% compared to 2017. Estate2019, mainly a result of estate and terminating trust fees, which were up $1.1 million$569,000 or 661.3%176.4% in 20182020 over 2017, benefiting from2019, as a result of the settlement of a large estate in 2018.2020, and an increase in assets under management. Noninterest expenses remained flat year over year, as increases in technology expenses were flatoffset by decreases in 2018 compared to 2017, mainly due to lower staffing levels in 2018 compared to 2017.travel and meetings expenses as a result of the COVID-19 pandemic. The market value of assets under management or in custody at December 31, 20182020 totaled $3.8$4.4 billion, a decreasean increase of 5.3%9.5% compared to year-end 2017.2019. This figure included $1.2 billion at year-end 2020, of Company-owned securities from which no income was recognized as the Trust Company was serving as custodian.
Net Interest Income
Net interest income is the Company’s largest source of revenue, representing 73.2%75.3% of total revenues for the year ended December 31, 2018,2020, and 74.4%73.6% of total revenues for the year ended December 31, 2017. Net interest income in 2018 increased 5.2% over 2017.2019. Net interest income is dependent on the volume and composition of interest earning assets and interest-bearing liabilities and the level of market interest rates. The Company’s net interest income over the past several years benefited from steady growth in average earning assets, which increased 5.3% in 2018 compared to 2017.
Table 1 – Average Statements of Condition and Net Interest Analysis shows average interest-earning assets and interest-bearing liabilities, and the corresponding yield or cost associated with each. Taxable-equivalent
Tax-equivalent net interest income for 20182020 increased 3.9% over 2017, benefitingby $15.2 million or 7.1% from 2019. The increase was mainly due to lower interest expense in 2020 compared to 2019, driven by lower market interest rates and by deposit growth, which contributed to a reduction in other borrowings. Average total deposits represented 91.7% of average total liabilities in 2020 compared to 84.4% in 2019, while total average borrowings represented 6.6% of average total liabilities in 2020 and 13.9% in 2019. Net interest income also benefited from the growth in average earning assets which increased by 5.3% in 2018, and growth in2020 over 2019; however, average noninterest bearing deposits, which increased by 8.1% compared to the prior year.asset yields for 2020 were down from 2019. The net interest margin for 20182020 was 3.37%3.31% compared to 3.41%3.39% for 2017. Tax equivalent net interest income and2019. The decline in net interest margin were impacted by the reductionfor 2020 when compared to 2019 was mainly due to a decrease in overall asset yields. The decrease in average asset yields was mainly due to lower securities yields and a slight shift in the U.S. federal statutory income tax rate from 35% in 2017 to 21% in 2018 under the Tax Cuts and Jobs Actcomposition of 2017. Assumingaverage earning assets, with a tax rategreater mix of 21% in 2017 would have reduced the netlower yielding average interest margin by about 4 basis points in 2017, resulting in a flat net interest margin compared to 2018. The rising interest rate environment resulted in funding costs rising at a faster pace than asset yields, which pressured the margin in 2018.bearing balances.
Tax-equivalent interest income increased $22.3decreased $6.6 million or 9.6%2.5% in 2018 over 2017.2020 from 2019. The increasedecrease in taxable-equivalent interest income reflects a $317.8 million or 5.3%was mainly due to lower asset yields, partially offset by an increase in the volume of average interest-earning assetsearning assets. Average asset yields for 2020 were down 47 basis points compared to 2019, which reflects the impact of reductions in market interest rates during 2020, and improved yields. The increase in average interest-earning assets was mainly in averagethe addition of lower yielding PPP loans. Average loans and leases which increased $356.4$398.0 million or 8.1%8.2% in 20182020 compared to 2017. Average loan balances2019, and represented 75.0%76.1% of average earning assets in 20182020 compared to 73.1%77.1% in 2017.2019. The increase in average yield onloans includes $465.6 million in PPP loans originated in the second quarter of 2020. As a result of its participation in the SBA's PPP, the Company recorded net deferred loan fees of $9.2 million, which are included in interest earning assets for 2018 was 4.0%, which increased by 16 basis points from 2017.income. The average yield on loans was 4.53%4.38% in 2018, an increase2020, a decrease of 1134 basis points compared to 4.42%4.72% in 2017.2019. Average balances on securities decreased $45.4increased $27.4 million or 2.9%2.0% in 2020 compared to 2017,2019, while the average yield on the securities portfolio increased 5decreased 47 basis points or 2.3%20.4% compared to 2017.2019 due to lower market interest rates in 2020.
Interest expense for 2018 increased $14.32020 decreased $21.8 million or 56.3%42.9% compared to 2017, and average interest bearing liabilities increased $187.8 million or 4.2% over 2017. The increase2019, driven mainly by decreases in interest expense was the result of the increase in the average rates paid on deposits and borrowings as a result of lower market interest bearing liabilities in 2018 compared to 2017, as well as the growth in average borrowings during 2018 when compared to 2017.rates. The average rate paid oncost of interest bearing deposits was 0.48%0.46% in 2018, up 132020, down 38 basis points from 0.35%0.84% in 2017,2019, while the average costscost of interest bearing liabilities increaseddecreased to 0.85%0.60% in 20182020 from 0.57%1.12% in 2017. Average other borrowings increased by $204.6 million or 23.2% year over year, mainly due to a higher volume of overnight borrowings with the FHLB in 2018, which were used to support loan growth that exceeded deposit growth in 2018. Average total deposits were up $89.7 million or 1.9% in 2018 over 2017, with the majority of the growth in average noninterest bearing deposits.2019. Average interest bearing deposits in 2018 decreased $13.92020 increased $671.0 million or 0.4%18.2% compared to 2017.2019. Average noninterest bearing deposit balances in 20182020 increased $103.5$349.9 million or 8.1%24.9% over 20172019 and represented 28.4%28.7% of average total deposits in 20182020 compared to 26.8%27.6% in 2017.2019. Average total deposits were up $1.0 billion or 20.1% in 2020 over 2019. Average deposit balances increased due to the $465.6 million of PPP loan originations during the second quarter of 2020, the majority of which were deposited into Tompkins checking accounts, as well as brokered funds obtained in the first half of 2020 to support PPP loans and overall liquidity during COVID-19. Average other borrowings decreased by $397.3 million or 52.1% in 2020 from 2019. The decrease in borrowings was due to the strong deposit growth during 2020.
35
Table 1 - Average Statements of Condition and Net Interest Analysis
| For the year ended December 31, | For the year ended December 31, | ||||||||||||||||||||||||||||||||||||||||||||||||||||
| 2018 | 2017 | 2016 | 2020 | 2019 | 2018 | ||||||||||||||||||||||||||||||||||||||||||||||||
| (dollar amounts in thousands) | Average Balance (YTD) | Interest | Average Yield/Rate | Average Balance (YTD) | Interest | Average Yield/Rate | Average Balance (YTD) | Interest | Average Yield/Rate | (dollar amounts in thousands) | Average Balance (YTD) | Interest | Average Yield/Rate | Average Balance (YTD) | Interest | Average Yield/Rate | Average Balance (YTD) | Interest | Average Yield/Rate | ||||||||||||||||||||||||||||||||||
ASSETS | ASSETS | ||||||||||||||||||||||||||||||||||||||||||||||||||||
Interest-earning assets | Interest-earning assets | ||||||||||||||||||||||||||||||||||||||||||||||||||||
| Interest-bearing balances due from banks | $ | 2,139 | $ | 31 | 1.45 | % | $ | 4,599 | $ | 37 | 0.80 | % | $ | 2,019 | $ | 6 | 0.30 | % | Interest-bearing balances due from banks | $ | 194,211 | $ | 194 | 0.10 | % | $ | 1,647 | $ | 41 | 2.49 | % | $ | 2,139 | $ | 31 | 1.45 | % | ||||||||||||||||
Securities1 | Securities1 | ||||||||||||||||||||||||||||||||||||||||||||||||||||
U.S. Government securities | 1,429,875 | 31,645 | 2.21 | % | 1,471,717 | 31,006 | 2.11 | % | 1,443,894 | 29,318 | 2.03 | % | U.S. Government securities | 1,307,905 | 22,906 | 1.75 | % | 1,301,813 | 29,411 | 2.26 | % | 1,429,875 | 31,645 | 2.21 | % | ||||||||||||||||||||||||||||
Trading securities | 0 | 0 | 0.00 | % | 0 | 0 | 0.00 | % | 4,893 | 220 | 4.50 | % | |||||||||||||||||||||||||||||||||||||||||
State and municipal2 | 97,116 | 2,520 | 2.59 | % | 100,595 | 3,393 | 3.37 | % | 97,937 | 3,309 | 3.38 | % | State and municipal2 | 114,462 | 3,048 | 2.66 | % | 93,168 | 2,547 | 2.73 | % | 97,116 | 2,520 | 2.59 | % | ||||||||||||||||||||||||||||
Other securities2 | 3,491 | 153 | 4.38 | % | 3,597 | 129 | 3.59 | % | 3,645 | 123 | 3.37 | % | Other securities2 | 3,430 | 117 | 3.40 | % | 3,417 | 158 | 4.62 | % | 3,491 | 153 | 4.38 | % | ||||||||||||||||||||||||||||
Total securities | 1,530,482 | 34,318 | 2.24 | % | 1,575,909 | 34,528 | 2.19 | % | 1,550,369 | 32,970 | 2.13 | % | Total securities | 1,425,797 | 26,071 | 1.83 | % | 1,398,398 | 32,116 | 2.30 | % | 1,530,482 | 34,318 | 2.24 | % | ||||||||||||||||||||||||||||
FHLBNY and FRB stock | 51,815 | 3,377 | 6.52 | % | 42,465 | 2,121 | 4.99 | % | 32,528 | 1,434 | 4.41 | % | FHLBNY and FRB stock | 20,815 | 1,373 | 6.60 | % | 38,308 | 3,003 | 7.84 | % | 51,815 | 3,377 | 6.52 | % | ||||||||||||||||||||||||||||
Total loans and leases, net of unearned income2,3 | 4,757,583 | 215,648 | 4.53 | % | 4,401,205 | 194,433 | 4.42 | % | 3,957,221 | 172,443 | 4.36 | % | Total loans and leases, net of unearned income2,3 | 5,228,135 | 228,806 | 4.38 | % | 4,830,089 | 227,869 | 4.72 | % | 4,757,583 | 215,648 | 4.53 | % | ||||||||||||||||||||||||||||
| Total interest-earning assets | 6,342,019 | 253,374 | 4.00 | % | 6,024,178 | 231,119 | 3.84 | % | 5,542,137 | 206,853 | 3.73 | % | Total interest-earning assets | 6,868,958 | 256,444 | 3.73 | % | 6,268,442 | 263,029 | 4.20 | % | 6,342,019 | 253,374 | 4.00 | % | ||||||||||||||||||||||||||||
Other assets | 350,659 | 365,326 | 355,943 | Other assets | 489,520 | 411,136 | 350,659 | ||||||||||||||||||||||||||||||||||||||||||||||
Total assets | $ | 6,692,678 | $ | 6,389,504 | $ | 5,898,080 | Total assets | $ | 7,358,478 | $ | 6,679,578 | $ | 6,692,678 | ||||||||||||||||||||||||||||||||||||||||
| LIABILITIES & EQUITY | LIABILITIES & EQUITY | ||||||||||||||||||||||||||||||||||||||||||||||||||||
Deposits | Deposits | ||||||||||||||||||||||||||||||||||||||||||||||||||||
Interest-bearing deposits | Interest-bearing deposits | ||||||||||||||||||||||||||||||||||||||||||||||||||||
Interest bearing checking, savings, & money market | 2,822,747 | 9,847 | 0.35 | % | 2,674,204 | 5,141 | 0.19 | % | 2,529,009 | 4,008 | 0.16 | % | Interest bearing checking, savings, & money market | $ | 3,650,358 | $ | 9,430 | 0.26 | % | $ | 3,007,221 | $ | 20,099 | 0.67 | % | $ | 2,822,747 | $ | 9,847 | 0.35 | % | ||||||||||||||||||||||
Time deposits | 664,788 | 6,748 | 1.02 | % | 827,181 | 6,992 | 0.85 | % | 871,595 | 6,705 | 0.77 | % | Time deposits | 703,999 | 10,534 | 1.50 | % | 676,106 | 10,805 | 1.60 | % | 664,788 | 6,748 | 1.02 | % | ||||||||||||||||||||||||||||
Total interest-bearing deposits | 3,487,535 | 16,595 | 0.48 | % | 3,501,385 | 12,133 | 0.35 | % | 3,400,604 | 10,713 | 0.32 | % | Total interest-bearing deposits | 4,354,357 | 19,964 | 0.46 | % | 3,683,327 | 30,904 | 0.84 | % | 3,487,535 | 16,595 | 0.48 | % | ||||||||||||||||||||||||||||
Federal funds purchased & securities sold under agreements to repurchase | 63,472 | 152 | 0.24 | % | 64,888 | 235 | 0.36 | % | 99,622 | 2,228 | 2.24 | % | Federal funds purchased & securities sold under agreements to repurchase | 55,973 | 95 | 0.17 | % | 59,825 | 143 | 0.24 | % | 63,472 | 152 | 0.24 | % | ||||||||||||||||||||||||||||
Other borrowings | 1,086,847 | 21,818 | 2.01 | % | 882,235 | 11,934 | 1.35 | % | 616,560 | 6,772 | 1.10 | % | Other borrowings | 365,732 | 7,799 | 2.13 | % | 762,993 | 18,427 | 2.42 | % | 1,086,847 | 21,818 | 2.01 | % | ||||||||||||||||||||||||||||
| Trust preferred debentures | 16,771 | 1,227 | 7.32 | % | 18,338 | 1,158 | 6.31 | % | 37,588 | 2,390 | 6.36 | % | Trust preferred debentures | 17,092 | 1,133 | 6.63 | % | 16,943 | 1,276 | 7.53 | % | 16,771 | 1,227 | 7.32 | % | ||||||||||||||||||||||||||||
Total interest-bearing liabilities | 4,654,625 | 39,792 | 0.85 | % | 4,466,846 | 25,460 | 0.57 | % | 4,154,374 | 22,103 | 0.53 | % | Total interest-bearing liabilities | 4,793,154 | 28,991 | 0.60 | % | 4,523,088 | 50,750 | 1.12 | % | 4,654,625 | 39,792 | 0.85 | % | ||||||||||||||||||||||||||||
Noninterest bearing deposits | 1,382,550 | 1,279,027 | 1,130,406 | Noninterest bearing deposits | 1,753,226 | 1,403,330 | 1,382,550 | ||||||||||||||||||||||||||||||||||||||||||||||
Accrued expenses and other liabilities | 64,559 | 66,185 | 66,243 | Accrued expenses and other liabilities | 112,544 | 101,819 | 64,559 | ||||||||||||||||||||||||||||||||||||||||||||||
| Total liabilities | 6,101,734 | 5,812,058 | 5,351,023 | Total liabilities | 6,658,924 | 6,028,237 | 6,101,734 | ||||||||||||||||||||||||||||||||||||||||||||||
| Tompkins Financial Corporation Shareholders’ equity | 589,475 | 575,958 | 545,545 | Tompkins Financial Corporation Shareholders’ equity | 698,088 | 649,871 | 589,475 | ||||||||||||||||||||||||||||||||||||||||||||||
Noncontrolling interest | 1,469 | 1,488 | 1,512 | Noncontrolling interest | 1,466 | 1,470 | 1,469 | ||||||||||||||||||||||||||||||||||||||||||||||
| Total equity | 590,944 | 577,446 | 547,057 | Total equity | 699,554 | 651,341 | 590,944 | ||||||||||||||||||||||||||||||||||||||||||||||
Total liabilities and equity | $ | 6,692,678 | $ | 6,389,504 | $ | 5,898,080 | Total liabilities and equity | $ | 7,358,478 | $ | 6,679,578 | $ | 6,692,678 | ||||||||||||||||||||||||||||||||||||||||
Interest rate spread | 3.14 | % | 3.27 | % | 3.20 | % | Interest rate spread | 3.13 | % | 3.07 | % | 3.14 | % | ||||||||||||||||||||||||||||||||||||||||
Net interest income /margin on earning assets | 213,582 | 3.37 | % | 205,659 | 3.41 | % | 184,750 | 3.33 | % | Net interest income /margin on earning assets | 227,453 | 3.31 | % | 212,279 | 3.39 | % | 213,582 | 3.37 | % | ||||||||||||||||||||||||||||||||||
Tax Equivalent Adjustment | (1,782 | ) | (4,355 | ) | (4,114 | ) | Tax Equivalent Adjustment | (2,114) | (1,651) | (1,782) | |||||||||||||||||||||||||||||||||||||||||||
Net interest income per consolidated financial statements | $ | 211,800 | $ | 201,304 | $ | 180,636 | Net interest income per consolidated financial statements | $ | 225,339 | $ | 210,628 | $ | 211,800 | ||||||||||||||||||||||||||||||||||||||||
1 Average balances and yields on available-for-sale securities are based on historical amortized cost.
2 Interest income includes the tax effects of taxable-equivalent adjustments using a combined New York State andthe Federal effective income tax rate of 21%21.0% in 20182020, 2019 and 40% in 20172018 to increase tax exempt interest income to taxable-equivalent basis.
3 Nonaccrual loans are included in the average asset totals presented above. Payments received on nonaccrual loans have been recognized as disclosed in Note 1 of the Company’s consolidated financial statements included in Part 1 of this annual report on Form 10-K.
36
Table 2 - Analysis of Changes in Net Interest Income
| 2020 vs. 2019 | 2019 vs. 2018 | ||||||||||||||||||||||
| Increase (Decrease) Due to Change in Average | Increase (Decrease) Due to Change in Average | ||||||||||||||||||||||
(In thousands)(taxable equivalent) | Volume | Yield/Rate | Total | Volume | Yield/Rate | Total | |||||||||||||||||
INTEREST INCOME: | |||||||||||||||||||||||
| Interest-bearing balances due from banks | $ | 229 | $ | (76) | $ | 153 | $ | (10) | $ | 20 | $ | 10 | |||||||||||
Investments1 | |||||||||||||||||||||||
Taxable | 139 | (6,685) | (6,546) | (2,896) | 667 | (2,229) | |||||||||||||||||
Tax-exempt | 566 | (65) | 501 | (105) | 132 | 27 | |||||||||||||||||
| FHLB and FRB stock | (1,212) | (418) | (1,630) | (970) | 596 | (374) | |||||||||||||||||
Loans, net1 | 18,122 | (17,185) | 937 | 3,354 | 8,867 | 12,221 | |||||||||||||||||
| Total interest income | $ | 17,844 | $ | (24,429) | $ | (6,585) | $ | (627) | $ | 10,282 | $ | 9,655 | |||||||||||
INTEREST EXPENSE: | |||||||||||||||||||||||
| Interest-bearing deposits: | |||||||||||||||||||||||
Interest checking, savings and money market | 3,638 | (14,307) | (10,669) | 938 | 9,314 | 10,252 | |||||||||||||||||
Time | 440 | (711) | (271) | 148 | 3,909 | 4,057 | |||||||||||||||||
Federal funds purchased and securities sold under agreements to repurchase | (8) | (40) | (48) | (9) | 0 | (9) | |||||||||||||||||
| Other borrowings | (8,642) | (2,129) | (10,771) | (7,148) | 3,806 | (3,342) | |||||||||||||||||
| Total interest expense | (4,572) | (17,187) | (21,759) | (6,071) | 17,029 | 10,958 | |||||||||||||||||
| Net interest income | $ | 22,416 | $ | (7,242) | $ | 15,174 | $ | 5,444 | $ | (6,747) | $ | (1,303) | |||||||||||
| 2018 vs. 2017 | 2017 vs. 2016 | ||||||||||||||||||||||
| Increase (Decrease) Due to Change in Average | Increase (Decrease) Due to Change in Average | ||||||||||||||||||||||
(in thousands)(taxable equivalent) | Volume | Yield/Rate | Total | Volume | Yield/Rate | Total | |||||||||||||||||
INTEREST INCOME: | |||||||||||||||||||||||
| Certificates of deposit, other banks | $ | (28 | ) | $ | 22 | $ | (6 | ) | $ | 14 | $ | 17 | $ | 31 | |||||||||
Investments1 | |||||||||||||||||||||||
Taxable | (931 | ) | 1,594 | 663 | 354 | 1,120 | 1,474 | ||||||||||||||||
Tax-exempt | (102 | ) | (771 | ) | (873 | ) | 90 | (6 | ) | 84 | |||||||||||||
| FHLB and FRB stock | 538 | 718 | 1,256 | 438 | 249 | 687 | |||||||||||||||||
Loans, net1 | 15,948 | 5,267 | 21,215 | 19,414 | 2,576 | 21,990 | |||||||||||||||||
| Total interest income | $ | 15,425 | $ | 6,830 | $ | 22,255 | $ | 20,310 | $ | 3,956 | $ | 24,266 | |||||||||||
INTEREST EXPENSE: | |||||||||||||||||||||||
| Interest-bearing deposits: | |||||||||||||||||||||||
Interest checking, savings and money market | 401 | 4,305 | 4,706 | 259 | 874 | 1,133 | |||||||||||||||||
Time | (1,505 | ) | 1,261 | (244 | ) | (342 | ) | 629 | 287 | ||||||||||||||
Federal funds purchased and securities sold under agreements to repurchase | (5 | ) | (78 | ) | (83 | ) | (252 | ) | (1,741 | ) | (1,993 | ) | |||||||||||
| Other borrowings | 3,339 | 6,614 | 9,953 | 2,078 | 1,852 | 3,930 | |||||||||||||||||
| Total interest expense | $ | 2,230 | $ | 12,102 | $ | 14,332 | $ | 1,743 | $ | 1,614 | $ | 3,357 | |||||||||||
| Net interest income | $ | 13,195 | $ | (5,272 | ) | $ | 7,923 | $ | 18,567 | $ | 2,342 | $ | 20,909 | ||||||||||
1 Interest income includes the tax effects of taxable-equivalent adjustments using a combined New York State andthe Federal effective income tax rate of 21%21.0% in 20182020, 2019 and 40% in 20172018 to increase tax exempt interest income to taxable-equivalent basis.
Changes in net interest income occur from a combination of changes in the volume of interest-earning assets and interest-bearing liabilities, and in the rate of interest earned or paid on them. The above table illustrates changes in interest income and interest expense attributable to changes in volume (change in average balance multiplied by prior year rate), changes in rate (change in rate multiplied by prior year volume), and the net change in net interest income. The net change attributable to the combined impact of volume and rate has been allocated to each in proportion to the absolute dollar amounts of the change. In 2018,2020, net interest income increased by $7.9$15.2 million,, resulting from a $22.3$21.8 million increasedecrease in interest income,expense, partially offset by a $14.3$6.6 million increasedecrease in interest expense. Growthincome. Lower yields on average earning assets reduced interest income by $24.4 million, while the increase in average balances on interest-earning assets contributed $15.4 million to the increase inincreased interest income while the higher yields on average earning assets added $6.8by $17.8 million. The increasedecrease in interest expense reflects higherlower rates paid on interest bearing liabilities, both deposits and growth inother borrowings. Lower rates on deposits and borrowings reduced interest expense by $17.2 million, while lower average balances of interest bearing liabilities.liabilities reduced interest expense by $4.6 million.
Provision for Credit Loss Expense
The provision for credit loss expense represents management’s estimate of the expense necessary to maintain the allowance for credit losses at an appropriate level. The provision for credit loss expense was $16.2 million in 2020, compared to $1.4 million in 2019. The ratio of total allowance to total loans and leases increased to 0.98% at December 31, 2020 from 0.81% at December 31, 2019. The first quarter of 2020 included a provision expense of $16.3 million driven by the impact of the economic restrictions/shutdowns related to COVID-19 on economic forecasts and other model assumptions relied upon by management in determining the allowance, as well as normal adjustments for loan growth and changing loan portfolio mix. See the section captioned “The Allowance for Credit Losses” included within “Management’s Discussion and Analysis of Financial Condition and Results of Operations-Financial Condition” of this Report for further analysis of the Company’s allowance for credit losses.
37
Noninterest Income
| Year ended December 31, | |||||||||||||||||
| (In thousands) | 2020 | 2019 | 2018 | ||||||||||||||
| Insurance commissions and fees | $ | 31,505 | $ | 31,091 | $ | 29,369 | |||||||||||
| Investment services | 17,520 | 16,434 | 17,288 | ||||||||||||||
| Service charges on deposit accounts | 6,312 | 8,321 | 8,435 | ||||||||||||||
| Card services | 9,263 | 10,526 | 9,693 | ||||||||||||||
| Other income | 8,817 | 8,416 | 13,130 | ||||||||||||||
| Net gain (loss) on securities transactions | 443 | 645 | (466) | ||||||||||||||
| Total | $ | 73,860 | $ | 75,433 | $ | 77,449 | |||||||||||
Noninterest income represented 24.7% of total revenues in 2020, and 26.4% in 2019.
Insurance commissions and fees increased 1.3% to $31.5 million in 2020, compared to $31.1 million in 2019. The increase in insurance commissions and fees in 2020 over 2019, was mainly in property and casualty commissions, personal line commissions, and contingency income, partially offset by an increase in reserves for cancellations and policy changes as a result of economic uncertainties related to COVID-19. New business volumes were also negatively impacted by COVID-19.
Investment services income of $17.5 million increased $1.1 million or 6.6% in 2020 compared to 2019, mainly due to an increase in advisory fee income resulting from the growth in assets under management, and higher estate and terminating trust fees earned in 2020. Investment services income includes trust services, financial planning, wealth management services, and brokerage related services. The fair value of assets managed by, or in custody of, Tompkins was $4.4 billion at December 31, 2020, up from $4.1 billion at December 31, 2019. The fair value of assets in custody at December 31, 2020 and 2019 includes $1.2 billion, and $1.0 billion, respectively, of Company-owned securities where Tompkins Trust Company is custodian.
Service charges on deposit accounts in 2020 were down $2.0 million or 24.1% compared to the prior year. Overdraft/insufficient funds charges, the largest component of service charges on deposit accounts, were down $1.7 million or 32.2% in 2020 compared to 2019. The decreases in overdraft/insufficient funds charges during 2020 were primarily related to a decrease in the volume of overdrafts relative to 2019.
Card services income decreased $1.3 million or 12.0% over 2019. The primary components of card services income are fees related to interchange income and transactions fees for debit card transactions, credit card transactions and ATM usage. The reduction in card services income in 2020, when compared to 2019, is largely related to the pandemic-related travel and business restrictions, which resulted in lower transaction volume. Additionally, card services income for 2019 included a one-time incentive payment of $500,000 related to the Company's merchant card business.
Other income of $8.8 million was up $401,000 or 4.8% compared to 2019. The increase was largely due to gains on sales of residential mortgage loans of $2.0 million in 2020, compared to gains of $227,000 in 2019, due to a higher volume of loans sold and higher premiums paid on loans sold in 2020.
Noninterest Expense
| Year ended December 31, | |||||||||||||||||
| (In thousands) | 2020 | 2019 | 2018 | ||||||||||||||
| Salaries and wages | $ | 92,519 | $ | 89,399 | $ | 85,625 | |||||||||||
| Other employee benefits | 24,812 | 23,488 | 22,090 | ||||||||||||||
| Net occupancy expense of premises | 12,930 | 13,210 | 13,309 | ||||||||||||||
| Furniture and fixture expense | 7,846 | 7,815 | 7,351 | ||||||||||||||
| FDIC insurance | 2,398 | 773 | 2,618 | ||||||||||||||
| Amortization of intangible assets | 1,484 | 1,673 | 1,771 | ||||||||||||||
| Other | 43,393 | 45,476 | 48,303 | ||||||||||||||
| Total | $ | 185,382 | $ | 181,834 | $ | 181,067 | |||||||||||
Noninterest expense as a percentage of total revenue was 62.0% in 2020, compared to 63.6% in 2019. Expenses associated with salaries and wages and employee benefits are the largest component of total noninterest expense. In 2020, these expenses increased $4.4 million or 3.9% compared to 2019. Salaries and wages increased $3.1 million or 3.5% in 2020 over the prior
38
year, mainly as a result of annual merit pay increases. Other employee benefits increased $1.3 million or 5.6% over 2019, mainly in health insurance, which was up $942,000 or 10.4% in 2020 over 2019. The $1.6 million increase in FDIC expense in 2020 over 2019 is due to the benefit of the FDIC insurance assessment small bank credits in 2019.
Other operating expenses of $43.4 million decreased by $2.1 million or 4.6% compared to 2019. The primary components of other operating expenses in 2020 were technology expense ($11.8 million), professional fees ($6.1 million), marketing expense ($4.8 million), and cardholder expense ($3.3 million) The decrease in other operating expenses in 2020 compared to 2019 was mainly in professional fees (down $2.9 million or 32.3%) and business related travel and entertainment expense (down $1.3 million or 67.3%). These decreases were partially offset by increases in technology related expenses in 2020 over 2019 (up $1.1 million or 10.5%), and expense related to our allowance for off-balance sheet exposures (up $1.0 million).
Noncontrolling Interests
Net income attributable to noncontrolling interests represents the portion of net income in consolidated majority-owned subsidiaries that is attributable to the minority owners of a subsidiary. The Company had net income attributable to noncontrolling interests of $154,000 in 2020, up $27,000 from 2019. The noncontrolling interests relate to three real estate investment trusts, which are substantially owned by the Company’s New York banking subsidiaries.
Income Tax Expense
The provision for income taxes provides for Federal, New York State, Pennsylvania and other miscellaneous state income taxes. The 2020 provision was $19.9 million, which decreased $1.1 million or 5.2% compared to the 2019 provision. The effective tax rate for the Company was 20.4% in 2020, down from 20.5% in 2019. The effective rates for 2020 and 2019 differed from the U.S. statutory rate of 21.0% during those periods due to the effect of tax-exempt income from loans, securities, and life insurance assets, investments in tax credits, and excess tax benefits of stock based compensation.
Results of Operations
(Comparison of December 31, 2019 and 2018 results)
General
The Company reported diluted earnings per share of $5.37 in 2019, compared to diluted earnings per share of $5.35 in 2018. Net income for the year ended December 31, 2019, was $81.7 million, a decrease of 0.7% compared to $82.3 million in 2018.
In addition to earnings per share, key performance measurements for the Company include return on average shareholders’ equity (ROE) and return on average assets (ROA). ROE was 12.55% in 2019, compared to 13.93% in 2018, while ROA was 1.22% in 2019 and 1.23% in 2018.
Segment Reporting
Banking Segment
The banking segment reported net income of $74.5 million for the year ended December 31, 2019, representing a $424,000 or 0.6% decrease compared to 2018. Net interest income decreased $1.2 million or 0.6% in 2019 compared to 2018. Contributing to the decline from 2018, was a decline in average security balances, which was partially offset by an improved net interest margin in 2019. Interest income increased $9.8 million or 3.9% compared to 2018, while interest expense increased $11.0 million or 27.5%.
The provision for loan and lease losses was $1.4 million in 2019, compared to $3.9 million in the prior year. The reduction in provision was primarily due to a $3.0 million specific reserve on one commercial real estate property at December 31, 2018, which was subsequently charged off in the first quarter of 2019. The provision expense in 2019 also benefited from favorable trends in certain qualitative factors and lower average historical loan loss rates in all loan portfolios except commercial real estate at year-end 2019, compared to year-end 2018.
Noninterest income in the banking segment of $29.1 million in 2019 decreased by $2.7 million or 8.5% when compared to 2018. The negative variance to prior year was mainly due to the $2.9 million gain on the sale of two properties in 2018 related to the completion and move to the Company's new headquarters building and the collection of fees and nonaccrual interest of $2.5 million in 2018 on a loan that was charged off in 2010. This was partially offset by the $500,000 one-time incentive payment received by the Company in the first quarter of 2019 related to the Company's merchant card business, and gains of
39
$645,000 on sales of available-for-sale securities in 2019 compared to net losses on sales of available-for-sale securities of $466,000 in 2018.
Noninterest expenses in 2019 were flat compared to 2018. Salary and wages and employee benefits were up in 2019 over 2018, mainly as a result of an increase in average FTEs, normal annual merit and incentive adjustments and higher health insurance costs. These increases were mainly offset by a decrease in other operating expenses. FDIC insurance expense was down in 2019 compared to 2018, mainly as a result of deposit insurance credits received from the FDIC, which included $1.5 million that were applied in 2019. 2018 operating expenses included write-downs of $2.3 million on leases on space vacated in 2018 following completion of the Company's new headquarters in 2018.
Insurance Segment
The insurance segment reported net income of $4.2 million, up $926,000 or 28.5% when compared to 2018, as a 5.9% increase in noninterest revenue was only partially offset by a 1.9% increase in expenses. This increase included $900,000 or 4.6% of organic growth in property and casualty commissions and a $738,000 or 32.0% increase in contingency revenue over 2018, while life, health and financial services commissions decreased slightly.
On May 1, 2019, Tompkins Insurance purchased the assets of Cali Agency, Inc. in Warsaw, NY, adding an additional $112,000 in non-interest income for 2019. The increase in expenses was mainly attributed to an increase in salary and wages and employee benefits reflecting normal annual merit and incentive adjustments and higher health insurance costs, respectively, over the prior year.
Wealth Management Segment
The wealth management segment reported net income of $3.1 million for the year ended December 31, 2019, a decrease of $1.1 million or 26.3% compared to 2018. Noninterest income of $17.0 million decreased $1.0 million or 5.5% compared to 2018, mainly a result of estate and terminating trust fees, which were down $1.0 million or 75.4% in 2019 over 2018, as a result of the settlement of a large estate in 2018. Noninterest expenses increased by $331,000 or 2.6% in 2019 compared to 2018, mainly due to changes in staffing and normal merit and incentive adjustments in 2019 compared to 2018. The market value of assets under management or in custody at December 31, 2019 totaled $4.1 billion, an increase of 6.7% compared to year-end 2018. This figure included $1.0 billion at year-end 2019 of Company-owned securities from which no income was recognized as the Trust Company was serving as custodian.
Net Interest Income
Net interest income is the Company’s largest source of revenue, representing 73.6% of total revenues for the year ended December 31, 2019, and 73.2% of total revenues for the year ended December 31, 2018. Net interest income is dependent on the volume and composition of interest earning assets and interest-bearing liabilities and the level of market interest rates.
Tax-equivalent net interest income for 2019 decreased by $1.3 million or 0.6% from 2018. The decrease was mainly due to the decline in average earning assets and higher funding costs in 2019 compared to 2018. Average total deposits represented 84.4% of average total liabilities in 2019 compared to 79.8% in 2018, while total average borrowings represented 13.9% of average total liabilities in 2019 and 19.1% in 2018.
Tax-equivalent interest income increased $9.7 million or 3.8% in 2019 over 2018. The increase in taxable-equivalent interest income was mainly the result of improved asset yields and an increase in average loan balances. Average loans and leases increased $72.5 million or 1.5% in 2019 compared to 2018. Average loan balances represented 77.1% of average earning assets in 2019 compared to 75.0% in 2018. The average yield on interest earning assets for 2019 was 4.2%, which increased by 20 basis points from 2018. The average yield on loans was 4.72% in 2019, an increase of 19 basis points compared to 4.53% in 2018. Average balances on securities decreased $132.1 million or 8.6% compared to 2018, while the average yield on the securities portfolio increased 5 basis points or 2.2% compared to 2018. The decrease in average securities was mainly due to the sale of approximately $152.1 million of available-for-sale securities in the second quarter of 2019. The proceeds from the sale were mainly used to reduce borrowings.
Interest expense for 2019 increased $11.0 million or 27.5% compared to 2018, reflecting higher rates as average interest bearing liabilities decreased $131.5 million or 2.8% from 2018. The increase in interest expense was the result of the increase in the average rates paid on deposits and interest bearing liabilities in 2019 compared to 2018. The average cost of interest bearing deposits was 0.84% in 2019, up 36 basis points from 0.48% in 2018, while the average costs of interest bearing liabilities increased to 1.12% in 2019 from 0.85% in 2018. Average total deposits were up $216.6 million or 4.4% in 2019 over 2018, with the majority of the growth in average interest bearing deposits. Average interest bearing deposits in 2019 increased $195.8
40
million or 5.6% compared to 2018. Average noninterest bearing deposit balances in 2019 increased $20.8 million or 1.5% over 2018 and represented 27.6% of average total deposits in 2019 compared to 28.4% in 2018. Average other borrowings decreased by $323.9 million or 29.8% in 2019 from 2018. The decrease in borrowings was due to strong deposit growth during the third quarter of 2019 as well as pay downs resulting from proceeds from sales of $152.1 million of available-for-sale securities in the second quarter of 2019.
Provision for Loan and Lease Losses
The provision for loan and lease losses represents management’s estimate of the expense necessary to maintain the allowance for loan and lease losses at an appropriate level. The provision for loan and lease losses was $1.4 million in 2019, compared to $3.9 million in 2018,2018. The ratio of total allowance to total loans and leases decreased to 0.81% at December 31, 2019 from 0.90% at December 31, 2018. Favorable trends in certain qualitative factors and lower average historical loan loss rates in all loan portfolios except commercial real estate at year-end 2019, compared to $4.2 million in 2017. Loan growthyear-end 2018, and lower specific reserves for 2018 was down from 2017, whichimpaired loans, contributed to the lower provision expense.allowance level at December 31, 2019. The allowance at December 31, 2018 included a specific reserve of $3.0 million related to one commercial real estate credit that was subsequently charged off in the first quarter of 2019. See the section captioned “The Allowance for Loan and Lease Losses” included within “Management’s Discussion and Analysis of Financial Condition and Results of Operations-Financial Condition” of this Report for further analysis of the Company’s allowance for loan and lease losses.
Noninterest Income
| Year ended December 31, | |||||||||||
| (in thousands) | 2018 | 2017 | 2016 | ||||||||
| Insurance commissions and fees | $ | 29,369 | $ | 28,778 | $ | 29,492 | |||||
| Investment services | 17,288 | 15,665 | 15,203 | ||||||||
| Service charges on deposit accounts | 8,435 | 8,437 | 8,793 | ||||||||
| Card services | 9,693 | 9,100 | 8,058 | ||||||||
| Net mark-to-market gains | 0 | 0 | 45 | ||||||||
| Other income | 13,130 | 7,631 | 6,291 | ||||||||
| Net (loss) gain on securities transactions | (466 | ) | (407 | ) | 926 | ||||||
| Total | $ | 77,449 | $ | 69,204 | $ | 68,808 | |||||
Noninterest income is a significant source of income for the Company, representing 26.8%represented 26.4% of total revenues in 2018,2019, and 25.6%26.8% in 2017, and is an important factor in the Company’s results of operations.2018.
Insurance commissions and fees increased 2.1%5.9% to $31.1 million in 2019, compared to $29.4 million in 2018.This increase included $900,000 or 4.6% of organic growth in property and casualty commissions and a $738,000 or 32.0% increase in contingency revenue over 2018, compared to $28.8 million in 2017. Insurance revenues increased $654,000, or 2.2%, when compared to 2017, reflecting increases in all business lines (personal, commercial,while life, health and life and health). Revenues for 2017 included a non-recurring gain on the sale of certain customer relationships in the amount of $154,000.financial services commissions decreased slightly.
Investment services income of $17.3$16.4 million decreased $854,000 or 4.9% in 2018 increased $1.6 million or 10.4%2019 compared to 2017.2018. Investment services income includes trust services, financial planning, and wealth management services. The increasedecrease in fees in 2018 over 2017income was mainly a result of estate and terminating trust fees being down $1.0 million or 75.4% in trust and estate2019 over 2018, due to fees and included feesreceived in 2018 related to the settlement of a large estate as well as growth in higher fee accounts such as asset management accounts and an increase in fees on certain products. With feesestate.Fees are largely based on the market value and the mix of assets managed, and accordingly, the general direction of the stock market can have a considerable impact on fee income. Global equity markets and the broad market index averages finished generally lower in 2018, when compared to 2017, which had an unfavorable impact on fees. The market value of assets managed by, or in custody of, the Trust Company was $3.8 billionat December 31, 2018, and $4.0$4.1 billion at December 31, 2017.2019, and $3.8 billion at December 31, 2018. These figures included $1.0 billion in 20182019 and $1.0 billion in 2017,2018 of Company-owned securities from which no income was recognized as the Trust Company was serving as custodian.
Service charges on deposit accounts in 20182019 were flatdown $114,000 or 1.4% compared to prior year. Overdraft/insufficient funds charges, the largest component of service charges on deposit accounts, were up $112,000down $180,000 or 2.1%3.2% in 20182019 compared to 2017, but were mainly offset by a decrease in2018, while service fees on personal and business accounts.accounts were up by $36,000 or 1.4% in 2019 compared to 2018.
Card services income increased $593,000$833,000 or 6.5%8.6% over 2017.2018. The primary components of card services income are fees related to interchange income and transactions fees for debit card transactions, credit card transactions and ATM usage.Card services income for 2019 included a one-time incentive payment of $500,000 related to the Company's merchant card business.Increased revenue was largelyalso driven by increased transaction volume in both credit and debit cards.
The Company recognized $466,000$645,000 of lossesgains on sales/calls of available-for-sale securities in 2018,2019, compared to $407,000$466,000 of losses in 2017.2018. The lossesgains are primarily related to the sales of available-for-sale securities, which are generally the result of general portfolio maintenance and interest rate risk management.
Other income of $13.1$8.4 million was up $5.5down $4.7 million or 72.1%35.9% compared to 2017.2018. The primary contributors for the increasedecrease in 20182019 over 20172018 were $2.9 million of gains on the sale of two properties we sold in 2018 upon completion of the Company's new headquarters building and $2.5 million related to the collection of fees and nonaccrual interest for a credit that was charged off in 2010. Other income also included $458,000
41
Noninterest Expense
| Year ended December 31, | |||||||||||
| (in thousands) | 2018 | 2017 | 2016 | ||||||||
| Salaries and wages | $ | 85,625 | $ | 81,948 | $ | 77,379 | |||||
| Other employee benefits | 22,090 | 21,458 | 19,909 | ||||||||
| Net occupancy expense of premises | 13,309 | 13,214 | 12,521 | ||||||||
| Furniture and fixture expense | 7,351 | 7,028 | 6,450 | ||||||||
| FDIC insurance | 2,618 | 2,527 | 3,024 | ||||||||
| Amortization of intangible assets | 1,771 | 1,932 | 2,090 | ||||||||
| Other | 48,303 | 42,998 | 37,234 | ||||||||
| Total | $ | 181,067 | $ | 171,105 | $ | 158,607 | |||||
Noninterest expense as a percentage of total revenue was 63.6% in 2019, compared to 62.6% in 2018, compared to 63.3% in 2017. 2018.Expenses associated with salaries and wages and employee benefits are the largest component of total noninterest expense.In 2018,2019, these expenses increased $4.3$5.2 million or 4.2%4.8% compared to 2017.2018. Salaries and wages increased $3.7$3.8 million or 4.5%4.4% in 20182019 over prior year, mainly as a result of annual merit pay increases as well as the Company's decision to raise the minimum wage paid to our employees.increases. Other employee benefits increased $632,000$1.4 million or 2.9%6.3% over 2017. The increase over prior year in other employee benefit expenses was2018, mainly in health insurance, which was up $431,000$736,000 or 5.5%8.9% in 20182019 over 2017.2018.
Other operating expenses of $48.3$45.5 million increaseddecreased by $5.3$2.8 million or 12.3%5.9% compared to 2017.2018. The primary components of other operating expenses in 20182019 were technology expense ($10.110.7 million), professional fees ($8.9 million), marketing expense ($5.5 million), professional fees ($8.64.9 million), cardholder expense ($3.33.2 million) and other miscellaneous expense ($20.818.3 million).Professional fees and technology related expenses in 20182019 were up by $2.8 million$378,000 and $1.8 million,$567,000, respectively, over 2017,2018, mainly as a result of investments in strengthening the Company's compliance and information security infrastructure.Other operating expensesexpense in 2018 included $2.5 million of write-downs related to two leases on space vacated in 2018. Other operating expense in 2017 included $2.7 million related to a write-off of a historic tax credit investment. The historic tax credit project was placed in service in 2017 resulting in the write-off of $2.7 million and recognition of the $3.3 million of tax credits as a reduction of income tax expense for 2017.
Noncontrolling Interests
Net income attributable to noncontrolling interests represents the portion of net income in consolidated majority-owned subsidiaries that is attributable to the minority owners of a subsidiary. The Company had net income attributable to noncontrolling interests of $127,000 in 20182019 and $128,000 in 2017.2018. The noncontrolling interests relate to three real estate investment trusts, which are substantially owned by the Company’s New York banking subsidiaries.
Income Tax Expense
The provision for income taxes provides for Federal, New York State, Pennsylvania and Pennsylvaniaother miscellaneous state income taxes. The 20182019 provision was $21.8$21.0 million, which decreased $20.8 million$789,000 or 48.8%3.6% compared to the 20172018 provision. The effective tax rate for the Company was 20.5% in 2019, down from 20.9% in 2018, down from 44.8% in 2017.2018. The effective rates for 20172019 and 2018 differed from the U.S. statutory rate of 35.0% and 21.0% during those periods due to the effect of tax-exempt income from loans, securities, and life insurance assets, investments in tax credits, and excess tax benefits of stock based compensation. The effective rate in 2017 was significantly impacted
Financial Condition
Total assets were $7.6 billion at December 31, 2020, increasing by a $14.913.3% or $896.5 million one-time write down of net deferred tax assets due to the required remeasurement of the assets that resulted from the TCJA. The change in the effective rate in 2017 was partially offset by the recognition of $3.3 million of tax credits related to an investment in a historic tax credit. The changes to the tax laws approved in December 2017 reduced the federal statutory tax rate from 35% in 2017, to 21% in 2018 and beyond.
Loans and leases were 71.5%69.0% of total assets at December 31, 2018,2020, compared to 70.2%73.1% of total assets at December 31, 2017.2019. Total loan balances were $5.2 billion at December 31, 2020, up $342.8 million or 7.0% compared to the $4.9 billion reported at year-end 2019, mainly due to the addition of PPP loans originated and funded in the second quarter of 2020. PPP loan balances totaled $291.3 million at year-end 2020. A more detailed discussion of the loan portfolio is provided below in this section under the caption “Loans and Leases”.
As of December 31, 2018,2020, total securities comprised 21.8%21.4% of total assets, compared to 23.0%19.3% of total assets at year-end 2017.2019. Securities were up $328.6 million or 25.3% at December 31, 2020, compared to December 31, 2019. The increase in securities from year-end 2019 was largely due to the investment of excess liquidity into securities and interest bearing balances. The securities portfolio primarily contains mortgage-backed securities, obligations of U.S. Government sponsored entities, and obligations of states and political subdivisions. A more detailed discussion of the securities portfolio is provided below in this section under the caption “Securities”.
Total deposits at year-end 2020 increased by $51.2 million$1.2 billion or 1.1%23.5% compared to December 31, 2017. Noninterest2019. All deposit categories at year-end 2020 were up over year-end 2019, with noninterest bearing deposits decreasedup by $39.5$472.4 million or 2.7%32.4%, while time deposit balances decreasedup by 14.8% compared to 2017 year-end. Checking,$71.2 million or 10.6% and checking, savings and money market accounts increased $201.6up by $681.2 million or 7.6%22.1% at December 31, 2020 compared to December 31, 2017.2019. Other borrowings, consisting mainly of short term advances with the FHLB, increased $4.3decreased $393.1 million from December 31, 2017.2019, as deposit growth were used to reduce borrowings. A more detailed discussion of deposits and borrowings is provided below in this section under the caption “Deposits and Other Liabilities”.
42
Shareholders’ Equity
The Consolidated Statements of Changes in Shareholders’ Equity included in the Consolidated Financial Statements of the Company contained in Part II, Item 8. of this Report, detail the changes in equity capital.capital over prior year end. Total shareholders’ equity was up $44.7$54.6 million or 7.8%8.2% to $620.9$717.7 million at December 31, 2018,2020, from $576.2$663.1 million at December 31, 2017.2019. Additional paid-in capital increaseddecreased by $2.6$4.5 million, from $364.0$338.5 million at December 31, 2017,2019, to $366.6$334.0 million at December 31, 2018.2020. The $2.6$4.5 million increasedecrease included the following: $3.5a $9.4 million aggregate purchase price related to the Company's repurchase and retirement of 127,690 shares of its common stock in connection with the 2020 Repurchase Plan and $1.9 million related to stock-based compensation; $3.1the exercise of stock options and restricted stock activity. These were partially offset by $4.7 million attributed to stock based compensation expense, $1.8 million related to shares issued forin connection with the employee stock ownership plan;Company's dividend reinvestment program and $410,000$255,000 related to shares issued for the Company's director deferred compensation plan. These were partially offset by the repurchase of Company stock of $2.4 million; and net payout of $1.4 million and $541,000 from restricted stock activity and stock option exercises, respectively. Retained earnings increased by $54.4$47.9 million, reflecting net income of $82.3$77.6 million, less dividends paid of $29.6$31.4 million and the net cumulative effect adjustment related to the adoption of ASU 2016-13 of $1.7 million.
Accumulated other comprehensive loss increaseddecreased from $51.3$43.6 million at December 31, 20172019 to $63.2$32.1 million at December 31, 2018;2020, reflecting a $10.6$16.6 million increase in unrealized lossesgains on available-for-sale securities due to market interest rates, and a $1.3$5.1 million increase in actuarial loss associated with employee benefit plans. Under regulatory requirements, amounts reported as accumulated other comprehensive income/loss related to net unrealized gain or loss on available-for-sale securities and the funded status of the Company’s defined benefit post-retirement benefit plans do not increase or reduce regulatory capital and are not included in the calculation of risk-based capital and leverage capital ratios.
Total shareholders’ equity was up $26.8$42.2 million or 4.9%6.8% to $576.2$663.1 million at December 31, 2017,2019, from $549.4$620.9 million at December 31, 2016.2018. Additional paid-in capital increaseddecreased by $6.6$28.1 million, from $357.4$366.6 million at December 31, 2016,2018, to $364.0$338.5 million at December 31, 2017.2019. The $6.6$28.1 million increasedecrease included the following: $3.0$29.9 million aggregate purchase price related to the Company's repurchase and retirement of 376,021 shares of its common stock in connection with its stock repurchase plan and $2.9 million related to stock-based compensation; $2.9the exercise of stock options and restricted stock activity. These were partially offset by $4.2 million in connection with the Company's dividend reinvestment plan; $2.3 million relatedattributed to shares issued for the employee stock ownership plan;based compensation expense and $441,000$377,000 related to shares issued for the Company's director deferred compensation plan. These were partially offset by the net payout of $1.2 million and $643,000 from restricted stock activity and stock option exercises, respectively. Retained earnings increased by $34.8$51.1 million, reflecting net income of $52.5$81.7 million, less dividends paid of $27.6 million, and a positive, one-time $10.0 million reclassification adjustment of the disproportionate tax effect from accumulated other comprehensive income due to tax law changes associated with the enactment of the TCJA.$30.6 million.
Accumulated other comprehensive loss increaseddecreased from $37.1$63.2 million at December 31, 20162018 to $51.3$43.6 million at December 31, 2017;2019; reflecting a $2.4$27.6 million increase in unrealized lossesgains on available-for-sale securities due to market interest rates, and a $1.8$8.0 million decrease in actuarial loss associated with employee benefit plans. The increase also includes the one-time $10.0 million reclassification adjustment mentioned above attributed to the disproportionate tax effect resulting from the recent tax law changes associated with the enactment of the TCJA.
The Company continued its long history of increasing cash dividends with a per share increase of 6.6%4.0% in 2018,2020, which followed an increase of 2.8%4.1% in 2017.2019. Dividends per share amounted to $2.10 in 2020, compared to $2.02 in 2019, and $1.94 in 2018, compared to $1.82 in 2017, and $1.77 in 2016.2018. Cash dividends paid represented 36.0%40.4%, 52.6%37.5%, and 44.8%36.0% of after-tax net income in 2018, 2017,2020, 2019, and 2016,2018, respectively.
On July 19, 2018, the Company’s Board of Directors authorized a stock repurchase plan (the "2018 Repurchase Plan") for the Company to repurchase up to 400,000 shares of the Company’s common stock. Purchases may be madestock over the 24 months following adoption of the plan. TheThrough December 31, 2019, the Company had repurchased 393,004 shares under the 2018 Repurchase Plan at an average price of $79.15.
On January 30, 2020, the Company’s Board of Directors authorized a stock repurchase plan (the "2020 Repurchase Plan") for the Company to repurchase up to 400,000 shares of the Company’s common stock over the 24 months following adoption of the plan. As with the 2018 Repurchase Plan, shares may be repurchased from time to time under the 2020 Repurchase Plan in open market transactions at prevailing market prices, in privately negotiated transactions, or by other means in accordance with federal securities laws, and the repurchase program may be suspended, modified or terminated by the Board of Directors at any time for any reason. The 2018 Repurchase Plan replacedThrough December 31, 2020, the Company’s previous 400,000 share repurchase plan announced on July 21, 2016 (the “2016 Repurchase Plan”). 16,983Company had repurchased 127,690 shares have been purchased to date under the 20182020 Repurchase Plan at an average price of $73.17.$73.72.
The Company and its subsidiary banks are subject to various regulatory capital requirements administered by Federal bank regulatory agencies. Failure to meet minimum capital requirements can initiate certain mandatory and possibly additional discretionary actions by regulators that, if undertaken, could have a direct material adverse effect on the Company’s business, results of operation and financial condition. Under capital adequacy guidelines and the regulatory framework for prompt corrective action (PCA), banks must meet specific guidelines that involve quantitative capitalmeasures of assets, liabilities, and certain off-balance-sheet items as calculated under regulatory accounting practices. Capital amounts and classifications of the Company and its subsidiary banks are also subject to qualitative judgments by regulators concerning components, risk
43
weightings, and other factors. Quantitative measures established by regulation to ensure capital adequacy. Consistent withadequacy require the objectivemaintenance of operating a sound financial organization,minimum amounts and ratios of common equity Tier 1 capital, Total capital and Tier 1 capital to risk-weighted assets, and of Tier 1 capital to average assets. Management believes that the Company and its subsidiary banks maintainmeet all capital adequacy requirements to which they are subject.
In addition to setting higher minimum capital ratios, well above regulatory minimumsthe Basel III Capital Rules introduced a capital conservation buffer, which must be added to each of the minimum capital ratios and meet the requirementsis designed to be considered well-capitalized under the regulatory guidelines.absorb losses during periods of economic stress. The capital conservation buffer was phased-in over a three year period that began on January 1, 2016, and was fully phased-in on January 1, 2019 at 2.5%.
As of December 31, 2018,2020, the capital ratios for the Company’s 4four subsidiary banks exceeded the minimum levels required to be considered well capitalized. Additional information on the Company’s capital ratios and regulatory requirements is provided in “Note 20 - Regulations and Supervision” in Notes to Consolidated Financial Statements in Part II, Item 8. of this Report on Form 10-K.
Securities
The Company maintains a portfolio of securities such as U.S. Treasuries, U.S. government sponsored entities securities, U.S. government agencies, non-U.S. Government agencies or sponsored entities mortgage-backed securities, obligations of states and political subdivisions thereof and equity securities. Management typically invests in securities with short to intermediate average lives in order to better match the interest rate sensitivities of its assets and liabilities. Investment decisions are made within policy guidelines established by the Company’s Board of Directors. The investment policy established by the Company’s Board of Directors is based on the asset/liability management goals of the Company, and is monitored by the Company’s Asset/Liability Management Committee. The intent of the policy is to establish a portfolio of high quality diversified securities, which optimizes net interest income within safety and liquidity limits deemed acceptable by the Asset/Liability Management Committee.
The Company classifies its securities at date of purchase as available-for-sale, held-to-maturity or trading. Securities, other than certain obligations of states and political subdivisions thereof, are generally classified as available-for-sale. Securities available-for-sale may be used to enhance total return, provide additional liquidity, or reduce interest rate risk. TheSecurities in the held-to-maturity portfolio would consists of obligations of U.S. Government sponsored entities and obligations of state and political subdivisions. The securitiesSecurities in the trading portfolio would reflect those securities that the Company elects to account for at fair value, with the adoption of ASC Topic 825, Financial Instruments.
The Company’s total securities portfolio at December 31, 20182020 totaled $1.47$1.63 billion compared to $1.53$1.30 billion at December 31, 2017.2019. The table below shows the composition of the available-for-sale and held-to-maturity securities portfolio as of year-end 2018, 20172020, 2019 and 2016.2018. The increase in the available-for-sale portfolio has decreasedat year-end 2020 over year-end 2019 reflects the past two years asreinvestment of excess liquidity. The Company purchased about $904.9 million of securities in 2020, which were partially offset by $545.6 million of payments, maturities calls and sales have exceeded purchases in the portfolio.calls. In addition,2020, fair values were unfavorablyfavorably impacted by changes in market interest rates. The balance of
For held-to-maturity securities, has been fairly stable the past few years.Company early adopted ASU 2019-04 on November 30, 2019. Since the Company had already adopted ASUs 2016-01 and 2017-12, the related amendments were effective as of November 30, 2019. As part of the adoption of ASU 2019-04, the Company reclassified $138.2 million in aggregate amortized cost basis of debt securities from held-to-maturity to available-for-sale. Included in other comprehensive income at December 31, 2019 is an unrealized gain of approximately $3.8 million related to the fair market value versus the cost basis of the portfolio at the time of the transfer. The decreaseCompany had not reclassified debt securities from held-to-maturity to available-for-sale upon adoption of the amendments in fair valueASU 2017-12. Under ASU 2019-04, entities that did not reclassify debt securities from held-to-maturity to available-for-sale upon adoption of the amendments in ASU 2017-12 and elect to reclassify debt securities upon adoption of the held-to-maturity portfolio was primarily dueamendments in ASU 2019-04 are required to changes in market interest rates. reflect the reclassification as of the date of adoption of that Update.
Additional information on the securities portfolio is available in “Note 2 Securities” in Notes to Consolidated Financial Statements in Part II, Item 8. of this Report, which details the types of securities held, the carrying and fair values, and the contractual maturities as of December 31, 20182020 and 2017.2019.
44
| As of December 31, | As of December 31, | |||||||||||||||||||||||||||||||||||||||||||||||||||||||||
| Available-for-Sale Securities | 2018 | 2017 | 2016 | Available-for-Sale Securities | 2020 | 2019 | 2018 | |||||||||||||||||||||||||||||||||||||||||||||||||||
| (in thousands) | Amortized Cost | Fair Value | Amortized Cost | Fair Value | Amortized Cost | Fair Value | ||||||||||||||||||||||||||||||||||||||||||||||||||||
| (In thousands) | (In thousands) | Amortized Cost | Fair Value | Amortized Cost | Fair Value | Amortized Cost | Fair Value | |||||||||||||||||||||||||||||||||||||||||||||||||||
| U.S. Treasuries | $ | 289 | $ | 289 | $ | 0 | $ | 0 | $ | 0 | $ | 0 | U.S. Treasuries | $ | 0 | $ | 0 | $ | 1,840 | $ | 1,840 | $ | 289 | $ | 289 | |||||||||||||||||||||||||||||||||
| Obligations of U.S. Government sponsored entities | $ | 493,371 | $ | 485,898 | $ | 507,248 | $ | 504,193 | $ | 527,057 | $ | 527,627 | Obligations of U.S. Government sponsored entities | 599,652 | 607,480 | 367,551 | 372,488 | 493,371 | 485,898 | |||||||||||||||||||||||||||||||||||||||
| Obligations of U.S. states and political subdivisions | 86,260 | 85,440 | 91,659 | 91,519 | 89,910 | 89,056 | Obligations of U.S. states and political subdivisions | 126,642 | 129,746 | 96,668 | 97,785 | 86,260 | 85,440 | |||||||||||||||||||||||||||||||||||||||||||||
| Mortgage-backed securities-residential, issued by | Mortgage-backed securities-residential, issued by | |||||||||||||||||||||||||||||||||||||||||||||||||||||||||
| U.S. Government agencies | 131,831 | 128,267 | 139,747 | 137,735 | 159,417 | 158,226 | U.S. Government agencies | 179,538 | 182,108 | 164,643 | 164,451 | 131,831 | 128,267 | |||||||||||||||||||||||||||||||||||||||||||||
| U.S. Government sponsored entities | 649,620 | 630,558 | 667,767 | 656,178 | 662,724 | 651,430 | U.S. Government sponsored entities | 691,562 | 705,480 | 660,037 | 659,590 | 649,620 | 630,558 | |||||||||||||||||||||||||||||||||||||||||||||
| Non-U.S. Government agencies or sponsored entities | 31 | 31 | 75 | 75 | 116 | 116 | Non-U.S. Government agencies or sponsored entities | 0 | 0 | 0 | 0 | 31 | 31 | |||||||||||||||||||||||||||||||||||||||||||||
| U.S. corporate debt securities | 2,500 | 2,175 | 2,500 | 2,162 | 2,500 | 2,162 | U.S. corporate debt securities | 2,500 | 2,379 | 2,500 | 2,433 | 2,500 | 2,175 | |||||||||||||||||||||||||||||||||||||||||||||
| Total available-for-sale securities | $ | 1,363,902 | $ | 1,332,658 | $ | 1,408,996 | $ | 1,391,862 | $ | 1,441,724 | $ | 1,428,617 | Total available-for-sale securities | $ | 1,599,894 | $ | 1,627,193 | $ | 1,293,239 | $ | 1,298,587 | $ | 1,363,902 | $ | 1,332,658 | |||||||||||||||||||||||||||||||||
| Held-to-Maturity Securities | 2020 | 2019 | 2018 | ||||||||||||||||||||||||||||||||
| (In thousands) | Amortized Cost | Fair Value | Amortized Cost | Fair Value | Amortized Cost | Fair Value | |||||||||||||||||||||||||||||
| Obligations of U.S. Government sponsored entities | $ | 0 | $ | 0 | $ | 0 | $ | 0 | $ | 131,306 | $ | 130,108 | |||||||||||||||||||||||
| Obligations of U.S. states and political subdivisions | 0 | 0 | 0 | 0 | 9,273 | 9,269 | |||||||||||||||||||||||||||||
| Total held-to-maturity securities | $ | 0 | $ | 0 | $ | 0 | $ | 0 | $ | 140,579 | $ | 139,377 | |||||||||||||||||||||||
| Held-to-Maturity Securities | 2018 | 2017 | 2016 | ||||||||||||||||||||
| (in thousands) | Amortized Cost | Fair Value | Amortized Cost | Fair Value | Amortized Cost | Fair Value | |||||||||||||||||
| Obligations of U.S. Government sponsored entities | $ | 131,306 | $ | 130,108 | $ | 131,707 | $ | 132,720 | $ | 132,098 | $ | 132,619 | |||||||||||
| Obligations of U.S. states and political subdivisions | 9,273 | 9,269 | 7,509 | 7,595 | 10,021 | 10,213 | |||||||||||||||||
| Total held-to-maturity securities | $ | 140,579 | $ | 139,377 | $ | 139,216 | $ | 140,315 | $ | 142,119 | $ | 142,832 | |||||||||||
•Adverse conditions specifically related to the security, an industry, or geographic area (changes in technology, business practice).
•Payment structure of the debt security with respect to underlying issuer or obligor.
•Failure of the issuer to make scheduled payment of principal and/or interest.
•Changes to the rating of a security or issuer by a NRSRO.
•Changes in tax or regulatory guidelines that impact a security or underlying issuer.
For available for sale debt securities in an unrealized loss position, the Company evaluates all investmentthe securities with a fair value less than amortized cost to identify any other-than-temporary impairment as defined under generally accepted accounting principles. The Company did not recognize any net credit impairment charge to earnings on investment securities in 2018, 2017, and 2016.
However, if the Company intends to sell an impaired available for sale debt security, or more likely than not be required to sell the debt security before the recovery of the amortized cost basis, the entire impairment amount, including any previously
45
recognized ACL, must be recognized in earnings with a corresponding adjustment to the security’s amortized cost basis.Because the security’s amortized cost basis is adjusted to fair value.value, there is no ACL.
The Company also holds non-marketable Federal Home Loan Bank New York (“FHLBNY”) stock, non-marketable Federal Home Loan Bank Pittsburgh (“FHLBPITT”) stock and non-marketable Atlantic Community Bankers Bank (“ACBB”) stock, all of which are required to be held for regulatory purposes and for borrowing availability. The required investment in FHLB stock is tied to the Company’s borrowing levels with the FHLB. Holdings of FHLBNY stock, FHLBPITT stock and ACBB stock totaled $37.4$11.0 million, $14.8$5.2 million and $95,000 at December 31, 2018,2020, respectively. These securities are carried at par, which is also cost. The FHLBNY and FHLBPITT continue to pay dividends and repurchase stock. As such, the Company has not recognized any impairment on its holdings of FHLBNY and FHLBPITT stock. At December 31, 2017,2019, the Company’s holdings of FHLBNY stock, FHLBPITT stock, and ACBB stock totaled $34.2$24.3 million, $16.2$9.3 million, and $95,000, respectively.
Management’s policy is to purchase investment grade securities that, on average, have relatively short expected durations. This policy helps mitigate interest rate risk and provides sources of liquidity without significant risk to capital. The contractual maturity distribution of debt securities and mortgage-backed securities as of December 31, 2018,2020, along with the weighted average yield of each category, is presented in Table 3-Maturity Distribution below. Balances are shown at amortized cost and weighted average yields are calculated on a fully taxable-equivalent basis. Expected maturities will differ from contractual maturities presented in Table 3-Maturity Distribution below, because issuers may have the right to call or prepay obligations with or without penalty and mortgage-backed securities will pay throughout the periods prior to contractual maturity.
46
Table 3 - Maturity Distribution
| As of December 31, 2020 | ||||||||||||||
Securities Available-for-Sale1 | Securities Held-to-Maturity | |||||||||||||
| (dollar amounts in thousands) | Amount | Yield2 | Amount | Yield2 | ||||||||||
| Obligations of U.S. Government sponsored entities | ||||||||||||||
| Within 1 year | $ | 43,255 | 2.31 | % | $ | 0 | 0.00 | % | ||||||
| Over 1 to 5 years | 358,032 | 1.35 | % | 0 | 0.00 | % | ||||||||
| Over 5 to 10 years | 173,156 | 0.82 | % | 0 | 0.00 | % | ||||||||
| Over 10 years | 25,209 | 1.87 | % | $ | 0 | 0.00 | % | |||||||
| $ | 599,652 | 1.29 | % | $ | 0 | 0.00 | % | |||||||
| Obligations of U.S. state and political subdivisions | ||||||||||||||
| Within 1 year | $ | 11,229 | 2.75 | % | $ | 0 | 0.00 | % | ||||||
| Over 1 to 5 years | 21,011 | 2.46 | % | 0 | 0.00 | % | ||||||||
| Over 5 to 10 years | 52,917 | 2.92 | % | 0 | 0.00 | % | ||||||||
| Over 10 years | 41,485 | 2.51 | % | 0 | 0.00 | % | ||||||||
| $ | 126,642 | 2.69 | % | $ | 0 | 0.00 | % | |||||||
| Mortgage-backed securities - residential | ||||||||||||||
| Within 1 year | $ | 0 | 0.00 | % | $ | 0 | 0.00 | % | ||||||
| Over 1 to 5 years | 7,914 | 3.22 | % | 0 | 0.00 | % | ||||||||
| Over 5 to 10 years | 105,389 | 2.05 | % | 0 | 0.00 | % | ||||||||
| Over 10 years | 757,797 | 1.10 | % | 0 | 0.00 | % | ||||||||
| $ | 871,100 | 1.23 | % | $ | 0 | 0.00 | % | |||||||
| Other securities | ||||||||||||||
| Over 5 to 10 years | $ | 2,500 | 3.04 | % | $ | 0 | 0.00 | % | ||||||
| $ | 2,500 | 3.04 | % | $ | 0 | 0.00 | % | |||||||
| Total securities | ||||||||||||||
| Within 1 year | $ | 54,484 | 2.40 | % | $ | 0 | 0.00 | % | ||||||
| Over 1 to 5 years | 386,958 | 1.45 | % | 0 | 0.00 | % | ||||||||
| Over 5 to 10 years | 333,961 | 1.56 | % | 0 | 0.00 | % | ||||||||
| Over 10 years | 824,491 | 1.19 | % | 0 | 0.00 | % | ||||||||
| $ | 1,599,894 | 1.37 | % | $ | 0 | 0.00 | % | |||||||
| As of December 31, 2018 | ||||||||||
Securities Available-for-Sale1 | Securities Held-to-Maturity | |||||||||
| (dollar amounts in thousands) | Amount | Yield2 | Amount | Yield2 | ||||||
| U.S. Treasury | ||||||||||
| Within 1 year | $ | 289 | 0.00 | % | $ | 0 | 0.00 | % | ||
| $ | 289 | 0.00 | % | $ | 0 | 0.00 | % | |||
| Obligations of U.S. Government sponsored entities | ||||||||||
| Within 1 year | $ | 69,123 | 1.73 | % | $ | 0 | 0.00 | % | ||
| Over 1 to 5 years | 327,326 | 2.02 | % | 86,170 | 2.32 | % | ||||
| Over 5 to 10 years | 96,922 | 2.83 | % | 45,136 | 2.71 | % | ||||
| $ | 493,371 | 2.14 | % | $ | 131,306 | 2.45 | % | |||
| Obligations of U.S. state and political subdivisions | ||||||||||
| Within 1 year | $ | 8,748 | 2.57 | % | $ | 8,850 | 3.09 | % | ||
| Over 1 to 5 years | 28,173 | 2.30 | % | 350 | 4.60 | % | ||||
| Over 5 to 10 years | 42,638 | 2.84 | % | 73 | 7.11 | % | ||||
| Over 10 years | 6,701 | 3.59 | % | 0 | 0.00 | % | ||||
| $ | 86,260 | 2.69 | % | $ | 9,273 | 3.18 | % | |||
| Mortgage-backed securities - residential | ||||||||||
| Within 1 year | $ | 0 | 0.00 | % | $ | 0 | 0.00 | % | ||
| Over 1 to 5 years | 1,577 | 4.52 | % | 0 | 0.00 | % | ||||
| Over 5 to 10 years | 184,968 | 2.17 | % | 0 | 0.00 | % | ||||
| Over 10 years | 594,937 | 2.46 | % | 0 | 0.00 | % | ||||
| $ | 781,482 | 2.40 | % | $ | 0 | 0.00 | % | |||
| Other securities | ||||||||||
| Over 10 years | $ | 2,500 | 5.61 | % | $ | 0 | 0.00 | % | ||
| $ | 2,500 | 5.61 | % | $ | 0 | 0.00 | % | |||
| Total securities | ||||||||||
| Within 1 year | $ | 78,160 | 1.82 | % | $ | 8,850 | 3.09 | % | ||
| Over 1 to 5 years | 357,076 | 2.05 | % | 86,520 | 2.33 | % | ||||
| Over 5 to 10 years | 324,528 | 2.46 | % | 45,209 | 2.72 | % | ||||
| Over 10 years | 604,138 | 2.49 | % | 0 | 0.00 | % | ||||
| $ | 1,363,902 | 2.33 | % | $ | 140,579 | 2.50 | % | |||
1 Balances of available-for-sale securities are shown at amortized cost.
2 Interest income includes the tax effects of taxable-equivalent adjustments using a combined New York State and Federal effective income tax rate of 24.5% to increase tax exempt interest income to taxable-equivalent basis.
The average taxable-equivalent yield on the securities portfolio was 1.83% in 2020, 2.30% in 2019 and 2.24% in 2018, 2.19% in 2017 and 2.13% in 2016.2018.
At December 31, 2018,2020, there were no holdings of any one issuer, other than the U.S. Government sponsored entities, in an amount greater than 10% of the Company’s shareholders’ equity.
47
Loans and Leases
Table 4 - Composition of Loan and Lease Portfolio
| Loans and Leases | As of December 31, | ||||||||||||||||
| (In thousands) | 2020 | 2019 | 2018 | 2017 | 2016 | ||||||||||||
| Commercial and industrial | |||||||||||||||||
| Agriculture | $ | 94,489 | $ | 105,786 | $ | 107,494 | $ | 108,608 | $ | 118,247 | |||||||
| Commercial and industrial other | 792,987 | 902,275 | 970,141 | 983,043 | 926,372 | ||||||||||||
| PPP Loans | 291,252 | 0 | 0 | 0 | 0 | ||||||||||||
| Subtotal commercial and industrial | 1,178,728 | 1,008,061 | 1,077,635 | 1,091,651 | 1,044,619 | ||||||||||||
| Commercial real estate | |||||||||||||||||
| Construction | 163,016 | 213,637 | 165,669 | 203,966 | 144,770 | ||||||||||||
| Agriculture | 201,866 | 184,898 | 170,229 | 129,959 | 102,776 | ||||||||||||
| Commercial real estate other | 2,204,310 | 2,045,030 | 2,004,763 | 1,866,802 | 1,673,295 | ||||||||||||
| Subtotal commercial real estate | 2,569,192 | 2,443,565 | 2,340,661 | 2,200,727 | 1,920,841 | ||||||||||||
| Residential real estate | |||||||||||||||||
| Home equity | 200,827 | 219,245 | 229,608 | 241,256 | 247,014 | ||||||||||||
| Mortgages | 1,235,160 | 1,158,592 | 1,104,286 | 1,061,685 | 972,801 | ||||||||||||
| Subtotal residential real estate | 1,435,987 | 1,377,837 | 1,333,894 | 1,302,941 | 1,219,815 | ||||||||||||
| Consumer and other | |||||||||||||||||
| Indirect | 8,401 | 12,964 | 12,663 | 12,144 | 14,835 | ||||||||||||
| Consumer and other | 61,399 | 61,446 | 58,326 | 50,979 | 45,219 | ||||||||||||
| Subtotal consumer and other | 69,800 | 74,410 | 70,989 | 63,123 | 60,054 | ||||||||||||
| Leases | 14,203 | 17,322 | 14,556 | 14,467 | 16,650 | ||||||||||||
| Total loans and leases | 5,267,910 | 4,921,195 | 4,837,735 | 4,672,909 | 4,261,979 | ||||||||||||
| Less: unearned income and deferred costs and fees | (7,583) | (3,645) | (3,796) | (3,789) | (3,946) | ||||||||||||
| Total loans and leases, net of unearned income and deferred costs and fees | $ | 5,260,327 | $ | 4,917,550 | $ | 4,833,939 | $ | 4,669,120 | $ | 4,258,033 | |||||||
| Originated Loans and Leases | As of December 31, | ||||||||||||||
| (in thousands) | 2018 | 2017 | 2016 | 2015 | 2014 | ||||||||||
| Commercial and industrial | |||||||||||||||
| Agriculture | $ | 107,494 | $ | 108,608 | $ | 118,247 | $ | 88,299 | $ | 78,507 | |||||
| Commercial and industrial other | 926,429 | 932,067 | 847,055 | 768,024 | 688,529 | ||||||||||
| Subtotal commercial and industrial | 1,033,923 | 1,040,675 | 965,302 | 856,323 | 767,036 | ||||||||||
| Commercial real estate | |||||||||||||||
| Construction | 164,285 | 202,486 | 135,834 | 103,037 | 72,427 | ||||||||||
| Agriculture | 170,005 | 129,712 | 102,509 | 86,935 | 58,994 | ||||||||||
| Commercial real estate other | 1,827,279 | 1,660,782 | 1,431,690 | 1,167,250 | 979,621 | ||||||||||
| Subtotal commercial real estate | 2,161,569 | 1,992,980 | 1,670,033 | 1,357,222 | 1,111,042 | ||||||||||
| Residential real estate | |||||||||||||||
| Home equity | 208,459 | 212,812 | 209,277 | 202,578 | 186,957 | ||||||||||
| Mortgages | 1,083,802 | 1,039,040 | 947,378 | 823,841 | 710,904 | ||||||||||
| Subtotal residential real estate | 1,292,261 | 1,251,852 | 1,156,655 | 1,026,419 | 897,861 | ||||||||||
| Consumer and other | |||||||||||||||
| Indirect | 12,663 | 12,144 | 14,835 | 17,829 | 18,298 | ||||||||||
| Consumer and other | 57,565 | 50,214 | 44,393 | 40,904 | 35,874 | ||||||||||
| Subtotal consumer and other | 70,228 | 62,358 | 59,228 | 58,733 | 54,172 | ||||||||||
| Leases | 14,556 | 14,467 | 16,650 | 14,861 | 12,251 | ||||||||||
| Total loans and leases | 4,572,537 | 4,362,332 | 3,867,868 | 3,313,558 | 2,842,362 | ||||||||||
| Less: unearned income and deferred costs and fees | (3,796 | ) | (3,789 | ) | (3,946 | ) | (2,790 | ) | (2,388 | ) | |||||
| Total originated loans and leases, net of unearned income and deferred costs and fees | $ | 4,568,741 | $ | 4,358,543 | $ | 3,863,922 | $ | 3,310,768 | $ | 2,839,974 | |||||
| Acquired Loans | |||||||||||||||
| Commercial and industrial | |||||||||||||||
| Commercial and industrial other | $ | 43,712 | $ | 50,976 | $ | 79,317 | $ | 84,810 | $ | 97,034 | |||||
| Subtotal commercial and industrial | 43,712 | 50,976 | 79,317 | 84,810 | 97,034 | ||||||||||
| Commercial real estate | |||||||||||||||
| Construction | 1,384 | 1,480 | 8,936 | 4,892 | 35,906 | ||||||||||
| Agriculture | 224 | 247 | 267 | 2,095 | 3,182 | ||||||||||
| Commercial real estate other | 177,484 | 206,020 | 241,605 | 284,952 | 308,488 | ||||||||||
| Subtotal commercial real estate | 179,092 | 207,747 | 250,808 | 291,939 | 347,576 | ||||||||||
| Residential real estate | |||||||||||||||
| Home equity | 21,149 | 28,444 | 37,737 | 42,092 | 56,008 | ||||||||||
| Mortgages | 20,484 | 22,645 | 25,423 | 27,491 | 32,282 | ||||||||||
| Subtotal residential real estate | 41,633 | 51,089 | 63,160 | 69,583 | 88,290 | ||||||||||
| Consumer and other | |||||||||||||||
| Indirect | 0 | 0 | 0 | 0 | 0 | ||||||||||
| Consumer and other | 761 | 765 | 826 | 911 | 1,095 | ||||||||||
| Subtotal consumer and other | 761 | 765 | 826 | 911 | 1,095 | ||||||||||
| Covered loans | 0 | 0 | 0 | 14,031 | 19,319 | ||||||||||
| Total acquired loans and leases | $ | 265,198 | $ | 310,577 | $ | 394,111 | $ | 461,274 | $ | 553,314 | |||||
Total loans and leases of $4.8$5.3 billion at December 31, 20182020 were up $164.8$342.8 million or 3.5%7.0% from December 31, 2017.2019. The growth was mainly due to organic loan growth. On August 1, 2012, the Company acquired $889.3in PPP loans, which totaled $291.3 million of loans in the VIST Financial acquisition. These loans are shown in the table under the acquired loan heading. All other loans, including loans originated by VIST Bank since the acquisition date of August 1, 2012, are considered originated loans. Originated loan balances at December 31, 2018 were up 4.8% over year-end 2017. The increase in originated loans, over prior year-end, was in all loan categories except commercial and industrial, which was relatively flat compared to prior year-end.2020. As of December 31, 2018,2020, total loans and leases represented 71.5%69.0% of total assets compared to 70.2%73.1% of total assets at December 31, 2017.2019.
Residential real estate loans, including home equity loans, of $1.3$1.4 billion at December 31, 2018, including home equity loans,2020, increased by $31.0$58.2 million or 2.4%4.2% from $1.3$1.4 billion at year-end 2017,2019, and comprised 27.6%27.3% of total loans and leases at December 31, 2018.2020. Growth in residential loan balances is impacted by the Company’s decision to retain these loans or sell them in the secondary market due to interest rate considerations. The Company’s Asset/Liability Committee meets regularly and establishes standards for selling and retaining residential real estate mortgage originations.
The Company may sell residential real estate loans in the secondary market based on interest rate considerations. These residential real estate loans are generally sold to Federal Home Loan Mortgage Corporation (“FHLMC”) or State of New York Mortgage Agency (“SONYMA”) without recourse in accordance with standard secondary market loan sale agreements. These residential real estate loans also are subject to customary representations and warranties made by the Company, including representations and warranties related to gross incompetence and fraud. The Company has not had to repurchase any loans as a result of these representations and warranties.
48
The Company originates fixed rate and adjustable rate residential mortgage loans, including loans that have characteristics of both, such as a 7/1 adjustable rate mortgage, which has a fixed rate for the first seven years and then adjusts annually thereafter. The majority of residential mortgage loans originated over the last several years have been fixed rate given the low interest rate environment. Adjustable rate residential real estate loans may be underwritten based upon an initial rate which is below the fully indexed rate; however, the initial rate is generally less than 100 basis points below the fully indexed rate. As such, the Company does not believe that this practice creates any significant credit risk.
Commercial real estate loans totaled $2.3$2.6 billion at December 31, 2018;2020, an increase of $139.9$125.6 million or 5.1% compared to December 31, 2017,2019, and represented 48.4%48.8% of total loans and leases at December 31, 2018,2020, compared to 47.1%49.7% at December 31, 2017.2019.
Commercial and industrial loans totaled $1.1$1.2 billion at December 31, 2018,2020, which is a decreasean increase of $14.0$170.7 million or 16.9% from December 31, 2017.2019. Commercial and industrial loans represented 22.3%22.4% of total loans at December 31, 20182020 compared to 23.4%20.5% at December 31, 2017.2019. The increase at year-end 2020 over year-end 2019 was mainly due to PPP loan originations. In the second quarter of 2020, the Company funded $465.6 million of PPP loans. At December 31, 2020, PPP loans totaled $291.3 million, with the decrease reflecting loans forgiven by the SBA. The PPP provides borrower guarantees for lenders, as well as loan forgiveness incentives for borrowers that utilize the loan proceeds to cover employee compensation-related expenses and certain other eligible business operating costs, all in accordance with the rules and regulations established by the SBA. On January 11, 2021, the SBA reactivated the PPP. The Company's banking subsidiaries have originated additional PPP loans through the PPP, which is currently scheduled to extend through March 31, 2021. As of February 21, 2021, the Company had submitted 1,341 PPP loan applications totaling $171.0 million under the 2021 PPP authorization.
As of December 31, 2018,2020, agriculturally-related loans totaled $277.7$296.4 million or 5.7%5.6% of total loans and leases compared to $238.6$290.7 million or 5.1%5.9% of total loans and leases at December 31, 2017.2019. Agriculturally-related loans include loans to dairy farms and cash and vegetable crop farms. Agriculturally related loans are primarily made based on identified cash flows of the borrower with consideration given to underlying collateral, personal guarantees, and government related guarantees. Agriculturally-related loans are generally secured by the assets or property being financed or other business assets such as accounts receivable, livestock, equipment or commodities/crops.
The consumer loan portfolio includes personal installment loans, indirect automobile financing, and overdraft lines of credit. Consumer and other loans were $71.0$69.8 million at December 31, 2018,2020, compared to $63.1$74.4 million at December 31, 2017.2019.
The lease portfolio increaseddecreased by 0.6%18.0% to $14.6$14.2 million at December 31, 20182020 from $14.5$17.3 million at December 31, 2017.2019. As of December 31, 2018,2020, commercial leases and municipal leases represented 100.0% of total leases.
The Company has adopted comprehensive lending policies, underwriting standards and loan review procedures. There were no significant changes to the Company’s existing policies, underwriting standards and loan review during 2018.2020. The Company’s Board of Directors approves the lending policies at least annually. The Company recognizes that exceptions to policy guidelines may occasionally occur and has established procedures for approving exceptions to these policy guidelines. Management has also implemented reporting systems to monitor loan originations, loan quality, concentrations of credit, loan delinquencies and nonperforming loans and potential problem loans.
The Company’s loan and lease customers are located primarily in the New York and Pennsylvania communities served by its 4four subsidiary banks. Although operating in numerous communities in New York State and Pennsylvania, the Company is still dependent on the general economic conditions of these states. The suspension of business activities in our market area has led to a significant increase in unemployment rates and has had a negative effect on our customers. There continues to be a great deal of uncertainty regarding how long those conditions will continue to exist. As a result, the economic consequences of the pandemic on our market area generally and on the Company in particular continue to be difficult to quantify. Other than geographic and general economic risks, management is not aware of any material concentrations of credit risk to any industry or individual borrower.
49
Analysis of Past Due and Nonperforming Loans
| As of December 31, | |||||||||||||||||
| (In thousands) | 2020 | 2019 | 2018 | 2017 | 2016 | ||||||||||||
Loans 90 days past due and accruing1 | |||||||||||||||||
| Consumer and other | $ | 0 | $ | 0 | $ | 0 | $ | 44 | $ | 0 | |||||||
| Total loans 90 days past due and accruing | 0 | 0 | 0 | 44 | 0 | ||||||||||||
| Nonaccrual loans | |||||||||||||||||
| Commercial and industrial | 1,775 | 2,335 | 1,883 | 2,852 | 738 | ||||||||||||
| Commercial real estate | 23,627 | 10,789 | 8,007 | 5,948 | 9,076 | ||||||||||||
| Residential real estate | 13,145 | 10,882 | 12,072 | 10,363 | 9,061 | ||||||||||||
| Consumer and other | 429 | 275 | 234 | 354 | 166 | ||||||||||||
| Total nonaccrual loans and leases | 38,976 | 24,281 | 22,196 | 19,517 | 19,041 | ||||||||||||
| Troubled debt restructurings not included above | 6,803 | 7,154 | 4,395 | 3,449 | 2,631 | ||||||||||||
| Total nonperforming loans and leases | 45,779 | 31,435 | 26,591 | 23,010 | 21,672 | ||||||||||||
| Other real estate owned | 88 | 428 | 1,595 | 2,047 | 908 | ||||||||||||
| Total nonperforming assets | $ | 45,867 | $ | 31,863 | $ | 28,186 | $ | 25,057 | $ | 22,580 | |||||||
| Total nonperforming loans and leases as a percentage of total loans and leases | 0.87 | % | 0.64 | % | 0.55 | % | 0.49 | % | 0.51 | % | |||||||
| Total nonperforming assets as a percentage of total assets | 0.60 | % | 0.47 | % | 0.42 | % | 0.38 | % | 0.36 | % | |||||||
| Allowance as a percentage of nonperforming loans and leases | 112.87 | % | 126.90 | % | 163.25 | % | 172.84 | % | 164.98 | % | |||||||
| As of December 31, | |||||||||||||||
| (in thousands) | 2018 | 2017 | 2016 | 2015 | 2014 | ||||||||||
| Loans 90 days past due and accruing* | |||||||||||||||
| Commercial real estate | $ | 0 | $ | 0 | $ | 0 | $ | 0 | $ | 0 | |||||
| Residential real estate | 0 | 0 | 0 | 58 | 106 | ||||||||||
| Consumer and other | 0 | 44 | 0 | 0 | 0 | ||||||||||
| Total loans 90 days past due and accruing | 0 | 44 | 0 | 58 | 106 | ||||||||||
| Nonaccrual loans | |||||||||||||||
| Commercial and industrial | 1,883 | 2,852 | 738 | 1,738 | 2,116 | ||||||||||
| Commercial real estate | 8,007 | 5,948 | 9,076 | 6,054 | 7,520 | ||||||||||
| Residential real estate | 12,072 | 10,363 | 9,061 | 9,863 | 9,043 | ||||||||||
| Consumer and other | 234 | 354 | 166 | 182 | 349 | ||||||||||
| Leases | 0 | 0 | 0 | 0 | 0 | ||||||||||
| Total nonaccrual loans and leases | 22,196 | 19,517 | 19,041 | 17,837 | 19,028 | ||||||||||
| Troubled debt restructurings not included above | 4,395 | 3,449 | 2,631 | 3,915 | 3,444 | ||||||||||
| Total nonperforming loans and leases | 26,591 | 23,010 | 21,672 | 21,810 | 22,578 | ||||||||||
| Other real estate owned | 1,595 | 2,047 | 908 | 2,692 | 5,683 | ||||||||||
| Total nonperforming assets | $ | 28,186 | $ | 25,057 | $ | 22,580 | $ | 24,502 | $ | 28,261 | |||||
| Total nonperforming loans and leases as a percentage of total loans and leases | 0.55 | % | 0.49 | % | 0.51 | % | 0.58 | % | 0.67 | % | |||||
| Total nonperforming assets as a percentage of total assets | 0.42 | % | 0.38 | % | 0.36 | % | 0.43 | % | 0.54 | % | |||||
| Allowance as a percentage of nonperforming loans and leases | 163.25 | % | 172.84 | % | 164.98 | % | 146.74 | % | 128.43 | % | |||||
The level of nonperforming assets at the past five year-ends is illustrated in the table above. The ratio of nonperforming loans to total loans improved between 2014 and 2017, but was up slightly at year-end 2018. The Company’s total nonperforming assets as a percentage of total assets was 0.42%0.60% at December 31, 2018,2020, up from 0.38%0.47% at December 31, 2017, but continues to compare favorably2019, and compares to its peer group’sgroup's most recent ratio of 0.61%0.51% at September 30, 2018.2020. The peer data is from the Federal Reserve Board and represents banks or bank holding companies with assets between $3.0 billion and $10.0 billion.
A breakdown of nonperforming loans by portfolio segment is shown above. Nonperforming loans totaled $45.8 million at December 31, 20182020 and were up 15.6%45.6% from December 31, 2017.2019. Nonperforming loans represented 0.87% of total loans at December 31, 2020, compared to 0.64% of total loans at December 31, 2019, and 0.55% of total loans at December 31, 2018, compared to 0.49% of total loans at December 31, 2017, and 0.51% of total loans at December 31, 2016.2018. The increase in nonperforming loans at year-end 2018 compared to year-end 2017 was mainly in the commercial real estate and residential real estate portfolios, and a result of unfavorable economic conditions related to the COVID-19 pandemic. Nonperforming loans and partially offset by a decrease in commercial and industrial loans. The increase inthe commercial real estate nonaccrual loansportfolio at year-end 2020 increased by $12.8 million compared to 2019; the increase was mainly due to one credit totaling $11.8 million in the additionhospitality industry that was downgraded to Substandard and placed on nonaccrual status in the fourth quarter of one relationship2020. The loan totaling $4.8 million. The decreaseis also currently in commercial and industrial nonaccrual loans reflects paydowns and loans returned to accruing status due to improved performance.the Company's deferral payment program. At December 31, 2018,2020, other real estate owned was down $452,000$340,000 from prior year-end and represented 5.7%0.2% of total nonperforming assets, down from 8.2%1.3% at December 31, 2017.2019. The decrease in other real estate owned was mainly a result of sales during 2020.
The Company implemented a payment deferral program to assist both consumer and business borrowers that may be experiencing financial hardship due to COVID-19. Weekly deferral requests for the write-downmonth of December were down 98.5% from peak levels the Company experienced in late March. As of December 31, 2020, total loans, impacted by COVID-19 and that continued in a deferral status amounted to approximately $212.2 million, representing 4.0% of total loans. Loans to finance hotels and motels comprise approximately 53.0% of total loans that continue in deferral status. Of loans that had come out of the deferral program as of December 31, 2020, about 94.4% had made at least one commercial real estate property during 2018.payment and only 0.13% were more than 30 days delinquent.
50
Loans are considered modified in a troubled debt restructuring (“TDR”) when, due to a borrower’s financial difficulties, the Company makes a concession(s) to the borrower that the Company would not otherwise consider. When modifications are provided for reasons other than as a result of the financial distress of the borrower, these loans are not classified as TDRs or impaired. These modifications may include, among others, an extension of the term of the loan, and granting a period when interest-only payments can be made, with the principal payments made over the remaining term of the loan or at maturity. TDRs are included in the above table within the following categories: “loans 90 days past due and accruing”, “nonaccrual loans”, or “troubled debt restructurings not included above”. Loans in the latter category include loans that meet the definition of a TDR but are performing in accordance with the modified terms and have shown a satisfactory period of repayment (generally six consecutive months) and where full collection of all is reasonably assured. At December 31, 2018,2020, the Company had $6.9$8.5 million in TDR balances, which are included in the above table; $4.4table, of which $6.8 million are included in the line captioned “Troubled debt restructurings not included above” and the remainder are included within nonaccrual loans.
In general, the Company places a loan on nonaccrual status if principal or interest payments become 90 days or more past due and/or management deems the collectability of the principal and/or interest to be in question, as well as when called for by regulatory requirements. Although in nonaccrual status, the Company may continue to receive payments on these loans. These payments are generally recorded as a reduction to principal and interest income is recorded only after principal recovery is reasonably assured. For additional financial information on the difference between the interest income that would have been recorded if these loans and leases had been paid in accordance with their original terms and the interest income that was recorded, refer to “Note 3 – Loans and Leases” in the Notes to Consolidated Financial Statements in Part II, Item 8. of this Report.
The Company’s recorded investment in originated loans and leases that are considered impairedindividually evaluated totaled $14.2$32.18 million at December 31, 2018,2020, and $12.1million$19.4 million at December 31, 2017.2019. A loan is impairedindividually evaluated when, based on current information and events, it is probable that we will be unable to collect all amounts due according to the contractual terms of the loan agreement. ImpairedIndividually evaluated loans consist of our non-homogenous nonaccrual loans and loans that are 90 days or more past due. Specific reserves on individually identified impairedevaluated loans that are not collateral dependent are measured based on the present value of expected future cash flows discounted at the original effective interest rate of each loan. For loans that are collateral dependent, impairment is measured based on the fair value of the collateral less estimated selling costs, and such impaired amounts are generally charged off.
At December 31, 2018,2020, there was awere specific reservereserves of $3.8 million$308,000 on sevenfour commercial real estate loans and five commercial loans, in the originated loan portfolio, compared to a $441,000 reserve$907,000 of specific reserves on seven commercial real estate loans at December 31, 2017. The increase in the specific reserve was mainly due to the addition of a $3.0 million specific reserve added to one loan in the fourth quarter of 2018.2019. The majority of the remaining impairedindividually evaluated loans are collateral dependent impaired loans that have limited exposure or require limited specific reserves because of the amount of collateral support with respect to these loans or the loans have been written down to fair value. Interest payments on impairedindividually evaluated loans are typically applied to principal unless collectability of the principal amount is reasonably assured. In these cases, interest is recognized on a cash basis. There was no interest income recognized on impairedindividually evaluated loans and leases for 2018, 20172020, 2019 and 2016.2018.
The ratio of the allowance to nonperforming loans (loans past due 90 days and accruing, nonaccrual loans and restructured troubled debt) was 163.25%112.87% at December 31, 2018,2020, compared to 172.84%126.90% at December 31, 2017.2019. The Company’s nonperforming loans are mostly made up of collateral dependent impaired loans requiring little to no specific allowance due to the level of collateral available with respect to these loans and/or previous charge-offs.
Management reviews the loan portfolio for evidence of potential problem loans and leases. Potential problem loans and leases are loans and leases that are currently performing in accordance with contractual terms, but where known information about possible credit problems of the related borrowers causes management to have doubt as to the ability of such borrowers to comply with the present loan payment terms and may result in such loans and leases becoming nonperforming at some time in the future. Management considers loans and leases classified as Substandard, which continue to accrue interest, to be potential problem loans and leases. The Company, through its credit administration function, identified 2935 commercial relationships from the originated portfolio and 6 commercial relationships from the acquired portfolio totaling $33.7$40.8 million and $1.2 million, respectively at December 31, 20182020 that were potential problem loans. At December 31, 2017,2019, there were 2841 relationships totaling $11.2$44.0 million in the originated portfolio and 10 relationships totaling $3.6 million in the acquiredloan portfolio that were considered potential problem loans.
Of the 2935 commercial relationships from the originated portfolio that were classified as potential problem loans at December 31, 2018,2020, there were 1112 relationships that equaled or exceeded $1.0 million, which in aggregate totaled $30.1 million. Of the 6 commercial relationships from the acquired loan portfolio, there were no relationships that equaled or exceeded $1.0$36.1 million. The potential problem loans remain in a performing status due to a variety of factors, including payment history, the value of collateral supporting the credits, and personal or government guarantees. These factors, when considered in the aggregate, give management reason to believe that the current risk exposure on these loans does not warrant accounting for these loans as nonperforming. However, these loans do exhibit certain risk factors, which have the potential to cause them to become nonperforming. Accordingly, management’s attention is focused on these credits, which are reviewed on at least a quarterly basis.
51
The Allowance for Loan and LeaseCredit Losses
The Company uses a discounted cash flow ("DCF") method to estimate expected credit losses for all loan segments excluding the leasing segment. For each of current economic conditions. these loan segments, the Company generates cash flow projections at the instrument level wherein payment expectations are adjusted for estimated prepayment speeds, curtailments, recovery lag probability of default, and loss given default. The modeling of expected prepayment speeds, curtailment rates, and time to recovery are based on internal historical data.
Due to the size and characteristics of the leasing portfolio, the Company uses the remaining life method, using the historical loss rate of the commercial and industrial segment, to determine the allowance for loancredit losses.
The combination of adjustments for credit expectations and lease losses. While none of these components, when used independently,timing expectations produces an expected cash flow stream at the instrument level. Instrument effective yield is effective in arriving at a reserve level thatappropriately measures the risk inherent in the portfolio, management believes that using them collectively, provides reasonable measurementcalculated, net of the loss exposure inimpacts of prepayment assumptions, and the portfolio. instrument expected cash flows are then discounted at that effective yield to produce a net present value of expected cash flows ("NPV"). An ACL is established for the difference between the NPV and amortized cost basis.
The components include:
Since the model. This validation includes reviewing the appropriateness of model calculations, back testing of model resultsmethodology is based upon historical experience and appropriateness of key assumptions used in the model.
Loan Commitments and Allowance for Credit Losses on Off-Balance Sheet Credit Exposures
Financial instruments include off-balance sheet credit markinstruments, such as commitments to provide for expected losses in our acquired loan portfolio. There was no allowance for loan losses carried over from the acquired company. To the extent thatmake loans, and commercial letters of credit. The Company's exposure to credit quality deteriorates subsequent to acquisition, such deterioration would resultloss in the establishmentevent of nonperformance by the other party to the financial instrument for off-balance sheet loan commitments is represented by the contractual amount of those instruments. Such financial instruments are recorded when they are funded. The Company records an allowance for credit losses on off-balance sheet credit exposures, unless the acquired loan portfolio.commitments to extend credit are unconditionally cancelable, through a charge to credit loss expense for off-balance sheet credit exposures included in other noninterest expense in the Company's consolidated statements of income.
52
The allocation of the Company’s allowance as of December 31, 2018,2020, and each of the previous four years is illustrated in Table 5- Allocation of the Allowance for Loan and LeaseCredit Losses, below.
| As of December 31, | |||||||||||||||||||
| (in thousands) | 2018 | 2017 | 2016 | 2015 | 2014 | ||||||||||||||
| Originated loans outstanding at end of year | $ | 4,568,741 | $ | 4,358,543 | $ | 3,863,922 | $ | 3,310,768 | $ | 2,839,974 | |||||||||
| Allocation of the originated allowance by originated loan type: | |||||||||||||||||||
| Commercial and industrial | $ | 11,217 | $ | 11,812 | $ | 9,389 | $ | 10,495 | $ | 9,157 | |||||||||
| Commercial real estate | 23,483 | 20,412 | 19,836 | 15,479 | 12,069 | ||||||||||||||
| Residential real estate | 7,317 | 6,161 | 5,149 | 4,070 | 5,030 | ||||||||||||||
| Consumer and other | 1,304 | 1,301 | 1,224 | 1,268 | 1,900 | ||||||||||||||
| Total | $ | 43,321 | $ | 39,686 | $ | 35,598 | $ | 31,312 | $ | 28,156 | |||||||||
| Allocation of the originated allowance as a percentage of total originated allowance: | |||||||||||||||||||
| Commercial and industrial | 26 | % | 30 | % | 27 | % | 34 | % | 32 | % | |||||||||
| Commercial real estate | 54 | % | 51 | % | 56 | % | 49 | % | 43 | % | |||||||||
| Residential real estate | 17 | % | 16 | % | 14 | % | 13 | % | 18 | % | |||||||||
| Consumer and other | 3 | % | 3 | % | 3 | % | 4 | % | 7 | % | |||||||||
| Total | 100 | % | 100 | % | 100 | % | 100 | % | 100 | % | |||||||||
| Loan and lease types as a percentage of total originated loans and leases: | |||||||||||||||||||
| Commercial and industrial | 23 | % | 24 | % | 25 | % | 26 | % | 27 | % | |||||||||
| Commercial real estate | 47 | % | 46 | % | 43 | % | 41 | % | 39 | % | |||||||||
| Residential real estate | 28 | % | 29 | % | 30 | % | 31 | % | 32 | % | |||||||||
| Consumer and other | 2 | % | 1 | % | 2 | % | 2 | % | 2 | % | |||||||||
| Total | 100 | % | 100 | % | 100 | % | 100 | % | 100 | % | |||||||||
| As of December 31, | |||||||||||||||||||
| (in thousands) | 2018 | 2017 | 2016 | 2015 | 2014 | ||||||||||||||
| Acquired loans outstanding at end of year | $ | 265,198 | $ | 310,577 | $ | 394,111 | $ | 461,274 | $ | 553,314 | |||||||||
| Allocation of the acquired allowance by acquired loan type: | |||||||||||||||||||
| Commercial and industrial | $ | 55 | $ | 25 | $ | 0 | $ | 433 | $ | 431 | |||||||||
| Commercial real estate | 0 | 0 | 97 | 61 | 337 | ||||||||||||||
| Residential real estate | 28 | 54 | 54 | 198 | 51 | ||||||||||||||
| Consumer and other | 6 | 6 | 6 | 0 | 22 | ||||||||||||||
| Total | $ | 89 | $ | 85 | $ | 157 | $ | 692 | $ | 841 | |||||||||
| Allocation of the acquired allowance as a percentage of total acquired allowance: | |||||||||||||||||||
| Commercial and industrial | 62 | % | 29 | % | 0 | % | 62 | % | 51 | % | |||||||||
| Commercial real estate | 0 | % | 0 | % | 62 | % | 9 | % | 40 | % | |||||||||
| Residential real estate | 31 | % | 64 | % | 34 | % | 29 | % | 6 | % | |||||||||
| Consumer and other | 7 | % | 7 | % | 4 | % | 0 | % | 3 | % | |||||||||
| Total | 100 | % | 100 | % | 100 | % | 100 | % | 100 | % | |||||||||
| Loan and lease types as a percentage of total acquired loans and leases: | |||||||||||||||||||
| Commercial and industrial | 16 | % | 16 | % | 20 | % | 18 | % | 18 | % | |||||||||
| Commercial real estate | 68 | % | 67 | % | 64 | % | 64 | % | 63 | % | |||||||||
| Residential real estate | 16 | % | 17 | % | 16 | % | 15 | % | 16 | % | |||||||||
| Consumer and other | 0 | % | 0 | % | 0 | % | 0 | % | 0 | % | |||||||||
| Covered | 0 | % | 0 | % | 0 | % | 3 | % | 3 | % | |||||||||
| Total | 100 | % | 100 | % | 100 | % | 100 | % | 100 | % | |||||||||
Table 5 - Allocation of the Allowance for Credit Losses
| As of December 31, | |||||||||||||||||||||||||||||
| (In thousands) | 2020 | 2019 | 2018 | 2017 | 2016 | ||||||||||||||||||||||||
| Total loans outstanding at end of year | $ | 5,260,327 | $ | 4,917,550 | $ | 4,833,939 | $ | 4,669,120 | $ | 4,258,033 | |||||||||||||||||||
| Allocation of the ACL by loan type: | |||||||||||||||||||||||||||||
| Commercial and industrial | $ | 9,239 | $ | 10,541 | $ | 11,272 | $ | 11,837 | $ | 9,389 | |||||||||||||||||||
| Commercial real estate | 30,546 | 21,608 | 23,483 | 20,412 | 19,933 | ||||||||||||||||||||||||
| Residential real estate | 10,257 | 6,381 | 7,345 | 6,215 | 5,203 | ||||||||||||||||||||||||
| Consumer and other | 1,562 | 1,362 | 1,310 | 1,307 | 1,230 | ||||||||||||||||||||||||
| Leases | 65 | 0 | 0 | 0 | 0 | ||||||||||||||||||||||||
| Total | $ | 51,669 | $ | 39,892 | $ | 43,410 | $ | 39,771 | $ | 35,755 | |||||||||||||||||||
| Allocation of the ACL as a percentage of total allowance: | |||||||||||||||||||||||||||||
| Commercial and industrial | 18 | % | 26 | % | 26 | % | 30 | % | 26 | % | |||||||||||||||||||
| Commercial real estate | 59 | % | 54 | % | 54 | % | 51 | % | 56 | % | |||||||||||||||||||
| Residential real estate | 20 | % | 16 | % | 17 | % | 16 | % | 15 | % | |||||||||||||||||||
| Consumer and other | 3 | % | 3 | % | 3 | % | 3 | % | 3 | % | |||||||||||||||||||
| Leases | 0 | % | 0 | % | 0 | % | 0 | % | 0 | % | |||||||||||||||||||
| Total | 100 | % | 100 | % | 100 | % | 100 | % | 100 | % | |||||||||||||||||||
| Loan and lease types as a percentage of total loans and leases: | |||||||||||||||||||||||||||||
| Commercial and industrial | 23 | % | 21 | % | 22 | % | 24 | % | 25 | % | |||||||||||||||||||
| Commercial real estate | 49 | % | 50 | % | 49 | % | 47 | % | 45 | % | |||||||||||||||||||
| Residential real estate | 27 | % | 28 | % | 28 | % | 28 | % | 29 | % | |||||||||||||||||||
| Consumer and other | 1 | % | 1 | % | 1 | % | 1 | % | 1 | % | |||||||||||||||||||
| Leases | 0 | % | 0 | % | 0 | % | 0 | % | 0 | % | |||||||||||||||||||
| Total | 100 | % | 100 | % | 100 | % | 100 | % | 100 | % | |||||||||||||||||||
The five year trend in the allowance is shown above. Over the fivethree year period between 2016 through 2018, the originated allowance has steadily increased driven in large part by growth in originated loans, whileloans. The increase in 2018 was also a result of specific reserve allocations for one commercial real estate relationship. This credit was charged off during 2019, which contributed to the acquired portfolio has steadily decreased, reflecting run-offdecrease in the allowance from year-end 2018 to year-end 2019.
As a result of the acquired portfolio, improving asset quality metrics inadoption of ASU 2016-13, the acquired portfolio, andCompany recorded a net charge-offs.cumulative-effect adjustment reducing the allowance for credit losses by $2.5 million from $39.9 million at December 31, 2019 to $37.4 million at January 1, 2020. As of December 31, 2018,2020, the total allowance for loan and leasecredit losses was $43.4$51.7 million, which was up $3.6$11.8 million or 9.2%29.5% from year-end 2017.2019. The year-end allowance for originated loans and leases was up $3.6$14.3 million compared to prior year end, and the allowance for acquired loans was up $4,000 from year-end 2017. At December 31, 2018, the total allowance was 163.25% of total nonperforming loans compared to 172.84% at December 31, 2017.
53
between June 30, 2020 and December 31, 2020, as lower estimated reserves driven by improvements in forecasts for unemployment and the gross domestic product used in our model were offset by increases in qualitative reserves for loans within the hospitality and certain other industries that may have an elevated level of risk due to the adverse economic impact of the COVID-19 pandemic, as well as loans that remain in the Company's payment deferral program implemented in response to the COVID-19 pandemic. The qualitative reserves were added to all portfolio segments with the majority in commercial real estate and then residential real estate.
Total loans shown in the originated allowance table above. Asset quality metrics in the originated portfolio remain favorablewere $5.3 billion at December 31, 2018 but did show some deterioration2020, up $342.8 million or 7.0% from December 31, 2017. Originated2019. The increase from year-end 2019 included $465.6 million of PPP loans internally-classified as Special Mention and Substandard totaled $72.0 millionoriginated in the second quarter of 2020. Since the PPP loans are guaranteed by the SBA, there are no reserves allocated to these loans. Credit quality metrics at December 31, 2018, up from $66.7 million2020, were mixed compared to year-end 2019. Nonperforming assets represented 0.60% of total assets at year-end 2017. Loans classified as Substandard increased by $23.4 million over December 31, 2017, while loans classified as Special Mention were down by $16.3 million. Nonaccrual originated loans were $19.3 million as of2020, compared to 0.47% at December 31, 2018, up $3.1 million from year-end 2017. Net charge-offs of originated loans were $262,000 or 0.1% of average originated loans in 2018 compared to net charge-offs of $140,000 or 0.0% of average originated loans in 2017.
Table 6 - Analysis of the Allowance for Originated and Acquired Loan and LeaseCredit Losses
| December 31, | ||||||||||||||||||||||||||||||||||||||||||||||||
| (In thousands) | (In thousands) | 2020 | 2019 | 2018 | 2017 | 2016 | ||||||||||||||||||||||||||||||||||||||||||
| Average loans outstanding during year | Average loans outstanding during year | $ | 5,228,135 | $ | 4,830,089 | $ | 4,757,583 | $ | 4,401,205 | $ | 3,957,221 | |||||||||||||||||||||||||||||||||||||
| Balance of allowance at beginning of year | Balance of allowance at beginning of year | 39,892 | 43,410 | 39,771 | 35,755 | 32,004 | ||||||||||||||||||||||||||||||||||||||||||
| Impact of adopting ASU 2016-13 | Impact of adopting ASU 2016-13 | (2,534) | 0 | 0 | 0 | 0 | ||||||||||||||||||||||||||||||||||||||||||
| December 31, | ||||||||||||||||||||||||||||||||||||||||||||||||
| (in thousands) | 2018 | 2017 | 2016 | 2015 | 2014 | |||||||||||||||||||||||||||||||||||||||||||
| Average originated loans outstanding during year | $ | 4,472,682 | $ | 4,051,298 | $ | 3,525,649 | $ | 3,023,456 | $ | 2,624,282 | ||||||||||||||||||||||||||||||||||||||
| Balance of allowance at beginning of year | 39,686 | 35,598 | 31,312 | 28,156 | 26,700 | |||||||||||||||||||||||||||||||||||||||||||
| Originated loans charged-off: | ||||||||||||||||||||||||||||||||||||||||||||||||
| Loans charged-off: | Loans charged-off: | |||||||||||||||||||||||||||||||||||||||||||||||
| Commercial and industrial | 293 | 291 | 878 | 221 | 470 | Commercial and industrial | $ | 2 | $ | 696 | $ | 334 | $ | 365 | $ | 1,576 | ||||||||||||||||||||||||||||||||
| Commercial real estate | 60 | 21 | 12 | 363 | 639 | Commercial real estate | 1,903 | 4,015 | 142 | 180 | 193 | |||||||||||||||||||||||||||||||||||||
| Residential real estate | 424 | 584 | 263 | 338 | 512 | Residential real estate | 84 | 256 | 614 | 1,067 | 298 | |||||||||||||||||||||||||||||||||||||
| Consumer and other | 1,350 | 960 | 521 | 1,074 | 1,308 | Consumer and other | 482 | 823 | 1,350 | 962 | 642 | |||||||||||||||||||||||||||||||||||||
| Leases | 0 | 0 | 0 | 0 | 0 | Leases | 0 | 0 | 0 | 0 | 0 | |||||||||||||||||||||||||||||||||||||
| Total loans charged-off | $ | 2,127 | $ | 1,856 | $ | 1,674 | $ | 1,996 | $ | 2,929 | Total loans charged-off | 2,471 | 5,790 | 2,440 | 2,574 | 2,709 | ||||||||||||||||||||||||||||||||
| Recoveries of originated loans previously charged-off: | ||||||||||||||||||||||||||||||||||||||||||||||||
| Recoveries of loans previously charged-off: | Recoveries of loans previously charged-off: | |||||||||||||||||||||||||||||||||||||||||||||||
| Commercial and industrial | 50 | 119 | 576 | 809 | 636 | Commercial and industrial | 131 | 103 | 156 | 143 | 596 | |||||||||||||||||||||||||||||||||||||
| Commercial real estate | 812 | 980 | 859 | 1,277 | 1,832 | Commercial real estate | 58 | 174 | 843 | 1,617 | 1,127 | |||||||||||||||||||||||||||||||||||||
| Residential real estate | 324 | 212 | 63 | 112 | 88 | Residential real estate | 194 | 334 | 459 | 256 | 63 | |||||||||||||||||||||||||||||||||||||
| Consumer and other | 679 | 405 | 325 | 487 | 536 | Consumer and other | 248 | 295 | 679 | 413 | 353 | |||||||||||||||||||||||||||||||||||||
| Total loan recoveries | $ | 1,865 | $ | 1,716 | $ | 1,823 | $ | 2,685 | $ | 3,092 | Total loan recoveries | 631 | 906 | 2,137 | 2,429 | 2,139 | ||||||||||||||||||||||||||||||||
| Net loan charge-offs and (recoveries) | 262 | 140 | (149 | ) | (689 | ) | (163 | ) | Net loan charge-offs and (recoveries) | 1,840 | 4,884 | 303 | 145 | 570 | ||||||||||||||||||||||||||||||||||
| Additions to allowance charged to operations | 3,897 | 4,228 | 4,137 | 2,467 | 1,293 | Additions to allowance charged to operations | 16,151 | 1,366 | 3,942 | 4,161 | 4,321 | |||||||||||||||||||||||||||||||||||||
| Balance of originated allowance at end of year | $ | 43,321 | $ | 39,686 | $ | 35,598 | $ | 31,312 | $ | 28,156 | ||||||||||||||||||||||||||||||||||||||
| Originated allowance as a percentage of originated loans and leases outstanding | 0.95 | % | 0.91 | % | 0.92 | % | 0.95 | % | 0.99 | % | ||||||||||||||||||||||||||||||||||||||
| Net (recoveries) charge-offs as a percentage of average originated loans and leases outstanding during the year | 0.01 | % | 0.00 | % | 0.00 | % | (0.02 | )% | (0.01 | )% | ||||||||||||||||||||||||||||||||||||||
| Balance of allowance at end of year | Balance of allowance at end of year | $ | 51,669 | $ | 39,892 | $ | 43,410 | $ | 39,771 | $ | 35,755 | |||||||||||||||||||||||||||||||||||||
| Allowance as a percentage of total loans and leases outstanding | Allowance as a percentage of total loans and leases outstanding | 0.98 | % | 0.81 | % | 0.90 | % | 0.85 | % | 0.84 | % | |||||||||||||||||||||||||||||||||||||
| Net charge-offs (recoveries) as a percentage of average loans and leases outstanding during the year | Net charge-offs (recoveries) as a percentage of average loans and leases outstanding during the year | 0.04 | % | 0.10 | % | 0.01 | % | 0.00 | % | 0.01 | % | |||||||||||||||||||||||||||||||||||||
| December 31, | |||||||||||||||||||
| (in thousands) | 2018 | 2017 | 2016 | 2015 | 2014 | ||||||||||||||
| Average acquired loans outstanding during year | $ | 284,901 | $ | 349,915 | $ | 431,572 | $ | 508,490 | $ | 614,740 | |||||||||
| Balance of allowance at beginning of year | 85 | 157 | 692 | 841 | 1,270 | ||||||||||||||
| Acquired loans charged-off: | |||||||||||||||||||
| Commercial and industrial | 41 | 74 | 698 | 77 | 293 | ||||||||||||||
| Commercial real estate | 82 | 159 | 181 | 400 | 631 | ||||||||||||||
| Residential real estate | 190 | 483 | 35 | 302 | 484 | ||||||||||||||
| Consumer and other | 0 | 2 | 121 | 6 | 51 | ||||||||||||||
| Total loans charged-off | $ | 313 | $ | 718 | $ | 1,035 | $ | 785 | $ | 1,459 | |||||||||
| Recoveries of acquired loans previously charged-off: | |||||||||||||||||||
| Commercial and industrial | 106 | 24 | 20 | 7 | 0 | ||||||||||||||
| Commercial real estate | 31 | 637 | 268 | 142 | 0 | ||||||||||||||
| Residential real estate | 135 | 44 | 0 | 9 | 0 | ||||||||||||||
| Consumer and other | 0 | 8 | 28 | 0 | 17 | ||||||||||||||
| Total loan recoveries | $ | 272 | $ | 713 | $ | 316 | $ | 158 | $ | 17 | |||||||||
| Net loans charged-off | 41 | 5 | 719 | 627 | 1,442 | ||||||||||||||
| Additions (reductions) to allowance charged to operations | 45 | (67 | ) | 184 | 478 | 1,013 | |||||||||||||
| Balance of acquired allowance at end of year | $ | 89 | $ | 85 | $ | 157 | $ | 692 | $ | 841 | |||||||||
| Acquired allowance as a percentage of acquired loans outstanding | 0.03 | % | 0.02 | % | 0.04 | % | 0.14 | % | 0.14 | % | |||||||||
| Net charge-offs as a percentage of average acquired loans and leases outstanding during the year | 0.01 | % | 0.00 | % | 0.17 | % | 0.12 | % | 0.23 | % | |||||||||
| Total net charge-offs as a percentage of average total loans and leases outstanding during the year | 0.01 | % | 0.00 | % | 0.00 | % | 0.00 | % | 0.04 | % | |||||||||
54
historical loss rates in all loan portfolios except for commercial real estate at year-end 2019 compared to year-end 2018, and lower specific reserves for impaired loans contributed to the originated portfoliolower allowance level at December 31, 2019 compared to December 31, 2018 and a decrease in provision expense for the acquired portfolio over the period from 2014in 2019 compared to 2018. As mentioned above, the $16.2 million provision expense in 2020 was driven by changes in economic conditions and forecasts related to the impact of COVID-19, including forecasts of significantly slower economic growth and higher unemployment. The majority of the increase in the allowance and provision expense for the originated portfolio largely reflects the growthin 2020 was in the originated portfolio over that period. Asset quality has been generally favorable over the period. The provision expense for originated loans over the past five years benefited from significant recoveries on two commercial/commercial real estate relationships that resulted in net loan recoveries on originated loans in 2016, 2015, and 2014 and smaller net charge-offs in 2018 and 2017. Provision expense for the acquired portfolio showed an increase from 2017, but showed decreases from 2014 through 2017. Asset quality trends for the acquired portfolio continue to show improvement as evidenced by low net charge-offs and lower Special Mention and Substandard loans.first quarter of 2020.
The ratio of the allowance for originated loan and leasecredit losses as a percentage of total originated loans was 0.95%0.98% at year-end 20182020 compared to 0.91%0.81% at year-end 2017.2019. The allowance coverage to nonperforming loans and leases was 163.25%112.87% at December 31, 20182020 compared to 172.84%126.90% at December 31, 2017.2019. Management believes that, based upon its evaluation as of December 31, 2018,2020, the allowance is appropriate.
Deposits and Other Liabilities
Total deposits were $4.9$6.4 billion at December 31, 2018, an increase of $51.2 million2020, up $1.2 billion or 1.1%23.5% compared to year-end 2017.2019. The increase from year-end 20172019 consisted of savings and money market balances, (up $201.6 million), which is partially offset by noninterest bearing deposits, (down $39.5 million) and time deposits (down $111.0 million).up $681.2 million, $472.4 million, and $71.2 million, respectively. Deposit balances during 2020 benefited from the $465.6 million of PPP loan originations during the second quarter of 2020, the majority of which were deposited in Tompkins checking accounts. The growth also included short-term brokered deposits. In April 2020, the Company obtained $295.0 million of short-term brokered deposits and actively increased liquid assets to further strengthen the Company's liquidity position in response to the economic uncertainty related to the COVID-19 pandemic. Of the $295.0 million of brokered deposits, $95.0 million matured and were paid in the fourth quarter of 2020; the remaining $200.0 million mature in April 2021.
The most significant source of funding for the Company is core deposits. The Company defines core deposits as total deposits less time deposits of $250,000 or more, brokered deposits, and municipal money market deposits.deposits and reciprocal deposit relationships with municipalities. Core deposits increased by $113.4$863.8 million or 2.8%20.1% to $4.1$5.2 billion at year-end 20182020 from $4.0$4.3 billion at year-end 2017.2019. Core deposits represented 84.0%80.1% of total deposits at December 31, 2018,2020, compared to 82.6%82.3% of total deposits at December 31, 2017.2019.
Municipal money market accounts and reciprocal deposit relationships with municipalities totaled $577.6$685.6 million at year-end 2018,2020, which was an increase of 5.8%increased 11.3% over year-end 2017.2019. In general, there is a seasonal pattern to municipal deposits starting with a low point during July and August. Account balances tend to increase throughout the fall and into the winter months from tax deposits and receive an additional inflow at the end of March from the electronic deposit of state funds.
Table 1-Average Statements of Condition and Net Interest Analysis, shows the average balance and average rate paid on the Company’s primary deposit categories for the years ended December 31, 2018, 2017,2020, 2019, and 2016.2018. Average interest-bearing deposits were flat for 2018in 2020 increased $671.0 million or 18.2% when compared to 2017.2019. The average cost of interest-bearing deposits was 0.48%0.46% for 20182020 and 0.35%0.84% for 2017.2019. Average noninterest bearing deposits at December 31, 2018for 2020 were up $103.5$349.9 million or 8.1%24.9% over year-end 2017.2019. A maturity schedule of time deposits outstanding at December 31, 20182020 is included in “Note 7 Deposits” in Notes to Consolidated Financial Statements in Part II, Item 8. of this Report.
The Company uses both retail and wholesale repurchase agreements. Retail repurchase agreements are arrangements with local customers of the Company, in which the Company agrees to sell securities to the customer with an agreement to repurchase those securities at a specified later date. Retail repurchase agreements totaled $81.8$65.8 million at December 31, 2018,2020, and $75.2$60.3 million at December 31, 2017.2019. Management generally views local repurchase agreements as an alternative to large time deposits. Refer to “Note 8 Federal Funds Purchased and Securities Sold Under Agreements to Repurchase” in Notes to Consolidated Financial Statements in Part II, Item 8. of this Report for further details on the Company’s repurchase agreements.
The Company’s other borrowings totaled $1.1 billion$265.0 million at year-end 2018,2020, which was $393.1 million below prior year end. The decrease in line with prior year.borrowings was due to core deposit growth, municipal deposit growth, and an increase in brokered deposits from year-end 2019. The increase was to support loan growth in excess of deposit growth. The $1.1 billion$265.0 million in borrowings at December 31, 2018,2020, represented term advances from the FHLB. Borrowings of $658.1 million at year-end 2019 included $647.1$239.1 million in overnight advances from the FHLB, $425.0$415.0 million inof FHLB term advances, from the FHLB and a $4.0 million advance from a third party bank. Borrowings at year-end 2017 included $587.7 million in overnight advances from the FHLB, $475.0 million of FHLB term advances, and a $9.0 million advance from a bank. Of the $425.0$265.0 million of thein FHLB term advances at year-end 2018, $150.02020, $235.0 million are due in over one year. Refer to “Note 9 - Other Borrowings” in Notes to Consolidated Financial Statements in Part II, Item 8. of this Report for further details on the Company’s term borrowings with the FHLB.
Liquidity Management
As of December 31, 2020, the Company had not experienced any significant impact on our liquidity or funding capabilities as a result of the COVID-19 pandemic. As previously noted, the Company participated in the SBA's PPP. The Company began accepting applications for PPP loans on April 3, 2020, and funded 2,998 PPP loans during the second quarter of 2020. Outstanding PPP loans totaled $291.3 million as of December 31, 2020. The majority of the PPP loan proceeds were deposited into accounts at Tompkins, which contributed to the deposit growth in the second quarter of 2020. In April 2020, the Company obtained $295.0 million of short-term brokered deposits and actively increased liquid assets to further strengthen the Company's position with the goal of guarding against economic uncertainty related to the COVID-19 pandemic. The Company has a long-standing liquidity plan in place that is designed to ensure that appropriate liquidity resources are available to fund the balance sheet. Additionally, given the uncertainties related to the impact of the COVID-19 crisis on liquidity, the Company has confirmed the availability of funds at the FHLB of NY and FHLB of Pittsburgh, completed actions required to activate participation in the Federal Reserve Bank PPP lending facility, and confirmed availability of Federal Fund lines with correspondent bank partners.
The objective of liquidity management is to ensure the availability of adequate funding sources to satisfy the demand for credit, deposit withdrawals, operating expenses, and business investment opportunities. The Company’s large, stable core deposit base and strong capital position are the foundation for the Company’s liquidity position. The Company uses a variety of resources to meet its liquidity needs, which include deposits, cash and cash equivalents, short-term investments, cash flow from lending and investing activities, repurchase agreements, and borrowings. The Company may also use borrowings as part of a growth strategy. Asset and liability positions are monitored primarily through the Asset/Liability Management Committee of the Company’s subsidiary banks. This Committee reviews periodic reports on the liquidity and interest rate sensitivity positions. Comparisons with industry and peer groups are also monitored. The Company’s strong reputation in the communities it serves, along with its strong financial condition, provides access to numerous sources of liquidity as described below. Management believes these diverse liquidity sources provide sufficient means to meet all demands on the Company’s liquidity that are reasonably likely to occur.
Core deposits, discussed above under “Deposits and Other Liabilities”, are a primary and low cost funding source obtained primarily through the Company’s branch network. In addition to core deposits, the Company uses non-core funding sources to support asset growth. These non-core funding sources include time deposits of $250,000 or more, brokered time deposits, national deposit listing services, municipal money market deposits, reciprocal deposits, bank borrowings, securities sold under agreements to repurchase, overnight borrowings and term advances from the FHLB and other funding sources. Rates and terms are the primary determinants of the mix of these funding sources.
Non-core funding sources totaled $1.9$1.6 billion at December 31, 2018,2020, a decrease of $51.3$26.6 million or 2.6%1.6% from $2.0$1.6 billion at December 31, 2017.2019. The decrease reflects the pay down of FHLB borrowings, partially offset by the increase in brokered deposits mentioned above under "Deposits and Other Liabilities". Non-core funding sources decreased year-over-year as the Company experienced sufficient growth in core deposits to fund earning asset growth. Non-core funding sources as a percentage of total liabilities decreased from 32.8%27.1% at year-end 20172019 to 31.6%23.4% at year-end 2018.2020.
Non-core funding sources may require securities to be pledged against the underlying liability. Securities carried at $1.2 billion at December 31, 20182020 and $1.3 billion at December 31, 2017,2019, were either pledged or sold under agreements to repurchase. Pledged securities or securities sold under agreements to repurchase represented 77.8%75.3% of total securities at December 31, 2018,2020, compared to 84.3%89.7% of total securities at December 31, 2017.2019.
Cash and cash equivalents totaled $80.4$388.5 million as of December 31, 2018, down2020, up from $84.3$138.0 million at December 31, 2017.2019. Short-term investments, consisting of securities due in one year or less, increaseddecreased from $57.9$108.1 million at December 31, 2017,2019, to $86.8$55.0 million at December 31, 2018.2020.
Cash flow from the loan and investment portfolios provides a significant source of liquidity. These assets may have stated maturities in excess of one year, but they have monthly principal reductions. Total mortgage-backed securities, at fair value, were $758.9$887.6 million at December 31, 20182020 compared with $794.0$824.0 million at December 31, 2017.2019. Outstanding principal balances of residential mortgage loans, consumer loans, and leases totaled approximately $1.4$1.5 billion at December 31, 2018 as2020 compared to $1.4$1.5 billion at December 31, 2017.2019. Aggregate amortization from monthly payments on these assets provides significant additional cash flow to the Company.
Liquidity is enhanced by ready access to national and regional wholesale funding sources including Federal funds purchased, repurchase agreements, brokered certificates of deposit, and FHLB advances. Through its subsidiary banks, the Company has
56
borrowing relationships with the FHLB and correspondent banks, which provide secured and unsecured borrowing capacity. At December 31, 2018,2020, the unused borrowing capacity on established lines with the FHLB was $1.0$2.1 billion.
As members of the FHLB, the Company’s subsidiary banks can use certain unencumbered mortgage-related assets and securities to secure additional borrowings from the FHLB. At December 31, 2018,2020, total unencumbered mortgage loans and securities of the Company were $554.3 million.$1.6 billion. Additional assets may also qualify as collateral for FHLB advances upon approval of the FHLB.
The Company has not identified any trends or circumstances that are reasonably likely to result in material increases or decreases in liquidity in the near term.
Table 7 - Loan Maturity
| Remaining maturity of originated loans | December 31, 2018 | |||||||||||||||||||||||||||||||||||||
| (in thousands) | Total | Less than 1 year | After 1 year to 5 years | After 5 years | ||||||||||||||||||||||||||||||||||
| Remaining maturity of loans | Remaining maturity of loans | December 31, 2020 | ||||||||||||||||||||||||||||||||||||
| (In thousands) | (In thousands) | Total | Less than 1 year | After 1 year to 5 years | After 5 years | |||||||||||||||||||||||||||||||||
| Commercial and industrial | $ | 1,033,923 | $ | 258,420 | $ | 301,245 | $ | 474,258 | Commercial and industrial | $ | 1,178,728 | $ | 213,472 | $ | 597,066 | $ | 368,190 | |||||||||||||||||||||
| Commercial real estate | 2,161,569 | 107,468 | 254,418 | 1,799,683 | Commercial real estate | 2,569,192 | 98,844 | 342,075 | 2,128,273 | |||||||||||||||||||||||||||||
| Residential real estate | 1,292,261 | 255 | 14,982 | 1,277,024 | Residential real estate | 1,435,987 | 855 | 20,897 | 1,414,235 | |||||||||||||||||||||||||||||
| Total | $ | 4,487,753 | $ | 366,143 | $ | 570,645 | $ | 3,550,965 | Total | $ | 5,183,907 | $ | 313,171 | $ | 960,038 | $ | 3,910,698 | |||||||||||||||||||||
| Remaining maturity of acquired loans | December 31, 2018 | ||||||||||||||
| (in thousands) | Total | Less than 1 year | After 1 year to 5 years | After 5 years | |||||||||||
| Commercial and industrial | $ | 43,712 | $ | 9,392 | $ | 15,538 | $ | 18,782 | |||||||
| Commercial real estate | 179,092 | 13,309 | 84,977 | 80,806 | |||||||||||
| Residential real estate | 41,633 | 139 | 3,880 | 37,614 | |||||||||||
| Total | $ | 264,437 | $ | 22,840 | $ | 104,395 | $ | 137,202 | |||||||
Of the loan amounts shown above in Table 7 - Loan Maturity, maturing over 1 year, $1.9$2.3 billion have fixed rates and $2.4$2.5 billion have adjustable rates.
In the normal course of business, the Company is party to certain financial instruments, which in accordance with accounting principles generally accepted in the United States, are not included in its Consolidated Statements of Condition. These transactions include commitments under standby letters of credit, unused portions of lines of credit, and commitments to fund new loans and are undertaken to accommodate the financing needs of the Company’s customers. Loan commitments are agreements by the Company to lend monies at a future date. These loan and letter of credit commitments are subject to the same credit policies and reviews as the Company’s loans. Because most of these loan commitments expire within one year from the date of issue, the total amount of these loan commitments as of December 31, 2018,2020, are not necessarily indicative of future cash requirements. Further information on these commitments and contingent liabilities is provided in “Note 17 Commitments and Contingent Liabilities” in Notes to Consolidated Financial Statements in Part II, Item 8. of this Report.
The Company leases land, buildings, and equipment under operating lease arrangements extending to the year 2090. Most leases include options to renew for periods ranging from 5 to 20 years. In addition, the Company has a software contract for its core banking application through June 30, 2024 along with contracts for more specialized software programs through 2020.2021. Further information on the Company’s lease arrangements is provided in “Note 6 Premises and Equipment” in Notes to Consolidated Financial Statements in Part II, Item 8. of this Report. The Company’s contractual obligations as of December 31, 2018,2020, are shown in Table 8-Contractual Obligations and Commitments below.
57
Table 8 - Contractual Obligations and Commitments
| Contractual cash obligations | At December 31, 2020 Payments due within | ||||||||||||||||||||||||||||
| (In thousands) | Total | 1 year | 1-3 years | 3-5 years | After 5 years | ||||||||||||||||||||||||
| Long-term debt | $ | 276,330 | $ | 35,175 | $ | 170,658 | $ | 70,497 | $ | 0 | |||||||||||||||||||
Trust Preferred Debentures1 | 21,662 | 540 | 1,079 | 1,079 | 18,964 | ||||||||||||||||||||||||
Operating leases 2 | 43,446 | 4,528 | 8,196 | 7,120 | 23,602 | ||||||||||||||||||||||||
| Software contracts | 5,420 | 1,764 | 2,835 | 821 | 0 | ||||||||||||||||||||||||
| Total contractual cash obligations | $ | 346,858 | $ | 42,007 | $ | 182,768 | $ | 79,517 | $ | 42,566 | |||||||||||||||||||
| Contractual cash obligations | At December 31, 2018 Payments due within | ||||||||||||||||||
| (in thousands) | Total | 1 year | 1-3 years | 3-5 years | After 5 years | ||||||||||||||
| Long-term debt | $ | 437,366 | $ | 285,442 | $ | 151,924 | $ | 0 | $ | 0 | |||||||||
Trust Preferred Debentures1 | 35,518 | 1,149 | 2,298 | 2,298 | 29,773 | ||||||||||||||
| Operating leases | 32,267 | 4,790 | 7,640 | 6,815 | 13,022 | ||||||||||||||
| Software contracts | 8,984 | 2,168 | 3,383 | 2,727 | 706 | ||||||||||||||
| Total contractual cash obligations | $ | 514,135 | $ | 293,549 | $ | 165,245 | $ | 11,840 | $ | 43,501 | |||||||||
1 Dollar amounts include interest payments and contractual payments due until maturity without conversion to stock or early redemption for the remainder of the Company's Trust Preferred Debentures.
2 Operating leases include renewals the Company considers reasonably certain to exercise.
Non-GAAP Disclosure
The following table summarizes the Company’s results of operations on a GAAP basis and on an operating (non-GAAP) basis for the periods indicated. The non-GAAP financial measures adjust GAAP measures to “Noteexclude the effects of non-operating items, such as acquisition related intangible amortization expense, and significant nonrecurring income or expense on earnings, equity, and capital. The Company believes the non-GAAP measures provide meaningful comparisons of our underlying operational performance and facilitate management's and investors' assessments of business and performance trends in comparison to others in the financial services industry. These non-GAAP financial measures should not be considered in isolation or as a measure of the Company's profitability or liquidity; they are in addition to, and are not a substitute for, financial measures under GAAP. The non-GAAP financial measures presented herein may be different from non-GAAP financial measures used by other companies, and may not be comparable to similarly titled measures reported by other companies. In the future, the Company may utilize other measures to illustrate performance. Non-GAAP financial measures have limitations since they do not reflect all of the amounts associated with the Company's results of operations as determined in accordance with GAAP.
58
| Reconciliation of Net Income Available to Common Shareholders/Diluted Earnings Per Share (GAAP) to Net Operating Income Available to Common Shareholders/Adjusted Diluted Earnings Per Share (Non-GAAP) and Adjusted Operating Return on Average Tangible Common Equity (Non-GAAP) | |||||||||||||||||
| For the year ended December 31, | |||||||||||||||||
| (In thousands, except per share data) | 2020 | 2019 | 2018 | 2017 | 2016 | ||||||||||||
| Net income available to common shareholders | $ | 77,588 | $ | 81,718 | $ | 82,308 | $ | 52,494 | $ | 59,340 | |||||||
| Less: income attributable to unvested stock-based compensations awards | (857) | (1,306) | (1,315) | (818) | (912) | ||||||||||||
| Net earnings allocated to common shareholders (GAAP) | 76,731 | 80,412 | 80,993 | 51,676 | 58,428 | ||||||||||||
| Diluted earnings per share (GAAP) | 5.20 | 5.37 | 5.35 | 3.43 | 3.91 | ||||||||||||
| Adjustments for non-operating income and expense: | |||||||||||||||||
| Gain on sale of real estate | 0 | 0 | (2,950) | 0 | 0 | ||||||||||||
| Write-down of impaired leases | 0 | 0 | 2,536 | 0 | 0 | ||||||||||||
| Remeasurement of deferred taxes | 0 | 0 | 0 | 14,944 | 0 | ||||||||||||
| Write-down of real estate pending sale | 673 | 0 | 0 | 0 | 0 | ||||||||||||
| Total adjustments | 673 | 0 | (414) | 14,944 | 0 | ||||||||||||
| Tax (benefit) expense | (165) | 0 | 102 | 0 | 0 | ||||||||||||
| Total adjustments, net of tax | 508 | 0 | (312) | 14,944 | 0 | ||||||||||||
| Net operating income available to common shareholders (Non-GAAP) | 77,239 | 80,412 | 80,681 | 66,620 | 58,428 | ||||||||||||
| Weighted average shares outstanding (diluted) | 14,751,303 | 14,973,951 | 15,132,257 | 15,073,255 | 14,936,231 | ||||||||||||
| Adjusted diluted earnings per share (Non-GAAP) | 5.24 | 5.37 | 5.33 | 4.42 | 3.91 | ||||||||||||
| Net earnings allocated to common shareholders (GAAP) | 76,731 | 80,412 | 80,681 | 66,620 | 58,428 | ||||||||||||
| Average Tompkins Financial Corporation shareholders' equity (GAAP) | 699,554 | 649,871 | 589,475 | 575,958 | 545,545 | ||||||||||||
| Amortization of intangibles | 1,484 | 1,673 | 1,771 | 1,932 | 2,090 | ||||||||||||
| Tax expense | 364 | 410 | 434 | 773 | 836 | ||||||||||||
| Amortization of intangibles, net of tax | 1,120 | 1,263 | 1,337 | 1,159 | 1,254 | ||||||||||||
| Adjusted net operating income available to common shareholders' (Non-GAAP) | 77,851 | 81,675 | 82,018 | 67,779 | 59,682 | ||||||||||||
| Average Tompkins Financial Corporation shareholders' common equity | 698,088 | 649,871 | 589,475 | 575,958 | 545,545 | ||||||||||||
| Average goodwill and intangibles | 97,134 | 98,104 | 99,999 | 101,583 | 104,263 | ||||||||||||
| Average Tompkins Financial Corporation shareholders' tangible common equity (Non-GAAP) | $ | 600,954 | $ | 551,767 | $ | 489,476 | $ | 474,375 | $ | 441,282 | |||||||
| Adjusted operating return on average shareholders' tangible common equity (Non-GAAP) | 12.95 | % | 14.80 | % | 16.76 | % | 14.29 | % | 13.52 | % | |||||||
Newly Adopted Accounting Standards
ASU No. 2016-13, “Financial Instruments - Credit Losses (Topic 326): Measurement of Credit Losses on Financial Instruments.” ASU 2016-13 requires the measurement of all expected credit losses for financial assets held at the reporting date based on historical experience, current conditions, and reasonable and supportable forecasts and requires enhanced disclosures related to the significant estimates and judgments used in estimating credit losses, as well as the credit quality and underwriting standards of an organization’s portfolio. In addition, ASU 2016-13 amends the accounting for credit losses on available-for-sale debt securities and purchased financial assets with credit deterioration. ASU 2016-13 was effective for the Company on January 1, Summary2020. Upon adoption, a cumulative effect adjustment for the change in the allowance for credit losses was recognized in
59
retained earnings. The cumulative-effect adjustment to Consolidated Financial Statements in Part II, Item 8.retained earnings, net of this Form 10-K for detailstaxes, is comprised of recently issued accounting pronouncements and their expectedthe impact on the Company’sallowance for credit losses on outstanding loans and leases and the impact on the liability for off-balance sheet commitments. The Company adopted ASU 2016-13 on January 1, 2020 using the modified retrospective approach. Results for the periods beginning after January 1, 2020 are presented under Accounting Standards Codification (“ASC”) 326, while prior period amounts continue to be reported in accordance with previously applicable US GAAP. The Company recorded a net increase to retained earnings of $1.7 million, upon adoption. The transition adjustment includes a decrease in the allowance for credit losses on loans of $2.5 million, and an increase in the allowance for credit losses on off-balance sheet credit exposures of $0.4 million, net of the corresponding decrease in deferred tax assets of $0.4 million.
The Company adopted ASU 2016-13 using the prospective transition approach for financial statements.assets purchased with credit deterioration (“PCD”) that were previously classified as purchased credit impaired (“PCI”) and accounted for under ASC 310-30. In accordance with the standard, the Company did not reassess whether PCI assets met the criteria of PCD assets as of the date of adoption. The remaining discount on the PCD assets was determined to be related to noncredit factors and will be accreted into interest income on a level-yield method over the life of the loans.
ASU 2017-04, “Intangibles - Goodwill and Other (Topic 350) - Simplifying the Test for Goodwill Impairment.” ASU 2017-04 eliminates Step 2 from the goodwill impairment test which required entities to compute the implied fair value of goodwill. Under ASU 2017-04, an entity should perform its annual, or interim, goodwill impairment test by comparing the fair value of a reporting unit with its carrying amount. An entity should recognize an impairment charge for the amount by which the carrying amount exceeds the reporting unit’s fair value; however, the loss recognized should not exceed the total amount of goodwill allocated to that reporting unit. ASU 2017-04 was effective for the Company on January 1, 2020 and did not have a material impact on our consolidated financial statements.
ASU 2018-13, “Fair Value Measurement (Topic 820) - Disclosure Framework-Changes to the Disclosure Requirements for Fair Value Measurement.” ASU 2018-13 modifies the disclosure requirements on fair value measurements in Topic 820. The amendments in this update remove disclosures that no longer are considered cost beneficial, modify/clarify the specific requirements of certain disclosures, and add disclosure requirements identified as relevant. ASU 2018-13 was effective for the Company on January 1, 2020, and did not have a significant impact on our consolidated financial statements.
ASU 2018-14, “Compensation - Retirement Benefits-Defined Benefit Plans-General (Subtopic 715-20).” ASU 2018-14 amends and modifies the disclosure requirements for employers that sponsor defined benefit pension or other post-retirement plans. The amendments in this update remove disclosures that no longer are considered cost beneficial, clarify the specific requirements of disclosures, and add disclosure requirements identified as relevant. ASU 2018-14 became effective for us on December 31, 2020, and did not have a significant impact on our consolidated financial statements. The Company updated its disclosures at December 31, 2020, to comply with the amended guidance.
ASU 2018-15, “Intangibles - Goodwill and Other - Internal-Use Software (Subtopic 350-40) - Customer’s Accounting for Implementation Costs Incurred in a Cloud Computing Arrangement That Is a Service Contract.” ASU 2018-15 clarifies certain aspects of ASU 2015-05, “Customer’s Accounting for Fees Paid in a Cloud Computing Arrangement,” which was issued in April 2015. Specifically, ASU 2018-15 aligns the requirements for capitalizing implementation costs incurred in a hosting arrangement that is a service contract with the requirements for capitalizing implementation costs incurred to develop or obtain internal-use software (and hosting arrangements that include an internal-use software license). ASU 2018-15 does not affect the accounting for the service element of a hosting arrangement that is a service contract. ASU 2018-15 was effective for the Company on January 1, 2020, and did not have a significant impact on our consolidated financial statements.
ASU 2020-03 "Codification Improvements to Financial Instruments." ASU 2020-03 revised a wide variety of topics in the Codification with the intent to make the Codification easier to understand and apply by eliminating inconsistencies and providing clarifications. ASU 2020-03 was effective immediately upon its release in March 2020 and did not have a significant impact on our consolidated financial statements.
Accounting Standards Pending Adoption
ASU No 2019-12, "Income Taxes (Topic 740): Simplifying the Accounting for Income Taxes.” ASU 2019-12 removes certain exceptions to the general principles in Topic 740 in Generally Accepted Accounting Principles. ASU 2019-12 is effective for public entities for fiscal years beginning after December 15, 2020, with early adoption permitted. Tompkins is currently evaluating the potential impact of ASU 2019-12 on our consolidated financial statements.
60
ASU No. 2020-04, "Reference Rate Reform (Topic 848): Facilitation of the Effects of Reference Rate Reform on Financial Reporting." The amendments in this update provide optional guidance for a limited period of time to ease the potential burden in accounting for (or recognizing the effects of) reference rate reform on financial reporting. It provides optional expedients and exceptions for applying generally accepted accounting principles to contracts, hedging relationships, and other transactions affected by reference rate reform if certain criteria are met. The amendments in this update are effective for all entities as of March 12, 2020 through December 31, 2022. Tompkins is currently evaluating the potential impact of ASU 2020-04 on our consolidated financial statements.
Fourth Quarter Summary
Net income for the fourth quarter of 2018 was $18.9 million, up from $2.5 million for the same period in 2017. Diluted earnings per share of $1.23 for the fourth quarter of 2018 were up from $0.16 in the fourth quarter of 2017. Fourth quarter 2017 net income was adversely impacted by the TCJA, which reduced the Federal statutory tax rate from 35% in 2017 to 21% in 2018 and beyond. The change in the tax law created a one-time, non-cash write-down of net deferred tax assets in the amount of $14.9 million in the fourth quarter of 2017 due to the required remeasurement of the net deferred tax assets using the new lower tax rate. Removing the impact of that one-time charge from 2017 fourth quarter earnings would have resulted in diluted earnings per share of $1.15 for the fourth quarter of 2017. For the fourth quarter of 2018, adjusted diluted earnings per share of $1.23 reflected an increase of 7.0% over the $1.15 adjusted diluted earnings per share reported in same quarter last year. Please see the discussion above under “Results of Operations (Comparison of December 31, 2018 and 2017 results) Non-GAAP Disclosure” for an explanation of why management believes this non-GAAP financial measure is useful, and a reconciliation to diluted earnings per share.
Net interest income was $57.8 million for the fourth quarter of 2020, compared to $53.2 million reported for the same period in 2019. The increase reflectsnet interest margin for the fourth quarter of 2020 was 3.12%, down from the 3.44% reported for the quarter ended December 31, 2019, and 3.26% for the third quarter of 2020.
Net interest income benefited from lower funding costs and growth in average earning assets of $204.7 million or 3.3% over the same quarter in 2017.and average deposits. The growth in average earning assets
Average deposits for the fourth quarter of 20182020 increased $78.1 million,$1.3 billion, or 1.6%24.0% compared to the same period in 2017.2019. Included in the growth of average deposits during 2018for the fourth quarter of 2020 was a $39.7$442.4 million or 30.1% increase in average noninterest bearing deposits up 2.9% fromover the fourth quarter of 2017.2019.
Noninterest income was $19.9of $18.8 million for the fourth quarter of 2018,2020 was up $2.5 million or 14.7%4.8% compared to the same period in 2017. Contributing to2019. The increase was mainly in insurance commissions and fees, investment services income and gains on sales of residential real estate loans. Investment services income in the increase in noninterest income was $2.5 millionfourth quarter of 2020 benefited from fees related to the collectionsettlement of a large estate. These increases were partially offset by lower service charges on deposit accounts, mainly due to a decrease in overdraft fees, and nonaccrual interest forresulting from a credit that was charged offdecline in 2010.the volume of overdrafts related to the COVID-19 pandemic.
Noninterest expense was $47.2$46.4 million for the fourth quarter of 2018,2020, up $0.9 million$505,000, or 2.0%1.1%, over the fourth quarter of 2017. Expenses associated with salaries and wages and employee benefits are the largest component of total noninterest expense. For the fourth quarter of 2018, these expenses increased $1.1 million or 4.0% compared to the fourth quarter of 2017. Salaries and wages increased $0.5 million or 2.4% in the fourth quarter of 2018 over the same period in the prior year, mainly as a result of annual merit-based adjustments as well as some wage increases related to tax reform initiatives. Other employee benefits increased $0.6 million or 9.8% over 2017. The increase over prior year in other employee benefit expenses was mainly in health insurance, which was up $0.6 million or 25.6% in the fourth quarter of 2018 over the fourth quarter of 2017. Other expenses for the fourth quarter of 2018 included an increase of $1.5 million in professional fees, primarily related to investments in strengthening the Company’s compliance and information security infrastructure. Other expenses for the fourth quarter of 2017 included a $2.7 million write-off of a historic tax credit investment, which was placed in service in 2017, resulting in the write-off of the investment and recognition of the $3.3 million of tax credits as a reduction of income tax expense.2019.
Income tax expense for the fourth quarter of 20182020 was $4.6$6.1 million compared to $18.5$5.2 million for the fourth quarter of 2017.2019. The decrease is a direct result of the change in the Federal statutory rate from 35% in 2017 to 21% in 2018 as a result of the Tax Cuts and Jobs Act of 2017. In addition, the change in theCompany's effective tax rate also resulted in a $14.9 million non-cash write-down of net deferred tax assets recorded inwas 20.4% for the fourth quarter of 2017, which was partially offset by2020, compared to 19.8% for the $3.3 million historic tax credit recognizedsame period in the fourth quarter of 2017.2019.
Item 7A. Quantitative and Qualitative Disclosures About Market Risk
Market Risk
Interest rate risk is the primary market risk category associated with the Company’s operations. Interest rate risk refers to the volatility of earnings caused by changes in interest rates. The Company manages interest rate risk using income simulation to measure interest rate risk inherent in its on-balance sheet and off-balance sheet financial instruments at a given point in time by showingtime. The simulation models are used to estimate the potential effect of interest rate shifts on net interest income for future periods. Each quarter the Company’s Asset/Liability Management Committee reviews the simulation results to determine whether the exposure of net interest income to changes in interest rates remains within Board-approved levels. The Committee also discusses strategies to manage this exposure and incorporates these strategies into the investment and funding decisions of the
61
Company. The Company does not currently use derivatives, such as interest rate swaps, to manage its interest rate risk exposure, but may consider such instruments in the future.
The Company’s Board of Directors has set a policy that interest rate risk exposure will remain within a range whereby net interest income will not decline by more than 10% in one year as a result of a 100 basis point parallel change in rates. Based upon the simulation analysis performed as of November 30, 2018,2020, a 200 basis point parallel upward change in interest rates over a one-year time frame would result in a one-year decrease in net interest income of approximately 3.7%2.0% from the base case, while a 200100 basis
point parallel decline in interest rates over a one-year period would result in a one-year increasedecrease in net interest income of approximately 0.9%0.7% from the base case. The simulation assumes no balance sheet growth and no management action to address balance sheet mismatches.
The decrease in net interest income in the rising rate scenario is a result of the balance sheet showing a more liability sensitive position over a one year time horizon. As such, in the short-term net interest income is expected to trend slightly below the base assumption, as upward adjustments to rate sensitive deposits and short-term funding outpace increases to asset yields which are concentrated in intermediate to longer-term products. As intermediate and longer-term assets continue to reprice/adjust into higher rate environment and funding costs stabilize, net interest income is expected to trend upwards.
The exposuredown 100 basis point scenario decreases net income slightly in the 200 basis point decline scenario results fromfirst year as a result of the Company’sCompany's assets repricing downward to a greater degree than the rates on the Company’sCompany's interest-bearing liabilities, mainly deposits.deposits and overnight borrowings. Rates on savings and money market accounts have recently experienced slight increases compared withmoved down in the last 3 months, approaching historically low interest rate environment experienced in prior years;levels, allowing for someminimal interest expense relief in the first year of thea declining rate scenario. In addition, the model assumes that prepayments accelerate in the downlower interest rate environment resulting in additional pressure on asset yields as proceeds are reinvested at lower rates.
The most recent simulation of a base case scenario, which assumes interest rates remain unchanged from the date of the simulation, reflects a net interest margin that is stable to higherdeclining slightly over the next 12 to 18 months.
Although the simulation model is useful in identifying potential exposure to interest rate movements, actual results may differ from those modeled as the repricing, maturity, and prepayment characteristics of financial instruments may change to a different degree than modeled. In addition, the model does not reflect actions that management may employ to manage its interest rate risk exposure. The Company’s current liquidity profile, capital position, and growth prospects, offer a level of flexibility for management to take actions that could offset some of the negative effects of unfavorable movements in interest rates. Management believes the current exposure to changes in interest rates is not significant in relation to the earnings and capital strength of the Company.
In addition to the simulation analysis, management uses an interest rate gap measure. Table 9-Interest Rate Risk Analysis below is a Condensed Static Gap Report, which illustrates the anticipated repricing intervals of assets and liabilities as of December 31, 2018.2020. The Company’s one-year interest rate gap was a negative $897.7positive $58.9 million or 13.28%0.77% of total assets at December 31, 2018,2020, compared with a negative $762.6$173.6 million or 11.47%2.58% of total assets at December 31, 2017.2019. The change from year-end 2019 to year-end 2020 is mainly due to deposit growth, which resulted in a decrease in overnight borrowings with the FHLB as well as an increase some shorter term assets, including interest bearing balances. A negativepositive gap position exists when the amount of interest-bearing liabilitiesassets maturing or repricing exceeds the amount of interest-earning assetsliabilities maturing or repricing within a particular time period. This analysis suggests that the Company’s net interest income is more vulnerable toequally at risk in both an increasing and decreasing rate environment than it is to a prolonged declining interest rate environment.over the next 12 months. An interest rate gap measure could be significantly affected by external factors such as a rise or decline in interest rates, loan or securities prepayments, and deposit withdrawals.
Table 9 - Interest Rate Risk Analysis
| Condensed Static Gap - December 31, 2020 | |||||||||||||||||
| (In thousands) | Total | 0-3 months | 3-6 months | 6-12 months | 12 months | ||||||||||||
Interest-earning assets1 | $ | 7,244,820 | $ | 1,715,224 | $ | 589,020 | $ | 861,581 | $ | 3,165,825 | |||||||
| Interest-bearing liabilities | 4,852,232 | 2,219,960 | 508,777 | 378,180 | 3,106,917 | ||||||||||||
| Net gap position | (504,736) | 80,243 | 483,401 | 58,908 | |||||||||||||
| Net gap position as a percentage of total assets | (6.62) | % | 1.05 | % | 6.34 | % | 0.77 | % | |||||||||
| Condensed Static Gap - December 31, 2018 | Repricing Interval | ||||||||||||||||||
| (in thousands) | Total | 0-3 months | 3-6 months | 6-12 months | 12 months | ||||||||||||||
| Interest-earning assets* | $ | 6,393,434 | $ | 1,210,120 | $ | 290,091 | $ | 513,464 | $ | 2,013,675 | |||||||||
| Interest-bearing liabilities | 4,665,265 | 2,408,280 | 168,420 | 334,711 | 2,911,411 | ||||||||||||||
| Net gap position | (1,198,160 | ) | 121,671 | 178,753 | (897,736 | ) | |||||||||||||
| Net gap position as a percentage of total assets | (17.73 | )% | 1.80 | % | 2.64 | % | (13.28 | )% | |||||||||||
62
[This Page Intentionally Left Blank]
63
Item 8. Financial Statements and Supplementary Data
Financial Statements and Supplementary Data consist of the consolidated financial statements and the unaudited quarterly financial data as indexed and presented below and the Unaudited Quarterly Financial Data presented in Part II, Item 8. of this Report.below.
| Index to Financial Statements | Page | ||||
64
Management’s Statement of Responsibility
Management is responsible for the preparation of the consolidated financial statements and related financial information contained in all sections of this annual report, including the determination of amounts that must necessarily be based on judgments and estimates. It is the belief of management that the consolidated financial statements have been prepared in conformity with accounting principlesU.S. generally accepted in the United States of America.accounting principles.
Management establishes and monitors the Company’s system of internal accounting controls to meet its responsibility for reliable financial statements. The system is designed to provide reasonable assurance that assets are safeguarded, and that transactions are executed in accordance with management’s authorization and are properly recorded.
The Audit/Examining Committee of the board of directors, composed solely of outside directors, meets periodically and privately with management, internal auditors, and the independent registered public accounting firm, KPMG LLP, to review matters relating to the quality of financial reporting, internal accounting control, and the nature, extent, and results of audit efforts. The independent registered public accounting firm and internal auditors have unlimited access to the Audit/Examining Committee to discuss all such matters. The consolidated financial statements have been audited by KPMG LLP for the purpose of expressing an opinion on the consolidated financial statements. In addition, KPMG LLP has audited the Company's internal control over financial reporting, as of December 31, 2018.2020.
| /s/ Stephen S. Romaine | /s/ Francis M. Fetsko | Date: | March 1, 2021 | ||||||||||||||
| Chief Executive Officer | Chief Financial Officer | ||||||||||||||||
| Chief Operating Officer | |||||||||||||||||
65
Report of Independent Registered Public Accounting Firm
To the shareholdersShareholders and boardBoard of directorsDirectors
Tompkins Financial Corporation:
Opinion on Internal Control Over Financial Reporting
We have audited Tompkins Financial Corporation and subsidiaries’ (the "Company")Company) internal control over financial reporting as of December 31, 2018,2020, based on criteria established in Internal Control -– Integrated Framework (2013) issued by the Committee of Sponsoring Organizations of the Treadway Commission. In our opinion, the Company maintained, in all material respects, effective internal control over financial reporting as of December 31, 2018,2020, based on criteria established in Internal Control -– Integrated Framework (2013) issued by the Committee of Sponsoring Organizations of the Treadway Commission.
We also have audited, in accordance with the standards of the Public Company Accounting Oversight Board (United States) (PCAOB), the consolidated statements of condition of the Company as of December 31, 20182020 and 2017,2019, the related consolidated statements of income, comprehensive income, cash flows, and changes in shareholders’ equity for each of the years in the three-year period ended December 31, 2018,2020, and the related notes (collectively, the "consolidatedconsolidated financial statements")statements), and our report dated March 1, 20192021 expressed an unqualified opinion on those consolidated financial statements.
Basis for Opinion
The Company’s management is responsible for maintaining effective internal control over financial reporting and for its assessment of the effectiveness of internal control over financial reporting, included in the accompanying Management’s Annual Report on Internal Control overOver Financial Reporting. Our responsibility is to express an opinion on the Company’s internal control over financial reporting based on our audit. We are a public accounting firm registered with the PCAOB and are required to be independent with respect to the Company in accordance with the U.S. federal securities laws and the applicable rules and regulations of the Securities and Exchange Commission and the PCAOB.
We conducted our audit in accordance with the standards of the PCAOB. Those standards require that we plan and perform the audit to obtain reasonable assurance about whether effective internal control over financial reporting was maintained in all material respects. Our audit of internal control over financial reporting included obtaining an understanding of internal control over financial reporting, assessing the risk that a material weakness exists, and testing and evaluating the design and operating effectiveness of internal control based on the assessed risk. Our audit also included performing such other procedures as we considered necessary in the circumstances. We believe that our audit provides a reasonable basis for our opinion.
Definition and Limitations of Internal Control Over Financial Reporting
A company’s internal control over financial reporting is a process designed to provide reasonable assurance regarding the reliability of financial reporting and the preparation of financial statements for external purposes in accordance with generally accepted accounting principles. A company’s internal control over financial reporting includes those policies and procedures that (1) pertain to the maintenance of records that, in reasonable detail, accurately and fairly reflect the transactions and dispositions of the assets of the company; (2) provide reasonable assurance that transactions are recorded as necessary to permit preparation of financial statements in accordance with generally accepted accounting principles, and that receipts and expenditures of the company are being made only in accordance with authorizations of management and directors of the company; and (3) provide reasonable assurance regarding prevention or timely detection of unauthorized acquisition, use, or disposition of the company’s assets that could have a material effect on the financial statements.
Because of its inherent limitations, internal control over financial reporting may not prevent or detect misstatements. Also, projections of any evaluation of effectiveness to future periods are subject to the risk that controls may become inadequate because of changes in conditions, or that the degree of compliance with the policies or procedures may deteriorate.
| /s/ KPMG LLP | |||||
| March 1, | |||||
66
Report of Independent Registered Public Accounting Firm
To the shareholdersShareholders and boardBoard of directorsDirectors
Tompkins Financial Corporation:
Opinion on the ConsolidatedFinancial Statements
We have audited the accompanying consolidated statements of condition of Tompkins Financial Corporation and subsidiaries (the “Company”)Company) as of December 31, 20182020 and 2017,2019, the related consolidated statements of income, comprehensive income, cash flows, and changes in shareholders’ equity for each of the years in the three‑year period ended December 31, 2018,2020, and the related notes (collectively, the “consolidatedconsolidated financial statements”)statements). In our opinion, the consolidated financial statements present fairly, in all material respects, the financial position of the Company as of December 31, 20182020 and 2017,2019, and the results of its operations and its cash flows for each of the years in the three‑year period ended December 31, 2018,2020, in conformity with U.S. generally accepted accounting principles.
We also have audited, in accordance with the standards of the Public Company Accounting Oversight Board (United States) (PCAOB), the Company’s internal control over financial reporting as of December 31, 2018,2020, based on criteria established in Internal Control -– Integrated Framework (2013) issued by the Committee of Sponsoring Organizations of the Treadway Commission, and our report dated March 1, 20192021 expressed an unqualified opinion on the effectiveness of the Company’s internal control over financial reporting.
Change in Accounting Principle
As discussed in Note 1 to the consolidated financial statements, the Company has changed its method of accounting for the recognition and measurement of credit losses as of January 1, 2020 due to the adoption of ASC Topic 326, Financial Instruments – Credit Losses.
Basis for Opinion
These consolidated financial statements are the responsibility of the Company’s management. Our responsibility is to express an opinion on these consolidated financial statements based on our audits. We are a public accounting firm registered with the PCAOB and are required to be independent with respect to the Company in accordance with the U.S. federal securities laws and the applicable rules and regulations of the Securities and Exchange Commission and the PCAOB.
We conducted our audits in accordance with the standards of the PCAOB. Those standards require that we plan and perform the audit to obtain reasonable assurance about whether the consolidated financial statements are free of material misstatement, whether due to error or fraud. Our audits included performing procedures to assess the risks of material misstatement of the consolidated financial statements, whether due to error or fraud, and performing procedures that respond to those risks. Such procedures included examining, on a test basis, evidence regarding the amounts and disclosures in the consolidated financial statements. Our audits also included evaluating the accounting principles used and significant estimates made by management, as well as evaluating the overall presentation of the consolidated financial statements. We believe that our audits provide a reasonable basis for our opinion.
Critical Audit Matter
The critical audit matter communicated below is a matter arising from the current period audit of the consolidated financial statements that was communicated or required to be communicated to the audit committee and that: (1) relate to accounts or disclosures that are material to the consolidated financial statements and (2) involved our especially challenging, subjective, or complex judgments. The communication of a critical audit matter does not alter in any way our opinion on the consolidated financial statements, taken as a whole, and we are not, by communicating the critical audit matter below, providing a separate opinion on the critical audit matter or on the accounts or disclosures to which it relates.
Allowance for Credit Losses – Loans evaluated on a Collective Basis
As discussed in Note 1 to the consolidated financial statements, the Company adopted ASU No. 2016-13, Financial Instruments — Credit Losses (ASC Topic 326), as of January 1, 2020. As discussed in Notes 1 and 4 to the consolidated financial statements, the Company’s allowance for credit losses on loans was $51.7 million as of December 31, 2020, a portion of which related to the allowance for credit losses on loans evaluated on a collective bases (the collective ACL on loans). The collective ACL on loans includes the measure of expected credit losses on a
67
collective basis for those loans that share similar risk characteristics. The methodologies apply historical loss information, adjusted for asset-specific characteristics, economic conditions at the measurement date, and forecasts about future economic conditions expected to exist through the contractual lives of the financial assets that are reasonable and supportable. The Company uses a discounted cash flow methodology (DCF methodology) where the respective cash flows for each segment are developed using the assumptions of probability of default (PD), loss given default (LGD), and exposure at default using estimated prepayment speeds. The DCF methodology is calculated at the loan level and aggregated at the segment level, and expected credit losses are estimated over the effective life of the loans by measuring the difference between the net present value of modeled cash flows and the amortized cost basis. The Company uses models to develop the PD and LGD, which are derived from internal and selected peer groups’ historical default and loss experience, that incorporate probability weighted economic scenarios and macroeconomic assumptions over a reasonable and supportable forecast period. In order to capture the unique risks of the loan segments within the PD and LGD models, the Company measures expected credit losses at the loan level by segment, by pooling loans when the financial assets share similar risk characteristics. After the reasonable and supportable forecast period, the Company reverts back to a historical loss rate over eight quarters on a straight-line basis. A portion of the collective ACL on loans is comprised of adjustments to historical loss information. These adjustments are based on qualitative factors not reflected in the quantitative model but are likely to impact the measurement of estimated credit losses.
We identified the assessment of the collective ACL on loans as a critical audit matter. A high degree of audit effort, including specialized skills and knowledge, and subjective and complex auditor judgment was involved in the assessment of the collective ACL on loans due to significant measurement uncertainty. Specifically, the assessment encompassed the evaluation of the collective ACL on loans methodology, including the methods and models used to estimate the PD, LGD and their significant assumptions, including portfolio segmentation, estimated prepayment speeds, the economic forecast scenarios and scenario weightings, macroeconomic assumptions, the reasonable and supportable forecast period, the composition of the peer group data, and the historical observation period. The assessment also included the evaluation of the qualitative factors and their significant assumptions, including the effects of limitations inherent in the quantitative model and an evaluation of the conceptual soundness and performance of the PD and LGD models. In addition, auditor judgment was required to evaluate the sufficiency of audit evidence obtained.
The following are the primary procedures we performed to address this critical audit matter. We evaluated the design and tested the operating effectiveness of certain internal controls related to the measurement of the collective ACL on loans, including controls over the:
–development of the collective ACL on loans methodology
–development of the PD and LGD models
–performance monitoring of the PD and LGD models
–identification and determination and measurement of the significant assumptions used in the PD and LGD models, including prepayment assumptions
–development of the qualitative adjustments, including the significant assumptions
–analysis of the collective ACL on loans results, trends, and ratios.
We evaluated the Company’s process to develop the collective ACL on loans estimate by testing certain sources of data, factors, and assumptions that the Company used, and considered the relevance and reliability of such data, factors, and assumptions. In addition, we involved credit risk professionals with specialized skills and knowledge, who assisted in:
–evaluating the Company’s collective ACL on loans methodology for compliance with U.S. generally accepted accounting principles
–evaluating judgments made by the Company relative to the development and performance testing of the PD and LGD models, and other significant assumptions such as prepayment speeds by comparing them to relevant Company-specific metrics and trends and the applicable industry and regulatory practices
–assessing the conceptual soundness and performance testing of the PD and LGD models, by inspecting the model documentation to determine whether the models are suitable for their intended use
68
–evaluating the economic forecast, including selection of the economic forecast scenarios and weightings, by comparing them to the Company's business environment and relevant industry practices
–evaluating the length of the historical observation period and reasonable and supportable forecast period evaluating to relevant trends
–assessing the composition of the peer group by comparing to specific portfolio characteristics
–evaluating the methodology used to develop the qualitative factors and the effect of those factors on the collective ACL on loans compared with relevant credit risk factors and consistency with credit trends and identified limitations of the underlying quantitative model.
We also assessed the sufficiency of the audit evidence obtained related to the collective ACL on loans by evaluating the:
–cumulative results of the audit procedures
–qualitative aspects of the Company’s accounting practices
–potential bias in the accounting estimate.
| /s/ KPMG LLP | ||||||
| We have served as the Company's auditor since 1995. | ||||||
| March 1, | ||||||
69
TOMPKINS FINANCIAL CORPORATION
CONSOLIDATED STATEMENTS OF CONDITION
| (In thousands, except share and per share data) | As of | (In thousands, except share and per share data) | As of | |||||||||||
| ASSETS | 12/31/2018 | 12/31/2017 | ASSETS | 12/31/2020 | 12/31/2019 | |||||||||
| Cash and noninterest bearing balances due from banks | $ | 78,524 | $ | 77,688 | Cash and noninterest bearing balances due from banks | $ | 21,245 | $ | 136,010 | |||||
| Interest bearing balances due from banks | 1,865 | 6,615 | Interest bearing balances due from banks | 367,217 | 1,972 | |||||||||
| Cash and Cash Equivalents | 80,389 | 84,303 | Cash and Cash Equivalents | 388,462 | 137,982 | |||||||||
| Available-for-sale securities, at fair value (amortized cost of $1,363,902 at December 31, 2018 and $1,408,996 at December 31, 2017) | 1,332,658 | 1,391,862 | ||||||||||||
| Held-to-maturity securities, at amortized cost (fair value of $139,377 at December 31, 2018 and $140,315 at December 31, 2017) | 140,579 | 139,216 | ||||||||||||
| Equity securities, at fair value (amortized cost $1,000 at December 31, 2018 and $1,000 at December 31, 2017) | 887 | 913 | ||||||||||||
| Originated loans and leases, net of unearned income and deferred costs and fees | 4,568,741 | 4,358,543 | ||||||||||||
| Acquired loans | 265,198 | 310,577 | ||||||||||||
| Less: Allowance for loan and lease losses | 43,410 | 39,771 | ||||||||||||
| Available-for-sale debt securities, at fair value (amortized cost of $1,599,894 at December 31, 2020 and $1,293,239 at December 31, 2019) | Available-for-sale debt securities, at fair value (amortized cost of $1,599,894 at December 31, 2020 and $1,293,239 at December 31, 2019) | 1,627,193 | 1,298,587 | |||||||||||
| Equity securities, at fair value (amortized cost $929 at December 31, 2020 and $915 at December 31, 2019) | Equity securities, at fair value (amortized cost $929 at December 31, 2020 and $915 at December 31, 2019) | 929 | 915 | |||||||||||
| Total loans and leases, net of unearned income and deferred costs and fees | Total loans and leases, net of unearned income and deferred costs and fees | 5,260,327 | 4,917,550 | |||||||||||
| Less: Allowance for credit losses | Less: Allowance for credit losses | 51,669 | 39,892 | |||||||||||
| Net Loans and Leases | 4,790,529 | 4,629,349 | Net Loans and Leases | 5,208,658 | 4,877,658 | |||||||||
| Federal Home Loan Bank and other stock | 52,262 | 50,498 | Federal Home Loan Bank and other stock | 16,382 | 33,695 | |||||||||
| Bank premises and equipment, net | 97,202 | 86,995 | Bank premises and equipment, net | 88,709 | 94,355 | |||||||||
| Corporate owned life insurance | 81,928 | 80,106 | Corporate owned life insurance | 84,736 | 82,961 | |||||||||
| Goodwill | 92,283 | 92,291 | Goodwill | 92,447 | 92,447 | |||||||||
| Other intangible assets, net | 7,628 | 9,263 | Other intangible assets, net | 4,905 | 6,223 | |||||||||
| Accrued interest and other assets | 82,091 | 83,494 | Accrued interest and other assets | 109,750 | 100,800 | |||||||||
| Total Assets | 6,758,436 | 6,648,290 | Total Assets | 7,622,171 | 6,725,623 | |||||||||
| LIABILITIES | LIABILITIES | |||||||||||||
| Deposits: | Deposits: | |||||||||||||
| Interest bearing: | Interest bearing: | |||||||||||||
| Checking, savings and money market | 2,853,190 | 2,651,632 | Checking, savings and money market | 3,761,933 | 3,080,686 | |||||||||
| Time | 637,295 | 748,250 | Time | 746,234 | 675,014 | |||||||||
| Noninterest bearing | 1,398,474 | 1,437,925 | Noninterest bearing | 1,929,585 | 1,457,221 | |||||||||
| Total Deposits | 4,888,959 | 4,837,807 | Total Deposits | 6,437,752 | 5,212,921 | |||||||||
| Federal funds purchased and securities sold under agreements to repurchase | 81,842 | 75,177 | Federal funds purchased and securities sold under agreements to repurchase | 65,845 | 60,346 | |||||||||
| Other borrowings | 1,076,075 | 1,071,742 | Other borrowings | 265,000 | 658,100 | |||||||||
| Trust preferred debentures | 16,863 | 16,691 | Trust preferred debentures | 13,220 | 17,035 | |||||||||
| Other liabilities | 73,826 | 70,671 | Other liabilities | 122,665 | 114,167 | |||||||||
| Total Liabilities | 6,137,565 | 6,072,088 | Total Liabilities | 6,904,482 | 6,062,569 | |||||||||
| EQUITY | EQUITY | |||||||||||||
| Tompkins Financial Corporation shareholders' equity: | Tompkins Financial Corporation shareholders' equity: | |||||||||||||
| Common Stock - par value $.10 per share: Authorized 25,000,000 shares; Issued: 15,348,287 at December 31, 2018; and 15,301,524 at December 31, 2017 | 1,535 | 1,530 | ||||||||||||
| Common Stock - par value $.10 per share: Authorized 25,000,000 shares; Issued: 14,964,389 at December 31, 2020; and 15,014,499 at December 31, 2019 | Common Stock - par value $.10 per share: Authorized 25,000,000 shares; Issued: 14,964,389 at December 31, 2020; and 15,014,499 at December 31, 2019 | 1,496 | 1,501 | |||||||||||
| Additional paid-in capital | 366,595 | 364,031 | Additional paid-in capital | 333,976 | 338,507 | |||||||||
| Retained earnings | 319,396 | 265,007 | Retained earnings | 418,413 | 370,477 | |||||||||
| Accumulated other comprehensive loss | (63,165 | ) | (51,296 | ) | Accumulated other comprehensive loss | (32,074) | (43,564) | |||||||
| Treasury stock, at cost – 122,227 shares at December 31, 2018, and 120,805 shares at December 31, 2017 | (4,902 | ) | (4,492 | ) | ||||||||||
| Treasury stock, at cost – 124,849 shares at December 31, 2020, and 123,956 shares at December 31, 2019 | Treasury stock, at cost – 124,849 shares at December 31, 2020, and 123,956 shares at December 31, 2019 | (5,534) | (5,279) | |||||||||||
| Total Tompkins Financial Corporation Shareholders’ Equity | 619,459 | 574,780 | Total Tompkins Financial Corporation Shareholders’ Equity | 716,277 | 661,642 | |||||||||
| Noncontrolling interests | 1,412 | 1,422 | Noncontrolling interests | 1,412 | 1,412 | |||||||||
| Total Equity | $ | 620,871 | $ | 576,202 | Total Equity | 717,689 | 663,054 | |||||||
| Total Liabilities and Equity | $ | 6,758,436 | $ | 6,648,290 | Total Liabilities and Equity | $ | 7,622,171 | $ | 6,725,623 | |||||
See notes to consolidated financial statements.
70
TOMPKINS FINANCIAL CORPORATION
CONSOLIDATED STATEMENTS OF INCOME
| Year ended December 31, | |||||||||||||||||
| (In thousands, except per share data) | 2020 | 2019 | 2018 | ||||||||||||||
| INTEREST AND DIVIDEND INCOME | |||||||||||||||||
| Loans | $ | 227,313 | $ | 226,723 | $ | 214,370 | |||||||||||
| Due from banks | 194 | 41 | 31 | ||||||||||||||
| Available-for-sale securities | 25,450 | 28,460 | 30,377 | ||||||||||||||
| Held-to-maturity securities | 0 | 3,151 | 3,437 | ||||||||||||||
| Federal Home Loan Bank stock and Federal Reserve Bank stock | 1,373 | 3,003 | 3,377 | ||||||||||||||
| Total Interest and Dividend Income | 254,330 | 261,378 | 251,592 | ||||||||||||||
| INTEREST EXPENSE | |||||||||||||||||
| Time certificates of deposits of $250,000 or more | 3,175 | 3,095 | 1,712 | ||||||||||||||
| Other deposits | 16,789 | 27,809 | 14,883 | ||||||||||||||
| Federal funds purchased and securities sold under agreements to repurchase | 95 | 143 | 152 | ||||||||||||||
| Trust preferred debentures | 1,133 | 1,276 | 1,227 | ||||||||||||||
| Other borrowings | 7,799 | 18,427 | 21,818 | ||||||||||||||
| Total Interest Expense | 28,991 | 50,750 | 39,792 | ||||||||||||||
| Net Interest Income | 225,339 | 210,628 | 211,800 | ||||||||||||||
| Less: Provision for Credit Loss Expense | 16,151 | 1,366 | 3,942 | ||||||||||||||
| Net Interest Income After Provision for Credit Loss Expense | 209,188 | 209,262 | 207,858 | ||||||||||||||
| NONINTEREST INCOME | |||||||||||||||||
| Insurance commissions and fees | 31,505 | 31,091 | 29,369 | ||||||||||||||
| Investment services income | 17,520 | 16,434 | 17,288 | ||||||||||||||
| Service charges on deposit accounts | 6,312 | 8,321 | 8,435 | ||||||||||||||
| Card services income | 9,263 | 10,526 | 9,693 | ||||||||||||||
| Other income | 8,817 | 8,416 | 13,130 | ||||||||||||||
| Net gain (loss) on securities transactions | 443 | 645 | (466) | ||||||||||||||
| Total Noninterest Income | 73,860 | 75,433 | 77,449 | ||||||||||||||
| NONINTEREST EXPENSES | |||||||||||||||||
| Salaries and wages | 92,519 | 89,399 | 85,625 | ||||||||||||||
| Other employee benefits | 24,812 | 23,488 | 22,090 | ||||||||||||||
| Net occupancy expense of premises | 12,930 | 13,210 | 13,309 | ||||||||||||||
| Furniture and fixture expense | 7,846 | 7,815 | 7,351 | ||||||||||||||
| Amortization of intangible assets | 1,484 | 1,673 | 1,771 | ||||||||||||||
| Other operating expenses | 45,791 | 46,249 | 50,921 | ||||||||||||||
| Total Noninterest Expenses | 185,382 | 181,834 | 181,067 | ||||||||||||||
| Income Before Income Tax Expense | 97,666 | 102,861 | 104,240 | ||||||||||||||
| Income Tax Expense | 19,924 | 21,016 | 21,805 | ||||||||||||||
| Net Income Attributable to Noncontrolling Interests and Tompkins Financial Corporation | 77,742 | 81,845 | 82,435 | ||||||||||||||
| Less: Net income attributable to noncontrolling interests | 154 | 127 | 127 | ||||||||||||||
| Net Income Attributable to Tompkins Financial Corporation | $ | 77,588�� | $ | 81,718 | $ | 82,308 | |||||||||||
| Basic Earnings Per Share | $ | 5.22 | $ | 5.39 | $ | 5.39 | |||||||||||
| Diluted Earnings Per Share | $ | 5.20 | $ | 5.37 | $ | 5.35 | |||||||||||
| Year ended December 31, | |||||||||||
| (in thousands, except per share data) | 2018 | 2017 | 2016 | ||||||||
| INTEREST AND DIVIDEND INCOME | |||||||||||
| Loans | $ | 214,370 | $ | 191,410 | $ | 169,630 | |||||
| Due from banks | 31 | 37 | 6 | ||||||||
| Trading securities | 0 | 0 | 220 | ||||||||
| Available-for-sale securities | 30,377 | 29,721 | 27,846 | ||||||||
| Held-to-maturity securities | 3,437 | 3,475 | 3,603 | ||||||||
| Federal Home Loan Bank stock and Federal Reserve Bank stock | 3,377 | 2,121 | 1,434 | ||||||||
| Total Interest and Dividend Income | 251,592 | 226,764 | 202,739 | ||||||||
| INTEREST EXPENSE | |||||||||||
| Time certificates of deposits of $250,000 or more | 1,712 | 1,880 | 1,654 | ||||||||
| Other deposits | 14,883 | 10,253 | 9,059 | ||||||||
| Federal funds purchased and securities sold under agreements to repurchase | 152 | 235 | 2,228 | ||||||||
| Trust preferred debentures | 1,227 | 1,158 | 2,390 | ||||||||
| Other borrowings | 21,818 | 11,934 | 6,772 | ||||||||
| Total Interest Expense | 39,792 | 25,460 | 22,103 | ||||||||
| Net Interest Income | 211,800 | 201,304 | 180,636 | ||||||||
| Less: Provision for loan and lease losses | 3,942 | 4,161 | 4,321 | ||||||||
| Net Interest Income After Provision for Loan and Lease Losses | 207,858 | 197,143 | 176,315 | ||||||||
| NONINTEREST INCOME | |||||||||||
| Insurance commissions and fees | 29,369 | 28,778 | 29,492 | ||||||||
| Investment services income | 17,288 | 15,665 | 15,203 | ||||||||
| Service charges on deposit accounts | 8,435 | 8,437 | 8,793 | ||||||||
| Card services income | 9,693 | 9,100 | 8,058 | ||||||||
| Mark-to-market loss on trading securities | 0 | 0 | (182 | ) | |||||||
| Mark-to-market gain on liabilities held at fair value | 0 | 0 | 227 | ||||||||
| Other income | 13,130 | 7,631 | 6,291 | ||||||||
| Net (loss) gain on securities transactions | (466 | ) | (407 | ) | 926 | ||||||
| Total Noninterest Income | 77,449 | 69,204 | 68,808 | ||||||||
| NONINTEREST EXPENSES | |||||||||||
| Salaries and wages | 85,625 | 81,948 | 77,379 | ||||||||
| Other employee benefits | 22,090 | 21,458 | 19,909 | ||||||||
| Net occupancy expense of premises | 13,309 | 13,214 | 12,521 | ||||||||
| Furniture and fixture expense | 7,351 | 7,028 | 6,450 | ||||||||
| FDIC insurance | 2,618 | 2,527 | 3,024 | ||||||||
| Amortization of intangible assets | 1,771 | 1,932 | 2,090 | ||||||||
| Other operating expenses | 48,303 | 42,998 | 37,234 | ||||||||
| Total Noninterest Expenses | 181,067 | 171,105 | 158,607 | ||||||||
| Income Before Income Tax Expense | 104,240 | 95,242 | 86,516 | ||||||||
| Income Tax Expense | 21,805 | 42,620 | 27,045 | ||||||||
| Net Income Attributable to Noncontrolling Interests and Tompkins Financial Corporation | 82,435 | 52,622 | 59,471 | ||||||||
| Less: Net income attributable to noncontrolling interests | 127 | 128 | 131 | ||||||||
| Net Income Attributable to Tompkins Financial Corporation | $ | 82,308 | $ | 52,494 | $ | 59,340 | |||||
| Basic Earnings Per Share | $ | 5.39 | $ | 3.46 | $ | 3.94 | |||||
| Diluted Earnings Per Share | $ | 5.35 | $ | 3.43 | $ | 3.91 | |||||