UNITED STATES
SECURITIES AND EXCHANGE COMMISSION
WASHINGTON, D.C. 20549
FORM 10-K
|
| |
| (Mark One) |
| x | ANNUAL REPORT PURSUANT TO SECTION 13 OR 15(d) OF THE SECURITIES EXCHANGE ACT OF 1934 |
For the fiscal year ended December 31, 201129, 2012
OR
|
| |
| o | TRANSITION REPORT PURSUANT TO SECTION 13 OR 15(d) OF THE SECURITIES EXCHANGE ACT OF 1934 |
For the Transition period from to
Commission file number 1-11657
TUPPERWARE BRANDS CORPORATION
(Exact name of registrant as specified in its charter)
|
| |
| Delaware | 36-4062333 |
| (State or other jurisdiction of incorporation or organization) | (I.R.S. Employer Identification No.) |
| | |
14901 South Orange Blossom Trail, Orlando, Florida | 32837 |
| (Address of principal executive offices) | (Zip Code) |
| | |
| Registrant's telephone number, including area code: (407) 826-5050 |
| | |
| Securities registered pursuant to Section 12(b) of the Act: |
| Title of Each Class | Name of Each Exchange on Which Registered |
| Common Stock, $0.01 par value | New York Stock Exchange |
| | |
| Securities registered pursuant to Section 12(g) of the Act: None |
Indicate by check mark if the Registrant is a well-known seasoned issuer, as defined in Rule 405 of the Securities Act. Yes x No o
Indicate by check mark if the Registrant is not required to file reports pursuant to Section 13 or Section 15(d) of the Act. Yes o No x
Indicate by check mark whether the Registrant (1) has filed all reports required to be filed by Section 13 or 15(d) of the Securities Exchange Act of 1934 during the preceding 12 months (or for such shorter period that the Registrant was required to file such reports), and (2) has been subject to such filing requirements for the past 90 days. Yes x No o
Indicate by check mark whether the Registrant has submitted electronically and posted on its corporate Website, if any, every Interactive Data File required to be submitted and posted pursuant to Rule 405 of Regulation S-T during the preceding 12 months (or for such shorter period that the Registrant was required to submit and post such files). Yes x No o
Indicate by check mark if disclosure of delinquent filers pursuant to Item 405 of Regulation S-K is not contained herein, and will not be contained, to the best of Registrant's knowledge, in definitive proxy or information statements incorporated by reference in Part III of this Form 10-K or any amendment to this Form 10-K. xo
Indicate by check mark whether the Registrant is a large accelerated filer, an accelerated filer, a non-accelerated filer, or a smaller reporting company. See definitions of "large accelerated filer," "accelerated filer" and "smaller reporting company" in Rule 12b-2 of the Exchange Act.
Large accelerated filer x Accelerated filer o Non-accelerated filer o Smaller reporting company o
Indicate by check mark whether the registrant is a shell company (as defined in Rule 12b-2 of the Exchange
Act). Yes o No x
The aggregate market value of the voting and non-voting common equity on the New York Stock Exchange-Composite Transaction Listing on July 1, 2011June 29, 2012 (the last business day of the registrant's most recently completed second fiscal quarter) was $4,138,903,8512,999,899,643.
As of February 23, 201221, 2013, 56,131,71954,016,274 shares of the common stock, $0.01 par value, of the registrant were outstanding.
Documents Incorporated by Reference:
Portions of the Proxy Statement relating to the Annual Meeting of Shareholders to be held May 22, 201224, 2013 are incorporated by reference into Part III of this Report.
Table of Contents
|
| | |
| Item | | Page |
| Part I |
| | | |
| Item 1 | | |
| Item 1A | | |
| Item 1B | | |
| Item 2 | | |
| Item 3 | | |
| |
| Part II |
| | | |
| Item 5 | | |
| Item 5a | | |
| Item 5c | | |
| Item 6 | | |
| Item 7 | | |
| Item 7A | | |
| Item 8 | | |
| Item 9 | | |
| Item 9A | | |
| Item 9B | | |
| | | |
| Part III |
| | | |
| Item 10 | | |
| Item 11 | | |
| Item 12 | | |
| Item 13 | | |
| Item 14 | | |
| | | |
| Part IV |
| | | |
| Item 15 | | |
| | | |
| | | |
| | | |
| |
PART I
(a) General Development of Business
Tupperware Brands Corporation (“Registrant”, “Tupperware Brands” or the “Company”), is a global direct seller of premium, innovative products across multiple brands and categories through an independent sales force of 2.72.8 million. Product brands and categories include design-centric preparation, storage and serving solutions for the kitchen and home through the Tupperware®Tupperware® brand and beauty and personal care products through itsthe Armand Dupree®Dupree®, Avroy Shlain®Shlain®, BeautiControl®BeautiControl®, Fuller®Fuller®, NaturCare®NaturCare®, Nutrimetics®Nutrimetics® and Nuvo®Nuvo® brands. The Registrant is a Delaware corporation that was organized on February 8, 1996 in connection with the corporate reorganization of Premark International, Inc. (“Premark”). In the reorganization, certain businesses of the Registrant and certain other assets and liabilities of Premark and its subsidiaries were transferred to the Registrant. On May 31, 1996, the Registrant became a publicly held company through the pro rata distribution by Premark to its shareholders of all of the then outstanding shares of common stock of the Registrant. Prior to December 5, 2005, the Registrant's name was Tupperware Corporation. On October 18, 2000, the Registrant acquired 100 percent of the stock of BeautiControl, Inc. (“BeautiControl”), and on December 5, 2005, the Registrant acquired the direct sellingdirect-to-consumer businesses of Sara Lee Corporation. The 2005 acquisition was made to advance the strategy, begun with the acquisition of BeautiControl in 2000, of adding consumable items to the product category mix by expanding into beauty and personal care products.
(b) New York Stock Exchange-Required Disclosures
General. The address of the Registrant's principal office is 14901 South Orange Blossom Trail, Orlando, Florida 32837. The names of the Registrant's directors are Catherine A. Bertini, Rita Bornstein, Ph.D., Susan M. Cameron, Kriss Cloninger, III, E.V. Goings, Clifford J. Grum, Joe R. Lee, Bob Marbut, Angel R. Martinez, Antonio Monteiro de Castro, Robert J. Murray, David R. Parker, Joyce M. Roché and M. Anne Szostak. Members of the Audit, Finance and Corporate Responsibility Committee of the Board of Directors are Ms. Bertini, Dr. Bornstein, Ms. Cameron and Messrs. Cloninger (Chair), Grum, Marbut, Martinez and Murray.Parker. The members of the Compensation and Management Development Committee of the Board of Directors are Ms. Roché (Chair), Ms. Szostak, and Messrs. Lee, Monteiro de Castro and Parker.Murray. The members of the Nominating and Governance Committee of the Board of Directors are Mr. Murray (Chair), Ms. Roché, Ms. Szostak, and Messrs. Parker (Chair), Cloninger Grum and Murray.Parker. The members of the Executive Committee of the Board of Directors are Mr. Goings (Chair), Ms. Roché and Messrs. Goings (Chair), Cloninger, GrumMurray and Parker. The Chairman and Chief Executive Officer is E.V. Goings and the Presiding Director is David R. Parker.Robert J. Murray. The Registrant's officers and the number of its employees are set forth below in Part I of this Report. The name and address of the Registrant's transfer agent and registrar is Wells Fargo Bank, N.A., c/o Wells Fargo Shareowner Services, 161 North Concord Exchange, South St. Paul, MN 55075. The number of the Registrant's shareholders is set forth below in Part II, Item 5 of this Report. The Registrant is satisfying its annual distribution requirement to shareholders under the New York Stock Exchange (“NYSE”) rules by the distribution of its Annual Report on Form 10-K as filed with the United States Securities and Exchange Commission (“SEC”) in lieu of a separate annual report.
Corporate Governance. Investors can obtain access to periodic reports and corporate governance documents, including board committee charters, corporate governance principles and codes of conduct and ethics for financial executives, and information regarding the Registrant's transfer agent and registrar through the Registrant's website free of charge (as soon as reasonably practicable after reports are filed with the SEC, in the case of periodic reports) by going to www.tupperwarebrands.com and searching under Investor Relations / SEC Filings and Governance Documents. The Chief Executive Officer of the Registrant has certified to the NYSE that he is not aware of any violation by the Registrant of NYSE corporate governance listing standards.
BUSINESS OF TUPPERWARE BRANDS CORPORATION
The Registrant is a worldwide direct selling consumer productsdirect-to-consumer company engaged in the manufacture and sale of Tupperware® products and cosmetics and personal care products under a variety of trade names, including Armand Dupree®, Avroy Shlain®, BeautiControl®, Fuller®, NaturCare®, Nutrimetics® and Nuvo®. Each business manufactures and/or markets a broad line of high quality products.
I. PRINCIPAL PRODUCTS
Tupperware. The core of Tupperware'sthe Tupperware product line consists of design-centric preparation, storage and serving solutions for the kitchen and home. Tupperware also has an established line of kitchen cookware and tools, microwave products, microfiber textiles and gifts. FromIn addition to its traditional kitchen and home lines, such as the Modular Mates* and FridgeSmart* Containerscontainers and Tupperware* Impressions serve ware, which it still carries,the Tupperware line has evolved towards truly lifestyle-oriented products and has leveraged its research and development expertise to bring new concepts to market, such as the Individual Microwave Rice Maker,Power Time Savers Extra Chef* food processor system, which simplifies and speeds up everyday meal preparation. In 2012, key launches contemporized Tupperware classics, leveraging Tupperware's design, engineering and manufacturing expertise to bring consumers the Microwave Omelet Maker, a Universal Knife Sharpener that not only sharpens straight but also serrated bladesnext generation of serving, fridge storage and a Compact Cookwaremicrowave products. The new ranges offer enhanced consumer features and benefits without additional cost. These include the Blossom* serving range, Crystalwave* Generation II microwave reheatable line, that is perfect for city life. In 2011, Tupperware also introduced funTupperware* MicroCook microwave cooking line and smart, reusable and non-disposable solutions to stay healthy, save time and money and protect the environment. New products such as the Square Eco by Tupperware* Water Bottle, a new Commuter Mug with strainer and the Hot Food On-The-Go Lunch Solution help consumers in all these important ways.VentSmart* fridge storage line.
The Company continues to introduce new materials, designs, colors and decoration in its product lines, to vary its offerings by season and to extend existing products into new markets around the world. The development of new products varies across markets in order to address differences in cultures, lifestyles, tastes and needs, although most products are offered in a large number of markets. New product development will continue to be an important part of the Company's strategy.
Beauty. In Beauty, the Company manufactures and distributes skin care products, cosmetics, bath and body care, toiletries, fragrances, jewelry and nutritional products.
New skin care products introducedlaunched in 2011 in the Fuller Mexico business included the fragrances2012 include Bio Joven* Ginseng Energizing Anti-Wrinkle Facial Treatment, Armand Dupree* White, Acqua byRevitalizing Anti-Wrinkle Treatment, Armand Dupree* Eye Contour Gel, Armand Dupree Reductive* Body Sculpting Gel and Unire*. New products introduced in 2011 under the BeautiControl* brand included BeautiControl* Spa Facial Collection, BeautiControl* Sugar & Spice Collection,Herbal 3* Body Creams by Fuller Mexico; Regeneration* Tight, Firm &and Fill* FoundationsExtreme Tri-Peptide Complex, Regeneration* Tight, Firm and Fill* Extreme Lip Treatment and the BC Color Shimmer Eyes Contour Powder, Lip ShimmersSpa Bright line by BeautiControl; Nutrimetics Ultra Care+* Extreme Hand Repair, Nutrimetics Ultra Care+* Facial Rejuvenation Kit and Intense Lip Crème. Also introduced were new fragrance and body wash lines such as BeautiControl* Aura Collection for her and for him, BeautiControl* Extreme Blue Cologne and Body Wash, Eau de Toilette and Nail Lacquers that benefit the W.H.O. (Women Helping Others) Foundation and BeautiControl* Delicate Eau de Toilette and Body Wash. New products introduced in 2011 under the Nutrimetics* brand included the Restore Range, Nutrimetics* Anti-Age Firming Foundation SPF 15, Nutrimetics* Mineralised Matte Oil-Free Foundation,Anti-Aging Serum by Nutrimetics; as well as the Sun Caring* UV Protector Face Lotion and Natur Radiance* Moistrich Base by NaturCare.
Numerous new fragrances were also launched, such as Armand Dupree Red*, Tour Collection New York*, Scappare Fly* and celebrity fragrances, Espinoza Paz* and Galilea*, by Fuller Mexico; Sexy Red, BeautiControl Fancy*, Summer Mist, BC Man* and BeautiControl Spirit* by BeautiControl; Pink Diamond*, Avroy Shlain Delite Me*, After Midnight Gold* and Be Mine Tonight* by Avroy Shlain; and Armand Dupree Acqua*, Ornella Piü Fresh and Bella fragrances by Nuvo.
New additions to the Company's cosmetics ranges include Armand Dupree* Extra Glossy Lipstick from Fuller Mexico; BC Color Hydrating Lip Color from BeautiControl; Nutrimetics Jewelry.Hydra Brilliance* Lipstick, Colour Impact Eyeshadow and Pure Touch Blush from Nutrimetics; as well as a complete color cosmetics line under the brand name Colorfull*, which includes lipsticks, lip pencils, nail enamels, mascara, eye pencils and eye shadow, from Avroy Shlain.
Category expansions included baby care and jewelry by BeautiControl, with the BC Spa for Baby Collection and BC Jewelry which includes four jewelry collections, customized to correspond with BeautiControl's eBeauti Style online fashion diagnostic tool; and a family range including Camphor Cream, as well as a Naturals range which includes body butters by Avroy Shlain.
(Words followed by * are registered or unregistered trademarks of the Registrant.)
II. MARKETS
The Company operates its business under five reporting segments in three broad geographic regions: Europe (Europe, Africa and the Middle East), Asia Pacific and the Americas. Market penetration varies throughout the world. Several areas that have low penetration, such as Latin America, Asia and Eastern and Central Europe, provide the Company significant growth potential. The Company's strategy continues to include greater penetration in markets throughout the world.
Tupperware Brands' products are sold in almost 100 countries around the world under eight brands: Tupperware, Armand Dupree, Avroy Shlain, BeautiControl, Fuller, NaturCare, Nutrimetics and Nuvo. The Company defines its established market economy units as those in Western Europe including Scandinavia,(including Scandinavia), Australia, Canada, Japan, New Zealand and the United States. All other units are classified as operating in emerging market economies. Businesses operating in emerging markets accounted for 5961 percent of 20112012 sales, while businesses operating in established markets accounted for the other 4139 percent. For the past five fiscal years, 8586 to 90 percent of total revenues from the sale of Tupperware Brands' products have been in international markets.
III. DISTRIBUTION OF PRODUCTS
The Company's products are distributed worldwide primarily through the “direct selling” channel“direct-to-consumer” method, under which products are sold by an independent sales force to consumers outside traditional retail store locations. The system facilitates the timely distribution of products to consumers, without having to work through retail intermediaries, and establishes uniform practices regarding the use of Tupperware Brands' trademarks and administrative arrangements, such as order entry, delivery and payment, along with the recruiting and training of the sales force.
Products are primarily sold directly to distributors, directors, managers and dealers (“sales force”) throughout the world. Where distributorships are granted, they have the right to market the Company's products using parties and other non-retail methods and to utilize the Tupperware Brands' trademarks. The vast majority of the sales force are independent contractors and not employees of Tupperware. In certain limited circumstances, the Company has acquired ownership of distributorships for a period of time, until an independent distributor can be installed, in order to maintain market presence.
In addition to the introduction of new products and development of new geographic markets, a key element of the Company's strategy is expanding its business by increasing the size of its sales force. Under the system, distributors, directors and directorsmanagers recruit, train, and motivate a large number of dealers. Managers are developed from among the dealer group and promoted to assist in recruiting, training and motivating dealers, while continuing to sell products.
As of December 31, 201129, 2012, the Company's distribution system had approximately 1,7001,800 distributors, 81,00086,000 managers and 2.72.8 million dealers worldwide. During the year, 2122 million group presentation sales events, or parties, took place worldwide.
Tupperware relies primarily on the “party” method of sales, which is designed to enable the purchaser to appreciate, through demonstration, the features and benefits of the Company's products. Parties are held in homes, offices, social clubs and other locations. Products are also promoted through brochures mailed or given to people invited to attend parties and various other types of demonstrations. Some business units utilize a campaign merchandising system, whereby sales force members sell through brochures generated every two or three weeks, to their friends, neighbors and relatives,relatives. Sales of products are supported through programs of sales promotions, sales and training aids and motivational conferences for the sales force. In addition, to support its sales force, the Company utilizes catalogs and television and magazine advertising, which help to increase its sales levels with hard-to-reach customers and generate leads for sales and new dealers. A significant portion of the Company's business is operated through distributors, whomany of whom stock inventory and fulfill orders of the sales force that are generally placed after orders have been received from end consumers. In other cases, the Company sells directly to the sales force, also generally after they have received a consumer order.
In 20112012, the Company continued to sell directly, and/or through its sales force, to end consumers via the Internet. It also entered into a limited number of business-to-business transactions, in which it sells products to a partner company for sale to consumers through the partner's distribution channel, with a link back to the core business.
IV. COMPETITION
There are many competitors to Tupperware Brands' businesses both domestically and internationally. The principal bases of competition generally are marketing, price, quality and innovation of products, as well as competition with other “direct sales”“direct-to-consumer” companies for sales personnel and demonstration dates. Due to the nature of the direct-sellingdirect-to-consumer industry, it is critical that the Company provides a compelling earnings opportunity for the sales force, along with developing new and innovative products. The Company maintains its competitive position, in part, through the use of strong incentives and promotional programs.
Through its Tupperware® brand, the Company competes in the food storage, serving and preparation, containers, toys and gifts categories. Through its beauty and personal care brands, the Company also competes in the skin care, cosmetics, toiletries and fragrances categories. The Company works to differentiate itself from its competitors through its brand names, product innovation, quality, value-added services, celebrity endorsements, technological sophistication, new product introductions and its channel of distribution, including the training, motivation and compensation arrangements for its independent sales forces.
V. EMPLOYEES
The Registrant employs approximately 13,60013,000 people, of whom approximately 1,000 are based in the United States.
VI. RESEARCH AND DEVELOPMENT
The Registrant incurred $19.518.9 million, $17.819.5 million and $18.017.8 million for fiscal years 20112012, 20102011 and 20092010, respectively, on research and development activities for new products.
VII. RAW MATERIALS
Many of the products manufactured by and for the Company require plastic resins that meet its specifications. These resins are purchased through various arrangements with a number of large chemical companies located throughout the Company's markets. As a result, the Company has not experienced difficulties in obtaining adequate supplies and generally has been successful in obtaining favorable resin prices on a relative basis. Research and development relating to resins used in Tupperware® products is performed by both the Company and its suppliers.
Materials used in the Company's skin care, cosmetic and bath and body care products consist primarily of readily available ingredients, containers and packaging materials. Such raw materials and components used in goods manufactured and assembled by the Company and through outsource arrangements are available from a number of sources. To date, the Company has been able to secure an adequate supply of raw materials for its products, and it endeavors to maintain relationships with backup suppliers in an effort to ensure that no interruptions occur in its operations.
VIII. TRADEMARKS AND PATENTS
Tupperware Brands considers its trademarks and patents to be of material importance to its business; however, except for the Tupperware®, Fuller® and BeautiControl® trademarks, Tupperware Brands is not dependent upon any single patent or trademark, or group of patents or trademarks. The Tupperware®, Fuller® and BeautiControl® trademarks are registered on a country-by-country basis. The current duration for such registration ranges from five years to ten years; however, each such registration may be renewed an unlimited number of times. The patents used in Tupperware Brands' business are registered and maintained on a worldwide basis, with a variety of durations. Tupperware Brands has followed the practice of applying for design and utility patents with respect to most of its significant patentable developments. The Company has a patent on the formula for its “REGENERATION”® alpha-hydroxy acid-based products.
IX. ENVIRONMENTAL LAWS
Compliance with federal, state and local environmental protection laws has not had in the past, and is not expected to have in the future, a material effect upon the Registrant's capital expenditures, liquidity, earnings or competitive position.
X. OTHER
Sales do not vary significantly on a quarterly basis; however, third quarter sales are generally lower than the other quarters in any year due to vacations by dealers and their customers, as well as reduced promotional activities during this quarter. Sales generally increase in the fourth quarter, as it includes traditional gift-giving occasions in many markets and as children return to school and households refocus on activities that include party plan sales events and the use of the Company's housewares products, along with increased promotional activities supporting these opportunities.
Generally, there are no working capital practices or backlog conditions which are material to an understanding of the Registrant's business, although the Company generally seeks to minimize its net working capital position at the end of each fiscal year and normally generates a significant portion of its annual cash flow from operating activities in its fourth quarter. The Registrant's business is not dependent on a small number of customers, nor is any of its business subject to renegotiation of profits or termination of contracts or subcontracts at the election of the United States government.
XI. EXECUTIVE OFFICERS OF THE REGISTRANT
Following is a list of the names and ages of all the Executive Officers of the Registrant, indicating all positions and offices held by each such person with the Registrant, and each such person's principal occupations or employment during the past five years. Each such person has been elected to serve until the next annual election of officers of the Registrant (expected to occur on May 22, 201224, 2013).
|
| | |
| Name and Age | | Office and Experience |
| Edward R. Davis III, age 50 | | Vice President and Treasurer since May 2004. |
| R. Glenn Drake, age 60 | | Group President, Europe, Africa and the Middle East since August 2006. |
| Lillian D. Garcia, age 57 | | Executive Vice President and Chief Human Resources Officer, after serving as Executive Vice President and Area Vice President, Argentina, Uruguay, Venezuela and Ecuador from January 2011 to December 2012, and as Executive Vice President and President, Fuller Argentina since January 2010. Prior thereto, she served as Executive Vice President and Chief Human Resources Officer since August 2005. |
| E.V. Goings, age 67 | | Chairman and Chief Executive Officer since October 1997. |
| Josef Hajek, age 55 | | Senior Vice President, Tax and Governmental Affairs since February 2006. |
| Simon C. Hemus, age 63 | | President and Chief Operating Officer since January 2007. |
| Timothy A. Kulhanek, age 48 | | Vice President, Internal Audit and Enterprise Risk Management since June 2010 after serving as Vice President and Chief Financial Officer, BeautiControl, Inc., since August 2007. |
| Pablo Munoz, age 55 | | Group President, Americas, after serving as Group President, Latin America from January 2011 to September 2012, and as Area Vice President, Tupperware and Beauty, Latin America since January 2006. |
| Michael S. Poteshman, age 49 | | Executive Vice President and Chief Financial Officer since August 2004. |
| Nicholas K. Poucher, age 51 | | Vice President and Controller since August 2007. |
| Thomas M. Roehlk, age 62 | | Executive Vice President, Chief Legal Officer & Secretary since August 2005. |
| Christian E. Skroeder, age 64 | | Group President, Asia Pacific since January 2009, after serving as Senior Vice President, Worldwide Market Development since April 2001. |
Positions and Offices Held and Principal Occupations
of Employment During Past Five Years
|
| | |
| Name and Age | | Office and Experience |
Anna Braungardt, age 57 | | Senior Vice President, Worldwide Human Resources since January 2010, after serving as Vice President, Human Resources, North America & Beauty Group since January 2009. Prior thereto she served as Vice President, Human Resources, International Beauty since October 2005. |
Edward R. Davis III, age 49 | | Vice President and Treasurer since May 2004. |
R. Glenn Drake, age 59 | | Group President, Europe, Africa and the Middle East since August 2006. |
Lillian D. Garcia, age 56 | | Executive Vice President and Area Vice President, Argentina, Uruguay, Venezuela and Ecuador since January 2011, after serving as Executive Vice President and President, Fuller Argentina since January 2010. Prior thereto, she served as Executive Vice President and Chief Human Resources Officer since August 2005. |
E.V. Goings, age 66 | | Chairman and Chief Executive Officer since October 1997. |
Josef Hajek, age 54 | | Senior Vice President, Tax and Governmental Affairs since February 2006. |
Simon C. Hemus, age 62 | | President and Chief Operating Officer since January 2007, after serving as Group President, International Beauty since December 2005. |
Timothy A. Kulhanek, age 47 | | Vice President, Internal Audit and Enterprise Risk Management since June 2010 after serving as Vice President and Chief Financial Officer, BeautiControl, Inc., since August 2007. Prior thereto he served as Vice President and Controller since January 2005. |
Pablo Munoz, age 54 | | Group President, Latin America since January 2011, after serving as Area Vice President, Tupperware and Beauty, Latin America since January 2006. |
Michael S. Poteshman, age 48 | | Executive Vice President and Chief Financial Officer since August 2004. |
Nicholas K. Poucher, age 50 | | Vice President and Controller since August 2007, after serving as Vice President and Chief Financial Officer of Tupperware Europe, Africa and the Middle East since November 2003. |
Thomas M. Roehlk, age 61 | | Executive Vice President, Chief Legal Officer & Secretary since August 2005. |
Christian E. Skroeder, age 63 | | Group President, Asia Pacific since January 2009, after serving as Senior Vice President, Worldwide Market Development since April 2001. |
Jose R. Timmerman, age 6364 | | Executive Vice President, Supply Chain Worldwide since February 2010, after serving as Senior Vice President, Supply Chain since March 2009 and Senior Vice President, Worldwide Operations since August 1997. |
Robert F. Wagner, age 5152 | | Vice President and Chief Technology Officer since August 2002. |
William J. Wright, age 4950 | | Senior Vice President, Global Product Marketing since October 2010, after serving as Senior Vice President, Global Third Party Sourced Products & Product Development since June 2010. Prior thereto, he served as Vice President of Marketing and Business Development of Tupperware Europe, Africa and the Middle East since August 2006. |
Item 1A. Risk FactorsFactors.
The risks and uncertainties described below are not the only ones facing the Company. Other events that the Company does not currently anticipate or that the Company currently deems immaterial also may affect results of operations and financial condition.
Sales Force Factors
The Company’s products are marketed and sold through the direct selling"direct-to-consumer" method of distribution, in which products are primarily marketed and sold to consumers, without the use of retail establishments, by a sales force made up of independent contractors to consumers without the use of retail establishments.contractors. This distribution system depends upon the successful recruitment, retention and motivation of a large force of sales personnel to grow and compensate for a high turnover rate. The recruitment and retention of sales force members is dependent upon the competitive environment among direct sellersdirect-to-consumer companies and upon the general labor market, unemployment levels, general economic conditions, and demographic and cultural changes in the workforce. The motivation of the sales force is dependent, in part, upon the effectiveness of compensation and promotional programs of the Company, the competitiveness of the same compared with other direct sellingdirect-to-consumer companies, the introduction of new products and the ability to advance through the sales force structure.
The Company’s sales are directly tied to the activity levels of its sales force, which is in large part a temporary working activity for sales force members. Activity levels may be affected by the degree to which a market is penetrated by the presence of the Company’s sales force, the amount of average sales per party,order, the amount of sales per sales force member, and the mix of high-margin and low-margin products sold at parties and elsewhere, and the activities and actions of the Company’s product line and channel competitors. In addition, the Company’s sales force members may be affected by initiatives undertaken by the Company to grow theits revenue base of the Company that may lead to the inaccurate perception that the independent sales force system is at risk of being phased out.
International Operations
A significant portion of the Company’s sales and profit comes from its international operations. Although these operations are geographically dispersed, which partially mitigates the risks associated with operating in particular countries, the Company is subject to the usual risks associated with international operations. These risks include local political and economic environments, adverse new tax regulations and relations between U.S. and foreign governments.
The Company derived 90 percent of its net sales from operations outside the United States in 20112012. Because of this, movement in exchange rates may have a significant impact on the Company’s earnings, cash flows and financial position. The Company’s most significant exposures are to the euro, the Indonesian rupiah and the Mexican peso. Business units in which the Company generated at least $100 million of sales in 20112012 included Brazil, Tupperware France, Germany, Indonesia, Malaysia/Singapore, Fuller Mexico, Tupperware Mexico, and Tupperware United States and Canada. Although this currency risk is partially mitigated by the natural hedge arising from the Company’s local product sourcing in many markets, a strengthening U.S. dollar generally has a negative impact on the Company. In response to this fact, the Company continues to implement foreign currency hedging and risk management strategies to reduce the exposure to fluctuations in earnings associated with changes in foreign exchange rates. The Company generally does not seek to hedge the impact of currency fluctuations on the translated value of the sales, profit or cash flow generated by its operations. Some of the hedging strategies implemented have a positive or negative impact on cash flows as foreign currencies fluctuate versus the U.S. dollar. There can be no assurance that foreign currency fluctuations will not have a material adverse impact on the Company’s results of operations, cash flows and/or financial condition.
Another risk associated with the Company’s international operations is restrictions foreign governments may impose on currency remittances. Due to the possibility of government restrictions on transfers of cash out of countries and control of exchange rates, the Company may not be able to immediately repatriateaccess its cash at the exchange rate used to translate its financial statements. This is a particular issue currently in Venezuela.
Legal and Regulatory Issues
The Company’sCompany's business may also be affected by actions of domestic and foreign governments to restrict the activities of direct sellingdirect-to-consumer companies for various reasons, including the limitation on the ability of direct sellingdirect-to-consumer companies to operate through direct sales without the involvement of a traditional retail channel. Foreign governments may also introduce other forms of protectionist legislation, such as limitations on the products which can be produced locally or requirements that non-domestic companies doing or seeking to do business place a certain percentage of ownership of legal entities in the hands of local nationals to protect the commercial interests of its citizens. Customs laws, tariffs, import duties, export quotas and restrictions on repatriation of foreign earnings and/or other methods of accessing cash generated internationally, may negatively affect the Company’sCompany's international operations. Governments may seek either to impose taxes on independent sales force members or to classify independent sales force members as employees of direct sellingdirect-to-consumer companies with whom they may be associated, triggering employment-related taxes on the part of the direct sellingdirect-to-consumer companies. The U.S. government may impose restrictions on the Company’sCompany's ability to engage in business in a foreign country in connection with the foreign policy of the United States.
Product Safety
Certain of the materials used in the Company’s product lines may give rise to concerns of consumers based upon scientific theories which are espoused from time to time, including the risk of certain materials leaching out of plastic containers used for their intended purposes or the ingredients used in cosmetics, personal care or nutritional products causing harm to human health. This includes polycarbonate that contains the chemical Bisphenol A. It is the Company’s policy to use only those materials or ingredients that are approved by relevant regulatory authorities for contact with food or skin or for ingestion by consumers, as applicable.
General Business Factors
The Company’s business can be affected by a wide range of factors that affect other businesses. Weather, natural disasters, strikes, epidemics/pandemics, and political instability and public scrutiny of the direct-to-consumer channel, may have a significant impact on the willingness or ability of consumers to attend parties or otherwise purchase the Company’s products. The supply and cost of raw materials, particularly petroleum and natural gas-based resins, may have an impact on the availability or profitabilitycost of the Company’s plastic products. The Company is also subject to frequent product copying, counterfeiting and other intellectual property infringement, which may be difficult to police and prevent, depending upon the availability of intellectual property rights, the ability to identify the source of such counterfeiting or intellectual property infringementactivities and the existence and enforceability of laws affording protection to Company property. Other risks, as discussed under the sub-heading “Forward-Looking Statements” contained in Part II, Item 7A of this Report, may be relevant to performance as well.
Item 1B. Unresolved Staff Comments.
None.
Item 2. Properties.
The principal executive office of the Registrant is owned by the Registrant and is located in Orlando, Florida. The Registrant owns and maintains significant manufacturing and distribution facilities in Brazil, France, Greece, Indonesia, Japan, Korea, Mexico, New Zealand, Portugal, South Africa and the United States, and leases significant manufacturing and distribution facilities in Belgium, China, India Indonesia, and Venezuela. The Registrant owns and maintains the BeautiControl headquarters in Texas and leases its manufacturing and distribution facilities in Texas. The Registrant conducts a continuing program of new product design and development at its facilities in Florida, Texas, Belgium, Japan, Mexico and New Zealand. None of the owned principal properties is subject to any encumbrance material to the consolidated operations of the Company. The Registrant considers the condition and extent of utilization of its plants, warehouses and other properties to be good, the capacity of its plants and warehouses generally to be adequate for its needs, and the nature of the properties to be suitable for its needs.
In addition to the above-described improved properties, the Registrant owns unimproved real estate surrounding its corporate headquarters in Orlando, Florida. The Registrant prepared certain portions of this real estate for a variety of development purposes and, in 2002, began selling parts of this property. To date, approximately 200 acres have been sold and about 300 acres remain to be sold in connection with this project, which is expected to continue for a number of years.
Item 3. Legal ProceedingsProceedings.
A number of ordinary-course legal and administrative proceedings against the Registrant or its subsidiaries are pending. In addition to such proceedings, there are certain proceedings that involve the discharge of materials into, or otherwise relating to the protection of, the environment. Certain of such proceedings involve federal environmental laws such as the Comprehensive Environmental Response, Compensation and Liability Act of 1980, as well as state and local laws. The Registrant has established reserves with respect to certain of such proceedings. Because of the involvement of other parties and the uncertainty of potential environmental impacts, the eventual outcomes of such actions and the cost and timing of expenditures cannot be determined with certainty. It is not expected that the outcome of such proceedings, either individually or in the aggregate, will have a material adverse effect upon the Registrant.
As part of the 1986 reorganization involving the formation of Premark, Premark was spun-off by Dart & Kraft, Inc., and Kraft Foods, Inc. assumed any liabilities arising out of any legal proceedings in connection with certain divested or discontinued former businesses of Dart Industries Inc., a subsidiary of the Registrant, including matters alleging product and environmental liability. The assumption of liabilities by Kraft Foods, Inc. remains effective subsequent to the distribution of the equity of the Registrant to Premark shareholders in 1996.
As part of the 2005 acquisition of the direct sellingdirect-to-consumer businesses of Sara Lee Corporation, that company indemnified the Registrant for any liabilities arising out of any existing litigation at that time and for certain legal and tax matters arising out of circumstances that might relate to periods before or after the date of that date.acquisition.
Item 4. Mine Safety Procedures.
Not applicable.
PART II
| |
| Item 5. | Market for Registrant’s Common Equity, Related Stockholder Matters and Issuer Purchases of Equity Securities. |
The Registrant has not sold any securities in 20082010 through 20112012 that were not registered under the Securities Act of 1933. As of February 23, 2012,21, 2013, the Registrant had 50,18258,628 shareholders of record and beneficial holders. The principal United States market on which the Registrant’s common stock is being traded is the New York Stock Exchange. The stock price and dividend information set forth in Note 19 to the Consolidated Financial Statements, entitled “Quarterly Financial Summary (Unaudited),” is included in Item 8 of Part II of this Report and is incorporated by reference into this Item 5.
| |
| Item 5a. | Performance Graph. |
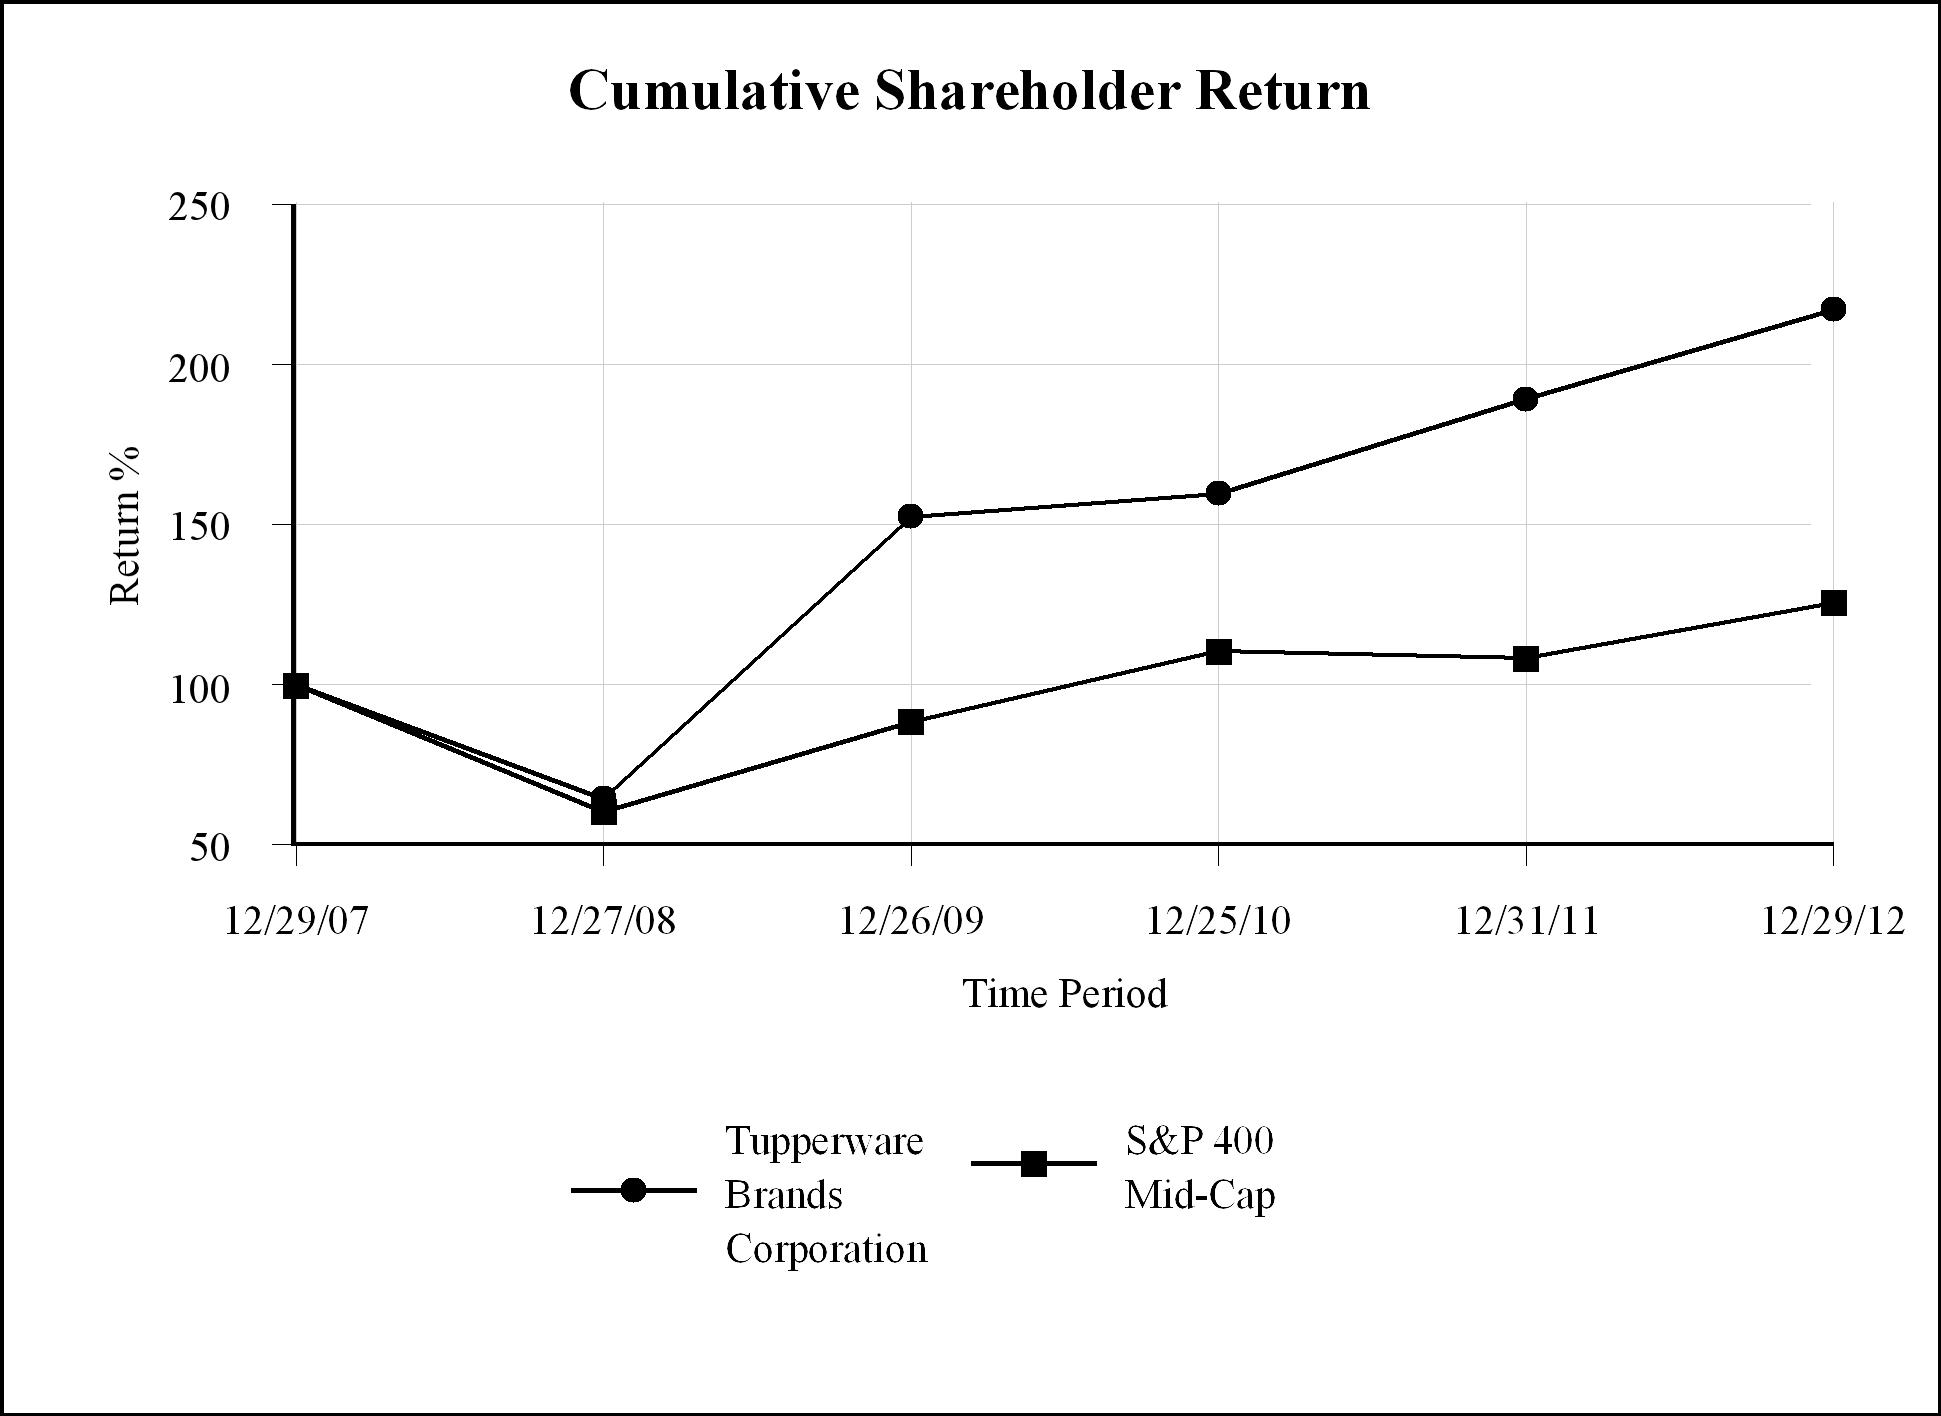
The following performance graph compares the performance of the Company's common stock to the Standard & Poor's 400 Mid-Cap Stock Index and the Standard & Poor's 400 Mid-Cap Consumer Discretionary Index. The graph assumes that the value of the investment in the Company's common stock and each index was $100 at December 30, 200629, 2007 and that all dividends were reinvested. The Company's stock is included in both indices.
|
| | | | | | | | |
Measurement Period (Fiscal Year Ended) | Tupperware Brands Corporation | | S&P 400 Mid-Cap | | S&P 400 Mid-Cap Consumer Discretionary Index |
| 12/30/2006 | 100.00 |
| | 100.00 |
| | 100.00 |
|
| 12/29/2007 | 150.77 |
| | 108.60 |
| | 90.62 |
|
| 12/27/2008 | 97.59 |
| | 65.83 |
| | 52.41 |
|
| 12/26/2009 | 229.93 |
| | 96.25 |
| | 85.43 |
|
| 12/25/2010 | 240.74 |
| | 120.22 |
| | 112.89 |
|
| 12/31/2011 | 285.30 |
| | 117.72 |
| | 113.70 |
|
|
| | | | | | | | |
Measurement Period (Fiscal Year Ended) | Tupperware Brands Corporation | | S&P 400 Mid-Cap | | S&P 400 Mid-Cap Consumer Discretionary Index |
| 12/29/2007 | 100.00 |
| | 100.00 |
| | 100.00 |
|
| 12/27/2008 | 64.73 |
| | 60.62 |
| | 57.83 |
|
| 12/26/2009 | 152.50 |
| | 88.63 |
| | 94.27 |
|
| 12/25/2010 | 159.67 |
| | 110.70 |
| | 124.57 |
|
| 12/31/2011 | 189.23 |
| | 108.40 |
| | 125.47 |
|
| 12/29/2012 | 217.08 |
| | 125.76 |
| | 151.66 |
|
| |
| Item 5c. | Changes in Securities, Use of Proceeds and Issuer Purchases of Equity Securities. |
The following information relates to the repurchase by the Registrant of its equity securities during each month of the fourth quarter of the Registrant's fiscal year covered by this report:
|
| | | | | | | | | | | | | |
| | Total Number of Shares Purchased | | Average Price Paid Per Share | | Total Number of Shares Purchased as Part of Publicly Announced Plans or Programs (a) | | Maximum Number (or Approximate Dollar Value) of Shares that May yet be Purchased Under the Plans or Programs (a) |
| 10/2/11-11/5/11 | 673,586 |
| |
| $55.69 |
| | 673,586 |
| | $ | 624,803,309 |
|
| 11/6/11-12/3/11 | 517,200 |
| | 55.11 |
| | 517,200 |
| | 596,299,215 |
|
| 12/4/11-12/31/11 | 432,200 |
| | 55.52 |
| | 432,200 |
| | 572,303,903 |
|
| | 1,622,986 |
| |
| $55.46 |
| | 1,622,986 |
| | $ | 572,303,903 |
|
|
| | | | | | | | | | | | | |
| | Total Number of Shares Purchased | | Average Price Paid Per Share | | Total Number of Shares Purchased as Part of Publicly Announced Plans or Programs (a) | | Maximum Number (or Approximate Dollar Value) of Shares that May yet be Purchased Under the Plans or Programs (a) |
| 9/30/12-11/3/12 | 192,800 |
| |
| $60.58 |
| | 192,800 |
| | $ | 460,638,113 |
|
| 11/4/12-12/1/12 | 885,700 |
| | 63.12 |
| | 885,700 |
| | 404,736,085 |
|
| 12/2/12-12/29/12 | 493,700 |
| | 65.66 |
| | 493,700 |
| | 372,319,383 |
|
| | 1,572,200 |
| |
| $63.60 |
| | 1,572,200 |
| | $ | 372,319,383 |
|
____________________
| |
| (a) | The Company's Board of Directors approved, in February 2010,October 2011, a program for repurchasing shares with an aggregate cost up to $350 million$1.2 billion until February 1, 2015. In January 2011, the Company's board increased the share repurchase authorization by $250 million to $600 million, and in October 2011,2013, the Company's board further increased the share repurchase authorization by $600800 million to $1.22 billion. The revised authorization continues to runis effective until February 1, 2015.2017. |
| |
| Item 6. | Selected Financial DataData. |
The following table presents the Company’s selected historical financial information for the last five years. The selected financial information below has been derived from the Company's audited consolidated financial statements which, for the data presented for fiscal years 20112012 and 20102011 and for some data presented for 2009,2010, are included as Item 8 of this Report. This data should be read in conjunction with the Company's other financial information, including "Management's Discussion and Analysis of Financial Condition and Results of Operations (MD&A)" and the Consolidated Financial Statements and Notes to the Consolidated Financial Statements included as Items 7 and 8, respectively, in this report.
Effective with the first quarter of 2011, the Company changed its segment reporting to reflect the geographic distribution of its businesses in accordance with how it views the operations. Consequently, the Company no longer has a Beauty Other segment, and the businesses previously reported in that segment are now reported as follows: Tupperware Brands Philippines in Asia Pacific; the Company’s Central America businesses in Tupperware North America; the Nutrimetics businesses in Europe and Asia Pacific (as applicable); and the businesses in South America as a separate geographic segment. Comparable information from the 2010, 2009 2008, and 20072008 fiscal years has been revised to conform to the new segment presentation. The Company's fiscal year ends on the last Saturday of December and, as a result, the 2011 fiscal year contained 53 weeks as compared with 52 weeks for the other fiscal years presented.
| | | (Dollars in millions, except per share amounts) | 2011 | | 2010 | | 2009 | | 2008 | | 2007 | |
| (in millions, except per share amounts) | | 2012 | | 2011 | | 2010 | | 2009 | | 2008 |
| Operating results | | | | | | | | | | | | | | | | | | |
| Net sales: | | | | | | | | | | | | | | | | | | |
| Europe | $ | 848.9 |
| | $ | 796.0 |
| | $ | 768.9 |
| | $ | 789.2 |
| | $ | 708.1 |
| $ | 791.4 |
| | $ | 848.9 |
| | $ | 796.0 |
| | $ | 768.9 |
| | $ | 789.2 |
|
| Asia Pacific | 714.0 |
| | 584.0 |
| | 494.0 |
| | 451.8 |
| | 407.8 |
| 780.7 |
| | 714.0 |
| | 584.0 |
| | 494.0 |
| | 451.8 |
|
| Tupperware North America | 352.0 |
| | 331.5 |
| | 296.9 |
| | 306.4 |
| | 292.6 |
| 344.8 |
| | 352.0 |
| | 331.5 |
| | 296.9 |
| | 306.4 |
|
| Beauty North America | 395.5 |
| | 406.0 |
| | 391.6 |
| | 460.7 |
| | 461.5 |
| 348.3 |
| | 395.5 |
| | 406.0 |
| | 391.6 |
| | 460.7 |
|
| South America | 274.6 |
| | 182.9 |
| | 176.1 |
| | 153.7 |
| | 111.4 |
| 318.6 |
| | 274.6 |
| | 182.9 |
| | 176.1 |
| | 153.7 |
|
| Total net sales | $ | 2,585.0 |
| | $ | 2,300.4 |
| | $ | 2,127.5 |
| | $ | 2,161.8 |
| | $ | 1,981.4 |
| $ | 2,583.8 |
| | $ | 2,585.0 |
| | $ | 2,300.4 |
| | $ | 2,127.5 |
| | $ | 2,161.8 |
|
| Segment profit (loss): | | | | | | | | | | | | | | | | | | |
| Europe | $ | 148.3 |
| | $ | 147.1 |
| | $ | 141.8 |
| | $ | 121.2 |
| | $ | 109.2 |
| $ | 131.6 |
| | $ | 148.3 |
| | $ | 147.1 |
| | $ | 141.8 |
| | $ | 121.2 |
|
| Asia Pacific | 147.0 |
| | 111.8 |
| | 84.9 |
| | 65.3 |
| | 48.7 |
| 172.7 |
| | 147.0 |
| | 111.8 |
| | 84.9 |
| | 65.3 |
|
| Tupperware North America | 58.4 |
| | 52.8 |
| | 40.3 |
| | 29.2 |
| | 22.5 |
| 63.7 |
| | 58.4 |
| | 52.8 |
| | 40.3 |
| | 29.2 |
|
| Beauty North America | 37.9 |
| | 58.9 |
| | 52.2 |
| | 60.5 |
| | 66.3 |
| 30.2 |
| | 37.9 |
| | 58.9 |
| | 52.2 |
| | 60.5 |
|
| South America (a) | 48.6 |
| | 24.4 |
| | 12.7 |
| | (4.5 | ) | | (3.7 | ) | 61.0 |
| | 48.6 |
| | 24.4 |
| | 12.7 |
| | (4.5 | ) |
| Unallocated expenses | (58.9 | ) | | (56.8 | ) | | (51.9 | ) | | (39.8 | ) | | (43.9 | ) | (62.6 | ) | | (58.9 | ) | | (56.8 | ) | | (51.9 | ) | | (39.8 | ) |
| Gain on disposal of assets including insurance recoveries, net (b),(c) | 3.8 |
| | 0.2 |
| | 21.9 |
| | 24.9 |
| | 11.8 |
| 7.9 |
| | 3.8 |
| | 0.2 |
| | 21.9 |
| | 24.9 |
|
| Re-engineering and impairment charges (a) | (7.9 | ) | | (7.6 | ) | | (8.0 | ) | | (9.0 | ) | | (9.0 | ) | (22.4 | ) | | (7.9 | ) | | (7.6 | ) | | (8.0 | ) | | (9.0 | ) |
| Impairment of goodwill and intangible assets (d) | (36.1 | ) | | (4.3 | ) | | (28.1 | ) | | (9.0 | ) | | (11.3 | ) | (76.9 | ) | | (36.1 | ) | | (4.3 | ) | | (28.1 | ) | | (9.0 | ) |
| Interest expense, net (e) | (45.8 | ) | | (26.8 | ) | | (28.7 | ) | | (36.9 | ) | | (49.2 | ) | (32.4 | ) | | (45.8 | ) | | (26.8 | ) | | (28.7 | ) | | (36.9 | ) |
| Income before income taxes | 295.3 |
| | 299.7 |
| | 237.1 |
| | 201.9 |
| | 141.4 |
| 272.8 |
| | 295.3 |
| | 299.7 |
| | 237.1 |
| | 201.9 |
|
| Provision for income taxes | 77.0 |
| | 74.1 |
| | 62.0 |
| | 40.5 |
| | 24.5 |
| 79.8 |
| | 77.0 |
| | 74.1 |
| | 62.0 |
| | 40.5 |
|
| Net income | $ | 218.3 |
| | $ | 225.6 |
| | $ | 175.1 |
| | $ | 161.4 |
| | $ | 116.9 |
| $ | 193.0 |
| | $ | 218.3 |
| | $ | 225.6 |
| | $ | 175.1 |
| | $ | 161.4 |
|
| Basic earnings per common share (f) | $ | 3.63 |
| | $ | 3.60 |
| | $ | 2.80 |
| | $ | 2.61 |
| | $ | 1.90 |
| $ | 3.49 |
| | $ | 3.63 |
| | $ | 3.60 |
| | $ | 2.80 |
| | $ | 2.61 |
|
| Diluted earnings per common share (f) | $ | 3.55 |
| | $ | 3.53 |
| | $ | 2.75 |
| | $ | 2.55 |
| | $ | 1.86 |
| $ | 3.42 |
| | $ | 3.55 |
| | $ | 3.53 |
| | $ | 2.75 |
| | $ | 2.55 |
|
| Profitability ratios | | | | | | | | | | |
| Segment profit as a percent of sales: | | | | | | | | | | |
| Europe | | 17 | % | | 17 | % | | 18 | % | | 18 | % | | 15 | % |
| Asia Pacific | | 22 |
| | 21 |
| | 19 |
| | 17 |
| | 14 |
|
| Tupperware North America | | 19 |
| | 17 |
| | 16 |
| | 14 |
| | 10 |
|
| Beauty North America | | 9 |
| | 10 |
| | 15 |
| | 13 |
| | 13 |
|
| South America (a) | | 19 |
| | 18 |
| | 13 |
| | 7 |
| | na |
|
| Return on average equity (g) | | 37.4 |
| | 30.0 |
| | 31.7 |
| | 31.6 |
| | 29.3 |
|
| Return on average invested capital (h) | | 18.7 |
| | 20.5 |
| | 21.4 |
| | 18.1 |
| | 15.8 |
|
See footnotes beginning on the following page.
| | | (Dollars in millions, except per share amounts) | 2011 | | 2010 | | 2009 | | 2008 | | 2007 | 2012 | | 2011 | | 2010 | | 2009 | | 2008 |
| Profitability ratios | | | | | | | | | | |
| Segment profit as a percent of sales: | | | | | | | | | | |
| Europe | 17 | % | | 18 | % | | 18 | % | | 15 | % | | 15 | % | |
| Asia Pacific | 21 |
| | 19 |
| | 17 |
| | 14 |
| | 12 |
| |
| Tupperware North America | 17 |
| | 16 |
| | 14 |
| | 10 |
| | 8 |
| |
| Beauty North America | 10 |
| | 15 |
| | 13 |
| | 13 |
| | 14 |
| |
| South America (a) | 18 |
| | 13 |
| | 7 |
| | na |
| | na |
| |
| Return on average equity (g) | 30.0 |
| | 31.7 |
| | 31.6 |
| | 29.3 |
| | 24.6 |
| |
| Return on average invested capital (h) | 20.5 |
| | 21.4 |
| | 18.1 |
| | 15.8 |
| | 12.8 |
| |
| Financial Condition | | | | | | | | | | | | | | | | | | |
| Cash and cash equivalents | $ | 138.2 |
| | $ | 248.7 |
| | $ | 112.4 |
| | $ | 124.8 |
| | $ | 102.7 |
| $ | 119.8 |
| | $ | 138.2 |
| | $ | 248.7 |
| | $ | 112.4 |
| | $ | 124.8 |
|
| Net working capital | 94.0 |
| | 348.8 |
| | 236.3 |
| | 252.3 |
| | 249.2 |
| 72.0 |
| | 96.0 |
| | 348.8 |
| | 236.3 |
| | 252.3 |
|
| Property, plant and equipment, net | 273.1 |
| | 258.0 |
| | 254.6 |
| | 245.4 |
| | 266.0 |
| 298.8 |
| | 273.1 |
| | 258.0 |
| | 254.6 |
| | 245.4 |
|
| Total assets | 1,844.2 |
| | 2,015.8 |
| | 1,818.8 |
| | 1,789.8 |
| | 1,850.7 |
| 1,821.8 |
| | 1,822.6 |
| | 1,991.7 |
| | 1,818.8 |
| | 1,789.8 |
|
Short-term borrowings and current portion
of long-term obligations | 195.7 |
| | 1.9 |
| | 1.9 |
| | 3.8 |
| | 3.5 |
| 203.4 |
| | 195.7 |
| | 1.9 |
| | 1.9 |
| | 3.8 |
|
| Long-term obligations | 415.2 |
| | 426.8 |
| | 426.2 |
| | 567.4 |
| | 589.8 |
| 414.4 |
| | 415.2 |
| | 426.8 |
| | 426.2 |
| | 567.4 |
|
| Shareholders’ equity | 500.8 |
| | 789.8 |
| | 637.7 |
| | 474.0 |
| | 522.7 |
| 479.1 |
| | 500.8 |
| | 789.8 |
| | 637.7 |
| | 474.0 |
|
| Current ratio | 1.14 |
| | 1.70 |
| | 1.51 |
| | 1.56 |
| | 1.55 |
| 1.10 |
| | 1.14 |
| | 1.70 |
| | 1.51 |
| | 1.56 |
|
| Long-term obligations-to-equity | 82.9 | % | | 54.0 | % | | 66.8 | % | | 119.7 | % | | 112.8 | % | |
| Other Data | | | | | | | | | | | | | | | | | | |
| Net cash provided by operating activities | $ | 274.7 |
| | $ | 299.5 |
| | $ | 250.9 |
| | $ | 131.0 |
| | $ | 177.4 |
| $ | 298.7 |
| | $ | 274.7 |
| | $ | 299.5 |
| | $ | 250.9 |
| | $ | 131.0 |
|
| Net cash used in investing activities | (68.9 | ) | | (46.1 | ) | | (26.9 | ) | | (39.1 | ) | | (25.0 | ) | (64.8 | ) | | (68.9 | ) | | (46.1 | ) | | (26.9 | ) | | (39.1 | ) |
| Net cash used in financing activities | (300.9 | ) | | (103.9 | ) | | (227.8 | ) | | (66.5 | ) | | (155.6 | ) | (252.5 | ) | | (300.9 | ) | | (103.9 | ) | | (227.8 | ) | | (66.5 | ) |
| Capital expenditures | 73.9 |
| | 56.1 |
| | 46.4 |
| | 54.4 |
| | 50.3 |
| 75.6 |
| | 73.9 |
| | 56.1 |
| | 46.4 |
| | 54.4 |
|
| Depreciation and amortization | 49.8 |
| | 49.7 |
| | 51.7 |
| | 60.6 |
| | 63.5 |
| 49.6 |
| | 49.8 |
| | 49.7 |
| | 51.7 |
| | 60.6 |
|
| Common Stock Data | | | | | | | | | | | | | | | | | | |
| Dividends declared per share | $ | 1.20 |
| | $ | 1.05 |
| | $ | 0.91 |
| | $ | 0.88 |
| | $ | 0.88 |
| $ | 1.44 |
| | $ | 1.20 |
| | $ | 1.05 |
| | $ | 0.91 |
| | $ | 0.88 |
|
| Dividend payout ratio (i) | 33.1 | % | | 29.2 | % | | 32.5 | % | | 33.7 | % | | 46.3 | % | 41.3 | % | | 33.1 | % | | 29.2 | % | | 32.5 | % | | 33.7 | % |
| Average common shares outstanding (thousands): | | | | | | | | | | | | | | | | | | |
| Basic | 60,046 |
| | 62,550 |
| | 62,374 |
| | 61,559 |
| | 60,904 |
| 55,271 |
| | 60,046 |
| | 62,550 |
| | 62,374 |
| | 61,559 |
|
| Diluted | 61,432 |
| | 63,845 |
| | 63,403 |
| | 62,976 |
| | 62,509 |
| 56,413 |
| | 61,432 |
| | 63,845 |
| | 63,403 |
| | 62,976 |
|
| Period-end book value per share (j) | $ | 8.15 |
| | $ | 12.37 |
| | $ | 10.10 |
| | $ | 7.51 |
| | $ | 8.35 |
| $ | 8.49 |
| | $ | 8.15 |
| | $ | 12.37 |
| | $ | 10.10 |
| | $ | 7.51 |
|
| Period-end price/earnings ratio (k) | 15.8 |
| | 13.7 |
| | 17.1 |
| | 8.1 |
| | 17.7 |
| 18.3 |
| | 15.8 |
| | 13.7 |
| | 17.1 |
| | 8.1 |
|
| Period-end market/book ratio (l) | 6.9 |
| | 3.9 |
| | 4.7 |
| | 2.8 |
| | 4.0 |
| 7.4 |
| | 6.9 |
| | 3.9 |
| | 4.7 |
| | 2.8 |
|
____________________
na - not applicable
| |
| a. | Re-engineering and impairment charges provide for severance and other exit costs. In fiscal year 2008, the Company reached a decision to begin selling beauty products in Brazil through the Tupperware sales force and cease operating its separate beauty business in Brazil.business. As a result of this decision, the Company recorded a $2.9 million charge relating to the write-off of inventory, prepaid assets and accounts receivable. This amount was included in the South America results. |
| |
| b. | In 2002, the Company began to sell land held for development near its Orlando, Florida headquarters. There were no land sales in the 2012, 2010 or 2009 fiscal years. During 2011 2008, and 20072008 fiscal years, pretax gains from these sales were $0.7 million $2.2 million, and $5.6$2.2 million, respectively, and were included in gains on disposal of assets including insurance recoveries, net. |
| |
| c. | Included in gain on disposal of assets including insurance recoveries, net are: |
Pretax gains of $0.2 million in 2012, $3.0 million in 2011 and $1.1 million in 2008, as a result of respective insurance recoveries from flood damage in Venezuela in 2012, Australia in 2011 and France and Indonesia in 2008;
Pretax gains of $7.5 million in 2012 from the sale of a facility in Belgium, and $0.2 million $2.9 million and $2.1$2.9 million in 2010 2009 and 2007,2009, respectively, from the sale of property in Australia, and $1.6 million in 2007 from the sale of the Company's former Philippines manufacturing facility;Australia;
Pretax gains of $19.0 million and $22.2 million in 2009 and 2008, respectively, as a result of insurance recoveries associated with a 2007 fire in South Carolina;
A pretax loss of $0.6 million in 2008, as a result of asset disposals in the Philippines; and
A pretax gain of $2.5$0.2 million of equipment sales in 2007, as a result2012.
| |
| d. | Valuations completed on the Company’s intangible assets resulted in the conclusion that certain tradenames and goodwill values were impaired. This resulted in non-cash charges of $76.9 million, $36.1 million, $28.1 million and $9.0 million and $11.3 million in 2012, 2011, 2009 2008 and 2007 fiscal years,2008, respectively. In fiscal year 2010, the Company recorded a $4.3 million impairment related to certain intangibles and goodwill, associated with a decision by the Company to cease operating its Swissgarde business as an independent entity. See Note 6 to the Consolidated Financial Statements. |
| |
| e. | In 2011, and 2007, the Company entered into new credit agreements, which resulted in a non-cash write-offswrite-off of deferred debt costs to interest expense of $0.9 million in 2011 and $6.1 million in 2007.million. In connection with the termination of the previous credit facilities, the Company also impaired or terminated certain floating-to-fixed interest rate swaps resulting in interest expense of $18.9 million in 2011 and $3.5 million in 2007.million. |
| |
| f. | On December 28, 2008, the Company adopted authoritative guidance addressing share-based payment transactions and participating securities, which requires that unvested share-based payment awards with a nonforfeitable right to receive dividends (participating securities) be included in the two-class method of computing earnings per share. The net income available to common shareholders for 2011, 2010 and 2009 - 2012, were computed in accordance with this guidance. The prior periods haveperiod has been retrospectively adjusted, resulting in a $0.01 reduction in each of 2008 diluted and 2007 dilutedbasic earnings per share. The impact on basic earnings per share was a $0.01 reduction in 2008 and a $0.02 reduction in 2007. The Company had 0.2 million, 0.2 million 0.4 million, and 0.50.4 million of unvested share-based payment awards outstanding for 2010, 2009 2008, and 2007,2008, respectively, which were classified as participating securities under this guidance. The Company had no unvested share-based payment awards classified as participating securities in 2012 and 2011. |
| |
| g. | Return on average equity is calculated by dividing net income by the average monthly balance of shareholders’ equity. |
| |
| h. | Return on average invested capital is calculated by dividing net income plus net interest expense multiplied by one minus the estimated marginal tax rate of 38%, by average shareholders’ equity plus debt, for the last five quarters. |
| |
| i. | The dividend payout ratio is dividends declared per share divided by basic earnings per share. |
| |
| j. | Period-end book value per share is calculated as year-end shareholders’ equity divided by average diluted shares. |
| |
| k. | Period-end price/earnings ratio is calculated as the year-end market price of the Company’s common stock divided by full year diluted earnings per share. |
| |
| l. | Period-end market/book ratio is calculated as the period-end market price of the Company’s common stock divided by period-end book value per share. |
Item 7. Management's Discussion and Analysis of Financial Condition and Results of Operations.
The following is a discussion of the results of operations for 2012 compared with 2011 and 2011 compared with 2010 and 2010 compared with 2009, and changes in financial condition during 20112012. The Company'sCompany’s fiscal year ends on the last Saturday of December and, as a result, the 2011 fiscal year contained 53included 52 weeks during 2012 and 2010, as compared with 5253 weeks for fiscal 2010 and 2009.in 2011. This information should be read in conjunction with the consolidated financial information provided in Item 8 of this Annual Report.
The Company's primary means of distributing its products is through independent sales organizations and individuals, which in many cases are also its customers. The vast majority of the Company's products are, in turn, sold to end customers who are not members of its sales force. The Company is largely dependent upon these independent sales organizations and individuals to reach end consumers, and any significant disruption of this distribution network would have a negative financial impact on the Company and its ability to generate sales, earnings and operating cash flows. The Company's primary business drivers are the size, activity and productivity of its independent sales organizations.
As exchange rates are an important factor in understanding period-to-period comparisons, the Company believes the presentation of results on a local currency basis, as a supplement to reported results, helps improve readers' ability to understand those results and evaluate performance in comparison with prior periods. The Company presents local currency information that compares results between periods as if current period exchange rates had been the exchange rates in the prior period. The Company uses results on a local currency basis as one measure to evaluate performance. The Company generally refers to such amounts as calculated on a "local currency" basis or "excluding the impact of foreign currency." These results should be considered in addition to, not as a substitute for, results reported in accordance with generally accepted accounting principles in the United States ("GAAP"). Results on a local currency basis may not be comparable to similarly titled measures used by other companies.
Estimates included herein are those of the Company’s management and are subject to the risks and uncertainties as described in the Forward Looking Statements caption included in Item 7A.
Overview
(Dollars in millions, except per share amounts)
Total Company results 20112012 vs 20102011
| | | | 53 weeks ended | | 52 weeks ended | | Change | | Change excluding the impact of foreign exchange | | Foreign exchange impact | 52 weeks ended | | 53 weeks ended | | Change | | Change excluding the impact of foreign exchange | | Foreign exchange impact |
| | December 31,
2011 | | December 25,
2010 | | December 29,
2012 | | December 31,
2011 | |
| Net sales | $ | 2,585.0 |
| | $ | 2,300.4 |
| | 12 | % | | 9 | % | | $ | 69.1 |
| $ | 2,583.8 |
| | $ | 2,585.0 |
| | — | % | | 5 | % | | $ | (127.3 | ) |
| Gross margin as percent of sales | 66.6 | % | | 66.7 | % | | (0.1 | )pp | | na |
| | na |
| |
| Gross margin as a percent of sales | | 66.9 | % | | 66.6 | % | | 0.3 | pp | | na |
| | na |
|
| Delivery, sales & administrative expense as a percent of sales | 51.8 | % | | 51.9 | % | | (0.1 | )pp | | na |
| | na |
| 51.5 | % | | 51.8 | % | | (0.3 | )pp | | na |
| | na |
|
| Operating income | $ | 342.3 |
| | $ | 329.4 |
| | 4 | % | | 1 | % | | $ | 8.7 |
| $ | 306.5 |
| | $ | 342.3 |
| | (10 | )% | | (2 | )% | | $ | (29.3 | ) |
| Net income | 218.3 |
| | 225.6 |
| | (3 | ) | | (6 | ) | | 6.5 |
| 193.0 |
| | 218.3 |
| | (12 | ) | | (2 | ) | | (22.2 | ) |
| Net income per diluted share | 3.55 |
| | 3.53 |
| | 1 |
| | (2 | ) | | 0.11 |
| 3.42 |
| | 3.55 |
| | (4 | ) | | 7 |
| | (0.36 | ) |
Total Company results 20102011 vs 20092010
| | | | 52 weeks ended | | Change | | Change excluding the impact of foreign exchange | | Foreign exchange impact | 53 weeks ended | | 52 weeks ended | | Change | | Change excluding the impact of foreign exchange | | Foreign exchange impact |
| | December 25,
2010 | | December 26,
2009 | | December 31,
2011 | | December 25,
2010 | |
| Net sales | $ | 2,300.4 |
| | $ | 2,127.5 |
| | 8 | % | | 6 | % | | $ | 34.9 |
| $ | 2,585.0 |
| | $ | 2,300.4 |
| | 12 | % | | 9 | % | | $ | 69.1 |
|
| Gross margin as percent of sales | 66.7 | % | | 66.2 | % | | 0.5 | pp | | na |
| | na |
| 66.6 | % | | 66.7 | % | | (0.1 | )pp | | na |
| | na |
|
| Delivery, sales & administrative expense as a percent of sales | 51.9 | % | | 52.6 | % | | (0.7 | )pp | | na |
| | na |
| 51.8 | % | | 51.9 | % | | (0.1 | )pp | | na |
| | na |
|
| Operating income | $ | 329.4 |
| | $ | 275.7 |
| | 19 | % | | 16 | % | | $ | 7.6 |
| $ | 342.3 |
| | $ | 329.4 |
| | 4 | % | | 1 | % | | $ | 8.7 |
|
| Net income | 225.6 |
| | 175.1 |
| | 29 |
| | 25 |
| | 5.7 |
| 218.3 |
| | 225.6 |
| | (3 | ) | | (6 | ) | | 6.5 |
|
| Net income per diluted share | 3.53 |
| | 2.75 |
| | 28 |
| | 24 |
| | 0.10 |
| 3.55 |
| | 3.53 |
| | 1 |
| | (2 | ) | | 0.11 |
|
____________________
na not applicable
pp percentage points
Sales
Reported sales increased 12 percentdecreased slightly in 20112012 compared with 20102011. This increase included under the Company's fiscal year, an estimated 1 percentage point positivenegative impact on the comparison from the extra week in 2011 compared with 2010.2011. Excluding the impact of changes in foreign currency exchange rates sales increased 95 percent, reflecting strong growth in the Company’s emerging market economy businesses, while its sales in established market economy businesses were about evendown slightly compared with 2010.2011. The Company defines its established markets as those in Western Europe including Scandinavia, Australia, Canada, Japan, New Zealand, and the United States. All other markets are classified as emerging markets. The Company’s emerging markets accounted for 5961 and 5659 percent of reported sales in 20112012 and 20102011, respectively. The 20112012 reported sales in the emerging markets were up 184 percent compared with the prior year, including a positivenegative $19.689.7 million impact on the comparison from changes in foreign currency exchange rates. Excluding the impact of foreign currency, these markets’ had strong growth of 11 percent. The strong results in the emerging markets were led by Brazil, India, Indonesia, Malaysia/Singapore, Tupperware Mexico, Turkey and Venezuela. This primarily reflected increases in their total and active sales forces, other than in Venezuela where the increase primarily reflected inflation related price increases. Among the emerging markets, those with notable declines in local currency sales were Fuller Mexico, due to a smaller and less active sales force in light of heavy promotional investments made in 2011 that were not repeated to the same extent, and Tupperware South Africa due to less sales force productivity. In South Africa, this reflected the impact on confidence of the sales force in light of counterfeit and knocked-off product in the market place and a generally weak consumer spending environment. The Company’s established market businesses' sales were down6 percent in U.S. dollars, including a negative$37.6 million impact on the comparison from changes in foreign currency exchange rates. Excluding the impact of foreign currency, sales in these markets were down3 percent. Among these units, there were local currency decreases in BeautiControl and Tupperware United States and Canada due to smaller and less active sales forces, as well as in Tupperware France, reflecting lower productivity. These decreases were partially offset by an increase in Germany, reflecting continued strength in sales force recruiting.
Reported sales increased 12 percent in 2011 compared with 2010. This increase included an estimated 1 percentage point positive impact from the extra week in 2011 compared with 2010. Excluding the impact of changes in foreign currency exchange rates, sales increased 9 percent, reflecting strong growth in the Company’s emerging market economy businesses, while sales in established market economy businesses were about even with 2010. The Company’s emerging markets accounted for 59 and 56 percent of reported sales in 2011 and 2010, respectively. The 2011 reported sales in the emerging markets were up 18 percent compared with the prior year, including a positive $19.6 million impact on the comparison from changes in foreign currency exchange rates. Excluding the impact of foreign currency, these markets’ sales grewhad strong growth of 16 percent.percent. The strong results in the emerging markets were led by Brazil, India, Indonesia, Malaysia/Singapore, Turkey and Venezuela. The core businesses in all of these units performed well through increases in their total and active sales forces, along with higher sales per active sales force member in most units. Of the emerging markets, Russia had the most notable decline in local currency sales compared with 2010,, due to a lower sales force size with less activity, as the Company worksworked to strengthen its top independent sales force leaders and reflectingleaders. The decrease also reflected continued difficulties in the consumer spending environment. The Company’s established market businesses were up5.0 5 percent in 2011 reported sales, including a positive$49.6 $49.6 million impact on the comparison from changes in foreign currency exchange rates. Excluding the foreign exchange benefit, sales in these markets were even with 2010. Germany, Italy and Tupperware United States and Canada were the units with the most significant sales growth during the year, reflecting larger and more productive sales forces, offset by declines by Tupperware Australia and BeautiControl, due to smaller and less active sales forces.
Reported sales increased 8 percent in 2010 compared with 2009. Excluding the impact of changes in foreign currency exchange rates, sales increased 6 percent, reflecting strong growth in the Company’s emerging market economy businesses partially offset by a slight decrease in its established market economy businesses. The Company’s emerging markets accounted for 56 and 51 percent of reported sales in 2010 and 2009, respectively. The 2010 reported sales in the emerging markets were up 18 percent compared with the prior year, including a positive $30.5 million impact on the comparison from changes in foreign currency exchange rates. Excluding the impact of foreign currency, these markets’ sales grew 15 percent. The strong results in the emerging markets were led by Brazil, China, India, Indonesia, Malaysia/Singapore, Tupperware South Africa, Turkey, and Venezuela. The core businesses in all of these units performed very well mainly due to higher total and active sales forces. Of the emerging markets, Russia had the most notable decline in local currency sales compared with 2009, due to lower sales force activity, reflecting a more difficult consumer spending environment and the impact on sales and the sales force of the third quarter fires and heat wave in this market, along with more conservative ordering by the market’s distributors in light of their cash flow. The Company’s established market businesses were down 2 percent in 2010 reported sales, including a positive $4.3 million impact on the comparison from changes in foreign currency exchange rates. The decline in the established markets was mainly due to lower sales in Tupperware Australia and Japan and BeautiControl reflecting smaller sales force sizes, partially offset by significant growth in Austria and France due to strong improvements in recruiting and larger sale forces.
Specific segment impacts are further discussed in the Segment Results section.
Gross Margin
Gross margin as a percentage of sales was 66.9 percent in 2012 and 66.6 percent in 2011. The increase of 0.3 percentage points ("pp") was primarily due to a better product mix, improved merchandising and slightly less promotional pricing (1.2 pp) and lower inventory obsolescence (0.1 pp). These improvements were partially offset by increased manufacturing costs, in part due to the lower absorption of fixed costs from lower sales volume in certain markets, mainly in Europe and Tupperware North America (0.8 pp), and a less favorable country mix as sales fell in some units with high gross margins (0.2 pp).
Gross margin as a percentage of sales was 66.6 percent in 2011 and 66.7 percent in 2010.2010. The decrease was primarily due to higher resin costs of $16 million or 0.6 percentage points ("pp"). These costs were(0.6 pp), partially offset by the leverage on fixed costs from higher sales volume in certain markets (0.2 pp), changes in estimates of certain non-income tax costs (0.1 pp) and reduced inventory obsolescence (0.2 pp).
Gross margin as a percentage of sales was 66.7 percent in 2010 and 66.2 percent in 2009. The increase was from leverage on higher sales volume, a favorable product mix sold and a greater share of in-country sourcing by Tupperware Indonesia compared with 2009, partially offset by higher obsolescence costs and $9 million in higher resin costs.
Operating Expenses
Delivery, sales and administrative expense (DS&A) as a percentage of sales was 51.5 percent in 2012, compared with 51.8 percent in 2011, compared with 51.9 percent in 2010. The lower DS&A percentage in 2012 was mainly due to lower commission expenses (0.3 pp), lower promotion expenses (0.4 pp) and lower marketing expenses (0.1pp). Partially offsetting these improvements was an overall increase in operating expenses and the impact of a stronger U.S. dollar that offset some of the normal benefit of the leverage on higher sales on the dollar-denominated fixed cost elements of this caption (0.5 pp).
DS&A as a percentage of sales was 51.8 percent in 2011, compared with 51.9 percent in 2010. The lower DS&A percentage in 2011 was mainly due to lower commission expenses (0.4 pp), the absence of out-of-period amounts recorded in Russia (0.2 pp) in 2010, and the leverage from higher sales volume due to the fixed nature of a portion of the costs included in this caption. Partially offsetting these improvements was higher spending on promotions (0.4 pp) and marketing (0.2 pp), reflecting efforts to grow itsthe sales forcesforce size and build brand recognition and appreciation in certain markets. A strengthening U.S. dollar offset some ofAlso, the normal benefit of the leverage on higher sales was offset by the impact of the strengthening of certain foreign currencies against the U.S. dollar on the dollar-denominatednon-dollar-denominated fixed cost elements of this caption.
DS&A also declined as a percentage17
The Company allocatessegregates corporate operating expenses to its reporting segmentsinto allocated and unallocated expenses based upon estimatedthe time spent relatedmanaging segment operations. The allocated costs are then apportioned to those segments where a direct relationship is present andeach segment based upon segment revenue for general expenses.revenues. The unallocated expenses reflect amounts unrelated to segment operations. AllocationsOperating expenses to be allocated are determined at the beginning of the year based upon estimated expenditures. Total unallocated expenses for 20112012 increased $2.13.7 million million compared with 20102011, largely reflecting impacts from variations in foreign exchange rates. Excluding the impact of changes in foreign currency exchange rates, unallocated expenses were about even with 2010.
Total unallocated expenses for 2010 increased $4.9 million compared with 2009, reflecting higher incentive and equity compensation due to improved operating results, incremental audit fees in connection with review of internal controls in selected emerging markets andas well as impacts from variations in foreign exchange rates.
16Total unallocated expenses for 2011 increased $2.1 million compared with 2010, largely reflecting impacts from variations in certain foreign exchange rates.
As discussed in Note 1 to the Consolidated Financial Statements, the Company includes costs related to the distribution of its products in DS&A expense. As a result, the Company’s gross margin may not be comparable with other companies that include these costs in cost of products sold.
Included in 20112012 net income were pretax charges of $7.922.4 million million for re-engineering and impairment charges, compared with $7.67.9 million and $8.0 million in 2010 and 2009$7.6 million in 2011 and 2010, respectively. These charges are discussed in the re-engineering costs section following.
The Company’s goodwill and intangible assets relate primarily to the December 2005 acquisition of the direct sellingdirect-to-consumer businesses of Sara Lee Corporation and the October 2000 acquisition of BeautiControl. The Company conducts an annual impairment testassessment of goodwill and intangible assets in the third quarter of each year, other than for BeautiControl where the annual valuation is performed in the second quarter, and in other quarters in the event of a change in circumstances that would lead the Company to believe that a triggering event for impairment may have occurred. The impairment assessment is completed by estimating the fair valueRefer to Note 6 of the reporting units and intangible assets and comparing these estimates with their carrying values.Consolidated Statements.
InDuring the second quarter of 2009,2012, the Company notedcompleted its annual impairment test of the BeautiControl reporting units, resulting in an impairment charge of $38.9 million related to the goodwill in the BeautiControl United States and Canada business. This was a result of the rates of growth of sales, profit and cash flow and expectations for future performance that were below the Company's previous projections. Also in the second quarter, the financial performance of the Nutrimetics reporting units fell below their previous trend line and it became apparent that they would fall significantly short of previous expectations for the year. Additionally, reductions in the forecasted operating trends of NaturCare, relating to declines in the rates of growth of sales, profit and cash flows in the Japanese market, led to interim impairment testing in both these businesses, were below the Company’s projections used in its previous valuations, as was the forecast for growth in future periods. At that time, the Company also noted that financial results of the South African beauty business were not meeting the projections used in the 2008 annual valuation. Given the sensitivityend of the valuations to changes in cash flows for these reporting units, the Company performed interim impairment tests of tradenamesMay and reporting units, reflecting reduced future forecasts in these businesses, including the impact of the external environment.June 2012, respectively. The result of the interim impairmentthese tests was to record tradename impairments of $10.1$13.8 million for Nutrimetics $4.2and $9.0 million for NaturCare, primarily due to the use of lower estimated royalty rates in light of lower sales and $2.0 millionprofit forecasts for Avroy Shlainthese units, as well as macroeconomic factors that increased the discount rates used in the secondvaluations versus those used previously. In addition, the Company wrote off the $7.2 million and $7.7 million carrying value of the goodwill of the Nutrimetics Asia Pacific and Nutrimetics Europe reporting units, respectively, in light of then current operating trends and expected future results, as well as the macroeconomic factors that increased the discount rates used in the valuations.
During the third quarter of 2009. In addition2011, the financial results of Nutrimetics were below expectations. The Company also made at that time, the decision to cease operating its Nutrimetics business in Malaysia. As a result, the Company lowered its forecast of future sales and profit. The result of the impairment of tradenames, the Company also recognized impairments of goodwill of $8.6tests was to record a $31.1 million and $3.2 million relating impairment to the Nutrimetics goodwill in the Asia Pacific reporting unit and South African beauty reporting units, respectively.a $5.0 million impairment to its tradename.
During 2010, the Company decided it would cease operating separately its Swissgarde unit. As a result of this decision, the Company concluded that its intangible assets and goodwill were impaired. Hence, in the fourth quarter of 2010, the Company recorded a $2.1$2.1 million impairment to the Swissgarde tradename, a $0.1$0.1 million impairment related to itsa sales force intangible asset and a $2.1$2.1 million impairment to goodwill relating to the South African beauty reporting unit. During 2011, the Company sold its interest in Swissgarde for $0.7 million, which that resulted in a gain of $0.1 million.
The Company continues working on its program to sell land for development near its Orlando, Florida headquarters, which began in 2002. During 2011, a pretax gain of $0.7 million was recognized as a result of a sale under this program. There were no land sales under this program in 20102012 or 20092010 due to negative developments in the real estate market, including ramifications of the credit crisis in the United States. Gains on land transactions are recorded based upon when the transactions close and proceeds are collected. Transactions in one period may not be representative of what may occur in future periods. Since the Company began this program in 2002, cumulative proceeds from these sales have totaled $67.7 million and currently are expected to be up to an additional $100 million when the program is completed. The carrying value of the remaining land included in the Company's land sales program was $23$23.2 million as of December 31, 201129, 2012. This amount was included in property, plant and equipment held for use within the Consolidated Balance Sheet as it is not considered probable that any land sales will be completed within one year.
In 2009,2012, the company recordedCompany recognized a $7.5 million pretax gain of $19.0 million for insurance recoveries from the settlementsale of its claim from the 2007 fire at its South Carolinaold manufacturing facility.
Infacility in Belgium, and in 2010, and 2009, the Company recorded a pretax gain of $0.2 million and $2.9 million, respectively, from the sale of property in Australia.
Re-engineering Costs
As the Company continuously evaluates its operating structure in light of current business conditions and strives to maintain the most efficient possible structure, it periodically implements actions designed to reduce costs and improve operating efficiency. These actions often result in re-engineering costs related to facility downsizing and closure, as well as related asset write downs and other costs that may be necessary in light of the revised operating landscape. In addition, the Company may recognize gains upon disposal of closed facilities or other activities directly related to its re-engineering efforts. Over the past three years, the Company has incurred such costs as detailed below that were included in the following income statement captions (in millions):
| | | | 2011 | | 2010 | | 2009 | 2012 | | 2011 | | 2010 |
| Re-engineering and impairment charges | $ | 7.9 |
| | $ | 7.6 |
| | $ | 8.0 |
| $ | 22.4 |
| | $ | 7.9 |
| | $ | 7.6 |
|
| Cost of products sold | 1.7 |
| | — |
| | — |
| 0.2 |
| | 1.7 |
| | — |
|
| Total pretax re-engineering costs | $ | 9.6 |
| | $ | 7.6 |
| | $ | 8.0 |
| $ | 22.6 |
| | $ | 9.6 |
| | $ | 7.6 |
|
The Company recorded re-engineering and impairment charges of$5.3 million, $5.9 million, and $6.5 million and $5.2 millionin 20112012, 20102011 and 20092010, respectively, related to severance costs incurred to reduce head count in various units, mainly due to implementing changes in the businesses' management structures. These costs were primarily related to operations in Argentina, Australia, Fuller Mexico, Japan and exiting the Nutrimetics businesses in Greece and the United Kingdom in 2012; France, Fuller Mexico, Japan and Malaysia in 2011; and Australia, France and Japan in 2010;2010.In 2012, re-engineering and Australia, BeautiControl, France, Fuller Mexicoimpairment charges included$0.9 millionin exit costs, primarily related to the decision to cease operating the Nutrimetics businesses in Greece and Japanthe United Kingdom. Also in 2009.connection with the liquidation of the Nutrimetics business in the United Kingdom, the Company incurred a$16.2 million non-cash charge that related to the reclassification of currency translation adjustments from accumulated other comprehensive income into operating income, as well as a $0.2 million charge to cost of sales for inventory obsolescence. In 2011, re-engineering and impairment charges also included $1.3 millionrelated to the decision to merge the Nutrimetics and Tupperware businesses in Malaysia and$0.7 million related to asset impairments, exit activities and relocation costs. Also in 2011, in connection with the decision to cease operating Nutrimetics Malaysia, the Company recordedcosts as well as a $1.7 million charge to cost of sales for inventory obsolescence. In 2010, re-engineering and impairment charges also included $1.1 millionrelated to moving costs and the impairment of property, plant and equipment associated with the relocation of certaina manufacturing facilitiesfacility in Japan. In 2009, these costs also included $2.1 million related to the impairment of software and property, plant and equipment and $0.7 million of costs associated with the relocation of certain manufacturing facilities.
See also Note 2 to the Consolidated Financial Statements, regarding the Company's re-engineering actions.
Net Interest Expense
Net interest expense was $45.832.4 million million forin 20112012, compared with $26.845.8 million million in 2010. The increase in 2011 was primarily. Excluding the impact of the non-cash interest rate swap impairment charge recorded in 2011 of $18.9 million and the write-off of deferred debt issuance costs of $0.9 million, interest expense increased due to anhigher borrowing levels and higher weighted average interest rates.
Net interest expense was $45.8 million in 2011, compared with $26.8 million in 2010. This increase reflected the $18.9 million charge resultingcost from the impairment of floating-to-fixed interest swaps, that became ineffective when the underlying debt was repaid in the second quarter of 2011, along with a $0.9 millionthe write-off of deferred debt costs. This was partially offset by higher interest income earned on higher average cash balances held during 2011 in Brazil, China and India.
Net interest expense was $26.8 million in 2010, compared with $28.7 million in 2009, reflecting a lower level of borrowings exposed to floating rates.
Tax Rate
The effective tax rates for 20112012, 20102011 and 20092010 were 26.129.3, 24.726.1 and 26.224.7 percent, respectively. The comparatively higher 2011 and 20092012 tax rates wererate was due to the impact of nondeductible foreign goodwill impairment charges. As a result of tax law changes in Mexico, an election was made during 2011that2011 that resulted in a reduction of $20.4 million of deferred tax liabilities. The Company also incurred in 2011, additional costs of $16.0 million associated with the repatriation of foreign earnings. During 2011, the Company decided to repatriate earnings from Australia and certain other foreign units that were previously determined to be indefinitely reinvested in order to take advantage of historically favorable exchange rates. In 2009, there were significant costs related to the impact of changes in Mexican legislation and a revaluation of tax assets. The effective tax rates for 20112012, 20102011 and 20092010 are below the U.S. statutory rate, reflecting the availability of excess foreign tax credits, as well as lower foreign effective tax rates.
Tax rates are affected by many factors, including the global mix of earnings, changes in tax legislation, acquisitions or dispositions as well as the tax characteristics of income. The Company is required to make judgments on the need to record deferred tax assets and liabilities, uncertain tax positions and assessments regarding the realizability of deferred tax assets in determining the income tax provision. The Company has recognized deferred tax assets based upon its analysis of the likelihood of realizing the benefits inherent in them. TheAt December 29, 2012 and December 31, 2011, the Company has not recorded ahad valuation allowanceallowances against certain deferred tax assets totaling $103.1 million and $96.0 million, respectively. These valuation allowances relate to tax assets in jurisdictions where it has concludedis management's best estimate that itthere is more likelynot a greater than not50 percent probability that the benefitsbenefit of the assets will ultimately be realized.realized in the associated tax returns. This assessment is based upon expectations ofexpected future domestic operatingresults, future foreign dividends from then current year earnings and non-operating results, foreign dividendscash flows and other foreign source income, including rents and royalties, as well as anticipated gains related to the Company's future sales of land held for development near itsthe Company's Orlando, Florida headquarters. In addition, certain tax planning transactions may be entered into to facilitate realization of these benefits. In evaluating uncertain tax positions, the Company makes determinations regarding the application of complex tax rules, regulations and practices. Uncertain tax positions are evaluated based on many factors including but not limited to changes in tax laws, new developments and the impact of settlements on future periods. Refer to the critical accounting policies section and Note 12 to the Consolidated Financial Statements for additional discussions of the Company's methodology for evaluating deferred tax assets.
As of December 31, 201129, 2012 and December 25, 201031, 2011, the Company's gross unrecognized tax benefit was $28.624.9 million and $27.328.6 million, respectively. During the year ended December 31, 201129, 2012, the Company settled certain tax positions in various foreign countries which included a payment of $0.4 million of interest and taxes. As a result of the settlement, the Company's unrecognized tax benefit decreased by $3.2 million, and related accruals for interest and penalties decreased by $0.3 million. Also during 2011, the Company reduced its liability by $1.2 million upon entering into certain advance pricing agreements. During the year, the accrual for uncertain tax positions decreased $4.5 million due to the expiration of the statute of limitations in various jurisdictions. The accrual also increased for positions being taken during the year in various tax filings. The accrual is further impacted by changes in foreign exchange rates.
The Company estimates that it may settle one or more foreign audits in the next twelve months that may result in a decrease in the amount of accrual for uncertain tax positions of up to $2.21.8 million. For the remaining balance as of December 31, 2011,29, 2012, the Company is not able to reliably estimate the timing or ultimate settlement amount. While the Company does not currently expect material changes, it is possible that the amount of unrecognized benefit with respect to the uncertain tax positions will significantly increase or decrease related to audits in various foreign jurisdictions that may conclude during that period or new developments that could also, in turn, impact the Company's assessment relative to the establishment of valuation allowances against certain existing deferred tax assets. At this time, the Company is not able to make a reasonable estimate of the range of impact on the balance of unrecognized tax benefits or the impact on the effective tax rate related to these items.
Net Income
For 20112012, operating income increased 4decreased10 percent compared with 20102011, which included aan 38 percent positivenegative impact on the comparison from changes in foreign currency exchange rates. Net income decreased 312 percent on a reported basis, and this included aprimarily reflecting the positive3 percentnegative impact from changes in foreign currency exchange rates. Excluding the impact of foreign exchange rates, net income was 2 percent lower than 2011. The coredecrease was due to the impact of lower sales by Beauty North America and a higher level of operating expenses in Europe, as well as lower gross margin from lower manufacturing volume in Europe. There were also non-cash charges related to higher goodwill and intangible asset impairment charges in 2012, as well as $16.2 million related to the reclassification of currency translation adjustments from accumulated other comprehensive income into operating income as a result of the liquidation of the Nutrimetics business in the United Kingdom. There was also a higher income tax rate in 2012 than in 2011, primarily reflecting the impact of the higher nondeductible foreign goodwill impairment charges. These decreases were partially offset by the higher profit achieved from the businesses in Asia Pacific and South America based on the contribution margin on higher sales, while Tupperware North America had lower operating expenses that led to higher profit despite local currency sales that were even with 2011. In addition, the year-over-year comparison also benefited from not having the $18.9 million impairment charge associated with interest rate swaps recorded in 2011 as well as a $7.5 million gain from the sale of an old manufacturing facility in Belgium in 2012.
For 2011, operating income increased 4 percent compared with 2010, which included a 3 percent positive impact on the comparison from changes in foreign currency exchange rates. Net income decreased 3 percent on a reported basis, and this included a positive 3 percent impact from changes in foreign currency exchange rates. The businesses in Asia Pacific, Tupperware North America, and South America achieved higher profit based on the contribution margin on higher sales. These increases were offset by the impact of lower sales by Beauty North America, as well as higher levels of promotional spending in Europe and Beauty North America, along with the $36.1 million impairment of goodwill and intangible assets of the Nutrimetics businesses and $19.8 million in costs incurred from the impairment of interest rate swaps and the write-off of deferred debt issuance costs in connection with the repayment of the underlying debt in the second quarter.quarter of 2011. There was also a higher income tax rate in 2011 than in 2010, primarily reflecting the impact of the nondeductible foreign goodwill impairment charges.
For 2010, operating income increased 19International operations accounted for 90 percent compared with 2009, which included a 3of the Company's sales in both 2012 and 2011 and 88 percent positive impact on the comparison from stronger foreign exchange rates. Net income increased 29in 2010. They accounted for 98, 99 and 96 percent on a reported basis, and this included a positive 4 percent impact from stronger foreign exchange rates. In addition to the net impact of having lower impairment charges related to goodwill and intangible assets and not having an insurance recovery in 2010, the local currency increase in net income was from improvements in all of the Company’s segments, mainly reflecting the contribution margin on higher sales. There was also a positive impact on the comparison from not having the $8.4 million foreign exchange related costsnet segment profit in Venezuela incurred in 2009, which are described below,2012, 2011 and from a lower tax rate, primarily due to the lack of a tax benefit associated with the intangible impairment charges recorded in 2009. These items were partially offset by out-of-period amounts recorded in Russia that negatively impacted the 2010 comparison with 2009., respectively.
International operationsSegment Results 2012 vs. 2011
|
| | | | | | | | | | | | | | | | | | | | | | | | | | | |
| (Dollars in millions) | 2012 | | 2011 | | Change | | Change excluding the impact of foreign exchange | | Foreign exchange impact | | Percent of total |
| Dollar | | Percent | | 2012 | | 2011 |
| Net Sales | | | | | | | | | | | | | | | |
| Europe | $ | 791.4 |
| | $ | 848.9 |
| | $ | (57.5 | ) | | (7)% |
| | 1% |
| | $ | (62.0 | ) | | 31 | % | | 33 | % |
| Asia Pacific | 780.7 |
| | 714.0 |
| | 66.7 |
| | 9 |
| | 12 |
| | (17.1 | ) | | 30 |
| | 27 |
|
| Tupperware North America | 344.8 |
| | 352.0 |
| | (7.2 | ) | | (2 | ) | | — |
| | (7.1 | ) | | 13 |
| | 14 |
|
| Beauty North America | 348.3 |
| | 395.5 |
| | (47.2 | ) | | (12 | ) | | (9 | ) | | (14.3 | ) | | 14 |
| | 15 |
|
| South America | 318.6 |
| | 274.6 |
| | 44.0 |
| | 16 |
| | 29 |
| | (26.8 | ) | | 12 |
| | 11 |
|
| Total net sales | $ | 2,583.8 |
| | $ | 2,585.0 |
| | $ | (1.2 | ) | | — |
| | 5% |
| | $ | (127.3 | ) | | 100 | % | | 100 | % |
| Segment profit | | | | | | | | | | | | | | | |
| Europe | $ | 131.6 |
| | $ | 148.3 |
| | $ | (16.7 | ) | | (11)% |
| | (4)% |
| | $ | (11.2 | ) | | 29 | % | | 34 | % |
| Asia Pacific | 172.7 |
| | 147.0 |
| | 25.7 |
| | 17 |
| | 23 |
| | (6.4 | ) | | 38 |
| | 33 |
|
| Tupperware North America | 63.7 |
| | 58.4 |
| | 5.3 |
| | 9 |
| | 13 |
| | (1.9 | ) | | 14 |
| | 13 |
|
| Beauty North America | 30.2 |
| | 37.9 |
| | (7.7 | ) | | (20 | ) | | (14 | ) | | (2.6 | ) | | 6 |
| | 9 |
|
| South America | 61.0 |
| | 48.6 |
| | 12.4 |
| | 25 |
| | 42 |
| | (5.6 | ) | | 13 |
| | 11 |
|
| Segment profit as a percent of sales |
| Europe | 16.6 | % | | 17.5 | % | | na |
| | (0.9 | )pp | | (0.8 | )pp | | (0.1 | )pp | | na | | na |
| Asia Pacific | 22.1 |
| | 20.6 |
| | na |
| | 1.5 |
| | 1.9 |
| | (0.4 | ) | | na | | na |
| Tupperware North America | 18.5 |
| | 16.6 |
| | na |
| | 1.9 |
| | 2.1 |
| | (0.2 | ) | | na | | na |
| Beauty North America | 8.7 |
| | 9.6 |
| | na |
| | (0.9 | ) | | (0.6 | ) | | (0.3 | ) | | na | | na |
| South America | 19.1 |
| | 17.7 |
| | na |
| | 1.4 |
| | 1.7 |
| | (0.3 | ) | | na | | na |
____________________
Europe
Reported sales decreased7 percent in 2012 compared with 2011. Excluding the impact of foreign currency exchange rates, sales increased 1 percent. The slight improvement was due to a local currency increase in the Company’s established markets, which are composed of Western Europe, including Scandinavia. The increase in these markets was driven by Germany, the largest market in the segment, and Scandinavia, primarily reflecting larger and slightly more productive sales forces, and was partially offset by a decreases at Tupperware France due to lower productivity resulting from the social and political environment in that market in 2012.
Emerging markets accounted for 90, 88$271.7 and 86$298.1 million of reported net sales in this segment in 2012 and 2011, respectively, which represented 34 percent and 35 percent of reported net segment sales. Local currency sales in the emerging markets were about even with 2011. The most significant growth in these markets was in Turkey, due to a larger sales force from improved recruiting and lower turnover, as well as increased activity during significant promotional campaigns. Positive results also came from the Avroy Shlain beauty business in South Africa, reflecting a larger sales force, as well as modest growth in Russia due to greater productivity. This growth was offset by a significant sales decrease in Tupperware South Africa, reflecting a less productive sales force due to the impact on confidence and decrease in sales leadership associated with counterfeit and knocked off product issues, as well as a more challenging consumer spending environment.
For 2012, compared with 2011, segment profit decreased$16.7 million, or 11 percent. Segment profit as a percentage of sales at 16.6 percent decreased 0.9 percentage points from 2011. Excluding the impact of foreign currency exchange rates, segment profit decreased 4 percent. On a local currency basis, the decrease in segment profit primarily reflected the decline in sales in Tupperware France and Tupperware South Africa, lower gross margin due to the impact on cost per unit of low production volume, as well as overall increased operating expenses. These impacts were partially offset by increased profit from higher sales in Germany, Scandinavia and Turkey, as well as a profit increase in Russia due to lower operating costs.
The negative impact of foreign currency rates on the year-over-year comparison of sales and profit for the entire segment was primarily attributable to the weaker euro and South African rand versus the U.S. dollar.
Asia Pacific
Reported sales in Asia Pacific increased 9 percent in 2012, reflecting significant growth by the emerging market businesses. Excluding the impact of foreign currency exchange rates, the segment's sales increased 12 percent. Emerging markets include China, India, Indonesia, Korea, Malaysia/Singapore, the Philippines and Thailand, and accounted for $593.1 million and $511.5 million, or 76 and 72 percent, of the Company’ssales in this segment in 2012 and 2011, respectively. Total emerging market sales increased$81.6 million, or 16 percent, in 2012 compared with 2011. The comparison was negatively impacted by changes in foreign currency exchange rates totaling $16.7 million. Excluding the impact of foreign currencies, these markets' sales increased by 20 percent in 2012, primarily from substantial growth in India, Indonesia and Malaysia/Singapore. India grew primarily from a larger active sales force, in part reflecting continued market penetration into new, densely populated areas. Growth in Indonesia, which is the Company's largest housewares unit, was attributable to continued strength in recruiting and retention resulting from well received sales force activity initiatives and attractive consumer offers. Malaysia/Singapore drove an increased sales force activity rate through strong marketing and merchandising campaigns and successful new product launches.
Reported sales in the established markets decreased7 percent. The impact of changes in foreign currency exchange rates was minimal in the established markets. The more significant decreases in local currency were in Nutrimetics Australia, due to a smaller and less active sales force, and Tupperware Japan, reflecting lower productivity as it continued to shift its product mix toward core housewares categories that, on average, have lower price points than non-core categories.
Total segment profit increased$25.7 million, or 17 percent, in 2012. Segment profit as a percentage of sales at 22.1 percent was higher than 2011 by 1.5 percentage points. The segment profit comparison was negatively impacted by changes in foreign currency, and excluding this impact, segment profit increased 23 percent compared with 2011. The increase was mainly from the improved sales volume in the emerging markets and the leverage these higher sales had on the fixed components of DS&A spending, as well as more efficient promotional spending. These were partially offset by lower profit at Nutrimetics Australia and Tupperware Japan, reflecting the lower sales volume.
The negative impact from foreign currencies on the sales and 99, 96profit comparison of 2012 with 2011 was mainly attributable to the Indian rupee and 94the Indonesian rupiah.
Tupperware North America
Reported sales decreased2 percent in 2012 compared with 2011. Excluding the impact of foreign currency exchange rates, sales were even with the Company’s net segmentprior year, reflecting strong growth in Tupperware Mexico due to a larger sales force. This increase was offset by a decrease at Tupperware United States and Canada, as less promotionally driven recruiting initiatives led to a smaller and less active sales force.
Segment profitincreased$5.3 million, or 9 percent, in 2012 compared with 2011. Segment profit as a percentage of sales at 18.5 percent was 1.9 percentage points higher in 2012 than in 2011. The improvement was primarily in Mexico due to higher sales volume and an improved gross margin from more efficient manufacturing during the year. Notwithstanding the decrease in sales in the United States and Canada, profit in this unit increased slightly due to a higher realized gross margin percentage and less aggressive promotional spending.
Beauty North America
Reported sales for this segment were down 12 percent in 2012. Excluding the impact of foreign currency exchange rates, sales decreased 9%. This decrease was primarily a result of smaller and less active sales forces in both Fuller Mexico, due to higher field manager turnover, and BeautiControl, from higher achievement standards for awards and fewer promotionally driven initiatives compared with 2011.
Segment profit decreased$7.7 million, or 20 percent, in 2012 compared with 2011. Segment profit as a percentage of sales, at 8.7 percent, was 0.9 percentage points lower than 2011. Foreign currency exchange rates negatively impacted the comparison by $2.6 million, or 6 percent. The decrease in profit was largely due to lower sales and a slightly lower gross margin percentage due to promotional pricing of certain products at Fuller Mexico. This was partially offset by value chain improvements at BeautiControl compared with 2011.
South America
Reported sales for this segment increased 16 percent in 2012 compared with 2011. Excluding the impact of changes in foreign currency exchange rates, sales increased 29 percent. The increase was mainly in Brazil and Venezuela. In Brazil, the increase was driven by a larger sales force as a result of strong recruiting programs and less turnover, and higher prices in light of consumer inflation, while in Venezuela, the increase was due primarily to higher prices as well as a larger sales force. The Company estimates that half of the overall local currency sales increase for the segment was due to price increases.
Segment profit increased$12.4 million, or 25 percent, in 2012 compared with 2011. Segment profit as a percentage of sales, at 19.1 percent, was 1.4 percentage points higher than in 2011. Excluding the impact of foreign currency exchange rates, segment profit increased 42 percent. The increase in profit was primarily due to the contribution margin from the significantly higher sales volume and the leverage these higher sales had on the fixed cost components of the value chain.
The Company had expected to implement during 2012, the registration of certain of its independent sales force members under new requirements of the social security system in Brazil. While most of the changes involved in the process were implemented in the fourth quarter of the year, due to changes in some of the governmental regulations and process, the remainder of the implementation is now expected to take place in 2013. While there could be a financial impact to the Company as the result of this change, any adverse impact is not expected to be significant.
The Company uses the "banded" exchange rate of 5.3 to translate the value of the Venezuelan bolivar versus the U.S dollar. There were no changes to this rate in 2012; however, in February 2013, the Venezuelan government set a new official exchange rate of 6.3 bolivars to the U.S. dollar and abolished the banded exchange rate. Venezuela continues to be deemed hyper-inflationary for accounting purposes. As a result, assuming the 6.3 exchange rate is the rate used by the Company and remains in effect for the rest of 2013, the Company estimates it will record expense associated with the devaluation's impact on its net monetary assets and inventory produced and procured prior to the February 2013 devaluation, of $4 million in the first quarter and $1 million in the second quarter of 2013. To illustrate the sensitivity of potential future changes in the exchange rate, if the exchange rate were to further devalue to 18 bolivars to the U.S. dollar as of the beginning of March 2013, the Company estimates there would be an additional negative impact upon translating the value of its net monetary assets and inventory on hand of $10 million in the first quarter of 2013 and $4 million in the second quarter of 2013. In addition, with respect to the translation of the ongoing results of the Company's business in Venezuela, the negative impact on pretax earnings of using the 6.3 rate for the succeeding 12 months is estimated to be between $2 and $3 million, and from a devaluation to 18, an additional $10 million.
As of December 29, 2012, the Company had $17 million in net monetary assets denominated in Venezuelan bolivars, which will be directly impacted by any change in the exchange rate, including $24 million in cash and cash equivalents.
Segment Results 2011 vs. 2010 and 2009, respectively.
Segment Results 2011 vs. 2010
Effective with the first quarter of 2011, the Company changed its segment reporting to reflect the geographic distribution of its businesses in accordance with how it views the operations. Consequently, the Company no longer has a Beauty Other segment, and the businesses previously reported in that segment are now reported as follows: Tupperware Brands Philippines in the Asia Pacific segment; the Company's Central America businesses in the Tupperware North America segment; the Nutrimetics businesses in the Europe and Asia Pacific segments (as applicable); and the businesses in South America as a separate geographic segment. Comparable information from 2010 and 2009 havehas been reclassified to conform with the new presentation.
| | | (Dollars in millions) | 2011 | | 2010 | | Change | | Change excluding the impact of foreign exchange | | Foreign exchange impact | | Percent of total | 2011 | | 2010 | | Change | | Change excluding the impact of foreign exchange | | Foreign exchange impact | | Percent of total |
| Dollar | | Percent | | 2011 | | 2010 | Dollar | | Percent | | 2011 | | 2010 |
| Net Sales | | | | | | | | | | | | | | | | | | | | | | | | | | | | | | |
| Europe | $ | 848.9 |
| | $ | 796.0 |
| | $ | 52.9 |
| | 7% |
| | 3% |
| | $ | 25.3 |
| | 33 | % | | 35 | % | $ | 848.9 |
| | $ | 796.0 |
| | $ | 52.9 |
| | 7 | % | | 3% |
| | $ | 25.3 |
| | 33 | % | | 35 | % |
| Asia Pacific | 714.0 |
| | 584.0 |
| | 130.0 |
| | 22 |
| | 15 |
| | 34.9 |
| | 27 |
| | 25 |
| 714.0 |
| | 584.0 |
| | 130.0 |
| | 22 |
| | 15 |
| | 34.9 |
| | 27 |
| | 25 |
|
| Tupperware North America | 352.0 |
| | 331.5 |
| | 20.5 |
| | 6 |
| | 5 |
| | 3.2 |
| | 14 |
| | 14 |
| 352.0 |
| | 331.5 |
| | 20.5 |
| | 6 |
| | 5 |
| | 3.2 |
| | 14 |
| | 14 |
|
| Beauty North America | 395.5 |
| | 406.0 |
| | (10.5 | ) | | (3 | ) | | (3 | ) | | 3.0 |
| | 15 |
| | 18 |
| 395.5 |
| | 406.0 |
| | (10.5 | ) | | (3 | ) | | (3 | ) | | 3.0 |
| | 15 |
| | 18 |
|
| South America | 274.6 |
| | 182.9 |
| | 91.7 |
| | 50 |
| | 48 |
| | 2.7 |
| | 11 |
| | 8 |
| 274.6 |
| | 182.9 |
| | 91.7 |
| | 50 |
| | 48 |
| | 2.7 |
| | 11 |
| | 8 |
|
| Total net sales | $ | 2,585.0 |
| | $ | 2,300.4 |
| | $ | 284.6 |
| | 12% |
| | 9% |
| | $ | 69.1 |
| | 100 | % | | 100 | % | $ | 2,585.0 |
| | $ | 2,300.4 |
| | $ | 284.6 |
| | 12% |
| | 9% |
| | $ | 69.1 |
| | 100 | % | | 100 | % |
| Segment profit | | | | | | | | | | | | | | | | | | | | | | | | | | | | | | |
| Europe | $ | 148.3 |
| | $ | 147.1 |
| | $ | 1.2 |
| | 1% |
| | (1)% |
| | $ | 3.2 |
| | 34 | % | | 37 | % | $ | 148.3 |
| | $ | 147.1 |
| | $ | 1.2 |
| | 1% |
| | (1)% |
| | $ | 3.2 |
| | 34 | % | | 37 | % |
| Asia Pacific | 147.0 |
| | 111.8 |
| | 35.2 |
| | 31 |
| | 26 |
| | 5.3 |
| | 33 |
| | 28 |
| 147.0 |
| | 111.8 |
| | 35.2 |
| | 31 |
| | 26 |
| | 5.3 |
| | 33 |
| | 28 |
|
| Tupperware North America | 58.4 |
| | 52.8 |
| | 5.6 |
| | 11 |
| | 9 |
| | 0.8 |
| | 13 |
| | 13 |
| 58.4 |
| | 52.8 |
| | 5.6 |
| | 11 |
| | 9 |
| | 0.8 |
| | 13 |
| | 13 |
|
| Beauty North America | 37.9 |
| | 58.9 |
| | (21.0 | ) | | (36 | ) | | (36 | ) | | 0.3 |
| | 9 |
| | 15 |
| 37.9 |
| | 58.9 |
| | (21.0 | ) | | (36 | ) | | (36 | ) | | 0.3 |
| | 9 |
| | 15 |
|
| South America | 48.6 |
| | 24.4 |
| | 24.2 |
| | 99 |
| | 92 |
| | 0.9 |
| | 11 |
| | 6 |
| 48.6 |
| | 24.4 |
| | 24.2 |
| | 99 |
| | 92 |
| | 0.9 |
| | 11 |
| | 6 |
|
| Segment profit as a percentage of sales | | | | | | | | | | | | | | | | |
| Segment profit as a percent of sales | | Segment profit as a percent of sales |
| Europe | 17.5 | % | | 18.5 | % | | na |
| | (1.0 | )pp | | (1.2 | )pp | | 0.2 | pp | | na | | na | 17.5 | % | | 18.5 | % | | na |
| | (1.0 | )pp | | (0.8 | )pp | | (0.2 | )pp | | na | | na |
| Asia Pacific | 20.6 |
| | 19.1 |
| | na |
| | 1.5 |
| | 1.7 |
| | (0.2 | ) | | na | | na | 20.6 |
| | 19.1 |
| | na |
| | 1.5 |
| | 1.7 |
| | (0.2 | ) | | na | | na |
| Tupperware North America | 16.6 |
| | 15.9 |
| | na |
| | 0.7 |
| | 0.6 |
| | 0.1 |
| | na | | na | 16.6 |
| | 15.9 |
| | na |
| | 0.7 |
| | 0.6 |
| | 0.1 |
| | na | | na |
| Beauty North America | 9.6 |
| | 14.5 |
| | na |
| | (4.9 | ) | | (4.9 | ) | | — |
| | na | | na | 9.6 |
| | 14.5 |
| | na |
| | (4.9 | ) | | (4.9 | ) | | — |
| | na | | na |
| South America | 17.7 |
| | 13.3 |
| | na |
| | 4.4 |
| | 4.1 |
| | 0.3 |
| | na | | na | 17.7 |
| | 13.3 |
| | na |
| | 4.4 |
| | 4.1 |
| | 0.3 |
| | na | | na |
____________________
| |
+ | Increase is greater than 100 percent |
Europe
Reported sales increased 7 percent in 2011 compared with 2010.2011. Excluding the impact of foreign currency exchange rates, sales increased 3 percent.percent. The improvement was due to a slight local currency improvement in the Company’s emerging markets and modest local currency growth in the established markets, which are composed of Western Europe, including Scandinavia.markets. Emerging markets accounted for $298.1$298.1 and $292.3$292.3 million of reported net sales in this segment in 2011 and 2010,, respectively, which represented 35 percent and 37 percent of reported net segment sales. The impact of changes in foreign currency exchange rates was minimal in the emerging markets. The improvement in emerging markets came from significant growth in Turkey, as well as strong growth in the Avroy Shlain, beauty business in South Africa, due to a larger and more active sales forces in those markets. This growth was offset by a significant sales decrease in Russia, resulting from a decline in consumer spending power and a smaller sales force with lower activity. Sales by the Tupperware South Africa unit were up modestly for the full year, although down in the fourth quarter, after several years of robust growth. The lower sales in the fourth quarter reflected a less favorable reaction to the holiday promotional program than in 2010, including a lower number of active sellers. The unit is working to increasesellers as a result of lower confidence in light of counterfeit and knocked-off product activity in the number of sales force leaders promoting other sales force leaders that if successful would lead to a larger sales force size and sales growth.country.
The established markets’ increase in reported sales, compared with 2010,, was driven by Tupperware France, Germany, the largest market in the segment, and Italy, reflecting larger and more productive sales forces resulting from a continued focus on recruiting, pay for performance under sales force compensation and incentive programs, sales force leadership development and training in these markets. These results were partially offset by decreases in Austria and Tupperware Greece, primarily from less productive sales forces. In Greece particularly, there iswas an impact of lower consumer spending in light of the difficult economic environment.
For 2011,, compared with 2010,, segment profit increased$1.2 $1.2 million, or 1 percent.percent. Segment profit as a percentage of sales of 17.5 percent decreased 1 percentage point from 2010.2010. The higher segment profit was due to the positive impact of foreign currency exchange rates. On a local currency basis, segment profit was down slightly due to elevated promotional spending in Italy that resulted in a significant sales increase, but at a much higher than normal cost, as well as a lower gross margin from a variation in sales mix. The decreases were partially offset by the benefit of not having the $7.6 million of out-of-period amounts recorded in Russia in 2010.
The year-over-year comparison on sales and profit for the entire segment was positively impacted by foreign currency rates, primarily a stronger euro versus the U.S. dollar.
Asia Pacific
Asia Pacific achieved significant growth in 2011 with a 22 percent increase in reported sales, largely reflecting increases by the businesses in emerging markets in this segment. Excluding the impact of foreign currency exchange rates, sales increased 15 percent.percent. Emerging markets include China, Korea, India, Indonesia, Malaysia/Singapore, the Philippines and Thailand, and accounted for $511.5$511.5 million and $384.6$384.6 million, or 72 and 66 percent,, of the sales in this segment in 2011 and 2010,, respectively. Total emerging market sales increased$126.9 $126.9 million, or 33 percent,, in 2011 compared with 2010.2010. The comparison was positively impacted by changes in foreign currency exchange rates totaling $12.7$12.7 million. Excluding the impact of foreign currencies, these markets increased by 29 percent in 2011,, compared with 2010.2010. This result was from larger, more active sales forces, reflecting strong recruiting, training and retention, attractive consumer offers and successful promotional activities.
Reported sales in the established markets increased 2 percent.percent. Excluding the impacts of foreign currency exchange rates, the established markets decreased by 9 percent compared with 2010.2010. The more significant decreases in local currency were in the Tupperware and Nutrimetics businesses in Australia and the Tupperware business in Japan, largely due to smaller and less active sales forces in light of continued difficult consumer spending environments in these markets.
Total segment profit increased$35.2 $35.2 million, or 31 percent,, in 2011 compared with 2010.2010. Segment profit as a percentage of sales at 20.6 percent was higher than 2010 by 1.5 percentage points. The segment profit comparison was positively impacted by changes in foreign currency, and excluding this impact, segment profit increased 26 percent compared with 2010.2010. This was mainly due to improved sales volume in the emerging market units, as well as an improved gross margin percentage, reflecting the leverage on fixed costs from the higher sales volume, lower inventory obsolescence, changes in estimates of certain non-income tax costs and a more favorable product mix. There was also leverage from the higher sales on the fixed components of DS&A spending. This was partially offset with higher marketing expenses for continued brand building initiatives.
The positive impact from foreign currencies on the sales and profit comparison of 2011 with 2010 was mainly attributable to the Australian dollar, the Indonesian rupiah and the Malaysian ringgit.
Tupperware North America
Reported sales increased 6 percent in 2011 compared with 2010.2010. Excluding the impact of foreign currency exchange rates, sales increased 5 percent.percent. The modest increase came primarily from growth in core sales by both Tupperware Mexico and the United States and Canada, primarily reflecting a larger sales force in Mexico and higher active sales forces in both units. Tupperware Mexico also overcame $5.2 million less business-to-business sales than in 2010, primarily in the first quarter. While the Company actively pursues business-to-business opportunities, sales from this channel are based on reaching agreements with business partners and their product needs, along with consideration of how the arrangements will be integrated with the Company’s primary sales channel. Consequently, activity in one period may not be indicative of future trends.2010.
Segment profit increased$5.6 $5.6 million, or 11 percent,, in 2011 compared with 2010.2010. Segment profit as a percentage of sales at 16.6 percent was 0.7 percentage points higher in 2011 than in 2010.2010. The improvement was primarily from the higher sales volume in Mexico and lower inventory obsolescence, along with a mix benefit toward core consumer sales by that unit, as consumer sales hadhave a higher gross margin. These improvements were partially offset by a lower profit by the United States and Canada unit due to a lower gross margin and planned investments to activate the sales force and drive sales growth.
Beauty North America
Reported sales for this segment were down 3 percent in 2011 compared with 2010,, primarily reflecting lower sales by BeautiControl North America where there was a smaller and less active sales force. The impact of foreign currency exchange rates on the comparison was minimal. Fuller Mexico was also down slightly.
Segment profit decreased$21.0 $21.0 million, or 36.036 percent,, in 2011 compared with 2010.2010. Segment profit as a percentage of sales, at 9.6 percent,, was 4.9 percentage points lower than 2010.2010. The impact of foreign currency exchange rates on the comparison was minimal. The decrease in profit was largely due to lower sales with lower margins due to increased product costs at both BeautiControl and Fuller Mexico. Both units also made significant promotional investments for sales force recruiting and activation initiatives during the year that did not translate into incremental sales.
South America
Reported sales for this segment increased 50 percent in 2011 compared with 2010.2010. Excluding the impact of foreign currency exchange rates, sales increased 48 percent.percent. The increase was mainly in Tupperware Brazil driven by a larger sales force from strong recruiting, sales force activation and higher productivity. Also contributing to the segment sales increase was Venezuela due to higher pricing reflecting inflation and a modest increase in the size and activity of the sales force, as well as Uruguay and Argentina due to higher pricing in line with inflation. The Company estimates that one-third of the overall local currency sales increase by the segment was from price increases.
Segment profit increased$24.2 $24.2 million, or 99 percent,, in 2011 compared with 2010.2010. Segment profit as a percentage of sales, at 17.7 percent,, was 4.4 percentage points higher than 2010.2010. The impact of foreign currency exchange rates on the comparison was minimal. The increase in profit mainly reflected higher sales volume in Brazil and, to a lesser extent, in Venezuela, as well as more efficient promotional spending and leverage from the higher sales on the fixed components of DS&A spending.
The Company began translating Venezuelan sales and profit results at the "parallel rate" as of the beginning of 2010. In May 2010, the Venezuelan government closed the use of the parallel rate, and consequently, this rate was no longer available and could not be used to translate the results from Venezuela. In June 2010, several large Venezuelan commercial banks began operating the Transaction System for Foreign Currency Denominated Securities (SITME), which established a new “banded” exchange rate. As the Company believed this would be the primary rate at which it would settle its non-bolivar denominated liabilities and repatriate dividends, it began translating its bolivar denominated transactions and balances at this rate beginning in June 2010.
As of the beginning of 2010, Venezuela was determined to be highly inflationary. Gains and losses from translation of the financial statements of subsidiaries operating in highly inflationary economies are recorded in earnings. The impact of the changes in the value of the Venezuelan bolivar versus the U.S. dollar on earnings in 2010 was not significant. As of December 31, 2011, the Company had $13 million in net monetary assets denominated in Venezuelan bolivars, which would be directly impacted by any change in the exchange rate, including $19 million in cash and cash equivalents. If the exchange rate in Venezuela were to change to the rate used in May 2010, before the government closed the use of the parallel rate, the Company estimates the negative impact on its 2012 pretax earnings would be $13 million, which includes a $5 million impact related to the $13 million bolivar net asset position.
Segment Results 2010 vs. 2009
|
| | | | | | | | | | | | | | | | | | | | | | | | | | | |
| (Dollars in millions) | 2010 | | 2009 | | Change | | Change excluding the impact of foreign exchange | | Foreign exchange impact | | Percent of total |
| Dollar | | Percent | | 2010 | | 2009 |
| Net Sales | | | | | | | | | | | | | | | |
| Europe | $ | 796.0 |
| | $ | 768.9 |
| | $ | 27.1 |
| | 4 | % | | 4% |
| | $ | (6.9 | ) | | 35 | % | | 36 | % |
| Asia Pacific | 584.0 |
| | 494.0 |
| | 90.0 |
| | 18 |
| | 8 |
| | 44.8 |
| | 25 |
| | 23 |
|
| Tupperware North America | 331.5 |
| | 296.9 |
| | 34.6 |
| | 12 |
| | 8 |
| | 10.0 |
| | 14 |
| | 14 |
|
| Beauty North America | 406.0 |
| | 391.6 |
| | 14.4 |
| | 4 |
| | (1 | ) | | 19.8 |
| | 18 |
| | 18 |
|
| South America | 182.9 |
| | 176.1 |
| | 6.8 |
| | 4 |
| | 28 |
| | (32.8 | ) | | 8 |
| | 9 |
|
| Total net sales | $ | 2,300.4 |
| | $ | 2,127.5 |
| | $ | 172.9 |
| | 8% |
| | 6% |
| | $ | 34.9 |
| | 100 | % | | 100 | % |
| Segment profit | | | | | | | | | | | | | | | |
| Europe | $ | 147.1 |
| | $ | 141.8 |
| | $ | 5.3 |
| | 4% |
| | 3% |
| | $ | 1.5 |
| | 37 | % | | 43 | % |
| Asia Pacific | 111.8 |
| | 84.9 |
| | 26.9 |
| | 32 |
| | 20 |
| | 8.6 |
| | 28 |
| | 25 |
|
| Tupperware North America | 52.8 |
| | 40.3 |
| | 12.5 |
| | 31 |
| | 26 |
| | 1.6 |
| | 14 |
| | 12 |
|
| Beauty North America | 58.9 |
| | 52.2 |
| | 6.7 |
| | 13 |
| | 5 |
| | 3.8 |
| | 15 |
| | 16 |
|
| South America | 24.4 |
| | 12.7 |
| | 11.7 |
| | 92 |
| | + | | (7.4 | ) | | 6 |
| | 4 |
|
| Segment profit as a percentage of sales | | | | | | | | | | | | | | | |
| Europe | 18.5 | % | | 18.4 | % | | na |
| | 0.1 | pp | | (0.3 | )pp | | 0.4 | pp | | na | | na |
| Asia Pacific | 19.1 |
| | 17.2 |
| | na |
| | 1.9 |
| | 1.8 |
| | 0.1 |
| | na | | na |
| Tupperware North America | 15.9 |
| | 13.6 |
| | na |
| | 2.3 |
| | 2.3 |
| | — |
| | na | | na |
| Beauty North America | 14.5 |
| | 13.3 |
| | na |
| | 1.2 |
| | 0.9 |
| | 0.3 |
| | na | | na |
| South America | 13.3 |
| | 7.2 |
| | na |
| | 6.1 |
| | 9.6 |
| | (3.5 | ) | | na | | na |
____________________
| |
+ | Increase is greater than 100 percent |
Europe
Reported sales increased 4 percent in 2010 compared with 2009. The improvement was largely due to continued success in the emerging markets, as well as a modest improvement in local currency sales in the Company’s established markets. Emerging markets accounted for $292.3 and $259.6 million of reported net sales in this segment in 2010 and 2009, respectively, which represented 37 percent and 34 percent of reported net segment sales. Total emerging market sales were positively impacted by changes in foreign currency exchange rates totaling $15.4 million. Excluding the impact of foreign currencies, these markets increased by 6 percent in 2010, compared with 2009. The improvement in emerging markets was driven by significant sales growth in Tupperware South Africa and Turkey, resulting from larger, more productive sales forces. This growth was offset by a significant sales decrease in Russia, resulting from a decline in consumer spending power and lower sales force activity.
The established markets’ modest increase in local currency sales, compared with 2009, reflected a continuation of significant growth in Tupperware France and Austria, driven by a strong improvement in recruiting and sales force size. These results were partially offset by a substantial decrease in sales in the Tupperware and Nutrimetics businesses in Greece, as a result of ongoing economic turmoil in that country, and a slight decrease in Germany. The Company continues to focus on recruiting, sales force leadership development, training and activity in Germany.
For 2010, compared with 2009, segment profit increased $5.3 million, or 4 percent. Segment profit as a percentage of sales was about even with 2009 at 18.5 percent. The higher segment profit was mainly due to the modest growth in sales. Segment profit was negatively impacted by the out-of-period amounts recorded in Russia in 2010.
The year-over-year comparison on sales for the entire segment was negatively impacted by foreign currency rates, primarily driven by a weaker euro versus the U.S. dollar. The segment profit comparison was positively impacted by changes in foreign currency rates, primarily driven by a stronger South African rand versus the U.S. dollar.
Asia Pacific
Asia Pacific achieved strong growth in 2010 with an 18 percent increase in reported sales from improvements in the emerging markets in this segment. Excluding the impact of foreign currency exchange rates sales increased 8 percent. Emerging markets accounted for $384.6 million and $282.2 million, or 66 and 57 percent, of the sales in this segment for 2010 and 2009, respectively. Total emerging market sales increased $102.4 million, or 36 percent, in 2010 compared with 2009, and the comparison was positively impacted by changes in foreign currency exchange rates totaling $21.5 million. Excluding the impact of foreign currencies, these markets increased by 27 percent in 2010, compared with 2009. This result was from larger, more active sales forces, reflecting strong recruiting, training and retention, attractive consumer offers and successful promotional activities.
The strong growth experienced in the emerging markets was partially offset by a significant decline in local currency sales in the established markets. The decline was the result of lower average active sales forces compared with 2009.
Total segment profit increased $26.9 million, or 32 percent, in 2010 compared with 2009. Segment profit as a percentage of sales, at 19.1 percent, was higher than 2009 by 1.9 percentage points. The segment profit comparison with 2009 was positively impacted by changes in foreign currency and excluding the impact of foreign currency, segment profit increased 20 percent compared with 2009. This was mainly due to improved sales volume in the emerging markets, as well as an improved gross margin percentage reflecting the leverage on fixed costs from the higher sales volume and a more favorable product mix. The margin also improved in Indonesia as the market sourced a greater proportion of its product needs locally in 2010 at a lower cost. There was also leverage from the higher sales on the fixed components of DS&A spending. This was partially offset with higher marketing expenses for continued brand building initiatives.
The positive impact from foreign currencies on the sales and profit comparison of 2010 with 2009 was mainly attributable to the Australian dollar, the Indonesian rupiah and the Malaysian ringgit.
Tupperware North America
Reported sales increased 12 percent in 2010 compared with 2009. Excluding the impact of foreign currency exchange rates, sales increased 8 percent. The increase in the segment was primarily from strong core sales growth by Tupperware Mexico, reflecting a higher average active sales force. The United States and Canada business was up slightly in local currency sales in 2010 reflecting a larger sales force compared with 2009. Tupperware Mexico also had $3.9 million more business-to-business sales than in 2009, primarily in the first quarter.
Segment profit increased $12.5 million, or 31 percent, in 2010 compared with 2009. Segment profit as a percentage of sales, at 15.9 percent, was 2.3 percentage points higher in 2010 than 2009. The improvement was from higher sales in the segment, along with more efficient promotional and marketing spending and lower bad debt expense. These improvements were partially offset by a lower gross margin in the segment reflecting promotional pricing decisions and a lower margin on the business-to-business sales that also accounted for a greater share of sales in 2010 compared with 2009.
Beauty North America
Reported sales for this segment increased 4 percent in 2010 compared with 2009. Excluding the impact of foreign currency exchange rates sales were down 1 percent, reflecting lower sales by BeautiControl North America, where there was a smaller sales force during the year. The decline in sales at BeautiControl North America was partially offset by a slight increase in sales at Fuller Mexico, reflecting a slight improvement in sales force size compared with 2009.
Segment profit increased $6.7 million, or 13 percent, in 2010 compared with 2009. The year-over-year comparison was positively impacted by $3.8 million from a stronger Mexican peso versus the U.S. dollar. Excluding the positive impact of foreign currency on the comparison, the segment achieved a 5 percent increase in profit. Segment profit as a percentage of sales, at 14.5 percent, was 1.2 percentage points higher than 2009. The overall local currency improvement in segment profit mainly reflected a value chain improvement implemented in the second half of 2009, as well as lower costs at Fuller Mexico, from the absence of certain incentives offered in 2009, lower promotion expenses in BeautiControl from less sales force members qualifying for events, and promotional gift and cost savings at BeautiControl from re-engineering plans implemented in 2009. These cost savings were partially offset by investments made by the Company to support the BeautiControl sales force in its transition to operating under a new compensation plan, and initiatives implemented in the first half of 2010 by Fuller Mexico to improve sales force recruiting.
South America
Reported sales for this segment increased 4 percent in 2010 compared with 2009. Excluding the impact of foreign currency exchange rates, sales increased 28 percent. The increase was mainly in Tupperware Brazil, the result of a larger sales force from strong recruiting and training, and higher productivity. Also contributing to the segment sales increase was Argentina due to higher pricing reflecting inflation; Uruguay, reflecting a higher sales per order; and Venezuela, due to higher pricing in line with inflation.
Segment profit increased in 2010, mainly reflecting the higher sales volume in Brazil, Uruguay and Venezuela, as well as more efficient promotional spending and leverage from the higher sales on the fixed components of DS&A spending. In 2009, the Company recorded $8.4 million in pre-tax foreign exchange losses resulting from converting Venezuelan bolivars to U.S dollars at a less favorable rate than had been recorded on the balance sheet, and remeasuring non-Venezuelan bolivar denominated balances at the end of 2009, as the Company began translating on December 26, 2009 the Venezuela operations at the parallel rate. These costs did not recur in 2010.
As described above, the Company discontinued use of the official exchange rate in December of 2009, and this had a negative translation impact on its year-over-year sales and profit comparison totaling $39.1 million and $8.7 million, respectively.
As noted above, the change in the value of the Venezuelan bolivar had a negative impact on the sales and profit comparison for the segment, which was partially offset by a stronger Brazilian real.
Financial Condition
Liquidity and Capital Resources
Net working capital was $94.072.0 million as of December 29, 2012, compared with $96.0 million as of December 31, 2011, compared with and $348.8 million as of December 25, 2010 and $236.3 million as of December 26, 2009. The current ratio was 1.1 to 1 at the end of 2012 and 2011, and 1.7 to 1 at the end of 2010 and 1.5 to 1 at the end of 2009.
The most significant component in the Company’s $24 million reduction in net working capital in 2012 was $18 million less cash and cash equivalents, which together with cash flow from operating activities, was the main source of funding the cash outflow during the year for investing activities, dividends and share repurchases. While both inventory and accounts receivable increased modestly, this was largely offset by an increase in accrued liabilities, including accrued compensation related to management incentives.
The Company’s net working capital decreased as of the end of 2011 compared with 2010,, primarily reflecting a lower level of cash as of the end of 2011 and borrowings under its revolving credit facility, both of which were used to repurchase shares. There was also an impact from a reduction in receivables, reflecting the timing of collections around the Company's fiscal year-end. There was a partial offset from a higher level of inventory to support a higher level of sales generally, along with more specific instances where inventory was increased in units to enable a better level of service to customers and in light of sales below expectations. There was also an increase in deferred tax assets and a decrease in accrued liabilities, largely from lower income taxes payable due to the timing of the Company's tax liabilitypayments around year end.
The higher net working capital as of the end 2010, compared with 2009, reflected a higher level of cash resulting both from the Company’s favorable operating results and cash flow. The Company also generated significant cash flow in 2009, but used a portion of that cash to prepay $140 million of term loans, while there were no such prepayments in 2010. The increase in net working capital was also impacted by a higher inventory level, reflecting the need to support a higher level of sales, partially offset by higher accounts payable, reflecting the timing of payments around the Company’s fiscal year in 2010 compared with 2009, as well as higher accrued compensation and commissions resulting from the favorable sales and operating results.
On June 2, 2011, the Company completed the sale of $400 million in aggregate principal amount of 4.750% Senior Notes due June 1, 2021 (the “Senior Notes”) at an issue price of 98.989%, as well as entered into a new $450 million multicurrency revolving Credit Agreement (the “Credit Agreement”). The proceeds were used to repay all of the Company's $405 million outstanding term loans outstanding under the Company's previous credit facility from September 2007 ("Old Credit Facility"), which was terminated on the same date. The Company's wholly-owned subsidiary, Dart Industries Inc. (the “Guarantor”), has granted a security interest for the Senior Notes andCompany is permitted to request, on up to three separate occasions, an increase to its borrowing capacity under the Credit Agreement by up to $200 million in certain "Tupperware" trademarks and service marks owned by the Guarantor.aggregate (for a maximum aggregate Facility Amount of $650 million).
Loans made under the revolving credit facility bear interest under a formula that includes, at the Company's option, one of three different base rates. The Company generally selects the London interbank offered rate ("LIBOR") for the applicable currency and interest period as its base for its interest rate. As provided in the credit facility, a margin is added to the base. The applicable margin is determined by reference to a pricing schedule based upon the ratio (the “Consolidated Leverage Ratio”) of the consolidated funded indebtedness of the Company and its subsidiaries to the consolidated EBITDA (as defined in the Credit Agreement) of the Company and its subsidiaries for the four (4) fiscal quarters then most recently ended. As of December 31, 201129, 2012, the Company had $192.3 million of euro-denominated borrowings outstanding under its Credit Agreement which dictated a base rate spread of 150 basis points, andwhich gave the Company a weighted average interest rate of 2.92.03 percent on$199.0 million of total borrowings under the Credit Agreement.Agreement, of which $162 million was denominated in euros. The Company routinely increases its revolver borrowings under the Credit Agreement during each quarter to fund operationsoperating, investing and financing activities and uses cash available at the end of the periodeach quarter to reduce borrowing levels. As a result, the Company has higher foreign exchange exposure on the value of its cash during each quarter than at the end of each quarter.
The Credit Agreement contains customary covenants, including financial covenants requiring minimum interest coverage and allowing a maximum amount of leverage. As of December 31, 201129, 2012, the Company had, and currently has, considerable leeway under its financial covenants. However, economic conditions, adverse changes in foreign exchange rates, lower than foreseen sales and profit or the occurrence of other events discussed under “Forward Looking Statements” and elsewhere could cause noncompliance.
The interest rate charged on outstanding borrowings under the Old Credit Facility was based on a floating LIBOR base rate plus an applicable margin. Although the Old Credit Facility was a floating rate instrument, the Company was required to maintain at least 40 percent of outstanding term loans at fixed rates, which was achieved through the use of interest rate swaps. The Old Credit Facility dictated a contractual spread of 62.5 basis points and combined with the swap agreements, gave the Company an all-in effective rate of about 4.5 percent on the $405 million borrowings in 2011 through their repayment. In connection with the repayment of the borrowings under the Old Credit Facility, the related interest rate swaps became ineffective, which resulted in a reclassification of $18.9 million from other comprehensive loss to interest expense in the second quarter of 2011.
The Company monitors the financial stability of third-party depository institutions that hold its cash and cash equivalents and diversifies its cash and cash equivalents among counterparties, which minimizes exposure to any one of these entities. Furthermore, the Company is exposed to financial market risk resulting from changes in interest rates, foreign currency rates and the possible liquidity and credit risks of its counterparties. The Company believes that it has sufficient liquidity to fund its working capital and capital spending needs and its current dividend. This liquidity includes its year-end 20112012 cash and cash equivalents balance of $138.2119.8 million, cash flows from operating activities, and access to its $450 million Credit Agreement. As of December 31, 201129, 2012, the Company had $254.6247.9 million available under its Credit Agreement and $105.385.6 million available under other uncommitted lines of credit. The Company has not experienced any limitations on its ability to access its committed facility. On February 1, 2013, in conjunction with executing its planned 2013 share repurchase program, the Company entered into a 90-day $75 million promissory note with the same interest rate and covenant terms as under its $450 million Credit Agreement. The Company expects to make further changes to its financing arrangements in 2013 in order to fund its investing and financing activities.
Cash and cash equivalents (“cash”) totaled $138.2119.8 million as of December 31, 201129, 2012. Of this amount, $135$118.7 million was held by foreign subsidiaries. Approximately 6050 percent of thisthe cash held outside of the United States was not eligible for repatriation due to the level of past statutory earnings by the foreign unit in which the cash was held.held or other local restrictions. The remaining cash is subject to repatriation tax effects. The Company's current intent is to indefinitely reinvest these funds in its foreign operations, as it does not anticipate needing them in the United States.cash is needed to fund on-going operations. In the event circumstances change, leading to the conclusion that these funds will not be indefinitely reinvested, the Company would need to provide at that time for the income taxes that would be triggered upon their repatriation.
The Company’s two debt ratings agencies, Standard and Poor’s and Moody’s, have both rated the Company. Standard and Poor’s currently has a corporate credit rating on the Company of BBB- and has assigned a stable outlook. Moody’s assigns a rating of Baa3 with a stable outlookmost significant foreign currency exposures are to the corporate family rating of the Company.
euro, Indonesian rupiah and Mexican peso. Business units in which the Company generated at least $100 million of sales in 20112012 included Brazil, Tupperware France, Fuller Mexico, Germany, Indonesia, Malaysia/Singapore, Tupperware Mexico and Tupperware United States and Canada. A significant downturn in the Company’s business in these marketsunits would adversely impact the Company’sits ability to generate operating cash flows. Operating cash flows would also be adversely impacted by significant difficulties in the recruitment, retention and activity of the Company’s independent sales force or the success of new products and/or promotional programs.
On December 11, 2007, the Company experienced a fire at its Hemingway, SC facility, causing the complete destruction of its main finished goods warehouse and its contents. In 2009, the Company finalized its claim with its insurance companies and received a total of $18.9 million in proceeds during the year, bringing the total settlement to $61.5 million to recover the value of destroyed inventory; property, plant and equipment; and costs associated with recovering from the fire, resulting in $19.0 million in pretax gains related to the fire recorded in 2009. In 2009, the Company included in its Consolidated Statement of Cash Flows, $18.9 million in proceeds in investing activities, as they related to property, plant and equipment. The Company netted, in 2009, $8.2 million of proceeds against capital expenditures, as these proceeds represented a direct reimbursement of costs associated with rebuilding the distribution capability of the Hemingway facility.
Operating Activities
Net cash provided by operating activities in 20112012 was $274.7298.7 million, compared with $299.5274.7 million in 20102011. Net income before the impacts of non-cash charges for goodwill and intangible assets and gains on disposal of assets in both periods, reclassification of cumulative translation adjustments into operating income in 2012 and non-cash interest swap impairments in 2011, was $8 million higher in 2012 than 2011. Other more significant factors impacting the year-over-year comparison of cash flow from operating activities were a smaller increase in inventory due to success in managing to a lower number of days on hand, and offsetting effects in the comparison of trade receivables and accounts payable and accruals associated with the Company's fiscal year ending before the end of the calendar month of December in 2012 but not in 2011.
Net cash provided by operating activities in 2011 was $274.7 million, compared with $299.5 million in 2010. The decrease in operating cash flow in 2011,, notwithstanding a $44$44.0 million increase in net income excluding the non-cash impairment charges, primarily reflected the timing of distributions for payables and accruals around the beginning of each year and in light ofresulting from the inclusion of a 53rdextra week in fiscal 2011 that caused a shift in the Company's calendar at year end.2011. Inventory levels also increased during 2011 due to purchases to support higher sales and customer service levels in certain markets and in light of sales below forecast in other markets.
Net cash provided by operating activities increased to $299.5 million in 2010 from $250.9 million in 2009, reflecting the increase in net income for 2010, compared with 2009. Also contributing to the increase was a higher inflow from accounts payable and accrued liabilities resulting mainly from the timing of payments made at the end of the Company’s 2010 fiscal year compared with 2009, partially offset by an outflow from a higher level of inventory in 2010 versus a small reduction in 2009, and a cash outflow to settle foreign currency hedge contracts in 2010, compared with an inflow in 2009.
Insurance proceeds in 2011 included $3.0 million in recoveries, net of expenses, from flood damage in Australia.
Investing Activities
In 20112012, 20102011 and 20092010, the Company spent $73.975.6 million, $56.173.9 million and $46.456.1 million, respectively, for capital expenditures. The most significant type of spending in all years was for molds for new products, with the greatest amount spent in Europe, and capital expenditures related to automobiles purchasedvehicles for the sales force. In 2012, capital was also invested in the purchase of a new office in Venezuela for $6 million to support expanding operations and as a natural hedge against possible currency devaluation, the expansion of warehouse and office space in Indonesia for $8 million, as well as $17 million for manufacturing capacity in India, Brazil and various other operations. In 2011, the Company also spent capital for molding machinery and increasing warehouse and manufacturing capacity in South Africa, India and Brazil. In 2010, the Company also spent capital on molding machines and outfitting a new leased manufacturing facility in India. In 2009, the Company also had road costs related to the Orlando property and spent $8.2 million to improve the distribution capability at the Company’s Hemingway facility in South Carolina, following the 2007 destruction of its main finished goods warehouse at that facility. The cost of this project was reimbursed by insurance proceeds and is shown net in the Consolidated Statement of Cash Flows.
Partially offsetting the capital spending were $5.010.8 million, $10.05.0 million and $19.510.0 million of proceeds related to the sale of certain property, plant and equipment and insurance recoveries in 20112012, 20102011 and 20092010, respectively. In 2011, theseall years, there were proceeds were primarily fromrelated to the sale of automobilesvehicles that had been purchased for the sales force. Another significant source of proceeds in markets where the Company purchases vehicles as incentive awards to some of its sales force members as well as2012 was the sale of land held for development near the Company's headquarters in Orlando, Florida. In both 2010 and 2009, proceeds resulted from the sale of excess property in Australia and the sale of automobiles. In 2009, there were also proceeds from the sale of the Company’s formeran old manufacturing facility in Halls, Tennessee.Belgium.
Insurance proceeds in 2009 included recoveries from the fire in South Carolina. See Note 16 to the Consolidated Financial Statements.29
Financing Activities
In 20112012, the Company made net payments on borrowings of $14.12.3 million, mainly related to its scheduled lease payments. The Company also had a net inflow of $6.0 million from increased borrowings under its Credit Agreement. In 2011, the Company made net payments on long-term borrowings of $14.1 million in connection with the issuance of the Senior Notes and termination of the Old Credit Facility, as well as scheduled lease payments. The Company also had a net inflow of $193.5$193.5 million from borrowings under its new Credit Agreement. In 2010, the Company made $2.0 million in net payments to reduce borrowings, mainly related to its capital lease obligations. In 2009, the Company made $143.7 million in net debt payments, mainly relating to voluntary prepayments on its term loans of $140 million.
Dividends
During 20112012, 20102011 and 20092010, the Company paid dividends of $1.201.44, $1.001.20, and $0.881.00 per share of common stock, respectively, totaling $73.877.6 million, $63.273.8 million and $55.063.2 million, respectively. In October 2009, the Board of Directors declared a quarterly dividend that was increased to $0.25 per share from the $0.22 per share that had been declared and paid each quarter since the Company became public in 1996. In November 2010, the Board of Directors further increased the quarterly dividend declared to $0.30 per share.
TheGoing forward, the Company expects its Board of Directors to evaluate its dividend rate annually with its declaration in the first quarter of each year, beginningyear. In the first quarters of 2013 and 2012, the Board increased the regular quarterly dividend per share by 72 percent, to $0.62 in 2013 and 20 percent to $0.36 in 2012. As a result, subsequent to year-end 2011,It also increased the Board of Directors declared an increasedregular quarterly dividend of $0.36by 20 percent to $0.30 per share beginning with the paymentits declaration in April 2012.November 2010. The payment of a dividend on common shares is a discretionary decision and subject to a significant event that would require cash, the ability to continue to comply with debt covenants, cash needed to finance operations, making necessary investments in the future growth of the business, required or discretionary debt repayment obligations or other cash needs. If there is an event requiring the use of cash, such as a strategic acquisition, the Company would need to reevaluate whether to maintain its dividend payout.
Stock Option Exercises
During 20112012, 20102011 and 20092010, the Company received proceeds of $16.112.9 million, $16.816.1 million and $39.416.8 million, respectively, related to the exercise of stock options. The higher amount of stock option proceeds during 2009 was due primarily to an increase in the Company's stock price and the holders' decisions to exercise, including how long before the expirationcorresponding shares were issued out of the options' 10-year terms. In 2011 and 2010, the Company issued stock from treasury shares when stock options were exercised. In 2009, until the third quarter when it began repurchasing shares, the Company used previously unissued shares.Company’s balance held in treasury.
Stock Repurchases
The Company's Board of Directors increased its existing share repurchase authorization in February 2010 to allow open market repurchases with an aggregate cost of up to $350 million until February 1, 2015. The Company expected, at that time, to use proceeds from stock option exercises and excess cash generated by the business to offset dilution associated with the Company's equity incentive plans, with the intention of keeping the number of shares outstanding at about 63 million. In 2011, the Company's board increased the share repurchase authorization on two occasions to a total of $1.2 billion. In January 2013, the Board further increased the share repurchase authorization by $250$800 million to $600 million in January$2 billion and extended the term of the authorization by an additional $600 million in Octobertwo years to $1.2 billion.February 1, 2017. Going forward, in setting share repurchase amounts, the Company expects to target over time a debt-to-EBITDA ratio of 1.5x1.75 times consolidated funded debt (as defined in the Company's Credit Agreement)., which is an increase of a quarter point from its previous target leverage ratio of 1.5 times consolidated funded debt, as targeted since 2011.
During 20112012, 20102011 and 20092010 the Company repurchased in the open market 7.13.3 million, 1.37.1 million and 1.81.3 million shares under this program at an aggregate cost of $426.1200.0 million, $60.3426.1 million and $77.060.3 million, respectively. Since inception of the program in May 2007, and through December 31, 201129, 2012, the Company hashad repurchased 12.215.5 million shares at an aggregate cost of $627.7827.7 million.
The Company has received, from time to time, shares to pay the exercise price by employees and directors who exercise stock options (granted under stock incentive plans), which are commonly referred to as stock swap exercises. In 2009, the Company began allowing participants to net share settle their stock options where the Company issues a number of shares representing the value of the spread between the option exercise price and the then current market value of the shares subject to the option. In 2009, options for the purchase of 0.7 million shares, with an aggregate exercise price value of $12.9 million, were exercised under this method. In 2011 and 2010, a minimal amount of options were exercised under this method.
Employees are also allowed to use shares to pay withholding taxes, up to the minimum statutory amount on all stock incentive plans. For 2012, 2011 and 2010, the value of shares used for withholding taxes was$5.1 million, $2.5 million and $2.2 million, respectively, which is included as stock repurchases in the Consolidated Statement of Cash Flows.
Contractual Obligations
The following summarizes the Company’s contractual obligations at December 31, 201129, 2012 and the effect such obligations are expected to have on its liquidity and cash flow in future periods (in millions).
| | | | Total | | Less than 1 year | | 1-3 years | | 3-5 years | | More than 5 years | Total | | Less than 1 year | | 1-3 years | | 3-5 years | | More than 5 years |
| Debt obligations | $ | 610.9 |
| | $ | 195.7 |
| | $ | 4.2 |
| | $ | 4.1 |
| | $ | 406.9 |
| $ | 617.8 |
| | $ | 203.4 |
| | $ | 4.8 |
| | $ | 4.8 |
| | $ | 404.8 |
|
| Interest payments on long term obligations | 195.9 |
| | 30.3 |
| | 39.6 |
| | 39.2 |
| | 86.8 |
| 165.8 |
| | 19.9 |
| | 39.5 |
| | 39.0 |
| | 67.4 |
|
| Pension benefits | 168.5 |
| | 12.5 |
| | 33.2 |
| | 26.0 |
| | 96.8 |
| 189.2 |
| | 14.3 |
| | 34.6 |
| | 52.6 |
| | 87.7 |
|
| Post-employment medical benefits | 28.8 |
| | 3.1 |
| | 6.2 |
| | 6.1 |
| | 13.4 |
| 25.7 |
| | 2.9 |
| | 5.8 |
| | 5.5 |
| | 11.5 |
|
| Income tax payments (a) | 2.2 |
| | 2.2 |
| | — |
| | — |
| | — |
| 1.8 |
| | 1.8 |
| | — |
| | — |
| | — |
|
| Capital commitments (b) | 6.7 |
| | 6.7 |
| | — |
| | — |
| | — |
| 6.0 |
| | 4.5 |
| | 1.5 |
| | — |
| | — |
|
| Operating lease obligations | 83.1 |
| | 31.7 |
| | 33.6 |
| | 12.7 |
| | 5.1 |
| 96.1 |
| | 33.0 |
| | 37.2 |
| | 16.4 |
| | 9.5 |
|
| Total contractual obligations (c) | $ | 1,096.1 |
| | $ | 282.2 |
| | $ | 116.8 |
| | $ | 88.1 |
| | $ | 609.0 |
| $ | 1,102.4 |
| | $ | 279.8 |
| | $ | 123.4 |
| | $ | 118.3 |
| | $ | 580.9 |
|
____________________
| |
| (a) | The Company has not included in the above table amounts related to its other unrecognized tax positions, as it is unable to make a reliable estimate of the amount and period in which these items might lead to payments. As of December 31, 201129, 2012 the Company’s total gross unrecognized tax positions were $28.6 million.$24.9 million. It is reasonably possible that the amount of uncertain tax positions could materially change within the next 12 months based on the results of tax examinations, expiration of statutes of limitations in various jurisdictions and additions due to ongoing transactions and activity. However, the Company is unable to estimate the impact of such events. |
| |
| (b) | Capital commitments represent signed agreements as of December 31, 201129, 2012 on relatively minor capital projects in process in the Company’s Brazil, Indonesia, Portugal manufacturing and SwitzerlandTupperware South Africa units. |
| |
| (c) | The table excludes information on recurring purchases of inventory as these purchase orders are non-binding, are generally consistent from year to year, and are short-term in nature. |
Application of Critical Accounting Policies and Estimates
Management’s Discussion and Analysis of Financial Condition and Results of Operations is based upon the Company’s Consolidated Financial Statements that have been prepared in accordance with accounting principles generally accepted in the United States of America. The preparation of these financial statements requires management to make estimates and assumptions that affect the reported and disclosed amounts. Actual results may differ from these estimates under different assumptions or conditions. The Company believes the implementation of the following critical accounting policies are the most significantly affected by its judgments and estimates.
Allowance for Doubtful Accounts.
The Company maintains current and long-term receivable amounts with most of its independent distributors and sales force in certain markets. It also maintains long-term receivable amounts with certain of these customers. The Company regularly monitors and assesses its risk of not collecting amounts owed to it by its customers. This evaluation is based upon an analysis of amounts currentlycurrent and past due, along with relevant history and facts particular to the customer. It is also based upon estimates of distributor business prospects, particularly related to the evaluation of the recoverability of long-term amounts due. This evaluation is performed market by market and account by account, based upon historical experience, market penetration levels access to alternative channels and similar factors. It also considers collateral of the customer that could be recovered to satisfy debts. Based uponThe Company records its allowance for uncollectible accounts based on the results of this analysis, the Company maintains an allowance for uncollectible accounts. Thisanalysis. The analysis requires the Company to make significant estimates and as such, changes in facts and circumstances could result in material changes in the allowance for doubtful accounts. The Company considers any receivable balance not collected within its contractual terms past due.
Inventory Valuation
The Company writes down its inventory for estimated obsolescence or unmarketability in an amount equal to the difference between the cost of the inventory and the estimated market value based upon estimates ofexpected future demand and selling price.pricing. The demand and pricing is estimated based upon the historical success of product lines as well as the projected success of promotional programs, new product introductions and new markets or distribution channels. The Company prepares projections of demand and pricing on an item by item basis for all of its products. If inventory quantityon hand exceeds projected demand or the expected market value is less than the carrying value, the excess inventory is written down.down to its net realizable value. However, if actual demand is less than projected by management or the estimate of the market value of inventory on hand decreases, additional inventory write-downs would be required.
Income Taxes
Deferred tax assets and liabilities are recognized for the future tax consequences attributable to temporary differences between the financial statement carrying amounts of assets and liabilities and their respective tax bases. Deferred tax assets also are recognized for credit carryforwards. Deferred tax assets and liabilities are measured using the enacted rates applicable to taxable income in the years in which the temporary differences are expected to reverse and the credits are expected to be used. The effect on deferred tax assets and liabilities of a change in tax rates is recognized in income in the period that includes the enactment date. An assessmentAt December 29, 2012 and December 31, 2011, the Company had valuation allowances against certain deferred tax assets totaling $103.1 million and $96.0 million, respectively. These valuation allowances relate to tax assets in jurisdictions where it is made as to whether ormanagement's best estimate that there is not a valuation allowance is required to offset deferred tax assets. This assessment requires estimates as to future operating results as well as an evaluationgreater than 50 percent probability that the benefit of the effectiveness of the Company's tax planning strategies. These estimates are made based upon the Company's business plans and growth strategies in each market and are made on an ongoing basis; consequently, future material changesassets will be realized in the valuation allowance are possible. Any change in valuation allowance amounts is reflected in the period in which the change occurs.associated tax returns. At the end of 2011,2012, the Company had netgross domestic deferred tax assets of approximately $324.5$378.0 million against which a valuation allowance of $4.2 million has been provided. Of these total assets, approximately $95.2$103.8 million relates to recurring type temporary differences which reverse regularly and are replaced by newly originated items. The balance is primarily related to foreign tax credits and federal and state net operating losses that, other than for the amount for which a valuation allowance has been provided, are expected to be realized prior to expirationexpiration. This assessment is based upon expected future operating and non-operating income generated from the United States businesses of Tupperware and BeautiControl, as well asdomestic results, future foreign dividends from then current year earnings and cash flows and other foreign source income. Also, expectedincome, including rents and royalties, as well as anticipated gains related to future sales of land aroundheld for development near the Company's Orlando, Florida headquarters would result in the realization of a portion of these assets.headquarters. In addition, certain tax planning transactions may be entered into to facilitate realization of these benefits. These estimates are available tomade based upon the Company should they be necessary.Company's business plans and growth strategies in each market and are made on an ongoing basis; consequently, future material changes in the valuation allowance are possible. Any change in valuation allowance amounts is reflected in the period in which the change occurs.
As of December 31, 201129, 2012 and December 25, 201031, 2011, the Company's gross unrecognized tax benefit was $28.624.9 million and $27.328.6 million, respectively. The Company estimates that approximately $23.3 million of the unrecognized tax benefits, if recognized, would impact the effective tax rate. During the year ended December 31, 201129, 2012, the Company settled certain tax positions in various foreign countries which included a payment of $0.4 million of interest and taxes. As a result of the settlement, the Company's unrecognized tax benefit decreased by $3.2 million, and related accruals for interest and penalties decreased by $0.3 million. Also during 2011, the Company reduced its liability by $1.2 million upon entering into certain advance pricing agreements. During the year, the accrual for uncertain tax positions decreased $4.5 million due to the expiration of the statute of limitations in various jurisdictions. The accrual also increased for positions being taken during the year in various tax filings. The accrual is further impacted by changes in foreign exchange rates.
Interest and penalties related to uncertain tax positions in the Company's global operations are recorded as a component of the provision for income taxes. Accrued interest and penalties were $5.85.9 million and $5.15.8 million as of December 31, 201129, 2012 and December 25, 201031, 2011, respectively. Interest and penalties included in the provision for income taxes totaled $0.3 million, $1.2 million and $0.8 million for 2012, 2011 and 2010, respectively. In 2009, the Company recorded a benefit of $1.0 million to the provision related to interest and penalties from the reversals of certain accruals made in previous years.
The Company estimates that it may settle one or more foreign audits in the next twelve months that may result in a decrease in the amount of accrual for uncertain tax positions of up to $2.21.8 million. For the remaining balance as of December 31, 2011,29, 2012, the Company is not able to reliably estimate the timing or ultimate settlement amount. While the Company does not currently expect material changes, it is possible that the amount of unrecognized benefit with respect to the uncertain tax positions will significantly increase or decrease related to audits in various foreign jurisdictions that may conclude during that period or new developments that could also, in turn, impact the Company's assessment relative to the establishment of valuation allowances against certain existing deferred tax assets. At this time, the Company is not able to make a reasonable estimate of the range of impact on the balance of unrecognized tax benefits or the impact on the effective tax rate related to these items.
Promotional and Other Accruals
The Company frequently makes promotional offers to its independent sales force to encourage them to meet specific goals or targets for sales levels, party attendance, recruiting or other business critical activities. The awards offered are in the form of cash, product awards, special prizes or trips. The cost of these awards is recorded during the period over which the sales force qualifies for the award. These accruals require estimates as to the cost of the awards based upon estimates of achievement and actual cost to be incurred. The Company makes these estimates on a market by market and program by program basis. It considers the historical success of similar programs, current market trends and perceived enthusiasm of the sales force when the program is launched. During the promotion qualification period, actual results are monitored and changes to the original estimates that are necessary are made when known. Like promotional accruals, other accruals are recorded at the time when the liability is probable and the amount is reasonably estimable. Adjustments to amounts previously accrued are made when changes occur in the facts and circumstances that generated the accrual.
Goodwill and Intangible Assets
The Company’s recorded goodwill relates primarily to that generated by its acquisition of BeautiControl in October 2000 and the Sara Lee Direct Sellingdirect-to-consumer businesses in December 2005. The Company conducts an annual impairment test of its recorded goodwill in each of its eight reporting units in the second and third quarter of each year related to BeautiControl and the former Sara Lee Direct Sellingdirect-to-consumer units, respectively. Additionally, in the event of a change in circumstances that leads the Company to determine that a triggering event for impairment testing has occurred, a test is completed at that time.
The annual process for evaluating goodwill begins with an assessment for each entity of qualitative factors to determine whether the two-step goodwill impairment test foris necessary. Further testing is only performed if the Company determines that it is more likely than not that the reporting unit's fair value is less than its carrying value. The qualitative factors evaluated by the Company include: macro-economic conditions of the local business environment, overall financial performance, sensitivity analysis from the most recent step one fair value test, and other entity specific factors as deemed appropriate. When the Company determines the two-step goodwill impairment test is necessary, the first step involves comparing the fair value of thea reporting unitsunit to theirits carrying amounts.amount, including goodwill, after any long-lived asset impairment charges. If the carrying amount of athe reporting unit exceeds its fair value, a second step is requiredperformed to measure fordetermine whether there is a goodwill impairment, and if so, the amount of the loss. This step revalues all assets and liabilities of the reporting unit to their current fair valuesvalue and then compares the implied fair value of the reporting unit’sunit's goodwill to the carrying amount of that goodwill. If the carrying amount of the reporting unit’sunit's goodwill exceeds the implied fair value of the goodwill, an impairment loss is recognized in an amount equal to the excess.
The valuation of goodwill is dependent upon Prior to 2012, the estimated fair market value of operations of the eight individual reporting units identified. Fair value of the reporting units is determined by the Company using either the income approach or a combination of the income and market approach with generally a greater weighting on the income approach (75 percent). The income approach, or discounted cash flow approach, requires significant assumptions to determine the fair value of each reporting unit. The significant assumptions used in the income approach include estimates regarding future operations and the ability to generate cash flows, including projections of revenue, costs, utilization of assets and capital requirements. It also requires estimates as to the appropriate discount rates to be used. The most sensitive estimate in this valuation is the projection of operating cash flows, as these provide the basis for the fair market valuation. The Company’s cash flow model uses forecasts for periods of about 10 years and a terminal value. The significant 2011 assumptions for these forecasts includedCompany's annual revenue growth rates ranging from zero to 12 percent with an average growth rate of 6 percent. The growth rates are determined by reviewing historical results of these units and the historical results of other of the Company’s business units that are similar to those of the reporting units, alongassessment began with the expected contribution from growth strategies implemented in the units. Terminal values for all reporting units were calculated using a long-term growth rate of two-step impairment test.3 percent. In estimating the fair value of the reporting units in 2011, the Company applied discount rates to its reporting units’ projected cash flows ranging from 11.6 to 22.3 percent. The discount rate at the higher end of this range was for the Avroy Shlain and Latin American reporting units due to higher country-specific risk. The market approach relies on an analysis of publicly-traded companies similar to Tupperware and deriving a range of revenue and profit multiples. The publicly-traded companies used in the market approach were selected based on their having similar product lines of consumer goods, beauty products and/or companies using a direct-selling distribution method. The resulting multiples were then applied to the reporting unit to determine fair value.
The Company recorded as assets the fair value of various trademarks and tradenames acquired in conjunction with its purchase of the Sara Lee Direct Sellingdirect-to-consumer businesses. Certain tradenames are allocated between multiple reporting units. The Company early adopted Accounting Standards Update 2012-02, "Testing Indefinite-Lived Intangibles for Impairment" ("the ASU") in connection with the performance of its 2012 annual impairment testing of its tradenames. Under the ASU, entities are provided the option of first performing a qualitative assessment that is similar to the assessment performed for goodwill. When the Company determines it is necessary, the quantitative impairment test for the Company's tradenames involves comparing the estimated fair value of the Company’s tradenames was determined usingassets to the relief from royalty method, whichcarrying amounts, to determine if fair value is lower and a formwrite-down required. If the carrying amount of a tradename exceeds its estimated fair value, an impairment charge is recognized in an amount equal to the excess.
During the second quarter of 2012, the Company completed its annual impairment test of the income approach.BeautiControl reporting units, resulting in an impairment charge of $38.9 million related to the goodwill in the BeautiControl United States and Canada business. This was a result of the rates of growth of sales, profit and cash flow and expectations for future performance that were below the Company's previous projections. Also in the second quarter, the financial performance of the Nutrimetics reporting units fell below their previous trend line and it became apparent that they would fall significantly short of previous expectations for the year. Additionally, reductions in the forecasted operating trends of NaturCare relating to declines in the rates of growth of sales, profit and cash flows in the Japanese market led to interim impairment testing in both these businesses, as of the end of May and June 2012, respectively. The result of these tests was to record tradename impairments of $13.8 million for Nutrimetics and $9.0 million for NaturCare, primarily due to the use of lower estimated royalty rates in light of lower sales and profit forecasts for these units, as well as macroeconomic factors that increased the discount rates used in the valuations versus those used previously. In this method,addition, the Company wrote off the $7.2 million and $7.7 million carrying value of the asset is calculated by selecting royalty rates which estimate the amount a company would be willing to pay for the usegoodwill of the asset. These rates were applied toNutrimetics Asia Pacific and Nutrimetics Europe reporting units, respectively, in light of then current operating trends and expected future results, as well as the Company’s projected revenue, tax affected and discounted to present value using an appropriate rate. Royalty rates used were selected by reviewing comparable trademark licensing agreements inmacroeconomic factors that increased the market, and a range from 3 to 4.75 percent was used in 2011. In estimating the fair value of the tradenames, the Company also applied a discount rate ranging from 12.6 to 22.3 percent, and revenue growth ranging from zero to 12 percent, with an average growth rate of 6 percent, and a long-term terminal growth rate of 3 percent. Similar to the rates used in valuing the goodwill,valuations. In the discount rates towardsthird quarter of 2012, the high endCompany completed the annual impairment assessments for all of the range related to tradenames locatedreporting units and tradename intangibles, except for BeautiControl which was completed in areas with higher country risks, such as revenue generated using the Avroy Shlain tradenames in South Africa and the Nuvo tradename in Uruguay.second quarter, determining there was no impairment.
In the third quarter of 2011, the Company completed the annual impairment tests for all of the reporting units and tradenames, other than BeautiControl, which was completed in the second quarter. During the third quarter of 2011, the financial results of Nutrimetics were below expectations. As well, theThe Company also made at that time, the decision to cease operating its Nutrimetics business in Malaysia. As a result, the Company lowered its forecast of future sales and profit. The result of the impairment tests was to record a $31.1 million impairment to the Nutrimetics goodwill in the Asia Pacific reporting unit and a $5.0 million impairment to its tradename.
During the fourth quarter of 2010, the Company completed the annual impairment tests for all of the reporting units and tradenames, determining there was no impairment. The Company subsequently decided it would cease separately operating its Swissgarde unit in Southern Africa.Africa as a separate business. As a result of this decision, and its expected impact on the Swissgarde sales force, the Company concluded that its intangible assets and goodwill were impaired and recorded a $2.1$2.1 million impairment to the Swissgarde tradename, a $0.1$0.1 million impairment related to the sales force intangible asset and a $2.1$2.1 million impairment to goodwill relating to the South African beauty reporting unit. During 2011, the Company sold its interest in Swissgarde for $0.7 million that resulted in a gain of $0.1 million.
In 2009,Fair value of the BeautiControl United States and Canada, Nutrimetics and NaturCare reporting units was determined by the Company recorded impairment charges relatedin the second quarter of 2012 using a combination of the income and market approaches with generally a greater weighting on the income approach (75 percent). When the characteristics of the reporting unit are more similar to its NaturCare,the guideline public companies in terms of size, markets and economy, then a more equal weighting is used between the income and market approaches. The income approach, or discounted cash flow approach, requires significant assumptions to determine the fair value of each reporting unit. These include estimates regarding future operations and the ability to generate cash flows, including projections of revenue, costs, utilization of assets and capital requirements, along with an estimate as to the appropriate discount rate to be used. The most sensitive estimate in this valuation is the projection of operating cash flows, as these provide the basis for the fair market valuation. The Company’s cash flow model uses forecasts for periods of about 10 years and a terminal value. The significant assumptions for these forecasts in 2012 included annual revenue growth rates ranging from negative7 percent to positive10.0 percent with an average growth rate of positive3 percent. The growth rates were determined by reviewing historical results of these units and the historical results of the Company’s other business units that are similar to those of the reporting units, along with the expected contribution from growth strategies implemented in the units. Terminal values for all reporting units were calculated using a long-term growth rate of 3 percent. In estimating the fair value of these reporting units in 2012, the Company applied discount rates to the projected cash flows ranging from 12.5 to 14.0 percent. The discount rate at the high end of this range was for the Nutrimetics and South African businesses, in part,Asia Pacific reporting unit due to the fact that currenthigher country-specific risks. The market approach relies on an analysis of publicly-traded companies similar to Tupperware and forecasted future resultsderiving a range of operations were below its prior projections. Also contributing to the impairments was an overall increase to the assumed discount ratesrevenue and profit multiples. The publicly-traded companies used in the valuations. In 2009, the Company recorded a $10.1 million impairmentmarket approach were selected based on their having similar product lines of consumer goods, beauty products and/or companies using direct-to-consumer or network marketing distribution methods. The resulting multiples were then applied to the reporting unit to determine fair value.
The fair value of the Nutrimetics tradename,and NaturCare tradenames were determined in the second quarter using the relief from royalty method, which is a $4.2 million impairmentform of the income approach. In this method, the value of the asset is calculated by selecting royalty rates, which estimate the amount a company would be willing to pay for the use of the asset. These rates were applied to the NaturCare tradenameCompany’s projected revenue, tax affected and discounted to present value. Royalty rates used were selected by reviewing comparable trademark licensing agreements in the market and the forecasted performance of the business. As a $2.0 million impairmentresult, the royalty rates were reduced to 1.5 percent from 3.0 percent for Nutrimetics and 3.75 percent from 4.75 percent for NaturCare. In estimating the Avroy Shlain tradename. In addition tofair value of the impairment of tradenames, the Company also recognized impairmentsapplied discount rates of goodwill15.2 and 13.5 percent, respectively, and annual revenue growth ranging from negative7 percent to positive7 percent, with an average growth rate of $8.6 millionpositive2 percent, and $3.2 million relating to the Nutrimetics and South African beauty reporting units, respectively. There were no impairments resulting from the respective annual impairment tests in 2010.a long-term terminal growth rate of 3 percent.
With the goodwilltradename impairment recorded in 2011the current year for Nutrimetics Asia Pacific, this unit isand NaturCare, these assets are at a higher risk of additional impairments in future periods if changes in certain assumptions occur. ThisThere is also the case for theno longer a goodwill balance recorded related to Nutrimetics tradename value, as the fair value was set equal to carrying value in the third quarter of 2011.or BeautiControl United States and Canada. The estimated fair value of the Avroy Shlain, Fuller Mexico, Fuller Philippines, NaturCare and Nutrimetics Europe reporting units as well as the Nuvo and Avroy Shlain trade namesunit exceeded the carrying value by over 6529 percent at the valuation date. The fair valueas of the Fuller Latin America and BeautiControl reporting units exceeded the carrying value by almost 45 percent. The fair value of the Company’s Fuller and NaturCare tradenames reflected an excess of 29 and 37 percent over carrying value, respectively.June 2012. Given the sensitivity of the valuations to changes in cash flow or market multiples, the Company may be required to recognize an impairment of goodwill or intangible assets in the future due to changes in market conditions or other factors related to the Company’s performance. Actual results below forecasted results or a decrease in the forecasted future results of the Company’s business plans or changes in interestdiscount rates could also result in an impairment charge, as could changes in market characteristics including declines in valuation multiples of comparable publicly-traded companies. Further impairment charges would have an adverse impact on the Company’s net income.income and shareholders' equity.
Additionally, as of December 31, 201129, 2012 the Company had $7.25.0 million included on its Consolidated Balance Sheets as the value of acquired sales forces. The estimated annual amortization expense associated with these intangibles for each of the five succeeding years is $2.0 million, $1.4 million, $1.0 million, $0.7 million, $0.6 million and $0.60.4 million, respectively. As of December 31, 201129, 2012, thea product formulation asset recorded as part of the acquisition was fully amortized.
Retirement Obligations
Pensions
The Company records pension costs and the funded status of its defined benefit pension plans using the applicable accounting guidance for defined benefit pension and other postretirement plans. This guidance requires that amounts recognized in the financial statements be determined on an actuarial basis. The measurement of the retirement obligations and costs of providing benefits under the Company’s pension plans involves various factors, including several assumptions. The Company believes the most critical of these assumptions are the discount rate and the expected long-term rate of return on plan assets.
The Company determines the discount rate primarily by reference to rates of high-quality, long-term corporate and government bonds that mature in a pattern similar to the expected payments to be made under the plans. The discount rate assumptions used to determine pension expense for the Company’s U.S. and foreign plans was as follows:
| | | Discount Rate | 2011 | | 2010 | | 2009 | 2012 | | 2011 | | 2010 |
| U.S. Plans | 4.7 | % | | 5.1 | % | | 5.8 | % | 3.7 | % | | 4.7 | % | | 5.1 | % |
| Foreign Plans | 3.9 |
| | 4.3 |
| | 5.0 |
| 3.3 |
| | 3.9 |
| | 4.3 |
|
The Company has established strategic asset allocation percentage targets for significant asset classes with the aim of achieving an appropriate balance between risk and return. The Company periodically revises asset allocations, where appropriate, in an effort to improve return and manage risk. The estimated rate of return is based on long-term expectations given current investment objectives and historical results. The expected rate of return assumptions used by the Company for its U.S. and foreign plans were as follows:
| | | Expected rate of return | 2011 | | 2010 | | 2009 | 2012 | | 2011 | | 2010 |
| U.S. Plans | 8.3 | % | | 8.3 | % | | 8.3 | % | 8.3 | % | | 8.3 | % | | 8.3 | % |
| Foreign Plans | 4.1 |
| | 4.4 |
| | 4.8 |
| 4.1 |
| | 4.1 |
| | 4.4 |
|
The following table highlights the potential impact on the Company’s pretax earningspension expense due to changes in certain key assumptions with respect to the Company’s pension plans, based on assets and liabilities at December 31, 201129, 2012:
| | | | | | 50 basis points |
| (In millions) | Impact on 2011 Pension Expense | Increase | | Decrease |
| Discount rate change by 50 basis points | $ | 1.5 |
| $ | 1.5 |
| | $ | 0.9 |
|
| Expected rate of return on plan assets change by 50 basis points | 0.6 |
| 0.6 |
| | 0.6 |
|
Other Post Retirement Benefits
The Company accounts for its post-retirement benefit plan in accordance with applicable accounting guidance, which requires that amounts recognized in financial statements be determined on an actuarial basis. This determination requires the selection of various assumptions, including a discount rate and health care cost trend rates used to value benefit obligations. The Company determines the discount rate primarily by reference to rates of return on high-quality, long term corporate bonds that mature in a pattern similar to the expected payments to be made under the plan. The discount rate assumptions used by the Company to determine other post retirement benefit expense were 5.04.0 percent, 5.35.0 percent, and 5.85.3 percent for the 20112012, 20102011 and 20092010 fiscal years, respectively. A change in discount rate of 50 basis points would not be material.
The following are the assumed health-care cost trend rates used by the Company:
| | | Health-care trend rates | 2011 | | 2010 | | 2009 | 2012 | | 2011 | | 2010 |
| Initial health-care cost trend | 7.3 | % | | 7.3 | % | | 7.6 | % | 7.3 | % | | 7.3 | % | | 7.3 | % |
| Ultimate health-care cost trend | 5.0 |
| | 5.0 |
| | 5.0 |
| 5.0 |
| | 5.0 |
| | 5.0 |
|
| Year Ultimate trend rate achieved | 2019 | | 2017 | | 2017 | 2019 | | 2019 |
| | 2017 |
The healthcare cost trend rate assumption may have a significant effect on the amounts reported. A one percentage point change in the assumed healthcare cost trend rates would have the following effects:
| | | | One percentage point | One percentage point |
| (In millions) | Increase | | Decrease | Increase | | Decrease |
| Effect on total of service and interest cost components | $ | 0.1 |
| | $ | 0.1 |
| $ | 0.1 |
| | $ | 0.1 |
|
| Effect on post-retirement benefit obligation | 2.5 |
| | 2.2 |
| 1.9 |
| | 1.7 |
|
Revenue Recognition
Revenue is recognized when the price is fixed, the risks and rewards of ownership have passed to the customer who, in most cases, is one of the Company’s independent distributors or a member of its independent sales force, and when collection is reasonably assured. When revenue is recorded, estimates of returns are made and recorded as a reduction of revenue. Discounts earned based on promotional programs in place, volume of purchases or other factors are also estimated at the time of revenue recognition and recorded as a reduction of that revenue.
Stock-Based Compensation
The Company measures compensation cost for stock-based awards at fair value and recognizes compensation over the service period for awards expected to vest. The Company uses the Black-Scholes option-pricing model to value stock options, which requires the input of assumptions, including dividend yield, risk-free interest rate, the estimated length of time employees will retain their vested stock options before exercising them (expected term) and the estimated volatility of the Company's common stock price over the expected term. Furthermore, in calculating compensation expense for these awards, the Company is also required to estimate the extent to which options will be forfeited prior to vesting (forfeitures). Many factors are considered when estimating expected forfeitures, including types of awards, employee class and historical experience. To the extent actual results or updated estimates differ from current estimates; such amounts are recorded as a cumulative adjustment to the previously recorded amounts.
Impact of Inflation
Inflation, as measured by consumer price indices, has continued at a low level in most of the countries in which the Company operates, except for Argentina and Venezuela.
New Pronouncements
Refer to Note 1 to the Consolidated Financial Statements for a discussion of new accounting pronouncements.
Item 7A. Quantitative and Qualitative Disclosures About Market RiskRisk.
During the second quarter of 2011, the Company terminated its Old Credit Facility, entered into a new $450 million Credit Agreement and issued $400 million in 4.75% Senior Notes. One of the Company's market risks is its exposure to the impact of interest rate changes on its borrowings. The Company's borrowings under the Credit Agreement carry a variable interest rate. The Company has elected to manage this risk through the maturity structure of its borrowings and the currencies in which it borrows.
Loans madetaken under the revolving credit facility, depending on the length of the borrowing, generallyCredit Agreement bear interest in reference tounder a formula that includes, at the Company's option, one of three different base rates, plus an applicable spread. The Company generally selects the London interbank offered rate for the applicable currency and interest period, plus a margin. The applicable margin is determined by reference to a pricing schedule based upon the ratio (the “Consolidated Leverage Ratio”("LIBOR") of the consolidated funded indebtedness of the Company to its consolidated EBITDA (as defined in the Credit Agreement) for the four fiscal quarters then most recently ended.. As of December 31, 201129, 2012, the Credit Agreement dictated a spread of 150 basis points, which gave the Company an interest rate of 2.902.03 percent on its outstanding borrowings under the Credit Agreement. Consequently, ifGoing forward, in light of the Company's share repurchase program, the Company is targeting an increase in its debt-to-EBITDA ratio from 1.5 times consolidated funded indebtedness to 1.75 times consolidated funded indebtedness (as defined in the Credit Agreement) as of the end of each quarter. At this level of leverage, the spread would increase by 25 basis points.
Of the Company's short-term borrowings as of December 29, 2012, $162.0 million was denominated in euro and $37.0 million in U.S. dollars. If short-term interest rates varied by 10 percent, with all other variables remaining constant, the Company's annual interest expense would not be significantly impacted.
The Company routinely increases its revolver borrowings under the Credit Agreement during each quarter to fund operationsoperating, investing and financing activities and uses cash available at the end of the periodeach quarter to reduce borrowing levels. As a result, the Company has higher foreign exchange exposure on the value of its cash during each quarter than at the end of each quarter. The borrowings outstanding under the Credit Agreement at the end of 2011 were denominated in euros.
Under the Old Credit Facility, the Company managed its interest rate risk in 2011 through the use of four interest rate swaps. These interest rate swaps effectively fixed the interest rate on $325 million of the Company's $405 million of outstanding term loans under the Old Credit Facility. The Company paid a variable rate on the remaining $80 million of term loans and any outstanding revolver borrowings. As a result of the termination of the Old Credit Facility, the four swaps became ineffective, which required a reclassification of $18.9 million of losses from other comprehensive loss into interest expense in the second quarter of 2011. These swaps will expire in the third quarter of 2012, and the remaining exposure to the fair value of these swaps is not expected to materially impact the results of the Company.
A significant portion of the Company's sales and profit come from its international operations. Although these operations are geographically dispersed, which partially mitigates the risks associated with operating in particular countries, the Company is subject to the usual risks associated with international operations. These risks include local political and economic environments and relations between foreign and U.S. governments.
Another economic risk of the Company is exposure to changes in foreign currency exchange rates on the earnings, cash flows and financial position of its international operations. The Company is not able to project, in any meaningful way, the possible effect of these fluctuations on translated amounts or future earnings or cash flows.earnings. This is due to the Company's constantly changing exposure to various currencies, the fact that all foreign currencies do not react in the same manner in relation to the U.S. dollar and the large number of currencies involved, although the Company's most significant exposures are to the euro, Indonesia rupiah and Mexican peso.peso, as well as the Brazilian real and Malaysian ringgit.
Although this currency risk is partially mitigated by the natural hedge arising from the Company's local product sourcing in many markets, a strengthening U.S. dollar generally has a negative impact on the Company. In response to this fact, the Company uses financial instruments, such as forward contracts, to hedge its exposure to certain foreign exchange risks associated with a portion of its investment in international operations. In addition to hedging against the balance sheet impact of changes in exchange rates, the hedge of investments in international operations also has the effect of hedging a portion of cash flows from those operations. The Company also hedges, with these instruments, certain other exposures to various currencies arising from amounts payable and receivable, non-permanent intercompany loans and forecasted purchases. The Company generally does not seek to hedge the impact of currency fluctuations on the translated value of the sales, profit or cash flow generated by its operations.
While the Company's hedges of its equity in its foreign subsidiaries and its fair value hedges of balance sheet risks all work together to mitigate its exposure to foreign exchange gains or losses, they result in an impact to operating cash flows as they are settled. For the years ended December 31, 2011, December 25, 2010 and December 26, 2009 theThe cash flow impact of these currency hedges was an inflow of $2.1 million and $6.1 million, in 2012 and 2011, respectively, and an outflow of of $5.9 million and an inflow of $12.7 million, respectively.in 2010.
The U.S. dollar equivalent of the Company's most significant net open foreign currency hedge positions as of December 31, 201129, 2012 were to buy U.S. dollar $69.9 million; euro $61.4$66.6 million; Malaysian ringgit $17.2 million and U.S. dollars $48.5Indonesian rupiah $11.3 million, and to sell Swiss francs $39.2franc $53.8 million; Japanese yen $28.4$32.8 million; Mexican peso $22.0 million; Australian dollars $17.5 million;dollar $15.5 million and the Turkish lira $14.4$12.3 million. In agreements to sell foreign currencies in exchange for U.S. dollars, for example, an appreciating dollar versus the opposing currency would generate a cash inflow for the Company at settlement, with the opposite result in agreements to buy foreign currencies for U.S. dollars. The above noted notional amounts change based upon changes in the Company's outstanding currency exposures. Based on rates existing as of December 31, 201129, 2012, the Company was in a net receivablepayable position of approximately $2.7 million related to its currency hedges, which, upon settlement, could have a significant impact on the Company's cash flow. The Company records the impact of forward points in net interest expense.
A precise calculation of the impact of currency fluctuations is not practical since some of the contracts are between non-U.S. dollar currencies. The Company continuously monitors its foreign currency exposure and may enter into additional contracts to hedge exposure in the future. See further discussion regarding the Company's hedging activities for foreign currency in Note 8 to the Consolidated Financial Statements.
The Company is subject to credit risks relating to the ability of counterparties of hedging transactions to meet their contractual payment obligations. The risks related to creditworthiness and nonperformance have been considered in the determination of fair value for the Company's foreign currency forward exchange contracts and interest rate swaps.contracts. The Company continues to closely monitor its counterparties and will take action, as appropriate and possible, to further manage its counterparty credit risk.
The Company is also exposed to rising material prices in its manufacturing operations and, in particular, the cost of oil and natural gas-based resins. This is the primary material used in production of most Tupperware®Tupperware® products, and the Company estimates that 20122013 cost of sales will include about $155$160 million for the cost of resin in the Tupperware®Tupperware® brand products it produces. The Company uses many different kinds of resins in its products. About three-fourths of its resins are “polyolefins” (simple chemical structure, easily refined from oil), and as such, the price of these is strongly affected by the underlying price of oil and natural gas. The remaining one-fourth of its resins is more highly engineered, where the price of oil and natural gas plays a less direct role in determining price. With a comparable product mix and exchange rates, a 10 percent fluctuation in the cost of resin would impact the Company's annual cost of sales by about $16 million compared with the prior year. For 20112012, the Company estimates its cost of sales of the Tupperware®Tupperware® products it produced was negativelypositively impacted by about $16$1 million in local currency due to resin cost changes, as compared with 20102011. For the full year of 20122013, the Company estimates itsimpact of resin cost changes, on a local currency basis, on the Company's cost of sales of the Tupperware® products it produces willis expected to be positively impacted by about $5positive $1 million, on a local currency basis, due to resin cost changes, as compared with 20112012. The Company partially manages its risk associated with rising resin costs by utilizing a centralized procurement function that is able to take advantage of bulk discounts while maintaining multiple suppliers and also enters into short-term pricing arrangements. It also manages its margin through the pricing of its products, with price increases generally in line with consumer inflation in each market, and its mix of sales through its promotional programs and discount offers. It may also, on occasion, make advance material purchases to take advantage of current favorable pricing. At this point in time, the Company has determined that entering into forward contracts for resin is not practical or cost beneficial and has no such contracts in place. However, should circumstances warrant, the Company may consider such contracts in the future.
The Company'sCompany has a program to sell land held for development around its Orlando, Florida headquarters. This program is exposed to the risks inherent in the real estate development process. Included among these risks is the ability to obtain all government approvals, the success of buyers in attracting tenants for commercial or residential developments in the Orlando real estate market or obtaining financing and general economic conditions, such as interest rate increases. The Company's land sale program has been negatively impacted by the drivers and ramifications of the credit crisis and real estate market conditions in the United States, which have delayed the completion of this program.
Forward-Looking Statements
Certain written and oral statements made or incorporated by reference from time to time by the Company or its representatives in this report, other reports, filings with the Securities and Exchange Commission, press releases, conferences or otherwise are “forward-looking statements” within the meaning of the Private Securities Litigation Reform Act of 1995. Statements in this report or elsewhere that are not based on historical facts or information are forward-looking statements. Such forward-looking statements involve risks and uncertainties which may cause actual results to differ materially from those projected in forward-looking statements. Such risks and uncertainties include, among others, the following:
successful recruitment, retention and productivity levels of the Company's independent sales forces;
disruptions caused by the introduction of new distributor operating models or sales force compensation systems;systems or allegations by equity analysts or others as to the legality or viability of the Company's business model;
success of new products and promotional programs;
the ability to implement appropriate product mix and pricing strategies;
governmental regulation of materials used in products coming into contact with food (e.g. polycarbonate), as well as beauty, personal care and nutritional products;
the impact of changes in consumer spending patterns and preferences, particularly given the global nature of the Company's business;
the value of long-term assets, particularly goodwill and indefinite lived intangibles associated with acquisitions, and the realizability of the value of recognized tax assets;
changes in plastic resin prices, other raw materials and packaging components, the cost of converting such items into finished goods and procured finished products and the cost of delivering products to customers;
the introduction of Company operations in new markets outside the United States;
general social, economic and political conditions in markets;
issues arising out of the sovereign debt crisis in Europe, resulting in potential economic and operational challenges for the Company's European supply chain, heightened counterparty credit risk due to adverse effects on customers and suppliers, exchange controls and translation risks due to potential impairments of investments in affected markets and the potential for banks with which the Company maintains lines of credit to be unable to fulfill their commitments;
disruptions resulting from either internal or external labor strikes, work stoppages, or similar difficulties;
changes in cash flow resulting from changes in operating results, working capital management, debt payments, share repurchases and hedge settlements;
the impact of currency fluctuations on the value of foreign operations generally, and particularly in Venezuela, including their cash balances, the results of those operations, and the cost of sourcing products across geographies and the success of foreign hedging and risk management strategies;
the impact of natural disasters and epidemic or pandemic disease outbreaks;
the ability to repatriate, or otherwise make available, cash in the United States and to do so at a favorable foreign exchange rate and with favorable tax ramifications;
the ability to obtain all government approvals on, and to control the cost of infrastructure obligations associated with, land development;
the ability to timely and effectively implement, transition, maintain and protect necessary information technology systems and infrastructure;
the ability to attract and retain certain executive officers and key management personnel;
the success of land buyers in attracting tenants for commercial and residential development and obtaining financing;
the costs and covenant restrictions associated with the Company's credit arrangements;
integration of non-traditional product lines into Company operations;
the effect of legal, regulatory and tax proceedings, as well as restrictions imposed on the Company operations or Company representatives by foreign governments, including exposure to tax responsibilities imposed on the sales force and their potential impact on the sales force's value chain and resulting disruption to the business;
the effect of competitive forces in the markets in which the Company operates, particularly related to sales of Beautybeauty, personal care and nutritional products, where there are a greater number of competitors;
the impact of changes in U.S. federal, state and foreign tax or other laws;
the Company's access to, and the costs of, financing; and
other risks discussed in Item 1A, Risk Factors, as well as the Company’s Consolidated Financial Statements, notes, other financial information appearing elsewherecontained in this report and the Company’s other filings with the United States Securities and Exchange Commission.
The Company does not intend to update forward-looking information other than in its quarterly earnings releases unless it expects diluted earnings per share for the current quarter, excluding adjustment items impacting comparability and the impact of changes in foreign exchange rates, to be significantly below its previous guidance.
Investors should also be aware that while the Company does, from time to time, communicate with securities analysts, it is against the Company's policy to disclose to them any material non-public information or other confidential commercial information. Accordingly, it should not be assumed that the Company agrees with any statement or report issued by any analyst irrespective of the content of the confirming financial forecasts or projections issued by others.
| |
| Item 8. | Financial Statements and Supplementary Data. |
Tupperware Brands Corporation
Consolidated Statements of Income
| | | | Year Ended | Year Ended |
| (In millions, except per share amounts) | December 31,
2011 | | December 25,
2010 | | December 26,
2009 | December 29,
2012 | | December 31,
2011 | | December 25,
2010 |
| Net sales | $ | 2,585.0 |
| | $ | 2,300.4 |
| | $ | 2,127.5 |
| $ | 2,583.8 |
| | $ | 2,585.0 |
| | $ | 2,300.4 |
|
| Cost of products sold | 862.5 |
| | 766.2 |
| | 718.5 |
| 856.4 |
| | 862.5 |
| | 766.2 |
|
| Gross margin | 1,722.5 |
| | 1,534.2 |
| | 1,409.0 |
| 1,727.4 |
| | 1,722.5 |
| | 1,534.2 |
|
| Delivery, sales and administrative expense | 1,340.0 |
| | 1,193.1 |
| | 1,119.1 |
| 1,329.5 |
| | 1,340.0 |
| | 1,193.1 |
|
| Re-engineering and impairment charges | 7.9 |
| | 7.6 |
| | 8.0 |
| 22.4 |
| | 7.9 |
| | 7.6 |
|
| Impairment of goodwill and intangible assets | 36.1 |
| | 4.3 |
| | 28.1 |
| 76.9 |
| | 36.1 |
| | 4.3 |
|
| Gains on disposal of assets | 3.8 |
| | 0.2 |
| | 21.9 |
| 7.9 |
| | 3.8 |
| | 0.2 |
|
| Operating income | 342.3 |
| | 329.4 |
| | 275.7 |
| 306.5 |
| | 342.3 |
| | 329.4 |
|
| Interest income | 3.2 |
| | 2.5 |
| | 2.9 |
| 2.5 |
| | 3.2 |
| | 2.5 |
|
| Interest expense | 49.0 |
| | 29.3 |
| | 31.6 |
| 34.9 |
| | 49.0 |
| | 29.3 |
|
| Other expense | 1.2 |
| | 2.9 |
| | 9.9 |
| 1.3 |
| | 1.2 |
| | 2.9 |
|
| Income before income taxes | 295.3 |
| | 299.7 |
| | 237.1 |
| 272.8 |
| | 295.3 |
| | 299.7 |
|
| Provision for income taxes | 77.0 |
| | 74.1 |
| | 62.0 |
| 79.8 |
| | 77.0 |
| | 74.1 |
|
| Net income | $ | 218.3 |
| | $ | 225.6 |
| | $ | 175.1 |
| $ | 193.0 |
| | $ | 218.3 |
| | $ | 225.6 |
|
| Basic earnings per common share | $ | 3.63 |
| | $ | 3.60 |
| | $ | 2.80 |
| $ | 3.49 |
| | $ | 3.63 |
| | $ | 3.60 |
|
| Diluted earnings per common share | $ | 3.55 |
| | $ | 3.53 |
| | $ | 2.75 |
| $ | 3.42 |
| | $ | 3.55 |
| | $ | 3.53 |
|
The accompanying notes are an integral part of these financial statements.
Tupperware Brands Corporation
Consolidated Balance Sheets |
| | | | | | | |
| (In millions, except share amounts) | December 31,
2011 | | December 25,
2010 |
| ASSETS | |
| | |
|
| Cash and cash equivalents | $ | 138.2 |
| | $ | 248.7 |
|
| Accounts receivable, less allowances of $26.8 million in 2011 and $32.4 million in 2010 | 163.7 |
| | 181.9 |
|
| Inventories | 302.5 |
| | 279.1 |
|
| Deferred income tax benefits, net | 94.2 |
| | 78.5 |
|
| Non-trade amounts receivable, net | 47.5 |
| | 39.4 |
|
| Prepaid expenses and other current assets | 23.3 |
| | 21.6 |
|
| Total current assets | 769.4 |
| | 849.2 |
|
| Deferred income tax benefits, net | 339.2 |
| | 391.3 |
|
| Property, plant and equipment, net | 273.1 |
| | 258.0 |
|
| Long-term receivables, less allowances of $23.3 million in 2011 and $18.8 million in 2010 | 23.2 |
| | 22.8 |
|
| Trademarks and tradenames | 157.1 |
| | 170.2 |
|
| Other intangible assets, net | 7.2 |
| | 10.2 |
|
| Goodwill | 241.4 |
| | 284.1 |
|
| Other assets, net | 33.6 |
| | 30.0 |
|
| Total assets | $ | 1,844.2 |
| | $ | 2,015.8 |
|
| LIABILITIES AND SHAREHOLDERS' EQUITY | |
| | |
|
| Accounts payable | $ | 157.2 |
| | $ | 153.1 |
|
| Short-term borrowings and current portion of long-term debt and capital lease obligations | 195.7 |
| | 1.9 |
|
| Accrued liabilities | 322.5 |
| | 345.4 |
|
| Total current liabilities | 675.4 |
| | 500.4 |
|
| Long-term debt and capital lease obligations | 415.2 |
| | 426.8 |
|
| Other liabilities | 252.8 |
| | 298.8 |
|
| Shareholders' equity: | |
| | |
|
| Preferred stock, $0.01 par value, 200,000,000 shares authorized; none issued | — |
| | — |
|
| Common stock, $0.01 par value, 600,000,000 shares authorized; 63,607,090 shares issued | 0.6 |
| | 0.6 |
|
| Paid-in capital | 126.8 |
| | 108.0 |
|
| Retained earnings | 1,091.7 |
| | 969.2 |
|
| Treasury stock 7,099,345 and 900,754 shares in 2011 and 2010, respectively, at cost | (422.8 | ) | | (41.5 | ) |
| Accumulated other comprehensive loss | (295.5 | ) | | (246.5 | ) |
| Total shareholders' equity | 500.8 |
| | 789.8 |
|
| Total liabilities and shareholders' equity | $ | 1,844.2 |
| | $ | 2,015.8 |
|
The accompanying notes are an integral part of these financial statements.
Tupperware Brands Corporation
Consolidated Statements of Shareholders' Equity and Comprehensive Income
|
| | | | | | | | | | | | | | | | | | | | | | | | | | | | | | | | |
| | Common Stock | | Treasury Stock | | Paid-In Capital | | Retained Earnings | | Accumulated Other Comprehensive Loss | | Total Shareholders' Equity | | Comprehensive Income |
| (In millions, except per share amounts) | Shares | | Dollars | | Shares | | Dollars | | | | | |
| December 27, 2008 | 62.4 | | $ | 0.6 |
| | 0.1 | | $ | (1.6 | ) | | $ | 56.4 |
| | $ | 743.2 |
| | $ | (324.6 | ) | | $ | 474.0 |
| | |
| Net income |
| |
| |
| |
| |
| | 175.1 |
| |
| | 175.1 |
| | $ | 175.1 |
|
| Other comprehensive income: |
| |
| |
| |
| |
| |
| |
| |
| | |
| Foreign currency translation adjustments |
| |
| |
| |
| |
| |
| | 57.5 |
| | 57.5 |
| | 57.5 |
|
| Net deferred gains on cash flow hedges, net of tax provision of $1.8 million |
| |
| |
| |
| |
| |
| | 3.3 |
| | 3.3 |
| | 3.3 |
|
| Pension and post retirement costs, net of tax provision of $0.3 million |
| |
| |
| |
| |
| |
| | 0.5 |
| | 0.5 |
| | 0.5 |
|
| Comprehensive income |
| |
| |
| |
| |
| |
| |
| |
| | $ | 236.4 |
|
| Cash dividends declared ($0.91 per share) |
| |
| |
| |
| |
| | (57.8 | ) | |
| | (57.8 | ) | | |
| Repurchase of common stock |
| |
| | 1.8 | | (77.0 | ) | |
| |
| |
| | (77.0 | ) | | |
| Income tax benefit from stock and option awards |
| |
| |
| |
| | 16.2 |
| |
| |
| | 16.2 |
| | |
| Stock and options issued for incentive plans | 1.2 | |
| | (1.3 | ) | | 51.8 |
| | 18.5 |
| | (24.4 | ) | |
| | 45.9 |
| | |
| December 26, 2009 | 63.6 | | $ | 0.6 |
| | 0.6 | | $ | (26.8 | ) | | $ | 91.1 |
| | $ | 836.1 |
| | $ | (263.3 | ) | | $ | 637.7 |
| | |
| Net income |
| |
| |
| |
| |
| | 225.6 |
| |
| | 225.6 |
| | $ | 225.6 |
|
| Other comprehensive income: |
| |
| |
| |
| |
| |
| |
| |
| | |
| Foreign currency translation adjustments |
| |
| |
| |
| |
| |
| | 18.7 |
| | 18.7 |
| | 18.7 |
|
| Net deferred gains on cash flow hedges, net of tax provision of $1.0 million |
| |
| |
| |
| |
| |
| | 2.6 |
| | 2.6 |
| | 2.6 |
|
| Pension and post retirement costs, net of tax benefit of $1.7 million |
| |
| |
| |
| |
| |
| | (4.5 | ) | | (4.5 | ) | | (4.5 | ) |
| Comprehensive income |
| |
| |
| |
| |
| |
| |
| |
| | $ | 242.4 |
|
| Cash dividends declared ($1.05 per share) |
| |
| |
| |
| |
| | (66.6 | ) | |
| | (66.6 | ) | | |
| Repurchase of common stock |
| |
| | 1.3 | | (60.3 | ) | |
| |
| |
| | (60.3 | ) | | |
| Income tax benefit from stock and option awards |
| |
| |
| |
| | 7.3 |
| |
| |
| | 7.3 |
| | |
| Stock and options issued for incentive plans |
| |
| | (1.0 | ) | | 45.6 |
| | 9.6 |
| | (25.9 | ) | |
| | 29.3 |
| | |
(continued on following page)
Tupperware Brands CorporationTUPPERWARE BRANDS CORPORATION
Consolidated Statements of Shareholders' Equity and Comprehensive Income - (Continued)CONSOLIDATED STATEMENTS OF COMPREHENSIVE INCOME
|
| | | | | | | | | | | | | | | | | | | | | | | | | | | | | | | | |
| | Common Stock | | Treasury Stock | | Paid-In Capital | | Retained Earnings | | Accumulated Other Comprehensive Loss | | Total Shareholders' Equity | | Comprehensive Income |
| (In millions, except per share amounts) | Shares | | Dollars | | Shares | | Dollars | | | | | |
| December 25, 2010 | 63.6 | | $ | 0.6 |
| | 0.9 | | $ | (41.5 | ) | | $ | 108.0 |
| | $ | 969.2 |
| | $ | (246.5 | ) | | $ | 789.8 |
| | |
| Net income |
| |
| |
| |
| |
| | 218.3 |
| |
| | 218.3 |
| | $ | 218.3 |
|
| Other comprehensive income: |
| |
| |
| |
| |
| |
| |
| |
| | |
| Foreign currency translation adjustments |
| |
| |
| |
| |
| |
| | (54.2 | ) | | (54.2 | ) | | (54.2 | ) |
| Change in cash flow hedges, net of tax provision of $8.7 million |
| |
| |
| |
| |
| |
| | 14.5 |
| | 14.5 |
| | 14.5 |
|
| Pension and post retirement costs, net of tax benefit of $1.9 million |
| |
| |
| |
| |
| |
| | (9.3 | ) | | (9.3 | ) | | (9.3 | ) |
| Comprehensive income |
| |
| |
| |
| |
| |
| |
| |
| | $ | 169.3 |
|
| Cash dividends declared ($1.20 per share) |
| |
| |
| |
| |
| | (72.5 | ) | |
| | (72.5 | ) | | |
| Repurchase of common stock |
| |
| | 7.1 | | (426.1 | ) | |
| |
| |
| | (426.1 | ) | | |
| Income tax benefit from stock and option awards |
| |
| |
| |
| | 9.3 |
| |
| |
| | 9.3 |
| | |
| Stock and options issued for incentive plans |
| |
| | (0.9 | ) | | 44.8 |
| | 9.5 |
| | (23.3 | ) | |
| | 31.0 |
| | |
| December 31, 2011 | 63.6 | | $ | 0.6 |
| | 7.1 | | $ | (422.8 | ) | | $ | 126.8 |
| | $ | 1,091.7 |
| | $ | (295.5 | ) | | $ | 500.8 |
| | |
|
| | | | | | | | | | | |
| (In millions) | December 29,
2012 | | December 31,
2011 | | December 25,
2010 |
| Net income | $ | 193.0 |
| | $ | 218.3 |
| | $ | 225.6 |
|
| Other comprehensive income (loss): | | | | | |
| Foreign currency translation adjustments | 32.2 |
| | (54.2 | ) | | 18.7 |
|
| Deferred (loss) gain on cash flow hedges, net of tax provision of $0.1, $8.7 and $1.0, respectively | (0.5 | ) | | 14.5 |
| | 2.6 |
|
| Pension and other post-retirement costs, net of tax benefit of $2.9, $2.9 and $1.7, respectively | (7.5 | ) | | (9.3 | ) | | (4.5 | ) |
| Other comprehensive income (loss) | 24.2 |
| | (49.0 | ) | | 16.8 |
|
| Total comprehensive income | $ | 217.2 |
| | $ | 169.3 |
| | $ | 242.4 |
|
The accompanying notes are an integral part of these financial statements.
Tupperware Brands Corporation
Consolidated Balance Sheets |
| | | | | | | |
| (In millions, except share amounts) | December 29,
2012 | | December 31,
2011 |
| ASSETS | |
| | |
|
| Cash and cash equivalents | $ | 119.8 |
| | $ | 138.2 |
|
| Accounts receivable, less allowances of $30.4 and $26.8, respectively | 173.4 |
| | 163.7 |
|
| Inventories | 313.9 |
| | 302.5 |
|
| Deferred income tax benefits, net | 94.9 |
| | 94.2 |
|
| Non-trade amounts receivable, net | 39.0 |
| | 47.5 |
|
| Prepaid expenses and other current assets | 25.5 |
| | 23.3 |
|
| Total current assets | 766.5 |
| | 769.4 |
|
| Deferred income tax benefits, net | 359.1 |
| | 317.6 |
|
| Property, plant and equipment, net | 298.8 |
| | 273.1 |
|
| Long-term receivables, less allowances of $22.4 and $23.3, respectively | 24.8 |
| | 23.2 |
|
| Trademarks and tradenames | 138.4 |
| | 157.1 |
|
| Other intangible assets, net | 5.0 |
| | 7.2 |
|
| Goodwill | 192.9 |
| | 241.4 |
|
| Other assets, net | 36.3 |
| | 33.6 |
|
| Total assets | $ | 1,821.8 |
| | $ | 1,822.6 |
|
| LIABILITIES AND SHAREHOLDERS' EQUITY | |
| | |
|
| Accounts payable | $ | 154.8 |
| | $ | 157.2 |
|
| Short-term borrowings and current portion of long-term debt and capital lease obligations | 203.4 |
| | 195.7 |
|
| Accrued liabilities | 336.3 |
| | 320.5 |
|
| Total current liabilities | 694.5 |
| | 673.4 |
|
| Long-term debt and capital lease obligations | 414.4 |
| | 415.2 |
|
| Other liabilities | 233.8 |
| | 233.2 |
|
| Shareholders' equity: | |
| | |
|
| Preferred stock, $0.01 par value, 200,000,000 shares authorized; none issued | — |
| | — |
|
| Common stock, $0.01 par value, 600,000,000 shares authorized; 63,607,090 shares issued | 0.6 |
| | 0.6 |
|
| Paid-in capital | 151.2 |
| | 126.8 |
|
| Retained earnings | 1,172.4 |
| | 1,091.7 |
|
| Treasury stock, 9,547,436 and 7,099,345 shares, respectively, at cost | (573.8 | ) | | (422.8 | ) |
| Accumulated other comprehensive loss | (271.3 | ) | | (295.5 | ) |
| Total shareholders' equity | 479.1 |
| | 500.8 |
|
| Total liabilities and shareholders' equity | $ | 1,821.8 |
| | $ | 1,822.6 |
|
The accompanying notes are an integral part of these financial statements.
Tupperware Brands Corporation
Consolidated Statements of Shareholders' Equity
|
| | | | | | | | | | | | | | | | | | | | | | | | | | | | |
| | Common Stock | | Treasury Stock | | Paid-In Capital | | Retained Earnings | | Accumulated Other Comprehensive Loss | | Total Shareholders' Equity |
| (In millions, except per share amounts) | Shares | | Dollars | | Shares | | Dollars | | | | |
| December 26, 2009 | 63.6 | | $ | 0.6 |
| | 0.6 | | $ | (26.8 | ) | | $ | 91.1 |
| | $ | 836.1 |
| | $ | (263.3 | ) | | $ | 637.7 |
|
| Net income |
| |
| |
| |
| |
| | 225.6 |
| |
| | 225.6 |
|
| Other comprehensive income |
| |
| |
| |
| |
| |
| | 16.8 |
| | 16.8 |
|
| Cash dividends declared ($1.05 per share) |
| |
| |
| |
| |
| | (66.6 | ) | |
| | (66.6 | ) |
| Repurchase of common stock |
| |
| | 1.3 | | (60.3 | ) | |
| |
| |
| | (60.3 | ) |
| Income tax benefit from stock and option awards |
| |
| |
| |
| | 7.3 |
| |
| |
| | 7.3 |
|
| Stock and options issued for incentive plans |
| |
| | (1.0 | ) | | 45.6 |
| | 9.6 |
| | (25.9 | ) | |
| | 29.3 |
|
| December 25, 2010 | 63.6 | | $ | 0.6 |
| | 0.9 | | $ | (41.5 | ) | | $ | 108.0 |
| | $ | 969.2 |
| | $ | (246.5 | ) | | $ | 789.8 |
|
| Net income |
| |
| |
| |
| |
| | 218.3 |
| |
| | 218.3 |
|
| Other comprehensive loss |
| |
| |
| |
| |
| |
| | (49.0 | ) | | (49.0 | ) |
| Cash dividends declared ($1.20 per share) |
| |
| |
| |
| |
| | (72.5 | ) | |
| | (72.5 | ) |
| Repurchase of common stock |
| |
| | 7.1 | | (426.1 | ) | |
| |
| |
| | (426.1 | ) |
| Income tax benefit from stock and option awards |
| |
| |
| |
| | 9.3 |
| |
| |
| | 9.3 |
|
| Stock and options issued for incentive plans |
| |
| | (0.9 | ) | | 44.8 |
| | 9.5 |
| | (23.3 | ) | |
| | 31.0 |
|
| December 31, 2011 | 63.6 | | $ | 0.6 |
| | 7.1 | | $ | (422.8 | ) | | $ | 126.8 |
| | $ | 1,091.7 |
| | $ | (295.5 | ) | | $ | 500.8 |
|
| Net income | | | | | | | | | | | 193.0 |
| | | | 193.0 |
|
| Other comprehensive income | | | | | | | | | | | | | 24.2 |
| | 24.2 |
|
| Cash dividends declared ($1.44 per share) | | | | | | | | | | | (80.4 | ) | | | | (80.4 | ) |
| Repurchase of common stock | | | | | 3.3 | | (200.0 | ) | | | | | | | | (200.0 | ) |
| Income tax benefit from stock and option awards | | | | | | | | | 13.7 |
| | | | | | 13.7 |
|
| Stock and options issued for incentive plans | | | | | (0.8 | ) | | 49.0 |
| | 10.7 |
| | (31.9 | ) | | | | 27.8 |
|
| December 29, 2012 | 63.6 | | $ | 0.6 |
| | 9.6 | | $ | (573.8 | ) | | $ | 151.2 |
| | $ | 1,172.4 |
| | $ | (271.3 | ) | | $ | 479.1 |
|
The accompanying notes are an integral part of these financial statements.
Tupperware Brands Corporation
Consolidated Statements of Cash Flows
| | | | Year Ended | Year Ended |
| (In millions) | December 31,
2011 | | December 25,
2010 | | December 26,
2009 | December 29,
2012 | | December 31,
2011 | | December 25,
2010 |
| Operating Activities: | | | |
| | | | | |
| | |
| Net income | $ | 218.3 |
| | $ | 225.6 |
| | $ | 175.1 |
| $ | 193.0 |
| | $ | 218.3 |
| | $ | 225.6 |
|
| Adjustments to reconcile net income to net cash provided by operating activities: | |
| | |
| | | |
| | |
| | |
| Depreciation and amortization | 49.8 |
| | 49.7 |
| | 51.7 |
| 49.6 |
| | 49.8 |
| | 49.7 |
|
| Equity compensation | 18.0 |
| | 14.8 |
| | 13.2 |
| 20.1 |
| | 18.0 |
| | 14.8 |
|
| Unrealized foreign exchange losses | — |
| | 2.2 |
| | 3.9 |
| — |
| | — |
| | 2.2 |
|
| Amortization and write-off of deferred debt costs | 1.4 |
| | 0.7 |
| | 1.2 |
| 1.0 |
| | 1.4 |
| | 0.7 |
|
| Interest rate swap impairment | 18.9 |
| | — |
| | — |
| — |
| | 18.9 |
| | — |
|
| Net gains on disposal of assets, including insurance recoveries | (3.0 | ) | | (0.2 | ) | | (21.9 | ) | (7.9 | ) | | (3.0 | ) | | (0.2 | ) |
| Provision for bad debts | 11.5 |
| | 11.1 |
| | 7.9 |
| 10.9 |
| | 11.5 |
| | 11.1 |
|
| Write-down of inventories | 11.2 |
| | 18.7 |
| | 16.2 |
| 13.6 |
| | 11.2 |
| | 18.7 |
|
| Non-cash impact of impairment costs | 36.5 |
| | 4.4 |
| | 30.2 |
| |
| Non-cash impact of impairment costs and re-engineering | | 93.3 |
| | 36.5 |
| | 4.4 |
|
| Net change in deferred income taxes | (8.8 | ) | | 8.7 |
| | (16.3 | ) | (30.3 | ) | | (8.8 | ) | | 8.7 |
|
| Excess tax benefits from share-based payment arrangements | (9.0 | ) | | (7.0 | ) | | (14.7 | ) | (13.5 | ) | | (9.0 | ) | | (7.0 | ) |
| Changes in assets and liabilities: | |
| | |
| | | |
| | |
| | |
| Accounts and notes receivable | (1.7 | ) | | (18.0 | ) | | (23.0 | ) | (21.0 | ) | | (1.7 | ) | | (18.0 | ) |
| Inventories | (49.5 | ) | | (28.9 | ) | | 4.2 |
| (23.3 | ) | | (49.5 | ) | | (28.9 | ) |
| Non-trade amounts receivable | (4.2 | ) | | (2.3 | ) | | (7.9 | ) | 1.1 |
| | (4.2 | ) | | (2.3 | ) |
| Prepaid expenses | (1.8 | ) | | 2.9 |
| | 1.1 |
| (0.8 | ) | | (1.8 | ) | | 2.9 |
|
| Other assets | (2.0 | ) | | (3.1 | ) | | 2.2 |
| (6.4 | ) | | (2.0 | ) | | (3.1 | ) |
| Accounts payable and accrued liabilities | (12.1 | ) | | 37.3 |
| | 21.8 |
| 10.6 |
| | (12.1 | ) | | 37.3 |
|
| Income taxes payable | (8.9 | ) | | (15.3 | ) | | (6.9 | ) | 3.8 |
| | (8.9 | ) | | (15.3 | ) |
| Other liabilities | 1.1 |
| | 3.7 |
| | 0.2 |
| 2.7 |
| | 1.1 |
| | 3.7 |
|
| Proceeds from insurance recoveries, net of costs | 3.0 |
| | — |
| | — |
| 0.2 |
| | 3.0 |
| | — |
|
| Net cash impact from hedging activity | 6.1 |
| | (5.9 | ) | | 12.7 |
| 2.1 |
| | 6.1 |
| | (5.9 | ) |
| Other | (0.1 | ) | | 0.4 |
| | — |
| (0.1 | ) | | (0.1 | ) | | 0.4 |
|
| Net cash provided by operating activities | 274.7 |
| | 299.5 |
| | 250.9 |
| 298.7 |
| | 274.7 |
| | 299.5 |
|
| Investing Activities: | |
| | |
| | | |
| | |
| | |
| Capital expenditures | (73.9 | ) | | (56.1 | ) | | (46.4 | ) | (75.6 | ) | | (73.9 | ) | | (56.1 | ) |
| Proceeds from disposal of property, plant and equipment | 5.0 |
| | 10.0 |
| | 8.8 |
| 10.8 |
| | 5.0 |
| | 10.0 |
|
| Proceeds from insurance recoveries | — |
| | — |
| | 10.7 |
| |
| Net cash used in investing activities | (68.9 | ) | | (46.1 | ) | | (26.9 | ) | (64.8 | ) | | (68.9 | ) | | (46.1 | ) |
| Financing Activities: | |
| | |
| | | |
| | |
| | |
| Dividend payments to shareholders | (73.8 | ) | | (63.2 | ) | | (55.0 | ) | (77.6 | ) | | (73.8 | ) | | (63.2 | ) |
Net proceeds from issuance of Senior Notes(1) | 393.3 |
| | — |
| | — |
| — |
| | 393.3 |
| | — |
|
| Proceeds from exercise of stock options | 16.1 |
| | 16.8 |
| | 39.4 |
| 12.9 |
| | 16.1 |
| | 16.8 |
|
| Repurchase of common stock | (428.6 | ) | | (62.5 | ) | | (83.2 | ) | (205.0 | ) | | (428.6 | ) | | (62.5 | ) |
| Repayment of long-term debt and capital lease obligations | (407.4 | ) | | (2.2 | ) | | (141.8 | ) | (2.3 | ) | | (407.4 | ) | | (2.2 | ) |
| Net change in short-term debt | 193.5 |
| | 0.2 |
| | (1.9 | ) | 6.0 |
| | 193.5 |
| | 0.2 |
|
| Debt issuance costs | (3.0 | ) | | — |
| | — |
| — |
| | (3.0 | ) | | — |
|
| Excess tax benefits from share-based payment arrangements | 9.0 |
| | 7.0 |
| | 14.7 |
| 13.5 |
| | 9.0 |
| | 7.0 |
|
| Net cash used in financing activities | (300.9 | ) | | (103.9 | ) | | (227.8 | ) | (252.5 | ) | | (300.9 | ) | | (103.9 | ) |
| Effect of exchange rate changes on cash and cash equivalents | (15.4 | ) | | (13.2 | ) | | (8.6 | ) | 0.2 |
| | (15.4 | ) | | (13.2 | ) |
| Net change in cash and cash equivalents | (110.5 | ) | | 136.3 |
| | (12.4 | ) | (18.4 | ) | | (110.5 | ) | | 136.3 |
|
| Cash and cash equivalents at beginning of year | 248.7 |
| | 112.4 |
| | 124.8 |
| 138.2 |
| | 248.7 |
| | 112.4 |
|
| Cash and cash equivalents at end of period | $ | 138.2 |
| | $ | 248.7 |
| | $ | 112.4 |
| |
| Cash and cash equivalents at end of year | | $ | 119.8 |
| | $ | 138.2 |
| | $ | 248.7 |
|
(1) In addition to a debt discount, $400 million of proceeds from issuance of Senior Notes was reduced by $2.6 million for non-cash debt issuance costs.
The accompanying notes are an integral part of these financial statements.
Notes to the Consolidated Financial Statements
| |
| Note 1: | Summary of Significant Accounting Policies |
Principles of Consolidation. The Consolidated Financial Statements include the accounts of Tupperware Brands Corporation and all of its subsidiaries (Tupperware Brands or the Company). All significant intercompany accounts and transactions have been eliminated. The Company'sCompany’s fiscal year ends on the last Saturday of December and, as a result, the 2011 fiscal year containsincluded 52 weeks during 2012 and 2010 and 53 weeks as compared within 522011 weeks for fiscal years 2010 and 2009..
Use of Estimates. The preparation of financial statements in conformity with accounting principles generally accepted in the United States of America requires management to make estimates and assumptions. These estimates and assumptions affect the reported amounts of assets and liabilities and disclosure of contingent liabilities at the date of the financial statements, as well as the reported amounts of revenues and expenses during the reporting period. Actual results could differ materially from these estimates.
Out-of-Period Amounts. In 2010, the Company identified certain accounting errors in its Consolidated Financial Statements for the first quarter of 2010 and periods prior to 2010. These errors were corrected in the second quarter of 2010, and the negative impact on full year 2010 net income was $6.0 million. The amounts related to errors identified in the financial reporting at the Company's Russian subsidiary, which resulted in overstatements of sales, including promotional credits that had not been recorded timely, prepaid expenses that should have been reflected in expenses in earlier time periods, inappropriate levels of accruals for certain promotional events and other operating liabilities and insufficient bad debt reserves. The Company determined that the errors were not material to the financial statements in the periods in which they originated or the period in which they were corrected and, accordingly, a restatement of the financial statements was not necessary.
Cash and Cash Equivalents. The Company considers all highly liquid investments with a maturity of three months or less when purchased to be cash equivalents. As of December 31, 201129, 2012 and December 25, 201031, 2011, $28.620.8 million and $19.028.6 million, respectively, of the cash and cash equivalents included on the Consolidated Balance Sheets were held in the form of time deposits, certificates of deposit or similar instruments.
Allowance for Doubtful Accounts. The Company maintains current receivable amounts with most of its independent distributors and sales force in certain markets. It also maintains long-term receivable amounts with certain of these customers. The Company regularly monitors and assesses its risk of not collecting amounts owed to it by customers. This evaluation is based upon an analysis of amounts current and past due, along with relevant history and facts particular to the customer. It is also based upon estimates of distributor business prospects, particularly related to the evaluation of the recoverability of long-term amounts due. This evaluation is performed market by market and account by account, based upon historical experience, market penetration levels and similar factors. It also considers collateral of the customer that could be recovered to satisfy debts. The Company records its allowance for uncollectible accounts based on the results of this analysis. The analysis requires the Company to make significant estimates and as such, changes in facts and circumstances could result in material changes in the allowance for doubtful accounts. The Company considers any receivable balance not collected within its contractual terms past due.
Inventories. Inventories are valued at the lower of cost or market on a FIFOfirst-in, first-out basis. Inventory cost includes cost of raw material, labor and overhead. The Company writes down its inventory for obsolescence or unmarketability in an amount equal to the difference between the cost of the inventory and estimated market value based upon expected future demand and pricing. The demand and pricing is estimated based upon the historical success of product lines as well as the projected success of promotional programs, new product introductions and new markets or distribution channels. The Company prepares projections of demand and pricing on an item by item basis for all of its products. If inventory on hand exceeds projected demand or the expected market value is less than the carrying value, the excess is written down to its net realizable value. However, if actual demand or the estimate of market decreases, additional write-downs would be required.
Internal Use Software Development Costs. The Company capitalizes internal use software development costs as they are incurred and amortizes such costs over their estimated useful lives of three to five years, beginning when the software is placed in service. Net unamortized costs of such amounts included in property, plant and equipment were $8.515.3 million and $9.68.5 million at December 31, 201129, 2012 and December 25, 201031, 2011, respectively. Amortization cost related to internal use software development costs totaled $3.13.5 million, $3.33.1 million and $3.43.3 million in 20112012, 20102011 and 20092010, respectively.
Property, Plant and Equipment. Property, plant and equipment is initially stated at cost. Depreciation is recorded on a straight-line basis over the following estimated useful lives of the assets:
|
| |
| | Years |
| Building and improvements | 10 - 40 |
| Molds | 4 - 10 |
| Production equipment | 10 - 20 |
| Distribution equipment | 5 - 10 |
| Computer/telecom equipment | 3 - 5 |
| Capitalized software | 3 - 5 |
Depreciation expense was $43.844.1 million, $42.543.8 million and $43.242.5 million in 20112012, 20102011 and 20092010, respectively. The Company considers the need for an impairment review when events occur that indicate that the book value of a long-lived asset may exceed its recoverable value. Impairments of property, plant and equipment are discussed further in Note 2 to the Consolidated Financial Statements. Upon the sale or retirement of property, plant and equipment, a gain or loss is recognized equal to the difference between sales price and net book value. Expenditures for maintenance and repairs are charged to cost of products sold or delivery, sales and administrative (DS&A) expense, depending on the asset to which the expenditure relates.
Goodwill. The Company's recorded goodwill relates primarily to that generated by its acquisition of the Sara Lee Direct Sellingdirect-to-consumer businesses in December 2005 and BeautiControl in October 2000. The Company conducts an annual impairment testassessment of its recorded goodwill in each of its eight reporting units during the third quarter of each year, except for goodwill associated with BeautiControl, which is completed in the second quarter. Additionally, in the event of a change in circumstances that leads the Company to determine that a triggering event for impairment testing has occurred, a test is completed at that time. The annual process for evaluating goodwill begins with an assessment for each entity of qualitative factors to determine whether the two-step goodwill impairment test foris necessary. Further testing is only performed if the Company determines that it is more likely than not that the reporting unit's fair value is less than its carrying value. The qualitative factors evaluated by the Company include: macro-economic conditions of the local business environment, overall financial performance, sensitivity analysis from the most recent step one fair value test, and other entity specific factors as deemed appropriate. When the Company determines the two-step goodwill impairment test is necessary, the first step involves comparing the fair value of thea reporting unitsunit to theirits carrying amounts.amount, including goodwill, after any long-lived asset impairment charges. If the carrying amount of athe reporting unit exceeds its fair value, a second step is requiredperformed to measure fordetermine whether there is a goodwill impairment, and if so, the amount of the loss. This step revalues all assets and liabilities of the reporting unit to their current fair valuesvalue and then compares the implied fair value of the reporting unit's goodwill to the carrying amount of that goodwill. If the carrying amount of the reporting unit's goodwill exceeds the implied fair value of the goodwill, an impairment loss is recognized in an amount equal to the excess. Prior to 2012, the Company's annual assessment began with the two-step impairment test.
FairWhen a determination of fair value of the Company's eightreporting units is necessary, it is determined by using either the income approach or a combination of the income and market approaches, with a greater weighting on the income approach (75 percent). The income approach, or discounted cash flow approach, requires significant assumptions to determine the fair value of each reporting unit. These include estimates regarding future operations and the ability to generate cash flows including projections of revenue, costs, utilization of assets and capital requirements, along with an estimate as to the appropriate discount rates to be used. Goodwill is further discussed in Note 6 to the Consolidated Financial Statements.
Intangible Assets. Intangible assets are recorded at their fair market values at the date of acquisition and definite lived intangibles are amortized over their estimated useful lives. The intangible assets included in the Company's Consolidated Financial Statements at December 31, 201129, 2012 and December 25, 201031, 2011 arewere related to the acquisition of the Sara Lee Direct Sellingdirect-to-consumer businesses in December 2005. The weighted average estimated useful lives of the Company's intangible assets arewere as follows:
|
| |
| | Weighted Average Estimated Useful Life |
| Trademarks and tradenames | Indefinite |
| Sales force relationships - single level | 6 - 8 years |
Sales force relationships - multi tiertiered | 10 - 12 years |
| Acquired proprietary product formulations | 3 years |
The Company's indefinite lived intangible assets are evaluated for impairment annually similarly to goodwill, as discussed above. Thegoodwill. When necessary, the fair value of these assets is determined using the relief from royalty method, which is a form of the income approach. In this method, the value of the asset is calculated by selecting royalty rates, which estimate the amount a company would be willing to pay for the use of the asset. These rates are applied to the Company's projected revenue, tax affected and discounted to present value using an appropriate rate.
The Company's definite lived intangible assets consist of the value of the acquired independent sales force and product formulations. The Company amortizes project formulas over a straight line basis and as of December 31, 201129, 2012, the amount from the acquisition of the Sara Lee Direct Sellingdirect-to-consumer units had been fully amortized. The sales force relationships are amortized to reflect the estimated turnover rates of the sales force acquired and are included in Distribution, SellingDelivery, Sales and Administration expense (DS&A) on the Consolidated Statements of Income.
Intangible assets are further discussed in Note 6 to the Consolidated Financial Statements.
Promotional and Other Accruals. The Company frequently makes promotional offers to members of its independent sales force to encourage them to fulfill specific goals or targets for sales levels, party attendance, recruiting of new sales force members or other business-critical functions. The awards offered are in the form of cash, product, awards, special prizes or trips.
A program is generally designed to recognize sales force members for achieving a primary objective. An example is to reward the independent sales force for recruiting new sales force members. In this situation, the Company offers a prize to sales force members that achieve a targeted number of recruits over a specified period. The period runs from a couple of weeks to several months. The prizes are generally graded, in that meeting one level may result in receiving a piece of jewelry, with higher achievement resulting in more valuable prizes such as a television set or a trip. Similar programs are designed to reward current sales force members who reach certain goals by promoting them to a higher level in the organization where their earning opportunity would be expanded, and they would take on additional responsibilities for recruiting new sales force members and providing training and motivation to new and existing sales force members. Other business drivers, such as scheduling parties, increasing the number of sales force members, holding parties or increasing end consumer attendance at parties, may also be the focus of a program.
The Company also offers cash awards for achieving targeted sales levels. These types of awards are generally based upon the sales achievement of at least a mid-level member of the sales force and her or his down-line members. The down-line consists of those sales force members that have been recruited directly by a given sales force member, as well as those recruited by her or his recruits. In this manner, sales force members can build an extensive organization over time if they are committed to recruiting and developing their units. In addition to the bonus, the positive performance of a unit may also entitle its leader to the use of a company-provided vehicle and in some cases, the permanent awarding of a vehicle. Similar to the prize programs noted earlier, these programs generally offer varying levels of vehicles that are dependent upon performance.
The Company accrues for the costs of these awards during the period over which the sales force qualifies for the award and reports these costs primarily as a component of DS&A expense. These accruals require estimates as to the cost of the awards, based upon estimates of achievement and actual cost to be incurred. During the qualification period, actual results are monitored and changes to the original estimates are made when known. Promotional and other sales force compensation expenses included in DS&A expense totaled $436.4425.3 million, $381.0436.4 million and $357.1381.0 million in 20112012, 20102011 and 20092010, respectively.
Like promotional accruals, other accruals are recorded at the time when a liability is probable and the amount is reasonably estimable. Adjustments to amounts previously accrued are made when changes occur in the facts and circumstances that generated the accrual.
Revenue Recognition. Revenue is recognized when the price is fixed, the risks and rewards of ownership have passed to the customer who, in most cases, is one of the Company’s independent distributors or a member of its independent sales force, and when collection is reasonably assured. When revenue is recorded, estimates of returns are made and recorded as a reduction of revenue. Discounts earned based on promotional programs in place, volume of purchases or other factors are also estimated at the time of revenue recognition and recorded as a reduction of that revenue.
Shipping and Handling Costs. The cost of products sold line item includes costs related to the purchase and manufacture of goods sold by the Company. Among these costs are inbound freight charges, purchasing and receiving costs, inspection costs, depreciation expense, internal transfer costs and warehousing costs of raw material, work in process and packing materials. The warehousing and distribution costs of finished goods are included in DS&A expense. Distribution costs are comprised of outbound freight and associated labor costs. Fees billed to customers associated with the distribution of products are classified as revenue. The distribution costs included in DS&A expense in 20112012, 20102011 and 20092010 were $151.7148.8 million, $135.5151.7 million and $124.0135.5 million, respectively.
Advertising and Research and Development Costs. Advertising and research and development costs are charged to expense as incurred. Advertising expense totaled $34.231.5 million, $25.134.2 million and $19.025.1 million in 20112012, 20102011 and 20092010, respectively. Research and development costs totaled $19.518.9 million, $17.819.5 million and $18.017.8 million, in 20112012, 20102011 and 20092010, respectively. Research and development expenses primarily include salaries, contractor costs and facility costs. Both advertising and research and development costs are included in DS&A expense.
Accounting for Stock-Based Compensation. The Company has several stock-based employee and director compensation plans, which are described more fully in Note 14 to the Consolidated Financial Statements. The Company records compensation expense using the applicable accounting guidance for share-based payments related to stock options, restricted stock, restricted stock units and performance share awards granted to directors and employees.
Compensation cost for share-based awards is recorded on a straight line basis over the required service period. The fair value of the stock option grants is estimated using the Black-Scholes option-pricing model, which requires the input of assumptions, including dividend yield, risk-free interest rate, the estimated length of time employees will retain their vested stock options before exercising them (expected term) and the estimated volatility of the Company's common stock price over the expected term. Furthermore, in calculating compensation expense for these awards, the Company is also required to estimate the extent to which options will be forfeited prior to vesting (forfeitures).vesting. Many factors are considered when estimating expected forfeitures, including types of awards, employee class and historical experience. To the extent actual results or updated estimates of forfeiture differ from current estimates, such amounts are recorded as a cumulative adjustment to the previously recorded amounts. Compensation expense associated with restricted stock, restricted stock units and performance share awards is equal to the market value of the Company's common stock on the date of grant and is recorded pro rata over the required service period. For those awards with performance criteria, the expense is recorded based on an assessment of achieving the criteria.
Current guidance governing share based payments requires the benefits associated with tax deductions in excess of recognized compensation cost, generated upon the exercise of stock options, to be reported as a financing cash flow. For 20112012, 20102011 and 20092010, the Company generated $9.013.5 million, $7.09.0 million and $14.77.0 million of excess cash benefits from option exercises, respectively.
In January 2009, the terms of the then-outstanding stock options were modified to allow employees to net share settle when exercising their stock options. This modification of the awards had no material impact.
Accounting for Asset Retirement Obligations. Asset retirement obligations refer to a company's legal obligation to perform an asset retirement activity in which the timing and (or) method of settlement are conditional on a future event that may or may not be within the control of the entity. The obligation to perform the asset retirement activity is unconditional even though uncertainty exists about the timing and (or) method of settlement. Thus, the timing and (or) method of settlement may be conditional on a future event. Accordingly, a company is required to recognize a liability for the fair value of a conditional asset retirement obligation if the fair value of the liability can be reasonably estimated. The fair value of a liability for the conditional asset retirement obligation should be recognized when incurred-generally upon acquisition, construction, or development and (or) through the normal operation of the asset. Uncertainty about the timing and (or) method of settlement of a conditional asset retirement obligation should be factored into the measurement of the liability when sufficient information exists. The Company has recognized a liability for the fair market value of conditional future obligations associated with environmental issues at its manufacturing facilities in Belgium and the United States that the Company will be required to remedy at some future date, when these assets are retired. The Company performs an annual evaluation of its obligations regarding this matter and is required to record depreciation and costs associated with accretion of the obligation. This was not material in 20112012, 20102011 and 20092010, and is not expected to be material in the future.
Income Taxes. Deferred tax assets and liabilities are recognized for the future tax consequences attributable to temporary differences between the financial statement carrying amounts of assets and liabilities and their respective tax bases. Deferred tax assets also are recognized for credit carryforwards. Deferred tax assets and liabilities are measured using the enacted rates applicable to taxable income in the years in which the temporary differences are expected to reverse and the credits are expected to be used. The effect on deferred tax assets and liabilities of a change in tax rates is recognized in income in the period that includes the enactment date. An assessment is made as to whether or not a valuation allowance is required to offset deferred tax assets. This assessment requires estimates as to future operating results as well as an evaluation of the effectiveness of the Company's tax planning strategies. These estimates are made on an ongoing basis based upon the Company's business plans and growth strategies in each market and consequently, future material changes in the valuation allowance are possible.
The Company accounts for uncertain tax positions in accordance with ASC 740, Income taxes. This guidance prescribes a minimum probability threshold that a tax position must meet before a financial statement benefit is recognized. The minimum threshold is defined as a tax position that is more likely than not to be sustained upon examination by the applicable taxing authority, including resolution of any related appeals or litigation processes, based on the technical merits of the position. The tax benefit to be recognized is measured as the largest amount of benefit that is greater than 50 percent likely of being realized upon ultimate settlement.
Interest and penalties related to tax contingency or settlement items are recorded as a component of the provision for income taxes in the Company's Consolidated Statements of Income. The Company records accruals for tax contingencies as a component of accrued liabilities or other long-term liabilities on its balance sheet.
Net Income Per Common Share. Basic per share information is calculated by dividing net income by the weighted average number of shares outstanding. Diluted per share information is calculated by also considering the impact of potential common stock on both net income and the weighted average number of shares outstanding. The Company's potential common stock consists of employee and director stock options, restricted stock, restricted stock units and performance share units. Performance share awards are included in the diluted per share calculation when the performance criteria are achieved. The Company's potential common stock is excluded from the basic per share calculation and is included in the diluted per share calculation when doing so would not be anti-dilutive.
The Company accounts for unvested share based payment awards with a nonforfeitable right to receive dividends ("Participating Securities") using the two-class method of computing earnings per share. The Company had 0.2 million of unvested share-based payment awards outstanding that were classified as Participating Securities in 2010 and 2009, and none in2012 and 2011. The two-class method is an earnings allocation formula that determines earnings per share for common stock and Participating Securities, according to dividends declared and participation rights in undistributed earnings. Under that method, net income is reduced by the amount of dividends declared in the current period for common shareholders and Participating Securities holders. The remaining earnings, or undistributed earnings, are allocated between common stock and Participating Securities to the extent that each security would share in earnings as if all of the earnings for the period had been distributed. In applying the two-class method, the Company determined that undistributed earnings should be allocated equally on a per share basis for common stock and Participating Securities due to the rights of the Participating Securities holders and the Company's history of paying dividends equally on a per share basis.
The elements of the earnings per share computations were as follows (in millions, except per share amounts):
| | | | 2011 | | 2010 | | 2009 | 2012 | | 2011 | | 2010 |
| Net income | $ | 218.3 |
| | $ | 225.6 |
| | $ | 175.1 |
| $ | 193.0 |
| | $ | 218.3 |
| | $ | 225.6 |
|
| Less dividends declared: | | | | | | | | | | |
| To common shareholders | 72.5 |
| | 66.4 |
| | 57.5 |
| 80.4 |
| | 72.5 |
| | 66.4 |
|
| To participating security holders | — |
| | 0.2 |
| | 0.2 |
| — |
| | — |
| | 0.2 |
|
| Total undistributed earnings | $ | 145.8 |
| | $ | 159.0 |
| | $ | 117.4 |
| $ | 112.6 |
| | $ | 145.8 |
| | $ | 159.0 |
|
| Undistributed earnings to common shareholders | $ | 145.8 |
| | $ | 158.7 |
| | $ | 117.1 |
| $ | 112.6 |
| | $ | 145.8 |
| | $ | 158.7 |
|
| Undistributed earnings to participating security holders | — |
| | 0.3 |
| | 0.3 |
| — |
| | — |
| | 0.3 |
|
| Net income available to common shareholders for basic and diluted earnings per share | $ | 218.3 |
| | $ | 225.1 |
| | $ | 174.6 |
| $ | 193.0 |
| | $ | 218.3 |
| | $ | 225.1 |
|
| Weighted-average shares of common stock outstanding | 60.0 |
| | 62.6 |
| | 62.4 |
| 55.3 |
| | 60.0 |
| | 62.6 |
|
| Common equivalent shares: | | | | | | | | | | |
| Assumed exercise of dilutive options, restricted shares, restricted stock units and performance share units | 1.4 |
| | 1.2 |
| | 1.0 |
| 1.1 |
| | 1.4 |
| | 1.2 |
|
| Weighted-average common and common equivalent shares outstanding | 61.4 |
| | 63.8 |
| | 63.4 |
| 56.4 |
| | 61.4 |
| | 63.8 |
|
| Basic earnings per share | $ | 3.63 |
| | $ | 3.60 |
| | $ | 2.80 |
| $ | 3.49 |
| | $ | 3.63 |
| | $ | 3.60 |
|
| Diluted earnings per share | $ | 3.55 |
| | $ | 3.53 |
| | $ | 2.75 |
| $ | 3.42 |
| | $ | 3.55 |
| | $ | 3.53 |
|
| Shares excluded from the determination of potential common stock because inclusion would have been anti-dilutive | 0.6 |
| | 0.5 |
| | 1.7 |
| 0.4 |
| | 0.6 |
| | 0.5 |
|
Derivative Financial Instruments. The Company recognizes all derivative instruments as either assets or liabilities in its Consolidated Balance Sheets and measures those instruments at fair value. If certain conditions are met, a derivative may be specifically designated as a hedge. The accounting for changes in the value of a derivative accounted for as a hedge depends on the intended use of the derivative and the resulting designation of the hedge exposure. Depending on how the hedge is used and the designation, the gain or loss due to changes in value is reported either in earnings or initially in other comprehensive income. Gains or losses that are reported in other comprehensive income eventually are recognized in earnings, with the timing of this recognition governed by ASC 815, Derivatives and Hedging.
The Company uses derivative financial instruments, principally over-the-counter forward exchange contracts and local currency options with major international financial institutions, to offset the effects of exchange rate changes on net investments in certain foreign subsidiaries, certain forecasted purchases, certain intercompany loan transactions, and certain accounts payable. Gains and losses on instruments designated as hedges of net investments in a foreign subsidiary or intercompany transactions that are permanent in nature are accrued as exchange rates change, and are recognized in shareholders' equity as a component of foreign currency translation adjustments within accumulated other comprehensive loss. Forward points and option costs associated with these net investment hedges are included in interest expense and other expense, respectively. Gains and losses on contracts designated as hedges of intercompany transactions that are not permanent in nature are accrued as exchange rates change and are recognized in income.
Gains and losses on contracts designated as hedges of identifiable foreign currency forecasted purchases are deferred and included in other comprehensive income. The Company previously utilized interest rate swap agreements to convert a portion of its floating rate U.S. dollar long-term debt to fixed rate U.S. dollar debt under its credit facility that was terminated in 2011. Changes in the underlying market value of swap arrangements that qualify as cash flow hedging activities are recorded as a component of other comprehensive income. Changes in the market value of swaps that do not qualify as cash flow hedges are recorded in income each period. See Note 8 to the Consolidated Financial Statements.
Foreign Currency Translation. Results of operations of foreign subsidiaries are translated into U.S. dollars using average exchange rates during the year. The assets and liabilities of those subsidiaries, other than those of operations in highly inflationary countries, are translated into U.S. dollars using exchange rates at the balance sheet date. The related translation adjustments are included in accumulated other comprehensive loss. Foreign currency transaction gains and losses, as well as re-measurement of financial statements of subsidiaries in highly inflationary countries, are included in income.
Prior to December 2009,2010, the Company utilized the official exchange rate in Venezuela to translate the sales and profit results of the subsidiary. In December 2009,At the Company considered its past and continued intent to use the parallel exchange rate to settle its U.S. dollar-denominated liabilities and the fact that the Company no longer expected to remit dividends at the official rate. In viewbeginning of these facts and circumstances existing, the Company determined that effective December 26, 2009, it would use the parallel rate to translate the operations of its Venezuelan subsidiary. As a result of this decision, the Company recorded a pretax loss of $3.5 million related to remeasuring the non-Venezuelan bolivar denominated balances as of year end 2009. Furthermore,2010, the Company began translating the Venezuelan sales and profit results at the parallel rate as of the beginning of 2010.a "parallel rate" that was available. In May 2010, the Venezuelan government closed the use of the parallel rate, and consequently, from that time forward, this rate iswas no longer available and has not been used to translate the results in Venezuela. In June 2010, several large Venezuelan commercial banks began operating the Transaction System for Foreign Currency Denominated Securities (SITME), which established a new “banded” exchange rate.rate of 5.3 bolivar to the U.S. dollar. As the Company believed this would be the primary rate at which it would settle its non-bolivar denominated liabilities and repatriate dividends, it began translating its bolivar denominated transactions and balances at this rate beginning in June 2010. There were no changes to this rate in 2012; however, in February 2013, the Venezuelan government set a new official exchange rate of 6.3 bolivars to the U.S. dollar and abolished the banded exchange rate. As a result, the Company will use the new official rate to translate sales and profit results of the subsidiary unless a more appropriate rate for settling its non-bolivar denominated liabilities and repatriating dividends becomes available.
Inflation in Venezuela has been at relatively high levels over the past few years. The Company uses a blended index of the Consumer Price Index and National Consumer Price Index for determining highly inflationary status in Venezuela. This blended index reached cumulative three-year inflation in excess of 100 percent at November 30, 2009 and as such, the Company transitioned to highly inflationary status at the beginning of its 2010 fiscal year. Gains and losses resulting from the translation of the financial statements of subsidiaries operating in highly inflationary economies are recorded in earnings. The Company continued to use the banded rate of 5.3 bolivar to the U.S. dollar in 2012. The impact of the changes in the value of the Venezuelan bolivar versus the U.S. dollar on earnings in 2011 and 2010 was not significant. As of the end of 20112012, the Company had approximately $1317 million of net monetary assets in Venezuela, which arewere of a nature that would generate income or expense associated with future exchange rate fluctuations versus the U.S. dollar. At the end of 2012, there was also $9 million of inventory on the balance sheet in Venezuela, which when it is sold will be included in cost of sales at the dollar value at which it was originally recorded.
Product Warranty. Tupperware® brand products are guaranteed against chipping, cracking, breaking or peeling under normal non-commercial use of the product with certain limitations. The cost of replacing defective products is not material.
New Accounting Pronouncements. In January 2011, the Financial Accounting Standards Board ("FASB") issued an amendment to defer the effective date of disclosures about troubled debt restructuring to interim and annual periods ending after June 15, 2011. The guidance on troubled debt restructuring did not impact the Company's disclosures included in its Consolidated Financial Statements.
In May 2011, the FASB issued amendments to existing guidance regarding fair value measurement practices. The amendments provide a consistent definition of fair value measurement and disclosure requirements between U.S. GAAP and International Financial Reporting Standards. Consequently, the amendments change certain fair value measurement principles and disclosure requirements under U.S. GAAP. For public companies, the amendments are effective for interim and annual periods beginning after December 15, 2011. The Company does not believe the amendments will have a significant impact on its Consolidated Financial Statements.
In June 2011, the FASB issued an amendment to existing guidance regarding comprehensive income. Under the amendment, an entity has the option to present the total of comprehensive income, the components of net income, and the components of other comprehensive income either in a single continuous statement of comprehensive income or in two separate but consecutive statements. For public companies, the amendment is effective for the fiscal years beginning after December 15, 2011. In December 2011, the FASB issued an amendment to its June 2011 guidance to defer the changes in that update that relate to the presentation of reclassification adjustments. All other requirements of the June 2011 amendment are not affected by this deferral. As a result, in 2012, the Company will change its presentation of comprehensive income.
In September 2011, the FASB issued amendments to existing guidance regarding goodwill impairment testing. The amendments permit an entity to first assess qualitative factors to determine whether it is more likely than not that the fair value of a reporting unit is less than its carrying amount, as a basis for determining whether it is necessary to perform the two-step goodwill impairment test. The amendments are effective for all companies for annual and interim goodwill impairment tests performed for fiscal years beginning after December 15, 2011, but early adoption is permitted. The Company has elected to adopt this guidance as of fiscal year 2012, and it does not believe the amendments will have an impact on its Consolidated Financial Statements.
In December 2011, the FASB issued an amendment to existing guidance regarding disclosures about offsetting assets and liabilities. The amendment requires an entityIn January 2013, the FASB amended the guidance to disclose information about offsettinglimit the scope to derivative instruments, repurchase agreements and related arrangements to enable users of its financial statements to understand the effect of those arrangements on its financial position. The amendment iscertain securities transactions. Both amendments are effective for annual reporting periods beginning on or after January 1, 2013, and interim periods within those annual periods. As the Company does not intend to use the right of offset in presenting itsthe applicable assets or liabilities, the amendment will not have an impact on its Consolidated Financial Statements.
In July 2012, the FASB issued amendments to existing guidance regarding indefinite-lived intangible asset impairment testing. The amendments permit an entity to first make an assessment using qualitative factors to determine whether it is more likely than not that the fair value of an indefinite-lived intangible asset is less than its carrying amount, as a basis for determining whether it is necessary to perform a quantitative impairment test. The amendments are effective for annual and interim impairment tests performed for fiscal years beginning after September 15, 2012, but early adoption is permitted. The Company adopted this guidance for its annual impairment testing completed during the third quarter 2012. The amendment did not have an impact on the Consolidated Financial Statements.
In February 2013, the FASB issued an amendment to existing guidance regarding the reporting of amounts reclassified out of accumulated other comprehensive income. The amendment requires an entity to present information about reclassification adjustments from accumulated other comprehensive income in its annual financial statements in a single note or on the face of the financial statements. The amendment is effective prospectively for reporting periods beginning after December 15, 2012. As substantially all of the information that this amendment requires is already disclosed elsewhere in the Company's financial statements, it will not have a significant impact on the Consolidated Financial Statements.
Reclassifications. Certain prior year amounts have been reclassified in the Consolidated Financial Statements to conform to current year presentation.
| |
| Note 2: | Re-engineering Costs |
The Company continually reviews its business models and operating methods for opportunities to increase efficiencies and/or align costs with business performance. Pretax costs incurred in the re-engineering and impairment charges caption by category were as follows:
| | | (In millions) | 2011 | | 2010 | | 2009 | 2012 | | 2011 | | 2010 |
| Severance | $ | 5.9 |
| | $ | 6.5 |
| | $ | 5.2 |
| $ | 5.3 |
| | $ | 5.9 |
| | $ | 6.5 |
|
| Asset impairment/facility moving costs | 2.0 |
| | 1.1 |
| | 2.8 |
| |
| Other | | 17.1 |
| | 2.0 |
| | 1.1 |
|
| Total re-engineering and impairment charges | $ | 7.9 |
| | $ | 7.6 |
| | $ | 8.0 |
| $ | 22.4 |
| | $ | 7.9 |
| | $ | 7.6 |
|
The Company recorded re-engineering and impairment charges of$5.3 million, $5.9 million, and $6.5 million and $5.2 millionin 20112012, 20102011 and 20092010, respectively, related to severance costs incurred to reduce head count in various units, mainly due to implementing changes in the businesses' management structures. These costs were primarily related to operations in Argentina, Australia, Fuller Mexico, Japan and exiting the Nutrimetics businesses in Greece and the United Kingdom in 2012; France, Fuller Mexico, Japan and Malaysia in 2011; and Australia, France and Japan in 2010;2010.In 2012, re-engineering and Australia, BeautiControl, France, Fuller Mexicoimpairment charges included$0.9 millionin exit costs, primarily related to the decision to cease operating the Nutrimetics businesses in Greece and Japanthe United Kingdom. Also in 2009.connection with the liquidation of the Nutrimetics business in the United Kingdom, the Company incurred a$16.2 millionnon-cash charge that related to the reclassification of currency translation adjustments from accumulated other comprehensive loss into operating income. In 2011, re-engineering and impairment charges also included$1.3 millionrelated to the decision to merge the Nutrimetics and Tupperware businesses in Malaysia and$0.7 millionrelated to asset impairments, exit activities and relocation costs. In 2010, re-engineering and impairment charges also included$1.1 millionrelated to moving costs and the impairment of property, plant and equipment associated with the relocation of certaina manufacturing facilitiesfacility in Japan. In 2009, these costs also included $2.1 million related to the impairment
Pretax costs incurred in connection with the re-engineering program included above and allocated to cost of products sold were as follows:
| | | (In millions) | 2011 | | 2010 | | 2009 | 2012 | | 2011 | | 2010 |
| Re-engineering and impairment charges | $ | 7.9 |
| | $ | 7.6 |
| | $ | 8.0 |
| $ | 22.4 |
| | $ | 7.9 |
| | $ | 7.6 |
|
| Cost of products sold | 1.7 |
| | — |
| | — |
| 0.2 |
| | 1.7 |
| | — |
|
| Total pretax re-engineering costs | $ | 9.6 |
| | $ | 7.6 |
| | $ | 8.0 |
| $ | 22.6 |
| | $ | 9.6 |
| | $ | 7.6 |
|
The balances included in accrued liabilities related to re-engineering and impairment charges as of December 31, 201129, 2012, December 25, 201031, 2011, and December 26, 200925, 2010 were as follows:
| | | (In millions) | 2011 | | 2010 | | 2009 | 2012 | | 2011 | | 2010 |
| Beginning balance | $ | 2.4 |
| | $ | 1.5 |
| | $ | 2.2 |
| $ | 3.0 |
| | $ | 2.4 |
| | $ | 1.5 |
|
| Provision | 7.9 |
| | 7.6 |
| | 8.0 |
| 22.4 |
| | 7.9 |
| | 7.6 |
|
| Cash expenditures: |
|
| | |
| | |
|
| | |
| | |
| Severance | (5.7 | ) | | (5.5 | ) | | (5.4 | ) | (6.0 | ) | | (5.7 | ) | | (5.5 | ) |
| Other | (1.1 | ) | | (1.1 | ) | | (1.2 | ) | (1.7 | ) | | (1.1 | ) | | (1.1 | ) |
| Non-cash asset impairments | (0.5 | ) | | (0.1 | ) | | (2.1 | ) | |
| Non-cash charges | | (16.2 | ) | | (0.5 | ) | | (0.1 | ) |
| Ending balance | $ | 3.0 |
| | $ | 2.4 |
| | $ | 1.5 |
| $ | 1.5 |
| | $ | 3.0 |
| | $ | 2.4 |
|
The accrual balance as of December 31, 201129, 2012, relates primarily to severance payments expected to be made by the end of the second quarter of 2012.2013. In connection with the decision to cease operating the Nutrimetics businesses in Greece and the United Kingdom in 2012 and Malaysia in 2011, the Company recorded acharges of $0.2 million and $1.7 million charge, respectively, to cost of sales for inventory obsolescence.
| | | (In millions) | 2011 | | 2010 | 2012 | | 2011 |
| Finished goods | $ | 206.4 |
| | $ | 184.7 |
| $ | 251.2 |
| | $ | 241.0 |
|
| Work in process | 22.0 |
| | 20.0 |
| 22.9 |
| | 22.0 |
|
| Raw materials and supplies | 74.1 |
| | 74.4 |
| 39.8 |
| | 39.5 |
|
| Total inventories | $ | 302.5 |
| | $ | 279.1 |
| $ | 313.9 |
| | $ | 302.5 |
|
| |
| Note 4: | Property, Plant and Equipment |
| | | (In millions) | 2011 | | 2010 | 2012 | | 2011 |
| Land | $ | 51.1 |
| | $ | 49.0 |
| $ | 52.0 |
| | $ | 51.1 |
|
| Buildings and improvements | 216.3 |
| | 212.3 |
| 220.0 |
| | 216.3 |
|
| Molds | 582.3 |
| | 570.2 |
| 610.0 |
| | 582.3 |
|
| Production equipment | 298.8 |
| | 282.6 |
| 315.2 |
| | 298.8 |
|
| Distribution equipment | 45.4 |
| | 47.9 |
| 43.2 |
| | 45.4 |
|
| Computer/telecom equipment | 65.0 |
| | 70.5 |
| 60.9 |
| | 65.0 |
|
| Furniture and fixtures | 24.7 |
| | 24.7 |
| 24.5 |
| | 24.7 |
|
| Capitalized software | 60.2 |
| | 58.0 |
| 69.5 |
| | 60.2 |
|
| Construction in progress | 34.0 |
| | 17.1 |
| 28.7 |
| | 34.0 |
|
| Total property, plant and equipment | 1,377.8 |
| | 1,332.3 |
| 1,424.0 |
| | 1,377.8 |
|
| Less accumulated depreciation | (1,104.7 | ) | | (1,074.3 | ) | (1,125.2 | ) | | (1,104.7 | ) |
| Property, plant and equipment, net | $ | 273.1 |
| | $ | 258.0 |
| $ | 298.8 |
| | $ | 273.1 |
|
The Company currently has construction projects planned to expand its manufacturing, warehousing and distribution facilities in China and sales offices in Indonesia. The projects are expected to be completed in 2013,2014, and spending is expected to be approximately $18.111 million.
| |
| Note 5: | Accrued and Other Liabilities |
| | | (In millions) | 2011 | | 2010 | 2012 | | 2011 |
| Income taxes payable | $ | 9.1 |
| | $ | 18.4 |
| $ | 13.8 |
| | $ | 9.1 |
|
| Compensation and employee benefits | 88.5 |
| | 96.4 |
| 99.4 |
| | 88.5 |
|
| Advertising and promotion | 70.2 |
| | 72.6 |
| 69.7 |
| | 70.2 |
|
| Taxes other than income taxes | 25.5 |
| | 26.7 |
| 28.3 |
| | 25.5 |
|
| Pensions | 3.1 |
| | 4.3 |
| 3.7 |
| | 3.1 |
|
| Post-retirement benefit | 3.0 |
| | 3.2 |
| |
| Post-retirement benefits | | 2.8 |
| | 3.0 |
|
| Dividends payable | 16.8 |
| | 18.7 |
| 19.4 |
| | 16.8 |
|
| Foreign currency and interest rate swap contracts | 19.0 |
| | 17.7 |
| |
| Foreign currency contracts | | 15.7 |
| | 19.0 |
|
| Other | 87.3 |
| | 87.4 |
| 83.5 |
| | 85.3 |
|
| Total accrued liabilities | $ | 322.5 |
| | $ | 345.4 |
| $ | 336.3 |
| | $ | 320.5 |
|
| | | (In millions) | 2011 | | 2010 | 2012 | | 2011 |
| Post-retirement benefit | $ | 35.3 |
| | $ | 33.4 |
| |
| Post-retirement benefits | | $ | 30.3 |
| | $ | 35.3 |
|
| Pensions | 127.5 |
| | 115.6 |
| 144.1 |
| | 127.5 |
|
| Income taxes | 17.4 |
| | 17.4 |
| 16.5 |
| | 17.4 |
|
| Long-term deferred income tax | 44.5 |
| | 81.9 |
| 11.9 |
| | 22.9 |
|
| Long-term interest rate swap contracts | — |
| | 23.1 |
| |
| Other | 28.1 |
| | 27.4 |
| 31.0 |
| | 30.1 |
|
| Total other liabilities | $ | 252.8 |
| | $ | 298.8 |
| $ | 233.8 |
| | $ | 233.2 |
|
| |
| Note 6: | Goodwill and Intangible Assets |
The Company's goodwill and intangible assets relate primarily to the December 2005 acquisition of the direct sellingdirect-to-consumer businesses of Sara Lee Corporation and the October 2000 acquisition of BeautiControl.
The Company does not amortize its goodwill or tradename intangible assets or goodwill.assets. Instead, the Company testsperforms an assessment to test these assets for impairment annually, or more frequently if events or changes in circumstances indicate they may be impaired. Certain tradenames are allocated between multiple reporting units.
The annual process for evaluating goodwill begins with an assessment for each entity of qualitative factors to determine whether the two-step goodwill impairment test foris necessary. Further testing is only performed if the Company's tradenames involves comparingCompany determines that it is more likely than not that the estimated combined fair value of the assets to the combined carrying amounts, to determine if a write-down toreporting unit's fair value is required. Ifless than its carrying value. The qualitative factors evaluated by the carrying amountCompany include: macro-economic conditions of a tradename exceeds its estimatedthe local business environment, overall financial performance, sensitivity analysis from the most recent step one fair value an impairment charge is recognized in an amount equal totest, and other entity specific factors as deemed appropriate. When the excess. TheCompany determines the two-step goodwill impairment test for goodwillis necessary, the first step involves comparing the fair value of a reporting unit to its carrying amount, including goodwill, after any intangiblelong-lived asset impairment charges. If the carrying amount of the reporting unit exceeds its fair value, a second step is requiredperformed to measure for anydetermine whether there is a goodwill impairment, and if so, the amount of the loss. This step revalues all assets and liabilities of the reporting unit to their current fair value and then compares the implied fair value of the reporting unit's goodwill to the carrying amount of that goodwill. If the carrying amount of the reporting unit's goodwill exceeds the implied fair value of the goodwill, an impairment loss is recognized in an amount equal to the excess. Prior to 2012, the Company's annual assessment began with the two-step impairment test.
In 2009,The Company early adopted Accounting Standards Update 2012-02, "Testing Indefinite-Lived Intangibles for Impairment" ("the ASU") in connection with the performance of its 2012 annual impairment testing of its tradenames. Under the ASU, entities are provided the option of first performing a qualitative assessment that is similar to the assessment performed for goodwill. When the Company recordeddetermines it is necessary, the quantitative impairment chargestest for the Company's tradenames involves comparing the estimated fair value of the assets to the carrying amounts, to determine if fair value is lower and a write-down required. If the carrying amount of a tradename exceeds its estimated fair value, an impairment charge is recognized in an amount equal to the excess.
During the second quarter of 2012, the Company completed its annual impairment test of the BeautiControl reporting units, resulting in an impairment charge of $38.9 million related to itsthe goodwill in the BeautiControl United States and Canada business. This was a result of the rates of growth of sales, profit and cash flow and expectations for future performance that were below the Company's previous projections. Also in the second quarter, the financial performance of the Nutrimetics reporting units fell below their previous trend line and it became apparent that they would fall significantly short of previous expectations for the year. Additionally, reductions in the forecasted operating trends of NaturCare relating to declines in the rates of growth of sales, profit and cash flows in the Japanese market led to interim impairment testing in both these businesses, as of the end of May and June 2012, respectively. The result of these tests was to record tradename impairments of $13.8 million for Nutrimetics and South African businesses, in part,$9.0 million for NaturCare, primarily due to the factuse of lower estimated royalty rates in light of lower sales and profit forecasts for these units, as well as macroeconomic factors that increased the discount rates used in the valuations versus those used previously. In addition, the Company wrote off the $7.2 million and $7.7 million carrying value of the goodwill of the Nutrimetics Asia Pacific and Nutrimetics Europe reporting units, respectively, in light of then current operating trends and forecastedexpected future results, of operations were below its prior projections. Also contributing to these impairments was an overall increase toas well as the assumedmacroeconomic factors that increased the discount rates used in the valuations. As a result,In the third quarter of 2012, the Company recorded impairments tocompleted the Nutrimetics, NaturCare and Avroy Shlain tradenamesannual impairment assessments for all of $10.1 million, $4.2 million and $2.0 million, respectively. In addition, the Company recognized impairments of goodwill of $8.6 million and $3.2 million relating to the Nutrimetics and South African beauty reporting units respectively.and tradename intangibles, except for BeautiControl which was completed in the second quarter, determining there was no impairment.
In the third quarter of 2010,2011, the Company completed the annual impairment tests for all of the reporting units and tradenames, other than BeautiControl, which was completed in the second quarter. During the third quarter of 2011, the financial results of Nutrimetics were below expectations. The Company also made at that time, the decision to cease operating its Nutrimetics business in Malaysia. As a result, the Company lowered its forecast of future sales and determinedprofit. The result of the impairment tests was to record a $31.1 million impairment to the Nutrimetics goodwill in the Asia Pacific reporting unit and a $5.0 million impairment to its tradename.
During 2010, the Company completed the annual impairment tests for all of the reporting units and tradenames, determining there was no further impairment. The Company subsequently decided it would cease operating its Swissgarde unit in Southern Africa as a separate business. As a result of this decision, the Company concluded that its intangible assets and goodwill were impaired and recorded in 2010 a $2.1 million impairment to the Swissgarde tradename, a $0.1 million impairment related to the sales force intangible and a $2.1 million impairment to goodwill relating to the South African beauty reporting unit. During 2011, the Company sold its interest in Swissgarde for $0.7 million that resulted in a gain of $0.1 million.
In the third quarter of 2011, the Company completed the annual impairment tests for all of the reporting units and tradenames, other than BeautiControl, which was completed in the second quarter. During the third quarter of 2011, the financial results of Nutrimetics were below expectations. As well, the Company made the decision to cease operating its Nutrimetics business in Malaysia. As a result, the Company lowered its forecast of future sales and profit. The result of the impairment tests was to record a $31.1 million impairment to the Nutrimetics goodwill in the Asia Pacific reporting unit and a $5.0 million impairment to its tradename.
Fair value of the BeautiControl United States and Canada, Nutrimetics and NaturCare reporting units iswas determined by the Company using eitherin the income approach orsecond quarter of 2012, using a combination of the income and market approaches with generally a greater weighting on the income approach (75 percent). When the characteristics of the reporting unit arewere more similar to the guideline public companies in terms of size, markets and economy, then a more equal weighting iswas used between the income and market approaches. The income approach, or discounted cash flow approach, requires significant assumptions to determine the fair value of each reporting unit. These include estimates regarding future operations and the ability to generate cash flows, including projections of revenue, costs, utilization of assets and capital requirements, along with an estimate as to the appropriate discount rate to be used. The most sensitive estimate in this valuation is the projection of operating cash flows, as these provide the basis for the fair market valuation. The Company’s cash flow model uses forecasts for periods of about 10 years and a terminal value. The significant 2011 assumptions for these forecasts in 2012 included annual revenue growth rates ranging from zeronegative7.0 percent to 12.0positive10.0 percent with an average growth rate of 6positive3.0 percent. The growth rates were determined by reviewing historical results of these units and the historical results of the Company’s other business units that are similar to those of the reporting units, along with the expected contribution from growth strategies implemented in the units. Terminal values for all reporting units were calculated using a long-term growth rate of 33.0 percent. In estimating the fair value of thethese reporting units in 2011,2012, the Company applied discount rates to its reporting units’the projected cash flows ranging from 11.612.5 to 22.314.0 percent. The discount rate at the high end of this range was for the Avroy Shlain and Latin AmericanNutrimetics Asia Pacific reporting unitsunit due to higher country-specific risks. The market approach relies on an analysis of publicly-traded companies similar to Tupperware and deriving a range of revenue and profit multiples. The publicly-traded companies used in the market approach were selected based on their having similar product lines of consumer goods, beauty products and/or companies using a direct-sellingdirect-to-consumer distribution method. The resulting multiples were then applied to the reporting unit to determine fair value.
The fair value of the Company’sNutrimetics and NaturCare tradenames waswere determined in the second quarter of 2012, using the relief from royalty method whichthat is a form of the income approach. In this method, the value of the asset is calculated by selecting royalty rates, which estimate the amount a company would be willing to pay for the use of the asset. These rates were applied to the Company’s projected revenue, tax affected and discounted to present value using an appropriate rate.value. Royalty rates used were selected by reviewing comparable trademark licensing agreements in the market and the forecasted performance of the business. As a rangeresult, the royalty rates were reduced to 1.5 percent from 3.0 percent tofor Nutrimetics and 3.75 percent from 4.75 percent was used in 2011.for NaturCare. In estimating the fair value of the tradenames, the Company also applied a discount rate ranging fromrates of 12.615.2 toand 22.313.5 percent, respectively, and annual revenue growth ranging from zeronegative7.0 percent to 12positive7.0 percent, with an average growth rate of 6positive2.0 percent, and a long-term terminal growth rate of 33.0 percent. Similar to the rates used in valuing goodwill, the discount rates toward the high end of the range related to tradenames located in areas with higher country risks, including revenue generated using the Avroy Shlain tradenames in South Africa and the Nuvo tradename in Uruguay.
With the goodwilltradename impairment recorded in the current year for Nutrimetics Asia Pacific, this unit isand NaturCare, these assets are at a higher risk of additional impairments in future periods if changes in certain assumptions occur. ThisThere is also the case for theno longer a goodwill balance recorded related to Nutrimetics tradename value, as the fair value was set equal to carrying value in the current year.or BeautiControl United States and Canada. The estimated fair value of the Avroy Shlain, Fuller Mexico, Fuller Philippines, NaturCare and Nutrimetics Europe reporting units as well as the Nuvo and Avroy Shlain trade namesunit exceeded the carrying value by over 6529 percent at the valuation date. The fair valueas of the Fuller Latin America and BeautiControl reporting units exceeded the carrying value by almost 45 percent. The fair value of the Company’s Fuller and NaturCare tradenames had an excess of 29 and 37 percent over carrying value, respectively.June 2012, when a step 1 impairment analysis was last performed. Given the sensitivity of the valuations to changes in cash flow or market multiples, the Company may be required to recognize an impairment of goodwill or intangible assets in the future due to changes in market conditions or other factors related to the Company’s performance. Actual results below forecasted results or a decrease in the forecasted future results of the Company’s business plans or changes in interestdiscount rates could also result in an impairment charge, as could changes in market characteristics including declines in valuation multiples of comparable publicly-traded companies. Further impairment charges would have an adverse impact on the Company’s net income.income and shareholders' equity.
The following table reflects gross goodwill and accumulated impairments allocated to each reporting segment at December 29, 2012, December 31, 2011, and December 25, 2010 and December 26, 2009:
| | | (In millions) | Europe | | Asia Pacific | | TW North America | | Beauty North America | | South America | | Total | Europe | | Asia Pacific | | TW North America | | Beauty North America | | South America | | Total |
| Gross goodwill balance at December 26, 2009 | $ | 35.0 |
| | $ | 79.2 |
| | $ | 16.3 |
| | $ | 155.6 |
| | $ | 7.1 |
| | $ | 293.2 |
| |
| Effect of changes in exchange rates | (1.0 | ) | | 6.9 |
| | — |
| | 4.9 |
| | (0.1 | ) | | 10.7 |
| |
| Gross goodwill balance at December 25, 2010 | 34.0 |
| | 86.1 |
| | 16.3 |
| | 160.5 |
| | 7.0 |
| | 303.9 |
| $ | 34.0 |
| | $ | 86.1 |
| | $ | 16.3 |
| | $ | 160.5 |
| | $ | 7.0 |
| | $ | 303.9 |
|
| Effect of changes in exchange rates | (0.9 | ) | | 2.6 |
| | — |
| | (12.9 | ) | | (0.4 | ) | | (11.6 | ) | (0.9 | ) | | 2.6 |
| | — |
| | (12.9 | ) | | (0.4 | ) | | (11.6 | ) |
| Gross goodwill balance at December 31, 2011 | $ | 33.1 |
| | $ | 88.7 |
| | $ | 16.3 |
| | $ | 147.6 |
| | $ | 6.6 |
| | $ | 292.3 |
| 33.1 |
| | 88.7 |
| | 16.3 |
| | 147.6 |
| | 6.6 |
| | 292.3 |
|
| Effect of changes in exchange rates | | (0.8 | ) | | (2.3 | ) | | — |
| | 8.6 |
| | (0.2 | ) | | 5.3 |
|
| Gross goodwill balance at December 29, 2012 | | $ | 32.3 |
| | $ | 86.4 |
| | $ | 16.3 |
| | $ | 156.2 |
| | $ | 6.4 |
| | $ | 297.6 |
|
| | | (In millions) | Europe | | Asia Pacific | | TW North America | | Beauty North America | | South America | | Total | Europe | | Asia Pacific | | TW North America | | Beauty North America | | South America | | Total |
| Accumulated impairment balance at December 26, 2009 | $ | 14.7 |
| | $ | 3.0 |
| | $ | — |
| | $ | — |
| | $ | — |
| | $ | 17.7 |
| |
| Goodwill impairment | 2.1 |
| | — |
| | — |
| | — |
| | — |
| | 2.1 |
| |
| Accumulated impairment balance at December 25, 2010 | 16.8 |
| | 3.0 |
| | — |
| | — |
| | — |
| | 19.8 |
| $ | 16.8 |
| | $ | 3.0 |
| | $ | — |
| | $ | — |
| | $ | — |
| | $ | 19.8 |
|
| Goodwill impairment | — |
| | 31.1 |
| | — |
| | — |
| | — |
| | 31.1 |
| — |
| | 31.1 |
| | — |
| | — |
| | — |
| | 31.1 |
|
| Accumulated impairment balance at December 31, 2011 | $ | 16.8 |
| | $ | 34.1 |
| | $ | — |
| | $ | — |
| | $ | — |
| | $ | 50.9 |
| 16.8 |
| | 34.1 |
| | — |
| | — |
| | — |
| | 50.9 |
|
| Goodwill impairment | | 7.7 |
| | 7.2 |
| | — |
| | 38.9 |
| | — |
| | 53.8 |
|
| Accumulated impairment balance at December 29, 2012 | | $ | 24.5 |
| | $ | 41.3 |
| | $ | — |
| | $ | 38.9 |
| | $ | — |
| | $ | 104.7 |
|
The gross carrying amount and accumulated amortization of the Company's intangible assets, other than goodwill, were as follows:
| | | | December 31, 2011 | December 29, 2012 |
| (In millions) | Gross Carrying Value | | Accumulated Amortization | | Net | Gross Carrying Value | | Accumulated Amortization | | Net |
| Trademarks and tradenames | $ | 157.1 |
| | $ | — |
| | $ | 157.1 |
| $ | 138.4 |
| | $ | — |
| | $ | 138.4 |
|
| Sales force relationships - single level | 26.9 |
| | 23.9 |
| | 3.0 |
| 29.0 |
| | 26.6 |
| | 2.4 |
|
| Sales force relationships - multi tier | 35.9 |
| | 31.7 |
| | 4.2 |
| |
| Sales force relationships - tiered | | 31.9 |
| | 29.3 |
| | 2.6 |
|
| Acquired proprietary product formulations | 3.6 |
| | 3.6 |
| | — |
| 3.5 |
| | 3.5 |
| | — |
|
| Total intangible assets | $ | 223.5 |
| | $ | 59.2 |
| | $ | 164.3 |
| $ | 202.8 |
| | $ | 59.4 |
| | $ | 143.4 |
|
| | | | December 25, 2010 | December 31, 2011 |
| (In millions) | Gross Carrying Value | | Accumulated Amortization | | Net | Gross Carrying Value | | Accumulated Amortization | | Net |
| Trademarks and tradenames | $ | 170.2 |
| | $ | — |
| | $ | 170.2 |
| $ | 157.1 |
| | $ | — |
| | $ | 157.1 |
|
| Sales force relationships - single level | 29.7 |
| | 25.1 |
| | 4.6 |
| 26.9 |
| | 23.9 |
| | 3.0 |
|
| Sales force relationships - multi tier | 35.3 |
| | 29.7 |
| | 5.6 |
| |
| Sales force relationships - tiered | | 35.9 |
| | 31.7 |
| | 4.2 |
|
| Acquired proprietary product formulations | 4.0 |
| | 4.0 |
| | — |
| 3.6 |
| | 3.6 |
| | — |
|
| Total intangible assets | $ | 239.2 |
| | $ | 58.8 |
| | $ | 180.4 |
| $ | 223.5 |
| | $ | 59.2 |
| | $ | 164.3 |
|
A summary of the identifiable intangible asset account activity is as follows:
| | | | Year Ending | Year Ending |
| (In millions) | December 31,
2011 | | December 25,
2010 | December 29,
2012 | | December 31,
2011 |
| Beginning balance | $ | 239.2 |
| | $ | 229.9 |
| $ | 223.5 |
| | $ | 239.2 |
|
| Impairment of intangible assets | (5.0 | ) | | (2.2 | ) | (22.8 | ) | | (5.0 | ) |
| Effect of changes in exchange rates | (10.7 | ) | | 11.5 |
| 2.1 |
| | (10.7 | ) |
| Ending balance | $ | 223.5 |
| | $ | 239.2 |
| $ | 202.8 |
| | $ | 223.5 |
|
Amortization expense was $2.92.0 million, $3.92.9 million and $5.13.9 million in 20112012, 20102011 and 20092010, respectively. The estimated annual amortization expense associated with the above intangibles for each of the five succeeding years is $2.0 million, $1.4 million, $1.0 million, $0.7 million, $0.6 million and $0.60.4 million, respectively.
| |
| Note 7: | Financing Obligations |
Debt Obligations
Debt obligations consisted of the following:
| | | (In millions) | 2011 | | 2010 | 2012 | | 2011 |
| 2007 term loan facility due 2012 | $ | — |
| | $ | 405.0 |
| |
| Fixed rate Senior Notes due 2021 | 396.1 |
| | — |
| 396.5 |
| | 396.1 |
|
| Five year Credit Agreement expiring 2016 | 192.3 |
| | — |
| 199.0 |
| | 192.3 |
|
| Belgium facility capital lease | 20.5 |
| | 22.3 |
| 18.8 |
| | 20.5 |
|
| Other | 2.0 |
| | 1.4 |
| 3.5 |
| | 2.0 |
|
| | 610.9 |
| | 428.7 |
| |
| Total debt obligations | | 617.8 |
| | 610.9 |
|
| Less current portion | (195.7 | ) | | (1.9 | ) | (203.4 | ) | | (195.7 | ) |
| Long-term debt | $ | 415.2 |
| | $ | 426.8 |
| $ | 414.4 |
| | $ | 415.2 |
|
| | | (Dollars in millions) | 2011 | | 2010 | 2012 | | 2011 |
| Total short-term borrowings at year-end | $ | 193.4 |
| | $ | — |
| $ | 199.0 |
| | $ | 193.4 |
|
| Weighted average interest rate at year-end | 3.0 | % | | na |
| 2.0 | % | | 3.0 | % |
| Average short-term borrowings during the year | $ | 166.1 |
| | $ | 125.2 |
| $ | 332.8 |
| | $ | 166.1 |
|
| Weighted average interest rate for the year | 2.1 | % | | 1.6 | % | 2.1 | % | | 2.1 | % |
| Maximum short-term borrowings during the year | $ | 425.2 |
| | $ | 188.6 |
| $ | 384.8 |
| | $ | 425.2 |
|
Senior Notes Sold
On June 2, 2011, the Company completed the sale of $400 million in aggregate principal amount of 4.750% Senior Notes due June 1, 2021 (the “Senior Notes”) at an issue price of 98.989%, pursuant to a purchase agreement, dated as of May 25, 2011, that included the Company and its wholly-owned100% owned subsidiary, Dart Industries Inc. (the “Guarantor”).
The Senior Notes were issued under an Indenture dated as of June 2, 2011 (the “Indenture”), between the Company, the Guarantor and Wells Fargo Bank, N.A., as trustee. As security for its obligations under the guarantee of the Senior Notes, the Guarantor has granted a security interest in certain "Tupperware" trademarks and service marks. The guarantee and the lien securing the guarantee may be released under certain circumstances specified in the Indenture.
Prior to March 1, 2021, the Company may redeem the Senior Notes, at its option, at a redemption price equal to 100 percent of the principal amount to be redeemed, accrued interest and a make-whole premium equal to the present value of the remaining scheduled payments of principal and interest. In determining the present value of the remaining scheduled payments, such payments shall be discounted to the redemption date using a discount rate equal to the Treasury Rate (as defined in the Indenture) plus 30 basis points. On or after March 1, 2021, the redemption price will equal 100 percent of the principal amount of the Senior Notes to be redeemed.
The Indenture includes covenants which, subject to certain exceptions, limit the ability of the Company and its subsidiaries to, among other things, (i) incur indebtedness secured by liens on real property, (ii) enter into sale and leaseback transactions, (iii) consolidate or merge with another entity, or sell or transfer all or substantially all of their properties and assets, and (iv) sell the capital stock of the Guarantor. In addition, upon a change of control, as defined in the Indenture, the Company may be required to make an offer to repurchase the Senior Notes at 101 percent of their principal amount, plus accrued and unpaid interest. The Indenture also contains customary events of default. These restrictions are not expected to impact the Company's operations. As of December 31, 201129, 2012, the Company was in compliance with all of its covenants.
On January 6, 2012, the company completed the process to register its Senior Notes under the Securities Act of 1933. This was accomplished through an exchange of the Senior Notes for new notes that are identical in all material respects, except that the transfer restrictions and rights under the registration rights agreement do not apply.
Credit Agreement
Also on June 2, 2011, the Company and its wholly owned subsidiary Tupperware International Holdings B.V. (the “Subsidiary Borrower”), entered into a multicurrency Credit Agreement (the “Credit Agreement”). The Credit Agreement makes available to the Company and the Subsidiary Borrower a committed five-yearfive-year credit facility in an aggregate amount of $450 million (the “Facility Amount”). The Credit Agreement provides (i) a revolving credit facility, available up to the full amount of the Facility Amount, (ii) a letter of credit facility, available up to $50 million of the Facility Amount, and (iii) a swingline facility, available up to $50 million of the Facility Amount. Each of such facilities is fully available to the Company and is available to the Subsidiary Borrower up to an aggregate amount not to exceed $225 million. The Company is permitted to increase, on up to three occasions, the Facility Amount by a total of up to $200 million (for a maximum aggregate Facility Amount of $650 million), subject to certain conditions. As of December 31, 201129, 2012, the Company had $192.3199.0 million of borrowings outstanding under its $450 million Credit Agreement.Agreement with $162.0 million of that amount denominated in euros. The Company routinely increases its revolver borrowings under the Credit Agreement during each quarter to fund operationsoperating, investing and financing activities and uses cash available at the end of the periodeach quarter to reduce borrowing levels. As a result, the Company has higher foreign exchange exposure on the value of its cash during each quarter than at the end of each quarter.
Loans made under the revolving credit facility bear interest under a formula that includes, at the Company's option, one of three different base rates. The Company generally selects the London interbank offered rate ("LIBOR") for the applicable currency and interest period as its base for its interest rate. As provided in the Credit Agreement, a margin is added to the base. The applicable margin is determined by reference to a pricing schedule based upon the ratio (the “Consolidated Leverage Ratio”) of the consolidated funded indebtedness of the Company and its subsidiaries to the consolidated EBITDA (as defined in the Credit Agreement) of the Company and its subsidiaries for the four fiscal quarters then most recently ended. As of December 31, 201129, 2012, the Credit Agreement dictated a base rate spread of 150 basis points, which gave the Company ana weighted average interest rate at that time of 2.92.03 percent on borrowings under the Credit Agreement.
The Credit Agreement contains customary covenants that, among other things, generally restrict the Company's ability to incur subsidiary indebtedness, create liens on and sell assets, engage in liquidation or dissolutions, engage in mergers or consolidations, or change lines of business. These covenants are subject to significant exceptions and qualifications. The agreement also has customary financial covenants related to interest coverage and leverage. These restrictions are not expected to impact the Company's operations. As of December 31, 201129, 2012, the Company had, and it currently has, considerable leeway under its financial covenants and was in compliance with all of its covenants.
The Guarantor unconditionally guarantees all obligations and liabilities of the Company and the Subsidiary Borrower relating to this Credit Agreement through a security interest in certain "Tupperware" trademarks and service marks.
Use of Proceeds
In connection with the closing of the Credit Agreement, the companyCompany terminated its Credit Facility dated September 28, 2007 (the "Old Credit Facility"). The net proceeds from the issuance of the Senior Notes, along with borrowings under the new Credit Agreement were used to repay all of the Company's $405 million outstanding term loans outstanding under the Old Credit Facility. As a result of the termination of the Old Credit Facility, the Company recorded a loss on the extinguishment of debt of $0.9 million of unamortized debt issuance costs, as well as an additional $18.9 million in interest expense reclassified from other comprehensive loss as hedges under related interest rate swaps became ineffective. As a result of the Senior Notes offering and the execution of the new Credit Agreement, the Company incurred costs of $5.8 million, of which $0.2 million were expensed andcapitalized $5.6 million were capitalized as deferred finance costs.
At December 31, 201129, 2012, the Company had $359.9333.5 million of unused lines of credit, including $254.6247.9 million under the committed, secured $450 million Credit Agreement, and $105.385.6 million available under various uncommitted lines around the world. Interest paid on total debt in 20112012, 20102011 and 20092010 was $36.041.2 million, $25.736.0 million and $32.625.7 million, respectively.
Prior Debt Structure
Prior to its termination in connection with the signing of the new Credit Agreement, the Old Credit Facility consisted of an $800 million five-year senior secured agreement including a $200 million revolving credit facility and originally $600 million in term loans. There were $405 million in outstanding term loans at the date of termination. The interest rate charged on outstanding borrowings under the old revolving credit facility was a floating LIBOR base rate plus an applicable margin. Although the Old Credit Facility was a floating rate debt instrument, the Company was required to maintain at least 40 percent of the term loans outstanding at fixed rates, which was achieved through the use of interest rate swaps, as further discussed in Note 8 to the Consolidated Financial Statements. As of the date the Old Credit Facility was terminated, $325 million of the term loans had been swapped to fixed interest rates. The Old Credit Facility, which dictated a contractual spread of 62.5 basis points at its termination, combined with the swap agreements, gave the Company an all-in effective rate of about 4.5 percent on the previous term loans.Contractual Maturities
Contractual maturities for long-termdebt obligations at December 31, 201129, 2012 are summarized by year as follows (in millions):
| | | Year ending: | Amount | Amount |
| December 29, 2012 | $ | 195.7 |
| |
| December 28, 2013 | 2.1 |
| $ | 203.4 |
|
| December 27, 2014 | 2.1 |
| 2.4 |
|
| December 26, 2015 | 2.0 |
| 2.4 |
|
| December 31, 2016 | 2.1 |
| 2.5 |
|
| December 30, 2017 | | 2.3 |
|
| Thereafter | 406.9 |
| 404.8 |
|
| Total | $ | 610.9 |
| $ | 617.8 |
|
Capital Leases
In 2006, the Company initiated construction of a new Tupperware center of excellence manufacturing facility in Belgium which was completed in 2007 and replaced its existing Belgium facility. The cost ofCosts related to the new facility and equipment totaled $24.0 million and was financed through a sales lease-back transaction under two separate leases. The two leases are being accounted for as capital leases and have terms of 10 and 15 years and interest rates of 5.1 percent. In 2010, the Company extended thea lease on one of its buildingsan additional building in Belgium that was previously accounted for as an operating lease. As a result of renegotiating the terms of the agreement, the lease is now classified as capital and had an initial value of $3.8 million with a term of 10 years and an interest rate of 2.9 percent.
Following is a summary of significant capital lease obligations at December 29, 2012 and December 31, 2011:
|
| | | | | | | |
| (In millions) | December 29,
2012 | | December 31,
2011 |
| Gross payments | $ | 23.0 |
| | $ | 25.6 |
|
| Less imputed interest | 4.2 |
| | 5.1 |
|
| Total capital lease obligation | 18.8 |
| | 20.5 |
|
| Less current maturity | 1.9 |
| | 1.8 |
|
| Capital lease obligation - long-term portion | $ | 16.9 |
| | $ | 18.7 |
|
Following is a summary of capital lease obligations at December 31, 2011 and December 25, 2010:
|
| | | | | | | |
| (In millions) | December 31,
2011 | | December 25,
2010 |
| Gross payments | $ | 25.6 |
| | $ | 28.6 |
|
| Less imputed interest | 5.1 |
| | 6.3 |
|
| Total capital lease obligation | 20.5 |
| | 22.3 |
|
| Less current maturity | 1.8 |
| | 1.4 |
|
| Capital lease obligation - long-term portion | $ | 18.7 |
| | $ | 20.9 |
|
| |
| Note 8: | Derivative Financial Instruments |
The Company markets its products in almost 100 countries and is exposed to fluctuations in foreign currency exchange rates on the earnings, cash flows and financial position of its international operations. Although this currency risk is partially mitigated by the natural hedge arising from the Company's local manufacturing in many markets, a strengthening U.S. dollar generally has a negative impact on the Company. In response to this fact, the Company uses financial instruments to hedge certain of its exposures and to manage the foreign exchange impact to its financial statements. At its inception, a derivative financial instrument used for hedging is designated as a fair value, cash flow or net equity hedge.
Fair value hedges are entered into with financial instruments such as forward contracts with the objective of limiting exposure to certain foreign exchange risks primarily associated with accounts receivable, accounts payable and non-permanent intercompany transactions. For derivative instruments that are designated and qualify as fair value hedges, the gain or loss on the derivative, as well as the offsetting gain or loss on the hedged item attributable to the hedged risk, are recognized in current earnings. In assessing hedge effectiveness, the Company excludes forward points, which are considered by the Company to be a component of interest expense. In 20112012, 20102011 and 20092010, the forward points on fair value hedges resulted in pretax gains of $8.310.3 million, $6.08.3 million and $1.66.0 million, respectively.
The Company also uses derivative financial instruments to hedge foreign currency exposures resulting from certain forecasted purchases and classifies these as cash flow hedges. The Company generally enters into cash flow hedge contracts for periods ranging from three to twelve months.months. The effective portion of the gain or loss on the hedging instrument is recorded in other comprehensive loss and is reclassified into earnings as the transactions being hedged are recorded. As such, the balance at the end of each reporting period in other comprehensive loss will be reclassified into earnings within the next twelve months. The associated asset or liability on the open hedges is recorded in other current assets or accrued liabilities, as applicable. As of December 31, 2011, December 25, 2010 and December 26, 2009, theThe balance in accumulated other comprehensive income,loss, net of tax, resulting from open foreign currency hedges designated as cash flow hedges was $0.3 million, $0.5 million and $0.8 million, respectively. The change in the balance in other comprehensive loss was a netdeferred loss of $0.2 million, as of December 29, 2012 and deferred gains of $0.3 million and $2.10.5 million during the years endedas of December 31, 2011, and December 25, 2010, respectively. In 2012, 2011 and December 26, 20092010, respectively.the Company recorded, net of tax, net losses associated with these types of hedges of $0.4 million, $0.2 million and $0.3 million, respectively, in other comprehensive loss. In assessing hedge effectiveness, the Company excludes forward points, which are included as a component of interest expense. In 20112012, 20102011 and 20092010, forward points on cash flow hedges resulted in pretax losses of $2.02.5 million, $2.62.0 million and $2.6 million, respectively.
The Company also uses financial instruments, such as forward contracts, to hedge a portion of its net equity investment in international operations and classifies these as net equity hedges. Changes in the value of these derivative instruments, excluding any ineffective portion of the hedges, are included in foreign currency translation adjustments within accumulated other comprehensive income.losses. In 20112012, 20102011 and 20092010, the Company recorded, net of tax, net (losses) gains (losses) associated with these hedges of $11.9(8.9) million, $(9.0)11.9 million and $(9.4)(9.0) million, respectively, in other comprehensive loss, net of tax.loss. Due to the permanent nature of the investments, the Company does not anticipate reclassifying any portion of these amounts to the income statement in the next 12 months. In assessing hedge effectiveness, the Company excludes forward points, which are included as a component of interest expense. In 20112012, 20102011 and 20092010, forward points on net equity hedges resulted in pretax losses of $11.212.9 million, $8.011.2 million and $4.08.0 million, respectively.
While the Company's net equity and fair value hedges of non-permanent intercompany balances mitigate its exposure to foreign exchange gains or losses, they result in an impact to operating cash flows as they are settled, whereas the hedged items do not generate offsetting cash flows. For the years ended December 31, 201129, 2012, December 25, 201031, 2011 and December 26, 200925, 2010 the cash flow impact of these currency hedges was an inflow of $6.12.1 million, an outflow ofinflow $5.96.1 million and an inflowoutflow of $12.75.9 million, respectively.
Following is a listing of the Company's outstanding derivative financial instruments at fair value as of December 31, 201129, 2012 and December 25, 201031, 2011. Related to the forward contracts, the “buy” amounts represent the U.S. dollar equivalent of commitments to purchase foreign currencies, and the “sell” amounts represent the U.S. dollar equivalent of commitments to sell foreign currencies, all translated at the period-end market exchange rates for the U.S. dollar. All forward contracts are hedging net investments in certain foreign subsidiaries, cross-currency intercompany loans that are not permanent in nature, cross-currency external payables and receivables or forecasted purchases. Some amounts are between two foreign currencies:
| | | Forward Contracts | 2011 | | 2010 | 2012 | | 2011 |
(in millions) | Buy | | Sell | | Buy | | Sell | Buy | | Sell | | Buy | | Sell |
| U.S. dollar | | $ | 69.9 |
| | | | $ | 48.5 |
| | |
| Euro | $ | 61.4 |
| |
| | $ | 65.2 |
| |
| 66.6 |
| |
| | 61.4 |
| |
|
| U.S. dollar | 48.5 |
| |
| | 21.0 |
| |
| |
| Malaysian ringgit | | 17.2 |
| | | | 5.0 |
| | |
| Indonesian rupiah | | 11.3 |
| | | | 6.6 |
| | |
| Philippine peso | | 9.9 |
| | | | 4.2 |
| | |
| South Korean won | 6.8 |
| |
|
| | 12.5 |
| |
|
| 3.0 |
| |
|
| | 6.8 |
| |
|
|
| Indonesian rupiah | 6.6 |
| |
|
| | 17.5 |
| |
|
| |
| Brazilian real | 6.3 |
| |
|
| | 2.8 |
| |
|
| |
| Malaysian ringgit | 5.0 |
| |
|
| |
|
| | $ | 0.3 |
| |
| New Zealand dollar | 4.6 |
| |
|
| | 4.4 |
| |
|
| 1.4 |
| | | | 4.6 |
| | |
| Philippine peso | 4.2 |
| |
|
| | — |
| |
|
| |
| Mexican peso | 1.8 |
| |
|
| |
|
| | 0.2 |
| |
| South African rand | 0.5 |
| |
|
| |
|
| | 1.2 |
| |
| Singapore dollar | | 0.4 |
| | | | | | $ | 1.3 |
|
| Swiss franc |
| | $ | 39.2 |
| |
| | 49.6 |
| | | $ | 53.8 |
| | | | 39.2 |
|
| Japanese yen |
| | 28.4 |
| |
| | 11.9 |
| | | 32.8 |
| | | | 28.4 |
|
| Mexican peso | | | | 22.0 |
| | 1.8 |
| | |
| Australian dollar |
|
| | 17.5 |
| |
|
| | 5.5 |
| | | 15.5 |
| | | | 17.5 |
|
| Turkish lira |
|
| | 14.4 |
| |
|
| | 11.9 |
| | | 12.3 |
| | | | 14.4 |
|
| South African rand | |
|
| | 6.8 |
| | 0.5 |
| |
|
|
| Russian ruble |
|
| | 9.3 |
| |
|
| | 1.0 |
| | | 5.7 |
| | | | 9.3 |
|
| British pound | | | | 4.8 |
| | | | 3.8 |
|
| Indian rupee | | | | 3.7 |
| | | | 2.0 |
|
| Canadian dollar |
|
| | 8.6 |
| |
|
| | 9.6 |
| | | 3.5 |
| | | | 8.6 |
|
| Argentine peso |
|
| | 4.3 |
| |
|
| | 7.6 |
| |
| British pound |
|
| | 3.8 |
| |
|
| | 3.3 |
| |
| Thai baht |
|
| | 2.6 |
| |
|
| | 2.2 |
| | | 3.3 |
| | | | 2.6 |
|
| Croatian kuna |
|
| | 2.5 |
| |
|
| | 2.6 |
| |
| Hungarian forint |
|
| | 2.0 |
| |
|
| | 1.9 |
| | | 3.3 |
| | | | 2.0 |
|
| Norwegian krone |
|
| | 2.0 |
| |
|
| | 1.8 |
| |
| Indian rupee |
|
| | 2.0 |
| |
|
| | — |
| |
| Czech koruna |
|
| | 1.9 |
| |
|
| | 1.6 |
| | | 3.3 |
| | | | 1.9 |
|
| Polish zloty |
|
| | 1.5 |
| |
|
| | 5.7 |
| | �� | 3.3 |
| | | | 1.5 |
|
| Croatian kuna | | | | 2.5 |
| | | | 2.5 |
|
| Norwegian krone | | | | 1.9 |
| | | | 2.0 |
|
| Brazilian real | | | | 1.7 |
| | 6.3 |
| | |
| Swedish krona |
|
| | 1.5 |
| |
|
| | 1.5 |
| | | 1.7 |
| | | | 1.5 |
|
| Ukraine hryvnia |
|
| | 1.3 |
| |
|
| | 1.3 |
| | | 0.9 |
| | | | 1.3 |
|
| Singapore dollar |
|
| | 1.3 |
| |
|
| | 0.2 |
| |
| Kazakhstan tenge |
|
| | 0.3 |
| |
| | 2.6 |
| |
| Argentine peso | | | | — |
| | | | 4.3 |
|
| Other currencies (net) |
|
| | 0.6 |
| |
| | 1.7 |
|
|
| | 0.8 |
| |
| | 0.9 |
|
| | $ | 145.7 |
| | $ | 145.0 |
| | $ | 123.4 |
| | $ | 125.2 |
| $ | 179.7 |
| | $ | 183.6 |
| | $ | 145.7 |
| | $ | 145.0 |
|
In agreements to sell foreign currencies in exchange for U.S. dollars, for example, an appreciating dollar versus the opposing currency would generategenerates a cash inflow for the Company at settlement, with the opposite result in agreements to buy foreign currencies for U.S. dollars. The above noted notional amounts change based upon changes in the Company's outstanding currency exposures.
UnderAt the Oldtime the Company entered into the Credit Facility, which was terminated duringAgreement in the second quarter of 2011, in conjunction with the signing of the new Credit Agreement, there was a requirement that the Company keep at least 40 percent of total borrowings at a fixedit had four out-of-the-money interest rate through September 2012. In September 2007, the Company entered into four interest rate swap agreements with notional values totaling $325 millionswaps that expire in 2012. Under the termswere hedging a portion of these swap agreements, the Company received a floating rate equal to the 3 month U.S. dollar LIBOR and paid a weighted average fixed rate of about 4.8 percent. In 2011, 2010 and 2009, through the date of termination, the interest rateits borrowing under the Old Credit Facility also included a spread of 62.5 basis points.Facility. As a result of the termination of the Old Credit Facility, the Company recorded $18.9 million in interest expense, which was reclassified from other comprehensive loss as a result of the hedges under related interest rate swaps becoming ineffective.
During 2008, The swaps expired in the Company entered into a forward interest rate agreement that swapped a portionthird quarter of the Company's then outstanding LIBOR-based floating obligation into a fixed obligation for $200 million in 2009 and $100 million in 2010. The Company paid a weighted average rate of about 2.2 percent on the $200 million for 2009 and about 1.9 percent on the $100 million for 2010, plus the spread under the Old Credit Facility. Both of these agreements had expired by the end of 2010.
The swap agreements which continued through the date of termination were designated as cash flow hedges, with interest payments designed to perfectly match the interest payments under the term loans due in 2012. The fair value of all these hedges was a net payable of $23.1 million ($14.7 million net of tax) as of December 25, 2010, which was mainly included as a component of accumulated other comprehensive income. In 2009, the Company made a voluntary prepayment on its term debt resulting in some interest rate swaps becoming partially ineffective. As a result, the Company recorded a $0.4 million loss to interest expense on the Consolidated Statement of Income for the year ended December 26, 2009. The interest rate swaps continued to be ineffective in 2010, through the date of termination, with a minimal impact.
The following tables summarize the Company's derivative positions and the impact they havehad on the Company's financial position as of December 31, 201129, 2012 and December 25, 201031, 2011:
| | | | | December 29, 2012 |
| | | Asset derivatives | | Liability derivatives |
Derivatives designated as hedging instruments (in millions) | | Balance sheet location | | Fair value | | Balance sheet location | | Fair value |
| Foreign exchange contracts | | Non-trade amounts receivable | | $ | 13.1 |
| | Accrued liabilities | | $ | 15.7 |
|
| Total derivative instruments | | | | $ | 13.1 |
| | | | $ | 15.7 |
|
| | | | | | | | | | | | |
| | December 31, 2011 | December 31, 2011 |
| | Asset derivatives | | Liability derivatives | Asset derivatives | | Liability derivatives |
Derivatives not designated as hedging instruments (in millions) | Balance sheet location | | Fair value | | Balance sheet location | | Fair value | Balance sheet location | | Fair value | | Balance sheet location | | Fair value |
| Interest rate contracts | Non-trade amounts receivable | | $ | — |
| | Accrued liabilities | | $ | 10.2 |
| Non-trade amounts receivable | | $ | — |
| | Other liabilities | | $ | 10.2 |
|
Derivatives designated as hedging instruments (in millions) | | | | | | | | |
| Foreign exchange contracts | Non-trade amounts receivable | | 21.4 |
| | Accrued liabilities | | 18.7 |
| Non-trade amounts receivable | | 21.4 |
| | Accrued liabilities | | 18.7 |
|
| Total derivatives instruments | | | $ | 21.4 |
| | | | $ | 28.9 |
| |
| | | |
| | December 25, 2010 | |
| | Asset derivatives | | Liability derivatives | |
Derivatives designated as hedging instruments (in millions) | Balance sheet location | | Fair value | | Balance sheet location | | Fair value | |
| Interest rate contracts | Non-trade amounts receivable | | $ | — |
| | Other liabilities | | $ | 23.1 |
| |
| Foreign exchange contracts | Non-trade amounts receivable | | 16.1 |
| | Accrued liabilities | | 17.7 |
| |
| Total derivatives designated as hedging instruments | | | $ | 16.1 |
| | | | $ | 40.8 |
| |
| Total derivative instruments | | | | $ | 21.4 |
| | | | $ | 28.9 |
|
The following tables summarize the Company's derivative positions and the impact they had on the Company's results of operations and comprehensive income for the years ended December 29, 2012, December 31, 2011, and December 25, 2010 and December 26, 2009:
| | Derivatives designated as fair value hedges (in millions) | | Location of gain or (loss) recognized in income on derivatives | | Amount of gain or (loss) recognized in income on derivatives | | Location of gain or (loss) recognized in income on related hedged items | | Amount of gain or (loss) recognized in income on related hedged items | | Location of gain or (loss) recognized in income on derivatives | | Amount of gain or (loss) recognized in income on derivatives | | Location of gain or (loss) recognized in income on related hedged items | | Amount of gain or (loss) recognized in income on related hedged items |
| | | 2011 | 2010 | 2009 | | 2011 | 2010 | 2009 | | 2012 | 2011 | 2010 | | 2012 | 2011 | 2010 |
| Foreign exchange contracts | | Other expense | |
| ($8.6 | ) |
| $8.5 |
|
| $32.6 |
| | Other expense | |
| $8.5 |
|
| ($9.0 | ) |
| ($32.8 | ) | | Other expense | |
| $11.9 |
|
| ($8.6 | ) |
| $8.5 |
| | Other expense | |
| ($11.9 | ) |
| $8.5 |
|
| ($9.0 | ) |
| | Derivatives designated as cash flow and net equity hedges (in millions) | | Amount of gain or (loss) recognized in OCI on derivatives (effective portion) | | Location of gain or (loss) reclassified from accumulated OCI into income (effective portion) | | Amount of gain or (loss) reclassified from accumulated OCI into income (effective portion) | | Location of gain or (loss) recognized in income on derivatives (ineffective portion and amount excluded from effectiveness testing) | | Amount of gain or (loss) recognized in income on derivatives (ineffective portion and amount excluded from effectiveness testing) | | Amount of gain or (loss) recognized in OCI on derivatives (effective portion) | | Location of gain or (loss) reclassified from accumulated OCI into income (effective portion) | | Amount of gain or (loss) reclassified from accumulated OCI into income (effective portion) | | Location of gain or (loss) recognized in income on derivatives (ineffective portion and amount excluded from effectiveness testing) | | Amount of gain or (loss) recognized in income on derivatives (ineffective portion and amount excluded from effectiveness testing) |
| Cash flow hedging relationships | | 2011 | 2010 | 2009 | | | | 2011 | 2010 | 2009 | | | | 2011 | 2010 | 2009 | | 2012 | 2011 | 2010 | | | | 2012 | 2011 | 2010 | | | | 2012 | 2011 | 2010 |
| Interest rate contracts | | $ | 4.1 |
| $ | 4.6 |
| $ | 8.5 |
| | Interest expense | | $ | — |
| $ | — |
| $ | — |
| | Interest expense | | $ | (18.9 | ) | $ | 0.2 |
| $ | (0.4 | ) | | $ | — |
| $ | 4.1 |
| $ | 4.6 |
| | Interest expense | | $ | — |
| $ | — |
| $ | — |
| | Interest expense | | $ | — |
| $ | (18.9 | ) | $ | 0.2 |
|
| Foreign exchange contracts | | 0.2 |
| (0.2 | ) | (0.5 | ) | | Cost of products sold and DS&A | | (1.9 | ) | 0.6 |
| 4.3 |
| | Interest expense | | (2.0 | ) | (2.6 | ) | (2.6 | ) | | (0.9 | ) | 0.2 |
| (0.2 | ) | | Cost of products sold and DS&A | | 1.0 |
| (1.9 | ) | 0.6 |
| | Interest expense | | (2.5 | ) | (2.0 | ) | (2.6 | ) |
| Net equity hedging relationships | | | | | | | | | | | | | | | | | | | | |
| Foreign exchange contracts | | 18.7 |
| (14.1 | ) | (14.8 | ) | | Other expense | | — |
| — |
| — |
| | Interest expense | | (11.2 | ) | (8.0 | ) | (4.0 | ) | | (13.9 | ) | 18.7 |
| (14.1 | ) | | Other expense | | — |
| — |
| — |
| | Interest expense | | (12.9 | ) | (11.2 | ) | (8.0 | ) |
The Company's theoretical credit risk for each derivative instrument is its replacement cost, but management believes that the risk of incurring credit losses is remote and such losses, if any, would not be material. The Company is also exposed to market risk on its derivative instruments due to potential changes in foreign exchange rates; however, such market risk would be partially offset by changes in the valuation of the underlying items being hedged. For all outstanding derivative instruments, the net accrued losses were $7.52.7 million, $24.77.5 million and $29.024.7 million at December 31, 201129, 2012, December 25, 201031, 2011 and December 26, 200925, 2010, respectively, and were recorded either in accrued liabilities or other assets, depending upon the net position of the individual contracts. While certain of its fair value hedges of non-permanent intercompany loans mitigate its exposure to foreign exchange gains or losses, they result in an impact to operating cash flows as the hedges are settled, as dodid the Company's impaired interest rate swaps.swap before they expired in the third quarter of 2012. However, the cash flow impact of certain of these exposures other than related to the impaired interest rate swaps, is in turn partially offset by hedges of net equity and other forward contracts. The notional amounts shown above change based upon the Company's outstanding exposure to fair value fluctuations.
| |
| Note 9: | Fair Value Measurements |
The Company applies the applicable accounting guidance for fair value measurements. This guidance provides the definition of fair value, describes the method used to appropriately measure fair value in accordance with generally accepted accounting principles and outlines fair value disclosure requirements.
The fair value hierarchy established under this guidance prioritizes the inputs used to measure fair value. The hierarchy gives the highest priority to unadjusted quoted prices in active markets for identical assets or liabilities (Level 1 measurement) and the lowest priority to unobservable inputs (Level 3 measurement). The three levels of the fair value hierarchy are as follows:
Level 1-Quoted prices are available in active markets for identical assets or liabilities as of the reporting date. Active markets are those in which transactions for the asset or liability occur in sufficient frequency and volume to provide pricing information on an ongoing basis.
Level 2-Pricing inputs are other than quoted prices in active markets included in Level 1, which are either directly or indirectly observable as of the reporting date. Level 2 includes those financial instruments that are valued using models or other valuation methodologies. These models are primarily industry-standard models that consider various assumptions, including quoted prices, time value, volatility factors, and current market and contractual prices for the underlying instruments, as well as other relevant economic measures. Substantially all of these assumptions are observable in the marketplace throughout the full term of the instrument, can be derived from observable data or are supported by observable levels at which transactions are executed in the marketplace.
Level 3-Pricing inputs include significant inputs that are generally less observable from objective sources. These inputs may be used with internally developed methodologies that result in management's best estimate of fair value from the perspective of a market participant.
Assets and Liabilities Recorded at Fair Value on a Recurring Basis
Some fair value measurements, such as those related to foreign currency forward contracts and interest rate swaps, are performed on a recurring basis, while others, such as those related to evaluating goodwill and other intangibles for impairment, are performed on a nonrecurring basis.
| | Description of Assets (in millions) | | December 31, 2011 | | Quoted Prices in Active Markets for Identical Assets (Level 1) | | Significant Other Observable Inputs (Level 2) | | Significant Unobservable Inputs (Level 3) | | December 29, 2012 | | Quoted Prices in Active Markets for Identical Assets (Level 1) | | Significant Other Observable Inputs (Level 2) | | Significant Unobservable Inputs (Level 3) |
| Money market funds | | $ | 9.5 |
| | $ | 9.5 |
| | $ | — |
| | $ | — |
| | $ | 2.1 |
| | $ | 2.1 |
| | $ | — |
| | $ | — |
|
| Foreign currency derivative contracts | | 21.4 |
| | — |
| | 21.4 |
| | — |
| | 13.1 |
| | — |
| | 13.1 |
| | — |
|
| Total | | $ | 30.9 |
| | $ | 9.5 |
| | $ | 21.4 |
| | $ | — |
| | $ | 15.2 |
| | $ | 2.1 |
| | $ | 13.1 |
| | $ | — |
|
| | | | | | | | | | | | | | | | | |
Description of Liabilities (in millions) | | |
| | |
| | |
| | |
| | |
| | |
| | |
| | |
|
| Interest rate swaps | | $ | 10.2 |
| | $ | — |
| | $ | 10.2 |
| | $ | — |
| |
| Foreign currency derivative contracts | | 18.7 |
| | — |
| | 18.7 |
| | — |
| | $ | 15.7 |
| | $ | — |
| | $ | 15.7 |
| | $ | — |
|
| Total | | $ | 28.9 |
| | $ | — |
| | $ | 28.9 |
| | $ | — |
| | $ | 15.7 |
| | $ | — |
| | $ | 15.7 |
| | $ | — |
|
| | | | | | | | | | | | | | | | | |
Description of Assets (in millions) | | December 25, 2010 | | Quoted Prices in Active Markets for Identical Assets (Level 1) | | Significant Other Observable Inputs (Level 2) | | Significant Unobservable Inputs (Level 3) | | December 31, 2011 | | Quoted Prices in Active Markets for Identical Assets (Level 1) | | Significant Other Observable Inputs (Level 2) | | Significant Unobservable Inputs (Level 3) |
| Money market funds | | $ | 30.2 |
| | $ | 30.2 |
| | $ | — |
| | $ | — |
| | $ | 9.5 |
| | $ | 9.5 |
| | $ | — |
| | $ | — |
|
| Foreign currency derivative contracts | | 16.1 |
| | — |
| | 16.1 |
| | — |
| | 21.4 |
| | — |
| | 21.4 |
| | — |
|
| Total | | $ | 46.3 |
| | $ | 30.2 |
| | $ | 16.1 |
| | $ | — |
| | $ | 30.9 |
| | $ | 9.5 |
| | $ | 21.4 |
| | $ | — |
|
| | | | | | | | | | | | | | | | | |
Description of Liabilities (in millions) | | |
| | |
| | |
| | |
| | |
| | |
| | |
| | |
|
| Interest rate swaps | | $ | 23.1 |
| | $ | — |
| | $ | 23.1 |
| | $ | — |
| | $ | 10.2 |
| | $ | — |
| | $ | 10.2 |
| | $ | — |
|
| Foreign currency derivative contracts | | 17.7 |
| | — |
| | 17.7 |
| | — |
| | 18.7 |
| | — |
| | 18.7 |
| | — |
|
| Total | | $ | 40.8 |
| | $ | — |
| | $ | 40.8 |
| | $ | — |
| | $ | 28.9 |
| | $ | — |
| | $ | 28.9 |
| | $ | — |
|
The Company markets its products in almost 100 countries and is exposed to fluctuations in foreign currency exchange rates on the earnings, cash flows and financial position of its international operations. The Company uses financial instruments to hedge certain of its exposures and to manage the foreign exchange impact to its financial statements. As of December 31, 201129, 2012 and December 25, 201031, 2011, the Company held foreign currency forward contracts to hedge various currencies which had a net fair value determined based on third party quotations, of positivenegative $2.7 million and negativepositive $1.62.7 million, respectively. The fair values of forward contracts were estimated based on quoted forward foreign exchange prices at the reporting date. Changes in fair market value are recorded either in other comprehensive income or earnings, depending on the designation of the hedge as outlined in Note 8 to the Consolidated Financial Statements.
The fair value of interest rate swap contracts in 2011 was based on the discounted net present value of the swap using third party quotes. Changes in fair market value were recorded in other comprehensive income through the termination date of the related credit facility, and changes resulting from ineffectiveness, which were not material, have beenwere recorded in current earnings. These contracts expired during the third quarter of 2012.
Included in the Company's cash equivalents balances as of December 31, 201129, 2012 and December 25, 201031, 2011 were $9.52.1 million and $30.29.5 million, respectively, in money market funds, which are highly liquid investments with a maturity of three months or less. These assets are classified within Level 1 of the fair value hierarchy, as the money market funds are valued using quoted market prices in active markets.
Assets and Liabilities Recorded at Fair Value on a Non-recurring Basis
The following table presents information about assets and liabilities measured at fair value on a non-recurring basis as of October 1, 2011,June 30, 2012, and indicates the placement in the fair value hierarchy of the valuation techniques utilized to determine such fair value.
| | Description of Assets (in millions) | | October 1, 2011 | | Quoted Prices in Active Markets for Identical Assets (Level 1) | | Significant Other Observable Inputs (Level 2) | | Significant Unobservable Inputs (Level 3) | | June 30, 2012 | | Quoted Prices in Active Markets for Identical Assets (Level 1) | | Significant Other Observable Inputs (Level 2) | | Significant Unobservable Inputs (Level 3) |
| Intangible Assets | | $ | 22.3 |
| | $ | — |
| | $ | — |
| | $ | 22.3 |
| | $ | 23.0 |
| | $ | — |
| | $ | — |
| | $ | 23.0 |
|
| Goodwill | | 7.3 |
| | — |
| | — |
| | 7.3 |
| |
| Total | | $ | 29.6 |
| | $ | — |
| | $ | — |
| | $ | 29.6 |
| | $ | 23.0 |
| | $ | — |
| | $ | — |
| | $ | 23.0 |
|
In the thirdsecond quarter of 2011,2012, the Company completed theits annual impairment tests for alltest of the BeautiControl reporting units. Additionally, the Company completed interim impairment testing for the Nutrimetics and NaturCare reporting units in May and tradenames, other than BeautiControl, which was completed in the second quarter.June of 2012, respectively. As a result, the carrying value of goodwill allocated to the Nutrimetics Asia Pacificand BeautiControl United States and Canada reporting units waswere written down to its implied fair valueoff in the amounts of $7.314.9 million. and $38.9 million, respectively. Additionally, intangible assets relating to the Company’s Nutrimetics tradename wasand NaturCare tradenames were written down to itstheir implied fair valuevalues of $22.37.9 million. and $15.1 million, respectively. Refer to Note 6 to the Consolidated Financial Statements for further discussion of goodwill and tradename impairments.
Fair Value of Financial Instruments
Due to their short maturities or their insignificance, the carrying amounts of cash and cash equivalents, accounts and notes receivable, accounts payable, accrued liabilities and short-term borrowings approximated their fair values at December 31, 201129, 2012 and December 25, 201031, 2011. The Company estimates that, based on current market conditions, the value of its 4.750% 2021 Senior Notes debt was $406420 million at December 31, 201129, 2012 compared with the carrying value of $396396.5 million. The higher fair value resulted from changes, since issuance, in the corporate bond market and investor preferences. The fair value of debt is classified as a Level 2 liability and is estimated using quoted market prices as provided in secondary markets that consider the Company's specific credit risk and market related conditions.
| |
| Note 10: | Accumulated Other Comprehensive Loss |
| | | (In millions) | December 31,
2011 | | December 25,
2010 | December 29,
2012 | | December 31,
2011 |
| Foreign currency translation adjustments | $ | (250.4 | ) | | $ | (196.2 | ) | $ | (218.2 | ) | | $ | (250.4 | ) |
| Pension and retiree medical | (45.4 | ) | | (36.1 | ) | |
| Deferred gain/(loss) on cash flow hedges | 0.3 |
| | (14.2 | ) | |
| Pension and retiree medical benefits | | (52.9 | ) | | (45.4 | ) |
| Deferred (loss)/gain on cash flow hedges | | (0.2 | ) | | 0.3 |
|
| Total | $ | (295.5 | ) | | $ | (246.5 | ) | $ | (271.3 | ) | | $ | (295.5 | ) |
| |
| Note 11: | Statements of Cash Flows Supplemental Disclosure |
In 2012 and 2010,, the Company acquired $1.2 million and $4.6 million, respectively, of property, plant and equipment under capital lease arrangements. There were no such capital lease arrangements initiated in 2011.2011 or 2009. In 2009, the Company began allowing participants the right to net share settle their stock options, where the Company issues a number
2009, options for the purchase of 0.7 million shares, with an aggregate exercise price value of $12.9 million were exercised under this method. In 2011 and 2010, a minimal amount of shares under option were exercised under this method. Employees are also allowed to use shares to pay withholding taxes up to the statutory minimum. In 20112012, 20102011 and 20092010, 83,077, 45,072, and 47,789 and 156,498 shares, respectively, were retained to fund withholding taxes, with values totaling $2.55.1 million, $2.22.5 million and $6.22.2 million, respectively, which were included as a component of stock repurchases in the Consolidated Statement of Cash Flows.
For income tax purposes, the domestic and foreign components of income (loss) before taxes were as follows:
| | | (In millions) | 2011 | | 2010 | | 2009 | 2012 | | 2011 | | 2010 |
| Domestic | $ | (15.2 | ) | | $ | (16.3 | ) | | $ | 29.3 |
| $ | (57.5 | ) | | $ | (15.2 | ) | | $ | (16.3 | ) |
| Foreign | 310.5 |
| | 316.0 |
| | 207.8 |
| 330.3 |
| | 310.5 |
| | 316.0 |
|
| Total | $ | 295.3 |
| | $ | 299.7 |
| | $ | 237.1 |
| $ | 272.8 |
| | $ | 295.3 |
| | $ | 299.7 |
|
The domestic and foreign components of income (loss) before taxes for 2011 and 2010 reflect an adjustmentadjustments as required under certain advanced pricing agreements.
The provision (benefit) for income taxes was as follows:
| | | (In millions) | 2011 | | 2010 | | 2009 | 2012 | | 2011 | | 2010 |
| Current: | | | | | | | | | | |
| Federal | $ | 4.2 |
| | $ | (4.2 | ) | | $ | 39.1 |
| $ | 19.3 |
| | $ | 4.2 |
| | $ | (4.2 | ) |
| Foreign | 79.4 |
| | 85.8 |
| | 66.3 |
| 110.3 |
| | 79.4 |
| | 85.8 |
|
| State | 1.2 |
| | 0.5 |
| | 1.1 |
| 0.9 |
| | 1.2 |
| | 0.5 |
|
| | 84.8 |
| | 82.1 |
| | 106.5 |
| 130.5 |
| | 84.8 |
| | 82.1 |
|
| Deferred: | | | | | | | | | | |
| Federal | 0.2 |
| | (9.2 | ) | | (38.0 | ) | (50.4 | ) | | 0.2 |
| | (9.2 | ) |
| Foreign | (7.5 | ) | | 1.7 |
| | (6.2 | ) | 0.2 |
| | (7.5 | ) | | 1.7 |
|
| State | (0.5 | ) | | (0.5 | ) | | (0.3 | ) | (0.5 | ) | | (0.5 | ) | | (0.5 | ) |
| | (7.8 | ) | | (8.0 | ) | | (44.5 | ) | (50.7 | ) | | (7.8 | ) | | (8.0 | ) |
| Total | $ | 77.0 |
| | $ | 74.1 |
| | $ | 62.0 |
| $ | 79.8 |
| | $ | 77.0 |
| | $ | 74.1 |
|
The differences between the provision for income taxes and income taxes computed using the U.S. federal statutory rate were as follows:
| | | (In millions) | 2011 | | 2010 | | 2009 | 2012 | | 2011 | | 2010 |
| Amount computed using statutory rate | $ | 103.4 |
| | $ | 104.9 |
| | $ | 83.0 |
| $ | 95.5 |
| | $ | 103.4 |
| | $ | 104.9 |
|
| (Reduction) increase in taxes resulting from: | | | | | | | | | | |
| Net impact from repatriating foreign earnings and direct foreign tax credits | 8.4 |
| | (8.8 | ) | | (7.8 | ) | (21.5 | ) | | 8.4 |
| | (8.8 | ) |
| Foreign income taxes | (24.1 | ) | | (21.7 | ) | | (18.7 | ) | (26.4 | ) | | (24.1 | ) | | (21.7 | ) |
| Impact of non-deductible intangible impairments | 12.6 |
| | — |
| | 7.5 |
| 23.7 |
| | 12.6 |
| | — |
|
| U.S. tax impact of foreign currency transactions | — |
| | (0.2 | ) | | (1.3 | ) | |
| Impact of non-deductible currency translation losses | | 5.7 |
| | — |
| | — |
|
| Impact of changes in Mexican legislation and revaluation of tax assets | (20.4 | ) | | (3.2 | ) | | 4.5 |
| — |
| | (20.4 | ) | | (3.2 | ) |
| Other changes in valuation allowances for deferred tax assets | (0.3 | ) | | 2.1 |
| | 2.9 |
| 2.7 |
| | (0.3 | ) | | 2.1 |
|
| Foreign and domestic tax audit settlement and adjustments | (3.4 | ) | | (1.8 | ) | | (9.1 | ) | (2.0 | ) | | (3.4 | ) | | (1.8 | ) |
| Other | 0.8 |
| | 2.8 |
| | 1.0 |
| 2.1 |
| | 0.8 |
| | 2.6 |
|
| Total | $ | 77.0 |
| | $ | 74.1 |
| | $ | 62.0 |
| $ | 79.8 |
| | $ | 77.0 |
| | $ | 74.1 |
|
The effective tax rates are below the U.S. statutory rate, primarily reflecting the availability of excess foreign tax credits, as well as lower foreign effective tax rates. During 2012, the Company recognized a benefit from repatriating current foreign earnings which resulted in an excess credit benefit. The Company also incurred charges related to impairment of goodwill and intangible assets and currency translation adjustments for which no tax benefit can be recognized. As a result of tax law changes in Mexico, a tax election was made in 2011 that resulted in a reduction of $20.4 million of deferred tax liabilities. The Company also incurred in 2011 additional costs of $16.0 million associated with the repatriation of foreign earnings. Included in the 2010 net impact from repatriating foreign earnings and direct foreign tax credits are a $16.1 million tax benefit of repatriating high tax foreign earnings and direct foreign tax credits and $22.3 million of certain previously unrecognized foreign tax credit benefits, partially offset by the $29.6 million U.S. tax cost due to additional repatriation of low tax foreign earnings in 2010. Certain prior year components have been reclassified to conform to current year presentation.
Deferred tax (liabilities) assets were composed of the following:
| | | (In millions) | 2011 | | 2010 | 2012 | | 2011 |
| Purchased intangibles | $ | (44.2 | ) | | $ | (46.2 | ) | $ | (38.8 | ) | | $ | (44.2 | ) |
| Other | (5.1 | ) | | (29.6 | ) | (6.6 | ) | | (5.1 | ) |
| Gross deferred tax liabilities | (49.3 | ) | | (75.8 | ) | (45.4 | ) | | (49.3 | ) |
| Credit and net operating loss carry forwards (net of unrecognized tax benefits) | 262.7 |
| | 343.1 |
| 325.0 |
| | 262.7 |
|
| Fixed assets basis differences | 25.2 |
| | 27.6 |
| 28.2 |
| | 25.2 |
|
| Employee benefits accruals | 60.0 |
| | 48.7 |
| 71.0 |
| | 60.0 |
|
| Postretirement benefits | 14.0 |
| | 13.5 |
| 12.0 |
| | 14.0 |
|
| Inventory | 11.6 |
| | 9.7 |
| 11.8 |
| | 11.6 |
|
| Accounts receivable | 12.3 |
| | 13.8 |
| 11.7 |
| | 12.3 |
|
| Depreciation | 9.5 |
| | 6.4 |
| 11.4 |
| | 9.5 |
|
| Deferred costs | 79.8 |
| | 25.0 |
| 60.1 |
| | 79.8 |
|
| Liabilities under interest rate swap contracts | 3.8 |
| | 8.5 |
| — |
| | 3.8 |
|
| Capitalized intangibles | 24.4 |
| | 20.6 |
| 26.9 |
| | 24.4 |
|
| Other accruals | 30.2 |
| | 40.7 |
| 31.6 |
| | 30.2 |
|
| Gross deferred tax assets | 533.5 |
| | 557.6 |
| 589.7 |
| | 533.5 |
|
| Valuation allowances | (96.0 | ) | | (99.8 | ) | (103.1 | ) | | (96.0 | ) |
| Net deferred tax assets | $ | 388.2 |
| | $ | 382.0 |
| $ | 441.2 |
| | $ | 388.2 |
|
At December 31, 201129, 2012, the Company had domestic federal and state net operating loss carry forwards of $46.264.9 million, separate state net operating loss carry forwards of $108.4108.8 million, and foreign net operating loss carry forwards of $459.1445.4 million. Of the total foreign and domestic net operating loss carry forwards, $465.5500.1 million expire at various dates from 20122013 to 2031,2032, while the remainder have unlimited lives. During 20112012, the Company realized net cash benefits of $11.010.1 million related to foreign net operating loss carry forwards. At December 31, 201129, 2012 and December 25, 201031, 2011, the Company had estimated foreign tax credit carry forwards of $123.2189.0 million and $176.1123.2 million, respectively, most of which expire in the years 2017 through 20202023 if not utilized. Deferred costs in 20112012 include assets of $77.555.5 million related to advanced payment agreements entered into by the company with its foreign subsidiaries, which are expected to reverse over the next three years.years. At December 31, 201129, 2012 and December 25, 201031, 2011, the Company had valuation allowances against certain deferred tax assets totaling $96.0103.1 million and $99.896.0 million, respectively. These valuation allowances relate to tax assets in jurisdictions where it is management's best estimate that there is not a greater than 50 percent probability that the benefit of the assets will be realized in the associated tax returns. This assessment is based upon expected future domestic results, future foreign dividends from then current year earnings and cash flows and other foreign source income, including rents and royalties, as well as anticipated gains related to future sales of land held for development near the Company's Orlando, Florida headquarters. In addition, certain tax planning transactions may be entered into to facilitate realization of these benefits. The likelihood of realizing the benefit of deferred tax assets is assessed on an ongoing basis. Consequently, future material changes in the valuation allowance are possible. Subject to certain developments, it is possible that the Company may release a material portion of the valuation allowance in 2013. The credit and net operating loss carryforwards wereincreased by $62.3 million, primarily impacted by a decreasean increase to federal foreign tax credit carryforwards, of $49.5 million, as well as a decreaseincreases in various foreign net operating losses. The increasedecrease in deferred costs of $54.819.7 million is due to additionalthe timing of payments received under advanced transaction agreements entered into during the yearcurrent and related payments received from foreign affiliates. The change in the Other accruals caption above is impacted by the timing of realization of foreign exchange gains and losses in the United States as well as multiple other timing differences across various foreign jurisdictions.prior year.
The Company paid income taxes net, in 20112012, 20102011 and 20092010 of $95.4106.4 million, $80.795.4 million and $85.280.7 million, respectively. The Company has a foreign subsidiary which receives a tax holiday that expires in 2020. The net benefit of this and other expired tax holidays was $3.64.1 million, $0.83.6 million and $0.70.8 million in 20112012, 20102011 and 20092010, respectively.
As of December 31, 201129, 2012 and December 25, 201031, 2011, the Company's gross unrecognized tax benefit was $28.624.9 million and $27.328.6 million, respectively. The Company estimates that approximately $23.321.3 million of the unrecognized tax benefits, if recognized, would impact the effective tax rate. A reconciliation of the beginning and ending amount of unrecognized tax benefits is as follows:
| | | (In millions) | 2011 | | 2010 | | 2009 | 2012 | | 2011 | | 2010 |
| Balance, beginning of year | $ | 27.3 |
| | $ | 53.1 |
| | $ | 46.9 |
| $ | 28.6 |
| | $ | 27.3 |
| | $ | 53.1 |
|
| Additions based on tax positions related to the current year | 3.5 |
| | 10.5 |
| | 15.1 |
| 2.1 |
| | 3.5 |
| | 10.5 |
|
| Additions for tax positions of prior year | 4.6 |
| | 2.8 |
| | 0.7 |
| 2.7 |
| | 4.6 |
| | 2.8 |
|
| Reduction for tax positions of prior years | (4.7 | ) | | (27.2 | ) | | (8.7 | ) | (2.6 | ) | | (4.7 | ) | | (27.2 | ) |
| Settlements | (0.2 | ) | | (11.3 | ) | | (0.5 | ) | (1.7 | ) | | (0.2 | ) | | (11.3 | ) |
| Reductions for lapse in statute of limitations | (1.3 | ) | | (0.9 | ) | | (2.1 | ) | (4.5 | ) | | (1.3 | ) | | (0.9 | ) |
| Impact of foreign currency rate changes versus the U.S. dollar | (0.6 | ) | | 0.3 |
| | 1.7 |
| 0.3 |
| | (0.6 | ) | | 0.3 |
|
| Balance, end of year | $ | 28.6 |
| | $ | 27.3 |
| | $ | 53.1 |
| $ | 24.9 |
| | $ | 28.6 |
| | $ | 27.3 |
|
Interest and penalties related to uncertain tax positions in the Company's global operations are recorded as a component of the provision for income taxes. Accrued interest and penalties were $5.85.9 million and $5.15.8 million as of December 31, 201129, 2012 and December 25, 201031, 2011, respectively. Interest and penalties included in the provision for income taxes totaled $0.3 million, $1.2 million and $0.8 million for 2012, 2011 and 2010, respectively. In
During the year ended 2009December 29, 2012, the Company recorded a benefit ofaccrual for uncertain tax positions decreased $1.04.5 million due to the provision related to interest and penalties fromexpiration of the reversalsstatute of certain accruals madelimitations in previous years.various jurisdictions. The accrual also increased for positions being taken during the year in various tax filings. The accrual is further impacted by changes in foreign exchange rates.
During the year ended December 31, 2011, the Company settled certain tax positions in various foreign countries which included a payment of $0.4 million of interest and taxes. As a result of the settlement, the Company's unrecognized tax benefit decreased by $3.2 million, and related accruals for interest and penalties decreased by $0.3 million. Also during 2011, the Company reduced its liability by $1.2 million upon entering into certain advance pricing agreements. During the year, the accrual for uncertain tax positions also increased for positions being taken in various tax filings. The accrual is also impacted by changes in foreign exchange rates.
In the year ended December 25, 2010, the Company recognized $22.3 million of previously unrecognized foreign tax credit benefits as a result of the issuance of clarifying tax guidance and favorable tax developments. In addition, the gross unrecognized tax benefit decreased by $1.9 million as a result of favorable audit settlements in several foreign jurisdictions. During 2010, the Company settled uncertain Mexican tax positions with a payment of $15.6 million ($9.2 million in tax and $6.4 million in interest), which was subject to indemnification by a third party. As a result, the Company's unrecognized tax benefit decreased by $4.2 million, and related accruals for interest and penalties decreased by $7.7 million.
The Company operates globally and files income tax returns in the United States federal, various state, and foreign jurisdictions. In the normal course of business, the Company is subject to examination by taxing authorities throughout the world. The Company is no longer subject to income tax examination in the following major jurisdictions: for U.S. federal tax for years before 2002, Australia (2006)(2008), Brazil (2008)(2005), China (2002), France (2006)(2008), Germany (2006), India (2001), Indonesia (2000), Italy (2005)(2006), Malaysia (2000)(2002), Mexico (2001)(2005), South Africa (2005)(2007) and South Korea (2010)Venezuela (2008), with limited exceptions.
The Company estimates that it may settle one or more foreign audits in the next twelve months that may result in a decrease in the amount of accrual for uncertain tax positions of up to $2.21.8 million. For the remaining balance as of December 31, 201129, 2012, the Company is not able to reliably estimate the timing or ultimate settlement amount. While the Company does not currently expect material changes, it is possible that the amount of unrecognized benefit with respect to the uncertain tax positions will significantly increase or decrease related to audits in various foreign jurisdictions that may conclude during that period or new developments that could also, in turn, impact the Company's assessment relative to the establishment of valuation allowances against certain existing deferred tax assets. At this time, the Company is not able to make a reasonable estimate of the range of impact on the balance of unrecognized tax benefits or the impact on the effective tax rate related to these items.
As of December 31, 201129, 2012, the Company had foreign undistributed earnings of $947 million1.0 billion where it is the Company's intent that the earnings be reinvested indefinitely. Consequently, the Company has not provided for U.S. deferred income taxes on these undistributed earnings. The determination of the amount of unrecognized deferred U.S. income tax liability associated with these undistributed earnings is not practicable because of the complexities associated with the calculation.
The Company recognized $9.313.7 million, $7.39.3 million and $16.27.3 million of benefits for deductions associated with the exercise of employee stock options in 20112012, 20102011 and 20092010, respectively. These benefits were added directly to paid-in capital, and were not reflected in the provision for income taxes.
| |
| Note 13: | Retirement Benefit Plans |
The Company has various defined benefit pension plans covering substantially all domestic employees employed as of June 30, 2005, except those employed by BeautiControl, and certain employees in other countries. In addition to providing pension benefits, the Company provides certain postretirement healthcare and life insurance benefits for selected U.S. and Canadian employees. Employees may become eligible for these benefits if they reach normal retirement age while working for the Company or satisfy certain age and years of service requirements. The medical plans are contributory for most retirees with contributions adjusted annually, and contain other cost-sharing features, such as deductibles and coinsurance. The medical plans include an allowance for Medicare for post-65 age retirees. Most employees and retirees outside the United States are covered by government healthcare programs.
The Company uses its fiscal year end as the measurement date for its plans. The funded status of all of the Company's plans was as follows:
| | | | U.S. plans | | Foreign plans | U.S. plans | | Foreign plans |
| | Pension benefits | | Postretirement benefits | | Pension benefits | Pension benefits | | Postretirement benefits | | Pension benefits |
| (In millions) | 2011 | | 2010 | | 2011 | | 2010 | | 2011 | | 2010 | 2012 | | 2011 | | 2012 | | 2011 | | 2012 | | 2011 |
| Change in benefit obligations: | | | | | | | | | | | | | | | | | | | | | | |
| Beginning balance | $ | 59.2 |
| | $ | 54.1 |
| | $ | 36.6 |
| | $ | 38.4 |
| | $ | 172.6 |
| | $ | 164.6 |
| $ | 63.6 |
| | $ | 59.2 |
| | $ | 38.3 |
| | $ | 36.6 |
| | $ | 176.0 |
| | $ | 172.6 |
|
| Service cost | 1.1 |
| | 1.0 |
| | 0.1 |
| | 0.1 |
| | 9.2 |
| | 8.4 |
| 0.8 |
| | 1.1 |
| | 0.1 |
| | 0.1 |
| | 9.1 |
| | 9.2 |
|
| Interest cost | 2.6 |
| | 2.6 |
| | 1.6 |
| | 1.8 |
| | 7.3 |
| | 7.4 |
| 2.3 |
| | 2.6 |
| | 1.2 |
| | 1.6 |
| | 6.6 |
| | 7.3 |
|
| Actuarial (gain) loss | 2.3 |
| | 3.9 |
| | 3.3 |
| | (0.9 | ) | | 8.6 |
| | 8.7 |
| |
| Actuarial loss (gain) | | 5.0 |
| | 2.3 |
| | (4.0 | ) | | 3.3 |
| | 20.3 |
| | 8.6 |
|
| Benefits paid | (1.4 | ) | | (2.3 | ) | | (3.3 | ) | | (2.9 | ) | | (16.4 | ) | | (17.2 | ) | (0.8 | ) | | (1.4 | ) | | (2.5 | ) | | (3.3 | ) | | (14.2 | ) | | (16.4 | ) |
| Impact of exchange rates | — |
| | — |
| | — |
| | 0.1 |
| | 0.8 |
| | 1.5 |
| — |
| | — |
| | — |
| | — |
| | 1.9 |
| | 0.8 |
|
| Plan participant contributions | — |
| | — |
| | — |
| | — |
| | 1.5 |
| | 4.8 |
| — |
| | — |
| | — |
| | — |
| | 2.1 |
| | 1.5 |
|
| Settlements | (0.2 | ) | | (0.1 | ) | | — |
| | — |
| | (7.6 | ) | | (5.0 | ) | (3.4 | ) | | (0.2 | ) | | — |
| | — |
| | (3.7 | ) | | (7.6 | ) |
| Curtailments/Amendments | — |
| | — |
| | — |
| | — |
| | — |
| | (0.6 | ) | |
| Ending balance | $ | 63.6 |
| | $ | 59.2 |
| | $ | 38.3 |
| | $ | 36.6 |
| | $ | 176.0 |
| | $ | 172.6 |
| $ | 67.5 |
| | $ | 63.6 |
| | $ | 33.1 |
| | $ | 38.3 |
| | $ | 198.1 |
| | $ | 176.0 |
|
| Change in plan assets at fair value: | | | | | | | | | | | | | | | | | | | | | | |
| Beginning balance | $ | 27.8 |
| | $ | 26.2 |
| | $ | — |
| | $ | — |
| | $ | 84.9 |
| | $ | 82.1 |
| $ | 29.8 |
| | $ | 27.8 |
| | $ | — |
| | $ | — |
| | $ | 80.8 |
| | $ | 84.9 |
|
| Actual return on plan assets | 2.1 |
| | 4.2 |
| | — |
| | — |
| | (0.2 | ) | | 4.3 |
| 4.4 |
| | 2.1 |
| | — |
| | — |
| | 5.1 |
| | (0.2 | ) |
| Company contributions | 1.8 |
| | 0.1 |
| | 3.3 |
| | 2.9 |
| | 14.8 |
| | 12.4 |
| 2.1 |
| | 1.8 |
| | 2.5 |
| | 3.3 |
| | 14.8 |
| | 14.8 |
|
| Plan participant contributions | — |
| | — |
| | — |
| | — |
| | 1.9 |
| | 5.0 |
| — |
| | — |
| | — |
| | — |
| | 2.3 |
| | 1.9 |
|
| Benefits and expenses paid | (1.7 | ) | | (2.7 | ) | | (3.3 | ) | | (2.9 | ) | | (15.6 | ) | | (15.7 | ) | (1.2 | ) | | (1.7 | ) | | (2.5 | ) | | (3.3 | ) | | (14.1 | ) | | (15.6 | ) |
| Impact of exchange rates | — |
| | — |
| | — |
| | — |
| | 2.1 |
| | 2.2 |
| — |
| | — |
| | — |
| | — |
| | 0.4 |
| | 2.1 |
|
| Settlements | (0.2 | ) | | — |
| | — |
| | — |
| | (7.1 | ) | | (5.4 | ) | (3.4 | ) | | (0.2 | ) | | — |
| | — |
| | (2.7 | ) | | (7.1 | ) |
| Ending balance | $ | 29.8 |
| | $ | 27.8 |
| | $ | — |
| | $ | — |
| | $ | 80.8 |
| | $ | 84.9 |
| $ | 31.7 |
| | $ | 29.8 |
| | $ | — |
| | $ | — |
| | $ | 86.6 |
| | $ | 80.8 |
|
| Funded status of plans | $ | (33.8 | ) | | $ | (31.4 | ) | | $ | (38.3 | ) | | $ | (36.6 | ) | | $ | (95.2 | ) | | $ | (87.7 | ) | $ | (35.8 | ) | | $ | (33.8 | ) | | $ | (33.1 | ) | | $ | (38.3 | ) | | $ | (111.5 | ) | | $ | (95.2 | ) |
Amounts recognized in the balance sheet consisted of:
| | | (In millions) | December 31,
2011 | | December 25,
2010 | December 29,
2012 | | December 31,
2011 |
| Accrued benefit liability | $ | (167.3 | ) | | $ | (155.7 | ) | $ | (180.4 | ) | | $ | (167.3 | ) |
| Accumulated other comprehensive loss (pretax) | 65.2 |
| | 53.5 |
| 76.1 |
| | 65.2 |
|
Items not yet recognized as a component of pension expense as of December 31, 201129, 2012 and December 25, 201031, 2011 consisted of:
| | | | 2011 | | 2010 | 2012 | | 2011 |
| (In millions) | Pension Benefits | | Postretirement Benefits | | Pension Benefits | | Postretirement Benefits | Pension Benefits | | Postretirement Benefits | | Pension Benefits | | Postretirement Benefits |
| Transition obligation | $ | 0.5 |
| | $ | — |
| | $ | — |
| | $ | — |
| $ | 0.4 |
| | $ | — |
| | $ | 0.5 |
| | $ | — |
|
| Prior service (benefit) | (1.3 | ) | | (6.0 | ) | | (1.7 | ) | | (6.7 | ) | |
| Prior service benefit | | (0.1 | ) | | (5.3 | ) | | (1.3 | ) | | (6.0 | ) |
| Net actuarial loss | 60.1 |
| | 11.9 |
| | 52.9 |
| | 9.0 |
| 73.5 |
| | 7.6 |
| | 60.1 |
| | 11.9 |
|
| Accumulated other comprehensive loss (pretax) | $ | 59.3 |
| | $ | 5.9 |
| | $ | 51.2 |
| | $ | 2.3 |
| $ | 73.8 |
| | $ | 2.3 |
| | $ | 59.3 |
| | $ | 5.9 |
|
Components of other comprehensive income (loss) for the years ended December 31, 201129, 2012 and December 25, 201031, 2011 consisted of the following:
|
| | | | | | | | | | | | | | | |
| | 2011 | | 2010 |
| (In millions) | Pension Benefits | | Postretirement Benefits | | Pension Benefits | | Postretirement Benefits |
| Transition obligation | $ | 0.5 |
| | $ | — |
| | $ | — |
| | $ | — |
|
| Net prior service (cost) benefit | 0.4 |
| | 0.7 |
| | 0.9 |
| | (0.8 | ) |
| Net actuarial gain (loss) | 7.2 |
| | 2.9 |
| | (7.2 | ) | | 0.9 |
|
| Other comprehensive income (loss) | $ | 8.1 |
| | $ | 3.6 |
| | $ | (6.3 | ) | | $ | 0.1 |
|
|
| | | | | | | | | | | | | | | |
| | 2012 | | 2011 |
| (In millions) | Pension Benefits | | Postretirement Benefits | | Pension Benefits | | Postretirement Benefits |
| Transition obligation | $ | — |
| | $ | — |
| | $ | 0.5 |
| | $ | — |
|
| Net prior service cost | 1.1 |
| | 0.7 |
| | 0.4 |
| | 0.7 |
|
| Net actuarial loss (gain) | 13.1 |
| | (4.4 | ) | | 7.2 |
| | 2.9 |
|
| Other comprehensive income loss (gain) | $ | 14.2 |
| | $ | (3.7 | ) | | $ | 8.1 |
| | $ | 3.6 |
|
In 20122013, the Company expects to recognize approximately $0.90.6 million of the prior service benefit and $5.05.1 million of the net actuarial loss, as components of pension and postretirement expense.
The accumulated benefit obligation for all defined benefit pension plans at December 31, 201129, 2012 and December 25, 201031, 2011 was $208.1230.1 million and $205.9208.1 million, respectively. At December 31, 201129, 2012 and December 25, 201031, 2011, the accumulated benefit obligations of certain pension plans exceeded those plans' assets. For those plans, the accumulated benefit obligations were $170.0224.4 million and $152.8170.0 million, and the fair value of their assets was $69.3109.8 million and $55.069.3 million as of December 31, 201129, 2012 and December 25, 201031, 2011, respectively. The accrued benefit cost for the pension plans is reported in accrued liabilities and other long-term liabilities.
The costs associated with all of the Company's plans were as follows:
| | | | Pension benefits | | Postretirement benefits | Pension benefits | | Postretirement benefits |
| (In millions) | 2011 | | 2010 | | 2009 | | 2011 | | 2010 | | 2009 | 2012 | | 2011 | | 2010 | | 2012 | | 2011 | | 2010 |
| Components of net periodic benefit cost: | | | | | | | | | | | | | | | | | | | | | | |
| Service cost and expenses | $ | 10.3 |
| | $ | 9.4 |
| | $ | 7.5 |
| | $ | 0.1 |
| | $ | 0.1 |
| | $ | 0.1 |
| $ | 9.9 |
| | $ | 10.3 |
| | $ | 9.4 |
| | $ | 0.1 |
| | $ | 0.1 |
| | $ | 0.1 |
|
| Interest cost | 9.9 |
| | 10.0 |
| | 9.7 |
| | 1.7 |
| | 1.8 |
| | 2.5 |
| 8.9 |
| | 9.9 |
| | 10.0 |
| | 1.2 |
| | 1.7 |
| | 1.8 |
|
| Return on plan assets | (5.5 | ) | | (6.5 | ) | | (5.7 | ) | | — |
| | — |
| | — |
| (5.6 | ) | | (5.5 | ) | | (6.5 | ) | | — |
| | — |
| | — |
|
| Settlement/Curtailment | 2.8 |
| | 2.2 |
| | — |
| | — |
| | — |
| | — |
| 1.7 |
| | 2.8 |
| | 2.2 |
| | — |
| | — |
| | — |
|
| Employee contributions | (0.3 | ) | | — |
| | — |
| | — |
| | — |
| | — |
| (0.3 | ) | | (0.3 | ) | | — |
| | — |
| | — |
| | — |
|
| Net deferral | 3.9 |
| | 3.2 |
| | 4.0 |
| | (0.4 | ) | | (0.4 | ) | | (0.5 | ) | 4.3 |
| | 3.9 |
| | 3.2 |
| | (0.4 | ) | | (0.4 | ) | | (0.4 | ) |
| Net periodic benefit cost | $ | 21.1 |
| | $ | 18.3 |
| | $ | 15.5 |
| | $ | 1.4 |
| | $ | 1.5 |
| | $ | 2.1 |
| $ | 18.9 |
| | $ | 21.1 |
| | $ | 18.3 |
| | $ | 0.9 |
| | $ | 1.4 |
| | $ | 1.5 |
|
| Weighted average assumptions: | | | | | | | | | | | | | | | | | | | | | | |
| U.S. plans | | | | | | | | | | | | | | | | | | | | | | |
| Discount rate, net periodic benefit cost | 4.7 | % | | 5.1 | % | | 5.8 | % | | 5.0 | % | | 5.3 | % | | 5.8 | % | 3.7 | % | | 4.7 | % | | 5.1 | % | | 4.0 | % | | 5.0 | % | | 5.3 | % |
| Discount rate, benefit obligations | 3.7 |
| | 4.7 |
| | 5.1 |
| | 4.0 |
| | 5.0 |
| | 5.3 |
| 3.3 |
| | 3.7 |
| | 4.7 |
| | 3.5 |
| | 4.0 |
| | 5.0 |
|
| Return on plan assets | 8.3 |
| | 8.3 |
| | 8.3 |
| | n/a | | n/a | | n/a | 8.3 |
| | 8.3 |
| | 8.3 |
| | n/a | | n/a | | n/a |
| Salary growth rate, net periodic benefit cost | 5.0 |
| | 5.0 |
| | 5.0 |
| | n/a | | n/a | | n/a | 3.0 |
| | 5.0 |
| | 5.0 |
| | n/a | | n/a | | n/a |
| Salary growth rate, benefit obligations | 3.0 |
| | 5.0 |
| | 5.0 |
| | n/a | | n/a | | n/a | 3.0 |
| | 3.0 |
| | 5.0 |
| | n/a | | n/a | | n/a |
| Foreign plans | | | | | | | | | | | | | | | | | | | | | | |
| Discount rate | 3.9 | % | | 4.3 | % | | 5.0 | % | | n/a | | n/a | | n/a | 3.3 | % | | 3.9 | % | | 4.3 | % | | n/a | | n/a | | n/a |
| Return on plan assets | 4.1 |
| | 4.4 |
| | 4.8 |
| | n/a | | n/a | | n/a | 4.1 |
| | 4.1 |
| | 4.4 |
| | n/a | | n/a | | n/a |
| Salary growth rate | 3.1 |
| | 3.0 |
| | 3.1 |
| | n/a | | n/a | | n/a | 3.1 |
| | 3.1 |
| | 3.0 |
| | n/a | | n/a | | n/a |
The Company has established strategic asset allocation percentage targets for significant asset classes with the aim of achieving an appropriate balance between risk and return. The Company periodically revises asset allocations, where appropriate, in an effort to improve return and manage risk. The estimatedexpected return on plan assets is determined based on the expected long-term rate of return on plan assets and the market-related value of plan assets. The market-related value of plan assets is based on long-term expectations given current investment objectives and historical results. The expected rate of return assumption used by the Company to determine the benefit obligation for its U.S. and foreign plans for 2011was 8.3 percent and 4.1 percent, respectively, andfor both 8.3 percent2012 and 4.4 percent2011 for 2010, respectively..
The Company determines the discount rate primarily by reference to rates of high-quality, long term corporate and government bonds that mature in a pattern similar to the expected payments to be made under the plans. The weighted average discount rates used to determine the benefit obligation was 3.3 percentfor both the U.S. and foreign plans forin 20112012 were, and 3.7 percent and 3.9 percent, respectively, and 4.7 percent and 4.3 percent, respectively, for 20102011.
The assumed healthcare cost trend rate for 20112012 was 7.3 percent for both post-65 age participants and pre-65 age participants, decreasing to 5.0 percent in 2019. The healthcare cost trend rate assumption could have a significant effect on the amounts reported. A one percentage point change in the assumed healthcare cost trend rates would have the following effects:
| | | | One percentage point | One percentage point |
| (In millions) | Increase | | Decrease | Increase | | Decrease |
| Effect on total of service and interest cost components | $ | 0.1 |
| | $ | 0.1 |
| $ | 0.1 |
| | $ | 0.1 |
|
| Effect on post-retirement benefit obligation | 2.5 |
| | 2.2 |
| 1.9 |
| | 1.7 |
|
The Company sponsors a number of pension plans in the United States and in certain foreign countries. There are separate investment strategies in the United States and for each unit operating internationally that depend on the specific circumstances and objectives of the plans and/or to meet governmental requirements. The Company's overall strategic investment objectives are to preserve the desired funded status of its plans and to balance risk and return through a wide diversification of asset types, fund strategies and investment managers. The asset allocation depends on the specific strategic objectives for each plan and is rebalanced to obtain the target asset mix if the percentages fall outside of the range considered to be acceptable. The investment policies are reviewed from time to time to ensure consistency with long-term objectives. Options, derivatives, forward and futures contracts, short positions, or margined positions may be held in reasonable amounts as deemed prudent. For plans that are tax-exempt, any transactions that would jeopardize this status are not allowed. Lending of securities is permitted in some cases in which appropriate compensation can be realized. The Company's plans do not invest directly in its own stock; however, this does not mean investment in insurance company accounts or other commingled or mutual funds, or any index funds may not hold securities of the Company. The investment objectives of each unit are more specifically outlined below.
The Company's weighted-average asset allocations at December 31, 201129, 2012 and December 25, 201031, 2011, by asset category, were as follows:
| | | | 2011 | | 2010 | 2012 | | 2011 |
| Asset Category | U.S. plans | | Foreign plans | | U.S. plans | | Foreign plans | U.S. plans | | Foreign plans | | U.S. plans | | Foreign plans |
| Equity securities | 62 | % | | 25 | % | | 64 | % | | 30 | % | 62 | % | | 29 | % | | 62 | % | | 24 | % |
| Fixed income securities | 38 |
| | 16 |
| | 36 |
| | 13 |
| 37 |
| | 12 |
| | 37 |
| | 13 |
|
| Real estate | — |
| | 5 |
| | — |
| | 1 |
| |
| Cash and money market investments | — |
| | 41 |
| | — |
| | 9 |
| 1 |
| | 7 |
| | 1 |
| | 8 |
|
| Guaranteed contracts | — |
| | 13 |
| | — |
| | 47 |
| — |
| | 51 |
| | — |
| | 54 |
|
| Other | | — |
| | 1 |
| | — |
| | 1 |
|
| Total | 100 | % | | 100 | % | | 100 | % | | 100 | % | 100 | % | | 100 | % | | 100 | % | | 100 | % |
The fair value of the Company's pension plan assets at December 29, 2012 by asset category is as follows:
|
| | | | | | | | | | | | | | | | |
Description of Assets (in millions) | December 29,
2012 | | Quoted Prices in Active Markets for Identical Assets (Level 1) | | Significant Other Observable Inputs (Level 2) | | Significant Unobservable Inputs (Level 3) |
| Domestic plans: | | | | | | | |
| | Common/collective trust (a) | $ | 31.7 |
| | $ | — |
| | $ | 31.7 |
| | $ | — |
|
| Foreign plans: | | | | | | | |
| Australia | Investment fund (b) | 5.6 |
| | — |
| | 5.6 |
| | — |
|
| Switzerland | Guaranteed insurance contract (c) | 35.2 |
| | — |
| | — |
| | 35.2 |
|
| Germany | Guaranteed insurance contract (c) | 5.6 |
| | — |
| | — |
| | 5.6 |
|
| Belgium | Mutual fund (d) | 19.9 |
| | 19.9 |
| | — |
| | — |
|
| Austria | Guaranteed insurance contract (c) | 0.5 |
| | — |
| | — |
| | 0.5 |
|
| Korea | Guaranteed insurance contract (c) | 3.1 |
| | — |
| | — |
| | 3.1 |
|
| Japan | Common/collective trust (e) | 7.3 |
| | — |
| | 7.3 |
| | — |
|
| | Money market fund (e) | 4.8 |
| | 4.8 |
| | — |
| | — |
|
| Philippines | Fixed income securities (f) | 2.6 |
| | 2.6 |
| | — |
| | — |
|
| | Equity funds (f) | 2.0 |
| | 2.0 |
| | — |
| | — |
|
| Total | | $ | 118.3 |
| | $ | 29.3 |
| | $ | 44.6 |
| | $ | 44.4 |
|
The fair value of the Company's pension plan assets at December 31, 2011 by asset category is as follows:
|
| | | | | | | | | | | | | | | | |
Description of Assets (in millions) | December 31,
2011 | | Quoted Prices in Active Markets for Identical Assets (Level 1) | | Significant Other Observable Inputs (Level 2) | | Significant Unobservable Inputs (Level 3) |
| Domestic plans: | | | | | | | |
| | Common/collective trust (a) | $ | 29.8 |
| | $ | — |
| | $ | 29.8 |
| | $ | — |
|
| Foreign plans: | | | | | | | |
| Australia | Investment fund (b) | 5.0 |
| | — |
| | 5.0 |
| | — |
|
| Switzerland | Guaranteed insurance contract (c) | 33.9 |
| | — |
| | — |
| | 33.9 |
|
| Germany | Guaranteed insurance contract (c) | 5.6 |
| | — |
| | — |
| | 5.6 |
|
| Belgium | Mutual fund (d) | 16.1 |
| | 16.1 |
| | — |
| | — |
|
| Austria | Euro bond fund (e) | 1.0 |
| | 1.0 |
| | — |
| | — |
|
| | Guaranteed insurance contract (c) | 0.5 |
| | — |
| | — |
| | 0.5 |
|
| Korea | Guaranteed insurance contract (c) | 2.8 |
| | — |
| | — |
| | 2.8 |
|
| Japan | Common/collective trust (f) | 7.4 |
| | — |
| | 7.4 |
| | — |
|
| | Money market fund (f) | 4.6 |
| | 4.6 |
| | — |
| | — |
|
| Philippines | Fixed income securities (g) | 3.1 |
| | 3.1 |
| | — |
| | — |
|
| | Money market fund (g) | 0.7 |
| | 0.7 |
| | — |
| | — |
|
| Total | | $ | 110.5 |
| | $ | 25.5 |
| | $ | 42.2 |
| | $ | 42.8 |
|
The fair value of the Company's pension plan assets at December 25, 2010 by asset category is as follows:
| | Description of Assets (in millions) | Description of Assets (in millions) | December 25,
2010 | | Quoted Prices in Active Markets for Identical Assets (Level 1) | | Significant Other Observable Inputs (Level 2) | | Significant Unobservable Inputs (Level 3) | Description of Assets (in millions) | December 31,
2011 | | Quoted Prices in Active Markets for Identical Assets (Level 1) | | Significant Other Observable Inputs (Level 2) | | Significant Unobservable Inputs (Level 3) |
| Domestic plans: | Domestic plans: | | | | | | | | Domestic plans: | | | | | | | |
| | Common/collective trust (a) | $ | 27.8 |
| | $ | — |
| | $ | 27.8 |
| | $ | — |
| Common/collective trust (a) | $ | 29.8 |
| | $ | — |
| | $ | 29.8 |
| | $ | — |
|
| Foreign plans: | Foreign plans: | | | | | | | | Foreign plans: | | | | | | | |
| Australia | Investment fund (b) | 6.4 |
| | — |
| | 6.4 |
| | — |
| Investment fund (b) | 5.0 |
| | — |
| | 5.0 |
| | — |
|
| Switzerland | Guaranteed insurance contract (c) | 30.5 |
| | — |
| | — |
| | 30.5 |
| Guaranteed insurance contract (c) | 33.9 |
| | — |
| | — |
| | 33.9 |
|
| Germany | Guaranteed insurance contract (c) | 5.4 |
| | — |
| | — |
| | 5.4 |
| Guaranteed insurance contract (c) | 5.6 |
| | — |
| | — |
| | 5.6 |
|
| Belgium | Mutual fund (d) | 19.2 |
| | — |
| | 19.2 |
| | — |
| Mutual fund (d) | 16.1 |
| | 16.1 |
| | — |
| | — |
|
| Austria | Euro bond fund (e) | 1.1 |
| | — |
| | 1.1 |
| | — |
| Euro bond fund (g) | 1.0 |
| | 1.0 |
| | — |
| | — |
|
| | | Guaranteed insurance contract (c) | 0.5 |
| | — |
| | — |
| | 0.5 |
|
| Korea | Guaranteed insurance contract (c) | 4.3 |
| | — |
| | — |
| | 4.3 |
| Guaranteed insurance contract (c) | 2.8 |
| | — |
| | — |
| | 2.8 |
|
| Japan | Common/collective trust (f) | 8.4 |
| | — |
| | 8.4 |
| | — |
| Common/collective trust (e) | 7.4 |
| | — |
| | 7.4 |
| | — |
|
| | Money market fund (f) | 6.0 |
| | 6.0 |
| | — |
| | — |
| Money market fund (e) | 4.6 |
| | 4.6 |
| | — |
| | — |
|
| Philippines | Fixed income securities (g) | 3.6 |
| | 3.6 |
| | — |
| | — |
| Fixed income securities (f) | 3.1 |
| | 3.1 |
| | — |
| | — |
|
| | | Money market fund (f) | 0.7 |
| | 0.7 |
| | — |
| | — |
|
| Total | | $ | 112.7 |
| | $ | 9.6 |
| | $ | 62.9 |
| | $ | 40.2 |
| | $ | 110.5 |
| | $ | 25.5 |
| | $ | 42.2 |
| | $ | 42.8 |
|
____________________
| |
| (a) | The investment strategy of the U.S. pension plan for each period presented is to seek to achieve each year a return greater than or equal to the return that would have been earned by a portfolio invested approximately 60 percent in equity securities and 40 percent in fixed income securities for both periods. As of each of the years ended December 31, 201129, 2012 and December 25, 201031, 2011, the common trusts held 62 and 64 percent of its assets in equity securities, and 38 and 3637 percent in fixed income securities respectively. Ofand the remaining amounts heldin cash and money markets. The percentage of invested funds in equity securities at the end of both 20112012 and 20102011, the percentage of invested funds included: 32 and 33 percent in large U.S. stocks, 20 and 21 percent small U.S. stocks respectively, and 10 percent in international stocks in each year.stocks. The common trusts are comprised of shares or units in commingled funds that are not publicly traded. The underlying assets in these funds (equity securities and fixed income securities) are valued using quoted market prices. |
| |
| (b) | For each period presented, the strategy of this fund is to achieve a long-term net return of at least 4 percent above inflation based on the Australian consumer price index over a rolling 5 year period. The investment strategy is to invest mainly in equities and property, which are expected to earn relatively higher returns over the long term. The fair value of the fund is determined using the net asset value per share using quoted market prices or other observable inputs in active markets. As of December 31, 201129, 2012 and December 25, 201031, 2011, the percentage of funds held in investments included: Australian equities of 3534 and 3735 percent, government and corporate bonds of 11 and 10 percent and cash of 7 and 7 percent, respectively, and other equities of listed companies outside of Australia of 38 and 27 percent, and real estate of 10 and 19 percent, government and corporate bonds of 10 and 11 percent and cash of 7 and 6 percent, respectively.in each year. |
| |
| (c) | The strategy of the Company's plans in Austria, Germany, Korea and Switzerland is to seek to ensure the future benefit payments of their participants and manage market risk. This is achieved by funding the pension obligations through guaranteed insurance contracts. The plan assets operate similar to investment contracts whereby the interest rate, as well as the surrender value, is guaranteed. The fair value is determined as the contract value, using a guaranteed rate of return which will increase if the market performance exceeds that return. |
| |
| (d) | The strategy of the Belgian plan in each period presented is to seek to achieve each year a return greater than or equal to the return that would have been earned by a portfolio invested approximately 60 percent in equity securities and 40 percent in fixed income securities. The fair value of the fund is calculated using the net asset value per share as determined by the quoted market prices of the underlying investments. As of December 31, 201129, 2012 and December 25, 201031, 2011, the percentage of funds held in investments included: large-cap equities of European companies of 2834 and 3328 percent, small-cap equities of European companies of 2018 and 2220 percent, equities outside of Europe, mainly in the U.S. and emerging markets, of 1411 and 1214 percent, and the remaining amount in bonds, primarily from European and U.S. governments, of 3837 and 3338 percent, respectively. |
| |
| (e) | This fund invests in highly-rated euro government bonds. The fair value of the bond fund is determined using quoted market prices of the underlying assets included in the fund. |
| |
(f) | The Company's strategy for each period presented is to invest approximately 60 percent of assets to benefit from the higher expected returns from long-term investments in equities and to invest 40 percent of assets in short-term low investment risk instruments to fund near term benefits payments. The target allocation for plan assets to implement this strategy is 50 percent equities in Japanese listed securities, 7 percent in equities outside of Japan and 43 percent in cash and other short-term investments. The equity investment has been achieved through a collective trust that held 6261 and 5962 percent in total funded assets as of December 31, 201129, 2012 and December 25, 201031, 2011, respectively. Of the amount held in the collective trust as of the end of both 20112012 and 20102011, 88 and 87 percent was invested in Japanese equities, while 12 and 13 percent was invested in equities of companies based outside of Japan, respectively.Japan. The fair value of the collective trust is determined by the market value of the underlying shares, which are traded in active markets. At year end 20112012 and 20102011, 3839 and 4138 percent of the plan assets were held in a money market fund. The money market fund is a highly liquid investment and is valued using quoted market prices in active markets. |
| |
(g)(f) | TheIn 2012, the investment strategy in the Philippines is to achieve an appropriate balance between risk and return, from a diversified portfolio of Philippine peso denominated bonds and equities. The target asset class allocations is 57 percent in equity securities, 38 percent fixed income securities and 5 percent in cash and deposits. The fixed income securities at year end were valued using quoted bid prices on similarly termed government securities. The equity index fund was valued at the closing price of the active market in which it was traded. In 2011, the strategy was to invest in low risk domestic fixed-incomefixed income earnings securities. Assets include,securities, including but are not limited to Philippine peso denominated treasury bills, treasury bonds, treasury notes and other government securities fully guaranteed by the Philippine government. |
| |
| (g) | In 2011, these amounts represented highly-rated euro government bonds. The amounts held at year end were valued using quoted bid prices on similarly termed government securities. The money marketfair value of the bond fund is a highly liquid investment and is valuedwas determined using quoted market prices of the underlying assets included in active markets.the fund. |
The following table presents a reconciliation of the beginning and ending balances of the fair value measurements using significant unobservable inputs (Level 3):
| | | | Level 3 | Year Ending |
| Beginning balance at December 25, 2010 | $ | 40.2 |
| |
| | | December 29,
2012 | | December 31,
2011 |
| Beginning balance | | $ | 42.8 |
| | $ | 40.2 |
|
| Realized gains | 1.1 |
| 0.8 |
| | 1.1 |
|
| Purchases, sales and settlements, net | 0.6 |
| (0.1 | ) | | 0.6 |
|
| Impact of exchange rates | 0.9 |
| 0.9 |
| | 0.9 |
|
| Ending balance at December 31, 2011 | $ | 42.8 |
| |
| Ending balance | | $ | 44.4 |
| | $ | 42.8 |
|
The Company expects to contribute $16.4 million to its U.S. and foreign pension plans and $3.12.8 million to its other U.S. postretirement benefit plan in 20122013.
The Company also has several savings, thrift and profit-sharing plans. Its contributions to these plans are in part based upon various levels of employee participation. The total cost of these plans was $8.7 million, $8.98.7 million and $7.88.9 million for 20112012, 20102011 and 20092010, respectively.
The following benefit payments, which reflect expected future service, as appropriate, are expected to be paid forfrom the Company's U.S. and foreign plans:
| | | Years | Pension benefits | | Postretirement benefits | | Subsidy receipts | | Total | Pension benefits | | Postretirement benefits | | Subsidy receipts | | Total |
| 2012 |
| $12.5 |
| |
| $3.5 |
| |
| $0.4 |
| |
| $15.6 |
| |
| 2013 | 13.2 |
| | 3.5 |
| | 0.4 |
| | 16.3 |
|
| $14.3 |
| |
| $3.2 |
| |
| $0.3 |
| |
| $17.2 |
|
| 2014 | 20.0 |
| | 3.6 |
| | 0.5 |
| | 23.1 |
| 21.6 |
| | 3.2 |
| | 0.3 |
| | 24.5 |
|
| 2015 | 11.9 |
| | 3.6 |
| | 0.5 |
| | 15.0 |
| 13.0 |
| | 3.2 |
| | 0.3 |
| | 15.9 |
|
| 2016 | 14.1 |
| | 3.5 |
| | 0.5 |
| | 17.1 |
| 14.8 |
| | 3.1 |
| | 0.3 |
| | 17.6 |
|
| 2017-2021 | 96.8 |
| | 15.8 |
| | 2.4 |
| | 110.2 |
| |
| 2017 | | 37.8 |
| | 3.0 |
| | 0.3 |
| | 40.5 |
|
| 2018-2022 | | 87.7 |
| | 13.2 |
| | 1.7 |
| | 99.2 |
|
Included in the postretirement benefits in the table above are expected payments for prescription drug benefits. As a result of the Medicare Prescription Drug, Improvement and Modernization Act of 2003, the Company expects subsidies of $4.73.2 million from 20122013 through 20212022 related to these prescription drug benefits.
| |
| Note 14: | Incentive Compensation Plans |
On May 12, 2010, the shareholders of the Company approved the adoption of the Tupperware Brands Corporation 2010 Incentive Plan (the “2010 Incentive Plan”). The 2010 Incentive Plan provides for the issuance of cash and stock-based incentive awards to employees, directors and certain non-employee participants. Stock-based awards may be in the form of performance awards, stock options, stock appreciation rights, restricted stock awards and restricted stock unit awards. Under the plan, awards that are canceled or expire are added back to the pool of available shares. TheWhen the 2010 Incentive Plan was approved, the number of shares of the Company's common stock available for stock-based awards under the plan totaled 4,750,000, plus any remaining shares available for issuance under the Tupperware Brands Corporation 2006 Incentive Plan and the Tupperware Brands Corporation Director Stock Plan. Shares may no longer be granted under these plans. The total number of shares available for grant under the 2010 Incentive Plan as of December 31, 201129, 2012 was 4,684,0813,950,003.
Under the 2010 Incentive Plan, non-employee directors are obligated to receive one-half of their annual retainers in the form of stock and may elect to receive the balance of their annual retainers in the form of stock or cash. In addition, each non-employee director is eligible to receive a stock award in such form, at such time and in such amount as may be determined by the Nominating and Governance Committee of the Board of Directors.
Stock Options
Stock options to purchase the Company's common stock are granted to employees, upon approval by the Company's Board of Directors, with an exercise price equal to the fair market value of the stock on the date of grant. Options generally become exercisable in three years, in equal installments beginning one year from the date of grant, and generally expire 10 years from the date of grant. The fair value of the Company's stock options was estimated on the date of grant using the Black-Scholes option-pricing model with the following weighted average assumptions:
| | | | 2011 | | 2010 | | 2009 | 2012 | | 2011 | | 2010 |
| Dividend yield | 2.1 | % | | 2.7 | % | | 3.5 | % | 2.5 | % | | 2.1 | % | | 2.7 | % |
| Expected volatility | 40 | % | | 40 | % | | 39 | % | 39 | % | | 40 | % | | 40 | % |
| Risk-free interest rate | 1.6 | % | | 2.0 | % | | 2.9 | % | 1.2 | % | | 1.6 | % | | 2.0 | % |
| Expected life | 8 years |
| | 8 years |
| | 8 years |
| 8 years |
| | 8 years |
| | 8 years |
|
Stock option activity for 20112012, under all of the Company's incentive plans, is summarized in the following table:
| | | | Outstanding | | Exercisable | | | | | | | | | | |
| Stock options | Shares subject to option | | Weighted average exercise price per share | | Options exercisable at year end | | Weighted average exercise price per share | Shares subject to option | | Weighted average exercise price per share | | Aggregate Intrinsic Value (in millions) |
| Balance at December 25, 2010 | 3,535,204 |
| |
| $27.43 |
| | 2,591,135 |
| |
| $23.69 |
| |
| Outstanding at December 31, 2011 | | 3,153,506 |
| |
| $31.43 |
| | |
| Granted | 334,800 |
| | 54.92 |
| | |
| | |
| 382,850 |
| | 61.10 |
| | |
|
| Expired/Forfeited | (2,484 | ) | | 48.30 |
| | |
| | |
| |
| Exercised | (714,014 | ) | | 22.60 |
| | |
| | |
| (600,437 | ) | | 22.37 |
| | |
|
| Balance at December 31, 2011 | 3,153,506 |
| |
| $31.43 |
| | 2,405,638 |
| |
| $25.85 |
| |
| Outstanding at December 29, 2012 | | 2,935,919 |
| |
| $37.15 |
| | $ | 74.9 |
|
| Exercisable at December 29, 2012 | | 2,202,605 |
| |
| $30.59 |
| | $ | 70.7 |
|
The intrinsic value of options exercised during 20112012, 20102011 and 20092010 totaled $24.123.5 million, $22.024.1 million and $54.922.0 million, respectively. The average remaining contractual life on outstanding and exercisable options was 6.16.2 years and 5.15.3 years, respectively, at the end of 20112012. The weighted average estimated grant date fair value of 20112012, 20102011 and 20092010 option grants was $19.3719.73, $15.7119.37 and $12.6415.71 per share, respectively.
Performance Awards, Restricted Stock and Restricted Stock Units
The Company also grants performance awards, restricted stock and restricted stock units to employees and directors. The Company has time-vested and performance-vested awards, which typically have initial vesting periods ranging from one to six years.years. Compensation expense associated with restricted stock and restricted stock units is equal to the market value of the Company's common stock on the date of grant, and for time-vested awards, is recorded on a straight-line basis over the required service period.
The Company's performance-vested awards, granted under its performance share plan, provide incentive opportunity based on the overall success of the Company, as reflected through cash flow and earnings per share achieved over a three-yearthree-year performance period. The program is based upon a pre-defined number of performance share units, and depending on achievement under the performance measures, the number of shares actually vested can be up to 150 percent of shares initially granted. The awards have been made in the Company's common stock, and the Company records expense on these awards based on the probability of achieving the performance conditions over the three-year performance period.
In 20112012, as a result of improved performance, the Company increased the estimated number of shares expected to vest by a total of 15,7759,435 shares for the three performance share plans running during 20112012.
Restricted stock, restricted stock units, and performance share award activity for 20112012 under all of the Company's incentive plans is summarized in the following table:
| | | | Shares outstanding | | Weighted average grant date fair value | Non-vested Shares outstanding | | Weighted average grant date fair value |
| Balance at December 25, 2010 | 987,739 |
| |
| $25.86 |
| |
| Outstanding at December 31, 2011 | | 945,265 |
| |
| $34.93 |
|
| Granted | 278,509 |
| | 56.26 |
| 167,625 |
| | 60.69 |
|
| Performance share adjustments | 15,775 |
| | 54.76 |
| 9,435 |
| | 55.44 |
|
| Vested | (324,262 | ) | | 26.74 |
| (319,023 | ) | | 29.17 |
|
| Forfeited | (12,496 | ) | | 40.42 |
| (3,261 | ) | | 48.77 |
|
| Balance at December 31, 2011 | 945,265 |
| |
| $34.93 |
| |
| Outstanding at December 29, 2012 | | 800,041 |
| |
| $43.01 |
|
The grant date fair value of performance awards, restricted stock and restricted stock units vested in 20112012, 20102011 and 20092010 was $17.319.6 million, $11.817.3 million and $4.211.8 million, respectively. The weighted-average grant-date fair value per share of these awards in 2012, 2011 and 2010 was $60.69, $56.26 and $46.59, respectively.
Compensation expense associated with performance awards, restricted stock and restricted stock units that settle in stock is equal to the market value of the shares on the date of grant and is recorded pro rata over the requisite service period. For awards which are paid in cash, compensation expense is remeasured each reporting period based on the market value of the shares and is included as a liability on the Consolidated Balance Sheets. Shares outstanding with cash settled awards totaled 7,5307,071, 10,6517,530 and 7,96910,651 shares as of December 31, 201129, 2012,December 25, 2010 and December 26, 2009, respectively. As of December 31, 2011 and December 25, 2010, theserespectively. These cash settled awards had a fair value of $0.4 million as of December 29, 2012and $0.5 millionDecember 31, 2011, respectively..
Compensation expense associated with all employee stock-based compensation was $18.020.1 million, $14.818.0 million and $13.214.8 million in 20112012, 20102011 and 20092010, respectively. The estimated tax benefit associated with this compensation expense was $6.57.2 million, $5.46.5 million and $4.85.4 million in 20112012, 20102011 and 20092010, respectively. As of December 31, 201129, 2012, total unrecognized stock based compensation expense related to all stock based awards was $22.820.9 million, which is expected to be recognized over a weighted average period of 2624 months.
Expense related to earned cash performance awards of $18.722.2 million, $23.618.7 million and $25.123.6 million was included in the Consolidated Statements of Income for 20112012, 20102011 and 20092010, respectively.
Stock from treasury shares was issued during 2009 when stock options were exercised until all such shares were issued, which occurred duringUnder an open market share repurchase program that originally began in 2007, the first quarter. Subsequently, the Company began using previously unissued shares and then began repurchasing shares in the third quarter of 2009. Some of these shares were then used to satisfy option exercises. The Company's Board of Directors, in February 2010, approved a revised program for repurchasing shares with an aggregate cost upincreased to $350 million the amount that could be spent on repurchases until February 1, 2015. The Company expected, at that time, to use proceeds from stock option exercises and excess cash generated by the business to offset dilution associated with the Company's equity incentive plans, with the intention of keeping the number of shares outstanding at about 63 million. In January 2011, the Company's board increased the share repurchase authorization by $250 million to $600 million, and in October 2011, further increased the share repurchase authorization by $600 million to $1.2 billion and finally in January 2013 increased the authorization by $800 million to $2 billion. The authorization continues to run untilcurrently has an expiration date of February 1, 2015.2017.
During 20112012, 20102011 and 20092010, the Company repurchased 7.13.3 million, 1.37.1 million and 1.81.3 million shares at an aggregate cost of $426.1200.0 million, $60.3426.1 million and $77.060.3 million, respectively. Since inception of the program in May 2007 and through December 31, 201129, 2012, the Company had repurchased 12.215.5 million shares at an aggregate cost of $627.7827.7 million.
| |
| Note 15: | Segment Information |
The Company manufactures and distributes a broad portfolio of products, primarily through independent direct sales consultants. Certain operating segments have been aggregated based upon consistency of economic substance, geography, products, production process, class of customers and distribution method.
Effective with the first quarter of 2011, the Company changed its segment reporting to reflect the geographic distribution of its businesses in accordance with how it views the operations. Since the acquisition of the direct sellingdirect-to-consumer businesses of Sara Lee Corporation in 2005, certain segments previously aggregated in Beauty Other havea "Beauty Other" segment changed such that both Tupperware and beauty and personal care products contribute significantly to sales and profit, which has changed the way these businesses have been operated. Consequently, the Company no longer has a Beauty Other segment, and the businesses previously reported in that segment are now reported as follows: Tupperware Brands Philippines in Asia Pacific; the Company's Central America businesses in Tupperware North America; the Nutrimetics businesses in Europe and Asia Pacific (as applicable); and the businesses in South America as a separate geographic segment. Comparable information from 2010 and 2009 has been reclassified to conform to the new presentation.
The Company's reportable segments include the following:
|
| |
| Europe | Primarily design-centric preparation, storage and serving solutions for the kitchen and home through the Tupperware® brand. Europe also includes Avroy Shlain® and Nutrimetics® units that sell beauty and personal care products. Asia Pacific also sells beauty and personal care products in some of its units under the NaturCare®, Nutrimetics® and Fuller® brands.
|
| Asia Pacific |
| Tupperware North America |
| Beauty North America | Premium cosmetics, skin care and personal care products marketed under the BeautiControlArmand Dupree® and Armand DupreeBeautiControl® brands in the United States, Canada and Puerto Rico and the Armand Dupree® and Fuller Cosmetics® brandbrands in Mexico and Central America.
|
| South America | Both housewarehousewares and beauty products under the Fuller®, Nuvo® and Tupperware® brands. |
Worldwide sales of beauty and personal care products totaled $679.8610.5 million, $666.6679.8 million and $622.6666.6 million in 20112012, 20102011 and 20092010, respectively.
| | | (In millions) | 2011 | | 2010 | | 2009 | 2012 | | 2011 | | 2010 |
| Net sales: | | | | | | | | | | |
| Europe | $ | 848.9 |
| | $ | 796.0 |
| | $ | 768.9 |
| $ | 791.4 |
| | $ | 848.9 |
| | $ | 796.0 |
|
| Asia Pacific | 714.0 |
| | 584.0 |
| | 494.0 |
| 780.7 |
| | 714.0 |
| | 584.0 |
|
| Tupperware North America | 352.0 |
| | 331.5 |
| | 296.9 |
| 344.8 |
| | 352.0 |
| | 331.5 |
|
| Beauty North America | 395.5 |
| | 406.0 |
| | 391.6 |
| 348.3 |
| | 395.5 |
| | 406.0 |
|
| South America | 274.6 |
| | 182.9 |
| | 176.1 |
| 318.6 |
| | 274.6 |
| | 182.9 |
|
| Total net sales | $ | 2,585.0 |
| | $ | 2,300.4 |
| | $ | 2,127.5 |
| $ | 2,583.8 |
| | $ | 2,585.0 |
| | $ | 2,300.4 |
|
| Segment profit: | | | | | | | | | | |
| Europe | $ | 148.3 |
| | $ | 147.1 |
| | $ | 141.8 |
| $ | 131.6 |
| | $ | 148.3 |
| | $ | 147.1 |
|
| Asia Pacific | 147.0 |
| | 111.8 |
| | 84.9 |
| 172.7 |
| | 147.0 |
| | 111.8 |
|
| Tupperware North America | 58.4 |
| | 52.8 |
| | 40.3 |
| 63.7 |
| | 58.4 |
| | 52.8 |
|
| Beauty North America | 37.9 |
| | 58.9 |
| | 52.2 |
| 30.2 |
| | 37.9 |
| | 58.9 |
|
South America (a) | 48.6 |
| | 24.4 |
| | 12.7 |
| 61.0 |
| | 48.6 |
| | 24.4 |
|
| Total segment profit | 440.2 |
| | 395.0 |
| | 331.9 |
| 459.2 |
| | 440.2 |
| | 395.0 |
|
| Unallocated expenses | (58.9 | ) | | (56.8 | ) | | (51.9 | ) | (62.6 | ) | | (58.9 | ) | | (56.8 | ) |
Re-engineering and impairment charges (b)(a) | (7.9 | ) | | (7.6 | ) | | (8.0 | ) | (22.4 | ) | | (7.9 | ) | | (7.6 | ) |
Impairment of goodwill and intangibles (c)(b) | (36.1 | ) | | (4.3 | ) | | (28.1 | ) | (76.9 | ) | | (36.1 | ) | | (4.3 | ) |
Gains on disposal of assets (d)(c) | 3.8 |
| | 0.2 |
| | 21.9 |
| 7.9 |
| | 3.8 |
| | 0.2 |
|
Interest expense, net (e)(d) | (45.8 | ) | | (26.8 | ) | | (28.7 | ) | (32.4 | ) | | (45.8 | ) | | (26.8 | ) |
| Income before taxes | $ | 295.3 |
| | $ | 299.7 |
| | $ | 237.1 |
| $ | 272.8 |
| | $ | 295.3 |
| | $ | 299.7 |
|
| | | (In millions) | 2011 | | 2010 | | 2009 | 2012 | | 2011 | | 2010 |
| Depreciation and amortization: | | | | | | | | | | |
| Europe | $ | 21.3 |
| | $ | 20.3 |
| | $ | 21.9 |
| $ | 20.7 |
| | $ | 21.3 |
| | $ | 20.3 |
|
| Asia Pacific | 9.2 |
| | 10.6 |
| | 11.3 |
| 10.1 |
| | 9.2 |
| | 10.6 |
|
| Tupperware North America | 10.4 |
| | 8.5 |
| | 8.1 |
| 7.6 |
| | 8.4 |
| | 8.5 |
|
| Beauty North America | 6.4 |
| | 6.9 |
| | 7.0 |
| 5.2 |
| | 6.4 |
| | 6.9 |
|
| South America | 2.1 |
| | 1.2 |
| | 1.2 |
| 2.1 |
| | 2.1 |
| | 1.2 |
|
| Corporate | 0.4 |
| | 2.2 |
| | 2.2 |
| 3.9 |
| | 2.4 |
| | 2.2 |
|
| Total depreciation and amortization | $ | 49.8 |
| | $ | 49.7 |
| | $ | 51.7 |
| $ | 49.6 |
| | $ | 49.8 |
| | $ | 49.7 |
|
| Capital expenditures: | | | | | | | | | | |
| Europe | $ | 34.4 |
| | $ | 26.1 |
| | $ | 16.9 |
| $ | 24.7 |
| | $ | 34.4 |
| | $ | 26.1 |
|
| Asia Pacific | 11.6 |
| | 11.5 |
| | 7.5 |
| 23.3 |
| | 11.6 |
| | 11.5 |
|
| Tupperware North America | 9.4 |
| | 7.2 |
| | 4.6 |
| 10.1 |
| | 9.4 |
| | 7.2 |
|
| Beauty North America | 3.9 |
| | 3.5 |
| | 3.4 |
| 3.8 |
| | 3.9 |
| | 3.5 |
|
| South America | 6.4 |
| | 4.1 |
| | 5.0 |
| 11.8 |
| | 6.4 |
| | 4.1 |
|
| Corporate | 8.2 |
| | 3.7 |
| | 9.0 |
| 1.9 |
| | 8.2 |
| | 3.7 |
|
| Total capital expenditures | $ | 73.9 |
| | $ | 56.1 |
| | $ | 46.4 |
| $ | 75.6 |
| | $ | 73.9 |
| | $ | 56.1 |
|
| Identifiable assets: | | | | | | | | | | |
| Europe | $ | 395.9 |
| | $ | 397.8 |
| | $ | 409.2 |
| $ | 385.4 |
| | $ | 395.9 |
| | $ | 397.7 |
|
| Asia Pacific | 330.6 |
| | 349.6 |
| | 338.3 |
| 331.3 |
| | 331.9 |
| | 350.9 |
|
| Tupperware North America | 130.4 |
| | 165.3 |
| | 156.4 |
| 140.0 |
| | 143.8 |
| | 178.7 |
|
| Beauty North America | 373.7 |
| | 419.2 |
| | 405.8 |
| 320.3 |
| | 337.4 |
| | 380.4 |
|
| South America | 105.4 |
| | 95.1 |
| | 83.5 |
| 114.9 |
| | 105.4 |
| | 95.1 |
|
| Corporate | 508.2 |
| | 588.8 |
| | 425.6 |
| 529.9 |
| | 508.2 |
| | 588.9 |
|
| Total identifiable assets | $ | 1,844.2 |
| | $ | 2,015.8 |
| | $ | 1,818.8 |
| $ | 1,821.8 |
| | $ | 1,822.6 |
| | $ | 1,991.7 |
|
____________________
| |
| a. | In the third and fourth quarter of 2009, the Company recorded $4.9 million and $3.5 million, respectively, in foreign currency losses associated with the cost to convert cash generated by the business in Venezuela at an exchange rate less favorable than had been used to translate the balance sheet at the time, and to translate the Venezuelan balance sheet as of the end of the 2009 fiscal year, for the first time, at the parallel exchange rate rather than the official exchange rate in that country. See Note 1 to the Consolidated Financial Statements, under the caption Foreign Currency Translation.
|
| |
b. | The re-engineering and impairment charges line provides forincludes severance expenses and other exit costs. See Note 2 to the Consolidated Financial Statements. |
| |
c.b. | Reviews of the value of the intangible assets related to the acquisition of the Sara Lee Direct Sellingdirect-to-consumer units acquired in 2005 and BeautiControl acquired in 2000, resulted in the conclusion that certain of the tradenames and goodwill had been impaired. This resulted in 2011 charges of$76.9 million related to BeautiControl, NaturCare and Nutrimetics in 2012 and $36.1 million related to Nutrimetics and in 2009, in charges of $28.1 million related to Nutrimetics, NaturCare and Avroy Shlain.2011. In 2010, the Company recorded an impairment of $4.3 million related to Swissgarde in connection with a decision to cease operating that unit as a separate business. See Note 6 to the Consolidated Financial Statements. |
| |
d.c. | Gains on disposal of assets in 2012 included $7.5 million from the sale of a facility in Belgium, $0.2 million from insurance proceeds due to a flood in Venezuela and $0.2 million from equipment sales. In 2011, wasthe Company recorded a pretax gain from insurance proceeds of $3.0 million, net of cost, related to a flood in Australia, as well as $0.7 million related to the sale of land held for development near the Company's Orlando, Florida headquarters. In 2010, the Company recognized a $0.2 million gain on the sale of property atby Nutrimetics Australia. In 2009, the Company recorded a pretax gain of $19.0 million as a result of insurance recoveries from a 2007 fire in South Carolina and pretax gains of $2.9 million from the sale of property in Australia. |
| |
e.d. | In 2011, the Company recorded $19.8 million in interest expense related to the impairment of interest rate swaps and the write off of deferred debt costs in conjunction with the early extinguishment of debt. See Note 7 to the Consolidated Financial Statements, under the caption Use of Proceeds. |
Sales and segment profit in the preceding table are from transactions with customers, with inter-segment profit eliminated. Sales generated by product line, except beauty and personal care, as opposed to Tupperware®Tupperware®, are not captured in the financial statements, and disclosure of the information is impractical. Sales to a single customer did not exceed 10 percent of total sales in any segment. Sales of Tupperware and beauty products to customers in Mexico were $436.5404.8 million, $421.0436.5 million and $369.6421.0 million in 20112012, 20102011 and 20092010, respectively. There was no other foreign country in which sales were individually material to the Company's total sales. Sales of Tupperware and beauty products to customers in the United States were $264.3244.7 million, $265.4264.3 million and $277.8265.4 million in 20112012, 20102011 and 20092010, respectively. Unallocated expenses are corporate expenses and other items not directly related to the operations of any particular segment.
Corporate assets consist of cash and buildings and assets maintained for general corporate purposes. As of the end of 20112012, 20102011 and 20092010, respectively, long-lived assets in the United States were $81.285.5 million, $77.281.2 million and $90.777.2 million.
As of December 31, 201129, 2012 and December 25, 201031, 2011, the Company's net investment in international operations was $560.0562.1 million and $832.5566.3 million, respectively. The Company is subject to the usual economic, business and political risks associated with international operations; however, these risks are partially mitigated by the broad geographic dispersion of the Company's operations.
| |
| Note 16: | Commitments and Contingencies |
The Company and certain subsidiaries are involved in litigation and various legal matters that are being defended and handled in the ordinary course of business. Included among these matters are environmental issues. The Company does not include estimated future legal costs in accruals recorded related to these matters. The Company believes that it is remote that the Company's contingencies will have a material adverse effect on its financial position, results of operations or cash flow.
Kraft Foods, Inc., which was formerly affiliated with Premark International, Inc., the Company's former parent, and Tupperware, has assumed any liabilities arising out of certain divested or discontinued businesses. The liabilities assumed include matters alleging product liability, environmental liability and infringement of patents. As part of the acquisition of the direct sellingdirect-to-consumer businesses of Sara Lee Corporation in December 2005, that company indemnified the Company for any liabilities arising out of any existing litigation at that time and for certain legal matters arising out of circumstances whichthat might relate to periods before or after the date of the acquisition.
On December 11, 2007, the Company experienced a fire at its Hemingway, SC facility, causing complete destruction of its main finished goods warehouse and its contents. As of December 26, 2009, the Company had settled its claim with its insurance companies and it received a total of $18.9 million in proceeds in 2009, bringing the total settlement to $61.5 million to recover the value of destroyed inventory; property, plant and equipment; and costs associated with recovering from the fire. This resulted in $19.0 million pretax gains related to the fire being recorded in 2009. The Company included $18.9 million of proceeds in investing activities for 2009, as they related to property, plant and equipment. The Company netted, in 2009, $8.2 million of proceeds against capital expenditures on the Consolidated Statements of Cash Flows, as these proceeds represented a direct reimbursement of costs associated with rebuilding the distribution capability of the Hemingway facility.
Leases. Rental expense for operating leases totaled $32.1 million in 2012, $34.3 million in 2011, and $29.6 million in 2010 and $29.5 million in 2009. Approximate minimum rental commitments under non-cancelable operating leases in effect at December 31, 201129, 2012 were:2012-$31.7 million; 2013-$21.433.0 million; 2014-$12.223.7 million; 2015-$7.713.5 million; 2016-$5.08.8 million; 2017-$7.6 million; and after 20162017-$5.19.5 million. Leases included in the minimum rental commitments for 20122013 and 20132014 primarily relate to lease agreements for automobiles which generally have a lease term of 2-32-3 years with the remaining leases related to office, manufacturing and distribution space. It is common for lease agreements to contain various provisions for items such as step rent or other escalation clauses and lease concessions, which may offer a period of no rent payment. These types of items are considered by the Company, and are recorded into expense on a straight line basis over the minimum lease terms. There are no material lease agreements containing renewal options. Certain leases require the Company to pay property taxes, insurance and routine maintenance.
| |
| Note 17: | Allowance for Long-Term Receivables |
As of December 31, 201129, 2012, $25.524.5 million of long-term receivables from both active and inactive customers were considered past due, the majority of which were reserved through the Company's allowance for uncollectible accounts.
The balance of the allowance for long-term receivables as of December 31, 201129, 2012 was as follows (in millions):
| | | Balance at December 25, 2010 | $ | 18.8 |
| |
| Balance at December 31, 2011 | | $ | 23.3 |
|
| Write-offs | (4.2 | ) | (4.8 | ) |
| Recoveries | — |
| |
| Provision (a) | 9.0 |
| 3.7 |
|
| Currency translation adjustment | (0.3 | ) | 0.2 |
|
| Balance at December 31, 2011 | $ | 23.3 |
| |
| Balance at December 29, 2012 | | $ | 22.4 |
|
____________________
(a) Provision includes $5.21.9 million of reclassifications from current receivables.
| |
| Note 18: | Guarantor Information |
The Company's payment obligations under the Senior Notes are fully and unconditionally guaranteed by certain "Tupperware" trademarks and service marks owned by the Guarantor, as discussed in Note 7 to the Consolidated Financial Statements.
Condensed consolidated financial information as of December 31, 201129, 2012 and December 25, 201031, 2011 and for the years ended December 31, 201129, 2012, December 25, 201031, 2011 and December 26, 200925, 2010 for Tupperware Brands Corporation (the "Parent"), Dart Industries Inc. (the "Guarantor") and all other subsidiaries (the "Non-Guarantors") is as follows. Each entity in the consolidating financial information follows the same accounting policies as described in the consolidated financial statements, except for the use by the Parent and Guarantor of the equity method of accounting to reflect ownership interests in subsidiaries which are eliminated upon consolidation. Note that the Guarantor is 100% owned by the Parent, and there are certain entities within the Non-Guarantors classification whichthat the Parent owns directly. There are no significant restrictions on the ability of either the Parent or the Guarantor from obtaining adequate funds from their respective subsidiaries by dividend or loan that should interfere with their ability to meet their operating needs or debt repayment obligations.
Condensed Consolidating Balance Sheet
| | | | December 31, 2011 | December 29, 2012 |
| (In millions) | Parent | | Guarantor | | Non-Guarantors | | Eliminations | | Total | Parent | | Guarantor | | Non-Guarantors | | Eliminations | | Total |
| ASSETS | |
| | |
| | | | | | | |
| | |
| | | | | | |
| Cash and cash equivalents | $ | — |
| | $ | 1.9 |
| | $ | 136.3 |
| | $ | — |
| | $ | 138.2 |
| $ | — |
| | $ | 0.2 |
| | $ | 119.6 |
| | $ | — |
| | $ | 119.8 |
|
| Accounts receivable, net | — |
| | — |
| | 163.7 |
| | — |
| | 163.7 |
| — |
| | — |
| | 173.4 |
| | — |
| | 173.4 |
|
| Inventories | — |
| | — |
| | 302.5 |
| | — |
| | 302.5 |
| — |
| | — |
| | 313.9 |
| | — |
| | 313.9 |
|
| Deferred income tax benefits, net | 5.5 |
| | 44.6 |
| | 44.1 |
| | — |
| | 94.2 |
| 4.8 |
| | 46.8 |
| | 43.3 |
| | — |
| | 94.9 |
|
| Non-trade amounts receivable, net | 0.4 |
| | 10.1 |
| | 37.0 |
| | — |
| | 47.5 |
| — |
| | 3.2 |
| | 35.8 |
| | — |
| | 39.0 |
|
| Intercompany receivables | 1,674.7 |
| | 3,757.3 |
| | 257.7 |
| | (5,689.7 | ) | | — |
| 152.0 |
| | 378.0 |
| | 415.4 |
| | (945.4 | ) | | — |
|
| Prepaid expenses and other current assets | 1.2 |
| | 1.6 |
| | 83.0 |
| | (62.5 | ) | | 23.3 |
| 1.4 |
| | 65.8 |
| | 111.0 |
| | (152.7 | ) | | 25.5 |
|
| Total current assets | 1,681.8 |
| | 3,815.5 |
| | 1,024.3 |
| | (5,752.2 | ) | | 769.4 |
| 158.2 |
| | 494.0 |
| | 1,212.4 |
| | (1,098.1 | ) | | 766.5 |
|
| Deferred income tax benefits, net | 68.7 |
| | 128.7 |
| | 141.8 |
| | — |
| | 339.2 |
| 82.9 |
| | 174.2 |
| | 102.0 |
| | — |
| | 359.1 |
|
| Property, plant and equipment, net | — |
| | 28.7 |
| | 244.4 |
| | — |
| | 273.1 |
| — |
| | 32.4 |
| | 266.4 |
| | — |
| | 298.8 |
|
| Long-term receivables, net | — |
| | 0.1 |
| | 23.1 |
| | — |
| | 23.2 |
| — |
| | 0.1 |
| | 24.7 |
| | — |
| | 24.8 |
|
| Trademarks and tradenames | — |
| | — |
| | 157.1 |
| | — |
| | 157.1 |
| — |
| | — |
| | 138.4 |
| | — |
| | 138.4 |
|
| Other intangible assets, net | — |
| | — |
| | 7.2 |
| | — |
| | 7.2 |
| — |
| | — |
| | 5.0 |
| | — |
| | 5.0 |
|
| Goodwill | — |
| | 2.9 |
| | 238.5 |
| | — |
| | 241.4 |
| — |
| | 2.9 |
| | 190.0 |
| | — |
| | 192.9 |
|
| Investments in subsidiaries | 2,695.0 |
| | 1,734.6 |
| | — |
| | (4,429.6 | ) | | — |
| 1,417.0 |
| | 2,195.0 |
| | — |
| | (3,612.0 | ) | | — |
|
| Intercompany notes receivable | 85.9 |
| | 506.0 |
| | 1,088.5 |
| | (1,680.4 | ) | | — |
| 81.5 |
| | 578.2 |
| | 1,677.4 |
| | (2,337.1 | ) | | — |
|
| Other assets, net | 34.6 |
| | 7.9 |
| | 130.0 |
| | (138.9 | ) | | 33.6 |
| 4.5 |
| | 7.9 |
| | 86.2 |
| | (62.3 | ) | | 36.3 |
|
| Total assets | $ | 4,566.0 |
| | $ | 6,224.4 |
| | $ | 3,054.9 |
| | $ | (12,001.1 | ) | | $ | 1,844.2 |
| $ | 1,744.1 |
| | $ | 3,484.7 |
| | $ | 3,702.5 |
| | $ | (7,109.5 | ) | | $ | 1,821.8 |
|
| LIABILITIES AND SHAREHOLDERS' EQUITY | |
| | |
| | |
| | |
| | |
| |
| | |
| | |
| | |
| | |
|
| Accounts payable | $ | — |
| | $ | — |
| | $ | 157.2 |
| | $ | — |
| | $ | 157.2 |
| $ | — |
| | $ | 2.6 |
| | $ | 152.2 |
| | $ | — |
| | $ | 154.8 |
|
| Short-term borrowings and current portion of long-term debt and capital lease obligations | — |
| | — |
| | 195.7 |
| | — |
| | 195.7 |
| 37.0 |
| | — |
| | 166.4 |
| | — |
| | 203.4 |
|
| Intercompany payables | 3,270.0 |
| | 2,415.5 |
| | 4.2 |
| | (5,689.7 | ) | | — |
| 343.4 |
| | 556.3 |
| | 45.7 |
| | (945.4 | ) | | — |
|
| Accrued liabilities | 35.5 |
| | 116.1 |
| | 272.4 |
| | (101.5 | ) | | 322.5 |
| 116.4 |
| | 96.7 |
| | 275.9 |
| | (152.7 | ) | | 336.3 |
|
| Total current liabilities | 3,305.5 |
| | 2,531.6 |
| | 629.5 |
| | (5,791.2 | ) | | 675.4 |
| 496.8 |
| | 655.6 |
| | 640.2 |
| | (1,098.1 | ) | | 694.5 |
|
| Long-term debt and capital lease obligations | 396.1 |
| | — |
| | 19.1 |
| | — |
| | 415.2 |
| 396.4 |
| | — |
| | 18.0 |
| | — |
| | 414.4 |
|
| Intercompany notes payable | 342.9 |
| | 1,337.5 |
| | — |
| | (1,680.4 | ) | | — |
| 346.9 |
| | 1,330.5 |
| | 659.7 |
| | (2,337.1 | ) | | — |
|
| Other liabilities | 20.7 |
| | 112.9 |
| | 219.1 |
| | (99.9 | ) | | 252.8 |
| 24.9 |
| | 77.3 |
| | 193.9 |
| | (62.3 | ) | | 233.8 |
|
| Shareholders' equity | 500.8 |
| | 2,242.4 |
| | 2,187.2 |
| | (4,429.6 | ) | | 500.8 |
| 479.1 |
| | 1,421.3 |
| | 2,190.7 |
| | (3,612.0 | ) | | 479.1 |
|
| Total liabilities and shareholders' equity | $ | 4,566.0 |
| | $ | 6,224.4 |
| | $ | 3,054.9 |
| | $ | (12,001.1 | ) | | $ | 1,844.2 |
| $ | 1,744.1 |
| | $ | 3,484.7 |
| | $ | 3,702.5 |
| | $ | (7,109.5 | ) | | $ | 1,821.8 |
|
Condensed Consolidating Balance Sheet
| | | | December 25, 2010 | December 31, 2011 |
| (In millions) | Parent | | Guarantor | | Non-Guarantors | | Eliminations | | Total | Parent | | Guarantor | | Non-Guarantors | | Eliminations | | Total |
| ASSETS | |
| | |
| | | | | | | |
| | |
| | | | | | |
| Cash and cash equivalents | $ | 20.0 |
| | $ | 52.2 |
| | $ | 176.5 |
| | $ | — |
| | $ | 248.7 |
| $ | — |
| | $ | 1.9 |
| | $ | 136.3 |
| | $ | — |
| | $ | 138.2 |
|
| Accounts receivable, net | — |
| | — |
| | 181.9 |
| | — |
| | 181.9 |
| — |
| | — |
| | 163.7 |
| | — |
| | 163.7 |
|
| Inventories | — |
| | — |
| | 279.1 |
| | — |
| | 279.1 |
| — |
| | — |
| | 302.5 |
| | — |
| | 302.5 |
|
| Deferred income tax benefits, net | 58.5 |
| | — |
| | 60.0 |
| | (40.0 | ) | | 78.5 |
| 5.5 |
| | 44.6 |
| | 44.1 |
| | — |
| | 94.2 |
|
| Non-trade amounts receivable, net | — |
| | 0.7 |
| | 38.7 |
| | — |
| | 39.4 |
| 0.4 |
| | 10.1 |
| | 37.0 |
| | — |
| | 47.5 |
|
| Intercompany receivables | 693.7 |
| | 2,370.2 |
| | 776.9 |
| | (3,840.8 | ) | | — |
| 1,674.7 |
| | 3,757.3 |
| | 257.7 |
| | (5,689.7 | ) | | — |
|
| Prepaid expenses and other current assets | 1.2 |
| | 2.0 |
| | 18.4 |
| | — |
| | 21.6 |
| 1.2 |
| | 1.6 |
| | 83.0 |
| | (62.5 | ) | | 23.3 |
|
| Total current assets | 773.4 |
| | 2,425.1 |
| | 1,531.5 |
| | (3,880.8 | ) | | 849.2 |
| 1,681.8 |
| | 3,815.5 |
| | 1,024.3 |
| | (5,752.2 | ) | | 769.4 |
|
| Deferred income tax benefits, net | 53.8 |
| | 187.8 |
| | 150.3 |
| | (0.6 | ) | | 391.3 |
| 68.7 |
| | 128.7 |
| | 120.2 |
| | — |
| | 317.6 |
|
| Property, plant and equipment, net | — |
| | 21.1 |
| | 236.9 |
| | — |
| | 258.0 |
| — |
| | 28.7 |
| | 244.4 |
| | — |
| | 273.1 |
|
| Long-term receivables, net | — |
| | 0.1 |
| | 22.7 |
| | — |
| | 22.8 |
| — |
| | 0.1 |
| | 23.1 |
| | — |
| | 23.2 |
|
| Trademarks and tradenames | — |
| | — |
| | 170.2 |
| | — |
| | 170.2 |
| — |
| | — |
| | 157.1 |
| | — |
| | 157.1 |
|
| Other intangible assets, net | — |
| | — |
| | 10.2 |
| | — |
| | 10.2 |
| — |
| | — |
| | 7.2 |
| | — |
| | 7.2 |
|
| Goodwill | — |
| | 2.9 |
| | 281.2 |
| | — |
| | 284.1 |
| — |
| | 2.9 |
| | 238.5 |
| | — |
| | 241.4 |
|
| Investment in subsidiaries | 2,495.5 |
| | 1,592.2 |
| | — |
| | (4,087.7 | ) | | — |
| 2,695.0 |
| | 1,734.6 |
| | — |
| | (4,429.6 | ) | | — |
|
| Intercompany notes receivable | 239.5 |
| | 518.9 |
| | 1,538.3 |
| | (2,296.7 | ) | | — |
| 85.9 |
| | 506.0 |
| | 1,088.5 |
| | (1,680.4 | ) | | — |
|
| Other assets, net | 54.7 |
| | 7.8 |
| | 29.2 |
| | (61.7 | ) | | 30.0 |
| 34.6 |
| | 7.9 |
| | 130.0 |
| | (138.9 | ) | | 33.6 |
|
| Total assets | $ | 3,616.9 |
| | $ | 4,755.9 |
| | $ | 3,970.5 |
| | $ | (10,327.5 | ) | | $ | 2,015.8 |
| $ | 4,566.0 |
| | $ | 6,224.4 |
| | $ | 3,033.3 |
| | $ | (12,001.1 | ) | | $ | 1,822.6 |
|
| LIABILITIES AND SHAREHOLDERS' EQUITY | |
| | |
| | |
| | |
| | |
| |
| | |
| | |
| | |
| | |
|
| Accounts payable | $ | — |
| | $ | — |
| | $ | 153.1 |
| | $ | — |
| | $ | 153.1 |
| $ | — |
| | $ | — |
| | $ | 157.2 |
| | $ | — |
| | $ | 157.2 |
|
| Short-term borrowings and current portion of long-term debt and capital lease obligations | — |
| | — |
| | 1.9 |
| | — |
| | 1.9 |
| — |
| | — |
| | 195.7 |
| | — |
| | 195.7 |
|
| Intercompany payables | 1,967.0 |
| | 1,462.1 |
| | 411.7 |
| | (3,840.8 | ) | | — |
| 3,270.0 |
| | 2,415.5 |
| | 4.2 |
| | (5,689.7 | ) | | — |
|
| Accrued liabilities | 24.0 |
| | 119.7 |
| | 295.9 |
| | (94.2 | ) | | 345.4 |
| 35.5 |
| | 116.1 |
| | 270.4 |
| | (101.5 | ) | | 320.5 |
|
| Total current liabilities | 1,991.0 |
| | 1,581.8 |
| | 862.6 |
| | (3,935.0 | ) | | 500.4 |
| 3,305.5 |
| | 2,531.6 |
| | 627.5 |
| | (5,791.2 | ) | | 673.4 |
|
| Long-term debt and capital lease obligations | 405.0 |
| | — |
| | 21.8 |
| | — |
| | 426.8 |
| 396.1 |
| | — |
| | 19.1 |
| | — |
| | 415.2 |
|
| Intercompany notes payable | 385.1 |
| | 1,153.1 |
| | 758.5 |
| | (2,296.7 | ) | | — |
| 342.9 |
| | 1,337.5 |
| | — |
| | (1,680.4 | ) | | — |
|
| Other liabilities | 46.0 |
| | 19.1 |
| | 241.8 |
| | (8.1 | ) | | 298.8 |
| 20.7 |
| | 112.9 |
| | 199.5 |
| | (99.9 | ) | | 233.2 |
|
| Shareholders' equity | 789.8 |
| | 2,001.9 |
| | 2,085.8 |
| | (4,087.7 | ) | | 789.8 |
| 500.8 |
| | 2,242.4 |
| | 2,187.2 |
| | (4,429.6 | ) | | 500.8 |
|
| Total liabilities and shareholders' equity | $ | 3,616.9 |
| | $ | 4,755.9 |
| | $ | 3,970.5 |
| | $ | (10,327.5 | ) | | $ | 2,015.8 |
| $ | 4,566.0 |
| | $ | 6,224.4 |
| | $ | 3,033.3 |
| | $ | (12,001.1 | ) | | $ | 1,822.6 |
|
Consolidating Statement of Income
| | | | Year Ended December 31, 2011 | Year Ended December 29, 2012 |
| (In millions) | Parent | | Guarantor | | Non-Guarantors | | Eliminations | | Total | Parent | | Guarantor | | Non-Guarantors | | Eliminations | | Total |
| Net sales | $ | — |
| | $ | — |
| | $ | 2,591.1 |
| | $ | (6.1 | ) | | $ | 2,585.0 |
| $ | — |
| | $ | — |
| | $ | 2,591.3 |
| | $ | (7.5 | ) | | $ | 2,583.8 |
|
| Other revenue | — |
| | 101.9 |
| | 12.3 |
| | (114.2 | ) | | — |
| — |
| | 128.2 |
| | 30.8 |
| | (159.0 | ) | | — |
|
| Cost of products sold | — |
| | 12.4 |
| | 970.4 |
| | (120.3 | ) | | 862.5 |
| — |
| | 30.9 |
| | 992.0 |
| | (166.5 | ) | | 856.4 |
|
| Gross margin | — |
| | 89.5 |
| | 1,633.0 |
| | — |
| | 1,722.5 |
| — |
| | 97.3 |
| | 1,630.1 |
| | — |
| | 1,727.4 |
|
| Delivery, sales and administrative expense | 20.9 |
| | 42.9 |
| | 1,276.2 |
| | — |
| | 1,340.0 |
| 21.7 |
| | 55.4 |
| | 1,252.4 |
| | — |
| | 1,329.5 |
|
| Re-engineering and impairment charges | — |
| | — |
| | 7.9 |
| | — |
| | 7.9 |
| — |
| | — |
| | 22.4 |
| | — |
| | 22.4 |
|
| Impairment of goodwill and intangible assets | — |
| | — |
| | 36.1 |
| | — |
| | 36.1 |
| — |
| | — |
| | 76.9 |
| | — |
| | 76.9 |
|
| Gains on disposal of assets including insurance recoveries, net | — |
| | 3.0 |
| | 0.8 |
| | — |
| | 3.8 |
| — |
| | 0.5 |
| | 7.4 |
| | — |
| | 7.9 |
|
| Operating (loss) income | (20.9 | ) | | 49.6 |
| | 313.6 |
| | — |
| | 342.3 |
| (21.7 | ) | | 42.4 |
| | 285.8 |
| | — |
| | 306.5 |
|
| Interest income | 2.0 |
| | 33.1 |
| | 10.5 |
| | (42.4 | ) | | 3.2 |
| 1.6 |
| | 30.9 |
| | 4.9 |
| | (34.9 | ) | | 2.5 |
|
| Interest expense | 46.9 |
| | 15.0 |
| | 29.5 |
| | (42.4 | ) | | 49.0 |
| 28.1 |
| | 20.4 |
| | 21.3 |
| | (34.9 | ) | | 34.9 |
|
| Income from equity investments in subsidiaries | 260.5 |
| | 222.9 |
| | — |
| | (483.4 | ) | | — |
| 223.8 |
| | 180.8 |
| | — |
| | (404.6 | ) | | — |
|
| Other expense | 0.1 |
| | — |
| | 1.1 |
| | — |
| | 1.2 |
| — |
| | 1.0 |
| | 0.3 |
| | — |
| | 1.3 |
|
| Income before income taxes | 194.6 |
| | 290.6 |
| | 293.5 |
| | (483.4 | ) | | 295.3 |
| 175.6 |
| | 232.7 |
| | 269.1 |
| | (404.6 | ) | | 272.8 |
|
| Provision for income taxes | (23.7 | ) | | 35.6 |
| | 65.1 |
| | — |
| | 77.0 |
| (17.4 | ) | | 11.2 |
| | 86.0 |
| | — |
| | 79.8 |
|
| Net income | $ | 218.3 |
| | $ | 255.0 |
| | $ | 228.4 |
| | $ | (483.4 | ) | | $ | 218.3 |
| $ | 193.0 |
| | $ | 221.5 |
| | $ | 183.1 |
| | $ | (404.6 | ) | | $ | 193.0 |
|
| Comprehensive income | | $ | 217.2 |
| | $ | 248.8 |
| | $ | 178.6 |
| | $ | (427.4 | ) | | $ | 217.2 |
|
Consolidating Statement of Income
| | | | Year Ended December 25, 2010 | Year Ended December 31, 2011 |
| (In millions) | Parent | | Guarantor | | Non-Guarantors | | Eliminations | | Total | Parent | | Guarantor | | Non-Guarantors | | Eliminations | | Total |
| Net sales | $ | — |
| | $ | — |
| | $ | 2,303.6 |
| | $ | (3.2 | ) | | $ | 2,300.4 |
| $ | — |
| | $ | — |
| | $ | 2,591.1 |
| | $ | (6.1 | ) | | $ | 2,585.0 |
|
| Other revenue | — |
| | 56.9 |
| | 16.0 |
| | (72.9 | ) | | — |
| — |
| | 101.9 |
| | 12.3 |
| | (114.2 | ) | | — |
|
| Cost of products sold | — |
| | 16.1 |
| | 826.2 |
| | (76.1 | ) | | 766.2 |
| — |
| | 12.4 |
| | 970.4 |
| | (120.3 | ) | | 862.5 |
|
| Gross margin | — |
| | 40.8 |
| | 1,493.4 |
| | — |
| | 1,534.2 |
| — |
| | 89.5 |
| | 1,633.0 |
| | — |
| | 1,722.5 |
|
| Delivery, sales and administrative expense | 17.7 |
| | 49.1 |
| | 1,126.3 |
| | — |
| | 1,193.1 |
| 20.9 |
| | 42.9 |
| | 1,276.2 |
| | — |
| | 1,340.0 |
|
| Re-engineering and impairment charges | — |
| | — |
| | 7.6 |
| | — |
| | 7.6 |
| — |
| | — |
| | 7.9 |
| | — |
| | 7.9 |
|
| Impairment of goodwill and intangible assets | — |
| | — |
| | 4.3 |
| | — |
| | 4.3 |
| — |
| | — |
| | 36.1 |
| | — |
| | 36.1 |
|
| Gains on disposal of assets including insurance recoveries, net | — |
| | — |
| | 0.2 |
| | — |
| | 0.2 |
| — |
| | 3.0 |
| | 0.8 |
| | — |
| | 3.8 |
|
| Operating (loss) income | (17.7 | ) | | (8.3 | ) | | 355.4 |
| | — |
| | 329.4 |
| (20.9 | ) | | 49.6 |
| | 313.6 |
| | — |
| | 342.3 |
|
| Interest income | 2.3 |
| | 32.5 |
| | 7.8 |
| | (40.1 | ) | | 2.5 |
| 2.0 |
| | 33.1 |
| | 10.5 |
| | (42.4 | ) | | 3.2 |
|
| Interest expense | 28.6 |
| | 10.4 |
| | 30.4 |
| | (40.1 | ) | | 29.3 |
| 46.9 |
| | 15.0 |
| | 29.5 |
| | (42.4 | ) | | 49.0 |
|
| Income from equity investments in subsidiaries | 253.8 |
| | 272.5 |
| | — |
| | (526.3 | ) | | — |
| 260.5 |
| | 222.9 |
| | — |
| | (483.4 | ) | | — |
|
| Other expense | — |
| | — |
| | 2.9 |
| | — |
| | 2.9 |
| 0.1 |
| | — |
| | 1.1 |
| | — |
| | 1.2 |
|
| Income before income taxes | 209.8 |
| | 286.3 |
| | 329.9 |
| | (526.3 | ) | | 299.7 |
| 194.6 |
| | 290.6 |
| | 293.5 |
| | (483.4 | ) | | 295.3 |
|
| Provision for income taxes | (15.8 | ) | | 27.1 |
| | 62.8 |
| | — |
| | 74.1 |
| (23.7 | ) | | 35.6 |
| | 65.1 |
| | — |
| | 77.0 |
|
| Net income | $ | 225.6 |
| | $ | 259.2 |
| | $ | 267.1 |
| | $ | (526.3 | ) | | $ | 225.6 |
| $ | 218.3 |
| | $ | 255.0 |
| | $ | 228.4 |
| | $ | (483.4 | ) | | $ | 218.3 |
|
| Comprehensive income | | $ | 169.3 |
| | $ | 187.9 |
| | $ | 194.0 |
| | $ | (381.9 | ) | | $ | 169.3 |
|
Consolidating Statement of Income
| | | | Year Ended December 26, 2009 | Year Ended December 25, 2010 |
| (In millions) | Parent | | Guarantor | | Non-Guarantors | | Eliminations | | Total | Parent | | Guarantor | | Non-Guarantors | | Eliminations | | Total |
| Net sales | $ | — |
| | $ | — |
| | $ | 2,132.2 |
| | $ | (4.7 | ) | | $ | 2,127.5 |
| $ | — |
| | $ | — |
| | $ | 2,303.6 |
| | $ | (3.2 | ) | | $ | 2,300.4 |
|
| Other revenue | — |
| | 98.1 |
| | 8.0 |
| | (106.1 | ) | | — |
| — |
| | 56.9 |
| | 16.0 |
| | (72.9 | ) | | — |
|
| Cost of products sold | — |
| | 8.0 |
| | 821.3 |
| | (110.8 | ) | | 718.5 |
| — |
| | 16.1 |
| | 826.2 |
| | (76.1 | ) | | 766.2 |
|
| Gross margin | — |
| | 90.1 |
| | 1,318.9 |
| | — |
| | 1,409.0 |
| — |
| | 40.8 |
| | 1,493.4 |
| | — |
| | 1,534.2 |
|
| Delivery, sales and administrative expense | 19.0 |
| | 47.7 |
| | 1,052.4 |
| | — |
| | 1,119.1 |
| 17.7 |
| | 49.1 |
| | 1,126.3 |
| | — |
| | 1,193.1 |
|
| Re-engineering and impairment charges | — |
| | — |
| | 8.0 |
| | — |
| | 8.0 |
| — |
| | — |
| | 7.6 |
| | — |
| | 7.6 |
|
| Impairment of goodwill and intangible assets | — |
| | — |
| | 28.1 |
| | — |
| | 28.1 |
| — |
| | — |
| | 4.3 |
| | — |
| | 4.3 |
|
| Gains on disposal of assets including insurance recoveries, net | — |
| | — |
| | 21.9 |
| | — |
| | 21.9 |
| — |
| | — |
| | 0.2 |
| | — |
| | 0.2 |
|
| Operating (loss) income | (19.0 | ) | | 42.4 |
| | 252.3 |
| | — |
| | 275.7 |
| (17.7 | ) | | (8.3 | ) | | 355.4 |
| | — |
| | 329.4 |
|
| Interest income | 2.6 |
| | 24.4 |
| | 6.9 |
| | (31.0 | ) | | 2.9 |
| 2.3 |
| | 32.5 |
| | 7.8 |
| | (40.1 | ) | | 2.5 |
|
| Interest expense | 32.4 |
| | 13.0 |
| | 17.2 |
| | (31.0 | ) | | 31.6 |
| 28.6 |
| | 10.4 |
| | 30.4 |
| | (40.1 | ) | | 29.3 |
|
| Income from equity investments in subsidiaries | 206.3 |
| | 175.2 |
| | — |
| | (381.5 | ) | | — |
| 253.8 |
| | 272.5 |
| | — |
| | (526.3 | ) | | — |
|
| Other (income) expense | (0.1 | ) | | (0.3 | ) | | 10.3 |
| | — |
| | 9.9 |
| |
| Other expense | | — |
| | — |
| | 2.9 |
| | — |
| | 2.9 |
|
| Income before income taxes | 157.6 |
| | 229.3 |
| | 231.7 |
| | (381.5 | ) | | 237.1 |
| 209.8 |
| | 286.3 |
| | 329.9 |
| | (526.3 | ) | | 299.7 |
|
| Provision for income taxes | (17.5 | ) | | 23.2 |
| | 56.3 |
| | — |
| | 62.0 |
| (15.8 | ) | | 27.1 |
| | 62.8 |
| | — |
| | 74.1 |
|
| Net income | $ | 175.1 |
| | $ | 206.1 |
| | $ | 175.4 |
| | $ | (381.5 | ) | | $ | 175.1 |
| $ | 225.6 |
| | $ | 259.2 |
| | $ | 267.1 |
| | $ | (526.3 | ) | | $ | 225.6 |
|
| Comprehensive income | | $ | 242.4 |
| | $ | 272.3 |
| | $ | 268.4 |
| | $ | (540.7 | ) | | $ | 242.4 |
|
Condensed Consolidating Statement of Cash Flows
|
| | | | | | | | | | | | | | | | | | | |
| | Year Ended December 29, 2012 |
| (In millions) | Parent | | Guarantor | | Non-Guarantors | | Eliminations | | Total |
| Operating Activities: | | | | | | | | | |
| Net cash (used in) provided by operating activities | $ | (644.0 | ) | | $ | 942.0 |
| | $ | 158.5 |
| | $ | (157.8 | ) | | $ | 298.7 |
|
| Investing Activities: | | | | | | | | | |
| Capital expenditures | — |
| | (10.6 | ) | | (65.0 | ) | | — |
| | (75.6 | ) |
| Proceeds from disposal of property, plant and equipment | — |
| | 0.3 |
| | 10.5 |
| | — |
| | 10.8 |
|
| Return of capital | 854.9 |
| | — |
| | — |
| | (854.9 | ) | | — |
|
| Net cash provided by (used in) investing activities | 854.9 |
| | (10.3 | ) | | (54.5 | ) | | (854.9 | ) | | (64.8 | ) |
| Financing Activities: | | | | | | | | | |
| Dividend payments to shareholders | (77.6 | ) | | — |
| | — |
| | — |
| | (77.6 | ) |
| Dividend payments to parent | — |
| | — |
| | (131.7 | ) | | 131.7 |
| | — |
|
| Proceeds from exercise of stock options | 12.9 |
| | — |
| | — |
| | — |
| | 12.9 |
|
| Repurchase of common stock | (205.0 | ) | | — |
| | — |
| | — |
| | (205.0 | ) |
| Repayment of long-term debt and capital lease obligations | — |
| | — |
| | (2.3 | ) | | — |
| | (2.3 | ) |
| Net change in short-term debt | 37.0 |
| | — |
| | (31.0 | ) | | — |
| | 6.0 |
|
| Excess tax benefits from share-based payment arrangements | 13.5 |
| | — |
| | — |
| | — |
| | 13.5 |
|
| Net intercompany notes payable (receivable) | 8.3 |
| | (79.3 | ) | | 44.9 |
| | 26.1 |
| | — |
|
| Return of capital to parent | — |
| | (854.9 | ) | | — |
| | 854.9 |
| | — |
|
| Net cash used in financing activities | (210.9 | ) | | (934.2 | ) | | (120.1 | ) | | 1,012.7 |
| | (252.5 | ) |
| Effect of exchange rate changes on cash and cash equivalents | — |
| | 0.8 |
| | (0.6 | ) | | — |
| | 0.2 |
|
| Net change in cash and cash equivalents | — |
| | (1.7 | ) | | (16.7 | ) | | — |
| | (18.4 | ) |
| Cash and cash equivalents at beginning of year | — |
| | 1.9 |
| | 136.3 |
| | — |
| | 138.2 |
|
| Cash and cash equivalents at end of period | $ | — |
| | $ | 0.2 |
| | $ | 119.6 |
| | $ | — |
| | $ | 119.8 |
|
Condensed Consolidating Statement of Cash Flows
|
| | | | | | | | | | | | | | | | | | | |
| | Year Ended December 31, 2011 |
| (In millions) | Parent | | Guarantor | | Non-Guarantors | | Eliminations | | Total |
| Operating Activities: | | | | | | | | | |
| Net cash provided by (used in) operating activities | $ | 360.4 |
| | $ | (232.0 | ) | | $ | 129.5 |
| | $ | 16.8 |
| | $ | 274.7 |
|
| Investing Activities: | | | | | | | | | |
| Capital expenditures | — |
| | (12.7 | ) | | (61.2 | ) | | — |
| | (73.9 | ) |
| Proceeds from disposal of property, plant and equipment | — |
| | — |
| | 5.0 |
| | — |
| | 5.0 |
|
| Net cash used in investing activities | — |
| | (12.7 | ) | | (56.2 | ) | | — |
| | (68.9 | ) |
| Financing Activities: | | | | | | | | | |
| Dividend payments to shareholders | (73.8 | ) | | — |
| | — |
| | — |
| | (73.8 | ) |
| Dividend payments to parent | — |
| | — |
| | (12.0 | ) | | 12.0 |
| | — |
|
| Net proceeds from issuance of Senior Notes | 393.3 |
| | — |
| | — |
| | — |
| | 393.3 |
|
| Proceeds from exercise of stock options | 16.1 |
| | — |
| | — |
| | — |
| | 16.1 |
|
| Repurchase of common stock | (428.6 | ) | | — |
| | — |
| | — |
| | (428.6 | ) |
| Repayment of long-term debt and capital lease obligations | (405.0 | ) | | — |
| | (2.4 | ) | | — |
| | (407.4 | ) |
| Net change in short-term debt | 0.2 |
| | — |
| | 193.3 |
| | — |
| | 193.5 |
|
| Debt issuance costs | (3.0 | ) | | — |
| | — |
| | — |
| | (3.0 | ) |
| Excess tax benefits from share-based payment arrangements | 9.0 |
| | — |
| | — |
| | — |
| | 9.0 |
|
| Net intercompany notes payable (receivable) | 111.4 |
| | 195.8 |
| | (278.4 | ) | | (28.8 | ) | | — |
|
| Net cash (used in) provided by financing activities | (380.4 | ) | | 195.8 |
| | (99.5 | ) | | (16.8 | ) | | (300.9 | ) |
| Effect of exchange rate changes on cash and cash equivalents | — |
| | (1.4 | ) | | (14.0 | ) | | — |
| | (15.4 | ) |
| Net change in cash and cash equivalents | (20.0 | ) | | (50.3 | ) | | (40.2 | ) | | — |
| | (110.5 | ) |
| Cash and cash equivalents at beginning of year | 20.0 |
| | 52.2 |
| | 176.5 |
| | — |
| | 248.7 |
|
| Cash and cash equivalents at end of period | $ | — |
| | $ | 1.9 |
| | $ | 136.3 |
| | $ | — |
| | $ | 138.2 |
|
Condensed Consolidating Statement of Cash Flows
|
| | | | | | | | | | | | | | | | | | | |
| | Year Ended December 25, 2010 |
| (In millions) | Parent | | Guarantor | | Non-Guarantors | | Eliminations | | Total |
| Operating Activities: | | | | | | | | | |
| Net cash provided by (used in) operating activities | $ | 437.3 |
| | $ | (428.9 | ) | | $ | 299.3 |
| | $ | (8.2 | ) | | $ | 299.5 |
|
| Investing Activities: | | | | | | | | | |
| Capital expenditures | — |
| | (4.8 | ) | | (51.3 | ) | | — |
| | (56.1 | ) |
| Proceeds from disposal of property, plant and equipment | — |
| | — |
| | 10.0 |
| | — |
| | 10.0 |
|
| Return of capital | 45.0 |
| | — |
| | — |
| | (45.0 | ) | | — |
|
| Net cash provided by (used in) investing activities | 45.0 |
| | (4.8 | ) | | (41.3 | ) | | (45.0 | ) | | (46.1 | ) |
| Financing Activities: | | | | | | | | | |
| Dividend payments to shareholders | (63.2 | ) | | — |
| | — |
| | — |
| | (63.2 | ) |
| Dividend payments to parent | — |
| | — |
| | (13.2 | ) | | 13.2 |
| | — |
|
| Proceeds from exercise of stock options | 16.8 |
| | — |
| | — |
| | — |
| | 16.8 |
|
| Repurchase of common stock | (62.5 | ) | | — |
| | — |
| | — |
| | (62.5 | ) |
| Repayment of long-term debt and capital lease obligations | — |
| | — |
| | (2.2 | ) | | — |
| | (2.2 | ) |
| Net change in short-term debt | — |
| | — |
| | 0.2 |
| | — |
| | 0.2 |
|
| Excess tax benefits from share-based payment arrangements | 7.0 |
| | — |
| | — |
| | — |
| | 7.0 |
|
| Net intercompany notes (receivable) payable | (360.4 | ) | | 485.8 |
| | (120.4 | ) | | (5.0 | ) | | — |
|
| Return of capital to parent | — |
| | — |
| | (45.0 | ) | | 45.0 |
| | — |
|
| Net cash (used in) provided by financing activities | (462.3 | ) | | 485.8 |
| | (180.6 | ) | | 53.2 |
| | (103.9 | ) |
| Effect of exchange rate changes on cash and cash equivalents | — |
| | (9.3 | ) | | (3.9 | ) | | — |
| | (13.2 | ) |
| Net change in cash and cash equivalents | 20.0 |
| | 42.8 |
| | 73.5 |
| | — |
| | 136.3 |
|
| Cash and cash equivalents at beginning of year | — |
| | 9.4 |
| | 103.0 |
| | — |
| | 112.4 |
|
| Cash and cash equivalents at end of period | $ | 20.0 |
| | $ | 52.2 |
| | $ | 176.5 |
| | $ | — |
| | $ | 248.7 |
|
Condensed Consolidating Statement of Cash Flows
|
| | | | | | | | | | | | | | | | | | | |
| | Year Ended December 26, 2009 |
| (In millions) | Parent | | Guarantor | | Non-Guarantors | | Eliminations | | Total |
| Operating Activities: | | | | | | | | | |
| Net cash provided by (used in) operating activities | $ | 218.9 |
| | $ | (34.4 | ) | | $ | 340.3 |
| | $ | (273.9 | ) | | $ | 250.9 |
|
| Investing Activities: | | | | | | | | | |
| Capital expenditures | — |
| | (4.7 | ) | | (41.7 | ) | | — |
| | (46.4 | ) |
| Proceeds from disposal of property, plant and equipment | — |
| | — |
| | 8.8 |
| | — |
| | 8.8 |
|
| Proceeds from insurance recoveries | — |
| | — |
| | 10.7 |
| | — |
| | 10.7 |
|
| Return of capital | 56.1 |
| | — |
| | — |
| | (56.1 | ) | | — |
|
| Net cash provided by (used in) investing activities | 56.1 |
| | (4.7 | ) | | (22.2 | ) | | (56.1 | ) | | (26.9 | ) |
| Financing Activities: | | | | | | | | | |
| Dividend payments to shareholders | (55.0 | ) | | — |
| | — |
| | — |
| | (55.0 | ) |
| Dividend payments to parent | — |
| | (70.4 | ) | | (144.5 | ) | | 214.9 |
| | — |
|
| Proceeds from exercise of stock options | 39.4 |
| | — |
| | — |
| | — |
| | 39.4 |
|
| Repurchase of common stock | (83.2 | ) | | — |
| | — |
| | — |
| | (83.2 | ) |
| Repayment of long-term debt and capital lease obligations | (140.0 | ) | | — |
| | (1.8 | ) | | — |
| | (141.8 | ) |
| Net change in short-term debt | (1.9 | ) | | 8.7 |
| | (8.7 | ) | | — |
| | (1.9 | ) |
| Excess tax benefits from share-based payment arrangements | 14.7 |
| | — |
| | — |
| | — |
| | 14.7 |
|
| Net intercompany notes (receivable) payable | (49.0 | ) | | 100.3 |
| | (110.3 | ) | | 59.0 |
| | — |
|
| Return of capital to parent | — |
| | — |
| | (56.1 | ) | | 56.1 |
| | — |
|
| Net cash (used in) provided by financing activities | (275.0 | ) | | 38.6 |
| | (321.4 | ) | | 330.0 |
| | (227.8 | ) |
| Effect of exchange rate changes on cash and cash equivalents | — |
| | (2.2 | ) | | (6.4 | ) | | — |
| | (8.6 | ) |
| Net change in cash and cash equivalents | — |
| | (2.7 | ) | | (9.7 | ) | | — |
| | (12.4 | ) |
| Cash and cash equivalents at beginning of year | — |
| | 12.1 |
| | 112.7 |
| | — |
| | 124.8 |
|
| Cash and cash equivalents at end of period | $ | — |
| | $ | 9.4 |
| | $ | 103.0 |
| | $ | — |
| | $ | 112.4 |
|
| |
| Note 19: | Quarterly Financial Summary (Unaudited) |
Following is a summary of the unaudited interim results of operations for each quarter in the years ended December 31, 201129, 2012 and December 25, 201031, 2011.
| | | (In millions, except per share amounts) | First quarter | | Second quarter | | Third quarter | | Fourth quarter | First quarter | | Second quarter | | Third quarter | | Fourth quarter |
| Year ended December 29, 2012: | | | | | | | | |
| Net sales | | $ | 639.5 |
| | $ | 638.9 |
| | $ | 594.4 |
| | $ | 711.0 |
|
| Gross margin | | 426.4 |
| | 432.2 |
| | 394.9 |
| | 473.9 |
|
| Net income | | 58.3 |
| | 12.7 |
| | 47.5 |
| | 74.5 |
|
| Basic earnings per share | | 1.04 |
| | 0.23 |
| | 0.86 |
| | 1.37 |
|
| Diluted earnings per share | | 1.02 |
| | 0.22 |
| | 0.85 |
| | 1.34 |
|
| Dividends declared per share | | 0.36 |
| | 0.36 |
| | 0.36 |
| | 0.36 |
|
| Composite stock price range: | | | | | | | | |
| High | | 64.99 |
| | 64.63 |
| | 58.08 |
| | 67.82 |
|
| Low | | 54.88 |
| | 51.28 |
| | 50.90 |
| | 52.80 |
|
| Close | | 63.50 |
| | 54.76 |
| | 53.59 |
| | 62.67 |
|
| Year ended December 31, 2011: | | | | | | | | | | | | | | |
| Net sales | $ | 636.4 |
| | $ | 669.9 |
| | $ | 602.6 |
| | $ | 676.1 |
| $ | 636.4 |
| | $ | 669.9 |
| | $ | 602.6 |
| | $ | 676.1 |
|
| Gross margin | 421.5 |
| | 450.3 |
| | 400.9 |
| | 449.8 |
| 421.5 |
| | 450.3 |
| | 400.9 |
| | 449.8 |
|
| Net income | 55.8 |
| | 65.1 |
| | 10.5 |
| | 86.9 |
| 55.8 |
| | 65.1 |
| | 10.5 |
| | 86.9 |
|
| Basic earnings per share | 0.90 |
| | 1.05 |
| | 0.18 |
| | 1.53 |
| 0.90 |
| | 1.05 |
| | 0.18 |
| | 1.53 |
|
| Diluted earnings per share | 0.88 |
| | 1.03 |
| | 0.17 |
| | 1.50 |
| 0.88 |
| | 1.03 |
| | 0.17 |
| | 1.50 |
|
| Dividends declared per share | 0.30 |
| | 0.30 |
| | 0.30 |
| | 0.30 |
| 0.30 |
| | 0.30 |
| | 0.30 |
| | 0.30 |
|
| Composite stock price range: | | | | | | | | | | | | | | |
| High | 60.57 |
| | 69.64 |
| | 71.99 |
| | 61.35 |
| 60.57 |
| | 69.64 |
| | 71.99 |
| | 61.35 |
|
| Low | 45.18 |
| | 57.39 |
| | 52.50 |
| | 49.86 |
| 45.18 |
| | 57.39 |
| | 52.50 |
| | 49.86 |
|
| Close | 59.41 |
| | 69.60 |
| | 53.74 |
| | 55.97 |
| 59.41 |
| | 69.60 |
| | 53.74 |
| | 55.97 |
|
| Year ended December 25, 2010: | | | | | | | | |
| Net sales | $ | 557.1 |
| | $ | 565.1 |
| | $ | 523.2 |
| | $ | 655.0 |
| |
| Gross margin | 372.9 |
| | 383.5 |
| | 346.4 |
| | 431.4 |
| |
| Net income | 47.1 |
| | 57.9 |
| | 39.9 |
| | 80.7 |
| |
| Basic earnings per share | 0.75 |
| | 0.92 |
| | 0.64 |
| | 1.29 |
| |
| Diluted earnings per share | 0.73 |
| | 0.90 |
| | 0.62 |
| | 1.26 |
| |
| Dividends declared per share | 0.25 |
| | 0.25 |
| | 0.25 |
| | 0.30 |
| |
| Composite stock price range: | | | | | | | | |
| High | 49.51 |
| | 54.15 |
| | 44.27 |
| | 50.46 |
| |
| Low | 41.44 |
| | 36.19 |
| | 36.12 |
| | 43.32 |
| |
| Close | 47.77 |
| | 40.09 |
| | 44.04 |
| | 48.21 |
| |
Certain items impacting quarterly comparability for 20112012 and 20102011 were as follows:
Pretax re-engineering and impairment costs of $0.9 million, $1.1 million, $2.0 million and $18.4 million were recorded in the first through fourth quarters of 2012, respectively. Pretax re-engineering and impairment costs of $1.4 million, $1.1 million, $2.2 million and $3.2 million were recorded in the first through fourth quarters of 2011, respectively. Pretax re-engineering and impairment costs of $1.6 million, $2.0 million, $0.4 million and $3.6 million were recorded inRefer to Note 2 to the first through fourth quarters of 2010, respectively.Consolidated Financial Statements for further discussion.
In the second quarter of 2012, the Company recorded a $76.9 million of impairment charges related to certain intangibles and goodwill, related to BeautiControl, NaturCare and Nutrimetics. In the third quarter of 2011,, the Company recorded a $36.1 million impairment related to certain intangibles and goodwill duerelated to the financial results of Nutrimetics, being below expectations, as well as the Company's decision to cease operating its Nutrimetics business in Malaysia. InRefer to Note 6 to the fourth quarter of 2010, the Company recorded a $4.3 million impairment related to certain intangibles and goodwill, associated with a decision by the Company to cease operating its Swissgarde business as an independent entity.Consolidated Financial Statements for further discussion.
In the second quarter of 2011, the Company recorded a loss on the extinguishment of debt of $0.9 million for the write-off of unamortized debt issuance costs, as well as $18.9 million in interest expense reclassified from other comprehensive loss as hedges under related interest rate swaps became ineffective.
The Company's fiscal year ends on the last Saturday of December, and as a result, the first quarter of 20112012 contained 1413 weeks, as compared with 1314 weeks in the first quarter of 2010.2011.
On February 1, 2013, in conjunction with executing its planned 2013 share repurchase program, the Company entered into a 90-day $75 million promissory note with the same interest rate and covenant terms as under its $450 million Credit Agreement.
Report of Independent Registered Certified Public Accounting Firm
To the Board of Directors and Shareholders of Tupperware Brands Corporation
In our opinion, the consolidated balance sheets and the related consolidatedfinancial statements of income, of shareholders' equity and comprehensive income and cash flows listed in the index appearing under Item 15(a)(1) present fairly, in all material respects, the financial position of Tupperware Brands Corporation and its subsidiaries at December 31, 201129, 2012 and December 25, 201031, 2011, and the results of their operations and their cash flows for each of the three years in the period ended December 31, 201129, 2012 in conformity with accounting principles generally accepted in the United States of America. In addition, in our opinion, the financial statement schedule listed in the index appearing under Item 15(a)(2) presents fairly, in all material respects, the information set forth therein when read in conjunction with the related consolidated financial statements. Also in our opinion, the Company maintained, in all material respects, effective internal control over financial reporting as of December 31, 201129, 2012, based on criteria established in Internal Control-Integrated Framework issued by the Committee of Sponsoring Organizations of the Treadway Commission (COSO). The Company's management is responsible for these financial statements and the financial statement schedule, for maintaining effective internal control over financial reporting and for its assessment of the effectiveness of internal control over financial reporting, included in Management's Report on Internal Control Over Financial Reporting appearing inunder Item 9A. Our responsibility is to express opinions on these financial statements, on the financial statement schedule, and on the Company's internal control over financial reporting based on our integrated audits. We conducted our audits in accordance with the standards of the Public Company Accounting Oversight Board (United States). Those standards require that we plan and perform the audits to obtain reasonable assurance about whether the financial statements are free of material misstatement and whether effective internal control over financial reporting was maintained in all material respects. Our audits of the financial statements included examining, on a test basis, evidence supporting the amounts and disclosures in the financial statements, assessing the accounting principles used and significant estimates made by management, and evaluating the overall financial statement presentation. Our audit of internal control over financial reporting included obtaining an understanding of internal control over financial reporting, assessing the risk that a material weakness exists, and testing and evaluating the design and operating effectiveness of internal control based on the assessed risk. Our audits also included performing such other procedures as we considered necessary in the circumstances. We believe that our audits provide a reasonable basis for our opinions.
A company's internal control over financial reporting is a process designed to provide reasonable assurance regarding the reliability of financial reporting and the preparation of financial statements for external purposes in accordance with generally accepted accounting principles. A company's internal control over financial reporting includes those policies and procedures that (i) pertain to the maintenance of records that, in reasonable detail, accurately and fairly reflect the transactions and dispositions of the assets of the company; (ii) provide reasonable assurance that transactions are recorded as necessary to permit preparation of financial statements in accordance with generally accepted accounting principles, and that receipts and expenditures of the company are being made only in accordance with authorizations of management and directors of the company; and (iii) provide reasonable assurance regarding prevention or timely detection of unauthorized acquisition, use, or disposition of the company's assets that could have a material effect on the financial statements.
Because of its inherent limitations, internal control over financial reporting may not prevent or detect misstatements. Also, projections of any evaluation of effectiveness to future periods are subject to the risk that controls may become inadequate because of changes in conditions, or that the degree of compliance with the policies or procedures may deteriorate.
PricewaterhouseCoopers LLP
Orlando, Florida
February 28, 201226, 2013
| |
| Item 9. | Changes in and Disagreements With Accountants on Accounting and Financial Disclosure. |
None.
| |
| Item 9A. | Controls and Procedures. |
Evaluation of Disclosure Controls and Procedures
The Company maintains disclosure controls and procedures (as defined in Exchange Act Rules 13a-15(e) and 15(d)-15(e)) that are designed to ensure that information required to be disclosed in the Company's reports filed or submitted under the Exchange Act is recorded, processed, summarized and reported within the time periods specified in the Securities and Exchange Commission's rules and forms, and that such information is accumulated and communicated to the Company's management, including the Chief Executive Officer and the Chief Financial Officer, as appropriate to allow timely decisions regarding required disclosure. In designing and evaluating the disclosure controls and procedures, management recognized that controls and procedures, no matter how well designed and operated, can provide only reasonable assurance of achieving the desired control objectives.
As of the end of the period covered by this report, management, under the supervision of the Company's Chief Executive Officer and Chief Financial Officer, evaluated the effectiveness of the design and operation of the Company's disclosure controls and procedures. Based upon that evaluation, the Chief Executive Officer and Chief Financial Officer concluded that the design and operation of the disclosure controls and procedures were effective.
Management's Report on Internal Control Over Financial Reporting
The Company's management is also responsible for establishing and maintaining adequate internal control over financial reporting as defined in Exchange Act Rule 13a-15(f). As of the end of the period covered by this report, management, under the supervision of the Company's Chief Executive Officer and Chief Financial Officer, evaluated the effectiveness of the Company's internal control over financial reporting based on the framework in Internal Control-Integrated Framework issued by the Committee of Sponsoring Organizations of the Treadway Commission. Based upon that evaluation, the Chief Executive Officer and Chief Financial Officer concluded that the Company's internal control over financial reporting was effective as of the end of the period covered by this report. The effectiveness of the Company's internal control over financial reporting as of December 31, 201129, 2012 has been audited by PricewaterhouseCoopers LLP, an independent registered public accounting firm, as stated in its report which is included herein.
Changes in Internal Controls
There have been no significant changes in the Company's internal control over financial reporting during the Company's fourth quarter that have materially affected or are reasonably likely to materially affect its internal control over financial reporting, as defined in Rule 13a-15(f) promulgated under the Securities Exchange Act of 1934.
Item 9B.Other Information.
None.
PART III
Item 10.Directors, Executive Officers and Corporate Governance.
Certain information with regard to the directors of the Registrant as required by Item 401 of Regulation S-K is set forth under the sub-caption “Board of Directors” appearing under the caption “Election of Directors” in the Proxy Statement related to the 20122013 Annual Meeting of Shareholders to be held on May 22, 201224, 2013 and is incorporated herein by reference.
The information as to the executive officers of the Registrant is included in Part I hereof under the caption “Executive Officers of the Registrant” in reliance upon General Instruction G to Form 10-K and Instruction 3 to Item 401(b) of Regulation S-K.
The section entitled “Section 16(a) Beneficial Ownership Reporting Compliance” appearing in the Registrant's Proxy Statement for the 20122013 Annual Meeting of Shareholders to be held on May 22, 201224, 2013 sets forth certain information as required by Item 405 of Regulation S-K and is incorporated herein by reference.
The section entitled “Corporate Governance” appearing in the Registrant's Proxy Statement for the 20122013 Annual Meeting of Shareholders to be held on May 22, 201224, 2013 sets forth certain information with respect to the Registrant's code of conduct and ethics as required by Item 406 of Regulation S-K and is incorporated herein by reference.
There were no material changes to the procedures by which security holders may recommend nominees to the registrant's board of directors during 20112012, as set forth by Item 407(c)(3).
The sections entitled “Corporate Governance” and “Board Committees” appearing in the Registrant's Proxy Statement for the 20122013 Annual Meeting of Shareholders to be held on May 22, 201224, 2013 sets forth certain information regarding the Audit, Finance and Corporate Responsibility Committee, including the members of the Committee and the financial expert, as set forth by Item 407(d)(4) and (d)(5) of Regulation S-K and is incorporated herein by reference.
Item 11.Executive Compensation.
The information set forth under the caption “Compensation of Directors and Executive Officers” of the Proxy Statement relating to the 20122013 Annual Meeting of Shareholders to be held on May 22, 201224, 2013, and the information in such Proxy Statement relating to executive officers' and directors' compensation is incorporated herein by reference.
The information set forth under the captions “Board Committees” and “Compensation and Management Development Committee Report” of the Proxy Statement relating to the 20122013 Annual Meeting of Shareholders to be held on May 22, 201224, 2013 sets forth certain information as required by Item 407(e)(4) and Item 407(e)(5) of Regulation S-K and is incorporated herein by reference.
| |
| Item 12. | Security Ownership of Certain Beneficial Owners and Management and Related Stockholder Matters. |
The information set forth under the captions “Security Ownership of Certain Beneficial Owners”, “Security Ownership of Management” and “Equity Compensation Plan Information” in the Proxy Statement relating to the 20122013 Annual Meeting of Shareholders to be held on May 22, 201224, 2013, is incorporated herein by reference.
Item 13.Certain Relationships and Related Transactions, and Director Independence.
The information set forth under the captions “Transactions with Related Persons” and “Corporate Governance” appearing in the Registrant's Proxy Statement for the 20122013 Annual Meeting of Shareholders to be held on May 22, 201224, 2013 is incorporated herein by reference.
Item 14.Principal Accounting Fees and Services.
The information set forth under the captions “Audit Fees,” “Audit-Related Fees,” “Tax Fees,” “All Other Fees,” and “Approval of Services” in the Proxy Statement related to the 20122013 Annual Meeting of Shareholders to be held on May 22, 201224, 2013 is incorporated herein by reference.
PART IV
| |
Item 15. | Exhibits, Financial Statement Schedules. |
(a) (1) List of Financial Statements
The following Consolidated Financial Statements of Tupperware Brands Corporation and Report of Independent Registered Public Accounting Firm are included in this Report under Item 8:
Consolidated Statements of Income, Comprehensive Income, Shareholders' Equity and Comprehensive Income and Cash Flows - Years ended December 31, 201129, 2012, December 25, 201031, 2011 and December 26, 200925, 2010;
Consolidated Balance Sheets - December 31, 201129, 2012 and December 25, 201031, 2011;
Notes to the Consolidated Financial Statements; and
Report of Independent Registered Public Accounting Firm.
(a) (2) List of Financial Statement Schedules
The following Consolidated Financial Statement Schedule (numbered in accordance with Regulation S-X) of Tupperware Brands Corporation is included in this Report:
Schedule II-Valuation and Qualifying Accounts for each of the three years ended December 31, 201129, 2012.
All other schedules for which provision is made in the applicable accounting regulations of the Securities Exchange Commission (SEC or the Commission) are not required under the related instructions, are inapplicable or the information called for therein is included elsewhere in the financial statements or related notes contained or incorporated by reference herein.
(a) (3) List of Exhibits: (numbered in accordance with Item 601 of Regulation S-K)
|
| |
Exhibit Number | Description |
| *3.1 | Restated Certificate of Incorporation of the Registrant (Attached as Exhibit 3.1 to Form 10-Q, filed with the Commission on August 5, 2008 and incorporated herein by reference). |
| *3.2 | Amended and Restated By-laws of the Registrant as amended August 28, 2008 (Attached as Exhibit 3.2 to Form 8-K, filed with the Commission on August 28, 2008 and incorporated herein by reference). |
| *4 | Indenture dated June 2, 2011 (Attached as Exhibit 4.1 to Form 8-K, filed with the Commission on June 7, 2011 and incorporated herein by reference). |
| *10.1 | 1996 Incentive Plan as amended through January 26, 2009 (Attached as Exhibit 10.1 to Form 10-K, filed with the Commission on February 25, 2009 and incorporated herein by reference). |
| *10.2 | Directors' Stock Plan as amended through January 26, 2009 (Attached as Exhibit 10.2 to Form 10-K, filed with the Commission on February 25, 2009 and incorporated herein by reference). |
| *10.3 | Form of Change of Control Employment Agreement (Attached as Exhibit 10.3 for Form 10-K, filed with the Commission on February 25, 2009 and incorporated herein by reference). |
| *10.4 | Securities and Asset Purchase Agreement between the Registrant and Sara Lee Corporation dated as of August 10, 2005 (Attached as Exhibit 10.01 to Form 8-K/A, filed with the Commission on August 15, 2005 and incorporated herein by reference). |
| *10.5 | Forms of stock option, restricted stock and restricted stock unit agreements utilized with the Registrant's officers and directors under certain stock-based incentive plans (Attached as Exhibit 10.6 to Form 10-K, filed with the Commission on February 25, 2009 and incorporated herein by reference). |
| *10.6 | Chief Executive Officer Severance Agreement between the Registrant and E.V. Goings amended and restated effective February 17, 2010 (Attached as Exhibit 10.8 to From 10-K, filed with the Commission on February 23, 2010 and incorporated herein by reference). |
|
| |
Exhibit Number | Description |
| *10.7 | Supplemental Executive Retirement Plan, amended and restated effective February 2, 2010 (Attached as Exhibit 10.9 to Form 10-K, filed with the Commission on February 23, 2010 and incorporated herein by reference). |
| *10.8 | 2002 Incentive Plan, as amended through January 26, 2009 (Attached as Exhibit 10.10 to Form 10-K, filed with the Commission on February 25, 2009 and incorporated herein by reference). |
| *10.9 | Supplemental Plan, amended and restated effective January 1, 2009 (Attached as Exhibit 10.11 to Form 10-K, filed with the Commission on February 25, 2009 and incorporated herein by reference). |
| *10.10 | 2006 Incentive Plan as amended through January 26, 2009 (Attached as Exhibit 10.12 to Form 10-K, filed with the Commission on February 25, 2009 and incorporated herein by reference). |
| *10.11 | Tupperware Brands Corporation 2010 Incentive Plan (Attached as Exhibit 4.3 to Form S-8, filed with the Commission on November 3, 2010 and incorporated herein by reference). |
| *10.12 | Tupperware Brands Corporation 2010 Incentive Plan Restricted Stock Agreement (Attached as Exhibit 4.4 to Form S-8, filed with the Commission on November 3, 2010 and incorporated herein by reference). |
| *10.13 | Credit Agreement dated June 2, 2011.2011 (Attached as Exhibit 10.13 to Form 10-K/A, filed with the Commission on January 9, 2013 and incorporated herein by reference). |
| 21 | Subsidiaries of Tupperware Brands Corporation as of February 24, 2012.25, 2013. |
| 23 | Consent of Independent Registered Public Accounting Firm. |
| 24 | Powers of Attorney. |
| 31.1 | Rule 13a-14(a)/15d-14(a) Certification of the Chief Executive Officer. |
| 31.2 | Rule 13a-14(a)/15d-14(a) Certification of the Chief Financial Officer. |
| 32.1 | Certification Pursuant to Section 1350 of Chapter 63 of Title 18 of the United States Code by the Chief Executive Officer. |
| 32.2 | Certification Pursuant to Section 1350 of Chapter 63 of Title 18 of the United States Code by the Chief Financial Officer. |
**101 | The following financial statements from Tupperware Brands Corporation's Annual Report on Form 10-K for the year ended December 31, 2011, filed on February 28,29, 2012, formatted in XBRL (eXtensible Business Reporting Language): (i) Consolidated Statements of Income, (ii) Consolidated Statements of Comprehensive Income, (iii) Consolidated Balance Sheets, (iii)(iv) Consolidated Statements of Shareholders' Equity, and Comprehensive Income, (iv)(v) Consolidated Statements of Cash Flows, (v)(vi) Notes to the Consolidated Financial Statements, tagged in detail.detail, and (vii) Schedule II. Valuation and Qualifying Accounts. |
* Document has heretofore been filed with the SEC and is incorporated by reference and made a part hereof.
** Furnished, not filed.
The Registrant agrees to furnish, upon request of the SEC, a copy of all constituent instruments defining the rights of holders of long-term debt of the Registrant and its consolidated subsidiaries.
TUPPERWARE BRANDS CORPORATION
SCHEDULE II-VALUATION AND QUALIFYING ACCOUNTS
FOR THE THREE YEARS ENDED DECEMBER 31, 201129, 2012
(In millions)
| | | Col. A | Col. B | | Col. C | | Col. D | | Col. E | Col. B | | Col. C | | Col. D | | Col. E |
| | | | Additions | | | | | | | Additions | | | | |
| | Balance at Beginning of Period | | Charged to Costs and Expenses | | Charged to Other Accounts | | Deductions | | Balance at End of Period | Balance at Beginning of Period | | Charged to Costs and Expenses | | Charged to Other Accounts | | Deductions | | Balance at End of Period |
| Allowance for doubtful accounts, current and long term: | | | | | | | | | | | | | | | | | | |
| Year ended December 29, 2012 | | $ | 51.2 |
| | $ | 10.9 |
| | $ | — |
| | $ | (9.0 | ) | /F1 | | $ | 53.9 |
|
| | | | | | | | | 0.8 |
| /F2 | | |
| Year ended December 31, 2011 | $ | 52.3 |
| | $ | 11.5 |
| | $ | — |
| | $ | (10.6 | ) | /F1 | | $ | 51.2 |
| 52.3 |
| | 11.5 |
| | — |
| | (10.6 | ) | /F1 | | 51.2 |
|
| | | | | | | | (2.0 | ) | /F2 | | | | | | | | | (2.0 | ) | /F2 | | |
| Year ended December 25, 2010 | 51.2 |
| | 11.1 |
| | — |
| | (8.6 | ) | /F1 | | 52.3 |
| 51.2 |
| | 11.1 |
| | — |
| | (8.6 | ) | /F1 | | 52.3 |
|
| | | | | | | | (1.4 | ) | /F2 | | | | | | | | | (1.4 | ) | /F2 | | |
| Year ended December 26, 2009 | 49.2 |
| | 7.9 |
| | — |
| | (8.3 | ) | /F1 | | 51.2 |
| |
| | | | | | | | 2.4 |
| /F2 | | | |
| Valuation allowance for deferred tax assets: | | | | | | | | | | | | | | | | | | |
| Year ended December 29, 2012 | | 96.0 |
| | 2.7 |
| | 2.5 |
| | 1.9 |
| /F2 | | 103.1 |
|
| Year ended December 31, 2011 | 99.8 |
| | (0.3 | ) | | — |
| | (3.5 | ) | /F2 | | 96.0 |
| 99.8 |
| | (0.3 | ) | | 4.3 |
| | (7.8 | ) | /F2 | | 96.0 |
|
| Year ended December 25, 2010 | 99.0 |
| | 2.1 |
| | — |
| | (1.3 | ) | /F2 | | 99.8 |
| 99.0 |
| | 2.1 |
| | — |
| | (1.3 | ) | /F2 | | 99.8 |
|
| Year ended December 26, 2009 | 88.1 |
| | 2.9 |
| | — |
| | 8.0 |
| /F2 | | 99.0 |
| |
____________________
| |
| F1 | Represents write-offs, less recoveries. |
| |
| F2 | Foreign currency translation adjustment. |
SIGNATURES
Pursuant to the requirements of Section 13 or 15(d) of the Securities Exchange Act of 1934, the Registrant has duly caused this Report to be signed on its behalf by the undersigned, thereunto duly authorized.
|
| | |
| | TUPPERWARE BRANDS CORPORATION |
| | (Registrant) |
| | | |
| | By: | /S/ E.V. GOINGS |
| | | E.V. Goings |
| | | Chairman and Chief Executive Officer |
February 28, 201226, 2013
Pursuant to the requirements of the Securities Exchange Act of 1934, this Report has been signed below by the following persons on behalf of the Registrant and in the capacities and on the date indicated.
|
| | |
| Signature | | Title |
| | | |
| /s/ E.V. GOINGS | | Chairman and Chief Executive Officer and Director (Principal Executive Officer) |
| E.V. Goings | |
| | | |
| /s/ MICHAEL S. POTESHMAN | | Executive Vice President and Chief Financial Officer (Principal Financial Officer) |
| Michael S. Poteshman | |
| | | |
| /s/ NICHOLAS K. POUCHER | | Vice President and Controller (Principal Accounting Officer) |
| Nicholas K. Poucher | |
| | | |
| * | | Director |
| Catherine A. Bertini | | |
| | | |
| * | | Director |
Rita Bornstein, Ph.D. | | |
| | |
* | | Director |
| Susan M. Cameron | | |
| | | |
| * | | Director |
| Kriss Cloninger III | | |
| | | |
| * | | Director |
Clifford J. Grum | | |
| | |
* | | Director |
| Joe R. Lee | | |
| | |
* | | Director |
Bob Marbut | | |
|
| | |
| | | |
| * | | Director |
| Angel R. Martinez | | |
| | | |
| * | | Director |
| Antonio Monteiro de Castro | | |
| | | |
| * | | Director |
| Robert J. Murray | | |
|
| | |
| * | | Director |
| David R. Parker | | |
| | | |
| * | | Director |
| Joyce M. Roche | | |
| | | |
| * | | Director |
| M. Anne Szostak | | |
|
| |
| By: | /s/ THOMAS M. ROEHLK |
| | Thomas M. Roehlk |
| | Attorney-in-fact |
February 28, 201226, 2013