UNITED STATES
SECURITIES AND EXCHANGE COMMISSION
Washington, D.C. 20549
FORM 10-K
(Mark One)
| [X] | ANNUAL REPORT PURSUANT TO SECTION 13 OR 15(d) OF THE SECURITIES EXCHANGE ACT OF 1934 |
| | For the fiscal year ended December 31, 20112012 OR |
| [ ] | TRANSITION REPORT PURSUANT TO SECTION 13 OR 15(d) OF THE SECURITIES EXCHANGE ACT OF 1934 |
| | For the transition period from to |
Commission file number 0-24960
COVENANT TRANSPORTATION GROUP, INC.
(Exact name of registrant as specified in its charter)
| Nevada | | 88-0320154 |
| (State / other jurisdiction of incorporation or organization) | | (I.R.S. Employer Identification No.) |
| 400 Birmingham Hwy. | | |
| Chattanooga, TN | | 37419 |
| (Address of principal executive offices) | | (Zip Code) |
| Registrant's telephone number, including area code: | 423 - 821-1212 |
| | |
| Securities registered pursuant to Section 12(b) of the Act: | $0.01 Par Value Class A Common Stock – The NASDAQ Global Select Market |
| | (Title of class) |
| | |
| Securities registered pursuant to Section 12(g) of the Act: | None |
Indicate by check mark if the registrant is a well-known seasoned issuer, as defined in Rule 405 of the Securities Act.
[ ] Yes [X] No
Indicate by check mark if the registrant is not required to file reports pursuant to Section 13 or 15(d) of the Act.
[ ] Yes [X] No
Indicate by check mark whether the registrant (1) has filed all reports required to be filed by Section 13 or 15(d) of the Securities Exchange Act of 1934 during the preceding 12 months (or for such shorter period that the registrant was required to file such reports), and (2) has been subject to such filing requirements for the past 90 days.
[X] Yes [ ] No
Indicate by check mark whether the registrant has submitted electronically and posted on its corporate Website, if any, every Interactive Data File required to be submitted and posted pursuant to Rule 405 of Regulation S-T (§ 232.405 of this chapter) during the preceding 12 months (or for such shorter period that the registrant was required to submit and post such files).
[X] Yes [ ] No
Indicate by check mark if disclosure of delinquent filers pursuant to Item 405 of Regulation S-K is not contained herein, and will not be contained, to the best of registrant's knowledge, in definitive proxy or information statements incorporated by reference in Part III of this Form 10-K or any amendments to this Form 10-K. [ ][X]
Indicate by check mark whether the registrant is a large accelerated filer, an accelerated filer, a non-accelerated filer, or a non-accelerated filer.smaller reporting company. See definitiondefinitions of "accelerated filer, and "large accelerated filer"filer," and "smaller reporting company" in ruleRule 12b-2 of the Exchange Act.
[ ] Large Accelerated Fileraccelerated filer | [ ] | Accelerated Filerfiler | [ ] |
| Non-accelerated filer | [ ] (Do not check if a smaller reporting company) | Smaller reporting company | [X] Non-Accelerated Filer |
Indicate by check mark whether the registrant is a shell company (as defined in Rule 12b-2 of the Exchange Act).
[ ] Yes [X] No
The aggregate market value of the common equity held by non-affiliates of the registrant as of June 30, 2011,29, 2012, was approximately $65$28 million (based upon the $7.75$3.74 per share closing price on that date as reported by NASDAQ). In making this calculation the registrant has assumed, without admitting for any purpose, that all executive officers, directors, and affiliated holders of more than 10% of a class of outstanding common stock, and no other persons, are affiliates.
As of March 5, 2012,25, 2013, the registrant had 12,371,55212,411,602 shares of Class A common stock and 2,350,000 shares of Class B common stock outstanding.
Portions of the materials from the registrant's definitive proxy statement for the 20122013 Annual Meeting of Stockholders to be held on May 15, 2012,29, 2013, have been incorporated by reference into Part III of this Form 10-K.
| Part I | | |
| | Item 1. | Business | |
| | Item 1A. | Risk Factors | |
| | Item 1B. | Unresolved Staff Comments | |
| | Item 2. | Properties | |
| | Item 3. | Legal Proceedings | |
| | Item 4. | Mine Safety Disclosures | |
| | | | |
| Part II | | |
| | Item 5. | Market for Registrant's Common Equity, Related Stockholder Matters and Issuer Purchases of Equity Securities | |
| | Item 6. | Selected Financial Data | |
| | Item 7. | Management's Discussion and Analysis of Financial Condition and Results of Operations | |
| | Item 7A. | Quantitative and Qualitative Disclosures about Market Risk | |
| | Item 8. | Financial Statements and Supplementary Data | |
| | Item 9. | Changes in and Disagreements with Accountants on Accounting and Financial Disclosure | |
| | Item 9A. | Controls and Procedures | |
| | Item 9B. | Other Information | |
| | | | |
| Part III | | |
| | Item 10. | Directors, Executive Officers, and Corporate Governance | |
| | Item 11. | Executive Compensation | |
| | Item 12. | Security Ownership of Certain Beneficial Owners and Management and Related Stockholder Matters | |
| | Item 13. | Certain Relationships and Related Transactions, and Director Independence | |
| | Item 14. | Principal Accounting Fees and Services | |
| | | | |
| Part IV | | |
| | Item 15. | Exhibits and Financial Statement Schedules | |
| | | |
Signatures | |
| | |
Report of Independent Registered Public Accounting Firm | |
| | |
| Financial Data | |
| | Consolidated Balance Sheets | |
| | Consolidated Statements of Operations | |
| | Consolidated Statements of Comprehensive Income (Loss) | |
| Consolidated Statements of Stockholders' Equity and Comprehensive Income (Loss) | |
| | Consolidated Statements of Cash Flows | |
| | Notes to Consolidated Financial Statements | |
PART I
This Annual Report on Form 10-K contains certain statements that may be considered forward-looking statements within the meaning of Section 27A of the Securities Act of 1933, as amended and Section 21E of the Securities Exchange Act of 1934, as amended and such statements are subject to the safe harbor created by those sections.sections and the Private Securities Litigation Reform Act of 1995, as amended. All statements, other than statements of historical or current fact, are statements that could be deemed forward-looking statements, including without limitation: any projections of earnings, revenues, or other financial items; any statement of plans, strategies, and objectives of management for future operations; any statements concerning proposed new services or developments; any statements regarding future economic conditions or performance; and any statements of belief and any statement of assumptions underlying any of the foregoing. Such statements may be identified by their use of terms or phrases such as "believe," "may," "could," "expects," "estimates," "projects," "believes," "anticipates," "plans," "intends," and similar terms and phrases. Forward-looking statements are based on currently available operating, financial, and competitive information. Forward-looking statements are inherently subject to risks and uncertainties, some of which cannot be predicted or quantified, which could cause future events and actual results to differ materially from those set forth in, contemplated by, or underlying the forward-looking statements. Factors that could cause or contribute to such differences include, but are not limited to, those discussed in the section entitles "Item 1A. Risk Factors," set forth below. Readers should review and consider the factors discussed in "Risk Factors" of this Annual Report on Form 10-K,"Item 1A. Risk Factors," along with various disclosures in our press releases, stockholder reports, and other filings with the Securities and Exchange Commission.
All such forward-looking statements speak only as of the date of this Annual Report on Form 10-K.Report. You are cautioned not to place undue reliance on such forward-looking statements. We expressly disclaim any obligation or undertaking to release publicly any updates or revisions to any forward-looking statements contained herein to reflect any change in our expectations with regard thereto or any change in the events, conditions, or circumstances on which any such statement is based.
References in this Annual Report to "we," "us," "our," or the "Company" or similar terms refer to Covenant Transportation Group, Inc. and its subsidiaries.
GeneralGENERAL
Background
We focus on targeted marketsprovide truckload transportation services throughout the continental United States, whereinto and out of Mexico and into and out of portions of Canada. Generally, we believe our service standards can provide a competitive advantage. We are a major carrier for transportation companies such astransport full trailer loads of freight forwarders, less-than-truckload carriers, and third-party logistics providers that require a high level of service to support their businesses, as well as for traditional truckload customers such as manufacturers, retailers, and food and beverage shippers. All of our asset-based subsidiaries are truckload carriers and as such generally dedicate an entire trailer to one customer from origin to destination. We also generate revenue throughdestination without intermediate stops or handling. Our truckload freight services utilize equipment we own or lease or equipment owned by independent contractors for the pick-up and delivery of freight. In most of our truckload business, we transport freight over nonroutine routes. Our dedicated freight service offering provides similar transportation services, but does so pursuant to agreements whereby we make our equipment available to a subsidiary that providesspecific customer for shipments over particular routes at specified times. To complement our truckload operations, we provide freight brokerage services. Through our asset based and non-asset based capabilities, we transport many types of freight for a diverse customer base.
We were founded in 1986 as a provider of expedited long-haul freight transportation, primarily using two-person driver teams in transcontinental lanes. A combinationSince that time, we have grown from 25 trucks to approximately 3,000 trucks and expanded our services from predominantly long-haul dry van to include refrigerated, dedicated, cross-border, regional, brokerage, and other offerings. The expansion of customer demand for additional servicesour fleet and service offerings have placed us among the nation's largest truckload transportation companies.
As our fleet grew and our service platform matured, several important trends dramatically affected the truckload industry and our business. First, supply chain patterns became more fluid in response to dynamic changes in labor and transportation costs, ocean freight and rail-intermodal service standards, retail distribution patterns resultedcenter networks, governmental regulations, and other industry-wide factors. Second, the cost structure of the truckload business, particularly equipment and fuel prices, rose dramatically, impacting us and our customers' freight decisions. Third, customers used technology to constantly optimize their supply chains which necessitated expanding our own technological capability to optimize our asset allocation, manage yields, and drive operational efficiency. Fourth, a confluence of regulatory constraints, safety and security demands, and scarcity of qualified applicants, negatively impacted our asset productivity and reinforced what a precious resource professional truck drivers are (and we believe increasingly will be) in additional services. Through several acquisitions in the late 1990's and continuing through 2006, we entered the refrigerated, solo, and regional markets. Over the past several years we internally developed the capacity to provide dedicated fleet and freight brokerage services. Since the beginning ofour industry.
In the fourth quarter of 2011, we have been analyzingbegan examining the services we offerkey components of each of our business units, including: market trends and developing a plan to increase asset productivity, further reduce costs, and focus future investmentsour relative positioning in the market; leadership and our personnel's ability to execute; financial results, investment returns, and capital requirements; importance of our service offerings whereto our customers; and growth prospects.
As a result of this assessment process, we seeidentified several key initiatives that we began executing in 2012, including the most promisefollowing:
| • | Expanding our refrigerated, non-asset based brokerage and ancillary services, and specialized team operation, while reducing capital allocated to certain other operations; |
| • | Increasing the use of owner-operators, particularly in our team operations, to more flexibly match equipment positioning to changes in freight patterns and economic demand, as well as reduce the capital allocated to this very mileage-intensive business; |
| • | Improving our debt-to-capitalization ratio through capital decisions and other means; |
| • | Implementing a more comprehensive sales and marketing approach that emphasizes to customers the enterprise-wide breadth of services we offer and encourages all sales associates to market all of our services; and |
| • | Designing our business to optimize the career opportunity for our drivers. |
To accompany our operational goals, we also adopted the following financial goals:
| • | Grow freight revenue meaningfully without increasing our fleet of owned trucks; |
| • | Improve operating ratio to the low to mid 90s; |
| • | Generate a return on invested capital approaching double digits; and |
| • | Reduce total leverage by a meaningful amount. |
Based on our return to profitability in 2012, we believe that certain of adequate returns. We were disappointed withthe initiatives are starting to provide positive results. However, we still have significant work ahead to achieve our performance in 2011goals, deliver a strong and are focused on finding the marketsstable product for our customers, provide a bright future for our employees and customers thatowner-operators, and create meaningful value for our services.stockholders.
Business Units
We have two reportable segments: Asset-Based Truckload Servicesasset-based truckload services ("Truckload") and our Brokerage Services, also known as Covenant Transport Solutions, Inc.non-asset based brokerage and ancillary services ("Solutions").
The Truckload segment consists of three asset-based operating fleets that are aggregated because they have similar economic characteristics and meet the aggregation criteria. The three operating fleets that comprise our Truckload segment are as follows: (i) Covenant Transport, Inc. ("Covenant Transport"), our historical flagship operation, which provides expedited long-haul, dedicated, temperature-controlled, and solo-driver regional service; (ii) Southern Refrigerated Transport, Inc. ("SRT"), which provides primarily long-haul and regional temperature-controlled service; and (iii) Star Transportation, Inc. ("Star"), which provides regional solo-driver service,and dedicated services, primarily in the southeastern United States.
The Solutions segment providesprovides: (i) freight brokerage service directly and through freight brokerage agents who are paid a commission for the freight they provide. The brokerage operation has helped us continue to serve customers when we lack capacity in a given area or when the load has not met the operating profile of our Truckload segment.provide; (ii) less-than-truckload consolidation services; and (iii) accounts receivable factoring.
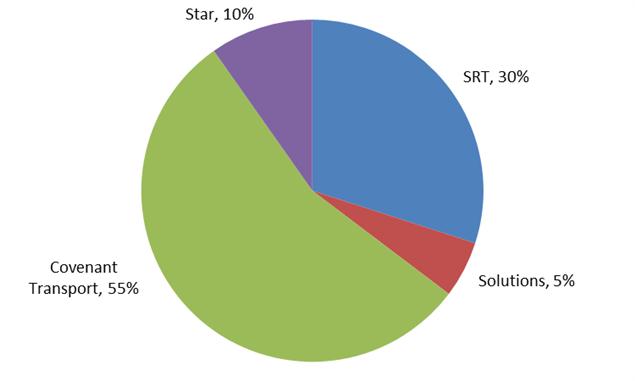
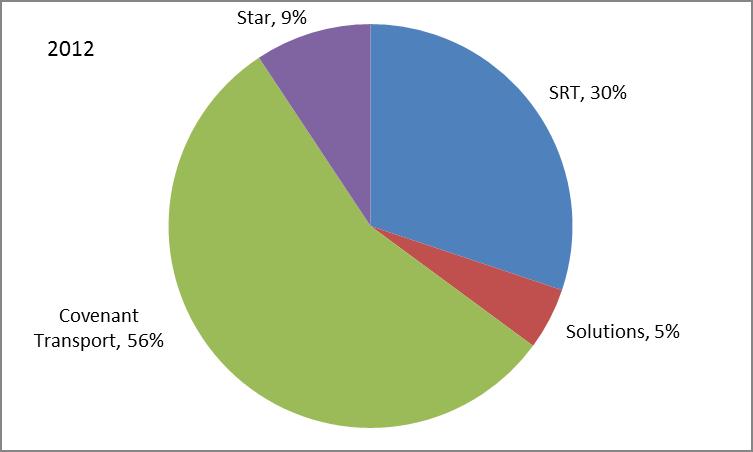
The following chart reflectscharts reflect the size of each of our subsidiaries measured by 20112012 freight revenue:
| Distribution of Revenue Among Subsidiaries |
| 55%56% |
| SRT | 30% |
| Star | 10%9% |
| Solutions | 5% |
Asset-Based Truckload Services
Our Truckload segment comprised approximately 95%, 93%95%, and 91%93% of our total freight revenue in 2012, 2011, 2010, and 2009,2010, respectively.
WeIn our Truckload segment, we primarily generate revenue by transporting freight for our customers. Generally, we are paid a predetermined rate per mile for our truckload services. We enhance our truckload revenue by charging for tractor and trailer detention, loading and unloading activities, and other specialized services, as well as through the collection of fuel surcharges to mitigate the impact of increases in the cost of fuel. The main factors that affect our truckloadTruckload revenue are the revenue per mile we receive from our customers, the percentage of miles for which we are compensated, and the number of shipments and miles we generate. These factors relate, among other things, to the general level of economic activity in the United States, inventory levels, specific customer demand, the level of capacity in the trucking industry, and driver availability.
The main factorsexpenses that impact the profitability of our profitability in terms of expensesTruckload segment are the variable costs of transporting freight for our customers. These costs include fuel expenses, driver-related expenses, such as wages, benefits, training, and recruitment, and purchased transportation expenses, which primarily include compensating independent contractors. Expenses that have both fixed and variable components include maintenance and tire expense and our total cost of insurance and claims. These expenses generally vary with the miles we travel, but also have a controllable component based on safety, self-insured retention versus insurance premiums, fleet age, efficiency, and other factors. Our main fixed costs include rentals and depreciation of long-term assets, such as revenue equipment and terminal facilities, and the compensation of non-driver personnel.
The development
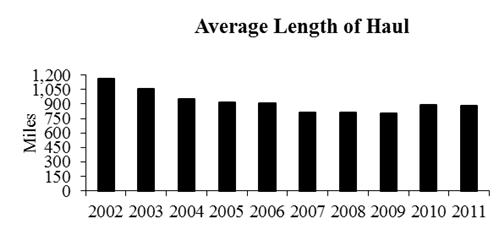
We measure performancethe productivity of our Truckload segment and the related subsidiaries' service offerings in four areas: average length-of-haul,with three key performance metrics: average freight revenue per total mile (excluding fuel surcharges), average miles per tractor, and average freight revenue per tractor per week (excluding fuel surcharges). A description of each follows:
Average Length-of-Haul. Prior to 2009, our average length-of-haul decreased over time as we increased the use of solo-driver tractors and increased our presence in regional markets. The increase in the length-of-haul since 2009 resulted from changes in our allocation of assets among our subsidiaries and focus on lane selection between target markets.
| |
| | 2002 | 2003 | 2004 | 2005 | 2006 | 2007 | 2008 | 2009 | 2010 | 2011 |
| Average Length-of-Haul in Miles | 1,159 | 1,055 | 950 | 920 | 908 | 815 | 815 | 805 | 887 | 879 |
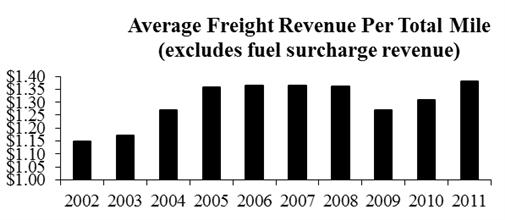
Average Freight Revenue Per Total Mile. Our average freight revenue per total mile is primarily a function of 1) the allocation of assets among our subsidiaries and 2) the macro U.S. economic environment including supply/demand of freight and carriers. The increase in 2012 and 2011 compared to 2010 and 2009 is a result of allocating more tractors to our niche/specialized service offerings that provide higher rates (including high-value/constant security, temperature controlled, cross boarder services and expedited/critical freight). Also, shipper concerns about the strengthening U.S. economy,prospect of tighter capacity expected tighter capacity in 2012, and rate increases required to mitigate inflationary costs.costs, afforded an environment more conducive to rate increases. | |
| | 2002 | 2003 | 2004 | 2005 | 2006 | 2007 | 2008 | 2009 | 2010 | 2011 |
| Average Freight Revenue Per Total Mile (excludes fuel surcharge revenue) | $1.15 | $1.17 | $1.27 | $1.357 | $1.364 | $1.363 | $1.36 | $1.271 | $1.307 | $1.382 |
| Average Freight Revenue Per Total Mile (excludes fuel surcharge revenue) | 2008 | 2009 | 2010 | 2011 | 2012 |
| $1.36 | $1.27 | $1.31 | $1.38 | $1.47 |
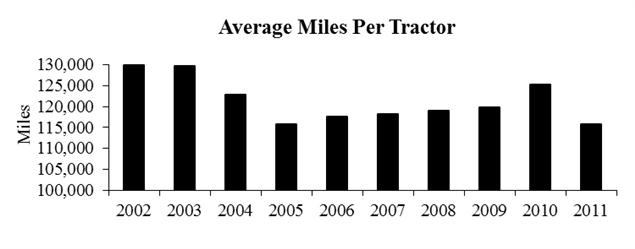
Average Miles Per Tractor. Average miles per tractor reflect economic demand, our ability to match fleet size to demand,driver availability, regulatory constraints, and the percentageallocation of team-driven tractors in our fleet.among the service offerings. The decreaseincrease in utilization in 20112012 is a result of an increasea decrease in our unseated truck count, reduction in productivity asallocation of assets to business units with better freight, and a result of utilizing Electronic On-Board Recorders ("EOBRs"), andfull year without a system conversion, at our Covenant Transport subsidiary.which more than overcame negative regulatory impact. | 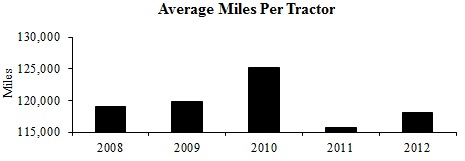 |
| Average Miles Per Tractor | 2008 | 2009 | 2010 | 2011 | 2012 |
| 118,992 | 119,836 | 125,178 | 115,775 | 118,103 |
| | 2002 | 2003 | 2004 | 2005 | 2006 | 2007 | 2008 | 2009 | 2010 | 2011 |
| Average Miles Per Tractor | 129,906 | 129,656 | 122,899 | 115,765 | 117,621 | 118,159 | 118,992 | 119,836 | 125,178 | 115,775 |
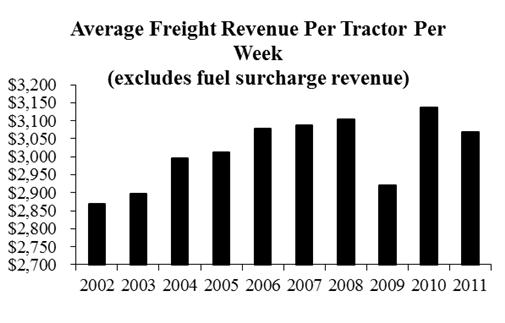
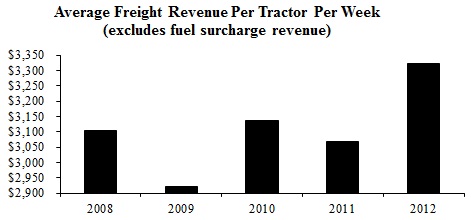
Average Freight Revenue Per Tractor Per Week. We use average freight revenue per tractor per week as our main measure of asset productivity. This operating metric takes into account the effects of freight rates, non-revenue miles, and miles per tractor. In addition, because we calculate average freight revenue per tractor using all of our trucks, it takes into account the percentage of our fleet that is unproductive due to lack of drivers, repairs, and other factors. The decreaseincrease in average freight revenue per tractor per week in 20112012 is primarily due to the aforementioned decline in utilization, partially offset by our increase in freight revenue per total mile.allocation of tractors to more productive service offerings, which contributed to higher rates and utilization. | |
| | 2002 | 2003 | 2004 | 2005 | 2006 | 2007 | 2008 | 2009 | 2010 | 2011 |
| Average Freight Revenue Per Tractor Per Week (excludes fuel surcharge revenue) | $2,870 | $2,897 | $2,995 | $3,013 | $3,077 | $3,088 | $3,105 | $2,920 | $3,137 | $3,069 |
| Average Freight Revenue Per Tractor Per Week (excludes fuel surcharge revenue) | 2008 | 2009 | 2010 | 2011 | 2012 |
| $3,105 | $2,920 | $3,137 | $3,069 | $3,322 |
Our Solutions segment comprised approximately 5%, 7%5%, and 9%7% of our total operating revenue in 2012, 2011, 2010, and 2009,2010, respectively. Solutions derives revenue from arranging transportation services for customers through relationships with thousands of third-party carriers and integration with our Truckload segment. Solutions provides freight brokerage services through freight brokerage agents, who are paid a commission for the freight brokerage service they provide, and directly through in-house brokerage personnel working in direct contact with customers. The main factors that impact profitability in terms of expenses are the variable costs of outsourcing the transportation freight for our customers and managing fixed costs, including salaries and selling, general, and administrative expenses. Our brokerage loads decreasedincreased to 22,965 in 2012, from 14,773 in 2011, from 19,589 in 2010, primarily due to a reduction in agents. Averagewhile average revenue per load decreased approximately 8%38% to $1,144 in 2012, from $1,853 in 2011, from $2,014 in 2010, primarily due to the loss of a changelarge agent in January 2012 and the addition of less-than-truckload services offerings, which changed the mix of Solutions’ business providing forbusiness. Solutions also experienced a 23.0%decrease in the number of special projects, resulting in a decrease in miles per load. This decrease was partially offset byload of approximately 15% and began factoring receivables adding approximately $0.8 million in related revenue.
On May 31, 2011, we acquired a 19.1% increase49.0% interest in rates asTransport Enterprise Leasing, LLC ("TEL"). TEL is a tractor and trailer equipment leasing company and used equipment reseller. We have accounted for our investment in TEL using the equity method of accounting and thus our financial results include our proportionate share of TEL’s net income since May 31, 2011, or $1.9 million in 2012 and $0.7 million in 2011. As a result, of the tighter capacity for trucks along with year-over-year increasesTEL’s results and growth are significant to our current year results and, in fuel costs.our estimation, to our longer-tem vision.
Refer to Note 16,15, "Segment Information," of the accompanying consolidated financial statements for further information about each of our reporting segments' operating and financial results for 2012, 2011, 2010, and 2009.2010.
Customers and Operations
Our primary customers include manufacturersWe focus on targeted markets throughout the United States where we believe our service standards can provide a competitive advantage. We are a major carrier for transportation companies such as freight forwarders, less-than-truckload carriers, and retailers,third-party logistics providers that require a high level of service to support their businesses, as well as other transportation companiesfor traditional truckload customers such as manufacturers, retailers, and food and beverage shippers. All of our asset-based subsidiaries are truckload carriers and as such generally dedicate an entire trailer to one customer from origin to destination. We also generate revenue through a subsidiary that seek our services when our team-driven tractors or other service capabilities offer them an advantage.provides freight brokerage services. No customer accounted for more than 10% of our consolidated revenue in 2012, 2011, 2010, or 2009.2010. Our top five customers accounted for approximately 31%24%, 31%, and 26%31% of our total revenue in 2012, 2011, 2010, and 2009,2010, respectively.
We operate tractors driven by a single driver and also tractors assigned to two-person driver teams. Our single driver tractors generally operate in shorter lengths of haul, generate fewer miles per tractor, and experience more non-revenue miles, but the lower productive miles are expected to be offset by generally higher revenue per loaded mile and the reduced employee expense of compensating only one driver. In contrast, our two-person driver tractors generally operate in longer lengths of haul, generate greater miles per tractor, and experience fewer non-revenue miles, but we typically receive lower revenue per loaded mile and incur higher employee expenses of compensating both drivers. We expect operating statistics and expenses to shift with the mix of single and team operations.
At December 31, 2011, we operated 2,978 tractors and 7,361 trailers. Of these tractors, 2,412 were owned, 350 were financed under operating leases, and 216 were provided by independent contractors, who own and drive their own tractors. Of these trailers, 2,550 were owned, 4,363 were financed under operating leases, and 448 were financed under capital leases.
Independent contractors provide a tractor and a driver and are responsible for all operating expenses in exchange for a fixed payment per mile. We do not have the capital outlay of purchasing the tractor. The payments to independent contractors are recorded in revenue equipment rentals and purchased transportation. When independent contractor tractors are utilized, we avoid expenses generally associated with company-owned equipment, such as driver compensation, fuel, interest, and depreciation. Obtaining equipment from independent contractors and under operating leases effectively shifts financing expenses from interest to "above the line" operating expenses. We evaluate our efficiency using net margin as well as operating ratio. We have increased the number of independent contractors in our fleet to 216 at December 31, 2011 from 138 at December 31, 2010. The majority of this increase came in the second half of 2011. We expect the trend of increased independent contractors as a percentage of our fleet to continue into 2012.
We equip our tractors with a satellite-based tracking and communications system that permits direct communication between drivers and fleet managers. We believe that this system enhances our operating efficiency and improves customer service and fleet management. This system also updates the tractor's position every thirty minutes, which allows us and our customers to locate freight and accurately estimate pick-up and delivery times. We also use the system to monitor engine idling time, speed, performance, and other factors that affect operating efficiency. Approximately 96% of our fleet was equipped with EOBRs at December 31, 2011. The EOBRs electronically monitor truck miles and enforce hours of service.
As an additional service to customers, we offer electronic data interchange and internet-based communication for customer usage in tendering loads and accessing information such as cargo position, delivery times, and billing information. These services allow us to communicate electronically with our customers, permitting real-time information flow, reductions or eliminations in paperwork, and the employment of fewer clerical personnel. We use a document imaging system to reduce paperwork and enhance access to important information.
We operate throughout the U.S. and in parts of Canada and Mexico, with substantially all of our revenue generated from within the U.S. All of our tractors are domiciled in the U.S., and for the past three years, we estimate thathave generated less than two percent of our revenue in Canada and Mexico in 2012 and less than one percent of our revenue has been generated in Canada2011 and Mexico. We do not separately track domestic and foreign revenue from customers or domestic and foreign long-lived assets, and providing such information would not be meaningful.2010.
In 2009, we began a multi-year project to upgrade the hardware and software of our information systems. The goal upon completion of the project is to have uniform operational and financial systems across the entire Company as we believe this will improve customer service, utilization, and enhance our visibility into and across the organization. Star, Solutions, and Covenant Transport are currently operating on the new system, and management is planning for implementation at SRT.system. We encountered difficulties when we converted our Covenant Transport subsidiary to the new system in the third quarter of 2011, which disrupted our operations and impacted our customer service, driver relations, and results of operations. We believe allAll significant problems associated with the Covenant Transport conversion have been addressed.were addressed by the end of January 2012 and efficiencies from the new system were realized by Covenant Transport in 2012. We expect to implement the new operating system at SRT in 2014.
Drivers and Other Personnel
Driver recruitment, retention, and satisfaction are essential to our success, and we have made each of these factors a primary element of our strategy. We recruit both experienced and student drivers as well as independent contractor drivers who own and drive their own tractor and provide their services to us under lease. We conduct recruiting and/or driver orientation efforts from five of our locations, and we offer ongoing training throughout our terminal network. We emphasize driver-friendly operations throughout our organization. We have implemented automated programs to signal when a driver is scheduled to be routed toward home, and we assign fleet managers specific tractor units, regardless of geographic region, to foster positive relationships between the drivers and their principal contact with us.
The truckload industry has periodically experienced difficulty in attracting and retaining enough qualified truck drivers. It is also common for the driver turnover rate of individual carriers to exceed 100% in a year. At times, there are driver shortages in the trucking industry. In past years, when there were driver shortages, the number of qualified drivers had not kept pace with freight growth because of (i) changes in the demographic composition of the workforce; (ii) alternative employment opportunities other than truck driving that became available in a growing economy; and (iii) individual drivers' desire to be home more often.
DriverWhile driver recruiting and retention were challenging in 2011, as evidenced by an increase in our average number of open trucks. While2012, we had fewer open trucks, excludingincluding wrecked units, approximated 4% of our fleetthroughout the year, with approximately 3.9% at December 31, 2011 and 3% of our fleet2012 compared to approximately 5.7% at December 31, 2010, there were fewer open trucks throughout most2011. We believe this decrease is the result of 2010positive recruiting efforts due to improved driver compensation arrangements and certain company specific initiatives during the year, partially offset by increased year over year driver turnover, as well as a result of the weaknessreduction in the economy contributing to more candidates entering the driver markettractor count in the early part of 2010. Additionally, the combination of lower miles throughout 2011 and the system conversion in the third quarter of 2011 increased driver turnover and thus unseated trucks during 2011 compared to 2010.2012 over 2011. Management's goal is to reduce open trucks, excludingincluding wrecked units, to less than 1%3% of our fleet, although no significant progress was made in 2011. Weand we will continue to work towardtowards this goal and we employed certain initiatives in 2011 that we expect to provide for improvement in 2012. 2013.
We believe having a happy, healthy, and safe driver is the key to our success, both in the short term and over a longer period. As a result, we are actively working to enhance our drivers' experience in an effort to recruit and retain more drivers.
Independent contractors provide a tractor and a driver and are responsible for all operating expenses in exchange for a fixed payment per mile. We do not have the capital outlay of purchasing the tractor. The payments to independent contractors are recorded in revenue equipment rentals and purchased transportation. When independent contractor tractors are utilized, we avoid expenses generally associated with company-owned equipment, such as driver compensation, fuel, interest, and depreciation. Obtaining equipment from independent contractors and under operating leases effectively shifts financing expenses from interest to "above the line" operating expenses. We evaluate our efficiency using net margin as well as operating ratio. We have increased the number of independent contractors in our fleet to 252 at December 31, 2012 from 216 at December 31, 2011, reaching a yearly average of 249 for 2012 compared to 165 in 2011. We expect the trend of increased independent contractors as a percentage of our fleet to continue into 2013.
Internal education and evaluation of the Federal Motor Carrier Safety Administration ("FMCSA") ComprehensiveSafety Accountability program ("CSA") (formerly "Comprehensive Safety Analysis 2010 ("CSA"2010") are priorities as we develop plans to keep our top talent and challenge those drivers that need improvement. Overall, we believe this regulation will bring challenges as well as opportunities for truckload carriers. CSA, in conjunction with the new U.S. Department of Transportation ("DOT") reductions in hours-of-service for drivers, may reduce effective capacity in our industry as well as negatively impact equipment utilization. Nevertheless, for carriers that successfully manage the new environment with driver-friendly equipment, compensation, and operations, we believe opportunities to increase market share may be available. Driver pay may increase as a result of regulation and economic expansion, which providescould provide more alternative employment opportunities. If economic growth is sustained, however, we expect the supply/demand environment to be favorable enough for us to offset expected compensation increases with better freight pricing.
We use driver teams in a substantial portion of our tractors. Driver teams permit us to provide expedited service on selected long-haul lanes because teams are able to handle longer routes and drive more miles while remaining within DOT hours-of-service rules. The use of teams contributes to greater equipment utilization of the tractors they drive than obtained with single drivers. The use of teams, however, increases the accumulation of miles on tractors and trailers as well as personnel costs as a percentage of revenue and the number of drivers we must recruit. At December 31, 2011,2012, teams operated approximately 26%29% of our tractors versus 27% in the preceding year.
We are not a party to a collective bargaining agreement. At December 31, 2011,2012, we employed approximately 4,0224,289 drivers and approximately 785835 non-driver personnel. At December 31, 2011,2012, we also contracted with approximately 216252 independent contractors.
Revenue Equipment
At December 31, 2012, we operated 2,884 tractors and 6,904 trailers. Of these tractors, 2,025 were owned, 607 were financed under operating leases, and 252 were provided by independent contractors, who own and drive their own tractors. Of these trailers, 2,643 were owned, 3,816 were financed under operating leases, and 445 were financed under capital leases. Furthermore, at December 31, 2012, approximately 71% of our trailers were dry vans and the remaining trailers were refrigerated vans.
We believe that operating high quality, late-model equipment contributes to operating efficiency, helps us recruit and retain drivers, and is an important part of providing excellent service to customers. Our policy is to operate a modern fleet of tractors, with the majority of units under warranty, to minimize repair and maintenance costs and reduce service interruptions caused by breakdowns. We also order most of our equipment with uniform specifications to reduce our parts inventory and facilitate maintenance. At December 31, 2011,2012, our tractor fleet had an average age of approximately 1.62.1 years, and our trailer fleet had an average age of approximately 5.75.8 years. As of December 31, 2011,2012, almost 100% of our tractor fleet had engines compliant with stricter regulations regarding emissions that became effective in 2007 and 37.1%51.8% of our tractor fleet had engines compliant with stricter regulations regarding emissions that became effective in 2010. Approximately 96%We equip our tractors with a satellite-based tracking and communications system that permits direct communication between drivers and fleet managers. We believe that this system enhances our operating efficiency and improves customer service and fleet management. This system also updates the tractor's position every thirty minutes, which allows us and our customers to locate freight and accurately estimate pick-up and delivery times. We also use the system to monitor engine idling time, speed, performance, and other factors that affect operating efficiency. At December 31, 2012, 100% of our fleet was equipped with EOBRs at December 31, 2011. Furthermore, at December 31, 2011, approximately 79% of our trailers were dry vanselectronic on board recorders (“EOBR’s), which electronically monitor truck miles and the remaining trailers were refrigerated vans.enforce hours-of-service.
Over the past several years, the price of new tractors has risen dramatically and there has been significant volatility in the used equipment market. This has substantially increased our costs of operation over the past several years. Tractor manufacturers have again increased prices in connection with the manufacturing of 2010 emission-compliant engines.
Industry and Competition
The U.S. market for truck-based transportation services was estimated to have generated $563.4$603.9 billion in 2010,2011, according to the most recently available data published by American Trucking Associations, Inc. The trucking industry includes both private fleets and "for-hire" carriers. We operate in the highly fragmented for-hire truckload segment of this market, which generated revenues of approximately $255.2$215.0 billion in 2010.2011. Our dedicated business also competes in the estimated $259.6$250.0 billion private fleet portion of the overall trucking market, by seeking to convince private fleet operators to outsource or supplement their private fleets.
The U.S. trucking industry is highly competitive and includes thousands of "for-hire" motor carriers, none of which dominate the market. Service and price are the principal means of competition in the trucking industry. We compete to some extent with railroads and rail-truck intermodal service but attempt to differentiate ourselves from themour competition on the basis of service. Rail and rail-truck intermodal movements are more often subject to delays and disruptions arising from rail yard congestion, which reduce the effectiveness of such service to customers with time-definite pick-up and delivery schedules. In times of high fuel prices or less consumer demand, however, rail-intermodal competition becomes more significant.
We believe that the cost and complexity of operating trucking fleets are increasing and that economic and competitive pressures are likely to force many smaller competitors and private fleets to consolidate or exit the industry. As a result, we believe that larger, better-capitalized companies, like us, will have opportunities to increase profit margins and gain market share. In the market for dedicated services, we believe that truckload carriers, like us, have a competitive advantage over truck lessors, which are the other major participants in the market, because we can offer lower prices by utilizing back-haul freight within our network that traditional lessors may not have.
Regulation
Our operations are regulated and licensed by various U.S. agencies. Our Canadian business activities are subject to similar requirements imposed by the laws and regulations of Canada, as well as its provincial laws and regulations. We operate within Mexico by utilizing third-party carriers within that country. Our Company drivers and independent contractors also must comply with the safety and fitness regulations of the DOT, including those relating to drug and alcohol testing and hours-of-service. Such matters as weight and equipment dimensions are also subject to U.S. regulations. We also may become subject to new or more restrictive regulations relating to fuel emissions, drivers' hours-of-service, ergonomics, or other matters affecting safety or operating methods. Other agencies, such as the Environmental Protection Agency ("EPA") and the Department of Homeland Security ("DHS") also regulate our equipment, operations, and drivers.
The DOT, through the FMCSA, imposes safety and fitness regulations on us and our drivers. New rules that limit driver hours-of-service were adopted effective January 4, 2004, and then modified effective October 1, 2005 (the "2005 Rules"). In July 2007, a federal appeals court vacated portions of the 2005 Rules. Two of the key portions that were vacated include the expansion of the driving day from 10 hours to 11 hours, and the "34-hour restart," which allowed drivers to restart calculations of the weekly on-duty time limits after the driver had at least 34 consecutive hours off-duty. The court indicated that, in addition to other reasons, it vacated these two portions of the 2005 Rules because FMCSA failed to provide adequate data supporting its decision to increase the driving day and provide for the 34-hour restart. In November 2008, following the submission of additional data by FMCSA and a series of appeals and related court rulings, FMCSA published its final rule, which retains the 11 hour driving day and the 34-hour restart (the "Final Rule"). However, advocacy groups have continued to challenge the Final Rule. On December 20, 2010, the FMCSA issued a Notice of Proposed Rulemaking that would place additional limits on the time drivers may operate a commercial motor vehicle. On December 27, 2011, the FMCSA published its 2011 Hours of ServiceHours-of-Service Final Rule (the "2011 Rule"). The rule2011 Rule preserved the 11-hour daily driving limit, but the FMCSA indicated that this daily limit may be revisited in the future. The 2011 Rule requires drivers to take 30-minute breaks after eight hours of consecutive driving and reduces the total number of hours a driver is permitted to work during each week from 82 to 70. The 2011 Rule also modified the requirements for when the weekly hours-of-service limit can be reset by having the drive refrain from working for a period of 34 hours, known as a "34-hour restart." The 2011 Rule also provides that the 34-hour restart may only be used once per week and must include two rest periods between one a.m. and five a.m. These rule changes are scheduled to become effective July 1, 2013. We anticipate that the 2011 Rule will be challenged prior to its effective date. We are unable to predict how a court may address challenges to the rule and to what extent the FMCSA might attempt to materially revise the rules under the current or future presidential administrations. On the whole, however, we believe these modifications to the current rule will decrease productivity and cause some loss of efficiency, as drivers and shippers may need to be retrained, computer programming may require modifications, additional drivers may need to be employed or engaged, additional equipment may need to be acquired, and some shipping lanes may need to be reconfigured.
The FMCSA also is considering revisions to the existing rating system and the safety labels assigned to motor carriers evaluated by the DOT. We currently have a “satisfactory”"satisfactory" DOT rating, which is the highest available rating under the current safety rating scale. If we were to receive a conditional or unsatisfactory DOT safety rating, it could adversely affect our business because some of our customer contracts require a satisfactory DOT safety rating, and a conditional or unsatisfactory rating could negatively impact or restrict our operations. Under the revised rating system being considered by the FMCSA, our safety rating would be evaluated more regularly, and our safety rating would reflect a more in-depth assessment of safety-based violations.
CSA introduced a new enforcement and compliance model. Under CSA, drivers and fleets are evaluated and ranked based on certain safety-related standards. The methodology for determining a carrier’s DOT safety rating has been expanded to include the on-road safety performance of the carrier’s drivers. As a result, certain current and potential drivers may no longer be eligible to drive for us, our fleet could be ranked poorly as compared to our peer firms, and our safety rating could be adversely impacted. A reduction in eligibleThe occurrence of future deficiencies could affect driver recruitment and retention by causing high-quality drivers to seek employment with other carriers, or a poor fleet ranking may result in difficulty attracting and retaining qualified drivers, and could cause our customers to direct their business away from us and to carriers with higher fleet safety rankings, either of which would adversely affect our results of operations.
Certain of our subsidiaries have exceeded the established intervention thresholds in several of the seven safety-related standards of CSA. Based on these unfavorable ratings, we may be prioritized for an intervention action or roadside inspection, either of which could adversely affect our results of operations. We have put new maintenance management and procedures in place in an attempt to address maintenance issues that were cited. Additionally, we have reduced the maximum speed on a large portion of our fleet and enhanced programs that reward drivers for positive safety behavior.
The FMCSA has proposed new rules that willwould require nearly all carriers, including us, to install and use EOBRs in their tractors to electronically monitor truck miles and enforce hours-of-service. Approximately 96%These rules were vacated by the Seventh Circuit Court of Appeals in August 2011. In July 2012, Congress passed a federal transportation bill that requires promulgation of rules mandating the use of EOBRs by July 2013 with full adoption by all trucking companies no later than July 2015. It is uncertain if this adoption date will be challenged or extended. We have proactively installed EOBRs on 100% of our owned tractors are equipped with EOBRs.tractors.
The Transportation Security Administration ("TSA") has adopted regulations that require determination by the TSA that each driver who applies for or renews his or her license for carrying hazardous materials is not a security threat. This could reduce the pool of qualified drivers, which could require us to increase driver compensation, limit our fleet growth, or result in trucks sitting idle. These regulations also could complicate the matching of available equipment with hazardous material shipments, thereby increasing our response time on customer orders and our non-revenue miles. As a result, it is possible we could fail to meet the needs of our customers or could incur increased expenses to do so.
We are subject to various environmental laws and regulations dealing with the hauling and handling of hazardous materials, fuel storage tanks, air emissions from our vehicles and facilities, engine idling, and discharge and retention of storm water. Our truck terminals often are located in industrial areas where groundwater or other forms of environmental contamination could occur. Our operations involve the risks of fuel spillage or seepage, environmental damage, and hazardous waste disposal, among others. Certain of our facilities have waste oil or fuel storage tanks and fueling islands. A small percentage of our freight consists of low-grade hazardous substances, which subjects us to a wide array of regulations. Although we have instituted programs to monitor and control environmental risks and promote compliance with applicable environmental laws and regulations, if we are involved in a spill or other accident involving hazardous substances, if there are releases of hazardous substances we transport, if soil or groundwater contamination is found at our facilities or results from our operations, or if we are found to be in violation of applicable laws or regulations, we could be subject to cleanup costs and liabilities, including substantial fines or penalties or civil and criminal liability, any of which could have a materially adverse effect on our business and operating results.
Regulations
EPA regulations limiting exhaust emissions became more restrictive in 2010. In May 2010, President Obama signed an executive memorandum directing the National Highway Traffic Safety Administration ("NHTSA") and the EPA to develop new, stricter fuel efficiency standards for heavy tractors, beginning in 2014. In August of 2011, the EPA released fuel economy standards for heavy trucks for the first time. These standards will require a fuel economy improvement of approximately 20% by 2018, starting with the 2014 model year. In December 2008, California adopted new performance requirements for diesel tractors, with targets to be met between 2011 and 2023, and California also has adopted aerodynamics requirements for certain trailers. These regulations, as well as proposed regulations or legislation related to climate change that potentially impose restrictions, caps, taxes, or other controls on emissions of greenhouse gas, could adversely affect our operations and financial results. In addition, increasing efforts to control emissions of greenhouse gases are likely to have an impact on us. The EPA has announced a finding relating to greenhouse gas emissions that may result in promulgation of greenhouse gas emission limits. Federal and state lawmakers also are considering a variety of climate-change proposals. Compliance with such regulations could increase the cost of new tractors and trailers, impair equipment productivity, and increase operating expenses. These effects, combined with the uncertainty as to the operating results that will be produced by the newly designed diesel engines and the residual values of these vehicles, could increase our costs or otherwise adversely affect our business or operations.
In order to reduce exhaust emissions, some states and municipalities have begun to restrict the locations and amount of time where diesel-powered tractors, such as ours, may idle. These restrictions could force us to alter our drivers' behavior, purchase on-board power units that do not require the engine to idle, or face a decrease in productivity.
Fuel Availability and Cost
The cost of fuel trended higher in 2011,2012, compared to 20102011 and 2009,2010, as a result of geo-political tensions and volatility in the Middle East, weakness of the U.S. dollar, and an increase in global demand for petroleum products. To mitigate the cost and volatility in the cost of fuel, we utilize a variety of initiatives.
We actively manage our fuel costs by routing our drivers through fuel centers with which we have negotiated volume discounts and through jurisdictions with lower fuel taxes, where possible. We have also reduced the maximum speed of many of our trucks, implemented strict idling guidelines for our drivers, purchased technology to enhance our management and monitoring of out-of-route miles, encouraged the use of shore power units in truck stops, and imposed standards for accepting broker freight that includes minimum rates and fuel surcharges. This combination of initiatives has contributed to significant improvements in fleet-wide average fuel mileage. Moreover, we have a fuel surcharge revenue program in place with the majority of our customers, which has historically enabled us to recover some of the higher fuel costs. However, even with the fuel surcharges, the price of fuel has affected our profitability. Our fuel surcharges are billed on a lagging basis, meaning we typically bill customers in the current week based on a previous week's applicable index. Therefore, in times of increasing fuel prices, we do not recover as much as we are currently paying for fuel. In periods of declining prices, the opposite is true. In addition, we incur additional costs when fuel prices rise that cannot be fully recovered due to our engines being idled during cold or warm weather, empty or out-of-route miles, and for fuel used by refrigerated trailer units that generally are not billed to customers. In addition, during 2009 manytime-to-time customers attemptedattempt to modify their surcharge programs, some successfully, which has resultedcan result in recovery of a smaller portion of fuel price increases. In 2011 and 2010, we refocused on ensuring fuel surcharges from customers were acceptable to mitigate the rising cost of fuel. Rapid increases in fuel costs or shortages of fuel could have a materially adverse effect on our operations or future profitability.
We engage in activities that expose us to market risks, including the effects of changes in fuel prices. Financial exposures are evaluated as an integral part of our risk management program, which seeks, from time-to-time, to reduce the potentially adverse effects that the volatility of fuel markets may have on operating results. In an effort to seek toTo reduce the variability of the ultimate cash flows associated with fluctuations in diesel fuel prices, we periodically enter into various derivative instruments, including forward futures swap contracts. As diesel fuel is not a traded commodity on the futures market, heating oil is used as a substitute for diesel fuel as prices for both generally move in similar directions. Under these contracts, we pay a fixed rate per gallon of heating oil and receive the monthly average price of New York heating oil per the NYMEX ("New"NYMEX" (New York Mercantile Exchange")Exchange). The retrospective and prospective regression analyses provided that changes in the prices of diesel fuel and heating oil were deemed to be highly effective based on the relevant authoritative guidance. We do not engage in speculative transactions, nor do we hold or issue financial instruments for trading purposes.
We recognize all derivative instruments at fair value on our consolidated balance sheets. Our derivative instruments are designated as cash flow hedges, thus the effective portion of the gain or loss on the derivatives is reported as a component of accumulated other comprehensive income and will be reclassified into earnings in the same period during which the hedged transaction affects earnings. The effective portion of the derivative represents the change in fair value of the hedge that offsets the change in fair value of the hedged item. To the extent the change in the fair value of the hedge does not perfectly offset the change in the fair value of the hedged item, the ineffective portion of the hedge is immediately recognized in other income on our consolidated statements of operations. Ineffectiveness is calculated using the cumulative dollar offset method as an estimate of the difference in the expected cash flows of the heating oil futures contracts compared to the changes in the all-in cash outflows required for the diesel fuel purchases.
At December 31, 2011,2012, we had forward futures swap contracts on approximately 12.912.1 million gallons of diesel to be purchased in 2012,2013, or approximately 21.4%20% of our projected annual 20122013 fuel requirements, and approximately 4.0 million gallons to be purchased in 2014, or approximately 6% of our projected annual 2014 fuel requirements.
Seasonality
In the trucking industry, revenue generally decreases as customers reduce shipments after the winter holiday season and as inclement weather impedes operations. At the same time, operating expenses generally increase, with fuel efficiency declining because of engine idling and weather, creating more equipment repairs. For the reasons stated, first quarter operating results historically have been lower than results in each of the other three quarters of the year excluding charges. Our equipment utilization typically improves substantially between May and October of each year because of the trucking industry's seasonal shortage of equipment on traffic originating in California and because of general increases in shipping demand during those months. During September and October, business sometimes increases as a result of increased retail merchandise shipped in anticipation of the holidays. Due to the economic downturn and related low inventory levels, this historical trend has not been presentless pronounced over the past several years, including fiscal 2012, 2011, and 2010, as we have seen increases in demand at varying times, specifically between March and June, based primarily on restocking required to replenish inventories and less pronounced seasonal spikes prior to the holidays.
Additional Information
At December 31, 2011,2012, our corporate structure included Covenant Transportation Group, Inc., a Nevada holding company organized in May 1994, and its wholly owned subsidiaries: Covenant Transport, Inc., a Tennessee corporation; Southern Refrigerated Transport, Inc., an Arkansas corporation; Star Transportation, Inc., a Tennessee corporation; Covenant Transport Solutions, Inc., a Nevada corporation; Covenant Logistics, Inc., a Nevada corporation; Covenant Asset Management, Inc., a Nevada corporation; and CTG Leasing Company, a Nevada corporation.
Our headquarters is located at 400 Birmingham Highway, Chattanooga, Tennessee 37419, and our website address is www.ctginvestor.com. Our Annual Report on Form 10-K, quarterly reports on Form 10-Q, current reports on Form 8-K, and all other reports we file with the SEC pursuant to Section 13(a) or 15(d) of the Securities Exchange Act of 1934, as amended (the "Exchange Act") are available free of charge through our website. Information contained in or available through our website is not incorporated by reference into, and you should not consider such information to be part of, this Annual Report on Form 10-K.
Additionally, you may read all of the materials that we file with the SEC by visiting the SEC's Public Reference Room at 100 F Street, N.E., Washington, D.C. 20549. If you would like information about the operation of the Public Reference Room, you may call the SEC at 1-800-SEC-0330. You may also visit the SEC's website at www.sec.gov. This site contains reports, proxy and information statements and other information regarding the Company and other companies that file electronically with the SEC.
Factors That May Affect Future Results
Our future results may be affected by a number of factors over which we have little or no control. The following discussion of risk factors contains forward-looking statements as discussed in Item 1 above. The following issues, uncertainties, and risks, among others, should be considered in evaluating our business and growth outlook.
Our business is subject to general economic and business factors affecting the trucking industry that are largely out of our control, any of which could have a materially adverse effect on our operating results.
Our business is dependent on a number of factors that may have a materially adverse effect on our results of operations, many of which are beyond our control. Some of the most significant of these factors include excess tractor and trailer capacity in the trucking industry, declines in the resale value of used equipment, strikes or other work stoppages, increases in interest rates, fuel taxes, tolls, and license and registration fees, and rising costs of healthcare.
We also are affected by recessionary economic cycles, changes in customers' inventory levels, and downturns in customers' business cycles, particularly in market segments and industries, such as retail and manufacturing, where we have a significant concentration of customers, and regions of the country, such as California, Texas, and the Southeast, where we have a significant amount of business. Some of the principal risks are as follows:
| • | We may experience a reduction in overall freight levels, which may impair our asset utilization; |
| • | Certain of our customers may face credit issues and could experience cash flow problems that may lead to payment delays, increased credit risk, bankruptcies, and other financial hardships that could result in even lower freight demand and may require us to increase our allowance for doubtful accounts; |
| • | Freight patterns may change as supply chains are redesigned, resulting in an imbalance between our capacity and our customers' freight demand; |
| • | Customers may bid out freight or select competitors that offer lower rates from among existing choices in an attempt to lower their costs, and we might be forced to lower our rates or lose freight; and |
| • | We may be forced to accept more freight from freight brokers, where freight rates are typically lower, or may be forced to incur more non-revenue miles to obtain loads. |
We also are subject to increases in costs and other events that are outside of our control that could materially reduce our profitability if we are unable to increase our rates sufficiently. Such cost increases include, but are not limited to, fuel and energy prices, taxes and interest rates, tolls, license and registration fees, insurance, revenue equipment and related maintenance costs, and healthcare and other benefits for our employees. We could be affected by strikes or other work stoppages at our service centers or at customer, port, border, or other shipping locations. Changing impacts of regulatory measures could impair our operating efficiency and productivity, decrease our revenues and profitability, and result in higher operating costs. In addition, it is not possibledeclines in the resale value of revenue equipment can also affect our profitability and cash flows. From time-to-time, various federal, state, or local taxes are also increased, including taxes on fuels. We cannot predict whether, or in what form, any such increase applicable to us will be enacted, but such an increase could adversely affect our profitability.
In addition, we cannot predict the effects offuture economic conditions, fuel price fluctuations, or how consumer confidence could be affected by actual or threatened armed conflicts or terrorist attacks, government efforts to combat terrorism, military action against anya foreign state or group located in a foreign state, or heightened security requirements, or other related events. Such events, however,requirements. Enhanced security measures could negatively impact the economyimpair our operating efficiency and consumer confidenceproductivity and result in the U.S. Such events could also have a materially adverse effect on our future results of operations.
We operate in a highly competitive and fragmented industry, and numerous competitive factors could impair our ability to improve our profitability.
These factors include:
| • | We compete with many other truckload carriers of varying sizes and, to a lesser extent, with less-than-truckload carriers, railroads, intermodal companies, and other transportation companies, many of which have more equipment and greater capital resources than we do.do; |
| • | Many of our competitors periodically reduce their freight rates to gain business, especially during times of reduced growth rates in the economy, which may limit our ability to maintain or increase freight rates or maintain significant growth in our business.business; |
| • | Many of our customers, including the majorityfour of our top ten, are other transportation companies, and they may decide to transport their own freight.freight; |
| • | Many customers reduce the number of carriers they use by selecting "core carriers" as approved service providers, and in some instances we may not be selected.selected; |
| • | Many customers periodically accept bids from multiple carriers for their shipping needs, and this process may depress freight rates or result in the loss of some business to competitors.competitors; |
| • | The trend toward consolidation in the trucking industry may create other large carriers with greater financial resources and other competitive advantages relating to their size.size; |
| • | Advances in technology require increased investments to remain competitive, and our customers may not be willing to accept higher freight rates to cover the cost of these investments.investments; and |
| • | Competition from non-asset-based logistics and freight brokerage companies may adversely affect our customer relationships and freight rates. |
We have a recent history of net losses and may be unsuccessful in improving our profitability.
After generatingWe have generated a profit in 2010, we had a net loss in 2011 and have incurred net losses in fouronly two of the last five years.years and our aggregate net losses during the five year period are significantly more than our aggregate net income. We may not be able to achieve profitability or, if we do, we may not be able to sustain or increase profitability in the future. If we are unable to improve our profitability, then our liquidity, financial position, and results of operations may be adversely affected.
We self-insure for a significant portion of our claims exposure, which could significantly increase the volatility of, and decrease the amount of, our earnings.
Our future insurance and claims expense could reduce our earnings and make our earnings more volatile. We self-insure for a significant portion of our claims exposure and related expenses. We accrue amounts for liabilities based on our assessment of claims that arise and our insurance coverage for the periods in which the claims arise, and we evaluate and revise these accruals from time-to-time based on additional information. Due to our significant self-insured amounts, we have significant exposure to fluctuations in the number and severity of claims and the risk of being required to accrue or pay additional amounts if our estimates are revised or the claims ultimately prove to be more severe than originally assessed. Further, our self-insured retention levels could change and result in more volatility than in recent years. Historically, we have had to significantly adjust our reserves on several occasions, and future significant adjustments may occur.
We maintain insurance above the amounts for which we self-insure with licensed insurance carriers. Although we believe our aggregate insurance limits are sufficient to cover reasonably expected claims, it is possible that one or more claims could exceed those limits. If any claim was to exceed our coverage, we would bear the excess, in addition to our other self-insured amounts. Our insurance and claims expense could increase, or we could find it necessary to again raise our self-insured retention or decrease our aggregate coverage limits when our policies are renewed or replaced. Our operating results and financial condition may be adversely affected if these expenses increase, if we experience a claim in excess of our coverage limits, if we experience a claim for which we do not have coverage, if we experience an increase in number of claims, or if we have to increase our reserves. Healthcare legislation and inflationary cost increases could also negatively affect our financial results.
Fluctuations in the price or availability of fuel, hedging activities, and the volume and terms of diesel fuel purchase commitments, and surcharge collection and surcharge policies approved by customers may increase our costs of operation, which could materially and adversely affect our profitability.
Fuel is one of our largest operating expenses. Diesel fuel prices fluctuate greatly due to economic, political, weather, and other factors beyond our control, each of which may lead to an increase in the cost of fuel. Fuel also is subject to regional pricing differences and often costs more on the West Coast, where we have significant operations. From time-to-time, we use hedging contracts and volume purchase arrangements to attempt to limit the effect of price fluctuations. We may be forced to make cash payments under the hedging arrangements. We use a fuel surcharge program to recapture a portion of the increases in fuel prices over a base rate negotiated with our customers. Our fuel surcharge program does not protect us against the full effect of increases in fuel prices. The terms of each customer's fuel surcharge program vary and certain customers have sought to modify the terms of their fuel surcharge programs to minimize recoverability for fuel price increases. A failure to improve our fuel price protection through these measures, increases in fuel prices, or a shortage or rationing of diesel fuel, could materially and adversely affect our results of operations.
We depend on the proper functioning and availability of our information systems and a system failure or unavailability or an inability to effectively upgrade our information systems could cause a significant disruption to our business and have a materially adverse effect on our results of operation.
We depend on the proper functioning and availability of our information systems, including financial reporting and operating systems, in operating our business. Our operating system is critical to understanding customer demands, accepting and planning loads, dispatching equipment and drivers, and billing and collecting for our services. Our financial reporting system is critical to producing accurate and timely financial statements and analyzing business information to help us manage effectively. We are in the process of implementing a multi-year project to upgrade the hardware and software of our information systems. When we have converted portions of our operations in the past, we have experienced difficulties. If any of our critical information systems fail or become otherwise unavailable, whether as a result of the upgrade project or otherwise, we would have to perform the functions manually, which could temporarily impact our ability to manage our fleet efficiently, to respond to customers' requests effectively, to maintain billing and other records reliably, and to bill for services and prepare financial statements accurately or in a timely manner. Our business interruption insurance may be inadequate to protect us in the event of an unforeseeable and extreme catastrophe. Any system failure, delay, or complication in the upgrade, security breach, or other system failure could interrupt or delay our operations, damage our reputation, cause us to lose customers, or impact our ability to manage our operations and report our financial performance, any of which could have a materially adverse effect on our business.
Our Third Amended and Restated Credit Facility ("Credit Facility") and other financing arrangements contain certain covenants, restrictions, and requirements, and we may be unable to comply with the covenants, restrictions, and requirements. A default could result in the acceleration of all or part of our outstanding indebtedness, which could have an adverse effect on our financial condition, liquidity, results of operations, and the price of our common stock.
We have an $85.0a $95.0 million Credit Facility with a group of banks and numerous other financing arrangements. The Credit Facility contains certain restrictions and covenants relating to, among other things, dividends, liens, acquisitions and dispositions outside of the ordinary course of business, affiliate transactions, and a fixed charge coverage ratio, andif availability is below a leverage ratio.certain threshold. We have had difficulty meeting budgeted results and have had to request amendments in the past. If we are unable to meet budgeted results or otherwise comply with our Credit Facility, we may be unable to obtain amendments or waivers under our Credit Facility, or we may incur fees in doing so. See "Material Debt Agreements" belowunder Item 7 in Part II of this Annual Report on Form 10-K for additional information.
Certain other financing arrangements contain certain restrictions and non-financial covenants as well.in addition to those contained in our Credit Facility. If we fail to comply with any of our financing arrangement covenants, restrictions, and requirements, we will be in default under the relevant agreement, which could cause cross-defaults under our other financing arrangements. In the event of any such default, if we failed to obtain replacement financing, amendments to, or waivers under the applicable financing arrangements, our lenders could cease making further advances, declare our debt to be immediately due and payable, fail to renew letters of credit, impose significant restrictions and requirements on our operations, institute foreclosure procedures against their collateral, or impose significant fees and transaction costs. If acceleration occurs, economic conditions such as the recent credit market crisis may make it difficult or expensive to refinance the accelerated debt or we may have to issue equity securities, which would dilute stock ownership. Even if new financing is made available to us, credit may not be available to us on acceptable terms. A default under our financing arrangements could cause a materially adverse effect on our liquidity, financial condition, and results of operations.
Our substantial indebtedness and capital and operating lease obligations could adversely affect our ability to respond to changes in our industry or business.
As a result of our level of debt, capital leases, operating leases, and encumbered assets:assets, we believe:
| • | Our vulnerability to adverse economic conditions and competitive pressures is heightened; |
| • | We will continue to be required to dedicate a substantial portion of our cash flows from operations to lease payments and repayment of debt, limiting the availability of cash for other purposes; |
| • | Our flexibility in planning for, or reacting to, changes in our business and industry will be limited; |
| • | Our profitability is sensitive to fluctuations in interest rates because some of our debt obligations are subject to variable interest rates, and future borrowings and lease financing arrangements will be affected by any such fluctuations; |
| • | Our ability to obtain additional financing in the future for working capital, capital expenditures, acquisitions, or other purposes may be limited; and |
| • | We may be required to issue additional equity securities to raise funds, which would dilute the ownership position of our stockholders. |
Our financing obligations could negatively impact our future operations, our ability to satisfy our capital needs, or our ability to engage in other business activities. We also cannot assure you that additional financing will be available to us when required or, if available, will be on terms satisfactory to us.
We have significant ongoing capital requirements that could affect our profitability if we are unable to generate sufficient cash from operations and obtain financing on favorable terms.
The truckload industry is capital intensive, and our policy of operating newer equipment requires us to expend significant amounts annually. We expect to pay for projected capital expenditures with cash flows from operations, borrowings under our Credit Facility, proceeds from the sale of our used revenue equipment, proceeds under our financing facilities, and leases of revenue equipment. If we are unable to generate sufficient cash from operations and obtain financing on favorable terms in the future, we may have to limit our fleet size, enter into less favorable financing arrangements, or operate our revenue equipment for longer periods, any of which could have a materially adverse effect on our profitability.
We derive a significant portion of our revenue from our major customers, the loss of one or more of which could have a materially adverse effect on our business.
A significant portion of our revenue is generated from our major customers. Economic conditions and capital markets may adversely affect our customers and their ability to remain solvent. Our customers' financial difficulties can negatively impact our results of operations and financial condition, especially if our customers were to delay or default on payments to us. Generally, we do not have long-term contractual relationships with our major customers, and our customers may not continue to use our services or could reduce their use of our services. For some of our customers, we have entered into multi-year contracts, and the rates we charge may not remain advantageous. A reduction in or termination of our services, by one or more of our major customers, could have a materially adverse effect on our business and operating results.
We depend on third parties, particularly in our brokerage business, and service instability from these providers could increase our operating costs and reduce our ability to offer brokerage services, which could adversely affect our revenue, results of operations, and customer relationships.
Our brokerage business is dependent upon the services of third-party capacity providers, including other truckload carriers. These third-party providers seek other freight opportunities and may require increased compensation in times of improved freight demand or tight trucking capacity. Our inability to secure the services of these third parties, or increases in the prices we must pay to secure such services, could have an adverse effect on our operations and profitability.
Increases in driver compensation or difficulty in attracting and retaining qualified drivers could adversely affect our profitability.
Like many truckload carriers, we experience substantial difficulty in attracting and retaining sufficient numbers of qualified drivers, including independent contractors. In addition, dueOur industry periodically experiences a shortage of qualified drivers, particularly during periods of economic expansion, in partwhich alternative employment opportunities are more plentiful and freight demand increases, or during periods of economic downturns, in which unemployment benefits might be extended and financing is limited for independent contractors who seek to current economic conditions, including the cost of fuel, insurance, and tractors, the available pool of independent contractor drivers has been declining.purchase equipment or for students who seek financial aid for driving school. Regulatory requirements, including CSA and hours-of-service changes, (both discussed below), and an improved economy could further reduce the number of eligible drivers or force us to pay moreincrease driver compensation to attract and retain drivers. A shortage of qualified drivers and intense competition for drivers from other trucking companies will create difficulties in maintaining or increasing the number of our drivers, including independent contractor drivers. The compensation we offer our drivers and independent contractors is subject to market conditions, and we may find it necessary to increase driver and independent contractor compensation in future periods. In addition, we and our industry suffer from a high turnover rate of drivers. The high turnover rate requires us to continually recruit a substantial number of drivers in order to operate existing revenue equipment. If we are unable to continue to attract and retain a sufficient number of drivers, we could be forced to, among other things, adjust our compensation packages, increase the number of our tractors without drivers, or operate with fewer trucks and face difficulty meeting shipper demands, any of which could adversely affect our growth and profitability.
If our independent contractor drivers are deemed by regulators or judicial process to be employees, our business and results of operations could be adversely affected.
Tax and other regulatory authorities have in the past sought to assert that independent contractor drivers in the trucking industry are employees rather than independent contractors, and our classification of independent contractors has been the subject of audits by such authorities from time-to-time. Federal legislators have introduced legislation in the past to make it easier for tax and other authorities to reclassify independent contractor drivers as employees, including legislation to increase the recordkeeping requirements for employers of independent contractor drivers and to heighten the penalties of employers who misclassify their employees and are found to have violated employees' overtime and/or wage requirements. Additionally, federal legislators have sought to abolish the current safe harbor allowing taxpayers meeting certain criteria to treat individuals as independent contractors if they are following a long-standing, recognized practice, extend the Fair Labor Standards Act to independent contractors, and impose notice requirements based upon employment or independent contractor status and fines for failure to comply. Some states have put initiatives in place to increase their revenues from items such as unemployment, workers' compensation, and income taxes, and a reclassification of independent contractor drivers as employees would help states with this initiative. Taxing and other regulatory authorities and courts apply a variety of standards in their determination of independent contractor status. If our independent contractor drivers are determined to be our employees, we would incur additional exposure under federal and state tax, workers' compensation, unemployment benefits, labor, employment, and tort laws, including for prior periods, as well as potential liability for employee benefits and tax withholdings.
We operate in a highly regulated industry, and changes in existing regulations or violations of existing or future regulations could have a materially adverse effect on our operations and profitability.
We operate in the U.S. pursuant to operating authority granted by the DOT and in various Canadian provinces pursuant to operating authority granted by the Ministries of Transportation and Communications in such provinces. We operate within Mexico by utilizing third-party carriers within that country. Our Company drivers and independent contractors also must comply with the safety and fitness regulations of the DOT, including those relating to drug and alcohol testing and hours-of-service. Such matters as weight and equipment dimensions also are subject to government regulations. We also may become subject to new or more restrictive regulations relating to fuelexhaust emissions, drivers’ hours-of-service, ergonomics, on-board reporting of operations, collective bargaining, security at ports, and other matters affecting safety or operating methods. Other agencies, such as the EPA and the DHS, also regulate our equipment, operations, and drivers. Future laws and regulations may be more stringent and require changes in our operating practices, influence the demand for transportation services, or require us to incur significant additional costs. Higher costs incurred by us or by our suppliers who pass the costs onto us through higher prices could adversely affect our results of operations.
The DOT, through the FMCSA, imposes safetyRegulation section in Item 1 of Part I of this Annual Report on Form 10-K discusses in detail several proposed, pending, and fitnessfinal regulations on us and our drivers. In December 2011, the FMCSA issued a final rule that placed additional limits on the amount of time drivers may operate a commercial motor vehicle. The FMCSA preserved the current 11-hour daily driving limit, but indicated that this daily limit may be revisited in the future. The rule proscribed two new requirements regarding driving hours. First, drivers must take 30 minute breaks after 8 hours of consecutive driving. Second, the rule reduced the total hours a driver is permitted to work during each week from 82 to 70.
The new rule also modified the requirements for when the weekly hours-of-service limit can be reset by having the driver refrain from working for a period of 34 hours, known as a “34-hour restart.” While there were previously no conditions limiting the use of 34-hour restart periods, the new rule requires that a 34-hour restart may only be used once per week and only after the driver has observed two rest periods between 1 A.M. and 5 A.M. The new rule also adjusted the definition of “off-duty time” to exclude from hourly limits driver time spent in a parked vehicle. Finally, the rule defined what violations of hours-of-service rules are considered “egregious,” and provided for enhanced penalties to carriers for when such violations occur.
We are unable to predict thecould significantly impact that the new hours-of-service rules may have, how a court may rule on challenges to such rules, and to what extent the FMCSA might attempt to materially revise the rules. On the whole, however, we believe that the new rules will decrease productivity and cause some loss of efficiency, as drivers and shippers may need to be retrained, computer programming may require modifications, additional drivers may need to be employed or engaged, additional equipment may need to be acquired, and some shipping lanes may need to be reconfigured. We are also unable to predict the effect of any new rules that might be proposed if the issued rule is stricken by a court, but any such proposed rules could increase costs in our industry or decrease productivity.
Our operations are subject to various environmental laws and regulations dealing with the transportation, storage, presence, use, disposal, and handling of hazardous materials, discharge of wastewater and storm water, and with waste oil and fuel storage tanks. Our terminals often are located in industrial areas where groundwater or other forms of environmental contamination could occur. Our operations involve the risks of fuel spillage or seepage, environmental damage, and hazardous waste disposal, among others. Certain of our facilities have waste oil or fuel storage tanks and fueling islands. A small percentage of our freight consists of low-grade hazardous substances, which subjects us to a wide array of regulations. Although we have instituted programs to monitor and control environmental risks and promote compliance with applicable environmental laws and regulations, if we are involved in a spill or other accident involving hazardous substances, if there are releases of hazardous substances we transport, if soil or groundwater contamination is found at our facilities or results from our operations, or if we are found to be in violation of applicable laws or regulations, we could be subject to cleanup costs and liabilities, including substantial fines or penalties or civil and criminal liability, any of which could have a materially adverse effect on our business and operating results.
EPA regulations limiting exhaust emissions became more restrictive in 2010. In May 2010, President Obama signed an executive memorandum directing the National Highway Traffic Safety Administration, or "NHTSA," and the EPA to develop new, stricter fuel efficiency standards for heavy tractors, beginning in 2014. In August of 2011, the EPA released fuel economy standards for heavy trucks for the first time. These standards will require a fuel economy improvement of approximately 20% by 2018, starting with the 2014 model year. In December 2008, California adopted new performance requirements for diesel tractors, with targets to be met between 2011 and 2023, and California also has adopted aerodynamics requirements for certain trailers. These regulations, as well as proposed regulations or legislation related to climate change that potentially impose restrictions, caps, taxes, or other controls on emissions of greenhouse gas, could adversely affect our operations and financial results. In addition, increasing efforts to control emissions of greenhouse gases are likely to have an impact on us. The EPA has announced a finding relating to greenhouse gas emissions that may result in promulgation of greenhouse gas emission limits. Federal and state lawmakers also are considering a variety of climate-change proposals. Compliance with such regulations could increase the cost of new tractors and trailers, impair equipment productivity, and increase operating expenses. These effects, combined with the uncertainty as to the operating results that will be produced by the newly designed diesel engines and the residual values of these vehicles, could increase our costs or otherwise adversely affect our business or operations.
In order to reduce exhaust emissions, some states and municipalities have begun to restrict the locations and amount of time where diesel-powered tractors, such as ours, may idle. These restrictions could force us to alter our drivers' behavior, purchase on-board power units that do not require the engine to idle, or face a decrease in productivity.
From time-to-time, various federal, state, or local taxes are increased, including taxes on fuels. We cannot predict whether, or in what form, any such increase applicable to us will be enacted, but such an increase could adversely affect our profitability.
The FMCSA has proposed new rules that will require nearly all carriers, including us, to install and use EOBRs in our tractors to electronically monitor tractor miles and enforce hours-of-service. Such installation could cause an increase in driver turn-over, information that can be used in litigation, cost increases, and decreased asset utilization.
In the aftermath of the September 11, 2001 terrorist attacks, federal, state, and municipal authorities implemented and continue to implement various security measures, including checkpoints and travel restrictions on large tractors. The TSA has adopted regulations that require determination by the TSA that each driver who applies for or renews his or her license for carrying hazardous materials is not a security threat. This could reduce the pool of qualified drivers, which could require us to increase driver compensation, limit fleet growth, or let tractors sit idle. These regulations also could complicate the matching of available equipment with hazardous material shipments, thereby increasing our response time and our non-revenue miles on customer orders. As a result, it is possible that we may fail to meet the needs of our customers or may incur increased expenses to do so. These security measures could negatively impact our operating results.
CSA could adversely affect our profitability and operations, our ability to maintain or grow our fleet, and our customer relationships.
In December 2010, the FMCSA launched CSA, a new enforcement and compliance model implementing driver standards in addition to our current standards. Under CSA, drivers and fleets are evaluated and ranked based on certain safety-related standards. The methodology for determining a carrier's DOT safety rating has been expanded to include the on-road safety performance of the carrier's drivers. As a result, certain current and potential drivers may no longer be eligible to drive for us, our fleet could be ranked poorly as compared to our peer carriers, and our safety rating could be adversely impacted. We recruit and retain first-time drivers to be part of our fleet, and these drivers may have a higher likelihood of creating adverse safety events under CSA. A reduction in eligibleThe occurrence of future deficiencies could affect driver recruitment by causing high-quality drivers to seek employment with other carriers or a poor fleet ranking may result in difficulty attracting and retaining qualified drivers, and could cause our customers to direct their business away from us and to carriers with higher fleet safety rankings, either of which would adversely affect our results of operations. Additionally, competition for drivers with favorable safety ratings may increase and thus could necessitate increases in driver-related compensation costs. Further, we may incur greater than expected expenses in our attempts to improve our scores or as a result of those scores.
Certain of our subsidiaries have exceeded the established intervention thresholds in a number of the seven safety-related standards. Based on these unfavorable ratings, we may be prioritized for an intervention action or roadside inspection, either of which could adversely affect our results of operations. In addition, customers may be less likely to assign loads to us. We have put new maintenance management and procedures in place in an attempt to address maintenance issues that were cited.areas where we have exceeded the thresholds. However, we cannot assure you these measures will be effective.
The FMCSA also is considering revisions to the existing rating system and the safety labels assigned to motor carriers evaluated by the DOT. We currently have a satisfactory DOT rating, which is the highest available rating under the current safety rating scale. If we were to receive a conditional or unsatisfactory DOT safety rating, it could adversely affect our business as customer contracts may require a satisfactory DOT safety rating, and a conditional or unsatisfactory rating could negatively impact or restrict our operations. Under the revised rating system being considered by the FMCSA, our safety rating would be evaluated more regularly, and our safety rating would reflect a more in-depth assessment of safety-based violations.
Increased prices, reduced productivity, and scarcity of financing for new revenue equipment may adversely affect our earnings and cash flows.
We are subject to risk with respect to higher prices for new tractors. Prices have increased and may continue to increase, due, in part, to government regulations applicable to newly manufactured tractors and diesel engines and due to the pricing power amongdiscretion of equipment manufacturers. More restrictive EPA emissions standards have required vendors to introduce new engines. Compliance with such regulations has increased the cost of our new tractors and could impair equipment productivity, lower fuel mileage, and increase our operating expenses. These adverse effects, combined with the uncertainty as to the reliability of the vehicles equipped with the newly designed diesel engines and the residual values realized from the disposition of these vehicles, could increase our costs or otherwise adversely affect our business or operations as the regulations become effective.
We have a combination of agreements and non-binding statements of indicative trade values covering the terms of trade-in commitments from our primary equipment vendors for disposal of a portion of our revenue equipment. From time-to-time, prices we expect to receive under these arrangements may be higher than the prices we would receive in the open market. We may suffer a financial loss upon disposition of our equipment if these vendors refuse or are unable to meet their financial obligations under these agreements, if we fail todo not enter into definitive agreements consistent with the indicative trade values, if we fail to or are unable to enter into similar arrangements in the future, or if we do not purchase the required number of replacement units from the vendors.vendors required for such trade-ins.
If we are unable to retain our key employees, our business, financial condition, and results of operations could be harmed.
We are highly dependent upon the services of the following key employees: David R. Parker, our Chairman of the Board, Chief Executive Officer, and President and Joey B. Hogan, our Senior Executive Vice President and Chief Operating Officer. We currently do not have employment agreements with Messrs. Parker or Hogan. The loss of any of their services could negatively impact our operations and future profitability. We must continue to develop and retain a core group of managers if we are to continue to improve our profitability and have appropriate succession planning for key management personnel.
We may not make acquisitions in the future, or if we do, we may not be successful in our acquisition strategy.
We made ten acquisitions between 1996 and 2006. Accordingly, acquisitions have provided a substantial portion of our growth. We may not have the financial capacity or be successful in identifying, negotiating, or consummating any future acquisitions. If we fail to make any future acquisitions, our historical growth rate could be materially and adversely affected. Any acquisitions we undertake could involve the dilutive issuance of equity securities and/or incurring indebtedness. In addition, acquisitions involve numerous risks, including difficulties in assimilating the acquired company's operations, the diversion of our management's attention from other business concerns, risks of entering into markets in which we have had no or only limited direct experience, and the potential loss of customers, key employees, and drivers of the acquired company, all of which could have a materially adverse effect on our business and operating results. If we make acquisitions in the future, we may not be able to successfully integrate the acquired companies or assets into our business.
TEL faces certain additional risks particular to its operations, any one of which could adversely affect our operating results.
On May 31, 2011, we acquired a 49% interest in Transport Enterprise Leasing, LLC ("TEL"),TEL, a used equipment leasing company and reseller. We account for our investment in TEL using the equity method of accounting. TEL faces several risks similar to those we face and additional risks particular to its business and operations. The ability to secure financing and market fluctuations in interest rates could impact TEL’s ability to grow its leasing business and its margins on leases. Adverse economic activity may restrict the number of used equipment buyers and their ability to pay prices for used equipment that we find acceptable. Further, we believe the used equipment market will significantly impact TEL's results of operations and such market has been volatile in the past. There can be no assurance that TEL will experience gains on sale similar to those it has experienced in the past and it may incur losses on sale. As regulations change, the market for used equipment may be impacted as such regulatory changes may make used equipment costly to upgrade to comply with such regulations or we may be forced to scrap equipment if such regulations eliminate the market for particular used equipment.
Under the purchase agreement we entered into, TEL's majority owners are eligible to receive an earn-out over two years and we have an option to acquire 100% of TEL.TEL between January 1, 2013 and May 31, 2016. If the earn-out is met or we exercise the option, we believe our total leverage would increase. Further, there is an overlap in providers of equipment financing to TEL and our wholly owned operations and those providers may consider the combined exposure and limit the amount of credit available to us.
Finally, we do not control TEL's ownership or management. Our investment in TEL is subject to the risk that TEL’s management and controlling members may make business, financial, or management decisions with which we do not agree or that the management or controlling members may take risks or otherwise act in a manner that does not serve our interests. If any of the foregoing were to occur, the value of our investment in TEL could decrease, and our financial condition, results of operations, and cash flow could suffer as a result.
We are exposed to risks related to our receivables factoring arrangements.
We engage in receivables factoring arrangements pursuant to which our clients, consisting of smaller trucking companies, factor their receivables to us for a fee to facilitate faster cash flow. We advance 80% to 90% of each receivable factored and retain the remainder as collateral for collection issues that might arise. The retained amounts are returned to the clients after the related receivable has been collected. We evaluate each client’s customer base and only factor specific receivables that meet predefined criteria. These factored receivables are generally unsecured, except when personal guarantees are received. While we have procedures to monitor and limit exposure to credit risk on these receivables, there can be no assurance such procedures will continue to effectively limit collection risk and avoid losses. We periodically assess the credit risk of our client’s customers and regularly monitor the timeliness of payments. Slowdowns, bankruptcies, or financial difficulties within the markets our clients serve may impair the financial condition of one or more of our client’s customers and may hinder such customers’ ability to pay the factored receivables on a timely basis or at all. If any of these difficulties are encountered, our cash flows and results of operations could be adversely impacted.
Our Chief Executive Officer and President and his wife control a large portion of our stock and have substantial control over us, which could limit other stockholders' ability to influence the outcome of key transactions, including changes of control.
Our Chairman of the Board, Chief Executive Officer, and President, David Parker, and his wife, Jacqueline Parker, our Chief Strategy Officer, beneficially own approximately 27% of our outstanding Class A common stock and 100% of our Class B common stock. On all matters with respect to which our stockholders have a right to vote, including the election of directors, each share of Class A common stock is entitled to one vote, while each share of Class B common stock is entitled to two votes. All outstanding shares of Class B common stock are owned by the Parkers and are convertible to Class A common stock on a share-for-share basis at the election of the Parkers or automatically upon transfer to someone outside of the Parker family. This voting structure gives the Parkers approximately 47% of the voting power of all of our outstanding stock. The Parkers are able to substantially influence decisions requiring stockholder approval, including the election of our entire board of directors, the adoption or extension of anti-takeover provisions, mergers, and other business combinations. This concentration of ownership could limit the price that some investors might be willing to pay for the Class A common stock, and could allow the Parkers to prevent or could discourage or delay a change of control, which other stockholders may favor. The interests of the Parkers may conflict with the interests of other holders of Class A common stock, and they may take actions affecting us with which other stockholders disagree.
Seasonality and the impact of weather affect our operations and profitability.
Our tractor productivity decreases during the winter season because inclement weather impedes operations, and some customers reduce their shipments after the winter holiday season. Revenue also can be affected by bad weather and holidays, since revenue is directly related to available working days of shippers. At the same time, operating expenses increase due to declining fuel efficiency because of engine idling and due to harsh weather creating higher accident frequency, increased claims, and more equipment repairs. We also could suffer short-term impacts from weather-related events such as hurricanes, blizzards, ice storms, and floods that could harm our results or make our results more volatile. Weather and other seasonal events could adversely affect our operating results.
None.
Our corporate headquarters and main terminal are located on approximately 180 acres of property in Chattanooga, Tennessee. This facility includes an office building of approximately 182,000 square feet, a maintenance facility of approximately 65,000 square feet, a body shop of approximately 60,000 square feet, and a truck wash. Our Solutions segment is also operated and managed out of the Chattanooga facility. We maintain elevennine terminals, which are utilized by our Truckload segment located on our major traffic lanes in or near the cities listed below. These terminals provide a base for drivers in proximity to their homes, a transfer location for trailer relays on transcontinental routes, parking space for equipment dispatch, and the other uses indicated below.
| | | | |
| Chattanooga, Tennessee | x | x | x | Leased |
| Indianapolis, Indiana | | | | Leased |
| Texarkana, Arkansas | x | x | x | Owned |
| Hutchins, Texas | x | x | | Owned |
French Camp, California | | | | Leased |
Long Beach, California | | | | Owned |
| Pomona, California | | x | | Owned |
| Allentown, Pennsylvania | | | | Owned |
| Nashville, Tennessee | x | x | x | Owned |
| Olive Branch, Mississippi | x | | | Owned |
| Orlando, Florida | | | | Owned |
From time-to-time we are a party to routine litigation arising in the ordinary course of business, most of which involves claims for personal injury and property damage incurred in connection with the transportation of freight. We maintain insurance to cover liabilities arising from the transportation of freight for amounts in excess of certain self-insured retentions.
None.
PART II
ITEM 5. 5. MARKET FOR REGISTRANT'S COMMON EQUITY, RELATED STOCKHOLDER MATTERS AND ISSUER PURCHASES OF EQUITY SECURITIES
Price Range of Common Stock
Our Class A common stock is traded on the NASDAQ Global Select Market, under the symbol "CVTI." The following table sets forth, for the calendar periods indicated, the range of high and low sales price for our Class A common stock as reported by NASDAQ from January 1, 2010,2011, to December 31, 2011.2012.
| Period | High | | Low | High | | Low |
| | | | | |
| Calendar Year 2010: | | | | |
| | | | | |
1st Quarter | $6.45 | | $3.02 | |
2nd Quarter | $8.19 | | $5.90 | |
3rd Quarter | $9.90 | | $6.62 | |
4th Quarter | $9.88 | | $6.63 | |
| | | | | | | |
| Calendar Year 2011: | | | | | | |
| | | | | | | |
1st Quarter | $10.00 | | $8.00 | $10.00 | | $8.00 |
2nd Quarter | $9.86 | | $7.22 | $9.86 | | $7.22 |
3rd Quarter | $7.83 | | $3.60 | $7.83 | | $3.60 |
4th Quarter | $3.69 | | $2.35 | $3.69 | | $2.35 |
| | | | | |
| Calendar Year 2012: | | | | |
| | | | | |
1st Quarter | | $3.70 | | $2.84 |
2nd Quarter | | $3.90 | | $2.92 |
3rd Quarter | | $6.00 | | $3.50 |
4th Quarter | | $5.88 | | $4.25 |
On March 5, 2012,11, 2013, the last reported sale price of our Class A common stock on the NASDAQ Global Select Market was $3.50.$6.30.
As of March 5, 2012,11, 2013, we had approximately 122115 stockholders of record of our Class A common stock; however, we estimate our actual number of stockholders is much higher because a substantial number of our shares are held of record by brokers or dealers for their customers in street names. As of March 5, 2012,11, 2013, Mr. Parker, together with certain of his family members, owned all of the outstanding Class B common stock.
Dividend Policy
We have never declared and paid a cash dividend on our Class A or Class B common stock. It is the current intention of our Board of Directors to continue to retain earnings to finance our business and reduce our indebtedness rather than to pay dividends. The payment of cash dividends is currently limited by our financing arrangements. Future payments of cash dividends will depend upon our financial condition, results of operations, capital commitments, restrictions under then-existing agreements, and other factors deemed relevant by our Board of Directors.
See "Equity Compensation Plan Information" under Item 12 in Part III of this Annual Report on Form 10-K for certain information concerning shares of our Class A common stock authorized for issuance under our equity compensation plans.
Issuer Purchases of Equity Securities
The table below sets forth the information with respect to purchases of our Class A common stock made by or on behalf of us during the quarter ended December 31, 2011:2012:
| | (a) Total Number of Shares Purchased (1) | | | (b) Average Price Paid per Share | | | (c) Total Number of Shares Purchased as Part of Publicly Announced Plans or Programs (2) | | | (d) Maximum Number of Class A Shares that May Yet Be Purchased Under the Publicly Announced Plans or Programs (2) | |
| October 1-31, 2011 | | | - | | | | - | | | | - | | | | - | |
| November 1-30, 2011 | | | - | | | | - | | | | - | | | | - | |
| | | 529 | | | $ | 2.97 | | | | - | | | | - | |
| | | 529 | | | $ | 2.97 | | | | - | | | | - | |
| | (a) Total Number of Shares Purchased (1) | | | (b) Average Price Paid per Share | | | (c) Total Number of Shares Purchased as Part of Publicly Announced Plans or Programs | | | (d) Maximum Number of Class A Shares that May Yet Be Purchased Under the Publicly Announced Plans or Programs | |
| October 1-31, 2012 | | | - | | | | - | | | | - | | | | - | |
| November 1-30, 2012 | | | - | | | | - | | | | - | | | | - | |
| | | 529 | | | $ | 5.10 | | | | - | | | | - | |
| | | 529 | | | $ | 5.10 | | | | - | | | | - | |
| (1) | Includes 529 shares of Class A common stock withheld at an average price of $2.97$5.10 per share (under the terms of grants under the Covenant Transportation Group, Inc. 2006 Omnibus Incentive Plan) to offset tax withholding obligations that occurred upon vesting and release of restricted shares. These were forfeitures that wereThe withholding of shares was permitted under the applicable award agreements and werewas not part of any stock repurchase plan. |
(2) | On May 11, 2005, we announced a $1.3 million Class A common stock repurchase plan pursuant to which shares could be purchased in the open market or through negotiated transactions subject to criteria established by our board of directors. No shares were purchased under this plan during 2009, 2008, or 2007, and the plan expired on June 30, 2009. Our Credit Facility prohibits the repurchase of any shares, except those purchased to offset an employee's minimum statutory withholding requirements upon the vesting of equity awards, without obtaining approval from the lenders. Accordingly, we do not currently have a stock repurchase program in place. |
| (In thousands, except per share and operating data amounts) | (In thousands, except per share and operating data amounts) | | (In thousands, except per share and operating data amounts) | |
| | | Years Ended December 31, | | | Years Ended December 31, | |
| | | 2011 | | | 2010 | | | 2009 | | | 2008 | | | 2007 | | | | | | | | | | | | | | | | |
| Statement of Operations Data: | | | | | | | | | | | | | | | | | | | | | | | | | | | | | | |
| Freight revenue | | $ | 512,026 | | | $ | 546,320 | | | $ | 520,495 | | | $ | 615,810 | | | $ | 602,629 | | | $ | 529,080 | | | $ | 512,026 | | | $ | 546,320 | | | $ | 520,495 | | | $ | 615,810 | |
| Fuel surcharge revenue | | | 140,601 | | | | 103,429 | | | | 68,192 | | | | 158,104 | | | | 109,897 | | | | 145,174 | | | | 140,601 | | | | 103,429 | | | | 68,192 | | | | 158,104 | |
Total revenue | | $ | 652,627 | | | $ | 649,749 | | | $ | 588,687 | | | $ | 773,914 | | | $ | 712,526 | | | $ | 674,254 | | | $ | 652,627 | | | $ | 649,749 | | | $ | 588,687 | | | $ | 773,914 | |
| | | | | | | | | | | | | | | | | | | | | | | | | | | | | | | | | | | | | | | | | |
| Operating expenses: | | | | | | | | | | | | | | | | | | | | | | | | | | | | | | | | | | | | | | | | |
Salaries, wages, and related expenses (4) | | | 211,169 | | | | 216,316 | | | | 220,213 | | | | 268,742 | | | | 275,508 | | | | 217,080 | | | | 211,169 | | | | 216,316 | | | | 220,213 | | | | 268,742 | |
Fuel expense | | | 208,693 | | | | 177,239 | | | | 143,835 | | | | 260,704 | | | | 211,022 | | | | 194,841 | | | | 208,693 | | | | 177,239 | | | | 143,835 | | | | 260,704 | |
Operations and maintenance (4) | | | 43,585 | | | | 42,050 | | | | 40,833 | | | | 48,837 | | | | 46,614 | | | | 45,265 | | | | 43,585 | | | | 42,050 | | | | 40,833 | | | | 48,837 | |
Revenue equipment rentals and purchased transportation | | | 63,353 | | | | 71,474 | | | | 76,484 | | | | 90,974 | | | | 66,515 | | | | 85,010 | | | | 63,353 | | | | 71,474 | | | | 76,484 | | | | 90,974 | |
Operating taxes and licenses | | | 12,148 | | | | 11,090 | | | | 12,113 | | | | 13,078 | | | | 14,112 | | | | 11,043 | | | | 12,148 | | | | 11,090 | | | | 12,113 | | | | 13,078 | |
Insurance and claims (4) | | | 36,163 | | | | 32,648 | | | | 26,531 | | | | 31,200 | | | | 30,214 | | | | 33,707 | | | | 36,163 | | | | 32,648 | | | | 26,531 | | | | 31,200 | |
Communications and utilities | | | 5,137 | | | | 4,974 | | | | 5,740 | | | | 6,702 | | | | 7,377 | | | | 4,809 | | | | 5,137 | | | | 4,974 | | | | 5,740 | | | | 6,702 | |
General supplies and expenses (4) | | | 15,627 | | | | 16,143 | | | | 19,538 | | | | 21,450 | | | | 18,304 | | | | 16,068 | | | | 15,627 | | | | 16,143 | | | | 19,538 | | | | 21,450 | |
Depreciation and amortization, including gains and losses on disposition of equipment and impairment of assets (1) | | | 46,274 | | | | 51,807 | | | | 48,122 | | | | 63,235 | | | | 53,541 | | | | 43,222 | | | | 46,274 | | | | 51,807 | | | | 48,122 | | | | 63,235 | |
Goodwill impairment charge (2) | | | 11,539 | | | | - | | | | - | | | | 24,671 | | | | - | | | | - | | | | 11,539 | | | | - | | | | - | | | | 24,671 | |
| Total operating expenses | | | 653,688 | | | | 623,741 | | | | 593,409 | | | | 829,593 | | | | 723,207 | | | | 651,045 | | | | 653,688 | | | | 623,741 | | | | 593,409 | | | | 829,593 | |
| Operating (loss)income | | | (1,061 | ) | | | 26,008 | | | | (4,722 | ) | | | (55,679 | ) | | | (10,681 | ) | |
| Other (income) expense: | | | | | | | | | | | | | | | | | | | | | |
| Operating income (loss) | | | | 23,209 | | | | (1,061 | ) | | | 26,008 | | | | (4,722 | ) | | | (55,679 | ) |
| Other expense (income): | | | | | | | | | | | | | | | | | | | | | |
Interest expense | | | 16,208 | | | | 16,566 | | | | 14,184 | | | | 10,373 | | | | 12,285 | | | | 12,697 | | | | 16,208 | | | | 16,566 | | | | 14,184 | | | | 10,373 | |
Interest income | | | (32 | ) | | | (2 | ) | | | (144 | ) | | | (435 | ) | | | (477 | ) | | | - | | | | (32 | ) | | | (2 | ) | | | (144 | ) | | | (435 | ) |
Loss on sale of Transplace investment and note receivable (3) | | | - | | | | - | | | | 11,485 | | | | - | | | | - | | | | - | | | | - | | | | - | | | | 11,485 | | | | - | |
Loss on early extinguishment of debt | | | - | | | | - | | | | - | | | | 726 | | | | - | | | | - | | | | - | | | | - | | | | - | | | | 726 | |
Other | | | (123 | ) | | | (20 | ) | | | (199 | ) | | | (160 | ) | | | (183 | ) | | | (13 | ) | | | (123 | ) | | | (20 | ) | | | (199 | ) | | | (160 | ) |
| Other expenses, net | | | 16,053 | | | | 16,544 | | | | 25,326 | | | | 10,504 | | | | 11,625 | | | | 12,684 | | | | 16,053 | | | | 16,544 | | | | 25,326 | | | | 10,504 | |
| Equity in income of affiliate | | | 675 | | | | - | | | | - | | | | - | | | | - | | | | 1,875 | | | | 675 | | | | - | | | | - | | | | - | |
| (Loss) income before income taxes | | | (16,439 | ) | | | 9,464 | | | | (30,048 | ) | | | (66,183 | ) | | | (22,306 | ) | |
| Income tax (benefit) expense | | | (2,172 | ) | | | 6,175 | | | | (5,018 | ) | | | (12,792 | ) | | | (5,580 | ) | |
| Net (loss) income | | $ | (14,267 | ) | | $ | 3,289 | | | $ | (25,030 | ) | | $ | (53,391 | ) | | $ | (16,726 | ) | |
| Income (loss) before income taxes | | | | 12,400 | | | | (16,439 | ) | | | 9,464 | | | | (30,048 | ) | | | (66,183 | ) |
| Income tax expense (benefit) | | | | 6,335 | | | | (2,172 | ) | | | 6,175 | | | | (5,018 | ) | | | (12,792 | ) |
| Net income (loss) | | | $ | 6,065 | | | $ | (14,267 | ) | | $ | 3,289 | | | $ | (25,030 | ) | | $ | (53,391 | ) |
| (1) | Includes a $15,791 pre-tax impairment charge related to revenue equipment in 2008. |
| (2) | Represents non-cash impairment charges to write off the goodwill in our truckload segment. See the discussion below under "Additional Information Concerning Non-Cash Charges" for a more extensive description of the impairment in 2011. |
| (3) | Represents a non-cash loss on sale of investment in Transplace, Inc. ("Transplace") and a related receivable. See the discussion below under "Additional Information Concerning Non-Cash Charges" for a more extensive description. |
(4) | Certain reclassifications have been made to the 2010, 2009, 2008 and 2007 consolidated financial statements to conform to the 2011 presentation, including reclassifying amounts from general supplies and expenses to salaries, wages, and related expenses related to agent fees and contract labor and reclassifying amounts from insurance and claims to operations and maintenance related to a change in the threshold used to classify certain over-the-road damage not specifically related to an accident. The reclassifications did not affect the previously reported stockholders' equity or net income (loss).
|
| Basic income (loss) per share | | $ | 0.41 | | | $ | (0.97 | ) | | $ | 0.23 | | | $ | (1.77 | ) | | $ | (3.80 | ) |
| | | | | | | | | | | | | | | | | | | | | |
| Diluted income (loss) per share | | $ | 0.41 | | | $ | (0.97 | ) | | $ | 0.23 | | | $ | (1.77 | ) | | $ | (3.80 | ) |
| | | | | | | | | | | | | | | | | | | | | |
| Basic weighted average common shares outstanding | | | 14,742 | | | | 14,689 | | | | 14,374 | | | | 14,124 | | | | 14,038 | |
| | | | | | | | | | | | | | | | | | | | | |
| Diluted weighted average common shares outstanding | | | 14,808 | | | | 14,689 | | | | 14,505 | | | | 14,124 | | | | 14,038 | |
| Basic (loss) income per share | | $ | (0.97 | ) | | $ | 0.23 | | | $ | (1.77 | ) | | $ | (3.80 | ) | | $ | (1.19 | ) |
| | | | | | | | | | | | | | | | | | | | | |
| Diluted (loss) income per share | | $ | (0.97 | ) | | $ | 0.23 | | | $ | (1.77 | ) | | $ | (3.80 | ) | | $ | (1.19 | ) |
| | | | | | | | | | | | | | | | | | | | | |
| Basic weighted average common shares outstanding | | | 14,689 | | | | 14,374 | | | | 14,124 | | | | 14,038 | | | | 14,018 | |
| | | | | | | | | | | | | | | | | | | | | |
| Diluted weighted average common shares outstanding | | | 14,689 | | | | 14,505 | | | | 14,124 | | | | 14,038 | | | | 14,018 | |
| | | Years Ended December 31, | | | Years Ended December 31, | |
| | | 2011 | | | 2010 | | | 2009 | | | 2008 | | | 2007 | | | | | | | | | | | | | | | | |
| Selected Balance Sheet Data: | | | | | | | | | | | | | | | | | | | | | | | | | | | | | | |
| Net property and equipment | | $ | 322,303 | | | $ | 323,954 | | | $ | 278,335 | | | $ | 236,018 | | | $ | 247,530 | | | $ | 279,017 | | | $ | 322,303 | | | $ | 323,954 | | | $ | 278,335 | | | $ | 236,018 | |
| Total assets | | $ | 439,825 | | | $ | 441,179 | | | $ | 398,312 | | | $ | 393,676 | | | $ | 439,794 | | | $ | 400,232 | | | $ | 439,825 | | | $ | 441,179 | | | $ | 398,312 | | | $ | 393,676 | |
| Long-term debt and capital lease obligations, less current maturities | | $ | 144,296 | | | $ | 155,381 | | | $ | 146,556 | | | $ | 107,956 | | | $ | 86,467 | | | $ | 109,217 | | | $ | 144,296 | | | $ | 155,381 | | | $ | 146,556 | | | $ | 107,956 | |
| Total stockholders' equity | | $ | 87,055 | | | $ | 100,698 | | | $ | 94,675 | | | $ | 118,820 | | | $ | 172,266 | | | $ | 94,673 | | | $ | 87,055 | | | $ | 100,698 | | | $ | 94,675 | | | $ | 118,820 | |
| | | | | | | | | | | | | | | | | | | | | | | | | | | | | | | | | | | | | | | | | |
| Selected Operating Data: | | | | | | | | | | | | | | | | | | | | | | | | | | | | | | | | | | | | | | | | |
| Average freight revenue per loaded mile (1) | | $ | 1.53 | | | $ | 1.45 | | | $ | 1.42 | | | $ | 1.53 | | | $ | 1.52 | | | $ | 1.63 | | | $ | 1.53 | | | $ | 1.45 | | | $ | 1.42 | | | $ | 1.53 | |
| Average freight revenue per total mile (1) | | $ | 1.38 | | | $ | 1.31 | | | $ | 1.27 | | | $ | 1.36 | | | $ | 1.36 | | | $ | 1.47 | | | $ | 1.38 | | | $ | 1.31 | | | $ | 1.27 | | | $ | 1.36 | |
| Average freight revenue per tractor per week (1) | | $ | 3,069 | | | $ | 3,137 | | | $ | 2,920 | | | $ | 3,105 | | | $ | 3,088 | | | $ | 3,322 | | | $ | 3,069 | | | $ | 3,137 | | | $ | 2,920 | | | $ | 3,105 | |
| Average miles per tractor per year | | | 115,775 | | | | 125,178 | | | | 119,836 | | | | 118,992 | | | | 118,159 | | | | 118,103 | | | | 115,775 | | | | 125,178 | | | | 119,836 | | | | 118,992 | |
| Weighted average tractors for year (2) | | | 3,029 | | | | 3,099 | | | | 3,111 | | | | 3,456 | | | | 3,623 | | | | 2,895 | | | | 3,029 | | | | 3,099 | | | | 3,111 | | | | 3,456 | |
| Total tractors at end of period (2) | | | 2,978 | | | | 3,087 | | | | 3,113 | | | | 3,292 | | | | 3,555 | | | | 2,884 | | | | 2,978 | | | | 3,087 | | | | 3,113 | | | | 3,292 | |
| Total trailers at end of period (3) | | | 7,361 | | | | 7,332 | | | | 8,005 | | | | 8,277 | | | | 8,667 | | | | 6,904 | | | | 7,361 | | | | 7,332 | | | | 8,005 | | | | 8,277 | |
| (1) | Excludes fuel surcharge revenue. |
| (2) | Includes monthly rental tractors and tractors provided by independent contractors. |
| (3) | Excludes monthly rental trailers. |
The information set forth above should be read in conjunction with "Management’s Discussion and Analysis of Financial Condition and Results of Operations" and the Company’s consolidated financial statements and notes thereto included in Items 7 and 8, respectively, of this Form 10-K.
ITEM 7. MANAGEME7NT'S. MANAGEMENT'S DISCUSSION AND ANALYSIS OF FINANCIAL CONDITION AND RESULTS OF OPERATIONS
Cautionary Note Regarding Forward-Looking Statements
Item 7, as well as other items of this Annual Report, contains certain statements that may be considered forward-looking statements within the meaning of Section 27A of the Securities Act of 1933, as amended, and Section 21E of the Securities Exchange Act of 1934, as amended, and such statements are subject to the safe harbor created by those sections.sections and the Private Securities Litigation Reform Act of 1995, as amended. All statements, other than statements of historical or current fact, are statements that could be deemed forward-looking statements, including without limitation: any projections of earnings, revenues, or other financial items; any statement of plans, strategies, and objectives of management for future operations; any statements concerning proposed new services or developments; any statements regarding future economic conditions or performance; and any statements of belief and any statements of assumptions underlying any of the foregoing. Such statements may be identified by thetheir use of terms or phrases such as "believe," "may," "could," "expects," "estimates," "projects," "anticipates," "plans," "intends," and similar terms and phrases. Forward-looking statements are based on currently available operating, financial, and competitive information. Forward-looking statements are inherently subject to risks and uncertainties, some of which cannot be predicted or quantified, which could cause future events and actual results to differ materially from those set forth in, contemplated by, or underlying the forward-looking statements. Factors that could cause or contribute to such differences include, but are not limited to, those discussed in the section entitled "Item 1A. Risk Factors," set forth above. Readers should review and consider the factors discussed in "Item 1A. Risk Factors," along with various disclosures in our press releases, stockholder reports, and other filings with the Securities and Exchange Commission.
All such forward-looking statements speak only as of the date of this Annual Report. You are cautioned not to place undue reliance on such forward-looking statements. We expressly disclaim any obligation or undertaking to release publicly any updates or revisions to any forward-looking statements contained herein to reflect any change in our expectations with regard thereto or any change in the events, conditions, or circumstances on which any such statement is based.
EXECUTIVE OVERVIEW
Solid execution of our plan contributed to enhanced asset productivity and our best financial performance since 2003. Key factors in the improvement were improved network yields, a higher percentage of seated trucks, and a higher team-driven truck fleet both overall and as a percentage of the fleet. Our sales, operations, and driving personnel improved their execution of the business, and we allocated capital to maintain or grow our capacity in our expedited and refrigerated service offerings, while reducing capacity in our dedicated and regional service offerings. Also, all significant problems associated with the Covenant Transport conversion to the new enterprise management system in the third quarter of 2011 were addressed by the end of January 2012 and efficiencies from the new system began to be realized in 2012.
Compared to the year ended December 31 2011, our asset-based division's revenue, excluding fuel surcharge revenue, increased 3.7% due to an 8.3% increase in average freight revenue per tractor per week, offset by a 4.4% decrease in average tractors. Our miles per truck were up 2.0% as compared to 2011, while average freight revenue per total mile was up 8.9 cents per mile or 6.4%. These improvements more than overcame higher operating costs.
Additional items of note for the year ended December 31, 2012 include the following:
| • | Operating income was $23.2 million, compared with an operating loss of $1.1 million for 2011. Operating income in 2012 included a $2.4 million gain on disposition of real estate, a $4.0 million benefit from commutation of an insurance policy, and a $3.1 million gain on fuel hedging. Operating loss in 2011 included an $11.5 million charge for goodwill impairment and a $1.9 million gain on fuel hedging; |
| • | Net income was $6.1 million, or $0.41 per basic and diluted share, compared with net loss of $14.3 million, or ($0.97) per basic and diluted share, for 2011. Net loss for 2011 included pre-tax non-cash goodwill impairment charges of $11.5 million, or ($0.64) per share; |
| • | Since December 31, 2011, aggregate lease-adjusted indebtedness (which includes the present value of off-balance sheet lease obligations), net of cash, decreased by approximately $54.5 million to $242.4 million; |
| • | Stockholders' equity at December 31, 2012, was $94.7 million and our tangible book value was $94.1 million, or $6.38 per basic share; and |
| • | Our equity investment in TEL provided $1.9 million of pre-tax earnings in 2012 compared to $0.7 million for the seven months ended December 31, 2011. |
During 2013, we intend to continue our emphasis on (i) allocation of assets towards service offerings with better returns on invested capital, such as refrigerated and expedited/high-value team operations, (ii) increasing our use of owner-operators, (iii) coordinating efforts among all of our operating companies, (iv) reducing leverage, and (v) improving our drivers' employment experience.
While the pace of economic growth remains uncertain and the driver market is extremely tight, we believe the trucking economy’s freight demand and capacity remain closely in balance. Regulatory issues, increasing costs and the tight driver market pose substantial challenges to the trucking industry. These factors also have limited trucking capacity to an extent that yield improvements have been and should continue to be available in markets with solid demand to carriers with excellent customer service. We believe a combination of these company-specific initiatives and steady improvement in the overall economic and freight environments will afford us the opportunity for continued year-over-year improvements in profitability and stockholder value. Headwinds for 2013 include a small number of significant claims incurred early in 2013, the sale of real estate in the first quarter of 2012 that provided a $2.4 million gain, and the commutation of an insurance policy in the second quarter of 2012 that provided a benefit of $4.0 million to insurance and claims, net of $0.5 million in reserves established on claims previously covered by the policy becoming our responsibility when the policy was commuted. As a result, we expect earnings comparisons in the first half of 2013 to be negative compared with 2012, then becoming positive in the second half of 2013.
RESULTS OF CONSOLIDATED OPERATIONS
The following table sets forth the percentage relationship of certain items to total revenue and freight revenue:
| | | | | | | | | | | | | | | | | | | | |
| | | | | | | | | | | | | | | | | | | | |
| Total revenue | | | 100.0 | % | | | 100.0 | % | | | 100.0 | % | Freight revenue (1) | | | 100.0 | % | | | 100.0 | % | | | 100.0 | % |
| Operating expenses: | | | | | | | | | | | | | Operating expenses: | | | | | | | | | | | | |
Salaries, wages, and related expenses | | | 32.2 | | | | 32.3 | | | | 33.2 | | Salaries, wages, and related expenses | | | 41.0 | | | | 41.2 | | | | 39.6 | |
Fuel expense | | | 28.9 | | | | 32.0 | | | | 27.3 | | Fuel expense (1) | | | 9.4 | | | | 13.3 | | | | 13.5 | |
Operations and maintenance | | | 6.7 | | | | 6.7 | | | | 6.5 | | Operations and maintenance | | | 8.5 | | | | 8.5 | | | | 7.7 | |
Revenue equipment rentals and purchased transportation | | | 12.6 | | | | 9.7 | | | | 11.0 | | Revenue equipment rentals and purchased transportation | | | 16.1 | | | | 12.4 | | | | 13.1 | |
Operating taxes and licenses | | | 1.7 | | | | 1.9 | | | | 1.7 | | Operating taxes and licenses | | | 2.1 | | | | 2.4 | | | | 2.0 | |
Insurance and claims | | | 5.0 | | | | 5.5 | | | | 5.0 | | Insurance and claims | | | 6.4 | | | | 7.1 | | | | 6.0 | |
Communications and utilities | | | 0.7 | | | | 0.8 | | | | 0.8 | | Communications and utilities | | | 0.9 | | | | 1.0 | | | | 0.9 | |
General supplies and expenses | | | 2.4 | | | | 2.4 | | | | 2.5 | | General supplies and expenses | | | 3.0 | | | | 3.0 | | | | 2.9 | |
Depreciation and amortization (2) | | | 6.4 | | | | 7.1 | | | | 8.0 | | Depreciation and amortization (2) | | | 8.2 | | | | 9.0 | | | | 9.5 | |
Goodwill impairment (3) | | | - | | | | 1.8 | | | | - | | Goodwill impairment (3) | | | - | | | | 2.3 | | | | - | |
| Total operating expenses | | | 96.6 | | | | 100.2 | | | | 96.0 | | Total operating expenses | | | 95.6 | | | | 100.2 | | | | 95.2 | |
| Operating income (loss) | | | 3.4 | | | | (0.2 | ) | | | 4.0 | | Operating income (loss) | | | 4.4 | | | | (0.2 | ) | | | 4.8 | |
| Other expense, net | | | 1.9 | | | | 2.5 | | | | 2.5 | | Other expense, net | | | 2.4 | | | | 3.1 | | | | 3.0 | |
| Equity in income of affiliate | | | 0.3 | | | | 0.1 | | | | - | | Equity in income of affiliate | | | 0.3 | | | | 0.1 | | | | - | |
| Income (loss) before income taxes | | | 1.8 | | | | (2.6 | ) | | | 1.5 | | Income (loss) before income taxes | | | 2.3 | | | | (3.2 | ) | | | 1.8 | |
| Income tax expense (benefit) | | | 0.9 | | | | (0.3 | ) | | | 1.0 | | Income tax expense (benefit) | | | 1.2 | | | | (0.4 | ) | | | 1.2 | |
| Net income (loss) | | | 0.9 | % | | | (2.2 | )% | | | 0.5 | % | Net income (loss) | | | 1.1 | % | | | (2.8 | )% | | | 0.6 | % |
| (1) | Freight revenue is total revenue less fuel surcharges. In this table, fuel surcharges are eliminated from revenue and subtracted from fuel expense. The amounts were $145.2 million, $140.6 million, and $103.4 million in 2012, 2011, and 2010, respectively. |
| (2) | Includes a gain on the sale of property and equipment totaling $4.9 million, $6.7 million, and $4.3 million in 2012, 2011, and 2010, respectively. |
| (3) | Represents an $11.5 million non-cash impairment charge to write off the remaining goodwill in our truckload segment associated with several acquisitions that we made prior to 2001. |
Comparison of Year Ended December 31, 2012 to Year Ended December 31, 2011
Revenue
For the year ended December 31, 2012, total revenue increased $21.7 million, or 3.3%, to $674.3 million from $652.6 million in 2011. Freight revenue increased $17.1 million, or 3.3%, to $529.1 million in the year ended December 31, 2012, from $512.0 million in 2011. The increase resulted from an $18.2 million increase in freight revenue from our Truckload segment, while our Solutions segment's freight revenue decreased $1.1 million. Fuel surcharge revenue increased $4.6 million, or 3.3%, to $145.2 million at December 31, 2012, from $140.6 million at December 31, 2011.
The increase in Truckload freight revenue relates to an increase in average freight revenue per tractor per week to $3,322 during the 2012 period from $3,069 during the 2011 period. Average freight revenue per total mile increased by 8.9 cents per mile, or 6.4%, compared to the 2011 period, while average miles per unit increased by 2.0%. Rates have continued to increase as a result of increases required to offset increasing costs, including driver pay, and supply and demand dynamics. The main factors favorably impacting utilization were the percentage of our fleet which was manned, the percentage of our fleet comprised of team-driven tractors, and overcoming certain inefficiencies that resulted from the system implementation at our Covenant Transport subsidiary in the second half of 2011. These increases were partially offset by a 4.4% decrease of our average tractor fleet. Revenue and rates were positively impacted in the third and fourth quarters of 2012 as a result of project work related to hurricane Isaac and super storm Sandy. Revenue specific to these disasters was approximately $3.0 million and our rates were positively impacted by approximately 2.0 cents per mile for the second half of 2012.
The decrease in Solutions' revenue related primarily to a special project in 2011, where Solutions handled the nationwide launch of Allegra to the over-the-counter market, and the loss of a large agent in January 2012.
For comparison purposes in the discussion below, we use freight revenue (total revenue less fuel surcharge revenue) when discussing changes as a percentage of revenue. We believe removing this sometimes volatile source of revenue affords a more consistent basis for comparing the results of operations from period-to-period.
Salaries, wages, and related expenses
Salaries, wages, and related expenses as a percentage of freight revenue declined as compared to the 2011 period. This decline is primarily related to the increase in the percentage of our fleet comprised of independent contractors, since they generate a similar amount of revenue per truck, while the payments to them are included in the purchased transportation line item. Driver pay increased approximately 2.6 cents per company tractor mile due to driver pay adjustments and the fixed nature of certain of our pay to student drivers and other driver incentives. Non-driver wages have also increased as a result of incentive compensation tied to our results of operations. Workers’ compensation expense was higher in 2012 at 2.8 cents per company mile, compared to 2.6 cents in 2011, as a result of adverse claims development. We expect driver pay may further increase per company mile as we look to reduce the number of unseated trucks in our fleet and given the tight market for drivers. We are continuing our objective of growing our independent contractor fleet as a percentage of our total fleet. Increasing independent contractor capacity has shifted (and assuming all other factors remain equal, is expected to continue to shift) expenses to the purchased transportation line item with offsetting reductions in employee driver wages and related expenses, net of fuel (as independent contractors generate fuel surcharge revenue, while the related cost of their fuel is included with their compensation in purchased transportation), maintenance, and capital costs.
Fuel expense
Fuel expense as a percentage of freight revenue decreased as compared to the 2011 period. This decline is primarily related to the increase in the percentage of our fleet comprised of independent contractors, since they generate a similar amount of revenue per truck, while the cost of their fuel is included in the amounts paid to them as purchased transportation, discussed below. We receive a fuel surcharge on our loaded miles from most shippers; however, this does not cover the entire increase in fuel prices for several reasons, including the following: surcharges cover only loaded miles; surcharges do not cover miles driven out-of-route by our drivers; and surcharges typically do not cover refrigeration unit fuel usage or fuel burned by tractors while idling. Moreover, most of our shipments obtained from freight brokers did not carry a fuel surcharge. Finally, fuel surcharges vary in the percentage of reimbursement offered, and not all surcharges fully compensate for fuel price increases even on loaded miles.
The rate of fuel price increases also can have an impact on results. Most fuel surcharges are based on the average fuel price as published by the DOE for the week prior to the shipment, meaning we typically bill customers in the current week based on a previous week's applicable index. Therefore, in times of increasing fuel prices, we do not recover as much as we are currently paying for fuel. In periods of declining prices, the opposite is true. The DOE's national average cost of diesel fuel increased 13.2 cents per gallon (or 3.4%) in 2012, compared with 2011. Although fuel prices were higher in 2012, a combination of better fuel surcharge recovery, higher miles per gallon, and more gains from hedging resulted in 3.0 cents per company mile decrease in our per mile cost of fuel, net of company truck fuel surcharge compared with 2011.
Additionally, a $3.1 million gain was reclassified from accumulated other comprehensive income to results of operations, as a reduction in fuel expense, during the year ended December 31, 2012 related to gains on contracts that expired or were sold and for which we completed the transaction by purchasing the hedged diesel fuel. Our fuel hedging program provided for a $1.9 million reduction in fuel expense during 2011.
We expect to continue managing our idle time and truck speeds, investing in more fuel-efficient tractors to improve our fuel miles per gallon, locking in fuel hedges when deemed appropriate, and negotiating with customers to adjust fuel surcharge programs that are inadequate to recover a fair portion of rising fuel costs. Going forward, our net fuel expense is expected to fluctuate as a percentage of revenue based on factors such as diesel fuel prices, percentage recovered from fuel surcharge programs, percentage of uncompensated miles, percentage of revenue generated by independent contractors, percentage of revenue generated by team-driven tractors (which tend to generate higher miles and lower revenue per mile, thus proportionately more fuel cost as a percentage of revenue), percentage of revenue generated by refrigerated operation (which use diesel fuel for refrigeration but usually do not recover fuel surcharges on refrigeration fuel), and the success of fuel efficiency initiatives.
Revenue equipment rentals and purchased transportation
The increase in revenue equipment rentals and purchased transportation as a percentage of freight revenue in 2012 from 2011 was a result of a $15.8 million increase in payments to independent contractors and a $4.7 million increase in tractor and trailer equipment rental expense. For the period ended December 31, 2012, miles run by independent contractors increased to 8.7% of our total miles from 5.4% for the same period of 2011. We financed approximately 607 tractors and 3,816 trailers under operating leases at December 31, 2012, compared with 350 tractors and 4,363 trailers under operating leases at December 31, 2011. In the last year, we have reduced our trailer fleet in order to better match our current number of tractors. The increase in payments to independent contractors in 2012 from 2011 is mainly due to an increase in the size of the independent contractor fleet and the increase in fuel surcharges passed through that are a component of the related expense. We expect this expense category to fluctuate with the number of loads hauled by independent contractors and handled by Solutions and the percentage of our fleet financed with operating leases, as well as the amount of fuel surcharge revenue passed through to the independent contractors and third-party carriers. If capacity remains tight, we believe we may need to increase the amounts we pay to independent contractors and third-party transportation providers, which could increase this expense category as a percentage of freight revenue absent an offsetting increase in revenue. Additionally, we are actively recruiting independent contractors, and, as such, we expect the percentage of independent contractors in our fleet to grow in 2013.
Operating taxes and licenses
Operating taxes and licenses decreased in the aggregate and as a percentage of freight revenue due to the reduction in the average tractor count by 134 units when comparing 2012 to 2011, including the addition of an average of approximately 84 additional owner operator units since the end of 2011. The combination provides for approximately 218 fewer company units on which taxes and licenses are due, while freight revenue increased 3.3% as a result of higher rates and utilization. Additionally, the fluctuation is the result of the costs having a high fixed component.
EXECUTIVE OVERVIEWInsurance and claims
Insurance and claims, consisting primarily of premiums and deductible amounts for liability, physical damage, and cargo damage insurance and claims, decreased in the 2012 period when compared to the 2011 period as a percentage of freight revenue. Insurance and claims per mile cost decreased to 9.8 cents per mile in the 2012 period from approximately 10.0 cents per mile in the 2011 period, primarily due to a credit of $4.0 million of previously expensed premium from our commutation of the April 1, 2011 through March 31, 2012 policy for our primary auto liability insurance. By commuting the policy, we received a credit of a portion of the premium in exchange for taking responsibility for the full amount of claims formerly covered by the policy, which exposes us to additional risk. As a result of a few large accidents during the policy that runs from April 1, 2012 to March 31, 2013, management believes the possibility of commuting the current policy to be remote and as such we expect insurance and claims cost to be higher on a per mile basis in 2013 than 2012. With our significant self-insured retention, insurance and claims expense may fluctuate significantly from period-to-period, and any increase in frequency or severity of claims could adversely affect our financial condition and results of operations.
ComparedDepreciation and amortization
Depreciation and amortization is affected by several items, such as the percentage of our fleet that is owned versus leased or obtained from independent contractors, the gain or loss on disposition of assets, and the values and useful lives of owned assets. Depreciation, consisting primarily of depreciation of revenue equipment and excluding gains and losses, decreased $4.9 million in 2012 from 2011, primarily because owned tractors decreased by 387 due to both our expectations for 2011the use of operating leases and 2010 results, 2011independent contractors. This was a disappointing year. The major items negatively impacting our results were a 7.5% reduction in utilization and increased operating costs, partially offset by increased rates. The declinecost of new tractors. Gains on the disposal of property and equipment, totaling $4.9 million in utilization was2012, including a result$2.4 million gain on the sale of deteriorationa terminal, were $1.8 million lower than 2011 due to fewer units being sold and the used equipment market being less robust in 2012. While we expect continued gains on the sale of our used equipment, assuming no significant changes in the macro-economicmacroeconomic environment and the market segments in which we operate, specifically the West Coast,related supply and an increase in our unseated truck count in 2011 compareddemand of used equipment, such gains for 2013 are expected to 2010 due to capacity constraints in the driver market. These factors were exacerbated by implementation of our upgrade to the hardware and software of our information systems at the Covenant Transport subsidiary and inefficiencies resulting from installing EOBRs in a large portion of our fleet. From a positive standpoint, our pricing improved by 7.5 cents per mile, or 5.7%, when compared to 2010, due to industry pressure for higher rates resulting from higher demand and expected capacity constraints in the next several years, improvements in freight mix, and customer recognition of the combination of services and capacity that we offer.be lower than 2012.
Our asset-based operating costs, net of fuel surcharge revenue, were 11.4 cents per mile higher in 2011 than 2010, net of impairment. The cost increases primarily related to increased driver pay per mile resulting from pay increases instituted in the second half of 2010, increased net fuel expense due to the year-over-year increase in fuel costs, increased workers' compensation expense resulting from unfavorable claims development where new information or settlements led to increased expenses on past claims, an increase in group health insurance expense related to unfavorable claims experience, and an increase in operating and maintenance expense due to inflationary pressures related to tires and vehicle parts and additional maintenance expense we incurred when trucks experiencing lower utilization were able to be scheduled for maintenance. These factors were partially offset by favorable improvement in our frequency of accidents and reduced depreciation and amortization due to a robust used equipment market and less depreciation as a result of slowing depreciation on all units to be sold in 2011. Further, the decrease in utilization negatively impacts our operating costs per mile given inefficiencies resulting from downtime and not covering fixed costs as efficiently.
Our Solutions segment’s margins and business mix improved, which produced $1.7 million of operating income in 2011, compared to $1.5 million in 2010. This improvement came on a 30.6% reduction in revenue.
Goodwill impairment
Based upon a combination of factors that occurred in the third quarter of 2011, including a significant decline in our market capitalization below our book value, a reduction in year-over-year earnings as a result of deterioration in the macro-economic environment and the market segments in which we operate, reductions in current and forecasted earnings estimates, and the need to amend our Credit Facility to remain in compliance with our financial covenants, we recordeddeemed that there had been multiple triggering events that would require an update to the Company’s annual goodwill impairment analysis as of September 30, 2011. This updated analysis provided that the carrying value of both reporting units exceeded their fair values. As a result of the second step of the goodwill impairment analysis, which involves calculating the implied fair value of each reporting unit's goodwill by allocating the fair value of all of its assets and liabilities other than goodwill (including both recognized and unrecognized intangible assets), and comparing the residual amount to the carrying value of goodwill, we determined that the carrying value of both reporting units exceeded the fair value. The non-cash goodwill impairment charge ofamounted to $11.5 million ($9.4 million, net of a $2.1 million income tax benefit) to write off the remaining goodwill associated with several acquisitions that were made prior to 2001. Following this impairment charge, as of September 30, 2011, no goodwill remained on our balance sheet.
Other expense, net
Other expense, net includes interest expense, interest income, and other miscellaneous non-operating items. The non-cashincrease in the cash flow from operations and use of leases as opposed to on-balance sheet financing in the past twelve months resulted in $70.5 million less net debt (debt less cash) at December 31, 2012, when compared to December 31, 2011, and when combined with a reduced weighted average interest rate, interest expense decreased $3.5 million period-over-period. This line item will fluctuate based on our decision with respect to purchasing revenue equipment with balance sheet debt versus operating leases as well as based on our ability to continue to generate profitable results and reduce our leverage. We expect that our weighted average interest rate will likely decrease in the next twelve months due to reductions in the pricing associated with our Credit Facility, resulting from the eighth amendment, which was effective December 31, 2012.
Equity in income of affiliate
We have accounted for our investment in TEL using the equity method of accounting and thus our financial results include our proportionate share of income or $1.9 million for the twelve months ended December 31, 2012 compared to $0.7 million for the seven months ended December 31, 2011. Given TEL's growth over the past three years and volatility in the used and leased equipment markets in which TEL operates, the impact on our earnings resulting from our investment in TEL could be significant.
Income tax expense
The difference in the tax expense recognized in the 2012 period compared to the tax benefit recognized in the 2011 period is primarily related to the $28.8 million increase in the pre-tax income in the 2012 period compared to the 2011 period, resulting from the aforementioned improvements in operating income, reduced interest expense, the goodwill impairment charge does not affect our liquidity, cash flows, day-to-day operations, competitive position, or compliance with our financial covenants in our Credit Facility.
Additional items of note include the following:
| Freight revenue decreased $34.3 million, or 6.3%, to $512.0 million for the year ended December 31, 2011, from $546.3 million in 2010. The decrease resulted from a $22.2 million reduction in freight revenue from our Truckload segment, while our Solutions segment’s freight revenue decreased $12.1 million. |
| Total indebtedness, net of cash and including the present value of off-balance sheet lease obligations, increased by approximately $32.4 million to $296.9 million, since December 31, 2010, while the age of our tractor fleet has remained at 1.6 years. |
| We were in compliance with the amended financial covenants in our Credit Facility at December 31, 2011. |
| We completed on May 31, 2011, the acquisition of a 49.0% equity method investment in Transport Enterprise Leasing, LLC (“TEL”), which provided for $0.7 million of pretax income contribution in 2011. |
| Our equity at December 31, 2011 was $87.1 million and our tangible book value was $86.2 million, or $5.86 per basic share. |
| We recorded an operating loss of $1.1 million and an operating ratio of 100.2%, which includes pre-tax goodwill impairment charges of $11.5 million. This compares with operating income of $26.0 million and an operating ratio of 95.2% for 2010. |
| We recorded a net loss of $14.3 million, or ($0.97) per basic and diluted share, which includes pre-tax non-cash goodwill impairment charges of $11.5 million, or ($0.64) per share. This compares with net income of $3.3 million, or $0.23 per basic and diluted share, in 2010. |
Based on industry-wide tonnage levels and the prevailingincrease in the contribution from TEL’s earnings. The effective tax rate environment,is different from the expected combined tax rate due to permanent differences related to our performance should have been better. We are not generating sufficient revenue per tractordiem pay structure for drivers and the impact of non-deductible portion of the aforementioned goodwill impairment. Due to the partial nondeductible effect of the per diem payments, our tax rate will fluctuate in certain of our operations to justify continued investment at historical levels. While all units have margin improvement potential, our refrigerated, expedited, and logistic units continue to lead us in performance and our dedicated and regional operations have significant ground to make up.future periods as income fluctuates.
Since the beginning of the fourth quarter of 2011, we have been taking a hard look at every aspect of our business. We are developing a plan to increase asset productivity, further reduce costs, and focus future investments in the business units where we see the most promise of adequate returns, while decreasing capital investments elsewhere. We intend to work closely with our customers to determine their needs and which ones we can serve profitably. We believe substantial additional yield improvements must be part of the plan. In the supply-demand environment expected by many industry commentators, we expect to find markets and customers that value our capacity and services.
Our ability to increase both utilization and rates, while maintaining or improving our cost structure along with appropriately allocating resources to markets where we provide value and can thus generate acceptable margins are the keys to the future. Looking forward into 2012, the strength of the economy, inflationary costs (specifically including fuel and driver pay), and the tightening driver market and related impact on our ability to seat trucks are our primary concerns. We are examining the allocation of resources and the size of the overall tractor fleet relative to what we believe are acceptable returns of capital and could again reduce the size of the fleet if margins and results do not improve.
RESULTS OF CONSOLIDATED OPERATIONS
The following table sets forth the percentage relationship of certain items to total revenue and freight revenue:
| | | 2011 | | | 2010 | | | 2009 | | | | | 2011 | | | 2010 | | | 2009 | |
| | | | | | | | | | | | | | | | | | | | | |
| Total revenue | | | 100.0 | % | | | 100.0 | % | | | 100.0 | % | | Freight revenue (1) | | | 100.0 | % | | | 100.0 | % | | | 100.0 | % |
| Operating expenses: | | | | | | | | | | | | | | Operating expenses: | | | | | | | | | | | | |
Salaries, wages, and related expenses | | | 32.3 | | | | 33.2 | | | | 37.4 | | | Salaries, wages, and related expenses | | | 41.2 | | | | 39.6 | | | | 42.3 | |
Fuel expense | | | 32.0 | | | | 27.3 | | | | 24.4 | | | Fuel expense (1) | | | 13.3 | | | | 13.5 | | | | 14.6 | |
Operations and maintenance | | | 6.7 | | | | 6.5 | | | | 6.9 | | | Operations and maintenance | | | 8.5 | | | | 7.7 | | | | 7.8 | |
Revenue equipment rentals and purchased transportation | | | 9.7 | | | | 11.0 | | | | 13.0 | | | Revenue equipment rentals and purchased transportation | | | 12.4 | | | | 13.1 | | | | 14.7 | |
Operating taxes and licenses | | | 1.9 | | | | 1.7 | | | | 2.1 | | | Operating taxes and licenses | | | 2.4 | | | | 2.0 | | | | 2.3 | |
Insurance and claims | | | 5.5 | | | | 5.0 | | | | 4.5 | | | Insurance and claims | | | 7.1 | | | | 6.0 | | | | 5.1 | |
Communications and utilities | | | 0.8 | | | | 0.8 | | | | 1.0 | | | Communications and utilities | | | 1.0 | | | | 0.9 | | | | 1.1 | |
General supplies and expenses | | | 2.4 | | | | 2.5 | | | | 3.3 | | | General supplies and expenses | | | 3.0 | | | | 2.9 | | | | 3.9 | |
Depreciation and amortization (2) | | | 7.1 | | | | 8.0 | | | | 8.2 | | | Depreciation and amortization (2) | | | 9.0 | | | | 9.5 | | | | 9.3 | |
Goodwill impairment (3) | | | 1.8 | | | | - | | | | - | | | Goodwill impairment (3) | | | 2.3 | | | | - | | | | - | |
| Total operating expenses | | | 100.2 | | | | 96.0 | | | | 100.8 | | | Total operating expenses | | | 100.2 | | | | 95.2 | | | | 100.9 | |
| Operating (loss) income | | | (0.2 | ) | | | 4.0 | | | | (0.8 | ) | | Operating (loss) income | | | (0.2 | ) | | | 4.8 | | | | (0.9 | ) |
| Other expense, net (4) | | | 2.5 | | | | 2.5 | | | | 4.3 | | | Other expense, net (4) | | | 3.1 | | | | 3.0 | | | | 4.9 | |
| Equity in income of affiliate | | | 0.1 | | | | - | | | | - | | | Equity in income of affiliate | | | 0.1 | | | | - | | | | - | |
| (Loss) income before income taxes | | | (2.6 | ) | | | 1.5 | | | | (5.1 | ) | | (Loss) income before income taxes | | | (3.2 | ) | | | 1.8 | | | | (5.8 | ) |
| Income tax (benefit) expense | | | (0.3 | ) | | | 1.0 | | | | (0.9 | ) | | Income tax (benefit) expense | | | (0.4 | ) | | | 1.2 | | | | (1.0 | ) |
| Net (loss) income | | | (2.2 | )% | | | 0.5 | % | | | (4.2 | )% | | Net (loss) income | | | (2.8 | )% | | | 0.6 | % | | | (4.8 | )% |
(1) | Freight revenue is total revenue less fuel surcharges. In this table, fuel surcharges are eliminated from revenue and subtracted from fuel expense. The amounts were $140.6 million, $103.4 million, and $68.2 million in 2011, 2010, and 2009, respectively. |
(2) | Includes a gain (loss) on the sale of property and equipment totaling $6.7 million, $4.3 million, and ($0.1) million in 2011, 2010, and 2009, respectively. |
(3) | Represents an $11.5 million non-cash impairment charge to write off the remaining goodwill in our truckload segment associated with several acquisitions that we made prior to 2001. See the discussion below under "Additional Information Concerning Non-Cash Charges" for a more extensive description of this impairment. |
(4) | Includes an $11.5 million non-cash loss on the sale of the investment in and note receivable from Transplace in 2009. See the discussion below under "Additional Information Concerning Non-Cash Charges" for a more extensive description of the loss. |
Comparison of Year Ended December 31, 2011 to Year Ended December 31, 2010
Revenue
For the year ended December 31, 2011, total revenue increased $2.9 million, or 0.4%, to $652.6 million from $649.7 million in 2010. Freight revenue decreased $34.3 million, or 6.3%, to $512.0 million in the year ended December 31, 2011, from $546.3 million in 2010. The decrease resulted from a $22.2 million reduction in freight revenue from our Truckload segment, while our Solutions segment's freight revenue decreased $12.1 million. The decrease in Solutions freight revenue was primarily attributable to the elimination of unprofitable freight and agents in 2010, partially offset by an increase in revenue per loaded mile resulting from freight with a higher rate per mile, including fuel. The reduction in our Truckload segment's freight revenue iswas a result of a 2.3% decrease in average tractors, a 7.5% decrease in utilization based on reduced average miles per tractor, partially offset by a 7.5 cent, or 5.7%, period-over-period increase in average freight revenue per total mile. The main factors impacting utilization were: (i) a decline in the freight market for our long-haul service offering, which also drove a drop in the number of teams we operated compared with 2010; (ii) reduced efficiency of loading trucks and freight optimization related to the early July 2011 implementation of our upgrade to the hardware and software of our information systems at our largest operating subsidiary, Covenant Transport, together with a related increase in our number of unseated trucks for most of the year; (iii) reduced unprofitable business at our Star Transportation regional truckload subsidiary as we increased pricing to profitable levels on selected lanes; and (iv) inefficiencies resulting from the implementation across each of our fleets of EOBRs used to log driving hours. We attribute the increase in average freight revenue per total mile to improvements in our freight mix and customer recognition of the combination of service and capacity that we offer, and an improved rate environment.
Our reduction in tractors over the past several years, our decisions related to which markets to serve, the availability of freight in the markets in which we operate, and our ability to capture opportunities as they arise have historically impacted, and we believe will continue to impact, the volatility of our revenue and ultimate profitability. With that in mind, we are managing our network and the related allocation of resources to maximize utilization, minimize out-of-route and/or deadhead miles, minimize broker freight, and improve rates. The simple fact is that we have not been getting enough freight revenue per tractor to justify serving all of our lanes.
For comparison purposes in the discussion below, we use freight revenue (total revenue less fuel surcharge revenue) when discussing changes as a percentage of revenue. We believe removing this sometimes volatile source of revenue affords a more consistent basis for comparing the results of operations from period-to-period.
Salaries, wages, and related expenses
The increase in salaries, wages, and related expenses as a percentage of freight revenue for 2011 compared to 2010 iswas the result of an increase in driver wages of 2.1 cents per company mile due to pay adjustments in the second half of 2010 and due to the fixed nature of certain of our pay to student drivers and other driver incentives. In addition, we experienced a $3.3 million, or 0.9 cents per mile, increase in workers’ compensation expense related to adverse claims development in 2011 where new information or settlements led to increased expenses on past claims and abnormally low expenses in 2010. Group health costs were $0.7 million more than the prior year as a result of several large claims in 2011. These increases were offset by a $1.4 million decrease on non-driver salaries, primarily related to the decrease in incentive compensation. The other expense items in salaries, wages, and related expenses, including non-driver wages, are relatively fixed in nature and were flat period-over-period, causing them to be more per mile period-over-period and as a percentage of revenue. Going forward, we believe these expenses could increase in absolute terms (and as a percentage of revenue absent an increase in revenue to offset increased costs). In particular, we expect driver pay may increase as we look to reduce the number of unseated trucks in our fleet and do so in a tight market for drivers.
Fuel expense
We receive a fuel surcharge on our loaded miles from most shippers; however, this does not cover the entire increase in fuel prices for several reasons, including the following: surcharges cover only loaded miles we operated during the year; surcharges do not cover miles driven out-of-route by our drivers; and surcharges typically do not cover refrigeration unit fuel usage, or fuel burned by tractors while idling. Moreover, most of our business during 2011 relating to shipments obtained from freight brokers did not carry a fuel surcharge. Finally, fuel surcharges vary in the percentage of reimbursement offered, and not all surcharges fully compensate for fuel price increases even on loaded miles.
The rate of fuel price increases also can have an impact on results. Most fuel surcharges are based on the average fuel price as published by the DOE for the week prior to the shipment, meaning we typically bill customers in the current week based on a previous week's applicable index. Therefore, in times of increasing fuel prices, we do not recover as much as we are currently paying for fuel. In periods of declining prices, the opposite is true. The DOE's national average cost of diesel fuel increased $0.85/85.0 cents per gallon (or 28.4%) in 2011, compared with 2010. The higher prices and the negative effect that escalating fuel prices have on fuel surcharge recovery from customers resulted in a 0.6 cents per company mile increase in our per mile cost of fuel, net of fuel surcharge revenue, compared with 2010.
Additionally, $1.9 million gain wasnet gains were reclassified from accumulated other comprehensive income to results of operations, as a reduction in fuel expense, during the year ended December 31, 2011 related to gains on contracts that expired or were sold and for which we completed the transaction by purchasing the hedged diesel fuel. Our fuel hedging program provided for a $2.6 million reduction in fuel expense during 2010.
We expect to continue managing our idle time and truck speeds, investing in more fuel-efficient tractors to improve our fuel miles per gallon, locking in fuel hedges when deemed appropriate, and negotiating with customers to adjust fuel surcharge programs that are inadequate to recover a fair portion of rising fuel costs. Going forward, our net fuel expense is expected to fluctuate as a percentage of revenue based on factors such as diesel fuel prices, percentage recovered from fuel surcharge programs, percentage of uncompensated miles, percentage of revenue generated by team-driven tractors (which tend to generate higher miles and lower revenue per mile, thus proportionately more fuel cost as a percentage of revenue), percentage of revenue generated by refrigerated operation (which use diesel fuel for refrigeration but usually do not recover fuel surcharges on refrigeration fuel), and the success of fuel efficiency initiatives.
Operations and maintenance
The increase in operations and maintenance as a percentage of freight revenue primarily relatesrelated to a $0.4 million increase in our tire costs, a $0.9 million increase in parts expense, and a $1.4 million increase in outside tractor and trailer maintenance on a 9.6% reduction in miles. Vendors havehad increased the cost per tire as a result of supply shortages and increased petroleum product prices, while we arewere also experiencing increases in prices for parts and in over-the-road repair costs as a result of many vendors passing along price increases, as well as costs associated with the implementation of CSA regulations. The increase in outside vehicle maintenance iswas the result of additional maintenance that iswas completed when the trucks arewere idle during periods of low utilization, as well as costs associated with the implementation of CSA regulations. Recruiting and new hire costs arewere also higher in 2011 than 2010 as a result of the tight capacity in the driver market and our efforts to fill unseated trucks. We expect period-over-period operations and maintenance costs to be higher in 2012 when compared to 2011, given the aforementioned trends, higher tire and parts costs, and costs needed to recruit drivers when capacity is limited.
Revenue equipment rentals and purchased transportation
The decrease in revenue equipment rentals and purchased transportation as a percentage of freight revenue in 2011 from 2010 was a result of a $1.9 million decrease in tractor and trailer equipment rental expense and a $11.2 million decrease in payments to third-party transportation providers, partially offset by a $4.6 million increase in payments to independent contractors. We had financed approximately 350 tractors and 4,363 trailers under operating leases at December 31, 2011, compared with 28 tractors and 4,611 trailers under operating leases at December 31, 2010. In the last year, we have reduced our trailer fleet in order to better match our current number of tractors. Also, in the fourth quarter of 2010, we entered into an agreement that improved the rental rate on a large portion of our existing trailers. Payments to third-party transportation providers decreased in 2011 from 2010, primarily due to decreased loads partially offset by higher rates and fuel costs passed on to those providers. The increase in payments to independent contractors in 2011 from 2010 iswas mainly due to an increase in the size of the independent contractor fleet and the increase in fuel surcharges passed through that are a component of the related expense. This expense category will fluctuatefluctuates with the number of loads hauled by independent contractors and handled by Solutions and the percentage of our fleet financed with operating leases, as well as the amount of fuel surcharge revenue passed through to the independent contractors and third-party carriers. If capacity remains tight, we believe we may need to increase the amounts we pay to independent contractors and third-party transportation providers, which could increase this expense category as a percentage of freight revenue absent an offsetting increase in revenue. Additionally, we have enhanced our independent contractor lease purchase program, which we operate with TEL, and are actively recruiting independent contractors, and, as such, we expect the percentage of independent contractors in our fleet to grow in 2012.
Insurance and claims
Insurance and claims, consisting primarily of premiums and deductible amounts for liability, physical damage, and cargo damage insurance and claims, increased in 2011 from 2010 as a percentage of freight revenue. This increase was the result of additional claims reserves where new information or settlements led to increased expenses or reserves on past claims during 2011. Settling an unusually high number of large claims during the first and second quarters of 2011 also contributed to this increase in costs. As a result, the cost of insurance and claims increased to approximately 10.0 cents per mile in 2011 from approximately 8.4 cents per mile in 2010, even though the frequency and severity of claims iswas lower in 2011 than 2010. Additionally, premium expense iswas $1.2 million higher in 2011 given the change to the lower deductible policy in April of 2010, which was increased by the fixed nature of our premiums for our self-insured retention and the impact on a percentage of revenue and cost per mile in periods when miles decrease period-over-period. With our significant self-insured retention, insurance and claims expense may fluctuate significantly from period-to-period, and any increase in frequency or severity of claims could adversely affect our financial condition and results of operations.
Depreciation and amortization
Depreciation, consisting primarily of depreciation of revenue equipment and excluding gains and losses, decreased $2.8 million in 2011 from 2010, as a result of adjusting residual values for units expected to be sold in 2011 given the robust used equipment market, fewer owned tractors on our consolidated balance sheet (2,412 and 2,919 tractors at December 31, 2011 and 2010, respectively), partially offset by increased cost of new tractors. Gains on the disposal of property and equipment, totaling $6.7 million in 2011, were $2.4 million higher than 2010 due to the favorable used equipment market. While we expect continued gains on the sale
Goodwill impairment
Based upon a combination of factors that occurred in the third quarter of 2011, including a significant decline in our market capitalization below book value, a reduction in year-over-year earnings as a result of deterioration in the macro-economic environment and the market segments in which we operate, reductions in current and future year budgeted and analyst earnings estimates, and the need to amend our Credit Facility to remain in compliance with our financial covenants, we deemed that there had been multiple triggering events that would require an updated analysis as of September 30, 2011. This updated analysis provided that the carrying value of both reporting units exceeded their fair values. As a result of the second step of the goodwill impairment analysis, which involves calculating the implied fair value of each reporting unit's goodwill by allocating the fair value of all of its assets and liabilities other than goodwill (including both recognized and unrecognized intangible assets), and comparing the residual amount to the carrying value of goodwill, we determined that the faircarrying value of both reporting units exceeded the carryingfair value. The non-cash goodwill impairment charge amounted to $11.5 million ($9.4 million, net of a $2.1 million income tax benefit) to write off the remaining goodwill associated with several acquisitions that were made prior to 2001. Following this impairment charge, no goodwill currently remains on our balance sheet.
Other expense, net
Other expense, net includes interest expense, interest income, and other miscellaneous non-operating items. The reduction in cash flow resulting from the year-over-year change in earnings provided for an increase in outstanding debt, offset by lower interest rates and deferred loan cost amortization as a result of the fourth amendment to our Credit Facility in August 2010, which, among other things, decreased the interest rate grids under the Credit Facility. As a result, interest expense decreased $0.4 million period-over-period.
Equity in income of affiliate
We have accounted for our investment in TEL using the equity method of accounting and thus our financial results includeincluded our proportionate share of income since May 31, 2011, or $0.7 million for the seven months ended December 31, 2011. Given TEL's growth over the past two years and volatility in the used and leased equipment markets in which TEL operates, we expect the impact on our earnings resulting from our investment and TEL’s profitability to become more significant over the next year.
Income tax benefit
The tax benefit recognized in 2011 compared to the tax expense in 2010 iswas primarily related to the $25.9 million decrease in the pre-tax earnings in 2011 compared to 2010, resulting from the $11.5 million goodwill impairment and the negative impact on profitability of lower freight revenue and increases in costs in the aggregate and on a per mile basis as discussed above. The effective tax rate is different from the expected combined tax rate due to permanent differences related to a per diem pay structure for drivers and the impact of non-deductible portion of the aforementioned goodwill impairment. Due to the partial nondeductible effect of the per diem payments, our tax rate will fluctuate in future periods as income fluctuates.
Comparison of Year Ended December 31, 2010 to Year Ended December 31, 2009
Revenue
For the year ended December 31, 2010, total revenue increased $61.1 million, or 10.4%, to $649.7 million from $588.7 million in 2009. Freight revenue increased $25.8 million, or 5.0%, to $546.3 million in the year ended December 31, 2010, from $520.5 million in 2009. The increased level of freight revenue in 2010 was primarily attributable to the improvement in the freight environment and certain Company-specific initiatives that improved rates and utilization compared to 2009. We believe rates have improved as a result of customers sensing the tightening of capacity and understanding that capacity may tighten further in connection with CSA and looming potential changes in hours-of-service. Our average freight revenue per total mile increased $0.036 per mile, or 2.8%, compared with 2009. Utilization and productivity have improved as a result of improved truckload fundamentals along with certain initiatives we have employed to increase asset productivity and utilization, reduce deadhead, and increase freight rates. Reduced inventories, improved economic growth, and the continued reduction in the number of tractors on the road, particularly in the long-haul marketplace, provided for tighter capacity and thus higher spot-market prices in 2010 when compared to 2009.
Salaries, wages, and related expenses
The decrease in salaries, wages, and related expenses as a percentage of freight revenue was primarily attributable to reductions in driver pay per mile, which was partially offset by 7.4 million more miles in 2010 than 2009, providing for a net $2.3 million reduction in the related expense. Payroll expense for non-driver employees increased $0.3 million in 2010 from 2009 due to incentive pay, which was partially offset by fewer employees as a result of various initiatives to increase our ratio of tractors per non-driver employee. Additionally, workers' compensation expense was $0.5 million less in 2010 than 2009 as a result of reduced claims activity in 2010 caused by a reduction in employees in 2010 and 2009 and credits related to certain prior period claims. Group health was $0.5 million higher in 2010 than 2009 primarily as the result of several large claims in 2010. Included in salaries, wages, and related expenses is stock-based compensation expense for the year ended December 31, 2010 and 2009 of approximately $1.0 million and $0.6 million, respectively.
Fuel expense
Given fuel volatility, we experienced favorable fuel surcharge trends in the first half of 2010 and unfavorable trends in the second half of 2010; however, the full-year 2010 impact was not significant. Even though the DOE's national average cost of diesel fuel increased $0.53 per gallon in 2010 compared with 2009, we experienced a $0.01 per mile reduction in our net cost of fuel and a reduction in fuel expense as a percentage of freight revenue. These decreases are primarily the result of increased fuel surcharge recovery, reduced idle time, and the positive results of our fuel hedging program. Our hedging program provided for a $2.6 million reduction in fuel expense during 2010. Based on the amounts in accumulated other comprehensive income as of December 31, 2010 and the expected timing of the purchases of the diesel hedged, we expect to reclassify $0.8 million of gains on derivative instruments from accumulated other comprehensive income to earnings during the next year due to the actual diesel fuel purchases.
Operations and maintenance
Operations and maintenance, consisting primarily of vehicle maintenance, repairs, and driver recruitment expenses, decreased in 2010 from 2009 as a percentage of freight revenue as a result of managing non-essential expenses and a slightly younger fleet. With the recovering economic environment in 2009 and early 2010, we had more difficulty recruiting and retaining drivers, which resulted in a year-over-year increase in driver recruitment expenses.
Revenue equipment rentals and purchased transportation
The decrease in revenue equipment rentals and purchased transportation as a percentage of freight revenue in 2010 from 2009 was a result of the increased revenue per total mile discussed above, an $8.9 million decrease in tractor and trailer equipment rental expense, and a $6.0 million decrease in payments to third-party transportation providers are partially offset by a $10.1 million increase in payments to independent contractors. The decrease in revenue equipment rentals expense is a result of financing all 2010 revenue equipment additions with balance sheet debt and capital leases as opposed to replacing existing operating leases. We had 28 tractors and 4,611 trailers financed under operating leases at December 31, 2010, compared with 236 tractors and 5,987 trailers at December 31, 2009. Payments to third-party transportation providers associated with our Solutions subsidiary decreased in 2010 from 2009, primarily due to decreased load count partially offset by higher rates and fuel costs passed on to those providers. We had a significant increase in payments to independent contractors in 2010 from 2009, mainly due to an increase in the size of our independent contractor fleet and the increase in fuel surcharges passed through that are a component of the related expense. This expense category will fluctuate with the number of loads hauled by independent contractors and handled by our Solutions segment and the percentage of our fleet financed with operating leases, as well as the amount of fuel surcharge revenue passed through to the independent contractors and third-party carriers.
As discussed herein, on October 28, 2010, certain of our subsidiaries entered into a Letter Agreement with Transport International Pool, Inc. ("TIP"), relating to and modifying the Master Lease Agreement dated April 15, 2003 with TIP. Contemporaneously with the execution of the Letter Agreement, we returned 543 trailers in order to better match our trailer fleet with our current number of tractors. Under the terms of the Letter Agreement, the trailers subject to the agreement will be required to be returned or purchased at the rate of approximately 100 trailers per month beginning February 2012. The improved rental rate, coupled with the reduction in rental expense associated with the return of 543 trailers, is expected to provide us with savings on the TIP trailers in 2011.
Insurance and claims
Insurance and claims, consisting primarily of premiums and deductible amounts for liability, physical damage, and cargo damage insurance and claims, increased in 2010 from 2009 as a percentage of freight revenue as a result of higher claims and premium expense during 2010. Although our driver and safety teams achieved historically low reportable accidents per million miles for the year ended December 31, 2010, we experienced a small number of severe accidents in the first and third quarters of 2010 and a slight increase in the period-over-period loss development expense resulting from claims that occurred in prior periods. The increase in premium expense related to the insurance renewal that was effective April 1, 2010, which reduced our self-insured retention limit for the primary layer of casualty claims to no more than $1.0 million from the $4.0 million self-insured retention limit we have had for a number of years. With our significant self-insured retention, insurance and claims expense may fluctuate significantly from period-to-period, and any increase in frequency or severity of claims could adversely affect our financial condition and results of operations.
General supplies and expenses
The decrease in general supplies and expenses as a percentage of freight revenue in 2010 from 2009 is primarily the result of the increase in revenue discussed above as well as a reduction in the various expenses as a result of our cost saving initiatives. The larger decreases included a $1.3 million reduction in bad debt expense given several large bankruptcies and reserve adjustments in 2009, a $0.9 million reduction in agent fees a result of reduced revenue at our Solutions segment in 2010, and a $0.5 million reduction in building rent a result of consolidating certain locations.
Depreciation and amortization
Depreciation and amortization, consisting primarily of depreciation of revenue equipment, increased as a percentage of freight revenue in 2010 from 2009 as a result of the increased cost of new tractors and financing all 2010 revenue equipment additions with balance sheet debt and capital leases, whereby a portion of the replaced equipment had previously been operated under operating leases. We owned 2,919 and 2,784 tractors and had 348 and 300 trailers under capital leases at December 31, 2010 and 2009, respectively. These increases were partially offset by gains on the sale of equipment totaling $4.3 million in 2010 compared to a loss of $0.1 million in 2009.
Other expense, net
Other expense, net includes interest expense, interest income, and other miscellaneous non-operating items. The decrease in the other expense, net category as a percentage of freight revenue relates to the Transplace impairment, which provided for $11.5 million of expense in 2009. This decrease was partially offset by an increase in interest expense of $2.5 million, resulting from a period-over-period increase in debt related to an increase in financing revenue equipment with balance sheet debt. As detailed below, we entered into a fourth amendment to our Credit Facility in August 2010, which, among other things, decreased the interest rate grids under the Credit Facility.
Income tax expense (benefit)
Fluctuations in income tax benefit are primarily the result of the related period's pre-tax results and the effects of certain non-cash charges. The income tax expense in 2010, as opposed to a benefit in 2009, and the related percentage of freight revenue was primarily a result of producing net income in 2010 and therefore being subject to statutory taxing requirements. The increase was partially offset by the $0.6 million, net, favorable impact of the release of a portion of the valuation allowance on a prior period capital loss in 2010 as the result of generating capital gains to utilize a portion of the loss that related to our prior sale of our investment in Transplace. The effective tax rate is different from the expected combined tax rate due to permanent differences related to a per diem pay structure for drivers. Due to the partial nondeductible effect of the per diem payments, our tax rate will fluctuate in future periods as income fluctuates.
RESULTS OF SEGMENT OPERATIONS
We operatehave two reportable business segments. Our Asset-Based Truckload Servicessegments: asset-based truckload services ("Truckload") segment consists of Covenant Transport, SRT, and Star. Our Brokerage Services segment consists of Covenant Transport Solutions, Inc.non-asset based brokerage and ancillary services ("Solutions"). The operation of each of these businesses is described in our notes to the "Business" section.Item 1 of Part 1 of this Annual Report on Form 10-K. Unallocated corporate overhead includes costs that are incidental to our activities and are not specifically allocated to one of the segments. The following table summarizes financial and operating data by segment:
| | | Year ended December 31, | | | Year ended | |
| (in thousands) | | 2011 | | | 2010 | | | 2009 | | | | | | | | | | |
| | | | | | | | | | | |
| Revenues: | | | | | | | | | | | | | | | | | | |
| | | | | | | | | | | |
| Asset-Based Truckload Services | | $ | 625,252 | | | $ | 610,291 | | | $ | 541,325 | | |
| Brokerage Services | | | 27,375 | | | | 39,458 | | | | 47,362 | | |
| | | | | | | | | | | | | | |
| Truckload | | | $ | 647,986 | | | $ | 625,252 | | | $ | 610,291 | |
| Solutions | | | | 26,268 | | | | 27,375 | | | | 39,458 | |
| Total | | $ | 652,627 | | | $ | 649,749 | | | $ | 588,687 | | | $ | 674,254 | | | $ | 652,627 | | | $ | 649,749 | |
| Operating Income (loss): | | | | | | | | | | | | | | | | | | | | | | | | |
| | | | | | | | | | | | | | |
| Asset-Based Truckload Services | | $ | 10,438 | | | $ | 35,390 | | | $ | 10,552 | | |
| Brokerage Services | | | 1,687 | | | | 1,462 | | | | 155 | | |
| Truckload | | | $ | 34,185 | | | $ | 10,438 | | | $ | 35,390 | |
| Solutions | | | | (741 | ) | | | 1,687 | | | | 1,462 | |
| Unallocated Corporate Overhead | | | (13,186 | ) | | | (10,844 | ) | | | (15,429 | ) | | | (10,235 | ) | | | (13,186 | ) | | | (10,844 | ) |
| | | | | | | | | | | | | | |
| Total | | $ | (1,061 | ) | | $ | 26,008 | | | $ | (4,722 | ) | | $ | 23,209 | | | $ | (1,061 | ) | | $ | 26,008 | |
Comparison of Year Ended December 31, 2012 to Year Ended December 31, 2011
For the twelve months ended December 31, 2012, the increase in Truckload revenue relates to an 8.5% increase in our freight revenue per tractor. Average freight revenue per tractor per week increased to $3,322 during the 2012 year from $3,069 during the 2011 year. Average freight revenue per total mile increased by 8.9 cents per mile (or 6.4%) compared to the 2011 year, while average miles per unit increased by 2.0%. Rates have continued to increase, as a result of increases required to offset increasing costs and to bring rates back from the recessionary environment in prior year, as well as the result of supply and demand metrics within the markets in which we operate and related concerns about future capacity constraints. The main factors favorably impacting utilization were a decrease in fleet size, the percentage of our fleet comprised of team-driven tractors, and a shorter length of haul. These increases were partially offset by a 4.4% decrease of our average tractor fleet. As a result of the system conversion at the Covenant subsidiary in July of 2011, these comparisons to the prior year’s revenue statistics are not indicative of the larger freight environment in 2012 or our expectations for 2013.
Our asset-based operating income was $34.2 million or $23.7 million higher for 2012 than 2011, primarily as a result of the $11.5 million goodwill impairment in the third quarter of 2011. Additionally, we fully overcame the inefficiencies that resulted from the system implementation at our Covenant Transport subsidiary in the second half of 2011, as well as saw rate and utilization improvements that outpaced our increased costs.
Solutions’ total revenue decreased $1.1 million in 2012 compared to 2011 and operating income decreased $2.4 million for the same period. These declines related to the loss of an agent early in 2012 and a decrease in the number of special projects, including the nationwide launch of Allegra to the over-the-counter market in 2011 and several large seasonal projects. Additionally, Solutions added less-than-truckload and accounts receivable factoring service offerings, requiring investment in additional personnel and related startup expenses to expand the capacity and range of services offered to our customers. These items combined to negatively impact Solutions’ profitability; however management is diligently looking at each aspect of the business to address issues and improve profitability in 2013.
The fluctuation in unallocated corporate overhead is primarily the result of the policy release credit recorded in the second quarter of 2012, related to our commutation of the April 1, 2011 through March 31, 2012 policy year of our primary auto liability insurance policy.
Comparison of Year Ended December 31, 2011 to Year Ended December 31, 2010
Total revenue in our asset-based operations decreased for the year ended December 31, 2011 by $15.0 million as compared with the prior year. Fuel surcharge revenue increased $37.2 million in the year ended December 31, 2011 while freight revenues declined $22.2 million for the year ended December 31, 2011 as compared with 2010. The $22.2 million decrease in freight revenues related to a 2.2% decrease in average freight revenue per tractor per week and a 3.5% decrease of our average tractors as a result of deterioration in the macro-economic environment and the market segments in which we operate, specifically the west coast, and an increase in our unseated truck count in 2011 compared to 2010 due to capacity constraints in the driver market, both of which were accentuated by implementation of our new fully-integrated operating system software at the Covenant Transport subsidiary and inefficiencies resulting from installing EOBRs in a large portion of our fleet. The decreases in utilization and seated tractors were partially offset by a 5.7% or 7.5 cent per mile increase in rates per total mile for 2011 compared to 2010. The Truckload segment's results included ana $11.5 million non-cash goodwill impairment for the year ended December 31, 2011. Excluding the impairment, our asset-based operating costs, net of fuel surcharge revenue, were 11.4 cents per mile higher in 2011 than 2010. The cost increases primarily related to increased driver pay per mile resulting from pay increases instituted in the second half of 2010, increased workers' compensation expense resulting from unfavorable claims development where new information or settlements led to increased expenses on past claims, an increase in group health insurance expense related to unfavorable claims experience, and an increase in operating and maintenance expense due to inflationary pressures related to tires and vehicle parts, as well as additional maintenance we were able to complete when trucks experienced lower utilization, partially offset by favorable decreased frequency of accidents, and increased net fuel expense due to the year-over-year increase in fuel costs and negative impact on our costs of the portion of the increase not covered by fuel surcharge revenue. Further, the decrease in utilization negatively impacts our operating costs per mile given inefficiencies resulting from downtime and not covering fixed costs as efficiently. Depreciation and amortization was $5.5 million less in 2011 than 2010, given the used equipment market was very robust and provided for a year-over-year $2.4 million increase in the gains on the sale of used tractors and trailers, coupled with less depreciation as a result of slowing depreciation on all units to be sold in 2011 as a result of the significant gains and a $0.3 million reduction amortization.
Our brokerage subsidiary revenue decreased for the year ended December 31, 2011 by $12.1 million as compared with 2010. Our gross margins improved as purchased transportation was 77.2% of total revenue for the year ended December 31, 2011 compared to 84.4% in 2010. Solutions’ other operating expenses as a percentage of revenue increased to 16.6% of total revenue for the year ended December 31, 2011 compared to 11.9% in 2010, as agent fees increased as a percentage of total revenues. The decrease in revenue and purchased transportation expense relatedrelates primarily to the termination of certain agent and customer relationships during 2010, which had contributed lower margin revenue during 2010, and increased special project work in 2011, which has a higher margin.
Comparison of Year Ended December 31, 2010 to Year Ended December 31, 2009
Our Truckload segment revenue increased in 2010 when compared to 2009 as the result of increases in utilization, rates, and fuel surcharge revenue. Rates and utilization improved as a result of improved truckload fundamentals including inventory re-stocking, economic growth, and tightened capacity. Additionally, fuel price increases and increases in fuel surcharge revenue provided for a $35.2 million increase in fuel surcharge revenue for 2010 compared to 2009. The Truckload segment's operating expenses (including unallocated corporate overhead), net of fuel surcharge revenue, decreased $0.04 per mile in 2010 versus 2009. The cost reductions were led by a $0.03 per mile decrease in salaries, wages, and related expenses, a $0.01 per mile reduction in net fuel costs, and a $0.01 decrease in general supplies and expenses, partially offset by a $0.01 per mile increase in insurance expense.
Our Solutions segment revenue decreased for 2010, when compared to 2009 as the result of an elimination of unprofitable freight and agents as evidenced by a 21% decrease in loads, partially offset by an increase in revenue per load and per loaded mile resulting from freight with a higher rate per mile and more miles per load. Net revenue (total revenue less purchased transportation) was 16.6% in 2010 and 2009. Solutions' other operating expenses as a percentage of revenue decreased to 11.9% of revenue in 2010 from 15.2% of revenue in 2009. This was primarily the result of reduced overhead arising from headcount reductions, changes in our agent commission structure, and reductions in bad debt expense. We have continued to improve our cost structure in this segment in light of reductions in revenue, with the goal of growing the segment's revenue base, generating appropriate gross margins, and maintaining a lean cost structure such that the business is a truly variable cost business and should produce a positive operating profit in most freight environments.
Additional Information Concerning Non-Cash Charges
Goodwill
We test goodwill for impairment at least annually or more frequently if events or circumstances indicate that goodwill may be impaired. As a result of the annual test, which was conducted as of May 31, 2011, we determined that no impairment existed given the fair value of each of our reporting units containing goodwill, Covenant and SRT, exceeded the carrying value of each reporting unit, including the $7.2 million and $4.3 million of goodwill related to Covenant and SRT, respectively. We perform our impairment tests of goodwill at the reporting unit level. Based upon a combination of factors that occurred in the third quarter of 2011, including a significant decline in our market capitalization below our book value, a reduction in year-over-year earnings as a result of deterioration in the macro-economic environment and the market segments in which we operate, reductions in current and forecasted earnings estimates, and the need to amend our Credit Facility to remain in compliance with our financial covenants, we deemed that there had been multiple triggering events that would require an updated impairment analysis as of September 30, 2011. This updated analysis provided that the carrying value of both reporting units exceeded their fair values. As a result of the second step of the goodwill impairment analysis, which involves calculating the implied fair value of each reporting units goodwill by allocating the fair value of all of its assets and liabilities other than goodwill (including both recognized and unrecognized intangible assets), and comparing the residual amount to the carrying value of goodwill, we determined that the fair value of both reporting units exceed the carrying value. The non-cash goodwill impairment charge amounted to $11.5 million ($9.4 million, net of a $2.1 million income tax benefit) to write off the remaining goodwill associated with several acquisitions that were made prior to 2001. Following this impairment charge, no goodwill currently remains on our balance sheet.
Transplace
From July 2001 to December 2009, we owned approximately 12.4% of Transplace, a global logistics provider. During the first quarter of 2005, we loaned Transplace approximately $2.6 million through a 6% interest-bearing note receivable. After receiving an offer to purchase our 12.4% equity ownership and related note receivable that was accepted by a majority of Transplace's stockholders, we determined that the value of our equity investment had become completely impaired in the third quarter of 2009, and the value of the note receivable had become impaired by approximately $0.9 million. As a result, we recorded a non-cash impairment charge of $11.6 million during the third quarter of 2009. The transaction closed in December 2009, whereby the proceeds of $1.9 million provided for a recovery of $0.1 million of the previously impaired amount in the fourth quarter of 2009 and thus an $11.5 million non-cash loss on the sale of our investment and related note receivable. There was no tax benefit recorded in connection with the loss on the sale of the investment, given a full valuation allowance was established for the related capital loss.
LIQUIDITY AND CAPITAL RESOURCES
Our business requires significant capital investments over the short-term and the long-term. Recently, we have financed our capital requirements with borrowings under our Third Amended and Restated Credit Facility ("Credit Facility"), cash flows from operations, long-term operating leases, capital leases, secured installment notes with finance companies, and refundsproceeds from the sale of previously paid federal income taxes as a result of net operating loss carry backs pursuant to the Worker, Homeownership,our used revenue equipment in 2012 and Business Assistance Act of 2009 in 2011 and 2010.2011. Our primary sources of liquidity at December 31, 2011,2012, were funds provided by operations, proceeds from the sale of used revenue equipment, borrowings under our Credit Facility, borrowings from secured installment notes, capital leases, operating leases of revenue equipment, and cash and cash equivalents. We had a working capital (total current assets less total current liabilities) deficit of $42.1$20.0 million and $30.8$42.1 million at December 31, 20112012 and 2010,2011, respectively. Working capital deficits are common to many trucking companies that operate by financing revenue equipment purchases through borrowing or capitalized leases. When we finance revenue equipment through borrowing or capitalized leases, the principal amortization scheduled for the next year is categorized as a current liability, although the revenue equipment is classified as a long-term asset. Consequently, each purchase of revenue equipment financed with borrowing or capitalized leases decreases working capital. Additionally, due to the nature of the lockbox on our Credit Facility, such facility is reflected as a current liability on our balance sheet. The facility matures in September 2014. We believe our working capital deficit had little impact on our liquidity. Based on our expected financial condition, net capital expenditures, and results of operations and related net cash flows, we believe our working capital and sources of liquidity will be adequate to meet our current and projected needs for the next year.
We do not expect to experience material liquidity constraints in the foreseeable future or on a long-term basis, based on our anticipated financial condition, results of operations, cash flows, continued availability of our Credit Facility, secured installment notes, and other sources of financing that we expect will be available to us. OurSince the end of 2011, the Company’s balance sheet debt and capital lease obligations, net capital expenditures are expectedof cash, has decreased by $70.5 million, while the present value of financing provided by operating leases increased by approximately $16.0 million. We do not expect that changes in our lease adjusted indebtedness in 2013 to be significantly lessas significant as in 2012 than 2011 or 2010 as a result of the young age2012. Outside of our tractor fleet providing for fewer replacementsoperating income, the largest variable in 2012, partially offset by a planned increase in the purchase of trailers. Additionally, we have increased the number of independent contractors indetermining whether our fleetlease adjusted indebtedness increases or decreases is our capital investment plan, which continues to 216 at December 31, 2011 from 138 at December 31, 2010. The majority of this increase came in the second half of 2011. We expect the trend of increased independent contractors as a percentage of our fleet to continue into 2012.be revised.
We had $15.9 million ina de minimus amount of borrowings outstanding under the Credit Facility as of December 31, 2011,2012, undrawn letters of credit outstanding of approximately $38.9$39.6 million, and available borrowing capacity of $27.6$52.7 million. Our intra-period borrowings under the Credit Facility have ranged between $10.7less than $0.1 million and $20.9$9.2 million during the fourth quarter of 20112012 and between zeroless than $0.1 million and $22.4$25.0 million during 2011.2012. Fluctuations in the outstanding balance and related availability under our Credit Facility are driven primarily by cash flows from operations and the timing and nature of property and equipment additions that are not funded through notes payable, as well as the nature and timing of receipt of proceeds from disposals of property and equipment.
The amendment to our Credit Facility completed in January 2013, as discussed below, includes several favorable provisions that enhance our liquidity and provide flexibility related to capital decisions. As a result, we expect an increase in borrowings under the Credit Facility, such that our pro forma availability will be less than the $52.7 million available at December 31, 2012.
Cash Flows
Net cash flows provided by operating activities were lower$55.1 million in 2011 than 2010, primarily due2012 compared with $32.1 million in 2011. The improvement was similar to the improvement to $6.1 million of net income in 2010 of $3.3 million2012 compared towith a net loss of $14.3 million in 2011. However, significant items impacted cash flows in each period. The 2011 of $4.9 million, excludingperiod included the impact of thea non-cash $11.5 million goodwill impairment and related tax effect. The $19.62012 period included a $4.0 million pre-tax reduction in insurance and claims expense recorded in the second quarter of 2012 associated with commuting an auto liability policy. The insurer did not remit the premium refund directly to the Company, but instead applied a credit to the current auto liability insurance policy, such that we recorded the policy release premium refund as a prepaid asset at June 30, 2012 and are amortizing it over the term of the policy. The $8.9 million year-over-year fluctuation in deferred tax expense (benefit) relates to the receipt of an $8.7 million refund of federal income taxesyear-over-year fluctuations in 2010, compared with a $0.9 million refund in 2011,profitability, the benefit of $2.1 million of the goodwill impairment being tax deductible and fluctuations in deferred taxes resulting from book and tax depreciation differences on revenue equipment. Additionally,Depreciation and amortization was lower in the 2012 period, primarily due to having fewer owned tractors at December 31, 2012 compared to 2011, while gain on the sale of property and equipment was also lower as the result of selling less equipment and a less robust used equipment market, partially offset by the sale of a terminal property that provided for a $2.4 million pre-tax gain. The increase in accounts receivable related to a $7.4 million increase in receivables associated with the growth in Solutions' factoring business and higher freight revenue and fuel surcharge revenue during December 2012 compared to December 2011. These increases were partially offset by improved days sales outstanding resulting from overcoming inefficiencies associated with the 2011 system conversion at Covenant. The fluctuations in cash flows from accounts payable and accrued expenses primarily related to period-over-period increases in fuel costs andthe timing of payment of various accrued expenses, including payment in the 2011 period of incentive compensation related to the achievement of 2010 performance targets with no significantsuch related payments in 2010. As a result of a robust used equipment market, we adjusted the residual values for units expected to be sold in 2011 and experienced $2.4 million in higher gains in 2011 versus 2010.2012 period. The fluctuation in cash flows related to prepaidassociated with insurance and other assets primarilyclaims accruals relates to cash outflows relatedhigher expense in the 2012 period, when excluding the aforementioned policy release credit, a large portion of which relates to a consulting project in 2010, with no similar cash expendituresaccruals for claims that have not been paid, noting several large claims were settled and paid in 2011. Cash
Net cash flows from receivables and advances are lowerassociated with investing activities were $13.2 million of cash flows provided by investing activities in 2011 than 2010 as a result2012 compared with $50.7 million of decreased total revenue in the second half of 2011 compared to 2010 and an increase in days sales outstanding on receivables.
The decrease in net cash flows used in investing activities was primarily the resultduring 2011. The substantial difference in net cash flows related to purchasing approximately 425 new tractors and disposing of a decrease650 tractors in our acquisition2012, compared with purchasing approximately 1,075 and disposing of revenue equipment during925 in 2011. Of such additions, approximately 260 and 350 were tractors financed under operating leases in 2012 and 2011, compared to 2010 and the increase in the proceeds we received from the units sold as a result of a robust used equipment market.respectively. With an average tractor fleet age of 1.62.1 years, we have flexibility to manage our fleet and we plan to regularly evaluate our tractor replacement cycle, new tractor purchase requirements, and financing options. Our equipment plan for 2013 is currently being revised; however, net capital expenditures in 2013 will exceed 2012 fleet plan includes the additionlevels, due to plans to purchase more trucks in 2013 than 2012 and disposal of approximately 300 tractors, compared to 950 in 2011. We expectplans to replace approximately 450 dry van800 trailers and 200 refrigeratedas we continue a multi-year replacement of the older trailers in 2012 and dispose of approximately 75 refrigerated trailers.the fleet. We have not finalized our decisions on how to finance these transactions; however, management currently expects to lease new tractors and purchase new trailers. The ultimatethe financing decision as well as our success in adding independent contractors will impact cash flows from investing activities in 2012; however,2013. Additionally, we expect net cash used to acquire equipment will decreasemade $2.9 million in 2012 compared to 2011. If we are successful in growing our independent contractor fleet on net cash used to acquire equipment could be further decreased. Additionally, late in the second quarter of 2011, we purchased a 49% equity investment in TEL, a tractor and trailer equipment leasing company and used equipment reseller. The equity investment totaled $1.5 million, with future potential earn-out payments based on performance. During the third quarterto TEL, our equity method investee, of which $1.0 million relates to earn-out payments earned in 2011, webut not paid until 2012 and $1.9 million earned and paid in 2012. We also received an equity distribution from TEL for $0.3 million and $0.2 million during 2012 and 2011, respectively, that was distributed to each member based on their respective ownership percentage in order to satisfy estimated tax payments resulting from TEL’s earnings. The distribution isAdditionally, the result ofpurchase option associated with our investment in TEL being a limited liability company and thus its earnings pass through to the members and are taxed for federal and certain state income on their respective tax returns.could impact our cash flows from investing activities, should it be exercised.
The changes in net cash flows provided by financing activities were a function of a $28.5$31.8 million period-over-period change in the cash flows associated with the 2012 net repayment and 2011 net borrowings and 2010 net repayments on our Credit Facility, as well as a $1.2 million year-over-year increase in the change in checks outstanding in excess of bank balances, both of which areis directly related to the decreaseincrease in cash flows from operations discussed above. Additionally, repayments of notes payable and capital leases, offset by proceeds from new notes payable used $51.7 million in the 2012 period, compared to using $3.4 million in the 2011 period, compared to providing for $20.4 million in the 2010 period, primarily related to the trade cycle of our revenue equipment. Givenequipment and the budgeted reduction indisposal of units without a corresponding addition as we decreased the acquisitionsize of new revenue equipment in 2012, we expect significantly less proceeds from the issuance of debt in 2012 than 2011 or 2010.fleet by 4.4% and grew our owner operator program.
Material Debt Agreements
In September 2008, we and substantially all of our subsidiaries (collectively, the "Borrowers") entered into thea Third Amended and Restated Credit Facility (the "Credit Facility") with Bank of America, N.A., as agent (the "Agent") and JPMorgan Chase Bank, N.A. ("JPM," and together with the Agent, the "Lenders").
The Credit Facility iswas originally structured as an $85.0 million revolving credit facility, with an accordion feature that, so long as no event of default exists, allows us to request an increase in the revolving credit facility of up to $50.0 million. The Credit Facility includes, within our $85.0 million revolving credit facility, a letter of credit sub facility in an aggregate amount of $85.0 million and a swing line sub facility in an aggregate amount equal to the greater of $10.0 million or 10% of the Lenders' aggregate commitments under the Credit Facility from time-to-time.
On AugustJanuary 29, 2013, we entered into an eighth amendment, which was effective December 31, 2010, we obtained a fourth amendment2012, to the Credit Facility which, among other things, (i) increased the revolver commitment to $95.0 million, (ii) extended the maturity date of the Credit Facility from September 20112014 to September 2014, decreased2017, (iii) eliminated the availability block of $15.0 million, (iv) improved pricing for revolving borrowings by amending the applicable margin on loans, eliminated the LIBOR floor, andas set forth below (beginning January 1, 2013), (v) improved the unused line fee. fee pricing to 0.375% per annum when availability is less than $50.0 million and 0.5% per annum when availability is at or over such amount (beginning January 1, 2013), (vi) provided that the fixed charge coverage ratio covenant will be tested only during periods that commence when availability is less than or equal to the greater of 12.5% of the revolver commitment or $11.9 million, (vii) eliminated the consolidated leverage ratio covenant, (viii) reduced the level of availability below which cash dominion applies to the greater of 15% of the revolver commitment or $14.3 million (previously this level was $75.0 million), (ix) added deemed amortization of real estate and eligible revenue equipment included in the borrowing base to the calculation of fixed charge coverage ratio, (x) amended certain types of permitted debt to afford additional flexibility, and (xi) allowed for stock repurchases in an aggregate amount not exceeding $5.0 million and the purchase of up to the remaining 51% equity interest in TEL, provided that certain conditions are met.
In exchange for these amendments, the amendment, we paidBorrowers agreed to pay fees and expenses of approximately $0.6$0.3 million. While amounts outstanding underBased on availability as of December 31, 2012, there was no fixed charge coverage requirement. Following the Credit Facility are not due until September 2014, the related borrowings are reflected as current maturities in our consolidated balance sheet as a resulteffectiveness of the Credit Facility requiring thateighth amendment, the receipts from our lock-box automatically pay down the Credit Facility daily and additional borrowings be funded through additional draws against the Credit Facility.applicable margin was changed as follows:
New Pricing
| Level | Average Pricing Availability | Base Rate Loans | LIBOR Loans | L/C Fee |
| I | > $75,000,000 | .50% | 1.50% | 1.50% |
| II | ≤ $75,000,000 but > $50,000,000 | .75% | 1.75% | 1.75% |
| III | ≤ $50,000,000 but > $25,000,000 | 1.00% | 2.00% | 2.00% |
| IV | ≤ $25,000,000 | 1.25% | 2.25% | 2.25% |
Prior Pricing
| Level | Average Excess Availability | Base Rate Loans | LIBOR Loans |
| I | >$70,000,000 | 1.25% | 2.25% |
| II | ≤$70,000,000 but >$35,000,000 | 1.50% | 2.50% |
| III | ≤$35,000,000 but >$20,000,000 | 1.75% | 2.75% |
| IV | ≤$20,000,000 but <$10,000,000 | 2.00% | 3.00% |
| V | ≤$10,000,000 | 2.25% | 3.25% |
Borrowings under the Credit Facility are classified as either "base rate loans" or "LIBOR loans." Base rate loans accrue interest at a base rate equal to the greater of the Agent's prime rate, the federal funds rate plus 0.5%, or LIBOR plus 1.0%, plus an applicable margin that is adjusted quarterly between 1.25% and 2.25% based on average pricing availability.margin; while LIBOR loans accrue interest at LIBOR, plus an applicable margin that ismargin. The applicable rates are adjusted quarterly between 2.25% and 3.25% based on average pricing availability. The unused line fee is also adjusted quarterly between 0.5% and 0.75% ofbased on the average daily amount by which the Lenders' aggregate revolving commitments under the Credit Facility exceed the outstanding principal amount of revolver loans and the aggregate undrawn amount of all outstanding letters of credit issued under the Credit Facility. The obligations under the Credit Facility are guaranteed by us and secured by a pledge of substantially all of our assets, with the notable exclusion of any real estate or revenue equipment pledged under other financing agreements, including revenue equipment installment notes and capital leases.
Borrowings under the Credit Facility are subject to a borrowing base limited to the lesser of (A) $85.0$95.0 million, minus the sum of the stated amount of all outstanding letters of credit; or (B) the sum of (i) 85% of eligible accounts receivable, plus (ii) the lesser of (a) 85% of the appraised net orderly liquidation value of eligible revenue equipment, (b) 95% of the net book value of eligible revenue equipment, or (c) 35% of the Lenders' aggregate revolving commitments under the Credit Facility, plus (iii) the lesser of (a) $25.0 million or (b) 65% of the appraised fair market value of eligible real estate. The borrowing base is limited by a $15.0 million availability block, plus any other reserves the Agent may establish in its judgment. We had $15.9 million ina de minimis amount of borrowings outstanding under the Credit Facility as of December 31, 2011,2012, undrawn letters of credit outstanding of approximately $38.9$39.6 million, and available borrowing capacity of $27.6$52.7 million. The interest rate on outstanding borrowings as of December 31, 2011 and 20102012 was 5.0% and 4.8%, respectively.
all loans were base rate loans.
The Credit Facility includes usual and customary events of default for a facility of this nature and provides that, upon the occurrence and continuation of an event of default, payment of all amounts payable under the Credit Facility may be accelerated, and the Lenders' commitments may be terminated. The Credit Facility contains certain restrictions and covenants relating to, among other things, debt, dividends, liens, acquisitions and dispositions outside of the ordinary course of business, and affiliate transactions. Following the most recent amendment to the Credit Facility discussed below, the Credit Facility contains two financial covenants: a covenant requiring us to maintain a monthly consolidated fixed charge coverage ratio (defined below) of at least 1.0 to 1.0 and a covenant requiring us to maintain a quarterly consolidated leverage ratio (defined below) not to exceed 4.35 to 1.0.
Our fixed charge coverage ratio is comprised of dividing (i) (a) our consolidated EBITDAR, as defined in the Credit Facility, minus (b) certain capital expenditures, excluding debt incurred to finance capital expenditures, by (ii) the sum, without duplication of, (a) interest expense, cash rental expense, scheduled principal debt payments, certain payments with respect to the revolving credit facility, certain voluntary or discretionary principal payments or other prepayments of debt, taxes paid in cash, minus (b) any cash tax refunds received, plus (c) distributions paid in cash and payments made in respect of obligations under capital leases.
Our consolidated leverage ratio requires us not to exceed a ratio calculated by dividing (i) the sum of (a) our consolidated balance sheet debt, plus (b) sums obligated by Borrowers under letters of credit, plus (c) the present value (utilizing a discount rate of 10% annually) of all future lease payments on any operating leases, by (ii) our consolidated adjusted EBITDAR, as set forth in the Credit Facility.
In the past, we have had difficulty achieving profitability, causing us to risk breaching our fixed charge coverage ratio covenant. To avoid such breach, we have worked with our Lenders to obtain multiple amendments and waivers to the Credit Facility in return for higher interest rates, fees, and additional restrictions. In the fourth quarter of 2011, we entered into a fifth amendment that prevented a default of our fixed charge coverage ratio for the twelve months ended September 30, 2011, by adjusting the fixed charge coverage ratio for that period to 0.95 to 1.0 from 1.0 to 1.0. Subsequent to the fifth amendment, we entered into a sixth amendment to our Credit Facility that revises the definitions underlying our fixed charge coverage ratio, which we expect to provide us with additional flexibility under this covenant going forward. However, the sixth amendment also added the consolidated leverage ratio covenant discussed above, which could restrict our ability to incur additional indebtedness, undertake acquisitions, or make other capital investments to the extent such indebtedness, acquisitions, or capital investments would cause the leverage ratio to exceed the specified maximum. In exchange for these amendments, we agreed to the increases in interest rates and fees described above and paid fees and expenses of approximately $0.3 million.
Failure to comply with the covenants and restrictions set forth in the Credit Facility could result in an event of default. In such an event, all amounts outstanding under the Credit Facility, together with accrued interest, could then be declared immediately due and payable. If an event of default occurs under the Credit Facility and the Lenders cause all of the outstanding debt obligations under the Credit Facility to become due and payable, this could result in a default under other debt instruments that contain acceleration or cross-default provisions. The Credit Facility contains certain restrictions and covenants relating to, among other things, debt, dividends, liens, acquisitions and dispositions outside of the ordinary course of business, and affiliate transactions. Failure to comply with our financial covenant ratiosthe covenants and restrictions set forth in the Credit Facility could significantly constrain our liquidity and hinder our operations and growth prospects.result in an event of default.
Capital lease obligations are utilized to finance a portion of our revenue equipment and are entered into with certain finance companies who are not parties to our Credit Facility. The leases in effect at December 31, 20112012 terminate in September 2014 through September 2016 and contain guarantees of the residual value of the related equipment by us. As such, the residual guarantees are included in the related debt balance as a balloon payment at the end of the related term as well as included in the future minimum capital lease payments. These lease agreements require us to pay personal property taxes, maintenance, and operating expenses.
Pricing for the revenue equipment installment notes are quoted by the respective financial affiliates of our primary revenue equipment suppliers and other lenders at the funding of each group of equipment acquired and include fixed annual rates for new equipment under retail installment contracts. The notes included in the funding are due in monthly installments with final maturities at various dates ranging from January 20122013 to May 2016.January 2018. The notes contain certain requirements regarding payment, insuring of collateral, and other matters, but do not have any financial or other material covenants or events of default except certain notes totaling $156.1$126.5 million are cross-defaulted with the Credit Facility. Additional borrowings from the financial affiliates of our primary revenue equipment suppliers and other lenders are available to fund most new tractors expected to be delivered in 2012,2013, while any other property and equipment purchases, including trailers, will be funded with a combination of notes, operating leases, capital leases, and/or from the Credit Facility.
Contractual Obligations and Commercial Commitments (1)
The following table sets forth our contractual cash obligations and commitments as of December 31, 2011:2012:
Payments due by period: (in thousands) | | | | | | | | | | | | | | | | | | | | | | | | | | | | | | | | | | | | | | | | | | |
| Credit Facility, including interest (2) | | $ | 16,685 | | | $ | 16,685 | | | $ | - | | | $ | - | | | $ | - | | | $ | - | | | $ | - | | | $ | 5 | | | $ | - | | | $ | - | | | $ | - | | | $ | - | | | $ | 5 | | | $ | - | |
| | | | | | | | | | | | | | | | | | | | | | | | | | | | | | |
| Revenue equipment and property installment notes, including interest (3) | | $ | 228,985 | | | $ | 90,378 | | | $ | 56,434 | | | $ | 24,807 | | | $ | 32,489 | | | $ | 24,877 | | | $ | - | | | $ | 172,805 | | | $ | 70,140 | | | $ | 29,541 | | | $ | 35,493 | | | $ | 28,486 | | | $ | 7,033 | | | $ | 2,112 | |
| | | | | | | | | | | | | | | | | | | | | | | | | | | | | | |
| Operating leases (4) | | $ | 81,502 | | | $ | 19,792 | | | $ | 14,456 | | | $ | 8,804 | | | $ | 7,434 | | | $ | 4,309 | | | $ | 26,707 | | | $ | 112,089 | | | $ | 24,334 | | | $ | 21,152 | | | $ | 19,204 | | | $ | 14,464 | | | $ | 6,683 | | | $ | 26,252 | |
| | | | | | | | | | | | | | | | | | | | | | | | | | | | | | |
| Capital leases (5) | | $ | 21,239 | | | $ | 3,104 | | | $ | 3,104 | | | $ | 8,783 | | | $ | 3,362 | | | $ | 2,886 | | | $ | - | | | $ | 18,058 | | | $ | 3,059 | | | $ | 8,751 | | | $ | 3,362 | | | $ | 2,886 | | | $ | - | | | $ | - | |
| | | | | | | | | | | | | | | | | | | | | | | | | | | | | | |
| Lease residual value guarantees | | $ | 3,868 | | | $ | - | | | $ | - | | | $ | - | | | $ | - | | | $ | 3,868 | | | $ | - | | | $ | 9,221 | | | $ | - | | | $ | - | | | $ | - | | | $ | 5,711 | | | $ | 1,212 | | | $ | 2,298 | |
| | | | | | | | | | | | | | | | | | | | | | | | | | | | | | |
| Purchase obligations (6) | | $ | 56,412 | | | $ | 56,012 | | | $ | 400 | | | $ | - | | | $ | - | | | $ | - | | | $ | - | | | $ | 75,231 | | | $ | 75,231 | | | $ | - | | | $ | - | | | $ | - | | | $ | - | | | $ | - | |
| Total contractual cash obligations | | $ | 408,691 | | | $ | 185,971 | | | $ | 74,394 | | | $ | 42,394 | | | $ | 43,285 | | | $ | 35,940 | | | $ | 26,707 | | | $ | 387,409 | | | $ | 172,764 | | | $ | 59,444 | | | $ | 58,059 | | | $ | 51,547 | | | $ | 14,933 | | | $ | 30,662 | |
| (1) | Excludes any amounts accrued for unrecognized tax benefits as we are unable to reasonably predict the ultimate amount or timing of settlement of such unrecognized tax benefits. |
| (2) | Represents principal and interest payments owed at December 31, 2011.2012. The borrowings consist of draws under our Credit Facility, with fluctuating borrowing amounts and variable interest rates. While amounts outstanding under the Credit Facility are not due until September 2014, the related borrowings are reflected as current maturities in our consolidated balance sheet as a result of the Credit Facility requiring that the receipts from our lock-box automatically pay down the Credit Facility daily and additional borrowings be funded through additional draws against the Credit Facility. In determining future contractual interest and principal obligations, for variable interest rate debt, the interest rate and principal amount in place at December 31, 2011,2012, was utilized. The table assumes long-term debt is held to maturity. Refer to Note 8,7, "Debt" of the accompanying consolidated financial statements for further information. |
| (3) | Represents principal and interest payments owed at December 31, 2011.2012. The borrowings consist of installment notes with finance companies, with fixed borrowing amounts and fixed interest rates, except for a variable rate real estate note, for which the interest rate and principal amount in place at December 31, 2011,2012, was utilized. The table assumes these installment notes are held to maturity. Refer to Note 8,7, "Debt" of the accompanying consolidated financial statements for further information. |
| (4) | Represents future monthly rental payment obligations under operating leases for tractors, trailers, office and terminal properties, and computer and office equipment. Substantially all lease agreements for revenue equipment have fixed payment terms based on the passage of time. The tractor lease agreements generally stipulate maximum miles and provide for mileage penalties for excess miles. These leases generally run for a period of three to five years for tractors and five to seven years for trailers. Refer to Note 9,8, "Leases" of the accompanying consolidated financial statements for further information. |
| (5) | Represents principal and interest payments owed at December 31, 2011.2012. The borrowings consist of capital leases with several finance companies, with fixed borrowing amounts and fixed interest rates. Borrowings in 2014 and thereafter include the residual value guarantees on the related equipment as balloon payments. Refer to Note 8,7, "Debt" of the accompanying consolidated financial statements for further information. |
| (6) | Represents purchase obligations for revenue equipment totaling approximately $55.0$74.3 million in 2012.2013. These commitments are cancelable, subject to certain adjustments in the underlying obligations and benefits. Additionally, 20122013 purchase obligations includes $1.0$0.5 million related to TEL earn-out payments to be paid in 20122013 related to 20112012 performance. We also had commitments outstanding at December 31, 2011,2012, to acquire computer software totaling $0.4 million in 2013. These purchase commitments are expected to be financed by operating leases, capital leases, long-term debt, proceeds from sales of existing equipment, and/or cash flows from operations. Refer to Notes 87 and 9,8, "Debt" and "Leases", respectively, of the accompanying consolidated financial statements for further information. |
Off-Balance Sheet Arrangements
Operating leases have been an important source of financing for our revenue equipment, computer equipment, and certain real estate. At December 31, 2011,2012, we had financed 350607 tractors and 4,3633,816 trailers under operating leases. Vehicles held under operating leases are not carried on our consolidated balance sheets, and lease payments, in respect of such vehicles, are reflected in our consolidated statements of operations in the line item "Revenue equipment rentals and purchased transportation." Our revenue equipment rental expense was $15.2$19.7 million in 2011,2012, compared with $17.0$15.4 million in 20102011 as we moved to financing new revenue equipment purchases with on-balanceoff-balance sheet financing. The total amountpresent value of remaining payments under operating leases as of December 31, 20112012 was approximately $58.3$74.3 million. In connection with various operating leases, we issued residual value guarantees, which provide that if we do not purchase the leased equipment from the lessor at the end of the lease term, we are liable to the lessor for an amount equal to the shortage (if any) between the proceeds from the sale of the equipment and an agreed value. We estimate thatThe undiscounted value of the residual guarantees are approximately $3.9$9.2 million and $8.2$3.9 million at December 31, 20112012 and 2010,2011, respectively. The residual guarantees at December 31, 20112012 expire in 2016.between 2016 and 2019. We expect our residual guarantees to approximate the market value at the end of the lease term. We believe that proceeds from the sale of equipment under operating leases would exceed the payment obligation on substantially all operating leases.
On October 28, 2010, we executed a Letter Agreement ("Letter Agreement") with Transport International Pool, Inc. ("TIP"). The Letter Agreement modifies the Master Lease Agreement dated April 15, 2003, between TIP and us, pursuant to which we have entered into (among others) equipment lease schedules covering 2,446 trailers (the "Designated Schedules") which expired between November 2010 and May 2011. In addition, contemporaneously with the execution of the Letter Agreement, we returned 543 trailers in accordance with the terms of the Master Lease Agreement in order to better match our trailer fleet with our current number of tractors. Pursuant to the terms of the Letter Agreement, upon the scheduled expiration of each of the Designated Schedules, we will lease from TIP the trailers that are subject to such Designated Schedule on the terms and conditions set forth in the Letter Agreement and a new lease schedule attached to and made a part of the Letter Agreement. Under the terms of the Letter Agreement, the trailers subject to the agreement will be required to be returned or purchased at the rate of approximately 100 trailers per month beginning February 2012. The improved rental rate, coupledIn 2012, we began turning in the trailers that were covered by the Designated Schedules and replaced a portion of the trailers with the reductionnew ones, such that our total trailer count is approximately 450 less at December 31, 2012 than December 31, 2011. We plan to continue turning in rental expense associated with the return of 543 trailers, provided us with savings on the TIP trailers in fiscal year 2011, which2013 and 2014 pursuant to the Letter Agreement; however, these units will continue into 2012 absent any incremental costs from replacinggenerally be replaced on a large portionone-for-one basis with new trailers.
CRITICAL ACCOUNTING POLICIES AND ESTIMATES
The preparation of financial statements in conformity with accounting principles generally accepted in the U.S. requires us to make decisions based upon estimates, assumptions, and factors we consider as relevant to the circumstances. Such decisions include the selection of applicable accounting principles and the use of judgment in their application, the results of which impact reported amounts and disclosures. Changes in future economic conditions or other business circumstances may affect the outcomes of our estimates and assumptions. Accordingly, actual results could differ from those anticipated. A summary of the significant accounting policies followed in preparation of the financial statements is contained in Note 1, "Summary of Significant Accounting Policies," of the consolidated financial statements attached hereto. The following discussion addresses our most critical accounting policies, which are those that are both important to the portrayal of our financial condition and results of operations and that require significant judgment or use of complex estimates.
Revenue Recognition
Revenue, drivers' wages, and other direct operating expenses generated by our Truckload reportable segment are recognized on the date shipments are delivered to the customer. Revenue includes transportation revenue, fuel surcharges, loading and unloading activities, equipment detention, and other accessorial services.
Revenue generated by our Solutions reportable segment is recognized upon completion of the services provided. Revenue is recorded on a gross basis, without deducting third party purchased transportation costs, as we act as a principal with substantial risks as primary obligor, except for transactions whereby equipment from our Truckload segment perform the related services, which we record on a net basis in accordance with the related authoritative guidance.
revenue related to an accounts receivable factoring business started in 2012 to supplement several aspects of our non-asset operations. Revenue for this business is recognized on a net basis, given we are acting as an agent and are not the primary obligor in these transactions.
Depreciation of Revenue Equipment
Property and equipment is stated at cost less accumulated depreciation. Depreciation for book purposes is determined using the straight-line method over the estimated useful lives of the assets, while depreciation for tax purposes is generally recorded using an accelerated method. Depreciation of revenue equipment is our largest item of depreciation. We generally depreciate new tractors (excluding day cabs) over five years to salvage values of approximately 22%23% of their cost and new trailers over seven years for refrigerated trailers and ten years for dry van trailers to salvage values of approximately 22%21% of their cost. We annually review the reasonableness of our estimates regarding useful lives and salvage values of our revenue equipment and other long-lived assets based upon, among other things, our experience with similar assets, conditions in the used revenue equipment market, and prevailing industry practice. Over the past several years, the price of new tractors has risen dramatically and there has been significant volatility in the used equipment market. Changes in the useful life or salvage value estimates, or fluctuations in market values that are not reflected in our estimates, could have a material effect on our results of operations. Gains and losses on the disposal of revenue equipment are included in depreciation expense in the consolidated statements of operations.
Over the past several years, the price of new tractors has risen dramatically and there has been significant volatility in the used equipment market. In 2008, we recognized a $15.8 million pre-tax impairment charge related to revenue equipment, including assets held for sale; while in 2012, 2011, and 2010 we generated net gains of $6.8$4.9 million (including a $2.4 million gain on the sale of a terminal property), $6.7 million, and $4.3 million, respectively. As a result, in 2011 we adjustedWe review salvage values for units expected to be soldof our revenue equipment annually and adjust as needed based on trends in 2011 given the robust used equipment market, and as a result also recorded reduced depreciation per tractor in 2011. to ensure the assets are being depreciated to amounts that represent updated estimates of their fair value at disposal.
We lease certain revenue equipment under capital leases with terms of 60 months. Amortization of leased assets is included in depreciation and amortization expense.
Pursuant to applicable accounting standards, revenue equipment and other long-lived assets are tested for impairment whenever an event occurs that indicates an impairment may exist. Expected future cash flows are used to analyze whether an impairment has occurred. If the sum of expected undiscounted cash flows is less than the carrying value of the long-lived asset, then an impairment loss is recognized. We measure the impairment loss by comparing the fair value of the asset to its carrying value. Fair value is determined based on a discounted cash flow analysis or the appraised value of the assets, as appropriate.
Although a portion of our tractors are protected by non-binding indicative trade-in values or binding trade-back agreements with the manufacturers, we continue to have some tractors and substantially all of our owned trailers continue to be subject to fluctuations in market prices for used revenue equipment. Moreover, our trade-back agreements are contingent upon reaching acceptable terms for the purchase of new equipment. Further declines in the price of used revenue equipment or failure to reach agreement for the purchase of new tractors with the manufacturers issuing trade-back agreements could result in impairment of, or losses on the sale of, revenue equipment. Historically, only a de minimus percentage of our equipment has been sold back to the dealers pursuant to the trade back agreements as we have generally found that market prices exceeded the trade back allowances. Further, in recent years, trade back allowances have increased as a result of the increasing cost of the underlying equipment.
Assets Held For Sale
Assets held for sale include property and revenue equipment no longer utilized in continuing operations which are available and held for sale. Assets held for sale are no longer subject to depreciation, and are recorded at the lower of depreciated book value or fair market value less selling costs. We periodically review the carrying value of these assets for possible impairment. We expect to sell the majority of these assets within twelve months.
Goodwill and Other Intangible Assets
We classify intangible assets into two categories: (i) intangible assets with definite lives subject to amortization and (ii) goodwill. We test intangible assets with definite lives for impairment if conditions exist that indicate the carrying value may not be recoverable. Such conditions may include an economic downturn in a geographic market or a change in the assessment of future operations. We record an impairment charge when the carrying value of the definite lived intangible asset is not recoverable by the cash flows generated from the use of the asset.
We test goodwill for impairment at least annually or more frequently if events or circumstances indicate that such intangible assets or goodwill might be impaired. We perform our impairment tests of goodwill at the reporting unit level. Our reporting units are defined as our subsidiaries because each is a legal entity that is managed separately. Such impairment tests for goodwill include comparing the fair value of the respective reporting unit with its carrying value, including goodwill. We use a variety of methodologies in conducting these impairment tests, including discounted cash flow analyses and market analyses. AsDuring the year ended December 31, 2011, we recorded goodwill impairment of December 31,approximately $11.5 million, such that as of September 30, 2011, we have no goodwill on our consolidated balance sheet.
We determine the useful lives of our identifiable intangible assets after considering the specific facts and circumstances related to each intangible asset. Factors we consider when determining useful lives include the contractual term of any agreement, the history of the asset, our long-term strategy for the use of the asset, any laws or other local regulations which could impact the useful life of the asset, and other economic factors, including competition and specific market conditions. Intangible assets that are deemed to have definite lives are amortized, generally on a straight-line basis, over their useful lives, ranging from 4 to 20 years.
Insurance and Other Claims
The primary claims arising against us consist of cargo, liability, personal injury, property damage, workers' compensation, and employee medical expenses. Our insurance program involves self-insurance with high risk retention levels. Due to our significant self-insured retention amounts, we have exposure to fluctuations in the number and severity of claims and to variations between our estimated and actual ultimate payouts. We accrue the estimated cost of the uninsured portion of pending claims and an estimate for allocated loss adjustment expenses including legal and other direct costs associated with a claim. Estimates require judgments concerning the nature and severity of the claim, historical trends, advice from third-party administrators and insurers, the size of any potential damage award based on factors such as the specific facts of individual cases, the jurisdictions involved, the prospect of punitive damages, future medical costs, and inflation estimates of future claims development, and the legal and other costs to settle or defend the claims. We have significant exposure to fluctuations in the number and severity of claims. If there is an increase in the frequency and severity of claims, or we are required to accrue or pay additional amounts if the claims prove to be more severe than originally assessed, or any of the claims would exceed the limits of our insurance coverage, our profitability wouldcould be adversely affected.
In addition to estimates within our self-insured retention layers, we also must make judgments concerning claims where we have third party insurance and for claims outside our coverage limits. In addition, our current auto liability policy includes a policy release premium refund of up to $4.0 million per year, if certain losses are not met and we were to commute the policy for that policy year. We did not elect to commute the policy for the April 1, 2010 through March 31, 2011 policy year. However, in June 2012 we commuted the policy for the April 1, 2011 through March 31, 2012 policy year and as such are responsible for all claims that occurred during that policy year, excluding any claims between $10.0 million and $20.0 million, should such a claim develop. As a result of a few large accidents during the April 1, 2012 to March 31, 2013 policy year, management believes the possibility of commuting the policy for such year is remote. Our critical estimates include evaluating the likely exposure in each policy year and deciding whether to release the policy. Upon settling claims and expenses associated with claims where we have third party coverage, we are generally required to initially fund payment to the claimant and seek reimbursement from the insurer. Receivables from insurers for claims and expenses we have paid on their behalf total $2.0 million and $0.7 million at December 31, 2011 and 2010, respectively, and are included in drivers advances and other receivables on the consolidated balance sheet. Additionally, we accrue claims above our self-insured retention and record a corresponding receivable for amounts we expect to collect from insurers upon settlement of such claims. We have $2.2 million and $8.8 million at December 31, 2011 and 2010, respectively, as a receivable in other assets and as a corresponding accrual in the long-term portion of insurance and claims accruals on the consolidated balance sheet for claims above our self insured retention for which we believe it is reasonably assured that the insurers will provide their portion of such claims. We evaluate collectability of the receivables based on the credit worthiness and surplus of the insurers along with our prior experience and contractual terms with each. If any claim occurrence were to exceed our aggregate coverage limits, we would have to accrue for the excess amount. Our critical estimates include evaluating whether a claim may exceed such limits and, if so, by how much. If one or more claims were to exceed our then effective coverage limits, our financial condition and results of operations could be materially and adversely affected.
Effective April 1, 2010, we finalized ourOur casualty insurance renewal which resulted in a reduction in our self-insured retention limit for the primary excess layer of casualty claims tois no more than $1.0 million from the $4.0 million self-insured retention limit we had for a number of years.million. The policy is a three-year policy and includes a limit for a single loss of $9.0 million, an aggregate of $15.0 million for each policy year, and a $27.0 million aggregate for all three years. The policy includes a policy release premium refund of up to $4.0 million per year, if certain losses are not met and we were to commute the policy for that policy year. No receivable was recorded at Decemberyears ended March 31, 2011 or 2010 as it is not probable that any premium refund will be received. Additionally, effective April 1, 2010, we entered into new2013. Our excess policies for one to three years that cover up to $30.0 million per claim, subject to certain aggregate limits. Prior to April 1, 2010, we had insurance coverage up to $50.0 million per claim and were self-insured on an occurrence/per claim basis for personal injury and property damage claims for amounts up to the first $4.0 million, except for Star where we have insurance coverage for all periods presented up to $2.0 million per claim after the first $0.3 million for which we are self-insured. We are self-insured on an occurrence/per claim basis for workers' compensation up to the first $1.25 million. Effective April 1, 2010, we purchasedWe purchase coverage on an occurrence/occurrence per claim basis for any cargo losses in the $0.3 million to $2.0 million layer, with our contracts generally excluding the value of any cargo in excess of $0.3$2.0 million. Prior to April 1, 2010, we generally were completely self-insured for damages to the cargo we hauled. We also maintain a self-insured group medical plan for our Covenant Transport, Solutions, and corporate employees with annual per individual claimant stop-loss deductible of $0.4 million with a maximum lifetime benefit of $1.0 million. Star offers a self-insured group medical plan with annual per individual claimant stop-loss deductible of $0.2 million with a maximum lifetime benefit of $1.0 million, while SRT offers a fully insured group health program to its employees. We are completely self-insured for physical damage to our own tractors and trailers.
If claims development factors that are based upon historical experience change by 10%, our claims accrual as of December 31, 2011,2012, would change by approximately $1.0$3.5 million.
Lease Accounting and Off-Balance Sheet Transactions
We issue residual value guarantees in connection with the operating leases we enter into for certain of our revenue equipment. These leases provide that if we do not purchase the leased equipment from the lessor at the end of the lease term, then we are liable to the lessor for an amount equal to the shortage (if any) between the proceeds from the sale of the equipment and an agreed value. To the extent the expected value at the lease termination date is lower than the residual value guarantee; we would accrue for the difference over the remaining lease term. We believe that proceeds from the sale of equipment under operating leases would exceed the payment obligation on substantially all operating leases. The estimated values at lease termination involve management judgments. As leases are entered into, determination as to the classification as an operating or capital lease involves management judgments on residual values and useful lives.
Accounting for Income Taxes
Deferred tax assets and liabilities are recognized for the future tax consequences attributable to differences between the financial statement carrying amounts of existing assets and liabilities and their respective tax basis. Deferred tax assets and liabilities are measured using enacted tax rates expected to apply to taxable income in the years in which those temporary differences are expected to be recovered or settled. The effect on deferred tax assets and liabilities of a change in tax rates is recognized in income in the period that includes the enactment date. We have reflected the necessary deferred tax assets and liabilities in the accompanying consolidated balance sheets. We believe the future tax deductions will be realized principally through future reversals of existing taxable temporary differences and future taxable income, except for when a valuation allowance has been provided as discussed in Note 10. provided.
In the ordinary course of business there is inherent uncertainty in quantifying our income tax positions. We assess our income tax positions and record tax benefits for all years subject to examination based upon management's evaluation of the facts, circumstances, and information available at the reporting dates. For those tax positions where it is more-likely-than-not that a tax benefit will be sustained, we have recorded the largest amount of tax benefit with a greater than 50% likelihood of being realized upon ultimate settlement with a taxing authority that has full knowledge of all relevant information. For those income tax positions where it is not more-likely-than-not that a tax benefit will be sustained, no tax benefit has been recognized in the financial statements. Potential accrued interest and penalties related to unrecognized tax benefits are recognized as a component of income tax expense.
Stock-Based Employee Compensation
We issue several types of stock-based compensation, including awards that vest based on service, market, and performance conditions or a combination of the conditions. Performance-based awards vest contingent upon meeting certain performance criteria established by the Compensation Committee. Market-based awards vest contingent upon meeting certain stock price targets selected by the Compensation Committee. All awards require future service and thus forfeitures are estimated based on historical forfeitures and the remaining term until the related award vests. Determining the appropriate amount to expense in each period is based on likelihood and timing of achieving the stated targets for performance and market based awards, respectively, and requires judgment, including forecasting future financial results and market performance. The estimates are revised periodically based on the probability and timing of achieving the required performance and market targets, respectively, and adjustments are made as appropriate. Awards that are only subject to time vesting provisions are amortized using the straight-line method. The unvested shares at December 31, 2011 will vest based on when and if the related vesting criteria are met for each award. All awards require continued service to vest, noting that 187,000 of these awards vest solely based on continued service, which vest in varying increments between 2012 and 2015. Additionally, 35,000 awards vest based on market conditions such that one-third of the each employee's awards vests if our Class A stock trades above $11.00 for twenty trading days beginning January 1, 2012 through December 31, 2015. Performance-based awards account for 246,000 of the unvested shares at December 31, 2011, including 143,000 shares that will vest in two equal parts if our performance meets or exceeds a 0.5% and 1.0% improvement in the net income margin over 2010 results beginning January 1, 2011 through December 31, 2013 and 103,000 shares that will vest in two equal parts if our performance meets or exceeds a 0.5% and 1.0% improvement in the net income margin over 2011 results beginning January 1, 2012 through December 31, 2014. As of December 31, 2011, we had approximately $0.9 million of unrecognized compensation expense related to restricted stock awards, which is probable to be recognized over a weighted average period of approximately thirty-six months.
Fair Value of Financial Instruments
Our financial instruments consist primarily of cash and cash equivalents, accounts receivable, commodity contracts, accounts payable, and debt. The carrying amount of cash and cash equivalents, accounts receivable, accounts payable, and current debt approximates their fair value because of the short-term maturity of these instruments. Included in accounts receivable is $7.5 million of factoring receivables at December 31, 2012, net of a $0.1 million allowance for bad debts. We advance 80% to 90% of each receivable factored and retain the remainder as collateral for collection issues that might arise. The retained amounts are returned to the clients after the related receivable has been collected. At December 31, 2012, the retained amounts related to factored receivables totaled $0.3 million and were included in accounts payable in the consolidated balance sheet. Our clients are smaller trucking companies that factor their receivables to us for a fee to facilitate faster cash flow. We evaluate each client���s customer base and only factor specific receivables that meet predefined criteria. The carrying value of the factored receivables approximates the fair value, as the receivables are generally repaid directly to us by the client’s customer within 30-40 days due to the combination of the short-term nature of the financing transaction and the underlying quality of the receivables. Interest rates that are currently available to us for issuance of long-term debt with similar terms and remaining maturities are used to estimate the fair value of our long-term debt, which primarily consists of revenue equipment installment notes. The fair value of our revenue equpment installment notes approximated the carrying value at December 31, 2012, as the weighted average interest rate on these notes approximates the market rate for similar debt. Borrowings under our revolving credit facilityCredit Facility approximate fair value due to the variable interest rate on the facility. Additionally, commodity contracts, which are accounted for as hedge derivatives as discussed in Note 14 to the consolidated financial statements, are valued based on the forward rate of the specific indices upon which the contract is being settled and adjusted for counterparty credit risk using available market information and valuation methodologies.
Derivative Instruments and Hedging Activities
We periodically utilize derivative instruments to manage exposure to changes in fuel prices. At inception of a derivative contract, we document relationships between derivative instruments and hedged items, as well as our risk-management objective and strategy for undertaking various derivative transactions, and assess hedge effectiveness. We record derivative financial instruments in the balance sheet as either an asset or liability at fair value. If it is determined that a derivative is not highly effective as a hedge, or if a derivative ceases to be a highly effective hedge, we discontinue hedge accounting prospectively. The effective portion of changes in the fair value of derivatives are recorded in other comprehensive income and reclassified into earnings in the same period during which the hedged transaction affects earnings. The ineffective portion is recorded in other income or expense. Based on the amounts in accumulated other comprehensive income as of December 31, 2011,2012, and the expected timing of the purchases of the diesel hedged, we expect to reclassify less than $0.1approximately $0.3 million on derivative instruments from accumulated other comprehensive income into our results from operations during the next year due to actual diesel fuel purchases. The amounts actually realized will be dependent on the fair values as of the date of settlement. At December 31, 2011,2012, we had forward futures swap contracts on approximately 12.912.1 million gallons of diesel to be purchased in 2012,2013, or approximately 21.4%20% of our projected 20122013 fuel requirements, and approximately 4.0 million gallons of diesel to be purchased in 2014 or approximately 6% of projected 2014 fuel requirements. While the value of our hedges was de minimusapproximately $0.5 million at December 31, 2011,2012, there has been volatility in the petroleum markets, which we expect to continue into 2012.2013. As a result, we expect volatility in the price we pay for fuel and the value of the hedges.
Recent Accounting Pronouncements
There are no recently promulgated accounting pronouncements (either recently adopted or yet to be adopted) that are likely to have a material impact on our financial reporting. See "Recent Accounting Pronouncements" in Note 1 to the consolidated financial statements.
INFLATION, NEW EMISSIONS CONTROL REGULATIONS, AND FUEL COSTS
Most of our operating expenses are inflation-sensitive, with inflation generally producing increased costs of operations. During the past four years, the most significant effects of inflation have been on revenue equipment prices and fuel prices. New emissions control regulations and increases in commodity prices, wages of manufacturing workers, and other items have resulted in higher tractor prices. The cost of fuel has been extremely volatile over the last fourfive years, with costs trending upward in 2012, 2011 and 2010 after a reprieve in 2009 from the record high prices in 2008. Although weWe believe at least some of this increase primarily reflects the weak U.S. dollar, increased Asian demand for petroleum products, and unrest in certain oil-producing countries, rather than underlyingcountries. As the United States and global economies recover, we believe that this trend will likely continue as a result of inflationary pressure, wepressure. We have attempted to limit the effects of inflation through certain cost control efforts and limiting the effects of fuel prices through fuel surcharges. Fluctuations in the price or availability of fuel, as well as hedging activities, surcharge collection, the percentage of freight we obtain through brokers, and the volume and terms of diesel fuel purchase commitments may increase our costs of operation, which could materially and adversely affect our profitability. We impose fuel surcharges on substantially all accounts. These arrangements generally do not fully protect us from fuel price increases and also may prevent us from receiving the full benefit of any fuel price decreases. We may be forced to make cash payments under the hedging arrangements and the absence of meaningful fuel price protection through these measures could adversely affect our profitability.
The cost of engines used in our tractors are subject to emissions control regulations, which have substantially increased our capital costs since additional and more stringent regulation began in 2002. As of December 31, 2011,2012, almost 100% of our tractor fleet had engines compliant with stricter regulations regarding emissions that became effective in 2007 and 37.1%51.8% of our tractor fleet had engines compliant with stricter regulations regarding emissions that became effective in 2010. Compliance with such regulations has increased and in our estimation will continue to increase the cost of new tractors, may not provide fuel mileage increases proportionate to the increase in the cost of equipment, and could increase our operations and maintenance expense. These adverse effects and the residual values that will be realized from the disposition of these vehicles could increase our costs or otherwise adversely affect our business or operations as the regulations impact our business through new tractor purchases.
SEASONALITY
In the trucking industry, revenue generally decreases as customers reduce shipments during the winter holiday season and as inclement weather impedes operations. At the same time, operating expenses generally increase, with fuel efficiency declining because of engine idling and weather, creating more equipment repairs. For the reasons stated, first quarter results historically have been lower than results in each of the other three quarters of the year excluding charges. Our equipment utilization typically improves substantially between May and October of each year because of the trucking industry's seasonal shortage of equipment on traffic originating in California and because of general increases in shipping demand during those months. During September and October, business sometimes increases as a result of increased retail merchandise shipped in anticipation of the holidays. Due to the economic downturn and related low inventory levels, this historical trend has not been presentless pronounced over the past several years, including fiscal 20112012 and 2010,2011, as we have seen increases in demand at varying times, specifically March through June, based primarily on restocking required to replenish inventories and less pronounced seasonal spikes prior to the holidays.
We experience various market risks, including changes in interest rates and fuel prices. We do not enter into derivatives or other financial instruments for trading or speculative purposes, or when there are no underlying related exposures.
COMMODITY PRICE RISK
We are subject to risks associated with the availability and price of fuel, which are subject to political, economic, and market factors that are outside of our control. We also may be adversely affected by the timing and degree of fluctuations in fuel prices. Our fuel-surcharge program mitigates the effect of rising fuel prices but does not always result in fully recovering the increase in our cost of fuel. In part, this is due to fuel costs that cannot be billed to customers, including costs such as those incurred in connection with empty and out-of-route miles or when engines are being idled during cold or warm weather and due to fluctuations in the price of fuel between the fuel surcharge's benchmark index reset.
In an effort to seek to reduce the variability of the ultimate cash flows associated with fluctuations in diesel fuel prices, we periodically enter into various derivative instruments, including forward futures swap contracts. As diesel fuel is not a traded commodity on the futures market, heating oil is used as a substitute for diesel fuel becauseas prices for both generally move in similar directions. Under these contracts, we pay a fixed rate per gallon of heating oil and receive the monthly average price of New York heating oil per the NYMEX. Based on"NYMEX" (New York Mercantile Exchange). The retrospective and prospective regression analyses provided that changes in the prices of diesel fuel and heating oil were deemed to be highly effective based on the relevant authoritative guidance. We do not engage in speculative transactions, nor do we hold or issue financial instruments for trading purposes.
At December 31, 2011, we had forward futures swap contractsWe recognize all derivative instruments at fair value on approximately 12.9 million gallonsour consolidated balance sheets. Our derivative instruments are designated as cash flow hedges, thus the effective portion of diesel tothe gain or loss on the derivatives is reported as a component of accumulated other comprehensive income and will be purchasedreclassified into earnings in 2012 or approximately 21.4%the same period during which the hedged transaction affects earnings. The effective portion of our projected 2012 fuel requirements.
Thethe derivative represents the change in fair value of the contractshedge that wereoffsets the change in effect at December 31, 2011, which had a fair value of approximately $0.1 million and are includedthe hedged item. To the extent the change in the fair value of the hedge does not perfectly offset the change in the fair value of the hedged item, the ineffective portion of the hedge is immediately recognized in other assetsincome on our consolidated statements of operations. Ineffectiveness is calculated using the cumulative dollar offset method as an estimate of the difference in the consolidated balance sheet, are includedexpected cash flows of the heating oil futures contracts compared to the changes in accumulated other comprehensive income, net of tax. Additionally, $1.9 million was reclassified from accumulated other comprehensive income to our results from operationsthe all-in cash outflows required for the year ended December 31, 2011, related to gains on contracts that expired or were sold and for which we completed the forecasted transaction by purchasing the hedged diesel fuel.fuel purchases.
During the fourth quarter of 2010, the Company sold all of its contracts related to the forecasted purchase of diesel fuel in 2011 to lock-in the related gains. The gains totaling $0.5 million are included in accumulated other comprehensive income, net of tax of $0.3 million. As such, there are no outstanding derivative instruments at December 31, 2010. During 2010, $1.8 million was reclassified from accumulated other comprehensive income to earnings related to gains on contracts that expired or were sold and for which the Company completed the forecasted transaction by purchasing the hedged diesel fuel. At December 31, 2009, the Company's derivative instruments2012, we had a fair value of $0.5 million, while the offsetting $0.3 million, net of tax of $0.2 million, was included in accumulated other comprehensive income. No amounts were reclassified from accumulated other comprehensive income into earnings in 2009 given theforward futures swap contracts were forward starting in 2010 and as such there had been no transactions involving purchases of the related diesel fuel being hedged at December 31, 2009.
During the second quarter of 2010, the Company entered into a fixed forward purchase agreement with a fuel vendor whereby the Company agreed to purchase 0.5on approximately 12.1 million gallons of diesel to be purchased in 2013 or approximately 20% of our projected annual 2013 fuel per month for twenty-four monthsrequirements and included4.0 million gallons to be purchased in the contract was a hedge2014 or approximately 6% of the related cost of theour projected annual 2014 fuel under which the Company pays a fixed rate per gallon of heating oil and receives the monthly average price of New York heating oil per the NYMEX. The hedge and related purchase of the fuel was accounted for using the normal purchases and sales scope exception given management concluded that all relevant criteria were met. Subsequent to entering into the agreement, the Company sold the related contract as a result of a significant gain on the hedge and determination that the fundamentals of the petroleum markets provided for the likely ability of the Company to both realize the gain and enter into a subsequent hedge to mitigate the risk at a similar cost. The termination of the agreement generated a $0.8 million gain that was recorded during the second quarter of 2010 and is included as a reduction in fuel expense.requirements.
Based on the amounts in accumulated other comprehensive income as of December 31, 20112012 and the expected timing of the purchases of the diesel hedged, we expect to reclassify less than $0.1approximately $0.3 million on derivative instruments from accumulated other comprehensive income into our results from operations during the next year due to the actual diesel fuel purchases. The amounts actually realized will be dependent on the fair values as of the date of settlement.
The aggregate result of our various hedging activities related initiatives provided for a reduction of $3.1 million, $1.9 million, and $2.6$1.8 million in fuel costs in 2012, 2011, and 2010, respectively. Based on our expected fuel consumption for 2012,2013, a one dollar change in the related price of heating oil or diesel per gallon would change our net fuel expense by approximately $5.1$4.4 million, assuming no further changes to our fuel hedging program or our fuel surcharge recovery. This sensitivity analysis considers that we purchase approximately 65.0 million gallons of diesel annually, on which we recovered 74.5% of the cost in 2012. Assuming our fuel surcharge recovery is consistent in 2013, this leaves 16.5 million gallons that are not covered by the natural hedge created by our fuel surcharges. Of such gallons, 12.1 million are hedged, leaving 4.4 million gallons fully exposed to market fluctuations.
INTEREST RATE RISK
Our market risk is also affected by changes in interest rates. Historically, we have used a combination of fixed-rate and variable-rate obligations to manage our interest rate exposure. Fixed-rate obligations expose us to the risk that interest rates might fall. Variable-rate obligations expose us to the risk that interest rates might raise. Of our total $242.5$174.9 million of debt, we had $18.5$2.3 million of variable rate debt outstanding at December 31, 2011,2012, including both our Credit Facility and a real-estate note whereas at December 31, 2010,2011, of our total $225.2$242.5 million of debt, we had $2.9$18.5 million of variable rate debt outstanding including our Credit Facility and a real-estate note. The interest rates applicable to these agreements are based on either the prime rate or LIBOR. Our earnings would be affected by changes in these short-term interest rates. Risk can be quantified by measuring the financial impact of a near-term adverse increase in short-term interest rates. At our current level of borrowing, a 1% increase in our applicable rate would reduce annual pre-tax earnings by $0.2less than $0.1 million and less than $0.1$0.2 million as of December 31, 20112012 and 2010,2011, respectively. Our remaining debt is fixed rate debt, and therefore changes in market interest rates do not directly impact our interest expense.
ITEM 8. 8. FINANCIAL STATEMENTS AND SUPPLEMENTARY DATA
The consolidated financial statements of Covenant Transportation Group, Inc. and subsidiaries including the consolidated balance sheets as of December 31, 20112012 and 2010,2011, and the related statements of operations, statements of stockholders' equity and comprehensive income (loss), statements of stockholders' equity, and statements of cash flows for each of the years in the three-year period ended December 31, 2011,2012, together with the related notes, and the report of KPMG LLP, our independent registered public accounting firm as of and for the years ended December 31, 2012, 2011, 2010, and 20092010 are set forth at pages 5043 through 7567 elsewhere in this report.
ITEM 9. 9. CHANGES IN AND DISAGREEMENTS WITH ACCOUNTANTS ON ACCOUNTING AND FINANCIAL DISCLOSURE
There has been no change in accountants during our three most recent fiscal years.
Evaluation of Disclosure Controls and Procedures
We have established disclosure controls and procedures to ensure that material information relating to us and our consolidated subsidiaries is made known to the officers who certify our financial reports and to other members of senior management and the Board of Directors.
Based on their evaluation as of December 31, 2011,2012, our Chief Executive Officer and Chief Financial Officer have concluded that our disclosure controls and procedures (as defined in Rule 13a-15 and 15d-15 under the Exchange Act) are effective to ensure that the information required to be disclosed by us in the reports that we file or submit under the Exchange Act is recorded, processed, summarized, and reported within the time periods specified in SEC rules and forms.
Management's Annual Report on Internal Control Over Financial Reporting
Management is responsible for establishing and maintaining adequate internal control over financial reporting. Internal control over financial reporting is defined in Rule 13a-15 promulgated under the Exchange Act as a process designed by, or under the supervision of, the principal executive and principal financial officers and effected by the board of directors, management, and other personnel, to provide reasonable assurance regarding the reliability of financial reporting and the preparation of financial statements for external purposes in accordance with generally accepted accounting principles and includes those policies and procedures that:
| • | pertain to the maintenance of records, that in reasonable detail, accurately and fairly reflect the transactions and dispositions of our assets; |
| • | provide reasonable assurance that transactions are recorded as necessary to permit preparation of financial statements in accordance with generally accepted accounting principles, and that our receipts and expenditures are being made only in accordance with authorizations of our management and directors; and |
| • | provide reasonable assurance regarding prevention or timely detection of unauthorized acquisition, use, or disposition of our assets that could have a material effect on our financial statements. |
We have confidence in our internal controls and procedures. Nevertheless, our management, including our Chief Executive Officer and Chief Financial Officer, does not expect that our disclosure procedures and controls or our internal controls will prevent all errors or intentional fraud. An internal control system, no matter how well-conceived and operated, can provide only reasonable, not absolute, assurance that the objectives of such internal controls are met. Further, the design of an internal control system must reflect the fact that there are resource constraints, and the benefits of controls must be considered relative to their costs. As a result of the inherent limitations in all internal control systems, no evaluation of controls can provide absolute assurance that all our control issues and instances of fraud, if any, have been detected.
Management assessed the effectiveness of our internal control over financial reporting as of December 31, 2011.2012. In making this assessment, management used the criteria set forth by the Committee of Sponsoring Organizations of the Treadway Commission, (COSO), an Internal Control-Integrated Framework. Based on its assessment, management believes that, as of December 31, 2011,2012, our internal control over financial reporting is effective based on those criteria.
Attestation Report of Independent Registered Public Accounting Firm
This annual report does not include an attestation report of our registered public accounting firm regarding internal control over financial reporting. Management's report was not subject to attestation by our registered public accounting firm pursuant to rules of the Securities and Exchange Commission that permit us to provide only management's report in this annual report given our status as a non-accelerated filer.smaller reporting company.
Design and Changes in Internal Control over Financial Reporting
Disclosure controls and procedures are controls and other procedures that are designed to ensure that information required to be disclosed in our reports filed or submitted under the Exchange Act is recorded, processed, summarized, and reported within the time periods specified in the Securities and Exchange Commission's rules and forms. In accordance with these controls and procedures, information is accumulated and communicated to management, including our Chief Executive Officer, as appropriate, to allow timely decisions regarding disclosures. There were no changes in our internal control over financial reporting that occurred during the quarter ended December 31, 2011,2012, that have materially affected, or are reasonably likely to materially affect, our internal control over financial reporting.
None.
PART III
We incorporate by reference the information respecting executive officers and directors set forth under the captions "Proposal 1 - Election of Directors", "Corporate Governance – Section 16(a) Beneficial Ownership Reporting Compliance", "Corporate Governance – Our Executive Officers", "Corporate Governance – Code of Conduct and Ethics", and "Corporate Governance – Committees of the Board of Directors – The Audit Committee" in our Proxy Statement for the 20122013 annual meeting of stockholders, which will be filed with the Securities and Exchange Commission in accordance with Rule 14a-6 promulgated under the Securities Exchange Act of 1934, as amended (the "Proxy Statement"); provided, that the section entitled "Corporate Governance – Committees of the Board of Directors – The Audit Committee – Report of the Audit Committee" contained in the Proxy Statement areis not incorporated by reference.
We incorporate by reference the information set forth under the sections entitled "Executive Compensation", "Corporate Governance – Committees of the Board of Directors – The Compensation Committee – Compensation Committee Interlocks and Insider Participation", and "Corporate Governance – Committees of the Board of Directors – The Compensation Committee –Compensation Committee Report"– Report of the Compensation Committee" in ourthe Proxy Statement for the 2012 annual meeting of stockholders;Statement; provided, that the section entitled "Corporate Governance – Committees of the Board of Directors – The Compensation Committee – Report of the Compensation Committee Report"Committee" contained in the Proxy Statement is not incorporated by reference.
ITEM 12. SECUR12ITY. SECURITY OWNERSHIP OF CERTAIN BENEFICIAL OWNERS AND MANAGEMENT AND RELATED STOCKHOLDER MATTERS
The following table provides certain information, as of December 31, 2011,2012, with respect to our compensation plans and other arrangements under which shares of our Class A common stock are authorized for issuance.
Equity Compensation Plan Information
| Number of securities to be issued upon exercise of outstanding options, warrants and rights | Weighted average exercise price of outstanding options warrants and rights | Number of securities remaining eligible for future issuance under equity compensation plans (excluding securities reflected in column (a)) | | Number of securities to be issued upon exercise of outstanding options, warrants and rights | | | Weighted average exercise price of outstanding options, warrants and rights | | | Number of securities remaining eligible for future issuance under equity compensation plans (excluding securities reflected in column (a)) | |
| | | | | | | | | | | | | |
Equity compensation plans approved by security holders | 437,000 (1) 468,000 (2) | $ 15.67 $ - | - 584,000 | | | 332,863(1) 764,295 (2) | | | $ $ | 15.70 - | | | | - 224,731 | |
Equity compensation plans not approved by security holders | | | | | - | | | | - | | | | - | |
| Total | | | | | | 1,097,158 | | | $ | 15.70 | | | | 224,731 | |
| (1) | Stock Optionsoptions granted under our 1994, 2003, and 2006 Incentive Plans. |
| (2) | Restricted Stockstock granted under the 2006 Omnibus Incentive Plan, as amended. |
We incorporate by reference the information set forth under the section entitled "Security Ownership of Certain Beneficial Owners and Management" in the Proxy Statement.
ITEM 13. 13. CERTAIN RELATIONSHIPS AND RELATED TRANSACTIONS, AND DIRECTOR INDEPENDENCE
We incorporate by reference the information set forth under the sections entitled "Corporate Governance – Board of Directors and Its Committees" and "Certain Relationships and Related Transactions" in the Proxy Statement.
We incorporate by reference the information set forth under the section entitled "Relationships with Independent Registered Public Accounting Firm – Principal Accountant Fees and Services" in the Proxy Statement.
PART IV
| (a) | 1. | Financial Statements. | |
| | | | |
| | | Our audited consolidated financial statements are set forth at the following pages of this report: | |
| | | Report of Independent Registered Public Accounting Firm – KPMG LLP | |
| | | Consolidated Balance Sheets | |
| | | Consolidated Statements of Operations | |
| | Consolidated Statements of Comprehensive Income (Loss) | |
| | | Consolidated Statements of Stockholders' Equity and Comprehensive Income (Loss) | |
| | | Consolidated Statements of Cash Flows | |
| | | Notes to Consolidated Financial Statements | |
| | | | |
| | 2. | Financial Statement Schedules. | |
| | | | |
| | | Financial statement schedules are not required because all required information is included in the financial statements or is not applicable. | |
| | | | |
| | 3. | Exhibits. | |
| | | | |
| | | The exhibits required to be filed by Item 601 of Regulation S-K are listed under paragraph (b) below and on the Exhibit Index appearing at the end of this report. Management contracts and compensatory plans or arrangements are indicated by an asterisk. | |
| | | | |
| (b) | | Exhibits. | |
| | | | |
| | | The following exhibits are filed with this Form 10-K or incorporated by reference to the document set forth next to the exhibit listed below. | |
Exhibit Number | Reference | Description |
| 3.1 | | Amended and Restated Articles of Incorporation (Incorporated by reference to Exhibit 99.2 to the Company's Report on Form 8-K, filed May 29, 2007) |
| 3.2 | | Second Amended and Restated Bylaws, dated February 22, 2011 (Incorporated by reference to Exhibit 3.2 to the Company's Form 10-Q, filed May 13, 2011) |
| 4.1 | | Amended and Restated Articles of Incorporation (Incorporated by reference to Exhibit 99.2 to the Company's Report on Form 8-K, filed May 29, 2007) |
| 4.2 | | Second Amended and Restated Bylaws, dated December 6, 2007February 22, 2011 (Incorporated by reference to Exhibit 3.2 to the Company's Form 10-K,10-Q, filed March 17, 2008)May 13, 2011) |
| 10.1 | | 401(k) Plan (Incorporated by reference to Exhibit 10.10 to the Company's Form S-1, Registration No. 33-82978, effective October 28, 1994) |
| 10.2 | | Master Lease Agreement, dated April 15, 2003, between Transport International Pool, Inc. and Covenant Transport, Inc. (Incorporated by reference to Exhibit 10.4 to the Company's Form 10-Q/A, filed October 31, 2003) |
| 10.3 | * | Form of Indemnification Agreement between Covenant Transport, Inc. and each officer and director, effective May 1, 2004 (Incorporated by reference to Exhibit 10.2 to the Company's Form 10-Q, filed August 5, 2004) |
| 10.4 | | Purchase and Sale Agreement, dated April 3, 2006, between Covenant Transport, Inc., a Tennessee corporation, and CT Chattanooga TN, LLC (Incorporated by reference to Exhibit 10.4 to the Company's Form 10-K, filed March 31,30, 2010) |
| 10.5 | | Lease Agreement, dated April 3, 2006, between Covenant Transport, Inc., a Tennessee corporation, and CT Chattanooga TN, LLC (Incorporated by reference to Exhibit 10.5 to the Company's Form 10-K, filed March 31,30, 2010) |
| 10.6 | | Lease Guaranty, dated April 3, 2006, by Covenant Transport, Inc., a Nevada corporation, for the benefit of CT Chattanooga TN, LLC (Incorporated by reference to Exhibit 10.20 to the Company's Report on Form 8-K, filed April 7, 2006) |
| 10.7 | * | Form of Restricted Stock Award Notice under the Covenant Transport, Inc. 2006 Omnibus Incentive Plan (Incorporated by reference to Exhibit 10.22 to the Company's Form 10-Q, filed August 9, 2006) |
| 10.8 | * | Form of Restricted Stock Special Award Notice under the Covenant Transport, Inc. 2006 Omnibus Incentive Plan (Incorporated by reference to Exhibit 10.23 to the Company's Form 10-Q, filed August 9, 2006) |
| 10.9 | * | Form of Incentive Stock Option Award Notice under the Covenant Transport, Inc. 2006 Omnibus Incentive Plan (Incorporated by reference to Exhibit 10.24 to the Company's Form 10-Q, filed August 9, 2006) |
| 10.10 | | Form of Lease Agreement used in connection with Daimler Facility (Incorporated by reference to Exhibit 10.3 to the Company's Form 10-Q, filed August 11, 2008) |
| 10.11 | | Amendment to Lease Agreement (Open End) (Incorporated by reference to Exhibit 10.4 to the Company's Form 10-Q, filed August 11, 2008) |
| 10.12 | | Form of Direct Purchase Money Loan and Security Agreement used in connection with Daimler Facility (Incorporated by reference to Exhibit 10.5 to the Company's Form 10-Q, filed August 11, 2008) |
| 10.13 | | Amendment to Direct Purchase Money Loan and Security Agreement (Incorporated by reference to Exhibit 10.6 to the Company's Form 10-Q, filed August 11, 2008) |
| 10.14 | | Third Amended and Restated Credit Agreement, dated September 23, 2008, among Covenant Transportation Group, Inc., Covenant Transport, Inc., CTG Leasing Company, Covenant Asset Management, Inc., Southern Refrigerated Transport, Inc., Covenant Transport Solutions, Inc., Star Transportation, Inc., Bank of America, N.A., JPMorgan Chase Bank, N.A., and Textron Financial Corporation (Incorporated by reference to Exhibit 10.14 to the Company's Form 10-K, filed March 31,30, 2010) |
| 10.15 | * | Covenant Transportation Group, Inc. Amended and Restated 2006 Omnibus Incentive Plan (Incorporated by reference to Appendix A to the Company's Schedule 14A, filed April 10, 2009) |
| 10.16 | | First Amendment No. 1 to Third Amended and Restated Credit Agreement, dated March 27, 2009 among Covenant Transportation Group, Inc., Covenant Transport, Inc., CTG Leasing Company, Covenant Asset Management, Inc., Southern Refrigerated Transport, Inc., Covenant Transport Solutions, Inc., Star Transportation, Inc., Bank of America, N.A., JPMorgan Chase Bank, N.A., and Textron Financial Corporation (Incorporated by reference to Exhibit 10.1 to the Company's Form 10-Q, filed May 15, 2009) |
| 10.17 | * | Description of Covenant Transportation Group, Inc. 2009 Voluntary Incentive Opportunity, dated March 31, 2009 (Incorporated by reference to Exhibit 10.2 to the Company's Form 10-Q, filed May 15, 2009) |
10.18 | * | Description of Covenant Transportation Group, Inc. 2009 Named Executive Officer Bonus Program, dated March 31, 2009 (Incorporated by reference to Exhibit 10.3 to the Company's Form 10-Q, filed May 15, 2009) |
10.19 | | Second Amendment to Third Amended and Restated Credit Agreement, dated February 25, 2010, among Covenant Transportation Group, Inc., Covenant Transport, Inc., CTG Leasing Company, Covenant Asset Management, Inc., Southern Refrigerated Transport, Inc., Covenant Transport Solutions, Inc., Star Transportation, Inc., Bank of America, N.A., JPMorgan Chase Bank, N.A., and Textron Financial Corporation (Incorporated by reference to Exhibit 10.1 to the Company's Form 10-Q, filed May 17, 2010) |
10.2010.18 | | Third Amendment to Third Amended and Restated Credit Agreement dated July 30, 2010 among Covenant Transportation Group, Inc., Covenant Transport, Inc., CTG Leasing Company, Covenant Asset Management, Inc., Southern Refrigerated Transport, Inc., Covenant Transport Solutions, Inc., Star Transportation, Inc., and Bank of America, N.A., as agent (Incorporated by reference to Exhibit 10.1 to the Company's Form 10-Q, filed November 9, 2010) |
10.2110.19 | | Fourth Amendment to Third Amended and Restated Credit Agreement dated August 31, 2010 among Covenant Transportation Group, Inc., Covenant Transport, Inc., CTG Leasing Company, Covenant Asset Management, Inc., Southern Refrigerated Transport, Inc., Covenant Transport Solutions, Inc., Star Transportation, Inc., and Bank of America, N.A., as agent (Incorporated by reference to Exhibit 10.2 to the Company's Form 10-Q, filed November 9, 2010) |
10.2210.20 | | Letter Agreement, dated October 28, 2010, between Transport International Pool, Inc., Covenant Transport, Inc. and CTG Leasing Company (Incorporated by reference to Exhibit 10.22 to the Company's Form 10-K, filed March 1, 2011) |
10.2310.21 | | Fifth Amendment to Third Amended and Restated Credit Agreement dated September 1, 2011 among Covenant Transportation Group, Inc., Covenant Transport, Inc., CTG Leasing Company, Covenant Asset Management, Inc., Southern Refrigerated Transport, Inc., Covenant Transport Solutions, Inc., Star Transportation, Inc., and Bank of America, N.A., as agent (Incorporated by reference to Exhibit 10.1 to the Company's Report on Form 8-K, filed October 28, 2011) |
10.2410.22 | | Sixth Amendment to Third Amended and Restated Credit Agreement dated effective as of October 24, 2011 among Covenant Transportation Group, Inc., Covenant Transport, Inc., CTG Leasing Company, Covenant Asset Management, Inc., Southern Refrigerated Transport, Inc., Covenant Transport Solutions, Inc., Star Transportation, Inc., and Bank of America, N.A., as agent (Incorporated by reference to Exhibit 10.2 to the Company's Report on Form 8-K, filed October 28, 2011) |
| 10.23 | | Seventh Amendment to Third Amended and Restated Credit Agreement dated effective as of March 29, 2012 among Covenant Transportation Group, Inc., Covenant Transport, Inc., CTG Leasing Company, Covenant Asset Management, Inc., Southern Refrigerated Transport, Inc., Covenant Transport Solutions, Inc., Star Transportation, Inc., and Bank of America, N.A., as agent (Incorporated by reference to Exhibit 10.1 to the Company's Report on Form 8-K, filed April 2, 2012) |
| 10.24 | | Eighth Amendment to Third Amended and Restated Credit Agreement dated effective as of December 31, 2012 among Covenant Transportation Group, Inc., Covenant Transport, Inc., CTG Leasing Company, Covenant Asset Management, Inc., Southern Refrigerated Transport, Inc., Covenant Transport Solutions, Inc., Star Transportation, Inc., and Bank of America, N.A., as agent (Incorporated by reference to Exhibit 10.1 to the Company's Report on Form 8-K, filed January 31, 2013) |
| * # | Description of 2011 Bonus Plan |
| * # | Description of 2012 Bonus Plan |
| * # | Description of Director Compensation Program |
| # | List of Subsidiaries |
| # | Consent of Independent Registered Public Accounting Firm – KPMG LLP |
| # | Consent of Independent Auditor – Lattimore Black Morgan & Cain, PC |
| # | Certification pursuant to Item 601(b)(31) of Regulation S-K, as adopted pursuant to Section 302 of the Sarbanes-Oxley Act of 2002, by David R. Parker, the Company's ChiefPrincipal Executive Officer |
| # | Certification pursuant to Item 601(b)(31) of Regulation S-K, as adopted pursuant to Section 302 of the Sarbanes-Oxley Act of 2002, by Richard B. Cribbs, the Company's ChiefPrincipal Financial Officer |
| # | Certification pursuant to 18 U.S.C. Section 1350, as adopted pursuant to Section 906 of the Sarbanes-Oxley Act of 2002, by David R. Parker, the Company's Chief Executive Officer |
| # | Certification pursuant to 18 U.S.C. Section 1350, as adopted pursuant to Section 906 of the Sarbanes-Oxley Act of 2002, by Richard B. Cribbs, the Company's Chief Financial Officer |
| # | Financial Statements of Transport Enterprise Leasing, LLC |
| 101.INS | ** | XBRL Instance Document |
| 101.SCH | ** | XBRL Taxonomy Extension Schema Document |
| 101.CAL | ** | XBRL Taxonomy Extension Calculation Linkbase Document |
| 101.DEF | ** | XBRL Taxonomy Extension Definition Linkbase Document |
| 101.LAB | ** | XBRL Taxonomy Extension Labels Linkbase Document |
| 101.PRE | ** | XBRL Taxonomy Extension Presentation Linkbase Document |
References:
| # | Filed herewith |
| * | Management contract or compensatory plan or arrangement. |
| ** | In accordance with Regulation S-T, the XBRL-related information in Exhibit 101 to this Annual Report on Form 10-K shall be deemed to be "furnished" and not "filed." |
Pursuant to the requirements of Section 13 or 15(d) of the Securities Exchange Act of 1934, the registrant has duly caused this report to be signed on its behalf by the undersigned, thereunto duly authorized.
| | COVENANT TRANSPORTATION GROUP, INC. |
| | |
| | |
Date: March 9, 201228, 2013 | By: | /s/ Richard B. Cribbs |
| | | Richard B. Cribbs |
| | | Senior Vice President and Chief Financial Officer in his capacity as such and on behalf of the issuer. |
Pursuant to the requirements of the Securities Exchange Act of 1934, this report has been signed below by the following persons on behalf of the registrant and in the capacities and on the dates indicated.
| Signature and Title | | Date |
| | | |
| /s/ David R. Parker | | March 9, 201228, 2013 |
| David R. Parker | | |
Chairman of the Board, President, and Chief Executive Officer (principal executive officer) | | |
| | | |
| /s/ Richard B. Cribbs | | March 9, 201228, 2013 |
| Richard B. Cribbs | | |
Senior Vice President and Chief Financial Officer (principal financial officer) | | |
| | | |
| /s/ M. Paul Bunn | | March 9, 201228, 2013 |
| M. Paul Bunn | | |
Chief Accounting Officer (principal accounting officer) | | |
| | | |
| /s/ Bradley A. Moline | | March 9, 201228, 2013 |
| Bradley A. Moline | | |
| Director | | |
| | | |
| /s/ William T. Alt | | March 9, 201228, 2013 |
| William T. Alt | | |
| Director | | |
| | | |
| /s/ Robert E. Bosworth | | March 9, 201225, 2013 |
| Robert E. Bosworth | | |
| Director | | |
| | | |
| /s/ Niel B. Nielson | | March 9, 201228, 2013 |
| Niel B. Nielson | | |
| Director | | |
The Board of Directors and Stockholders
Covenant Transportation Group, Inc.:
We have audited the accompanying consolidated balance sheets of Covenant Transportation Group, Inc. and subsidiaries as of December 31, 20112012 and 2010,2011, and the related consolidated statements of operations, stockholders' equity and comprehensive income (loss), stockholders' equity, and cash flows for each of the years in the three-year period ended December 31, 2011.2012. These consolidated financial statements are the responsibility of the Company's management. Our responsibility is to express an opinion on these consolidated financial statements based on our audits.
We conducted our audits in accordance with the standards of the Public Company Accounting Oversight Board (United States). Those standards require that we plan and perform the audit to obtain reasonable assurance about whether the financial statements are free of material misstatement. An audit includes examining, on a test basis, evidence supporting the amounts and disclosures in the financial statements. An audit also includes assessing the accounting principles used and significant estimates made by management, as well as evaluating the overall financial statement presentation. We believe that our audits provide a reasonable basis for our opinion.
In our opinion, the consolidated financial statements referred to above present fairly, in all material respects, the financial position of Covenant Transportation Group, Inc. and subsidiaries as of December 31, 20112012 and 2010,2011, and the results of their operations and their cash flows for each of the years in the three-year period ended December 31, 2011,2012, in conformity with U.S. generally accepted accounting principles.
/s/ KPMG LLP
Atlanta, Georgia
March 9, 201228, 2013
CONSOLIDATED BALANCE SHEETS DECEMBER 31, 2011 AND 2010 (In thousands, except share data) | | |
COVENANT TRANSPORTATION GROUP, INC. AND SUBSIDIARIES DECEMBER 31, 2012 AND 2011 (In thousands, except share data) | | COVENANT TRANSPORTATION GROUP, INC. AND SUBSIDIARIES DECEMBER 31, 2012 AND 2011 (In thousands, except share data) | |
| | | | | | | | |
| | | 2011 | | | 2010 | | | | | | | |
| ASSETS | | | | | | | | | | | | |
| Current assets: | | | | | | | | | | | | |
Cash and cash equivalents | | $ | 3,895 | | | $ | 9,361 | | | $ | 6,846 | | | $ | 3,895 | |
Accounts receivable, net of allowance of $1,711 in 2011 and $1,537 in 2010 | | | 64,676 | | | | 60,816 | | |
Drivers' advances and other receivables, net of allowance of $730 in 2011 and $2,499 in 2010 | | | 5,711 | | | | 4,591 | | |
| Accounts receivable, net of allowance of $1,729 in 2012 and $1,711 in 2011 | | | | 76,220 | | | | 64,676 | |
| Drivers' advances and other receivables, net of allowance of $1,041 in 2012 and $730 in 2011 | | | | 3,851 | | | | 5,711 | |
Inventory and supplies | | | 4,611 | | | | 4,481 | | | | 4,550 | | | | 4,611 | |
Prepaid expenses | | | 8,002 | | | | 8,833 | | | | 8,244 | | | | 8,002 | |
Assets held for sale | | | 16,891 | | | | 802 | | | | 3,898 | | | | 16,891 | |
Deferred income taxes | | | 4,383 | | | | 677 | | | | 4,642 | | | | 4,383 | |
Income taxes receivable | | | 232 | | | | 1,577 | | | | 59 | | | | 232 | |
| Total current assets | | | 108,401 | | | | 91,138 | | | | 108,310 | | | | 108,401 | |
| | | | | | | | | | | | | | | | | |
| Property and equipment, at cost | | | 440,051 | | | | 450,467 | | | | 419,947 | | | | 440,051 | |
| Less: accumulated depreciation and amortization | | | (117,748 | ) | | | (126,513 | ) | | | (140,930 | ) | | | (117,748 | ) |
Net property and equipment | | | 322,303 | | | | 323,954 | | | | 279,017 | | | | 322,303 | |
| | | | | | | | | | | | | | | | | |
| Goodwill | | | - | | | | 11,539 | | |
| Other assets, net | | | 9,121 | | | | 14,548 | | | | 12,905 | | | | 9,121 | |
| | | | | | | | | | | | | | | | | |
| Total assets | | $ | 439,825 | | | $ | 441,179 | | | $ | 400,232 | | | $ | 439,825 | |
| LIABILITIES AND STOCKHOLDERS' EQUITY | | | | | | | | | | | | | | | | |
| Current liabilities: | | | | | | | | | | | | | | | | |
Checks outstanding in excess of bank balances | | $ | 5,963 | | | $ | 4,795 | | | $ | 8,261 | | | $ | 5,963 | |
Accounts payable | | | 8,752 | | | | 6,902 | | | | 10,035 | | | | 8,752 | |
Accrued expenses | | | 23,272 | | | | 26,481 | | | | 27,884 | | | | 23,272 | |
Current maturities of long-term debt | | | 96,258 | | | | 68,400 | | | | 63,636 | | | | 96,258 | |
Current portion of capital lease obligations | | | 1,957 | | | | 1,399 | | | | 2,091 | | | | 1,957 | |
Current portion of insurance and claims accrual | | | 14,303 | | | | 13,927 | | | | 16,383 | | | | 14,303 | |
| Total current liabilities | | | 150,505 | | | | 121,904 | | | | 128,290 | | | | 150,505 | |
| | | | | | | | | | | | | | | | | |
Long-term debt | | | 128,167 | | | | 141,942 | | | | 95,214 | | | | 128,167 | |
Long-term portion of capital lease obligations | | | 16,129 | | | | 13,418 | | | | 14,003 | | | | 16,129 | |
Insurance and claims accrual | | | 13,734 | | | | 19,713 | | | | 16,768 | | | | 13,734 | |
Deferred income taxes | | | 42,670 | | | | 41,821 | | | | 49,837 | | | | 42,670 | |
Other long-term liabilities | | | 1,565 | | | | 1,683 | | | | 1,447 | | | | 1,565 | |
| Total liabilities | | | 352,770 | | | | 340,481 | | | | 305,559 | | | | 352,770 | |
| Commitments and contingent liabilities | | | - | | | | - | | | | - | | | | - | |
| Stockholders' equity: | | | | | | | | | | | | | | | | |
Class A common stock, $.01 par value; 20,000,000 shares authorized; 13,469,090 shares issued; 12,371,552 and 12,190,682 outstanding as of December 31, 2011 and 2010, respectively | | | 143 | | | | 140 | | |
| Class A common stock, $.01 par value; 20,000,000 shares authorized; 13,469,090 shares issued; 12,409,447 and 12,371,552 outstanding as of December 31, 2012 and 2011, respectively | | | | 143 | | | | 143 | |
Class B common stock, $.01 par value; 5,000,000 shares authorized; 2,350,000 shares issued and outstanding | | | 24 | | | | 24 | | | | 24 | | | | 24 | |
Additional paid-in-capital | | | 89,535 | | | | 90,842 | | | | 90,328 | | | | 89,535 | |
Treasury stock at cost; 1,097,538 and 1,278,408 shares as of December 31, 2011 and 2010, respectively | | | (14,445 | ) | | | (16,799 | ) | |
| Treasury stock at cost; 1,059,643 and 1,097,538 shares as of December 31, 2012 and 2011, respectively | | | | (13,955 | ) | | | (14,445 | ) |
Accumulated other comprehensive income | | | 50 | | | | 476 | | | | 320 | | | | 50 | |
Retained earnings | | | 11,748 | | | | 26,015 | | | | 17,813 | | | | 11,748 | |
| Total stockholders' equity | | | 87,055 | | | | 100,698 | | | | 94,673 | | | | 87,055 | |
| Total liabilities and stockholders' equity | | $ | 439,825 | | | $ | 441,179 | | | $ | 400,232 | | | $ | 439,825 | |
The accompanying notes are an integral part of these consolidated financial statements.
CONSOLIDATED STATEMENTS OF OPERATIONS YEARS ENDED DECEMBER 31, 2011, 2010, AND 2009 (In thousands, except per share data) | | |
COVENANT TRANSPORTATION GROUP, INC. AND SUBSIDIARIES YEARS ENDED DECEMBER 31, 2012, 2011, AND 2010 (In thousands, except per share data) | | COVENANT TRANSPORTATION GROUP, INC. AND SUBSIDIARIES YEARS ENDED DECEMBER 31, 2012, 2011, AND 2010 (In thousands, except per share data) | |
| | | | | | | | | | | |
| | | 2011 | | | 2010 | | | 2009 | | | 2012 | | | 2011 | | | 2010 | |
| Revenues | | | | | | | | | | | | | | | | | | |
Freight revenue | | $ | 512,026 | | | $ | 546,320 | | | $ | 520,495 | | | $ | 529,080 | | | $ | 512,026 | | | $ | 546,320 | |
Fuel surcharge revenue | | | 140,601 | | | | 103,429 | | | | 68,192 | | | | 145,174 | | | | 140,601 | | | | 103,429 | |
| Total revenue | | $ | 652,627 | | | $ | 649,749 | | | $ | 588,687 | | | $ | 674,254 | | | $ | 652,627 | | | $ | 649,749 | |
| | | | | | | | | | | | | | | | | | | | | | | | | |
| Operating expenses: | | | | | | | | | | | | | | | | | | | | | | | | |
Salaries, wages, and related expenses | | | 211,169 | | | | 216,316 | | | | 220,213 | | | | 217,080 | | | | 211,169 | | | | 216,316 | |
Fuel expense | | | 208,693 | | | | 177,239 | | | | 143,835 | | | | 194,841 | | | | 208,693 | | | | 177,239 | |
Operations and maintenance | | | 43,585 | | | | 42,050 | | | | 40,833 | | | | 45,265 | | | | 43,585 | | | | 42,050 | |
Revenue equipment rentals and purchased transportation | | | 63,353 | | | | 71,474 | | | | 76,484 | | | | 85,010 | | | | 63,353 | | | | 71,474 | |
Operating taxes and licenses | | | 12,148 | | | | 11,090 | | | | 12,113 | | | | 11,043 | | | | 12,148 | | | | 11,090 | |
Insurance and claims | | | 36,163 | | | | 32,648 | | | | 26,531 | | | | 33,707 | | | | 36,163 | | | | 32,648 | |
Communications and utilities | | | 5,137 | | | | 4,974 | | | | 5,740 | | | | 4,809 | | | | 5,137 | | | | 4,974 | |
General supplies and expenses | | | 15,627 | | | | 16,143 | | | | 19,538 | | | | 16,068 | | | | 15,627 | | | | 16,143 | |
Depreciation and amortization, including gains and losses on disposition of equipment | | | 46,274 | | | | 51,807 | | | | 48,122 | | | | 43,222 | | | | 46,274 | | | | 51,807 | |
Goodwill impairment | | | 11,539 | | | | - | | | | - | | | | - | | | | 11,539 | | | | - | |
| Total operating expenses | | | 653,688 | | | | 623,741 | | | | 593,409 | | | | 651,045 | | | | 653,688 | | | | 623,741 | |
| Operating (loss) income | | | (1,061 | ) | | | 26,008 | | | | (4,722 | ) | |
| Other (income) expenses: | | | | | | | | | | | | | |
| Operating income (loss) | | | | 23,209 | | | | (1,061 | ) | | | 26,008 | |
| Other expenses (income): | | | | | | | | | | | | | |
Interest expense | | | 16,208 | | | | 16,566 | | | | 14,184 | | | | 12,697 | | | | 16,208 | | | | 16,566 | |
Interest income | | | (32 | ) | | | (2 | ) | | | (144 | ) | | | - | | | | (32 | ) | | | (2 | ) |
Loss on sale of Transplace investment and note receivable | | | - | | | | - | | | | 11,485 | | |
Other | | | (123 | ) | | | (20 | ) | | | (199 | ) | | | (13 | ) | | | (123 | ) | | | (20 | ) |
| Other expenses, net | | | 16,053 | | | | 16,544 | | | | 25,326 | | | | 12,684 | | | | 16,053 | | | | 16,544 | |
| Equity in income of affiliate | | | 675 | | | | - | | | | - | | | | 1,875 | | | | 675 | | | | - | |
| (Loss) income (loss) before income taxes | | | (16,439 | ) | | | 9,464 | | | | (30,048 | ) | |
| Income tax (benefit) expense | | | (2,172 | ) | | | 6,175 | | | | (5,018 | ) | |
| Net (loss) income | | $ | (14,267 | ) | | $ | 3,289 | | | $ | (25,030 | ) | |
| Income (loss) before income taxes | | | | 12,400 | | | | (16,439 | ) | | | 9,464 | |
| Income tax expense (benefit) | | | | 6,335 | | | | (2,172 | ) | | | 6,175 | |
| Net income (loss) | | | $ | 6,065 | | | $ | (14,267 | ) | | $ | 3,289 | |
| (Loss) income per share: | | | | | | | | | |
| Basic (loss) income per share: | | $ | (0.97 | ) | | $ | 0.23 | | | $ | (1.77 | ) |
| | | | | | | | | | | | | |
| Diluted (loss) income per share: | | $ | (0.97 | ) | | $ | 0.23 | | | $ | (1.77 | ) |
| | | | | | | | | | | | | |
| Basic weighted average shares outstanding | | | 14,689 | | | | 14,374 | | | | 14,124 | |
| | | | | | | | | | | | | |
| Diluted weighted average shares outstanding | | | 14,689 | | | | 14,505 | | | | 14,124 | |
| Income (loss) per share: | | | | | | | | | |
| Basic income (loss) per share: | | $ | 0.41 | | | $ | (0.97 | ) | | $ | 0.23 | |
| | | | | | | | | | | | | |
| Diluted income (loss) per share: | | $ | 0.41 | | | $ | (0.97 | ) | | $ | 0.23 | |
| | | | | | | | | | | | | |
| Basic weighted average shares outstanding | | | 14,742 | | | | 14,689 | | | | 14,374 | |
| | | | | | | | | | | | | |
| Diluted weighted average shares outstanding | | | 14,808 | | | | 14,689 | | | | 14,505 | |
The accompanying notes are an integral part of these consolidated financial statements.
COVENANT TRANSPORTATION GROUP, INC. AND SUBSIDIARIES
FOR THE YEARS ENDED DECEMBER 31, 2012, 2011, AND 2010
(In thousands)
| | | | | | | | | | |
| | | | | | | | | | |
| Net income (loss) | | $ | 6,065 | | | $ | (14,267 | ) | | $ | 3,289 | |
| | | | | | | | | | | | | |
Other comprehensive income (loss): | | | | | | | | | | | | |
| Unrealized gain on effective portion of fuel hedges, net of tax of $2,100, $935, and $1,208 in 2012, 2011 and 2010, respectively | | | 3,369 | | | | 1,500 | | | | 1,938 | |
| | | | | | | | | | | | | |
| Reclassification of fuel hedge gains into statement of operations, net of tax of $1,932, $1,200, and $1,101 in 2012, 2011, and 2010, respectively | | | (3,099 | ) | | | (1,926 | ) | | | (1,767 | ) |
| Total other comprehensive income (loss) | | | 270 | | | | (426 | ) | | | 171 | |
| | | | | | | | | | | | | |
| Comprehensive income (loss) | | $ | 6,335 | | | $ | (14,693 | ) | | $ | 3,460 | |
The accompanying notes are an integral part of these consolidated financial statements.
AND COMPREHENSIVE INCOME (LOSS)
FOR THE YEARS ENDED DECEMBER 31, 2012, 2011, 2010, AND 20092010
(In thousands)
| | | Common Stock | | | Additional Paid-In Capital | | | Treasury Stock | | | Accumulated Other Comprehensive Income | | | Retained Earnings | | | Total Stockholders' Equity | |
| | | Class A | | | Class B | | | | | | | | | | | |
| | | | | | | | | | | | | | | | | | | | | | |
Balances at December 31, 2008 | | $ | 135 | | | $ | 24 | | | $ | 91,912 | | | $ | (21,007 | ) | | $ | - | | | $ | 47,756 | | | $ | 118,820 | |
| Net loss | | | - | | | | - | | | | - | | | | - | | | | - | | | | (25,030 | ) | | | (25,030 | ) |
| Other comprehensive loss: | | | | | | | | | | | | | | | | | | | | | | | | | | | | |
Unrealized gain on effective portion of fuel hedge, net of tax of $191 | | | - | | | | - | | | | - | | | | - | | | | 305 | | | | - | | | | 305 | |
| Comprehensive loss | | | - | | | | - | | | | - | | | | - | | | | 305 | | | | (25,030 | ) | | | (24,725 | ) |
| Stock-based employee compensation cost | | | - | | | | - | | | | 595 | | | | - | | | | - | | | | - | | | | 595 | |
| Issuance of restricted stock | | | 1 | | | | - | | | | (1,828 | ) | | | 1,812 | | | | - | | | | - | | | | (15 | ) |
| Balances at December 31, 2009 | | $ | 136 | | | $ | 24 | | | $ | 90,679 | | | $ | (19,195 | ) | | $ | 305 | | | $ | 22,726 | | | $ | 94,675 | |
| Net income | | | - | | | | - | | | | - | | | | - | | | | - | | | | 3,289 | | | | 3,289 | |
| Other comprehensive income: | | | | | | | | | | | | | | | | | | | | | | | | | | | | |
Unrealized gain on effective portion of fuel hedge, net of tax of $746 | | | - | | | | - | | | | - | | | | - | | | | 1,938 | | | | - | | | | 1,938 | |
| Comprehensive income | | | - | | | | - | | | | - | | | | - | | | | 1,938 | | | | 3,289 | | | | 5,227 | |
| Reclassification of fuel hedge gain into statement of operations, net of tax of $680 | | | - | | | | - | | | | - | | | | - | | | | (1,767 | ) | | | - | | | | (1,767 | ) |
| Issuance of restricted stock | | | 2 | | | | - | | | | (2,582 | ) | | | 2,396 | | | | - | | | | - | | | | (184 | ) |
| Exercise of stock options | | | 2 | | | | - | | | | 1,306 | | | | - | | | | - | | | | - | | | | 1,308 | |
| Income tax benefit arising from exercise of stock options and restricted stock vesting | | | - | | | | - | | | | 421 | | | | - | | | | - | | | | - | | | | 421 | |
| Stock-based employee compensation cost | | | - | | | | - | | | | 1,018 | | | | - | | | | - | | | | - | | | | 1,018 | |
| | | | | | | | | | | | | | | | | | | | | | | | | | | | | |
| Balances at December 31, 2010 | | $ | 140 | | | $ | 24 | | | $ | 90,842 | | | $ | (16,799 | ) | | $ | 476 | | | $ | 26,015 | | | $ | 100,698 | |
| Net loss | | | - | | | | - | | | | - | | | | - | | | | - | | | | (14,267 | ) | | | (14,267 | ) |
| Other comprehensive loss: | | | | | | | | | | | | | | | | | | | | | | | | | | | | |
Unrealized gain on effective portion of fuel hedge, net of tax of $576 | | | - | | | | - | | | | - | | | | - | | | | 1,500 | | | | - | | | | 1,500 | |
| Comprehensive loss | | | - | | | | - | | | | - | | | | - | | | | 1,500 | | | | (14,267 | ) | | | (12,767 | ) |
| Reclassification of fuel hedge gain into statement of operations, net of tax of $740 | | | - | | | | - | | | | - | | | | - | | | | (1,926 | ) | | | - | | | | (1,926 | ) |
| Issuance of restricted stock | | | 3 | | | | - | | | | (2,765 | ) | | | 2,354 | | | | - | | | | - | | | | (408 | ) |
| Income tax benefit arising from restricted stock vesting | | | - | | | | - | | | | 432 | | | | - | | | | - | | | | - | | | | 432 | |
| Stock-based employee compensation cost | | | - | | | | - | | | | 1,026 | | | | - | | | | - | | | | - | | | | 1,026 | |
| | | | | | | | | | | | | | | | | | | | | | | | | | | | | |
| Balances at December 31, 2011 | | $ | 143 | | | $ | 24 | | | $ | 89,535 | | | $ | (14,445 | ) | | $ | 50 | | | $ | 11,748 | | | $ | 87,055 | |
| | | Common Stock | | | | | | | | | | | | | | | | |
| | | | | | | | | Additional Paid-In Capital | | | | | | Accumulated Other Comprehensive Income | | | | | | | |
| | | | | | | | | | | | | | | | | | | | | | |
| Balances at December 31, 2009 | | $ | 136 | | | $ | 24 | | | $ | 90,679 | | | $ | (19,195 | ) | | $ | 305 | | | $ | 22,726 | | | $ | 94,675 | |
| Net income | | | - | | | | - | | | | - | | | | - | | | | - | | | | 3,289 | | | | 3,289 | |
| Other comprehensive income | | | - | | | | - | | | | - | | | | - | | | | 171 | | | | - | | | | 171 | |
| Income tax benefit arising from exercise of stock options and restricted stock vesting | | | - | | | | - | | | | 421 | | | | - | | | | - | | | | - | | | | 421 | |
Stock-based employee compensation cost | | | - | | | | - | | | | 1,018 | | | | - | | | | - | | | | - | | | | 1,018 | |
| Issuance of restricted stock, net | | | 2 | | | | - | | | | (2,582 | ) | | | 2,396 | | | | - | | | | - | | | | (184 | ) |
| Exercise of stock options | | | 2 | | | | - | | | | 1,306 | | | | - | | | | - | | | | - | | | | 1,308 | |
| Balances at December 31, 2010 | | $ | 140 | | | $ | 24 | | | $ | 90,842 | | | $ | (16,799 | ) | | $ | 476 | | | $ | 26,015 | | | $ | 100,698 | �� |
| Net loss | | | - | | | | - | | | | - | | | | - | | | | - | | | | (14,267 | ) | | | (14,267 | ) |
| Other comprehensive loss | | | - | | | | - | | | | - | | | | - | | | | (426 | ) | | | - | | | | (426 | ) |
| Income tax benefit arising from restricted stock vesting | | | - | | | | - | | | | 432 | | | | - | | | | - | | | | - | | | | 432 | |
Stock-based employee compensation cost | | | - | | | | - | | | | 1,026 | | | | - | | | | - | | | | - | | | | 1,026 | |
| Issuance of restricted stock, net | | | 3 | | | | - | | | | (2,765 | ) | | | 2,354 | | | | - | | | | - | | | | (408 | ) |
| Balances at December 31, 2011 | | $ | 143 | | | $ | 24 | | | $ | 89,535 | | | $ | (14,445 | ) | | $ | 50 | | | $ | 11,748 | | | $ | 87,055 | |
| Net income | | | - | | | | - | | | | - | | | | - | | | | - | | | | 6,065 | | | | 6,065 | |
| Other comprehensive income | | | - | | | | - | | | | - | | | | - | | | | 270 | | | | - | | | | 270 | |
Stock-based employee compensation cost | | | - | | | | - | | | | 1,184 | | | | - | | | | - | | | | - | | | | 1,184 | |
| Issuance of restricted stock, net | | | - | | | | - | | | | (391 | ) | | | 490 | | | | - | | | | - | | | | 99 | |
| Balances at December 31, 2012 | | $ | 143 | | | $ | 24 | | | $ | 90,328 | | | $ | (13,955 | ) | | $ | 320 | | | $ | 17,813 | | | $ | 94,673 | |
The accompanying notes are an integral part of these consolidated financial statements.
FOR THE YEARS ENDED DECEMBER 31, 2012, 2011, 2010, AND 20092010
(In thousands)
| | | 2011 | | | 2010 | | | 2009 | | | | | | | | | | |
| Cash flows from operating activities: | | | | | | | | | | | | | | | | | | |
| Net (loss) income | | $ | (14,267 | ) | | $ | 3,289 | | | $ | (25,030 | ) | |
| Adjustments to reconcile net (loss) income to net cash provided by operating activities: | | | | | | | | | | | | | |
| Net income (loss) | | | $ | 6,065 | | | $ | (14,267 | ) | | $ | 3,289 | |
| Adjustments to reconcile net income (loss) to net cash provided by operating activities: | | | | | | | | | | | | | |
Provision for losses on accounts receivable | | | 713 | | | | 422 | | | | 1,727 | | | | 904 | | | | 713 | | | | 422 | |
Deferred gain on sales of equipment to affiliate | | | 562 | | | | - | | | | - | | | | 198 | | | | 562 | | | | - | |
Depreciation and amortization | | | 53,001 | | | | 56,100 | | | | 47,987 | | | | 48,135 | | | | 53,001 | | | | 56,100 | |
Goodwill impairment | | | 11,539 | | | | - | | | | - | | | | - | | | | 11,539 | | | | - | |
Amortization of deferred financing fees | | | 414 | | | | 715 | | | | 851 | | | | 492 | | | | 414 | | | | 715 | |
Loss on sale of Transplace investment and note receivable | | | - | | | | - | | | | 11,485 | | |
Gain on ineffective portion of fuel hedge | | | - | | | | - | | | | (31 | ) | |
(Reversal into earnings) deferred gain on fuel hedge | | | (773 | ) | | | 773 | | | | - | | | | - | | | | (773 | ) | | | 773 | |
Casualty premium credit | | | | (4,000 | ) | | | - | | | | - | |
Equity in income of affiliate | | | (675 | ) | | | - | | | | - | | | | (1,875 | ) | | | (675 | ) | | | - | |
Deferred income tax (benefit) expense | | | (2,158 | ) | | | 17,422 | | | | (8,664 | ) | |
Deferred income tax expense (benefit) | | | | 6,735 | | | | (2,158 | ) | | | 17,422 | |
(Gain) loss on disposition of property and equipment | | | (6,727 | ) | | | (4,293 | ) | | | 135 | | | | (4,913 | ) | | | (6,727 | ) | | | (4,293 | ) |
Income tax benefit arising from restricted share vesting and exercise of stock options | | | (432 | ) | | | (421 | ) | | | - | | | | - | | | | (432 | ) | | | (421 | ) |
Stock-based compensation expense | | | 1,226 | | | | 1,118 | | | | 695 | | | | 1,284 | | | | 1,226 | | | | 1,118 | |
Changes in operating assets and liabilities: | | | | | | | | | | | | | | | | | | | | | | | | |
Receivables and advances | | | (4,348 | ) | | | 1,018 | | | | 9,948 | | | | (10,415 | ) | | | (4,348 | ) | | | 1,018 | |
Prepaid expenses and other assets | | | 1,513 | | | | (2,097 | ) | | | 1,545 | | | | 4,630 | | | | 1,513 | | | | (2,097 | ) |
Inventory and supplies | | | (130 | ) | | | (477 | ) | | | (110 | ) | | | 61 | | | | (130 | ) | | | (477 | ) |
Insurance and claims accrual | | | 1,056 | | | | 1,690 | | | | (9,543 | ) | | | 3,979 | | | | 1,056 | | | | 1,690 | |
Accounts payable and accrued expenses | | | (8,453 | ) | | | (4,420 | ) | | | (97 | ) | | | 3,821 | | | | (8,453 | ) | | | (4,420 | ) |
| Net cash flows provided by operating activities | | | 32,061 | | | | 70,839 | | | | 30,898 | | | | 55,101 | | | | 32,061 | | | | 70,839 | |
| | | | | | | | | | | | | | | | | | | | | | | | | |
| Cash flows from investing activities: | | | | | | | | | | | | | | | | | | | | | | | | |
Acquisition of property and equipment | | | (114,800 | ) | | | (137,347 | ) | | | (113,063 | ) | | | (41,787 | ) | | | (114,800 | ) | | | (137,347 | ) |
Investment in affiliated company | | | (1,500 | ) | | | - | | | | - | | | | (2,900 | ) | | | (1,500 | ) | | | - | |
Return of investment in affiliated company | | | 241 | | | | - | | | | - | | | | 316 | | | | 241 | | | | - | |
Proceeds from disposition of property and equipment | | | 65,318 | | | | 55,075 | | | | 50,305 | | | | 57,525 | | | | 65,318 | | | | 55,075 | |
Payment of acquisition obligation | | | - | | | | - | | | | (250 | ) | |
| Net cash flows used in investing activities | | | (50,741 | ) | | | (82,272 | ) | | | (63,008 | ) | |
| Net cash flows provided by (used in) investing activities | | | | 13,154 | | | | (50,741 | ) | | | (82,272 | ) |
| | | | | | | | | | | | | | | | | | | | | | | | | |
| Cash flows from financing activities: | | | | | | | | | | | | | | | | | | | | | | | | |
Payment of minimum tax withholdings on stock compensation | | | (561 | ) | | | (284 | ) | | | (115 | ) | | | (9 | ) | | | (561 | ) | | | (284 | ) |
Proceeds from the exercise of stock options | | | - | | | | 1,308 | | | | - | | | | - | | | | - | | | | 1,308 | |
Proceeds (repayments) from/of borrowings under revolving credit facility, net | | | 15,869 | | | | (12,665 | ) | | | 8,879 | | |
(Repayments) proceeds from/of borrowings under revolving credit facility, net | | | | (15,885 | ) | | | 15,869 | | | | (12,665 | ) |
Repayments of capital lease obligation | | | (1,651 | ) | | | (1,158 | ) | | | (298 | ) | | | (1,992 | ) | | | (1,651 | ) | | | (1,158 | ) |
Change in checks outstanding in excess of bank balances | | | 1,168 | | | | (43 | ) | | | 4,753 | | | | 2,298 | | | | 1,168 | | | | (43 | ) |
Proceeds from issuance of notes payable | | | 85,152 | | | | 97,766 | | | | 95,592 | | | | 26,395 | | | | 85,152 | | | | 97,766 | |
Repayments of notes payable | | | (86,938 | ) | | | (76,208 | ) | | | (70,219 | ) | | | (76,085 | ) | | | (86,938 | ) | | | (76,208 | ) |
Debt refinancing costs | | | (257 | ) | | | (564 | ) | | | (561 | ) | | | (26 | ) | | | (257 | ) | | | (564 | ) |
Income tax benefit arising from restricted share vesting and exercise of stock options | | | 432 | | | | 421 | | | | - | | | | - | | | | 432 | | | | 421 | |
| Net cash flows provided by financing activities | | | 13,214 | | | | 8,573 | | | | 38,031 | | |
| Net cash flows (used in) provided by financing activities | | | | (65,304 | ) | | | 13,214 | | | | 8,573 | |
| | | | | | | | | | | | | | | | | | | | | | | | | |
| Net change in cash and cash equivalents | | | (5,466 | ) | | | (2,860 | ) | | | 5,921 | | | | 2,951 | | | | (5,466 | ) | | | (2,860 | ) |
| | | | | | | | | | | | | | | | | | | | | | | | | |
| Cash and cash equivalents at beginning of year | | | 9,361 | | | | 12,221 | | | | 6,300 | | | | 3,895 | | | | 9,361 | | | | 12,221 | |
| Cash and cash equivalents at end of year | | $ | 3,895 | | | $ | 9,361 | | | $ | 12,221 | | | $ | 6,846 | | | $ | 3,895 | | | $ | 9,361 | |
| | | | | | | | | | | | | | |
| Supplemental disclosure of cash flow information: | | | | | | | | | | | | | |
Cash paid (received) during the year for: | | | | | | | | | | | | | |
Interest, net of capitalized interest | | $ | 16,236 | | | $ | 16,710 | | | $ | 13,016 | | |
Income taxes | | $ | (295 | ) | | $ | (7,928 | ) | | $ | 239 | | |
Equipment purchased under capital leases | | $ | 4,920 | | | $ | 2,405 | | | $ | 14,000 | | |
Non-cash change in variable rate real-estate note | | $ | - | | | $ | - | | | $ | 157 | | |
Accrued property additions | | $ | - | | | $ | - | | | $ | 811 | | |
Accrued investment in TEL | | $ | 1,000 | | | $ | - | | | $ | - | | |
| Supplemental disclosure of cash flow information: | | | | | | | | | |
Cash paid (received) during the year for: | | | | | | | | | |
Interest, net of capitalized interest | | $ | 12,967 | | | $ | 16,236 | | | $ | 16,710 | |
Income taxes | | $ | 342 | | | $ | (295 | ) | | $ | (7,928 | ) |
Equipment purchased under capital leases | | $ | - | | | $ | 4,920 | | | $ | 2,405 | |
Accrued investment in TEL | | $ | 500 | | | $ | 1,000 | | | $ | - | |
Noncash change in insurance claims accruals recorded in excess of retention | | $ | 1,236 | | | $ | - | | | $ | - | |
The accompanying notes are an integral part of these consolidated financial statements.
NOTES TO CONSOLIDATED FINANCIAL STATEMENTS DECEMBER 31, 2012, 2011 2010 AND 20092010
1. SUMMARY OF SIGNIFICANT ACCOUNTING POLICIES
Nature of Business and Segments
Covenant Transportation Group, Inc., a Nevada holding company, together with its wholly-owned subsidiaries offers truckload transportation and brokerage services to customers throughout the continental United States.
We have two reportable segments: Asset-Based Truckload Services ("Truckload"asset-based truckload services (“Truckload”) and our Brokerage Services, also known as Covenant Transport Solutions, Inc.non-asset based brokerage and ancillary services ("Solutions").
The Truckload segment consists of three asset-based operating fleets that are aggregated because they have similar economic characteristics and meet the aggregation criteria. The three operating fleets that comprise our Truckload segment are as follows: (i) Covenant Transport, Inc. ("Covenant Transport"), our historical flagship operation, which provides expedited long haul, dedicated, temperature control, and regional solo-driver service; (ii) Southern Refrigerated Transport, Inc. ("SRT"), which provides primarily long-haul and regional temperature-controlled service; and (iii) Star Transportation, Inc. ("Star"), which provides regional solo-driver service,and dedicated services, primarily in the southeastern United States.
The Solutions segment providesprovides: (i) freight brokerage service directly and through freight brokerage agents who are paid a commission for the freight they provide. The brokerage operation has helped us continue to serve customers when we lacked capacity in a given area or when the load has not met the operating profile of our Truckload segment.provide; (ii) less-than-truckload consolidation services; and (iii) accounts receivable factoring.
Principles of Consolidation
The consolidated financial statements include the accounts of Covenant Transportation Group, Inc., a holding company incorporated in the state of Nevada in 1994, and its wholly-owned subsidiaries: Covenant Transport, Inc., a Tennessee corporation; Southern Refrigerated Transport, Inc., an Arkansas corporation; Star Transportation, Inc., a Tennessee corporation; Covenant Transport Solutions, Inc., a Nevada corporation; Covenant Logistics, Inc., a Nevada corporation; Covenant Asset Management, Inc., a Nevada corporation; and CTG Leasing Company, a Nevada corporation.
References in this report to "it," "we," "us," "our," the "Company," and similar expressions refer to Covenant Transportation Group, Inc. and its wholly owned subsidiaries. All significant intercompany balances and transactions have been eliminated in consolidation.
Investment in Transport Enterprise Leasing, LLC.
Transport Enterprise Leasing, LLC (“TEL”("TEL") is a tractor and trailer equipment leasing company and used equipment reseller. We evaluated our investment in TEL to determine whether it should be recorded on a consolidated basis. The percentage of ownership interest, an evaluation of control and whether a variable interest entity (“VIE”("VIE") existed were all considered in our consolidation assessment. The analysis provided that we do not control TEL and that TEL is not deemed a VIE. We have accounted for our investment in TEL using the equity method of accounting given our 49% ownership interest and ability to exercise significant influence over operating and financial policies. Under the equity method, the cost of our investment is adjusted for our share of equity in the earnings of TEL and reduced by distributions received and our proportionate share of TEL’s net income is included in our earnings.
On a periodic basis, we assess whether there are any indicators that the fair value of our investment in TEL may be impaired. The investment is impaired only if the estimate of the fair value of the investment is less than the carrying value of the investment, and such decline in value is deemed to be other than temporary. To the extent impairment has occurred, the loss would be measured as the excess of the carrying amount of the investment over the fair value of the investment. Given that we made our initial investment in TEL in 2011 and asAs a result of TEL’s 2012 and 2011 earnings, no impairment indicators were noted that would provide for impairment of our investment.
Revenue Recognition
Revenue, drivers' wages, and other direct operating expenses generated by our Truckload reportable segment are recognized on the date shipments are delivered to the customer. Revenue includes transportation revenue, fuel surcharges, loading and unloading activities, equipment detention, and other accessorial services.
Revenue generated by our Solutions reportable segment is recognized upon completion of the services provided. Revenue is recorded on a gross basis, without deducting third party purchased transportation costs, as we act as a principal with substantial risks as primary obligor, except for transactions whereby equipment from our Truckload segment perform the related services, which we record on a net basis in accordance with the related authoritative guidance. Solutions revenue includes $0.8 million of revenue related to an accounts receivable factoring business started in 2012 to supplement several aspects of our non-asset operations. Revenue for this business is recognized on a net basis, given we are acting as an agent and are not the primary obligor in these transactions.
Estimates
The preparation of financial statements in conformity with accounting principles generally accepted in the United States of America requires us to make decisions based upon estimates, assumptions, and factors we consider as relevant to the circumstances. Such decisions include the selection of applicable accounting principles and the use of judgment in their application, the results of which impact reported amounts and disclosures. Changes in future economic conditions or other business circumstances may affect the outcomes of our estimates and assumptions. Accordingly, actual results could differ from those anticipated.
Cash and Cash Equivalents
We consider all highly liquid investments with a maturity of three months or less at acquisition to be cash equivalents. Additionally, we are also subject to concentrations of credit risk related to deposits in banks in excess of the Federal Deposit Insurance Corporation limits.
Accounts Receivable and Concentration of Credit Risk
We extend credit to our customers in the normal course of business. We perform ongoing credit evaluations and generally do not require collateral. Trade accounts receivable are recorded at their invoiced amounts, net of allowance for doubtful accounts. We evaluate the adequacy of our allowance for doubtful accounts quarterly. Accounts outstanding longer than contractual payment terms are considered past due and are reviewed individually for collectability. We maintain reserves for potential credit losses based upon its loss history and specific receivables aging analysis. Receivable balances are written off when collection is deemed unlikely.
Accounts receivable are comprised of a diversified customer base that results in a lack of concentration of credit risk. During 2012, 2011, 2010, and 2009,2010, our top ten customers generated 39%32%, 40%39%, and 26%40% of total revenue, respectively. During each of the years in the three year period ended December 31, 2011,2012, no single customer represented more than 10% of total revenue. The carrying amount reported in the consolidated balance sheet for accounts receivable approximates fair value based on the fact that the receivables collection averaged approximately 37 days and 3536 days in 2011both 2012 and 2010, respectively.2011.
Included in accounts receivable is $7.5 million of factoring receivables at December 31, 2012, net of a $0.1 million allowance for bad debts. We advance 80% to 90% of each receivable factored and retain the remainder as collateral for collection issues that might arise. The retained amounts are returned to the clients after the related receivable has been collected. At December 31, 2012, the retained amounts related to factored receivables totaled $0.3 million and were included in accounts payable in the consolidated balance sheet. Our clients are smaller trucking companies that factor their receivables to us for a fee to facilitate faster cash flow. We evaluate each client’s customer base and only factor specific receivables that meet predefined criteria.
The following table provides a summary of the activity in the allowance for doubtful accounts for 2012, 2011, 2010, and 2009:2010:
Years ended December 31: | | Beginning balance January 1, | | Additional provisions to allowance | | Write-offs and other deductions | | Ending balance December 31, | | Beginning balance January 1, | | | Additional provisions to allowance | | | Write-offs and other deductions | | | Ending balance December 31, | |
| | | | | | | | | | | | | | |
| 2012 | | | $ | 1,711 | | | $ | 904 | | | $ | (886 | ) | | $ | 1,729 | |
| | | | | | | | | | | | | | | | | | | | | | | | | |
| 2011 | | $1,537 | | $713 | | ($539) | | $1,711 | | $ | 1,537 | | | $ | 713 | | | $ | (539 | ) | | $ | 1,711 | |
| | | | | | | | | | | | | | | | | | | | | | | | | |
| 2010 | | $1,845 | | $422 | | ($730) | | $1,537 | | $ | 1,845 | | | $ | 422 | | | $ | (730 | ) | | $ | 1,537 | |
| | | | | | | | | | |
| 2009 | | $1,484 | | $1,727 | | ($1,366) | | $1,845 | |
Inventories and suppliesSupplies
Inventories and supplies consist of parts, tires, fuel, and supplies. Tires on new revenue equipment are capitalized as a component of the related equipment cost when the tractor or trailer is placed in service and recovered through depreciation over the life of the vehicle. Replacement tires and parts on hand at year end are recorded at the lower of cost or market with cost determined using the first-in, first-out (FIFO) method. Replacement tires are expensed when placed in service.
Assets Held for Sale
Assets held for sale include property and revenue equipment no longer utilized in continuing operations which are available and held for sale. Assets held for sale are no longer subject to depreciation, and are recorded at the lower of depreciated book value or fair market value less, selling costs. We periodically review the carrying value of these assets for possible impairment. We expect to sell the majority of these assets within twelve months.
Property and Equipment
Property and equipment is stated at cost less accumulated depreciation. Depreciation for book purposes is determined using the straight-line method over the estimated useful lives of the assets, while depreciation for tax purposes is generally recorded using an accelerated method. Depreciation of revenue equipment is our largest item of depreciation. We generally depreciate new tractors (excluding day cabs) over five years to salvage values of approximately 22%23% of their cost and new trailers over seven years for refrigerated trailers and ten years for dry van trailers to salvage values of approximately 22%21% of their cost. We annually review the reasonableness of our estimates regarding useful lives and salvage values of our revenue equipment and other long-lived assets based upon, among other things, our experience with similar assets, conditions in the used revenue equipment market, and prevailing industry practice. Changes in the useful life or salvage value estimates, or fluctuations in market values that are not reflected in our estimates, could have a material effect on our results of operations. Gains and losses on the disposal of revenue equipment are included in depreciation expense in the consolidated statements of operations.
We lease certain revenue equipment under capital leases with terms of 60 months. Amortization of leased assets is included in depreciation and amortization expense.
Although a majority of our tractors are protected by non-binding indicative trade-in values or binding trade-back agreements with the manufacturers, substantially all of our owned trailers are subject to fluctuations in market prices for used revenue equipment. Moreover, our trade-back agreements are contingent upon reaching acceptable terms for the purchase of new equipment. Declines in the price of used revenue equipment or failure to reach agreement for the purchase of new tractors with the manufacturers issuing trade-back agreements could result in impairment of, or losses on the sale of, revenue equipment.
Impairment of Long-Lived Assets
Pursuant to applicable accounting standards, revenue equipment and other long-lived assets are tested for impairment whenever an event occurs that indicates an impairment may exist. Expected future cash flows are used to analyze whether an impairment has occurred. If the sum of expected undiscounted cash flows is less than the carrying value of the long-lived asset, then an impairment loss is recognized. We measure the impairment loss by comparing the fair value of the asset to its carrying value. Fair value is determined based on a discounted cash flow analysis or the appraised value of the assets, as appropriate.
Goodwill and Other Intangible Assets
We classify intangible assets into two categories: (i) intangible assets with definite lives subject to amortization and (ii) goodwill. We test intangible assets with definite lives for impairment if conditions exist that indicate the carrying value may not be recoverable. Such conditions may include an economic downturn in a geographic market or a change in the assessment of future operations. We record an impairment charge when the carrying value of the definite lived intangible asset is not recoverable by the cash flows generated from the use of the asset.
We test goodwill for impairment at least annually or more frequently if events or circumstances indicate that such intangible assets or goodwill might be impaired. We perform our impairment tests of goodwill at the reporting unit level. Our reporting units are defined as our subsidiaries because each is a legal entity that is managed separately. Such impairment tests for goodwill include comparing the fair value of the respective reporting unit with its carrying value, including goodwill. We use a variety of methodologies in conducting these impairment tests, including discounted cash flow analyses and market analyses. As of December 31,September 30, 2011, we have no goodwill on our consolidated balance sheet.
We determine the useful lives of our identifiable intangible assets after considering the specific facts and circumstances related to each intangible asset. Factors we consider when determining useful lives include the contractual term of any agreement, the history of the asset, our long-term strategy for the use of the asset, any laws or other local regulations which could impact the useful life of the asset, and other economic factors, including competition and specific market conditions. Intangible assets that are deemed to have definite lives are amortized, generally on a straight-line basis, over their useful lives, ranging from 4 to 20 years.
Insurance and Other Claims
The primary claims arising against us consist of cargo, liability, personal injury, property damage, workers' compensation, and employee medical expenses. Our insurance program involves self-insurance with high risk retention levels. Due to our significant self-insured retention amounts, we have exposure to fluctuations in the number and severity of claims and to variations between our estimated and actual ultimate payouts. We accrue the estimated cost of the uninsured portion of pending claims and an estimate for allocated loss adjustment expenses including legal and other direct costs associated with a claim. Estimates require judgments concerning the nature and severity of the claim, historical trends, advice from third-party administrators and insurers, the size of any potential damage award based on factors such as the specific facts of individual cases, the jurisdictions involved, the prospect of punitive damages, future medical costs, and inflation estimates of future claims development, and the legal and other costs to settle or defend the claims. We have significant exposure to fluctuations in the number and severity of claims. If there is an increase in the frequency and severity of claims, or we are required to accrue or pay additional amounts if the claims prove to be more severe than originally assessed, or any of the claims would exceed the limits of our insurance coverage, our profitability wouldcould be adversely affected.
In addition to estimates within our self-insured retention layers, we also must make judgments concerning claims where we have third party insurance and for claims outside our coverage limits. In addition, our current auto liability policy includes a policy release premium refund of up to $4.0 million per year, if certain losses are not met and we were to commute the policy for that policy year. We did not elect to commute the policy for the April 1, 2010 through March 31, 2011 policy year. However, in June 2012 we commuted the policy for the April 1, 2011 through March 31, 2012 policy year and as such are responsible for all claims that occurred during that policy year, excluding any claims between $10.0 million and $20.0 million, should such a claim develop. As a result of a few large accidents during the policy that runs from April 1, 2012 to March 31, 2013, management believes the possibility of commuting the current policy to be remote. Our critical estimates include evaluating the likely exposure in each policy year and deciding whether to release the policy. Upon settling claims and expenses associated with claims where we have third party coverage, we are generally required to initially fund payment to the claimant and seek reimbursement from the insurer. Receivables from insurers for claims and expenses we have paid on their behalf total $2.0$0.5 million and $0.7$2.0 million at December 31, 20112012 and 2010,2011, respectively, and are included in driversdrivers’ advances and other receivables on the consolidated balance sheet. Additionally, we accrue claims above our self-insured retention and record a corresponding receivable for amounts we expect to collect from insurers upon settlement of such claims. We have $2.2$3.4 million and $8.8$2.2 million at December 31, 20112012 and 2010,2011, respectively, as a receivable in other assets and as a corresponding accrual in the long-term portion of insurance and claims accruals on the consolidated balance sheet for claims above our self insuredself-insured retention for which we believe it is reasonably assured that the insurers will provide their portion of such claims. We evaluate collectability of the receivables based on the credit worthiness and surplus of the insurers along with our prior experience and contractual terms with each. If any claim occurrence were to exceed our aggregate coverage limits, we would have to accrue for the excess amount. Our critical estimates include evaluating whether a claim may exceed such limits and, if so, by how much. If one or more claims were to exceed our then effective coverage limits, our financial condition and results of operations could be materially and adversely affected. Additionally, we accrue claims above our self-insured retention and record a corresponding receivable for amounts we expect to collect from insurers upon settlement of such claims. We evaluate collectability of the receivables based on the credit worthiness and surplus of the insurers along with our prior experience and contractual terms with each. If any claim occurrence were to exceed our aggregate coverage limits, we would have to accrue for the excess amount. Our critical estimates include evaluating whether a claim may exceed such limits and, if so, by how much. If one or more claims were to exceed our then effective coverage limits, our financial condition and results of operations could be materially and adversely affected.
Effective April 1, 2010, we finalized ourOur casualty insurance renewal which resulted in a reduction in our self-insured retention limit for the primary excess layer of casualty claims tois no more than $1.0 million from the $4.0 million self-insured retention limit we had for a number of years.million. The policy is a three-year policy and includes a limit for a single loss of $9.0 million, an aggregate of $15.0 million for each policy year, and a $27.0 million aggregate for all three years. The policy includes a policy release premium refund of up to $4.0 million per year, if certain losses are not met and we were to commute the policy for that policy year. No receivable was recorded at Decemberyears ended March 31, 2011 or 2010 as it is not probable that any premium refund will be received. Additionally, effective April 1, 2010, we entered into new2013. Our excess policies for one to three years that cover up to $30.0 million per claim, subject to certain aggregate limits. Prior to April 1, 2010, we had insurance coverage up to $50.0 million per claim and were self-insured on an occurrence/per claim basis for personal injury and property damage claims for amounts up to the first $4.0 million, except for Star where we have insurance coverage for all periods presented up to $2.0 million per claim after the first $0.3 million for which we are self-insured. We are self-insured on an occurrence/per claim basis for workers' compensation up to the first $1.25$1.3 million. Effective April 1, 2010, we purchasedWe purchase coverage on an occurrence/occurrence per claim basis for any cargo losses in the $0.3 million to $2.0 million layer, with our contracts generally excluding the value of any cargo in excess of $0.3$2.0 million. Prior to April 1, 2010, we generally were completely self-insured for damages to the cargo we hauled. We also maintain a self-insured group medical plan for our Covenant Transport, Solutions, and corporate employees with annual per individual claimant stop-loss deductible of $0.4 million with a maximum lifetime benefit of $1.0 million. Star offers a self-insured group medical plan with annual per individual claimant stop-loss deductible of $0.2 million with a maximum lifetime benefit of $1.0 million, while SRT offers a fully insured group health program to its employees. We are completely self-insured for physical damage to our own tractors and trailers.
Insurance and claims expense varies based on the frequency and severity of claims, the premium expense, the level of self-insured retention, the development of claims over time, and other factors. With our significant self-insured retention, insurance and claims expense may fluctuate significantly from period-to-period, and any increase in frequency or severity of claims could adversely affect our financial condition and results of operations.
Interest
We capitalize interest on major projects during construction. Interest is capitalized based on the average interest rate on related debt. Capitalized interest was less than $0.1 million in 2012, 2011, 2010, and 2009.2010.
Fair Value of Financial Instruments
Our financial instruments consist primarily of cash and cash equivalents, accounts receivable, commodity contracts, accounts payable, and debt. The carrying amount of cash and cash equivalents, accounts receivable, accounts payable, and current debt approximates their fair value because of the short-term maturity of these instruments. The carrying value of the factored receivables approximates the fair value, as the receivables are generally repaid directly to us by the client’s customer within 30-40 days due to the combination of the short-term nature of the financing transaction and the underlying quality of the receivables. Interest rates that are currently available to us for issuance of long-term debt with similar terms and remaining maturities are used to estimate the fair value of our long-term debt, which primarily consists of revenue equipment installment notes. The fair value of our revenue equipment installment notes approximated the carrying value at December 31, 2012, as the weighted average interest rate on these notes approximates the market rate for similar debt. Borrowings under our revolving Credit Facility approximate fair value due to the variable interest rate on the facility. Additionally, commodity contracts, which are accounted for as hedge derivatives, as discussed in Note 14,13, are valued based on the forward rate of the specific indices upon which the contract is being settled and adjusted for counterparty credit risk using available market information and valuation methodologies.
Income Taxes
Deferred tax assets and liabilities are recognized for the future tax consequences attributable to differences between the financial statement carrying amounts of existing assets and liabilities and their respective tax basis. Deferred tax assets and liabilities are measured using enacted tax rates expected to apply to taxable income in the years in which those temporary differences are expected to be recovered or settled. The effect on deferred tax assets and liabilities of a change in tax rates is recognized in income in the period that includes the enactment date. We have reflected the necessary deferred tax assets and liabilities in the accompanying consolidated balance sheets. We believe the future tax deductions will be realized principally through future reversals of existing taxable temporary differences and future taxable income, except for when a valuation allowance has been provided as discussed in Note 10.9.
In the ordinary course of business there is inherent uncertainty in quantifying our income tax positions. We assess our income tax positions and record tax benefits for all years subject to examination based upon management's evaluation of the facts, circumstances, and information available at the reporting dates. For those tax positions where it is more-likely-than-not that a tax benefit will be sustained, we have recorded the largest amount of tax benefit with a greater than 50% likelihood of being realized upon ultimate settlement with a taxing authority that has full knowledge of all relevant information. For those income tax positions where it is not more-likely-than-not that a tax benefit will be sustained, no tax benefit has been recognized in the financial statements. Potential accrued interest and penalties related to unrecognized tax benefits are recognized as a component of income tax expense.
Our policy is to recognize income tax benefit arising from the exercise of stock options and restricted share vesting based on the ordering provisions of the tax law as proscribedprescribed by the Internal Revenue Code, including indirect tax effects, if any.
Lease Accounting and Off-Balance Sheet Transactions
We issue residual value guarantees in connection with the operating leases we enter into for certain of our revenue equipment. These leases provide that if we do not purchase the leased equipment from the lessor at the end of the lease term, then we are liable to the lessor for an amount equal to the shortage (if any) between the proceeds from the sale of the equipment and an agreed value. To the extent the expected value at the lease termination date is lower than the residual value guarantee; we would accrue for the difference over the remaining lease term. We believe that proceeds from the sale of equipment under operating leases would exceed the payment obligation on substantially all operating leases. The estimated values at lease termination involve management judgments. As leases are entered into, determination as to the classification as an operating or capital lease involves management judgments on residual values and useful lives.
Capital Structure
The shares of Class A and B common stock are substantially identical except that the Class B shares are entitled to two votes per share while beneficially owned by our Chief Executive Officer or certain members of his immediate family, and Class A shares are entitled to one vote per share. The terms of any future issuances of preferred shares will be set by our Board of Directors.
Comprehensive Income (Loss) income
Comprehensive income (loss) income generally includes all changes in equity during a period except those resulting from investments by owners and distributions to owners. Comprehensive income for 2012 and 2010 were comprised of the net income plus the unrealized gain on the effective portion of diesel fuel hedges. Comprehensive loss for 2011 and 2009 was comprised of the net loss and the unrealized gain on the effective portion of diesel fuel hedges. Comprehensive income for 2010 was comprised of the net income plus the unrealized gain on the effective portion of diesel fuel hedges.
Income (loss)(Loss) Per Share
Basic income (loss) per share excludes dilution and is computed by dividing earnings available to common stockholders by the weighted-average number of common shares outstanding for the period. Diluted income (loss) per share reflects the dilution that could occur if securities or other contracts to issue common stock were exercised or converted into common stock or resulted in the issuance of common stock that then shared in our earnings. The calculation of diluted loss per share excludes all unexercised options and 48,247, 61,097, and 70,178 unvested shares since the effect of any assumed exercise of the related awards would be anti-dilutive for the years ended December 31, 2012, 2011, and 2009,2010, respectively.
The following table sets forth the calculation of net income (loss) per share included in the consolidated statements of operations for each of the three years ended December 31:
| (in thousands except per share data) | | | | | | | | | | | | | | | | | | |
| | | 2011 | | | 2010 | | | 2009 | | | | | | | | | | |
| Numerator: | | | | | | | | | | | | | | | | | | |
| | | | | | | | | | | | | | | | | | | |
Net (loss) income | | $ | (14,267 | ) | | $ | 3,289 | | | $ | (25,030 | ) | |
Net income (loss) | | | $ | 6,065 | | | $ | (14,267 | ) | | $ | 3,289 | |
| | | | | | | | | | | | | | | | | | | | | | | | | |
| Denominator: | | | | | | | | | | | | | | | | | | | | | | | | |
| | | | | | | | | | | | | | | | | | | | | | | | | |
Denominator for basic (loss) income per share – weighted-average shares | | | 14,689 | | | | 14,374 | | | | 14,124 | | |
Denominator for basic income (loss) per share – weighted-average shares | | | | 14,742 | | | | 14,689 | | | | 14,374 | |
| Effect of dilutive securities: | | | | | | | | | | | | | | | | | | | | | | | | |
| Equivalent shares issuable upon conversion of unvested restricted stock | | | - | | | | 128 | | | | - | | | | 66 | | | | - | | | | 128 | |
| Equivalent shares issuable upon conversion of unvested employee stock options | | | - | | | | 3 | | | | - | | | | - | | | | - | | | | 3 | |
| Denominator for diluted (loss) income per share adjusted weighted-average shares and assumed conversions | | | 14,689 | | | | 14,505 | | | | 14,124 | | |
Denominator for diluted income (loss) per share adjusted weighted-average shares and assumed conversions | | | | 14,808 | | | | 14,689 | | | | 14,505 | |
| | | | | | | | | | | | | | | | | | | | | | | | | |
| Net (loss) income per share: | | | | | | | | | | | | | |
| Basic (loss) income per share | | $ | (0.97 | ) | | $ | 0.23 | | | $ | (1.77 | ) | |
| Diluted (loss) income per share | | $ | (0.97 | ) | | $ | 0.23 | | | $ | (1.77 | ) | |
| Net income (loss) per share: | | | | | | | | | | | | | |
| Basic income (loss) per share | | | $ | 0.41 | | | $ | (0.97 | ) | | $ | 0.23 | |
| Diluted income (loss) per share | | | $ | 0.41 | | | $ | (0.97 | ) | | $ | 0.23 | |
Stock-Based Employee Compensation
We issue several types of stock-based compensation, including awards that vest based on service, market, and performance conditions or a combination of the conditions. Performance-based awards vest contingent upon meeting certain performance criteria established by the Compensation Committee. Market-based awards vest contingent upon meeting certain stock price targets selected by the Compensation Committee. All awards require future service and thus forfeitures are estimated based on historical forfeitures and the remaining term until the related award vests. Determining the appropriate amount to expense in each period is based on likelihood and timing of achieving the stated targets for performance and market based awards, respectively, and requires judgment, including forecasting future financial results and market performance. The estimates are revised periodically based on the probability and timing of achieving the required performance and market targets, respectively, and adjustments are made as appropriate. Awards that are only subject to time vesting provisions are amortized using the straight-line method.
Derivative Instruments and Hedging Activities
We periodically utilize derivative instruments to manage exposure to changes in fuel prices. At inception of a derivative contract, we document relationships between derivative instruments and hedged items, as well as our risk-management objective and strategy for undertaking various derivative transactions, and assess hedge effectiveness. We record derivative financial instruments in the balance sheet as either an asset or liability at fair value. If it is determined that a derivative is not highly effective as a hedge, or if a derivative ceases to be a highly effective hedge, we discontinue hedge accounting prospectively. The effective portion of changes in the fair value of derivatives are recorded in other comprehensive income, and reclassified into earnings in the same period during which the hedged transaction affects earnings. The ineffective portion is recorded in other income or expense.
Reclassifications
Certain reclassifications have been made to the 2010 and 2009 consolidated financial statements to conform to the 2011 presentation, including $3.2 million and $4.1 million from general supplies and expenses to salaries, wages, and related expenses related to agent fees and contract labor and $5.3 million and $5.4 million from insurance and claims to operations and maintenance related to a change in the threshold used to classify certain over-the-road damages not specifically related to an accident for the years ended December 31, 2010 and 2009, respectively. The reclassifications did not affect the previously reported stockholders' equity or net income (loss).
Recent Accounting Pronouncements
Fair Value MeasurementPresentation of Comprehensive Income (loss) - In MayJune 2011, the Financial Accounting Standards Board (“FASB”("FASB") issued Accounting Standards Update 2011-04. ASU 2011-04 represents the converged guidance of the FASB and the International Accounting Standards Board on fair value measurement. The guidance clarifies certain existing requirements and changes certain principles to achieve convergence between U.S. GAAP and IFRS. ASU 2011-04 also expands the disclosures for fair value measurements. ASU 2011-04 is effective for interim and annual periods beginning after December 15, 2011. We do not expect the adoption of this standard to have a significant impact on our consolidated financial statements.
Presentation of Comprehensive Income (loss) - In June 2011, the FASB issued Accounting Standards Update 2011-05. Under ASU 2011-05, an entity has the option to present the total of comprehensive income (loss), the components of net income (loss), and the components of other comprehensive income (loss) either in a single continuous statement of comprehensive income (loss) or in two separate but consecutive statements. Under both options, an entity will be required to present each component of net income (loss) along with total net income (loss), each component of other comprehensive income (loss) along with a total for other comprehensive income (loss), and a total amount for comprehensive income (loss). In December 2011, the FASB issued ASU 2011-12, which deferred the requirement to present on the face of the financial statements reclassification adjustments for items that are reclassified from other comprehensive income (loss) to net income (loss) while the FASB further deliberates this aspect of the proposal. The amendments contained in ASU 2011-05 do not change the items that must be reported in other comprehensive income (loss) or when an item of other comprehensive income (loss) must be reclassified to net income. The amendments also do not affect how earnings per share is calculated or presented. ASU 2011-05, as amended by ASU 2011-12, is effective for us on January 1, 2012. Although adoptingWe adopted this guidance in the guidance will not impact our accounting forfirst quarter of 2012 and have presented a separate statement of comprehensive income (loss), it will affect our presentation of components ofwhich contains net income (loss) and comprehensive income (loss) by eliminating the historical practice of showing these items within. This accounting guidance only impacted presentation and did not have an impact on our consolidated statementsbalance sheets, results of stockholders'operations, stockholders’ equity or cash flows.
2. LIQUIDITY
Our business requires significant capital investments over the short-term and the long-term. Recently, we have financed our capital requirements with borrowings under our Third Amended and Restated Credit Facility ("Credit Facility"), cash flows from operations, long-term operating leases, capital leases, secured installment notes with finance companies, and refundsproceeds from the sale of previously paid federal income taxes as a result of net operating loss carry backs pursuant to the Worker, Homeownership,our used revenue equipment in 2012 and Business Assistance Act of 2009 in 2011 and 2010.2011. Our primary sources of liquidity at December 31, 2011,2012, were funds provided by operations, proceeds from the sale of used revenue equipment, borrowings under our Credit Facility, borrowings from secured installment notes, capital leases, operating leases of revenue equipment, and cash and cash equivalents. We had a working capital (total current assets less total current liabilities) deficit of $42.1$20.0 million and $30.8$42.1 million at December 31, 20112012 and 2010,2011, respectively. Working capital deficits are common to many trucking companies that operate by financing revenue equipment purchases through borrowing or capitalized leases. When we finance revenue equipment through borrowing or capitalized leases, the principal amortization scheduled for the next year is categorized as a current liability, although the revenue equipment is classified as a long-term asset. Consequently, each purchase of revenue equipment financed with borrowing or capitalized leases decreases working capital. Additionally, as discussed in Note 8, our Credit Facility is reflected as a current maturity while the outstanding debt is not due until September 2014. We believe our working capital deficit had little impact on our liquidity. Based on our expected financial condition, net capital expenditures, and results of operations and related net cash flows, we believe our working capital and sources of liquidity will be adequate to meet our current and projected needs for at least the next year.
borrowings outstanding under the Credit Facility as of December 31, 2012, undrawn letters of credit outstanding of approximately $39.6 million, and available borrowing capacity of $52.7 million. We do not expect to experience material liquidity constraints in the foreseeable future or on a long-term basis, based on our anticipated financial condition, results of operations, cash flows, continued availability of our Credit Facility, secured installment notes, and other sources of financing that we expect will be available to us. Our net capital expenditures are expected to be significantly less in 2012 than 2011 or 2010 as a result
We had $15.9 million in borrowings outstanding under the Credit Facility as of December 31, 2011, undrawn letters of credit outstanding of approximately $38.9 million, and available borrowing capacity of $27.6 million. Our intra-period borrowings under the Credit Facility have ranged between $10.7 million and $20.9 million during the fourth quarter of 2011 and between zero and $22.4 million during 2011. Fluctuations in the outstanding balance and related availability under our Credit Facility are driven primarily by cash flows from operations and the timing and nature of property and equipment additions that are not funded through notes payable, as well as the nature and timing of receipt of proceeds from disposals of property and equipment.
3. FAIR VALUE OF FINANCIAL INSTRUMENTS
Fair value is defined as an exit price, representing the amount that would be received to sell an asset or paid to transfer a liability in an orderly transaction between market participants. Accordingly, fair value is a market-based measurement that is determined based on assumptions that market participants would use in pricing an asset or liability. The fair value of the hedge derivative asset was determined based on quotes from the counterparty which were verified by comparing them to the exchange on which the related futures are traded, adjusted for counterparty credit risk. A three-tier fair value hierarchy is used to prioritize the inputs in measuring fair value as follows:
| • | Level 1. Observable inputs such as quoted prices in active markets; |
| • | Level 2. Inputs, other than the quoted prices in active markets, that are observable either directly or indirectly; and |
| • | Level 3. Unobservable inputs in which there is little or no market data, which require the reporting entity to develop its own assumptions. |
Assets and Liabilities Measured at Fair Value on a Recurring Basis
| (in thousands) | | December 31 | | December 31, |
| Hedge derivative asset | | 2011 | | 2010 | | | |
| Fair Value of Derivative | | $82 | | $- | | $524 | $82 |
| Quoted Prices in Active Markets (Level 1) | | - | | - | | - | - |
| Significant Other Observable Inputs (Level 2) | | $82 | | $- | | $524 | $82 |
| Significant Unobservable Inputs (Level 3) | | - | | - | | - | - |
4. STOCK-BASED COMPENSATION
On March 31, 2011, the Compensation Committee of the Board of Directors of the Company approved a second amendment (the "Second Amendment") to the 2006 Omnibus Incentive Plan (the "Incentive Plan") to, among other things, (i) provide that the maximum aggregate number of shares of Class A common stock available for the grant of awards under the Incentive Plan from and after May 17, 2011, shall not exceed 800,000, (ii) limit the shares of Class A common stock that shall be available for issuance or reissuance under the Incentive Plan from and after May 17, 2011 to the additional 800,000 shares reserved, plus any expirations, forfeitures, cancellations, or certain other terminations of such shares, and (iii) re-set the term of the Incentive Plan to expire with respect to the ability to grant new awards on March 31, 2021. The Compensation Committee also re-approved, subject to stockholder re-approval, the material terms of the performance-based goals under the Incentive Plan so that certain incentive awards granted thereunder would continue to qualify as exempt "performance-based compensation" under Internal Revenue Code Section 162(m). The Second Amendment and the material terms of the performance-based goals under the Incentive Plan were forwarded for stockholder approval, and on May 17, 2011, at our 2011 Annual Meeting, our stockholders approved the adoption of the Second Amendment and re-approved the material terms of the performance-based goals under the Incentive Plan.
The Incentive Plan permits annual awards of shares of our Class A common stock to executives, other key employees, non-employee directors, and eligible participants under various types of options, restricted stock awards, or other equity instruments. At December 31, 2011, 583,8972012, 224,731 of the aforementioned 800,000 shares were available for award under the amended Incentive Plan. No participant in the Incentive Plan may receive awards of any type of equity instruments in any calendar-year that relates to more than 200,000 shares of our Class A common stock. No awards may be made under the Incentive Plan after March 31, 2021. To the extent available, we have issued treasury stock to satisfy all share-based incentive plans.
Included in salaries, wages, and related expenses within the consolidated statements of operations is stock-based compensation expense of $1.0$1.2 million $1.0 million,in 2012 and $0.6$1.0 million in 2011 2010, and 2009, respectively.2010. Included in general supplies and expenses within the consolidated statements of operations is stock-based compensation expenses for non-employee directors of $0.1 million in 2012, 2011, 2010, and 2009.2010. All stock compensation expense recorded in 2012, 2011, 2010 and 20092010 relates to restricted stock given no options were granted during these periods. Income tax benefits associated with stock compensation expense totaled $0.4 million in 2011 and 2010 related to the exercise of stock options and restricted share vesting, resulting in a related reduction in taxable income and an offsetting increase to additional paid in capital. There was no tax benefit in 2009.
In addition to the 2011 period includes $0.1 million expense related to liability awards issued to non-employees. The fair value of our liability for these awards has been fully recognized at December 31, 2011 as there are no continuing service requirements associated with these awards. Changes in the fair value of the liability that occur in the future will be recognized as compensation cost during the period in which the changes occur. We re-measure the liability for the outstanding awards at the end of each reporting period based on the closing price of our Class A common stock at that date, and the compensation cost is based on the change in fair value for each reporting period. The liability for these awards totaled $0.1 million at December 31, 2011 and is included in accrued expenses in the accompanying consolidated balance sheet.
The Incentive Plan allows participants to pay the federal and state minimum statutory tax withholding requirements related to awards that vest or allows the participant to deliver to us shares of Class A common stock having a fair market value equal to the minimum amount of such required withholding taxes. To satisfy withholding requirements for shares that vested, certain participants elected to deliver to us 1,940 Class A common stock shares, which were withheld at a weighted average per share price of $4.60 based on the closing price of our Class A common stock on the dates the shares vested in 2012, in lieu of the federal and state minimum statutory tax withholding requirements. We remitted a de minimis amount to the proper taxing authorities in satisfaction of the employees' minimum statutory withholding requirements. To satisfy withholding requirements for shares that vested in 2011, certain participants elected to deliver to us approximately 61,752 Class A common stock shares, which were withheld at a weighted average per share price of $9.02 based on the closing price of our Class A common stock on the dates the shares vested, in 2011, in lieu of the federal and state minimum statutory tax withholding requirements. We remitted approximately $0.6 million to the proper taxing authorities in satisfaction of the employees' minimum statutory withholding requirements. To satisfy withholding requirements for shares that vested in 2010, certain participants elected to deliver to us approximately 41,000 Class A common stock shares, which were withheld at a weighted average per share price of $6.87 based on the closing price of our Class A common stock on the dates the shares vested, in lieu of the federal and state minimum statutory tax withholding requirements. We remitted approximately $0.3 million to the proper taxing authorities in satisfaction of the employees' minimum statutory withholding requirements. To satisfy withholding requirements for shares that vested in 2009, certain participants elected to deliver to us approximately 21,000 shares which were withheld at a per share price of $5.50,$6.87, based on the closing price of our common stock on the date the shares vested, in lieu of the federal and state minimum statutory tax withholding requirements. We remitted approximately $0.1$0.3 million to the proper taxing authorities in satisfaction of the employees' minimum statutory withholding requirements. The payment of minimum tax withholdings on stock compensation are reflected within the issuances of restricted stock from treasury stock in the accompanying consolidated statement of stockholders' equity.
The following table summarizes our restricted stock award activity for the fiscal years ended December 31, 2012, 2011, 2010, and 2009:2010:
| | | Number of stock awards (in thousands) | | | Weighted average grant date fair value | | | Number of stock awards (in thousands) | | | Weighted average grant date fair value | |
| | | | | | | | | | | | | |
| Unvested at December 31, 2008 | | | 766 | | | $ | 9.14 | | |
| | | | | | | | | | |
Granted | | | 335 | | | $ | 3.07 | | |
Vested | | | (162 | ) | | $ | 3.15 | | |
Forfeited | | | (165 | ) | | $ | 9.30 | | |
| Unvested at December 31, 2009 | | | 774 | | | $ | 7.76 | | | | 774 | | | $ | 7.76 | |
| | | | | | | | | | | | | | | | | |
Granted | | | 370 | | | $ | 6.59 | | | | 370 | | | $ | 6.59 | |
Vested | | | (228 | ) | | $ | 3.07 | | | | (228 | ) | | $ | 3.07 | |
Forfeited | | | (145 | ) | | $ | 10.60 | | | | (145 | ) | | $ | 10.60 | |
| Unvested at December 31, 2010 | | | 771 | | | $ | 8.05 | | | | 771 | | | $ | 8.05 | |
| | | | | | | | | | | | | | | | | |
Granted | | | 224 | | | $ | 9.33 | | | | 224 | | | $ | 9.33 | |
Vested | | | (238 | ) | | $ | 4.01 | | | | (238 | ) | | $ | 4.01 | |
Forfeited | | | (289 | ) | | $ | 12.04 | | | | (289 | ) | | $ | 12.04 | |
| Unvested at December 31, 2011 | | | 468 | | | $ | 8.27 | | | | 468 | | | $ | 8.27 | |
| | | | | | | | | | |
Granted | | | | 383 | | | $ | 4.48 | |
Vested | | | | (40 | ) | | $ | 4.19 | |
Forfeited | | | | (47 | ) | | $ | 7.64 | |
| Unvested at December 31, 2012 | | | | 764 | | | $ | 6.62 | |
The unvested shares at December 31, 20112012 will vest based on when and if the related vesting criteria are met for each award. All awards require continued service to vest, noting that 187,000288,031 of these awards vest solely based on continued service, which vest in varying increments between 20122013 and 2015. Additionally, 35,00030,999 awards vest based on market conditions suchif and to the extent that one third of the each employee's awards vests if our Class A Stock trades above $11 for twenty consecutive trading days beginning January 1, 20122013 through December 31, 2015. Performance based awards account for 246,000445,265 of the unvested shares at December 31, 2011,2012, including 143,000111,957 shares that will vest in two equal partsbased on our 2012 performance goals once such satisfaction of such performance goals has been certified by the compensation committee, 111,942 shares that will vest if our performance meets or exceeds a 0.5% and 1.0% improvement in the net income margin over 2010 results beginning January 1, 20112013 through December 31, 2013, and 103,000113,366 shares that will vest in two equal parts if our performance meets or exceeds a 0.5%1.3% and 1.0% improvement in1.8% margin for the fiscal years 2013 and 2014, respectively, whereby if the 1.3% margin is not attained for fiscal year 2013, the full number of shares will vest if our performance meets or exceeds a 1.8% margin for the fiscal year 2014, and 108,000 awards that will vest if we meet or exceed $1.12 earnings per share for fiscal year 2014, 65.0% total net income margin over 2011 results beginning January 1, 2012 through December 31,indebtedness, and 9.0% return on invested capital for fiscal year 2014.
The fair value of restricted stock awards that vested in 2012, 2011, 2010, and 20092010 were approximately $0.1 million, $2.2 million, $1.6 million, and $0.5$1.6 million, respectively. As of December 31, 2011,2012, we had approximately $0.9$1.2 million of unrecognized compensation expense related to restricted stock awards, which is probable to be recognized over a weighted average period of approximately thirty-sixtwenty-four months. All restricted shares awarded to executives and other key employees pursuant to the 2006 Plan have voting and other stockholder-type rights, but will not be issued until the relevant restrictions are satisfied.
On February 21, 2013, the Compensation Committee of our Board of Directors approved, subject to stockholder approval, a third amendment (the “Third Amendment”) to the Incentive Plan. The Third Amendment provides that (i) the maximum aggregate number of shares of Class A common stock available for grant of awards under the Incentive Plan from and after May 29, 2013, shall not exceed 750,000, plus any remaining available shares of the 800,000 shares approved under the Second Amendment, and any expirations, forfeitures, cancellations, or certain other terminations of shares approved for grant under the Third Amendment or the Second Amendment, and (ii) the term of the Incentive Plan will expire with respect to the ability to grant new awards on March 31, 2023. The Third Amendment is subject to stockholder approval at the Company’s May 29, 2013 annual meeting.
The following table summarizes our stock option activity for the fiscal years ended December 31, 2012, 2011, 2010, and 2009:2010:
| | | Number of options (in thousands) | | | Weighted average exercise price | | Weighted average remaining contractual term | | Aggregate intrinsic value (in thousands) | | | Number of options (in thousands) | | | Weighted average exercise price | | Weighted average remaining contractual term | | Aggregate intrinsic value (in thousands) | |
| | | | | | | | | | | | | | | | | | | | | |
| Outstanding at December 31, 2008 | | | 1,096 | | | $ | 13.43 | | 52 months | | $ | - | | |
| | | | | | | | | | | | | | | |
| Options granted | | | - | | | | - | | | | | | | |
| Options exercised | | | - | | | | - | | | | | | | |
| Options forfeited | | | (116 | ) | | $ | 14.05 | | | | | | | |
| Outstanding at December 31, 2009 | | | 980 | | | $ | 13.36 | | 43 months | | $ | - | | | | 980 | | | $ | 13.36 | | 3.6 years | | $ | - | |
| | | | | | | | | | | | | | | | | | | | | | | | | | | |
| Options granted | | | - | | | | - | | | | | | | | | - | | | | - | | | | | | |
| Options exercised | | | (163 | ) | | $ | 8.00 | | | | | | | | | (163 | ) | | $ | 8.00 | | | | | | |
| Options forfeited | | | (197 | ) | | $ | 13.42 | | | | | | | | | (197 | ) | | $ | 13.42 | | | | | | |
| Outstanding at December 31, 2010 | | | 620 | | | $ | 14.66 | | 38 months | | $ | 230 | | | | 620 | | | $ | 14.66 | | 3.2 years | | $ | 230 | |
| | | | | | | | | | | | | | | | | | | | | | | | | | | |
| Options granted | | | - | | | | - | | | | | | | | | - | | | | - | | | | | | |
| Options exercised | | | - | | | | - | | | | | | | | | - | | | | - | | | | | | |
| Options forfeited | | | (183 | ) | | $ | 12.27 | | | | | | | | | (183 | ) | | $ | 12.27 | | | | | | |
| Outstanding at December 31, 2011 | | | 437 | | | $ | 15.67 | | 25 months | | $ | - | | | | 437 | | | $ | 15.67 | | 2.1 years | | $ | - | |
| | | | | | | | | | | | | | | | | | | | | | | | | | | |
| Exercisable at December 31, 2011 | | | 437 | | | $ | 15.67 | | 25 months | | $ | - | | |
| Options granted | | | | - | | | | - | | | | | | |
| Options exercised | | | | - | | | | - | | | | | | |
| Options forfeited | | | | (104 | ) | | $ | 15.54 | | | | | | |
| Outstanding at December 31, 2012 | | | | 333 | | | $ | 15.70 | | 1.5 years | | $ | - | |
| | | | | | | | | | | | | | | |
| Exercisable at December 31, 2012 | | | | 333 | | | $ | 15.70 | | 1.5 years | | $ | - | |
| | | | | | | | | | | | | | | |
During the third quarter of 2010, certain members of management exercised 163,000 stock options, which provided for $1.3 million of proceeds.
5. INVESTMENT IN TRANSPLACE
From July 2001 through December 2009, we owned approximately 12.4% of Transplace, Inc. ("Transplace"), a global transportation logistics service. In the formation transaction for Transplace, we contributed our logistics customer list, logistics business software and software licenses, certain intellectual property, intangible assets, and $5.0 million in cash, in exchange for our ownership. We accounted for this investment, which totaled approximately $10.7 million, using the cost method of accounting, and it was historically included in other assets in the consolidated balance sheet. Also, during the first quarter of 2005, we loaned Transplace approximately $2.6 million, which along with the related accrued interest was historically included in other assets in the consolidated balance sheet.
Based on an offer to purchase our 12.4% equity ownership and related note receivable in Transplace that was accepted by a majority of the stockholders, we determined that the value of our equity investment had become completely impaired in the third quarter of 2009, and the value of the note receivable had become impaired by approximately $0.9 million. As a result, we recorded a non-cash impairment charge of $11.6 million during the third quarter of 2009.
The transaction closed in December 2009, whereby the proceeds of $1.9 million provided for a recovery of $0.1 million of the previously impaired amount in the fourth quarter of 2009 and thus an $11.5 million non-cash loss on the sale of our investment and related note receivable. There was no tax benefit recorded in connection with the loss on the sale of the investment, given a full valuation allowance was established for the related capital loss. Under our Credit Facility, the non-cash loss was added back in the computation of our fixed charge coverage ratio.
We provided transportation services to Transplace which generated gross revenues of approximately $18.8 million in 2009 and trade accounts receivable of approximately $4.7 million at December 31, 2009.
6. PROPERTY AND EQUIPMENT
A summary of property and equipment, at cost, as of December 31, 20112012 and 20102011 is as follows:
| (in thousands) | | Estimated Useful Lives | | | 2011 | | | 2010 | | | | | | | | | | |
| Revenue equipment | | 3-10 years | | | $ | 351,433 | | | $ | 357,326 | | | 3-10 years | | | $ | 331,761 | | | $ | 351,433 | |
| Communications equipment | | 5-10 years | | | | 12,706 | | | | 18,591 | | | 5-10 years | | | | 13,089 | | | | 12,706 | |
| Land and improvements | | 0-10 years | | | | 18,910 | | | | 17,356 | | | 0-10 years | | | | 16,658 | | | | 18,910 | |
| Buildings and leasehold improvements | | 7-40 years | | | | 39,025 | | | | 37,822 | | | 7-40 years | | | | 41,050 | | | | 39,025 | |
| Construction in-progress | | | - | | | | 1,221 | | | | 1,565 | | | | - | | | | 1,310 | | | | 1,221 | |
| Other | | 1-10 years | | | | 16,756 | | | | 17,807 | | | 2-7 years | | | | 16,079 | | | | 16,756 | |
| | | | | | | $ | 440,051 | | | $ | 450,467 | | | | | | | $ | 419,947 | | | $ | 440,051 | |
Depreciation expense was $47.8 million, $52.6 million, and $55.5 million in 2012, 2011, and $47.2 million in 2011, 2010, and 2009, respectively. The aforementioned depreciation expense excludes net gains (losses) on the sale of property and equipment totaling $4.9 million, $6.7 million and $4.3 million in 2012, 2011 and ($0.1) million in 2011, 2010, and 2009, respectively, which are presented net in depreciation and amortization expense in the consolidated statements of operations.
We lease certain revenue equipment under capital leases with terms of 60 months. At December 31, 20112012 and 2010,2011, property and equipment included capitalized leases, which had capitalized costs of $21.3 million and $16.4 million, respectively, and accumulated amortization of $3.4$5.5 million and $1.6$3.4 million, respectively. Amortization of these leased assets is included in depreciation and amortization expense in the consolidated statement of operations and totaled $2.1 million, $1.8 million, and $1.4 million during 2012, 2011, and $0.2 million during 2011, 2010, and 2009, respectively.
In 2009, we began a multi-year project to upgrade the hardware and software
76. GOODWILL AND OTHER ASSETS
As a result of our annual goodwill impairment test, which was conducted as of May 31, 2011, we determined that no impairment existed given the fair value of each of our reporting units containing goodwill, Covenant and SRT, exceeded the carrying value of each reporting unit, including the $7.2 million and $4.3 million of goodwill related to Covenant and SRT, respectively. Based upon a combination of factors that occurred in the third quarter of 2011, including a significant decline in our market capitalization below our book value, a reduction in year-over-year earnings as a result of deterioration in the macro-economic environment and the market segments in which we operate, reductions in current and forecasted earnings estimates, and the need to amend our Credit Facility to remain in compliance with our financial covenants, we deemed that there had been multiple triggering events that would require an updatedupdate to the Company’s annual goodwill impairment analysis as of September 30, 2011. This updated analysis provided that the carrying value of both reporting units exceeded their fair values. As a result of the second step of the goodwill impairment analysis, which involves calculating the implied fair value of each reporting unitsunit's goodwill by allocating the fair value of all of its assets and liabilities other than goodwill (including both recognized and unrecognized intangible assets), and comparing the residual amount to the carrying value of goodwill, we determined that the faircarrying value of both reporting units exceedexceeded the carryingfair value. The non-cash goodwill impairment charge amounted to $11.5 million ($9.4 million, net of a $2.1 million income tax benefit) to write off the remaining goodwill associated with several acquisitions that were made prior to 2001. Following this impairment charge, as of September 30, 2011, no goodwill currently remainsremained on our balance sheet.
A summary of other assets as of December 31, 20112012 and 20102011 is as follows:
| (in thousands) | | 2011 | | | 2010 | | | | | | | |
| Covenants not to compete | | $ | 2,690 | | | $ | 2,690 | | | $ | 1,192 | | | $ | 1,192 | |
| Trade name | | | 1,250 | | | | 1,250 | | |
| Customer relationships | | | 3,490 | | | | 3,490 | | | | 3,490 | | | | 3,490 | |
| Less: accumulated amortization of intangibles | | | (6,559 | ) | | | (6,177 | ) | | | (4,129 | ) | | | (3,811 | ) |
Net intangible assets | | | 871 | | | | 1,253 | | | | 553 | | | | 871 | |
| Investment in TEL | | | 2,372 | | | | - | | | | 6,133 | | | | 2,372 | |
| Other long-term receivables | | | 2,154 | | | | 8,813 | | | | 3,389 | | | | 2,154 | |
| Deposits | | | 1,824 | | | | 2,390 | | | | 947 | | | | 1,824 | |
| Deferred loan costs, net | | | 1,285 | | | | 1,442 | | | | 819 | | | | 1,285 | |
| Other, net | | | 615 | | | | 650 | | | | 1,064 | | | | 615 | |
| | | $ | 9,121 | | | $ | 14,548 | | | $ | 12,905 | | | $ | 9,121 | |
Amortization expenses of intangible assets were $0.3 million, $0.4 million, and $0.6 million for 2012, 2011, and $0.8 million for 2011, 2010, and 2009, respectively. Approximate intangible amortization expense for the next five years is as follows:
| | | (In thousands) | | | (In thousands) | |
| 2012 | | $ | 317 | | |
| 2013 | | | 227 | | | $ | 227 | |
| 2014 | | | 91 | | | | 91 | |
| 2015 | | | 66 | | | | 66 | |
| 2016 | | | 48 | | | | 48 | |
| 2017 | | | | 35 | |
| Thereafter | | $ | 122 | | | $ | 86 | |
8.
7. DEBT
Current and long-term debt consisted of the following at December 31, 20112012 and 2010:2011:
| (in thousands) | | December 31, 2011 | | | December 31, 2010 | | | | | | | |
| | | Current | | | Long-Term | | | Current | | | Long-Term | | | | | | | | | | | | | |
| Borrowings under Credit Facility | | $ | 15,890 | | | $ | - | | | $ | 21 | | | $ | - | | | $ | - | | | $ | 5 | | | $ | 15,890 | | | $ | - | |
| Revenue equipment installment notes; weighted average interest rate of 5.7% at December 31, 2011, and 6.5% December 31, 2010, due in monthly installments with final maturities at various dates ranging from January 2012 to May 2016, secured by related revenue equipment | | | 80,003 | | | | 125,666 | | | | 68,014 | | | | 139,395 | | |
| Real estate note; interest rate of 2.8% and 2.8% at December 31, 2011 and 2010, respectively, due in monthly installments with fixed maturity at October 2013, secured by related real-estate | | | 365 | | | | 2,258 | | | | 365 | | | | 2,547 | | |
| Other note payable, interest rate of 3.0% at December 31, 2011, with fixed maturity at November 2016 | | | - | | | | 243 | | | | - | | | | - | | |
| Revenue equipment installment notes; weighted average interest rate of 5.2% at December 31, 2012, and 5.7% December 31, 2011, due in monthly installments with final maturities at various dates ranging from January 2013 to January 2018, secured by related revenue equipment | | | | 61,200 | | | | 94,920 | | | | 80,003 | | | | 125,666 | |
| Real estate note; interest rate of 2.7% and 2.8% at December 31, 2012 and 2011, respectively, due in monthly installments with fixed maturity at October 2013, secured by related real-estate | | | | 2,328 | | | | - | | | | 365 | | | | 2,258 | |
| Other note payable, interest rate of 3.0% at December 31, 2012 and 2011, with fixed maturity at November 2016 | | | | 108 | | | | 289 | | | | - | | | | 243 | |
| Total debt | | | 96,258 | | | | 128,167 | | | | 68,400 | | | | 141,942 | | | | 63,636 | | | | 95,214 | | | | 96,258 | | | | 128,167 | |
| Principal portion of capital lease obligations, secured by related revenue equipment | | | 1,957 | | | | 16,129 | | | | 1,399 | | | | 13,418 | | | | 2,091 | | | | 14,003 | | | | 1,957 | | | | 16,129 | |
| | | | | | | | | | | | | | | | | | | | | | | | | | | | | | | | | |
| Total debt and capital lease obligations | | $ | 98,215 | | | $ | 144,296 | | | $ | 69,799 | | | $ | 155,360 | | | $ | 65,727 | | | $ | 109,217 | | | $ | 98,215 | | | $ | 144,296 | |
In September 2008, we and substantially all of our subsidiaries (collectively, the "Borrowers") entered into a Third Amended and Restated Credit Facility (the "Credit Facility") with Bank of America, N.A., as agent (the "Agent") and JPMorgan Chase Bank, N.A. ("JPM," and together with the Agent, the "Lenders").
The Credit Facility iswas originally structured as an $85.0 million revolving credit facility, with an accordion feature that, so long as no event of default exists, allows us to request an increase in the revolving credit facility of up to $50.0 million. The Credit Facility includes,included, within our $85.0 million revolving credit facility, a letter of credit sub facility in an aggregate amount of $85.0 million and a swing line sub facility in an aggregate amount equal to the greater of $10.0 million or 10% of the Lenders' aggregate commitments under the Credit Facility from time-to-time.
On January 29, 2013, we entered into an eighth amendment, which was effective December 31, 2012, to the Credit Facility which, among other things, (i) increased the revolver commitment to $95.0 million, (ii) extended the maturity date from September 2014 to September 2017, (iii) eliminated the availability block of $15.0 million, (iv) improved pricing for revolving borrowings by amending the applicable margin as set forth below (beginning January 1, 2013), (v) improved the unused line fee pricing to 0.375% per annum when availability is less than $50.0 million and 0.5% per annum when availability is at or over such amount (beginning January 1, 2013), (vi) provided that the fixed charge coverage ratio covenant will be tested only during periods that commence when availability is less than or equal to the greater of 12.5% of the revolver commitment or $11.9 million, (vii) eliminated the consolidated leverage ratio covenant, (viii) reduced the level of availability below which cash dominion applies to the greater of 15% of the revolver commitment or $14.3 million (previously this level was $75.0 million), (ix) added deemed amortization of real estate and eligible revenue equipment included in the borrowing base to the calculation of fixed charge coverage ratio, (x) amended certain types of permitted debt to afford additional flexibility, and (xi) allowed for stock repurchases in an aggregate amount not exceeding $5.0 million and the purchase of up to the remaining 51% equity interest in Transport Enterprise Leasing, provided that certain conditions are met.
On August 31, 2010, we obtained a fourth amendment to our Credit Facility, which among other things, extended the maturity date of the Credit Facility from September 2011 to September 2014. In exchange for these amendments, the amendment, we paidBorrowers agreed to pay fees and expenses of approximately $0.6$0.3 million. While amounts outstanding underBased on availability as of December 31, 2012, there was no fixed charge coverage requirement. Following the Credit Facility are not due until September 2014, the related borrowings are reflected as current maturities in our consolidated balance sheet as a resulteffectiveness of the Credit Facility requiring thateighth amendment, the receipts from our lock-box automatically pay down the Credit Facility daily and additional borrowings be funded through additional draws against the Credit Facility.applicable margin was changed as follows:
New Pricing
| Level | Average Pricing Availability | Base Rate Loans | LIBOR Loans | L/C Fee |
| I | > $75,000,000 | .50% | 1.50% | 1.50% |
| II | ≤ $75,000,000 but > $50,000,000 | .75% | 1.75% | 1.75% |
| III | ≤ $50,000,000 but > $25,000,000 | 1.00% | 2.00% | 2.00% |
| IV | ≤ $25,000,000 | 1.25% | 2.25% | 2.25% |
Prior Pricing
| Level | Average Excess Availability | Base Rate Loans | LIBOR Loans |
| I | >$70,000,000 | 1.25% | 2.25% |
| II | ≤$70,000,000 but >$35,000,000 | 1.50% | 2.50% |
| III | ≤$35,000,000 but >$20,000,000 | 1.75% | 2.75% |
| IV | ≤$20,000,000 but <$10,000,000 | 2.00% | 3.00% |
| V | ≤$10,000,000 | 2.25% | 3.25% |
Borrowings under the Credit Facility are classified as either "base rate loans" or "LIBOR loans." Base rate loans accrue interest at a base rate equal to the greater of the Agent's prime rate, the federal funds rate plus 0.5%, or LIBOR plus 1.0%, plus an applicable margin that is adjusted quarterly between 1.25% and 2.25% based on average pricing availability.margin; while LIBOR loans accrue interest at LIBOR, plus an applicable margin that ismargin. The applicable rates are adjusted quarterly between 2.25% and 3.25% based on average pricing availability. The unused line fee is also adjusted quarterly between 0.5% and 0.75% ofbased on the average daily amount by which the Lenders' aggregate revolving commitments under the Credit Facility exceed the outstanding principal amount of revolver loans and the aggregate undrawn amount of all outstanding letters of credit issued under the Credit Facility. The obligations under the Credit Facility are guaranteed by us and secured by a pledge of substantially all of our assets, with the notable exclusion of any real estate or revenue equipment pledged under other financing agreements, including revenue equipment installment notes and capital leases.
Borrowings under the Credit Facility are subject to a borrowing base limited to the lesser of (A) $85.0$95.0 million, minus the sum of the stated amount of all outstanding letters of credit; or (B) the sum of (i) 85% of eligible accounts receivable, plus (ii) the lesser of (a) 85% of the appraised net orderly liquidation value of eligible revenue equipment, (b) 95% of the net book value of eligible revenue equipment, or (c) 35% of the Lenders' aggregate revolving commitments under the Credit Facility, plus (iii) the lesser of (a) $25.0 million or (b) 65% of the appraised fair market value of eligible real estate. The borrowing base is limited by a $15.0 million availability block, plus any other reserves the Agent may establish in its judgment. We had $15.9 million ina de minimis amount of borrowings outstanding under the Credit Facility as of December 31, 2011,2012, undrawn letters of credit outstanding of approximately $38.9$39.6 million, and available borrowing capacity of $27.6$52.7 million. The interest rate on outstanding borrowings as of December 31, 2011 and 20102012 was 5.0% and 4.8%, respectively.all loans were base rate loans.
The Credit Facility includes usual and customary events of default for a facility of this nature and provides that, upon the occurrence and continuation of an event of default, payment of all amounts payable under the Credit Facility may be accelerated, and the Lenders' commitments may be terminated. The Credit Facility contains certain restrictions and covenants relating to, among other things, debt, dividends, liens, acquisitions and dispositions outside of the ordinary course of business, and affiliate transactions. Following the most recent amendment to the Credit Facility discussed below, the Credit Facility contains two financial covenants: a covenant requiring us to maintain a monthly consolidated fixed charge coverage ratio (defined below) of at least 1.0 to 1.0 and a covenant requiring us to maintain a quarterly consolidated leverage ratio (defined below) not to exceed 4.35 to 1.0.
Our fixed charge coverage ratio is comprised of dividing (i) (a) our consolidated EBITDAR, as defined in the Credit Facility, minus (b) certain capital expenditures, excluding debt incurred to finance capital expenditures, by (ii) the sum, without duplication of, (a) interest expense, cash rental expense, scheduled principal debt payments, certain payments with respect to the revolving credit facility, certain voluntary or discretionary principal payments or other prepayments of debt, taxes paid in cash, minus (b) any cash tax refunds received, plus (c) distributions paid in cash and payments made in respect of obligations under capital leases.
Our consolidated leverage ratio requires us not to exceed a ratio calculated by dividing (i) the sum of (a) our consolidated balance sheet debt, plus (b) sums obligated by Borrowers under letters of credit, plus (c) the present value (utilizing a discount rate of 10% annually) of all future lease payments on any operating leases, by (ii) our consolidated adjusted EBITDAR, as set forth in the Credit Facility.
In the past, we have had difficulty achieving profitability, causing us to risk breaching our fixed charge coverage ratio covenant. To avoid such breach, we have worked with our Lenders to obtain multiple amendments and waivers to the Credit Facility in return for higher interest rates, fees, and additional restrictions. In the fourth quarter of 2011, we entered into a fifth amendment that prevented a default of our fixed charge coverage ratio for the year ended September 30, 2011, by adjusting the fixed charge coverage ratio for that period to 0.95 to 1.0 from 1.0 to 1.0. Subsequent to the fifth amendment, we entered into a sixth amendment to our Credit Facility that revises the definitions underlying our fixed charge coverage ratio, which we expect to provide us with additional flexibility under this covenant going forward. However, the sixth amendment also added the consolidated leverage ratio covenant discussed above, which could restrict our ability to incur additional indebtedness, undertake acquisitions, or make other capital investments to the extent such indebtedness, acquisitions, or capital investments would cause the leverage ratio to exceed the specified maximum. In exchange for these amendments, we agreed to the increases in interest rates and fees described above and paid fees and expenses of approximately $0.3 million.
Failure to comply with the covenants and restrictions set forth in the Credit Facility could result in an event of default. In such an event, all amounts outstanding under the Credit Facility, together with accrued interest, could then be declared immediately due and payable. If an event of default occurs under the Credit Facility and the Lenders cause all of the outstanding debt obligations under the Credit Facility to become due and payable, this could result in a default under other debt instruments that contain acceleration or cross-default provisions. FailureThe Credit Facility contains certain restrictions and covenants relating to, comply with our financial covenant ratios could significantly constrain our liquidityamong other things, debt, dividends, liens, acquisitions and hinder our operationsdispositions outside of the ordinary course of business, and growth prospects.affiliate transactions.
Capital lease obligations are utilized to finance a portion of our revenue equipment and are entered into with certain finance companies who are not parties to our Credit Facility. The leases in effect at December 31, 20112012 terminate in September 2014 through September 2016 and contain guarantees of the residual value of the related equipment by us. As such, the residual guarantees are included in the related debt balance as a balloon payment at the end of the related term as well as included in the future minimum capital lease payments. These lease agreements require us to pay personal property taxes, maintenance, and operating expenses.
Pricing for the revenue equipment installment notes are quoted by the respective financial affiliates of our primary revenue equipment suppliers and other lenders at the funding of each group of equipment acquired and include fixed annual rates for new equipment under retail installment contracts. The notes included in the funding are due in monthly installments with final maturities at various dates ranging from January 20122013 to May 2016.January 2018. The notes contain certain requirements regarding payment, insuring of collateral, and other matters, but do not have any financial or other material covenants or events of default except certain notes totaling $156.1$126.5 million are cross-defaulted with the Credit Facility. Additional borrowings from the financial affiliates of our primary revenue equipment suppliers and other lenders are available to fund most new tractors expected to be delivered in 2012,2013, while any other property and equipment purchases, including trailers, will be funded with a combination of notes, operating leases, capital leases, and/or from the Credit Facility.
As of December 31, 2011,2012, the scheduled principal payments of debt, excluding capital leases for which future payments are discussed in Note 98 are as follows:
| | | (in thousands) | |
| 2012 | | $ | 96,258 | |
| 2013 | | $ | 51,402 | |
| 2014 | | $ | 21,488 | |
| 2015 | | $ | 30,753 | |
| 2016 | | $ | 24,524 | |
| Thereafter | | $ | - | |
9.| | | |
| 2013 | | $ | 63,636 |
| 2014 | | $ | 25,520 |
| 2015 | | $ | 33,132 |
| 2016 | | $ | 27,657 |
| 2017 | | $ | 6,793 |
| Thereafter | | $ | 2,112 |
8. LEASES
We have operating lease commitments for office and terminal properties, revenue equipment, and computer and office equipment and capital lease commitments for revenue equipment, exclusive of owner/operator rentals and month-to-month equipment rentals, summarized for the following fiscal years (in thousands):
| | | Operating | | | Capital | | | | | | | |
| 2012 | | | 19,792 | | | | 3,104 | | |
| 2013 | | | 14,456 | | | | 3,104 | | | $ | 24,334 | | | $ | 3,059 | |
| 2014 | | | 8,804 | | | | 8,783 | | | $ | 21,152 | | | $ | 8,751 | |
| 2015 | | | 7,434 | | | | 3,362 | | | $ | 19,204 | | | $ | 3,362 | |
| 2016 | | | 4,309 | | | | 2,886 | | | $ | 14,464 | | | $ | 2,886 | |
| 2017 | | | $ | 6,683 | | | $ | - | |
| Thereafter | | | 26,707 | | | | - | | | $ | 26,252 | | | $ | - | |
A portion of our operating leases of tractors and trailers contain residual value guarantees under which we guarantee a certain minimum cash value payment to the leasing company at the expiration of the lease. We estimate that the residual guarantees are approximately $3.9$9.2 million and $8.2$3.9 million at December 31, 20112012 and 2010,2011, respectively. The residual guarantees at December 31, 20112012 expire in 2016.between 2016 and 2019. We expect our residual guarantees to approximate the market value at the end of the lease term. Additionally, certain leases contain cross-default provisions with other financing agreements and additional charges if the unit's mileage exceeds certain thresholds defined in the lease agreement.
Rental expense is summarized as follows for each of the three years ended December 31:
| (in thousands) | | 2011 | | | 2010 | | | 2009 | | 2012 | 2011 | 2010 |
| | | | | | | | | | | |
| Revenue equipment rentals | | $ | 15,158 | | | $ | 17,017 | | | $ | 25,863 | | $19,746 | $15,364 | $17,346 |
| Building and lot rentals | | | 3,266 | | | | 3,586 | | | | 3,976 | | 3,714 | 3,266 | 3,586 |
| Other equipment rentals | | | 812 | | | | 1,063 | | | | 1,829 | | | | |
| | | $ | 19,236 | | | $ | 21,666 | | | $ | 31,668 | | | | |
On October 28, 2010, we executed a Letter Agreement ("Letter Agreement") with Transport International Pool, Inc. ("TIP"). The Letter Agreement modifies the Master Lease Agreement dated April 15, 2003, between TIP and us, pursuant to which we have entered into (among others) equipment lease schedules covering 2,446 trailers (the "Designated Schedules") which expired between November 2010 and May 2011. In addition, contemporaneously with the execution of the Letter Agreement, we returned 543 trailers in accordance with the terms of the Master Lease Agreement in order to better match our trailer fleet with our current number of tractors. Pursuant to the terms of the Letter Agreement, upon the scheduled expiration of each of the Designated Schedules, we will lease from TIP the trailers that are subject to such Designated Schedule on the terms and conditions set forth in the Letter Agreement and a new lease schedule attached to and made a part of the Letter Agreement. Under the terms of the Letter Agreement, the trailers subject to the agreement will be required to be returned or purchased at the rate of approximately 100 trailers per month beginning February 2012. The improved rental rate, coupledIn 2012, we began turning in the trailers that were covered by the Designated Schedules and replaced a portion of the trailers with the reductionnew ones, such that our total trailer count is approximately 450 less at December 31, 2012 than December 31, 2011. We will continue turning in rental expense associated with the return of 543 trailers, provided us with savings on the TIP trailers in fiscal year 2011, which2013 and 2014 pursuant to the Letter Agreement; however, these units will continue into 2012 absent any incremental costs from replacinggenerally be replaced on a large portion of our trailer fleet. In order to induce TIP to enter into the agreement, we and certain of our subsidiaries delivered to TIP a corporate guaranty, in which the guarantors agreed to guaranty all existing and future obligations of us from time-to-time owing to TIP, including, without limitation, all obligations under the Master Lease Agreement.one-for-one basis with new trailers.
In April 2006, we entered into a sale leaseback transaction involving our corporate headquarters, a maintenance facility, a body shop, and approximately forty-six acres of surrounding property in Chattanooga, Tennessee. In the transaction, we entered into a twenty-year lease agreement, whereby we will lease back the property at an annual rental rate of approximately $2.5 million subject to annual rent increases of 1.0%, resulting in annual straight-line rental expense of approximately $2.7 million, which comprises a significant portion of building rentals above. The transaction resulted in a gain of approximately $2.1 million, which is being amortized ratably over the life of the lease, noting the $1.6$1.4 million deferred gain is included in other long-term liabilities in the consolidated balance sheet.
10.
9. INCOME TAXES
Income tax expense (benefit) for the years ended December 31, 2012, 2011, 2010, and 20092010 is comprised of:
| (in thousands) | | 2011 | | | 2010 | | | 2009 | |
| | | | | | | | | | |
| Federal, current | | $ | (198 | ) | | $ | (11,377 | ) | | $ | 3,680 | |
| Federal, deferred | | | (1,688 | ) | | | 16,739 | | | | (8,038 | ) |
| State, current | | | 184 | | | | 130 | | | | (34 | ) |
| State, deferred | | | (470 | ) | | | 683 | | | | (626 | ) |
| | | $ | (2,172 | ) | | $ | 6,175 | | | $ | (5,018 | ) |
| (in thousands) | | | | | | | | | |
| Federal, current | | $ | (707 | ) | | $ | (198 | ) | | $ | (11,377 | ) |
| Federal, deferred | | | 6,897 | | | | (1,688 | ) | | | 16,739 | |
| State, current | | | 307 | | | | 184 | | | | 130 | |
| State, deferred | | | (162 | ) | | | (470 | ) | | | 683 | |
| | | $ | 6,335 | | | $ | (2,172 | ) | | $ | 6,175 | |
Income tax expense varies from the amount computed by applying the federal corporate income tax rate of 35% to income before income taxes for the years ended December 31, 2012, 2011, 2010, and 20092010 as follows:
| (in thousands) | | 2011 | | | 2010 | | | 2009 | | | | | | | | | | |
| | | | | | | | | | | |
| Computed "expected" income tax expense | | $ | (5,754 | ) | | $ | 3,312 | | | $ | (10,517 | ) | | $ | 4,340 | | | $ | (5,754 | ) | | $ | 3,312 | |
| State income taxes, net of federal income tax effect | | | (559 | ) | | | 322 | | | | (1,050 | ) | | | 409 | | | | (559 | ) | | | 322 | |
| Per diem allowances | | | 3,015 | | | | 3,350 | | | | 3,320 | | | | 2,550 | | | | 3,015 | | | | 3,350 | |
| Tax contingency accruals | | | (70 | ) | | | 145 | | | | (216 | ) | | | (444 | ) | | | (70 | ) | | | 145 | |
| Nondeductible foreign operating income | | | - | | | | (133 | ) | | | (504 | ) | | | - | | | | - | | | | (133 | ) |
| Nondeductible goodwill impairment | | | 2,275 | | | | - | | | | - | | | | - | | | | 2,275 | | | | - | |
| Realization of outside basis difference related to Transplace | | | - | | | | - | | | | 2,599 | | |
| Valuation allowance (release), net | | | (708 | ) | | | (638 | ) | | | 1,896 | | | | (251 | ) | | | (708 | ) | | | (638 | ) |
| Disallowed interest release | | | - | | | | (48 | ) | | | (189 | ) | | | - | | | | - | | | | (48 | ) |
| Tax credits | | | (61 | ) | | | (182 | ) | | | (44 | ) | | | (407 | ) | | | (61 | ) | | | (182 | ) |
| Other, net | | | (310 | ) | | | 47 | | | | (313 | ) | | | 138 | | | | (310 | ) | | | 47 | |
| Actual income tax expense | | $ | (2,172 | ) | | $ | 6,175 | | | $ | (5,018 | ) | | $ | 6,335 | | | $ | (2,172 | ) | | $ | 6,175 | |
Income tax expense varies from the amount computed by applying the federal corporate income tax rate of 35% to income (loss) before income taxes primarily due to state income taxes, net of federal income tax effect, adjusted for permanent differences, the most significant of which is the effect of the per diem pay structure for drivers. Drivers who meet the requirements to receive per diem are generally required to receive non-taxable per diem pay in lieu of a portion of their taxable wages. This per diem program increases our drivers' net pay per mile, after taxes, while decreasing gross pay, before taxes. As a result, salaries, wages, and employee benefits are slightly lower and our effective income tax rate is higher than the statutory rate. Generally, as pre-tax income increases, the impact of the driver per diem program on our effective tax rate decreases, because aggregate per diem pay becomes smaller in relation to pre-tax income, while in periods where earnings are at or near breakeven the impact of the per diem program on our effective tax rate is significant. Due to the partially nondeductible effect of per diem pay, our tax rate will fluctuate in future periods based on fluctuations in earnings. Our effective tax rate is also significantly impacted in the 2011 period by the tax deductibility of the $11.5 million goodwill impairment recorded in the third quarter of 2011, wherebyof which $2.1 million of the goodwill impaired related toimpairment was tax deductible goodwill, whileand the remaining $9.4 million was nondeductible and in the 2009 period by the $11.5 million loss on the sale of our investment in Transplace and the related note receivable, of which none as deductible.nondeductible.
The temporary differences and the approximate tax effects that give rise to our net deferred tax liability at December 31, 20112012 and 20102011 are as follows:
| (in thousands) | | 2011 | | | 2010 | | | 2012 | | | 2011 | |
| | | | | | | | |
| Net deferred tax assets: | | | | | | | |
| Deferred tax assets: | | | | | | | |
Allowance for doubtful accounts | | $ | 657 | | | $ | 539 | | | $ | 662 | | | $ | 657 | |
Insurance and claims | | | 10,766 | | | | 9,533 | | | | 11,950 | | | | 10,766 | |
Net operating loss carryovers | | | 31,031 | | | | 34,343 | | | | 16,978 | | | | 31,031 | |
| Capital loss carryover related to Transplace | | | 251 | | | | 1,670 | | | | - | | | | 251 | |
Other accrued liabilities | | | 1,094 | | | | 445 | | |
Other | | | 4,991 | | | | 6,189 | | | | 5,607 | | | | 6,085 | |
| Valuation allowance | | | (550 | ) | | | (1,258 | ) | | | (299 | ) | | | (550 | ) |
| Total net deferred tax assets | | | 48,240 | | | | 51,461 | | |
| Total deferred tax assets | | | | 34,898 | | | | 48,240 | |
| | | | | | | | | | | | | | | | | |
| Net deferred tax liabilities: | | | | | | | | | |
| Deferred tax liabilities: | | | | | | | | | |
Property and equipment | | | (83,651 | ) | | | (87,009 | ) | | | (76,748 | ) | | | (83,651 | ) |
| Other | | | (34 | ) | | | (1,990 | ) | | | (291 | ) | | | (34 | ) |
| Prepaid expenses | | | (2,842 | ) | | | (3,606 | ) | | | (3,054 | ) | | | (2,842 | ) |
| Total net deferred tax liabilities | | | (86,527 | ) | | | (92,605 | ) | | | (80,093 | ) | | | (86,527 | ) |
| | | | | | | | | | | | | | | | | |
| Net deferred tax liability | | $ | (38,287 | ) | | $ | (41,144 | ) | | $ | (45,195 | ) | | $ | (38,287 | ) |
Deferred taxes are classified in the accompanying consolidated balance sheet based on the nature of the related asset or liability as current or long-term, such that current deferred tax assets and liabilities provide a net asset of $4.4$4.6 million, while long-term deferred tax assets and liabilities provide a net liability of $42.7$49.8 million. The net deferred tax liability of $38.3$45.2 million primarily relates to differences in cumulative book versus tax depreciation of property and equipment, partially off-set by net operating loss carryovers and insurance claims that have been reserved but not paid. The carrying value of the our deferred tax assets assumes that it will be able to generate, based on certain estimates and assumptions, sufficient future taxable income in certain tax jurisdictions to utilize these deferred tax benefits. If these estimates and related assumptions change in the future, it may be required to establish a valuation allowance against the carrying value of the deferred tax assets, which would result in additional income tax expense. The carrying value of our deferred tax assets assumes that we will be able to generate, based on certain estimates and assumptions, sufficient future taxable income in certain tax jurisdictions to utilize these deferred tax benefits. If these estimates and related assumptions change in the future, we may be required to establish a valuation allowance against the carrying value of the deferred tax assets, which would result in additional income tax expense. On a periodic basis, we assess the need for adjustment of the valuation allowance. Based on forecasted taxable income resulting from the reversal of deferred tax liabilities, primarily generated by accelerated depreciation for tax purposes in prior periods, and tax planning strategies available to us, no valuation allowance has been established at December 31, 20112012 or 2010,2011, except for $0.6$0.3 million and $1.3$0.6 million, respectively, related to certain state net operating loss and capital loss carry-forwards. If these estimates and related assumptions change in the future, we may be required to modify our valuation allowance against the carrying value of the deferred tax assets.
The activity in the valuation allowance on deferred tax assets (in thousands) is as follows:
Years ended December 31: | | Beginning balance January 1, | | | Additional provisions to allowance | | | Write-offs and other deductions | | | Ending balance December 31, | | | Beginning balance January 1, | | | Additional provisions to allowance | | | Write-offs and other deductions | | | Ending balance December 31, | |
| 2012 | | | $ | 550 | | | $ | - | | | $ | (251 | ) | | $ | 299 | |
| | | | | | | | | | | | | | | | | | |
| 2011 | | $ | 1,258 | | | $ | 32 | | | $ | (740 | ) | | $ | 550 | | | $ | 1,258 | | | $ | 32 | | | $ | (740 | ) | | $ | 550 | |
| | | | | | | | | | | | | | | | | | |
| 2010 | | $ | 1,896 | | | $ | 42 | | | $ | (680 | ) | | $ | 1,258 | | |
As of December 31, 2011,2012, we had a $3.3$2.6 million liability recorded for unrecognized tax benefits, which includes interest and penalties of $1.3$1.0 million. We recognize interest and penalties accrued related to unrecognized tax benefits in tax expense. As of December 31, 2010,2011, we had a $3.4$3.3 million liability recorded for unrecognized tax benefits, which included interest and penalties of $1.3 million. Interest and penalties recognized for uncertain tax positions were approximatelyprovided for a $0.3 million benefit in 2012, compared to $0.1 million, $0.2 million and $0.2 million of expense in 2011 2010, and 2009,2010, respectively.
The following tables summarize the annual activity related to our gross unrecognized tax benefits (in thousands) for the years ended December 31, 2012, 2011, 2010, and 2009:2010:
| | | 2011 | | | 2010 | | | 2009 | | | | | | | | | | |
| Balance as of January 1, | | $ | 2,133 | | | $ | 2,137 | | | $ | 1,971 | | | $ | 1,979 | | | $ | 2,133 | | | $ | 2,137 | |
Increases related to prior year tax positions | | | 3 | | | | 75 | | | | 67 | | | | - | | | | 3 | | | | 75 | |
Decreases related to prior year positions | | | - | | | | (30 | ) | | | (3 | ) | | | - | | | | - | | | | (30 | ) |
Increases related to current year tax positions | | | 58 | | | | 110 | | | | 279 | | | | 2 | | | | 58 | | | | 110 | |
Decreases related to settlements with taxing authorities | | | - | | | | - | | | | (122 | ) | | | - | | | | - | | | | - | |
Decreases related to lapsing of statute of limitations | | | (215 | ) | | | (159 | ) | | | (55 | ) | | | (418 | ) | | | (215 | ) | | | (159 | ) |
| Balance as of December 31, | | $ | 1,979 | | | $ | 2,133 | | | $ | 2,137 | | | $ | 1,563 | | | $ | 1,979 | | | $ | 2,133 | |
If recognized, $2.0$1.7 million and $2.1$2.0 million of unrecognized tax benefits would impact our effective tax rate as of December 31, 20112012 and 20102011 respectively. Any prospective adjustments to our reserves for income taxes will be recorded as an increase or decrease to our provision for income taxes and would impact our effective tax rate.
Our 20082009 through 20112012 tax years remain subject to examination by the IRS for U.S. federal tax purposes, our major taxing jurisdiction. In the normal course of business, we are also subject to audits by state and local tax authorities. While it is often difficult to predict the final outcome or the timing of resolution of any particular tax matter, we believe that our reserves reflect the more likely than not outcome of known tax contingencies. We adjust these reserves, as well as the related interest, in light of changing facts and circumstances. Settlement of any particular issue would usually require the use of cash. Favorable resolution would be recognized as a reduction to our annual tax rate in the year of resolution. We do not expect any significant increases or decreases for uncertain income tax positions during the next year.
Our federal net operating loss carryforwards are available to offset future federal taxable income, if any, through 2030, while our state net operating loss carryforwards and state tax credits expire over various periods throughbetween 2013 and 2030 based on jurisdiction. The capital loss carryforward related to the loss on the investment in Transplace is available to offset future capital gains through 2014.
We recognized a $0.4 million income tax benefit arising from the exercise
11.10. EQUITY METHOD INVESTMENT
On May 31, 2011, we acquired a 49.0% interest in Transport Enterprise Leasing, LLC for $1.5 million in cash. Additionally, TEL’s majority owners arewere eligible to receive an earn-out of up to $4.5 million over two years,for TEL’s results through December 31, 2012, of which $1.0 million iswas earned based on TEL’s 2011 results and $2.4 million was earned based on TEL’s 2012 results. At December 31, 2012 and 2011, $0.5 million and $1.0 million, respectively, were included in accrued expenses at December 31, 2011 onin the consolidated balance sheet related to amounts due TEL’s majority ownersearned but not paid as a result of its 2011 earnings. Anythe respective balance sheet dates. The earn-out payments will increaseincreased our investment balance should they be required. and there are no additional earn-outs pursuant for future results.
TEL is a tractor and trailer equipment leasing company and used equipment reseller. We have not guaranteed any of TEL’s debt and have no obligation to provide funding, services or assets. Under the agreement, we have an option to acquire 100% of TEL between January 1, 2013 and May 31, 2016, by purchasing the majority owners’ interest based on a multiple of TEL’s average earnings before incomeinterest and taxes, adjusted for certain items including cash and debt balances as of the acquisition date. Subsequent to May 31, 2016, TEL’s majority owners’ have the option to acquire our interest based on the same terms detailed above. DuringFor the seven month periodyears ended, December 31, 2012 and 2011, we sold tractors and trailers to TEL for $8.6 million $5.4 million, respectively, and received $2.1 million and $0.5 million, respectively, for providing various maintenance services, certain back-office functions and for miscellaneous equipment. We deferred gains totaling $0.2 million and $0.6 million infor the years ending December 31, 2012 and 2011, representing 49% of the gains on the tractors and trailersunits sold to TEL untilless any gains previously deferred and recognized when the equipment is subsequentlywas sold to a third party. The deferredDeferred gains totaling $0.8 and $0.6 million at December 31, 2012 and December 31, 2011, respectively, are being carried as a reduction in our investment in TEL. At December 31, 2011, weWe had a receivable from TEL for 2012 and 2011 of $0.8 million and $0.6 million, respectively, related to cash disbursements made pursuant to a cash management agreement.our performance of certain back-office and maintenance functions on their behalf.
We have accounted for our investment in TEL using the equity method of accounting and thus our financial results include our proportionate share of TEL’s net income since May 31, 2011, or $1.9 million in 2012 and $0.7 million. In the third quarter of 2011, wemillion in 2011. We received an equity distribution from TEL for $0.3 million in 2012 and $0.2 million thatin 2011, which was distributed to each member based on theirits respective ownership percentage in order to satisfy estimated tax payments resulting from TEL’s earnings. The distribution is the result of TEL being a limited liability company and thus its earnings pass through to the members and are taxed for federal and certain state income on their respective tax returns. Our investment in TEL, totaling $6.1 million and $2.4 million at December 31, 2012 and 2011, respectively, is included in other assets in the accompanying consolidated balance sheet.
See TEL’s summarized financial information below subsequent to our investment.investment below.
| (in thousands) | | As of and for the seven months ended December 31, | | | As of and for the twelve months ended December 31, 2012 | | | As of and for the seven months ended December 31, 2011 | |
| | | 2011 | | |
| Current Assets | | $ | 3,805 | | | $ | 6,898 | | | $ | 3,805 | |
| Non-current Assets | | | 11,255 | | | | 21,150 | | | | 11,255 | |
| Current Liabilities | | | 5,136 | | | | 9,988 | | | | 5,136 | |
| Non-current Liabilities | | | 8,739 | | | | 13,670 | | | | 8,739 | |
| Total Equity | | | 1,185 | | | | 4,390 | | | | 1,185 | |
| | | | | | | | | | | | | |
| Revenue | | $ | 31,070 | | | $ | 53,459 | | | $ | 31,070 | |
| Operating Expenses | | | 29,426 | | | | 48,382 | | | | 29,426 | |
| Operating Income | | | 1,644 | | | | 5,077 | | | | 1,644 | |
| Net Income | | $ | 1,331 | | | $ | 3,850 | | | $ | 1,331 | |
12.11. DEFERRED PROFIT SHARING EMPLOYEE BENEFIT PLAN
We have a deferred profit sharing and savings plan under which all of our employees with at least six months of service are eligible to participate. Employees may contribute a percentage of their annual compensation up to the maximum amount allowed by the Internal Revenue Code. We may make discretionary contributions as determined by a committee of its Board of Directors. We made no contributions in 2012, 2011, and 2010 and less than $0.1 million in 2009 to the profit sharing and savings plan. The Board approved the suspension of employee matching "discretionary" contributions to be made beginning early in 2009 for an indefinite time period.
12. RELATED PARTY TRANSACTIONS
See Note 10 for discussions of the related party transactions associated with TEL.
13. RELATED PARTY TRANSACTIONS
See Note 5 and Note 11 for discussions of the related party transactions associated with Transplace and TEL, respectively.
14. DERIVATIVE INSTRUMENTS
We engage in activities that expose us to market risks, including the effects of changes in fuel prices. Financial exposures are evaluated as an integral part of our risk management program, which seeks, from time-to-time, to reduce the potentially adverse effects that the volatility of fuel markets may have on operating results. In an effort to seek to reduce the variability of the ultimate cash flows associated with fluctuations in diesel fuel prices, we periodically enter into various derivative instruments, including forward futures swap contracts. As diesel fuel is not a traded commodity on the futures market, heating oil is used as a substitute for diesel fuel as prices for both generally move in similar directions. Under these contracts, we pay a fixed rate per gallon of heating oil and receive the monthly average price of New York heating oil per the NYMEX ("New"NYMEX" (New York Mercantile Exchange")Exchange). The retrospective and prospective regression analyses provided that changes in the prices of diesel fuel and heating oil were deemed to be highly effective based on the relevant authoritative guidance. We do not engage in speculative transactions, nor do we hold or issue financial instruments for trading purposes.
We recognize all derivative instruments at fair value on our consolidated balance sheets. Our derivative instruments are designated as cash flow hedges, thus the effective portion of the gain or loss on the derivatives is reported as a component of accumulated other comprehensive income and will be reclassified into earnings in the same period during which the hedged transaction affects earnings. The effective portion of the derivative represents the change in fair value of the hedge that offsets the change in fair value of the hedged item. To the extent the change in the fair value of the hedge does not perfectly offset the change in the fair value of the hedged item, the ineffective portion of the hedge is immediately recognized in other income on our consolidated statements of operations. Ineffectiveness is calculated using the cumulative dollar offset method as an estimate of the difference in the expected cash flows of the heating oil futures contracts compared to the changes in the all-in cash outflows required for the diesel fuel purchases.
At December 31, 2011,2012, we had forward futures swap contracts on approximately 12.912.1 million gallons of diesel to be purchased in 20122013 or approximately 21.4%20% of our projected annual 20122013 fuel requirements and 4.0 million gallons to be purchased in 2014 or approximately 6% of our projected annual 2014 fuel requirements.
The fair value of the contracts that were in effect at December 31, 2012 and 2011, which had a fair value of approximately $0.5 million and $0.1 million, respectively, and are included in other assets in the consolidated balance sheet, are included in accumulated other comprehensive income, net of tax. Additionally, $3.1 million, $1.9 million, wasand $1.8 million were reclassified from accumulated other comprehensive income (loss) to our results from operations for the yearyears ended December 31, 2012, 2011, and 2010, respectively, related to gains on contracts that expired or were sold and for which we completed the forecasted transaction by purchasing the hedged diesel fuel.
During the fourth quarter of 2010, the Company sold all of its contracts related to the forecasted purchase of diesel fuel in 2011 to lock-in the related gains. The gains totaling $0.5 million are included in accumulated other comprehensive income, net of tax of $0.3 million at December 31, 2010. As such, there are no outstanding derivative instruments at December 31, 2010. During 2010, $1.8 million was reclassified from accumulated other comprehensive income to earnings related to gains on contracts that expired or were sold and for which the Company completed the forecasted transaction by purchasing the hedged diesel fuel. At December 31, 2009, the Company's derivative instruments had a fair value of $0.5 million, while the offsetting $0.3 million, net of tax of $0.2 million, was included in accumulated other comprehensive income. No amounts were reclassified from accumulated other comprehensive income into earnings in 2009 given the futures swap contracts were forward starting in 2010 and as such there had been no transactions involving purchases of the related diesel fuel being hedged at December 31, 2009.
During the second quarter of 2010, the Company entered into a fixed forward purchase agreement with a fuel vendor whereby the Company agreed to purchase 0.5 million gallons of diesel fuel per month for twenty-four months and included in the contract was a hedge of the related cost of the fuel under which the Company pays a fixed rate per gallon of heating oil and receives the monthly average price of New York heating oil per the NYMEX. The hedge and related purchase of the fuel was accounted for using the normal purchases and sales scope exception given management concluded that all relevant criteria were met. Subsequent to entering into the agreement, the Company sold the related contract as a result of a significant gain on the hedge and determination that the fundamentals of the petroleum markets provided for the likely ability of the Company to both realize the gain and enter into a subsequent hedge to mitigate the risk at a similar cost. The termination of the agreement generated a $0.8 million gain that was recorded during the second quarter of 2010 and is included as a reduction in fuel expense.
Based on the amounts in accumulated other comprehensive income as of December 31, 20112012 and the expected timing of the purchases of the diesel hedged, we expect to reclassify less than $0.1approximately $0.3 million on derivative instruments from accumulated other comprehensive income into our results from operations during the next year due to the actual diesel fuel purchases. The amounts actually realized will be dependent on the fair values as of the date of settlement.
We perform both a prospective and retrospective assessment of the effectiveness of our hedge contracts at inception and quarterly, including assessing the possibility of counterparty default. If we determine that a derivative is no longer expected to be highly effective, we discontinue hedge accounting prospectively and recognize subsequent changes in the fair value of the hedge in earnings. As a result of our effectiveness assessment at inception, quarterly, and at December 31, 20112012 and 2010,2011, we believe our hedge contracts have been and will continue to be highly effective in offsetting changes in cash flows attributable to the hedged risk.
Outstanding financial derivative instruments expose us to credit loss in the event of nonperformance by the counterparties to the agreements. We do not expect any of the counterparties to fail to meet their obligations. Our credit exposure related to these financial instruments is represented by the fair value of contracts reported as assets. To manage credit risk, we review each counterparty's audited financial statements and credit ratings and obtain references.
15.14. COMMITMENTS AND CONTINGENT LIABILITIES
From time-to-time, we are a party to ordinary, routine litigation arising in the ordinary course of business, most of which involves claims for personal injury and property damage incurred in connection with the transportation of freight. We maintain insurance to cover liabilities arising from the transportation of freight for amounts in excess of certain self-insured retentions. In management's opinion, our potential exposure under pending legal proceedings is adequately provided for in the accompanying consolidated financial statements.
We had $38.9$39.6 million and $44.7$38.9 million of outstanding and undrawn letters of credit as of December 31, 20112012 and 2010,2011, respectively. The letters of credit are maintained primarily to support our insurance programs.
We had commitments outstanding at December 31, 2011,2012, to acquire revenue equipment totaling approximately $55.0$74.3 million in 20122013 versus commitments at December 31, 20102011, of approximately $112.5$55.0 million. These commitments are cancelable, subject to certain adjustments in the underlying obligations and benefits. These purchase commitments are expected to be financed by operating leases, capital leases, long-term debt, proceeds from sales of existing equipment, and/or cash flows from operations. Additionally, 20122013 purchase obligations include $1.0$0.5 million of earn-out payments related to our investment in TEL to be paid in 20122013 related to 20112012 performance. We also had commitments outstanding at December 31, 2011,2012, to acquire computer software totaling $0.4 million in 2013.
16.
15. SEGMENT INFORMATION
As previously discussed, we have two reportable segments: Asset-Based Truckload Services and our Brokerage Services.Solutions.
The accounting policies of the segments are the same as those described in the summary of significant accounting policies. Substantially all intersegment sales prices are market based. We evaluate performance based on operating income of the respective business units.
"Unallocated Corporate Overhead" includes expenses that are incidental to our activities and are not specifically allocated to one of the segments.
Year Ended December 31, 2012 | | | | | | | | | Unallocated Corporate Overhead | | | | |
| Revenue | | | $ | 647,986 | | | $ | 33,250 | | | $ | - | | | $ | 681,236 | |
| Intersegment revenue | | | | - | | | | (6,982 | ) | | | - | | | | (6,982 | ) |
| Operating income (loss) | | | | 34,185 | | | | (741 | ) | | | (10,235 | ) | | | 23,209 | |
| Depreciation and amortization | | | | 42,015 | | | | 26 | | | | 1,181 | | | | 43,222 | |
| Total assets | | | | 363,223 | | | | 11,963 | | | | 25,046 | | | | 400,232 | |
| Capital expenditures (proceeds), net | | | | (14,093 | ) | | | - | | | | 939 | | | | (13,154 | ) |
| | | | | | | | | | | | | | | | | | |
Year Ended December 31, 2011 | | Truckload | | | Brokerage | | | Unallocated Corporate Overhead | | | Consolidated | | | | | | | | | | | | | | | | | |
| Revenue | | $ | 625,252 | | | $ | 33,526 | | | $ | - | | | $ | 658,778 | | | $ | 625,252 | | | $ | 33,526 | | | $ | - | | | $ | 658,778 | |
| Intersegment revenue | | | - | | | | (6,151 | ) | | | - | | | | (6,151 | ) | | | - | | | | (6,151 | ) | | | - | | | | (6,151 | ) |
| Operating income (loss) (1) | | | 10,438 | | | | 1,687 | | | | (13,186 | ) | | | (1,061 | ) | | | 10,438 | | | | 1,687 | | | | (13,186 | ) | | | (1,061 | ) |
| Depreciation and amortization | | | 44,825 | | | | 24 | | | | 1,425 | | | | 46,274 | | | | 44,825 | | | | 24 | | | | 1,425 | | | | 46,274 | |
| Goodwill at carrying value | | | - | | | | - | | | | - | | | | - | | |
| Total assets | | | 405,699 | | | | 6,138 | | | | 27,988 | | | | 439,825 | | | | 405,699 | | | | 6,138 | | | | 27,988 | | | | 439,825 | |
| Capital expenditures, net | | | 49,210 | | | | - | | | | 1,531 | | | | 50,741 | | | | 49,210 | | | | - | | | | 1,531 | | | | 50,741 | |
| | | | | | | | | | | | | | | | | | | | | | | | | | | | | | | | | |
| Year Ended December 31, 2010 | | | | | | | | | | | | | | | | | | | | | | | | | | | | | | | | |
| Revenue | | $ | 610,291 | | | $ | 46,053 | | | $ | - | | | $ | 656,344 | | | $ | 610,291 | | | $ | 46,053 | | | $ | - | | | $ | 656,344 | |
| Intersegment revenue | | | - | | | | (6,595 | ) | | | - | | | | (6,595 | ) | | | - | | | | (6,595 | ) | | | - | | | | (6,595 | ) |
| Operating income (loss) | | | 35,390 | | | | 1,462 | | | | (10,844 | ) | | | 26,008 | | | | 35,390 | | | | 1,462 | | | | (10,844 | ) | | | 26,008 | |
| Depreciation and amortization | | | 50,821 | | | | 23 | | | | 963 | | | | 51,807 | | | | 50,821 | | | | 23 | | | | 963 | | | | 51,807 | |
| Goodwill at carrying value | | | 11,539 | | | | - | | | | - | | | | 11,539 | | | | 11,539 | | | | - | | | | - | | | | 11,539 | |
| Total assets | | | 391,510 | | | | 6,983 | | | | 42,686 | | | | 441,179 | | | | 391,510 | | | | 6,983 | | | | 42,686 | | | | 441,179 | |
| Capital expenditures, net | | | 81,316 | | | | 2 | | | | 954 | | | | 82,272 | | | | 81,316 | | | | 2 | | | | 954 | | | | 82,272 | |
| | | | | | | | | | | | | | | | | �� | |
| Year Ended December 31, 2009 | | | | | | | | | | | | | | | | | |
| Revenue | | $ | 541,325 | | | $ | 58,771 | | | $ | - | | | $ | 600,096 | | |
| Intersegment revenue | | | - | | | | (11,409 | ) | | | - | | | | (11,409 | ) | |
| Operating income (loss) | | | 10,552 | | | | 155 | | | | (15,429 | ) | | | (4,722 | ) | |
| Depreciation and amortization | | | 46,482 | | | | 374 | | | | 1,266 | | | | 48,122 | | |
| Goodwill at carrying value | | | 11,539 | | | | - | | | | - | | | | 11,539 | | |
| Total assets | | | 369,979 | | | | 7,856 | | | | 20,477 | | | | 398,312 | | |
| Capital expenditures, net | | | 60,946 | | | | 104 | | | | 1,958 | | | | 63,008 | | |
| (1) | Truckload segment includes $11.5 million goodwill impairment discussed in Note 76. |
17.16. QUARTERLY RESULTS OF OPERATIONS (UNAUDITED)
| | | (in thousands except per share amounts) | |
| Quarters ended | | Mar. 31, 2011 | | | June 30, 2011 | | | Sep. 30, 2011 | | | Dec. 31, 2011 | |
| | | | | | | | | | | | | |
| Freight revenue | | $ | 124,418 | | | $ | 133,630 | | | $ | 126,482 | | | $ | 127,496 | |
| Operating income (loss)(1) | | | 301 | | | | 7,234 | | | | (9,754 | ) | | | 1,159 | |
| Net (loss) income (1) | | | (2,464 | ) | | | 1,655 | | | | (11,213 | ) | | | (2,245 | ) |
| Basic and diluted (loss) income per share | | | (0.17 | ) | | | 0.11 | | | | (0.76 | ) | | | (0.15 | ) |
| | | (in thousands except per share amounts) | |
Quarters ended | | | | | | | | | | | | |
| | | | | | | | | | | | | |
| Total revenue | | $ | 157,031 | | | $ | 171,301 | | | $ | 168,427 | | | $ | 177,495 | |
| Operating income (1) | | | 2,357 | | | | 11,059 | | | | 4,645 | | | | 5,149 | |
| Net income (loss) (1) | | | (640 | ) | | | 4,251 | | | | 1,002 | | | | 1,452 | |
| Basic and diluted income (loss) per share | | | (0.04 | ) | | | 0.29 | | | | 0.07 | | | | 0.10 | |
| | | (in thousands except per share amounts) | |
| | | | | | | | | | | | | |
| Quarters ended | | Mar. 31, 2010 | | | June 30, 2010 | | | Sep. 30, 2010 | | | Dec. 31, 2010 | |
| | | | | | | | | | | | | |
| Freight revenue | | $ | 129,336 | | | $ | 141,392 | | | $ | 138,964 | | | $ | 136,628 | |
| Operating income | | | 1,816 | | | | 10,042 | | | | 8,172 | | | | 5,976 | |
| Net income (loss) | | | (2,176 | ) | | | 2,889 | | | | 1,884 | | | | 690 | |
| Basic and diluted income (loss) per share (1) | | | (0.15 | ) | | | 0.20 | | | | 0.13 | | | | 0.05 | |
| | | (in thousands except per share amounts) | |
| | | | | | | | | | | | | |
Quarters ended | | | | | | | | | | | | |
| | | | | | | | | | | | | |
| Total revenue | | $ | 156,391 | | | $ | 172,865 | | | $ | 161,418 | | | $ | 161,953 | |
| Operating income | | | 301 | | | | 7,234 | | | | (9,754 | ) | | | 1,159 | |
| Net (loss) income | | | (2,464 | ) | | | 1,655 | | | | (11,213 | ) | | | (2,245 | ) |
| Basic and diluted (loss) income per share (1) | | | (0.17 | ) | | | 0.11 | | | | (0.76 | ) | | | (0.15 | ) |
| (1) | Quarter totals do not aggregate to annualizedannual results due to rounding. |
| (2) | Includes $2.4 million gain on the sale of a terminal property. |
| (3) | Includes $11.5 million goodwill impairment discussed in Note 6. |
67
75