UNITED STATES
SECURITIES AND EXCHANGE COMMISSION
WASHINGTON, D.C. 20549
FORM 10-K
(Mark One)
|
| | |
(Mark One) |
x☒ | ANNUAL REPORT PURSUANT TO SECTION 13 OR 15(d) OF THE SECURITIES EXCHANGE ACT OF 1934
|
For the fiscal year ended December 31, 2019
|
For the fiscal year ended December 31, 2016 | |
OR |
o☐ | TRANSITION REPORT PURSUANT TO SECTION 13 OR 15(d) OF THE SECURITIES EXCHANGE ACT OF 1934
|
Commission File Number 0-20853 |
ANSYS, Inc. |
|
Commission File Number: 0-20853
ANSYS, Inc.
(Exact name of registrant as specified in its charter)
|
| | | | | |
| Delaware | | 04-3219960 |
| (State or other jurisdiction of incorporation or organization) | | (I.R.S. Employer Identification No.) |
| 2600 ANSYS Drive, | Canonsburg, | PA | | | 15317 |
(Address of principal executive offices)Principal Executive Offices) | | (Zip Code) |
844-462-6797 |
|
844-462-6797
(Registrant's telephone number, including area code)
|
| | | | |
| Securities registered pursuant to Section 12(b) of the Act: |
| Title of each class | Trading Symbol(s) | Name of exchange on which registered |
| Common Stock, $0.01 par value per share | ANSS | The NASDAQNasdaq Stock Market LLC |
(Title of each class) | | | (Name of exchange on which registered)Nasdaq Global Select Market)
|
Securities registered pursuant to Sectionsection 12(g) of the Act: |
| None |
| (Title of class) |
Indicate by a check mark if the registrant is a well-known seasoned issuer, as defined in Rule 405 of the Securities Act. Yesx☒ No ¨
Indicate by a check mark if the registrant is not required to file reports pursuant to Section 13 or 15(d) of the Act. Yes ¨Nox☒
Indicate by a check mark whether the registrant (1) has filed all reports required to be filed by Section 13 or 15(d) of the Securities Exchange Act of 1934 during the preceding 12 months (or for such shorter period that the registrant was required to file such reports), and (2) has been subject to such filing requirements for the past 90 days. Yesx☒ No ¨
Indicate by check mark whether the registrant has submitted electronically and posted on its corporate website, if any, every Interactive Data File required to be submitted and posted pursuant to Rule 405 of Regulation S-T (§232.405 of this chapter) during the preceding 12 months (or for such shorter period that the registrant was required to submit and post such files). Yesx☒ No ¨
Indicate by a check mark if disclosure of delinquent filers pursuant to Item 405 of Regulation S-K (§229.405 of this chapter) is not contained herein and will not be contained, to the best of the Registrant's knowledge, in definitive proxy or information statements incorporated by reference in PART III of this Form 10-K, or any amendment to this Form 10-K. ¨
Indicate by a check mark whether the registrant is a large accelerated filer, an accelerated filer, a non-accelerated filer, or a smaller reporting company, (as definedor an emerging growth company. See the definitions of "large accelerated filer," "accelerated filer," "smaller reporting company," and "emerging growth company" in Rule 12b-2 of the Exchange Act Rule 12b-2). (Check one):Act.
|
| | | |
Large accelerated filerx | ☒
| Accelerated filer | ☐
|
| Non-accelerated filer | ☐
| Smaller reporting company | ☐ |
| Emerging growth company | ☐ | | Accelerated filer ¨
|
Non-accelerated filer ¨
| | Smaller reporting company ¨
|
If an emerging growth company, indicate by check mark if the registrant has elected not to use the extended transition period for complying with any new or revised financial accounting standards provided pursuant to Section 13(a) of the Exchange Act.¨
Indicate by a check mark whether the registrant is a shell company (as defined in Exchange Act Rule 12b-2)12b-2 of the Act). Yes ¨☐ No x
The aggregate market value of the voting stock held by non-affiliates of the Registrant,registrant, based upon the closing sale price per share of the Common Stockregistrant's common stock on June 30, 201628, 2019, as reported on the NASDAQNasdaq Global Select Market, was $6,086,000,000. Shares of Common Stock held by each officer and director, and each shareholder who owns 5% or more of the outstanding Common Stock have been excluded in that such shareholders may be deemed to be affiliates. This determination of affiliate status is not necessarily a conclusive determination for other purposes.$14,436,000,000.
The number of shares of the Registrant's Common Stock,registrant's common stock, par value $.01$0.01 per share, outstanding as of February 14, 201720, 2020 was 85,373,36385,914,375 shares.
Documents Incorporated By Reference:
Portions of the Proxy Statement for the Registrant's 2017registrant's 2020 Annual Meeting of Stockholders are incorporated by reference into Part III.
ANSYS, Inc.
ANNUAL REPORT ON FORM 10-K FOR FISCAL YEAR 20162019
Table of Contents
|
| | |
| | | |
| PART I |
| | | |
| Item 1. | | |
| Item 1A. | | |
| Item 1B. | | |
| Item 2. | | |
| Item 3. | | |
| Item 4. | | |
| |
| PART II |
| | | |
| Item 5. | | |
| Item 6. | | |
| Item 7. | | |
| Item 7A. | | |
| Item 8. | | |
| Item 9. | | |
| Item 9A. | | |
| Item 9B. | | |
| |
| PART III |
| | | |
| Item 10. | | |
| Item 11. | | |
| Item 12. | | |
| Item 13. | | |
| Item 14. | | |
| |
| PART IV |
| | | |
| Item 15. | | |
| Item 16. | | |
| | |
| |
Important Factors Regarding Future Results
Information provided by ANSYS, Inc. (hereafter the "Company" or "ANSYS"),us in this Annual Report on Form 10-K may contain forward-looking statements concerning such matters as projected financial performance, market and industry segment growth, product development and commercialization, acquisitions or other aspects of future operations. Such statements, made pursuant to the safe harbor established by the securities laws, are based on the assumptions and expectations of the Company's management at the time such statements are made. The Company cautionsWe caution investors that itsour performance (and, therefore, any forward-looking statement) is subject to risks and uncertainties. Various important factors including, but not limited to, those discussed in Item 1A. Risk Factors, may cause the Company'sour future results to differ materially from those projected in any forward-looking statement. All information presented is as of December 31, 20162019, unless otherwise indicated.
Note About Forward-Looking Statements
The following discussion should be read in conjunction with the audited consolidated financial statements and notes thereto included elsewhere in this Annual Report on Form 10-K. Our discussion and analysis of our financial condition and results of operations in Part II, Item 7 of this Annual Report on Form 10-K are based upon our consolidated financial statements, which have been prepared in accordance with accounting principles generally accepted in the United States of America (GAAP). The preparation of these financial statements requires us to make estimates and judgments that affect the reported amounts of assets, liabilities, revenues and expenses, and related disclosure of contingent assets and liabilities. On an ongoing basis, we evaluate our estimates, including those related to fair values of stock awards, bad debts, contract revenue, acquired deferred revenue, the standalone selling prices of our products and services, the valuation of goodwill and other intangible assets, deferred compensation, income taxes, uncertain tax positions, tax valuation reserves, operating lease assets and liabilities, useful lives for depreciation and amortization, and contingencies and litigation. We base our estimates on historical experience, market experience, estimated future cash flows and various other assumptions that management believes are reasonable under the circumstances, the results of which form the basis for making judgments about the carrying values of assets and liabilities that are not readily apparent from other sources. Actual results may differ from these estimates.
This Annual Report on Form 10-K contains forward-looking statements within the meaning of Section 27A of the Securities Act of 1933 and Section 21E of the Securities Exchange Act of 1934, including, but not limited to, the following statements, as well as statements that contain such words as "anticipates," "intends," "believes," "plans" and other similar expressions:
Our intentions regarding our hybrid sales and distribution model.
Our intentions related to investments in research and development, particularly as it relates to expanding the ease of use and capabilities of our broad portfolio of simulation software products.
Our expectations regarding the accelerated development of new and innovative products to the marketplace while lowering design and engineering costs for customers as a result of our acquisitions.
Our statements regarding the impact of global economic conditions.
Our expectations regarding the outcome of our service tax audit cases.
Our belief that, in most geographical locations, our facilities allow for sufficient space to support present and future foreseeable needs, including such expansion and growth as the business may require.
Our expectation that we can renew existing facility leases as they expire or find alternative facilities without difficulty, as needed.
Our assessment of the ultimate liabilities arising from various investigations, claims and legal proceedings.
Our statements regarding the strength of the features, functionality and integrated multiphysics capabilities of our software products.
Our belief that our overall performance is best measured by fiscal-year results rather than by quarterly results.
Our estimates regarding the expected impact on reported revenue related to the acquisition accounting treatment of deferred revenue.
Our expectation that we will continue to make targeted investments in our global sales and marketing organizations and our global business infrastructure to enhance and support our revenue-generating activities.
Our intention to repatriate previously taxed earnings in excess of working capital needs and to reinvest all other earnings of our non-U.S. subsidiaries.
Our plans related to future capital spending.
The sufficiency of existing cash and cash equivalent balances to meet future working capital and capital expenditure requirements.
Our belief that the best uses of our excess cash are to invest in the business, make payments on outstanding debt balances and repurchase stock in order to both offset dilution and return capital, in excess of our requirements, to stockholders with the goal of increasing stockholder value.
Our intentions related to investments in complementary companies, products, services and technologies.
Our expectation that changes in currency exchange rates will affect our financial position, results of operations and cash flows.
Our expectations regarding future claims related to indemnification obligations.
Our estimates regarding future stock-based compensation.
Our expectations regarding the impacts of new accounting guidance.
Our assessment of our ability to realize deferred tax assets.
Our performance expectations related to our partnerships and strategic alliances.
Our expectations regarding acquisitions and integrating such acquired companies to realize the benefits of cost reductions and other synergies relating thereto.
Our statements regarding market opportunity, including the size and growth of addressable markets.
Forward-looking statements should not be unduly relied upon because they involve known and unknown risks, uncertainties and other factors, some of which are beyond our control. Our actual results could differ materially from those set forth in the forward-looking statements. Certain factors that might cause such a difference include risks and uncertainties detailed in Item 1A. Risk Factors.
PART I
ANSYS, Inc. (Ansys, we, us, our), a Delaware corporation formed in 1994, develops and globally markets engineering simulation software and services widely used by engineers, designers, researchers and students across a broad spectrum of industries and academia, including aerospace and defense, automotive, industrial equipment, electronics, biomedical,semiconductors, energy, materials and chemical processing, turbomachinery, consumer products, healthcare, and semiconductors.sports. Headquartered south of Pittsburgh, Pennsylvania, the Company and its subsidiarieswe employed approximately 2,8004,100 people as of December 31, 2016. The Company focuses2019. We focus on the development of open and flexible solutions that enable users to analyze designs directly on the desktop, providing a common platform for fast, efficient and cost-conscious product development, from design concept to final-stage testing and validation. The Company distributes its ANSYS®We distribute our suite of simulation technologies through a global network of independent resellers and distributors (collectively, channel partners) and direct sales offices in strategic, global locations. It is the Company'sour intention to continue to maintain this hybrid sales and distribution model. We operate and report as one segment.
The Company'sOur product portfolio consists of the following:
Simulation Platform: ANSYSPlatform
Ansys Workbench™
ANSYS Workbench is the framework upon which the Company'sour suite of advanced engineering simulation technologies is built. The innovative project schematic view ties together the entire simulation process, guiding the user through complex multiphysics analyses with drag-and-drop simplicity. With bi-directional computer-aided design ("CAD")(CAD) connectivity, powerful highly-automated meshing, a project-level update mechanism, pervasive parameter management and integrated optimization tools, the ANSYSAnsys Workbench platform delivers unprecedented productivity, enabling Simulation-Driven Product Development™enables Pervasive Engineering Simulation™.
Simulation Process
Our Workbench framework allows engineers and Data Managementdesigners to incorporate the compounding effects of multiple physics into a virtual prototype of their design and simulate its operation under real-world conditions. As product architectures become smaller, lighter and more complex, companies must be able to accurately predict how products will behave in real-world environments where multiple types of physics interact in a coupled way. Our multiphysics software enables engineers to simulate the interactions between structures, heat transfer, fluids and electronics all within a single, unified engineering simulation environment.
ANSYS Engineering Knowledge Manager ("ANSYS EKM™") isAnsys Workbench enables companies to create a comprehensive solution for simulation-basedcustomized simulation environment to deploy specialized simulation best practices and automations unique to their product development process or industry. With Ansys ACT™, our partners and data management challenges. ANSYS EKM provides solutions and benefits to all levels of a company, enabling an organization to addressend users can modify the critical issues associated withuser interface, process simulation data including backup and archival, traceability and audit trail, process automation, collaboration and capture of engineering expertise, and intellectual property protection.or embed third-party applications to create specialized tools based on Ansys Workbench.
High-Performance Computing
The Company'sOur high-performance computing ("HPC")(HPC) product suite enables enhanced insight into product performance and improves the productivity of the design process. The HPC product suite delivers cross-physics parallel processing capabilities for the full spectrum of the Company'sour simulation software by supporting structures, fluids, thermal and electronics simulations. This product suite decreases turnaround time for individual simulations, allowing users to consider multiple design ideas and make the right design decisions early in the design cycle.
Geometry Interfaces
The Company offers comprehensive geometry handlingRefer to the section titled "New Product Offerings" for solutions for engineering simulationadded to our platform offerings in an integrated environment with direct interfaces to all major CAD systems, support of additional readers and translators, and an integrated geometry modeler exclusively focused on analysis.
Meshing
Creating a mesh that transforms a physical model into a mathematical model is a critical and foundational step in almost every engineering simulation study. Accurate meshing is especially challenging today with increasing product design complexity and heightened expectations of product performance. The Company's meshing technology provides a means to balance these requirements, obtaining the right mesh for each simulation in the most automated way possible. The technology is built on the strengths of world-class leading algorithms that are integrated in a single environment to produce extremely robust and reliable meshing.
Customization
ANSYS Workbench enables companies to create a customized simulation environment to deploy specialized simulation best practices and automations unique to their product development process or industry. With ANSYS ACT, end users or ANSYS partners can modify the user interface, process simulation data or embed third-party applications to create specialized tools based on ANSYS Workbench.2019.
Structures
The Company'sOur structural analysis product suite offers simulation tools for product design and optimization that increase productivity, minimize physical prototyping and help to deliver better and more innovative products in less time. These tools tackle real-world analysis problems by making product development less costly and more reliable. In addition, these tools have capabilities that cover a broad range of analysis types, elements, contacts, materials, equation solvers and coupled physics capabilities, all targeted toward understanding and solving complex design problems.
Explicit Dynamics
The Company's explicit dynamics product suite simulates events involving short duration, large strain, large deformation, fracture, We also provide comprehensive topology optimization tools that engineers use to design structural components to meet loading requirements with minimal material and component weight. We offer a complete material failure or structural problems with complex interactions. This suite is idealsimulation workflow for additive manufacturing that allows reliable 3D printing by simulating physical eventsthe laser sintering process and delivering compensated CAD geometries that occur in a short period of time and may result in material damage or failure. Such events are often difficult or expensive to study experimentally.
Composites
Composites blend two or more materials that possess very different properties. The Company's composite analysis and optimization technology efficiently defines materials, plies and stacking sequences, and also offers a wide choice of state-of-the-art failure criteria. The Company's composite software provides all necessary functionalities for finite element analysis of layered composites structures.ensure reliable printed parts.
Fluids
The Company'sOur fluids product suite enables modeling of fluid flow and other related physical phenomena. Fluid flow analysis capabilities provide all the tools needed to design and optimize new fluids equipment and to troubleshoot already existing installations. The suite contains general-purpose computational fluid dynamics software and specialized products to address specific industry applications.
ElectronicsElectromagnetics
The Company's electronicsOur electromagnetics product suite provides field simulation software for designing high-performance electronic and electromechanical products. The software streamlines the design process and predicts performance of mobile communication and internet-access devices, broadband networking components and systems, integrated circuits ("ICs")(ICs) and printed circuit boards ("PCBs")(PCBs), as well as electromechanical systems such as automotive components and power electronics equipment, all prior to building a prototype.
Semiconductors
Advancements in semiconductor design and manufacturing enable smaller electronic architectures. Shrinking geometries, especially in the emerging 3D IC, FinFET and stacked-die architectures, reveal design challenges related to power and reliability. The Company'sOur power analysis and optimization software suite manages the power budget, power delivery integrity and power-induced noise in an electronic design, from initial prototyping to system sign-off. These solutions deliver accuracy with correlation to silicon measurement; the capacity to handle an entire electronic system, including IC, package and PCB, efficiently for ease-of-debugease-of-debugging and fast turnaround time; and comprehensiveness to facilitate cross-domain communications and electronic ecosystem enablement.
Multiphysics
The Company's Workbench framework allows engineers and designers to incorporate the compounding effects of multiple physics into a virtual prototype of their design and simulate its operation under real-world conditions. As product architectures become smaller, lighter and more complex, companies must be able to accurately predict how products will behave in real-world environments, where multiple types of physics interact in a coupled way. ANSYS multiphysics software enables engineers and scientists to simulate the interactions between structures, heat transfer, fluids and electronics all within a single, unified engineering simulation environment.
AIM®
AIM is a single-window application which integrates structural, fluids and electromagnetics simulation and includes all aspects of the simulation workflow. Its easy-to-use interface and guided workflows are designed for casual simulation users, and its integrated 3-D modeling and optimization tools are well-suited for exploring designs early in the product lifecycle. AIM’s user interface is easily customized to comply with a company’s standards for simulation or to create simulation templates for unique industry applications. AIM is based on the same, industry-proven solver technology from the fluids, structures and electronics suites and provides fast and accurate results.
Embedded Software
The Company'sOur SCADE® product suite is a comprehensive solution for embedded software simulation, code production and automated certification. It has been developed specifically for use in critical systems with high dependability requirements, including aerospace, rail transportation, nuclear, industrial and more recently, automotive applications. SCADE software supports the entire development workflow, from requirements analysis and design, through verification, implementation and deployment. SCADE solutions easily integrate with each other and the rest of the ANSYSour product suite, allowing for development optimization and increased communication among team members.
Systems
The Company deliversWe deliver a unique and comprehensive system simulation capability that is ideal for the design of today's increasingly automated products. This collaborative environment leverages the Company'sour multiphysics, multibody dynamics, circuit and embedded software simulation capabilities, enabling users to simulate the complex interactions between components, circuits and control software within a single environment. These technologies provide a complete view into predicted product performance, which creates greater design confidence for engineers.
3-D Direct Modeling3D Design
Our Discovery™ product family allows every engineer to benefit from the insight of simulation in their product design. The Company's 3-D direct modeling technology provides a CAD-neutral environment to modify and prepare geometry for simulation. This approach allows engineers to dramatically reduce the pre-processing step inDiscovery products range from early design exploration tools powered by interactive real-time simulation and ultimately deliversintuitive geometry editing, to detailed product validation solutions utilizing proven flagship solver technology with easy-to-use guided workflows. These tools allow for design engineers of all levels of expertise to utilize simulation across the entire product design insights much faster inprocess and to work seamlessly with simulation experts using our flagship products for even more advanced analysis.
Optical
Using optical sensor and closed-loop, real-time simulation, our capabilities now span the earliest stagessimulation of development.all sensors, including lidar, cameras and radar; the multiphysics simulation of physical and electronic components; the analysis of systems functional safety; as well as the automated development of safety-certified embedded software. This functionality can be integrated into a closed-loop simulation environment that interacts with weather and traffic simulators, enabling thousands of driving scenarios to be executed virtually.
Materials
Ansys Granta products give our customers access to material intelligence, including data that is critical to simulations. Refer to the section titled "New Product Offerings" for additional discussion around our materials offerings.
Academic
The Company'sOur academic product suite provides a highly scalable portfolio of academic products based on several usage tiers, including associate, research and teaching. Each tier includes various noncommercialnon-commercial products that bundle a broad range of physics and advanced coupled field solver capabilities. The academic product suite provides entry-level tools intended for class demonstrations and hands-on instruction. It includes flexible terms of use and more complex analysis suitable for doctoral and post-doctoral research projects. The CompanyWe also providesprovide a special product at no cost to students that is suitable for use away from the classroom and in non-commercial applications.
PRODUCT DEVELOPMENT
The Company makesWe make significant investments in research and development and emphasizesemphasize frequent, integrated product releases. The Company'sOur product development strategy centers on ongoing development and innovation of new technologies to increase productivity and to provide engineering simulation solutions that customers can integrate into enterprise-wide product lifecycle management ("PLM")(PLM) systems. The Company'sOur product development efforts focus on extensions of the full product line with new functional modules, further integration with CAD, electronic CAD ("ECAD"),(ECAD) and PLM products, and the development of new products. The Company'sOur products run on the most widely usedwidely-used engineering computing platforms and operating systems, including Windows, Linux and most UNIX workstations.
During the year ended December 31, 2016 and in the period from January 1, 2017 until the filing date, the Company completed the following major product development activities and releases:
In January 2017, the Company announced the release of ANSYS 18.0 with major advancements in the entire product portfolio to create complete and accurate digital prototypes across the major physics areas. ANSYS 18.0 expanded the boundaries of simulation with new developments to enable simulation earlier in the product lifecycle, as well as downstream in the operation phase, using digital twins. A digital twin is a real-time, virtual copy of an actual operating machine that provides insight into individual product performance and maintenance. Additionally, ANSYS 18.0 introduced a new, comprehensive fluids product, which includes full versions of all ANSYS fluids solvers for customers solving the toughest and broadest range of fluid dynamics problems. New technology in the structures product line was delivered to design and optimize products for additive manufacturing methods, and a new automotive embedded software package was introduced for developing advanced driver assistance systems applications.
In August 2016, ANSYS 17.2 was released with new functionality for antenna design to meet the growing demand of wireless devices and the Internet of Things, as well as enhanced multiphysics coupling for electronics and electric motors. ANSYS 17.2 also included improved links to other tools in the product development lifecycle. The embedded software suite added new interoperability with third-party requirement management tools, and the fluids suite was extended to allow detailed combustion models to be included in third-party 1-D simulation products.
In May 2016, the Company announced the release of ANSYS 17.1 which featured enhancements to the electronics, semiconductor, structures and fluids product lines. AIM, the Company's immersive, multiphysics user environment, was enhanced to support magnetostatics and coupled magnetic-thermal-structural analysis to rapidly design electromechanical products. Polymer extrusion simulation was also added in AIM. With ANSYS 17.1, structures, electronics and embedded software customers gained access to entry-level system simulation capabilities to analyze how detailed component physics and embedded controls affect overall system design.
| |
• | In the second quarter of 2016, the Company announced ANSYS SeaScape™, a unique architecture which provides services for elastic computing, machine learning and big data analytics for engineering simulation applications. With the SeaScape architecture, computation can be easily scaled across commodity hardware to deliver broad and rapid simulation coverage. Additionally, SeaScape provides a high-level programming interface to perform data analytics on large simulation datasets to identify actionable design changes. ANSYS SeaHawk™ is the first new product to take advantage of the new architecture for electronic design automation. ANSYS SeaScape allows designers of advanced system-on-chip designs to assess more electromigration and voltage drop scenarios per day than with traditional architectures and develop a high level of confidence of their design prior to sign-off.
|
In January 2016, the Company released ANSYS 17.0. Demonstrable order of magnitude speed-ups were made across fluids, structures and electromagnetic simulation with HPC solutions. Engineering teams can leverage this power from their desktop or Cloud environments. Significant innovation was delivered across all physics domains in ANSYS 17.0 as well as in the area of complete virtual prototyping, allowing for full systems simulations. The ANSYS Workbench platform expanded its integrated interface for customization to cover virtually the entire portfolio as well as third-party solutions, sustaining its leadership as the industry's broadest engineering simulation platform.
The Company'sOur total research and development expenses were $183.1$298.2 million, $168.8$233.8 million and $165.4$202.7 million in 2016, 20152019, 2018 and 2014,2017, respectively, or 18.5%19.7%, 17.9%18.1% and 17.7%18.5% of total revenue, respectively. As of December 31, 2016, the Company's2019 and 2018, our product development staff consisted of approximately 1,0001,500 and 1,200 employees, respectively, most of whom hold advanced degrees and have industry experience in engineering, mathematics, computer science or related disciplines. The Company hasWe have traditionally
invested significant resources in research and development activities and intendsintend to continue to make investments in expanding the ease of use and capabilities of itsour broad portfolio of simulation software products. More specifically, this
We recently completed the following major product development activities and releases:
In January 2020, we released Ansys 2020 R1, which streamlines product development lifecycles and helps boost product performance with enhancements to the interfaces, functionality and power of our simulation solvers. Among these advances is Ansys Minerva, a knowledge management application platform that delivers an integrated suite of Ansys tools, fusing simulation and optimization to product lifecycle processes across any enterprise. Minerva spurs collaboration within global engineering teams and increases data sharing to innovate product designs and reduce development costs. From improving product development with Ansys Minerva to running complex simulations with substantially streamlined workflows with Ansys Fluent to optimizing electromagnetic design processes with Ansys HFSS, Ansys 2020 R1 helps enable companies to pioneer innovations and create cost-effective designs.
To leverage the combined benefits of cloud computing and best-in-class engineering simulation, we are partnering with Microsoft® Azure™ to create a secure cloud solution. In Ansys 2020 R1, Ansys Cloud™ introduced new licensing options to enable greater business flexibility. Companies can cost optimize cloud software usage by mixing elastic (usage-based) and traditional (leased or paid-up) licensing while accessing on-demand compute resources. In addition, within Ansys Mechanical, Ansys Fluent and Ansys Electronics Desktop, you can directly access HPC in the Cloud.
In September 2019, we released Ansys 2019 R3, which strengthens our autonomous vehicles (AV) solutions with the addition of Ansys Autonomy. Ansys Autonomy enables engineers to develop safer AV through advanced closed-loop scenario simulation, automated driving and control software development, functional safety analysis, and sensor, camera, lidar, and radar simulation. Among a number of other enhancements to our product portfolio, Ansys 2019 R3 also includes the evolutionSPEOS Road Library for Sensors Simulation, a comprehensive, retro-reflecting materials database, as well as updates to Ansys HFSS SBR+ that provide greater accuracy in predicting radar cross sections of large targets with curvatures.
As fully autonomous vehicles edge closer to real-world deployment, operating safely becomes more critical than ever. AVs require rigorous testing in complex environments and under variable conditions. Physical testing would require billions of miles of driving or flying — a time-consuming, cost-prohibitive approach. Using simulation to virtually test AVs is the only viable option for validating systems safety and accelerating AV development. From sensors to virtual environments to artificial intelligence, Ansys 2019 R3 includes robust offerings that speed the safe development and deployment of AVs on the road and in the air.
| |
| • | In June 2019, we released Ansys 2019 R2, which accelerates, streamlines and simplifies the product life cycle through new functionalities. With the new functionalities, including new materials capabilities for structural analysis following the acquisition of Granta Design Limited (Granta Design), our simulation solutions accelerate collaboration, validation and verification, creating a reliable digital thread throughout operations. The release also includes a revolutionary Ansys Mechanical™ user experience, simplified simulation of complex electronics and a new Ansys FluentTM workflow that significantly speeds meshing of dirty geometries. |
New Product Offerings
Our 2019 acquisitions, each a leader in their respective fields, are intended to bolster our strategy of Pervasive Engineering Simulation. The acquired technologies offer solutions that significantly enhance our portfolio, providing solutions valuable to our customers.
The acquisition of material intelligence leader Granta Design gives our customers access to material intelligence, including data that is critical to successful simulations. With Granta Design technology, our customers benefit from access to the world's premier system for managing corporate material intelligence and the market-leading solution for materials sources, selection and management. Ansys Granta MI is a leading system for materials information management in engineering enterprises. Ansys Granta Selector is the standard tool for materials selection and graphical analysis of materials properties. A comprehensive materials data library plus unique software tools enable engineers to use materials to innovate and evolve products, quickly identify solutions to material issues, confirm and validate choice of materials, and reduce material and development costs. CES EduPack is a unique set of teaching resources that supports materials education across engineering, design, science and sustainable development. Granta Materials Data for Simulation provides easy access to materials property data from within Ansys Mechanical and the Ansys Electronics Desktop environment.
The acquisition of Helic, Inc. (Helic), an industry-leading provider of electromagnetic (EM) crosstalk solutions for systems on chips, combined with our flagship electromagnetic and semiconductor solvers, provides a comprehensive solution for on-chip, 3DIC and chip-package-system electromagnetics and noise analysis. Helic’s software products (VeloceRF, RaptorX, Exalto and Pharos) help engineers analyze and mitigate the risk of on-chip EM crosstalk, which can lead to silicon failure and time to market delays. VeloceRF is an inductive device synthesizer and modeler for geometries as small as 5 nm and frequencies up to 110Ghz. RaptorX is an electromagnetic modeling, extraction and analysis tool for chip designs pre-layout-vs-schematic (LVS). Exalto is a post-LVS resistance, capacitance, self and mutual inductance (RLCk) extraction tool for electromagnetic coupling. Pharos is a tool that identifies wires that are susceptible to EM and substrate crosstalk.
The acquisition of DfR Solutions' electronics reliability technology, combined with our existing multiphysics portfolio, gives customers a complete designer-level solution to analyze for electronics failure earlier in the design cycle. DfR Solutions' Sherlock is the industry's only automated design reliability analysis software. Sherlock revolutionizes electronic design by empowering designers to simulate real-world conditions and accurately model PCBs and assemblies to predict solder fatigue due to thermal, mechanical, and shock and vibration conditions. During pre-processing, Sherlock automatically translates ECAD and MCAE data into 3D finite element models in minutes. In post-processing, Sherlock automates thermal derating and democratizes the thermal and mechanical analysis of electronics - meaning analysis is done in minutes rather than weeks. Sherlock seamlessly integrates with already existing simulation workflows in the hardware design process making Ansys SIwave, Ansys Icepak and Ansys Mechanical users more efficient. It directly connects simulation to material and manufacturing costs.
Our acquisition of Livermore Software Technology (LST) and its ANSYStechnologies empower customers to solve a new class of engineering challenges, including developing safer automobiles, aircraft and trains while reducing or even eliminating the need for costly physical testing. LST's LS-DYNA is an advanced general-purpose multiphysics simulation software package that can simulate many complex, real-world problems. LS-DYNA is the most advanced multiphysics simulation technology for high-speed, short-duration events (for example, a cell phone drop or automotive crash). Additionally, the acquisition results in an even tighter integration between LS-DYNA and Ansys Workbench platform, expansion(already a leading pre- and post-processor for LS-DYNA) computations. Most automotive companies use LS-DYNA to design and optimize automobile components or entire vehicles to produce safe cars for consumers. Companies all over the world have developed a trust in LST for their vehicle development process due to deep technical relationships. While we have partnered with LST for years, their industry-leading vehicle crash capabilities were not traditionally part of high-performance computing capabilities, ANSYSAIM immersiveour offerings. Now, we have much greater access and available know-how in those industries to sell the rest of our platform.
Our acquisition of Dynardo, a leading provider of multidisciplinary analysis and optimization technology, gives customers access to a full suite of process integration and robust design tools — empowering users to identify optimal product designs faster and more economically. Dynardo’s flagship offering, optiSLang, is a comprehensive multi-disciplinary design optimization solution with a full suite of multi-objective optimization, sensitivity, reliability, and robust design capabilities. Customers of all sizes and across industries leverage optiSlang to integrate chained simulation flows and automate execution for design space exploration and optimization, greatly reducing development time and accelerating the evaluation of optimal product design alternatives for cost and performance. Ansys optiSLang has an intuitive graphical user interface offerings on ANSYS Enterprise Cloud™,that enables engineers to connect computer-aided design tools together in a way that captures both the simulation process automation and workflows, such as sensitivity analysis or robust design optimization. Ansys optiSLang supports interfacing with most software tools used in virtual product development.
Ansys Minerva is a centralized knowledge management application engineered with an open and ongoingvendor-neutral architecture that improves multiphysics collaboration by making data, project plans and analytics easily accessible in one place so team members across the world and in different functional silos can work with the same, most up-to-date information. Minerva improves productivity and maximizes the value of existing engineering technology investments by providing simulation process and data management, life cycle traceability, process integration, of acquired technology.design optimization and simulation-driven data science capabilities. Available for both on-premise and cloud deployment, Minerva connects to most leading product life cycle management systems.
PRODUCT QUALITY
The Company'sOur employees generally perform product development tasks according to predefined quality plans, procedures and work instructions. Certain technical support tasks are also subject to a quality process. These plans define, for each project, the methods to be used, the responsibilities of project participants and the quality objectives to be met. The majority of software products are developed under a quality system that is certified to the ISO 9001:20082015 standard. The Company establishesWe establish quality plans for itsour products and services, and subjectssubject product designs to multiple levels of testing and verification in accordance with processes established under the Company'sour quality system.
SALES AND MARKETING
The Company distributesWe distribute and supports itssupport our products through our own direct sales offices, as well as a global network of independent channel partners, as well as through its own direct sales offices.partners. This channel partner network provides the Companyus with a cost-effective, highly-specialized channel of distribution and technical support. It also enables the Companyus to draw on business and technical expertise from a global network, provides relative stability to the Company'sour operations to offsethelp mitigate geography-specific economic trends and provides the Companyus with an opportunity to take advantage of new geographic markets. The Company derived 24.4%, 24.2% and 24.9% of its total revenue through the indirectmarkets or enhance our sales channel for the years ended December 31, 2016, 2015 and 2014, respectively.coverage in existing markets.
The channel partners sell ANSYSour products to new customers, expand installations within the existing customer base, offer training and consulting services, and provide the first line of ANSYSour technical support. The Company'sOur channel partner certification process helps to ensure that each channel partner has the ongoing capability to adequately represent the Company'sour expanding product lines and to provide an acceptable level of training, consultation and customer support. We derived 22.9%, 22.4% and 24.8% of our total revenue through the indirect sales channel for the years ended December 31, 2019, 2018 and 2017, respectively.
The CompanyWe also hashave a direct sales management organization in place to develop an enterprise-wide, focused sales approach and to implement a worldwide majorgo-to-market account strategy. The sales management organization also functions as a focal point for requests to ANSYS from the channel partners and provides additional support in strategic locations through the presence of direct sales offices.
During 2016, the Company2019, we continued to invest in itsour existing domestic and international strategic sales offices. In total, the Company'sour direct sales organization comprises 1,300comprised 2,100 and 1,700 employees as of December 31, 2019 and 2018, respectively, who arewere responsible for the sales, technical support, consulting services, marketing initiatives and administrative activities designed to support the Company'sour overall revenue growth and expansion strategies.
The Company'sOur products are utilized by organizations ranging in size from small consulting firms to the world's largest industrial companies. No single customer accounted for more than 5% of the Company'sour revenue in 2016, 20152019, 2018 or 2014.2017.
Information with respect to foreign and domestic revenue may be found in Note 1617 to the consolidated financial statements in Part IV, Item 15 of this Annual Report on Form 10-K and in the section entitled “Management's Discussion and Analysis of Financial Condition and Results of Operations” in Part II, Item 7 of this Annual Report on Form 10-K.
STRATEGIC ALLIANCES AND MARKETING RELATIONSHIPS
The Company hasWe have established and continuescontinued to pursue strategic alliances with advanced technology suppliers, cloud computing providers, hardware vendors, specialized application developers, and CAD, ECAD and PLM providers. The Company believesWe believe that these relationships facilitate accelerated incorporation of advanced technology into the Company'sour products, provide access to new customers, expand the Company'sour sales channels, develop specialized product applications and provide direct integration with leading CAD, electronic design automation ("EDA")(EDA), product data management and PLM systems.
The Company hasWe have technical and marketing relationships with leading CAD vendors, such as Autodesk, PTC and Siemens Product Lifecycle Management Software,Digital Industries, to provide direct links between products. These links facilitate the transfer of electronic data models between the CAD systems and ANSYSour products.
We partnered with PTC to accelerate product innovation by providing customers a world-class simulation-driven design solution. Working together, we are delivering Ansys Discovery Live real-time simulation within PTC’s Creo® 3D CAD software. The Company also hascombined solution, Creo Simulation Live, is sold by PTC as part of the Creo product suite. This solution offers customers a relationship with Spatial Corp.unified modeling and simulation environment, removing the boundaries between CAD and simulation and enabling design engineers to providegain insight into each of the 3-D modeling kernel technology upon whichmany design decisions they make throughout the Company's in-house geometry modeling software solutions are built.product development process. This insight enables design engineers to create higher quality products, while reducing product and development costs.
Similarly, the Company maintainswe maintain marketing and software development relationships with leading EDA software companies, including Cadence Design Systems, Synopsys, Mentor Graphics, Zuken and National Instruments. These relationships support the transfer of data between electronics design and layout software and the ANSYSour electronics simulation portfolio. In 2017, we entered into an integration and distribution agreement with Synopsys to cooperatively integrate Ansys RedHawk technology into an in-design add-on to a Synopsys design tool for the primary purpose of providing customers with direct, in-design access to the RedHawk technology's capabilities.
We also have relationships with Siemens and Spatial Corporation to provide the 3D modeling kernel and format translation technologies upon which our in-house geometry modeling software solutions are built.
The Company has established various initiativesmain method we employ to democratize HPC to a wider audience is through partnerships with partners to increase customers' engineering productivitya number of companies, such as cloud computing providers, HPC hardware manufacturers and supercomputing centers such as HLRS in Stuttgart,
Germany. In 2019, we launched a new cloud service fully managed by simplifying and increasing the adoption of HPC. For example, the Company has partnered with companies like Fujitsu, HPE and Lenovo,us and developed turn-keyin collaboration with Microsoft Azure that provides on-demand access to HPC appliances which are out-of-the-box, plug-and-simulate, externally manageddirectly from within our flagship applications. We also collaborated with Flexera to improve our elastic licensing solution by now supporting on-premise use and internet-based usage monitoring. We added Hewlett Packard Enterprises and Dell Technologies as new members to the HPC clusters, optimized for ANSYS applications,appliance program that is designed to simplify and pre-configured with ANSYS software and job management software. In addition, the Company joined the OpenHPC community to enable customers to reduce risk and to save time with specifying, deploying and managingaccelerate HPC systems. In 2015, ANSYS and Cray, working in conjunction with the NCSA and NERSC supercomputing centers, established a new simulation world record by scaling ANSYS Fluent® to 129,000 compute cores.cluster deployment.
In the area of cloud computing, the Company has tightened its partnership with Amazon Web Services by providing enterprise customers a reference architecture for end-to-end simulation that can be globally deployed in a virtual private cloud on demand. The Company'sOur open cloud strategy allows itus to work with various public cloud providers and cloud hostingcloud-hosting partners. Due to
the Company's participation in the AWS Partner Network, the Company was able to work with other partners who had extensive expertise running workloads in the Cloud, such as Cycle Computing and NICE Software, to develop the new ANSYS Enterprise Cloud solution. This solutionapproach makes it easy for customers to use the same work flowsworkflows on-premise and on the Cloud. In addition, the Company strengthened its other cloud-hosting service partnerships by further improving best practices for executing engineering simulation in the Cloud. Cloud-hosting partners such as Nimbix, Rescale and Gompute provide cloud access to us and/or third-party applications for customers having very complex workflows or other restrictive security certification requirements. Furthermore, we continued to enjoy mutually-committed alliances with large cloud platform providers such as Microsoft, AWS, Google and Alibaba. In 2018, we entered into an agreement with SAP SE (SAP) to embed our pervasive simulation solutions for digital twins into SAP's market-leading digital supply chain, manufacturing and asset management portfolio. The partnership's first solution launched in 2019 and runs on the SAP Cloud Platform and empowers industrial asset operators to optimize operations and maintenance through real-time engineering insights, which reduces product cycle times and increases profitability.
The Company's Enhanced SolutionOur Partner Program actively encourages specialized developers of specialized software solutions to use the Company'sour technology as a development platform for their applications and provides customers with enhanced functionality related to their use of the Company'sour software. With over 100more than 200 active enhanced solution partnerships, spanning a wide range of technologies, including materials, optimization, electronics, optical, mechanical, fluid and systems simulation, fluid simulation and CAD, thisour partner ecosystem extends the depth and breadth of the Company'sour technology offerings.
The Company has a software license agreement with Livermore Software Technology Corporation ("LSTC") whereby LSTC has provided LS-DYNA® software for explicit dynamics solutions used in applications such as crash test simulations in automotive and other industries. Under this arrangement, LSTC assists in the integration of the LS-DYNA software with the Company's pre- and post-processing capabilities and provides updates and problem resolution in return for royalties from sales of the ANSYS LS-DYNA® combined product.
The Company hasWe have a software license agreement with HBM that provides the advanced fatigue capabilities of nCode DesignLife™, a leading durability software from HBM. ANSYS nCode DesignLife™ technology leverages the open architecture of the ANSYSour platform and enables mechanical engineers to more easily address complex product life and durability issues before a prototype is built.
The Company has A similar agreement was executed with VirtualMotion to offer Ansys Motion™ as a software license agreement with NICE that targets the emerging paradigm of data-center-based deployment of simulation. EnginFrame from NICE is bundled with ANSYS EKMtightly-integrated, next-generation capability for simulating complex multi-body mechanisms and facilitates running interactive ANSYS applications on remote data centers.assemblies.
COMPETITION
The Company believesWe believe that the principal factors affecting sales of itsour software include ease of use, breadth and depth of functionality, flexibility, quality, ease of integration with other software systems, file compatibility across computer platforms, range of supported computer platforms, performance, price and total cost of ownership, customer service and support, company reputation and financial viability, and effectiveness of sales and marketing efforts.
The Company continuesWe continue to experience competition across all markets for itsour products and services. Our competitors include large, global, publicly traded companies; small, geographically-focused firms; startup firms; and solutions produced in-house by the end users. Some of the Company'sour current and possible future competitors have greater financial, technical, marketing and other resources than the Company,us, and some have well-established relationships with current and potential customers of the Company. The Company'sours. Our current and possible future competitors also include firms that have elected, or may in the future elect, to compete by means of open source licensing. These competitive pressures may result in decreased sales volumes, price reductions and/or increased operating costs, and could result in lower revenues, margins and net income.
PROPRIETARY RIGHTS AND LICENSES
The Company regards itsWe regard our software as proprietary and reliesrely on a combination of trade secret, copyright, patent and trademark laws, license agreements, nondisclosure and other contractual provisions, and technical measures to protect itsour proprietary rights in itsour products. The Company distributes itsWe distribute our software products under software license agreements that predominantly grant customers nonexclusive licenses, which are typically nontransferable, for the use of the Company'sour products. License agreements for the Company'sour products are generally directly between the Companyus and end users. Use of the licensed software product is restricted to specified sites unless the customer obtains a multi-site license for its use of the software product or the software product is by its nature a multi-site use product. Software security measures are also employed to prevent unauthorized use of the Company'sour software products and the licensed software is subject to terms and conditions prohibiting unauthorized use or reproduction. CustomersFor most products, customers may purchase a perpetual license of the technology with the right to annually purchase ongoing maintenance, technical support and upgrades, or may lease the product on a fixed-term basis for a fee that includes the license, maintenance, technical support and upgrades. For some products, customers purchase an annual subscription for a certain number of named users that includes the license, maintenance, technical support and upgrades or purchase elastic units hosted by our Cloud and use any supported product at any time until their licensed volume is met.
The Company licenses its
We license our software products utilizing a combination of web-based and hard-copy license terms and forms. For certain software products, the Companywe primarily reliesrely on "click-wrapped" licenses.licenses (i.e. online agreements where the website provider posts terms and conditions, and the user clicks on the "accept" button). The enforceability of these types of agreements under the laws of some jurisdictions is uncertain.
The CompanyWe also seeksseek to protect the source code of itsour software as a trade secret and as registered unpublished copyrighted work. The Company hasWe have obtained federal trademark registration protection for ANSYSAnsys and other marks in the U.S. and foreign countries. Additionally, the Company waswe were awarded numerous patents by the U.S. Patent and Trademark Office and hashave a number of
patent applications pending. To the extent the Company doeswe do not choose to seek patent protection for itsour intellectual property, the Companywe primarily reliesrely on the protection of itsour source code as a trade secret. We seek additional protection of our proprietary rights in our source code via copyright registrations.
Employees of the CompanyOur employees have signed agreements under which they have agreed not to disclose trade secrets or confidential information. These agreements, where legally permitted, restrict engagement in or connection with any business that is competitive with the Companyus anywhere in the world while employed by the Companyus (and, in some cases, for specified periods thereafter) and state that any products or technology created by employees during their term of employment are the property of the Company.our property. In addition, the Company requireswe require all channel partners to enter into agreements not to disclose the Company'sour trade secrets and other proprietary information.
Despite these precautions, there can be no assurance that misappropriation of the Company'sour technology and proprietary information (including source code) will be prevented. Further, there can be no assurance that copyright, trademark, patent and trade secret protection will be available for the Company'sour products in certain jurisdictions, or that restrictions on the ability of employees and channel partners to engage in activities competitive with the Companyus will be enforceable. Costly and time-consuming litigation could be necessary in the future to enforce the Company'sour rights to itsour trade secrets and proprietary information or to enforce itsour patent rights and copyrights, and it is possible that, in the future, the Company'sour competitors may be able to obtain the Company'sour trade secrets or to independently develop similar, unpatented technology.
The software development industry is characterized by rapid technological change. Therefore, the Company believeswe believe that factors such as the technological and creative skills of itsour personnel, new product developments, frequent product enhancements, name recognition and reliable product maintenance are also important to establishing and maintaining technology leadership in addition to the various legal protections of itsour technology that may be available.
The Company doesWe do not believe that any of itsour products infringe upon the proprietary rights of third parties. There can be no assurance, however, that third parties will not claim such infringement by the Companyus or itsour licensors or licensees with respect to current or future products. The Company expectsIn addition, there are non-practicing entities (NPEs) and patent assertion entities (PAEs) whose business models are built on not producing any products but rather extracting payments from revenue generating companies through patent infringement assertions and/or litigation. We expect that software suppliers will increasingly be subject to the risk of such claims as the number of products and suppliers continues to expand and the functionality of products continues to increase. Any such claims, with or without merit, could be time consuming, result in costly litigation, cause product release delays or require the Companyus to enter into royalty or licensing agreements. Such royalty or licensing agreements, if required, may not be available on terms acceptable to the Company.us.
SEASONAL VARIATIONS
The Company'sOur business has experienced seasonality, including quarterly reductions in software sales resulting from slowdowns of customer activities during the summer months, particularly in Europe, as well as from the seasonal purchasing and budgeting patterns of the Company'sour global customers. The Company'sLease and maintenance contract renewals are typically highest in the first and fourth quarters. Our revenue is typically highest in the fourth quarter.
DEFERRED REVENUE AND BACKLOG
Deferred revenue consists of billings made or payments received in advance of revenue recognition from software license and maintenancecustomer agreements. The deferred revenue on the Company'sour consolidated balance sheets does not represent the total value of annual or multi-year, noncancellable software license and maintenance agreements. The Company'sOur backlog represents installment billings for periods beyond the current quarterly billing cycle and customer orders received but not processed. The Company's. Our deferred revenue and backlog as of December 31, 20162019 and 20152018 consisted of the following:
| | | | Balance at December 31, 2016 | Balance at December 31, 2019 |
| (in thousands) | Total | | Current | | Long-Term | Total | | Current | | Long-Term |
| Deferred revenue | $ | 415,846 |
| | $ | 403,279 |
| | $ | 12,567 |
| $ | 365,274 |
| | $ | 351,353 |
| | $ | 13,921 |
|
| Backlog | 221,994 |
| | 64,361 |
| | 157,633 |
| 505,469 |
| | 218,398 |
| | 287,071 |
|
| Total | $ | 637,840 |
| | $ | 467,640 |
| | $ | 170,200 |
| $ | 870,743 |
| | $ | 569,751 |
| | $ | 300,992 |
|
| | | | Balance at December 31, 2015 | Balance at December 31, 2018 |
| (in thousands) | Total | | Current | | Long-Term | Total | | Current | | Long-Term |
| Deferred revenue | $ | 379,740 |
| | $ | 364,644 |
| | $ | 15,096 |
| $ | 343,174 |
| | $ | 328,584 |
| | $ | 14,590 |
|
| Backlog | 124,290 |
| | 47,015 |
| | 77,275 |
| 315,998 |
| | 147,299 |
| | 168,699 |
|
| Total | $ | 504,030 |
| | $ | 411,659 |
| | $ | 92,371 |
| $ | 659,172 |
| | $ | 475,883 |
| | $ | 183,289 |
|
Revenue associated with deferred revenue and backlog that will be recognized in the subsequent twelve months is classified as current in the tabletables above.
EMPLOYEES
As of December 31, 20162019, the Companywe employed approximately 2,8004,100 people. At that date, there were also contract personnel and co-op students providing ongoing development services and technical support. Certain employees of the Company are subject to collective bargaining agreements and have local work councils.
ACQUISITIONS
The Company makesWe make targeted acquisitions in order to support itsour long-term strategic direction, accelerate innovation, provide increased capabilities to itsour existing products, supply new products and services, expand itsour customer base and enhance itsour distribution channels.
During2019 Acquisitions
On November 1, 2019, we completed the twelve monthsacquisition of 100% of the shares of LST for a purchase price of $777.8 million.
On February 1, 2019, we completed the acquisition of 100% of the shares of Granta Design for a purchase price of $208.7 million.
Additionally, during the year ended December 31, 20162019, we acquired Dynardo, Helic and 2015,DfR Solutions to combine the Company completed various acquisitions to accelerate the development of new and innovative products to the marketplace while lowering design and engineering costs for customers. Theacquired technologies with our existing comprehensive multiphysics portfolio. These acquisitions were not individually significant. The combined purchase pricesprice of the acquisitions were approximately $10.3 million and $49.7 million for the years ended December 31, 2016 and 2015, respectively.
During the year ended December 31, 2014, the combined purchase price forthese acquisitions was $104.0$136.2 million. These
The 2019 acquisitions are further described in the table below:
|
| | | | |
| Date of Closing | | Company | | Details |
April 30, 2014November 1, 2019 | | SpaceClaim CorporationLST | | SpaceClaim Corporation ("SpaceClaim"),LST, the premier provider of explicit dynamics and other advanced finite element analysis technology, empowers our customers to solve a new class of engineering challenges, including developing safer automobiles, aircraft and trains while reducing or even eliminating the need for costly physical testing. |
| November 1, 2019 | | Dynardo | | Dynardo, a leading provider of 3-D modelingmultidisciplinary analysis and optimization technology, was acquired for $85.0 million. SpaceClaim's software providesgives our customers access to a full suite of process integration and robust design tools — empowering users to identify optimal product designs faster and more economically. |
| May 1, 2019 | | DfR Solutions | | DfR Solutions' electronics reliability technology, combined with our existing comprehensive multiphysics portfolio, gives our customers a powerful and intuitive 3-D direct modelingcomplete designer-level solution to author new concepts and then leverageanalyze for electronics failure earlier in the power of simulation to rapidly iterate on these designs to drive innovation.design cycle. |
January 3, 2014February 4, 2019 | | ReactionHelic | | Helic, the industry-leading provider of electromagnetic crosstalk solutions for systems on chips, combined with our flagship electromagnetic and semiconductor solvers, provides a comprehensive solution for on-chip, 3D integrated circuit and chip-package-system electromagnetics and noise analysis.
|
| February 1, 2019 | | Granta Design | | ReactionGranta Design, the premier provider of materials information technology, expands our portfolio into this important area, giving customers access to materials intelligence, including data that is critical to successful simulations.
|
2018 Acquisition
On May 2, 2018, we completed the acquisition of 100% of the shares of OPTIS, a premier provider of software for scientific simulation of light, human vision and physics-based visualization, for a purchase price of $291.0 million. The acquisition extended our portfolio into the area of optical simulation to provide comprehensive sensor solutions, covering visible and infrared light, electromagnetics and acoustics for camera, radar and lidar.
2017 Acquisitions
During the year ended December 31, 2017, we completed various acquisitions which were not individually significant. The combined purchase price of the acquisitions was approximately $67.0 million.
The 2017 technology acquisitions are further described in the table below: |
| | | | |
| Date of Closing | | Company | | Details |
| November 15, 2017 | | 3DSIM | | 3DSIM, a leading developer of chemistrypremier additive manufacturing technology, gives us a complete additive manufacturing simulation workflow solution. 3DSIM's software was acquired for $19.1 million. Reaction Design's solutions enable transportationempower manufacturers, designers, materials scientists and energy companiesengineers to rapidly achieve their cleanobjectives through simulation-driven innovation rather than physical trial and error. |
| July 5, 2017 | | Computational Engineering International, Inc. (CEI Inc.) | | CEI Inc., the developer of EnSight, aids engineers and scientists in their ability to analyze, visualize and communicate large simulation data sets in clear, higher-resolution outputs. |
| March 10, 2017 | | CLK Design Automation (CLK-DA) | | CLK-DA offers fast transistor simulation technology goals by automating the analysis of chemical processes via computer simulation and modeling solutions.that complements our semiconductor product portfolio. |
For further information on the Company'sour business combinations, see Note 34 to the consolidated financial statements included in Part IV, Item 15 of this Annual Report on Form 10-K.
AVAILABLE INFORMATION
The Company'sOur website is www.ansys.com. The Company also maintains a presence on social media through its blog at www.ansys-blog.com, Facebook page at www.facebook.com/ANSYSInc, Twitter account at twitter.com/ANSYS, YouTube account at www.youtube.com/user/ansysinc and LinkedIn page at www.linkedin.com/company/ansys-inc. The Company makesour investor relations website is https://investors.ansys.com. We make available on itsour investor relations website, free of charge, Annual Reports on Form 10-K, Quarterly Reports on Form 10-Q, interactive data files, Current Reports on Form 8-K, reports filed pursuant to Section 16 and amendments to those reports filed or furnished pursuant to Section 13(a) or 15(d) of the Securities Exchange Act of 1934, as amended, as soon as reasonably practicable after such materials are electronically filed or furnished to the Securities and Exchange Commission ("SEC")(SEC). The Company'sOur reports may also be obtained by accessing the EDGAR database of the SEC's website at www.sec.gov. In addition, the Company has posted the charters for its Audit Committee, Compensation Committee, and Nominating and Corporate Governance Committee, as well as the Company's Code of Business Conduct and Ethics, Standard Business Practices and Corporate Governance Guidelines on its website. Information posted on the Company's website or social media accounts is not incorporated by reference in this Annual Report on Form 10-K.
Information provided by the Company or its spokespersons,The following are important factors we have identified that could affect our future results and an investment in our common stock. In addition, from time to time we provide information, including information contained in this Annual Report on Form 10-K, may from time to time containthat contains forward-looking statements concerning, among other things, projected financial performance, total addressable market, market and industry sector growth, product development and commercialization or other aspects of future operations. Such statements will beare based on the assumptions and expectations of the Company'sour management at the time such statements are made. The Company cautionsWe caution investors that itsour performance (and, therefore,and any forward-looking statement) isstatements are subject to risks and uncertainties. Various important factors,uncertainties, including but not limited to, the followingfollowing:
Global Operational Risks
Adverse economic and geopolitical conditions may cause the Company's future results to differ materially from those projected in any forward-looking statement.impact our operations and financial performance.
Global Economic Conditions.The Company'sOur operations and performance depend significantly on global macroeconomic, specific foreign country and U.S. domestic economic conditions. UncertaintyAdverse conditions in the macroeconomic environment as well as geopolitical conditions, have resultedmay result in significanta decreased demand for our products and services, constrained credit and liquidity, reduced government spending and volatility in credit, equity and foreign currencyexchange markets. This volatility and the related economic conditions may negatively impact the Company as customers defer spending in response to tighter credit, higher unemployment, financial market volatility, government austerity programs, negative financial news, declining valuations of investments and other factors. In addition, certain ofto the Company's customers' budgets may be constrained and they may be unable to purchase the Company's products at the same level as they have in prior periods. Customer spending levels may be impacted by decreased government spending in certain countries as concerns continue regarding economic conditions and government debt levels. These conditions may persist or further deteriorate for an extended period of time. Asextent the global economy continues to experienceexperiences a significant downturn or volatility, the Companywe may be exposed to impairments of certain assets asif their values deteriorate.
Tighter credit due to economic conditions may diminish the Company'sour future borrowing ability. The Company's customers'ability and increase borrowing costs under our existing credit facilities. Customers' ability to pay for the Company'sour products and services may also be impaired, which maycould lead to an increase in the Company'sour allowance for doubtful accounts and write-offs of accounts receivable. Since the Company is exposed to the majority of major world markets, uncertainty in any significant market may negatively impact the Company's performance and results, particularly with respect to the Company's largest geographic customer bases. The Company is unable to predict the likely duration and severity of changing economic conditions or the likelihood of additional uncertainty arising in any of the Company's key markets. Should these economic conditions result in the Company not meeting its revenue growth objectives, the Company's operating results, cash flows and financial condition could be adversely affected.
Decline in Customers' Businesses.The Company's sales are based significantly on end-user demand for products in key industrial sectors. Many of these sectors periodically experience economic declines, which may be exacerbated by other economic factors. These factors may also adversely affect the Company's business by extending sales cycles and reducing revenue. These economic factors may cause the Company's customers to reduce the size of their workforce or cut back on operations and may lead to a reduction in renewals of licenses or maintenance contracts with the Company. The Company's customers may request discounts or extended payment terms on new products or seek to extend payment terms on existing contracts, all of which may cause fluctuations in the Company's future operating results. The Company may not be able to adjust its operating expenses to offset such fluctuations because a substantial portion of the Company's operating expenses is related to personnel, facilities and marketing programs. The level of personnel and related expenses may not be able to be adjusted quickly and is based, in significant part, on the Company's expectation for future revenue.
Risks Associated with International Activities. A majority of the Company'sour business comes from outside the United StatesU.S. and the Company hasour customers that supply a wide spectrumarray of goods and services in virtually allto most of the world'sworld’s major economic regions. AsInternational revenue represented 57.9%, 60.9% and 61.9% of our total revenue for the Company continuesyears ended December 31, 2019, 2018 and 2017, respectively. In fiscal year 2019, our largest geographic revenue bases included the U.S., Japan, Germany and South Korea.
If any of the foreign economies in which we do business deteriorates or suffers a period of uncertainty, our business and performance may be negatively impacted through reduced customer and government spending, changes in purchasing cycles or timing, reduced access to expand itscredit for our customers, or other factors impacting our international sales presenceand collections. Furthermore, customer spending levels in international regions,any foreign jurisdiction may be adversely impacted by changes in domestic policies, including tax and trade policies. For example, the United Kingdom withdrew from the European Union effective as of January 31, 2020 and is now in a period of transition until the end of 2020. We have significant operations in the United Kingdom and the European Union. It remains unclear as to what the terms of the new relationship between the United Kingdom and the European Union will be. Terms that are disadvantageous to us, including those related to trade, tax and the movement of people across borders could negatively impact our results.
A substantial portion of itsour license and maintenance revenue is derived from annual lease and maintenance contracts which typically have a high rate of customer renewal. If the rate of renewal for these contracts is adversely affected by economic or other factors, our lease license and maintenance growth will be adversely affected. As a result, our business, financial position, results of operations and cash flows may also be adversely impacted during those periods.
We face compliance risk as a result of our international operations and our sales model, including pertaining to anti-corruption and data privacy laws.
The laws with which we need to comply due to our international operations vary from country to country and are subject to frequent change and interpretation. In May 2018, the General Data Protection Regulation (GDPR), which governs data privacy practices within the European Economic Area (EEA), went into effect. The law, which applies to our data processing activities within the EEA, as well as the processing of EEA citizen data globally, imposes various compliance obligations related to the handling of personal data in the delivery of our products and services and to business operations involving employee data. Compliance with the GDPR has and will continue to require deployment of substantial resources and increased costs. If we fail to comply with the GDPR, it may lead to regulatory enforcement actions, which can result in monetary penalties of up to 4% of annual worldwide revenue, private lawsuits, extensive and prescriptive consent decrees or judgments that may require additional resources or expenses for compliance and may cause reputational damage.
In the U.S., California implemented the California Consumer Protection Act (CCPA) as of January 2020, which requires compliance measures similar to those of the GDPR and establishes the first state standard for a comprehensive set of data privacy rights. Several other states have proposed data privacy laws that would impose obligations on us with respect to how we collect and use personal data, including customer data. In order to comply with U.S. state laws, as well as any data breach notification laws that vary across states, we may be required to invest in additional resources or tools to manage our data
processing activities. If we fail to comply with the requirements of U.S. data privacy and data breach notification laws, we will be subject to state monetary fines, consent decrees issued by the Federal Trade Commission, and possible reputational damage.
Our global reach, including within countries considered high-risk environments for public corruption, exposes us to risks associated with violations of anti-bribery laws such as the U.S. Foreign Corrupt Practices Act and the U.K. Bribery Act. We develop and sell software and consulting services and maintain support operations in more than 40 countries whose laws and practices differ from one another and are subject to unexpected changes. Managing these geographically diverse operations requires significant attention and resources to ensure compliance. To promote compliance, we forbid our agents and employees from engaging in corrupt behavior and have implemented a compliance plan to prevent and detect violations of anti-corruption laws. There remains, however, a risk that illegal conduct could occur thereby exposing us to the financial and reputational risks associated with a violation of anti-corruption laws.
Noncompliance with these regulations could adversely impact our financial results or stock price as well as divert management time and effort.
We are subject to trade restrictions that could impact our ability to sell to customers and result in liability for violations.
Due to the global nature of our business, we are subject to import and export restrictions and regulations that prohibit the shipment or provision of certain products and services to certain countries, governments and persons targeted by the U.S., including the Export Administration Regulations administered by the U.S. Bureau of Industry and Security (BIS) and economic and trade sanctions administered by the U.S. Treasury Department’s Office of Foreign Assets Control (OFAC). During the second quarter of 2019, the BIS placed certain entities on the Entity List. Certain of our existing and prospective customers, including Huawei, were included in this list. In addition, restrictions implemented by OFAC restrict our ability to sell to some companies in certain countries, such as Russia. The Entity List and OFAC restrictions limit our ability to deliver products and services to these customers and, in the absence of a license, our ability to sell products and services to these customers in the future. The inclusion of companies on the Entity List may encourage them to seek substitute products from competitors who are not subject to these restrictions or to develop their own products. We cannot predict whether or when any changes will be made that eliminate or decrease these limitations on our ability to sell products and provide services to these customers. Additionally, other customers may continue to be added to the Entity List and/or be subjected to trade restrictions. There may be indirect impacts that cannot be quantified, including that our business may also be impacted by other trade restrictions that may be imposed by the U.S., China, or other countries. Restrictions on our ability to sell and ship to customers could have an adverse effect on our business, results of operations or financial condition.
Violators of these export controls may be subject to significant penalties, which may include considerable monetary fines, criminal proceedings against them and their officers and employees, a denial of export privileges, and suspension or debarment from selling products or services to the federal government. Any such penalties could have an adverse effect on our business, financial condition, operating results and cash flows. In addition, the political and media scrutiny surrounding any governmental investigation could cause significant expense and reputational harm and distract senior executives from managing normal day-to-day operations.
Our products could also be shipped to denied parties by third parties, including our channel partners. Even though we take precautions to ensure that our channel partners comply with all relevant import and export regulations, any failure by channel partners to comply with such regulations could have negative consequences for us, including reputational harm, government investigations and penalties.
The effect of foreign exchange rate fluctuation may adversely impact our revenue, expenses, cash flows and financial conditions.
As a result of our significant international presence, we have revenue, expenses, cash, accounts receivable and payment obligations denominated in foreign currencies, continues to increase. If any ofmost notably the foreign economies in which the Company does business deteriorate or suffer periods of uncertainty, the Company's businessBritish Pound, Euro, Japanese Yen, South Korean Won and performance may be negatively impacted through reduced customer spending, changes in purchasing cycles or timing, reduced access to credit for its customers, or other factors impacting the Company's international sales and collections. The Company's results may also be negatively impacted by geopolitical tensions, which may result in increased economic volatility.
As a result of its increasing international activities, the Company hasIndian Rupee. Our revenue expenses, cash, accounts receivable and payment obligations denominated in foreign currencies. As a result, the Company is subject to currency exchange risk. The Company's revenues and operating results are adversely affected when the U.S. Dollar strengthens relative to otherforeign currencies and are positively affected when the U.S. Dollar weakens. As a result, changesweakens relative to foreign currencies. If the U.S. Dollar strengthens relative to other currencies, certain channel partners who pay us in U.S. Dollars may have trouble paying on time or may have trouble distributing our products due to the impact of the currency exchange rates will affect the Company's financial position, results of operations andfluctuation on such channel partner's cash flows. In the event that there are economic declines in countries in which the Company conducts transactions, the resulting changes in currency exchange ratesThis may affect the Company's financial position, results of operationsimpact our ability to distribute our products into certain regions and cash flows. The Company is most impacted by movements in and among the Japanese Yen, Euro, British Pound, South Korean Won, Indian Rupee, Canadian Dollar and U.S. Dollar. The Company seeksmarkets.
We seek to reduce our currency exchange transaction risks primarily through itsour normal operating and treasury activities, including derivative instruments, but there can be no assurance that itthese activities will be successful in reducing these risks.
In June 2016, the United Kingdom voted to leave the European Union. The long-term impact of the decision is uncertain. As a result, the Company's businessaddition, we incur transaction fees in the United Kingdom and Europe could be adversely impacted due to political and economic instability, fluctuationsusage of such derivative instruments. Changes in currency exchange rates changes in laws and regulations, and other factors. These risks could negatively impact the Company'swill affect our financial position, results of operations and cash flows.
In May 2018, a new setA natural disaster or catastrophic event may disrupt our business.
A significant portion of data protection rules will go into effectour software development personnel, source code and computer equipment is located at operating facilities in the European Union. These rules provideU.S., Canada, India, Japan and throughout Europe. The occurrence of a unifiednatural disaster or other unforeseen catastrophe at any of these facilities could cause disruptions to our operations, services and comprehensive setproduct development activities. Additionally, if we experience problems that impair our business infrastructure, such as a computer virus, telephone system failure or an intentional disruption of requirements for data protection of individuals within the European Union. The Company will be subject toour information technology systems by a third party, these requirements, which include potentially significant monetary penalties for noncompliance. If the Company fails to comply with the new regulations, its reputation may suffer and its financial position, results of operations and cash flows may be negatively impacted.
Additional risks inherent in the Company's international business activities include imposition of government controls; export license requirements; restrictionsdisruptions could have a material adverse effect on the export of critical technology, products and services; the violation of anti-corruption laws and regulations, which are applicable to the Company, by third parties in countries where such conduct may be permissible or commonplace; political and economic instability; trade restrictions; changes in tariffs and taxes; difficulties in staffing and managing international operations; changes in data privacy regulations; longer accounts receivable payment cycles; and the burdens of complying with a wide variety of foreign laws and regulations. Effective patent, copyright, trademark and trade secret protection may not be available in every foreign country in which the Company sells its products and services. The Company'sour business, financial position, results of operations, and cash flows and the ability to meet financial reporting deadlines. Further, because our sales are not generally consistent across quarterly periods, the potential adverse effects resulting from any of the events described above or any other disruption of our business could be materially,accentuated if they occur close to the end of a fiscal quarter.
In addition, our business could be adversely affected by anythe effects of these risks.
Sales Forecasts. The Company makes many operational and strategic decisions based upon short- and long-term sales forecasts. The Company's sales personnel continually monitor the statusa widespread outbreak of all proposals,contagious disease, including the estimated closing daterecent outbreak of respiratory illness caused by a novel coronavirus first identified in Wuhan, Hubei Province, China. Any outbreak of contagious diseases, and other adverse public health developments, may cause us or our customers to temporarily suspend operations in the valueaffected city or country. In addition, a significant outbreak of contagious diseases in the sale,human population could result in order to forecast quarterly sales. These forecasts are subject to significant estimation and are impacted by many external factors, including global economic conditions and the performance of the Company's customers. A variation in actual sales activity froma widespread health crisis that forecasted could cause the Company to plan or budget incorrectly and, therefore, could adversely affect the Company's business,economies and financial position, resultsmarkets of operationsmany countries, resulting in an economic downturn that could affect demand for our products, our ability to collect against existing trade receivables and cash flows. The Company's management team forecasts macroeconomic trendsour operating results.
Industry Operational Risks
Our industry is highly competitive, which could result in downward pressure on our prices.
We continue to experience competition across all markets for our products and developments,services. Some of our current and integrates them through long-range planning into budgets, research and development strategies and a wide variety of general management duties. Global economic conditions, and the effect those conditionspotential competitors have greater financial, technical, marketing and other disruptionsresources than we do, and some have well-established relationships with our current and potential customers. Our current and potential competitors also include firms that have competed, or may in global marketsthe future compete, by means of open source licensing. Companies we have, or could have, strategic alliances with could reduce or discontinue technical, software development and marketing relationships with us for competitive purposes. If our competitors offer deep discounts on certain products or services, or develop products that the Company's customers,marketplace considers more valuable, we may have a significant impact on the accuracy of the Company's sales forecasts. These conditions may increase the likelihoodneed to lower prices or the magnitude of variations between actual sales activityoffer discounts or other favorable terms in order to compete successfully. Our maintenance products, which include software license updates and the Company's sales forecasts and,product support fees, are generally priced as a result,percentage of new software license fees. Our competitors may offer lower percentage pricing on product updates and support. Some competitors may bundle software products for promotional purposes or as a long-term pricing strategy or provide guarantees of prices, product implementations or wider geographical license usage provisions. Any of these practices could, over time, significantly constrain the Company's performanceprices that we can charge for certain products.
Furthermore, if we do not adapt pricing models to reflect changes in customer usage of our products or changes in customer demand, our new software license revenues could decrease. Additionally, increased distribution of applications through application service providers, including software-as-a-service providers, may be hindered becausereduce the average price of a failure to properly match corporate strategy with economic conditions. This, in turn, mayour products or adversely affect other sales of our products, reducing new software license revenues unless we can offset price reductions with volume increases.
These competitive pressures may result in decreased sales volumes, price reductions and/or increased operating costs, and could result in lower revenues, margins and net income.
We may not be successful in developing and marketing new products to adequately address the Company's business, financial position, results of operations and cash flows.rapidly changing technology industry.
Stock Market and Stock Price Volatility. Market prices for securities of software companies have generally been volatile. In particular, the market price of the Company's common stock has been, and may continue to be, subject to significant fluctuations as a result of factors affecting the Company, the software industry or the securities markets in general. Such factors include, but are not limited to, declines in trading price that may be triggered by the Company's failure to meet the expectations of securities analysts and investors. Moreover, the trading price could be subject to additional fluctuations in response to quarter-to-quarter variations in the Company's operating results, material announcements made by the Company or its competitors, conditions in the financial markets or the software industry generally, or other events and factors, many of which are beyond the Company's control.
Rapidly Changing Technology; New Products; Risk of Product Errors. The Company operatesWe operate in an industry generally characterized by rapidly changing technology and frequent new product introductions, which can render existing products obsolete or unmarketable. A major factor in the Company'sour future success will be itsour ability to anticipate technological changes and to develop and introduce, in a timely manner, enhancements to its existing products, products acquired in acquisitions and new products to meet those changes. IfOur ability to grow revenue will be dependent on our ability to respond to customer needs in the Company is unable to introduce new productsareas of, among others, 5G, autonomous vehicles, Industrial Internet of Things (IIoT) and electrification, and to respond quicklyleverage cloud computing and new computing platforms. In addition, our future success may depend on our ability to continue to develop a systems integrator ecosystem able to handle integrations and process and application development to address the challenge of the increasingly complex integration of our products’ different functionalities to address customers’ requirements. In addition, for those customers who authorize a third-party technology partner to access their data, we do not provide any warranty related to the functionality, security and integrity of the data transmission or processing. Despite contract provisions to protect us, customers may look to us to support and provide warranties for the third-party applications, integrations, data and content, even though not developed or sold by us, which may expose us to potential claims, liabilities and obligations, all of which could harm our business.
We devote substantial resources to research and development, which could cause our operating results to decline.
We devote substantial resources to research and development. New competitors, technological advances in the software development industry changes, its business,by us or our competitors, acquisitions, entry into new markets, or other competitive factors may require us to invest significantly greater resources than anticipated. If we are required to invest significantly greater resources than anticipated without a corresponding increase in revenue, operating results could decline. In addition, our periodic research and development expenses may be independent of our level of revenue, which could negatively impact financial position, results of operations and cash flows could be materially, adversely affected.results.
The introduction and marketing of new or enhanced products require the Company to manage the transition from existing products in order to minimize disruption in customer purchasing patterns. There can be no assurance that the Companywe will be successful in developing and marketing, on a timely basis, new products or product enhancements or that the new products will adequately address the changing needs of the marketplace or that the Companywe will successfully manage the transition from existing products. Software products as complex as those offered by the Companywe offer may contain undetected errors when first introduced, or as new versions are released, and the likelihood of errors is increased as a result of the Company'sour commitment to the frequency of its product releases. There can be no assurance that errors will not be found in any new or enhanced products after the commencement of commercial shipments. Certain products require a higher level of sales and support expertise. Failure of the Company'sour sales channel, particularly the indirectindependent channel partners, to obtain this expertise and to sell the new product offerings effectively could have an adverse impact on the Company'sour sales in future periods. Any of these problems may result in the loss of or delay in customer acceptance, diversion of development resources, damage to the Company'sour reputation, or increased service and warranty costs, any of which could have a material adverse effect on the Company'sour business, financial position, results of operations and cash flows.
Consolidation among our customers as well as our industry competitors may negatively impact our operating results.
There have been consolidations among our customers in the semiconductor, electronics and automotive industries, among others. This may result in the newly combined entity wanting the most favorable pricing from the former contracts and expecting larger volume discounts on future purchases. If a customer is acquired by an entity that does not utilize our products in favor of a competing product, we may not have future orders from the enterprise. Further, consolidation of our competitors may result in synergies that allow those competitors to benefit from broader sales channels and increased access to capital. Any of these impacts could adversely affect our business, financial position, results of operations and cash flows.
The price of our common stock is subject to volatility.
The market price of securities of software companies is subject to significant fluctuations. The valuation and trading price of our common stock may not be predictable. Factors that may adversely impact our share price include our failure to meet analyst expectations, reduced expectations regarding financial outlook, increases in our debt levels, changes in management or our material announcements or those of our competitors. In addition, volatility could result from causes that are unrelated to our operating performance such as conditions in the financial markets or the software industry generally.
Company Operational Risks
We are dependent upon our channel partners for a significant percentage of our revenue.
We distribute our products through a global network of independent channel partners, which accounted for 22.9%, 22.4% and 24.8% of our revenue during the years ended December 31, 2019, 2018 and 2017, respectively. Channel partners sell our software products to new and existing customers, expand installations within the existing customer base, offer consulting
Product Quality. The Company has separate quality systemsservices and registrations underprovide the ISO 9001:2008 standard,first line of technical support. In Asia-Pacific and EMEA, we are highly dependent upon our channel partners. Difficulties in additionongoing relationships with channel partners, such as failure to other governmentalmeet performance criteria and industrial regulations. The Company's continued compliance with quality standards and favorable outcomesdifferences in periodic examinations is importanthandling customer relationships, could adversely affect our performance. Additionally, the loss of any major channel partner, including a channel partner's decision to retain current customers and vital to procure new sales. If the Company was determined not to be compliant with various regulatory or ISO 9001/9000 standards, its certificates of registration could be suspended, requiring remedial action and a time-consuming re-registration process. Product quality issues or failuressell competing products rather than ours, could result in reduced revenue. Moreover, our future success will depend substantially on the Company's reputation becoming diminished, resulting in a material adverse impact on revenue, operating margins, net income, financial positionability and cash flows.
Competition. The Company continueswillingness of our channel partners to experience competition across all markets for itsdedicate the resources necessary to promote our portfolio of products and services. Someto support a larger installed base within each of our geographic regions. If the Company's current and possible future competitorschannel partners are unable or unwilling to do so, we may be unable to sustain revenue growth.
We have greater financial, technical, marketing and other resources thanbeen increasing the Company, and some have well-establishednumber of channel partners, particularly in international locations. The business relationships with current and potential customers of the Company. The Company's current and possible future competitors also include firms that have competed or may in the future elect to compete by means of open source licensing. Parties among the Company's current or future strategic alliances may diminish or sever technical, software development and marketing relationships with the Company for competitive purposes. These competitive pressures may result in decreased sales volumes, price reductions and/or increased operating costs,these channel partners are recently established and could result in lower revenues, marginsadditional compliance burdens for us. In addition, these partners have a less-established payment history and net income.
Changesrevenue from these partners could come with a higher rate of bad debt expense. Where channel partners operate on our behalf to collect and process personal data of customer contacts, failure to comply with relevant data privacy laws in the Company's Pricing Models. The intense competition the Company faceshandling of such personal data could result in the sales of its products and services, and general economic and business conditions, can put pressureour liability for any fines, civil suits or non-financial performance obligations imposed by regulatory authorities on the Companythese partners with respect to adjust its prices. If the Company's competitors offer deep discounts on certain products or services, or develop products that the marketplace considers more valuable, the Companyour customer data.
We may need to lower prices or offer discounts or other favorable terms in order to compete successfully. Any such changes may reduce operating margins and could adversely affect operating results. The Company's maintenance products, which include software license updates and product support fees, are generally priced as a percentage of its new software license fees. The Company's competitors may offer lower percentage pricing on product updates and support that could put pressure on the Company to further discount its new license or product support prices.
Any broad-based change to the Company's prices and pricing policies could cause new software license and service revenues to decline or be delayed as its sales force implements and its customers adjust to the new pricing policies. Some of the Company's competitors may bundle software products for promotional purposes or as a long-term pricing strategy or provide guarantees of prices, product implementations or wider geographical license usage provisions. These practices could, over time, significantly constrain the prices that the Company can charge for certain products. If the Company does not adapt its pricing models to reflect changes in customer use of its products or changes in customer demand, the Company's new software license revenues could decrease. Additionally, increased distribution of applications through application service providers, including software-as-a-service providers, may reduce the average price for the Company's products or adversely affect other sales of the Company's products, reducing new software license revenues unless the Company can offset price reductions with volume increases. The increase in open source software distribution may also cause the Company to adjust its pricing models.
Dependence on Senior Management and Key Technical Personnel. The Company's success depends upon the continued services of the Company's senior executives, key technical employees and other employees. Each of the Company's executive officers, key technical personnel and other employees could terminate his or her relationship with the Company at any time. The loss of any of the Company's senior executives might significantly delay or prevent the achievement of the Company's business objectives and could materially harm the Company's business and customer relationships.
In addition, because of the highly technical nature of the Company's products, the Company must attract and retain highly skilled engineering and development personnel, many of whom are recruited from outside of the United States. The market for this talent is highly competitive. The Company is limited in its ability to recruit internationally by restrictive domestic immigration laws. If the immigration laws become stricter or if the Company has less success in recruiting and retaining key personnel, the Company's business, reputation and operating results could be materially and adversely affected.
Dependence on Proprietary Technology. The Company's success is highly dependent upon its proprietary technology. The Company generally relies on contracts and the laws of copyrights, patents, trademarks and trade secrets to protect its technology. The Company maintains a trade secrets program, enters into confidentiality agreements with its employees and channel partners, and limits access to and distribution of its software, documentation and other proprietary information. There can be no assurance that the steps taken by the Company to protect its proprietary technology will be adequate to prevent misappropriation of its technology by third parties, or that third parties will not be able to develop similar technology independently. Costlyrealize the potential benefit of our acquisitions and time-consuming litigationsuch acquisitions could be necessarypose risks to enforceour business.
We consummate acquisitions to support our long-term strategic direction. We have completed a number of acquisitions in recent years, and determinein 2019 we acquired Granta Design, Helic, DfR Solutions, LST and Dynardo.
Any acquisitions that we complete may present risks, including: difficulty in integrating the scope of trade secret rightsmanagement teams, strategies, cultures and related confidentiality and nondisclosure provisions. Although the Company is not aware that any of its technology infringes upon the rights of third parties, there can be no assurance that other parties will not assert technology infringement claims against the Company or that, if asserted, such claims will not prevail.
Risks Associated with Securityoperations of the Company's Products, Source Codecompanies or businesses; failing to achieve anticipated synergies, revenue increases or cost savings; difficulty incorporating and IT Systems. The Company makes significant effortsintegrating the acquired technologies or products with our existing product lines; difficulty with sales, distribution and marketing functions; failure to maintain and improve the security and integrity of its products, source code, computer systems and data. Despite significant efforts to create security barriers to such programs, it is virtually impossible for the Company to entirely mitigate this risk. There appears to be an increasing number of computer “hackers” developing and deploying a variety of destructive software programs (such as viruses, worms and the like) that could attack the Company'sdevelop new products and computer systems. Becauseservices that utilize the techniques used to obtain unauthorized access to networks or to sabotage systems change frequentlytechnologies and generally are not recognized until launched against a target, the Company may be unable to anticipate these techniques or to implement adequate preventative measures. Like all software products, the Company's software is vulnerable to such attacks. The impact of such an attack could disrupt the proper functioningresources of the Company's software products, cause errors incompanies; disruption of our ongoing business and diversion of management's attention to transition or integration issues; liabilities that were not identified during the outputbuying process; the loss of its customers' work, allow unauthorized access to sensitive, proprietaryour key employees, customers, partners and channel partners or confidential informationthose of the Companyacquired company; and cybersecurity and data privacy risks, including any liabilities for failure to comply with data privacy laws and obligations for collection, use and retention of personal data.
Future acquisitions may involve the expenditure of significant cash resources; the incurrence of debt, which increases our interest expense and leverage; or its customersthe issuance of equity, which is dilutive to stockholders and result in other destructive outcomes. If this were to occur, the Company's reputation may suffer, customers may stop buying products, the Company could face lawsuits and potential liability, and the Company's financial performance could be negatively impacted.decrease earnings per share.
There is alsoWe allocate a danger of industrial espionage, cyber-attacks, misuse, theft of information or assets (including source code), or damage to assets by people who have gained unauthorized access to the Company's facilities, systems or information. Such cybersecurity breaches, misuse or other disruptions could lead to the disclosure of portions of the Company's product source code or other confidential information, improper usage and distribution of the Company's products without compensation, illegal usage of the Company's products which could jeopardize the security of information stored in and transmitted through its computer systems, and theft, manipulation and destruction of private and proprietary data, resulting in defective products and production downtimes. Although the Company actively employs measures to combat unlicensed copying, access and use of software and intellectual property through a variety of techniques, preventing unauthorized use or infringement of the Company's rights is inherently difficult. These events could adversely affect the Company's financial results or could result in significant claims for damages against it. Participating in lawsuits to protect against any such unauthorized access to, usage of or disclosure of any of the Company's products or any portion of the Company's product source code, or in prosecutions in connection with any such cybersecurity breach,purchase price to goodwill and intangible assets. If we do not recognize all the economic benefits of an acquisition, there could be costlyan impairment of goodwill or intangible assets. Furthermore, impairment charges are generally not tax-deductible and time-consuming, and may divert management's attention and adversely affect the market's perception of the Company and its products.
Policing the unauthorized distribution and use of the Company's products is difficult, and software piracy (including online piracy) is a persistent problem. The proliferation of technology designed to circumvent typical software protection measures usedwill result in an increased effective income tax rate in the Company's products, andperiod the possibilityimpairment is recorded.
If we do not achieve the anticipated benefits of methods that circumvent the techniques it employs in its products, may lead to an expansion in piracy or misuse of its products and intellectual property. As a result, and despite the Company's efforts to prevent such activities and to prosecute instances of such activities, the Company may nonetheless lose significant revenue due to illegal use of its software, and management's attention may be diverted to address specific instances of piracy or misuse,our acquisitions as rapidly or to address piracythe extent anticipated by our management or the financial and misuse in general.
A number of the Company's core processes, such as software development, sales and marketing, customer service and financial transactions, relyindustry analysts, there could be a material adverse effect on its IT infrastructure and applications. The Company also relies upon third-party products, which are exposed to various security vulnerabilities. Malicious software, sabotage and other cybersecurity breaches of the types discussed above could cause an outage of the Company's infrastructure, which could lead to a substantial denial of service and ultimately to production downtime, recovery costs and customer claims. This could have a significant negative impact on the Company'sour stock price, business, financial position, profitresults of operations and cash flows. Where customer contacts and leads are a significant consideration in the purchase price or expected financial outcome of an acquisition, failure to identify or mitigate data privacy concerns with the collection, use and retention of personal data may adversely impact our ability to use this information as anticipated and regulatory obligations may require that we delete all or a portion of the database, or take additional remediation measures before use. This may impact the value of the acquisition or reduce forecasted sales.
The Company has implementedimplementation of a numbernew CRM system may not achieve the corporate benefits initially identified in the anticipated time frame or at all.
We are in the process of measures designed to ensure the security of its information, IT resources and other assets. Nonetheless, unauthorized users could gain access to its systems through cyber-attacks and steal, use without authorization, and sabotage the Company's intellectual property and confidential data. Any breach of its IT security, misuse or theft could lead to loss of production, recovery costs or litigation brought by employees, customers or business partners, which could have a significant negative impact on the Company's business, financial position, profit, cash flows and reputation.
Implementation of IT Systems. The Company is currently implementing a new functionality in our existing Customer Relationship Management (CRM) system and moving the billing and revenue recognition processes from the Company’s existing ERP accounting system to an application of the new CRM system. While these systems, along with the re-design of the processes described above, arethis system is anticipated to simplify the demand generation, sales andcycle, order processing efforts and to enhance customer service and aid in the application of the new revenue accounting standard,activities, there is a risk that the project will not achieve the anticipated benefits or that the benefits will not be achieved as quickly as anticipated. There is also a risk that we will have to write off previously capitalized expenditures if the project is not successful or if implementation decisions regarding the project are modified. The project implementation timeline and scope may change and become longer and broader as new facets of the design and implementation efforts are undertaken. This may take the attention of key operational management away from other aspects of the business, including the integration of acquisitions, and may also result in increased consulting and software costs. These factors may have a significant negative impact on the Company'sour business, financial position, profit, cash flows and reputation.
If we are unable to attract and retain key talent, our business could be adversely affected.
Dependence on Channel Partners.Our success depends upon the continued service of our senior executives and our key technical and sales employees. Each of our executive officers and key technical personnel could terminate his or her relationship with us at any time. The Company continuesloss of any of our senior executives or key personnel for which there has not been adequate knowledge-sharing and transfer might significantly delay or prevent the achievement of our business objectives and could materially harm our business and customer relationships.
In addition, because of the highly technical nature of our products and services, we must attract and retain highly skilled engineering and development personnel. The market for this talent is highly competitive and we have difficulty filling these roles for this reason. While we have historically recruited from outside of the U.S., in recent years our ability to distribute a meaningful portiondo so has been curbed by more restrictive domestic immigration laws. If the immigration laws become even stricter or the processing of itsimmigration requests becomes even more cumbersome or less efficient, or if we have less success in recruiting and retaining key personnel, our business, reputation and operating results could be materially and adversely affected.
We may be subject to proceedings that could harm our business.
We are subject to various investigations, claims and legal proceedings that arise in the ordinary course of business, including commercial disputes, labor and employment matters, tax audits and litigations, alleged infringement of intellectual property rights and other matters. Use or distribution of our products through its global network of independent, regional channel partners. Thecould generate product liability, regulatory infraction, or similar claims by our customers, end users, channel partners, government entities or other third parties. Sales and marketing activities that impact processing of personal data, as well as measures taken to ensure license compliance, may also result in claims by customers and individual employees of customers. Each of these matters is subject to various uncertainties, and it is possible that an unfavorable resolution of one or more of these matters could materially and adversely affect our results of operations, cash flows and financial position, as well as cause damage to our reputation.
We may not be able to continue to obtain licenses to third-party software and intellectual property on reasonable terms or at all, which may disrupt our business and harm our financial results.
We license third-party software and other intellectual property for use in product research and development and, in several instances, for inclusion in our products. We also license third-party software, including the software of our competitors, to test the interoperability of our products with other industry products and in connection with our professional services. These licenses may need to be renegotiated or renewed from time to time, or we may need to obtain new licenses in the future. Third parties may stop adequately supporting or maintaining their technology, or they or their technology may be acquired by our competitors. If we are unable to obtain licenses to such third-party software and intellectual property on reasonable terms or at all, we may not be able to sell the Company'saffected products, our customers’ use of the products may be interrupted, or our product development processes and professional services offerings may be disrupted, which could in turn harm our financial results, our customers' ability to utilize our software, productsand our reputation.
We may suffer reputational or financial harm if we have product standard or quality issues.
We have separate quality systems and registrations under the ISO 9001:2015 standard in addition to other governmental and industrial regulations. Our continued compliance with quality standards and favorable outcomes in periodic examinations is important to retain current customers and vital to procure new sales. If it was determined that we were not in compliance with various regulatory or ISO 9001 standards, our certificates of registration could be suspended, requiring remedial action and existinga time-consuming re-registration process. Product quality issues or failures could result in our reputation becoming diminished, resulting in a material adverse impact on revenue, operating margins, net income, financial position and cash flows.
Our short-term and long-term sales forecast may not be accurate which could result in an adverse impact on our business.
The software business is generally characterized by long sales cycles. These long sales cycles increase the difficulty of predicting sales for any particular quarter. Many operational and strategic decisions are based upon short- and long-term sales forecasts. Our sales personnel continually monitor the status of proposals, including the estimated closing date and the value of the sale, in order to forecast quarterly sales. These forecasts are subject to significant estimation and are impacted by many external factors, including global economic conditions and the performance of our customers. A variation in actual sales activity from that forecasted could cause us to plan or budget incorrectly and, therefore, could adversely affect our business, financial position, results of operations and cash flows. Management also forecasts macroeconomic trends and developments and integrates them through long-range planning into budgets, research and development strategies and a wide variety of general management duties. Global economic conditions, and the effect those conditions and any disruptions in global markets have on our customers, expand installations withinmay have a significant impact on the existing customer base, offer consulting servicesaccuracy of our sales forecasts. These conditions may increase the likelihood or the magnitude of variations between actual sales activity and provideour sales forecasts and, as a result, our performance may be hindered because of a failure to properly match corporate strategy with economic conditions. This, in turn, may adversely affect our business, financial position, results of operations and cash flows. To the first line of technical support. Consequently, in certain geographies,extent our forecasts are incorrect and, as a result, we fail to meet analyst expectations regarding financial performance or miss or reduce the Companyfinancial guidance we give to investors, our share price may be adversely impacted.
Intellectual Property and Cybersecurity Risks
Our success is highly dependent upon the effortslegal protection of the channel partners. Difficulties in ongoing relationshipsour proprietary technology.
We primarily rely upon contracts and copyright, patent, trademark and trade secrets laws to protect our technology. We maintain intellectual property programs, including applying for patents, registering trademarks and copyrights, protecting trade secrets, entering into confidentiality agreements with our employees and channel partners, and limiting access to and distribution of our software, documentation and other proprietary information. However, software programs are particularly prone to piracy, which is a global phenomenon, and as a result we may lose revenue from the distribution of unlicensed software. Additionally, patent, copyright, trademark and trade secret protection do not provide the same coverage in every country in which we sell our products and services. Policing the unauthorized distribution and use of our products is difficult, and software piracy (including online piracy) is a persistent problem. While we continue to develop better mechanisms to detect and report or investigate unauthorized use of our software, we are also constrained by data privacy laws that restrict our ability to collect data about unlawful usage in some countries. We cannot assure that the steps we take to protect our proprietary technology are adequate to prevent misappropriation of our software by third parties, or that third parties will not be able to develop similar technology independently. Despite our efforts to prevent such as failureactivities, we may nonetheless lose significant revenue due to meet performance criteriaillegal use of our software.
Costly and time-consuming litigation would be necessary to enforce and determine the scope of trade secret rights and related confidentiality and nondisclosure provisions across our contractual agreements and partnerships. While we are not aware that any of our technology infringes upon the rights of third parties, there can be no assurance that other parties will not assert technology infringement claims against us, or that, if asserted, such claims will not prevail. Any such litigation could be costly to defend, damage our reputation, and distract our employees from their daily work. Any successful infringement claims asserted against us could require us to develop technology workarounds for the impacted products or product development, which could be costly, disrupt product development, and delay go-to-market activities. Such disruption and delay could negatively impact our financial results.
Cyberattacks and security vulnerabilities could lead to reduced revenue, increased costs, liability claims, or harm to our reputation.
While we undertake commercially reasonable efforts to maintain and improve the security and integrity of our products, source code, computer systems and data with respect to the relative sensitivity of such software, systems and data, the number of computer “hackers” developing and deploying destructive software programs that attack our products and computer systems continues to increase. We have incurred and will continue to incur additional costs to enhance our cybersecurity efforts. Because the tactics and tools used to obtain unauthorized access to networks or to promote the Company's products as aggressively as the Company expects, and differences in the handling of customer relationships, could adversely affect the Company's performance. Additionally, the loss of any major channel partner for any reason, including a channel partner's decision to sell competing products rather than the Company's products, could have a material adverse effect on the Company. Moreover, the Company's future success will depend substantially on the ability and willingness of its channel partners to continue to dedicate the resources necessary to promote the Company's portfolio of products and to support a larger installed base of the Company's products. If the channel partnerssabotage systems are unable or unwilling to do so, the Companyconstantly evolving, we may be unable to sustain revenue growth.implement adequate preventive measures. Such an attack could disrupt the proper functioning of our products, cause errors in the output of our customers' work, or allow unauthorized access to and disclosure of our sensitive, proprietary or confidential information or that of our customers and employees. In the event of a serious breach of our products or systems, or where a breach occurs due to our failure to implement reasonable and appropriate safeguards, our reputation may suffer, customers may stop buying products or may terminate current services, we could face lawsuits and potential civil liability, as well as regulatory fines and non-financial penalties for any personal data breach, and our financial performance could be negatively impacted.
There is also a danger of industrial espionage, cyberattacks, misuse, theft of information or assets (including source code), or damage to assets by people who have gained unauthorized access to our facilities, systems or information. This includes access to systems or information through email phishing attacks on our employees which has become a very prevalent technique used against companies, often delaying detection through increasingly complex practices. The Companyobjective of these attacks is often to acquire user account credentials in order to access other computer systems through linked accounts or where users have recycled passwords across systems.
Inadequate security practices or inadvertent acts or omissions by our employees and partners may also result in unauthorized access to our data. Employees or third parties may also intentionally compromise our or our customers’ security or systems. Such cybersecurity breaches, misuse of data or other disruptions could lead to loss of or unauthorized disclosure of our source code or other confidential information, unlicensed use and distribution of our products without compensation, illegal use of our products that could jeopardize the security of customer information stored in and transmitted through our computer systems, and theft, manipulation and destruction of proprietary data, resulting in defective products, performance downtimes and possible violation of export laws and other regulatory compliance requirements. Although we actively employ measures to combat such activities, preventing unauthorized access to our systems and data is inherently difficult. In addition, litigation to either pursue our legal rights or defend any claims against us could be costly and time-consuming and may divert management's attention and adversely affect the market's perception of us and our products.
We have experienced targeted and non-targeted cybersecurity attacks and incidents in the past that have resulted in unauthorized persons gaining access to our information and systems, and we could in the future experience similar attacks. To date, no cybersecurity incident or attack has been increasing itshad a material impact on our business, results of operations or financial condition.
A number of channel partners,our core processes, such as software development, sales and marketing, customer service and financial transactions, rely on IT infrastructure and applications. We also rely on third-party service providers and products, which are exposed to various security vulnerabilities outside of our control. Malicious software, sabotage and other cybersecurity breaches of the types discussed above could cause an outage of our infrastructure, which could cause short-term disruption in operations or, in the event of a longer disruption, lead to a substantial denial of service to our customers and ultimately to production downtime, recovery costs and customer claims for breach of contract, as well as reputational damage and impact to employee morale and productivity.
We rely on service providers for infrastructure and cloud-based products.
We use a number of third-party service providers for key components of our infrastructure, particularly with respect to development and delivery of our cloud-based products. The utilization of these service providers gives us greater flexibility in international locations. Theefficiently delivering a more tailored, scalable customer experience but also exposes us to additional risks and vulnerabilities. Those of our products and services that depend upon hosted components delivered by third parties are vulnerable to security risks inherent in web-based technologies, including greater risk of unauthorized access to or use of customers’ protected data. Interception of data transmission, misappropriation or modification of data, corruption of data and attacks by bad actors against our service providers may also adversely affect our products or product and service delivery. Malicious code, viruses or vulnerabilities that are undetected by our service providers may disrupt our business relationships with these channel partnersoperations generally and may have a disproportionate effect on those of our products that are recently establisheddeveloped and delivered in the cloud environment. These risks, though largely outside our control, may impact customer perception of our products, service and support, and may damage our brand. While we devote resources to maintaining the security and integrity of our products and systems, as well as ensuring adequate due diligence for our third-party service providers, cloud security and reliability is inherently challenging. In the event of a material breach of data hosted by our service providers or a serious security incident on behalf of, caused by or experienced by a service provider, we may experience significant operational and technical difficulties, loss of data including customer data, diminished competitive position or reputation, and loss of customer engagement, which could result in additional compliance burdens for the Company. These partners also havecivil liabilities and a less-established payment history with the Company andnegative impact to financial performance.
Financial Risks
Our revenue from these partners could come with a higher rate of bad debt expense.
During times of significant fluctuations in world currencies, certain channel partners may have solvency issuesis subject to the extent that effective hedge transactions are not employed or there is not sufficient working capital. In particular, if the U.S. Dollar strengthens relative to other currencies, certain channel partners who pay the Company in U.S. Dollars may have trouble paying the Company on time or may have trouble distributing the Company's productsincreased volatility due to the impactadoption of a new revenue recognition accounting standard on January 1, 2018.
In May 2014, the currency exchange fluctuationFinancial Accounting Standards Board (FASB) issued Accounting Standards Update No. 2014-09, Revenue from Contracts with Customers (Topic 606) (ASU 2014-09). We adopted ASU 2014-09 and its related amendments (collectively known as Accounting Standards Codification (ASC) 606) on such channel partner's cash flows. This may impactJanuary 1, 2018 which significantly impacted the Company's ability to distribute its products into certain regionstiming, allocation and markets,presentation of our lease license, perpetual license and may have an adverse effect on the Company's results of operations and cash flows.
Reliance on Perpetual Licenses. Although the Company has historically maintained stable recurringmaintenance revenue. Under previous revenue guidance, revenue was recognized ratably from the sale of software lease licenses and software maintenance subscriptions,subscriptions. However, under ASC 606, the license component of lease revenue is recognized up front. The post-contract support portion of lease license contracts continues to be recognized over the contract term, but it also has relied on sales ofis now allocated to maintenance and service revenue.
We continue to sell perpetual licenses that involve the payment of a single, up-frontupfront fee. Historically, these licenses have been more typical in the computer software industry and remain as the preferred licensing approach in certain markets. WhileThe revenue generated fromassociated with perpetual licenses continues to be recognized up front, consistent with prior revenue guidance.
The adoption of this revenue recognition guidance, coupled with our continued sales of perpetual licenses, creates the likelihood for software lease licenses and software maintenance subscriptions currently represents a portion of the Company's revenue, to the extent that perpetual license revenue continuesvolatility to represent a significant percentage of totalincrease across periods, particularly as compared to our results under the previous revenue the Company'srecognition standard. Our revenue in any period will depend significantly on sales contracts completed during that period. If customer purchasing patterns shift toward
Changes in existing financial accounting standards could adversely impact our financial results and operations.
Changes in existing accounting rules or practices, new accounting pronouncements, or varying interpretations of current accounting pronouncements could have a stronger preferencesignificant adverse effect on our results of operations or the manner in which we conduct our business.
In addition, we could incur significant costs for lease licenseschanges to our business systems, processes and fewer perpetual licenses,internal controls as a result of the Company has recently experienced, theretransition. These costs could behave a short-term,significant adverse impact on the Company's revenue and profitability.
Renewal Rates for Annual Lease and Maintenance Contracts. A substantial portion of the Company's license and maintenance revenue is derived from annual lease and maintenance contracts. These contracts are generally renewed on an annual basis and typically have a high rate of customer renewal. In addition to the recurring revenue base associated with these contracts, a majority of customers purchasing new perpetual licenses also purchase related annual maintenance contracts. If the rate of renewal for these contracts is adversely affected by economic or other factors, the Company's license and maintenance growth will be adversely affected over the term that the revenue for those contracts would have otherwise been recognized. As a result, the Company's business, financial position,our results of operations and cash flows mayflows. The transition could also be adversely impacted during those periods.
Risks Associated with Acquisitions. Historically,cause management to divert time from day-to-day operations, which could impact our business. If we are unable to successfully transition our business systems, processes and internal controls before the Company has consummated acquisitions in order to support the Company's long-term strategic direction, accelerate innovation, provide increased capabilities to existing products, supply new products and services, expand its customer base and enhance its distribution channels. The Company has completed a number of acquisitions in recent years and expects to make additional acquisitions in the future, but may not be able to identify suitable acquisition candidates or, if suitable candidates are identified, the Company may not be able to complete the business combination on commercially acceptable terms. The process of exploring and pursuing acquisition opportunities may result in devotion of significant management and financial resources.
Even if the Company is able to consummate acquisitions thatguidance effective date, it believes will be successful, such transactions present many risks including, among others, difficulty in integrating the management teams, strategies, cultures and operations of the companies; failing to achieve anticipated synergies and revenue increases; difficulty incorporating and integrating the acquired technologies or products with the Company's existing product lines; difficulty in coordinating, establishing or expanding sales, distribution and marketing functions, as necessary; difficulty in training the global sales team to sell the acquired products; failure to develop new products and services that utilize the technologies and resources of the companies; disruption of the Company's ongoing business and diversion of management's attention to transition or integration issues; unanticipated and unknown liabilities; the loss of key employees, customers, partners and channel partners of the Company or of the acquired
company, resulting in the loss of key information, expertise or know-how, and unanticipated additional recruitment and training costs; and difficulties implementing and maintaining sufficient controls, policies and procedures over the systems, products and processes of the acquired company. If the Company does not achieve the anticipated benefits of its acquisitions as rapidly or to the extent anticipated by the Company's management and financial or industry analysts, there could be a material adverse effect on the Company's stock price, business, financial position, results of operations and cash flows.
In addition, for companies acquired, limited experience will exist for several quarters following the acquisition relating to how the acquired company's sales pipelines will convert into sales or revenues, and the conversion rate post-acquisition may be quite different than the historical conversion rate. Because a substantial portion of the Company's sales are completed in the latter part of a quarter, and its cost structure is largely fixed in the short-term, revenue shortfalls may have a negative impact on the Company's profitability. A delay in a small number of large, new software license transactions could cause the Company's quarterly software license revenues to fall significantly short of its predictions.
The Company may periodically be involved in business combinations with enterprises that are developmental in nature. While these entities have leading-edge technology, they may not have developed direct or indirect distribution channels and may not have software revenues which cover the ongoing expenses. Therefore, the Company may have a decrease in operating margin and profitability while these types of acquisitions are integrated and the distribution channel incorporates the new product offerings.
Disruption of Operations or Infrastructure Failures. A significant portion of the Company's software development personnel, source code and computer equipment is located at operating facilities in the United States, Canada, India, Japan and throughout Europe. The occurrence of a natural disaster or other unforeseen catastrophe at any of these facilities could cause interruptions in the Company's operations, services and product development activities. Additionally, if the Company experiences problems that impair its business infrastructure, such as a computer virus, telephone system failure or an intentional disruption of its information technology systems by a third party, these interruptions could have a material adverse effect on the Company's business, financial position, results of operations, cash flows and theour ability to meet financial reporting deadlines. Further, becauseFor further information on the Company's sales are not generally linear during any quarterly period, the potential adverse effects resulting from anyimpact of the events described above or any other disruption of the Company's business could be accentuated if it occurs closerecently issued accounting guidance, see Note 2 to the endconsolidated financial statements included in Part IV, Item 15 of a fiscal quarter.this Annual Report on Form 10-K.
Risks Associated with Significant SalesChanges to Existing Customers. A significant portion of the Company's sales includes follow-on salestax laws, variable tax estimates and tax authority audits could impact our financial results and operations.
Our operations are subject to existing customers that investincome and transaction taxes in the Company's broad suite of engineering simulation softwareU.S. and services. If a significant number of current customers were to become dissatisfied with the Company's products and services, or choose to license or utilize competitive offerings, the Company's follow-on sales, and recurring lease and maintenance revenues, could be materially, adversely impacted, resulting in reduced revenue, operating margins, net income and cash flows.
Industry Consolidation. Consolidation in industries that utilize the Company’s software may result in combined workforces
where economies of scale and synergies are achieved, and fewer ANSYS software licenses are required. Consolidation may
also resultmultiple foreign jurisdictions. A change in the newly combined/surviving entity wantingtax law in the most favorable pricing fromjurisdictions in which we do business, including an increase in tax rates, an adverse change in the former contracts and expecting
larger volume discounts on future purchases. Iftreatment of an item of income or expense, or a customer is acquired by an entity that does not utilize ANSYSdecrease in favor oftax rates in a competing product, the Company may notjurisdiction in which we have future orders from the enterprise. Further, consolidation of the Company's competitors may result in synergies that allow those competitors to benefit from broader sales channels and increased access to capital. Any of these impactssignificant deferred tax assets, could adversely affect the Company's business, financial position, results of operations and cash flows.
Periodic Reorganization of Sales Force. The Company relies heavily on its direct sales force. From time to time, the Company reorganizes and makes adjustments to its sales leadership and/or its sales force in response to such factors as management changes, performance issues, market opportunities and other considerations. These changes may result in a temporary lack of sales production and may adversely impact revenuematerial increase in future quarters. There can be no assurance that the Company will not restructure its sales force in future periods or that the transition issues associated with such a restructuring will not occur.
Income Tax Estimates. The Company makes significant estimates in determining its worldwide income tax provision. These estimates involve complex tax regulations in a number of jurisdictions across the Company's global operations and are subject to many transactions and calculations in which the ultimate tax outcome is uncertain. The final outcome of tax matters could be different than the estimates reflected in the historical income tax provision and related accruals. Such differences couldexpense. Furthermore, we have a material impact on income tax expense and net income in the periods in which such determinations are made.
The amount of income tax paid by the Company is subject to ongoing audits by federal, state and foreign tax authorities. These audits can result in additional assessments, including interest and penalties. The Company's estimate for liabilities associated with uncertain tax positions is highly judgmental and actual future outcomes may result in favorable or unfavorable adjustments to the Company's estimated tax liabilities, including estimates for uncertain tax positions, in the period the
assessments are made or resolved, audits are closed or when statutes of limitation on potential assessments expire. As a result, the Company's effective tax rate may fluctuate significantly on a quarterly or annual basis.
The Company allocates a portion of its purchase price to goodwill and intangible assets. Impairment charges associated with goodwill are generally not tax-deductible and will result in an increased effective income tax rate in the period the impairment is recorded. The Company has recorded significant deferred tax liabilities related to acquired intangible assets that are not deductible for tax purposes. These deferred tax liabilities are based on future statutory tax rates in the locations in which the intangible assets are recorded. Any future changes in statutory tax rates would be recorded as an adjustment to the deferred tax liabilities in the period the change is announced and could have a material impact on the Company'sour effective tax rate during that period.
Regulatory Compliance. Like all other public companies,We also make significant estimates in determining our worldwide income tax provision. These estimates involve complex tax regulations in many jurisdictions and are subject to many transactions and calculations in which the Companyultimate tax outcome is uncertain. The outcome of tax matters could be different than the estimates reflected in the historical income tax provision and related accruals. Such differences could have a material impact on income tax expense and net income in the periods in which such determinations are made.
The amount of income tax we pay is subject to ongoing audits by federal, state and foreign tax authorities. These audits can result in additional assessments, including interest and penalties. Our estimates for liabilities associated with uncertain tax positions is highly judgmental and actual future outcomes may result in favorable or unfavorable adjustments to our estimated tax liabilities, including estimates for uncertain tax positions, in the rulesperiod the assessments are made or resolved, audits are closed or when statutes of limitation on potential assessments expire. As a result, our effective tax rate may fluctuate significantly on a quarterly or annual basis.
Our indebtedness could adversely affect our business, financial condition and regulationsresults of operations.
In connection with our acquisition of LST, we borrowed $500.0 million under a term loan facility which matures on November 1, 2024. We also have access to a $500.0 million revolving credit facility, which includes a $50.0 million sublimit for the issuance of letters of credit. The credit agreement governing these loans contains customary representations and warranties, affirmative and negative covenants and events of default. The credit agreement also contains a financial covenant requiring us
to maintain a consolidated leverage ratio of indebtedness to earnings before interest, taxes, depreciation and amortization not exceeding 3.50 to 1.00 as of the SEC, including those that requireend of any fiscal quarter (for the Companyfour-quarter period ending on such date) with an opportunity for a temporary increase in such consolidated leverage ratio to report on and receive an attestation from its independent registered public accounting firm regarding4.00 to 1.00 upon the Company's internal control over financial reporting. Compliance with these requirements causesconsummation of certain qualified acquisitions for which the Companyaggregate consideration is at least $250.0 million.
Notwithstanding the limits contained in the credit agreement governing our credit facility, we may be able to incur substantial additional expensesdebt from time to time to finance working capital, capital expenditures, share repurchases, investments or acquisitions, or for other purposes. If we do so, the risks related to our level of debt could intensify. Specifically, our level of debt could:
make it more difficult for us to satisfy our debt obligations and causes management to divert time from the day-to-day operationsother ongoing business obligations, which may result in defaults;
result in an event of the Company. While the Company anticipates being able to fully comply with these requirements,default if it is not ablewe fail to comply with the reportingfinancial and other covenants contained in the agreement governing our debt, which could result in all of our debt becoming immediately due and payable or attestation requirements relatingrequire us to internal control overnegotiate an amendment to financial reporting,or other covenants that could cause us to incur additional fees and expenses;
limit our ability to obtain additional financing to fund future working capital, capital expenditures, acquisitions or other general corporate requirements;
reduce the Company may be subjectavailability of our cash flow to sanctions byfund working capital, capital expenditures, acquisitions and other general corporate purposes;
increase our vulnerability to the SECimpact of adverse economic and industry conditions;
expose us to the risk of increased interest rates as certain of our borrowings, including borrowings under the credit facility, are at variable rates of interest;
limit our flexibility in planning for, or NASDAQ. Such sanctions could divertreacting to, and increasing our vulnerability to, changes in our business, the attentionindustries in which we operate, and the overall economy;
place us at a competitive disadvantage compared to other, less leveraged competitors; and
increase our cost of borrowing.
Any of the Company's management from implementing its business plan andabove-listed factors could have an adverse effect on the Company's business and results of operations.
As the Company's stock is listed on the NASDAQ Global Select Market, the Company is subject to the ongoing financial and corporate governance requirements of NASDAQ. While the Company anticipates being able to fully comply with these requirements, if it is not able to comply, the Company's name may be published on NASDAQ's daily Non-Compliant Companies list until NASDAQ determines that it has regained compliance or the Company no longer trades on NASDAQ. If the Company were unable to return to compliance with the governance requirements of NASDAQ, the Company may be delisted from the NASDAQ Global Select Market, which could have an adverse effect on the market value of the Company's equity securities and the ability to raise additional capital.
Governmental Revenue Sources. The Company's sales to the United States government must comply with Federal Acquisition Regulations. Failure to comply with these regulations could result in penalties being assessed against the Company or an order preventing the Company from making future sales to the United States government. Further, the Company's international activities must comply with the export control laws of the United States and other countries, the Foreign Corrupt Practices Act, the United Kingdom Bribery Act of 2010 and a variety of other laws and regulations of the United States and other countries in which the Company operates. Failure to comply with any of these laws and regulations could adversely affect the Company'sour business, financial position,condition and results of operations and cash flows.
In certain circumstances, the United States government, state and local governments and their respective agencies, and certain foreign governments may have the right to terminate contractual arrangements at any time, without cause. The United States, European Union and certain other government contracts, as well as the Company's state and local level contracts, are subject to the approval of appropriations or funding authorizations. Certain of these contracts permit the imposition of various civil and criminal penalties and administrative sanctions, including, but not limited to, termination of contracts, refund of a portion of fees received, forfeiture of profits, suspension of payments, fines and suspensions or debarment from future government business, any of which could have an adverse effect on the Company's results of operations and cash flows.
Contingencies. The Company is subject to various investigations, claims and legal proceedings that arise in the ordinary course of business, including commercial disputes, labor and employment matters, tax audits, alleged infringement of intellectual property rights and other matters. Each of these matters is subject to various uncertainties, and it is possible that an unfavorable resolution of one or more of these matters could materially affect the Company's results of operations, cash flows and financial position.
Changes in Existing Financial Accounting Standards. Changes in existing accounting rules or practices, new accounting pronouncements, or varying interpretations of current accounting pronouncements could have a significant adverse effect on the Company's results of operations or the manner in which the Company conducts its business.
In addition, the Company could incur significant costs for changes to its business systems, processes and internal controls as a result of the transition. These costs could have a significant adverse impact on the Company's results of operations and cash flows. The transition could also cause management to divert time from the day-to-day operations of the Company, which could impact the Company's business. If the Company is unable to successfully transition its business systems, processes and internal controls before the guidance effective date, it could impact theour ability to meet our payment obligations under our debt agreements.
Furthermore, borrowings under the credit agreement use the London Interbank Offering Rate (LIBOR) as a benchmark for establishing the interest rate. LIBOR has been the subject of recent national, international and other regulatory guidance and proposals for reform, and the financial reporting deadlines. For further information onindustry is currently transitioning away from LIBOR as a benchmark for the impactinterbank lending market. The consequences of recently issued accounting guidance on the Company, see Note 2 to the consolidated financial statements included in Part IV, Item 15 of this Annual Report on Form 10-K.
Of particular importance to the Company's business, the Financial Accounting Standards Board (FASB) issued Accounting Standards Update No. 2014-09, Revenue from Contracts with Customers (Topic 606), effective for annual periods beginning after December 15, 2017, whichsupersedes most current revenue recognition guidance, including industry-specific guidance. This update is expected to affect the timing and amounts of revenue recognized, whichthese developments cannot be entirely predicted but could have an adverse impact on the Company's revenue and results of operations. The Company could also incur significant costs for implementing the new guidance, including costs to change internal controls, systems, processes and customer contracts. Efforts to implement the guidance by the effective date could divert management's attention from other aspects of the business, which could have a significant adverse impact on the Company's results of operations, cash flows and financial position.
Changes in Tax Law. The Company's operations are subject to income and transaction taxes in the United States and in multiple foreign jurisdictions. A change in the tax law in the jurisdictions in which the Company does business, includinginclude an increase in tax rates, an adverse change in the treatmentcost of an item of income or expense, or a decrease in tax rates in a jurisdiction in which the Company has significant deferred tax assets, could result in a material increase in tax expense. Currently, a substantial portion of the Company's revenue is generated from customers located outside the United States, and a substantial portion of assets are located outside the United States. United States income taxes and foreign withholding taxes have not been provided on undistributed earnings for non-United States subsidiaries to the extent such earnings are considered to be indefinitely reinvested in the operations of those subsidiaries. Changes in existing taxation rules or practices, new taxation rules, or varying interpretations of current taxation practices could have a material adverse effect on the Company's results of operations or the manner in which the Company conducts its business.our variable rate indebtedness.
The Company has significant operations in India. There have been court rulings concerning certain Indian tax laws that have been inconsistent with tax positions taken by the Company and inconsistent with the advice provided to the Company by its tax advisors.
An Indian subsidiary of the Company has several service tax audits pending that have resulted in formal inquiries being received on transactions through mid-2012. The Company could incur tax charges and related liabilities, including those related to the service tax audit case, of approximately $7 million. The service tax issues raised in the Company’s notices and inquiries are very similar to the case, M/s Microsoft Corporation (I) (P) Ltd. Vs Commissioner of Service Tax, New Delhi, wherein the Delhi Customs, Excise and Service Tax Appellate Tribunal (CESTAT) has passed a favorable ruling to Microsoft. The Company can provide no assurances on whether the Microsoft case’s favorable ruling will be challenged in higher courts or on the impact that the present Microsoft case’s decision will have on the Company’s cases. The Company is uncertain as to when these service tax matters will be concluded.
Other court cases are pending in India that could have a material impact on the Company's financial position, results of operations and cash flows if the ultimate outcome of those cases is similarly inconsistent with tax positions taken by the Company.
A French subsidiary of the Company received notice that the French taxing authority rejected the Company's 2012 research and development credit. The Company has contested the decision. However, if the Company does not receive a favorable outcome, it could incur charges of approximately $0.8 million. In addition, an unfavorable outcome could result in the authorities reviewing or rejecting $3.8 million of similar research and development credits for 2013 through the current year that are currently reflected as an asset. The Company can provide no assurances on the timing or outcome of this matter.
| |
| ITEM 1B. | UNRESOLVED STAFF COMMENTS |
The Company has received no written comments regarding our periodic or current reports from the staff of the SEC that were issued 180 days or more preceding the end of our fiscal year 2016 and that remain unresolved.None.
The Company'sOur executive offices and those related to certain domestic product development, marketing, production and administration are located in a LEED certified, 186,000 square foot office facility in Canonsburg, Pennsylvania. The lease for this facility was effective as of September 14, 2012. The term of the lease is 183 months, beginning2012 and expires on October 1, 2014.December 31, 2029, excluding any renewal or termination options.
The Company owns:We own: a 65,00070,000 square foot office facility in Lebanon, New Hampshire; a 62,000 square foot office building near itsour current Canonsburg headquarters; and a 59,000 square foot facility in Pune, India.India; a 40,000 square foot campus in Livermore, California; and a 5,000 square foot facility in Apex, North Carolina.
The Company and its subsidiariesWe also lease office space in various locations throughout the world. The Company ownsWe own substantially all equipment used in itsour facilities. Management believes that, in most geographic locations, itsour facilities allow for sufficient space to support present and future
foreseeable needs, including such expansion and growth as the business may require. In other geographic locations, the Company expectswe expect that itwe will be required to expand capacity beyond that which itwe currently ownsown or leases.lease.
The Company'sOur properties and equipment are in good operating condition and are adequate for the Company'sour current needs. The Company doesWe do not anticipate difficulty in renewing existing leases as they expire or in finding alternative facilities.
The Company isWe are subject to various investigations, claims and legal proceedings that arise in the ordinary course of business, including commercial disputes, labor and employment matters, tax audits, alleged infringement of intellectual property rights and other matters. In theour opinion, of the Company, the resolution of pending matters is not expected to have a material adverse effect on the Company'sour consolidated results of operations, cash flows or financial position. However, each of these matters is subject to various uncertainties and it is possible that an unfavorable resolution of one or more of these proceedings could in the future, materially affect the Company'sour results of operations, cash flows or financial position.
| |
| ITEM 4. | MINE SAFETY DISCLOSURES |
Not applicable.
PART II
| |
| ITEM 5. | MARKET FOR REGISTRANT'S COMMON EQUITY, RELATED STOCKHOLDER MATTERS AND ISSUER PURCHASES OF EQUITY SECURITIES |
The Company'sOur common stock trades on the NASDAQNasdaq Global Select Market tier of the NASDAQNasdaq Stock Market under the symbol: "ANSS". The following table sets forth the low and high sale prices of the Company's common stock in each of the Company's last eight fiscal quarters:
|
| | | | | | | | | | | | | | | | |
| | | Fiscal Quarter Ended 2016 | | Fiscal Quarter Ended 2015 |
| | | Low Sale Price | | High Sale Price | | Low Sale Price | | High Sale Price |
| December 31 | | $ | 82.28 |
| | $ | 96.21 |
| | $ | 85.33 |
| | $ | 98.39 |
|
| September 30 | | $ | 88.30 |
| | $ | 98.99 |
| | $ | 84.90 |
| | $ | 97.59 |
|
| June 30 | | $ | 81.41 |
| | $ | 92.48 |
| | $ | 84.09 |
| | $ | 92.46 |
|
| March 31 | | $ | 80.51 |
| | $ | 91.62 |
| | $ | 78.76 |
| | $ | 88.96 |
|
On February 14, 2017,2020, there were 151126 stockholders of record and 63,151 beneficial holders of the Company's common stock.record.
The Company hasWe have not historically paid cash dividends on itsour common stock as it haswe have retained earnings primarily for acquisitions, for future business opportunities, to make payments on outstanding debt balances and to repurchase stock when authorized by the Board of Directors and when such repurchase meets the Company'sour objectives. The Company reviews itsWe review our policy with respect to the payment of dividends from time to time; however, there can be no assurance that any dividends will be paid in the future.
Performance Graph
Set forth below is a line graph comparing the yearly percentage change in the cumulative total stockholder return on the Company'sof our common stock, based on the market price per share of the Company'sour common stock, with the total return of companies included within the Russell 1000 Index, the NASDAQNasdaq Composite Stock Market Index, the S&P 500 Stock Index, a new industry peer group of seven companies (Autodesk, Inc., PTC Inc., Cadence Design Systems, Inc., Synopsys, Inc., Altair Engineering Inc., Aspen Technology, Inc. and Dassault Systemes SE) and an old industry peer group of four companies (Autodesk, Inc., PTC Inc., Cadence Design Systems, Inc. and Synopsys, Inc.) selected by the Company pursuant to Item 201(e) of Regulation S-K,, for the period commencing January 1, 2012December 31, 2014 and ending December 31, 2016.2019. The calculation of total cumulative returns assumes a $100 investment in the Company'sour common stock, the Russell 1000 Index, the NASDAQNasdaq Composite Stock Market Index, the S&P 500 Stock Index, the new peer group and the old peer group on January 1, 2012,December 31, 2014, and the reinvestment of all dividends, and accounts for all stock splits. The historical information set forth below is not necessarily indicative of future performance.
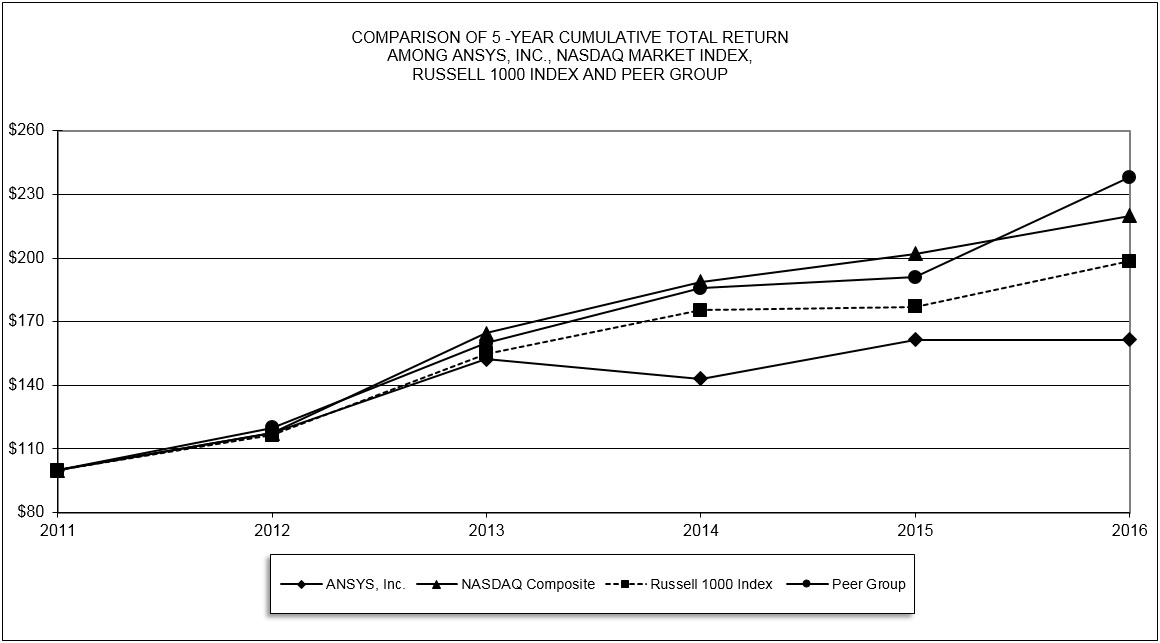
ASSUMES $100 INVESTED ON JANUARY 1, 2012DECEMBER 31, 2014
ASSUMES DIVIDENDS REINVESTED
FIVE FISCAL YEARS ENDINGENDED DECEMBER 31, 2016
Equity Compensation Plan Information as of December 31, 20162019
|
| | | | | | | | | | |
| | | (a) | | (b) | | (c) |
| Plan Category | | Number of Securities to be Issued Upon Exercise of Outstanding Options, Warrants and Rights | | Weighted Average Exercise Price of Outstanding Options, Warrants and Rights | | Number of Securities Remaining Available for Future Issuance Under Equity Compensation Plans (excluding securities reflected in column (a)) |
| Equity Compensation Plans Approved by Security Holders | | | | | | |
| 1996 Stock Option and Grant Plan | | 2,900,006 |
| | $ | 58.54 |
| | 10,134,170(3) |
|
| Ansoft Corporation 2006 Stock Incentive Plan | | 150,675 |
| | $ | 35.77 |
| | — |
|
| Apache Design Solutions, Inc. 2001 Stock/Option Issuance Plan | | 71,229 |
| | $ | 19.27 |
| | — |
|
| SpaceClaim Corporation 2005 Stock Incentive Plan | | 7,698 |
| | $ | 23.75 |
| | — |
|
| Gear Design Solutions, Inc. Stock Incentive Plan | | 6,328 |
| | $ | 12.26 |
| | — |
|
| 1996 Employee Stock Purchase Plan | | (1) | | (2) | | 350,772 |
|
| Equity Compensation Plans Not Approved by Security Holders | | | | | | |
| None | | | | | | |
| Total | | 3,135,936 |
| | | | 10,484,942 |
|
|
| | | | | | | | | | | |
| | As of December 31, |
| | 2014 | | 2015 | | 2016 | | 2017 | | 2018 | | 2019 |
| ANSYS, Inc. | $100 | | $113 | | $113 | | $180 | | $174 | | $314 |
| Nasdaq Composite | $100 | | $107 | | $116 | | $151 | | $147 | | $200 |
| S&P 500 Stock Index | $100 | | $101 | | $114 | | $138 | | $132 | | $174 |
New Peer Group(1) | $100 | | $103 | | $119 | | $169 | | $193 | | $273 |
| Old Peer Group | $100 | | $103 | | $128 | | $187 | | $214 | | $305 |
| |
(1) | The number of shares issuable with respect to the current offering period is not determinable until the end of the period. |
| |
(2) | The per share purchase price of shares issuable with respect to the current offering period is not determinable until the end of the period. |
| |
(3) | The number of securities remaining available for future issuance assumes attainment of 100% for awards with a performance condition or a market condition. |
(1) The new peer group is inclusive of the old peer group plus three companies added in 2019 (Altair Engineering Inc., Aspen Technology, Inc. and Dassault Systemes SE). The companies were added to enhance the comparability of the peer group to our size and business.
Unregistered Sale of Equity Securities and Use of Proceeds
None.
Issuer Purchases of Equity Securities
|
| | | | | | | | | | | | | |
| Period | | Total Number of Shares Purchased | | Average Price Paid per Share | | Total Number of Shares Purchased as Part of Publicly Announced Plans or Programs | | Maximum Number of Shares that May Yet Be Purchased Under Plans or Programs(1) |
| October 1 - October 31, 2016 | | — |
| | $ | — |
| | — |
| | 2,300,000 |
|
| November 1 - November 30, 2016 | | 640,331 |
| | $ | 92.62 |
| | 640,331 |
| | 1,659,669 |
|
| December 1 - December 31, 2016 | | 359,669 |
| | $ | 93.80 |
| | 359,669 |
| | 1,300,000 |
|
| Total | | 1,000,000 |
| | $ | 93.05 |
| | 1,000,000 |
| | 1,300,000 |
|
(1) The Company initially announced its stock repurchase program in February 2000, and subsequently announced various amendments to the program. The most recent amendment to the program, authorizing the repurchase of up to 5,000,000 shares, was approved by the Company's Board of Directors in February 2017. There is no expiration date to this amendment.
| |
| ITEM 6. | SELECTED FINANCIAL DATA |
The following table sets forth selected financial data as of and for the year ended December 31 for each of the last five years. This selected financial data should be read in conjunction with the consolidated financial statements and related notes included in Part IV, Item 15 of this Annual Report on Form 10-K.
| | | | | Year Ended December 31, | | Year Ended December 31, |
| (in thousands, except per share data) | | 2016 | | 2015 | | 2014 | | 2013 | | 2012 | | 2019(1) | | 2018(2) | | 2017 | | 2016 | | 2015 |
| Total revenue | | $ | 988,465 |
| | $ | 942,753 |
| | $ | 936,021 |
| | $ | 861,260 |
| | $ | 798,018 |
| | $ | 1,515,892 |
| | $ | 1,293,636 |
| | $ | 1,095,250 |
| | $ | 988,465 |
| | $ | 942,753 |
|
| Operating income | | 376,242 |
| | 353,679 |
| | 347,450 |
| | 321,863 |
| | 294,253 |
| | 515,040 |
| | 476,574 |
| | 390,728 |
| | 376,242 |
| | 353,679 |
|
| Net income | | 265,636 |
| | 252,521 |
| | 254,690 |
| | 245,327 |
| | 203,483 |
| | 451,295 |
| | 419,375 |
| | 259,251 |
| | 265,636 |
| | 252,521 |
|
| Earnings per share – basic | | $ | 3.05 |
| | $ | 2.82 |
| | $ | 2.77 |
| | $ | 2.65 |
| | $ | 2.20 |
| | $ | 5.36 |
| | $ | 4.99 |
| | $ | 3.05 |
| | $ | 3.05 |
| | $ | 2.82 |
|
| Weighted average shares – basic | | 87,227 |
| | 89,561 |
| | 92,067 |
| | 92,691 |
| | 92,622 |
| | 84,259 |
| | 83,973 |
| | 84,988 |
| | 87,227 |
| | 89,561 |
|
| Earnings per share – diluted | | $ | 2.99 |
| | $ | 2.76 |
| | $ | 2.70 |
| | $ | 2.58 |
| | $ | 2.14 |
| | $ | 5.25 |
| | $ | 4.88 |
| | $ | 2.98 |
| | $ | 2.99 |
| | $ | 2.76 |
|
| Weighted average shares – diluted | | 88,969 |
| | 91,502 |
| | 94,194 |
| | 95,139 |
| | 94,954 |
| | 85,925 |
| | 85,913 |
| | 86,854 |
| | 88,969 |
| | 91,502 |
|
| Total assets | | $ | 2,800,526 |
| | $ | 2,729,904 |
| | $ | 2,752,879 |
| | $ | 2,702,097 |
| | $ | 2,589,641 |
| | $ | 4,838,887 |
| | $ | 3,265,964 |
| | $ | 2,941,623 |
| | $ | 2,800,526 |
| | $ | 2,729,904 |
|
| Working capital | | 630,301 |
| | 592,280 |
| | 617,240 |
| | 601,183 |
| | 414,043 |
| | 860,340 |
| | 786,410 |
| | 661,713 |
| | 630,301 |
| | 592,280 |
|
| Long-term liabilities | | 53,021 |
| | 51,331 |
| | 70,303 |
| | 125,469 |
| | 173,372 |
| | 690,368 |
| | 91,650 |
| | 87,239 |
| | 53,021 |
| | 51,331 |
|
| Stockholders' equity | | 2,208,405 |
| | 2,194,427 |
| | 2,217,501 |
| | 2,136,246 |
| | 1,940,291 |
| | 3,453,379 |
| | 2,649,547 |
| | 2,245,831 |
| | 2,208,405 |
| | 2,194,427 |
|
Cash provided by operating activities | | 356,827 |
| | 367,523 |
| | 385,307 |
| | 332,983 |
| | 298,415 |
| | 499,936 |
| | 484,988 |
| | 427,660 |
| | 365,980 |
| | 375,699 |
|
(1)Effective January 1, 2019, we adopted new guidance on leases. We elected to adopt the change in accounting principle using the modified retrospective approach. Results for reporting periods beginning after January 1, 2019 are presented under the new guidance, while prior period amounts are not adjusted and continue to be reported in accordance with previous guidance (ASC 840). For further information, see Note 2 to the consolidated financial statements included in Part IV, Item 15 of this Annual Report on Form 10-K.
(2)Effective January 1, 2018, we adopted new guidance on revenue recognition. We elected to adopt the change in accounting principle using the modified retrospective approach. Results for reporting periods beginning after January 1, 2018 are presented under the new guidance, while prior period amounts are not adjusted and continue to be reported in accordance with previous guidance. For further information, see Note 3 to the consolidated financial statements included in Part IV, Item 15 of this Annual Report on Form 10-K.
(3)During fiscal year 2019, we retrospectively adopted new guidance on the accounting for costs incurred to implement a cloud computing arrangement (CCA) that is a service arrangement. As a result of the adoption, operating cash flows decreased with a corresponding increase to investing cash flows by $2.5 million, $1.4 million and $2.8 million for the years ending December 31, 2019, 2018 and 2017, respectively. The adoption had no impact on our consolidated balance sheets or consolidated statements of income. Fiscal years 2016 and 2015 have not been restated in the table above. For further information, see Note 2 to the consolidated financial statements included in Part IV, Item 15 of this Annual Report on Form 10-K.
In the table above, the comparability of information among the years presented is impacted by the Company'sour acquisitions. The operating results of the Company'sour acquisitions have been included in the results of operations since their respective acquisition dates. For further information, see the “Acquisitions” section of Management's Discussion and Analysis of Financial Condition and Results of Operations in Item 7 and Note 34 to the consolidated financial statements included in Part IV, Item 15 of this Annual Report on Form 10-K.
| |
| ITEM 7. | MANAGEMENT'S DISCUSSION AND ANALYSIS OF FINANCIAL CONDITION AND RESULTS OF OPERATIONS |
Overview
The Company'sOverall GAAP and Non-GAAP Results
Our growth rates of GAAP and non-GAAP results for the year ended December 31, 2016 reflect growth in revenue of 4.8%, operating income of 6.4% and diluted earnings per share of 8.3%2019 as compared to the year ended December 31, 2015. The Company2018 were as follows:
|
| | | | | |
| | Year Ended December 31, 2019 |
| | GAAP | | Non-GAAP |
| Revenue | 17.2 | % | | 17.3 | % |
| Operating income | 8.1 | % | | 12.0 | % |
| Diluted earnings per share | 7.6 | % | | 10.0 | % |
We experienced higher revenue in 2016 due toduring the year ended December 31, 2019 from double-digit growth in lease licenselicenses, maintenance and maintenance revenue,service, partially offsetdriven by decreased perpetual license revenue. The Companycontributions from our recent acquisitions. We also experienced increased operating expenses primarily due to increased personnel costs. Reductions in amortization expensecosts, higher stock-based compensation and additional operating expenses related to acquisitions, partially offset these cost increases.by a reduction in expenses due to a stronger U.S. Dollar.
The Company's non-GAAP results for the year ended December 31, 2016 reflect growth in revenue of 4.7%, operating income of 3.6% and diluted earnings per share of 6.1% as compared to the year ended December 31, 2015. The non-GAAP results exclude the income statement effects of the acquisition accounting adjustmentadjustments to deferred revenue, stock-based compensation, acquisition-related amortization of acquired intangible assets, restructuring charges and transaction costs related to business combinations.combinations, and adjustments related to the transition tax associated with the Tax Cuts and Jobs Act. For further disclosure regarding non-GAAP results, see the section titled “Non-GAAP Results”"Non-GAAP Results" immediately preceding the section titled “Liquidity"Liquidity and Capital Resources”.Resources."
The Company incurred $3.4 million in restructuring charges, or $2.4 million netImpact of tax, during the year ended December 31, 2016. The Company expects to incur additional charges of $10 million - $15 million, or $7 million - $10 million net of tax, primarily during the first quarter of 2017. These charges are excluded from the Company's non-GAAP results.Foreign Currency
The Company'sOur comparative financial results were impacted by fluctuations in the U.S. Dollar during the year ended December 31, 20162019 as compared to the year ended December 31, 2015.2018. The impacts on the Company'sour revenue and operating income due to currency fluctuations are reflected in the table below.
The amounts in the table represent the difference between the actual 2016 results and the same results calculated at the 2015 exchange rates. Amounts in brackets indicate a netan adverse impact from currency fluctuations.
| | | | Twelve Months Ended December 31, 2016 | Year Ended December 31, 2019 |
| (in thousands) | GAAP | | Non-GAAP | GAAP | | Non-GAAP |
| Revenue | $ | (2,247 | ) | | $ | (2,247 | ) | $ | (24,008 | ) | | $ | (24,235 | ) |
| Operating income | $ | 923 |
| | $ | 1,016 |
| $ | (10,213 | ) | | $ | (11,062 | ) |
In constant currency,(1), the Company's our growth rates were as follows:
| | | | Twelve Months Ended December 31, 2016 | Year Ended December 31, 2019 |
| | GAAP | | Non-GAAP | GAAP | | Non-GAAP |
| Revenue | 5.1 | % | | 4.9 | % | 19.0 | % | | 19.2 | % |
| Operating income | 6.1 | % | | 3.3 | % | 10.2 | % | | 13.8 | % |
(1) Constant currency amounts exclude the effecteffects of foreign currency fluctuations on the reported results. To present this information, the 2019 results for 2016 for entities whose functional currency is a currency other than the U.S. Dollar were converted to U.S. Dollars at rates that were in effect for 2015,the 2018 comparable period, rather than the actual exchange rates in effect for 2016.2019. Constant currency growth rates are calculated by adjusting the 2019 reported revenue and operating income amounts by the 2019 currency fluctuation impacts and comparing to the 2018 comparable period reported revenue and operating income amounts.
The Company'sOther Financial Information
Our financial position includes $822.9$872.4 million in cash and short-term investments, and working capital of $630.3$860.3 million as of December 31, 2016.2019.
During the year ended December 31, 2016, the Company2019, we repurchased 3.70.3 million shares for $336.3$59.1 million at an average price of $90.90$179.41 per share under the Company'sour stock repurchase program.
Business
On August 29, 2016, the Board of Directors (the “Board”) of the Company appointed Dr. Ajei S. Gopal,Ansys, a member of the Board, as President and Chief Operating Officer of the Company, effective as of such date. In addition, effective as of January 1, 2017, Dr. Gopal assumed the role of Chief Executive Officer of the Company and Mr. James E. Cashman III, who was the Chief Executive Officer of the Company as of December 31, 2016, became Chairman of the Board. In connection therewith, Ronald W. Hovsepian, the Chairman of the Board as of December 31, 2016, became the Board’s Lead Independent Director.
ANSYSDelaware corporation formed in 1994, develops and globally markets engineering simulation software and services widely used by engineers, designers, researchers and students across a broad spectrum of industries and academia, including aerospace and defense, automotive, industrial equipment, electronics, biomedical,semiconductors, energy, materials and chemical processing, turbomachinery, consumer products, healthcare, and semiconductors.sports. Headquartered south of Pittsburgh, Pennsylvania, the Companywe employed approximately 2,8004,100 people as of December 31, 2016. ANSYS focuses2019. We focus on the development of open and flexible solutions that enable users to analyze designs directly on the desktop, providing a common platform for fast, efficient and cost-conscious product development, from design concept to final-stage testing and validation. The Company distributes itsWe distribute our suite of simulation technologies through a global network of independent resellers and distributors (collectively, channel partnerspartners) and direct sales offices in strategic, global locations. It is the Company'sour intention to continue to maintain this hybrid sales and distribution model.
The Company licenses itsWe license our technology to businesses, educational institutions and governmental agencies. Growth in the Company'sour revenue is affected by the strength of global economies, general business conditions, currency exchange rate fluctuations, customer budgetary constraints and the competitive position of the Company'sour products. Please see Part I. Item 1A. Risk Factorsof this Annual Report on Form 10-K for a complete discussion of factors that might impact the Company'sour financial condition and operating results. The Company believesWe believe that the features, functionality and integrated multiphysics capabilities of itsour software products are as strong as they have ever been. However, the software business is generally characterized by long sales cycles. These long sales cycles increase the difficulty of predicting sales for any particular quarter. The Company makesWe make many operational and strategic decisions based upon short- and long-term sales forecasts that are impacted not only by these long sales cycles, but also by current global economic conditions. As a result, the Company believeswe believe that itsour overall performance is best measured by fiscal year results rather than by quarterly results. Please see the sub-section entitled "Sales Forecasts""Financial Risks" under Part I. Item 1A. Risk Factorsof this Annual Report on Form 10-K for a completeadditional discussion of the potential impact of the Company'sour sales forecasts on the Company'sour financial condition, cash flows and operating results.
The Company's managementManagement considers the competition and price pressure that it faces in the short- and long-term by focusing on expanding the breadth, depth, ease of use and quality of the technologies, features, functionality and integrated multiphysics capabilities of itsour software products as compared to itsour competitors; investing in research and development to develop new and innovative products and increase the capabilities of itsour existing products; supplying new products and services; focusing on customer needs, training, consulting and support; and enhancing itsour distribution channels. From time to time, the CompanyWe also considersconsider acquisitions to supplement itsour global engineering talent, product offerings and distribution channels.
Geographic Trends
The following table presents the Company'sour geographic constant currency revenue growth during the year ended December 31, 20162019 as compared to the year ended December 31, 2015:2018:
|
| | |
| | Twelve MonthsYear Ended December 31, 20162019 |
North AmericaAmericas | 3.725.4 | % |
| Europe, Middle East and Africa (EMEA) | 2.913.8 | % |
| Asia-Pacific | 9.015.6 | % |
| Total | 5.119.0 | % |
In North America, results were impacted by a combination of factors, including a partial shift in the preference for time-based licenses. Aerospace and defense performed well due to a robust commercial sector, loosening defense spending and the aggressive space race. Automotive companies continued to invest in research and development to support ongoing fuel economy, emissions requirements and accelerated development of autonomous driving systems. The renewable energy and nuclear sectors remained strong, but were offset by the negative impact of the oil and gas sector.
The Company continuesWe continue to focus on a number of sales improvement activities across the geographic regions, including sales hiring, pipeline building, productivity initiatives and customer engagement activities.
Note About Forward-Looking Statements
The following discussion shouldAs trade tensions between the U.S. and China continue, as well as the uncertainty around China's ability to control the coronavirus outbreak, our ability to sell and ship our products to certain customers and our ability to collect against existing trade receivables may be read in conjunction with the audited consolidatedfurther restricted and could have an adverse effect on our business, results of operations or financial statements and notes thereto included elsewhere incondition. For additional details, refer to Part I. Item 1A. of this Annual Report on Form 10-K.
Industry Commentary:
Our three largest industries — high-tech, automotive, and aerospace and defense (A&D) — remained strong throughout 2019. The Company's discussionhigh-tech industry was positively impacted by companies' investments in 5G and analysissmart connected products. The automotive industry continued its momentum due to continued investments by our customers to capture the disruptive mobility trends of its financial conditionautonomy and results of operations are based upon the Company's consolidated financial statements, which have been prepared in accordance with accounting principles generally accepted in the United States of America ("GAAP"). The preparation of these financial statements requires the Companyelectrification. Defense spending continued to make estimates and judgments that affect the reported amounts of assets, liabilities, revenues and expenses, and related disclosure of contingent assets and liabilities. On an ongoing basis, the Company evaluates its estimates, including those related to fair values of stock awards, bad debts, contract revenue, the valuation of goodwill and other intangible assets, deferred compensation, income taxes, uncertain tax positions, tax valuation reserves, and useful lives for depreciation and amortization, and contingencies and litigation. The Company bases its estimates on historical experience, market experience, estimated future cash flows and various other assumptions that management believes are reasonable under the circumstances, the results of which form the basis for making judgments about the carrying values of assets and liabilities that are not readily apparent from other sources. Actual results may differ from these estimates.
This Annual Report on Form 10-K contains forward-looking statements within the meaning of Section 27A of the Securities Act of 1933 and Section 21E of the Securities Exchange Act of 1934, including, but not limited to, the following statements, as well as statements that contain such words as "anticipates," "intends," "believes," "plans" and other similar expressions:
The Company's intentions regarding its hybrid sales and distribution model.
| |
• | The Company's intentions related to investments in research and development, particularly as it relates to expanding the ease of use and capabilities of its broad portfolio of simulation software products. More specifically, this includes the evolution of its ANSYS Workbench platform, expansion of high-performance computing capabilities, ANSYSAIM immersive user interface, offerings on ANSYS Enterprise Cloud, robust design and ongoing integration of acquired technology.
|
The Company's expectations regarding the accelerated development of new and innovative products to the marketplace while lowering design and engineering costs for customers as a result of the Company's acquisitions.
The Company's statements regarding the impact of global economic conditions.
The Company's expectations regarding the outcome of its service tax audit case.
The Company's expectations regarding the realization of the French research and development credit.
The Company's belief that, in most geographical locations, its facilities allow for sufficient space to support present and future foreseeable needs, including such expansion and growth as the business may require.
The Company's expectation that it can renew existing facility leases as they expire or find alternative facilities without difficulty, as needed.
The Company's assessment of the ultimate liabilities arising from various investigations, claims and legal proceedings.
The Company's expectations regarding future restructuring charges.
The Company's statement regarding the strength of the features, functionality and integrated multiphysics capabilities of its software products.
The Company's belief that its overall performance is best measured by fiscal-year results rather than by quarterly results.
The Company's expectations regarding the adverse impact on license and maintenance revenue growth in the near term due to an increased customer preference for time-based licenses.aerospace and defense industry.
The Company's expectation that it will continue to make targeted investments in its global sales and marketing organizations and its global business infrastructure to enhance and support its revenue-generating activities.Acquisitions
The Company's intention to repatriate previously taxed earnings and to reinvest all other earningsOn November 1, 2019, we completed the acquisition of its non-U.S. subsidiaries.
The Company's plans related to future capital spending.
The sufficiency100% of existing cash and cash equivalent balances to meet future working capital and capital expenditure requirements.
The Company's belief that the best usesshares of its excess cash are to invest inLST, the business and repurchase stock in order to both offset dilution and return capital, in excesspremier provider of its requirements, to stockholders with the goal of increasing stockholder value.
The Company's intentions related to investments in complementary companies, products, services and technologies.
The Company's expectations regarding future claims related to indemnification obligations.
The Company's estimates regarding total compensation expense associated with granted stock-based awards for future years.
The Company's expectations regarding the impacts of new accounting guidance.
The Company's assessment of its ability to realize deferred tax assets.
Forward-looking statements should not be unduly relied upon because they involve known and unknown risks, uncertaintiesexplicit dynamics and other factors, someadvanced finite element analysis technology, for a purchase price of which are beyond$777.8 million. The acquisition empowers our customers to solve a new class of engineering challenges, including developing safer automobiles, aircraft and trains while reducing or even eliminating the Company's control.need for costly physical testing.
On February 1, 2019, we completed the acquisition of 100% of the shares of Granta Design, the premier provider of materials information technology, for a purchase price of $208.7 million. The Company's actual results could differ materially from those set forth inacquisition expands our portfolio into this important area, giving customers access to materials intelligence, including data that is critical to successful simulations.
Additionally, during the forward-looking statements. Certain factors that might cause such a difference include risksyear ended December 31, 2019, we acquired Dynardo, Helic and uncertainties detailed in Item 1A. Risk Factors.
AcquisitionsDfR Solutions to combine the acquired technologies with our existing comprehensive multiphysics portfolio. These acquisitions were not individually significant. The combined purchase price of these acquisitions was $136.2 million.
During the twelve monthsyear ended December 31, 20162018, we completed the acquisition of 100% of the shares of OPTIS, a premier provider of software for scientific simulation of light, human vision and 2015,physics-based visualization, for a purchase price of $291.0 million. The acquisition extended our portfolio into the Companyarea of optical simulation to provide comprehensive sensor solutions, covering visible and infrared light, electromagnetics and acoustics for camera, radar and lidar.
During the year ended December 31, 2017, we completed various acquisitions to expand our customer base and accelerate the development of new and innovative products to the marketplace while lowering design and engineering costs for customers. The acquisitions were not individually significant. The combined purchase pricesprice of the acquisitions werewas approximately $10.3 million and $49.7 million for$67.0 million.
For further information on our business combinations during the years ended December 31, 20162019, 2018 and 2015, respectively.2017, see Note 4 to the consolidated financial statements included in Part IV, Item 15 of this Annual Report on Form 10-K.
During
Results of Operations
For purposes of the year ended December 31, 2014,following discussion and analysis, the combined purchase pricetable below sets forth certain consolidated financial data for the years 2019, 2018 and 2017. The operating results of our acquisitions was $104.0 million. The acquisitions during 2014 are further describedhave been included in the table below:results of operations since their respective acquisition dates.
|
| | | | |
Date of Closing | | Company | | Details |
April 30, 2014 | | SpaceClaim Corporation | | SpaceClaim, a leading provider of 3-D modeling technology, was acquired for $85.0 million. SpaceClaim's software provides customers with a powerful and intuitive 3-D direct modeling solution to author new concepts and then leverage the power of simulation to rapidly iterate on these designs to drive innovation. |
January 3, 2014 | | Reaction Design | | Reaction Design, a leading developer of chemistry simulation software, was acquired for $19.1 million. Reaction Design's solutions enable transportation manufacturers and energy companies to rapidly achieve their clean technology goals by automating the analysis of chemical processes via computer simulation and modeling solutions. |
|
| | | | | | | | | | | | |
| | | Year Ended December 31, |
| (in thousands) | | 2019 | | 2018 | | 2017 |
| Revenue: | | | | | | |
| Software licenses | | $ | 699,630 |
| | $ | 576,717 |
| | $ | 624,964 |
|
| Maintenance and service | | 816,262 |
| | 716,919 |
| | 470,286 |
|
| Total revenue | | 1,515,892 |
| | 1,293,636 |
| | 1,095,250 |
|
| Cost of sales: | | | | | | |
| Software licenses | | 23,944 |
| | 18,619 |
| | 34,421 |
|
| Amortization | | 21,710 |
| | 27,034 |
| | 36,794 |
|
| Maintenance and service | | 120,619 |
| | 110,232 |
| | 78,949 |
|
| Total cost of sales | | 166,273 |
| | 155,885 |
| | 150,164 |
|
| Gross profit | | 1,349,619 |
| | 1,137,751 |
| | 945,086 |
|
| Operating expenses: | | | | | | |
| Selling, general and administrative | | 521,200 |
| | 413,580 |
| | 338,640 |
|
| Research and development | | 298,210 |
| | 233,802 |
| | 202,746 |
|
| Amortization | | 15,169 |
| | 13,795 |
| | 12,972 |
|
| Total operating expenses | | 834,579 |
| | 661,177 |
| | 554,358 |
|
| Operating income | | 515,040 |
| | 476,574 |
| | 390,728 |
|
| Interest income | | 12,796 |
| | 11,419 |
| | 6,962 |
|
| Interest expense | | (3,461 | ) | | (59 | ) | | (86 | ) |
| Other expense, net | | (1,792 | ) | | (849 | ) | | (1,910 | ) |
| Income before income tax provision | | 522,583 |
| | 487,085 |
| | 395,694 |
|
| Income tax provision | | 71,288 |
| | 67,710 |
| | 136,443 |
|
| Net income | | $ | 451,295 |
| | $ | 419,375 |
| | $ | 259,251 |
|
Effective January 1, 2018, we adopted new guidance on revenue recognition. We elected to adopt the change in accounting principle using the modified retrospective approach. Results for reporting periods beginning after January 1, 2018 are presented under the new guidance, while prior period amounts are not adjusted and continue to be reported in accordance with previous guidance. For further information, on the Company's business combinations, see Note 3 to the consolidated financial statements included in Part IV, Item 15 of this Annual Report on Form 10-K.
Results of Operations
For purposes of the following discussion and analysis, the table below sets forth certain consolidated financial data for the years 2016, 2015 and 2014. The operating results of the Company's acquisitions have been included in the results of operations since their respective acquisition dates.
|
| | | | | | | | | | | | |
| | | Year Ended December 31, |
| (in thousands) | | 2016 | | 2015 | | 2014 |
| Revenue: | | | | | | |
| Software licenses | | $ | 568,174 |
| | $ | 555,105 |
| | $ | 564,502 |
|
| Maintenance and service | | 420,291 |
| | 387,648 |
| | 371,519 |
|
| Total revenue | | 988,465 |
| | 942,753 |
| | 936,021 |
|
| Cost of sales: | | | | | | |
| Software licenses | | 28,860 |
| | 29,105 |
| | 30,607 |
|
| Amortization | | 38,092 |
| | 38,755 |
| | 37,653 |
|
| Maintenance and service | | 79,908 |
| | 79,386 |
| | 85,126 |
|
| Total cost of sales | | 146,860 |
| | 147,246 |
| | 153,386 |
|
| Gross profit | | 841,605 |
| | 795,507 |
| | 782,635 |
|
| Operating expenses: | | | | | | |
| Selling, general and administrative | | 269,515 |
| | 253,603 |
| | 246,376 |
|
| Research and development | | 183,093 |
| | 168,831 |
| | 165,421 |
|
| Amortization | | 12,755 |
| | 19,394 |
| | 23,388 |
|
| Total operating expenses | | 465,363 |
| | 441,828 |
| | 435,185 |
|
| Operating income | | 376,242 |
| | 353,679 |
| | 347,450 |
|
| Interest expense | | (221 | ) | | (325 | ) | | (779 | ) |
| Interest income | | 4,209 |
| | 2,829 |
| | 3,002 |
|
| Other income (expense), net | | 85 |
| | 582 |
| | (1,534 | ) |
| Income before income tax provision | | 380,315 |
| | 356,765 |
| | 348,139 |
|
| Income tax provision | | 114,679 |
| | 104,244 |
| | 93,449 |
|
| Net income | | $ | 265,636 |
| | $ | 252,521 |
| | $ | 254,690 |
|
Year Ended December 31, 20162019 Compared to Year Ended December 31, 20152018
Revenue:
| | | | Year Ended December 31, | | Change | Year Ended December 31, | | Change |
| (in thousands, except percentages) | 2016 |
| 2015 | | Amount | | % | 2019 | | 2018 | | Amount | | % | | Constant Currency % |
| Revenue: |
|
|
| | | | | | | | | | | | | |
| Lease licenses | $ | 340,331 |
|
| $ | 316,367 |
| | $ | 23,964 |
| | 7.6 |
| $ | 406,043 |
| | $ | 275,619 |
| | $ | 130,424 |
| | 47.3 |
| | 49.4 |
|
| Perpetual licenses | 227,843 |
|
| 238,738 |
| | (10,895 | ) | | (4.6 | ) | 293,587 |
| | 301,098 |
| | (7,511 | ) | | (2.5 | ) | | (1.1 | ) |
| Software licenses | 568,174 |
|
| 555,105 |
| | 13,069 |
| | 2.4 |
| 699,630 |
| | 576,717 |
| | 122,913 |
| | 21.3 |
| | 23.1 |
|
| Maintenance | 394,745 |
|
| 364,591 |
| | 30,154 |
| | 8.3 |
| 760,574 |
| | 676,883 |
| | 83,691 |
| | 12.4 |
| | 14.3 |
|
| Service | 25,546 |
|
| 23,057 |
| | 2,489 |
| | 10.8 |
| 55,688 |
| | 40,036 |
| | 15,652 |
| | 39.1 |
| | 41.5 |
|
| Maintenance and service | 420,291 |
|
| 387,648 |
| | 32,643 |
| | 8.4 |
| 816,262 |
| | 716,919 |
| | 99,343 |
| | 13.9 |
| | 15.8 |
|
| Total revenue | $ | 988,465 |
|
| $ | 942,753 |
| | $ | 45,712 |
| | 4.8 |
| $ | 1,515,892 |
| | $ | 1,293,636 |
| | $ | 222,256 |
| | 17.2 |
| | 19.0 |
|
The Company'sOur revenue increased 4.8% duringin the year ended December 31, 20162019 increased 17.2% as compared to the year ended December 31, 2015, while revenue grew 5.1%2018, or 19.0% in constant currency. The growth rate was favorably impacted by the Company'sour continued investmentinvestments in itsour global sales, support and marketing organizations, as well as our 2019 and was adversely impacted by a recent shift in the licensing preference2018 acquisitions which contributed incremental revenue of certain customers from perpetual licenses to lease licenses.$72.9 million. Lease license revenue increased 7.6%47.3%, or 49.4% in constant currency, as compared to the prior year.year ended December 31, 2018, driven primarily by an increase in multi-year lease contracts. Annual maintenance contracts that were sold with new perpetual licenses, maintenance contracts for new perpetual licenses sold in previous years and the maintenance portion of lease license contracts each contributed to maintenance revenue growth of 12.4%, or 14.3% in constant currency. Service revenue, driven primarily by a focus on service offerings that provide on-site mentorship on simulation best practices, training and expanding simulation adoption, increased 39.1%, or 41.5% in constant currency, as compared to the year ended December 31, 2018. Perpetual license revenue, which is derived primarily from new sales decreased 4.6% as compared to the prior year. Annual maintenance contracts that were sold with new perpetual licenses, along with maintenance contracts sold with new perpetual licenses in previous years, contributed to maintenance revenue growth of 8.3%.
With respect to revenue, on average for the year ended December 31, 2016, the U.S. Dollar was 0.5% stronger, when measured against the Company's primary foreign currencies, than for the year ended December 31, 2015. The net overall strengthening resulted in decreased revenue of $2.2 million during the year ended December 31, 20162019, decreased 2.5%, or 1.1% in constant currency, as compared to the year ended December 31, 2015. The impact on revenue was primarily driven by $5.6 million, $3.9 million, $1.7 million and $0.9 million of adverse impact due2018.
We continue to a weaker Euro, British Pound, South Korean Won and Indian Rupee, respectively, partially offset by $10.4 million of favorable impact due to a stronger Japanese Yen. The fluctuations in the U.S. Dollar resulted in increased operating income of $0.9 million during the year ended December 31, 2016 as compared to the year ended December 31, 2015.
A substantial portion of the Company's license and maintenance revenue is derived from annual lease and maintenance contracts. These contracts are generally renewed on an annual basis and typically have a high rate of customer renewal. In addition to the recurring revenue base associated with these contracts, a majority of customers purchasing new perpetual licenses also purchase related annual maintenance contracts. As a result of the significant recurring revenue base, the Company's license and maintenance revenue growth rate in any period does not necessarily correlate to the growth rate of new license and maintenance contracts sold during that period. To the extent the rate of customer renewal for lease and maintenance contracts is high, incremental lease contracts, and maintenance contracts sold with new perpetual licenses, will result in license and maintenance revenue growth in constant currency. Conversely, if the rate of renewal for these contracts is adversely affected by economic or other factors, the Company's license and maintenance growth will be adversely affected over the term that the revenue for those contracts would have otherwise been recognized.
The Company is starting to experience an increased interest by some of itsour larger customers in enterprise agreements that often include longer-term, time-based licenses involving a larger number of the Company'sour software products. While these arrangements typically involve a higher overall transaction price, the upfront recognition of license revenue fromrelated to these contracts is typically deferred and recognized over the period of the contract, resultinglarger, multi-year transactions can result in increased deferredsignificantly higher lease license revenue and backlog. Tocorresponding revenue growth volatility. As software products, across a large variety of applications and industries, become increasingly distributed in software-as-a-service, cloud and other subscription environments in which the extent these types of contracts replace sales oflicensing approach is time-based rather than perpetual, licenses, there could be a near-term adverse impact on software license and maintenance revenue growth. The Company is similarlywe are also experiencing a shifting preference from perpetual licenses to time-based licenses across a broader spectrum of its customers, particularly in the more mature geographic markets, such as the U.S. and Japan. To the extent this shift continues or becomes more prevalent, the result could be a similar and incremental near-term adverse impactour customers.
With respect to revenue, on software license and maintenance revenue growth.
International and domestic revenues, as a percentage of total revenue, were 62.8% and 37.2%, respectively, duringaverage for the year ended December 31, 2016, and 62.4% and 37.6%, respectively, during2019, the U.S. Dollar was approximately 3.3% stronger, when measured against our primary foreign currencies, than for the year ended December 31, 2015.2018. The Company derived 24.4% and 24.2%table below presents the impacts of its totalcurrency fluctuations on revenue through the indirect sales channel for the yearsyear ended December 31, 2016 and 2015, respectively.2019. Amounts in brackets indicate an adverse impact from currency fluctuations.
|
| | | |
| (in thousands) | Year Ended December 31, 2019 |
| Euro | $ | (17,361 | ) |
| South Korean Won | (5,097 | ) |
| British Pound | (1,881 | ) |
| Japanese Yen | 1,791 |
|
| Other | (1,460 | ) |
| Total | $ | (24,008 | ) |
The net overall stronger U.S. Dollar also resulted in decreased operating income of $10.2 million for the year ended December 31, 2019 as compared to the year ended December 31, 2018.
As a percentage of revenue, our international and domestic revenues, and our direct and indirect revenues, were as follows:
|
| | | | | |
| | Year Ended December 31, |
| | 2019 | | 2018 |
| International | 57.9 | % | | 60.9 | % |
| Domestic | 42.1 | % | | 39.1 | % |
| | | | |
| Direct | 77.1 | % | | 77.6 | % |
| Indirect | 22.9 | % | | 22.4 | % |
In valuing deferred revenue on the balance sheets of the Company'sour recent acquisitions as of their respective acquisition dates, the Companywe applied the fair value provisions applicable to the accounting for business combinations, resulting in a reduction of deferred revenue as compared to itsthe historical carrying amount. As a result, the Company'sour post-acquisition revenue will be less than the sum of what would have otherwise been reported by ANSYSus and each acquiree absent the acquisitions. The impacts on reported revenue were $12.5 million and $9.4 million for the years ended December 31, 20162019 and 2015 were $0.12018, respectively. The expected impacts on reported revenue are $3.9 million and $1.7$8.0 million for the quarter ending March 31, 2020 and the year ending December 31, 2020, respectively.
Cost of Sales and Gross Profit:Operating Expenses:
The tabletables below reflects the Company'sreflect our operating results as presented on the consolidated statements of income, which are inclusive of foreign currency translation impacts. Amounts included in the discussiondiscussions that followsfollow each table are provided in constant currency.currency and are inclusive of costs related to our acquisitions. The impact where material, of foreign exchange translation on each expense line is provided separately.discussed separately, where material. The 2019 and 2018 acquisitions contributed $54.7 million to the overall increase in cost of sales and operating expenses with the most significant contributions from the OPTIS (May 2, 2018) and Granta Design (February 1, 2019) acquisitions of $17.3 million and $18.9 million, respectively.
| | | | Year Ended December 31, | | | | | Year Ended December 31, | | | | |
| 2016 | | 2015 | | Change | 2019 | | 2018 | | Change |
| (in thousands, except percentages) | Amount | | % of Revenue | | Amount | | % of Revenue | | Amount | | % | Amount | | % of Revenue | | Amount | | % of Revenue | | Amount | | % |
| Cost of sales: | | | | | | | | | | | | | | | | | | |
| Software licenses | $ | 28,860 |
| | 2.9 | | $ | 29,105 |
| | 3.1 | | $ | (245 | ) | | (0.8 | ) | $ | 23,944 |
| | 1.6 | | $ | 18,619 |
| | 1.4 | | $ | 5,325 |
| | 28.6 |
|
| Amortization | 38,092 |
| | 3.9 | | 38,755 |
| | 4.1 | | (663 | ) | | (1.7 | ) | 21,710 |
| | 1.4 | | 27,034 |
| | 2.1 | | (5,324 | ) | | (19.7 | ) |
| Maintenance and service | 79,908 |
| | 8.1 | | 79,386 |
| | 8.4 | | 522 |
| | 0.7 |
| 120,619 |
| | 8.0 | | 110,232 |
| | 8.5 | | 10,387 |
| | 9.4 |
|
| Total cost of sales | 146,860 |
| | 14.9 | | 147,246 |
| | 15.6 | | (386 | ) | | (0.3 | ) | 166,273 |
| | 11.0 | | 155,885 |
| | 12.1 | | 10,388 |
| | 6.7 |
|
| Gross profit | $ | 841,605 |
| | 85.1 | | $ | 795,507 |
| | 84.4 | | $ | 46,098 |
| | 5.8 |
| $ | 1,349,619 |
| | 89.0 | | $ | 1,137,751 |
| | 87.9 | | $ | 211,868 |
| | 18.6 |
|
Software Licenses: Contributing to The increase in the minimal change in costscost of software were the following two offsetting factors:
Decreased salaries and other headcount-related costs of $1.2 million,licenses was primarily due to a decrease in headcount.
Increasedincreased third-party royalties of $1.2$5.6 million.
Amortization: The net decrease in amortization expense was primarily due to a net decrease in the amortization of trade names and acquired technology due to assets that became fully amortized, which was partially offset by a net increase in the amortization of trade names.newly acquired intangible assets.
Maintenance and Service: The net increase in maintenance and service costs was primarily due to the following:
Net increase inIncreased salaries incentiveof $4.0 million.
Increased stock-based compensation and other headcount-relatedof $3.3 million.
Increased consulting costs of $3.5$1.7 million.
Increased IT-relatedIT maintenance and software hosting costs of $0.5$1.3 million.
Decreased depreciation and severance costs each of $0.7 million.
Decreased facility costs of $0.4 million.
Cost reduction related to foreign exchange translation of $0.4$2.0 million due to a stronger U.S. Dollar.
Decreased business travel and stock-based compensation, each of $0.3 million.
The improvement in gross profit was a result of the increase in revenue, and decreasepartially offset by the increase in the related cost of sales.
Operating Expenses:
The table below reflects the Company's operating results as presented on the consolidated statements of income, which are inclusive of foreign currency translation impacts. Amounts included in the discussion that follows are provided in constant currency. The impact, where material, of foreign exchange translation on each expense line is provided separately.
| | | | Year Ended December 31, | | | | | Year Ended December 31, | | | |
| 2016 | | 2015 | | Change | 2019 | | 2018 | | Change |
| (in thousands, except percentages) | Amount | | % of Revenue | | Amount | | % of Revenue | | Amount | | % | Amount | | % of Revenue | | Amount | | % of Revenue | | Amount | | % |
| Operating expenses: | | | | | | | | | | | | | |
| Selling, general and administrative | $ | 269,515 |
| | 27.3 | | $ | 253,603 |
| | 26.9 | | $ | 15,912 |
| | 6.3 |
| $ | 521,200 |
| | 34.4 | | $ | 413,580 |
| | 32.0 | | $ | 107,620 |
| | 26.0 |
| Research and development | 183,093 |
| | 18.5 | | 168,831 |
| | 17.9 | | 14,262 |
| | 8.4 |
| 298,210 |
| | 19.7 | | 233,802 |
| | 18.1 | | 64,408 |
| | 27.5 |
| Amortization | 12,755 |
| | 1.3 | | 19,394 |
| | 2.1 | | (6,639 | ) | | (34.2 | ) | 15,169 |
| | 1.0 | | 13,795 |
| | 1.1 | | 1,374 |
| | 10.0 |
| Total operating expenses | $ | 465,363 |
| | 47.1 | | $ | 441,828 |
| | 46.9 | | $ | 23,535 |
| | 5.3 |
| $ | 834,579 |
| | 55.1 | | $ | 661,177 |
| | 51.1 | | $ | 173,402 |
| | 26.2 |
Selling, General and Administrative: The net increase in selling, general and administrative costs was primarily due to the following:
$4.7 million of costs associated with an employment-related settlement agreement.
Increased severance costs of $3.2 million.
Net increase in salaries, incentive compensation and other headcount-related costs of $2.1$63.7 million.
Increased IT-related maintenance and software hosting costsstock-based compensation of $2.1$13.5 million.
Increased government charges and taxesbusiness travel of $1.4$6.5 million.
Increased marketing expenses of $5.4 million.
Increased professional fees of $4.5 million.
Increased consulting costs of $1.2$4.2 million.
The Company anticipatesDecreased costs related to foreign exchange translation of $7.1 million due to a stronger U.S. Dollar.
We anticipate that itwe will continue to make targeted investments in itsour global sales and marketing organizations and itsour global business infrastructure to enhance and support itsour revenue-generating activities.
Research and Development: The net increase in research and development costs was primarily due to the following:
Increased salaries, incentive compensation and other headcount-related costs of $10.6 million.
Increased IT-related maintenance and software hosting costs of $2.1$41.1 million.
Increased stock-based compensation of $0.9$16.0 million.
Cost reduction due to foreign exchange translation of $1.6 million.
The Company hasWe have traditionally invested significant resources in research and development activities and intendsintend to continue to make investments in expanding the ease of use and capabilities of itsour broad portfolio of simulation software products. More specifically, this includes the evolution of its ANSYS Workbench platform, expansion of high-performance computing capabilities, ANSYSAIM immersive user interface, offerings on ANSYS Enterprise Cloud, robust design and ongoing integration of acquired technology.
Amortization: The decrease in amortization expense was primarily due to a decrease in the amortization of acquired customer lists that became fully amortized.
Interest Income: Interest income for the year ended December 31, 20162019 was $4.2$12.8 million as compared to $2.8$11.4 million for the year ended December 31, 2015.2018. Interest income increased as a result of an increase in both the Company's average invested cash balances and the average rate of return on thoseinvested cash balances.
Other Income, net: The Company's other income consists of the following:
|
| | | | | | | |
| | Year Ended December 31, |
| (in thousands) | 2016 | | 2015 |
| Foreign currency gains, net | $ | 77 |
| | $ | 486 |
|
| Other | 8 |
| | 96 |
|
| Total other income, net | $ | 85 |
| | $ | 582 |
|
Income Tax Provision: The Company recorded income taxInterest Expense: Interest expense of $114.7 million and had income before income taxes of $380.3 million for the year ended December 31, 2016, representing an2019 was $3.5 million as compared to $0.1 million for the year ended December 31, 2018. Interest expense increased as a result of the interest incurred on debt financing obtained in fiscal year 2019.
Other Expense, net: Our other expense consisted of the following: |
| | | | | | | |
| | Year Ended December 31, |
| (in thousands) | 2019 | | 2018 |
| Foreign currency losses, net | $ | (2,510 | ) | | $ | (3,058 | ) |
| Investment gains, net | 333 |
| | 2,204 |
|
| Other | 385 |
| | 5 |
|
| Total other expense, net | $ | (1,792 | ) | | $ | (849 | ) |
Income Tax Provision: Our income before income tax provision, income tax provision and effective tax rate of 30.2%. During the year ended December 31, 2015, the Company recorded income tax expense of $104.2 million and had income before income taxes of $356.8 million, representing an effective tax rate of 29.2%.were as follows:
|
| | | | | | | |
| | Year Ended December 31, |
| (in thousands, except percentages) | 2019 | | 2018 |
| Income before income tax provision | $ | 522,583 |
| | $ | 487,085 |
|
| Income tax provision | $ | 71,288 |
| | $ | 67,710 |
|
| Effective tax rate | 13.6 | % | | 13.9 | % |
The increasedecrease in the effective tax rate from the prior year iswas primarily due to tax benefits$6.7 million of benefit related to the mergerrelease of the Company's Japan subsidiariesvaluation allowance in 2010 recognizeda foreign jurisdiction and $1.8 million of benefit related to transition tax recorded in 20152019. These benefits are offset by $6.7 million of benefit recorded in 2018 related to global legal entity restructuring activities that did not recur in 2016, partially offset by tax benefits from restructuring activities in 2016. 2019.
When compared to the federal and state combined statutory rate for each respective period, the effective tax rates for the years ended December 31, 20162019 and 20152018 were favorably impacted by tax benefits from stock-based compensation, the domestic manufacturingforeign-derived intangible income deduction, and research and development credits. The quarterly benefit of approximately $3.1 million associated with the merger of the Company's Japan subsidiaries was fully amortized in the third quarter of 2015. There will be no additional ongoing benefit from this transaction. The rates were also favorably impacted by the recurring item of lower statutory tax rates in many of the Company's foreign jurisdictions.
Net Income: The Company's Our net income, for the year ended December 31, 2016 was $265.6 million as compared to net income of $252.5 million for the year ended December 31, 2015. Diluteddiluted earnings per share was $2.99 for the year ended December 31, 2016 and $2.76 for the year ended December 31, 2015. The weighted average shares used in computing diluted earnings per share were 89.0 million and 91.5 million for the years ended December 31, 2016 and 2015, respectively.as follows:
|
| | | | | | | |
| | Year Ended December 31, |
| (in thousands, except per share data) | 2019 | | 2018 |
| Net income | $ | 451,295 |
| | $ | 419,375 |
|
| Diluted earnings per share | $ | 5.25 |
| | $ | 4.88 |
|
| Weighted average shares outstanding - diluted | 85,925 |
| | 85,913 |
|
Year Ended December 31, 20152018 Compared to Year Ended December 31, 20142017
Revenue:
| | | | Year Ended December 31, | | Change | Year Ended December 31, | | Change |
| (in thousands, except percentages) | 2015 | | 2014 | | Amount | | % | 2018
(ASC 606) | | 2017
(ASC 605) | | Amount | | % | | Constant Currency % |
| Revenue: | | | | | | | | | | | | | | | | |
| Lease licenses | $ | 316,367 |
| | $ | 318,041 |
| | $ | (1,674 | ) | | (0.5 | ) | $ | 275,619 |
| | $ | 376,886 |
| | $ | (101,267 | ) | | (26.9 | ) | | (27.4 | ) |
| Perpetual licenses | 238,738 |
| | 246,461 |
| | (7,723 | ) | | (3.1 | ) | 301,098 |
| | 248,078 |
| | 53,020 |
| | 21.4 |
| | 20.2 |
|
| Software licenses | 555,105 |
| | 564,502 |
| | (9,397 | ) | | (1.7 | ) | 576,717 |
| | 624,964 |
| | (48,247 | ) | | (7.7 | ) | | (8.5 | ) |
| Maintenance | 364,591 |
| | 346,698 |
| | 17,893 |
| | 5.2 |
| 676,883 |
| | 440,428 |
| | 236,455 |
| | 53.7 |
| | 51.6 |
|
| Service | 23,057 |
| | 24,821 |
| | (1,764 | ) | | (7.1 | ) | 40,036 |
| | 29,858 |
| | 10,178 |
| | 34.1 |
| | 33.1 |
|
| Maintenance and service | 387,648 |
| | 371,519 |
| | 16,129 |
| | 4.3 |
| 716,919 |
| | 470,286 |
| | 246,633 |
| | 52.4 |
| | 50.4 |
|
| Total revenue | $ | 942,753 |
| | $ | 936,021 |
| | $ | 6,732 |
| | 0.7 |
| $ | 1,293,636 |
| | $ | 1,095,250 |
| | $ | 198,386 |
| | 18.1 |
| | 16.8 |
|
The Company'sadoption of ASC 606 significantly impacted the timing, allocation and presentation of lease license, perpetual license and maintenance revenue. For further information about this adoption, see Note 3 to the consolidated financial statements included in Part IV, Item 15 of this Annual Report on Form 10-K.
For purposes of comparability, the changes in the following table and the related discussion that follows are presented in accordance with ASC 605.
|
| | | | | | | | | | | | | | | |
| | Year Ended December 31, | | Change |
| (in thousands, except percentages) | 2018
(ASC 605) | | 2017
(ASC 605) | | Amount | | % | | Constant Currency % |
| Revenue: | | | | | | | | | |
| Lease licenses | $ | 421,268 |
| | $ | 376,886 |
| | $ | 44,382 |
| | 11.8 | | 10.7 |
| Perpetual licenses | 255,578 |
| | 248,078 |
| | 7,500 |
| | 3.0 | | 2.0 |
| Software licenses | 676,846 |
| | 624,964 |
| | 51,882 |
| | 8.3 | | 7.2 |
| Maintenance | 499,510 |
| | 440,428 |
| | 59,082 |
| | 13.4 | | 11.6 |
| Service | 40,113 |
| | 29,858 |
| | 10,255 |
| | 34.3 | | 33.4 |
| Maintenance and service | 539,623 |
| | 470,286 |
| | 69,337 |
| | 14.7 | | 13.0 |
| Total revenue | $ | 1,216,469 |
| | $ | 1,095,250 |
| | $ | 121,219 |
| | 11.1 | | 9.7 |
Our ASC 605 revenue increased 0.7% duringin the year ended December 31, 20152018 increased 11.1% as compared to the year ended December 31, 2014,2017, while revenue grew 7.8%9.7% in constant currency. The growth rate was favorably impacted by the Company'sour continued investmentinvestments in itsour global sales, support and marketing organizations.organizations; continued progress with market segmentation and go-to-market adjustments; and the May 2018 acquisition of OPTIS. Lease license revenue increased 11.8%, or 10.7% in constant currency, as compared to the year ended December 31, 2017. Perpetual license revenue, which is derived primarily from new sales during the year, increased 3.0%, or 2.0% in constant currency, as compared to the year ended December 31, 2017. Annual maintenance contracts that were sold with new perpetual licenses, along with maintenance contracts sold with newfor perpetual licenses sold in previous years, contributed to maintenance revenue growth of 5.2%. This growth was13.4%, or 11.6% in constant currency. Service revenue, driven primarily due to maintenance contracts sold with electronics products. Perpetual license revenue, which is derived primarily from new sales, decreased 3.1%by a focus on service offerings that provide on-site mentorship on simulation best practices, training and expanding simulation adoption, increased 34.3%, or 33.4% in constant currency, as compared to the prior year. While lease licenses, perpetual licenses and service revenue declined as compared to the prior year all were higher in constant currency.ended December 31, 2017.
With respect to revenue, on average for the year ended December 31, 2015,2018, the U.S. Dollar was 12.5% stronger,approximately 2.3% weaker and 2.6% weaker, when measured against the Company'sour primary foreign currencies, than for the year ended December 31, 2014.2017 under ASC 606 and ASC 605, respectively. The net overall strengthening resulted in decreasedtable below presents the impacts of currency fluctuations on revenue of $65.9 million duringfor the year ended December 31, 20152018. Amounts in brackets indicate a net adverse impact from currency fluctuations.
|
| | | | | | | |
| | Year Ended December 31, 2018 |
| (in thousands) | ASC 606 | | ASC 605 |
| Euro | $ | 12,498 |
| | $ | 11,915 |
|
| Japanese Yen | 2,088 |
| | 2,075 |
|
| South Korean Won | 918 |
| | 1,182 |
|
| British Pound | 870 |
| | 1,083 |
|
| Indian Rupee | (1,623 | ) | | (1,372 | ) |
| Other | (129 | ) | | (36 | ) |
| Total | $ | 14,622 |
| | $ | 14,847 |
|
The net overall weaker U.S. Dollar also resulted in increased operating income of $9.6 million and $10.3 million for the year ended December 31, 2018 as compared to the year ended December 31, 2014. The impact on2017 under ASC 606 and ASC 605, respectively.
As a percentage of revenue, was primarily driven by $42.7 million, $14.6 million, $2.9 million and $2.9 million of adverse impact due to a weaker Euro, Japanese Yen, South Korean Won and British Pound, respectively. The net overall stronger U.S. Dollar also resulted in decreased operating income of $38.0 million during the year ended December 31, 2015 as compared to the year ended December 31, 2014.
Internationalour international and domestic revenues, and our direct and indirect revenues, were as a percentage of total revenue, were 62.4% and 37.6%, respectively, during the year ended December 31, 2015, and 65.8% and 34.2%, respectively, during the year ended December 31, 2014. The Company derived 24.2% and 24.9% of its total revenue through the indirect sales channel for the years ended December 31, 2015 and 2014, respectively.follows:
|
| | | | | | | | |
| | Year Ended December 31, |
| | 2018 (ASC 606) | | 2018 (ASC 605) | | 2017 (ASC 605) |
| International | 60.9 | % | | 60.5 | % | | 61.9 | % |
| Domestic | 39.1 | % | | 39.5 | % | | 38.1 | % |
| | | | | | |
| Direct | 77.6 | % | | 76.5 | % | | 75.2 | % |
| Indirect | 22.4 | % | | 23.5 | % | | 24.8 | % |
In valuing deferred revenue on the balance sheets of the Company'sour recent acquisitions as of their respective acquisition dates, the Companywe applied the fair value provisions applicable to the accounting for business combinations, resulting in a reduction of deferred revenue as compared to itsthe historical carrying amount. As a result, the Company'sour post-acquisition revenue will be less than the sum of what would have otherwise been reported by ANSYSus and each acquiree absent the acquisitions. TheUnder ASC 606, the impact on reported revenue was $9.4 million for the year ended December 31, 2018. Under ASC 605, the impacts on reported revenue were $15.6 million and $2.9 million for the years ended December 31, 20152018 and 2014 were $1.7 million and $5.4 million,2017, respectively.
Cost of Sales and Gross Profit:Operating Expenses:
The tabletables below reflects the Company'sreflect our operating results as presented on the consolidated statements of income, which are inclusive of foreign currency translation impacts. The adoption of ASC 606 resulted in a reclassification of expenses within cost of sales from software licenses to maintenance and service. Amounts included in the discussion that follows are provided in constant currency.currency and do not include the impact of the OPTIS acquisition. The impact of the OPTIS acquisition on each expense line is provided separately, where material. The impact, where material, of foreign exchange translation on each expense line is also provided separately.separately and is inclusive of the OPTIS acquisition.
| | | | Year Ended December 31, | | | | | Year Ended December 31, | | | | |
| 2015 | | 2014 | | Change | 2018 | | 2017 | | Change |
| (in thousands, except percentages) | Amount | | % of
Revenue | | Amount | | % of
Revenue | | Amount | | % | Amount | | % of Revenue | | Amount | | % of Revenue | | Amount | | % |
| Cost of sales: | | | | | | | | | | | | | | | | | | |
| Software licenses | $ | 29,105 |
| | 3.1 | | $ | 30,607 |
| | 3.3 | | $ | (1,502 | ) | | (4.9 | ) | $ | 18,619 |
| | 1.4 | | $ | 34,421 |
| | 3.1 | | $ | (15,802 | ) | | (45.9 | ) |
| Amortization | 38,755 |
| | 4.1 | | 37,653 |
| | 4.0 | | 1,102 |
| | 2.9 |
| 27,034 |
| | 2.1 | | 36,794 |
| | 3.4 | | (9,760 | ) | | (26.5 | ) |
| Maintenance and service | 79,386 |
| | 8.4 | | 85,126 |
| | 9.1 | | (5,740 | ) | | (6.7 | ) | 110,232 |
| | 8.5 | | 78,949 |
| | 7.2 | | 31,283 |
| | 39.6 |
|
| Total cost of sales | 147,246 |
| | 15.6 | | 153,386 |
| | 16.4 | | (6,140 | ) | | (4.0 | ) | 155,885 |
| | 12.1 | | 150,164 |
| | 13.7 | | 5,721 |
| | 3.8 |
|
| Gross profit | $ | 795,507 |
| | 84.4 | | $ | 782,635 |
| | 83.6 | | $ | 12,872 |
| | 1.6 |
| $ | 1,137,751 |
| | 87.9 | | $ | 945,086 |
| | 86.3 | | $ | 192,665 |
| | 20.4 |
|
Software Licenses: The net decrease in coststhe cost of software licenses was primarily due to the following:
Decreased stock-based compensationReclassification of $1.0 million.
Cost reduction from foreign exchange translation$18.2 million of $0.9 million.
Decreased salaries and incentive compensationcost of $0.9 million.
Increased SpaceClaim-related costs ofsales, previously reflected within software licenses, of $0.6 million, primarily as a result of twelve months of SpaceClaim activity in 2015 as compared to eight months of activity in 2014.
Increased facilities and IT-related maintenance of $0.4 million.
Increased third-party royalties of $0.2 million.
Amortization: The net increase in amortization expense was primarily due to an increase in the amortization of trade names, partially offset by a cost reduction related to foreign exchange translation.
Maintenance and Service: The net decrease in maintenance and service costs was primarily due to the following:adoption of ASC 606 in 2018.
Cost reduction related to foreign exchange translation of $7.6 million.
Increased salaries and severance costs, each of $0.7 million.
Increased third-party technical support costs of $0.6 million.
The improvement in gross profit was a result of the increase in revenue and decrease in related cost of sales.
Operating Expenses:
The table below reflects the Company's operating results as presented on the consolidated statements of income, which are inclusive of foreign currency translation impacts. Amounts included in the discussion that follows are provided in constant currency. The impact, where material, of foreign exchange translation on each expense line is provided separately.
|
| | | | | | | | | | | | | | | | | | |
| | Year Ended December 31, | | | | |
| 2015 | | 2014 | | Change |
| (in thousands, except percentages) | Amount | | % of
Revenue | | Amount | | % of
Revenue | | Amount | | % |
| Operating expenses: | | | | | | | | | | | |
| Selling, general and administrative | $ | 253,603 |
| | 26.9 | | $ | 246,376 |
| | 26.3 | | $ | 7,227 |
| | 2.9 |
|
| Research and development | 168,831 |
| | 17.9 | | 165,421 |
| | 17.7 | | 3,410 |
| | 2.1 |
|
| Amortization | 19,394 |
| | 2.1 | | 23,388 |
| | 2.5 | | (3,994 | ) | | (17.1 | ) |
| Total operating expenses | $ | 441,828 |
| | 46.9 | | $ | 435,185 |
| | 46.5 | | $ | 6,643 |
| | 1.5 |
|
Selling, General and Administrative: The net increase in selling, general and administrative costs was primarily due to the following:
Increased salaries, incentive compensation and other headcount-related costs of $18.4 million, primarily due to an increase in headcount.
Increased third-party commissions of $1.7 million.
Increased business travel and mealsOPTIS-related software license expenses of $1.6 million.million for the period from the acquisition date (May 2, 2018) through December 31, 2018.
Increased consulting costs of $1.4 million.
Increased office lease and utility costs of $1.0 million.
Cost reduction due to foreign exchange translation of $13.2 million.
Decreased severance costs of $3.1 million.
Research and Development: The net increase in research and development costs was primarily due to the following:
Increased salaries and other headcount-related costs of $7.5 million.
Increased SpaceClaim-related research and development costs of $1.8 million, primarily as a result of twelve months of SpaceClaim activity in 2015 as compared to eight months of activity in 2014.
Increased office lease and utility costs of $0.6 million.
Increased facilities and IT-related maintenance of $0.6 million.
Cost reduction due to foreign exchange translation of $5.4 million.
Decreased stock-based compensation of $1.8 million.
Amortization: The decrease in amortization expense was primarily due to a net decrease in the amortization of trade names and acquired customer liststechnology due to assets that became fully amortized.
Maintenance and Service: The increase in maintenance and service costs was primarily due to the following:
Reclassification of $18.2 million of cost of sales, previously reflected within software licenses, to maintenance and service due to the adoption of ASC 606 in 2018.
Increased third-party technical support of $5.5 million.
OPTIS-related maintenance and service expenses of $2.8 million for the period from the acquisition date (May 2, 2018) through December 31, 2018.
Increased salaries of $2.1 million.
The improvement in gross profit was a cost reduction related to foreign exchange translation.
Other Income (Expense), net: The Company's other income (expense) consistsresult of the following:increase in revenue, partially offset by the increase in the related cost of sales.
|
| | | | | | | |
| | Year Ended December 31, |
| (in thousands) | 2015 | | 2014 |
| Foreign currency gains (losses), net | $ | 486 |
| | $ | (1,649 | ) |
| Other | 96 |
| | 115 |
|
| Total other income (expense), net | $ | 582 |
| | $ | (1,534 | ) |
|
| | | | | | | | | | | | | | | | | |
| | Year Ended December 31, | | | | |
| 2018 | | 2017 | | Change |
| (in thousands, except percentages) | Amount | | % of Revenue | | Amount | | % of Revenue | | Amount | | % |
| Operating expenses: | | | | | | | | | | | |
| Selling, general and administrative | $ | 413,580 |
| | 32.0 | | $ | 338,640 |
| | 30.9 | | $ | 74,940 |
| | 22.1 |
| Research and development | 233,802 |
| | 18.1 | | 202,746 |
| | 18.5 | | 31,056 |
| | 15.3 |
| Amortization | 13,795 |
| | 1.1 | | 12,972 |
| | 1.2 | | 823 |
| | 6.3 |
| Total operating expenses | $ | 661,177 |
| | 51.1 | | $ | 554,358 |
| | 50.6 | | $ | 106,819 |
| | 19.3 |
Income Tax Provision:Selling, General and Administrative: The Company recordednet increase in selling, general and administrative costs was primarily due to the following:
Increased salaries, incentive compensation and other headcount-related costs of $35.2 million.
Increased stock-based compensation of $15.3 million.
OPTIS-related selling, general and administrative expenses of $13.8 million for the period from the acquisition date (May 2, 2018) through December 31, 2018.
Increased business travel of $3.9 million.
Increased severance expenses of $3.7 million.
Decreased consulting costs of $7.1 million.
Research and Development: The net increase in research and development costs was primarily due to the following:
Increased salaries, incentive compensation and other headcount-related costs of $15.2 million.
Increased stock-based compensation of $11.6 million.
OPTIS-related research and development expenses of $5.9 million for the period from the acquisition date (May 2, 2018) through December 31, 2018.
Increased IT maintenance and software hosting costs of $1.5 million.
Restructuring costs of $6.8 million related to 2017 workforce realignment activities that did not reoccur in 2018.
Interest Income: Interest income tax expense of $104.2for the year ended December 31, 2018 was $11.4 million and had income before income taxes of $356.8as compared to $7.0 million for the year ended December 31, 2015, representing2017. Interest income increased as a result of an increase in the average rate of return on invested cash balances.
Other Expense, net: Our other expense, net consists of the following:
|
| | | | | | | |
| | Year Ended December 31, |
| (in thousands) | 2018 | | 2017 |
| Foreign currency losses, net | $ | (3,058 | ) | | $ | (1,935 | ) |
| Investment gains, net | 2,204 |
| | 24 |
|
| Other | 5 |
| | 1 |
|
| Total other expense, net | $ | (849 | ) | | $ | (1,910 | ) |
Income Tax Provision: Our income before income tax provision, income tax provision and effective tax rate of 29.2%. During the year endedwere as follows:
|
| | | | | | | | | | | |
| | Year Ended December 31, |
| (in thousands, except percentages) | 2018
(ASC 606) | | 2018
(ASC 605) | | 2017
(ASC 605) |
| Income before income tax provision | $ | 487,085 |
| | $ | 409,918 |
| | $ | 395,694 |
|
| Income tax provision | $ | 67,710 |
| | $ | 53,067 |
| | $ | 136,443 |
|
| Effective tax rate | 13.9 | % | | 12.9 | % | | 34.5 | % |
On December 31, 2014,22, 2017, the CompanyU.S. government enacted comprehensive tax legislation commonly referred to as the Tax Cuts and Jobs Act (Tax Reform). Tax Reform made broad and complex changes to the U.S. tax code, including, but not limited to, (1) reducing the U.S. federal corporate tax rate from 35 percent to 21 percent; (2) requiring companies to pay a one-time federal income tax on certain unrepatriated earnings of foreign subsidiaries (transition tax); (3) generally eliminating U.S. federal income taxes on dividends from foreign subsidiaries; (4) creating a new provision designed to tax global intangible low-taxed income (GILTI) which allows for the possibility of using foreign tax credits (FTCs) and a deduction of up to 50 percent to offset the income tax liability (subject to some limitations); (5) repealing the domestic production activity deduction; (6) creating the foreign-derived intangible income deduction; (7) creating the base erosion anti-abuse tax, a new minimum tax; (8) allowing for full expensing of qualified property through bonus depreciation; and (9) creating limitations on the deductibility of certain executive compensation.
The SEC staff issued Staff Accounting Bulletin (SAB) 118, which provides guidance on accounting for the tax effects of Tax Reform. SAB 118 provided a measurement period that was limited to one year from enactment for companies to complete the accounting under ASC 740, Income Taxes. In accordance with SAB 118, throughout the measurement period, a company must reflect the income tax effects of those aspects of Tax Reform for which the accounting under ASC 740 was complete in the financial statements. To the extent that a company’s accounting for certain income tax effects of Tax Reform was incomplete, but a reasonable estimate was able to be made, the company must record a provisional estimate in the financial statements. If a company could not determine a provisional estimate to be included in the financial statements, it should continue to apply ASC 740 on the basis of the tax laws that were in effect immediately before the enactment of Tax Reform.
As further discussed below, we finalized our provisional Tax Reform calculations as of the end of the measurement period, based on guidance and information available as of the reporting date. The U.S. government has not yet issued final guidance related to a portion of the new rules enacted as part of Tax Reform. Subsequent adjustments, if any, will be recorded in the period in which guidance is finalized.
Our accounting for the impact of the reduction in the U.S. federal corporate tax rate on our deferred tax assets and liabilities is complete. Tax Reform reduced the corporate tax rate to 21 percent, effective January 1, 2018. Consequently, we recorded a net adjustment to deferred income tax expense of $93.4$1.9 million for the year ended December 31, 2017 to revalue our deferred tax assets and had income beforeliabilities. No further adjustments were recorded for the year ended December 31, 2018.
Our accounting for the transition tax is complete. Reasonable estimates of certain effects were calculated and a provisional adjustment of $16.0 million was recorded in the December 31, 2017 financial statements. To determine the amount of the transition tax, we determined, in addition to other factors, the amount of post-1986 earnings and profits (E&P) of the relevant subsidiaries, as well as the amount of non-U.S. income taxes paid on such earnings. Based on revised E&P calculations updated during the measurement period, we recognized an additional measurement-period adjustment for the year ended December 31, 2018 of $348.1$0.9 million representingto the transition tax obligation and a corresponding adjustment to tax expense.
Our accounting for the indefinite reinvestment assertion is complete. In general, it is our intention to permanently reinvest all earnings in excess of previously taxed amounts. As part of Tax Reform, substantially all of the previous earnings of our non-U.S. subsidiaries were taxed through the transition tax and current earnings are taxed as part of GILTI tax expense. These taxes increased our previously taxed earnings and allow for the repatriation of the majority of our foreign earnings without any residual U.S. federal tax. During the year ended December 31, 2018, we repatriated $144.3 million of foreign cash. We did not make any adjustments related to our indefinite reinvestment assertion during the year ended December 31, 2018.
Our accounting policy choice for GILTI is complete. Under U.S. GAAP, we are allowed to make an effectiveaccounting policy choice of either (1) treating taxes due on future U.S. inclusions in taxable income related to GILTI as a current-period expense when incurred (the period cost method) or (2) factoring such amounts into the measurement of our deferred taxes (the deferred method). We selected the period cost method and recorded GILTI tax rateexpense of 26.8%.$0.4 million in the financial statements for the year ended December 31, 2018.
The increasedecrease in the effective tax rate from the prior year iswas primarily due to the reduction in the U.S. federal corporate tax rate from 35 percent to 21 percent enacted as part of Tax Reform, the additional $15.1 million of transition tax in 2017 when compared to 2018, and a decrease in benefitsnet $6.7 million benefit related to global legal entity restructuring activities. The effective tax rate was also reduced by the foreign-derived intangible income deduction, increased research and development credits and increased stock-based compensation benefits, partially offset by the loss of the domestic manufacturing deduction, which was repealed as part of Tax Reform.
When compared to the federal and state combined statutory rate, the effective tax rates for the years ended December 31, 20152018 and 20142017 were favorably impacted by the domestic manufacturing deduction,tax benefits from stock-based compensation and research and development credits and tax benefits associated with the merger of the Company's Japan subsidiaries in 2010. The quarterly benefit of approximately $3.1 million associated with the merger of the Company's Japan subsidiaries was fully amortized in the third quarter of 2015. There will be no additional ongoing benefit from this transaction. The rates were also favorably impacted by the recurring item of lower statutory tax rates in many of the Company's foreign jurisdictions.credits.
Net Income: The Company's Our net income, for the year ended December 31, 2015 was $252.5 million as compared to net income of $254.7 million for the year ended December 31, 2014. Diluteddiluted earnings per share was $2.76 for the year ended December 31, 2015 and $2.70 for the year ended December 31, 2014. The weighted average shares used in computing diluted earnings per share were 91.5 million and 94.2 million for the years ended December 31, 2015 and 2014, respectively.as follows:
|
| | | | | | | | | | | |
| | Year Ended December 31, |
| (in thousands, except per share data) | 2018 (ASC 606) | | 2018 (ASC 605) | | 2017 (ASC 605) |
| Net income | $ | 419,375 |
| | $ | 356,851 |
| | $ | 259,251 |
|
| Diluted earnings per share | $ | 4.88 |
| | $ | 4.15 |
| | $ | 2.98 |
|
| Weighted average shares outstanding - diluted | 85,913 |
| | 85,913 |
| | 86,854 |
|
Non-GAAP Results
The Company providesWe provide non-GAAP revenue, non-GAAP operating income, non-GAAP operating profit margin, non-GAAP net income and non-GAAP diluted earnings per share as supplemental measures to GAAP regarding the Company'sour operational performance. These financial measures exclude the impact of certain items and, therefore, have not been calculated in accordance with GAAP. A detailed explanation and a reconciliation of each non-GAAP financial measure to itsour most comparable GAAP financial measure are described below.
| | | | | | | | | | | | | | | | | | | ASC 606 |
| | Year Ended December 31, | Year Ended December 31, |
| | 2016 | | 2015 | 2019 | | 2018 |
| (in thousands, except percentages and per share data) | As Reported | | Adjustments | | Non-GAAP Results | | As Reported | | Adjustments | | Non-GAAP Results | GAAP Results | | Adjustments | | Non-GAAP
Results | | GAAP Results | | Adjustments | | Non-GAAP
Results |
| Total revenue | $ | 988,465 |
| | $ | 103 |
| (1) | $ | 988,568 |
| | $ | 942,753 |
| | $ | 1,725 |
| (4) | $ | 944,478 |
| $ | 1,515,892 |
| | $ | 12,514 |
| (1) | $ | 1,528,406 |
| | $ | 1,293,636 |
| | $ | 9,442 |
| (4) | $ | 1,303,078 |
|
| Operating income | 376,242 |
| | 88,114 |
| (2) | 464,356 |
| | 353,679 |
| | 94,665 |
| (5) | 448,344 |
| 515,040 |
| | 177,093 |
| (2) | 692,133 |
| | 476,574 |
| | 141,442 |
| (5) | 618,016 |
|
| Operating profit margin | 38.1 | % | | | | 47.0 | % | | 37.5 | % | | | | 47.5 | % | 34.0 | % | | | | 45.3 | % | | 36.8 | % | | | | 47.4 | % |
| Net income | $ | 265,636 |
| | $ | 57,286 |
| (3) | $ | 322,922 |
| | $ | 252,521 |
| | $ | 60,854 |
| (6) | $ | 313,375 |
| $ | 451,295 |
| | $ | 113,702 |
| (3) | $ | 564,997 |
| | $ | 419,375 |
| | $ | 94,510 |
| (6) | $ | 513,885 |
|
| Earnings per share – diluted: | | | | | | | | | | | | | | | | | | | | | | |
| Earnings per share | $ | 2.99 |
| | | | $ | 3.63 |
| | $ | 2.76 |
| | | | $ | 3.42 |
| $ | 5.25 |
| | | | $ | 6.58 |
| | $ | 4.88 |
| | | | $ | 5.98 |
|
| Weighted average shares | 88,969 |
| | | | 88,969 |
| | 91,502 |
| | | | 91,502 |
| 85,925 |
| | | | 85,925 |
| | 85,913 |
| | | | 85,913 |
|
| |
| (1) | Amount represents the revenue not reported during the period as a result of the acquisition accounting adjustment associated with the accounting for deferred revenue in business combinations. |
| |
| (2) | Amount represents $50.8$116.2 million of stock-based compensation expense, $4.9 million of excess payroll taxes related to stock-based awards, $36.9 million of amortization expense associated with intangible assets acquired in business combinations, $33.3$6.6 million of stock-based compensation expense,transaction expenses related to business combinations and the $0.1$12.5 million adjustment to revenue as reflected in (1) above, $3.4 million of restructuring charges and $0.4 million of transaction expenses related to business combinations.above. |
| |
| (3) | Amount represents the impact of the adjustments to operating income referred to in (2) above, adjusteddecreased for the related income tax impact of $30.8$61.2 million, adjustments related to the transition tax associated with the Tax Cuts and Jobs Act of $1.8 million, and rabbi trust income of $0.4 million. |
| |
| (4) | Amount represents the revenue not reported during the period as a result of the acquisition accounting adjustment associated with the accounting for deferred revenue in business combinations. |
| |
| (5) | Amount represents $83.3 million of stock-based compensation expense, $4.3 million of excess payroll taxes related to stock-based awards, $40.8 million of amortization expense associated with intangible assets acquired in business combinations, $3.5 million of transaction expenses related to business combinations and the $9.4 million adjustment to revenue as reflected in (4) above. |
| |
| (6) | Amount represents the impact of the adjustments to operating income referred to in (5) above, decreased for the related income tax impact of $47.9 million and increased for a measurement-period adjustment related to the Tax Cuts and Jobs Act of $0.9 million and rabbi trust expense of $0.1 million. |
|
| | | | | | | | | | | | | | | | | | | | | | | |
| | ASC 605 |
| | Year Ended December 31, |
| | 2018 | | 2017 |
| (in thousands, except percentages and per share data) | GAAP Results | | Adjustments | | Non-GAAP Results | | GAAP Results | | Adjustments | | Non-GAAP Results |
| Total revenue | $ | 1,216,469 |
| | $ | 15,583 |
| (1) | $ | 1,232,052 |
| | $ | 1,095,250 |
| | $ | 2,856 |
| (4) | $ | 1,098,106 |
|
| Operating income | 399,407 |
| | 147,583 |
| (2) | 546,990 |
| | 390,728 |
| | 118,567 |
| (5) | 509,295 |
|
| Operating profit margin | 32.8 | % | | | | 44.4 | % | | 35.7 | % | | | | 46.4 | % |
| Net income | $ | 356,851 |
| | $ | 98,832 |
| (3) | $ | 455,683 |
| | $ | 259,251 |
| | $ | 88,663 |
| (6) | $ | 347,914 |
|
| Earnings per share – diluted: | | | | | | | | | | | |
| Earnings per share | $ | 4.15 |
| | | | $ | 5.30 |
| | $ | 2.98 |
| | | | $ | 4.01 |
|
| Weighted average shares | 85,913 |
| | | | 85,913 |
| | 86,854 |
| | | | 86,854 |
|
| |
| (1) | Amount represents the revenue not reported during the period as a result of the acquisition accounting adjustment associated with the accounting for deferred revenue in business combinations. |
| |
| (2) | Amount represents $83.3 million of stock-based compensation expense, $4.3 million of excess payroll taxes related to stock-based awards, $40.8 million of amortization expense associated with intangible assets acquired in business combinations, $3.5 million of transaction expenses related to business combinations and the $15.6 million adjustment to revenue as reflected in (1) above. |
| |
| (3) | Amount represents the impact of the adjustments to operating income referred to in (2) above, decreased for the related income tax impact of $49.7 million and increased for a measurement-period adjustment related to the Tax Cuts and Jobs Act of $0.9 million and rabbi trust expense of $0.1 million. |
| |
| (4) | Amount represents the revenue not reported during the period as a result of the acquisition accounting adjustment associated with the accounting for deferred revenue in business combinations. |
| |
| (5) | Amount represents $58.1$53.2 million of stock-based compensation expense, $49.8 million of amortization expense associated with intangible assets acquired in business combinations, $34.0$11.7 million of stock-based compensation expense,restructuring charges, $1.1 million of transaction expenses related to business combinations and the $1.7$2.9 million adjustment to revenue as reflected in (4) above and $0.8 million of transaction expenses related to business combinations.above. |
| |
| (6) | Amount represents the impact of the adjustments to operating income referred to in (5) above, adjusteddecreased for the related income tax impact of $33.8 million. |
|
| | | | | | | | | | | | | | | | | | | | | | | |
| | Year Ended December 31, |
| | 2015 | | 2014 |
| (in thousands, except percentages and per share data) | As
Reported | | Adjustments | | Non-GAAP
Results | | As
Reported | | Adjustments | | Non-GAAP
Results |
| Total revenue | $ | 942,753 |
| | $ | 1,725 |
| (1) | $ | 944,478 |
| | $ | 936,021 |
| | $ | 5,421 |
| (4) | $ | 941,442 |
|
| Operating income | 353,679 |
| | 94,665 |
| (2) | 448,344 |
| | 347,450 |
| | 104,403 |
| (5) | 451,853 |
|
| Operating profit margin | 37.5 | % | | | | 47.5 | % | | 37.1 | % | | | | 48.0 | % |
| Net income | $ | 252,521 |
| | $ | 60,854 |
| (3) | $ | 313,375 |
| | $ | 254,690 |
| | $ | 68,719 |
| (6) | $ | 323,409 |
|
| Earnings per share – diluted: | | | | | | | | | | | |
| Earnings per share | $ | 2.76 |
| | | | $ | 3.42 |
| | $ | 2.70 |
| | | | $ | 3.43 |
|
| Weighted average shares | 91,502 |
| | | | 91,502 |
| | 94,194 |
| | | | 94,194 |
|
| |
(1) | Amount represents the revenue not reported during the period as a result of the acquisition accounting adjustment associated with the accounting for deferred revenue in business combinations. |
| |
(2) | Amount represents $58.1$52.5 million, of amortization expense associated with intangible assets acquired in business combinations, $34.0 million of stock-based compensation expense, the $1.7 million adjustment to revenue as reflected in (1) above and $0.8 million of transaction expenses related to business combinations. |
| |
(3) | Amount representsexcluding the impact of the adjustments to operatingTax Cuts and Jobs Act, and rabbi trust income referred to in (2) above, adjustedof $0.1 million, and increased for the related income tax impact of $33.8 million. |
| |
(4) | Amount represents the revenue not reported during the period as a resulttotal net impacts of the acquisition accounting adjustment associated with the accounting for deferred revenue in business combinations. |
| |
(5) | Amount represents $61.0 millionTax Cuts and Jobs Act of amortization expense associated with intangible assets acquired in business combinations, $36.9 million of stock-based compensation expense, the $5.4 million adjustment to revenue as reflected in (4) above and $1.1 million of transaction expenses related to business combinations. |
| |
(6) | Amount represents the impact of the adjustments to operating income referred to in (5) above, adjusted for the related income tax impact of $35.7$22.7 million. |
Non-GAAP Measures
Management usesWe use non-GAAP financial measures (a) to evaluate the Company'sour historical and prospective financial performance as well as itsour performance relative to itsour competitors, (b) to set internal sales targets and spending budgets, (c) to allocate resources, (d) to measure operational profitability and the accuracy of forecasting, (e) to assess financial discipline over operational expenditures and (f) as an important factor in determining variable compensation for management and its employees. In addition, many financial analysts that follow the Companyus focus on and publish both historical results and future projections based on non-GAAP financial measures. The Company believesWe believe that it is in the best interest of itsour investors to provide this information to analysts so that they accurately report the non-GAAP financial information. Moreover, investors have historically requested, and the Company haswe have historically reported, these non-GAAP financial measures as a means of providing consistent and comparable information with past reports of financial results.
While management believeswe believe that these non-GAAP financial measures provide useful supplemental information to investors, there are limitations associated with the use of these non-GAAP financial measures. These non-GAAP financial measures are not prepared in accordance with GAAP, are not reported by all of the Company'sour competitors and may not be directly comparable to similarly titled measures of the Company'sour competitors due to potential differences in the exact method of calculation. The Company compensatesWe compensate for these limitations by using these non-GAAP financial measures as supplements to GAAP financial measures and by reviewing the reconciliations of the non-GAAP financial measures to their most comparable GAAP financial measures.
The adjustments to these non-GAAP financial measures, and the basis for such adjustments, are outlined below:
Acquisition accounting for deferred revenue and its related tax impact. Historically, the Company haswe have consummated acquisitions in order to support itsour strategic and other business objectives. In accordance with the fair value provisions applicable to the accounting for business combinations, acquired deferred revenue is often recorded on the opening balance sheet at an amount that is lower than the historical carrying value. Although this acquisition accounting requirement has no impact on the Company'sour business or cash flow, it adversely impacts the Company'sour reported GAAP revenue in the reporting periods following an acquisition. In order to provide investors with financial information that facilitates comparison of both historical and future results, the Company provideswe provide non-GAAP financial measures which exclude the impact of the acquisition accounting adjustment. The Company believesWe believe that this non-GAAP financial adjustment is useful to investors because it allows investors to (a) evaluate the effectiveness of the methodology and information used by managementus in itsour financial and operational decision-making, and (b) compare our past and future reports of financial results of the Company as the revenue reduction related to acquired deferred revenue will not recur when related annual lease licenses and software maintenance contracts are renewed in future periods.
Amortization of intangible assets from acquisitions and its related tax impact. The Company incurs We incur amortization of intangible assets, included in itsour GAAP presentation of amortization expense, related to various acquisitions it haswe have made. Management excludesWe exclude these expenses and their related tax impact for the purpose of calculating non-GAAP operating income, non-GAAP operating profit margin, non-GAAP net income and non-GAAP diluted earnings per share when it evaluates thewe evaluate our continuing operational performance of the Company because these costs are fixed at the time of an acquisition, are then amortized over a period of several years after the acquisition and generally cannot be changed or influenced by managementus after the acquisition. Accordingly, management doeswe do not consider these expenses for purposes of evaluating theour performance of the Company during the applicable time period after the acquisition, and it excludeswe exclude such expenses when making decisions to allocate resources. The Company believesWe believe that these non-GAAP financial measures are useful to investors because they allow investors to (a) evaluate the effectiveness of the methodology and information used by managementus in itsour financial and operational decision-making, and (b) compare our past reports of financial results of the Company as the Company haswe have historically reported these non-GAAP financial measures.
Stock-based compensation expense and its related tax impact. The Company incursWe incur expense related to stock-based compensation included in itsour GAAP presentation of cost of software licenses; cost of maintenance and service; research and development expense; and selling, general and administrative expense. This non-GAAP adjustment also includes excess payroll tax expense related to stock-based compensation. Stock-based compensation expense (benefit) incurred in connection with the Company'sour deferred compensation plan held in a rabbi trust includes an offsetting benefit (charge) recorded in other income (expense). Although stock-based compensation is an expense of the Company and viewed as a form of compensation, management excludeswe exclude these expenses for the purpose of calculating non-GAAP operating income, non-GAAP operating profit margin, non-GAAP net income and non-GAAP diluted earnings per share when it evaluates thewe evaluate our continuing operational performance of the Company. Managementperformance. We similarly excludesexclude income (expense) related to assets held in a rabbi trust in connection with the Company'sour deferred compensation plan. Specifically, the Company excludeswe exclude stock-based compensation and income (expense) related to assets held in the deferred compensation plan rabbi trust during itsour annual budgeting process and itsour quarterly and annual assessments of the Company's and management'sour performance. The annual budgeting process is the primary mechanism whereby the Company allocateswe allocate resources to various initiatives and operational requirements. Additionally, the annual review by theour board of directors during which it compares the Company'sour historical business model and profitability to the planned business model and profitability for the forthcoming year excludes the impact of stock-based compensation. In evaluating the performance of our senior management and department managers, charges related to stock-based compensation are excluded from expenditure and profitability results. In fact, the Company recordswe record stock-based compensation expense into a stand-alone cost center for which no single operational manager is responsible or accountable. In this way, management is able towe can review, on a period-to-period basis, each manager's performance and assess financial discipline over operational expenditures without the effect of stock-based compensation. The Company believesWe believe that these non-GAAP financial measures are useful to investors because they allow investors to (a) evaluate the Company'sour operating results and the effectiveness of the methodology used by managementus to review the Company'sour operating results, and (b) review historical comparability in the Company'sour financial reporting as well as comparability with competitors' operating results.
Restructuring charges and the related tax impact. The Company We occasionally incursincur expenses for restructuring itsour workforce included in itsour GAAP presentation of cost of software licenses; cost of maintenance and service; research and development expense; and selling, general and administrative expense. Management excludesWe exclude these expenses for the purpose of calculating non-GAAP operating income, non-GAAP operating profit margin, non-GAAP net income and non-GAAP diluted earnings per share when it evaluates thewe evaluate our continuing operational performance, of the Company, as itwe generally generally doesdo not incur these expenses as a part of itsour operations. The Company believesWe believe that these non-GAAP financial measures are useful to investors because they allow investors to (a) evaluate the Company'sour operating results and the effectiveness of the methodology used by managementus to review the Company'sour operating results, and (b) review historical comparability in the Company'sour financial reporting as well as comparability with competitors' operating results.
Transaction costs related to business combinations. The Company incurs We incur expenses for professional services rendered in connection with business combinations, which are included in itsour GAAP presentation of selling, general and administrative expense. These expenses are generally not tax-deductible. Management excludesWe exclude these acquisition-related transaction expenses, derived from announced
acquisitions, for the purpose of calculating non-GAAP operating income, non-GAAP operating profit margin, non-GAAP net income and non-GAAP diluted earnings per share when it evaluates thewe evaluate our continuing operational performance, of the Company, as itwe generally would not have otherwise incurred these expenses in the periods presented as a part of itsour operations. The Company believesWe believe that these non-GAAP financial measures are useful to investors because they allow investors to (a) evaluate the Company'sour operating results and the effectiveness of the methodology used by managementus to review the Company'sour operating results, and (b) review historical comparability in the Company'sour financial reporting as well as comparability with competitors' operating results.
Tax Cuts and Jobs Act. We recorded impacts to our income tax provision related to the enactment of the Tax Cuts and Jobs Act, specifically for the transition tax related to unrepatriated cash and the impacts of the tax rate change on net deferred tax assets. We exclude these impacts for the purpose of calculating non-GAAP net income and non-GAAP diluted earnings per share when we evaluate our continuing operational performance, as (i) the charges are not expected to recur as part of our normal operations and (ii) the charges resulted from the extremely infrequent event of major U.S. tax reform, the last such reform having occurred in 1986. We believe that these non-GAAP financial measures are useful to investors because they allow investors to (a) evaluate our operating results and the effectiveness of the methodology used by us to review our operating results, and (b) review historical comparability in our financial reporting.
Non-GAAP financial measures are not in accordance with, or an alternative for, GAAP. The Company'sOur non-GAAP financial measures are not meant to be considered in isolation or as a substitute for comparable GAAP financial measures and should be read only in conjunction with the Company'sour consolidated financial statements prepared in accordance with GAAP.
The Company hasWe have provided a reconciliation of the non-GAAP financial measures to the most directly comparable GAAP financial measures as listed below:
|
| |
| GAAP Reporting Measure | Non-GAAP Reporting Measure |
| Revenue | Non-GAAP Revenue |
| Operating Income | Non-GAAP Operating Income |
| Operating Profit Margin | Non-GAAP Operating Profit Margin |
| Net Income | Non-GAAP Net Income |
| Diluted Earnings Per Share | Non-GAAP Diluted Earnings Per Share |
Liquidity and Capital Resources
| | | | | As of December 31, | | Change | | As of December 31, | | Change |
| (in thousands, except percentages) | | 2016 | | 2015 | | Amount | | % | | 2019 | | 2018 | | Amount | | % |
| Cash, cash equivalents and short-term investments | | $ | 822,860 |
| | $ | 784,614 |
| | $ | 38,246 |
| | 4.9 | | $ | 872,382 |
| | $ | 777,364 |
| | $ | 95,018 |
| | 12.2 |
| Working capital | | $ | 630,301 |
| | $ | 592,280 |
| | $ | 38,021 |
| | 6.4 | | $ | 860,340 |
| | $ | 786,410 |
| | $ | 73,930 |
| | 9.4 |
Cash, Cash Equivalents and Short-Term Investments
Cash and cash equivalents consist primarily of highly liquid investments such as money market funds and deposits held at major banks. Short-term investments consist primarily of deposits held by certain of our foreign subsidiaries of the Company with original maturities of three months to one year. The following table presents the Company'sour foreign and domestic holdings of cash, cash equivalents and short-term investments:
| | | | As of December 31, | As of December 31, |
| (in thousands, except percentages) | 2016 | | % of Total | | 2015 | | % of Total | 2019 | | % of Total | | 2018 | | % of Total |
| Domestic | $ | 593,348 |
| | 72.1 | | $ | 539,031 |
| | 68.7 | $ | 626,433 |
| | 71.8 | | $ | 616,249 |
| | 79.3 |
| Foreign | 229,512 |
| | 27.9 | | 245,583 |
| | 31.3 | 245,949 |
| | 28.2 | | 161,115 |
| | 20.7 |
| Total | $ | 822,860 |
| | $ | 784,614 |
| | $ | 872,382 |
| | $ | 777,364 |
| |
If the foreign balances were repatriated to the U.S., unless previously taxed in the U.S., they would be subject to domestic tax, resulting in a tax obligation in the period of repatriation. In general, it is the practice andour intention to permanently reinvest all earnings in excess of previously taxed amounts. As part of Tax Reform, substantially all of the Company to repatriateprevious earnings of our non-U.S. subsidiaries were taxed through the transition tax and current earnings are taxed as part of GILTI tax expense. These taxes increased our previously taxed earnings and allow for the repatriation of the majority of our foreign earnings without any residual U.S. federal tax. While we believe that the financial reporting bases may be greater than the tax bases of investments in foreign subsidiaries for any earnings in excess of previously taxed amounts, such amounts are considered permanently reinvested. The cumulative temporary difference related to reinvest all othersuch permanently reinvested earnings is approximately $32.8 million and we would anticipate the tax effect on those earnings to be immaterial as a result of its non-U.S. subsidiaries. Tax Reform.
The amount of cash, cash equivalents and short-term investments held by foreign subsidiaries is subject to translation adjustments caused by changes in foreign currency exchange rates as of the end of each respective reporting period, the offset to which is recorded in accumulated other comprehensive loss on the Company'sour consolidated balance sheet.
Cash Flows from Operating Activities
| | | | | Year Ended December 31, | | Change | | Year Ended December 31, | | Change |
| (in thousands) | | 2016 | | 2015 | | 2014 | | 2016 vs. 2015 | | 2015 vs. 2014 | | 2019 | | 2018 | | 2017 | | 2019 vs. 2018 | | 2018 vs. 2017 |
| Net cash provided by operating activities | | $ | 356,827 |
| | $ | 367,523 |
| | $ | 385,307 |
| | $ | (10,696 | ) | | $ | (17,784 | ) | | $ | 499,936 |
| | $ | 484,988 |
| | $ | 427,660 |
| | $ | 14,948 |
| | $ | 57,328 |
|
Fiscal year 20162019 as compared to fiscal year 20152018
Net cash provided by operating activities decreasedincreased during the current fiscal year due to increased net income (net of non-cash operating adjustments) of $107.4 million, partially offset by decreased net cash flows from operating assets and liabilities of $19.0 million, partially offset$92.4 million.
Fiscal year 2018 as compared to fiscal year 2017
Net cash provided by operating activities increased during the prior fiscal year due to increased net income (net of non-cash operating adjustments) of $8.3 million. The Company experienced an increase in net tax payments of $8.5$151.4 million, in 2016 as compared to 2015 as the current year benefited less from prior year overpayments.
Fiscal year 2015 as compared to fiscal year 2014
Net cash providedpartially offset by operating activities decreased during the prior fiscal year due to decreased net cash flows from operating assets and liabilities of $18.2 million, primarily due to a $26.8 million refund received in 2014 related to the Company's 2009 and 2010 federal income tax years.$94.1 million.
Cash Flows from Investing Activities
| | | | | Year Ended December 31, | | Change | | Year Ended December 31, | | Change |
| (in thousands) | | 2016 | | 2015 | | 2014 | | 2016 vs. 2015 | | 2015 vs. 2014 | | 2019 | | 2018 | | 2017 | | 2019 vs. 2018 | | 2018 vs. 2017 |
| Net cash used in investing activities | | $ | (32,173 | ) | | $ | (62,032 | ) | | $ | (129,270 | ) | | $ | 29,859 |
| | $ | 67,238 |
| | $ | (833,548 | ) | | $ | (312,231 | ) | | $ | (94,665 | ) | | $ | (521,317 | ) | | $ | (217,566 | ) |
Fiscal year 20162019 as compared to fiscal year 20152018
Net cash used in investing activities decreasedincreased during the current fiscal year due primarily to decreasedincreased acquisition-related net cash outlays of $38.2$504.2 million and decreasedincreased capital expenditures of $3.7 million, partially offset by increased net cash outlays of $12.1 million for other investing activities. The Company$23.2 million. We currently plansplan capital spending of $15$45.0 million to $20$55.0 million during fiscal year 20172020 as compared to the $12.4$44.9 million that was spent in 2016.fiscal year 2019. The level of spending will be dependent upondepend on various factors, including the growth of the business and general economic conditions.
Fiscal year 20152018 as compared to fiscal year 20142017
Net cash used in investing activities increased during the prior fiscal year due primarily to increased acquisition-related net cash outlays of $219.1 million.
Cash Flows from Financing Activities
|
| | | | | | | | | | | | | | | | | | | | |
| | | Year Ended December 31, | | Change |
| (in thousands) | | 2019 | | 2018 | | 2017 | | 2019 vs. 2018 | | 2018 vs. 2017 |
| Net cash provided by (used in) financing activities | | $ | 429,409 |
| | $ | (262,675 | ) | | $ | (294,651 | ) | | $ | 692,084 |
| | $ | 31,976 |
|
Fiscal year 2019 as compared to fiscal year 2018
Net cash provided by financing activities increased during the current fiscal year due primarily to $500.0 million in proceeds from long-term debt obtained in fiscal year 2019 related to the LST acquisition and decreased stock repurchases of $210.7 million, partially offset by increased restricted stock unit withholding taxes paid in lieu of issuing shares of $13.6 million.
Fiscal year 2018 as compared to fiscal year 2017
Net cash used in financing activities decreased during the prior fiscal year due primarily to decreased acquisition-related net cash outlaysstock repurchases of $56.9$66.2 million, partially offset by increased restricted stock unit withholding taxes paid in lieu of issuing shares of $17.8 million and decreased capital expenditures of $9.9 million.
Cash Flows from Financing Activities:
|
| | | | | | | | | | | | | | | | | | | | |
| | | Year Ended December 31, | | Change |
| (in thousands) | | 2016 | | 2015 | | 2014 | | 2016 vs. 2015 | | 2015 vs. 2014 |
| Net cash used in financing activities | | $ | (279,477 | ) | | $ | (291,751 | ) | | $ | (185,642 | ) | | $ | 12,274 |
| | $ | (106,109 | ) |
Fiscal year 2016 as compared to fiscal year 2015
Net cash used in financing activities decreased during the current fiscal year due primarily to increased proceeds from shares issued for stock-based compensation of $10.2 million.
Fiscal year 2015 as compared to fiscal year 2014
Net cash used in financing activities increased during the prior fiscal year due primarily to increased stock repurchases of $104.1$11.5 million.
Other Cash Flow Information
The Company believesWe believe that existing cash and cash equivalent balances of $822.5$872.1 million, together with cash generated from operations and access to the $500.0 million revolving credit facility, will be sufficient to meet the Company'sour working capital and capital expenditure requirements through the next twelve months. The Company'sOur cash requirements in the future may also be financed through additional equity or debt financings. There can be no assurance that such financings can be obtained on favorable terms, if at all. We repaid $75.0 million of our unsecured term loan in January 2020 prior to its scheduled maturity date.
Under the Company'sour stock repurchase program, the Companywe repurchased shares as follows:
| | | | Year Ended December 31, | Year Ended December 31, |
| (in thousands, except per share data) | 2016 | | 2015 | | 2014 | 2019 | | 2018 | | 2017 |
| Number of shares repurchased | 3,700 |
| | 3,833 |
| | 2,977 |
| 330 |
| | 1,674 |
| | 2,750 |
|
| Average price paid per share | $ | 90.90 |
| | $ | 88.16 |
| | $ | 78.54 |
| $ | 179.41 |
| | $ | 161.12 |
| | $ | 122.20 |
|
| Total cost | $ | 336,335 |
| | $ | 337,910 |
| | $ | 233,793 |
| $ | 59,116 |
| | $ | 269,801 |
| | $ | 336,042 |
|
In February 2017, the Company's2018, our Board of Directors increased the number of shares authorized for repurchase to a total of 5.0 million shares under the stock repurchase program. As of December 31, 2016, 1.32019, 3.5 million shares remained available for repurchase under the program.
The authorized repurchase program does not have an expiration date, and the pace of the repurchase activity will depend on factors such as working capital needs, cash requirements for acquisitions, our stock price, and economic and market conditions. Our stock repurchases may be effected from time to time through open market purchases or pursuant to a Rule 10b5-1 plan.
The Company continuesWe continue to generate positive cash flows from operating activities and believesbelieve that the best uses of itsour excess cash are to invest in the business and repurchase stock in order to both offset dilution and return capital, in excess of its requirements, to stockholders with the goal of increasing stockholder value. Additionally, the Company has in the past, and expects in the future, tobusiness; acquire or make investments in complementary companies, products, services and technologies.technologies; and make payments on our outstanding debt balances. Any future acquisitions may be funded by available cash and investments, cash generated from operations, credit facilities,debt financing, or the issuance of additional securities. Additionally, we have in the past, and expect in the future, to repurchase stock in order to both offset dilution and return capital, in excess of our requirements, to stockholders with the goal of increasing stockholder value.
Off-Balance-Sheet Arrangements
The Company doesWe do not have any special-purpose entities or off-balance-sheet financing.arrangements.
Contractual Obligations
The Company'sOur significant contractual obligations as of December 31, 20162019 are summarized below:
|
| | | | | | | | | | | | | | | | | | | | |
| | | Payments Due by Period |
| (in thousands) | | Total | | Within 1 year | | 2 – 3 years | | 4 – 5 years | | After 5 years |
Global headquarters operating lease(1) | | $ | 40,859 |
| | $ | 4,278 |
| | $ | 8,556 |
| | $ | 8,928 |
| | $ | 19,097 |
|
Other operating leases(2) | | 29,808 |
| | 9,861 |
| | 12,814 |
| | 4,752 |
| | 2,381 |
|
Unconditional purchase obligations(3) | | 37,415 |
| | 14,134 |
| | 20,012 |
| | 3,269 |
| | — |
|
Obligations related to uncertain tax positions, including interest and penalties(4) | | 2 |
| | 2 |
| | — |
| | — |
| | — |
|
Other long-term obligations(5) | | 30,846 |
| | 13,292 |
| | 11,472 |
| | 1,763 |
| | 4,319 |
|
| Total contractual obligations | | $ | 138,930 |
| | $ | 41,567 |
| | $ | 52,854 |
| | $ | 18,712 |
| | $ | 25,797 |
|
|
| | | | | | | | | | | | | | | | | | | | |
| | | Payments Due by Period |
| (in thousands) | | Total | | Within 1 year | | 2 – 3 years | | 4 – 5 years | | After 5 years |
| Long-term debt: | |
|
| | | | | | | | |
Principal payments(1) | | $ | 500,000 |
| | $ | — |
| | $ | 25,000 |
| | $ | 475,000 |
| | $ | — |
|
Interest payments(2) | | 70,488 |
| | 17,372 |
| | 29,400 |
| | 23,716 |
| | — |
|
Global headquarters operating lease(3) | | 45,199 |
| | 4,464 |
| | 8,928 |
| | 8,944 |
| | 22,863 |
|
Other operating leases(4) | | 83,566 |
| | 17,153 |
| | 27,127 |
| | 15,990 |
| | 23,296 |
|
Unconditional purchase obligations(5) | | 71,382 |
| | 37,183 |
| | 24,723 |
| | 9,476 |
| | — |
|
Obligations related to uncertain tax positions, including interest and penalties(6) | | — |
| | — |
| | — |
| | — |
| | — |
|
Other long-term obligations(7) | | 44,767 |
| | 22,776 |
| | 10,568 |
| | 2,856 |
| | 8,567 |
|
| Total contractual obligations | | $ | 815,402 |
| | $ | 98,948 |
| | $ | 125,746 |
| | $ | 535,982 |
| | $ | 54,726 |
|
| |
| (1) | On September 14, 2012,We repaid $75.0 million of the Companyunsecured term loan in January 2020 prior to its scheduled maturity date. As such, the payment is reflected as current on our consolidated balance sheet but not in the table above. |
| |
| (2) | Interest on the long-term debt is estimated using the interest rate as of December 31, 2019, as the interest rate is variable. For additional information, see Note 10 to the consolidated financial statements included in Part IV, Item 15 of this Annual Report on Form 10-K. The interest payments reflected in the table above have not been reduced for the effect of the $75.0 million principal payment discussed in (1) above. |
| |
| (3) | We previously entered into a lease agreement for 186,000 square feet of rentable space located in an office facility in Canonsburg, Pennsylvania, which serves as the Company'sour headquarters. The lease was effective as of September 14, 2012, but because the leased premises were under construction, the Company was not obligated to pay rent until three months following the date that the leased premises were delivered to ANSYS, which occurred on October 1, 2014. The term of the lease is 183 months, beginning on October 1, 2014. The Company has2014 and expiring on December 31, 2029. We have a one-time right to terminate the lease effective upon the last day of the tenth full year following the date of possession (Decemberon December 31, 2024)2025 by providing the landlord with at least 18 months' prior written notice of such termination. |
| |
(2)(4) | Other operating leases primarily include noncancellable lease commitments for the Company'sour other domestic and international offices as well as certain operating equipment. |
| |
(3)(5) | Unconditional purchase obligations primarily include royalties and software licenses and long-term purchase contracts for network, communication and office maintenance services, which are unrecorded as of December 31, 2016.2019. |
| |
(4)(6) | The Company has $18.4We have $64.4 million of unrecognized tax benefits, including estimated interest and penalties, that have been recorded as liabilities in accordance with income tax accounting guidance for which the Company iswe are uncertain as to if or when such amounts may be settled. As a result, such amounts are excluded from the table above. |
| |
(5)(7) | Other long-term obligations primarily include third-party commissions of $15.0 million, deferred compensation of $7.4 million (including estimated imputed interest of $161,000 within 1 year and $87,000 within 2-3 years) and$28.3 million; post-employment benefits, including pension obligations, of $6.5$12.7 million for certain foreign locationslocations; and office space restoration of the Company.$3.1 million. These amounts include the related current portions when applicable. |
Critical Accounting Policies and Estimates
The Company believesWe believe that the following critical accounting policies affect the more significant judgments and estimates used in the preparation of itsour consolidated financial statements.
Revenue Recognition: RevenueRecognition: Our revenue is derived principally from the licensing of computer software products and from related maintenance contracts. We adopted ASC 606 on January 1, 2018 using the modified retrospective approach for all contracts not completed as of the date of adoption. Results for reporting periods beginning after January 1, 2018 are presented under ASC 606, while prior period amounts are not adjusted and continue to be reported in accordance with ASC 605. The adoption of ASC 606 represents a change in accounting principle that will more closely align revenue recognition with the delivery of our software licenses, maintenance and services.
Revenue Recognition Policy 2019 and 2018 (ASC 606)
We enter into contracts that include combinations of products, maintenance and services, which are accounted for as separate performance obligations with differing revenue recognition patterns.
Revenue from perpetual licenses is classified as software license revenue. Software license revenue and is recognized up front upon delivery of the licensed product andand/or the utility that enables the customer to access authorization keys, provided that acceptance has occurred and a signed contractual obligationan enforceable contract has been received, the price is fixedreceived. Typically, our perpetual licenses are sold with post-contract support (PCS), which includes unspecified technical enhancements and determinable,customer support. We allocate value in bundled perpetual and collectibility of the receivable is probable. The Company determines the fair value of post-contract customer support ("PCS") sold together with perpetual licensesPCS arrangements based on the rate charged for PCS when sold separately.standalone selling prices of the perpetual license and PCS. Revenue from PCS contracts is classified as maintenance and service revenue and is recognized ratably over the term of the contract.contract, as we satisfy the PCS performance obligation over time.
RevenueIn addition to perpetual licenses, we sell time-based lease licenses. Lease licenses are sold only as a bundled arrangement that includes the rights to a term software license and PCS. Utilizing observable inputs, we determined that 50% of the estimated standalone selling price of the lease license is attributable to the term license and 50% is attributable to the PCS. This determination considered the value relationship for softwareour products between PCS to time-based lease licenses, the value relationship between PCS and perpetual licenses, the average economic life of our products, software renewal rates and the price of the bundled arrangement in relation to the perpetual licensing approach. Consistent with the perpetual sales, the license component is classified as software license revenue and recognized as revenue up front at the commencement of the lease upon delivery of the licensed product and/or utility that enables the customer to access authorization keys. The PCS is classified as maintenance revenue and is recognized over the period of the lease contract. Typically, the Company's software leases include PCS which, due to the short term (principally one year or less) of the Company's software lease licenses, cannot be separated from lease revenue for accounting purposes. As a result, both the lease licenses and PCS are recognized ratably over the lease period. Due to the short-term nature of the software lease licenses and the frequency with which the Company provides major product upgrades (typically annually), the Company does not believe that a significant portion of the fee paid under the arrangement is attributable to the PCS component of the arrangement and, as a result, includes the revenue for the entire arrangement within software license revenue in the consolidated statements of income.
Many of the Company's semiconductor products are typically licensed via longer term leases of 24–36 months. The Company recognizes revenue for these licenses over the term of the lease contract. Becausecontract, as we provide the Company does not have vendor-specific objective evidence of the fair value of these leases, the Company also recognizes revenue from perpetual licensesPCS benefit over the term of the lease contract during the infrequent occurrence of these licenses being sold with semiconductor leases in multiple-element arrangements.time.
Revenue from training, support and other services is recognized as the services are performed. The Company applies the specific performance method toFor contracts in which the service consists of a single act,performance obligation, such as providing a training class to a customer, andwe recognize revenue upon completion of the proportional performance method to otherobligation. For service contracts that are longer in duration and often include multiple actsperformance obligations (for example, both training and consulting)., we measure the progress toward completion of the obligations and recognize revenue accordingly. In applyingmeasuring progress towards the proportionalcompletion of performance method, the Companyobligations, we typically utilizesutilize output-based estimates for services with contractual billing arrangements that are not based on time and materials, and estimatesestimate output based on the total tasks completed as compared to the total tasks required for each work contract. Input-based estimates are utilized for services that involve general consultations with contractual billing arrangements based on time and materials, utilizing direct labor as the input measure. Proceeds from customers for the purpose of expediting road-map items, developing new products or creating specific features and functionality for existing products is classified as revenue.
The CompanyWe also executesexecute arrangements through independent channel partners in which the channel partners are authorized to market and distribute the Company'sour software products to end users of the Company'sour products and services in specified territories. In sales facilitated by channel partners, the channel partner bears the risk of collection from the end-user customer. The Company recognizesWe recognize revenue from transactions with channel partners whenin a manner consistent with the channel partner submits a written purchase commitment, collectibility from the channel partner is probable, a license agreement signed by the end-user customer is receiveddirect sales described above for both perpetual and delivery has occurred, provided that all other revenue recognition criteria are satisfied.time-based licenses. Revenue from channel partner transactions is the amount remitted to the Companyus by the channel partners. This amount includes a fee for PCS that is compensation for providing technical enhancements and the second level of technical support to the end user, which is based on the rate charged for PCS when sold separately, and is recognized over the period that PCS is to be provided. The Company does not offer right of return, product rotation or price protection to any of its channel partners.
Non-income related taxes collected from customers and remitted to governmental authorities are recorded on the consolidated balance sheet as accounts receivable and accrued expenses. The collection and payment of these amounts are reported on a net basis in the consolidated statements of income and do not impact reported revenues or expenses.
The Company warrantsWe do not offer right of return. We warrant to itsour customers that itsour software will perform substantially perform as specified in the Company's mostour current user manuals. The Company hasWe have not experienced significant claims related to software warranties beyond the scope of
maintenance support, which the Company iswe are already obligated to provide. Consequently,The warranty is not sold, and cannot be purchased, separately. The warranty does not provide any type of additional service to the Company has not established reservescustomer or performance obligation for warranty obligations.us.
The Company'sOur agreements with itsour customers generally require itus to indemnify the customer against claims that the Company'sour software infringes third-party patent, copyright, trademark or other proprietary rights. Such indemnification obligations are generally limited in a variety of industry-standard respects, including the Company'sour right to replace an infringing product. As of December 31, 2016,
Significant Judgments (ASC 606)
Our contracts with customers typically include promises to transfer licenses and services to a customer. Judgment is required to determine if the Company had not experienced any losses related to these indemnificationpromises are separate performance obligations, and no claimsif so, to allocate the transaction price to each performance obligation. We use the estimated standalone selling price method to allocate the transaction price for each performance obligation. The estimated standalone selling price is determined using all information reasonably available to us, including market conditions and other observable inputs. The corresponding revenues are recognized as the related performance obligations are satisfied.
We apply a practical expedient to expense sales commissions as incurred when the amortization period would have been one year or less. Sales commissions associated with respect thereto were outstanding. The Company doesthe initial year of multi-year contracts are expensed as incurred due to their immateriality. Sales commissions associated with multi-year contracts beyond the initial year are subject to an employee service requirement and are expensed as incurred as they are not expectconsidered incremental costs to obtain a contract.
We are required to adjust promised amounts of consideration for the effects of the time value of money if the timing of the payments provides the customer or us with a significant claims relatedfinancing benefit. We consider various factors in assessing whether a financing component exists, including the duration of the contract, market interest rates and the timing of payments. Our contracts do not include a significant financing component requiring adjustment to these indemnification obligations,the transaction price.
Revenue Recognition Policy 2017 (ASC 605)
Revenue from perpetual licenses was classified as license revenue and consequently,was recognized upon delivery of the Company has not established any related reserves.
Allowance for Doubtful Accounts: The Company makes judgments aslicensed product and/or the utility that enabled the customer to its ability to collect outstanding receivablesaccess authorization keys, provided that acceptance had occurred and provides allowances for a portion of receivables when collection becomes doubtful. Provisions are made based upon a specific review of all significant outstanding invoices from both valuesigned contractual obligation was received, the price was fixed and delinquency perspectives. For those invoices not specifically reviewed, provisions are provided at differing rates based upon the agedeterminable, and collectibility of the receivable was probable. We determined the fair value of PCS sold together with perpetual licenses based on the rate charged for PCS when sold separately. Revenue from PCS contracts was classified as maintenance and service revenue and was recognized ratably over the term of the contract.
Revenue for software lease licenses was classified as license revenue and was recognized over the period of the lease contract. Typically, our software leases include PCS which, due to the short term (principally one year or less) of our software lease licenses, were not permitted to be separated from lease revenue for accounting purposes. As a result, both the lease licenses and PCS were recognized ratably over the lease period. We included the revenue for the entire lease arrangement within software license revenue in the consolidated statements of income.
Many of our semiconductor products are typically licensed via longer term leases of 24–36 months. We recognized revenue for these licenses over the term of the lease contract. Because we did not have vendor-specific objective evidence of the fair value of these leases, we also recognized revenue from perpetual licenses over the term of the lease contract during the infrequent occurrence of these licenses being sold with semiconductor leases in multiple-element arrangements.
Revenue from training, support and other services was recognized as the services were performed. We applied the specific performance method to contracts in which the service consisted of a single act, such as providing a training class to a customer, and the geographic areaproportional performance method to other service contracts that were longer in duration and often included multiple acts (for example, both training and consulting). In applying the proportional performance method, we typically utilized output-based estimates for services with contractual billing arrangements that were not based on time and materials, and estimated output based on the total tasks completed as compared to the total tasks required for each work contract. Input-based estimates were utilized for services that involved general consultations with contractual billing arrangements based on time and materials, utilizing direct labor as the input measure.
The accounting treatment under ASC 605 associated with arrangements through independent channel partners, non-income related taxes, warranties and indemnification obligations is consistent with the accounting treatment under ASC 606 described above.
Goodwill and Other Intangible Assets: We test goodwill and indefinite-lived intangible assets for impairment at least annually by performing a quantitative assessment of origin. In determiningwhether the fair value of each reporting unit or asset exceeds its carrying amount. We have one reporting unit. Goodwill is tested at this reporting unit level and indefinite-lived intangible assets are tested at the individual asset level. This requires us to assess and make judgments regarding a variety of factors which impact the fair value
of the reporting unit or asset being tested, including business plans, anticipated future cash flows, economic projections and other market data. Because there are inherent uncertainties involved in these percentages,factors, significant differences between these estimates and actual results could result in future impairment charges and could materially impact our future financial results. During the Company considers its historical collection experiencefirst quarter of 2019, we completed the annual impairment test for goodwill and current economic trendsthe indefinite-lived intangible asset and determined that these assets had not been impaired as of the test date, January 1, 2019. No other events or circumstances changed during the year ended December 31, 2019 that would indicate that the fair values of our reporting unit and indefinite-lived intangible asset are below their carrying values.
Intangible assets are recognized apart from goodwill whenever an acquired intangible asset arises from contractual or other legal rights, or whenever it is capable of being separated or divided from the acquired entity and sold, transferred, licensed, rented, or exchanged, either individually or in combination with a related contract, asset or liability. We determined the customer'sfair value of our intangible assets using various valuation techniques, including the relief-from-royalty method and the multi-period excess earnings method. These models utilize certain unobservable inputs classified as Level 3 measurements as defined by ASC 820, Fair Value Measurements and Disclosures. The determination of fair value requires considerable judgment and is sensitive to changes in underlying assumptions, estimates and market factors. Estimating fair value requires us to make assumptions and estimates regarding our future plans, as well as industry and geographic region. Ifeconomic conditions. These assumptions and estimates include, but are not limited to: royalty rate, discount rate and attrition rate. The fair values of the historical data used to calculateintangible assets will be amortized over their useful lives. Impairment losses are recognized if the allowance for doubtful accounts doescarrying amounts of finite-lived intangible assets are both not reflectrecoverable and exceed the future ability to collect outstanding receivables, additional provisions for doubtful accounts may be needed and future results of operations could be materially affected.fair values.
Income Taxes: The Company accountsTaxes: We account for income taxes under the asset and liability method, which requires the recognition of deferred tax assets and liabilities for the expected future tax consequences of events that have been included in the financial statements. Under this method, deferred tax assets and liabilities are determined based on the differences between the financial statement and tax bases of assets and liabilities using enacted tax rates in effect for the year in which the differences are expected to reverse. The effect of a change in tax rates on deferred tax assets and liabilities is recognized in income in the period of the enactment date.
The Company recordsWe record net deferred tax assets to the extent it believeswe believe these assets will more likely than not be realized. In making such determination, the Company considerswe consider all available positive and negative evidence, including scheduled reversals of deferred tax liabilities, projected future taxable income, tax planning strategies and recent financial operations. In the event the Company determineswe determine that itwe will be able to realize deferred tax assets for which a valuation allowance was used to reduce their carrying value, the adjustment to the valuation allowance will be recorded as a reduction to the provision for income taxes.
Tax benefits related to uncertain tax positions taken or expected to be taken on a tax return are recorded when such benefits meet a more-likely-than-not threshold. Otherwise, these tax benefits are recorded when a tax position has been effectively settled, which means that the statute of limitations has expired or the appropriate taxing authority has completed theirits examination even though the statute of limitations remains open. The Company recognizes
We recognize interest and penalties related to income taxes within the income tax expense line in the consolidated statements of income. Accrued interest and penalties are included within the related tax liability line in the consolidated balance sheets.
GoodwillStock-Based Compensation: We grant restricted stock units and Indefinite-Lived Intangible Assets: other stock awards to employees and directors under our equity incentive plan. Eligible employees can also purchase shares of our common stock at a discount under our employee stock purchase plan. The Company tests goodwillbenefits provided under these plans are stock-based payments subject to the provisions of stock-based payment accounting guidance. We use the fair value method to apply the provisions of stock-based payment accounting guidance. Stock-based compensation expense for 2019, 2018 and indefinite-lived intangible assets2017 was $116.2 million, $83.3 million and $53.2 million, respectively. As of December 31, 2019, total unrecognized estimated compensation expense related to awards granted prior to that date was $186.4 million, which is expected to be recognized over a weighted average period of 1.5 years.
Prior to 2017, we granted stock option awards. The value of each stock option award was estimated on the date of grant, or date of acquisition for impairment at least annually by performingoptions issued in a quantitative assessmentbusiness combination, using the Black-Scholes option pricing model (Black-Scholes model). The determination of whether the fair value of each reporting unit or asset exceeds its carrying amount. Goodwill is tested at the reporting unit level and indefinite-lived intangible assets are tested at the individual asset level. This requires the Company to assess and make judgmentsstock-based payment awards using an option pricing model was affected by our stock price as well as assumptions regarding a varietynumber of factorscomplex and subjective variables. These variables included our stock volatility during the preceding six years, actual and projected employee stock option exercise behaviors, interest rate assumptions using the five-year U.S. Treasury Note yield on the date of grant or acquisition date, and expected dividends. The stock-based compensation expense for options is recorded ratably over the requisite service period.
We issue various restricted stock unit awards which impactcontain either a market condition, a performance condition, a service condition, or certain combinations of the three. Restricted stock unit awards are valued based on the grant-date fair value of the award. Stock-based compensation expense is recognized over the employee's requisite service period for awards with only a service condition. For awards with a performance condition, stock-based compensation expense is recorded from the service
inception date through the conclusion of the measurement period based on management's estimates concerning the probability of vesting.
Vesting of restricted stock unit awards with a market condition is based on our performance as measured by total stockholder return relative to the appreciation of a specified stock index over the measurement period, subject to each participant's continued employment through the conclusion of the measurement period. The fair value of the restricted stock unit awards with a market condition is estimated using a Monte Carlo simulation model. The determination of the fair value of the awards is affected by the grant date and several variables, each of which has been identified in the chart below. Stock-based compensation expense based on the fair value of the award is recorded from the grant date through the conclusion of the measurement period.
|
| | | | | |
| | Year Ended December 31, |
| Assumptions used in Monte Carlo lattice pricing model | 2019 | | 2018 | | 2017 |
| Risk-free interest rate | 2.5% | | 2.4% | | 1.5% |
| Expected dividend yield | —% | | —% | | —% |
| Expected volatility—Ansys stock price | 23% | | 21% | | 19% |
| Expected volatility—Nasdaq Composite Index | 16% | | 15% | | 15% |
| Expected term | 2.8 years | | 2.8 years | | 2.8 years |
| Correlation factor | 0.71 | | 0.65 | | 0.70 |
| Weighted average fair value per share | $238.99 |
| $191.76 |
| $120.94 |
We also grant restricted stock units to non-employee Directors, which vest upon the earlier of one year from the date of grant or the date of the next regular annual meeting of stockholders. If a non-employee Director retires prior to the vest date, the non-employee Director receives a pro-rata portion of the restricted stock units.
To the extent we change the terms of our stock-based compensation programs, experience market volatility in the pricing of our common stock that increases the implied volatility assumption used in the pricing models, refine different assumptions, or assume stock awards from acquired companies that are different in nature than our stock award arrangements, among other potential impacts, the stock-based compensation expense recorded in future periods and the related tax benefits may differ significantly from what was recorded in previous reporting unit or asset being tested, including business plans, anticipated future cash flows, economic projectionsperiods. Forfeitures of awards are accounted for as they occur.
Estimates of stock-based compensation expense are significant to our financial statements, but this expense is partially based on the aforementioned option valuation and other market data. Because there are inherent uncertainties involved in these factors, significant differences between these estimatesMonte Carlo simulation models and actual results couldwill never result in future impairment chargesthe payment of cash by us other than through the payment of withholding taxes in lieu of additional share issuance. For this reason, and could materially impactbecause we do not view stock-based compensation as related to our operational performance, the Company's future financial results. During the first quarterBoard of 2016, the Company completed the annual impairment test for goodwillDirectors and the indefinite-lived intangible asset and determined that these assets had not been impaired as of the test date, January 1, 2016. No other events or circumstances changed during the twelve months ended December 31, 2016 that would indicate that the fair values of the Company's reporting unit and indefinite-lived intangible assetmanagement exclude stock-based compensation expense when evaluating our underlying business performance.
Contingencies: We are below their carrying values.
Contingencies: The Company is involved in various investigations, claims and legal proceedings that arise in the ordinary course of business, including commercial disputes, labor and employment matters, tax audits, alleged infringement of intellectual property rights and other matters. The Company reviewsWe review the status of these matters, assesses itsassess our financial exposure and recordsrecord a related accrual if the potential loss from an investigation, claim or legal proceeding is probable and the amount is reasonably estimable. Significant judgment is involved in the determination of probability and in the determination of whether an exposure is reasonably estimable. As a result of the uncertainties involved in making these estimates, the Companywe may have to revise itsour estimates as facts and circumstances change. The revision of these estimates could have a material impact on the Company'sour financial position and results of operations.
Stock-Based Compensation: The Company grants options and other stock awards to employees and directors under the Company's stock option and grant plan. Eligible employees can also purchase shares of the Company's common stock at a
discount under the Company's employee stock purchase plan. The benefits provided under these plans are share-based payments subject to the provisions of share-based payment accounting guidance. The Company uses the fair value method to apply the provisions of share-based payment accounting guidance. Stock-based compensation expense for 2016, 2015 and 2014 was $33.3 million, $34.0 million and $36.9 million, respectively. As of December 31, 2016, total unrecognized estimated compensation expense related to unvested stock options and awards granted prior to that date was $65.1 million, which is expected to be recognized over a weighted-average period of 1.9 years.
The value of each stock option award was estimated on the date of grant, or date of acquisition for options issued in a business combination, using the Black-Scholes option pricing model (“Black-Scholes model”). The determination of the fair value of share-based payment awards using an option pricing model is affected by the Company's stock price as well as assumptions regarding a number of complex and subjective variables. These variables include the Company's expected stock price volatility over the term of the awards, actual and projected employee stock option exercise behaviors, risk-free interest rates and expected dividends. The table below presents the weighted-average input assumptions used and resulting fair values for options granted or issued in business combinations during each respective year. The stock-based compensation expense for options is recorded ratably over the requisite service period. The interest rate assumptions were determined by using the five-year U.S. Treasury Note yield on the date of grant or date of acquisition.
|
| | | | | | |
| | | Year Ended December 31, |
| | | 2016 | | 2015 | | 2014 |
| Risk-free interest rate | | 1.19% to 1.93% | | 1.18% to 1.65% | | 1.49% to 1.76% |
| Expected dividend yield | | —% | | —% | | —% |
| Expected volatility | | 24% | | 25% | | 35% |
| Expected term | | 5.7 years | | 5.6 years | | 5.7 years |
| Weighted-average fair value per share | | $23.96 | | $30.83 | | $32.26 |
The Company issues various restricted stock awards which contain a market condition, a performance condition, a service condition, or any combination of the three. Restricted stock awards are valued based on the grant-date fair value of the award. Stock compensation expense is recognized over the employee's requisite service period for awards with only a service condition. For awards with a performance condition, stock-based compensation expense is recorded from the service inception date through the conclusion of the measurement period based on management's estimates concerning the probability of vesting.
Vesting of restricted stock awards with a market condition is based on the Company's performance as measured by total shareholder return relative to the appreciation of a specified stock index over the measurement period, subject to each participant's continued employment with the Company through the conclusion of the measurement period. The fair value of the restricted stock awards with a market condition is estimated using a Monte Carlo simulation model. The determination of the fair value of the awards is affected by the grant date and a number of variables, each of which has been identified in the chart below for awards granted during each respective period. Share-based compensation expense based on the fair value of the award is being recorded from the grant date through the conclusion of the measurement period.
|
| | | | | |
| | Year Ended December 31, |
| Assumptions used in Monte Carlo lattice pricing model | 2016 | | 2015 | | 2014 |
| Risk-free interest rate | 1.0% | | 1.1% | | 0.7% |
| Expected dividend yield | —% | | —% | | —% |
| Expected volatility—ANSYS stock price | 21% | | 23% | | 25% |
| Expected volatility—NASDAQ Composite Index | 16% | | 14% | | 15% |
| Expected term | 2.8 years | | 2.8 years | | 2.8 years |
| Correlation factor | 0.65 | | 0.60 | | 0.70 |
| Weighted-average fair value per share | $78.71 |
| $81.61 |
| $65.94 |
The Company also grants deferred stock awards to non-affiliate Independent Directors, which are rights to receive shares of common stock upon termination of service as a Director. In 2015 and prior, the deferred stock awards were issued quarterly in arrears and vested immediately upon grant. In 2016, the Company issued the deferred stock awards immediately, but the awards vest in full on the one-year anniversary of the grant.
To the extent the Company changes the terms of its stock-based compensation programs, experiences market volatility in the pricing of its common stock that increases the implied volatility assumption used in the Black-Scholes model, refines different
assumptions in future periods such as forfeiture rates that differ from current estimates, or assumes stock awards from acquired companies that are different in nature than the Company's stock award arrangements, among other potential impacts, the stock-based compensation expense recorded in future periods and the related tax benefits may differ significantly from what was recorded in previous reporting periods.
Estimates of stock-based compensation expense are significant to the Company's financial statements, but this expense is based on the aforementioned option valuation models and will never result in the payment of cash by the Company. For this reason, and because the Company does not view stock-based compensation as related to its operational performance, the Board of Directors and management exclude stock-based compensation expense when evaluating the Company's underlying business performance.
Recent Accounting Guidance
For information regarding recent accounting guidance and theits impact of this guidance on the Company'sour consolidated financial statements, see Note 2 to the consolidated financial statements in Part IV, Item 15 of this Annual Report on Form 10-K.
| |
| ITEM 7A. | QUANTITATIVE AND QUALITATIVE DISCLOSURES ABOUT MARKET RISK |
Interest Income Rate Risk. Changes in the overall level of interest rates affect the interest income that is generated from the Company'sour cash, cash equivalents and short-term investments.investments and the interest expense that is generated from our outstanding borrowings. For the year ended December 31, 20162019, total interest income was $4.212.8 million. and interest expense was $3.5 million. Cash and cash equivalents consist primarily of highly liquid investments such as money market funds and deposits held at major banks. Short-term investments consist primarily of deposits held by certain foreign subsidiaries of the Company with original maturities of three months to one year.
Foreign Currency Transaction Risk. As the Company operateswe operate in international regions, a portion of itsour revenue, expenses, cash, accounts receivable and payment obligations are denominated in foreign currencies. As a result, changes in currency exchange rates will affect the Company'sour financial position, results of operations and cash flows. The Company isWe are most impacted by movements in and among the British Pound, Euro, Japanese Yen, Euro, British Pound, South Korean Won Indian Rupee, Canadian Dollar and U.S. Dollar.
With respect to revenue, on average for the year ended December 31, 2016,2019, the U.S. Dollar was 0.5%approximately 3.3% stronger, when measured against the Company'sour primary foreign currencies, than for the year ended December 31, 2015.2018. The net overall strengthening resulted in decreasedtable below presents the impacts of currency fluctuations on revenue of $2.2 million duringfor the year ended December 31, 20162019. Amounts in brackets indicate a net adverse impact from currency fluctuations.
|
| | | |
| (in thousands) | Year Ended December 31, 2019 |
| Euro | $ | (17,361 | ) |
| South Korean Won | (5,097 | ) |
| British Pound | (1,881 | ) |
| Japanese Yen | 1,791 |
|
| Other | (1,460 | ) |
| Total | $ | (24,008 | ) |
The net overall stronger U.S. Dollar also resulted in decreased operating income of $10.2 million for the year ended December 31, 2019 as compared to the year ended December 31, 2015. The impact on revenue was primarily driven by $5.6 million, $3.9 million, $1.7 million and $0.9 million of adverse impact due to a weaker Euro, British Pound, South Korean Won and Indian Rupee, respectively, partially offset by $10.4 million of favorable impact due to a stronger Japanese Yen. The fluctuations in the U.S. Dollar resulted in increased operating income of $0.9 million during the year ended December 31, 2016 as compared to the year ended December 31, 2015.2018.
The most significant currency impacts on revenue and operating income are typically attributable to U.S. Dollar exchange rate changes against the British Pound, Euro, Japanese Yen and South Korean Won asWon. Historical exchange rates for these currency pairs are reflected in the charts below:
|
| | | | | | | | | | | |
| | Period End Exchange Rates |
| As of | GBP/USD | | EUR/USD | | USD/JPY | | USD/KRW |
| December 31, 2013 | 1.656 |
| | 1.375 |
| | 105.263 |
| | 1,055.743 |
|
| December 31, 2014 | 1.557 |
| | 1.210 |
| | 119.703 |
| | 1,094.930 |
|
| December 31, 2015 | 1.474 |
| | 1.086 |
| | 120.337 |
| | 1,176.886 |
|
| December 31, 2016 | 1.234 |
| | 1.051 |
| | 116.918 |
| | 1,208.313 |
|
|
| | | | | | | | | | | |
| | Period End Exchange Rates |
| As of | GBP/USD | | EUR/USD | | USD/JPY | | USD/KRW |
| December 31, 2016 | 1.234 |
| | 1.051 |
| | 116.918 |
| | 1,208.313 |
|
| December 31, 2017 | 1.351 |
| | 1.200 |
| | 112.701 |
| | 1,068.376 |
|
| December 31, 2018 | 1.276 |
| | 1.147 |
| | 109.589 |
| | 1,115.325 |
|
| December 31, 2019 | 1.326 |
| | 1.121 |
| | 108.637 |
| | 1,156.069 |
|
|
| | | | | | | | | | | |
| | Average Exchange Rates |
| Twelve Months Ended | GBP/USD | | EUR/USD | | USD/JPY | | USD/KRW |
| December 31, 2014 | 1.648 |
| | 1.329 |
| | 105.592 |
| | 1,052.715 |
|
| December 31, 2015 | 1.528 |
| | 1.110 |
| | 121.018 |
| | 1,131.542 |
|
| December 31, 2016 | 1.355 |
| | 1.107 |
| | 108.530 |
| | 1,160.699 |
|
|
| | | | | | | | | | | |
| | Average Exchange Rates |
| Year Ended | GBP/USD | | EUR/USD | | USD/JPY | | USD/KRW |
| December 31, 2017 | 1.289 |
| | 1.130 |
| | 112.139 |
| | 1,130.945 |
|
| December 31, 2018 | 1.335 |
| | 1.181 |
| | 110.405 |
| | 1,100.786 |
|
| December 31, 2019 | 1.277 |
| | 1.119 |
| | 109.033 |
| | 1,165.479 |
|
| |
| ITEM 8. | FINANCIAL STATEMENTS AND SUPPLEMENTARY DATA |
The following tables set forth selected unaudited quarterly information. The Company believesWe believe that the amounts stated below present fairly the results of such periods when read in conjunction with the consolidated financial statements and related notes included in Part IV, Item 15 of this Annual Report on Form 10-K.
Other information required by this Item is included in Part IV, Item 15 of this Annual Report on Form 10-K.
| | | | | Fiscal Quarter Ended | | Fiscal Quarter Ended |
| (in thousands, except per share data) | | December 31,
2016 | | September 30,
2016 | | June 30,
2016 | | March 31,
2016 | | December 31,
2019 | | September 30,
2019 | | June 30,
2019 | | March 31,
2019 |
| Revenue | | $ | 270,628 |
| | $ | 245,862 |
| | $ | 246,069 |
| | $ | 225,906 |
| | $ | 486,228 |
| | $ | 343,899 |
| | $ | 368,635 |
| | $ | 317,130 |
|
| Gross profit | | 231,650 |
| | 210,276 |
| | 209,058 |
| | 190,621 |
| | 436,632 |
| | 302,534 |
| | 328,138 |
| | 282,315 |
|
| Operating income | | 96,966 |
| | 100,099 |
| | 94,155 |
| | 85,022 |
| | 185,716 |
| | 105,047 |
| | 128,628 |
| | 95,649 |
|
| Net income | | 69,983 |
| | 69,557 |
| | 69,628 |
| | 56,468 |
| | 165,852 |
| | 89,463 |
| | 109,750 |
| | 86,230 |
|
| Earnings per share – basic | | $ | 0.81 |
| | $ | 0.80 |
| | $ | 0.79 |
| | $ | 0.64 |
| | $ | 1.95 |
| | $ | 1.06 |
| | $ | 1.31 |
| | $ | 1.03 |
|
| Earnings per share – diluted | | $ | 0.80 |
| | $ | 0.78 |
| | $ | 0.78 |
| | $ | 0.63 |
| | $ | 1.91 |
| | $ | 1.04 |
| | $ | 1.28 |
| | $ | 1.01 |
|
| | | | | Fiscal Quarter Ended | | Fiscal Quarter Ended |
| (in thousands, except per share data) | | December 31,
2015 | | September 30,
2015 | | June 30,
2015 | | March 31,
2015 | | December 31,
2018 | | September 30,
2018 | | June 30,
2018 | | March 31,
2018 |
| Revenue | | $ | 251,647 |
| | $ | 237,840 |
| | $ | 235,485 |
| | $ | 217,781 |
| | $ | 415,432 |
| | $ | 289,418 |
| | $ | 305,913 |
| | $ | 282,873 |
|
| Gross profit | | 214,655 |
| | 201,259 |
| | 197,700 |
| | 181,893 |
| | 375,343 |
| | 253,110 |
| | 265,463 |
| | 243,835 |
|
| Operating income | | 96,943 |
| | 90,183 |
| | 86,495 |
| | 80,058 |
| | 179,936 |
| | 93,024 |
| | 108,553 |
| | 95,061 |
|
| Net income | | 68,021 |
| | 66,033 |
| | 62,335 |
| | 56,132 |
| | 153,163 |
| | 89,336 |
| | 92,596 |
| | 84,280 |
|
| Earnings per share – basic | | $ | 0.77 |
| | $ | 0.74 |
| | $ | 0.69 |
| | $ | 0.62 |
| | $ | 1.83 |
| | $ | 1.06 |
| | $ | 1.10 |
| | $ | 1.00 |
|
| Earnings per share – diluted | | $ | 0.75 |
| | $ | 0.72 |
| | $ | 0.68 |
| | $ | 0.61 |
| | $ | 1.79 |
| | $ | 1.04 |
| | $ | 1.08 |
| | $ | 0.98 |
|
| |
| ITEM 9. | CHANGES IN AND DISAGREEMENTS WITH ACCOUNTANTS ON ACCOUNTING AND FINANCIAL DISCLOSURE |
None.
| |
| ITEM 9A. | CONTROLS AND PROCEDURES |
Evaluation of Disclosure Controls and Procedures. As required by Rules 13a-15 and 15d-15 of the Securities Exchange Act of 1934, as amended, or the Exchange Act, the Company haswe have evaluated, with the participation of management, including the Chief Executive Officer and the Chief Financial Officer, the effectiveness of the design and operation of itsour disclosure controls and procedures as of the end of the period covered by this report. Based on such evaluation, the Chief Executive Officer and Chief Financial Officer have concluded that such disclosure controls and procedures are effective, as defined in Rule 13a-15(e) of the Exchange Act.
The Company has a Disclosure Review Committee to assist in the quarterly evaluation of the Company's internal disclosure controls and procedures and in the review of the Company's periodic filings under the Exchange Act. The membership of the Disclosure Review Committee consists of the Company's Chief Executive Officer; Chief Financial Officer; Global Controller; General Counsel; Senior Director, Global Investor Relations; Vice President of Worldwide Sales and Support; Vice President of Human Resources; Vice President of Marketing; and Chief Product Officer. This committee is advised by external counsel, particularly on SEC-related matters. Additionally, other members of the Company's global management team advise the committee with respect to disclosure via a sub-certification process.
The Company believes,We believe, based on itsour knowledge, that the financial statements and other financial information included in this report fairly present, in all material respects, theour financial condition, results of operations and cash flows of the Company as of and for the periods presented in this report. The Company isWe are committed to both a sound internal control environment and to good corporate governance.
From time to time, we review the disclosure controls and procedures, and may periodically make changes to enhance their effectiveness and to ensure that our systems evolve with our business.
Management's Report on Internal Control over Financial Reporting. Management is responsible for establishing and maintaining adequate internal control over financial reporting, as such term is defined in Exchange Act Rules 13a-15(f). Under the supervision and with the participation of management, including our Chief Executive Officer and Chief Financial Officer, we have conducted an evaluation of the effectiveness of our internal control over financial reporting based upon the Internal Control – Integrated Framework (2013) issued by the Committee of Sponsoring Organizations of the Treadway Commission. Based on this evaluation, our Chief Executive Officer and Chief Financial Officer have concluded that our internal control over financial reporting was effective at December 31, 2019.
Because of its inherent limitations, internal control over financial reporting may not prevent or detect misstatements. Projections of any evaluation of effectiveness to future periods are subject to the risk that controls may become inadequate because of changes in conditions, or that the degree of compliance with policies or procedures may deteriorate.
From time to time, the Company reviews the disclosure controls and procedures, and may periodically make changes to enhance their effectiveness and to ensure that the Company's systems evolve with its business.
Report on Internal Control over Financial Reporting. The Company's management is responsible for establishing and maintaining adequate internal control over financial reporting, as such term is defined in Exchange Act Rules 13a-15(f). Under the supervision and with the participation of the Company's management, including the Company's Chief Executive Officer and Chief Financial Officer, the Company has conducted an evaluation of the effectiveness of its internal control over financial reporting based upon the Internal Control – Integrated Framework (2013) issued by the Committee of Sponsoring Organizations of the Treadway Commission. Based on this evaluation, the Company's Chief Executive Officer and Chief Financial Officer have concluded that the Company's internal control over financial reporting was effective at December 31, 2016.
Additionally, Deloitte & Touche LLP, an independent registered public accounting firm, has audited the financial statements included in this Annual Report on Form 10-K and has issued an attestation report on the Company'sour internal control over financial reporting. This report is included in Item 15 of this Annual Report on Form 10-K.
Changes in Internal Controls. There were no changes in the Company'sour internal controlscontrol over financial reporting that occurred during the three months ended December 31, 20162019 that materially affected, or were reasonably likely to materially affect, the Company'sour internal control over financial reporting.
| |
| ITEM 9B. | OTHER INFORMATION |
None.
PART III
| |
| ITEM 10. | DIRECTORS, EXECUTIVE OFFICERS AND CORPORATE GOVERNANCE |
The information required by this Item is incorporated by reference to the Company's 2017our 2020 Proxy Statement and is set forth under “Our Board of Directors”,“Corporate Governance at Ansys,” “Director Nominations,” “Continuing Directors Following the 2020 Annual Meeting,” “Our Executive Officers”Officers,” “Delinquent Section 16(a) Reports” and “Ownership“Audit Committee” therein.
We adopted a Code of Business Conduct and Ethics that applies to our principal executive officer, principal financial and accounting officer, and all of our directors and employees. Our Common Stock” therein.Code of Business Conduct and Ethics is posted under the Corporate Responsibility tab of the Investor Relations section of our website at https://investors.ansys.com. We will post any amendments to, or waiver of, our Code of Business Conduct and Ethics that apply to our principal executive officer and principal financial and accounting officer on our website.
| |
| ITEM 11. | EXECUTIVE COMPENSATION |
The information required by this Item is incorporated by reference to the Company's 2017our 2020 Proxy Statement and is set forth under “Our Board of Directors”“Compensation Discussion and “Our Executive Officers”Analysis,” “Compensation Policies and Practices Related to Risk Management,” “Fiscal 2019 Compensation Tables,” “2019 CEO Pay Ratio,” “Compensation Committee Report,” “Compensation Committee Interlocks and Insider Participation,” “Director Nominations” and “Non-Employee Director Compensation” therein.
| |
| ITEM 12. | SECURITY OWNERSHIP OF CERTAIN BENEFICIAL OWNERS AND MANAGEMENT, AND RELATED STOCKHOLDER MATTERS |
Equity Compensation Plan Information as of December 31, 2019
|
| | | | | | | | | | |
| | | (a) | | (b) | | (c) |
| Plan Category | | Number of Securities to be Issued Upon Exercise of Outstanding Options, Warrants and Rights | | Weighted Average Exercise Price of Outstanding Options, Warrants and Rights(1) | | Number of Securities Remaining Available for Future Issuance Under Equity Compensation Plans (excluding securities reflected in column (a)) |
| Equity Compensation Plans Approved by Security Holders | | | | | | |
| 1996 Stock Option and Grant Plan | | 2,617,302(2) |
| | $ | 69.69 |
| | 4,064,783(3) |
|
| 1996 Employee Stock Purchase Plan | | (4) | | (5) | | 191,960 |
|
Equity Compensation Plans Not Approved by Security Holders(6) | | | | | | |
| Ansoft Corporation 2006 Stock Incentive Plan | | 18,650 |
| | $ | 48.97 |
| | — |
|
| Apache Design Solutions, Inc. 2001 Stock/Option Issuance Plan | | 31,031 |
| | $ | 21.27 |
| | — |
|
| SpaceClaim Corporation 2005 Stock Incentive Plan | | 1,253 |
| | $ | 23.41 |
| | — |
|
| Gear Design Solutions, Inc. Stock Incentive Plan | | 3,740 |
| | $ | 12.26 |
| | — |
|
| Total | | 2,671,976 |
| | | | 4,256,743 |
|
| |
| (1) | The weighted average exercise price does not take into account the shares for outstanding restricted stock units or deferred stock awards, which have no exercise price. |
| |
| (2) | Includes 1,617,974 shares for outstanding restricted stock units for employees, 929,559 shares for outstanding stock options, 9,688 shares for outstanding restricted stock units for non-employee directors and 60,081 shares for deferred stock awards for non-employee directors. Restricted stock units with a performance or market condition are included based on target performance, unless performance is otherwise known. |
| |
| (3) | The number of securities remaining available for future issuance assumes maximum attainment for awards with a performance condition or a market condition. |
| |
| (4) | The number of shares issuable with respect to the current offering period is not determinable until the end of the period. |
| |
| (5) | The per share purchase price of shares issuable with respect to the current offering period is not determinable until the end of the period. |
| |
| (6) | We no longer issue awards under equity compensation plans not approved by security holders. |
All other information required by this Item is incorporated by reference to the Company's 2017our 2020 Proxy Statement and is set forth under “Ownership of Our Common Stock” therein.
| |
| ITEM 13. | CERTAIN RELATIONSHIPS AND RELATED TRANSACTIONS, AND DIRECTOR INDEPENDENCE |
The information required by this Item is incorporated by reference to the Company's 2017our 2020 Proxy Statement and is set forth under “Our Board of Directors”“Director Independence” and “Related-Party Transactions” therein.
| |
| ITEM 14. | PRINCIPAL ACCOUNTANT FEES AND SERVICES |
The information required by this Item is incorporated by reference to the Company's 2017our 2020 Proxy Statement and is set forth under “Independent Registered Public Accounting Firm”Firm Services and Fees” therein.
PART IV
| |
| ITEM 15. | EXHIBITS AND FINANCIAL STATEMENT SCHEDULES |
| |
| (a) | Documents Filed as Part of this Annual Report on Form 10-K: |
| |
| 1. | Financial Statements: The following consolidated financial statements and reports of independent registered public accounting firm are filed as part of this report: |
| |
| 2. | Financial Statement Schedule: The following financial statement schedule is filed as part of this report and should be read in conjunction with the consolidated financial statements. |
Schedules not listed above have been omitted because they are not applicable, are not required or the information required to be set forth therein is included in the consolidated financial statements or notes thereto.
| |
| 3. | Exhibits: The exhibits listed in the accompanying Exhibit Index immediately following the financial statement schedule are filed as part of, or incorporated by reference into, this Annual Report on Form 10-K. |
The CompanyWe hereby filesfile as part of this Annual Report on Form 10-K the exhibits listed in the Exhibit Index immediately following the financial statement schedule of this Annual Report on Form 10-K.
| |
| (c) | Financial Statement Schedule: |
The CompanyWe hereby filesfile as part of this Annual Report on Form 10-K the financial statement schedule listed in Item 15(a)(2) as set forth above.
MANAGEMENT'S REPORT ON INTERNAL CONTROL OVER FINANCIAL REPORTING
Management is responsible for establishing and maintaining an adequate system of internal control over our financial reporting for the Company.reporting. In order to evaluate the effectiveness of internal control over financial reporting, management has conducted an assessment, including testing, using the financial reporting criteria in the Internal Control - Integrated Framework (2013), issued by the Committee of Sponsoring Organizations of the Treadway Commission.
The Company'sOur system of internal control over financial reporting is designed to provide reasonable assurance to the Company's management and the Board of Directors regarding the reliability of financial records used in preparation of the Company'sour published financial statements. As all internal control systems have inherent limitations, even systems determined to be effective can provide only reasonable assurance with respect to financial statement preparation and presentation. Based on itstheir assessment, management has concluded that the Companywe maintained an effective system of internal control over financial reporting as of December 31, 2016.2019. Deloitte & Touche LLP, an independent registered public accounting firm, has audited the Company'sour internal control over financial reporting as of December 31, 2016,2019, as stated in their report which appears in Part IV, Item 15 of this Annual Report on Form 10-K.
|
| | |
/s/ AJEI S. GOPAL | | /s/ MARIA T. SHIELDS |
| Ajei S. Gopal | | Maria T. Shields |
| President and Chief Executive Officer | | Chief Financial Officer |
February 23, 201727, 2020 | | February 23, 201727, 2020 |
REPORT OF INDEPENDENT REGISTERED PUBLIC ACCOUNTING FIRM
To the Stockholders and the Board of Directors and Stockholders of ANSYS, Inc.
Canonsburg, Pennsylvania
Opinion on the Financial Statements
We have audited the accompanying consolidated balance sheets of ANSYS, Inc. and subsidiaries (the "Company"“Company”) as of December 31, 20162019 and 2015, and2018, the related consolidated statements of income, comprehensive income, stockholders'stockholders’ equity, and cash flows for each of the three years in the period ended December 31, 2016. Our audits also included2019, and the financial statementrelated notes and the schedule listed in the Index at Item 15. These financial statements and financial statement schedule are15 (collectively referred to as the responsibility of the Company's management. Our responsibility is to express an“financial statements”). In our opinion, on the financial statements present fairly, in all material respects, the financial position of the Company as of December 31, 2019 and financial statement schedule based on our audits.2018, and the results of its operations and its cash flows for each of the three years in the period ended December 31, 2019, in conformity with accounting principles generally accepted in the United States of America.
We conducted our auditshave also audited, in accordance with the standards of the Public Company Accounting Oversight Board (United States). (PCAOB), the Company’s internal control over financial reporting as of December 31, 2019, based on criteria established in Internal Control-Integrated Framework (2013) issued by the Committee of Sponsoring Organizations of the Treadway Commission and our report dated February 27, 2020, expressed an unqualified opinion on the Company’s internal control over financial reporting.
Change in Accounting Principle
As discussed in Note 2 to the financial statements, the Company has changed its method of accounting for leases in 2019 due to the adoption of the new leasing standard. The Company adopted the new leasing standard using a modified retrospective approach.
As discussed in Note 3 to the financial statements, the Company has changed its method of accounting for revenue from contracts with customers in 2018 due to the adoption of the new revenue standard. The Company adopted the new revenue standard using a modified retrospective approach.
Basis for Opinion
These financial statements are the responsibility of the Company’s management. Our responsibility is to express an opinion on the Company’s financial statements based on our audits. We are a public accounting firm registered with the PCAOB and are required to be independent with respect to the Company in accordance with the U.S. federal securities laws and the applicable rules and regulations of the Securities and Exchange Commission and the PCAOB.
We conducted our audits in accordance with the standards of the PCAOB. Those standards require that we plan and perform the audit to obtain reasonable assurance about whether the financial statements are free of material misstatement. An audit includesmisstatement, whether due to error or fraud. Our audits included performing procedures to assess the risks of material misstatement of the financial statements, whether due to error or fraud, and performing procedures that respond to those risks. Such procedures included examining, on a test basis, evidence supportingregarding the amounts and disclosures in the financial statements. An auditOur audits also includes assessingincluded evaluating the accounting principles used and significant estimates made by management, as well as evaluating the overall presentation of the financial statement presentation.statements. We believe that our audits provide a reasonable basis for our opinion.
InCritical Audit Matters
The critical audit matters communicated below are matters arising from the current-period audit of the financial statements that were communicated or required to be communicated to the audit committee and that (1) relate to accounts or disclosures that are material to the financial statements and (2) involved our especially challenging, subjective, or complex judgments. The communication of critical audit matters does not alter in any way our opinion such consolidated financial statements present fairly, in all material respects,on the financial position of ANSYS, Inc. and subsidiaries as of December 31, 2016 and 2015, and the results of their operations and their cash flows for each of the three years in the period ended December 31, 2016, in conformity with accounting principles generally accepted in the United States of America. Also, in our opinion, such financial statement schedule, when considered in relation to the basic consolidated financial statements, taken as a whole, presents fairly, in all material respects,and we are not, by communicating the information set forth therein.critical audit matters below, providing separate opinions on the critical audit matters or on the accounts or disclosures to which they relate.
We have also audited, in accordance withRevenue—Time-Based Lease Licenses—Refer to Notes 2 and 3 to the standardsfinancial statements
Critical Audit Matter Description
The Company sells time-based lease (TBL) licenses that are a bundled arrangement that include the rights to a term software license as well as post-contract support (PCS). Revenue is recognized up front at the commencement of the Publiclease for the term software license and recognized ratably over the term of the contract for the PCS in the arrangement. Utilizing observable
inputs, the Company Accounting Oversight Board (United States),determined that 50% of the Company's internal controlestimated standalone selling price of the TBL is attributable to the term software license, while 50% is attributable to PCS. This determination involved judgment, particularly as it relates to the value relationship between the Company’s PCS to TBLs, the value relationship between PCS and the Company’s perpetual licenses and its linkage to the shortened term of a TBL, the average economic life of the Company’s software, renewal rates of its customers, and the price of the bundled arrangement in relation to the perpetual licensing approach.
Given the judgments necessary to determine the allocation between the term software license and PCS, auditing this estimate involved a high degree of auditor judgment.
How the Critical Audit Matter Was Addressed in the Audit
Our audit procedures related to management’s estimate of the allocation between the term software license and PCS in a TBL included the following, among others:
We tested the effectiveness of controls over TBL revenue, including those over the determination of the estimated standalone selling price of the Company’s licenses and services, as well as the allocation of this standalone selling price within the arrangement.
We evaluated the pricing relationship between PCS and perpetual licenses on the net licensing fee of the arrangement, as well as the Company’s renewal rate of PCS sales on perpetual licenses through those arrangements selected for testing that contained both elements as a consideration point of the value relationship between the term software license and PCS when a customer purchases a bundled TBL.
We evaluated the estimated economic life of the Company’s software through observable data points.
Through our current and historical audit procedures, we confirmed that the term software license portion and PCS portion of an arrangement are not sold separately from one another.
We selected a sample of arrangements and performed the following:
| |
| – | Compared the list price of the TBL to the consideration received from the customer and recalculated the discount from list price for each arrangement |
| |
| – | Evaluated whether management appropriately calculated the estimated standalone selling price for the TBL |
| |
| – | Tested management’s identification of distinct performance obligations |
| |
| – | Tested the mathematical accuracy of revenue recognized at a point in time or over time based upon the identification of TBLs within the arrangement |
Acquisitions—Livermore Software Technology, LLC— Developed Software and Core Technologies Intangible Asset—Refer to Notes 2 and 4 to the financial reporting asstatements
Critical Audit Matter Description
The Company completed the acquisition of December 31, 2016,Livermore Software Technology, LLC for $777.8 million on November 1, 2019. The Company accounted for the acquisition under the acquisition method of accounting for business combinations. Accordingly, the purchase price was allocated to the assets acquired and liabilities assumed based on their respective fair values, including the criteria established in Internal Control - Integrated Framework (2013) issued bydeveloped software and core technologies intangible asset of $167.7 million. Management estimated the Committee of Sponsoring Organizationsfair value of the Treadway Commissiondeveloped software and core technologies intangible asset using the relief from royalty method. The fair value determination of the developed software and core technologies intangible asset required management to make significant estimates and assumptions related to the royalty rate, revenue growth rate, and the selection of the discount rate.
Given the fair value determination of the developed software and core technologies intangible asset requires management to make significant estimates and assumptions related to the selected royalty rate, forecasts of future revenue growth, and the selection of the discount rate, performing audit procedures to evaluate the reasonableness of these estimates and assumptions required a high degree of auditor judgment and an increased extent of effort, including the need to involve our report dated February 23, 2017 expressed an unqualified opinion onfair value specialists.
How the Company's internal controlCritical Audit Matter Was Addressed in the Audit
Our audit procedures related to the selection of the royalty rate, forecasts of future revenue growth, and the selection of the discount rate for the developed software and core technologies intangible asset included the following, among others:
We tested the effectiveness of controls over financial reporting.the valuation of the developed software and core technologies intangible asset, including management’s controls over the selection of the royalty rate, forecasts of future revenue growth, and selection of the discount rate.
We assessed the reasonableness of management’s forecasts of future revenue growth by comparing the projections to historical results and certain industry data.
We selected a sample of historical revenue transactions included within the valuation model and evaluated the appropriate recognition of revenue within the relevant period.
With the assistance of our fair value specialists, we evaluated the reasonableness of the (1) valuation methodology, (2) royalty rate, and (3) discount rate by:
| |
| – | Testing the source information underlying the determination of the discount rate and testing the mathematical accuracy of the calculation |
| |
| – | Evaluating the selected royalty rate against market data of comparable licensing agreements, as well as historical licensing agreements |
| |
| – | Developing a range of independent estimates and comparing those to the discount rate selected by management |
|
|
| /s/ Deloitte & Touche LLP |
| Pittsburgh, Pennsylvania |
February 23, 201727, 2020 |
| We have served as the Company's auditor since 2002. |
REPORT OF INDEPENDENT REGISTERED PUBLIC ACCOUNTING FIRM
To the Stockholders and the Board of Directors and Stockholders of ANSYS, Inc.
Canonsburg, Pennsylvania
Opinion on Internal Control over Financial Reporting
We have audited the internal control over financial reporting of ANSYS, Inc. and subsidiaries (the "Company"“Company”) as of December 31, 2016,2019, based on criteria established in Internal Control - Integrated Framework (2013)issued by the Committee of Sponsoring Organizations of the Treadway Commission. Commission (COSO). In our opinion, the Company maintained, in all material respects, effective internal control over financial reporting as of December 31, 2019, based on criteria established in Internal Control - Integrated Framework (2013) issued by COSO.
We have also audited, in accordance with the standards of the Public Company Accounting Oversight Board (United States) (PCAOB), the consolidated financial statements as of and for the year ended December 31, 2019, of the Company and our report dated February 27, 2020, expressed an unqualified opinion on those financial statements.
Basis for Opinion
The Company'sCompany’s management is responsible for maintaining effective internal control over financial reporting and for its assessment of the effectiveness of internal control over financial reporting, included in the accompanying Management'sManagement’s Report on Internal Control over Financial Reporting. Our responsibility is to express an opinion on the Company'sCompany’s internal control over financial reporting based on our audit. We are a public accounting firm registered with the PCAOB and are required to be independent with respect to the Company in accordance with the U.S. federal securities laws and the applicable rules and regulations of the Securities and Exchange Commission and the PCAOB.
We conducted our audit in accordance with the standards of the Public Company Accounting Oversight Board (United States).PCAOB. Those standards require that we plan and perform the audit to obtain reasonable assurance about whether effective internal control over financial reporting was maintained in all material respects. Our audit included obtaining an understanding of internal control over financial reporting, assessing the risk that a material weakness exists, testing and evaluating the design and operating effectiveness of internal control based on the assessed risk, and performing such other procedures as we considered necessary in the circumstances. We believe that our audit provides a reasonable basis for our opinion.
Definition and Limitations of Internal Control over Financial Reporting
A company'scompany’s internal control over financial reporting is a process designed by, or under the supervision of, the company's principal executive and principal financial officers, or persons performing similar functions, and effected by the company's board of directors, management, and other personnel to provide reasonable assurance regarding the reliability of financial reporting and the preparation of financial statements for external purposes in accordance with generally accepted accounting principles. A company'scompany’s internal control over financial reporting includes those policies and procedures that (1) pertain to the maintenance of records that, in reasonable detail, accurately and fairly reflect the transactions and dispositions of the assets of the company; (2) provide reasonable assurance that transactions are recorded as necessary to permit preparation of financial statements in accordance with generally accepted accounting principles, and that receipts and expenditures of the company are being made only in accordance with authorizations of management and directors of the company; and (3) provide reasonable assurance regarding prevention or timely detection of unauthorized acquisition, use, or disposition of the company'scompany’s assets that could have a material effect on the financial statements.
Because of theits inherent limitations, of internal control over financial reporting including the possibility of collusion or improper management override of controls, material misstatements due to error or fraud may not be preventedprevent or detected on a timely basis.detect misstatements. Also, projections of any evaluation of the effectiveness of the internal control over financial reporting to future periods are subject to the risk that the controls may become inadequate because of changes in conditions, or that the degree of compliance with the policies or procedures may deteriorate.
In our opinion, the Company maintained, in all material respects, effective internal control over financial reporting as of December 31, 2016, based on the criteria established in Internal Control - Integrated Framework (2013) issued by the Committee of Sponsoring Organizations of the Treadway Commission.
We have also audited, in accordance with the standards of the Public Company Accounting Oversight Board (United States), the consolidated financial statements and financial statement schedule as of and for the year ended December 31, 2016 of the Company and our report dated February 23, 2017 expressed an unqualified opinion on those financial statements and financial statement schedule.
|
|
| /s/ Deloitte & Touche LLP |
| Pittsburgh, Pennsylvania |
February 23, 201727, 2020 |
ANSYS, INC. AND SUBSIDIARIES
CONSOLIDATED BALANCE SHEETS
| | | | December 31, | December 31, |
| (in thousands, except share and per share data) | 2016 | | 2015 | 2019 | | 2018 |
| ASSETS | | | | | | |
| Current assets: | | | | | | |
| Cash and cash equivalents | $ | 822,479 |
| | $ | 784,168 |
| $ | 872,094 |
| | $ | 777,139 |
|
| Short-term investments | 381 |
| | 446 |
| 288 |
| | 225 |
|
| Accounts receivable, less allowance for doubtful accounts of $5,700 and $5,200, respectively | 107,192 |
| | 91,579 |
| |
| Accounts receivable, less allowance for doubtful accounts of $8,700 and $8,000, respectively | | 433,479 |
| | 317,700 |
|
| Other receivables and current assets | 239,349 |
| | 200,233 |
| 249,619 |
| | 216,113 |
|
| Total current assets | 1,169,401 |
| | 1,076,426 |
| 1,555,480 |
| | 1,311,177 |
|
| Long-term assets: | | | | |
| Property and equipment, net | 54,677 |
| | 61,924 |
| 83,636 |
| | 61,655 |
|
| Operating lease right-of-use assets | | 105,671 |
| | — |
|
| Goodwill | 1,337,215 |
| | 1,332,348 |
| 2,413,280 |
| | 1,572,455 |
|
| Other intangible assets, net | 172,619 |
| | 220,553 |
| 476,711 |
| | 211,272 |
|
| Other long-term assets | 24,287 |
| | 5,757 |
| 180,032 |
| | 82,775 |
|
| Deferred income taxes | 42,327 |
| | 32,896 |
| 24,077 |
| | 26,630 |
|
| Total long-term assets | | 3,283,407 |
| | 1,954,787 |
|
| Total assets | $ | 2,800,526 |
| | $ | 2,729,904 |
| $ | 4,838,887 |
| | $ | 3,265,964 |
|
| LIABILITIES AND STOCKHOLDERS' EQUITY | | | | | | |
| Current liabilities: | | | | | | |
| Accounts payable | $ | 7,395 |
| | $ | 4,865 |
| $ | 14,298 |
| | $ | 7,953 |
|
| Accrued bonuses and commissions | 49,487 |
| | 46,141 |
| 101,546 |
| | 79,945 |
|
| Accrued income taxes | 5,263 |
| | 4,695 |
| 9,996 |
| | 8,726 |
|
| Current portion of long-term debt | | 75,000 |
| | — |
|
| Other accrued expenses and liabilities | 73,676 |
| | 63,801 |
| 142,947 |
| | 99,559 |
|
| Deferred revenue | 403,279 |
| | 364,644 |
| 351,353 |
| | 328,584 |
|
| Total current liabilities | 539,100 |
| | 484,146 |
| 695,140 |
| | 524,767 |
|
| Long-term liabilities: | | | | | | |
| Deferred income taxes | 2,259 |
| | 2,091 |
| 78,643 |
| | 30,077 |
|
| Long-term operating lease liabilities | | 91,768 |
| | — |
|
| Long-term debt | | 423,531 |
| | — |
|
| Other long-term liabilities | 50,762 |
| | 49,240 |
| 96,426 |
| | 61,573 |
|
| Total long-term liabilities | 53,021 |
| | 51,331 |
| 690,368 |
| | 91,650 |
|
| Commitments and contingencies |
|
| |
|
|
|
| |
|
|
| Stockholders' equity: | | | | | | |
| Preferred stock, $.01 par value; 2,000,000 shares authorized; zero shares issued or outstanding | — |
| | — |
| — |
| | — |
|
| Common stock, $.01 par value; 300,000,000 shares authorized; 93,236,023 shares issued | 932 |
| | 932 |
| |
| Common stock, $.01 par value; 300,000,000 shares authorized; 94,627,585 and 93,236,023 shares issued, respectively | | 946 |
| | 932 |
|
| Additional paid-in capital | 883,010 |
| | 894,469 |
| 1,188,939 |
| | 867,462 |
|
| Retained earnings | 2,057,665 |
| | 1,792,029 |
| 3,370,706 |
| | 2,919,411 |
|
| Treasury stock, at cost: 7,548,188 and 5,096,505 shares, respectively | (675,550 | ) | | (440,839 | ) | |
| Treasury stock, at cost: 8,893,177 and 9,601,670 shares, respectively | | (1,041,831 | ) | | (1,075,879 | ) |
| Accumulated other comprehensive loss | (57,652 | ) | | (52,164 | ) | (65,381 | ) | | (62,379 | ) |
| Total stockholders' equity | 2,208,405 |
| | 2,194,427 |
| 3,453,379 |
| | 2,649,547 |
|
| Total liabilities and stockholders' equity | $ | 2,800,526 |
| | $ | 2,729,904 |
| $ | 4,838,887 |
| | $ | 3,265,964 |
|
The accompanying notes are an integral part of the consolidated financial statements.
ANSYS, INC. AND SUBSIDIARIES
CONSOLIDATED STATEMENTS OF INCOME
| | | | Year Ended December 31, | Year Ended December 31, |
| (in thousands, except per share data) | 2016 | | 2015 | | 2014 | 2019 | | 2018 | | 2017 |
| Revenue: | | | | | | | | | | |
| Software licenses | $ | 568,174 |
| | $ | 555,105 |
| | $ | 564,502 |
| $ | 699,630 |
| | $ | 576,717 |
| | $ | 624,964 |
|
| Maintenance and service | 420,291 |
| | 387,648 |
| | 371,519 |
| 816,262 |
| | 716,919 |
| | 470,286 |
|
| Total revenue | 988,465 |
| | 942,753 |
| | 936,021 |
| 1,515,892 |
| | 1,293,636 |
| | 1,095,250 |
|
| Cost of sales: | | | | | | | | | | |
| Software licenses | 28,860 |
| | 29,105 |
| | 30,607 |
| 23,944 |
| | 18,619 |
| | 34,421 |
|
| Amortization | 38,092 |
| | 38,755 |
| | 37,653 |
| 21,710 |
| | 27,034 |
| | 36,794 |
|
| Maintenance and service | 79,908 |
| | 79,386 |
| | 85,126 |
| 120,619 |
| | 110,232 |
| | 78,949 |
|
| Total cost of sales | 146,860 |
| | 147,246 |
| | 153,386 |
| 166,273 |
| | 155,885 |
| | 150,164 |
|
| Gross profit | 841,605 |
| | 795,507 |
| | 782,635 |
| 1,349,619 |
| | 1,137,751 |
| | 945,086 |
|
| Operating expenses: | | | | | | | | | | |
| Selling, general and administrative | 269,515 |
| | 253,603 |
| | 246,376 |
| 521,200 |
| | 413,580 |
| | 338,640 |
|
| Research and development | 183,093 |
| | 168,831 |
| | 165,421 |
| 298,210 |
| | 233,802 |
| | 202,746 |
|
| Amortization | 12,755 |
| | 19,394 |
| | 23,388 |
| 15,169 |
| | 13,795 |
| | 12,972 |
|
| Total operating expenses | 465,363 |
| | 441,828 |
| | 435,185 |
| 834,579 |
| | 661,177 |
| | 554,358 |
|
| Operating income | 376,242 |
| | 353,679 |
| | 347,450 |
| 515,040 |
| | 476,574 |
| | 390,728 |
|
| Interest income | | 12,796 |
| | 11,419 |
| | 6,962 |
|
| Interest expense | (221 | ) | | (325 | ) | | (779 | ) | (3,461 | ) | | (59 | ) | | (86 | ) |
| Interest income | 4,209 |
| | 2,829 |
| | 3,002 |
| |
| Other income (expense), net | 85 |
| | 582 |
| | (1,534 | ) | |
| Other expense, net | | (1,792 | ) | | (849 | ) | | (1,910 | ) |
| Income before income tax provision | 380,315 |
| | 356,765 |
| | 348,139 |
| 522,583 |
| | 487,085 |
| | 395,694 |
|
| Income tax provision | 114,679 |
| | 104,244 |
| | 93,449 |
| 71,288 |
| | 67,710 |
| | 136,443 |
|
| Net income | $ | 265,636 |
| | $ | 252,521 |
| | $ | 254,690 |
| $ | 451,295 |
| | $ | 419,375 |
| | $ | 259,251 |
|
| Earnings per share – basic: | | | | | | | | | | |
| Earnings per share | $ | 3.05 |
| | $ | 2.82 |
| | $ | 2.77 |
| $ | 5.36 |
| | $ | 4.99 |
| | $ | 3.05 |
|
| Weighted average shares | 87,227 |
|
| 89,561 |
| | 92,067 |
| 84,259 |
|
| 83,973 |
| | 84,988 |
|
| Earnings per share – diluted: | | | | | | | | | | |
| Earnings per share | $ | 2.99 |
| | $ | 2.76 |
| | $ | 2.70 |
| $ | 5.25 |
| | $ | 4.88 |
| | $ | 2.98 |
|
| Weighted average shares | 88,969 |
|
| 91,502 |
| | 94,194 |
| 85,925 |
|
| 85,913 |
| | 86,854 |
|
The accompanying notes are an integral part of the consolidated financial statements.
ANSYS, INC. AND SUBSIDIARIES
CONSOLIDATED STATEMENTS OF COMPREHENSIVE INCOME
| | | | Year Ended December 31, | Year Ended December 31, |
| (in thousands) | 2016 | | 2015 | | 2014 | 2019 | | 2018 | | 2017 |
| Net income | $ | 265,636 |
| | $ | 252,521 |
| | $ | 254,690 |
| $ | 451,295 |
| | $ | 419,375 |
| | $ | 259,251 |
|
| Other comprehensive loss: | | | | | | |
| Other comprehensive (loss) income: | | | | | | |
| Foreign currency translation adjustments | (5,488 | ) | | (20,410 | ) | | (29,110 | ) | (3,002 | ) | | (24,535 | ) | | 19,808 |
|
| Comprehensive income | $ | 260,148 |
| | $ | 232,111 |
| | $ | 225,580 |
| $ | 448,293 |
| | $ | 394,840 |
| | $ | 279,059 |
|
The accompanying notes are an integral part of the consolidated financial statements.
ANSYS, INC. AND SUBSIDIARIES
CONSOLIDATED STATEMENTS OF CASH FLOWS
| | | | Year Ended December 31, | Year Ended December 31, |
| (in thousands) | 2016 | | 2015 | | 2014 | 2019 | | 2018 | | 2017 |
| Cash flows from operating activities: | | | | | | | | | | |
| Net income | $ | 265,636 |
| | $ | 252,521 |
| | $ | 254,690 |
| $ | 451,295 |
| | $ | 419,375 |
| | $ | 259,251 |
|
| Adjustments to reconcile net income to net cash provided by operating activities: | | | | | | | | | | |
| Depreciation and amortization | 69,587 |
| | 77,670 |
| | 81,924 |
| 60,516 |
| | 59,255 |
| | 67,678 |
|
| Operating lease right-of-use assets amortization | | 18,459 |
| | — |
| | — |
|
| Deferred income tax benefit | (10,921 | ) | | (15,196 | ) | | (18,859 | ) | (14,511 | ) | | (33,675 | ) | | (2,693 | ) |
| Provision for bad debts | 2,009 |
| | 1,304 |
| | 2,104 |
| 2,928 |
| | 1,577 |
| | 1,474 |
|
| Stock-based compensation expense | 33,347 |
| | 33,951 |
| | 36,861 |
| 116,190 |
| | 83,346 |
| | 53,154 |
|
| Excess tax benefits from stock-based compensation | (9,153 | ) | | (8,176 | ) | | (14,531 | ) | |
| Other | 1,290 |
| | 1,413 |
| | 868 |
| 2,778 |
| | 410 |
| | 21 |
|
| Changes in operating assets and liabilities: | | | | | | | | | | |
| Accounts receivable | (17,388 | ) | | 6,044 |
| | (5,554 | ) | (154,403 | ) | | (74,455 | ) | | (14,406 | ) |
| Other receivables and current assets | (39,644 | ) | | (17,662 | ) | | (877 | ) | (26,182 | ) | | (30,241 | ) | | (18,498 | ) |
| Other long-term assets | (7,167 | ) | | 273 |
| | (1,838 | ) | (5,622 | ) | | 1,839 |
| | (435 | ) |
| Accounts payable, accrued expenses and current liabilities | 16,919 |
| | (6,993 | ) | | 8,208 |
| 38,543 |
| | 19,920 |
| | 27,045 |
|
| Accrued income taxes | 9,052 |
| | 5,770 |
| | 12,102 |
| 575 |
| | 1,086 |
| | 1,215 |
|
| Deferred revenue | 41,430 |
| | 40,566 |
| | 35,548 |
| 17,245 |
| | 56,213 |
| | 20,648 |
|
| Other long-term liabilities | 1,830 |
| | (3,962 | ) | | (5,339 | ) | (7,875 | ) | | (19,662 | ) | | 33,206 |
|
| Net cash provided by operating activities | 356,827 |
| | 367,523 |
| | 385,307 |
| 499,936 |
| | 484,988 |
| | 427,660 |
|
| Cash flows from investing activities: | | | | | | | | | | |
| Acquisitions, net of cash acquired | (7,891 | ) | | (46,117 | ) | | (103,016 | ) | (787,196 | ) | | (283,026 | ) | | (63,885 | ) |
| Capital expenditures | (12,443 | ) | | (16,145 | ) | | (26,023 | ) | (44,940 | ) | | (21,762 | ) | | (19,149 | ) |
| Other investing activities | (11,839 | ) | | 230 |
| | (231 | ) | (1,412 | ) | | (7,443 | ) | | (11,631 | ) |
| Net cash used in investing activities | (32,173 | ) | | (62,032 | ) | | (129,270 | ) | (833,548 | ) | | (312,231 | ) | | (94,665 | ) |
| Cash flows from financing activities: | | | | | | | | | | |
| Proceeds from long-term debt | | 500,000 |
| | — |
| | — |
|
| Purchase of treasury stock | (336,335 | ) | | (337,910 | ) | | (233,793 | ) | (59,116 | ) | | (269,801 | ) | | (336,042 | ) |
| Restricted stock withholding taxes paid in lieu of issued shares | (5,057 | ) | | (4,446 | ) | | (5,108 | ) | (42,431 | ) | | (28,879 | ) | | (11,112 | ) |
| Contingent consideration payments | (1,048 | ) | | (1,173 | ) | | (4,504 | ) | |
| Proceeds from shares issued for stock-based compensation | 53,811 |
| | 43,623 |
| | 43,323 |
| 34,093 |
| | 41,019 |
| | 52,503 |
|
| Excess tax benefits from stock-based compensation | 9,153 |
| | 8,176 |
| | 14,531 |
| |
| Other financing activities | (1 | ) | | (21 | ) | | (91 | ) | (3,137 | ) | | (5,014 | ) | | — |
|
| Net cash used in financing activities | (279,477 | ) | | (291,751 | ) | | (185,642 | ) | |
| Net cash provided by (used in) financing activities | | 429,409 |
| | (262,675 | ) | | (294,651 | ) |
| Effect of exchange rate fluctuations on cash and cash equivalents | (6,866 | ) | | (17,636 | ) | | (24,817 | ) | (842 | ) | | (14,444 | ) | | 20,678 |
|
| Net increase (decrease) in cash and cash equivalents | 38,311 |
| | (3,896 | ) | | 45,578 |
| 94,955 |
| | (104,362 | ) | | 59,022 |
|
| Cash and cash equivalents, beginning of period | 784,168 |
| | 788,064 |
| | 742,486 |
| 777,139 |
| | 881,501 |
| | 822,479 |
|
| Cash and cash equivalents, end of period | $ | 822,479 |
| | $ | 784,168 |
| | $ | 788,064 |
| $ | 872,094 |
| | $ | 777,139 |
| | $ | 881,501 |
|
| Supplemental disclosures of cash flow information: | | | | | | | | | | |
| Income taxes paid | $ | 118,455 |
| | $ | 107,218 |
| | $ | 118,004 |
| $ | 86,770 |
| | $ | 87,244 |
| | $ | 116,389 |
|
| Interest paid | $ | 822 |
| | $ | 620 |
| | $ | 643 |
| $ | 787 |
| | $ | 114 |
| | $ | 199 |
|
| Fair value of stock options and restricted stock awards assumed in connection with acquisitions | $ | — |
| | $ | 3,528 |
| | $ | 68 |
| |
| Construction-in-progress - leased facility | $ | — |
| | $ | — |
| | $ | (18,136 | ) | |
| Fair value of common stock issued as consideration in connection with acquisitions | | $ | 307,173 |
| | $ | — |
| | $ | — |
|
The accompanying notes are an integral part of the consolidated financial statements.
ANSYS, INC. AND SUBSIDIARIES
CONSOLIDATED STATEMENTS OF STOCKHOLDERS' EQUITY
| | | | Common Stock | | Additional Paid-In Capital | | Retained Earnings | | Treasury Stock | | Accumulated Other Comprehensive Loss | | Total Stockholders' Equity | Common Stock | | Additional Paid-In Capital | | Retained Earnings | | Treasury Stock | | Accumulated Other Comprehensive (Loss)/Income | | Total Stockholders' Equity |
| (in thousands) | Shares | | Amount | | Shares | | Amount | | Shares | | Amount | | Shares | | Amount | |
| Balance, January 1, 2014 | 93,236 | | $ | 932 |
| | $ | 926,031 |
| | $ | 1,284,818 |
| | 918 |
| | $ | (72,891 | ) | | $ | (2,644 | ) | | $ | 2,136,246 |
| |
| Balance, January 1, 2017 | | 93,236 | | $ | 932 |
| | $ | 883,010 |
| | $ | 2,057,665 |
| | 7,548 |
| | $ | (675,550 | ) | | $ | (57,652 | ) | | $ | 2,208,405 |
|
| Treasury shares acquired | | | | | | | | 2,977 |
| | (233,793 | ) | | | | (233,793 | ) | | | | | | | | 2,750 |
| | (336,042 | ) | | | | (336,042 | ) |
| Stock-based compensation activity, including tax benefit of $14,970 |
| |
|
| | (20,628 | ) | | | | (1,424 | ) | | 110,674 |
| | | | 90,046 |
| |
| Stock-based compensation activity | |
| |
|
| | (9,653 | ) | | | | (1,254 | ) | | 104,062 |
| | | | 94,409 |
|
| Other comprehensive income | | | | | | | | | | | | | 19,808 |
| | 19,808 |
|
| Net income for the year | | | | | | | 259,251 |
| | | | | | | | 259,251 |
|
| Balance, December 31, 2017 | | 93,236 | | 932 |
| | 873,357 |
| | 2,316,916 |
| | 9,044 |
| | (907,530 | ) | | (37,844 | ) | | 2,245,831 |
|
| Cumulative effect of the ASC 606 adoption | | | | | | | 183,120 |
| | | | | | | | 183,120 |
|
| Treasury shares acquired | | | | | | | | | 1,674 |
| | (269,801 | ) | | | | (269,801 | ) |
| Stock-based compensation activity | |
| |
|
| | (5,895 | ) | | | | (1,116 | ) | | 101,452 |
| | | | 95,557 |
|
| Other comprehensive loss | | | | | | | | | | | | (29,110 | ) | | (29,110 | ) | | | | | | | | | | | | (24,535 | ) | | (24,535 | ) |
| Net income for the year | | | | | | 254,690 |
| | | | | | | | 254,690 |
| | | | | | | 419,375 |
| | | | | | | | 419,375 |
|
| Acquisition-related activity | | | | | (578 | ) | | | | | | | | | | (578 | ) | |
| Balance, December 31, 2014 | 93,236 | | 932 |
| | 904,825 |
| | 1,539,508 |
| | 2,471 |
| | (196,010 | ) | | (31,754 | ) | | 2,217,501 |
| |
| Balance, December 31, 2018 | | 93,236 | | 932 |
| | 867,462 |
| | 2,919,411 |
| | 9,602 |
| | (1,075,879 | ) | | (62,379 | ) | | 2,649,547 |
|
| Acquisition of Livermore Software Technology, LLC | | 1,392 | | 14 |
| | 307,159 |
| | | | | | | | | | 307,173 |
|
| Treasury shares acquired | | | | | | | | 3,833 |
| | (337,910 | ) | | | | (337,910 | ) | | | | | | | | 330 |
| | (59,116 | ) | | | | (59,116 | ) |
| Stock-based compensation activity, including tax benefit of $6,068 |
| |
|
| | (8,434 | ) | | | | (1,139 | ) | | 87,631 |
| | | | 79,197 |
| |
| Stock-based compensation activity | |
| |
|
| | 14,318 |
| | | | (1,039 | ) | | 93,164 |
| | | | 107,482 |
|
| Other comprehensive loss | | | | | | | | | | | | (20,410 | ) | | (20,410 | ) | | | | | | | | | | | | (3,002 | ) | | (3,002 | ) |
| Net income for the year | | | | | | 252,521 |
| | | | | | | | 252,521 |
| | | | | | 451,295 |
| | | | | | | | 451,295 |
|
| Acquisition-related activity | | | | | (1,922 | ) | | | | (68 | ) | | 5,450 |
| | | | 3,528 |
| |
| Balance, December 31, 2015 | 93,236 | | 932 |
| | 894,469 |
| | 1,792,029 |
| | 5,097 |
| | (440,839 | ) | | (52,164 | ) | | 2,194,427 |
| |
| Treasury shares acquired | | | | | | | | 3,700 |
| | (336,335 | ) | | | | (336,335 | ) | |
| Stock-based compensation activity, including tax benefit of $8,065 |
| |
|
| | (11,459 | ) | | | | (1,249 | ) | | 101,624 |
| | | | 90,165 |
| |
| Other comprehensive loss | | | | | | | | | | | | (5,488 | ) | | (5,488 | ) | |
| Net income for the year | | | | | | 265,636 |
| | | | | | | | 265,636 |
| |
| Balance, December 31, 2016 | 93,236 | | $ | 932 |
| | $ | 883,010 |
| | $ | 2,057,665 |
| | 7,548 |
| | $ | (675,550 | ) | | $ | (57,652 | ) | | $ | 2,208,405 |
| |
| Balance, December 31, 2019 | | 94,628 | | $ | 946 |
| | $ | 1,188,939 |
| | $ | 3,370,706 |
| | 8,893 |
| | $ | (1,041,831 | ) | | $ | (65,381 | ) | | $ | 3,453,379 |
|
The accompanying notes are an integral part of the consolidated financial statements.
ANSYS, INC. AND SUBSIDIARIES
NOTES TO CONSOLIDATED FINANCIAL STATEMENTS
December 31, 20162019
ANSYS, Inc. (hereafter the "Company" or "ANSYS") developsWe develop and globally marketsmarket engineering simulation software and technologiesservices widely used by engineers, designers, researchers and students across a broad spectrum of industries and academia, including aerospace and defense, automotive, industrial equipment, electronics, biomedical,semiconductors, energy, materials and chemical processing, turbomachinery, consumer products, healthcare, and semiconductors.sports.
As defined by the accounting guidance for segment reporting, the Company operateswe operate as one1 segment.
Given the integrated approach to the multi-discipline problem-solving needs of the Company'sour customers, a single sale of software may contain components from multiple product areas and include combined technologies. The CompanyWe also hashave a multi-year product and integration strategy that will result in new, combined products or changes to the historical product offerings. As a result, it is impracticable for the Companyus to provide accurate historical or current reporting among itsour various product lines.
Accounting Principles
The financial statements and accompanying notes are prepared in accordance with accounting principles generally accepted in the United States. Certain items in the consolidated financial statements and the notes to the consolidated financial statements of prior years have been reclassified to conform to the current year's presentation. These reclassifications had no effect on reported net income, comprehensive income, cash flows, total assets or total liabilities and stockholders' equity.
Principles of Consolidation
The accompanying consolidated financial statements include theour accounts and those of the Company and itsour wholly owned subsidiaries. All intercompany accounts and transactions have been eliminated.
Recently Adopted Accounting Guidance
Leases: In February 2016, the Financial Accounting Standards Board (FASB) issued Accounting Standards Update (ASU) No. 2016-02, Leases(Topic 842) (ASU 2016-02). We adopted ASU 2016-02 and its related amendments (collectively known as Accounting Standards Codification (ASC) 842) on January 1, 2019 using the modified retrospective approach. Results for reporting periods beginning after January 1, 2019 are presented under ASC 842, while prior period amounts are not adjusted and continue to be reported in accordance with ASC 840, Leases. ASC 842 requires virtually all leases, other than leases of intangible assets, to be recorded on the balance sheet with a right-of-use (ROU) asset and a corresponding lease liability.
We elected the package of practical expedients permitted under the transition guidance within the new standard, which allowed us to carry forward our historical assessments of whether a contract contains a lease, lease classification and initial direct costs. In addition, we elected the accounting policy to combine the lease and nonlease components as a single component for all asset classes.
We determine if an arrangement is a lease at inception. Leases are classified as either operating or finance leases based on certain criteria. This classification determines the timing and presentation of expenses on the income statement, as well as the presentation of the related cash flows and balance sheet. Operating leases are recorded on the balance sheet as operating lease right-of-use assets, other accrued expenses and liabilities, and long-term operating lease liabilities. We currently have no finance leases.
ROU assets and related liabilities are recorded at lease commencement based on the present value of the lease payments over the expected lease term. Lease payments include future increases unless the increases are based on changes in an index or rate. As our leases do not usually provide an implicit rate, our incremental borrowing rate is used to calculate ROU assets and related liabilities. The incremental borrowing rate is determined based on our estimated credit rating, the term of the lease, the economic environment where the asset resides and full collateralization. The ROU assets and related lease liabilities include optional renewals for which we are reasonably certain to exercise; whereas, optional terminations are included unless it is reasonably certain not to be elected.
The adoption of the new standard resulted in the recognition of ROU assets of $90.9 million and lease liabilities of $92.5 million, and corresponding deferred tax assets and liabilities, on our consolidated balance sheet as of January 1, 2019. The adoption had no impact on our consolidated statements of income or cash flows.
Implementation cost accounting for cloud computing arrangements: In August 2018, the FASB issued ASU No. 2018-15, Intangibles—Goodwill and Other—Internal-Use Software (Subtopic 350-40): Customer's Accounting for Implementation Costs Incurred in a Cloud Computing Arrangement That Is a Service Contract (ASU 2018-15). The standard aligns the accounting for costs incurred to implement a cloud computing arrangement (CCA) that is a service arrangement with the guidance on capitalizing costs associated with developing or obtaining internal-use software. Under ASU 2018-15, an entity would apply Subtopic 350-40 to determine which implementation costs related to a CCA that is a service contract should be capitalized. The standard does not change the accounting for the service component of a CCA. The associated cash flows will be reflected within operating activities.
We retrospectively adopted the guidance during the quarter ended December 31, 2019. The adoption resulted in the reclassification of cash flows associated with implementation costs related to CCAs that are service contracts on our consolidated statements of cash flows. This resulted in a decrease to operating cash flows, and a corresponding increase to investing cash flows, of $2.5 million, $1.4 million and $2.8 million for the years ending December 31, 2019, 2018 and 2017, respectively. The adoption had no impact on our consolidated balance sheets or consolidated statements of income.
Accounting Guidance Issued and Not Yet Adopted
Credit losses: In June 2016, the FASB issued ASU No. 2016-13, Financial Instruments - Credit Losses (Topic 326): Measurement of Credit Losses on Financial Instruments (ASU 2016-13). The current guidance requires the allowance for doubtful accounts to be estimated based on an incurred loss model, which considers past and current conditions. ASU 2016-13 requires companies to use an expected loss model that also considers reasonable and supportable forecasts of future conditions. ASU 2016-13 is effective for annual periods beginning after December 15, 2019, including interim periods within that reporting period. Early adoption is permitted for annual periods beginning after December 15, 2018, including interim periods within that reporting period. The standard requires a cumulative-effect adjustment to the balance sheet as of the beginning of the first reporting period in which the guidance is effective. We will adopt the standard effective January 1, 2020 and do not expect the adoption of the new standard to have a material effect on our consolidated financial statements.
Income taxes: In December 2019, the FASB issued ASU No. 2019-12, Income Taxes (Topic 740): Simplifying the Accounting for Income Taxes (ASU 2019-12), as part of its initiative to reduce complexity in the accounting standards. The amendments in ASU 2019-12 eliminate certain exceptions related to the approach for intraperiod tax allocation, the methodology for calculating income taxes in an interim period and the recognition of deferred tax liabilities for outside basis differences. ASU 2019-12 also clarifies and simplifies other aspects of the accounting for income taxes. ASU 2019-12 is effective for fiscal years, and interim periods within those fiscal years, beginning after December 15, 2020. Early adoption is permitted, including adoption in any interim period. We are currently evaluating the impact that this guidance will have upon our financial position and results of operations, if any.
Use of Estimates
The preparation of financial statements in conformity with accounting principles generally accepted in the United States requires management to make estimates and assumptions that affect the reported amounts of assets and liabilities and disclosure of contingent assets and liabilities at the date of the financial statements. Estimates also affect the amounts of revenue and expenses during the reported periods. Significant estimates included in these consolidated financial statements include:
Allowances for doubtful accounts receivable
Income tax accruals, including those related to the Tax Cuts and Jobs Act
Uncertain tax positions
Tax valuation reserves
Fair value of stock-based compensation and probabilities of performance award attainment
Contract revenue
Standalone selling prices of our products and services
Acquired deferred revenue
Useful lives for depreciation and amortization
Valuations of goodwill and other intangible assets
Contingent consideration
Deferred compensation
Loss contingencies
Operating lease assets and liabilities
Actual results could differ from these estimates. Changes in estimates are recorded in the results of operations in the period that the changes occur.
Revenue Recognition
RevenueOur revenue is derived principally from the licensing of computer software products and from related maintenance contracts. We adopted ASC 606 on January 1, 2018. ASC 606 requires an entity to evaluate revenue recognition by identifying a contract with a customer, identifying the performance obligations in the contract, determining the transaction price, allocating the transaction price to the performance obligations in the contract, and recognizing revenue when (or as) the entity satisfies a performance obligation.
Revenue Recognition Policy 2019 and 2018 (ASC 606)
We enter into contracts that include combinations of products, maintenance and services, which are accounted for as separate performance obligations with differing revenue recognition patterns.
Revenue from perpetual licenses is classified as software license revenue. Software license revenue and is recognized up front upon delivery of the licensed product andand/or the utility that enables the customer to access authorization keys, provided that acceptance has occurred and a signed contractual obligationan enforceable contract has been received, the price is fixedreceived. Typically, our perpetual licenses are sold with post-contract support (PCS), which includes unspecified technical enhancements and determinable,customer support. We allocate value in bundled perpetual and collectibility of the receivable is probable. The Company determines the fair value of PCS sold together with perpetual licensesarrangements based on the rate charged for PCS when sold separately.standalone selling prices of the perpetual license and PCS. Revenue from PCS contracts is classified as maintenance and service revenue and is recognized ratably over the term of the contract.contract, as we satisfy the PCS performance obligation over time.
RevenueIn addition to perpetual licenses, we sell time-based lease licenses. Lease licenses are sold only as a bundled arrangement that includes the rights to a term software license and PCS. Utilizing observable inputs, we determined that 50% of the estimated standalone selling price of the lease license is attributable to the term license and 50% is attributable to the PCS. This determination considered the value relationship for softwareour products between PCS to time-based lease licenses, the value relationship between PCS and perpetual licenses, the average economic life of our products, software renewal rates and the price of the bundled arrangement in relation to the perpetual licensing approach. Consistent with the perpetual sales, the license component is classified as software license revenue and recognized as revenue up front at the commencement of the lease upon delivery of the licensed product and/or utility that enables the customer to access authorization keys. The PCS is classified as maintenance revenue and is recognized over the period of the lease contract. Typically, the Company's software leases include PCS which, due to the short term (principally one year or less) of the Company's software lease licenses, cannot be separated from lease revenue for accounting purposes. As a result, both the lease licenses and PCS are recognized ratably over the lease period. Due to the short-term nature of the software lease licenses and the frequency with which the Company provides major product upgrades (typically annually), the Company does not believe that a significant portion of the fee paid under the arrangement is attributable to the PCS component of the arrangement and, as a result, includes the revenue for the entire arrangement within software license revenue in the consolidated statements of income.
Many of the Company's semiconductor products are typically licensed via longer term leases of 24–36 months. The Company recognizes revenue for these licenses over the term of the lease contract. Becausecontract, as we satisfy the Company does not have vendor-specific objective evidence of the fair value of these leases, the Company also recognizes revenue from perpetual licensesPCS performance obligation over the term of the lease contract during the infrequent occurrence of these licenses being sold with semiconductor leases in multiple-element arrangements.time.
Revenue from training, support and other services is recognized as the services are performed. The Company applies the specific performance method toFor contracts in which the service consists of a single act,performance obligation, such as providing a training class to a customer, andwe recognize revenue upon completion of the proportional performance method to otherobligation. For service contracts that are longer in duration and often include multiple actsperformance obligations (for example, both training and consulting)., we measure the progress toward completion of the obligations and recognize revenue accordingly. In applyingmeasuring progress towards the proportionalcompletion of performance method, the Companyobligations, we typically utilizesutilize output-based estimates for services with contractual billing arrangements that are not based on time and materials, and estimatesestimate output based on the total tasks completed as compared to the total tasks required for each work contract. Input-based estimates are utilized for services that involve general consultations with contractual billing arrangements based on time and materials, utilizing direct labor as the input measure. Proceeds from customers for the purpose of expediting road-map items, developing new products or creating specific features and functionality for existing products is classified as revenue.
The CompanyWe also executesexecute arrangements through independent channel partners in which the channel partners are authorized to market and distribute the Company'sour software products to end users of the Company'sour products and services in specified territories. In sales facilitated by channel partners, the channel partner bears the risk of collection from the end-user customer. The Company recognizesWe recognize revenue from transactions with channel partners whenin a manner consistent with the channel partner submits a written purchase commitment, collectibility from the channel partner is probable, a license agreement signed by the end-user customer is receiveddirect sales described above for both perpetual and delivery has occurred, provided that all other revenue recognition criteria are satisfied.time-based licenses. Revenue from channel partner transactions is the amount remitted to the Companyus by the channel partners. This amount includes a fee for PCS that is compensation for providing technical enhancements and the second level of technical support to the end user, which is based on the rate charged for PCS when sold separately, and is recognized over the period that PCS is to be provided. The Company does not offer right of return, product rotation or price protection to any of its channel partners.
Non-income related taxes collected from customers and remitted to governmental authorities are recorded on the consolidated balance sheet as accounts receivable and accrued expenses. The collection and payment of these amounts are reported on a net basis in the consolidated statements of income and do not impact reported revenues or expenses.
The Company warrantsWe do not offer right of return. We warrant to itsour customers that itsour software will perform substantially perform as specified in the Company's mostour current user manuals. The Company hasWe have not experienced significant claims related to software warranties beyond the scope of
maintenance support, which the Company iswe are already obligated to provide. Consequently,The warranty is not sold, and cannot be purchased, separately. The warranty does not provide any type of additional service to the Company hascustomer or performance obligation for us.
Our agreements with our customers generally require us to indemnify the customer against claims that our software infringes third-party patent, copyright, trademark or other proprietary rights. Such indemnification obligations are generally limited in a variety of industry-standard respects, including our right to replace an infringing product.
Significant Judgments (ASC 606)
Our contracts with customers typically include promises to transfer licenses and services to a customer. Judgment is required to determine if the promises are separate performance obligations, and if so, to allocate the transaction price to each performance obligation. We use the estimated standalone selling price method to allocate the transaction price for each performance obligation. The estimated standalone selling price is determined using all information reasonably available to us, including market conditions and other observable inputs. The corresponding revenues are recognized as the related performance obligations are satisfied.
We apply a practical expedient to expense sales commissions as incurred when the amortization period would have been one year or less. Sales commissions associated with the initial year of multi-year contracts are expensed as incurred due to their immateriality. Sales commissions associated with multi-year contracts beyond the initial year are subject to an employee service requirement and are expensed as incurred as they are not established reservesconsidered incremental costs to obtain a contract.
We are required to adjust promised amounts of consideration for warranty obligations.the effects of the time value of money if the timing of the payments provides the customer or us with a significant financing benefit. We consider various factors in assessing whether a financing component exists, including the duration of the contract, market interest rates and the timing of payments. Our contracts do not include a significant financing component requiring adjustment to the transaction price.
Revenue Recognition Policy 2017 (ASC 605)
Revenue from perpetual licenses was classified as license revenue and was recognized upon delivery of the licensed product and/or the utility that enabled the customer to access authorization keys, provided that acceptance had occurred and a signed contractual obligation was received, the price was fixed and determinable, and collectibility of the receivable was probable. We determined the fair value of PCS sold together with perpetual licenses based on the rate charged for PCS when sold separately. Revenue from PCS contracts was classified as maintenance and service revenue and was recognized ratably over the term of the contract.
Revenue for software lease licenses was classified as license revenue and was recognized over the period of the lease contract. Typically, our software leases include PCS which, due to the short term (principally one year or less) of our software lease licenses, were not permitted to be separated from lease revenue for accounting purposes. As a result, both the lease licenses and PCS were recognized ratably over the lease period. We included the revenue for the entire lease arrangement within software license revenue in the consolidated statements of income.
Many of our semiconductor products are typically licensed via longer term leases of 24–36 months. We recognized revenue for these licenses over the term of the lease contract. Because we did not have vendor-specific objective evidence of the fair value of these leases, we also recognized revenue from perpetual licenses over the term of the lease contract during the infrequent occurrence of these licenses being sold with semiconductor leases in multiple-element arrangements.
Revenue from training, support and other services was recognized as the services were performed. We applied the specific performance method to contracts in which the service consisted of a single act, such as providing a training class to a customer, and the proportional performance method to other service contracts that were longer in duration and often included multiple acts (for example, both training and consulting). In applying the proportional performance method, we typically utilized output-based estimates for services with contractual billing arrangements that were not based on time and materials, and estimated output based on the total tasks completed as compared to the total tasks required for each work contract. Input-based estimates were utilized for services that involved general consultations with contractual billing arrangements based on time and materials, utilizing direct labor as the input measure.
The accounting treatment under ASC 605 associated with arrangements through independent channel partners, non-income related taxes, warranties and indemnification obligations is consistent with the accounting treatment under ASC 606 described above.
Cash and Cash Equivalents
Cash and cash equivalents consist primarily of highly liquid investments such as deposits held at major banks and money market funds with original maturities of three months or less.funds. Cash equivalents are carried at cost, which approximates fair value. The Company'sOur cash and cash equivalents balances comprise the following:
|
| | | | | | | | | | | |
| | December 31, 2019 | | December 31, 2018 |
| (in thousands, except percentages) | Amount | | % of Total | | Amount | | % of Total |
| Cash accounts | $ | 549,639 |
| | 63.0 | | $ | 331,084 |
| | 42.6 |
| Money market funds | 322,455 |
| | 37.0 | | 446,055 |
| | 57.4 |
| Total | $ | 872,094 |
| | | | $ | 777,139 |
| | |
|
| | | | | | | | | | | |
| | December 31, 2016 | | December 31, 2015 |
| (in thousands, except percentages) | Amount | | % of Total | | Amount | | % of Total |
| Cash accounts | $ | 488,504 |
| | 59.4 | | $ | 427,244 |
| | 54.5 |
| Money market funds | 333,975 |
| | 40.6 | | 356,924 |
| | 45.5 |
| Total | $ | 822,479 |
| | | | $ | 784,168 |
| | |
The Company'sOur money market fund balances are held in various funds of a single issuer.
Property and Equipment
Property and equipment is stated at cost. Depreciation is computed using the straight-line method over the estimated useful lives of the various classes of assets, which range from one year to forty years. Repairs and maintenance are charged to expense as incurred. Gains or losses from the sale or retirement of property and equipment are included in operating income.
Research and Development
Research and development costs other than certain capitalized software development costs, are expensed as incurred.
Software Development Costs
Internally developed software costs required to be capitalized as defined by the accounting guidance are not material to the Company'sour consolidated financial statements.
Business Combinations
When the Company consummateswe consummate an acquisition, the assets acquired and the liabilities assumed are recognized separately from goodwill at their acquisition date fair values. Goodwill as of the acquisition date is measured as the excess of the fair value of consideration transferred over the net of the acquisition date fair valuesvalue of the net identifiable assets acquired and the liabilities assumed.acquired. While best estimates and assumptions are used to accurately value assets acquired and liabilities assumed at the acquisition date as well as contingent consideration, where applicable, the Company'sour estimates are inherently uncertain and subject to refinement. As a result, during the measurement period, which may be up to one year from the acquisition date, the Company recordswe record adjustments to the assets acquired and liabilities assumed with the corresponding offset to goodwill as the Company obtainswe obtain new information about facts and circumstances that existed as of the acquisition date that, if known, would have affected the measurement of the amounts recognized as of that date. Upon the earlier of the conclusion of the measurement period or final determination of the values of assets acquired or liabilities assumed, any subsequent adjustments are recorded in the consolidated statements of income.
Goodwill and Other Intangible Assets
Goodwill represents the excess of the fair value of consideration transferred over the fair value of net identifiable assets acquired. Other intangible assets consist of trade names, customer lists, contract backlog and acquired software and technology. Intangible assets that are not considered to have an indefinite useful life are amortized over their useful lives, which are generallyrange from two years to fifteenseventeen years. Amortization expense for intangible assets was $50.8$36.9 million,, $58.1 $40.8 million and $61.0$49.8 million for the years ended December 31, 2016, 20152019, 2018 and 2014,2017, respectively.
The Company testsWe test goodwill and indefinite-lived intangible assets for impairment at least annually by performing a quantitative assessment of whether the fair value of each reporting unit or asset exceeds its carrying amount. We have one reporting unit. Goodwill is tested at thethis reporting unit level and indefinite-lived intangible assets are tested at the individual asset level. This requires the Companyus to assess and make judgments regarding a variety of factors which impact the fair value of the reporting unit or asset being tested, including business plans, anticipated future cash flows, economic projections and other market data.
The Company performs itsWe perform our annual impairment tests for goodwill and indefinite-lived intangible assets onas of January 1 of each year unless there is an indicator that would require a test during the year. The CompanyWe periodically reviewsreview the carrying value
of other intangible assets and will recognize impairments when events or circumstances indicate that such assets may be impaired.
Concentrations of Credit Risk
The Company hasWe have a concentration of credit risk with respect to revenue and trade receivables due to the use of certain significant channel partners to market and sell the Company'sour products. The Company performsWe perform periodic credit evaluations of itsour customers' financial condition and generally doesdo not require collateral. The following table outlines concentrations of risk with respect to the Company'sour revenue:
|
| | | | | | | | | |
| | | Year Ended December 31, |
| (as a % of revenue) | | 2019 | | 2018 | | 2017 |
| Revenue from channel partners | | 23 | % | | 22 | % | | 25 | % |
| Largest channel partner | | 4 | % | | 4 | % | | 5 | % |
2nd largest channel partner | | 2 | % | | 2 | % | | 2 | % |
|
| | | | | | | | | |
| | | Year Ended December 31, |
| (as a % of revenue) | | 2016 | | 2015 | | 2014 |
| Revenue from channel partners | | 24 | % | | 24 | % | | 25 | % |
| Largest channel partner | | 5 | % | | 5 | % | | 4 | % |
2nd largest channel partner | | 2 | % | | 2 | % | | 2 | % |
No single customer accounted for more than 5% of the Company'sour revenue in 2016, 20152019, 2018 or 2014.2017.
In addition to the concentration of credit risk with respect to trade receivables, the Company'sour cash and cash equivalents are also exposed to concentration of credit risk. The Company'sOur cash and cash equivalent accounts are insured through various public and private bank deposit insurance programs, foreign and domestic; however, a significant portion of the Company'sour funds are not insured. The following table outlines concentrations of risk with respect to the Company'sour cash and cash equivalents:
|
| | | | | | | |
| | As of December 31, |
| (in thousands) | 2019 | | 2018 |
| Cash and cash equivalents held domestically | $ | 626,433 |
| | $ | 616,249 |
|
| Cash and cash equivalents held by foreign subsidiaries | 245,661 |
| | 160,890 |
|
| Cash and cash equivalents held in excess of deposit insurance, foreign and domestic | 855,721 |
| | 754,163 |
|
| Largest balance of cash and cash equivalents held with one financial institution, foreign and domestic | 330,551 |
| | 452,166 |
|
|
| | | | | | | |
| | As of December 31, |
| (in thousands) | 2016 | | 2015 |
| Cash and cash equivalents held domestically | $ | 593,348 |
| | $ | 539,031 |
|
| Cash and cash equivalents held by foreign subsidiaries | 229,131 |
| | 245,137 |
|
| Cash and cash equivalents held in excess of deposit insurance, foreign and domestic | 805,374 |
| | 763,400 |
|
| Largest balance of cash and cash equivalents held with one financial institution, foreign and domestic | 377,602 |
| | 440,650 |
|
Allowance for Doubtful Accounts
The Company makesWe make judgments as to itsour ability to collect outstanding receivables and providesprovide allowances for a portion of receivables when collection becomes doubtful. Provisions are made based upon a specific review of all significant outstanding invoices from both value and delinquency perspectives. For those invoices not specifically reviewed, provisions are estimated at differing rates based upon the age of the receivable and the geographic area of origin. In determining these percentages, the Company considers itswe consider our historical collection experience and current economic trends in the customer's industry and geographic region. The CompanyWe recorded provisions for doubtful accountsbad debts of $2.0$2.9 million,, $1.3 $1.6 million and $2.1$1.5 million for the years ended December 31, 2016, 20152019, 2018 and 2014,2017, respectively.
Income Taxes
The Company accountsWe account for income taxes under the asset and liability method, which requires the recognition of deferred tax assets and liabilities for the expected future tax consequences of events that have been included in the financial statements. Under this method, deferred tax assets and liabilities are determined based on the differences between the financial statement and tax bases of assets and liabilities using enacted tax rates in effect for the year in which the differences are expected to reverse. The effect of a change in tax rates on deferred tax assets and liabilities is recognized in income in the period of the enactment date.
The Company recordsWe record net deferred tax assets to the extent it believeswe believe these assets will more likely than not be realized. In making such determination, the Company considerswe consider all available positive and negative evidence, including scheduled reversals of deferred tax liabilities, projected future taxable income, tax planning strategies and recent financial operations. In the event the Company determineswe determine that itwe will be able to realize deferred tax assets for which a valuation allowance was used to reduce their carrying value, the adjustment to the valuation allowance will be recorded as a reduction to the provision for income taxes.
Tax benefits related to uncertain tax positions taken or expected to be taken on a tax return are recorded when such benefits meet a more-likely-than-not threshold. Otherwise, these tax benefits are recorded when a tax position has been effectively
settled, which means that the statute of limitations has expired or the appropriate taxing authority has completed theirits examination even though the statute of limitations remains open. The Company recognizes
We recognize interest and penalties related to income taxes within the income tax expense line in the accompanying consolidated statements of income. Accrued interest and penalties are included within the related tax liability line in the consolidated balance sheets.
Foreign Currencies
Certain of the Company'sour sales and intercompany transactions are denominated in foreign currencies. These transactions are translated to the functional currency at the exchange rate on the transaction date. Assets and liabilities denominated in a currency other than the Company'sour functional currency or subsidiary'sour subsidiaries' functional currencycurrencies are translated at the effective exchange rate on the balance sheet date. Gains and losses resulting from foreign exchange transactions are included in other income (expense),expense, net. The CompanyWe recorded net foreign exchange gainslosses of $0.1$2.5 million, $3.1 million and $0.5$1.9 million for the years ended December 31, 20162019, 2018 and 2015, respectively, and net foreign exchange losses of $1.6 million for the year ended December 31, 2014.2017, respectively.
The financial statements of the Company'sour foreign subsidiaries are translated from the functional (local) currency to U.S. Dollars. Assets and liabilities are translated at the exchange rates on the balance sheet date. Results of operations are translated at average exchange rates, which approximate rates in effect when the underlying transactions occurred.
Accumulated Other Comprehensive Loss
Accumulated other comprehensive loss is composed entirely of foreign currency translation adjustments.
Earnings Per Share
Basic earnings per share ("EPS")(EPS) amounts are computed by dividing earnings by the weighted average number of common shares outstanding during the period. Diluted EPS amounts assume the issuance of common stock for all potentially dilutive equivalents outstanding. To the extent stock optionsawards are anti-dilutive, they are excluded from the calculation of diluted EPS.
The details of basic and diluted EPS are as follows:
|
| | | | | | | | | | | | |
| | Year Ended December 31, |
| (in thousands, except per share data) | | 2019 | | 2018 | | 2017 |
| Net income | | $ | 451,295 |
| | $ | 419,375 |
| | $ | 259,251 |
|
| Weighted average shares outstanding – basic | | 84,259 |
| | 83,973 |
| | 84,988 |
|
| Dilutive effect of stock plans | | 1,666 |
| | 1,940 |
| | 1,866 |
|
| Weighted average shares outstanding – diluted | | 85,925 |
| | 85,913 |
| | 86,854 |
|
| Basic earnings per share | | $ | 5.36 |
| | $ | 4.99 |
| | $ | 3.05 |
|
| Diluted earnings per share | | $ | 5.25 |
| | $ | 4.88 |
| | $ | 2.98 |
|
| Anti-dilutive shares | | 14 |
| | 7 |
| | 84 |
|
|
| | | | | | | | | | | | |
| | Year Ended December 31, |
| (in thousands, except per share data) | | 2016 | | 2015 | | 2014 |
| Net income | | $ | 265,636 |
| | $ | 252,521 |
| | $ | 254,690 |
|
| Weighted average shares outstanding – basic | | 87,227 |
| | 89,561 |
| | 92,067 |
|
| Dilutive effect of stock plans | | 1,742 |
| | 1,941 |
| | 2,127 |
|
| Weighted average shares outstanding – diluted | | 88,969 |
| | 91,502 |
| | 94,194 |
|
| Basic earnings per share | | $ | 3.05 |
| | $ | 2.82 |
| | $ | 2.77 |
|
| Diluted earnings per share | | $ | 2.99 |
| | $ | 2.76 |
| | $ | 2.70 |
|
| Anti-dilutive options | | 260 |
| | 206 |
| | 718 |
|
Stock-Based Compensation
The Company accountsWe account for stock-based compensation in accordance with share-based payment accounting guidance. The guidance requires an entity to measure the cost of employee services received in exchange for an award of equity instruments based on the grant-date fair value of the award. The cost is recognized over the period during which an employee is required to provide serviceservices in exchange for the award, typically the vesting period.
Fair Value of Financial Instruments
The Company accountsWe account for certain assets and liabilities at fair value in accordance with the accounting guidance applicable to fair value measurements and disclosures. The carrying values of cash, cash equivalents, short-term investments, accounts receivable, accounts payable, accrued expenses, other accrued liabilities and short-term obligations are deemed to be reasonable estimates of their fair values because of their short-term nature.
New Accounting Guidance
Business combinations: In January 2017, the Financial Accounting Standards Board (FASB) issued Accounting Standards Update No. 2017-01, Business Combinations (Topic 805): Clarifying the Definition of a Business (ASU 2017-01). This update narrows the definition of a business. If substantially all the fair value of the gross assets acquired is concentrated in a single identifiable asset or group of similar identifiable assets, the acquiree is not a business. The update also requires a business to
| |
| 3. | Revenue from Contracts with Customers |
include an input and a substantive process that significantly contributes to the ability to create outputs. This definition is expected to reduce the numberAdoption of acquisitions accounted for as business combinations, which will impact the accounting treatment of certain items, including the accounting treatment of contingent consideration and transaction expenses. ASU 2017-01 is effective for annual periods beginning after December 15, 2017, including interim periods within that reporting period. Early adoption is permitted and the update will be applied prospectively. The effect of the implementation will depend upon the nature of the Company's future acquisitions, if any. Historically, the Company has entered into acquisitions that would meet the definition of a business under ASU 2017-01.
Income taxes: In October 2016, the FASB issued Accounting Standards Update No. 2016-16, Income Taxes (Topic 740): Intra-Entity Transfers of Assets Other Than Inventory (ASU 2016-16). Previous guidance requires the tax effects from intra-entity asset transfers to be deferred until that asset is sold to a third party or recovered through use. ASU 2016-16 eliminates this deferral for all intra-entity asset transfers other than inventory. The standard is effective for annual periods beginning after December 15, 2017, including interim periods within that reporting period. Early adoption is permitted and a modified retrospective transition is required upon adoption. The Company plans to adopt ASU 2016-16 beginning in 2018 and expects adoption to have an immaterial effect, if any, on its financial results.
Employee share-based payment accounting: In March 2016, the FASB issued Accounting Standards Update No. 2016-09, Compensation - Stock Compensation (Topic 718): Improvements to Employee Share-Based Payment Accounting (ASU 2016-09). This update includes various areas for simplification related to aspects of the accounting for share-based payment transactions. One simplification is that the tax effects of share-based payment settlements will be recorded in the income statement. Prior guidance required tax windfalls at settlement, and tax shortfalls to the extent of previous windfalls, to be recorded in equity. This provision is required to be adopted prospectively. These tax effects will be reported as operating cash flows according to the new guidance as opposed to financing cash flows in the prior guidance. Other simplifications involve the classification of awards as either equity or liabilities and classification on the statements of cash flows. ASU 2016-09 is effective for annual periods beginning after December 15, 2016, including interim periods within that reporting period. The primary impact of adoption will be the recognition of excess tax benefits or deficiencies in the Company's provision for income taxes rather than paid-in capital, and the related change in classification of such benefits on the consolidated statements of cash flows.
Leases: In February 2016, the FASB issued Accounting Standards Update No. 2016-02, Leases (Topic 842) (ASU 2016-02). ASU 2016-02 requires virtually all leases, other than leases that meet the definition of a short-term lease, to be recorded on the balance sheet with a right-of-use asset and corresponding lease liability. As a result, the Company's assets and liabilities will increase upon adoption. Leases will be classified as either operating or finance leases based on certain criteria. This classification will determine the timing and presentation of expenses on the income statement, as well as the presentation of related cash flows. The standard is effective for annual periods beginning after December 15, 2018, including interim periods within that reporting period. Early adoption is permitted and a modified retrospective transition is required upon adoption. The Company does not expect to early adopt and is currently in the data-gathering phase of implementation. The Company is currently evaluating the effect that implementation of this update will have on its financial results upon adoption.
Revenue from contracts with customers: In May 2014, the FASB issued Accounting Standards Update No. 2014-09, ASC 606, Revenue from Contracts with Customers (Topic 606) (ASU 2014-09). ASU 2014-09 supersedes most current revenue recognition guidance, including industry-specific guidance. Previous guidance requires an entity to recognize revenue when persuasive evidence of an arrangement exists, delivery has occurred or services have been rendered,
We adopted ASC 606 on January 1, 2018 using the seller's price to the buyer is fixed or determinable, and collectibility is reasonably assured. Under the new guidance, an entity is required to evaluate revenue recognition by identifying a contract with a customer, identifying the performance obligations in the contract, determining the transaction price, allocating the transaction price to the performance obligations in the contract and recognizing revenue when (or as) the entity satisfies a performance obligation. The standard also requires disclosuremodified retrospective approach for all contracts not completed as of the nature, amount, timing and uncertainty of revenue and cash flows arising from contracts with customers.
ASU 2015-14, Revenue from Contracts with Customers (Topic 606): Deferral of the Effective Date, delayed the effective date of ASU 2014-09 to annualadoption. Results for reporting periods beginning after December 15, 2017, including interim periods withinJanuary 1, 2018 are presented under ASC 606, while prior period amounts are not adjusted and continue to be reported in accordance with ASC 605. The adoption of ASC 606 represents a change in accounting principle that reporting period. This standard is effective forwill more closely align revenue recognition with the Companydelivery of our software licenses, maintenance and services.
We recorded an increase to retained earnings of $242.4 million, or $183.1 million net of tax, on January 1, 2018. Entities have2018 due to the option of using a full retrospective, cumulative effect or modified approach to adopt ASU 2014-09. The Company expects to utilizeof the full retrospective method to restate each prior period presented upon adoption.
This update willASC 606 adoption, with the impact the timing and amounts of revenue recognized. The Company's preliminary assessment is that the adoption of this standard will have a material impact on the Company’s consolidated financial statements. While the Company expects that the standard will impact various elements of its business, the Company's initial assessment is that the most significant impact will be on the recognition ofprimarily derived from revenue related to time-based software lease licenses. These licenses include the right to use the software and PCSSoftware lease license revenue was recognized ratably over the term of the license. Thesecontract under the previous guidance; however, approximately 50% of the contract is recognized up front at the commencement of the lease under ASC 606 with the remainder recognized ratably to maintenance and service revenue.
Disaggregation of Revenue
The following table summarizes revenue:
|
| | | | | | | | | | | |
| | Year Ended December 31, |
| (in thousands) | 2019
(ASC 606) | | 2018
(ASC 606) | | 2017
(ASC 605) |
| Revenue: | | | | | |
| Lease licenses | $ | 406,043 |
| | $ | 275,619 |
| | $ | 376,886 |
|
| Perpetual licenses | 293,587 |
| | 301,098 |
| | 248,078 |
|
| Software licenses | 699,630 |
| | 576,717 |
| | 624,964 |
|
| Maintenance | 760,574 |
| | 676,883 |
| | 440,428 |
|
| Service | 55,688 |
| | 40,036 |
| | 29,858 |
|
| Maintenance and service | 816,262 |
| | 716,919 |
| | 470,286 |
|
| Total revenue | $ | 1,515,892 |
| | $ | 1,293,636 |
| | $ | 1,095,250 |
|
| | | | | | |
| Direct revenue, as a percentage of total revenue | 77.1 | % | | 77.6 | % | | 75.2 | % |
| Indirect revenue, as a percentage of total revenue | 22.9 | % | | 22.4 | % | | 24.8 | % |
Our software licenses are currentlyrevenue is recognized up front, while maintenance and service revenue is generally recognized over the term of the contract.
Deferred Revenue
Deferred revenue consists of billings made or payments received in advance of revenue recognition from customer agreements. The timing of revenue recognition may differ from the timing of billings to customers. Payment terms vary by the type and location of customer and the products or services offered. The time between invoicing and when payment is due is not significant.
The changes in deferred revenue, inclusive of both current and long-term deferred revenue, during the years ended December 31, 2019 and 2018 were as follows:
|
| | | | | | | |
| (in thousands) | 2019 | | 2018 |
| Beginning balance – January 1 | $ | 343,174 |
| | $ | 299,730 |
|
| Acquired deferred revenue | 6,880 |
| | 2,470 |
|
| Deferral of revenue | 1,532,549 |
| | 1,339,964 |
|
| Recognition of deferred revenue | (1,515,892 | ) | | (1,293,636 | ) |
| Currency translation | (1,437 | ) | | (5,354 | ) |
| Ending balance – December 31 | $ | 365,274 |
| | $ | 343,174 |
|
Revenue allocated to remaining performance obligations represents contracted revenue that has not yet been recognized, which includes both deferred revenue and backlog. Our backlog represents installment billings for periods beyond the current
quarterly billing cycle. Revenue recognized during the years ended December 31, 2019 and 2018 included amounts in deferred revenue and backlog at the beginning of the period of $475.9 million and $387.2 million, respectively.
Total revenue allocated to remaining performance obligations as of December 31, 2019 will be recognized as revenue ratably over the termas follows:
|
| | | |
| (in thousands) | |
| Next 12 months | $ | 569,751 |
|
| Months 13-24 | 177,364 |
|
| Months 25-36 | 93,097 |
|
| Thereafter | 30,531 |
|
| Total revenue allocated to remaining performance obligations | $ | 870,743 |
|
of the license. Under the new standard and the existing interpretations, the Company expects to recognize a meaningful portion of the revenue related to these licenses up-front at the time the license is delivered. However, the Company's preliminary assessment could change as additional interpretations relating to the new standard are provided and as issues identified by software industry groups are addressed.
During2019 Acquisitions
On November 1, 2019, we completed the twelve monthsacquisition of 100% of the shares of LST, the premier provider of explicit dynamics and other advanced finite element analysis technology. The acquisition empowers our customers to solve a new class of engineering challenges, including developing safer automobiles, aircraft and trains while reducing or even eliminating the need for costly physical testing. The transaction closed with a purchase price of $777.8 million, which included $470.6 million in cash and the issuance of 1.4 million shares of our common stock in an unregistered offering to the prior owners of LST. The fair value of the common stock issued as consideration was based on the volume-weighted average price of our common stock on November 1, 2019 of $220.74, resulting in a fair value of $307.2 million.
On February 1, 2019, we completed the acquisition of 100% of the shares of Granta Design for a purchase price of $208.7 million, paid in cash and inclusive of final net working capital adjustments. The acquisition of Granta Design, the premier provider of materials information technology, expands our portfolio into this important area, giving customers access to materials intelligence, including data that is critical to successful simulations.
Additionally, during the year ended December 31, 20162019, we acquired Dynardo, Helic and 2015,DfR Solutions to combine the Company completed various acquisitions to accelerate the development of new and innovative products to the marketplace while lowering design and engineering costs for customers. Theacquired technologies with our existing comprehensive multiphysics portfolio. These acquisitions were not individually significant. The combined purchase pricesprice of these other acquisitions was $136.2 million, paid in cash.
During the year ended December 31, 2019, we incurred $6.6 million in acquisition-related expenses, recognized as selling, general and administrative expense on the consolidated statements of income.
The assets and liabilities of the acquisitions were approximately $10.3have been recorded based upon management's estimates of their fair market values as of each respective date of acquisition. The following tables summarize the fair values of consideration transferred and the fair values of identified assets acquired and liabilities assumed at each respective date of acquisition:
Fair Value of Consideration Transferred:
|
| | | | | | | | | | | | | | | |
| (in thousands) | LST | | Granta Design | | Other Acquisitions | | Total |
| Cash | $ | 470,623 |
| | $ | 208,736 |
| | $ | 136,232 |
| | $ | 815,591 |
|
| Ansys common stock | 307,173 |
| | — |
| | — |
| | 307,173 |
|
| Total consideration transferred at fair value | $ | 777,796 |
| | $ | 208,736 |
| | $ | 136,232 |
| | $ | 1,122,764 |
|
Recognized Amounts of Identifiable Assets Acquired and Liabilities Assumed:
|
| | | | | | | | | | | | | | | |
| (in thousands) | LST | | Granta Design | | Other Acquisitions | | Total |
| Cash | $ | 8,520 |
| | $ | 13,644 |
| | $ | 6,231 |
| | $ | 28,395 |
|
| Accounts receivable and other tangible assets | 20,568 |
| | 6,941 |
| | 10,746 |
| | 38,255 |
|
| Developed software and core technologies (10-year weighted-average life) | 167,700 |
| | 32,445 |
| | 25,018 |
| | 225,163 |
|
| Customer lists (15-year weighted-average life) | 25,900 |
| | 20,016 |
| | 15,743 |
| | 61,659 |
|
| Trade names (10-year weighted-average life) | 10,600 |
| | 4,579 |
| | 2,051 |
| | 17,230 |
|
| Indemnification asset | 34,039 |
| | — |
| | — |
| | 34,039 |
|
Accounts payable and other liabilities
| (3,721 | ) | | (6,714 | ) | | (6,425 | ) | | (16,860 | ) |
Deferred revenue
| (3,565 | ) | | (1,426 | ) | | (1,889 | ) | | (6,880 | ) |
| Uncertain tax positions | (34,039 | ) | | — |
| | (257 | ) | | (34,296 | ) |
| Net deferred tax liabilities | (47,596 | ) | | (9,822 | ) | | (8,294 | ) | | (65,712 | ) |
| Total identifiable net assets | $ | 178,406 |
| | $ | 59,663 |
| | $ | 42,924 |
| | $ | 280,993 |
|
| Goodwill | $ | 599,390 |
| | $ | 149,073 |
| | $ | 93,308 |
| | $ | 841,771 |
|
LST has uncertain tax positions inclusive of interest and penalties of $34.0 million and $49.7 milliona corresponding indemnification asset. The uncertain tax positions reflect potential federal and state tax liabilities associated with tax years 2016 to 2019. Settlements of the tax positions, if any, will be funded by the indemnification asset that was created in accordance with the executed Agreement and Plan of Merger.
The goodwill, which is generally not tax-deductible, is attributed to intangible assets that do not qualify for separate recognition, including the years ended December 31, 2016assembled workforce of the acquired business and 2015, respectively.the synergies expected to arise as a result of the acquisitions.
The fair values of the assets acquired and liabilities assumed are based on preliminary calculations. The estimates and assumptions for these items are subject to change as additional information about what was known and knowable at the acquisition date is obtained during the measurement period (up to one year from the acquisition date).
We determined the fair value of our intangible assets using various valuation techniques, including the relief-from-royalty method and the multi-period excess earnings method. These models utilize certain unobservable inputs classified as Level 3 measurements as defined by ASC 820, Fair Value Measurements and Disclosures. The determination of fair value requires considerable judgment and is sensitive to changes in underlying assumptions, estimates and market factors. Estimating fair value requires us to make assumptions and estimates regarding our future plans, as well as industry and economic conditions. These assumptions and estimates include, but are not limited to: royalty rate, discount rate and attrition rate.
The valuation method and assumptions used to determine the fair value of the significant intangible assets acquired in 2019 are as follows:
|
| | | | | | |
| Intangible Asset | | Valuation Method | | LST Assumptions | | Granta Design Assumptions |
| Developed software and core technologies | | Relief-from-royalty | | Royalty rate: 50% Discount rate: 10% | | Royalty rate: 8% - 10% Discount rate: 12.5% |
| Trade names | | Relief-from-royalty | | Royalty rate: 2% Discount rate: 10% | | Royalty rate: 2% Discount rate: 14% |
| Customer lists | | Multi-period excess earnings | | Attrition rate: 10% Discount rate: 11% | | Attrition rate: 10% Discount rate: 12.5% |
The operating results of each acquisition have been included in the Company'sour consolidated financial statements since each respective date of acquisition. The effects of the business combinations were not material to the Company'sour consolidated results of operations individually or inindividually. The table presented below reflects the aggregate.
In valuing deferred revenueaggregate impact on the balance sheetsour results of operations of the Company's 20162019 acquisitions from the date of acquisition to December 31, 2019. The operating income does not include integration costs borne directly by us and 2015 acquisitionsour non-acquired subsidiaries as of their respective acquisition dates, the Company applied the fair value provisions applicable to the accounting for business combinations, resulting in a reduction of deferred revenue as compared to the historical carrying amounts. During 2015, acquired deferred revenues with a combined historical carrying value of $0.9 million were ascribed no fair value on the opening balance sheets. As a result the Company's post-acquisition revenue will be less than the sum of what would have otherwise been reported by ANSYS and each acquiree absent the acquisitions. The impacts on reported revenue for the years ended December 31, 2016 and 2015 were $0.1 million and $0.8 million, respectively.
SpaceClaim Corporation
|
| | | |
| (in thousands) | Year Ended December 31, 2019 |
| Revenue | $ | 44,079 |
|
| Operating income | $ | 6,733 |
|
2018 Acquisition
On April 30, 2014, the CompanyMay 2, 2018, we completed the acquisition of SpaceClaim,100% of the shares of OPTIS, a leadingpremier provider of 3-D modeling technology. Under the termssoftware for scientific simulation of the agreement, ANSYS acquired SpaceClaimlight, human vision and physics-based visualization, for a purchase price of $85.0$291.0 million, which was paid almost entirely in cash.
SpaceClaim's software provides customers with a powerful and intuitive 3-D direct modeling solution to author new concepts and then leverage The acquisition extends our portfolio into the powerarea of optical simulation to rapidly iterate on these designs to drive innovation. The broad appeal of the SpaceClaim technology can help the Company deliver simulation tools to any engineer in any industry. The complementary combination accelerates the development of newprovide comprehensive sensor solutions, covering visible and innovative products to the marketplace while lowering designinfrared light, electromagnetics and engineering costsacoustics for customers.camera, radar and lidar.
The operating results of SpaceClaimOPTIS have been included in the Company'sour consolidated financial statements from April 30, 2014,since May 2, 2018, the date of acquisition.
The assets and liabilities of SpaceClaimOPTIS have been recorded based upon management's estimates of their fair market values as of the acquisition date. The following tables summarize the fair value of consideration transferred and the fair values of identified assets acquired and liabilities assumed at the acquisition date, as adjusted within the one-year measurement period:date:
Fair Value of Consideration Transferred:
|
| | | |
| (in thousands) | OPTIS |
| Cash | $ | 290,983 |
|
|
| | | |
| (in thousands) | |
| Cash | $ | 84,892 |
|
| ANSYS replacement stock options | 68 |
|
| Total consideration transferred at fair value | $ | 84,960 |
|
Recognized Amounts of Identifiable Assets Acquired and Liabilities Assumed:
|
| | | |
| (in thousands) | OPTIS |
| Cash | $ | 7,957 |
|
| Accounts receivable and other tangible assets | 15,910 |
|
| Developed software and core technologies (10-year weighted-average life) | 47,597 |
|
| Customer lists (12-year life) | 41,303 |
|
| Trade names (9-year weighted-average life) | 10,749 |
|
Accounts payable and other liabilities
| (11,941 | ) |
Deferred revenue
| (2,470 | ) |
| Net deferred tax liabilities | (23,438 | ) |
| Total identifiable net assets | $ | 85,667 |
|
| Goodwill | $ | 205,316 |
|
|
| | | |
| (in thousands) | |
| Cash | $ | 723 |
|
| Accounts receivable and other tangible assets | 1,857 |
|
| Developed technology (10-year life) | 15,800 |
|
| Customer relationships (6-year life) | 9,400 |
|
| Trade name (6-year life) | 1,300 |
|
| Contract backlog (6-year life) | 550 |
|
| Non-compete agreement (2-year life) | 300 |
|
| Net deferred tax assets | 9,288 |
|
| Accounts payable and other liabilities | (2,011 | ) |
| Deferred revenue | (700 | ) |
| Total identifiable net assets | $ | 36,507 |
|
| Goodwill | $ | 48,453 |
|
The goodwill, which is generally not tax-deductible, is attributed to intangible assets that do not qualify for separate recognition, including the assembled workforce of the acquired business and the synergies expected to arise as a result of the acquisition of SpaceClaim.OPTIS.
During the one-year measurement period since the SpaceClaimOPTIS acquisition date, the Companywe adjusted the fair values of the assets acquired and liabilities assumed, with the offset recorded as a $4.8$2.6 million decreaseincrease to goodwill. These adjustments were made as the Companywe obtained new information about facts and circumstances that existed as of the acquisition date that, if known, would have affected the measurement of the amounts recognized as of that date.
In valuing deferred revenue onFull pro forma results of operations have not been presented as the SpaceClaim balance sheet aseffects of the OPTIS business combination were not material to our consolidated results of operations. The table presented below reflects the impact of OPTIS from the date of acquisition date, the Company applied the fair value provisions applicable to the accounting for business combinations. Acquired deferred revenue with a historical carrying value of $3.3 million was ascribed a fair value of $0.7 million on the opening balance sheet. AsDecember 31, 2018. The operating loss does not include integration costs borne directly by us and our non-OPTIS subsidiaries as a result the Company's post-acquisition revenue was less than the sum of what would have otherwise been reported by ANSYS and SpaceClaim absent the acquisition. The impacts on reported revenue for
|
| | | |
| (in thousands) | Year Ended December 31, 2018 |
| Revenue | $ | 18,532 |
|
| Operating loss | $ | (5,462 | ) |
2017 Acquisitions
During the twelve monthsyear ended December 31, 20152017, we completed various acquisitions to expand our customer base and 2014accelerate the development of new and innovative products to the marketplace while lowering design and engineering costs for customers. The acquisitions were $0.6 million and $2.0 million, respectively.
Reaction Design
On January 3, 2014, the Company completed the acquisition of Reaction Design, a leading developer of chemistry simulation software. Under the terms of the agreement, ANSYS acquired Reaction Design for anot individually significant. The combined purchase price of
$19.1 millionthe acquisitions was approximately $67.0 million. The 2017 technology acquisitions are further described in
cash. Reaction Design's solutions enable transportation manufacturers and energy companies to rapidly achieve their clean technology goals by automating the
analysis of chemical processes via computer simulation and modeling solutions.table below: |
| | | | |
| Date of Closing | | Company | | Details |
| November 15, 2017 | | 3DSIM | | 3DSIM, a developer of premier additive manufacturing technology, gives us a complete additive manufacturing simulation workflow solution. 3DSIM's software solutions empower manufacturers, designers, materials scientists and engineers to achieve their objectives through simulation-driven innovation rather than physical trial and error. |
| July 5, 2017 | | Computational Engineering International, Inc. (CEI Inc.) | | CEI Inc., the developer of EnSight, aids engineers and scientists in their ability to analyze, visualize and communicate large simulation data sets in clear, higher-resolution outputs. |
| March 10, 2017 | | CLK Design Automation (CLK-DA) | | CLK-DA offers fast transistor simulation technology that complements our semiconductor product portfolio. |
The operating results of Reaction Designeach acquisition have been included in the Company'sour consolidated financial statements since theeach respective date of acquisition, January 3, 2014.acquisition. The total consideration transferred was allocated to the assets and liabilities of Reaction Design based on management's estimateseffects of the fair valuesbusiness combinations were not material to our consolidated results of operations individually or in the assets acquired and the liabilities assumed. The allocation included $7.0 million to identifiable intangible assets, including core technology, customer lists and trade names, to be amortized over periods between two and eleven years, and $9.2 million to goodwill, which is not tax-deductible. These amounts include measurement-period adjustments. During the one-year measurement period since the Reaction Design acquisition date, the Company adjusted the fair values of the assets acquired and liabilities assumed, with the offset recorded as an increase toaggregate.
goodwill of $1.9 million and a reduction in noncontrolling interest of $0.6 million. These adjustments were made as the Company obtained new information about facts and circumstances that existed as of the acquisition date that, if known, would have affected the measurement of the amounts recognized as of that date.
In valuing deferred revenue on the Reaction Design balance sheet as of the acquisition date, the Company applied the fair value provisions applicable to the accounting for business combinations. Acquired deferred revenue with a historical carrying value of $2.3 million was ascribed no fair value on the opening balance sheet. As a result, the Company's post-acquisition revenue was less than the sum of what would have otherwise been reported by ANSYS and Reaction Design absent the acquisition. The impacts on reported revenue for the twelve months ended December 31, 2015 and 2014 were $0.3 million and $2.0 million, respectively.
| |
4.5. | Other Receivables and Current Assets and Other Accrued Expenses and Liabilities |
The Company'sOur other receivables and current assets, and other accrued expenses and liabilities, comprise the following balances:
|
| | | | | | | |
| | December 31, |
| (in thousands) | 2019 | | 2018 |
| Receivables related to unrecognized revenue | $ | 177,679 |
| | $ | 167,144 |
|
| Income taxes receivable, including overpayments and refunds | 26,672 |
| | 13,709 |
|
| Prepaid expenses and other current assets | 45,268 |
| | 35,260 |
|
| Total other receivables and current assets | $ | 249,619 |
| | $ | 216,113 |
|
| | | | |
| Consumption, sales and VAT tax liabilities | $ | 36,398 |
| | $ | 24,192 |
|
| Accrued expenses and other current liabilities | 106,549 |
| | 75,367 |
|
| Total other accrued expenses and liabilities | $ | 142,947 |
| | $ | 99,559 |
|
|
| | | | | | | |
| | December 31, |
| (in thousands) | 2016 | | 2015 |
| Receivables related to unrecognized revenue | $ | 199,119 |
| | $ | 170,186 |
|
| Income taxes receivable, including overpayments and refunds | 15,718 |
| | 7,877 |
|
| Prepaid expenses and other current assets | 24,512 |
| | 22,170 |
|
| Total other receivables and current assets | $ | 239,349 |
| | $ | 200,233 |
|
Receivables forrelated to unrecognized revenue represent the current portion of billings made for annual lease licenses and software maintenancecustomer contracts that have not yet been recognized as revenue.
| |
5.6. | Property and Equipment |
Property and equipment consists of the following:
|
| | | | | | | | | | |
| | | | | December 31, |
| (in thousands) | | Estimated Useful Lives | | 2019 |
| 2018 |
| Equipment | | 1-15 years | | $ | 105,428 |
| | $ | 92,409 |
|
| Computer software | | 1-5 years | | 33,878 |
| | 35,053 |
|
| Buildings and improvements | | 5-40 years | | 38,095 |
| | 27,352 |
|
| Leasehold improvements | | 1-17 years | | 19,876 |
| | 15,782 |
|
| Furniture | | 1-13 years | | 12,766 |
| | 10,846 |
|
| Land | | | | 2,696 |
| | 1,759 |
|
| Property and equipment, gross | | | | 212,739 |
| | 183,201 |
|
| Less: Accumulated depreciation | | | | (129,103 | ) | | (121,546 | ) |
| Property and equipment, net | | | | $ | 83,636 |
| | $ | 61,655 |
|
|
| | | | | | | | | | |
| | | | | December 31, |
| (in thousands) | | Estimated Useful Lives | | 2016 | | 2015 |
| Equipment | | 1-10 years | | $ | 78,614 |
| | $ | 78,932 |
|
| Computer software | | 1-5 years | | 30,867 |
| | 33,710 |
|
| Buildings | | 10-40 years | | 25,472 |
| | 25,041 |
|
| Leasehold improvements | | 1-15 years | | 11,571 |
| | 12,621 |
|
| Furniture | | 1-13 years | | 8,618 |
| | 8,601 |
|
| Land | | | | 1,759 |
| | 1,759 |
|
| Property and equipment, gross | | | | 156,901 |
| | 160,664 |
|
| Less: Accumulated depreciation | | | | (102,224 | ) | | (98,740 | ) |
| Property and equipment, net | | | | $ | 54,677 |
| | $ | 61,924 |
|
Depreciation expense related to property and equipment was $18.723.6 million, $19.518.4 million and $20.917.9 million for the years ended December 31, 20162019, 20152018 and 20142017, respectively.
| |
6.7. | Goodwill and Intangible Assets |
Goodwill represents the excess of the fair value of the consideration transferred over the fair value of net tangible and identifiable intangible assets of acquired businesses.acquired. Identifiable intangible assets acquired in business combinations are recorded based on their fair values on the date of acquisition.
During the first quarter of 2016, the Company2019, we completed the annual impairment test for goodwill and the indefinite-lived intangible asset and determined that these assets had not been impaired as of the test date, January 1, 2016.2019. No other events or circumstances changed during the twelve monthsyear ended December 31, 20162019 that would indicate that the fair values of the Company'sour reporting unit and indefinite livedindefinite-lived intangible asset are below their carrying values.
The Company's intangibleIntangible assets and estimated useful lives are classified as follows:
|
| | | | | | | | | | | | | | | |
| | December 31, 2019 | | December 31, 2018 |
| (in thousands) | Gross Carrying Amount | | Accumulated Amortization | | Gross Carrying Amount | | Accumulated Amortization |
| Finite-lived intangible assets: | | | | | | | |
| Developed software and core technologies | $ | 635,063 |
| | $ | (332,622 | ) | | $ | 410,680 |
| | $ | (314,730 | ) |
| Customer lists and contract backlog | 269,629 |
| | (132,596 | ) | | 209,031 |
| | (117,614 | ) |
| Trade names | 154,259 |
| | (117,379 | ) | | 137,225 |
| | (113,677 | ) |
| Total | $ | 1,058,951 |
| | $ | (582,597 | ) | | $ | 756,936 |
| | $ | (546,021 | ) |
| Indefinite-lived intangible asset: | | | | | | | |
| Trade name | $ | 357 |
| | | | $ | 357 |
| | |
|
| | | | | | | | | | | | | | | |
| | December 31, 2016 | | December 31, 2015 |
| (in thousands) | Gross Carrying Amount | | Accumulated Amortization | | Gross Carrying Amount | | Accumulated Amortization |
| Finite-lived intangible assets: | | | | | | | |
| Developed software and core technologies (3 – 11 years) | $ | 338,594 |
| | $ | (275,130 | ) | | $ | 336,262 |
| | $ | (251,201 | ) |
| Customer lists and contract backlog (5 – 15 years) | 159,549 |
| | (88,414 | ) | | 159,885 |
| | (76,160 | ) |
| Trade names (2 – 10 years) | 127,952 |
| | (90,289 | ) | | 127,903 |
| | (76,493 | ) |
| Total | $ | 626,095 |
| | $ | (453,833 | ) | | $ | 624,050 |
| | $ | (403,854 | ) |
| Indefinite-lived intangible assets: | | | | | | | |
| Trade names | $ | 357 |
| | | | $ | 357 |
| | |
Finite-lived intangible assets are amortized over their estimated useful lives of two years to seventeen years. Amortization expense for the intangible assets reflected above was $50.8$36.9 million, $58.1$40.8 million and $61.0$49.8 million for the years ended December 31, 2016, 20152019, 2018 and 2014,2017, respectively.
As of December 31, 2016,2019, estimated future amortization expense for the intangible assets reflected above is as follows: |
| | | |
| (in thousands) | |
| 2020 | $ | 54,735 |
|
| 2021 | 53,231 |
|
| 2022 | 53,548 |
|
| 2023 | 52,474 |
|
| 2024 | 50,530 |
|
| Thereafter | 211,836 |
|
| Total intangible assets subject to amortization, net | 476,354 |
|
| Indefinite-lived trade name | 357 |
|
| Other intangible assets, net | $ | 476,711 |
|
|
| | | |
| (in thousands) | |
| 2017 | $ | 47,937 |
|
| 2018 | 34,643 |
|
| 2019 | 21,332 |
|
| 2020 | 20,325 |
|
| 2021 | 16,199 |
|
| Thereafter | 31,826 |
|
| Total intangible assets subject to amortization, net | 172,262 |
|
| Indefinite-lived trade name | 357 |
|
| Other intangible assets, net | $ | 172,619 |
|
The changes in goodwill during the years ended December 31, 20162019 and 2015 are2018 were as follows:
|
| | | | | | | |
| (in thousands) | 2019 | | 2018 |
| Beginning balance - January 1 | $ | 1,572,455 |
| | $ | 1,378,553 |
|
Acquisitions and adjustments(1) | 842,588 |
| | 204,381 |
|
| Currency translation | (1,763 | ) | | (10,479 | ) |
| Ending balance - December 31 | $ | 2,413,280 |
| | $ | 1,572,455 |
|
|
| | | | | | | |
| (in thousands) | 2016 | | 2015 |
| Beginning balance - January 1 | $ | 1,332,348 |
| | $ | 1,312,182 |
|
| Acquisitions | 6,184 |
| | 28,561 |
|
Adjustments(1) | (1 | ) | | (4,573 | ) |
| Currency translation | (1,316 | ) | | (3,822 | ) |
| Ending balance - December 31 | $ | 1,337,215 |
| | $ | 1,332,348 |
|
(1) In accordance with the accounting for business combinations, the Companywe recorded adjustments to goodwill for the effect of changes in the provisional fair values of the assets acquired and liabilities assumed during the measurement period (up to one year from the acquisition date) as the Companywe obtained new information about facts and circumstances that existed as of the acquisition date that, if known, would have affected the measurement of the amounts recognized as of that date.
| |
7.8. | Fair Value Measurement |
The valuation hierarchy for disclosure of assets and liabilities reported at fair value prioritizes the inputs for such valuations into three broad levels:
Level 1: quoted prices (unadjusted) in active markets for identical assets or liabilities;
Level 2: quoted prices for similar assets and liabilities in active markets or inputs that are observable for the asset or liability, either directly or indirectly through market corroboration, for substantially the full term of the financial instrument; or
Level 3: unobservable inputs based on the Company'sour own assumptions used to measure assets and liabilities at fair value.
A financial asset's or liability's classification within the hierarchy is determined based on the lowest level input that is significant to the fair value measurement.
The following tables provide the assets and liabilities carried at fair value and measured on a recurring basis:
| | | | | | Fair Value Measurements at Reporting Date Using: | | | Fair Value Measurements at Reporting Date Using: |
| (in thousands) | December 31, 2016 | | Quoted Prices in Active Markets (Level 1) | | Significant Other Observable Inputs (Level 2) | | Significant Unobservable Inputs (Level 3) | December 31, 2019 | | Quoted Prices in Active Markets (Level 1) | | Significant Other Observable Inputs (Level 2) | | Significant Unobservable Inputs (Level 3) |
| Assets | | | | | | | | | | | | | | |
| Cash equivalents | $ | 333,975 |
| | $ | 333,975 |
| | $ | — |
| | $ | — |
| $ | 322,455 |
| | $ | 322,455 |
| | $ | — |
| | $ | — |
|
| Short-term investments | $ | 381 |
| | $ | — |
| | $ | 381 |
| | $ | — |
| $ | 288 |
| | $ | — |
| | $ | 288 |
| | $ | — |
|
| Deferred compensation plan investments | $ | 459 |
| | $ | 459 |
| | $ | — |
| | $ | — |
| $ | 1,110 |
| | $ | 1,110 |
| | $ | — |
| | $ | — |
|
|
| | | | | | | | | | | | | | | |
| | | | Fair Value Measurements at Reporting Date Using: |
| (in thousands) | December 31, 2018 | | Quoted Prices in Active Markets (Level 1) | | Significant Other Observable Inputs (Level 2) | | Significant Unobservable Inputs (Level 3) |
| Assets | | | | | | | |
| Cash equivalents | $ | 446,055 |
| | $ | 446,055 |
| | $ | — |
| | $ | — |
|
| Short-term investments | $ | 225 |
| | $ | — |
| | $ | 225 |
| | $ | — |
|
| Deferred compensation plan investments | $ | 1,646 |
| | $ | 1,646 |
| | $ | — |
| | $ | — |
|
|
| | | | | | | | | | | | | | | |
| | | | Fair Value Measurements at Reporting Date Using: |
| (in thousands) | December 31, 2015 | | Quoted Prices in Active Markets (Level 1) | | Significant Other Observable Inputs (Level 2) | | Significant Unobservable Inputs (Level 3) |
| Assets | | | | | | | |
| Cash equivalents | $ | 356,924 |
| | $ | 356,924 |
| | $ | — |
| | $ | — |
|
| Short-term investments | $ | 446 |
| | $ | — |
| | $ | 446 |
| | $ | — |
|
| Liabilities | | | | | | | |
| Contingent consideration | $ | (1,376 | ) | | $ | — |
| | $ | — |
| | $ | (1,376 | ) |
The cash equivalents in the preceding tables represent money market funds.funds, valued at net asset value, with carrying values which approximate their fair values because of their short-term nature.
The short-term investments in the preceding tables represent deposits held by certain foreign subsidiaries of the Company.subsidiaries. The deposits have fixed interest rates with original maturities ranging from three months to one year.
The deferred compensation plan investments in the preceding tabletables represent trading securities held in a rabbi trust for the benefit of the non-affiliate Independentnon-employee Directors. These securities consist of mutual funds traded in an active market with quoted prices. As a result, the plan assets wereare classified as Level 1 in the fair value hierarchy. The plan assets are recorded within other long-term assets on the Company'sour consolidated balance sheet.sheets.
The contingent consideration in the table above represents the final payment related to the 2013 acquisition of EVEN - Evolutionary Engineering AG ("EVEN"). The net present value calculation for the contingent consideration, which was paid during the quarter ended March 31, 2016, included significant unobservable inputs as of December 31, 2015 in the assumption that the remaining payment would be made, and, therefore, the liability was classified as Level 3 in the fair value hierarchy. The liability was recorded within other accrued expenses and liabilities on the Company's consolidated balance sheet.
The following table presents the changes during the years ended December 31, 2016 and 2015 in the Company's Level 3 liability for contingent consideration that is measured at fair value on a recurring basis:
|
| | | |
| | Fair Value Measurement Using Significant Unobservable Inputs |
| (in thousands) | Contingent Consideration |
| Balance as of January 1, 2015 | $ | 2,621 |
|
| Contingent payments | (1,456 | ) |
| Interest expense and foreign exchange activity included in earnings | 211 |
|
| Balance as of December 31, 2015 | $ | 1,376 |
|
| Contingent payments | (1,448 | ) |
| Interest expense and foreign exchange activity included in earnings | 72 |
|
| Balance as of December 31, 2016 | $ | — |
|
The carrying values of cash, accounts receivable, accounts payable, accrued expenses, other accrued liabilities and short-term obligations approximate their fair values because of their short-term nature.
We primarily have operating leases for office space and leased cars included in our ROU assets and lease liabilities. Our executive offices and those related to certain domestic product development, marketing, production and administration are located in a 186,000 square foot office facility in Canonsburg, Pennsylvania. The term of the lease is 183 months, which began on October 1, 2014 and expires on December 31, 2029. The lease agreement includes options to renew the contract through August 2044, an option to lease additional space in January 2025 and an option to terminate the lease in December 2025. No options are included in the lease liability as renewal is not reasonably certain. In addition, we are reasonably certain we will not terminate the lease agreement. Absent the exercise of options in the lease, our base rent (inclusive of property taxes and certain operating costs) was $4.3 million per annum for the first five years of the lease term, $4.5 million per annum for years six through ten and $4.7 million per annum for years eleven through fifteen.
The components of our global lease cost reflected in the consolidated statements of income for the year ended December 31, 2019 are as follows: |
| | | |
| (in thousands) | |
| Lease liability cost | $ | 22,507 |
|
Variable lease cost not included in the lease liability(1) | 3,754 |
|
Total lease cost
| $ | 26,261 |
|
(1) Variable lease cost includes common area maintenance, property taxes, utilities and fluctuations in rent due to a change in an index or rate.
For the years ended December 31, 2018 and 2017, lease cost totaled $21.3 million and $18.4 million, respectively.
Other information related to operating leases for the year ended December 31, 2019 is as follows: |
| | | |
| (in thousands) | |
| Cash paid for amounts included in the measurement of the lease liability: | |
| Operating cash flows from operating leases | $ | (20,031 | ) |
Right-of-use assets obtained in exchange for new operating lease liabilities
| $ | 35,191 |
|
As of December 31, 2019, the weighted-average remaining lease term of operating leases was 7.7 years, and the weighted-average discount rate of operating leases was 3.7%.
The maturity schedule of the operating lease liabilities as of December 31, 2019 is as follows: |
| | | |
| (in thousands) | |
| 2020 | $ | 21,617 |
|
| 2021 | 19,439 |
|
| 2022 | 16,616 |
|
| 2023 | 12,513 |
|
| 2024 | 12,421 |
|
| Thereafter | 46,159 |
|
| Total future lease payments | 128,765 |
|
Less: Present value adjustment
| (18,838 | ) |
Present value of future lease payments(1)
| $ | 109,927 |
|
(1)Includes the current portion of operating lease liabilities of $18.2 million, which is reflected in other accrued expenses and liabilities in the consolidated balance sheets.
As of December 31, 2019, we had operating office leases that have not yet commenced with combined lease obligations of $16.3 million. The leases commence in 2020 and have a weighted-average lease term of 7.2 years.
The future minimum lease payments under ASC 840, including termination fees, under noncancellable operating leases for office space in effect at December 31, 2018 were as follows:
|
| | | |
| (in thousands) | |
| 2019 | $ | 16,354 |
|
| 2020 | 12,469 |
|
| 2021 | 10,177 |
|
| 2022 | 8,523 |
|
| 2023 | 6,809 |
|
| Thereafter | 14,267 |
|
| Total | $ | 68,599 |
|
In February 2019, we entered into a credit agreement for a $500.0 million unsecured revolving credit facility, which includes a $50.0 million sublimit for the issuance of letters of credit, with Bank of America, N.A. as the Administrative Agent. The revolving credit facility becomes payable in full on February 22, 2024 and is available for general corporate purposes, including, among others, to finance acquisitions and capital expenditures.
In connection with the acquisition of LST, we amended our existing credit agreement (amended credit agreement). The amendment provides for a new $500.0 million unsecured term loan facility to finance the acquisition. The term loan was funded on November 1, 2019 and matures on November 1, 2024. Principal on the term loan will be payable on the last business day of each fiscal quarter commencing with the ninth full fiscal quarter after the funding date at a rate of 1.25% per quarter, increasing to 2.50% per quarter after the next four fiscal quarters.
Borrowings under the amended credit agreement will accrue interest at the Eurodollar rate plus an applicable margin or at the base rate, at our election. For the quarter ended December 31, 2019, we elected to apply the Eurodollar rate. The base rate is the applicable margin plus the highest of (i) the federal funds rate plus 0.500%, (ii) the Bank of America prime rate and (iii) the Eurodollar rate plus 1.000%. The applicable margin for these borrowings is a percentage per annum based on the lower of (1) a pricing level determined by our then-current consolidated leverage ratio and (2) a pricing level determined by our debt ratings (if such debt ratings exist). This results in a margin ranging from 1.125% to 1.750% and 0.125% to 0.750% for the Eurodollar rate and base rate, respectively. The interest rate in effect as of December 31, 2019 was 2.964%.
The amended credit agreement contains language in the event the Eurodollar rate is not available due to LIBOR changes. If this occurs, the base rate will be used for borrowings. However, we may work with the Administrative Agent to amend the agreement to replace the Eurodollar rate with (i) one or more rates based on the Secured Overnight Financing Rate (SOFR); or (ii) another alternative benchmark rate, subject to the lenders' approval.
The amended credit agreement contains customary representations and warranties, affirmative and negative covenants and events of default. The amended credit agreement also contains a financial covenant requiring us to maintain a consolidated leverage ratio of indebtedness to earnings before interest, taxes, depreciation and amortization not exceeding 3.50 to 1.00 as of the end of any fiscal quarter (for the four-quarter period ending on such date) with an opportunity for a temporary increase in such consolidated leverage ratio to 4.00 to 1.00 upon the consummation of certain qualified acquisitions for which the aggregate consideration is at least $250.0 million.
As of December 31, 2019, there were no outstanding borrowings under the unsecured revolving credit agreement, and the carrying value of the term loan was $498.5 million, which is net of $1.5 million of unamortized debt issuance costs. We were in compliance with all covenants.
As of December 31, 2019, scheduled maturities of total debt for each of the five succeeding fiscal years is as follows:
|
| | | |
| (in thousands) | |
2020(1) | $ | — |
|
| 2021 | — |
|
| 2022 | 25,000 |
|
| 2023 | 50,000 |
|
| 2024 | 425,000 |
|
| Total | $ | 500,000 |
|
(1)We repaid $75.0 million of the unsecured term loan in January 2020 prior to its scheduled maturity date. As such, the payment is reflected as current on our consolidated balance sheet but not in the table above.
Income before income taxes includesincluded the following components:
|
| | | | | | | | | | | | |
| | | Year Ended December 31, |
| (in thousands) | | 2019 | | 2018 | | 2017 |
| Domestic | | $ | 448,271 |
| | $ | 455,478 |
| | $ | 344,447 |
|
| Foreign | | 74,312 |
| | 31,607 |
| | 51,247 |
|
| Total | | $ | 522,583 |
| | $ | 487,085 |
| | $ | 395,694 |
|
|
| | | | | | | | | | | | |
| | | Year Ended December 31, |
| (in thousands) | | 2016 | | 2015 | | 2014 |
| Domestic | | $ | 340,251 |
| | $ | 325,097 |
| | $ | 291,042 |
|
| Foreign | | 40,064 |
| | 31,668 |
| | 57,097 |
|
| Total | | $ | 380,315 |
| | $ | 356,765 |
| | $ | 348,139 |
|
The provision for income taxes iswas composed of the following:
|
| | | | | | | | | | | | |
| | | Year Ended December 31, |
| (in thousands) | | 2019 | | 2018 | | 2017 |
| Current: | | | | | | |
| Federal | | $ | 44,824 |
| | $ | 58,138 |
| | $ | 112,414 |
|
| State | | 9,554 |
| | 12,888 |
| | 7,879 |
|
| Foreign | | 31,421 |
| | 30,359 |
| | 18,843 |
|
| Deferred: | | | | | | |
| Federal | | (8,833 | ) | | (20,764 | ) | | (7,387 | ) |
| State | | (965 | ) | | (2,901 | ) | | (584 | ) |
| Foreign | | (4,713 | ) | | (10,010 | ) | | 5,278 |
|
| Total | | $ | 71,288 |
| | $ | 67,710 |
| | $ | 136,443 |
|
|
| | | | | | | | | | | | |
| | | Year Ended December 31, |
| (in thousands) | | 2016 | | 2015 | | 2014 |
| Current: | | | | | | |
| Federal | | $ | 99,783 |
| | $ | 93,853 |
| | $ | 80,620 |
|
| State | | 8,338 |
| | 7,733 |
| | 7,192 |
|
| Foreign | | 17,479 |
| | 17,854 |
| | 24,495 |
|
| Deferred: | | | | | | |
| Federal | | (13,368 | ) | | (14,472 | ) | | (18,536 | ) |
| State | | (1,036 | ) | | (1,987 | ) | | (1,915 | ) |
| Foreign | | 3,483 |
| | 1,263 |
| | 1,593 |
|
| Total | | $ | 114,679 |
| | $ | 104,244 |
| | $ | 93,449 |
|
The reconciliation of the U.S. federal statutory tax rate to the consolidated effective tax rate iswas as follows:
|
| | | | | | | | | |
| | | Year Ended December 31, |
| | | 2019 | | 2018 | | 2017 |
| Federal statutory tax rate | | 21.0 | % | | 21.0 | % | | 35.0 | % |
| State income taxes, net of federal benefit | | 1.5 |
| | 1.5 |
| | 1.1 |
|
| Foreign rate differential | | 0.8 |
| | 0.8 |
| | 0.1 |
|
| Uncertain tax positions | | (0.2 | ) | | 0.5 |
| | 0.3 |
|
| U.S. tax reform enactment | | (0.4 | ) | | 0.2 |
| | 4.5 |
|
| Valuation allowance release | | (1.3 | ) | | — |
| | — |
|
| Domestic production activity benefit | | — |
| | — |
| | (2.6 | ) |
| Benefit from entity structuring activities | | — |
| | (1.4 | ) | | — |
|
| Research and development credits | | (2.2 | ) | | (2.3 | ) | | (1.4 | ) |
| Stock-based compensation | | (3.1 | ) | | (3.3 | ) | | (3.1 | ) |
| Foreign-derived intangible income deduction | | (3.8 | ) | | (3.9 | ) | | — |
|
| Other | | 1.3 |
| | 0.8 |
| | 0.6 |
|
| | | 13.6 | % | | 13.9 | % | | 34.5 | % |
|
| | | | | | | | | |
| | | Year Ended December 31, |
| | | 2016 | | 2015 | | 2014 |
| Federal statutory tax rate | | 35.0 | % | | 35.0 | % | | 35.0 | % |
| State income taxes, net of federal benefit | | 1.6 |
| | 1.1 |
| | 1.2 |
|
| Uncertain tax positions | | (0.2 | ) | | (0.4 | ) | | (0.9 | ) |
| Research and development credits | | (1.0 | ) | | (1.1 | ) | | (1.1 | ) |
| Benefit from restructuring activities | | (2.2 | ) | | (2.7 | ) | | (4.1 | ) |
| Domestic production activity benefit | | (3.7 | ) | | (3.1 | ) | | (3.5 | ) |
| Other | | 0.7 |
| | 0.4 |
| | 0.2 |
|
| | | 30.2 | % | | 29.2 | % | | 26.8 | % |
The SEC staff issued Staff Accounting Bulletin (SAB) 118, which provides guidance on accounting for the tax effects of Tax Reform. SAB 118 provided a measurement period that was limited to one year from enactment for companies to complete the accounting under ASC 740, Income Taxes. In accordance with SAB 118, throughout the measurement period, a company must reflect the income tax effects of those aspects of Tax Reform for which the accounting under ASC 740 was complete in the financial statements. To the extent that a company’s accounting for certain income tax effects of Tax Reform was incomplete, but a reasonable estimate was able to be made, the company must record a provisional estimate in the financial statements. If a company could not determine a provisional estimate to be included in the financial statements, it should continue to apply ASC 740 on the basis of the tax laws that were in effect immediately before the enactment of Tax Reform.
As further discussed below, we finalized our provisional Tax Reform calculations as of the end of the measurement period, based on guidance and information available as of the reporting date. The U.S. government has not yet issued final guidance related to a portion of the new rules enacted as part of Tax Reform. Subsequent adjustments, if any, will be recorded in the period in which guidance is finalized.
Our accounting for the impact of the reduction in the U.S. federal corporate tax rate on our deferred tax assets and liabilities is complete. Tax Reform reduced the corporate tax rate to 21 percent, effective January 1, 2018. Consequently, we recorded a net adjustment to deferred income tax expense of $1.9 million for the year ended December 31, 2017 to revalue our deferred tax assets and liabilities. No further adjustments were recorded for the years ended December 31, 2019 and 2018.
Our accounting for the transition tax is complete. Reasonable estimates of certain effects were calculated and a provisional adjustment of $16.0 million was recorded in the December 31, 2017 financial statements. To determine the amount of the transition tax, we determined, in addition to other factors, the amount of post-1986 earnings and profits (E&P) of the relevant subsidiaries, as well as the amount of non-U.S. income taxes paid on such earnings. Based on revised E&P calculations updated during the measurement period, we recognized an additional measurement-period adjustment for the year ended December 31, 2018 of $0.9 million to the transition tax obligation and a corresponding adjustment to tax expense. In February 2019, the U.S. government published final regulations relating to transition tax. In accordance with the final regulations, we recognized a post-measurement period reduction for the year ended December 31, 2019 of $1.8 million to the transition tax obligation and a corresponding adjustment to tax expense, resulting in a final transition tax obligation of $15.1 million. We have elected to pay this liability over eight years; however, in accordance with IRS issued guidance, tax overpayments from the year ended
December 31, 2017 are required to be applied to the transition tax obligation. Based on this guidance, the entire balance of the obligation has been paid as of December 31, 2019.
Our accounting for the indefinite reinvestment assertion is complete. In general, it is the practice andour intention to permanently reinvest all earnings in excess of previously taxed amounts. As part of Tax Reform, substantially all of the Company to repatriateprevious earnings of our non-U.S. subsidiaries were taxed through the transition tax and current earnings are taxed as part of GILTI tax expense. These taxes increased our previously taxed earnings and to reinvest all other earnings of its non-U.S. subsidiaries. The Company has not made a provisionallow for U.S. taxes on approximately $199 million, representing the excessrepatriation of the amount formajority of our foreign earnings without any residual U.S. federal tax. While we believe that the financial reporting overbases may be greater than the tax bases of investments in foreign subsidiaries that are essentially permanentfor any earnings in duration. Generally,excess of previously taxed amounts, such amounts become subjectare considered permanently reinvested. The cumulative temporary difference related to U.S. taxation uponsuch permanently reinvested earnings is approximately $32.8 million and we would anticipate the remittance of dividends and under certain other circumstances. The residual U.S. tax cost associated with this difference is estimatedeffect on those earnings to be $35 million.immaterial as a result of Tax Reform. During the year ended December 31, 2018, we repatriated $144.3 million of foreign cash. We did not make any adjustments related to our indefinite reinvestment assertion during the years ended December 31, 2019 and 2018.
Our accounting policy choice for GILTI is complete. Under U.S. GAAP, we are allowed to make an accounting policy choice of either (1) treating taxes due on future U.S. inclusions in taxable income related to GILTI as a current-period expense when incurred (the period cost method) or (2) factoring such amounts into the measurement of our deferred taxes (the deferred method). We selected the period cost method and recorded GILTI tax expense of $0.6 million and $0.4 million in the financial statements for the years ended December 31, 2019 and 2018, respectively.
The components of deferred tax assets and liabilities are as follows:
|
| | | | | | | | |
| | | December 31, |
| (in thousands) | | 2019 | | 2018 |
| Deferred tax assets: | | | | |
| Net operating loss carryforwards | | $ | 35,044 |
| | $ | 39,290 |
|
| Operating lease liabilities | | 26,628 |
| | — |
|
| Stock-based compensation | | 24,254 |
| | 20,464 |
|
| Uncertain tax positions | | 19,227 |
| | 17,823 |
|
| Employee benefits | | 9,392 |
| | 15,048 |
|
| Research and development credits | | 5,865 |
| | 5,951 |
|
| Other | | 6,309 |
| | 4,121 |
|
| Valuation allowance | | (17,524 | ) | | (21,676 | ) |
| Total deferred tax assets | | 109,195 |
| | 81,021 |
|
| Deferred tax liabilities: | | | | |
| Other intangible assets | | (99,193 | ) | | (38,787 | ) |
| Operating lease right-of-use assets | | (25,648 | ) | | — |
|
| Accounting method change | | (21,396 | ) | | (31,626 | ) |
| Deferred revenue | | (13,744 | ) | | (12,021 | ) |
| Property and equipment | | (3,780 | ) | | (2,034 | ) |
| Total deferred tax liabilities | | (163,761 | ) | | (84,468 | ) |
| Net deferred tax liabilities | | $ | (54,566 | ) | | $ | (3,447 | ) |
|
| | | | | | | | |
| | | December 31, |
| (in thousands) | | 2016 | | 2015 |
| Deferred tax assets: | | | | |
| Net operating loss carryforwards | | $ | 32,969 |
| | $ | 40,939 |
|
| Stock-based compensation | | 23,652 |
| | 23,258 |
|
| Employee benefits | | 17,187 |
| | 17,044 |
|
| Uncertain tax positions | | 11,562 |
| | 10,233 |
|
| Deferred revenue | | 6,382 |
| | 8,603 |
|
| Research and development credits | | 3,889 |
| | 3,562 |
|
| Allowance for doubtful accounts | | 2,078 |
| | 1,888 |
|
| Other | | 3,163 |
| | 3,240 |
|
| Valuation allowance | | (1,625 | ) | | (603 | ) |
| | | 99,257 |
| | 108,164 |
|
| Deferred tax liabilities: | | | | |
| Other intangible assets | | (56,195 | ) | | (73,933 | ) |
| Property and equipment | | (2,994 | ) | | (3,426 | ) |
| | | (59,189 | ) | | (77,359 | ) |
| Net deferred tax assets | | $ | 40,068 |
| | $ | 30,805 |
|
The Company excluded fromvaluation allowance decreased by $4.2 million for the above tableyear ended December 31, 2019. Due to an enacted law change in a $13.2 million deferredforeign jurisdiction during the year ended December 31, 2019, certain expenses will become nondeductible for tax asset associated with foreignpurposes in 2020, resulting in the ability to utilize net operating loss carryforwards and a corresponding $13.2 million valuation allowancelosses in a jurisdiction where the Companywe previously determined utilization iswas remote.
The net increase Considering all positive and negative evidence, we determined significant positive evidence exists to release $6.7 million of valuation allowance previously established. This decrease in the gross valuation allowance was $1.0 million. This increase was primarily due to a changeis offset by other increases in circumstances related to the ability to utilize a net operating loss in a foreign jurisdiction.unrealizable tax assets. As of each reporting date, management considers new evidence, both positive and negative, that could affect the future realization of deferred tax assets. If management determines it is more likely than not that an asset, or a portion of an asset, will not be realized, a valuation allowance is recorded.
As of December 31, 2016, the Company2019, we had federal net operating loss carryforwards of $28.7$4.2 million. These losses expire between 20202025 - 2034,2037, and are subject to limitations on their utilization. Deferred tax assets of $1.2$0.3 million have been recorded for state operating loss carryforwards. These losses expire between 20172030 - 2035,2038, and are subject to limitations on their utilization. The CompanyWe had total foreign net operating loss carryforwards of $76.9$142.0 million, of which $28.2$113.2 million are not currently subject to expiration dates. The remainder, $48.7$28.8 million, expires between 20192024 - 2025. The Company2036. We had tax credit carryforwards of $5.2$4.1 million, of which $3.0$1.2 million are subject to limitations on their utilization. Approximately $0.9$0.6 million of these tax credit
carryforwards are not currently subject to expiration dates. The remainder, $4.3$3.5 million, expires in various years between 20172020 - 2036.
2039.
The following is a reconciliation of the total amounts of unrecognized tax benefits:
|
| | | | | | | | | | | | |
| | | Year Ended December 31, |
| (in thousands) | | 2019 | | 2018 | | 2017 |
| Unrecognized tax benefit as of January 1 | | $ | 22,827 |
| | $ | 19,657 |
| | $ | 15,209 |
|
| Gross increases—acquisitions | | 26,914 |
| | — |
| | — |
|
| Gross increases—tax positions in prior period | | 207 |
| | 1,229 |
| | 905 |
|
| Gross decreases—tax positions in prior period | | (1,743 | ) | | (376 | ) | | (765 | ) |
| Gross increases—tax positions in current period | | 3,563 |
| | 4,014 |
| | 3,757 |
|
| Reductions due to a lapse of the applicable statute of limitations | | (2,230 | ) | | (994 | ) | | (847 | ) |
| Changes due to currency fluctuation | | (453 | ) | | (703 | ) | | 1,414 |
|
| Settlements | | — |
| | — |
| | (16 | ) |
| Unrecognized tax benefit as of December 31 | | $ | 49,085 |
| | $ | 22,827 |
| | $ | 19,657 |
|
|
| | | | | | | | | | | | |
| | | Year Ended December 31, |
| (in thousands) | | 2016 | | 2015 | | 2014 |
| Unrecognized tax benefit as of January 1 | | $ | 16,067 |
| | $ | 16,342 |
| | $ | 19,590 |
|
| Gross increases—tax positions in prior period | | 983 |
| | 64 |
| | 488 |
|
| Gross decreases—tax positions in prior period | | (2,502 | ) | | (850 | ) | | (3,715 | ) |
| Gross increases—tax positions in current period | | 2,725 |
| | 4,064 |
| | 2,513 |
|
| Reductions due to a lapse of the applicable statute of limitations | | (927 | ) | | (2,808 | ) | | (1,924 | ) |
| Changes due to currency fluctuation | | (348 | ) | | (653 | ) | | (610 | ) |
| Settlements | | (789 | ) | | (92 | ) | | — |
|
| Unrecognized tax benefit as of December 31 | | $ | 15,209 |
| | $ | 16,067 |
| | $ | 16,342 |
|
The Company believesWe believe that it is reasonably possible that approximately $0.1$8.3 million of uncertain tax positions included in the table above may be resolved within the next twelve months as a result of settlement with a taxing authority or a lapse of the statute of limitations. OfIf the total unrecognized tax benefit as of December 31, 2016, $9.22019 were to be recognized, a benefit of $47.3 million would affectimpact the effective tax rate, if recognized.rate.
The Company recognizesWe recognize interest and penalties related to income taxes as income tax expense. During the yearyears ended December 31, 2016, the Company2019, 2018 and 2017, we recorded penalty expense of $0.5 million, $0.8 million and $1.1 million, respectively. We recorded interest expense of penalty expense andless than $0.1 million, interest income of $0.1 million and interest benefit.expense of $0.4 million for the years ended December 31, 2019, 2018 and 2017, respectively. As of December 31, 2016, the Company2019, we accrued a liability for penalties of $2.7$11.7 million and interest of $2.8$6.6 million. As of December 31, 2015, the Company2018, we accrued a liability for penalties of $1.9$4.7 million and interest of $2.7$4.0 million.
The Company isWe are subject to taxation in the U.S. and various states and foreign jurisdictions. In the U.S., the Company'sour only major tax jurisdiction, the 20132016 - 20162019 tax years are open to examination by the Internal Revenue Service.
| |
9.12. | Pension and Profit-Sharing Plans |
The Company hasWe have a 401(k)/profit-sharing plan for all qualifying salaried domestic employees that permits participants to make contributions by salary reductiondefer a portion of their pay pursuant to Section 401(k) of the Internal Revenue Code. The Company makesWe make matching contributions on behalf of each eligible participant in an amount equal to 100% of the first 3% and an additional 25% of the next 5%, for a maximum total of 4.25% of the employee's compensation. The CompanyWe may make a discretionary contribution based on the participant's eligible compensation, provided the employee is employed at the end of the year and has worked at least 1,000 hours. The CompanyWe also maintainsmaintain and contribute to various defined contribution and defined benefit pension arrangements for itsour international employees. The Company funds the foreign defined benefit and contribution plans based onWe meet the minimum required deposits according tostatutory funding requirements for our foreign plans. As of December 31, 2019, the local statutory requirements. Thetotal unfunded portion of the defined benefit obligation for each planobligations is accrued in other long-term liabilities.$11.2 million.
Expenses related to the Company'sour retirement programs were $9.1$16.3 million in 2016, $8.42019, $12.4 million in 20152018 and $8.9$10.1 million in 2014.2017.
| |
10.13. | Non-Compete and Employment Agreements |
Employees of the CompanyOur employees have signed agreements under which they have agreed not to disclose trade secrets or confidential information that, where legally permitted, restrict engagement in or connection with any business that is competitive with the Companyus anywhere in the world while employed by the Companyus (and, in some cases, for specified periods thereafter)thereafter in relevant geographic areas), and that any products or technology created by them during their term of employment are the property of the Company.our property. In addition, the Company requireswe require all channel partners to enter into agreements not to disclose the Company'sour trade secrets and other proprietary information.
The Company hasWe have an employment agreement with theour Chief Executive Officer. This agreement provides for, among other things, in the case of termination for reasonsby us other than death, disabilityfor Cause (as defined therein) or causeby the Chief Executive Officer for Good Reason (as defined therein) and subject to non-competehis execution and non-solicit clauses,delivery of a release of claims against us, he will receive minimum severance payments equal to the sum of two times his base salary and target bonus to be paid out over two years from the date of
termination and up to two years of COBRA payments for health care coverage from the date ofafter termination. The Chief Executive Officer is subject to a two-year restriction on competitionDuring his employment with us and solicitationfor two years thereafter, following termination of employment under thecertain circumstances described in the contract.
The Company has a transition agreement with its Chairman of the Board. This agreement provides for, among other things, that the Chairman of the Board shall be employed by the Company until April 30, 2019 unless terminated earlier in accordance with the terms of the agreement. The Chairman of the Board shall receive salary paid in bi-monthly installments as specified in the transition agreement and restricted stock units vesting in part in February 2018 and the remainder at the end of the transition agreement, subject to the Chairman of the Board's continued employment, in accordance with the terms of the transition agreement. The Chairman of the Board will not be entitled to bonus payments during his employment pursuant to the transition agreement, butcontract, he will be eligible to participate in all of the Company’s benefit plans subject to the terms of such plans. The transition agreement provides for an additional payment (less salary receivednon-competition and equity calculations as set forth in the transition agreement) in the event that the Chairman of the Board's employment is terminated without cause prior to April 30, 2019.non-solicitation obligations.
The CompanyWe also hashave employment agreements with several other employees, primarily in foreign jurisdictions. The terms of these employment agreements generally include annual compensation severance payment provisions and non-compete clauses.
| |
11.14. | Stock-Based Compensation |
The Company has a stock option and grant plan—We have an equity incentive plan - the Fifth Amended and Restated ANSYS, Inc. 1996 Stock Option and Grant Plan ("Stock Plan")(Stock Plan). The Stock Plan, as amended, authorizes the grant of up toapproximately 39.8 million shares of the Company'sour common stock in the form of: (i) incentive stock options ("ISOs")(ISOs), (ii) nonqualified stock options, (iii) common stock with or without vesting or other restrictions, (iv) common stock upon the attainment of specified performance goals, (v) restricted stock awards, (vi) the right to receive cash dividends with the holders of the common stock as if the recipient held a specified number of shares of the common stock, (vii) deferred stock awards, (viii) restricted stock unit awards, (ix) stock appreciation rights and (x) cash-based awards.
The Stock Plan provides that: (i) the exercise price of an ISOany stock option must be no less than the fair value of the stock at the date of grant and (ii) the exercise price of an ISO held by an optionee who possesses more than 10% of the total combined voting power of all classes of stock must be no less than 110% of the fair market value of the stock at the time of grant. The Compensation Committee of the Board of Directors has the authority to set expiration dates that are no later than ten years from the date of grant (or five years for an optionee who meets the 10% criterion), payment terms, and other provisions for each grant. The majority of options granted have a four-year vesting period. Shares associated with unexercised options or reacquired shares of common stock (except those shares withheld as a result of tax withholding, shares used to pay an option exercise price or pursuant to a net issuance) become available again for option grants and common stock issuancesstock-related awards under the Stock Plan.
The Compensation Committee of the Board of Directors may, at its sole discretion, accelerate or extend the date or dates on which all or any particularan award or awards granted under the Stock Plan may vest or be exercised.extend, in the case of a stock option, the exercise period up to the expiration date of the option, subject to the terms and conditions of the Stock Plan. Upon termination of service of a participant due to the participant’s death or disability, the vesting of restricted stock units held by the participant accelerates (in case of performance-based vesting, subject to the attainment of the performance requirement).
In the event of a "sale event," defined in the Stock Plan as a "Transaction," all outstanding awards will be assumed or continued by the successor entity, with appropriate adjustment in the awards to reflect the transaction. In such event, except as the Compensation Committee may otherwise specify with respect to particular awards in the award agreements, if the service relationship of the holder of an award is terminated without cause on or within 18 months after the sale event, then all awards held by such holder will become fully vested and exercisable at that time. If there is a sale event in which the successor entity refuses to assume or continue outstanding awards, then subject to the consummation of the sale event, all awards with time-based vesting conditions will become fully vested and exercisable at the effective time of the sale event and all awards with performance-based vesting conditions may become vested and exercisable in accordance with the award agreements at the discretion of the Compensation Committee. If awards are not assumed or continued after a sale event,Committee and then all such awards will terminate at the time of the sale event. In the event of the termination of stock options or stock appreciation rights in connection with a sale event, the Compensation Committee may either make or provide for a cash payment to the holders of such awards equal to the difference between the per share transaction consideration and the exercise price of such awards or permit each holder to have at least a 15-day period to exercise such awards prior to their termination.
The CompanyWe currently issuesissue shares related to exercised stock options or vested awards from itsour existing pool of treasury shares and hashave no specific policy to repurchase treasury shares as stock options are exercised or as awards vest. If the treasury pool is depleted, the Companywe will issue new shares.
Total stock-based compensation expense recognized for the years ended December 31, 2016, 20152019, 2018 and 20142017 is as follows:
|
| | | | | | | | | | | | |
| | | Year Ended December 31, |
| (in thousands, except per share amounts) | | 2019 | | 2018 | | 2017 |
| Cost of sales: | | | | | | |
| Software licenses | | $ | — |
| | $ | — |
| | $ | 969 |
|
| Maintenance and service | | 8,494 |
| | 5,224 |
| | 2,533 |
|
| Operating expenses: | | | | | | |
| Selling, general and administrative | | 60,639 |
| | 47,099 |
| | 30,817 |
|
| Research and development | | 47,057 |
| | 31,023 |
| | 18,835 |
|
| Stock-based compensation expense before taxes | | 116,190 |
| | 83,346 |
| | 53,154 |
|
| Related income tax benefits | | (47,454 | ) | | (34,518 | ) | | (20,503 | ) |
| Stock-based compensation expense, net of taxes | | $ | 68,736 |
| | $ | 48,828 |
| | $ | 32,651 |
|
| Net impact on earnings per share: | | | | | | |
| Basic earnings per share | | $ | (0.82 | ) | | $ | (0.58 | ) | | $ | (0.38 | ) |
| Diluted earnings per share | | $ | (0.80 | ) | | $ | (0.57 | ) | | $ | (0.38 | ) |
|
| | | | | | | | | | | | |
| | | Year Ended December 31, |
| (in thousands, except per share amounts) | | 2016 | | 2015 | | 2014 |
| Cost of sales: | | | | | | |
| Software licenses | | $ | 701 |
| | $ | 745 |
| | $ | 1,776 |
|
| Maintenance and service | | 1,578 |
| | 1,868 |
| | 2,035 |
|
| Operating expenses: | | | | | | |
| Selling, general and administrative | | 15,990 |
| | 17,153 |
| | 17,073 |
|
| Research and development | | 15,078 |
| | 14,185 |
| | 15,977 |
|
| Stock-based compensation expense before taxes | | 33,347 |
| | 33,951 |
| | 36,861 |
|
| Related income tax benefits | | (10,538 | ) | | (11,656 | ) | | (10,927 | ) |
| Stock-based compensation expense, net of taxes | | $ | 22,809 |
| | $ | 22,295 |
| | $ | 25,934 |
|
| Net impact on earnings per share: | | | | | | |
| Basic earnings per share | | $ | (0.26 | ) | | $ | (0.25 | ) | | $ | (0.28 | ) |
| Diluted earnings per share | | $ | (0.26 | ) | | $ | (0.24 | ) | | $ | (0.28 | ) |
Prior to 2017, we granted stock option awards. The value of each stock option award was estimated on the date of grant, or date of acquisition for options issued in a business combination, using the Black-Scholes option pricing model (Black-Scholes model). The determination of the fair value of stock-based payment awards using an option pricing model was affected by our stock price as well as assumptions regarding a number of complex and subjective variables. These variables included our stock volatility during the preceding six years, actual and projected employee stock option exercise behaviors, interest rate assumptions using the five-year U.S. Treasury Note yield on date of grant or acquisition date, and expected dividends. The stock-based compensation expense for options is recorded ratably over the requisite service period.
Forfeitures of awards are accounted for as they occur.
As of December 31, 2019, total unrecognized estimated compensation cost related to unvested stock options granted prior to that date was $1.0 million, which is expected to be recognized over a weighted average period of less than 1.0 year.
Information regarding stock option transactions is summarized below:
| | | | | Year Ended December 31, | | Year Ended December 31, |
| | | 2016 | | 2015 | | 2014 | | 2019 | | 2018 | | 2017 |
| (options in thousands) | | Options | | Weighted- Average Exercise Price | | Options | | Weighted- Average Exercise Price | | Options | | Weighted- Average Exercise Price | | Options | | Weighted- Average Exercise Price | | Options | | Weighted- Average Exercise Price | | Options | | Weighted- Average Exercise Price |
| Outstanding, beginning of year | | 3,986 |
| | $ | 51.07 |
| | 4,932 |
| | $ | 48.76 |
| | 6,166 |
| | $ | 44.77 |
| | 1,484 |
| | $ | 62.80 |
| | 2,170 |
| | $ | 59.17 |
| | 3,136 |
| | $ | 56.37 |
|
| Granted | | 260 |
| | $ | 94.38 |
| | 57 |
| | $ | 88.10 |
| | 150 |
| | $ | 81.09 |
| | — |
| | $ | — |
| | — |
| | $ | — |
| | — |
| | $ | — |
|
| Issued pursuant to acquisitions | | — |
| | $ | — |
| | 8 |
| | $ | 12.26 |
| | 21 |
| | $ | 23.26 |
| |
| Exercised | | (1,082 | ) | | $ | 45.57 |
| | (975 | ) | | $ | 40.52 |
| | (1,266 | ) | | $ | 31.36 |
| | (495 | ) | | $ | 53.53 |
| | (679 | ) | | $ | 50.92 |
| | (956 | ) | | $ | 49.78 |
|
| Forfeited | | (28 | ) | | $ | 72.07 |
| | (36 | ) | | $ | 70.15 |
| | (139 | ) | | $ | 61.11 |
| | (5 | ) | | $ | 64.21 |
| | (7 | ) | | $ | 86.28 |
| | (10 | ) | | $ | 80.92 |
|
| Outstanding, end of year | | 3,136 |
| | $ | 56.37 |
| | 3,986 |
| | $ | 51.07 |
| | 4,932 |
| | $ | 48.76 |
| | 984 |
| | $ | 67.49 |
| | 1,484 |
| | $ | 62.80 |
| | 2,170 |
| | $ | 59.17 |
|
| Vested and Exercisable, end of year | | 2,762 |
| | $ | 51.80 |
| | 3,539 |
| | $ | 48.29 |
| | 3,958 |
| | $ | 44.22 |
| | 924 |
| | $ | 65.71 |
| | 1,347 |
| | $ | 59.69 |
| | 1,930 |
| | $ | 55.11 |
|
| Nonvested | | | 60 |
| | $ | 94.77 |
| | 137 |
| | $ | 93.44 |
| | 240 |
| | $ | 91.71 |
|
|
| | | | | | | | | | | | |
| | | 2016 | | 2015 | | 2014 |
Weighted-Average Remaining Contractual Term (in years) | | | | | | |
| Outstanding | | 4.62 |
| | 4.85 |
| | 5.53 |
|
| Vested and Exercisable | | 4.04 |
| | 4.53 |
| | 5.00 |
|
Aggregate Intrinsic Value (in thousands) | | | | | | |
| Outstanding | | $ | 113,822 |
| | $ | 165,131 |
| | $ | 163,932 |
|
| Vested and Exercisable | | $ | 112,379 |
| | $ | 156,487 |
| | $ | 149,536 |
|
|
| | | | | | | | | | | | |
| | | 2019 | | 2018 | | 2017 |
Weighted Average Remaining Contractual Term (in years) | | | | | | |
| Outstanding | | 3.18 |
| | 3.55 |
| | 4.10 |
|
| Vested and Exercisable | | 2.95 |
| | 3.14 |
| | 3.57 |
|
| Nonvested | | 6.71 |
| | 7.60 |
| | 8.30 |
|
Aggregate Intrinsic Value (in thousands) | | | | | | |
| Exercised | | $ | 72,098 |
| | $ | 78,648 |
| | $ | 58,472 |
|
| Outstanding | | $ | 186,926 |
| | $ | 118,908 |
| | $ | 191,895 |
|
| Vested and Exercisable | | $ | 177,111 |
| | $ | 112,133 |
| | $ | 178,456 |
|
| Nonvested | | $ | 9,815 |
| | $ | 6,775 |
| | $ | 13,439 |
|
Compensation Expense - Stock Options (in thousands) | | $ | 1,709 |
| | $ | 2,006 |
| | $ | 2,948 |
|
Historical and future expected forfeitures have not been significant and, as a result, the outstanding option amounts reflected in the tables above approximate the options expected to vest.
The fair value of each option grant is estimated on the date of grant, or date of acquisition for options issued in a business combination, using the Black-Scholes option pricing model, which was developed for use in estimating the fair value of traded options that have no vesting restrictions and are fully transferable. The Company's options have characteristics significantly different from those of traded options, and changes in input assumptions can materially affect the fair value estimates. The interest rates used were determined by using the five-year Treasury Note yield at the date of grant or date of acquisition for options issued in a business combination. The volatility was determined based on the historic volatility of the Company's stock during the preceding six years for 2016, 2015 and 2014.
The table below presents the weighted average input assumptions used and resulting fair values for options granted or issued in business combinations during each respective year:
|
| | | | | | |
| | | Year Ended December 31, |
| | | 2016 | | 2015 | | 2014 |
| Risk-free interest rate | | 1.19% to 1.93% | | 1.18% to 1.65% | | 1.49% to 1.76% |
| Expected dividend yield | | —% | | —% | | —% |
| Expected volatility | | 24% | | 25% | | 35% |
| Expected term | | 5.7 years | | 5.6 years | | 5.7 years |
| Weighted-average fair value per share | | $23.96 | | $30.83 | | $32.26 |
As stock-based compensation expense recognized in the consolidated statements of income is based on awards ultimately expected to vest, it must be reduced for estimated forfeitures. Forfeitures are estimated at the time of grant and revised, if necessary, in subsequent periods if actual forfeitures differ from those estimates. The effect of pre-vesting forfeitures on the Company's recorded expense has historically been negligible due to the relatively low turnover of stock option holders.
The Company's determination of fair value of share-based payment awards on the date of grant using an option pricing model is affected by the Company's stock price as well as assumptions regarding a number of variables. The total estimated grant-date fair values of stock options that vested during the years ended December 31, 2016, 2015 and 2014 were $7.4 million, $12.3 million and $19.5 million, respectively. As of December 31, 2016, total unrecognized estimated compensation cost related to unvested stock options granted prior to that date was $8.2 million, which is expected to be recognized over a weighted-average period of 2.1 years. The total intrinsic values of stock options exercised during the years ended December 31, 2016, 2015 and 2014 were $49.8 million, $47.1 million and $60.6 million, respectively. As of December 31, 2016, 0.4 million unvested options with an aggregate intrinsic value of $1.4 million are expected to vest and have a weighted-average exercise price of $90.12 and a weighted-average remaining contractual term of 8.9 years. The Company recorded cash received from the exercise of stock options of $49.3 million and tax benefits related to stock activity of $18.6 million for the year ended December 31, 2016.
Information regarding stock options outstanding as of December 31, 20162019 is summarized below:
|
| | | | | | | | | | | | | | | | | | | | | | | | | | | |
| (options in thousands) | | Options Outstanding | | Options Exercisable | | Options Unvested |
| Range of Exercise Prices | | Options | | Weighted-
Average
Remaining
Contractual
Life (years) | | Weighted-
Average
Exercise
Price | | Options | | Weighted- Average Remaining Contractual Life (years) | | Weighted-
Average
Exercise
Price | | Options | | Weighted- Average Remaining Contractual Life (years) | | Weighted- Average Exercise Price |
| $11.99 - $48.97 | | 181 |
| | 1.01 | | $ | 43.29 |
| | 181 |
| | 1.01 | | $ | 43.29 |
| | — |
| | 0.00 | | $ | — |
|
| $58.67 | | 267 |
| | 1.87 | | $ | 58.67 |
| | 267 |
| | 1.87 | | $ | 58.67 |
| | — |
| | 0.00 | | $ | — |
|
| $67.44 | | 280 |
| | 2.87 | | $ | 67.44 |
| | 280 |
| | 2.87 | | $ | 67.44 |
| | — |
| | 0.00 | | $ | — |
|
| $76.31 - $95.09 | | 256 |
| | 6.44 | | $ | 93.89 |
| | 196 |
| | 6.36 | | $ | 93.62 |
| | 60 |
| | 6.71 | | $ | 94.77 |
|
|
| | | | | | | | | | | | | | | | |
| (options in thousands) | | Options Outstanding | | Options Exercisable |
| Range of Exercise Prices | | Options | | Weighted-
Average
Remaining
Contractual
Life (years) | | Weighted-
Average
Exercise
Price | | Options | | Weighted-
Average
Exercise
Price |
| $5.91 - $40.89 | | 874 |
| | 2.35 | | $ | 34.25 |
| | 868 |
| | $ | 34.39 |
|
| $41.33 - $58.67 | | 1,175 |
| | 4.25 | | $ | 54.02 |
| | 1,175 |
| | $ | 54.02 |
|
| $61.68 - $69.70 | | 641 |
| | 5.71 | | $ | 67.38 |
| | 641 |
| | $ | 67.38 |
|
| $73.45 - $95.09 | | 446 |
| | 8.47 | | $ | 90.11 |
| | 78 |
| | $ | 83.78 |
|
Restricted Stock Units
Under the terms of the Fifth Amended and Restated ANSYS, Inc. Long-Term Incentive1996 Stock Option and Grant Plan, the Company issueswe issue various restricted stock unit awards. The following table summarizes the types of awards which may have a market condition, an operating performance condition or a service condition, or any combinationand vesting conditions:
|
| | |
| Award | Vesting Period | Vesting Condition |
| Restricted stock units with a market and service condition | Three years | Our performance measured by total stockholder return relative to the Nasdaq Composite Index for the measurement period and subject to continued employment through the vesting period. |
| Restricted stock units with an operating performance and service condition | Three years | Operating performance metrics as defined at the beginning of the performance cycle. |
| Restricted stock units with a service condition only | Three or four years | Continued employment through the yearly vesting period. |
The fair values of the three. The Company granted 35,000, 34,450 and 47,000 performance-based restricted stock units (RSUs) with a market condition in 2016, 2015 and 2014, respectively. The percentage of the award that vests is based on the Company's performance as measured by total shareholder return relative to the appreciation of a specified stock index over the measurement period, subject to each participant's continued employment with the Company through the conclusion of the measurement period. As of December 31, 2016, 5,973 units of the total 2014 awards granted were earned and will be issued in 2017. The measurement periods for the restricted stock units granted pursuant to the Long-Term Incentive Plan are one-, two- and three-year periods beginning January 1 of the year of the grant. Each restricted stock unit relates to one share of the Company's common stock. The weighted-average fair value of each restricted stock unit granted in 2016, 2015 and 2014 was estimated on the grant date to be $78.71, $81.61 and $65.94, respectively. The fair value of the restricted stock units was estimated using a Monte Carlo simulation model.model and are recognized over the vesting period. The determination of the fair valuevalues of the awards was affected by the grant date and a number ofseveral variables, each of which has been identified in the chart below. Share-based compensation expensebelow:
|
| | | | | |
| | Year Ended December 31, |
| Assumptions used in Monte Carlo lattice pricing model | 2019 | | 2018 | | 2017 |
| Risk-free interest rate | 2.5% | | 2.4% | | 1.5% |
| Expected dividend yield | —% | | —% | | —% |
| Expected volatility—Ansys stock price | 23% | | 21% | | 19% |
| Expected volatility—Nasdaq Composite Index | 16% | | 15% | | 15% |
| Expected term | 2.8 years | | 2.8 years | | 2.8 years |
| Correlation factor | 0.71 | | 0.65 | | 0.70 |
| Weighted average fair value per share | $238.99 | | $191.76 | | $120.94 |
The fair value of RSUs with operating performance metrics is based on the fair market value of our stock on the award is being recorded fromdate of the grant date through the conclusion of the three-year measurement period. Total compensation expense associated with the market condition awards recorded for the years ended December 31, 2016, 2015 and 2014 was $2.2 million, $3.1 million and $2.5 million, respectively.
|
| | | | | |
| | Year Ended December 31, |
| Assumptions used in Monte Carlo lattice pricing model | 2016 | | 2015 | | 2014 |
| Risk-free interest rate | 1.0% | | 1.1% | | 0.7% |
| Expected dividend yield | —% | | —% | | —% |
| Expected volatility—ANSYS stock price | 21% | | 23% | | 25% |
| Expected volatility—NASDAQ Composite Index | 16% | | 14% | | 15% |
| Expected term | 2.8 years | | 2.8 years | | 2.8 years |
| Correlation factor | 0.65 | | 0.60 | | 0.70 |
The Company issued 35,000, 115,485 and 39,900 performance-based restricted stock awards during 2016, 2015 and 2014, respectively. Of the cumulative performance-based restricted stock awards issued, defined operating metrics were assigned to 63,462, 51,795 and 20,667 awards with grant-date fair values of $84.61, $86.38 and $81.52 during 2016, 2015 and 2014, respectively. The grant-date fair value of the awards is being recordedrecognized from the grant date through the conclusion of the measurement period associated with each operating performance metric based on management's estimates concerning the probability of vesting. As
The fair value of December 31, 2016, 7,625 unitsRSUs with only a service condition is based on the fair market value of our stock on the date of the total 2014 awards granted were earnedgrant and will be issued in 2017. is recognized over the vesting period.
Total compensation expense associated with thefor employee RSU awards recorded for the years ended December 31, 2016, 20152019, 2018 and 20142017 was $0.4$109.9 million, $0.4$77.4 million and $0.1$46.3 million, respectively.
In addition, in 2016, 2015Information regarding all employee RSU transactions is summarized below:
|
| | | | | | | | | | | | | | | | | | | | | |
| | | Year Ended December 31, |
| | | 2019 | | 2018 | | 2017 |
| (RSUs in thousands) | | RSUs | | Weighted- Average Grant Date Fair Value | | RSUs | | Weighted- Average Grant Date Fair Value | | RSUs | | Weighted- Average Grant Date Fair Value |
| Nonvested, beginning of year | | 1,522 |
| | $ | 129.96 |
| | 1,361 |
| | $ | 100.66 |
| | 906 |
| | $ | 86.45 |
|
Granted(1) | | 843 |
| | $ | 192.37 |
| | 681 |
| | $ | 163.67 |
| | 866 |
| | $ | 109.67 |
|
Performance adjustment(2) | | 74 |
| | $ | 167.87 |
| | 76 |
| | $ | 151.52 |
| | 35 |
| | $ | 98.29 |
|
| Vested | | (704 | ) | | $ | 125.84 |
| | (524 | ) | | $ | 101.38 |
| | (341 | ) | | $ | 88.58 |
|
| Forfeited | | (117 | ) | | $ | 140.43 |
| | (72 | ) | | $ | 125.29 |
| | (105 | ) | | $ | 90.80 |
|
| Nonvested, end of year | | 1,618 |
| | $ | 165.26 |
| | 1,522 |
| | $ | 129.96 |
| | 1,361 |
| | $ | 100.66 |
|
(1) Includes all RSUs granted during the year. RSUs with operating performance conditions are issued annually and 2014,have one or three performance cycles. Performance conditions are assigned at the Company granted restricted stock unitsbeginning of 488,622, 344,500each performance cycle and 364,150, respectively,are reflected as grants at target at that will vest over a three- or four-year period with weighted-average grant-date fair values of $88.51, $86.34 and $82.13, respectively. During 2016 and 2015, 162,019 and 85,713 shares vested and were released, respectively. As of December 31, 2016, 2015 and 2014, 838,327, 571,462 and 344,750 units were outstanding, respectively. Total compensation expense is being recorded over the service period and was $19.1 million, $12.5 million and $5.8 million for the years ended December 31, 2016, 2015 and 2014, respectively.time.
In conjunction(2) RSUs with a 2015 acquisition, ANSYS issued 68,451 shares of replacement restricted stock with a weighted-average grant-date fair value of $90.48. Of the $6.2 million grant-date fair value, $3.5 million, related to partially vested awards, was recorded as non-cash purchase price consideration. The remaining fair value will be recognized as stock compensation expense through the conclusionmarket or performance condition are granted at target and vest based on achievement of the market or operating performance and service period. Duringconditions. The actual number of RSUs issued may be more or less than the years ended December 31, 2016 and 2015, the Company recorded $1.2 million and $0.6 million, respectively, of stock compensation expense related to these awards.
In conjunction with a 2011 acquisition, the Company granted performance-based restricted stock awards. Vesting was determined basedtarget RSUs depending on the achievements of certain revenue and operating income targetsachievement of the entity post-acquisition. Total compensation expense associated with the awards recorded for the year ended December 31, 2014 was $4.7 million.market or operating performance conditions.
The Company hasBoard of Directors
During and prior to 2015, we granted deferred stock awards to non-affiliate Independentnon-employee Directors, which are rights to receive shares of common stock upon termination of service as a Director. In 2015 and prior, the deferred stock awards were granted quarterly in arrears and vested immediately upon grant. Associated with these awards, the Companywe established a non-qualified 409(a) deferred compensation plan with assets held under a rabbi trust to provide Directors an opportunity to diversify their vested awards. During open trading windows and at their elective option, the Directors may convert their CompanyAnsys shares into a variety of non-Company-stocknon-Ansys-stock investment options in order to diversify a portion of their holdings. As of December 31, 2016, 5,000 shares have been diversified and 184,099 undiversifiedholdings, subject to meeting ownership guidelines.
Information regarding deferred stock awards have vested with the underlying shares remaining unissued until the service termination of the respective Director owners. to non-employee Directors is summarized below:
|
| | | | | | | | |
| | Year Ended December 31, 2019 |
| | Diversified | | Undiversified | | Total |
| Deferred Awards Outstanding, beginning of year | 12,250 |
| | 120,449 |
| | 132,699 |
|
| Shares Diversified | 13,348 |
| | (13,348 | ) | | — |
|
| Shares Issued Upon Retirement | (20,000 | ) | | (47,020 | ) | | (67,020 | ) |
| Deferred Awards Outstanding, end of year | 5,598 |
| | 60,081 |
| | 65,679 |
|
In May 2016, the Company2019, 2018 and 2017, we granted 38,400 deferred stock awards11,259, 13,632 and 18,018 RSUs to non-employee Directors, respectively, which will vest in full onupon the one-year anniversaryearlier of one year from the date of grant or the date of the grant.next regular meeting of stockholders. If a non-employee Director retires prior to the vest date, the non-employee Director receives a pro-rata portion of the RSUs. The weighted-average grant date fair values per RSU were $187.53, $165.71 and $123.38 for the years ended December 31, 2019, 2018 and 2017, respectively. Total compensation expense associated with the awards recorded for the years ended December 31, 2016, 20152019, 2018 and 20142017 was $1.9$2.5 million, $4.0$2.3 million and $3.5$2.6 million, respectively.
Employee Stock Purchase Plan
| |
12. | Stock Repurchase Program |
Under the Company's stock repurchase program, the Company repurchased shares as follows:
|
| | | | | | | | | | | |
| | Year Ended December 31, |
| (in thousands, except per share data) | 2016 | | 2015 | | 2014 |
| Number of shares repurchased | 3,700 |
| | 3,833 |
| | 2,977 |
|
| Average price paid per share | $ | 90.90 |
| | $ | 88.16 |
| | $ | 78.54 |
|
| Total cost | $ | 336,335 |
| | $ | 337,910 |
| | $ | 233,793 |
|
In February 2017, the Company's Board of Directors increased the number of shares authorized for repurchase to a total of 5.0 million shares under the stock repurchase program. As of December 31, 2016, 1.3 million shares remained available for repurchase under the program.
| |
13. | Employee Stock Purchase Plan |
The Company'sOur 1996 Employee Stock Purchase Plan (the “Purchase Plan”) was adopted by the Board of Directors on April 19, 1996 and was subsequently approved by the Company'sour stockholders. The stockholders approved an amendment to the Purchase Plan in May 2016 to increase the number of shares available for offerings to 1.8 million shares. The Purchase Plan is administered by the Compensation Committee. Offerings under the Purchase Plan commence on each February 1 and August 1, and have a duration of six months. An employee who owns or is deemed to own shares of stock representing in excess of 5% of the combined voting power of all classes of our stock of the Company may not participate in the Purchase Plan.
During each offering, an eligible employee may purchase shares under the Purchase Plan by authorizing payroll deductions of up to 10% of his or her cash compensation during the offering period. The maximum number of shares that may be purchased by any participating employee during any offering period is limited to 3,840 shares (as adjusted by the Compensation Committee from time to time). Unless the employee has previously withdrawn from the offering, his or her accumulated payroll deductions will be used to purchase common stock on the last business day of the period at a price equal to 90% of the fair market value of the common stock on the first or last day of the offering period, whichever is lower. Under applicable tax rules, an employee may not accrue the right to purchase more than $25,000 of common stock, based on the grant-date fair value, in any calendar year.year in which the option is outstanding at any time. As of December 31, 2016, 1.42019, 1.6 million shares of common stock had been issued under the Purchase Plan. The total compensation expense recorded under the Purchase Plan during the years ended December 31, 2016, 20152019, 2018 and 20142017 was $1.2$2.0 million,, $1.0 million and $0.9 million, respectively.
Office Space
The Company's executive offices and those related to certain domestic product development, marketing, production and administration are located in a 186,000 square foot office facility in Canonsburg, Pennsylvania. The lease was effective as of September 14, 2012, but because the leased premises were under construction, the Company was not obligated to pay rent until three months following the date that the leased premises were delivered to ANSYS, which occurred on October 1, 2014. The term of the lease is 183 months, beginning on October 1, 2014. Absent the exercise of options in the lease for additional rentable space or early lease termination, the Company's base rent (inclusive of property taxes and certain operating expenses) will be $4.3 million per annum for the first five years of the lease term, $4.5 million per annum for years six through ten and $4.7 million per annum for years eleven through fifteen. The Company incurred $4.4 million, $4.4 $1.8 million and $0.8$1.2 million, in lease expense related to this facility during the years ended December 31, 2016, 2015 and 2014, respectively.
The Company's corporate headquarters was previously located in a separate office facility, also in Canonsburg, Pennsylvania. The Company occupied this space until November 2014, and the lease term expired on December 31, 2014. Lease expense related to this facility was $1.4 million during the year ended December 31, 2014.
The Company has entered into various other noncancellable operating leases for office space.
Office space lease expense totaled $16.9 million, $16.5 million and $15.8 million for the years ended December 31, 2016, 2015 and 2014, respectively. Future minimum lease payments, including termination fees, under noncancellable operating leases for office space in effect at December 31, 2016 are as follows:
|
| | | |
| (in thousands) | |
| 2017 | $ | 12,516 |
|
| 2018 | 9,901 |
|
| 2019 | 9,178 |
|
| 2020 | 6,961 |
|
| 2021 | 6,132 |
|
| Thereafter | 21,204 |
|
| Total | $ | 65,892 |
|
| |
| 15. | Stock Repurchase Program |
Under our stock repurchase program, we repurchased shares as follows:
|
| | | | | | | | | | | |
| | Year Ended December 31, |
| (in thousands, except per share data) | 2019 | | 2018 | | 2017 |
| Number of shares repurchased | 330 |
| | 1,674 |
| | 2,750 |
|
| Average price paid per share | $ | 179.41 |
| | $ | 161.12 |
| | $ | 122.20 |
|
| Total cost | $ | 59,116 |
| | $ | 269,801 |
| | $ | 336,042 |
|
In February 2018, our Board of Directors increased the number of shares authorized for repurchase to a total of 5.0 million shares under the stock repurchase program. As of December 31, 2019, 3.5 million shares remained available for repurchase under the program.
The Company hasWe have entered into various renewable nonexclusive license agreements under which the Company haswe have been granted access to the licensor's technology and the right to sell the technology in the Company'sour product line. Royalties are payable to developers of the software at various rates and amounts, which generally are based upon unit sales, revenue or flat fees. Royalty fees are reported in cost of goods soldsoftware licenses and were $13.122.4 million, $11.816.9 million and $11.516.0 million for the years ended December 31, 20162019, 20152018 and 20142017, respectively.
| |
16.17. | Geographic Information |
Revenue to external customers is attributed to individual countries based upon the location of the customer. Revenue by geographic area iswas as follows:
|
| | | | | | | | | | | |
| | Year Ended December 31, |
| (in thousands) | 2019
(ASC 606) | | 2018
(ASC 606) | | 2017
(ASC 605) |
| United States | $ | 637,916 |
| | $ | 506,335 |
| | $ | 417,343 |
|
| Japan | 162,154 |
| | 145,951 |
| | 126,097 |
|
| Germany | 158,809 |
| | 140,506 |
| | 108,211 |
|
| South Korea | 90,082 |
| | 72,724 |
| | 63,011 |
|
| France | 68,551 |
| | 67,657 |
| | 53,672 |
|
| China | 64,725 |
| | 57,567 |
| | 54,415 |
|
| Other EMEA | 211,193 |
| | 193,317 |
| | 166,472 |
|
| Other international | 122,462 |
| | 109,579 |
| | 106,029 |
|
| Total revenue | $ | 1,515,892 |
| | $ | 1,293,636 |
| | $ | 1,095,250 |
|
|
| | | | | | | | | | | |
| | Year Ended December 31, |
| (in thousands) | 2016 | | 2015 | | 2014 |
| United States | $ | 367,937 |
| | $ | 354,433 |
| | $ | 320,327 |
|
| Japan | 120,160 |
| | 104,299 |
| | 108,757 |
|
| Germany | 99,814 |
| | 94,546 |
| | 99,714 |
|
| South Korea | 56,790 |
| | 55,142 |
| | 55,606 |
|
| France | 49,294 |
| | 49,444 |
| | 58,785 |
|
| Canada | 13,284 |
| | 13,314 |
| | 14,034 |
|
| Other European | 139,813 |
| | 145,985 |
| | 159,011 |
|
| Other international | 141,373 |
| | 125,590 |
| | 119,787 |
|
| Total revenue | $ | 988,465 |
| | $ | 942,753 |
| | $ | 936,021 |
|
Property and equipment by geographic area iswas as follows:
|
| | | | | | | |
| | December 31, |
| (in thousands) | 2019 | | 2018 |
| United States | $ | 59,473 |
| | $ | 46,605 |
|
| India | 5,660 |
| | 4,176 |
|
| Germany | 4,237 |
| | 2,158 |
|
| United Kingdom | 4,194 |
| | 1,238 |
|
| Other EMEA | 5,532 |
| | 3,724 |
|
| Other international | 4,540 |
| | 3,754 |
|
| Total property and equipment, net | $ | 83,636 |
| | $ | 61,655 |
|
|
| | | | | | | |
| | December 31, |
| (in thousands) | 2016 | | 2015 |
| United States | $ | 43,810 |
| | $ | 47,971 |
|
| Europe | 4,753 |
| | 6,808 |
|
| India | 3,033 |
| | 3,286 |
|
| Other international | 3,081 |
| | 3,859 |
|
| Total property and equipment, net | $ | 54,677 |
| | $ | 61,924 |
|
| |
17.18. | Unconditional Purchase Obligations |
The Company hasWe have entered into various unconditional purchase obligations which primarily include royalties and software licenses and long-term purchase contracts for network, communication and office maintenance services. The CompanyWe expended $7.2$24.2 million, $5.3$22.4 million and $2.9$14.1 million related to unconditional purchase obligations that existed as of the beginning of each year for the years ended December 31, 2016, 20152019, 2018 and 2014,2017, respectively. Future expenditures under unconditional purchase obligations in effect as of December 31, 20162019 are as follows: |
| | | |
| (in thousands) | |
| 2020 | $ | 37,183 |
|
| 2021 | 14,034 |
|
| 2022 | 10,689 |
|
| 2023 | 6,212 |
|
| 2024 | 3,264 |
|
| Total | $ | 71,382 |
|
|
| | | |
| (in thousands) | |
| 2017 | $ | 14,134 |
|
| 2018 | 10,288 |
|
| 2019 | 9,724 |
|
| 2020 | 2,617 |
|
| 2021 | 652 |
|
| Total | $ | 37,415 |
|
During the fourth quarter of 2016, the Companywe initiated workforce realignment activities. The Companyactivities to reallocate resources to align with our future strategic plans. We completed the workforce realignment activities as of September 30, 2017. We incurred $3.4 million inrelated restructuring charges or $2.4 million net of tax, during the year ended December 31, 2016. as follows:
|
| | | | | | | |
| (in thousands) | Gross | | Net of Tax |
| Q4 2016 | $ | 3,419 |
| | $ | 2,355 |
|
| Q1 2017 | 9,273 |
| | 6,176 |
|
| Q2 2017 | 2,000 |
| | 1,435 |
|
| Q3 2017 | 466 |
| | 331 |
|
| Total restructuring charges | $ | 15,158 |
| | $ | 10,297 |
|
The Company expects to incur additionalrestructuring charges of $10 million - $15 million, or $7 million - $10 million net of tax, primarily during the first quarter of 2017.
| |
19. | Employment-Related Settlement |
On February 15, 2017, the Company entered into an employment-related settlement agreement. In connection with the settlement agreement, the Company will make a lump-sum payment of $4.7 million. The charges related to this agreement are included in the presentation of cost of software licenses; cost of maintenance and service; research and development expense; and selling, general and administrative expense in the 2016 consolidated statementexpense. The gross charges were fully paid as of income. As part of the settlement agreement, all the claims initiated against the Company will be withdrawn and a general release of all claims in favor of the Company and all of its related entities was executed.March 31, 2018.
| |
| 20. | Contingencies and Commitments |
The Company isWe are subject to various investigations, claims and legal proceedings that arise in the ordinary course of business, including commercial disputes, labor and employment matters, tax audits, alleged infringement of intellectual property rights and other matters. In theour opinion, of the Company, the resolution of pending matters is not expected to have a material adverse effect on the Company'sour consolidated results of operations, cash flows or financial position. However, each of these matters is subject to various uncertainties and it is possible that an unfavorable resolution of one or more of these proceedings could materially affect the Company'sour results of operations, cash flows or financial position.
AnOur Indian subsidiary of the Company has several service tax audits pending that have resulted in formal inquiries being received on transactions through mid-2012. The CompanyWe could incur tax charges and related liabilities including those related to the service tax audit case, of approximately $7$7.2 million. The service tax issues raised in the Company’sour notices and inquiries are very similar to the case, M/s Microsoft Corporation (I) (P) Ltd. VsVs. Commissioner of Service Tax, New Delhi, wherein the Delhi Customs, Excise and Service Tax Appellate Tribunal (CESTAT) has passed a favorable ruling to Microsoft. The CompanyMicrosoft case ruling was subsequently challenged in the Supreme Court by the Indian tax authority. We can provide no assurances on whether the Microsoft case’s favorable ruling will be challenged in higher courts or on the impact that the present Microsoft case’s decision will have on the Company’sour cases. The Company isWe are uncertain as to when these service tax matters will be concluded.
A French subsidiary of the Company received notice that the French taxing authority rejected the Company's 2012 research and development credit. The Company has contested the decision. However, if the Company does not receive a favorable outcome, it could incur charges of approximately $0.8 million. In addition, an unfavorable outcome could result in the authorities reviewing or rejecting $3.8 million of similar research and development credits for 2013 through the current year that are currently reflected as an asset. The Company can provide no assurances on the timing or outcome of this matter.
The Company sellsWe sell software licenses and services to itsour customers under proprietary software licensecontractual agreements. Each license agreement contains the relevant terms of the contractual arrangement with the customer, andSuch agreements generally includesinclude certain provisions for indemnifying the customer against losses, expenses and liabilitiesclaims of intellectual property infringement by third parties arising from damages that are incurred bysuch customer’s usage of our products or awarded against the customer in the event the Company's software or services are found to infringe upon a patent, copyright or other proprietary right of a third party.services. To date, the Company has not had to reimburse any of its customers for any lossespayments related to these indemnification provisions and no material claims asserted under these indemnification provisions are outstanding as of December 31, 2016.have been immaterial. For several reasons, including the lack of prior material indemnification claims, the Companywe cannot determine the maximum amount of potential future payments, if any, related to such indemnification provisions.
SIGNATURES
Pursuant to the requirements of Section 13 or 15(d) of the Securities Exchange Act of 1934, the Registrant has duly caused this report to be signed on its behalf by the undersigned, thereunto duly authorized.
|
| | | | | |
| | | ANSYS, Inc. |
| | | |
Date: | February 23, 2017 | | By: | | /s/ AJEI S. GOPAL
|
| | | | | |
| | | | | Ajei S. Gopal |
| | | | | President and Chief Executive Officer |
| | | |
Date: | February 23, 2017 | | By: | | /s/ MARIA T. SHIELDS
|
| | | | | |
| | | | | Maria T. Shields |
| | | | | Chief Financial Officer |
POWER OF ATTORNEY
KNOW ALL PERSONS BY THESE PRESENTS, that each person whose signature appears below constitutes and appoints Ajei S. Gopal, his or her attorney-in-fact, with the power of substitution, for such person in any and all capacities, to sign any amendments to this Report on Form 10-K, and to file the same, with exhibits thereto and other documents in connection therewith, with the Securities and Exchange Commission, hereby ratifying and confirming all that said attorney-in-fact, or substitute or substitutes, may do or cause to be done by virtue hereof.
Pursuant to the requirements of the Securities Exchange Act of 1934, this Annual Report has been signed below by the following persons on behalf of the Registrant and in the capacities and on the dates indicated below.
|
| | |
Signature | Title | Date |
| | |
/s/ AJEI S. GOPAL
| President and Chief Executive Officer
(Principal Executive Officer)
| February 23, 2017 |
Ajei S. Gopal | |
| | |
/s/ MARIA T. SHIELDS
| Chief Financial Officer
(Principal Financial Officer and Accounting Officer)
| February 23, 2017 |
Maria T. Shields | |
| | |
/s/ JAMES E. CASHMAN III
| Non-Executive Chairman of the Board of Directors | February 23, 2017 |
James E. Cashman III | | |
| | |
/s/ GUY DUBOIS
| Director | February 23, 2017 |
Guy Dubois | | |
| | |
/s/ RONALD W. HOVSEPIAN
| Lead Independent Director | February 23, 2017 |
Ronald W. Hovsepian | | |
| | |
/s/ WILLIAM R. MCDERMOTT
| Director | February 23, 2017 |
William R. McDermott | | |
| | |
/s/ BRADFORD C. MORLEY
| Director | February 23, 2017 |
Bradford C. Morley | | |
| | |
/s/ BARBARA V. SCHERER
| Director | February 23, 2017 |
Barbara V. Scherer | | |
| | |
/s/ MICHAEL C. THURK
| Director | February 23, 2017 |
Michael C. Thurk | | |
| | |
/s/ PATRICK J. ZILVITIS
| Director | February 23, 2017 |
Patrick J. Zilvitis | | |
SCHEDULE II
ANSYS, INC. AND SUBSIDIARIES
Valuation and Qualifying Accounts
|
| | | | | | | | | | | | | | | | |
(in thousands) Description | | Balance at Beginning of Year | | Additions: Charges to Costs and Expenses | | Deductions: Returns and Write-Offs | | Balance at End of Year |
Year ended December 31, 2019
Allowance for doubtful accounts | | $ | 8,000 |
| | $ | 2,928 |
| | $ | 2,228 |
| | $ | 8,700 |
|
Year ended December 31, 2018
Allowance for doubtful accounts | | $ | 6,800 |
| | $ | 1,577 |
| | $ | 377 |
| | $ | 8,000 |
|
Year ended December 31, 2017
Allowance for doubtful accounts | | $ | 5,700 |
| | $ | 1,474 |
| | $ | 374 |
| | $ | 6,800 |
|
|
| | | | | | | | | | | | | | | | |
(in thousands) Description | | Balance at Beginning of Year | | Additions: Charges to Costs and Expenses | | Deductions: Returns and Write-Offs | | Balance at End of Year |
Year ended December 31, 2016
Allowance for doubtful accounts | | $ | 5,200 |
| | $ | 2,009 |
| | $ | 1,509 |
| | $ | 5,700 |
|
Year ended December 31, 2015
Allowance for doubtful accounts | | $ | 5,500 |
| | $ | 1,304 |
| | $ | 1,604 |
| | $ | 5,200 |
|
Year ended December 31, 2014
Allowance for doubtful accounts | | $ | 5,700 |
| | $ | 2,104 |
| | $ | 2,304 |
| | $ | 5,500 |
|
|
| | |
| Exhibit No. | | Exhibit |
| 3.1 | | |
| | |
| 3.2 | | Certificate of Amendment to the Company's Restated Certificate of Incorporation as filed with the Secretary of State of the State of Delaware (filed as Exhibit 3.1 to the Company's Current Report on Form 8-K, filed June 21, 2006, and incorporated herein by reference). |
| |
3.3 | | Certificate of Amendment to the Company's Restated Certificate of Incorporation as filed with the Secretary of State of the State of Delaware (filed as Exhibit 3.1 to the Company's Current Report on Form 8-K, filed May 17, 2011, and incorporated herein by reference). |
| | |
3.4 | | Certificate of Amendment to the Company's Restated Certificate of Incorporation as filed with the Secretary of State of the State of Delaware (filed as Exhibit 3.1 to the Company's Current Report on Form 8-K, filed May 21, 2012, and incorporated herein by reference). |
| |
3.5 | | Second |
| | | |
3.64.1 | | Amendment No. 1 to the Second Amended |
| | |
| 10.1 | | |
| |
3.7 | | Amendment No. 2 to the Second Amended and Restated By-laws of the Company (filed as Exhibit 3.1 to the Company's Current Report on Form 8-K, filed December 20, 2011, and incorporated herein by reference). |
| | |
3.8 | | Amendment No. 3 to the Second Amended and Restated By-laws of ANSYS, Inc. (filed as Exhibit 3.1 to the Company's Current Report on Form 8-K filed August 7, 2015, and incorporated herein by reference). |
| | |
3.9 | | Amendment No. 4 to the Second Amended and Restated By-laws of ANSYS, Inc. attached hereto as Exhibit 3.9. |
| |
10.1 | | ANSYS, Inc. Second Amended and Restated Employee Stock Purchase Plan (filed as Exhibit 10.1 to the Quarterly Report on Form 10-Q for the fiscal quarter ended September 30, 2007 and incorporated herein by reference).* |
| | | |
| 10.2 | | The Company's Pension |
| | |
| 10.3 | | Form of Director Indemnification Agreement (filed |
| | |
| 10.4 | | Employment Agreement between the Registrant and James E. Cashman III dated as of April 21, 2003 (filed as Exhibit 10.1 to the Company's Quarterly Report on Form 10-Q for the quarter ended March 31, 2003 and incorporated herein by reference).* |
| |
10.5 | | Description of Executive Bonus Plan, Director Stock Option Program and Officer Stock Option Program, including Forms of Option Agreements for Option Grants to Directors and Officers (filed as Exhibits 99.1 – 99.5 to the Company's Current Report on Form 8-K, filed February 8, 2005, and incorporated herein by reference).* |
| |
10.6 | | Options Granted to Independent Directors Related to the 2005 Annual Meeting of Stockholders on May 10, 2005 (filed as a disclosure in the Company's Current Report on Form 8-K, filed May 13, 2005, and incorporated herein by reference).* |
| |
10.7 | | Amendment to Non-Affiliate Independent Director Compensation on February 9, 2006 (filed as a disclosure in the Company's Current Report on Form 8-K, filed February 15, 2006, and incorporated herein by reference).* |
| |
10.8 | | Form of Deferred Stock Unit Agreement under the Third |
| | | |
10.910.5 | | |
| |
10.10 | | Amended and Restated ANSYS, Inc. Cash Bonus Plan (filed as Exhibit 10.5 to the Company's Quarterly Report on Form 10-Q for the quarter ended September 30, 2008 and incorporated herein by reference).* |
| |
10.11 | | First Amendment of the Employment Agreement Between the Company and James E. Cashman III as of November 6, 2008 (filed as Exhibit 10.6 to the Company's Quarterly Report on Form 10-Q for the quarter ended September 30, 2008 and incorporated herein by reference).* |
| | |
|
| | |
10.12 | | ANSYS, Inc. Executive Severance Plan, dated February 17, 2010 (filed as Exhibit 10.2 to the Company's Current Report on Form 8-K,Plan; filed February 23, 2010, and incorporated herein by reference).herewith.* |
| |
10.13 | | Form of Award Notice under the ANSYS, Inc. Long-Term Incentive Plan (filed as Exhibit 10.3 to the Company's Quarterly Report on Form 10-Q for the quarter ended March 31, 2010 and incorporated herein by reference).* |
| | | |
10.1410.6 | | Second Amendment of the Employment Agreement Between ANSYS, Inc. and James E. Cashman III dated March 14, 2011 (filed as Exhibit 10.1 to the Company's Current Report on Form 8-K, filed March 18, 2011, and incorporated herein by reference).* |
| |
10.15 | | Form of Employee Incentive Stock Option Agreement under the Fourth Amended and Restated ANSYS, Inc. Stock Option and Grant Plan (filed as Exhibit 10.5 to the Company's Current Report on Form 8-K, filed March 18, 2011, and incorporated herein by reference).* |
| |
10.16 | | |
| | | |
10.1710.7 | | Form of Employee Director Non-Qualified Stock Option Agreement under the Fourth Amended and Restated ANSYS, Inc. 1996 Stock Option and Grant Plan (filed as Exhibit 10.2 to the Company's Quarterly Report on Form 10-Q, filed May 2, 2013, and incorporated herein by reference).* |
| | |
10.18 | | Form of Non-Employee Director Non-Qualified Stock Option Agreement under the Fourth Amended and Restated ANSYS, Inc. 1996 Stock Option and Grant Plan (filed as Exhibit 10.3 to the Company's Quarterly Report on Form 10-Q, filed May 2, 2013, and incorporated herein by reference).* |
| | |
10.19 | | Form of Non-Qualified Option Transfer Acknowledgment under the Fourth Amended and Restated ANSYS, Inc. 1996 Stock Option and Grant Plan (filed as Exhibit 10.4 to the Company's Quarterly Report on Form 10-Q, filed May 2, 2013, and incorporated herein by reference).* |
| | |
10.20 | | Form of Indemnification Agreement between ANSYS, Inc. and Non-Employee Directors (filed as Exhibit 10.1 to the Company's Current Report on Form 8-K, filed March 20, 2013, and incorporated herein by reference). |
| |
10.21 | | First Amendment to Letter Agreement between ANSYS, Inc. and Maria T. Shields, dated March 14, 2011 (filed as Exhibit 10.2 to the Company's Current Report on Form 8-K, filed March 18, 2011, and incorporated herein by reference).* |
| |
10.22 | | Consent of the Compensation Committee of the ANSYS, Inc. Board of Directors dated March 14, 2011 (filed as Exhibit 10.3 to the Company's Current Report on Form 8-K, filed March 18, 2011, and incorporated herein by reference).* |
| |
10.23 | | Fourth Amended and Restated ANSYS, Inc. 1996 Stock Option and Grant Plan (filed as Exhibit 10.1 to the Company's Current Report on Form 8-K, filed May 17, 2011, and incorporated herein by reference).* |
| | |
10.24 | | Lease by and between ANSYS, Inc. and Quattro Investment Group, L.P., dated as of September 14, 2012 (filed as Exhibit 10.1 to the Company's Current Report on Form 8-K, filed September 18, 2012, and incorporated herein by reference). |
| | |
10.25 | | |
| | | |
10.2610.8 | | ANSYS, Inc. Second Amended and Restated Long-Term Incentive Plan, dated March 5, 2014 (filed as Exhibit 10.1 to the Company's Current Report on Form 8-K, filed March 11, 2014, and incorporated herein by reference).* |
| | |
10.27 | | Form of Performance-Based Restricted Stock Unit (Total Shareholder Return) Award under the ANSYS, Inc. Second Amended and Restated Long-Term Incentive Plan (filed as Exhibit 10.2 to the Company's Current Report on Form 8-K, filed March 11, 2014, and incorporated herein by reference).* |
| | |
10.28 | | Form of Performance-Based Restricted Stock Unit Award under the ANSYS, Inc. Fourth Amended and Restated 1996 Stock Option and Grant Plan (filed as Exhibit 10.3 to the Company's Current Report on Form 8-K, filed March 11, 2014, and incorporated herein by reference).* |
| | |
10.29 | | Employment Agreement between ANSYS, Inc. and Ajei S. Gopal, dated August 29, 2016 (filed as Exhibit 10.1 to the Company's Current Report on Form 8-K filed August 29, 2016, and incorporated herein by reference).* |
| | |
10.30 | | Form of Restricted Stock Unit Agreement with Ajei S. Gopal (filed as Exhibit 10.2 to the Company's Current Report on Form 8-K filed August 29, 2016, and incorporated herein by reference).* |
| | |
|
| | |
10.31 | | Form of Non-Qualified Stock Option Agreement with Ajei S. Gopal (filed as Exhibit 10.3 to the Company's Current Report on Form 8-K filed August 29, 2016, and incorporated herein by reference).* |
| | |
10.32 | | Transition Agreement between ANSYS, Inc. and James E. Cashman III, effective as of December 31, 2016 (filed as Exhibit 10.1 to the Company's Current Report on Form 8-K filed December 23, 2016, and incorporated herein by reference).* |
| | |
10.33 | | ANSYS, Inc. Third Amended and Restated Employee Stock Purchase Plan (filed as Appendix 2 to the registrant’s Definitive Proxy Statement on Schedule 14A filed with the SEC on March 31, 2016 and incorporated herein by reference).* |
| | |
10.34 | | Fifth Amended and Restated ANSYS, Inc. 1996 Stock Option and Grant Plan (filed as Appendix 1 to the registrant’s Definitive Proxy Statement on Schedule 14A filed with the SEC on March 31, 2016 and incorporated herein by reference).* |
| | | |
10.3510.9 | | |
| | |
| 10.10 | | |
| | | |
10.3610.11 | | |
| | | |
10.3710.12 | | |
| | | |
10.3810.13 | | |
| | | |
14.110.14 | | |
| | |
| 10.15 | | |
| | |
| 10.16 | | |
| | |
| 10.17 | | |
| | |
| 10.18 | | |
| | |
| 10.19 | | |
| | |
| 10.20 | | |
| | |
|
| | |
| 10.21 | | |
| | |
| 10.22 | | |
| | |
| 10.23 | | |
| | | |
| 21.1 | | |
| | |
| 23.1 | | |
| | |
| 24.1 | | |
| | |
| 31.1 | | |
| | |
| 31.2 | | |
| | |
| 32.1 | | |
| | |
| 32.2 | | |
| | |
| 101.INS | | Inline XBRL Instance Document (the instance document does not appear in the Interactive Data File because its XBRL tags are embedded within the Inline XBRL document) |
| | |
| 101.SCH | | Inline XBRL Taxonomy Extension Schema |
| | |
| 101.CAL | | Inline XBRL Taxonomy Extension Calculation Linkbase |
| | |
| 101.DEF | | Inline XBRL Taxonomy Extension Definition Linkbase |
| | |
| 101.LAB | | Inline XBRL Taxonomy Extension Label Linkbase |
| | |
| 101.PRE | | Inline XBRL Taxonomy Extension Presentation Linkbase |
| | |
| 104 | | Cover Page Interactive Data File (formatted as Inline XBRL and contained in Exhibit 101) |
|
| |
| * | Indicates management contract or compensatory plan, contract or arrangement. |
| |
| |
| ITEM 16. | FORM 10-K SUMMARY |
None.
SIGNATURES
90Pursuant to the requirements of Section 13 or 15(d) of the Securities Exchange Act of 1934, the Registrant has duly caused this report to be signed on its behalf by the undersigned, thereunto duly authorized.
|
| | | | | |
| | | ANSYS, Inc. |
| | | |
| Date: | February 27, 2020 | | By: | | /s/ AJEI S. GOPAL |
| | | | | |
| | | | | Ajei S. Gopal |
| | | | | President and Chief Executive Officer |
| | | | | (Principal Executive Officer) |
| | | | | |
| Date: | February 27, 2020 | | By: | | /s/ MARIA T. SHIELDS |
| | | | | |
| | | | | Maria T. Shields |
| | | | | Chief Financial Officer |
| | | | | (Principal Financial Officer and Principal Accounting Officer) |
POWER OF ATTORNEY
KNOW ALL PERSONS BY THESE PRESENTS, that each person whose signature appears below constitutes and appoints Ajei S. Gopal, his or her attorney-in-fact, with the power of substitution, for such person in any and all capacities, to sign any amendments to this Report on Form 10-K, and to file the same, with exhibits thereto and other documents in connection therewith, with the Securities and Exchange Commission, hereby ratifying and confirming all that said attorney-in-fact, or substitute or substitutes, may do or cause to be done by virtue hereof.
Pursuant to the requirements of the Securities Exchange Act of 1934, this Annual Report has been signed below by the following persons on behalf of the Registrant and in the capacities and on the dates indicated below.
|
| | |
| Signature | Title | Date |
| | |
/s/ AJEI S. GOPAL | President and Chief Executive Officer (Principal Executive Officer) | February 27, 2020 |
| Ajei S. Gopal | |
| | |
/s/ MARIA T. SHIELDS | Chief Financial Officer (Principal Financial Officer and Principal Accounting Officer) | February 27, 2020 |
| Maria T. Shields | |
| | |
/s/ NICOLE ANASENES | Director | February 27, 2020 |
| Nicole Anasenes | | |
| | |
/s/ GLENDA M. DORCHAK | Director | February 27, 2020 |
| Glenda M. Dorchak | | |
| | |
/s/ GUY E. DUBOIS | Director | February 27, 2020 |
| Guy E. Dubois | | |
| | |
/s/ DR. ALEC D. GALLIMORE | Director | February 27, 2020 |
| Dr. Alec D. Gallimore | | |
| | |
/s/ RONALD W. HOVSEPIAN | Chairman of the Board of Directors | February 27, 2020 |
| Ronald W. Hovsepian | | |
| | |
/s/ BARBARA V. SCHERER | Director | February 27, 2020 |
| Barbara V. Scherer | | |