| Massachusetts | 04-3308902 | |||||||
| (State or other jurisdiction of incorporation of organization) | (IRS Employer Identification No.) | |||||||
| 222 Merrimack Street, | Lowell, | Massachusetts | 01852 | |||||||||||||||||
| (Address of principal executive offices) | (Zip code) | |||||||||||||||||||
(978) 459-9000
Securities registered pursuant to Section 12(b) of the Exchange Act:
| Title of each class | Trading Symbol(s) | Name of each exchange on which registered | ||||||||||||
| Common Stock, $0.01 par value per share | EBTC | NASDAQ | ||||||||||||
Securities registered pursuant to Section 12(g) of the Exchange Act:
NONE
Indicate by check mark if the registrant is a well-known seasoned issuer, as defined in Rule 405 of the Securities Act. o Yes ý No
Indicate by check mark if the registrant is not required to file pursuant to Section 13 or Section 15(d) of the Act. o Yes ý No
Indicate by check mark whether the registrant (1) has filed all reports required to be filed by Section 13 or 15(d) of the Securities Exchange Act of 1934 during the preceding 12 months (or for such shorter period that the registrant was required to file such reports), and (2) has been subject to such filing requirements for the past 90 days. ý Yes o No
Indicate by check mark whether the registrant has submitted electronically and posted on its corporate Website, if any, every Interactive Data File required to be submitted and posted pursuant to Rule 405 of Regulation S-T (§232.405 of this chapter) during the preceding 12 months (or for such shorter period that the registrant was required to submit and post such files).
ý Yes o No
Indicate by check mark whether the registrant is a large accelerated filer, an accelerated filer, a non-accelerated filer, a smaller reporting company or an emerging growth company. See definition of “large accelerated filer,” “accelerated filer,” “smaller reporting company,” and "emerging growth company" in Rule 12b-2 of the Exchange Act (Check one):
Non-accelerated filer☐Smaller reporting company☐Emerging growth company☐
If an emerging growth company, indicate by check mark if the registrant has elected not to use the extended transition period for complying with any new or revised financial accounting standards provided pursuant to Section 13(a) of the Exchange Act. o☐
Indicate by check mark whether the registrant has filed a report on and attestation to its management's assessment of the effectiveness of its internal control over financial reporting under Section 404(b) of the Sarbanes-Oxley Act (15 U.S.C. 7262(b)) by the registered public accounting firm that prepared or issued its audit report. ☒
If the securities are registered pursuant to Section 12(b) of the Act, indicate by check mark whether the financial statements of the registrant included in the filing reflect the correction of an error to previously issued financial statements. ☐
Indicate by check mark whether any of those error corrections are restatements that required a recover analysis of incentive-based compensation received by any of the registrant’s executive officers during the relevant recover period pursuant to §240.10D-1(b). ☐
Indicate by check mark whether the registrant is a shell company (as defined in Rule 12b-2 of the Exchange Act) o☐ Yes ý No
State the aggregate market value of the voting and non-voting common equity held by non-affiliates computed by reference to the price at which the common equity was last sold, or the average bid price and asked price of such common equity, as of the last business day of the registrant’s most recently completed second fiscal quarter: $345,319,719$296,960,546 ($35.5428.94 per share) as of June 30, 20172023, the last trading day of the registrant’s most recently completed second quarter.
Indicate the number of shares outstanding of each of the registrant’sregistrant's classes of common stock, as of the latest practicable date:
DOCUMENTS INCORPORATED BY REFERENCE
Portions of the registrant’s definitive proxy statement for its annual meeting of stockholdersshareholders to be held on May 1, 20187, 2024, are incorporated by reference in Part III of this Form 10-K.
ENTERPRISE BANCORP, INC.
TABLE OF CONTENTS
| Page Number | ||||||||||||
2
ACRONYMS AND ABBREVIATIONS
The acronyms and abbreviations defined in the table below are provided to aid the reader when reviewing this Form 10-K:
| Acronym | Description | |||||||
| ACH: | Automatic clearing house | |||||||
| ACL: | Allowance for credit losses | |||||||
| AOCI: | Accumulated other comprehensive income | |||||||
| ASC: | Accounting Standards Codification | |||||||
| ASU: | Accounting Standards Update | |||||||
| BTFP: | Bank Term Funding Program | |||||||
| BOLI: | Bank-owned life insurance | |||||||
| CBLR | Community Bank Leverage Ratio | |||||||
| CD: | Certificate of deposit | |||||||
| CDE: | Community Development Entities | |||||||
| CECL: | Current expected credit loss | |||||||
| CEO: | Chief executive officer | |||||||
| CERCLA: | Comprehensive Environmental Response, Compensation and Liability Act | |||||||
| CET1: | Common equity tier 1 | |||||||
| CFPB: | Consumer Financial Protection Bureau | |||||||
| CISO: | Chief information security officer | |||||||
| CMO: | Collateralized mortgage obligations | |||||||
| CMP: | Compliance Management Program | |||||||
| CRA: | Community Reinvestment Act of 1977 | |||||||
| CTA: | Corporate Transparency Act of 2019 | |||||||
| DRSPP: | Dividend reinvestment and direct stock purchase plan | |||||||
| DIF: | Deposit Insurance Fund | |||||||
| DTA: | Deferred tax asset | |||||||
| EWMC: | Enterprise Wealth Management Committee | |||||||
| EGRRCPA: | Economic Growth, Regulatory Relief, and Consumer Protection Act of 2018 | |||||||
| FASB: | Financial Accounting Standards Board | |||||||
| FDIA: | Federal Deposit Insurance Act | |||||||
| FDIC: | Federal Deposit Insurance Corporation | |||||||
| FHLB: | Federal Home Loan Bank | |||||||
| FinCEN: | Financial Crimes Enforcement Network | |||||||
| Fintech: | Financial technology | |||||||
| FIRREA: | Financial Institutions Reform, Recovery and Enforcement Act | |||||||
| FRB: | Federal Reserve Bank of Boston | |||||||
| FS-ISAC | Financial Services Information Sharing and Analysis Center | |||||||
| GAAP: | Generally Accepted Accounting Principles | |||||||
| HMDA: | Home Mortgage Disclosure Act | |||||||
| IRS: | Internal Revenue Service | |||||||
| MBS: | Mortgage-backed securities | |||||||
| Net Interest Margin: | Tax-equivalent net interest margin | |||||||
| NH BFA: | New Hampshire Business Finance Authority | |||||||
| NIST: | National Institute of Standards and Technology | |||||||
| NMTC: | New Market Tax Credit | |||||||
| OREO: | Other real estate owned | |||||||
| PPP: | Paycheck Protection Program | |||||||
| RESPA: | Real Estate Settlement Procedures Act | |||||||
| ROU: | Right-of-use | |||||||
| RPA: | Risk participation agreement | |||||||
| SAR: | Suspicious activity reports | |||||||
| SBA: | Small Business Administration | |||||||
| SERP: | Supplemental employee retirement plan | |||||||
| SIEM: | Security Information and Event System | |||||||
| TDR: | Troubled debt restructuring | |||||||
| TILA: | Truth-in Lending Act | |||||||
| U.S.: | United States | |||||||
3
PART I
Item 1.Business
Organization
Enterprise Bancorp, Inc. (the "Company," "Enterprise," "us," "we," or "our") is a Massachusetts corporation organized in 1996, which operates as the parent holding company of Enterprise Bank and Trust Company, commonly referred to as Enterprise Bank (the “Bank”"Bank")., a community-focused commercial bank. Substantially all of the Company’s operations are conducted through the Bank.Bank and its subsidiaries. The Bank, a Massachusetts trust company and state chartered commercial bank that commenced banking operations in 1989, has five wholly owned subsidiaries that are included in the Company’s consolidated financial statements:
•Three Massachusetts security corporations, Enterprise Security Corporation (2005), Enterprise Security Corporation II (2007) and Enterprise Security Corporation III (2007), which hold various types of qualifying securities. The security corporations are limited to conducting securities investment activities that the Bank itself would be allowed to conduct under applicable laws.
•Enterprise Wealth Services, LLC, organized in 2000 in the State of Delaware for the purpose of offering non-deposit investment products and services, under the name of "Enterprise Wealth Services."
Enterprise's headquarters are located at 222 Merrimack Street in Lowell, Massachusetts.
The community banking services offered through the Bank and its subsidiaries are managed as one strategic unit and represent the Company’sCompany's only reportable operating segment.
All material intercompany balances and transactions have been eliminated in consolidation.
The Company's common stock trades on the NASDAQ Global Market under the trading symbol "EBTC."
Market Area
The Company’sCompany's primary market area is the Greater Merrimack ValleyNorthern Middlesex, Northern Essex, and North Central regionsNorthern Worcester counties of Massachusetts and the Southern New Hampshire (Southern Hillsborough and Southern Rockingham counties).counties in New Hampshire. Enterprise has 2427 full-service branch banking officesbranches located in the Massachusetts communities of Acton, Andover, Billerica (2), Chelmsford (2), Dracut, Fitchburg, Lawrence, Leominster, Lexington, Lowell (2), Methuen, North Andover, Tewksbury Tyngsboro(2), Tyngsborough and Westford and in the New Hampshire communities of Derry, Hudson, Nashua (2), Pelham, Londonderry, Salem, and Windham, which serve those cities and towns as well as the surrounding communities.Windham.
Management actively seeks to strengthen itsthe Company's market position by capitalizing on market opportunities to grow all business lines and through the continued pursuit of organic growth and strategic expansion within existing and into neighboring geographic markets.
Products and Services
The Company principally is engaged in the business of gathering deposits from the general public and investing primarily in commercial loans and investment securities and utilizing the resulting cash flows to conduct operations, expand the branch network, and pay dividends to stockholders.securities. Through the Bank and its subsidiaries, the Company offers a range of commercial, residential and consumer loan products, deposit products and cash management services, as well as investment advisorywealth management and wealth management, trust and insurance services.
The integrated branch network serves all product channels with knowledgeable service providers and well-appointedstate-of-the-art facilities. The Bank also offers various digital banking capabilities via online and mobile platforms. Management continually examines new products and technologies in order to maintain a highly competitive mix of offerings and state-of-the-art delivery channels in order to tailor product lines to customers' needs. These products, services and servicesdelivery channels are outlined below.
4
The Company's business is not dependent on one, or a few customers, nor upon a particular industry, the loss of which would have a material adverse impact on the financial condition or operations of the Company.
Lending Products
General
The Company specializes in lending to business entities, non-profit organizations, professional practices, and individuals. The Company’sCompany's primary lending focus is on the development of high qualityhigh-quality, long-term commercial relationships achieved through active business development efforts, long-term relationships with established commercial developers, strong community involvement, and focused marketing strategies. Loans made to businesses, non-profits, and professional practicesCommercial loans may include commercial real estate mortgage loans, construction and land development loans, secured and unsecured commercial loans and lines of credit, and letters of credit. The Company also originates equipment lease financing for businesses. Loans made to individualsConsumer or "retail" loans may include conventional residential mortgage loans, home equity loans and lines of credit, residential construction loans on owner-occupied primary and secondary residences, and secured and unsecured personal loans and lines of credit. The Company manages its loan portfolio to avoid concentration by industry, relationship size, and source of repayment to lessen its credit risk exposure.
Interest rates charged on loans may be fixed or variable; variable rate loans may have fixed initial periods before periodic rate adjustments begin. Individual rates offered are dependent on the associated degree of credit risk, term, underwriting and servicing costs, loan amount, and the extent of other banking relationships maintained with the borrower, and may be subject to interest rate floors. Rates are also subject to competitive pressures, the current interest rateinterest-rate environment, availability of funds, and government regulations. The Company has a “Back-to-Back Swap” program whereby the Bank enters into an interest-rate swap with a qualified commercial banking customer and simultaneously enters into an equal and opposite interest-rate swap with a swap counterparty. The customer interest-rate swap agreement allows commercial banking customers to convert a floating-rate loan payment to a fixed-rate payment. The transaction structure effectively minimizes the Bank’s net risk exposure resulting from such transactions.
Enterprise employs a seasoned commercial lending staff, with commercial lenders supporting each of the Bank's branch location.locations. An internal loan review function assesses the compliance of commercial loan originations with the Company’sCompany's internal policies and underwriting guidelines and monitors the ongoing credit quality of the loan portfolio. The credit risk management function monitors a wide variety of individual borrower and industry factors; and the Company's internal loan credit risk rating system classifies loans depending on risk of loss characteristics. The Company also contracts with an external loan review company to review, on a pre-determined schedule, the internal credit ratings assigned to loans in the commercial loan portfolioportfolio. The review is focused on a pre-determined schedule,the non-criticized segment of the commercial loan portfolio, based on the type, size, credit rating, and overall risk of the loan.loan and generally encompasses 65% or more of the commercial loan portfolio. This same company is also contracted to perform limited stress testing on the commercial real estate loan portfolio on an annual basis.
The Company's internal residential origination and underwriting staff originate residential loans and are responsible for compliance with residential lending regulations, consumer protection and internal policy guidelines. The Company contracts with an external loan review company to complete a regular quality control review in accordance with secondary market underwriting requirementsstandards for residential mortgage loans sold.loans. The sample reviewed is based on loan volume originated since the prior review. Additionally, the Company's internal compliance department monitors the residential loan origination activity for regulatory compliance.
A management loan review committee, consisting of senior lending officers, credit, loan workout, loan operations, risk management and accounting personnel, is responsible for setting loan policy and procedures, as well as reviewing loans on the internal “watched"watch asset list”list" and classified loan report.
An internal credit review committee, consisting of senior lending officers and credit review personnel, meets to review and approve loan requests related to borrowing relationships of certain dollar levels, as well as other borrower relationships recommended for discussion by committee members.
The Loan Committee of the Company’sCompany's Board of Directors (the “Board”"Board") approves loan relationships exceeding certain prescribed dollar limits. The Board's Loan Committee reviews current portfolio statistics, problem credits, construction loan reviews, watchedwatch assets, loan delinquencies, and the allowance for loancredit losses, as well as current market conditions and issues relating to the construction and commercial real estate development industry and the reports from the external loan review company. The Board’sBoard's Loan Committee is also responsible for approval of the loan policy and credit-related charge-offs recommended by management, subject to final approval by the full Board.
At December 31, 2017,2023, the Bank’sBank's statutory lending limit, based on 20% of capital (capital stock plus surplus and undivided profits, but excluding other comprehensive income), to any individual borrower and related entities was approximately $49.1$93.5 million,, subject to certain exceptions provided under applicable law.
5
Commercial Real Estate, Commercial and Industrial, and Commercial Construction Loans
Commercial real estate loans include loans secured by both owner-useowner and non-owner occupied (investor) real estate. These loans are typically secured by a variety of commercial, residential investment, and industrial property types, including one-to-four and multi-family apartment buildings, office, industrial, or mixed-use facilities, strip shopping centers, or other commercial properties, and are generally guaranteed by the principals of the borrower. Commercial real estate loans generally have repayment periods of approximately fifteen15 to twenty-five30 years. Variable interest rateinterest-rate loans have a variety of adjustment terms and underlying interest rateinterest-rate indices and are generally fixed for an initial period before periodic rate adjustments begin.
Commercial and industrial loans include seasonal and formula-based revolving lines of credit, working capital loans, equipment financing (including equipment leases), and term loans. Also included in commercial and industrial loans are loans partially or fully guaranteed by the U.S. Small Business Administration ("SBA"),SBA, and loans under various other government and municipal programs and agencies. Commercial and industrial credits may be unsecured loans and lines to financially strong borrowers, loans secured in whole or in part by real estate unrelated to the principal purpose of the loan or secured by inventories, equipment, or receivables, and are generally guaranteed by the principals of the borrower. Variable rate loans and lines in this portfolio have interest rates that are periodically adjusted, with loans generally having fixed initial periods. Revolving lines of credit are written on demand and those over $100 thousand are subject to annual credit review. Revolving lines of credit below this threshold are monitored based on payment history and other performance criteria. Commercial and industrial loans have average repayment periods of one1 to seven7 years.
Commercial construction loans include the development of residential housing and condominium projects, the development of commercial and industrial use property, and loans for the purchase and improvement of raw land. These loans are secured in whole or in part by underlying real estate collateral and are generally guaranteed by the principals of the borrowers. Construction lenders work to cultivate long-term relationships with established developers.In many cases, these loans move into the permanent commercial real estate portfolio when the construction phase is completed. The Company limits the amount of financing provided to any single developer for the construction of properties built on a speculative basis. Funds for construction projects are disbursed as pre-specified stages of construction are completed. Regular site inspections are performed, prior to advancing additional funds, at each construction phase, either by experienced construction lenders on staff or by independent outside inspection companies. Commercial construction loans generally are variable rate loans and lines with interest rates that are periodically adjusted and generally have terms of one1 to three3 years.
From time to time, the Company participates with other banks in the financing of certain commercial projects. Participating loans with other institutions provide banks the opportunity to retain customer relationships and reduce credit risk exposure among each participating bank, while providing customers with larger credit vehicles than the individual bank might be willing or able to offer independently. In some cases, the Company may act as the lead lender, originating and servicing the loans, but participating out a portion of the funding to other banks. In other cases, the Company may participate in loans originated by other institutions. In each case, the participating bank funds a percentage of the loan commitment and takes on the related pro-rata risk. In each case in which the Company participates in a loan, the rights and obligations of each participating bank are divided proportionately among the participating banks in an amount equal to their share of ownership and with equal priority among all banks. When the participation qualifies as a sale under U.S. generally accepted accounting procedures ("GAAP"),GAAP, the balances participated out to other institutions are not carried as assets on the Company’sCompany's consolidated financial statements. The Company performs an independent credit analysis of each commitment andWhen a review of the participating institution prior to participation indoes not qualify as a sale under GAAP, the loan is carried at gross principal outstanding and an annual review thereafter of each participating institution.the balances participated out to other institutions are carried as secured borrowings on the Company's consolidated financial statements. Loans originated by other banks in which the Company is a participating institution are carried in the loan portfolio at the Company’s pro-rata share of ownership.
Letters of credit are conditional commitments issued by the Company to guarantee the financial obligation or performance of a customer to a third party.third-party. The credit risk involved in issuing letters of credit is essentially the same as that involved in extending loan facilities to customers. If the letter of credit is drawn upon, a loan is created for the customer, generally a commercial loan, with the same criteria associated with similar commercial loans.
Residential Loans
Enterprise Bank originates conventional mortgage loans on one-to-four family residential properties. These properties may serve as the borrower’sborrower's primary residence, or as vacation homes or investment properties. Loan-to-value policy limits vary, generally from 75% for multi-family owner-occupied properties, up to 97% for single family owner-occupied properties, with mortgage insurance coverage required for loan-to-value ratios greater than 80% based on program parameters. In addition, financing is provided for the construction of owner-occupied primary and secondary residences. Residential mortgage loans may have terms of up to 30 years at either fixed or adjustable ratesadjustable-rates of interest. Fixed and adjustable rateadjustable-rate residential mortgage loans are generally originated using secondary market underwriting and documentation standards.
Depending on the current interest rateinterest-rate environment, management projections of future interest rates and the overall asset-liability management program of the Company, management may elect to sell those fixed and adjustable rateadjustable-rate residential mortgage loans whichthat are eligible for sale in the secondary market or hold some or all of this residential loan production for the Company’sCompany's portfolio. Mortgage loans are generally not pooled for sale, but instead sold on an individual basis. The Company may retain or
6
sell the servicing when selling the loans. Loans sold are subject to standard secondary market underwriting and eligibility representations and warranties over the life of the loan and are subject to an early payment default period covering the first four payments for certain loan sales. Loans classified as held for sale are carried as a separate line item on the balance sheet.
Home Equity Loans and Lines of Credit
("Home equity term loans have in the past been originated for one-to-four family residential properties with maximum original loan-to-value ratios generally up to 80% of the automated valuation or appraised value of the property securing the loan. Home equity loan payments consist of monthly principal and interest based on amortization ranging from three to fifteen years. The rates may be variable or fixed.equity")
The Company originates home equity revolving lines of credit for one-to-fourone-to-two family residential properties with maximum original loan-to-value ratios generally up to 80%75% of the automated valuation or appraised value of the property securing the loan. Home equity lines generally have interest rates that adjust monthly based on changes in the Wall Street Journal Prime Rate,prime lending rate, although minimum rates may be applicable. Some home equity line rates may be fixed for a period of time and then adjusted monthly thereafter. The payment schedule for standard home equity lines requires interest only payments for the first ten years of the lines. Generally, at the end of ten years, the line may be frozen to future advances, and principal plus interest payments are collected over a fifteen-year15-year amortization schedule or, for eligible borrowers meeting certain requirements, the line availability may be extended for an additional interest only period. Home equity line of credit programs are available with the ability to convert all or a portion of the home equity line of credit balance to a fixed-rate term note subject to certain requirements and limitations. Available credit on the home equity line becomes available again as principal is repaid on the converted amounts.
Consumer Loans
Consumer loans consist primarily of secured or unsecured personal loans, loans under energy efficiency financing programs in conjunction with Massachusetts public utilities (Mass Save ®), and overdraft protection lines on checking accounts extended to individual customers. The aggregate amountamounts of overdrawn deposit accounts are reclassified as loan balances.
Credit Risk and Allowance for LoanCredit Losses
Information regarding the Company’sCompany's credit risk and allowance for loancredit losses is contained in Item 7, "Management’s"Management's Discussion and Analysis of Financial Condition and Results of Operations," contained in the section "Financial Condition," under "Loans," in the headings “Creditsubsections "Credit Risk,” “Asset Quality”" and “Allowance"ACL for Loan Losses.”Loans" of this Annual Report on Form 10-K for the year ended December 31, 2023 (this "Form 10-K"). See also Note 1, "Summary of Significant Accounting Policies," under Item (h) "Credit Risk Management and ACL for Loans Methodology" to the Company's audited consolidated financial statements, contained in Item 8 of this Form 10-K.
Deposit Products
Deposits have traditionally been the principal source of the Company’sCompany's funds. Enterprise offers commercial checking, business and municipal savings accounts, term certificates of deposit ("CDs"), money market and business sweep accounts, Interest on Lawyers Trust Accounts ("IOLTA's"), and escrow management accounts, as well as checking and Simplified Employee Pension ("SEP") accounts to employees of our business customers. Aa broad selection of competitive commercial and retail deposit products, are also offered, including personal checking accounts, earning interest and/or reward points,limited-transactional savings accounts,and money market accounts, individual retirement accounts ("IRA")commercial sweep products, and term CDs. Terms on CDsThe Company's deposit products are offered ranging from one month to seventy-two months.commercial businesses, professionals, municipalities, non-profit organizations, and individuals. As a member of the Federal Deposit Insurance Corporation (the "FDIC"),FDIC, the Bank's depositors are provided deposit protection up to the maximum FDIC insurance coverage limits.
In addition to the deposit products noted above, the Company also provides customers the ability to allocateautomate allocation of investment sweep (commercial only), money market, checking deposits and CDsCD balances to nationwide networks of reciprocating FDIC insured banks. Deposits are placed into a nationwide networksnetwork of banks in increments that are eligible for FDIC insurance. This allows the Company to offer enhanced FDIC insurance coverage on larger deposit balances by placing the “excess”"excess" funds ininto participating FDIC insured accounts or term certificates issued by other banks participating in the networks.CDs. In exchange, the other institutions place dollar-for-dollar matching reciprocal and insurable deposits with the Company via the networks. Essentially, the equivalent of the original deposit comes back to the Company and is available to fund local loan growth.operations. The original funds placed into the networks are not carried as deposits on the Company's consolidated balance sheet,Consolidated Balance Sheet, however the network's reciprocal dollar deposits are carried as customer deposits within the appropriate product category under totalcustomer deposits on the consolidated balance sheet.Consolidated Balance Sheet.
Management determines the interest rates offered on deposit accounts based on current and expected economic conditions, competition, liquidity needs, the volatility of existing deposits, the asset-liability position of the Company and the overall objectives of the Company regarding the growth and retention of relationships. Low-cost checking deposits are an important component of the Company's core funding strategy.
Enterprise may also utilizesutilize brokered deposits, bothmainly term and overnight,products, from a number ofseveral available sources as part of the Company's asset-liability management strategy and as an alternative to borrowed funds to support asset growth in excess of internally generated deposits. Brokered The Company collectively refers to brokered
7
deposits along withand borrowed funds may be referred to as wholesale"wholesale funding."
Cash Management Services
In addition to the lending and deposit products discussed above, commercial banking and municipalpublic sector customers may take advantage of cash management services includingand products that provide comprehensive reporting, streamline the processing of deposits and facilitate the use of those funds for purposes such as disbursements and automated short-term investment activities.
Cash management clients can enroll in remote check deposit capture, Automated Clearing House ("ACH") creditlockbox, ACH origination, domestic and debit origination, credit card processing, lockbox, escrow management, Non-Sufficient Funds check recovery, coin and currency processing, check reconciliation, check payment fraud prevention, international and domesticU.S. dollar wire transfers, corporate credit cards, overnightforeign currency wire transfers, "Positive Pay" to reduce check fraud and unauthorized ACH received items, account reconciliation, zero balance target transfers, automated investment sweeps, and commercial card and merchant services programs offered through third parties.
Investment sweep services withinclude third-party FDIC enhanced FDIC coverage, and money markets with enhanced FDIC coverage.
Product Delivery Channels
In addition to traditional product access channels, on-line banking customers may connect to their bank accounts securely via personal computer or any internet-enabled phone or mobile device. Various electronicvarious digital banking capabilities includeare delivered through the following:Bank's online website and mobile apps allowing customers to view account inquiries; viewing of recent transactions;statements, activity and images, as well as perform internal and external account transfers; loan payments; bill payments; persontransfers, pay bills, place stop payments, make person-to-person payments, and conduct mobile deposits. Digital wallet and mobile card controls provide smart phone users with additional debit card safety features to person payments; check deposits; placement of stop payments; access to images of checks paid;actively control and access to prior period account statements; commercial customers can additionally launch cash management services described above.monitor their virtual debit card.
Wealth Management and passwords, as well as digital signatures for certain transactions.
The Company provides a range of investmentwealth advisory and management services delivered via two channels, Enterprise Wealth Management and Enterprise Wealth Services.
Enterprise Wealth Management primarily utilizes an open-architecture approach to client investment management. The philosophy ismanagement, focusing on strategic asset allocation to identify and select high performing mutual funds and independent investment management firms and individual securities on behalf of our clients. The Company partners with an investment research firms and due diligence firmuses state of the art analytic tools to strengthen strategic development and provide performance monitoring capabilities. This firm performs detailed researchinform the asset allocation and due diligence reviews and provides an objective analysis of each independentportfolio construction processes. The investment management firm based on historic returns, management quality, longevity, investment style, risk profile, and other criteria, and maintains ongoing oversight and monitoring of their performance. This due diligenceprocess is intended to enable the Company to customizebuild and maintain investment portfolios to meet each customer’sclient’s financial objectives and aims to deliver superior long-term performance.results.
Enterprise Wealth Services provides brokerage and management services through a third-party arrangement with Commonwealth Financial Network, a licensed securities brokerage firm, with products designed primarily for the individual investor. Retirement plan services are offered through third-party arrangements with leading 401(k) plan providers.
8
Investment Activities
The Company's investment portfolio activities are an integral part of the overall asset-liability management program of the Company. The investment function provides readily available fundsliquidity to support loan growth, as well as to meet withdrawals and maturities of deposits, and attempts to provide maximum return consistent with liquidity constraints and general prudence, including diversification and safety of investments. In addition to the Bank, the Company holds investment securities in three Massachusetts security corporation subsidiaries, which serve to increase after tax returns in order to provide enhanced tax savings associatedaccordance with certain state tax policies related to investment income.policy.
The securities in which the Company may invest are limited by regulation. In addition, an internal investment policy restricts investments in debt securities to high-quality securities within prescribed categories as approved by the Board. Management utilizes an outside registered investment adviser to manage the corporate and municipal bond portfolios within prescribed guidelines set by management. The Company’sCompany's internal investment policy also sets sector limits as a percentage of the total portfolio, identifies acceptable and unacceptable investment practices, and denotes approved security dealers. The effect of changes in interest rates, market values, timing of principal payments and credit risk are considered when purchasing securities.
Cash equivalents are defined as highly liquid investments with original maturities of three months or less, that are readily convertible to known amounts of cash and present insignificant risk of changes in value due to changes in interest rates. The Company's cash and cash equivalents may be comprised of cash on hand and cash items due from banks, interest-earning deposits with banks (deposit accounts, excess reserve cash balances, money marketmarkets and money market mutual fund accounts and short-termaccounts), short team U.S. Agency Discount Notes)Treasury notes and overnight and term federal funds sold ("fed funds") to money center banks. Balances in cash and cash equivalents will fluctuate due primarily to the timing of net cash flows from deposits, borrowings, loans and investments, and the immediate liquidity needs of the Company.
The Company primarily invests in debt securities, with a small portion of the portfolio invested in equities. As of the balance sheet dates reflected in this annual report,Form 10-K, all of the investmentdebt securities within the Company's investment portfolio were classified as available-for-sale and carried at fair value. Management regularly reviews the portfolio for securities with unrealized losses that are other-than-temporarily-impaired ("OTTI"). If a decline in the market value of an equity security or fund is considered other than temporary, the cost basis of the individual security or fund is written down to market value, with a charge to earnings. For debt securities, OTTI is generally recognized through a charge to earnings as of the balance sheet date, while non-OTTI unrealized losses are recognizedchanges in fair value reflected in other comprehensive income. Unrealized losses on debtThe equity securities are deemed OTTI if: 1) the Company intends to sell the security, 2) it is more likely than not that the Company will be required to sell the security before recovery, or 3) a credit loss exists and the Company does not expect to recover the
Management reports investment transactions, portfolio allocation, effective duration, marketfair value at risk and projected cash flows to the Board on a periodic basis. Credit risk inherent in the portfolio is closely monitored by management and presented at least annually to the Board. The Board also approves the Company’sCompany's internal investment policy annually and ongoing investment strategy.
The Company is required to purchase Federal Home Loan Bank of Boston (“FHLB”)FHLB stock at par value in association with the Bank’sBank's outstanding advances from the FHLB; this stock is classified as a restricted investment and carried at cost which management believes approximates fair value.
Borrowed Funds
Total borrowing capacity includes borrowing arrangements at the FHLB, andthe FRB discount window, the BTFP established by the Board of Governors of the Federal Reserve Bank of Boston ("FRB"System (the "Federal Reserve Board") Discount Window, and borrowing arrangements with correspondent banks. On January 24, 2024, the Federal Reserve Board announced that the BTFP will cease making new loans after March 11, 2024.
Membership in the FHLB provides borrowing capacity based on qualifying collateral balances pre-pledged to the FHLB, including certain residential loans, home equity lines, commercial loans, U.S. government and U.S. Governmentagency securities and Agencycertain municipal securities.
Borrowings from the FHLB typically are utilized to fund short-term liquidity needs or specific lending projects under the FHLB’sFHLB's community development programs. ThisThe FHLB funding facility is an integral component of the Company’sCompany's asset-liability management program.
The FRB Discount Windowdiscount window and BTFP borrowing capacity is based on the pledge of qualifying collateral balances to the FRB. Collateral pledged for thisto the FRB facility consists primarily of certain municipal and corporate securities held in the Company's investment portfolio. Additional types of collateral are available to increase borrowing capacity with the FRB if necessary.
9
Pre-established non-collateralized overnight borrowing arrangements with large national and regional correspondent banks provide additional overnight and short-term borrowing capacity for the Company.Company and are classified as "other borrowings" under Borrowed Funds on the Company's balance sheets.
Subordinated Debt
The Company had $14.8 millionhas issued subordinated notes as a component of its capital management strategy. As of the balance sheet dates contained in this Form 10-K, the Company's outstanding subordinated debt (net of deferred issuance costs) at both December 31, 2017 and December 31, 2016, which consisted of $15.0 million in aggregate principal amount of Fixed-to-Floating Rate Subordinated Notesfixed-to-floating rate subordinated notes (the "Notes") issued July 2020, callable in January 2015, with a 15 year term, net of debt issuance costs.whole or part beginning in 2025, due in 2030. The Notes are intended to qualify at the Company as Tier 2 capital for regulatory purposes and pay interest at a fixed rate of 6.00% per annum through January 30, 2025, after which floating rates apply.purposes.
Capital Resources
Capital planning by the Company and the Bank considers current needs and anticipated future growth. Historically, theThe primary sources of capital for the Company and the Bank have beeninclude proceeds from the issuance of the Company's common stock, and proceeds from the issuance of subordinated debt. Ongoing sources of capital include thedebt and retention of earnings, less dividends paid, proceeds from the exercise of employee stock options and proceeds from purchases of shares pursuant to the Company’s dividend reinvestment plan and direct stock purchase plan (together, the "DRSPP").paid. The Company believes its current capital is adequate to support ongoing operations.
See also "Capital Requirements" belowRequirements," and "Capital Requirements under Basel III," under the heading “Supervision"Supervision and Regulation” for further information regarding the Company’s and the Bank’s regulatory capital requirements. See also Note 10, "Stockholders' Equity" to the Company's consolidated financial statements,Regulation," contained in Item 8,below, for further information regarding the Company's and the Bank's regulatory capital ratios.requirements.
Patents, Trademarks, etc.
The Company holds a number ofseveral registered service marks and trademarks related to product names and corporate branding. The Company holds no other patents, registered trademarks, licenses (other than licenses required to be obtained from appropriate banking regulatory agencies), franchises or concessions that are material to its business.
The Company distinguishes itself through our strong sense of teamwork, purpose, inclusion, and equity, and through caring for each other, our customers, and our communities. We routinely engage independent third parties to conduct cultural, engagement, and inclusion surveys to assess our engagement and to act, if necessary, to address areas of improvement. Based on the feedback provided by our team members, management believes its team member relations are excellent.
At December 31, 2017,2023, the Company employed 482570 full-time equivalent employees.team members. None of the Company's employees are presently represented by a union or covered by a collective bargaining agreement. Management believes its employee relations
Diversity, Equity, Inclusion & Belonging
At Enterprise Bank, we encourage and foster a culture of diversity, equity, inclusion, and belonging where everyone feels valued and respected. Our Bank-wide DEIB Program Steering Committee was founded to further embrace and promote awareness of personal identity in the workplace, to identify and help resolve equity gaps and to strengthen everyone’s sense of belonging within our Enterprise family. To help team members with similar backgrounds and experiences connect, and to bring together supportive networks, we’ve established several Employee Resource Groups at the Bank, including the PRIDE Community of Respecting People’s Sexuality & Gender, Veterans ERG, Working Parents ERG, and our Multicultural Alliance, a cross-functional team of ambassadors who promote diversity and share ideas to help celebrate our differences while seeking connections through intercultural conversations, awareness, and respect. In 2023, a Young Professionals ERG was established at the Bank with a mission to help develop our young professionals through education, guidance, resources, and networking opportunities.
10
As of December 31, 2023, 68% of our team members are excellent.women and 22% are self-identified as Black, Indigenous, and persons of color. Of our managerial team members, 66% are women and 13% are self-identified as Black, Indigenous, and persons of color.
Employee Development
We strive to attract the best talent and to foster their growth and development by continually investing in and supporting the ongoing development of our team members. Our Enterprise team has the opportunity to participate in in-house training, seminars, webinars, and conferences. We also support professional certifications and designations, continued education assistance and reimbursement.
Managers are encouraged to work with their team members to develop individualized career development plans and strategies based on our S.O.A.R. framework: Strengths, Opportunities, Aspirations, Results. Enterprise also offers a mentorship program to help guide team members and contribute to their holistic personal and professional development.
Employee Benefits & Wellness
Enterprise strives to provide team members with a range of compensation and reward programs that are meaningful and important to them. We offer compensation opportunities that are competitive with our geographic markets. New team members starting in entry level roles begin at above minimum wage and we have increased starting pay each year.
Enterprise offers unique programs to give team members a greater vested interest in the Bank’s success. We offer a Spot Bonus Award Program, an Equity Ownership Participation Program, a Variable Compensation Incentive Plan, and Sales Incentive Plans to incentivize team members to perform well by rewarding them with a monetary payout when the team member and the Bank are successful.
As part of our "total rewards," we offer employees several insurance plan options, including three health insurance plans, two dental insurance plans, two vision insurance plans and 401(k) matches. Enterprise bankers also have access to our Employee Assistance Program, which offers help to team members and/or their household members who may be experiencing problems related to life changes and/or personal stress, paternity leave, tuition reimbursement, short- and long-term disability and flexible work arrangements.
Enterprise Bank’s wellness program encourages a healthy lifestyle and supports team members’ physical, financial, spiritual and emotional well-being through ongoing holistic education programs, interactive initiatives and social support.
Company WebsiteWebsites
The Company currently uses outside vendors to design, support, and host its two primary internet websites; www.enterprisebanking.com, for general banking products and services and Company information, as noted below; and www.enterprisewealth.com, for investment advisory and management services offered by the Bank, with a client portal that provides access to various customizable reports and statements for customers' wealth accounts. The underlying structure of the websites allows for ongoing maintenance to be performed by third parties, and updates of information to be performed by authorized Company personnel.website: www.enterprisebanking.com. The information contained on or accessible from our websites does not constitute a part of this reportForm 10-K and is not incorporated by reference.
The Bank's siteCompany's website provides information on the Company and its products and services. Users have the ability to securely open various deposit accounts, as well as the ability to submit mortgage loan applications and related documentation securely online and, via a link, to access their bank accounts and perform various financial transactions, with thoseand via the wealth-management link to access various wealth account reports and statements, and the ability to consolidate all investment accounts using a(Enterprise or others) on one secure Online Banking platform.
The siteBank's website also provides the access point to a variety of specified banking services and information, various financial management tools, and Company investor and corporate information, which includes a corporate governance page. The Company’sCompany's corporate governance page includes the corporate governance guidelines,Corporate Governance Guidelines, Code of Business Conduct and Ethics, and whistleblowerWhistleblower and non-retaliation protectionNon-Retaliation policy, as well as the charters of the Board of Directors’Board's Audit, Compensation and Human Resources, and Corporate Governance/Nominating committees.
In the Investor Relations section of the Bank'sCompany's website, under the SEC Filings tab, the Company makes available copies of the Company’sCompany's annual reports on Form 10-K, quarterly reports on Form 10-Q ("Form 10-Q"), proxy statements and current reports on Form 8-K.8-K ("Form 8-K"). Additionally, the site includes current registration statements that the Company has been required or elected to file in connection with the issuance of its shares.shares and other securities. The Company similarly makes available all insider stock ownership and transaction reports filed with the SEC by executive officers, directors and any 10% or
11
greater stockholdersshareholders under Section 16 of the Securities Exchange Act of 1934, as amended ( the(the "Exchange Act") (Forms 3, 4 and 5). Access to all of these reports is made available free of charge and is essentially simultaneous with the SEC’sSEC's posting of these reports on its EDGAR system through the SECSEC's website (www.sec.gov).
Competition
Numerous local savings banks, commercial banks, cooperative banks, and credit unions which have a presencealso compete in the region.Company's market area. The expanded commercial lending capabilities of credit unions and the shift to commercial lending by traditional savings banks means that both types of traditionally consumer-orientated institutions compete for the Company's targeted commercial customers. In addition, the non-taxable status of credit unions allows them an advantage as compared to taxable institutions such as Enterprise. Competition for loans, deposits and cash management services, investmentand wealth advisory assets and insurance business also comes from other businesses that provide financial services, including consumer finance companies, mortgage brokers and lenders, private lenders, insurance companies, securities brokerage firms, institutional mutual funds, and registered investment advisors,advisors.
Internet-based banks, non-bank electronic payment and funding channels, internet based banks and other tech-based financial intermediaries.
The Company faces increasing competition within its marketplace on the pricing and Analysisterms of Financial Conditionloans. This is expected to be an ongoing competitive challenge; however, the Company is committed to maintaining asset quality and Resultsfocuses its sales efforts on building long-term full relationships, rather than competing for individual transactions or easing loan terms.
The Company faces ongoing competition within its marketplace on the pricing and terms of Operations," for further discussion on how new lawsdeposit products. The Company actively seeks to increase deposit market share and regulations and other factors may affect the Company’sstrengthen its competitive position growth and/with a commitment to providing an enhanced customer experience. The Company continuously reviews its deposit product offerings, cash management and ancillary services and delivery channels to ensure it is competitive.
Enterprise carefully plans market expansion through the addition of new branch locations, identifying markets strategically located to complement existing locations while expanding the Company's geographic market footprint. The integrated branch network serves all product channels.
The increased use and advances in technology, data analytics and storage, such as online and mobile, and non-bank electronic payment channels, electronic transaction processing, block-chain based assets including digital currency and non-fungible tokens, and cloud-computing and storage, among others are expected to have a significant impact on the future competitive landscape confronting financial service businesses.
In addition, the cost of compliance with new and existing government regulations, changes in tax legislation and the interest-rate environment continue to impact competition and consolidation within the industry in various ways, with some participants better equipped to manage these changes than others based on size, depth of resources, or profitability.competitive product positioning, among other factors.
Supervision and Regulation
General
Set forth below is a summary description of the significantmaterial elements of the laws and regulations applicable to the Company and the Bank. The description is qualified in its entirety by reference to the full text of the statutes, regulations and policies that are described. Moreover, these statutes, regulations and policies are continually under review by the U.S. Congress and state legislatures and federal and state regulatory agencies. A change in statutes, regulations, or regulatory policies applicable to the
12
Company or its principal subsidiary, the Bank, could have a material effect on our business.business, financial condition or results of operations.
Regulatory Agencies
As a registered bank holding company, the Company is subject to the supervision and regulation of the Federal Reserve Board and, acting under delegated authority, the FRB pursuant to the Bank Holding Company Act of 1956, as amended (the "Bank Holding Company Act"). The Massachusetts Division of Banks (the "Division") also retains supervisory jurisdiction over the Company.
As a Massachusetts state-chartered bank, the Bank is subject to the supervision and regulation of the Massachusetts Division of Banks (the "Division") and, with respect to the Bank's New Hampshire branching operations, the New Hampshire Banking Department. As a state-chartered bank that accepts deposits and is not a member of the Federal Reserve System, the Bank is also subject to the supervision and regulation of the FDIC.
Bank Holding Company Regulation
As a registered bank holding company, the Company is required to furnish to the FRB annual and quarterly reports of its financial condition and results of operations, and may also be required to furnish such additionalamong other information and reports as the Federal Reserve Board or the FRBthat may require.be required.
Acquisitions by Bank Holding Companies
Under the Bank Holding Company Act, the Company must obtain the prior approval of the Federal Reserve Board or, acting under delegated authority, the FRB before (1)(i) acquiring direct or indirect ownership or control of any class of voting securities of any bank or bank holding company if, after the acquisition, the Company would directly or indirectly own or control 5% or
more of thesuch class; (2)(ii) acquiring all or substantially all of the assets of another bank or bank holding company; or (3)(iii) merging or consolidating with another bank holding company. The Company's acquisition of or merger with another bank holding company or acquisition of another bankThese activities would also require the prior approval of the Division.
Under the Bank Holding Company Act, and the regulations promulgated by the Federal Reserve Board thereunder, any company must obtain approval of the Federal Reserve Board or, acting under delegated authority, the FRB, prior to acquiring control of the Company or the Bank. For purposesSection 2(a)(2) of the Bank Holding Company Act applies a three-prong test for determining whether a company acquires "control" is defined as: (i) ownership, ofcontrol, or the power to vote 25% or more of any class of voting securities of the Company or the Bank, (ii) the ability to control in any manner the election of a majority of the directors of the Company or the Bank, or (iii) the direct or indirect exercise of a controlling influence over management or policies of the Company or the Bank. "Control" is conclusively presumed to exist upon the acquisition of 25% or more of the outstanding voting securities of a bank or bank holding company.
Control Acquisitions
The Change in Bank Control Act and the related regulations of the Federal Reserve Board generally require any person or groups of persons acting in concert (except for companies required to make application under the Bank Holding Company Act), to file a written notice with the Federal Reserve Board or, acting under delegated authority, the appropriate Federal Reserve Bank,FRB, before the person or group acquires control of the Company. The Change in Bank Control Act defines “control”"control" as the direct or indirect power to vote 25% or more of any class of voting securities or to direct the management or policies of a bank holding company or an insured bank. A rebuttable presumption of control arises under the Change in Bank Control Act where a person or group controls 10% or more, but less than 25%, of a class of the voting stock of a company or insured bank which is a reporting company under the Securities Exchange Act, of 1934, as amended, such as the Company, or such ownership interest is greater than the ownership interest held by any other person or group.
In addition, the Change in Bank Control Act prohibits any entity from acquiring 25% (5%(or 5% in the case of an acquirer that is a bank holding company) or more of a bank holding company’scompany's or bank’sbank's voting securities, or otherwise obtaining control or a controlling influence over a bank holding company or bank without the approval of the Federal Reserve Board. On September 22, 2008, theThe Federal Reserve Board has issued a policy statement on equity investments in bank holding companies and banks, which allows the Federal Reserve Board to generally be able to conclude that an entity’sentity's investment is not “controlling”"controlling" if the investment in the
13
form of voting and nonvoting shares represents in the aggregate (i) less than one-third of the total equity of the banking organization (and less than one-third of any class of voting securities, assuming conversion of all convertible nonvoting securities held by the entity) and (ii) less than 15% of any class of voting securities of the banking organization.
Under the Change in Bank Control Act and applicable Massachusetts law, any person or group of persons acting in concert would also be required to file a written notice with the FDIC and the Division before acquiring any such direct or indirect control of the Bank.
Permissible Activities
The Bank Holding Company Act and the implementing regulations of the Federal Reserve Board also limitslimit the investments and activities of bank holding companies. In general, a bank holding company is prohibited from acquiring direct or indirect ownership or control of more than 5% of the voting shares of a company that is not a bank or a bank holding company or from engaging directly or indirectly in activities other than those of banking, managing or controlling banks, providing services for its subsidiaries, and various non-bank activities that are deemed to be closely related to banking. The activities of the Company are subject to these legal and regulatory limitations under the Bank Holding Company Act and the implementing regulations of the Federal Reserve Board.
A bank holding company may also electthat qualifies and elects to become a "financial holding company," by which a qualified parent holding company of a banking institutioncompany" may engage, directly or through its non-bank subsidiaries, in any activity that is financial in nature or incidental to such financial activity or in any other activity that is complementary to a financial activity and does not pose a substantial risk to the safety and soundness of depository institutions or the financial system generally. These activities include securities underwriting and dealing, insurance underwriting and making merchant banking investments. A bank holding
Source of Strength
Imposition of Liability for Undercapitalized"Undercapitalized" Subsidiaries
Bank regulators are required to take "prompt corrective action" to resolve problems associated with insured depository institutions whose capital declines below certain levels. In the event an institution becomes "undercapitalized," it must submit a capital restoration plan to its regulators. The capital restoration plan will not be accepted by the regulators unless each company having control of the undercapitalized"undercapitalized" institution guarantees the subsidiary’ssubsidiary's compliance with the capital restoration plan up to a certain specified amount. Any such guarantee from a depository institution’sinstitution's holding company is entitled to a priority of payment in bankruptcy.
The aggregate liability of the holding company of an undercapitalized"undercapitalized" bank is limited to the lesser of 5% of the institution’sinstitution's assets at the time it became undercapitalized"undercapitalized" or the amount necessary to cause the institution to be "adequately capitalized." The bank regulators have greater power in situations where an institution becomes "significantly" or "critically" undercapitalized"undercapitalized" or fails to submit a capital restoration plan. For example, a bank holding company controlling such an institution can be required to obtain prior Federal Reserve Board approval of proposed dividends, or it may be required to consent to a consolidation or to divest the troubled institution or other affiliates.
Safety and Soundness
The federal banking agencies have adopted the Interagency Guidelines for Establishing Standards for Safety and Soundness. The guidelinesSoundness, which establish general standards relating to internal controls and information systems, internal audit systems, loan documentation, credit underwriting, interest rateinterest-rate exposure, asset growth, asset quality, earnings and compensation, and fees and benefits. In general, these guidelines require, among other things, appropriate systems and practices to identify and manage the risk and exposures specified in the guidelines. These guidelines also prohibit excessive compensation as an unsafe and unsound practice and describe compensation as excessive when the amounts paid are unreasonable or disproportionate to the services performed by an executive officer, employee, director or principal stockholder.shareholder.
Bank holding companies are not permitted to engage in unsafe or unsound banking practices. The Federal Reserve Board has the power to order a bank holding company to terminate any activity or investment, or to terminate its ownership or control of any subsidiary, when it has reasonable cause to believe that the continuation of such activity or investment or such ownership or
14
control constitutes a serious risk to the financial safety, soundness, or stability of any subsidiary bank of the bank holding company. The Federal Reserve Board also has the authority to prohibit activities of non-banking subsidiaries of bank holding companies which represent unsafe and unsound banking practices or which constitute violations of laws or regulations.
The Federal Reserve Board can assess civil money penalties for activities conducted on a knowing and reckless basis, if such unsafe and unsound activities caused a substantial loss to a depository institution. The FIRREA expanded the Federal Reserve Board's authority to prohibit activities of bank holding companies and their non-banking subsidiaries which represent unsafe and unsound banking practices, or which constitute violations of laws or regulations. Potential penalties can be as high as $1 million for each day the activity continues.
Capital Requirements
The federal banking agencies have adopted risk-based capital guidelines for bank holding companies and banks that are expected to provide a measure of capital that reflects the degree of risk associated with a banking organization's operations for both transactions reported on the consolidated balance sheet as assets, such as loans, and those recorded as off-balance sheet items, such as commitments, letters of credit and recourse arrangements. The risk-based guidelines apply on a consolidated basis to bank holding companies with consolidated assets of $1$3 billion or more.more, such as the Company, or with a material amount of equity securities outstanding that are registered with the SEC.
Pursuant to federal regulations, banks and bank holding companies must maintain capital levels commensurate with the level of risk to which they are exposed, including the volume and severity of problem loans. For example, holding companies experiencing internal growth or making acquisitions are expected to maintain strong capital positions substantially above the minimum supervisory levels, without significant reliance on intangible assets. The federal banking agencies may change, existing capital guidelinesadopt or adoptrequire new capital guidelines in the future and have required manyunder certain situations such as for high growth or acquisitive bank holding companies, when banks and bank holding companies are subject to enforcement actions, to maintain capital ratios in excess of the minimum ratios otherwise required to be deemed well-capitalized, in which case the affected institution may no longer be deemed well-capitalized and may be subjecthave also subjected such institutions to restrictions on various activities, including a bank's ability to accept or renew brokered deposits.
Under these capital guidelines, a banking organization is required to maintain certain minimum capital ratios, which are obtained by dividing its qualifying capital by its total risk-adjusted assets and off-balance sheet items. In general, the dollar amounts of assets and certain off-balance sheet items are "risk-adjusted" and assigned to various risk categories. In addition to such risk adjusted capital requirements, banking organizations are also required to maintain an additional minimum “leverage”"leverage" capital ratio, which is calculated based on the basis of average total assets without any adjustment for risk being made to the value of the assets.
Qualifying capital is classified depending on the type of capital as follows:
"Tier 1 capital" consists of common equity, retained earnings, qualifying non-cumulative perpetual preferred stock, a limited amount of qualifying cumulative perpetual preferred stock and minority interests in the equity accounts of consolidated subsidiaries, less goodwill and certain other intangible assets. In determining bank holding company compliance with holding company level capital requirements,certain limited circumstances, qualifying Tier 1 capital may count trust preferred securities, subject to certain criteria and quantitative limits for inclusion of restricted core capital elements in Tier 1 capital, provided that the bank holding company has total assets of less than $15 billion and such trust preferred securities were issued before May 19, 2010;securities.
"Tier 2 capital" includes, among other things, hybrid capital instruments, perpetual debt, mandatory convertible debt securities, qualifying term subordinated debt, preferred stock that does not qualify as Tier 1 capital, and a limited amount of allowance for loancredit and lease losses.
Capital Requirements under the Basel III Rules
Federal banking regulations implementing the international regulatory capital framework, referred to as the "Basel III Rules," apply to both depository institutions and (subject to certain exceptions not applicable to the Company) their holding companies. Under the Basel III Rules, (defined below), effective January 1, 2015, a bank holding company must satisfy increasedcertain capital levels in order to comply with the prompt corrective action framework and to avoid limitations on capital distributions and discretionary bonus payments once Basel III Rules are fully phased in. See “Capital Requirements under Basel III” below.
executives.
The Basel III Rules also establish a "capital conservation buffer" of 2.5% above the regulatory minimum risk-based capital requirements. The capital conservation buffer requirement was phased in beginning in January 2016 at 0.625% of risk-weighted assets and will increase by that amount each year until fully implemented in January 2019. An institution will be subject to limitations on certain activities, including payment of dividends, share repurchases and discretionary bonuses to executive officers, if its capital level is below the buffered ratio.
15
The Basel III minimum capital ratios as applicable towith the Company and the Bank in 2019 after the full phase-in period of the capital conservation buffer are summarized in the table below.
| Basel III Minimum for Capital Adequacy Purposes | Basel III Additional Capital Conservation Buffer | Basel III Ratio with Capital Conservation Buffer | ||||||||||||||||||
| Total Risk-Based Capital (total capital to risk-weighted assets) | 8.00% | 2.50% | 10.50% | |||||||||||||||||
| Tier 1 Risk-Based Capital (tier 1 to risk-weighted assets) | 6.00% | 2.50% | 8.50% | |||||||||||||||||
Tier 1 Leverage Ratio (tier 1 to average assets)(1) | 4.00% | N/A | 4.00% | |||||||||||||||||
| Common Equity Tier 1 Risk-Based Capital (CET1 to risk-weighted assets) | 4.50% | 2.50% | 7.00% | |||||||||||||||||
| Basel III Minimum for Capital Adequacy Purposes | Basel III Additional Capital Conservation Buffer | Basel III Ratio with Capital Conservation Buffer | ||||
| Total Risk Based Capital (total capital to risk weighted assets) | 8.00% | 2.50% | 10.50% | |||
| Tier 1 Risk Based Capital (tier 1 to risk weighted assets) | 6.00% | 2.50% | 8.50% | |||
| Tier 1 Leverage Ratio (tier 1 to average assets) | 4.00% | —% | 4.00% | |||
| Common Equity Tier 1 Risk Based Capital (CET1 to risk weighted assets) | 4.50% | 2.50% | 7.00% | |||
(1)Capital conservation buffer is not applicable to Tier 1 Leverage Ratio.
In addition, the Basel III Rules include certain exemptions to address concerns about the regulatory burden on community banks. For example, banking organizations with less than $15 billion in consolidated assets as of December 31, 2009 are permitted to include in Tier 1 capital trust preferred securities and cumulative perpetual preferred stock issued and included in Tier 1 capital prior to May 19, 2010 on a permanent basis, without any phase out. Community banks were also allowed to elect, on a one timeone-time basis in their March 31, 2015 quarterly filings, to permanently opt-out of the requirement to include most accumulated other comprehensive income ("AOCI")AOCI components in the calculation of CET1 capital and, in effect, retain the AOCI treatment under the previous capital rules. Under the Basel III Rules, in 2015 the Company made such an election to permanently exclude AOCI from capital.
Regulatory Restrictions on Dividends and Stock Redemptions and Repurchases
The Company is regarded as a legal entity separate and distinct from the Bank. The principal source of the Company’sCompany's revenues is dividends received from the Bank. Both Massachusetts and federal law limit the payment of dividends by the
Company. Under Massachusetts law, the Company is generally prohibited from paying a dividend or making any other distribution if, after making such distribution, it would be unable to pay its debts as they become due in the usual course of business, or if its total assets would be less than the sum of its total liabilities plus the amount that would be needed if it were dissolved at the time of the distribution, to satisfy any preferential rights on dissolution of holders of preferred stock ranking senior in right of payment to the capital stock on which the applicable distribution is made. The Federal Reserve Board also has further authority to prohibit dividends by bank holding companies if their actions constitute unsafe or unsound practices.
The Federal Reserve Board has issued a policy statement and supervisory guidance on the payment of cash dividends by bank holding companies which expresses the Federal Reserve Board's view that a bank holding company should pay cash dividends only to the extent that (1)(i) the bank holding company's net income for the past year is sufficient to cover the cash dividends, (2)(ii) the rate of earnings retention is consistent with the bank holding company's capital needs, asset quality, and overall financial condition, and (3)(iii) the minimum regulatory capital adequacy ratios are met. The Federal Reserve Board policy statement also provides that a bank holding company should inform the Federal Reserve Board or the FRB reasonably in advance of declaring or paying a dividend that exceeds earnings for the period for which the dividend is being paid or that could result in a material adverse change to the bank holding company's capital structure. Bank holding companies also are required to consult with the Federal Reserve Board or the FRB before materially increasing dividends. It is also the Federal Reserve Board's policy that bank holding companies should not maintain dividend levels that undermine their ability to serve as a source of strength to their banking subsidiaries. The Federal Reserve Board or the FRB could prohibit or limit the payment of dividends by a bank holding company if it determines that payment of the dividend would constitute an unsafe or unsound practice.
Bank holding companies must consult with the Federal Reserve Board or the FRB before redeeming any equity or other capital instrument included in tier 1 or tier 2 capital prior to stated maturity, if (x) such redemption could have a material effect on the level or composition of the organization's capital base or (y) as a result of such repurchase, there is a net reduction of the outstanding amount of common stock or preferred stock outstanding at the beginning of the quarter in which the redemption or repurchase occurs. In addition, bank holding companies are unable to repurchase shares equal to 10% or more of their net worth if they would not be "well-capitalized" (as defined by the Federal Reserve Board) after giving effect to such repurchase. Bank holding companies experiencing financial weaknesses, or that are at significant risk of developing financial weaknesses, must
16
consult with the Federal Reserve Board or the FRB before redeeming or repurchasing common stock or other regulatory capital instruments.
Bank Regulation
The Bank is subject to the supervision and regulation of the Division and the FDIC, and, with respect to its New Hampshire branching operations, of the New Hampshire Banking Department. Federal and Massachusetts laws and regulations that specifically apply to the Bank's business and operations cover, among other matters, the scope of its business, the nature of its investments, its reserves against deposits, the timing of the availability of deposited funds, its activities relating to dividends, investments, loans, the nature and amount of and collateral for certain loans, borrowings, capital requirements, certain check-clearing activities, branching, and mergers and acquisitions. The Bank is also subject to federal and state laws and regulations that restrict or limit loans or extensions of credit to, or other transactions with, “insiders,” including officers, directors and principal stockholders, and loans or extension of credit by banks to affiliates or purchases of assets from, or other transactions with, affiliates, including parent holding companies.acquisitions, as discussed below.
The FDIC and the Division may exercise extensive discretion in connection with their supervisory and enforcement activities and examination policies, including policies with respect to the classification of assets and the establishment of adequate loancredit loss reserves for regulatory purposes. If as a result of an examination, the Massachusetts Division of Banks or the FDIC should determine that the financial condition, capital resources, asset quality, earnings prospects, management, liquidity, sensitivity to market risk, or other aspects of the Bank's operations are unsatisfactory or that the Bank or its management is violating or has violated any law or regulation, the Division and the FDIC have authority to undertake a variety of enforcement measures of varying degrees of severity, including, the following:among other things:
Permissible Activities
Under the Federal Deposit Insurance Act,FDIA, as amended, (the "FDIA"), and applicable Massachusetts law, the Bank may generally engage in any activity that is permissible under Massachusetts law and either is permissible for national banks or the FDIC has determined does not pose a significant risk to the FDIC's Deposit Insurance Fund ("DIF").DIF. In addition, the Bank may also form, subject to the approvals of the Massachusetts Division of Banks and the FDIC, "financial subsidiaries" to engage in any activity that is financial in nature or incidental to a financial activity. In order to qualify for the authority to form a financial
subsidiary, the Bank is required to satisfy certain conditions, some of which are substantially similar to those that the Company would be required to satisfy in order to elect to become a financial holding company. The Company believes that the Bank would be able to satisfy all of the conditions that would be required to form a financial subsidiary, although the Bank has no current intention of doing so. Such a course of action may become necessary or appropriate at some time in the future depending upon the Bank's strategic plan.
Capital Adequacy Requirements
The FDIC monitors the capital adequacy of the Bank by using a combination of risk-based guidelines and leverage ratios. The FDIC considers the Bank’sBank's capital levels when taking action on various types of applications and when conducting supervisory activities related to the safety and soundness of the Bank and the banking system. UnderAs noted above, the Basel III rules which became effective on January 1, 2015,Rules require banks are required to maintain four minimum capital standards: (1)(i) a Tier 1 capital to adjusted total assets ratio, or "leverage capital ratio," of at least 4.0%, (2)(ii) a Tier 1 capital to risk-weighted assets ratio, or "Tier 1 risk-based capital ratio," of at least 6.0%, (3)(iii) a total risk-based capital (Tier 1 plus Tier 2) to risk-weighted assets ratio, or "total risk-based capital ratio," of at least 8.0%, and (4)(iv) a CET1 capital ratio of 4.5%, which are the same minimum capital standards to which the Company is held on a consolidated basis. In addition, the FDIC’sFDIC's prompt corrective action standards discussed below, in effect, increase the minimum regulatory capital ratios for banking organizations. These capital requirements are minimum requirements.organizations in order to be considered "well-capitalized." Higher capital levels may be required if warranted by the particular circumstances or risk profiles of individual institutions, or if required by the banking regulators due to the economic conditions impacting our market. For example, FDIC regulations provide
17
Management believes that, higheras of December 31, 2023, the Bank exceeded its minimum capital may be requiredrequirements and met all capital adequacy requirements to take adequate account of, among other things, interest rate risk andwhich it was subject under the risks posed by concentrations of credit, nontraditional activities or securities trading activities.Basel III Rules.
Prompt Corrective Action
The federal banking agencies have issued regulations pursuant to the FDIA, as revised by the Basel III Rules, definingdefine five categories in which an insured depository institution will be placed, based on the level of its capital ratios: well-capitalized, adequately"well-capitalized," "adequately capitalized, undercapitalized, significantly undercapitalized," "undercapitalized," "significantly undercapitalized" and critically"critically undercapitalized. As of January 1, 2015, insured" Insured depository institutions are required to meet the following capital levels in order to qualify as "well-capitalized:" (i) a Total risk-based capital ratio of 10% (unchanged from current rules); (ii) a Tier 1 risk-based capital ratio of 8% (increased from 6%); (iii) a Tier 1 leverage ratio of 5% (unchanged from current rules); and (iv) a CET1 risk-based capital ratio of 6.5%. Accordingly, a financial institution may be considered "well-capitalized" under the prompt corrective action framework, but not satisfy the full phased-in Basel III capital ratios. The Company's regulatory capital ratios and thoserequirements of the Bank were in excess of the levels established for "well-capitalized" institutions under the Basel III Rules as of December 31, 2017.Rules. Generally, a financial institution must be "well-capitalized" before the Federal Reserve Board or the FRB will approve an application by a bank holding company to acquire a bank or merge with a bank holding company. The FDIC applies the same requirement in approving bank merger applications.
A bank that may otherwise meetmeets the minimum requirements to be classified as well-capitalized, adequately capitalized,"well-capitalized," "adequately capitalized" or undercapitalized"undercapitalized" may be treated instead as though it were in the next lower capital category if the appropriate federal banking agency, after notice and opportunity for hearing, determines that an unsafe or unsound condition, or an unsafe or unsound practice, warrants such treatment. Under the prompt corrective action regulations, a bank that is deemed to be undercapitalized"undercapitalized" or in a lesser capital category will be required to submit to its primary federal banking regulator a capital restoration plan and to comply with the plan.
The Bank's regulatory capital restoration plan will be required to provide assurances of compliance by the bank with the capital restoration plan, subject to limitations on the bank holding company's aggregate liabilityratios were in connection with providing such required assurances. Failure to restore capital under a capital restoration plan can result in the bank being placed into receivership if it becomes critically undercapitalized. A bank subject to prompt corrective action also may affect its parent holding company in other ways. These include possible restrictions or prohibitions on dividends or subordinated debt payments to the parent holding company by the bank, as well as limitations on other transactions between the bank and the parent holding company. In addition, the Federal Reserve Board may impose restrictions on the abilityexcess of the bank holding company itself to pay dividends, or require divestiturelevels established for "well-capitalized" institutions as of holding company affiliates that pose a significant risk toDecember 31, 2023. As noted above, as of December 31, 2023, management believes the subsidiary bank, or require divestiture ofBank satisfied all capital adequacy requirements under the undercapitalized subsidiary bank. At each successive lower capital category, an insured bank may be subject to increased operating restrictions by its primary federal banking regulator.Basel III Rules.
State and Federal law provides that a Massachusetts banking company may be "eligible" to submit a notice to the Division and the FDIC to establish a branch within the Commonwealth. A bank is "eligible" to submit a notice to establish a branch in the
Commonwealth if the following conditions are met:if: (i) the bank has received a satisfactory"satisfactory" or higher Community Reinvestment Act (the "CRA")CRA rating at its most recent CRA examination by the Division or federal banking regulator; (ii) the bank is adequately capitalized"adequately capitalized" as defined under the provisions of the Federal Deposit Insurance Act and the FDIC’sFDIC's Capital Adequacy Regulations; and (iii) the bank has not been notified that it is in troubled condition by the Division or any federal banking regulatory agency. A bank must also submitmake an application to the Division and FDIC to relocate or close an existing branch in the Commonwealth.branch. The Division and the FDIC consider a number ofseveral factors when making a decision to approve the notice, including financial condition, capital adequacy, earnings prospects, the needs of the community, and whether competition would be adversely affected.
The Dodd-Frank Act amended the Riegle-Neal Interstate Banking and Branching Efficiency Act of 1994 (the "Riegle-Neal Act"), a bank's ability to branch into a particular state was largely dependent upon whether the state "opted in" to de novo interstate branching. Many states did not "opt-in," which resulted in branching restrictions in those states. The Dodd-Frank Act amended the Riegle-Neal legal framework for interstate branching to permit national banks and state banks to establish branches in any state if that state would permit the establishment of the branch by a state bank chartered in that state. The Bank may, therefore, also establish branches in any other state if that state would permit the establishment of a branch by a state bank chartered in that state. In this case, the Bank would also be required to file an applicationa notice with the Division, the FDIC and potentially the banking authority of the state into which the Bank intends to establish a branch.
Deposit Insurance
The FDIC insures the deposits of federally insured banks, such as the Bank, and thrifts, up to prescribed statutory limits of $250,000 for each depositor, through the DIF and safeguards the safety and soundness of the banking and thrift industries. The amount of FDIC assessments paid by each insured depository institution is based on its relative risk of default as measured by regulatory capital ratios and other supervisory factors.
At least semi-annually, the FDIC will update its loss and income projections for the DIF and, if needed, will increase or decrease assessment rates, following notice-and-comment rulemaking, if required. However, if there are additional bank or financial institution failures or if the FDIC otherwise determines to increase assessment rates, the Bank may be required to pay higher FDIC insurance premiums. Additionally, under the FDIA, the FDIC may terminate deposit insurance upon a finding that the institution has engaged in unsafe and unsound practices, is in an unsafe or unsound condition to continue operations, or has
18
violated any applicable law, regulation, rule, order or condition imposed by the FDIC.
The Bank is generally unable to control the amount of premiums that it is required to pay for FDIC insurance. In connection with the Dodd FrankDodd-Frank Act's requirement that insurance assessments be based on assets, in July 2016, the FDIC redefined its deposit insurance premium assessment base to be an institution's average consolidated total assets minus average tangible equity and revised its deposit insurance assessment rate schedule in lightschedule. Assessments for institutions with assets of this changeless than $10 billion, such as Enterprise Bank, are based on financial measures and supervisory ratings derived from statistical modeling estimating the probability of an institution's failure within three years. The FDIC is considering, and is expected to adopt, a final rule to apply the CBLR framework to the deposit insurance assessment base.system.
On October 18, 2022, the FDIC adopted a final rule applicable to all insured depository institutions increasing initial base deposit insurance assessment rate schedules by 2 basis points, beginning in the first quarterly assessment period of 2023. The FDIC also issued a notice maintaining a DIF reserve ratio of 2.0% for 2023. The increase in assessment rate schedules is intended to increase the likelihood that the DIF reserve ratio reaches the statutory minimum of 1.35% by September 30, 2028, the statutory deadline set by the Dodd-Frank Act. The new assessment rate schedules will update its lossremain in effect unless and income projectionsuntil the DIF reserve ratio meets or exceeds 2.0% in order to support growth in the DIF in progressing toward the FDIC's long-term goal of a 2.0% designated reserve ratio for the DIF and,DIF. FDIC staff may in the future recommend additional assessment rate adjustments if needed, will increase or decrease assessment rates, following notice-and-comment rulemaking, if required. If there are additional bank or financial institution failures or if the FDIC otherwise determines to increase assessment rates, the Bank may be required to pay higher FDIC insurance premiums. Any future increases in FDIC insurance premiums may have a material and adverse effect on the Company's earnings.deemed necessary.
Restrictions on Dividends and Other Capital Distributions
Both Massachusetts and federal law limit the payment of dividends by the Bank. Under FDIC regulations and applicable Massachusetts law, the dollar amount of dividends and any other capital distributions that the Bank may make depends upon its capital position and recent net income. Generally, so long asAny dividend payment that would exceed the Bank remains adequately capitalized, it may make capital distributions during any calendar year equal to up to 100%total of the Bank's net incomeprofits for the current year to date plus its retained net income forprofits of the preceding two preceding years. However,years would require the Massachusetts Division of Banks' approval. The Massachusetts banking statues define the term "net profits" to mean the remainder of all earnings from current operations plus actual recoveries on loans and investments and other assets after deducting from such total all current operating expenses, actual losses, accrued dividends on any preferred stock and all federal and state taxes. Applicable provisions of the FDIA also prohibit a bank from paying any dividends on its capital stock if the bank is in default on the payment of any assessment to the FDIC or if the payment of dividends would otherwise cause the bank to become "undercapitalized." If the Bank's capital becomes impaired or the FDIC or Division otherwise determines that the Bank is in need ofneeds more than normal supervision, the Bank may be prohibited or otherwise limited from paying any dividends or making capital distributions to the Company. Consequently, any other capital distributions.restrictions on the ability of the Bank to pay dividends to the Company may, in turn, restrict the ability of the Company to pay dividends to its shareholders.
Community Reinvestment Act
The Community Reinvestment Act of 1977CRA and the regulations issued thereunder are intended to encourage banks to help meet the credit needs of their entire assessment area, including lowlow- and moderate incomemoderate-income neighborhoods, consistent with the safe and sound operations of such banks. The CRA requires that the FDIC and the Division evaluate the record of each financial institution in meeting such credit needs. The CRA evaluation is also considered by the bank regulatory agencies in evaluating approvals for mergers, acquisitions, and applications to open, relocate or close a branch or facility. Failure to adequately meet the criteria
within CRA guidelines could impose additional requirements and limitations on the Bank. Additionally, the Bank must publicly disclose the ability to request the Bank’sBank's CRA Performance Evaluation and other various related documents. The Bank received a rating of "High Satisfactory" by the Division and "Satisfactory" by the FDIC on its most recent Community Reinvestment ActCRA examination.
On October 24, 2023, the federal banking agencies adopted a final rule to modernize regulations implementing the CRA. Under the final rule, (1) the federal banking agencies will evaluate bank performance across the varied activities they conduct and communities in which they operate in order to encourage banks to expand access to credit, investment, and banking services in low- and moderate-income communities, (2) the CRA regulations are updated to evaluate lending outside traditional assessment areas generated by the growth of non-branch delivery systems, such as online and mobile banking, branchless banking, and hybrid models, (3) a new metrics-based approach was adopted to evaluate bank retail lending and community development financing, using benchmarks based on peer and demographic data, and (4) CRA evaluations and data collection are tailored according to bank size and type. In addition, the final rule also exempts small and intermediate banks from new data collection and reporting requirements that apply to banks with assets of at least $2 billion, such as the Bank, and limits certain new data requirements to large banks with assets greater than $10 billion. Most provisions of the final rule will become effective on January 1, 2026, and the data reporting requirements will become effective on January 1, 2027.
19
Restrictions on Transactions with Affiliates and Loans to Insiders
Transactions between the Bank and its affiliates are subject to the provisions of Section 23A and 23B of the Federal Reserve Act (the "Affiliates Act"), and the Federal Reserve Board's Regulation W, as such provisions are made applicable to state non-member banks by Section 18(i) of the Federal Deposit Insurance Act. Affiliates of a bank include, among other entities, the bank's holding company and companies that are under common control with the bank.
These provisions place limits on the amount of:
the amount of loans or extensions of credit and investment in affiliates; assets that may be purchased; extensions of credit to third parties collateralized by the securities or obligations of affiliates;obligation; and
the guarantee, acceptance or letter of credit issued on behalf of an affiliate.
The total amount of the above transactions is limited in amount, as to any one affiliate, to 10% of the Bank's capital and surplus and, as to all affiliates combined, to 20% of its capital and surplus. In addition to the limitation on the amount of these transactions, each of the above transactions must also meet specified collateral requirements and the types of permissible collateral may be limited. The Bank must also comply with other provisions designed to avoid the purchase or acquisition of low-quality assets from affiliates. The Dodd-Frank Act expanded the scope of Section 23A, which now includes investment funds managed by an institution as an affiliate, as well as other procedural and substantive hurdles.
The Bank is also prohibitedsubject to Section 23B of the Federal Reserve Act which, among other things, prohibits the Bank from engaging in any transaction with an affiliate unless the transaction is on terms substantially the same, or at least as favorable to the Bank or its subsidiaries, as those prevailing at the time for comparable transactions with non-affiliated companies. The Federal Reserve Board has also issued Regulation W which codifies prior regulations under the Affiliates Act and interpretive guidance with respect to affiliate transactions.
Under both Massachusetts and federal law, including Section 22(h) of the Federal Reserve Act and Regulation O promulgated by the Federal Reserve thereunder, the Bank is also subject to restrictions on extensions of credit to its executive officers, directors, principal stockholdersshareholders and their related interests. These extensions of credit (1)(i) must be made on substantially the same terms, including interest rates and collateral, as those prevailing at the time for comparable transactions with third parties, (ii) must follow the credit underwriting procedures at least as stringent as those applicable to comparable transactions with third parties, and (2)(iii) must not involve more than the normal risk of repayment or present other unfavorable features. The Dodd-Frank Act expanded coverageIn addition, these extensions of transactionscredit may not exceed, together with all other outstanding loans to such persons and affiliated entities, the Bank's total capital and surplus. Any extension of credit to insiders by including credit exposure arising from derivative transactions (which are also covered byabove specified amounts must receive the expansionprior approval of Section 23A). The Dodd-Frank Act prohibits an insured depository institution from purchasingthe Bank's board of directors. Any violation of these restrictions may result in the assessment of substantial civil monetary penalties on the Bank or selling an asset to an executiveany officer, director, employee, agent or principal stockholder (or any related interest of such a person) unlessother person participating in the transaction is on market terms, and, if the transaction exceeds 10%conduct of the institution's capital, it is approved in advance by a majorityaffairs of the disinterested directors.Bank, the imposition of a cease-and-desist order, and other regulatory sanctions.
Concentrated Commercial Real Estate Lending Regulations
The federal banking agencies, including the FDIC, have promulgated guidance governing financial institutions with concentrations in commercial real estate lending. The guidance provides that a bank has a concentration in commercial real estate lending if (i) total reported loans for construction, land development, and other land represent 100% or more of total capital or (ii) total reported loans secured by multifamily and non-farm nonresidential properties (excluding loans secured by owner-occupied properties) and loans for construction, land development, and other land represent 300% or more of total capital and the bank's commercial real estate loan portfolio has increased 50% or more during the prior 36 months. If a concentration is present, management must employ heightened risk management practices that address the following key elements: including board and management oversight and strategic planning, portfolio management, development of underwriting standards, risk assessment and monitoring through market analysis and stress testing, and maintenance of increased capital levels as needed to support the level of commercial real estate lending. OnAs of December 18, 2015,31, 2023, the federal banking agencies jointly issued a "Statement on Prudent Risk Management for Commercial Real Estate Lending" reminding banksBank's concentrations of the need to engage in risk management practices for commercial real estate lending.loans fell slightly above the established levels and the Company believes its credit risk administration to be consistent with heightened risk management regulatory guidance.
The Dodd-Frank Wall Street Reform and Consumer Protection Act
20
On May 24, 2018, the EGRRCPA was enacted, which repeals or modifies certain provisions of the Dodd-Frank Act and eases regulations on all but the largest banks. The EGRRCPA's provisions—for which banking agencies have now issued certain corresponding guidance documents and/or proposed or final rules—include, among other things: (i) creating a more targeted financial reform bill. Accordingly,new category of "qualified mortgages" presumed to satisfy ability-to-repay requirements for loans that meet certain criteria and are held in portfolio by banks with less than $10 billion in assets; (ii) not requiring appraisals for certain transactions valued at less than $400,000 in rural areas; (iii) exempting banks that originate fewer than 500 open-end and 500 closed-end mortgages from the Home Mortgage Disclosure Act's expanded data disclosures; (iv) clarifying that, subject to various conditions, reciprocal deposits of another depository institution obtained using a deposit broker through a deposit placement network for purposes of obtaining maximum deposit insurance would not be considered brokered deposits subject to the FDIC's brokered-deposit regulations; and (v) simplifying capital calculations by requiring regulators to establish for institutions under $10 billion in assets a community bank leverage ratio (Tier 1 capital to average consolidated assets) at a percentage not less than 8% and not greater than 10% that such institutions may elect to replace the general applicable risk-based capital requirements for determining well-capitalized status. For those regulations that have been implemented, most will have little to no impact on the Company. However, the Company may be impacted by future agency rulemaking in connection with implementation of the EGRRCPA and it is difficult to anticipate the continued impact this expansive legislation willmay have on the Company, its customers and the financial industry generally. To
For more information on the extentEGRRCPA, please see the Dodd-Frank Act remains in place or is not materially amended, it is likely to continue to increase the Company's cost of doing business, limit the Bank's permissible activities,following sections "Permissible Activities," "Community Bank Leverage Ratio," and affect the competitive balance within the industry"Concentrated Commercial Real Estate Lending Regulations," above, and market."Consumer Financial Protection Bureau" and "HMDA," below.
Consumer Financial Protection Bureau
The Consumer Financial Protection BureauCFPB was created under the Dodd-Frank Act to centralize responsibility for consumer financial protection with broad rulemaking, supervision and enforcement authority for a wide range of consumer protection laws that would apply to all banks and thrifts, including the Equal Credit Opportunity Act, Truth-in Lending Act, ("TILA"), Real Estate Settlement Procedures Act, ("RESPA"), Fair Credit Reporting Act, Fair Debt Collection Act, the Consumer Financial Privacy provisions of the Gramm-Leach-Bliley Act and certain other statutes. Significant recent CFPB developments include:
•continued focus on fair lending, including promoting racial and economic equity for underserved, vulnerable and marginalized communities;
•focused efforts on enforcing certain compliance obligations the CFPB deems a priority, such as automobile loan servicing, debt collection, deposit, overdraft, non-sufficient funds, representment fees and other services fees, mortgage origination and servicing, and remittances, among others; and
•rulemaking plans concerning, among others, consumers' access to their financial information and requirements for financial institutions to collect, report and make public certain information concerning credit applications made by women-owned, minority-owned and small businesses.
Banking institutions with total assets of $10 billion or less, such as the Bank, remain subject to the supervision and enforcement of their primary federal banking regulator with respect to the federal consumer financial protection laws and such additional regulations as may be adopted by the CFPB.
The Dodd-Frank Act implemented significant increases in the regulation of January 1, 2016mortgage lending and continuing in 2017, the small creditor exemption was extended toservicing by banks with assets under $2.052 billion. As the Bank's assets are above $2.052 billion, the Bank does not meet this exemption.
21
designed by the CFPB issued the Know Before You Owe TILA/RESPA Integrated Disclosure Rule ("TRID"), which combined the disclosures required under TILAto monitor their operations; (iii) mandates of comprehensive additional and sections 4 and 5 of RESPA, into a single, integrated disclosure forenhanced residential mortgage loan transactions covered by those laws. TRID, which requires the use of a Loan Estimate that must be delivered or placed in the mail no later than the third business day after receiving the consumer’s application and a Closing Disclosure that must be provided to the consumer at least three business daysrelated disclosures, both prior to consummation, became effectiveloan origination and after; and (iv) mandates of additional appraisal practices for applications received on or after October 3, 2015, for applicable closed-end consumer credit transactionsloans secured by real property. TRID also has changedresidential dwellings, including potential additional appraisals at the scope of transactions applicable, and adjusted the tolerance requirements and record retention requirements.banks cost.
Home Mortgage Disclosure Act ("HMDA")
On October 15, 2015, pursuant to sectionSection 1094 of the Dodd-Frank Act, the CFPB issued amended rules in regardsregard to the collection, reporting and disclosure of certain residential mortgage transactions under the Home Mortgage Disclosure Act (the "HMDA Rules"). The Dodd-Frank Act mandated additional loan data collection points in addition to authorizing the Bureau to require other data collection points under implementing Regulation C. Most of the provisions of the HMDA Rule go into effect on January 1, 2018 and apply to data collected in 2018 and reporting in 2019 and later years. The HMDA Rule adoptsRules adopted a uniform loan volume threshold for all financial institutions, modifies the types of transactions that are subject to collection and reporting, expands the loan data information being collected and reported, and modifies procedures for annual submission and annual public disclosures. EGRRCPA amended provisions of the HMDA Rules to exempt certain insured institutions from most of the expanded data collection requirements required of the Dodd-Frank Act. The CFPB further amended the HMDA Rules in April 2020 so that, effective January 1, 2022, institutions originating fewer than 100 dwelling secured closed-end mortgage loans or fewer than 200 dwelling secured open-end lines are exempt from the expanded data collection requirements. On February 1, 2023, the Office of the Comptroller of the Currency issued OCC Bulletin 2023-5 which clarified that, following a recent court decision vacating the 2020 HMDA Final Rule as to the loan volume reporting threshold for closed-end mortgage loans, the loan origination threshold for reporting HMDA data on closed-end mortgage loans reverted to the 25 loan threshold established by the 2015 HMDA Final Rule. The Bank does not receive this reporting relief based on the number of dwellings secured mortgage loans reported annually.
UDAP and UDAAP
Banking regulatory agencies have increasingly used a general consumer protection statute to address "unethical""unfair," "deceptive" or otherwise "bad""abusive" acts and business practices that may not necessarily fall directly under the purview of a specific banking or consumer finance law. The law of choice for enforcement against such business practices has been Section 5 of the Federal Trade Commission Act, referred to as the FTC Act, which is the primary federal law that prohibits unfair or deceptive acts or practices, referred to as UDAP, and unfair methods of competition in or affecting commerce. "Unjustified consumer injury" is the principal focus of the FTC Act. Prior to the Dodd-Frank Act, there was little formal guidance to provide insight to the parameters for compliance with UDAP laws and regulations. However, UDAP laws and regulations have beenwere expanded under the Dodd-Frank Act to apply to "unfair, deceptive or abusive acts or practices," referred to as UDAAP which have beenand were delegated to the CFPB for rule-making.rulemaking. The federal banking agencies have the authority to enforce such rules and regulations. Under the Dodd-Frank Act, CFPB looks to various factors to assess whether an act or practice unfair, including whether it causes or is likely to cause substantial injury to consumers, the injury is not reasonably avoidable by consumers, and the injury is not outweighed by countervailing benefits to consumers or to competition. A key focus of CFPB is whether an act or practice hinders a consumer's decision-making.
Incentive Compensation
In June 2010, the Federal Reserve Board, the Office of the Comptroller of the Currency and the FDIC issued comprehensive final guidance on incentive compensation policies intended to ensure that the incentive compensation policies of banking organizations do not undermine the safety and soundness of such organizations by encouraging excessive risk-taking. The guidance, which covers all employees that have the ability to materially affect the risk profile of an organization, either individually or as part of a group, is based upon the key principles that a banking organization’sorganization's incentive compensation arrangements should (i) provide incentives that do not encourage risk-taking beyond the organization’sorganization's ability to effectively identify and manage risks, (ii) be compatible with effective internal controls and risk management, and (iii) be supported by strong corporate governance, including active and effective oversight by the organization’sorganization's board of directors.
The Federal Reserve Board will review, as part of the regular, risk-focused examination process, the incentive compensation arrangements of banking organizations, such as the Company, that are not "large, complex banking organizations." The findings of the supervisory initiatives will be included in reports of examination. Enforcement actions may be taken against a banking organization if its incentive compensation arrangements, or related risk-managementrisk management control or governance processes,
pose a risk to the organization’sorganization's safety and soundness and the organization is not taking prompt and effective measures to correct the deficiencies.
In addition, publicly traded companies are required by the SEC to give stockholdersshareholders a non-binding vote on executive compensation at least every three years and on so-called "golden parachute" payments in connection with approvals of mergers and acquisitions unless previously voted on by stockholders.shareholders. Also, certain publicly traded companies will beare required to disclose
22
the ratio of the compensation of its chief executive officer (CEO)their CEO to the median compensation of its employees. These companies will be required to provide disclosure of their pay ratios for their first fiscal year beginning on or after January 1, 2017.The Company addresses these votes and disclosures in its annual Proxy Statement.
The Dodd-Frank Act directs the federal banking regulators to promulgate rules prohibiting excessive compensation paid to executives of depository institutions and their holding companies with assets in excess of $1 billion, regardless of whether the company is publicly traded or not. In May 2016, the federal banking regulators, joined by the SEC, proposed such a rule that is tailored based on the asset size of the institution. All covered financial institutions would be subject to a prohibition on paying compensation, fees, and benefits that are "unreasonable" or "disproportionate" to the value of the services performed by a person covered by the proposed rule (generally, senior executive officers and employees who are significant risk-takers). Moreover,As of the proposeddate of this Form 10-K, the federal banking regulators have not yet implemented a final rule includes a new requirement which provides that an incentive-basedwith respect to excessive compensation arrangement must (i) include financialpaid to executives of depository institutions and non-financial measures of performance, (ii) be designed to allow non-financial measures of performance to override financial measures of performance, when appropriate (so called safety and soundness factors), and (iii) be subject to adjustment to reflect actual losses, inappropriate risk taking, compliance deficiencies, or other measures or aspects of financial and non-financial performance.their holding companies. Finally, the Dodd-Frank Act gives the SEC authority to prohibit broker discretionary voting on elections of directors and executive compensation matters.
In August 2022, the SEC adopted the final "pay-for-performance" rule mandated by the Dodd-Frank Act. Among other disclosure requirements, the rule requires companies to disclose the relationships among named executive officer compensation "actually paid," total shareholder return and certain financial performance measures that the company uses to link compensation to company performance for its five most recent fiscal years. The rule first applied to disclosures in the Company's proxy statement for the 2023 annual meeting of shareholders.
In October 2022, the SEC adopted a final rule directing national securities exchanges and associations, including the NASDAQ, to implement listing standards that require listed companies to adopt policies mandating the recovery or "clawback" of excess incentive-based compensation earned by a current or former executive officer during the three fiscal years preceding the date the listed company is required to prepare an accounting restatement, including to correct an error that would result in a material misstatement if the error were corrected in the current period or left uncorrected in the current period. In accordance with Rule 10D-1 promulgated by the SEC under the Exchange Act and Nasdaq Listing Rule 5608, the Compensation and Human Resources Committee of the Board of Directors adopted and implemented an Incentive Award Recoupment Policy, effective as of October 2, 2023. The Incentive Award Recoupment Policy can be found within Item 15, "Exhibits, Financial Statement Schedules," of this Form 10-K.
Technology Risk Management and Consumer Privacy
State and federal banking regulators have issued various policy statements emphasizing the importance of technology risk management and supervision in evaluating the safety and soundness of depository institutions with respect to banks that contract with third-party vendors to provide data processing and core banking functions. The use of technology-related products, services, delivery channels and processes exposesexpose a bank to various risks, particularly operational, privacy, cyber and information security, strategic, reputation and compliance risk. Banks are generally expected to prudently manage technology-related risks as part of their comprehensive risk management policies by identifying, measuring, monitoring and controlling risks associated with the use of technology.
Under Section 501 of the Gramm-Leach-Bliley Act, and its implementing regulations, the federal banking agencies have established appropriate standards for financial institutions regarding the implementation of safeguards to protect the security and confidentiality of customer records and information, protection against any anticipated threats or hazards to the security or integrity of such records and protection against unauthorized access to or use of such records or information in a way that could result in substantial harm or inconvenience to a customer. Among other matters, theUnder these rules, require each bankall financial institutions are required to implement a comprehensive written information security program that includes administrative, technical and physical safeguards relating to customer information. In addition, Massachusetts has established Standards for the Protection of Personal Information which create minimum standards to be met in connection with the safeguarding of personal information and outline the content and timing of disclosures required following a system breach or compromise.
Beginning on May 1, 2022, a bank holding company, such as the Company, and an FDIC-supervised depository institution, such as the Bank, are required to notify the Federal Reserve or FDIC, respectively, as soon as possible and no later than 36 hours after a determination that a computer-security incident that rises to the level of a notification incident has occurred.
On July 26, 2023, the SEC adopted final rules that require public companies to promptly disclose material cybersecurity incidents in a Current Report on Form 8-K and detailed information regarding their cybersecurity risk management, strategy, and governance on an annual basis in its Annual Reports on Form 10-K. Companies are required to report on Form 8-K any cybersecurity incident they determine to be material within four business days of making that determination.
23
Under the Gramm-Leach-Bliley Act, aall financial institution must also provide its customers with a notice of privacy policies and practices. Section 502 prohibits a financial institution from disclosing nonpublic personal information about a customer to non-affiliated third parties unless the institution satisfies various notice and opt-out requirements and the customer has not elected to opt out of the disclosure. Under Section 504, the agencies are authorized to issue regulations as necessary to implement notice requirements and restrictions on a financial institution's ability to disclose nonpublic personal information about customers to non-affiliated third parties. Under the final rule the regulators adopted, all banksinstitutions must develop initial and annual privacy notices which describethat are provided to its customers describing in general terms, the bank's information sharing practices. Banks that share nonpublic personal information about customers withpractices to affiliated and non-affiliated third parties must also provide customers with anand the customer's ability to opt-out notice and a reasonable period of time for the customer to opt out of any such disclosure (with certain exceptions).information sharing practices. Limitations are placed on the extent to which a bank can disclose an account number or access code for credit card, deposit or transaction accounts to any nonaffiliatedunaffiliated third-party for use in marketing.
Bank Secrecy Act, and Anti-Money Laundering Initiatives and USA PATRIOT Act
Our Company and the Bank are also subject to the Bank Secrecy Act, as amended by the USAUniting and Strengthening America by Providing Appropriate Tools Required to Intercept and Obstruct Terrorism Act of 2001 (the "USA PATRIOT Act") and as further amended by the National Defense Authorization Act for Fiscal Year 2021 (the "National Defense Authorization Act"), which gives the federal government powers to address money laundering and terrorist threats through enhanced domestic security measures, expanded surveillance powers, and mandatory transaction reporting obligations. The Bank Secrecy Act imposesand USA PATRIOT Act impose an affirmative obligation on the Bank to establish an anti-money laundering program designed to monitor and prohibit against certain transactions and account relationships, create due diligence standards for "know your customer;" regularly compare customer lists against lists of suspected terrorists, terrorist organizations and money launderers; report currency transactions that exceed certain thresholdsthresholds; and to report other transactions determined to be suspicious. Financial institutions must take reasonable steps to conduct enhanced scrutiny of account relationships to guard against money laundering and to report any suspicious information maintained by financial institutions. The Bank Secrecy Act requires that all banking institutions develop and provide for the continued administration of a program reasonably designed to assure and monitor compliance with certain record-keeping and reporting requirements regarding both domestic and international currency transactions. These programs must, at a minimum, provide for a system of internal controls to assure ongoing compliance, provide for independent testing of such systems and compliance, designate individuals responsible for such compliance and provide appropriate personnel training.
The FinCEN issued a final rule regarding customer due diligence requirements for covered financial institutions in connection with their Bank Secrecy Act and Anti-Money Laundering policies.policies, that became effective in May 2018. The final rule adds a requirement to understand the nature and purpose of customer relationships and identify the "beneficial owner" (25% or more ownership interest) of legal entity customers. Bank regulators routinely examine institutions for compliance with these obligations and they must consider an institution's anti-money laundering compliance when considering regulatory applications filed by the institution, including applications for bank mergers and acquisitions. The formal implementation date is May 11, 2018.regulatory authorities have imposed "cease-and-desist" orders and civil money penalty sanctions against institutions found to be violating these obligations.
Further, on January 1, 2021, Congress passed the National Defense Authorization Act, which enacted the most significant overhaul of the Bank Secrecy Act and Know-Your-Customer
On September 29, 2022, FinCEN issued a final rule establishing a beneficial ownership information reporting requirement, pursuant to the CTA. The rule requires most corporations, limited liability companies, and other entities created in or registered to do business in the United States to report information about their beneficial owners-the persons who ultimately own or control the company, to FinCEN. On December 22, 2023, FinCEN issued a final rule regarding access by authorized recipients to beneficial ownership information that will be reported to FinCEN pursuant to Sec. 6403 of the CTA, which is part of the NDAA. The regulations implement strict protocols required by the CTA to protect sensitive personally identifiable information reported to FinCEN and establish the circumstances in which specified financial transactionsrecipients have access to beneficial ownership information, along with data protection protocols and account relationships,oversight mechanisms applicable to each recipient category. The disclosure of beneficial ownership information to authorized recipients in accordance with appropriate protocols and oversight
24
will help law enforcement and national security agencies prevent and combat money laundering, terrorist financing, tax fraud, and other illicit activity, as well as enhanced due diligence and "know your customer" standards intended to detect, and prevent, the use of the United States financial system for money laundering and terrorist financing activities. The USA Patriot Act requires financial institutions, including banks, to establish anti-money laundering programs, including employee training and independent audit requirements, meet minimum standards specified by the act, follow minimum standards for customer identification and maintenance of customer identification records, and regularly compare customer lists against lists of suspected terrorists, terrorist organizations and money launderers.protect national security.
Other Operations and Consumer Compliance Laws
The Bank must comply with numerous other federal anti-money laundering and consumer protection statutes and implementimplementing regulations, including but not limited to the Truth in Savings Act, Electronic Funds Transfer Act, Expedited Funds Availability Act, the Community Reinvestment Act, the Equal Credit Opportunity Act, the Federal Housing Act, the National Flood Insurance Act and various other federal and state privacy protection laws. Failure to comply in any material respect with any of these laws could subject the Bank to lawsuits and could also result in administrative penalties, including fines and reimbursements. The Company and the Bank are also subject to federal and state laws prohibiting unfair or fraudulent business practices, untrue or misleading advertising and unfair competition. These laws and regulations mandate certain disclosure requirements and regulate the manner in which financial institutions must deal with customers when taking deposits, making loans, collecting loans, and providing other services. Failure
Environmental Laws Potentially Impacting the Bank
We are subject to comply in any material respect with any of thesestate and federal environmental laws and regulations could subjectregulations. The CERCLA is a federal statute that generally imposes strict liability on all prior and present "owners and operators" of sites containing hazardous waste. However, Congress acted to protect secured creditors by providing that the Bank to various penalties, including but notterm "owner and operator" excludes a person whose ownership is limited to enforcement actions, injunctions, finesprotecting its security interest in the site. Since the enactment of the CERCLA, this "secured creditor exemption" has been the subject of judicial interpretations which have left open the possibility that lenders could be liable for cleanup costs on contaminated property that they hold as collateral for a loan, which costs often substantially exceed the value of the property.
Other Pending and Proposed Legislation
From time to time, various legislative and regulatory initiatives are introduced in Congress, as well as by regulatory agencies. Such initiatives may include proposals to expand or criminal penalties, punitive damagescontract the powers of bank holding companies and depository institutions or proposals to consumers,substantially change the financial institution regulatory system. Such legislation could change banking statutes and the lossoperating environment of certain contractual rights.the Company or Bank in substantial and unpredictable ways. If enacted, such legislation could increase or decrease the cost of doing business, limit or expand permissible activities or affect the competitive balance among banks, savings associations, credit unions, and other financial institutions. The Company cannot predict whether any such legislation will be enacted, and, if enacted, the effect that it, or any implementing regulations, would have on the financial condition or results of operations of the Company. A change in statutes, regulations or regulatory policies applicable to the company or our subsidiaries could have a material effect on the Company's business, financial condition, and results of operations.
The Company maintains a Compliance Management Program designed to meet regulatory and legislative requirements. See alsoKey Risk Areas, below under the heading "Risk Management Framework."
Risk Management Framework
In addition to the risks discussed below, numerous other factors that could adversely affect the Company's future results of operations and financial condition, and its reputation and business model are addressed in Item 1A, "Risk Factors," of this Form 10-K. This Risk Management Framework discussion should be read in conjunction with Item 1A and "OpportunitiesItem 1C, "Cybersecurity," of this Form 10-K.
Management utilizes a comprehensive enterprise risk management framework that enables a coordinated and Risks" includedstructured approach for identifying, assessing, and managing risks across the Company and provides reasonable assurance that management has the tools, programs, people, and processes in place to support informed decision making, anticipate risks before they materialize and maintain the Company's risk profile consistent with its strategic planning, and applicable laws and regulations.
These risks, and the decisions related thereto, include, but are not limited to: credit risk, market and interest rate risk, liquidity management, capital risk, information technology and cybersecurity risk, legal and regulatory compliance risk, corporate governance, internal control over financial reporting, reputational risk, strategic risk, compensation risk, physical
25
security, loss and fraud prevention, policy reviews, third-party risk management (direct and indirect vendors) and contract management, business continuity and succession planning, and short and long-term capital projects and facility planning.
The Company promotes proactive risk management by all Enterprise employees with clear ownership and accountability. Managers in each line of business have responsibility for identifying, assessing, and managing the risks in their areas. The Risk Management department is responsible for providing guidance, oversight, and input on remediation to business lines to provide reasonable assurance that risk assessments and mitigating controls and procedures are properly designed and functioning within their areas. The Risk Management department also independently monitors operational risk, including information security, third-party risk management, disaster recovery and business continuity planning. Periodically, management reports and risk assessments are provided to the Board or its committees relating to the Bank's risk profile and the adequacy of the risk management program. In addition, the Internal Audit department, which is independent of management, through reviews and testing, confirms appropriate risk management controls, processes and systems are in place and functioning effectively.
The Company also maintains a package of commercial insurance policies with national insurers, which provides for a broad range of insurance coverage for a variety of risk factors, at levels deemed appropriate by management. Insurance policies are reviewed annually, or as circumstances change, by management for necessary updates and adjustments in coverage, in addition to reviews by an independent third-party and the Audit Committee of the Board.
Key Risk Areas
Operational risk includes the threat of loss from inadequate or failed internal processes, people, systems, or external events, due to, among other things: fraud or error; the inability to deliver products or services; failure to maintain a competitive position; lack of, or insufficient information security, cybersecurity, or physical security; inadequate procedures or controls followed by third-party service providers; or violations of ethical standards. In addition to ongoing employee training, and employee and customer awareness campaigns, controls to manage operational risk include, but are not limited to, technology administration, cyber and information security, third-party risk management, and disaster recovery and business continuity planning.
The Company's technology administration includes policies and guidelines for the design, procurement, installation, management and acceptable use of hardware, software, and network devices as well as third-party hosted and cloud-based solutions. The Company's project management standards are designed to provide risk-based oversight, coordinate and communicate ideas, and to prioritize and manage project implementation in a manner consistent with corporate objectives.
Information Security, third-party risk management, cybersecurity governance and the incident response plan are reviewed in detail in Item 1C, "Cybersecurity Risk Management and Strategy," of this Form 10-K, below. The Technology & Information Security Committee of the Board oversees the technology and cybersecurity strategies and their alignment with business strategies. The Committee also oversees the effectiveness of the information security program and monitors the results of third-party testing and risk assessments and responses to breaches of customer data, among other project management, cybersecurity governance, and business continuity oversight functions.
The Company's Disaster Recovery and Business Continuity Program combined with the Company's Pandemic Plan (the "plans") provide the information and procedures required to enable a rapid recovery from an occurrence that would disable the Company's operations for an extended period, due to circumstances such as: loss of personnel; loss of data and/or loss of access to, or the physical destruction or damage of facilities, infrastructure or systems; or denial of access to our systems or information by outside parties. The plans, which are reviewed annually, establish responsibility for assessing a disruption of business, contains alternative strategies for the continuance of critical business functions during an emergency, assigns responsibility for restoring services, and sets recovery point and time objectives by which critical services will be restored. A bank-owned and maintained secondary data center location provides the Company with back-up network processing capabilities if needed.
The Company maintains a CMP designed to meet regulatory and legislative compliance requirements. The CMP provides a framework for tracking and implementing regulatory changes, monitoring the effectiveness of policies and procedures, conducting compliance risk assessments, managing customer complaints, and educating employees in matters relating to regulatory compliance. The Audit Committee of the Board oversees the effectiveness of the CMP.
Credit risk management is reviewed in detail in Item 7, "Management's Discussion and Analysis of Financial Condition and
26
Results of Operations," in the section entitled "Overview,"Loans," whichunder the heading "Credit Risk" of this Form 10-K. The Loan Committee of the Board oversees the effectiveness of credit risk management.
Liquidity management is containedreviewed in Item 7, "Management’s"Management's Discussion and Analysis of Financial Condition and Results of Operations," in the section entitled "Financial Condition" under the heading "Liquidity" of this Form 10-K.
Interest rate risk is reviewed in detail under Item 7A, "Quantitative and Qualitative Disclosures About Market Risk," of this Form 10-K below. The Board of Directors oversees the Company's asset–liability management, which includes managing interest rate risk and liquidity.
For information regarding capital planning, current capital framework requirements applicable to the Company and the Bank and their respective capital levels at December 31, 2023, see the section within Item 1, "Business," entitled "Capital Resources" and the sections within "Supervision and Regulation" entitled "Capital Requirements" and "Capital Requirements under Basel III" and for further discussionthe Bank "Capital Adequacy Requirements" of this Form 10-K and also see Note 12, "Shareholders' Equity," to the consolidated financial statements contained in Item 8, "Financial Statements and Supplementary Data," of this Form 10-K.
The Company maintains a set of internal controls over financial reporting designed to provide reasonable assurance to management that the information required to be disclosed in reports it files with or furnishes to the SEC is prepared and fairly presented based on how new lawsproperly recorded, processed, and regulationssummarized information. The Audit Committee of the Board oversees the effectiveness of the internal control over financial reporting. See Item 9A, "Controls and Procedures," of this Form 10-K, below, for management's reports on its evaluation of disclosure controls and internal control over financial reporting.
Any system of controls or contingency plan, however well designed and operated, is based in part on certain assumptions and has inherent limitations and may affectnot prevent or detect all risks, and therefore can provide only reasonable, not absolute, assurances that the Company’s business, financial condition and resultsobjectives of operations.the system are met. An overview of these risks, among others, related to the Company are outlined in Part I, Item 1A, "Risk Factors," in this Form 10-K, below.
Item 1A.Risk Factors
An investment in the Company’sCompany's common stock is subject to a variety of risks and uncertainties including, without limitation, those set forth below, any of which could cause the Company's actual results to vary materially from recent results or from the other forward lookingforward-looking statements that the Company may make from time to time in news releases, annualperiodic reports and other written or oral communications. The materialThis Form 10-K is qualified in its entirety by these risk factors.
Realization of any of the risks outlined in the following sections, the Company's inability to identify, respond and uncertainties that management believes may affectcorrect a
breakdown in the Company are described below. These risksintegrity of the design or functioning of the Company’s internal controls and uncertainties are not listed in any particular order of priority and are not necessarily the only ones facing the Company. Additionalcontingency plan, or additional risks and uncertainties that management is not aware of, or focused on or that managementmay currently deemsdeem immaterial, may also impair the Company’sCompany's business in a variety of ways, including, but not limited to, any one or a combination of the following consequences: loss of assets; an interruption in the ability to conduct business and process transactions; loss of customer business; loss of key personnel; expose customers' personal information to unauthorized parties; additional regulatory scrutiny and potential enforcement actions and/or penalties against the Company or the Bank; damage the Company's reputation; expose the Company to civil litigation and possible financial liability; result in unanticipated charges against capital; increase operational costs; decrease revenue; restrict funding sources, which could adversely impact the Company's ability to meet cash needs; force the Company to liquidate investments or other assets; limit growth and branch network expansion; close locations or reduce staffing; or limit permissible activities. As a result, the Company's overall business, financial condition, and results of operations.
The Company’s Profitability Depends Significantly on Economic Conditionsmaterial risks and uncertainties that management believes may affect the Company are outlined below. These risks and uncertainties are not listed in any order of priority and are not necessarily the Company’s Primary Market Areasonly ones facing the Company.
27
RISK MANAGEMENT CONTROLS
Risk Management Controls and Procedures Could Fail or Be Circumvented
Management regularly reviews and updates the Company's internal controls, corporate governance policies, Information Security Program, compensation policies, Code of Business Conduct and Ethics and security controls to prevent and detect errors and potential monetary losses, loss of confidential information and data, denial of service attacks and loss of physical assets by theft, malicious destruction or damage, fraud, or robbery from both internal and external, physical or cyber sources.
The Company’s success depends principally onCompany is at risk of ineffective design of internal controls, any circumvention of the Company's internal controls and procedures, whether intentional or unintentional, or failure to comply with regulations related to controls and procedures, or failure to adequately execute controls and procedures, whether by employees, management, directors, or external elements, or any illegal activity conducted by a Bank customer or employee.
ECONOMICS & FINANCIAL MARKETS
The Company's financial results are impacted by the general economic conditions of the United States and the primary market areas in which the Company operates. The local economic conditions in these regions have a significant impact on the demand for the Company’s products and services, as well as the ability of the Company’s customers to repay loans, the value of the collateral securing loans and the stability of the Company’s deposit funding sources.
Any weakening in general economic conditions in the United States or the New England region, or anya long-term deterioration of national and global economies, as well as any possible subsequent effects of negative trends, could weaken the regional economy, and have long-term adverse consequences onthe local industries, employment levels, foreclosure rates and commercial real estate values, whichimpact of worsening national economic conditions or continued geopolitical instability could negatively impact the Company’s business, financial condition, capital position, liquidity, and performance in a variety of ways. Potential adverse effects on the Company could include the following: continued downward pressure on its net interest margin; deterioration in its asset quality; a decline in the underlying values of commercial and residential real estate collateral; an increased level of loan delinquencies; an increase in the level of its allowance for loan losses; a decline in the value of its investment portfolio; unanticipated charges against capital; restrictions on funding sources, which could adversely impact the Company’s ability to meet cash needs; and a decline in the market price of the Company’s common stock.results.
The Company is Subject to Interest Rate Risk
The Company’sCompany's earnings and cash flows are largely dependent upon its net interest income, meaning the difference, or spread, between interest income earned on interest-earning assets and interest expense paidpaid. Changes in market interest rates may affect the rates on interest-bearing liabilities. The re-pricing frequencyour loan, investment and magnitude ofdeposit products at differing speeds in both time and scale, which could negatively impact the Company’s assetsdemand for bank products and liabilities are not identical, and therefore subjectnet interest margin. Our net interest margin may decrease even if the Company toFederal Reserve Bank lowers the risk of adverse changes infederal funds rate interest rates.rate. Interest rates are highly sensitive to many factors that are beyond the Company’sCompany's control, including competition from both banks and non-bank financial service providers, the monetary policy of the federal government,Federal Reserve, inflation and deflation, and volatility of domestic and global financial markets volatilitydue to any number of credit markets, and competition. If thefactors including, among other things, widening geopolitical tensions. The current environment of elevated interest rates paidcould continue to increase our funding costs and negatively impact our net interest margin and our asset-liability management strategies for funding loan growth.
The Company is subject to Inflation and Deflation Risks
Unlike an industrial company, virtually all assets and liabilities of the Company are monetary in nature. As a result, interest rates, which are impacted by inflation, have a more significant impact on interest-bearing deposits and other liabilities increase at a faster rate or magnitudethe Company's performance than the general level of inflation. Interest rates do not necessarily move in the same direction, or at the same magnitude, as the prices of other goods and services impacted by inflation.
The ongoing inflationary environment in the United States and our market areas has resulted in higher interest rates receivedand increased interest rate risk as our interest earning asset yields are generally longer in duration and therefore reprice less quickly than our interest-bearing liabilities (only 13% of deposits are certificates of deposit). The risks to our business from inflation depend on loansthe durability of the current inflationary pressures in our markets. Persistent inflation could lead to tighter-than-expected monetary policy and other investments,higher interest rates, which could slow loan growth and increase cost of funds for the Company’sCompany, reduce net interest income,margin and therefore earnings,profitability, lower asset prices and weaken economic activity. Conversely a prolonged period of deflation may also lead to a deterioration in economic conditions in the United States and our markets causing stress on commercial customers and unemployment, which could beresult in an increase in loan delinquencies and non-performing assets, decreases in loan collateral values and a decrease in demand for our products and services, all of which, in turn, would adversely affected. Earnings could also be adversely affected if the interest rates received on loansaffect our business, financial condition and other investments fall more quickly or steeply than falling interest rates paid on interest-bearing liabilities.results of operations.
The Company's Investment Portfolio Could Incur Losses or Fair Value Could Deteriorate
There are inherent risks associated with the Company's investment activities. These risks include the impact from changes in interest rates, credit risk related to weakness in real estate values, municipalities, government sponsored enterprises, or other industries, the Company’s managementimpact of changes in income tax rates on the value of tax-exempt securities, adverse changes in regional or national economic conditions, and general turbulence in domestic and foreign financial markets, among other
28
things. These conditions could adversely impact the ultimate collectability of the Company's investments.
If an investment's value is in an unrealized loss position, the Company is required to assess the security to determine if a valuation allowance for the credit exposure of the debt security is necessary, which, if necessary, is recorded as a charge to earnings.
Higher market interest rate risk.rates have resulted in unrealized losses on the Company's fixed income bond portfolio. If market interest rates continue to rise, the fair value of the fixed income bond portfolio will decrease, resulting in additional unrealized losses, and depending on the extent of the rise in interest rates, the increase in unrealized losses could be significant. The non-credit portion of unrealized losses are recorded to AOCI, a component of Shareholders' Equity. A significant increase in market rates may have a negative impact on the Company's book value per common share. The Company's bond portfolio is expected to mature at par and therefore the unrealized losses in the portfolio that result from higher market interest rates will decrease as the bonds become closer to maturity. However, if the Company were required to sell investment securities with an unrealized loss for any reason, including liquidity needs, the unrealized loss would become realized and reduce both net income for the reported period and regulatory capital, which as currently reported, excludes unrealized losses on investment securities.
The Potential for Bank Failures and any Related Negative Impact on Customer Confidence in the Safety and Soundness of the Banking Industry may Adversely Affect our Business.
If other financial institutions experience severe financial difficulties, it could result in an adverse impact on the regional banking industry, generally, and the business environment in which the Company operates. Regional bank failures or failure of confidence in the financial industry generally, could result in significant market volatility among publicly traded bank holding companies which may cause uncertainty in the investor community, generally.
This uncertainty may negatively impact customer confidence in the safety and soundness of the banking system and, as a result, the Company's customers may choose to withdraw some or all of their deposited funds, which could have a materially adverse impact on our liquidity, cost of funding, loan growth, net interest margin, capital and results of operations. In addition, advances in technology have increased the speed at which deposits can be moved, as well as the speed and reach of media attention, including social media, and its ability to disseminate concerns or rumors, in each case potentially exacerbating liquidity concerns.
LIQUIDITY
Deposit Outflows May Increase Reliance on Borrowings and Brokered Deposits as Sources of Funds
The Company has traditionallyhistorically funded its asset growth principally through customer deposits and borrowings.to a lesser extent through wholesale borrowings (e.g., brokered deposits and borrowed funds). As a general matter, customer deposits are typically a lower cost source of funds than external wholesale funding (brokered deposits and borrowed funds), because interest rates paid for deposits are typically less than interest rates charged for wholesale funding. If as a result of competitive pressures, market interest rates, alternative investment opportunities that present more attractive returns to customers, general economic conditions or other events, the balance of the Company’sCompany's customer deposits decreases relative todecrease or are less than the Company’s overall banking operations,Company's asset growth, the Company may have to rely more heavily on higher-costing wholesale funding or other sources of external funding or may have to significantly increase deposit rates to maintain deposit levels in the future. Any such increased reliance on wholesale funding, or increases in funding rates in general could have a negative impact onfuture, all of which may lower the Company’sCompany's net interest income, net interest margin and consequently, on its results of operations and financial condition.profitability.
Sources of External Funding Could Become Restricted and Impact the Company’sCompany's Liquidity
Liquidity risk is the potential that we will be unable to meet our obligations as they come due because of an inability to liquidate assets or obtain adequate funding. The Company’s external wholesaleBank’s access to funding sources in amounts adequate to finance our activities or on acceptable terms could be impaired by factors that affect our organization, the financial services industry, or the economy in general. Factors that could detrimentally impact access to liquidity sources include borrowing capacity at the FHLB and FRB, capacitya downturn in the brokeredmarkets in which our loans are concentrated or adverse regulatory actions against the Bank. Market conditions or other events could also negatively affect the level or cost of funding, affecting the Bank’s ongoing ability to meet liability maturities and deposit markets, other borrowing arrangements with correspondent banks, as well as accessing the public markets through offerings of the Company’s stock or issuance of debt. withdrawals, meet contractual obligations and fund asset growth and new business transactions at a reasonable cost, in a timely manner and without adverse consequences.
If, as a result of general economic conditions or other events, these sources of external funding become restricted or are eliminated, the Company may not be able to raise adequate funds, or may incur substantially higher funding costs, be required to sell assets, restrict operations, or operating restrictions in order to raiserestrict the necessary funds to support the Company's operations and growth. Any such increase in funding costs or restrictions could have a negative impact on the Company’s net interest income and, consequently, on its resultspayment of operations and financial condition.
29
LENDING
There are inherent risks associated with the Company's lending activities. These risks include, among other factors, such as, by waythings, the impact of example only, possible future net operating losses, impairment charges against tangible or intangible assets, or adjustments to retained earnings due to changes in accounting rules.the economic conditions in the market areas in which the Company operates and changes in interest rates. In addition, the Company may be impacted by the following risks associated with its lending activities:
Commercial Lending Generally Involves a Higher Degree of Risk than Retail Residential Mortgage Lending
The Company's failureloan portfolio consists primarily of commercial real estate, commercial and industrial, and commercial construction loans. These types of loans are generally viewed as having more risk of default than owner-occupied residential real estate loans and typically have larger balances. The underlying commercial real estate values, lower demand for office and retail space, increase costs to remain "well-capitalized"complete construction projects. Customer cash flows can be more easily influenced by adverse conditions in the related industries, the real estate market or in the economy.
Commercial real estate values may be elevated and the outlook for commercial real estate remains dependent on the broader economic environment and, specifically, how major subsectors respond to higher interest rate environment and prices for commodities, goods and services. Credit performance across the industry over the medium- and long-term is susceptible to economic and market forces and our non-performing loans and charge offs may increase. Some degree of general instability in the broad commercial real estate market may occur in the coming quarters as loans are refinanced at higher interest rates and in markets with higher vacancy rates under current economic conditions. Our commercial borrowers may experience greater difficulties meeting their obligations if debt service coverage declines as adjustable-rate loans reprice to higher interest rates and customer cash flows are impacted by inflationary pressures. Conversely, in periods of decreasing interest rates, likely resulting from economic slowdown or recession, borrowers may experience difficulties meeting their obligations and seek to refinance their loans for lower rates, which may adversely affect income from these lending activities. Instability and uncertainty in the commercial real estate markets and elevated level of interest rates could have a material adverse effect on our financial condition and results of operations.
The Company May Need to Increase its Allowance for Credit Losses
The determination of the appropriate level of the allowance for credit losses inherently involves a high degree of subjectivity and requires the Company to make significant estimates of current credit risks, non-performing trends, and economic forecasts, all of which may undergo material changes. In addition, bank regulatory purposes couldagencies periodically review the Company's allowance for credit losses and may require an increase in the provision for credit losses or the recognition of loan charge-offs, based on judgments that may differ from those of the Company's management.
Increases in the Company's Non-performing Assets Could Adversely Affect the Company's Results of Operations and Financial Condition in the Future
Non-performing assets adversely affect customer confidence, restrictour net income in various ways. No interest income is recorded on non-accrual loans or other real estate owned, thereby adversely affecting income and returns on assets and equity. In addition, loan administration and workout costs increase, including significant time commitments from management and staff, resulting in additional reductions of earnings. When taking collateral in foreclosures and similar proceedings, the Company is required to carry the property or loan at its then-estimated fair value less estimated cost to sell, which, when compared to the carrying value of the loan, may result in a loss. In addition, any errors in documentation or previously unknown defects in deeds may impact the Company's ability to grow (bothperfect title of the collateral in foreclosure. These non-performing loans and other real estate owned assets and branching activity),also increase the Company's costsrisk profile and the capital that regulators believe is appropriate in light of fundssuch risks and have an impact on the Company's FDIC risk-based deposit insurance costs, prohibitpremium rate.
The Company's Use of Appraisals in Deciding Whether to Make a Loan Does Not Ensure the Value of the Collateral
In considering whether to make a loan secured by real property or other business assets, the sale of which may provide ultimate recovery of the outstanding balance of the loan, the Company generally requires an internal evaluation or independent appraisal of the collateral supporting the loan. However, these assessment methods are only an estimate of the value of the collateral at the time the assessment is made and involve estimates and assumptions. An error in fact, estimate or judgment could adversely affect the reliability of the valuation. Furthermore, changes in those estimates due to the economic environment and events occurring after the initial assessment, may cause the value of the collateral to differ significantly from the initial valuations. As a result, the value of collateral securing a loan may be less than estimated at the time of assessment, and if a default occurs the Company may not recover the outstanding balance of the loan.
The Company is Subject to Environmental Risks Associated with Real Estate Held as Collateral or Occupied
While the Company’s lending, foreclosure and facilities policies and guidelines are intended to exclude properties with an
30
unreasonable risk of contamination, hazardous substances could exist on some of the properties that the Company may own, acquire, manage, or occupy. Environmental laws could force the Company to clean up the properties at the Company’s expense. It may cost much more to clean a property than the property is worth, and it may be difficult or impossible to sell contaminated properties. The Company could also be liable for pollution generated by a borrower’s operations if the Company takes a role in managing those operations after a default.
Concentrations in Commercial Real Estate Loans are Subject to Heightened Risk Management and Regulatory Review
If a concentration in commercial real estate lending is present, as measured under government banking regulations, management must employ heightened risk management lending practices that address the following key elements: board and management oversight and strategic planning, portfolio management, development of underwriting standards, portfolio risk assessment and monitoring through market analysis and stress testing, and maintenance of increased capital levels as needed to support the level of commercial real estate lending. Management believes that it is in compliance with the enhanced risk management practices. When a concentration is determined to exist, the Company may incur additional operating expenses in order to comply with additional risk management practices and increased capital requirements.
INFORMATION & TECHNOLOGY RESOURCES
The use of technology related products, services, delivery channels, access points and processes expose the Company to various risks, particularly operational, privacy, cybersecurity, strategic, reputation and compliance risk. The ongoing move towards more cloud-based and third-party hosted technology solutions may subject the Bank to certain heightened cyber risks. The potential use of generative artificial intelligence to launch sophisticated cyber-attacks, and the threat that foreign state-sponsored agencies' cyber threat operations may pose heightened risk of disruptions to U.S. critical infrastructure and thereby the Bank's operations. Banks are required by regulatory agencies to prudently manage cyber, third-party, cloud-based and technology-related risks as part of their comprehensive risk management policies by identifying, measuring, monitoring, and controlling these risks.
Failure to Keep Pace with Technological Change Could Affect the Company's Profitability
The banking industry is continually undergoing rapid technological change with frequent introductions of new technology-driven products, services, extended service and settlement frequencies, data management and delivery channels. Failure to successfully plan or keep pace with technological changes affecting the banking industry, or failure to adequately plan, train and educate staff and customers on the use and risks of new technologies and extended service cycles, failure to capture or manage data, or failure to comply adequately with regulatory guidance regarding information and cybersecurity could have a material adverse effect on the Company's business and, in turn, the Company's financial condition and results of operations. In addition, there may be significant time and expenses associated with upgrading and implementing new technology, technology compliance, information security and cybersecurity processes.
Information Systems Could Experience an Interruption, Failure, Breach in Security, or Cyber-Attack
The Company relies heavily on public utilities infrastructure, internal information and operating systems, and cloud-based solutions and storage to conduct its business effectively, and these systems could fail in a variety of ways. In addition, the use of network, cloud-based, or third-party hosted systems expose the Company to the increased sophistication and activity of cyber-criminals, both domestic and international. Current geopolitical tensions could result in serious and catastrophic attempts at cyber-attacks on the U.S. web-based infrastructure. A cyber incident is considered to be any adverse event that threatens the confidentiality, integrity, or availability of the information resources of the Company. These incidents may be an intentional attack or an unintentional event and could involve blocking the Company from accessing its own systems or remote servers in exchange for a ransom payment, gaining unauthorized access directly to our information systems, or indirectly through our vendors and customers systems or servers, for purposes of misappropriating assets, stealing confidential corporate information or customers' Personally Identifiable Information, corrupting data, denying access or causing operational disruption. The Company's independent third-party service providers or their subcontractors may also expose the Company to cybersecurity risk. Additionally, vendors' and customers' home, business or mobile information systems and the servers they rely on, are at risk of fraudulent corporate account takeovers which the Company may not be able to detect, and may impact the Company's ability to pay dividends on common shares,service its customers. There is no guarantee the Company's counteractions will be successful or that the Company will have the resources or technical expertise to anticipate, detect or prevent rapidly evolving types of cyber-attacks.
The occurrence of any failures or disruptions as noted above, or the Company's inability to detect, respond, disclose and itscorrect such occurrence or compromise in a timely manner, could subject the Company to increased operational costs to detect and rectify the situation, damage the Company's reputation and deter customers from using the Company's services,
31
increase the Company insurance cost or the ability to make acquisitions, and have a negative impact on the Company's business, results of operation and financial conditions, generally. Under FDIC rules, if the Bank ceases to be a "well-capitalized" institution for bank regulatory purposes, its ability to accept brokered deposits and the interest rates that it pays may be restricted.
OPERATIONS
The Company Operates in a Competitive Industry and Market Area
The Company faces substantial competition in all areas of its operations from a variety of different competitors severalwithin its market area and beyond. Some of whichthese competitors are larger and have more financial resources than the Company. Competitors within the Company’s market area include not only national, regional, other community banks and internet based banks, but also various types of other non-bank financial institutions, including credit unions, consumer finance companies, mortgage brokers and lenders, as well as private lenders, insurance companies, securities brokerage firms, institutional mutual funds, registered investment advisors, other financial intermediaries and non-bank electronic payment and funding channels. Additionally,Company; some of these competitors are not subject to the same degree of government regulation as the Company and thus may have a competitive advantage over the Company.advantage. If due to the inability to compete successfully within the Company's target banking markets, the Company encounters difficulties attracting and retaining customers it would have a material adverse effect on the Company's growth and profitability.
The Company May Experience a Prolonged Interruption in its Ability to Conduct Business
The Company relies heavily on its personnel and facilities to conduct its business. A material loss of people or physical damage, destruction, or denial of access to our core operating facilities, for any number of reasons such asincluding localized natural disasters, infectious disease outbreak, powerglobal pandemics and government's reaction thereto, demonstrations/pickets at or telecommunications disruptions, actsnear facilities, or the local impact of terrorism or war, or similar events or disruptionsgeopolitical tensions, could result in an interruption inprolonged business interruptions impacting customer services and our ability to conduct transactions, loss of customer business and damage the Company's reputation, any of which may have a material adverse effect on the Company’s financial condition and results of operations.transactions.
The Company Relies on Third-PartyExternal Service Providers
The Company relies on independent third-party firms, including indirect vendors utilized by such third parties, to provide critical services necessary to conducting its business. These services include but are not limited to:to electronic funds delivery networks;networks, check clearing houses;houses, electronic banking services; investmentservices, wealth advisory, management and custodial services;services, correspondent banking services;services, information security assessments and technology support services;services, and loan underwriting and review services.services, among others. The occurrence of any failures or interruptions of the independent firms’firms' systems or in their delivery of services, or failure to perform in accordance with contracted service level agreements, for any number of reasons could alsoin turn impact the Company's ability to conduct business and process transactions and result in loss of customer business and damage to the Company's reputation, any of which may have a material adverse effect on the Company’s business, financial condition and results of operation.transactions.
The Company Relies on Financial Counterparty Relationships
The Company routinely executes transactions with counterparties in the financial services industry, including brokers and dealers, other community banks, investment banks, and mutual and hedge funds, in order to maintain correspondent bank relationships, liquidity, manage certain loan participations, and mortgage sales activities, interest-rate swaps, engage in securities transactions, and engage in other financial activities with counterparties that are customary to our industry. Many of these transactions expose the Company to counterparty credit, liquidity and/or reputation risk in the event of default by the counterparty, or negative publicity or public complaints, whether real or perceived, about one or more of the Company's financial counterparty,counterparties, or the financial services industry in general. Although the Company seeks to manage these risks through internal controls and procedures, the Company may experience loss or interruption of business damage to its reputation, or incur additional costs or liabilities as a result of unforeseen events with these counterparties. Any financial cost, liability or reputational damage could have a material adverse effect on the Company's business, which in turn, could have a material adverse effect on the Company's financial condition
Wealth Management and results of operations.
The Company's primary growth strategyWealth Management and Wealth Services channels derive their revenues primarily from investment management fees based on the market value of assets under management. The Company's ability to maintain or increase investment assets under management is organic growth via strategic expansion within existing and into neighboring geographic markets. However, in the future the Company could explore growth opportunities through acquisition of other banks, financial services companies or lines of business. These activities would involvesubject to a number of risks,factors, including but not limited to: the potential inaccuracychanges in client investment preferences, investment decisions by us or our third-party service provider partners, and various economic conditions, among other factors. Clients can terminate their relationships with us, reduce their aggregate assets under management, or shift their funds to other types of accounts with different rate structures for any number of reasons.
Investment performance is one of the estimatesmost important factors in retaining existing clients and judgments used to evaluate credit, operations,competing for new wealth management and market risks with respect to a targeted institution; the time and costsclients. Financial markets are affected by many factors, any of evaluating potential acquisition targets, new markets, hiring or retaining experienced local management, and opening new offices and the time lags between these activities and the generation of sufficient assets and deposits to support the costs of the expansion; the incurrence and possible impairment of goodwill associated with an acquisition and possible adverse effects on the Company's results of operations; and the risk of loss of key employees and customers.
The Company is Exposed to Legal Claims and Litigation
The Company maintainsworks with an independent third-party insurance advisor to obtain insurance policies that provide coverage for variousa variety of business and cyber risks at coverage levels that compare favorably to bench-marked coverage for loss exposures that are faced by similarly sized financial institutions. However, there are no guarantees that the Company deemswill
32
be able to obtain or maintain comparable or adequate to provide reasonable coverage for losses. The coverage applies to incidents and events which may impact such areas as: loss of bank facilities; accidental injury or death of employees; injuries sustained on bank premises; cyber and technology attacks or breaches; loss of customer nonpublic personal information; processing of fraudulent transactions; robberies, embezzlement and theft; improper processing of negotiable items or electronic transactions; improper loan underwriting and perfection of collateral, among others. These policies will provide varying degrees of coverage for losses under specific circumstances, andlevels in most cases after related deductible amounts are paid by the Company. However,future. In addition, there is no guarantee that the circumstancecircumstances of an incident will meet the criteria for insurance coverage under a specific policy, and despite the insurance policies in place the Company may experience a material loss incident or eventevent.
Lack of or Slower than Expected Growth Could Adversely Affect the Company's Profitability and its Ability to Pay Dividends
The Company operates with a long-term focus on organic growth, which requires a significant investment of both financial and personnel resources. The Company relies on its deposit and lending activities to generate the cash flow to conduct operations, expand service and product offerings, expand the branch network, and pay dividends to shareholders. Contraction or slower than expected loan and/or deposit growth and/or lower than expected fee or other income generated from these and other products and services could lower our profitability and net cash flow available for funding our growth strategies and paying dividends to shareholders.
The Company May Not be Able to Attract, Retain or Develop Key Personnel
The Company's success and growth strategy depends, in large part, on its ability to attract, retain and develop top performing banking professionals within our markets, and its ability to successfully identify and develop personnel for succession to key executive management positions and to the board of directors. The inability to do so could have a material adverse effectimpact on the Company’s business reputation, financial conditionbecause of the loss of their skills, knowledge of the Company's market, years of industry or business experience and resultsthe difficulty of operations.promptly hiring qualified replacements.
REGULATION
The Trading VolumeCompany is Subject to Extensive Government Regulation and Supervision
The Company and the Bank are subject to a variety of federal and state laws and regulations that are primarily intended to protect consumers in the Company’s Common Stock is Less Than Thatfinancial marketplace, provide fair and equal availability of Larger Companies
Climate Change and Related Legislative and Regulatory Initiatives May Materially Affect the Company’s Business
Climate change, which is having a dramatic effect on weather patterns and causing more frequent and severe weather events, may negatively impact the regional and local economy, increasing credit regulatory or information security issues. Althoughand other financial risks for the Company itselfand our customers. The physical effects of climate change may or may not be directly impactedadversely impact the value of real property securing the loans in our portfolios and our customers' ability to continue to conduct operations at their business locations. Additionally, if insurance obtained by such issues, the Company’s stock price may swing up or down dueour borrowers is insufficient to cover any losses sustained to the influence, both real and perceived, of these issues, among others, oncollateral, or if insurance coverage is otherwise unavailable to our borrowers, the banking industry in general. Investment in the Company's stock is not insured against loss by the FDIC, or any other public or private entity. As a result, and for the other reasons described in this "Risk Factors" section and elsewhere in this report, if you acquirecollateral securing our common stock, you may lose some or all of your investment.
Further, the U.S. Congress, state legislatures and may materially impact how the Company records and reports its financial transactions, financial condition, and results of operations and could impact the Company's business activities and strategy.
ESTIMATES AND ASSUMPTIONS
The Company's Financial Condition and Results of Operation Rely in Part on Management Estimates and Assumptions
In preparing the financial statements in conformity with GAAP, management is required to exercise judgment in determining many of the methodologies, estimates and assumptions to be utilized. These estimates and assumptions affect the reported values of assets and liabilities at the balance sheet date and income and expenses for the years then ended. Changes in those estimates resulting from continuing change in the economic environment and other factors will be reflected in the financial statements and results of operations in future periods. As future events and their effects cannot be determined with precision, actual results could differ significantly from these estimates and be adversely affected should the assumptions and estimates used be incorrect or change over time due to changestime. The most significant areas in circumstances.which management applies critical assumptions and estimates are: the estimates of the allowance for credit losses for loans, and available-for-sale securities, the reserve for unfunded commitments and the impairment review of goodwill.
33
The Net DTAs May be Determined to be Unrealizable in Future Periods
In making its assessment on the future realizability of net DTAs, management considers all available relevant information, including recent financial operations, projected future taxable income, and recoverable past income tax paid. If in the future, management believes based upon historical and expected future earnings that it is more likely than not that the Company will not generate sufficient taxable income to utilize the DTA balance, then a valuation allowance would be booked against the DTA, with the write down offset to current earnings. Factors beyond management's control can affect future levels of taxable income and there can be no assurances that sufficient taxable income will be generated to fully realize the DTAs in the future.
REPUTATION & LEGAL
Damage to the Company's Reputation Could Affect the Company's Profitability and Shareholders' Value
The Company is dependent on its reputation within its market area as a trusted and responsible financial company for all aspects of its business with customers, employees, vendors, third-party service providers, and others with whom the Company conducts business or potential future business. Any negative publicity or public complaints, whether real or perceived, disseminated by word of mouth, by the general media, by electronic or social networking means, or by other methods, could harm the Company's reputation.
Environmental, Social and Governance Oversight May Influence Stock Price and Increase Compliance Costs
Investors have begun to consider how corporations are addressing environmental, social and governance matters, commonly known as "ESG matters" when making investment decisions. Investor advocacy groups, investment funds and influential investors are also increasingly focused on these practices, especially as they relate to the environment, health and safety, diversity, executive compensation, labor conditions and human rights. These shifts in investing priorities may result in adverse effects on the trading price of the Company’s common stock if investors determine, whether real or perceived, that the Company's ESG actions are not satisfactory. In addition, new government regulations could also result in new or more stringent forms of ESG oversight and expanding mandatory and voluntary reporting, diligence, and disclosure. Increased ESG related compliance costs could result in increases to our overall operational costs.
The Company is Exposed to Legal Claims and Litigation
The Company is subject to legal challenges under a variety of circumstances in the course of its normal business practices. Regardless of the scope or the merits of any claims by potential or actual litigants, the Company may have to engage in litigation that could be expensive, time-consuming, disruptive to the Company's operations, and distracting to management. Whether claims or legal action are founded or unfounded, if such claims and legal actions are not resolved in a manner favorable to the Company, they may result in significant financial liability, damage the Company's reputation, subject the Company to additional regulatory scrutiny and restrictions, and/or adversely affect the market perception of our products and services, as well as impact customer demand for those products and services.
COMMON STOCK, SHAREHOLDER’S EQUITY, CAPITAL
The Trading Volume in the Company's Common Stock is Less Than That of Larger Companies
Although the Company's common stock is listed for trading on the NASDAQ Global Market, the trading volume in the Company's common stock is substantially less than that of larger companies. Given the lower trading volume of the Company's common stock, significant purchases or sales of the Company's common stock, or the expectation of such purchases or sales, could cause significant movement in the Company's stock price.
The Company's Capital Levels Could Fall Below Regulatory Minimums
If the Company's regulatory capital levels decline, or if regulatory requirements increase, and the Company is unable to raise additional capital to offset that decline or meet the increased requirements, then its regulatory capital ratios may fall below regulatory minimum capital adequacy levels.
The Company's failure to remain "well-capitalized" for bank regulatory purposes could affect customer confidence, restrict the Company's ability to grow (both assets and branching activity), increase the Company's costs of funds and FDIC insurance expense, prohibit the Company's ability to pay dividends on common shares, and restrict its ability to make acquisitions, among other impacts. Under FDIC rules, if the Bank ceases to be a "well-capitalized" institution, its ability to accept brokered deposits and the interest rates that it pays may be restricted. The Basel III Rules establish, among other rules, a "capital conservation buffer" of 2.5% above the regulatory minimum risk-based capital requirements. An institution
34
will be subject to limitations on certain activities, including payment of dividends, share repurchases and discretionary bonuses to executive officers, if its capital level is below the buffered ratio.
The Company's Articles Ofof Organization, By-Laws and Shareholders Rights Plan as Well as Certain Banking and Corporate Laws Could Have an Anti-Takeover Effect
Although management believes that certain anti-takeover strategies are in the Company's best interest of the Company and its shareholders, provisions of the Company’sCompany's articles of organization, and by-laws, itsand shareholders rights plan and certain federal and state banking laws and state corporate laws, including regulatory approval requirements for any acquisition of control of the Company, could make it more difficult for a third-party to acquire the Company, even if doing so would be perceived to be beneficial to the Company’s stockholders.Company's shareholders. The combination of these provisions effectively inhibitsis intended to prohibit a non-negotiated merger, or other business combination involving an acquisition of the Company, which, in turn, could adversely affect the market price of the Company’sCompany's common stock.
Directors and Executive Officers Own a Significant Portion of Common Stock
The Company’sCompany's directors and executive officers, as a group, beneficially own approximately 20%23% of the Company’sCompany's outstanding common stock as of December 31, 2017.2023. Management views this ownership commitment by insiders as an integral component of maintaining the Company’s locally managed connection to the communities we serve and sense ofCompany's ownership. However, as a result of this combined ownership interest, the directors and executive officers have the ability, if they vote their shares in a like manner, to significantly influence the outcome of all matters submitted to stockholdersshareholders for approval, including the election of directors.
The Company Relies on Dividends from the Bank for Substantially All of its Revenue
Holders of the Company’s common stock are entitled to receive dividends only when, and if declared by our Board. Although the Company has historically declared cash dividends on our common stock, we are not required to do so, and our Board may reduce or eliminate our common stock dividend in the future.
The Company is a separate and distinct legal entity from the Bank. It receives substantially all of its revenue from dividends paid by the Bank. These dividends are the principal source of funds used to pay dividends on the Company’s common stock and interest and principal on the Company’s subordinated debt. Various federal and state laws and regulations limit the amount of dividends that the Bank may pay to the Company.Company, and certain regulators may prohibit the Bank or the Company from paying future dividends if deemed an unsafe or unsound practice. If the Bank, due to its capital position, inadequate net income levels, or otherwise, is unable to pay dividends to the Company, then the Company will be unable to service its debt, pay obligations or pay dividends on the Company’s common stock. The Bank’s inability to pay dividendsstock, which could have a material adverse effect on the Company’s business, financial condition, results of operations and the market price of the Company’s common stock.
Item 5, "Market for Registrant’s Common Equity, Related Stockholder Matters and Issuer Purchases of Equity Securities" below.1B.Unresolved Staff Comments
None.
Item 1C.Cybersecurity
Overall Process
We have developed and implemented a comprehensive multi-layered cybersecurity risk management program, consisting of a dedicated cybersecurity function, risk assessments, policies and procedures managed by internal and external resources, that we believe is reasonably designed to prevent, detect and respond to cyber risks and incidents. We utilize a set of tools and services, including regular network, endpoint and cloud monitoring, vulnerability assessments, penetration testing, SIEM, and tabletop exercises to identify and assess material risks from cybersecurity threats and to evaluate our cyber defense capabilities.
Internal security controls are designed to align with standards set by the NIST. We monitor emerging data protection laws, conduct background checks of our employees in specific technology and cybersecurity roles, apply least privilege access to users, test the maturity and readiness of our cybersecurity program, conduct table top exercises based on current threat scenarios to increase awareness, conduct phishing testing, provide cybersecurity training to our Board and employees, and provide cybersecurity alerts to our customers on ongoing threats. We monitor notifications and alerts from the FS-ISAC and other industry cybersecurity sites to stay abreast of the most recent cybersecurity alerts.
Enterprise Risk Management Process Integration
The Company has implemented layered security approaches for all electronic delivery channels to detect, prevent and respond to rising cybersecurity risks. Management utilizes a combination of third-party information security assessments, key
35
technologies, and ongoing internal and external evaluations to provide a level of protection of non-public personal information, to continually monitor and attempt to safeguard information on its operating systems, in cloud-based solutions, and those of third-party service providers, and to prevent, quickly detect and respond to attacks. The Company also utilizes firewall technology, multi-factor authentication, complex password construction, and a combination of software and third-party monitoring to detect and prevent intrusion, and cybersecurity threats, guard against unauthorized access, and continuously identify and prevent computer viruses on the Company's information solutions. To minimize debit card losses, the Company works with a third-party provider to establish parameters for allowable transaction activity, monitor transactions, and alert customers of potentially fraudulent activity.
The Bank maintains a written Information Security Program based on a collection of information security policies, regulatory requirements, standards, guidelines, processes, procedures, third-party recommendations, and industry best practices. The purpose of this Program is to establish a company-wide approach for assessing and protecting the integrity, availability, and confidentiality of the Bank’s information assets.
Third-party Access
The Company has a fully integrated third-party risk management program to identify, assess, monitor and mitigate risks associated with third-party relationships, including cybersecurity risks. Under the program, risk ratings are assigned to each of the vendors based on an assessment of the vendor and its access to networks, systems, and confidential information. An assessment is conducted on each vendor to identify and measure the risks from cybersecurity threats that could impact our customer’s data and our environment. Third parties that have access to our systems or customer data must have appropriate technical and organizational security measures and security control principles based on commercially acceptable security standards, and we require third parties in this class to agree by contract to manage their cybersecurity risks.
In our Risk Factors, we describe whether and how risks from identified cybersecurity threats, including as a result of any previous cybersecurity incidents, have materially affected or are reasonably likely to materially affect us, including our business strategy, results of operations or financial condition.
Material Incidents
We are not aware of any risks from cybersecurity threats, including as a result of any previous cybersecurity incidents, that have materially affected or are reasonably likely to materially affect the Company, including our business strategy, results of operations or financial condition. Although we have a robust cybersecurity program that is designed to assess, identify, and manage material risks from cybersecurity threats, we cannot provide absolute surety that we have properly identified or mitigated all vulnerabilities or risks of incidents. We, and the third parties that we engage, are subject to constant and evolving threats of attack and cybersecurity incidents may be more difficult to detect for periods of time. A cybersecurity incident could harm our business strategy, results of operations, financial condition, reputation, and/or subject us to regulatory actions or litigation which may result in fines, judgments or indictments.
Incidents and Risks
The Company has developed an Incident Response Plan to guide its actions in responding to real and suspected information security incidents. This includes unlawful, unauthorized, or unacceptable actions that involve a computer system or a computer network such as Distributed Denial of Service attacks, Corporate Account Takeover schemes, or ransomware. Additionally, an event that disrupts one of the Bank's service channels, whether from a security incident or not, is also considered an incident requiring a response under this program. These disclosure controls and procedures compel the Company to make accurate and timely disclosures of material events and incidents to both customers and regulatory authorities. The reaction to an incident aims to reduce potential damage and loss and to protect and restore confidence through timely communication and the restoration of normal operating conditions for computers, services, and information. Management will work closely with its cybersecurity insurance provider, cybersecurity legal counsel, and forensic experts when investigating and responding to cyber or ransomware attacks.
Cybersecurity Governance
Cybersecurity risk management processes are an integral part of our enterprise risk management which is overseen by the Board and the Technology & Information Security Committee of the Board. The Board oversees the risk management policies of the Company and is responsible for the periodic review and approval of the risk management policies of the company and provides general oversight over the information security and technology programs. The TISC oversees the technology and cybersecurity strategies and their alignment with business strategies, the effectiveness of the information security program, monitors the results of third-party testing and risk assessments and responses to breaches of customer data, among other project management, cybersecurity, and business continuity oversight functions. The Committee meets five times during the year, or
36
more as needed. An information security advisor participates in the meetings and is available to provide additional insights into cybersecurity methodologies, best practices, threat trends, and resource planning.
The CISO has over 17 years of banking experience, is a Certified Information Systems Security Professional, and has been involved with the management of information and cybersecurity for over ten years. The CISO regularly reports to the Board Technology & Information Security Committee on information and cybersecurity strategy, testing, training, policies, procedures, cybersecurity insurance, and overall effectiveness of the Information Security Program and would report and discuss material incidents, and ongoing mitigation status, if any should occur. The CISO is the chair of Management’s Information Security Committee that meets on a monthly basis to evaluate threats, incidents, defense system effectiveness, accepted risks, results of third-party cyber assessments and engagements, and the overall adequacy of the cybersecurity program. In addition, the Chief Information Officer has over 15 years of experience in managing bank technologies, information security, and risk management, and collaborates in supporting the Information Security Program. The CISO reports directly to the Chief Risk Officer and meets on a monthly basis with the Executive Management team to discuss cybersecurity risk management matters.
Item 2.Properties
The Company's main office and operational support and lending offices are located in Lowell, Massachusetts. The main Lowell campus consists of four closely situated buildings, twothree of which are owned and two of which are leased,the fourth is under a 40 year lease, with ample on-site customer parking. The Company also owns and maintains a back-up operations/data facility in the Merrimack Valley region of Massachusetts. As of December 31, 2017,2023, the Company had 2427 full-service branch banking offices serving the Greater Merrimack ValleyNorthern Middlesex, Northern Essex and North Central regionsNorthern Worcester counties of Massachusetts, and Southern New Hampshire (Southern Hillsborough and Southern Rockingham counties). Of these branches, 15 were leased and 9 were owned.counties in New Hampshire.
The Company believes that all of its facilities are well maintained and suitable for the purpose for which they are used. However,
As of December 31, 2023, the Company regularly looks for opportunities to improve its facilities and locations. We expectwas the relocation (leased to owned) of our Leominster, MA branch to be completed in spring of 2018.lessee under 16 active operating real estate leases.
There are no material pending legal proceedings to which the Company or its subsidiaries are a party or to which any of its property is subject, other than ordinary routine litigation incidental to the business of the Company. Management does not believe resolution of any present litigation will have a material adverse effect on the business, consolidated financial condition or results of operations of the Company.
Item 4.Mine Safety Disclosures
Not Applicable.
PART II
Item 5.Market for Registrant's Common Equity, Related Shareholder Matters and Issuer Purchases of Equity Securities
Market for Common Stock
The Company’sCompany's common stock trades on the NASDAQ Global Market under the trading symbol "EBTC."
| Fiscal Year | Trading Volume | Share Price High | Share Price Low | |||||||
| 2017 | ||||||||||
4th Quarter | 548,890 | $ | 38.25 | $ | 33.80 | |||||
3rd Quarter | 538,569 | 37.89 | 30.00 | |||||||
2nd Quarter | 1,089,356 | 36.89 | 29.02 | |||||||
1st Quarter | 1,066,573 | 39.25 | 30.04 | |||||||
| 2016 | ||||||||||
4th Quarter | 927,525 | $ | 38.96 | $ | 25.35 | |||||
3rd Quarter | 1,000,337 | 30.81 | 22.34 | |||||||
2nd Quarter | 771,472 | 26.00 | 21.36 | |||||||
1st Quarter | 527,670 | 27.06 | 20.01 | |||||||
As of March 2, 2018,February 29, 2024, there were 1,221 registered stockholders of the Company’s common stock and 11,635,04412,278,649 shares of the Company’sCompany's common stock outstanding.outstanding held by 1,079 shareholders of record.
Dividends
37
On January 16, 2024, the Company announced a quarterly dividend of $0.24 per share, which was paid on March 1, 2024, to shareholders of record as of February 9, 2024.
In addition, the Company maintains a dividend reinvestment and direct stock purchase plan (the "DRSPP"). The DRSPP which enables stockholders,shareholders, at their discretion, to continue to elect to reinvest cash dividends paid on their shares of the Company’sCompany's common stock by purchasing additional shares of common stock from the Company at a purchase price equal to fair market value. Under the DRSPP, stockholdersshareholders and new investors also have the opportunity to purchase shares of the Company's common stock without brokerage fees, subject to monthly minimums and maximums.
Securities Authorized for Issuance under Equity Compensation Plans
The following table provides information as of December 31, 2017,2023, with respect to the Company’sCompany's 2009 Stock Incentive Plan, as amended, and theits 2016 Stock Incentive Plan, as amended, which together constitute all of the Company’sCompany's existing equity compensation plans that have been previously approved by the Company’s stockholders. Company's shareholders. The 2009 Plan expired in 2019 and is closed for future grants, although awards previously granted under the 2009 Plan remain outstanding and may be exercised through 2028.
| Plan Category | Number of Securities to be issued upon exercise of outstanding options, warrants and rights | Weighted-average exercise price of outstanding options, warrants and rights | Number of Securities remaining available for future issuance under equity compensation plans (excluding securities reflected in second column from left) | |||||||||||||||||
| Equity compensation plans approved by security holders | 162,539 | $ | 28.07 | 370,680 | ||||||||||||||||
| Equity compensation plans not approved by security holders | — | — | — | |||||||||||||||||
| TOTAL | 162,539 | $ | 28.07 | 370,680 | ||||||||||||||||
See also Note 14, "Stock-Based Compensation" to the Company's consolidated financial statements contained in Item 8 of this Form 10-K below for further information regarding the Company's Equity Compensation Plan.
Repurchases of Common Stock
During the three months ended December 31, 2023, the Company made no repurchases of common stock.
38
| Plan Category | Number of Securities to be issued upon exercise of outstanding options, warrants and rights | Weighted-average exercise price of outstanding options, warrants and rights | Number of Securities remaining available for future issuance under equity compensation plans (excluding securities reflected in second column from left) | |||||||
| Equity compensation plans approved by security holders | 194,218 | $ | 19.29 | 465,198 | ||||||
| Equity compensation plans not approved by security holders | — | — | — | |||||||
| TOTAL | 194,218 | $ | 19.29 | 465,198 | ||||||
Performance Graph
The following graph compares the cumulative total shareholder return (which assumes the reinvestment of all dividends) on the Company’sCompany's common stock with the cumulative total return reflected by a broad-based equity market index and an appropriate published industry index. This graph shows the changes over the five-year period ended on December 31, 20172023, in the value of $100 invested in (i) the Company’sCompany's common stock, (ii) the Standard & Poor's 500 Index, and (iii) the SNL Bank $1B to $5B index.Standard & Poor's U.S. Small Cap Banks Index.

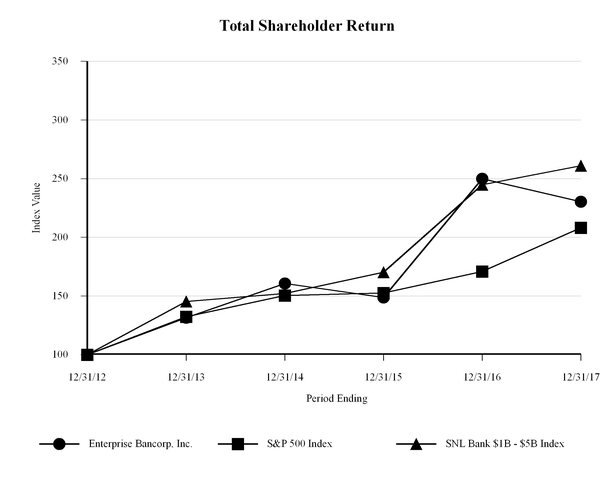
| Period Ending | ||||||||||||||||||||||||||||||||||||||
| Index | 12/31/18 | 12/31/19 | 12/31/20 | 12/31/21 | 12/31/22 | 12/31/23 | ||||||||||||||||||||||||||||||||
| Enterprise Bancorp, Inc. | $ | 100.00 | $ | 107.60 | $ | 83.58 | $ | 150.20 | $ | 120.86 | $ | 113.94 | ||||||||||||||||||||||||||
| S&P 500 Index | 100.00 | 131.49 | 155.68 | 200.37 | 164.08 | 207.21 | ||||||||||||||||||||||||||||||||
| S&P U.S. Small Cap Banks Index | 100.00 | 125.46 | 113.94 | 158.62 | 139.85 | 140.55 | ||||||||||||||||||||||||||||||||
Item 6. [Reserved]
Not Applicable.
39
| Period Ending | ||||||||||||||||||||||||
| Index | 12/31/12 | 12/31/13 | 12/31/14 | 12/31/15 | 12/31/16 | 12/31/17 | ||||||||||||||||||
| Enterprise Bancorp, Inc. | $ | 100.00 | $ | 131.52 | $ | 160.71 | $ | 148.75 | $ | 249.88 | $ | 230.29 | ||||||||||||
| S&P 500 Index | 100.00 | 132.39 | 150.51 | 152.59 | 170.84 | 208.14 | ||||||||||||||||||
| SNL Bank $1B - $5B Index | 100.00 | 145.41 | 152.04 | 170.20 | 244.85 | 261.04 | ||||||||||||||||||
Contents
Total number of shares repurchased (1) | Average Price Paid Per Share | Total Number of Shares Purchased as Part of Publicly Announced Plans or Programs Announced | Maximum Number of Shares that May Yet Be Purchased Under the Plans or Programs | |||||
| October | 2,289 | $37.20 | — | — | ||||
| November | 0 | 0 | — | — | ||||
| December | 0 | 0 | — | — | ||||
| Year Ended December 31, | ||||||||||||||||||||
| (Dollars in thousands, except per share data) | 2017 | 2016 | 2015 | 2014 | 2013 | |||||||||||||||
| EARNINGS DATA | ||||||||||||||||||||
| Net interest income | $ | 97,522 | $ | 86,792 | $ | 78,294 | $ | 71,230 | $ | 65,791 | ||||||||||
| Provision for loan losses | 1,430 | 2,993 | 3,267 | 1,395 | 3,279 | |||||||||||||||
| Net interest income after provision for loan loss | 96,092 | 83,799 | 75,027 | 69,835 | 62,512 | |||||||||||||||
| Non-interest income | 14,958 | 13,639 | 13,139 | 12,813 | 12,553 | |||||||||||||||
| Net gains on sales of investment securities | 716 | 802 | 1,828 | 1,619 | 1,239 | |||||||||||||||
| Non-interest expense | 76,145 | 70,328 | 65,732 | 62,031 | 55,824 | |||||||||||||||
| Income before income taxes | 35,621 | 27,912 | 24,262 | 22,236 | 20,480 | |||||||||||||||
| Provision for income taxes | 16,228 | 9,161 | 8,114 | 7,585 | 6,951 | |||||||||||||||
| Net income | $ | 19,393 | $ | 18,751 | $ | 16,148 | $ | 14,651 | $ | 13,529 | ||||||||||
| COMMON SHARE DATA | ||||||||||||||||||||
| Basic earnings per share | $ | 1.68 | $ | 1.71 | $ | 1.56 | $ | 1.45 | $ | 1.37 | ||||||||||
| Diluted earnings per share | 1.66 | 1.70 | 1.55 | 1.44 | 1.36 | |||||||||||||||
| Book value per share at year end | 19.97 | 18.72 | 17.38 | 16.35 | 15.14 | |||||||||||||||
| Dividends paid per share | $ | 0.54 | $ | 0.52 | $ | 0.50 | $ | 0.48 | $ | 0.46 | ||||||||||
| Basic weighted average shares outstanding | 11,568,430 | 10,966,333 | 10,323,016 | 10,118,762 | 9,862,678 | |||||||||||||||
| Diluted weighted average shares outstanding | 11,651,763 | 11,039,511 | 10,389,934 | 10,209,243 | 9,950,609 | |||||||||||||||
| YEAR END BALANCE SHEET AND OTHER DATA | ||||||||||||||||||||
| Total assets | $ | 2,817,564 | $ | 2,526,269 | $ | 2,285,531 | $ | 2,022,228 | $ | 1,849,925 | ||||||||||
| Loans serviced for others | 89,059 | 80,996 | 71,272 | 64,122 | 72,711 | |||||||||||||||
| Investment assets under management | 844,977 | 725,338 | 678,377 | 674,604 | 667,330 | |||||||||||||||
Total assets under management (1) | $ | 3,751,600 | $ | 3,332,603 | $ | 3,035,180 | $ | 2,760,954 | $ | 2,589,966 | ||||||||||
| Total loans | $ | 2,269,904 | $ | 2,022,729 | $ | 1,859,962 | $ | 1,672,604 | $ | 1,524,056 | ||||||||||
| Allowance for loan losses | 32,915 | 31,342 | 29,008 | 27,121 | 26,967 | |||||||||||||||
| Investment securities | 405,206 | 374,790 | 300,358 | 245,065 | 215,369 | |||||||||||||||
| Interest-earning deposits and fed funds | 14,496 | 17,428 | 19,177 | 10,102 | 12,371 | |||||||||||||||
| Deposits | 2,441,362 | 2,268,921 | 2,018,148 | 1,768,546 | 1,635,992 | |||||||||||||||
| Borrowed funds | 89,000 | 10,671 | 53,671 | 58,900 | 36,534 | |||||||||||||||
| Subordinated debt | 14,847 | 14,834 | 14,822 | 10,825 | 10,825 | |||||||||||||||
| Total stockholders’ equity | 231,810 | 214,786 | 180,327 | 166,950 | 151,334 | |||||||||||||||
| RATIOS | ||||||||||||||||||||
| Return on average total assets | 0.73 | % | 0.78 | % | 0.76 | % | 0.76 | % | 0.78 | % | ||||||||||
| Return on average stockholders’ equity | 8.58 | % | 9.33 | % | 9.29 | % | 9.20 | % | 9.32 | % | ||||||||||
| Allowance for loan losses to total loans | 1.45 | % | 1.55 | % | 1.56 | % | 1.62 | % | 1.77 | % | ||||||||||
| Stockholders’ equity to total assets | 8.23 | % | 8.50 | % | 7.89 | % | 8.26 | % | 8.18 | % | ||||||||||
| Dividend payout ratio | 32.14 | % | 30.41 | % | 32.05 | % | 33.10 | % | 33.58 | % | ||||||||||
Special Note Regarding Forward-Looking Statements
This report on Form 10-K (this "Form 10-K") contains certain forward-looking statements concerning plans, objectives, future events or performanceas defined in the Private Securities Litigation Reform Act of 1995. Such forward-looking statements about the Company and assumptionsits industry involve substantial risks and other statements that areuncertainties. Statements other than statements of current or historical fact.fact, including statements regarding the Company’s future financial condition, results of operations, business plans, liquidity, cash flows, projected costs, and the impact of any laws or regulations applicable to the Company, are forward-looking statements. Forward-looking statements may be identified by reference to a future period or periods or by use of forward-looking terminology such as "will," "should," "could," anticipates,"anticipates," "believes," "expects," "intends," "may," "plans," "pursue," "views" and similar terms or expressions. VariousWe caution you that any such forward-looking statements containedare not guarantees of future performance and are subject to risks, assumptions, estimates and uncertainties that are difficult to predict. Although we believe that the expectations reflected in Item 7 - "Management's Discussion and Analysisthese forward-looking statements are reasonable as of Financial Condition and Results of Operations" and Item 7A - "Quantitative and Qualitative Disclosures About Market Risk" of this Form 10-Kthe date made, actual results may prove to be materially different from the results expressed or implied by the forward-looking statements.
There are or will be important factors that could cause our actual results to differ materially from those indicated in these forward-looking statements, including, but not limited to, statementsthe following:
•potential recession in the United States and our market areas;
•the impacts related to management's views onor resulting from recent bank failures and any continuation of the recent uncertainty in the banking industry, including the associated impact to the Company and other financial institutions of any regulatory changes or other mitigation efforts taken by government agencies in response thereto;
•increased competition for deposits and related changes in deposit customer behavior;
•failure of risk management controls and procedures;
•the adequacy of the allowance for credit losses;
•risk specific to commercial loans and borrowers;
•changes in the business cycle and downturns in the local, regional, or national economies, including changes in consumer spending and deterioration in the local real estate market, could negatively impact credit and/or asset quality and result in credit losses and increases in the Company's allowance for credit losses;
•the effects of declines in housing prices in the United States and our market areas;
•declines in commercial real estate prices;
•the persistence of the current inflationary environment in the United States and our market areas, and its impact on market interest rates, the economy and credit quality;
•increases in unemployment rates in the United States and our market areas;
•deterioration of capital markets, which could adversely affect the value or credit quality of the Company's assets and the economy, competitionavailability of funding sources necessary to meet the Company's liquidity needs;
•changes in market interest rates could negatively impact the pricing of our loans and deposits and decrease our net interest income or net interest margin;
•increases in market expansion opportunities,interest rates could negatively impact bond market values and result in a lower net book value;
•our ability to successfully manage the interest ratecurrent rising market interest-rate environment, our credit risk and the level of future non-performing assets and charge-offs, charge-offs;
•potential asset and depositdecreases or growth of assets, deposits, future non-interest expenditures and non-interest incomeincome;
•inability to maintain adequate liquidity;
•the inability to raise the necessary capital to fund our operations or to meet minimum regulatory capital levels would restrict our business and operations;
40
•material decreases in the amount of deposits we hold, or a failure to grow our deposit base as necessary to help fund our growth and borrowing capacity are forward-looking statements.operations;
•our ability to keep pace with technological change or difficulties when implementing new technologies;
•technology-related risk, including technological changes and technology service interruptions or failure could adversely impact the Company's operations and increase technology-related expenditures;
•cybersecurity risk, including cyber incidents or other failures, disruptions or breaches of our operational or security systems or infrastructure, or those of our third-party vendors or other service providers, including as a result of a cyber attack, could impact the Company's reputation, increase regulatory oversight, and impact the financial results of the Company;
•increasing competition from larger regional and out-of-state banking organizations as well as non-bank providers of various financial services could adversely affect the Company's competitive position within its market area and reduce demand for the Company's products and services;
•our ability to retain and increase our aggregate assets under management;
•our ability to enter new markets successfully and capitalize on growth opportunities, including the receipt of required regulatory approvals;
•damage to our reputation in the markets we serve;
•risks associated with fraudulent, negligent, or other acts by our customers, employees or vendors;
•exposure to legal claims and litigation;
•our ability to maintain an effective system of disclosure controls and procedures and internal control over financial reporting;
•inability to attract, hire and retain qualified management personnel;
•recent and future changes in laws and regulations that apply to the Company's business and operations, and any additional regulations, or repeals that may be forthcoming as a result thereof, which could cause the Company to incur additional costs and adversely affect the Company's business environment, operations and financial results;
•future regulatory compliance costs, including any increase caused by new regulations imposed by the government;
•changes in tariffs and trade barriers;
•our ability to navigate the uncertain impacts of quantitative tightening and current and future governmental monetary and fiscal policies, including the current and future policies of the Board of Governors of the Federal Reserve System (the "Federal Reserve Board");
•uncertainty regarding United States fiscal debt and budget matters;
•severe weather, natural disasters, acts of war or terrorism, geopolitical instability or other external events;
•our ability to comply with supervisory actions by federal and state banking agencies;
•changes in the scope and cost of FDIC insurance and other coverage;
•changes in accounting and/or auditing standards, policies and practices, as may be adopted or established by the regulatory agencies, FASB, or the Public Company Accounting Oversight Board could negatively impact the Company's financial results; and
•systemic risks associated with the soundness of other financial institutions.
The foregoing factors should not be construed as exhaustive and should be read together with the other cautionary statements included in this Form 10-K, including those discussed in Item 1A, "Risk Factors," of this Form 10-K. The Company cautions readers that suchthe forward-looking statements in this Form 10-K reflect numerous assumptions that management believes to be reasonable, but which are inherently uncertain and beyond the Company's control. Forward-looking statements involve a number of risks and uncertainties that could cause the Company's actual results to differ materially from those expressed in, or implied by, the forward-looking statement. Accordingly, we caution you that any such forward-looking statements are not guarantees of future performance and readers should not place undue reliance on such forward-looking information and statements. Any forward-looking statements in this Form 10-K are based on information available to the Company as of the date of this Form 10-K, and the Company undertakes no obligation to publicly update or otherwise revise any forward-looking statement, whether as a result of new information, future events or otherwise, except as required by applicable law. The following important factors, among others, could cause the Company's results for subsequent periods to differ materially from those expressed in any forward-looking statement made herein: (i) changes in interest rates could negatively impact net interest income; (ii) changes in the business cycle and downturns in the local, regional or national economies, including deterioration in the local real estate market, could negatively impact credit and/or asset quality and result in credit losses and increases in the Company's allowance for loan losses; (iii) changes in consumer spending could negatively impact the Company's credit quality and financial results; (iv) increasing competition from larger regional and out-of-state banking organizations as well as non-bank providers
41
Overview
Executive Summary
The Company operates with a long-term outlook, focused on organic growth supported by continually investing in our people, products, services, technology, and branch network.
Key financial results at or for the twelve months ended December 31, 2023 are as follows:
•Net income amounted to $38.1 million, or $3.11 per diluted common share.
•Return on average assets and average equity were 0.85% and 12.48%, respectively.
•Net interest margin (non-GAAP) was 3.51%.
•Total loans increased 12% compared to December 31, 2022.
•Total deposits decreased 1% compared to December 31, 2022.
•The Company had no brokered deposits and only $25.8 million in borrowed funds.
•Wealth assets under management and administration amounted to $1.3 billion and increased 21% compared to December 31, 2022.
Net income for the year ended December 31, 2017,2023, amounted to $19.4$38.1 million, or $3.11 per diluted common share, compared to $42.7 million, or $3.52 per diluted common share, for the year ended December 31, 2022. The decrease in net income of $4.7 million for the year ended December 31, 2023 was attributable primarily to increases in the provision for credit losses of $3.4 million and non-interest expense of $1.9 million and a decrease in non-interest income of $853 thousand, partially offset by an increase in net interest income of $642 thousand$1.3 million.
The Company’s financial results for the years ended December 31, 2023 and 2022 were impacted by multiple non-core operating transactions. The non-core operating transactions for 2023 included net losses on sales of debt securities of $2.4 million and Employee Retention Credits of $3.6 million (included in salaries and benefits). The non-core operating transactions for 2022 included net losses on sales of debt securities of $2.0 million and a net gain on sale of insurance commissions of $2.0 million.
Total assets amounted to $4.47 billion at December 31, 2023, compared to $4.44 billion at December 31, 2022. Investment securities at fair value decreased $152.2 million during the year ended December 31, 2023, due primarily to sales of debt securities as well as principal pay-downs, calls and maturities, partially offset by a decrease in unrealized losses on debt securities. Total loans increased $387.1 million, or 12% versus a year ago with growth primarily in commercial real estate and commercial construction loans.
Credit quality remained strong at December 31, 2023 with the non-performing loan to total loan ratio amounting to 0.32% compared to 0.19% at December 31, 2022. Net charge-offs for 2023 were $105 thousand. The ACL for loans to total loans ratio was 1.65% at December 31, 2023 compared to 1.66% at December 31, 2022.
Customer deposits amounted to $3.98 billion, a decrease of $58.3 million, or 1%. In 2023, the Company experienced a highly competitive marketplace for deposits from bank and non-bank alternatives. As a result, the Company experienced a shift in deposit mix during the year with lower cost checking and savings balances decreasing $313.5 million while higher cost money market and certificate of deposit balances increased $255.2 million.
Shareholders’ equity increased $46.9 million, or 17%, due primarily to an increase in retained earnings of $26.8 million and a decrease in the accumulated other comprehensive loss of $16.4 million with the latter resulting from slightly lower market interest rates at December 31, 2023 compared to December 31, 2022.
42
Selected Financial Data and Ratios
The following table sets forth selected financial data and ratios for the Company at or for the years ended as indicated:
| At or for the year ended December 31, | ||||||||||||||||||||||||||||||||||||||
| (Dollars in thousands, except per share data) | 2023 | 2022 | 2021 | 2020 | 2019 | |||||||||||||||||||||||||||||||||
| Balance Sheet Data | ||||||||||||||||||||||||||||||||||||||
| Total cash and cash equivalents | $ | 56,592 | $ | 267,589 | $ | 436,576 | $ | 253,782 | $ | 63,794 | ||||||||||||||||||||||||||||
| Total investment securities at fair value | 668,171 | 820,371 | 958,215 | 583,049 | 505,255 | |||||||||||||||||||||||||||||||||
| Total loans | 3,567,631 | 3,180,518 | 2,920,684 | 3,073,860 | 2,565,459 | |||||||||||||||||||||||||||||||||
| Allowance for credit losses | (58,995) | (52,640) | (47,704) | (44,565) | (33,614) | |||||||||||||||||||||||||||||||||
| Total assets | 4,466,034 | 4,438,333 | 4,447,819 | 4,014,324 | 3,235,049 | |||||||||||||||||||||||||||||||||
| Total deposits | 3,977,521 | 4,035,806 | 3,980,239 | 3,551,263 | 2,786,730 | |||||||||||||||||||||||||||||||||
| Subordinated debt | 59,498 | 59,182 | 58,979 | 73,744 | 14,872 | |||||||||||||||||||||||||||||||||
| Total shareholders' equity | 329,117 | 282,267 | 346,895 | 334,426 | 296,641 | |||||||||||||||||||||||||||||||||
| Total liabilities and shareholders' equity | 4,466,034 | 4,438,333 | 4,447,819 | 4,014,324 | 3,235,049 | |||||||||||||||||||||||||||||||||
| Wealth Management | ||||||||||||||||||||||||||||||||||||||
Wealth assets under management(1) | $ | 1,077,761 | $ | 891,451 | $ | 1,041,409 | $ | 976,502 | $ | 914,301 | ||||||||||||||||||||||||||||
Wealth assets under administration(1) | $ | 242,338 | $ | 198,586 | $ | 257,867 | $ | 210,900 | $ | 187,501 | ||||||||||||||||||||||||||||
| Shareholders' Equity Ratios | ||||||||||||||||||||||||||||||||||||||
| Book value per common share | $ | 26.82 | $ | 23.26 | $ | 28.82 | $ | 28.01 | $ | 25.09 | ||||||||||||||||||||||||||||
| Dividends paid per common share | $ | 0.92 | $ | 0.82 | $ | 0.74 | $ | 0.70 | $ | 0.64 | ||||||||||||||||||||||||||||
| Regulatory Capital Ratios | ||||||||||||||||||||||||||||||||||||||
| Total capital to risk-weighted assets | 13.12 | % | 13.49 | % | 13.73 | % | 14.62 | % | 11.88 | % | ||||||||||||||||||||||||||||
Tier 1 capital to risk-weighted assets(2) | 10.34 | % | 10.56 | % | 10.62 | % | 10.77 | % | 10.13 | % | ||||||||||||||||||||||||||||
| Tier 1 capital to average assets | 8.74 | % | 8.10 | % | 7.56 | % | 7.52 | % | 8.86 | % | ||||||||||||||||||||||||||||
| Credit Quality Data | ||||||||||||||||||||||||||||||||||||||
| Non-performing loans | $ | 11,414 | $ | 6,122 | $ | 26,522 | $ | 38,050 | $ | 14,771 | ||||||||||||||||||||||||||||
| Non-performing loans to total loans | 0.32 | % | 0.19 | % | 0.91 | % | 1.24 | % | 0.58 | % | ||||||||||||||||||||||||||||
| Non-performing assets to total assets | 0.26 | % | 0.14 | % | 0.60 | % | 0.95 | % | 0.46 | % | ||||||||||||||||||||||||||||
| ACL for loans to total loans | 1.65 | % | 1.66 | % | 1.63 | % | 1.45 | % | 1.31 | % | ||||||||||||||||||||||||||||
| Net charge-offs | $ | 105 | $ | 239 | $ | 3,964 | $ | 1,548 | $ | 1,415 | ||||||||||||||||||||||||||||
| Income Statement Data | ||||||||||||||||||||||||||||||||||||||
| Net interest income | $ | 153,084 | $ | 151,798 | $ | 141,556 | $ | 130,134 | $ | 115,857 | ||||||||||||||||||||||||||||
| Provision for credit losses | 9,249 | 5,800 | 1,770 | 12,499 | 1,180 | |||||||||||||||||||||||||||||||||
| Total non-interest income | 17,609 | 18,462 | 18,107 | 17,247 | 16,319 | |||||||||||||||||||||||||||||||||
| Total non-interest expense | 110,199 | 108,314 | 102,135 | 93,254 | 86,415 | |||||||||||||||||||||||||||||||||
| Income before income taxes | 51,245 | 56,146 | 55,758 | 41,628 | 44,581 | |||||||||||||||||||||||||||||||||
| Provision for income taxes | 13,187 | 13,430 | 13,587 | 10,172 | 10,381 | |||||||||||||||||||||||||||||||||
| Net income | $ | 38,058 | $ | 42,716 | $ | 42,171 | $ | 31,456 | $ | 34,200 | ||||||||||||||||||||||||||||
| Income Statement Ratios | ||||||||||||||||||||||||||||||||||||||
| Diluted earnings per common share | $ | 3.11 | $ | 3.52 | $ | 3.50 | $ | 2.64 | $ | 2.89 | ||||||||||||||||||||||||||||
| Return on average total assets | 0.85 | % | 0.96 | % | 0.98 | % | 0.82 | % | 1.10 | % | ||||||||||||||||||||||||||||
| Return on average shareholders' equity | 12.48 | % | 14.47 | % | 12.49 | % | 9.95 | % | 12.31 | % | ||||||||||||||||||||||||||||
Net interest margin (tax-equivalent)(3) | 3.51 | % | 3.54 | % | 3.44 | % | 3.59 | % | 3.95 | % | ||||||||||||||||||||||||||||
(1)Wealth assets under management and wealth assets under administration are not carried as assets on the Company’s Consolidated Balance Sheet.
(2)Ratio also represents common equity tier 1 capital to risk-weighted assets as of the periods presented.
(3)Tax-equivalent net interest margin is net interest income adjusted for the tax-equivalent effect associated with tax-exempt loan and investment income, expressed as a percentage of average interest-earning assets.
43
Results of Operations
COMPARISON OF YEARS ENDED DECEMBER 31, 2023 AND 2022
Unless otherwise indicated, the reported results are for the year ended December 31, 2023, with the "prior year" referring to the year ended December 31, 2022. Average yields are presented on a tax-equivalent basis.
Net Income
Net income for the year ended December 31, 2023, amounted to $38.1 million, a decrease of $4.7 million, or 11%, compared to the year ended December 31, 2016. Diluted earnings per share were $1.66 for2022. The components of the year ended December 31, 2017, asdecrease in net income compared to $1.70 for the prior year ended December 31, 2016. Diluted earnings per share for the year ended December 31, 2017 includes the full year dilutive impact of the Company’s equity offering issued on June 23, 2016.are discussed below.
Net interest income for the year ended December 31, 20172023, amounted to $97.5$153.1 million, an increase of $10.7$1.3 million, or 12%1%, compared to the year ended December 31, 2016.2022. The increase in net interest income during the current period was due primarilylargely to increases in loan growth. Averageinterest income of $36.6 million and, to a lesser extent, other interest-earning asset income of $3.9 million, partially offset by an increase in deposit interest expense of $38.7 million.
The increase in net interest income of $1.3 million, or 1%, was negatively impacted by increases in funding costs that exceeded the increase in loan balances (including loans held for sale) increased $209.5yields. Additionally, the Company had $2.6 million in PPP related income in 2022 that was not present in the 2023 results.
Net Interest Margin
Net interest margin was 3.51% for the year ended December 31, 2017,2023, compared to the same 2016 period average. Margin was 3.97%3.54% for the year ended December 31, 2017,2022.
Net interest margin compared to 3.94% for the prior year ended December 31, 2016. Seewas impacted by the discussion underfollowing factors:
•Average interest-earning deposits with banks decreased $136.6 million, or 41%, while the heading "Results of Operations" below, in this Item 7, for further information regarding changes in margin.yield increased 322 basis points.
•Average debt securities decreased $90.3 million, or 9%, while the tax-equivalent yield increased 14 basis points.
•Average loan balances increased $293.8 million, or 10%, and the tax-equivalent yield increased 71 basis points.
•Average total deposits increased $28.4 million, or 1%, and the yield increased 95 basis points.
The re-pricing frequencydecrease in net interest margin over the respective periods was due primarily to increases in deposit costs, partially offset by increases in loan and other interest earning assets yields as well as strong loan growth. The increase in loan and other interest earning assets yields were positively impacted by the Federal Reserve Board federal funds rate increases of the Company’s assets525 basis points from March 2022 through July 2023. Deposit costs increased from higher market and liabilities are not identical,competitor interest rates as well as a change in mix as deposits migrated from lower yielding checking and therefore subject the Companysavings products into higher yielding money market and certificate of deposit products compared to the riskrespective periods.
The Company's 12% loan growth in 2023 was funded primarily by interest-earning deposits with banks and investment cash flows, including the sale of adverse changes$84.8 million in interest rates. This is often referred to as "interestdebt securities in June 2023.
Interest rate risk" andrisk is reviewed in more detail inunder the heading Item 7A, "Quantitative and Qualitative Disclosures About Market Risk," of this Form 10-K.10-K, below.
44
Rate/Volume Analysis
The following table sets forth, on a tax-equivalent basis, the extent to which changes in interest rates and changes in the average balances of interest-earning assets and interest-bearing liabilities have affected interest income and expense for the period indicated. For each category of interest-earning assets and interest-bearing liabilities, information is provided on changes attributable to: (i) volume (change in average portfolio balance multiplied by prior year average rate); and (ii) interest rate (change in average interest rate multiplied by prior year average balance). Changes attributable to the combined impact of volume and rate have been allocated proportionately based on absolute value to the changes due to volume and the changes due to rate.
| December 31, | |||||||||||||||||||||||||||||||||||||||||||||||
| 2023 vs 2022 | |||||||||||||||||||||||||||||||||||||||||||||||
| Increase (Decrease) due to | |||||||||||||||||||||||||||||||||||||||||||||||
| (Dollars in thousands) | Net Change | Volume | Rate | ||||||||||||||||||||||||||||||||||||||||||||
| Interest income | |||||||||||||||||||||||||||||||||||||||||||||||
| Loans and loans held for sale (tax-equivalent) | $ | 36,696 | $ | 13,600 | $ | 23,096 | |||||||||||||||||||||||||||||||||||||||||
| Investment securities (tax-equivalent) | (613) | (1,904) | 1,291 | ||||||||||||||||||||||||||||||||||||||||||||
Other interest-earning assets(1) | 3,929 | (3,280) | 7,209 | ||||||||||||||||||||||||||||||||||||||||||||
| Total interest-earning assets (tax-equivalent) | 40,012 | 8,416 | 31,596 | ||||||||||||||||||||||||||||||||||||||||||||
| Interest expense | |||||||||||||||||||||||||||||||||||||||||||||||
| Interest checking, savings, and money market | 26,865 | 38 | 26,827 | ||||||||||||||||||||||||||||||||||||||||||||
| CDs | 11,813 | 2,418 | 9,395 | ||||||||||||||||||||||||||||||||||||||||||||
| Borrowed funds | 61 | 35 | 26 | ||||||||||||||||||||||||||||||||||||||||||||
| Subordinated debt | 115 | 17 | 98 | ||||||||||||||||||||||||||||||||||||||||||||
| Total interest-bearing liabilities | 38,854 | 2,508 | 36,346 | ||||||||||||||||||||||||||||||||||||||||||||
| Change in net interest income (tax-equivalent) | $ | 1,158 | $ | 5,908 | $ | (4,750) | |||||||||||||||||||||||||||||||||||||||||
(1) Income on other interest-earning assets includes interest on deposits, and fed funds sold, and dividends on FHLB stock.
The table on the following page presents the Company's average balance sheet, net interest income and average rates for the years ended December 31, 20172023, 2022 and December 31, 2016, the provisions to the allowance for loan losses amounted to $1.4 million2021:
45
| Average Balances, Interest and Average Yields | ||||||||||||||||||||||||||||||||||||||||||||||||||||||||
| Year ended December 31, 2023 | Year ended December 31, 2022 | Year ended December 31, 2021 | ||||||||||||||||||||||||||||||||||||||||||||||||||||||
| (Dollars in thousands) | Average Balance | Interest(1) | Average Yield(1) | Average Balance | Interest(1) | Average Yield (1) | Average Balance | Interest(1) | Average Yield(1) | |||||||||||||||||||||||||||||||||||||||||||||||
| Assets: | ||||||||||||||||||||||||||||||||||||||||||||||||||||||||
Loans and loans held for sale(2) (tax-equivalent) | $ | 3,328,387 | $ | 173,077 | 5.20 | % | $ | 3,034,608 | $ | 136,381 | 4.49 | % | $ | 2,969,777 | $ | 133,696 | 4.50 | % | ||||||||||||||||||||||||||||||||||||||
Investment securities(3) (tax-equivalent) | 868,137 | 19,278 | 2.22 | % | 955,927 | 19,891 | 2.08 | % | 680,261 | 16,072 | 2.36 | % | ||||||||||||||||||||||||||||||||||||||||||||
Other interest-earning assets(4) | 196,931 | 9,943 | 5.05 | % | 333,433 | 6,014 | 1.80 | % | 501,201 | 682 | 0.14 | % | ||||||||||||||||||||||||||||||||||||||||||||
| Total interest-earning assets (tax-equivalent) | 4,393,455 | 202,298 | 4.60 | % | 4,323,968 | 162,286 | 3.75 | % | 4,151,239 | 150,450 | 3.62 | % | ||||||||||||||||||||||||||||||||||||||||||||
| Other assets | 84,914 | 110,238 | 169,315 | |||||||||||||||||||||||||||||||||||||||||||||||||||||
| Total assets | $ | 4,478,369 | $ | 4,434,206 | $ | 4,320,554 | ||||||||||||||||||||||||||||||||||||||||||||||||||
| Liabilities and shareholders' equity: | ||||||||||||||||||||||||||||||||||||||||||||||||||||||||
| Non-interest checking | $ | 1,233,908 | $ | — | $ | 1,422,618 | $ | — | $ | 1,341,633 | $ | — | ||||||||||||||||||||||||||||||||||||||||||||
| Interest checking, savings and money market | 2,404,132 | 30,956 | 1.29 | % | 2,381,774 | 4,091 | 0.17 | % | 2,249,023 | 1,558 | 0.07 | % | ||||||||||||||||||||||||||||||||||||||||||||
| CDs | 415,840 | 13,433 | 3.23 | % | 221,050 | 1,620 | 0.73 | % | 224,627 | 1,700 | 0.76 | % | ||||||||||||||||||||||||||||||||||||||||||||
| Brokered deposits | — | — | — | % | — | — | — | % | 45,617 | 664 | 1.46 | % | ||||||||||||||||||||||||||||||||||||||||||||
| Total deposits | 4,053,880 | 44,389 | 1.09 | % | 4,025,442 | 5,711 | 0.14 | % | 3,860,900 | 3,922 | 0.10 | % | ||||||||||||||||||||||||||||||||||||||||||||
| Borrowed funds | 5,090 | 113 | 2.23 | % | 3,286 | 52 | 1.58 | % | 7,632 | 60 | 0.79 | % | ||||||||||||||||||||||||||||||||||||||||||||
Subordinated debt(5) | 59,333 | 3,467 | 5.84 | % | 59,050 | 3,352 | 5.68 | % | 62,546 | 3,495 | 5.59 | % | ||||||||||||||||||||||||||||||||||||||||||||
| Total funding liabilities | 4,118,303 | 47,969 | 1.16 | % | 4,087,778 | 9,115 | 0.22 | % | 3,931,078 | 7,477 | 0.19 | % | ||||||||||||||||||||||||||||||||||||||||||||
| Other liabilities | 55,163 | 51,274 | 51,913 | |||||||||||||||||||||||||||||||||||||||||||||||||||||
| Total liabilities | 4,173,466 | 4,139,052 | 3,982,991 | |||||||||||||||||||||||||||||||||||||||||||||||||||||
| Shareholders' equity | 304,903 | 295,154 | 337,563 | |||||||||||||||||||||||||||||||||||||||||||||||||||||
| Total liabilities and shareholders' equity | $ | 4,478,369 | $ | 4,434,206 | $ | 4,320,554 | ||||||||||||||||||||||||||||||||||||||||||||||||||
| Net interest-rate spread (tax-equivalent) | 2.94 | % | 3.41 | % | 3.33 | % | ||||||||||||||||||||||||||||||||||||||||||||||||||
| Net interest income (tax-equivalent) | 154,329 | 153,171 | 142,973 | |||||||||||||||||||||||||||||||||||||||||||||||||||||
| Net interest margin (tax-equivalent) | 3.51 | % | 3.54 | % | 3.44 | % | ||||||||||||||||||||||||||||||||||||||||||||||||||
| Less tax-equivalent adjustment | 1,245 | 1,373 | 1,417 | |||||||||||||||||||||||||||||||||||||||||||||||||||||
| Net interest income | $ | 153,084 | $ | 151,798 | $ | 141,556 | ||||||||||||||||||||||||||||||||||||||||||||||||||
| Net interest margin | 3.48 | % | 3.51 | % | 3.41 | % | ||||||||||||||||||||||||||||||||||||||||||||||||||
_________________________________________
(1)Average yields and $3.0 million, respectively. The decreaseinterest income are presented on a tax-equivalent basis, calculated using a U.S. federal corporate income tax rate of 21% in the years ended 2023, 2022 and 2021, based on tax-equivalent adjustments associated with tax exempt loans and investments interest income.
(2)Average loans and loans held for sale are presented at average amortized cost and include non-accrual loans.
(3)Average investment are presented at average amortized cost.
(4)Average other interest-earning assets includes interest-earning deposits with banks, fed funds sold, and FHLB stock.
(5)The subordinated debt is net of average deferred debt issuance costs.
46
Provision for Credit Losses
The provision for the year ended December 31, 2017 was due primarily to generally improving credit quality metrics and underlying collateral values, partially offset by increased loan growth compared to the prior year.
The primary components of the provision for credit losses during the year ended December 31, 2023, are as follows:
•The provision expense on loans collectively evaluated resulted primarily from growth in commercial real estate and commercial construction loans, partially offset by the impact of a reduction in general reserve factors related to improved economic metrics in our ACL model relative to the prior year were:year.
•The ratio of adversely classifiedACL for loans to total loans amounted to 1.16%ratio was 1.65% at December 31, 2017,2023 compared to 1.70%1.66% at December 31, 2016.2022.
•The provision for unfunded commitments resulted primarily from increases in commitments on construction and commercial real estate commitments.
The balanceprovision for credit losses is a significant factor in the Company's operating results. For further discussion regarding the provision for credit losses and management's assessment of the allowanceadequacy of the ACL for loan losses allocated to impairedloans see "Credit Risk," and adversely classified loans decreased by $1.4 million"ACL for Loans" included in the section titled "Financial Condition," contained in this Item 7 of this Form 10-K above, for further information regarding the provision for credit losses.
Non-Interest Income
Non-interest income for the year ended December 31, 2017,2023, amounted to $17.6 million, a decrease of $853 thousand, or 5%, compared to the prior year.
The following table sets forth the components of non-interest income and the related changes for the periods indicated:
| Year Ended December 31, | ||||||||||||||||||||||||||
| (Dollars in thousands) | 2023 | 2022 | Change | % Change | ||||||||||||||||||||||
| Wealth management fees | $ | 6,730 | $ | 6,533 | $ | 197 | 3 | % | ||||||||||||||||||
| Deposit and interchange fees | 8,475 | 8,196 | 279 | 3 | % | |||||||||||||||||||||
| Income on bank-owned life insurance, net | 1,264 | 1,202 | 62 | 5 | % | |||||||||||||||||||||
| Net losses on sales of debt securities | (2,419) | (1,973) | (446) | 23 | % | |||||||||||||||||||||
| Net gains on sales of loans | 34 | 30 | 4 | 13 | % | |||||||||||||||||||||
| Net gain on sale of insurance commissions | — | 2,034 | (2,034) | 100 | % | |||||||||||||||||||||
| Gain (loss) on equity securities | 666 | (514) | 1,180 | (230) | % | |||||||||||||||||||||
| Other income | 2,859 | 2,954 | (95) | (3) | % | |||||||||||||||||||||
| Total non-interest income | $ | 17,609 | $ | 18,462 | $ | (853) | (5) | % | ||||||||||||||||||
The primary components of the decrease in non-interest income during the year ended December 31, 2023, are as follows:
•Non-interest income for the current year period included losses on sales of debt securities of $2.4 million and gains on equity securities of $666 thousand while non-interest income in the prior year included losses on sales of debt securities of $2.0 million, a gain on the sale of insurance commissions of $2.0 million and losses on equity securities of $514 thousand.
•Excluding these items, non-interest income for the year ended December 31, 2023 increased $446 thousand, or 2%, compared to the year ended December 31, 2022 due primarily to an increase in deposit and interchange fees of $279 thousand which was driven by increases in overdraft income and growth in business customer relationships resulting in greater product transaction volumes.
47
Non-Interest Expense
Non-interest expense for the year ended December 31, 2023, amounted to $110.2 million, an increase of $1.9 million, or 2%, compared to the prior year.
The following table sets forth the components of non-interest expense and the related changes for the periods indicated:
| Year Ended December 31, | ||||||||||||||||||||||||||
| (Dollars in thousands) | 2023 | 2022 | Change | % Change | ||||||||||||||||||||||
| Salaries and employee benefits | $ | 72,283 | $ | 72,120 | $ | 163 | — | % | ||||||||||||||||||
| Occupancy and equipment expenses | 9,722 | 9,299 | 423 | 5 | % | |||||||||||||||||||||
| Technology and telecommunications expenses | 10,656 | 10,735 | (79) | (1) | % | |||||||||||||||||||||
| Advertising and public relations expenses | 2,786 | 2,758 | 28 | 1 | % | |||||||||||||||||||||
| Audit, legal and other professional fees | 2,945 | 2,949 | (4) | — | % | |||||||||||||||||||||
| Deposit insurance premiums | 2,712 | 1,783 | 929 | 52 | % | |||||||||||||||||||||
| Supplies and postage expenses | 998 | 912 | 86 | 9 | % | |||||||||||||||||||||
| Other operating expenses | 8,097 | 7,758 | 339 | 4 | % | |||||||||||||||||||||
| Total non-interest expense | $ | 110,199 | $ | 108,314 | $ | 1,885 | 2 | % | ||||||||||||||||||
The primary components of the increase in non-interest expense during the year ended December 31, 2023, are as follows:
•Deposit insurance premiums increased $929 thousand due to an industry-wide increase in the FDIC insurance assessment rates.
•Salaries and employee benefits expense increased $163 thousand during the year and was favorably impacted by the receipt of $3.6 million in Employee Retention Credits and a decrease in performance-based compensation expense of $1.2 million during the year ended December 31, 2016.2023.
Income Tax Expense
The effective tax rate was 25.7% and 23.9% for the years ended December 31, 2023 and 2022, respectively. The increase in non-interest income over the prior year period was dueeffective tax rate resulted primarily from an increase in state taxes including a transfer of funds from the Bank's investment subsidiary corporations and annual book to increasestax return adjustments that increased tax expense in depositthe fourth quarter of 2023. Refer to Note 15, "Income Taxes," to the Company's consolidated financial statements, contained in Item 8 of this Form 10-K, for additional information about the Company's tax positions.
Results of Operations Comparison of Years Ended December 31, 2022 and interchange fees2021
For a comparison of the results of operations for the years ended December 31, 2022 and investment advisory fees, partially offset by decreases2021, see Part II, Item 7, "Management's Discussion and Analysis of Financial Condition and Results of Operations" in loan sale income.
Financial Condition
Total assets amounted to $76.1 million,$4.47 billion at December 31, 2023, compared to $4.44 billion at December 31, 2022, an increase of $5.8 million, or 8%, over the year ended$27.7 million. The balance sheet composition and changes since December 31, 2016. The increase in expenses over the prior year primarily related to the Company’s strategic growth2022, are discussed below.
Cash and market expansion initiatives, mainly increases in salariescash equivalents
Cash and benefits expenses.
48
compared to $267.6 million at December 31, 2022, a decrease of $211.0 million, or 8%, since79%. As of December 31, 20162023, cash and comprised 14%cash equivalents represented 1% of total assets compared to 6% of total assets at December 31, 20172022. The decrease in cash and cash equivalents since December 31, 2022 was related primarily to funding loan growth.
Investments
At December 31, 2023, the fair value of the investment portfolio amounted to $668.2 million, a decrease of $152.2 million, or 19%, since December 31, 2022. As of December 31, 2023, the investment portfolio represented 15% of total assets as compared to 18% of total assets at December 31, 2016.
During the year ended December 31, 2022, the Company had purchases of $145.9 million in debt securities, principal pay-downs, calls and maturities of $82.8 million, and sold debt securities with an amortized cost of $71.6 million realizing net losses on these sales of $2.0 million.
Sales of debt securities during the years ended December 31, 2023 and 2022 were made in order to improve the Company's balance sheet positioning and enhance future earnings.
Net unrealized losses on the debt securities portfolio amounted to $102.9 million at December 31, 2023, compared to $124.1 million at December 31, 2022. Management has concluded that the unrealized losses resulted from significant increases in market interest rates relative to the book yield on the securities held and that no allowance for credit losses was considered necessary as of December 31, 2023. The Company attributes the decrease in net unrealized losses compared to December 31, 2022 to a decrease in market interest rates at December 31, 2023 compared to December 31, 2022 and from the sale of $84.8 million in debt securities in the second quarter of 2023.
Debt Securities
The following table summarizes the fair value of debt securities at the dates indicated:
| December 31, | ||||||||||||||||||||||||||||||||||||||
| 2023 | 2022 | 2021 | ||||||||||||||||||||||||||||||||||||
| (Dollars in thousands) | Amount | Percent | Amount | Percent | Amount | Percent | ||||||||||||||||||||||||||||||||
| Federal agency obligations | $ | 4,978 | 1 | % | $ | 4,977 | 1 | % | $ | — | — | % | ||||||||||||||||||||||||||
| U.S. treasury securities | 15,925 | 2 | % | 43,251 | 5 | % | 62,166 | 6 | % | |||||||||||||||||||||||||||||
| Federal agency CMO | 334,751 | 50 | % | 406,982 | 50 | % | 486,713 | 51 | % | |||||||||||||||||||||||||||||
| Federal agency MBS | 18,812 | 3 | % | 21,021 | 3 | % | 22,894 | 2 | % | |||||||||||||||||||||||||||||
| Taxable municipal securities | 226,977 | 34 | % | 239,277 | 29 | % | 275,850 | 29 | % | |||||||||||||||||||||||||||||
| Tax-exempt municipal securities | 45,419 | 7 | % | 83,653 | 10 | % | 92,672 | 10 | % | |||||||||||||||||||||||||||||
| Corporate bonds | 3,966 | 1 | % | 6,294 | 1 | % | 9,000 | 1 | % | |||||||||||||||||||||||||||||
| Subordinated corporate bonds | 10,285 | 2 | % | 10,647 | 1 | % | 7,135 | 1 | % | |||||||||||||||||||||||||||||
| Total debt securities | $ | 661,113 | 100 | % | $ | 816,102 | 100 | % | $ | 956,430 | 100 | % | ||||||||||||||||||||||||||
Management continuously monitors and evaluates the debt securities portfolio to identify and assess risks within the portfolio, including, but not limited to, the impact of the current market interest-rate environment, prepayment risk, and credit quality. The mix of debt securities at December 31, 2023, compared to December 31, 2022, remained relatively unchanged. At December 31, 2023, the Company's debt securities portfolio consisted of 56% in U.S. Government or U.S. Federal Agency bonds and 41% in taxable and tax-exempt municipal bonds. The effective duration of debt securities portfolio at December 31, 2023 was approximately 5.1 years compared to 5.0 years at December 31, 2022.
49
The contractual maturity distribution as of December 31, 2023, of the debt securities portfolio with the weighted average tax-equivalent yield for each category is set forth below:
| Under 1 Year | >1 – 5 Years | >5 – 10 Years | Over 10 Years | |||||||||||||||||||||||||||||||||||||||||||||||
| (Dollars in thousands) | Amount | Yield | Amount | Yield | Amount | Yield | Amount | Yield | ||||||||||||||||||||||||||||||||||||||||||
| At amortized cost: | ||||||||||||||||||||||||||||||||||||||||||||||||||
| Federal agency obligations | $ | 5,006 | 4.20 | % | $ | — | — | % | $ | — | — | % | $ | — | — | % | ||||||||||||||||||||||||||||||||||
| U.S. treasury securities | 9,995 | 0.71 | % | 6,998 | 1.01 | % | — | — | % | — | — | % | ||||||||||||||||||||||||||||||||||||||
| Federal agency CMO | 8,388 | 2.39 | % | 9,615 | 2.85 | % | 4,962 | 1.61 | % | 373,700 | 1.88 | % | ||||||||||||||||||||||||||||||||||||||
| Federal agency MBS | — | — | % | 5,911 | 2.75 | % | 375 | 2.66 | % | 15,300 | 2.33 | % | ||||||||||||||||||||||||||||||||||||||
| Taxable municipal securities | 960 | 3.02 | % | 38,775 | 2.59 | % | 220,433 | 2.22 | % | 2,000 | 2.57 | % | ||||||||||||||||||||||||||||||||||||||
| Tax-exempt municipal securities | 5,708 | 3.17 | % | 21,289 | 3.20 | % | 14,582 | 3.42 | % | 3,969 | 3.12 | % | ||||||||||||||||||||||||||||||||||||||
| Corporate bonds | 600 | 3.94 | % | 3,259 | 3.62 | % | 199 | 3.94 | % | — | — | % | ||||||||||||||||||||||||||||||||||||||
| Subordinated corporate bonds | — | — | % | — | — | % | 11,957 | 3.97 | % | — | — | % | ||||||||||||||||||||||||||||||||||||||
| Total debt securities | $ | 30,657 | 2.33 | % | $ | 85,847 | 2.69 | % | $ | 252,508 | 2.36 | % | $ | 394,969 | 1.91 | % | ||||||||||||||||||||||||||||||||||
| Total debt securities at fair value | $ | 30,252 | $ | 81,696 | $ | 217,720 | $ | 331,445 | ||||||||||||||||||||||||||||||||||||||||||
Scheduled contractual maturities shown above may not reflect the actual maturities of the investments. The actual MBS/CMO cash flows likely will be faster than presented above due to prepayments and amortization. Similarly, included in the table above are callable securities, comprised of municipal securities and corporate bonds, with a fair value of $133.4 million, which can be redeemed by the issuer prior to the maturity presented above. Management considers these factors when evaluating the interest-rate risk in the Company's asset-liability management program.
Loans
This discussion should be read in conjunction with the material presented in Item 1, "Business," under the heading "Lending Products" of this Form 10-K, above.
At December 31, 2023, total loans amounted to $2.27$3.6 billion, at December 31, 2017, compared to $2.02 billion at December 31, 2016, an increase of $247.2$387.1 million, or 12%, comprising 81%since December 31, 2022. As of December 31, 2023, total loans represented 80% of total assets, compared to 72% of total assets at December 31, 20172022.
The following table sets forth the loan balances by certain loan categories at the dates indicated and 80% atthe percentage of each category to total loans:
| December 31, | ||||||||||||||||||||||||||||||||||||||||||||||||||||||||||||||
| 2023 | 2022 | 2021 | ||||||||||||||||||||||||||||||||||||||||||||||||||||||||||||
| (Dollars in thousands) | Amount | Percent | Amount | Percent | Amount | Percent | ||||||||||||||||||||||||||||||||||||||||||||||||||||||||
| Commercial real estate | $ | 2,064,737 | 58 | % | $ | 1,921,410 | 61 | % | $ | 1,680,792 | 58 | % | ||||||||||||||||||||||||||||||||||||||||||||||||||
| Commercial and industrial | 430,749 | 12 | % | 414,490 | 13 | % | 412,070 | 14 | % | |||||||||||||||||||||||||||||||||||||||||||||||||||||
| Commercial construction | 585,113 | 16 | % | 424,049 | 13 | % | 410,443 | 14 | % | |||||||||||||||||||||||||||||||||||||||||||||||||||||
| SBA PPP | — | — | % | — | — | % | 71,502 | 2 | % | |||||||||||||||||||||||||||||||||||||||||||||||||||||
| Total commercial loans | 3,080,599 | 86 | % | 2,759,949 | 87 | % | 2,574,807 | 88 | % | |||||||||||||||||||||||||||||||||||||||||||||||||||||
| Residential mortgages | 393,142 | 11 | % | 332,632 | 10 | % | 256,940 | 9 | % | |||||||||||||||||||||||||||||||||||||||||||||||||||||
| Home equity | 85,375 | 3 | % | 79,807 | 3 | % | 80,467 | 3 | % | |||||||||||||||||||||||||||||||||||||||||||||||||||||
| Consumer | 8,515 | — | % | 8,130 | — | % | 8,470 | — | % | |||||||||||||||||||||||||||||||||||||||||||||||||||||
| Total retail loans | 487,032 | 14 | % | 420,569 | 13 | % | 345,877 | 12 | % | |||||||||||||||||||||||||||||||||||||||||||||||||||||
| Total loans | 3,567,631 | 100 | % | 3,180,518 | 100 | % | 2,920,684 | 100 | % | |||||||||||||||||||||||||||||||||||||||||||||||||||||
| Allowance for credit losses | (58,995) | (52,640) | (47,704) | |||||||||||||||||||||||||||||||||||||||||||||||||||||||||||
| Net loans | $ | 3,508,636 | $ | 3,127,878 | $ | 2,872,980 | ||||||||||||||||||||||||||||||||||||||||||||||||||||||||
50
As of or for the year ended December 31, 2016. Total2023:
•Commercial real estate loans increased $143.3 million, or 7%, compared to December 31, 2022. The commercial real estate segment was the largest segment of the loan portfolio and was comprised of approximately 30% in owner occupied loans and 70% in non-owner occupied loans. The composition of owner and non-owner occupied loans within the commercial real estate segment has remained relatively consistent compared to December 31, 2022.
◦Non-owner occupied commercial real estate loans were comprised of approximately 46% residential (multi-family and 1-4 family), 11% retail, 10% office and 10% in industrial warehouse. All other collateral categories fell below 10% of total non-owner occupied commercial real estate loans.
◦Non-owner occupied commercial real estate secured by retail amounted to $1.98 billion,4% of total loans and consisted mostly local strip plazas and not large shopping centers or 87%mall complexes.
◦Non-owner occupied commercial real estate secured by office buildings amounted to 4% of grosstotal loans atand were located mainly in suburban areas and were modest in physical size.
•Commercial and industrial loans increased $16.3 million, or 4%, compared to December 31, 2017, which was relatively consistent with the composition at2022.
•Commercial construction loans increased $161.1 million, or 38%, since December 31, 2016.2022, particularly in the 4th quarter of 2023, driven primarily by residential development projects to meet the strong demand in our market area.
◦Commercial construction loans were comprised of approximately 21% multi-family, 18% residential condominiums, 16% land approved for development, 12% single residential lots and 12% commercial buildings. All other collateral categories fell below 10% of total commercial construction loans.
At December 31, 2023, commercial loan balances participated out to various banks amounted to $69.8 million, compared to $2.21 billion at December 31, 2016, or 87% of total assets, an increase of $84.3 million, or 4%. During the year, the increase was primarily due to increases in checking account balances (mainly non-interest bearing accounts), partially offset by decreases in money market account balances.
See also Note 3, "Loans," to the Company's consolidated financial statements, contained in Item 8 of total assets, an increasethis Form 10-K, below, for information on related party loans, loans serviced for others and loans pledged as collateral.
51
The Company's business model is to provide a full range of diversified financial products and services through a highly-trained staff of knowledgeable banking professionals, with in-depth understanding of our markets, and a commitment to open and honest communication with clients. Management believesfollowing table sets forth the Company has differentiated itself from the competition by building a solid reputation within the local market as a dependable commercial-focused community bank, delivering consistent and exceptional customer service, offering competitive products and taking an active role in support of the communities we serve. The Company's banking professionals are committed to upholding the Company's core values, including significant and active involvement in many charitable and civic organizations, and community development programs throughout our service area. This long-held commitment to community not only contributes to the welfare of the communities we serve, it also helps to fuel the local economy and has led to a strong referral network with local businesses, non-profit organizations and community leaders. Management believes the Company's community service culture and reputation makes the Enterprise team stand out among the competition and positions the Company to be a leading banking provider of loans, deposits and cash management services, investment advisory and wealth management, trust and insurance services in its growing market area.
| (Dollars in thousands) | Commercial Real Estate | Commercial & Industrial | Commercial Construction | |||||||||||||||||||||||
Amounts due(1): | ||||||||||||||||||||||||||
| One year or less, and demand notes | $ | 102,737 | $ | 282,823 | $ | 298,807 | ||||||||||||||||||||
| After one year through five years | 424,598 | 75,830 | 97,426 | |||||||||||||||||||||||
| After five years through fifteen years | 1,226,432 | 68,772 | 159,743 | |||||||||||||||||||||||
| Beyond fifteen years | 310,970 | 3,324 | 29,137 | |||||||||||||||||||||||
| $ | 2,064,737 | $ | 430,749 | $ | 585,113 | |||||||||||||||||||||
| Interest rate terms on amounts due after one year: | ||||||||||||||||||||||||||
| Fixed | $ | 186,918 | $ | 71,637 | $ | 28,004 | ||||||||||||||||||||
Adjustable(2) | $ | 1,775,082 | $ | 76,289 | $ | 258,302 | ||||||||||||||||||||
(1) Scheduled contractual maturities may not reflect the actual maturities of defaultloans. The average maturity of loans may be shorter than owner occupied residential real estate loans or consumer loans. Any significant deterioration in the credit quality of the commercial loan portfolio or underlying collateral valuestheir contractual terms principally due to prepayments and demand features.
(2) Adjustable-rate loans may have fixed initial periods before periodic rate adjustments begin.
Credit Risk
Non-performing assets are comprised of non-accrual loans (loans contractually past due, with respect to interest or principal, by 90 days, or where reasonable doubt exists as to the full and timely collection of interest or principal), and OREO. The designation of a downturn in the economic environment,loan or other factors, could have a material adverse effect onasset as non-performing does not necessarily indicate that loan principal and interest will ultimately be uncollectible. However, management recognizes the Company's financial conditiongreater risk characteristics of these assets and results of operations. Thetherefore considers the potential risk of loss due to customers' non-payment of loans or lines of credit is called "credit risk.” Credit risk management is reviewed belowon assets included in this Item 7 undercategory in evaluating the headings "Credit Risk," "Asset Quality" and "Allowance for Loan Losses."
See item (g) "Loans" contained in Note 1, "Summary of Significant Accounting Policies" of this Form 10-K, for additional information on the Company's loan accounting policies and Credit Risk monitoring.
52
The following table sets forth information regarding non-performing assets and delinquent loans 60-89 days past due as to interest or principal, held by the Company at the dates indicated:
| December 31, | ||||||||||||||||||||||||||||||||
| (Dollars in thousands) | 2023 | 2022 | 2021 | |||||||||||||||||||||||||||||
| Total adversely classified loans | $ | 56,650 | $ | 46,998 | $ | 61,013 | ||||||||||||||||||||||||||
| Performing adversely classified loans | $ | 45,266 | $ | 40,876 | $ | 34,494 | ||||||||||||||||||||||||||
| Non-accrual loan summary: | ||||||||||||||||||||||||||||||||
| Commercial real estate | $ | 5,369 | $ | 3,355 | $ | 22,870 | ||||||||||||||||||||||||||
| Commercial and industrial | 4,262 | 730 | 1,542 | |||||||||||||||||||||||||||||
| Commercial construction | — | 294 | 1,045 | |||||||||||||||||||||||||||||
| Residential mortgages | 1,526 | 1,532 | 794 | |||||||||||||||||||||||||||||
| Home equity | 257 | 211 | 246 | |||||||||||||||||||||||||||||
| Consumer | — | — | 25 | |||||||||||||||||||||||||||||
| Total non-performing loans | $ | 11,414 | $ | 6,122 | $ | 26,522 | ||||||||||||||||||||||||||
| Total Loans | $ | 3,567,631 | $ | 3,180,518 | $ | 2,920,684 | ||||||||||||||||||||||||||
| Loans 60-89 days past due and still accruing to total loans | — | % | 0.04 | % | — | % | ||||||||||||||||||||||||||
| Non-performing loans to total loans | 0.32 | % | 0.19 | % | 0.91 | % | ||||||||||||||||||||||||||
| Non-performing assets to total assets | 0.26 | % | 0.14 | % | 0.60 | % | ||||||||||||||||||||||||||
| Allowance for credit losses for loans | $ | 58,995 | $ | 52,640 | $ | 47,704 | ||||||||||||||||||||||||||
| Allowance for credit losses for loans to non-performing loans | 516.87 | % | 859.85 | % | 179.87 | % | ||||||||||||||||||||||||||
| Allowance for credit losses for loans to total loans | 1.65 | % | 1.66 | % | 1.63 | % | ||||||||||||||||||||||||||
Non-accrual loans that were not adversely classified amounted to $30 thousand and $3 thousand at December 31, 2023 and December 31, 2021, respectively. At December 31, 2022, there were no non-accrual loans that were not adversely classified.
Loans which are evaluated to be of weaker credit quality are classified as adverse and placed on the Company's "watch asset list" and reviewed on a more frequent basis by management. Adversely classified loans may be performing in accordance with their original terms or past due in respect to principal or interest and therefore additionally classified as non-performing loans.
Adversely classified loans as a percentage of total loans outstanding at December 31, 2023 increased compared to low levels at December 31, 2022, however the December 31, 2023 level was also considered low by historical comparisons.
The increase in non-accrual loans from December 31, 2022 to December 31, 2023 was attributable primarily to one commercial loan relationship with a net interestbook value of $4.8 million. The relationship consists of a $1.4 million commercial real estate loan and a $3.4 million commercial and industrial loan. At December 31, 2023, the relationship was individually evaluated and had a specific reserve allocation of $2.5 million.
The Company had no OREO at December 31, 2023, December 31, 2022 or December 31, 2021, and therefore non-performing loans were the only component of non-performing assets at those periods.
ACL for Loans
There have been no material changes to the Company's ACL for loans methodology, underwriting practices, or credit risk management system used to estimate credit loss exposure since December 31, 2022. See item (h) "Credit Risk Management and ACL for Loans Methodology" contained in Note 1, "Summary of Significant Accounting Policies" of this Form 10-K, for additional information on the Company's loan accounting policies, Credit Risk monitoring, and ACL methodology.
53
The following table sets forth the allocation of the Company's ACL among the categories of loans, the percentage of ACL allocated by category of loans to the total ACL, and the percentage of loans in each category to total loans for the periods ending on the respective dates indicated:
| December 31, | ||||||||||||||||||||||||||||||||||||||||||||||||||||||||||||||||||||||||||||||||
| 2023 | 2022 | 2021 | ||||||||||||||||||||||||||||||||||||||||||||||||||||||||||||||||||||||||||||||
| (Dollars in thousands) | ACL Allocation | % of ACL Allocation | % of Total Loans | ACL Allocation | % of ACL Allocation | % of Total Loans | ACL Allocation | % of ACL Allocation | % of Total Loans | |||||||||||||||||||||||||||||||||||||||||||||||||||||||||||||||||||||||
| Commercial real estate | $ | 38,074 | 65 | % | 58 | % | $ | 36,564 | 69 | % | 61 | % | $ | 31,847 | 67 | % | 58 | % | ||||||||||||||||||||||||||||||||||||||||||||||||||||||||||||||
| Commercial and industrial | 11,089 | 19 | % | 12 | % | 8,896 | 17 | % | 13 | % | 9,574 | 20 | % | 14 | % | |||||||||||||||||||||||||||||||||||||||||||||||||||||||||||||||||
| Commercial construction | 6,787 | 11 | % | 16 | % | 3,961 | 8 | % | 13 | % | 4,090 | 8 | % | 14 | % | |||||||||||||||||||||||||||||||||||||||||||||||||||||||||||||||||
| SBA PPP | — | — | % | — | % | — | — | % | — | % | — | — | % | 2 | % | |||||||||||||||||||||||||||||||||||||||||||||||||||||||||||||||||
| Residential mortgages | 2,152 | 4 | % | 11 | % | 2,255 | 4 | % | 10 | % | 1,405 | 3 | % | 9 | % | |||||||||||||||||||||||||||||||||||||||||||||||||||||||||||||||||
| Home equity | 579 | 1 | % | 3 | % | 633 | 1 | % | 3 | % | 465 | 1 | % | 3 | % | |||||||||||||||||||||||||||||||||||||||||||||||||||||||||||||||||
| Consumer | 314 | — | % | — | % | 331 | 1 | % | — | % | 323 | 1 | % | — | % | |||||||||||||||||||||||||||||||||||||||||||||||||||||||||||||||||
| Total | $ | 58,995 | 100 | % | 100 | % | $ | 52,640 | 100 | % | 100 | % | $ | 47,704 | 100 | % | 100 | % | ||||||||||||||||||||||||||||||||||||||||||||||||||||||||||||||
54
The following table summarizes the activity in the ACL for loans for the periods indicated:
| Years Ended December 31, | ||||||||||||||||||||||||||||||||
| (Dollars in thousands) | 2023 | 2022 | 2021 | 2020 | 2019 | |||||||||||||||||||||||||||
| Beginning balance | $ | 52,640 | $ | 47,704 | $ | 44,565 | $ | 33,614 | $ | 33,849 | ||||||||||||||||||||||
| Day one CECL adjustment | — | — | 6,560 | — | — | |||||||||||||||||||||||||||
| Provision charged to operations | 6,460 | 5,175 | 543 | 12,499 | 1,180 | |||||||||||||||||||||||||||
| Recoveries on charged-off loans: | ||||||||||||||||||||||||||||||||
| Commercial real estate | — | — | 39 | — | — | |||||||||||||||||||||||||||
| Commercial and industrial | 497 | 242 | 139 | 265 | 734 | |||||||||||||||||||||||||||
| Commercial construction | 1 | — | 105 | — | — | |||||||||||||||||||||||||||
| SBA PPP | — | — | — | — | — | |||||||||||||||||||||||||||
| Residential mortgages | — | — | — | — | — | |||||||||||||||||||||||||||
| Home equity | 12 | 11 | 71 | 45 | 9 | |||||||||||||||||||||||||||
| Consumer | 17 | 19 | 9 | 36 | 35 | |||||||||||||||||||||||||||
| Total recovered | $ | 527 | $ | 272 | $ | 363 | $ | 346 | $ | 778 | ||||||||||||||||||||||
| Charged-off loans: | ||||||||||||||||||||||||||||||||
| Commercial real estate | — | 250 | 1,825 | — | — | |||||||||||||||||||||||||||
| Commercial and industrial | 596 | 210 | 2,477 | 561 | 2,069 | |||||||||||||||||||||||||||
| Commercial construction | — | — | — | 1,300 | — | |||||||||||||||||||||||||||
| SBA PPP | — | — | — | — | — | |||||||||||||||||||||||||||
| Residential mortgages | — | — | — | — | — | |||||||||||||||||||||||||||
| Home equity | — | — | — | — | — | |||||||||||||||||||||||||||
| Consumer | 36 | 51 | 25 | 33 | 124 | |||||||||||||||||||||||||||
| Total charged-off | $ | 632 | $ | 511 | $ | 4,327 | $ | 1,894 | $ | 2,193 | ||||||||||||||||||||||
| Net loans charged-off | $ | 105 | $ | 239 | $ | 3,964 | $ | 1,548 | $ | 1,415 | ||||||||||||||||||||||
| Ending balance | $ | 58,995 | $ | 52,640 | $ | 47,704 | $ | 44,565 | $ | 33,614 | ||||||||||||||||||||||
| Average loans outstanding | $ | 3,328,729 | $ | 3,035,012 | $ | 2,969,371 | $ | 2,984,100 | $ | 2,430,912 | ||||||||||||||||||||||
| Net charge-offs to average loans | — | % | 0.01 | % | 0.13 | % | 0.05 | % | 0.06 | % | ||||||||||||||||||||||
| Recoveries to charge-offs | 83.39 | % | 53.23 | % | 8.39 | % | 18.27 | % | 35.48 | % | ||||||||||||||||||||||
| Net loans charged-off to allowance | 0.18 | % | 0.45 | % | 8.31 | % | 3.47 | % | 4.21 | % | ||||||||||||||||||||||
Reserve for unfunded commitments
The reserve for unfunded commitments is classified within "Other liabilities" on the Company's Consolidated Balance Sheets. The estimate of credit loss incorporates assumptions for both the likelihood and amount of funding over the estimated life of the commitments, including adjustments for current conditions and reasonable and supportable forecasts. Management periodically reviews and updates its assumptions for estimated funding rates.
The Company’s reserve for unfunded commitments amounted to $7.1 million as of December 31, 2023 and $4.3 million at December 31, 2022. The provision for unfunded commitments amounted to $2.8 million compared to $625 thousand for the years ended December 31, 2023 and December 31, 2022, respectively. The increase in the provision for unfunded commitments resulted primarily from growth in the Company's off-balance sheet commercial construction and commercial real estate commitments.
Based on the foregoing, management believes that the Company's ACL for loans and reserve for unfunded commitments is adequate as of December 31, 2023.
55
Deposits
As of December 31, 2023, total deposits amounted to $3.98 billion, a decrease of $58.3 million, or 1%, compared to December 31, 2022. Total deposits represented 89% of total assets at December 31, 2023, and 91% at December 31, 2022.
The following table sets forth the deposit balances by certain categories as of the dates indicated and the percentage of each category to total deposits:
| December 31, 2023 | December 31, 2022 | December 31, 2021 | ||||||||||||||||||||||||||||||||||||
| (Dollars in thousands) | Amount | Percent | Amount | Percent | Amount | Percent | ||||||||||||||||||||||||||||||||
| Non-interest checking | $ | 1,070,104 | 27 | % | $ | 1,361,588 | 34 | % | $ | 1,364,258 | 34 | % | ||||||||||||||||||||||||||
| Interest-bearing checking | 697,632 | 18 | % | 678,715 | 17 | % | 743,587 | 19 | % | |||||||||||||||||||||||||||||
| Savings | 285,770 | 7 | % | 326,666 | 8 | % | 310,244 | 8 | % | |||||||||||||||||||||||||||||
| Money markets | 1,402,939 | 35 | % | 1,381,645 | 34 | % | 1,355,701 | 34 | % | |||||||||||||||||||||||||||||
| CDs | 521,076 | 13 | % | 287,192 | 7 | % | 206,449 | 5 | % | |||||||||||||||||||||||||||||
| Deposits | $ | 3,977,521 | 100 | % | $ | 4,035,806 | 100 | % | $ | 3,980,239 | 100 | % | ||||||||||||||||||||||||||
During 2023, the Company experienced a shift in deposit mix as funds moved primarily from non-interest checking accounts to higher yielding certificates of deposit accounts.
The Company offers its customers the ability to enhance FDIC insurance coverage by electing to participate a portion of their deposit balance into nationwide deposit networks, with an equal and reciprocal balance deposited to the Company through the network. The Company’s total customer deposit balances reflect the reciprocal deposits received from other banks' customers participating in the programs. Essentially, the equivalent of the original customers' deposited funds comes back to the Company and are carried within the appropriate category under total customer deposits. Additional capacity to utilize these enhanced FDIC insured products exceeds the Company's total deposits balance. The Company's balances in these reciprocal products were $835.0 million, $589.7 million, and $546.7 million at December 31, 2023, December 31, 2022, and December 31, 2021, respectively. Savings accounts are not eligible for this program.
The following table shows the scheduled maturities of CDs greater than $250,000:
| (Dollars in thousands) | December 31, 2023 | December 31, 2022 | ||||||||||||
| Due in three months or less | $ | 49,545 | $ | 12,696 | ||||||||||
| Due in greater than three months through six months | 82,034 | 17,092 | ||||||||||||
| Due in greater than six months through twelve months | 86,622 | 46,423 | ||||||||||||
| Due in greater than twelve months | 7,086 | 23,223 | ||||||||||||
| Total CDs greater than $250,000 | $ | 225,287 | $ | 99,434 | ||||||||||
56
The table below sets forth a comparison of the Company's average deposits, and average rates paid for the periods indicated, as well as the percentage of each deposit category to total average deposits. The annualized average rate on total deposits reflects both interest-bearing and non-interest-bearing deposits.
| Year ended December 31, | ||||||||||||||||||||||||||||||||||||||||||||||||||||||||
| 2023 | 2022 | 2021 | ||||||||||||||||||||||||||||||||||||||||||||||||||||||
| (Dollars in thousands) | Average Balance | Average Rate | Average Balance | Average Rate | Average Balance | Average Rate | ||||||||||||||||||||||||||||||||||||||||||||||||||
| Non-interest checking | $ | 1,233,908 | — | % | $ | 1,422,618 | — | % | $ | 1,341,633 | — | % | ||||||||||||||||||||||||||||||||||||||||||||
| Interest checking | 685,347 | 0.38 | % | 696,639 | 0.07 | % | 651,985 | 0.03 | % | |||||||||||||||||||||||||||||||||||||||||||||||
| Savings | 301,172 | 0.16 | % | 336,881 | 0.05 | % | 293,868 | 0.04 | % | |||||||||||||||||||||||||||||||||||||||||||||||
| Money market | 1,417,613 | 1.96 | % | 1,348,254 | 0.25 | % | 1,303,170 | 0.09 | % | |||||||||||||||||||||||||||||||||||||||||||||||
| Total interest-bearing non-term deposits | 2,404,132 | 1.29 | % | 2,381,774 | 0.17 | % | 2,249,023 | 0.07 | % | |||||||||||||||||||||||||||||||||||||||||||||||
| CDs | 415,840 | 3.23 | % | 221,050 | 0.73 | % | 224,627 | 0.76 | % | |||||||||||||||||||||||||||||||||||||||||||||||
| Total customer deposits | 4,053,880 | 1.09 | % | 4,025,442 | 0.14 | % | 3,815,283 | 0.09 | % | |||||||||||||||||||||||||||||||||||||||||||||||
| Brokered deposits | — | — | % | — | — | % | 45,617 | 1.46 | % | |||||||||||||||||||||||||||||||||||||||||||||||
| Total | $ | 4,053,880 | 1.09 | % | $ | 4,025,442 | 0.14 | % | $ | 3,860,900 | 0.10 | % | ||||||||||||||||||||||||||||||||||||||||||||
Borrowed Funds
At December 31, 2023 and December 31, 2022, borrowed funds amounted to $25.8 million and $3.2 million, respectively, and were comprised of advances from the FRB, FHLB and NH BFA.
The table below shows the comparison of the Company's average borrowed funds and average rates paid for the periods indicated:
| Year ended December 31, | ||||||||||||||||||||||||||||||||||||||
| 2023 | 2022 | 2021 | ||||||||||||||||||||||||||||||||||||
| (Dollars in thousands) | Average Balance | Average Cost | Average Balance | Average Cost | Average Balance | Average Cost | ||||||||||||||||||||||||||||||||
| FHLB advances | $ | 3,548 | 2.65 | % | $ | 3,266 | 1.59 | % | $ | 7,632 | 0.79 | % | ||||||||||||||||||||||||||
| FRB advances | 534 | 3.39 | % | — | — | % | — | — | % | |||||||||||||||||||||||||||||
| Other borrowed funds | 1,008 | 0.13 | % | 20 | — | % | — | — | % | |||||||||||||||||||||||||||||
| Total borrowed funds | $ | 5,090 | 2.23 | % | $ | 3,286 | 1.58 | % | $ | 7,632 | 0.79 | % | ||||||||||||||||||||||||||
In the table above, "Other borrowings" represent term NH BFA advances or advances from correspondent banks, advanced as part of our annual test of these external funding facilities.
Subordinated Debt
The Company had outstanding subordinated debt, net of deferred issuance costs, of $59.5 million at December 31, 2023, and $59.2 million at December 31, 2022. The subordinated notes are due in 2030 and have a fixed rate of 5.25% through July 15, 2025, at which point the notes become callable and floating through maturity. The subordinated notes qualify as Tier 2 capital at the holding company of the bank for regulatory purposes.
Shareholders' Equity
Total shareholders' equity amounted to $329.1 million at December 31, 2023, compared to $282.3 million at December 31, 2022, an increase of $46.9 million, or 17%. The increase was due primarily to an increase in retained earnings of $26.8 million, consisting primarily of $38.1 million in net income less 9.7 million in dividends, net of reinvestment, and resultsa decrease in the accumulated other comprehensive loss of operations. In addition, if the$16.4 million resulting from lower market interest rates paidand the sale of $84.8 million in debt securities in the second quarter of 2023.
For the years ended December 31, 2023 and December 31, 2022, the Company declared cash dividends of $11.2 million and
57
$9.9 million, respectively, and shareholders utilized the dividend reinvestment portion of the Company's dividend reinvestment and direct stock purchase plan to purchase aggregate shares of the Company's common stock amounting to 50,443 shares and 40,640 shares, totaling $1.5 million and $1.4 million, respectively.
Derivatives and Hedging
Derivatives designated as hedging instruments
During the year ended December 31, 2023, the Company entered into three pay fixed, receive float, interest rate swap agreements all with a 2-year term. Under these interest rate swap agreements, the Company pays a weighted average fixed interest rate of 4.68% and receives the Secured Overnight Financing Rate. At December 31, 2023, the notional value of interest rate swap agreements designated as fair value hedges amounted to $100.0 million and the fair value of these interest rate swap agreements, carried on interest-bearingthe Company's Consolidated Balance Sheets a liability, was $760 thousand at December 31, 2023.
Derivatives not subject to hedge accounting
The notional value of back-to-back interest-rate swaps with customers and counterparties amounted to $7.5 million at December 31, 2023 and $7.8 million at December 31, 2022. The fair value of assets and corresponding liabilities increaseassociated with these swaps and carried on the Company's Consolidated Balance Sheets was $630 thousand at December 31, 2023, compared to $782 thousand at December 31, 2022.
Risk Participation Agreements
The notional value of RPAs sold amounted to $46.9 million at December 31, 2023 and $24.7 million at December 31, 2022. The fair value of RPAs, carried on the Company's Consolidated Balance Sheets as a faster rate or magnitude thanliability, was $65 thousand at December 31, 2023 and $73 thousand at December 31, 2022.
Liquidity
Liquidity is the interest rates received onability to meet cash needs arising from, among other things, fluctuations in loans, investments, deposits, and other investments, the Company’s net interest income, and therefore earnings, could be adversely affected. Interest rate risk is reviewed in more detail under the heading Item 7A, “Quantitative and Qualitative Disclosures About Market Risk,” below.
borrowings. Liquidity management is the coordination of activities so that cash needs are anticipated and met readily and efficiently. LiquidityThe Company's liquidity policies are set and monitored by the Company's Board. The duties and responsibilities related to asset-liability management matters are also covered by the Board. The Company's asset-liability objectives are to engage in sound balance sheet management strategies, maintain liquidity, provide and enhance access to a diverse and stable source of funds, provide competitively priced and attractive products to customers and conduct funding at a low-cost relative to current market conditions. Funds gathered are used to support current commitments, to fund earning asset growth, and to take advantage of selected leverage opportunities.
The Company's liquidity is maintained by projecting cash needs, balancing maturing assets with maturing liabilities, monitoring various liquidity ratios, monitoring deposit flows, maintaining cash flow within the investment portfolio, and maintaining wholesale funding resources.
The Company's wholesale funding sources included primarily borrowing capacity at the FHLB, FRB and brokered deposits. At December 31, 2023, the Bank had the capacity to borrow additional funds from the FHLB and FRB of up to approximately $860.0 million and $320.0 million, respectively.
Management believes that the Company has adequate liquidity to meet its obligations. However, if general economic conditions or other events, cause these sources of external funding to become restricted or are eliminated, the Company may not be able to raise adequate funds or may incur substantially higher funding costs or operating restrictions in order to raise the necessary funds to support the Company's operations and growth.
Capital Resources
The principal cash requirement of the Company is the payment of interest on subordinated debt and the payment of dividends on our common stock. The Company's Board may approve cash dividends on a quarterly basis after careful analysis and consideration of various factors, including our capital position, economic conditions, growth rates, earnings performance and projections as well as strategic initiatives and related regulatory capital requirements.
58
The Company's primary source of cash is dividends paid by the Bank, which are limited to the Bank's net income for the current year plus its retained net income for the prior two years.
The Company is subject to various regulatory capital requirements administered by the federal banking agencies. The Company's capital policies and capital levels are monitored internally on a quarterly basis and capital planning is reviewed further belowat least annually by the Board.
Failure to meet minimum capital requirements can initiate or result in this Item 7 undercertain mandatory and possible additional discretionary supervisory actions by regulators, which if undertaken, could have a material adverse effect on the heading "Liquidity."
The Company's total capital or changesand tier 1 capital to risk-weighted assets amounted to 13.12% and 10.34%, respectively, at December 31, 2023, compared to 13.49% and 10.56%, respectively, at December 31, 2022. The decrease in regulatory requirements such aseach ratio was due primarily to strong commercial loan growth, partially offset by an increase in retained earnings, over the phase-in requirements under Basel III, could impact those regulatoryrespective periods.
Tier 1 capital designations. Forto average assets amounted to 8.74% at December 31, 2023, compared to 8.10% at December 31, 2022. The increase was driven primarily by the increase in retained earnings noted above, partially offset by an increase in average assets.
See also Note 12, "Shareholders' Equity," to the Company's consolidated financial statements, contained in Item 8 of this Form 10-K below, for additional information regarding the current capital requirements applicable to the Company and the Bank and their respective capital levels at December 31, 2017, and changes to2023. For additional information on the regulatoryCompany's capital framework,planning, see the section within Item 1, “Business,” entitled "Capital Resources" and the sections "Capital Requirements" and "Capital Requirements under Basel III' within "Supervision and Regulation" and Note 10, "Stockholders' Equity” to the consolidated financial statements contained in Item 8 "Financial Statements1, "Business," of this Form 10-K.
Contractual Obligations and Supplementary Data."Commitments
| Payments Due by Period | ||||||||||||||||||||||||||||||||
| (Dollars in thousands) | Total | With-in 1 Year | >1 – 5 Years | >5 – 15 Years | After 15 Years | |||||||||||||||||||||||||||
| Contractual cash obligations: | ||||||||||||||||||||||||||||||||
| CDs | $ | 521,076 | $ | 494,320 | $ | 26,718 | $ | 38 | $ | — | ||||||||||||||||||||||
| FHLB borrowings | 2,830 | — | — | — | 2,830 | |||||||||||||||||||||||||||
| Other borrowings | 22,938 | 20,000 | 270 | — | 2,668 | |||||||||||||||||||||||||||
| Subordinated debt | 60,000 | — | — | — | 60,000 | |||||||||||||||||||||||||||
| Supplemental retirement plans | 1,387 | 276 | 992 | 119 | — | |||||||||||||||||||||||||||
| Operating lease obligations | 39,049 | 1,450 | 5,876 | 14,426 | 17,297 | |||||||||||||||||||||||||||
| Total contractual obligations | $ | 647,280 | $ | 516,046 | $ | 33,856 | $ | 14,583 | $ | 82,795 | ||||||||||||||||||||||
The Company is also party to financial instruments with off-balance sheet risk in government regulation or oversight could affectthe normal course of business to meet the financing needs of its customers. The instruments involve, to varying degrees, elements of credit risk in excess of the amount recognized in the Consolidated Balance Sheets. The contractual amounts of these instruments reflect the extent of involvement the Company has in substantialthe particular classes of financial instruments.
59
The following table summarizes the contractual commitments at December 31, 2023:
| Commitment Expiration — By Period | ||||||||||||||||||||||||||||||||
| (Dollars in thousands) | Total | With-in 1 Year | >1 – 5 Years | >5 – 15 Years | After 15 Years | |||||||||||||||||||||||||||
| Other Commitments: | ||||||||||||||||||||||||||||||||
| Unadvanced loans and lines | $ | 1,421,809 | $ | 840,491 | $ | 468,068 | $ | 111,664 | $ | 1,586 | ||||||||||||||||||||||
| Commitments to originate loans | 41,326 | 41,326 | — | — | — | |||||||||||||||||||||||||||
| Letters of credit | 15,610 | 13,338 | 2,232 | 40 | — | |||||||||||||||||||||||||||
| Commitments to sell loans | 200 | 200 | — | — | — | |||||||||||||||||||||||||||
Customer related interest-rate swaps notional amount(1) | 7,524 | — | — | 4,144 | 3,380 | |||||||||||||||||||||||||||
| Risk participation agreement notional amount | 46,910 | — | — | — | 46,910 | |||||||||||||||||||||||||||
| Total commitments | $ | 1,533,379 | $ | 895,555 | $ | 470,300 | $ | 115,848 | $ | 51,876 | ||||||||||||||||||||||
_______________________________________________
(1) Offsetting positions to these interest-rate swaps are entered into with a counterparty. Notional principal amounts are not actually exchanged.
Wealth Management
Wealth assets under management and unpredictable ways.wealth assets under administration are not carried as assets on the Company's consolidated balance sheets. The President has signedCompany provides a wide range of wealth management services, including investment management, brokerage, annuities, trust, and 401(k) administration.
Wealth assets under management amounted to $1.08 billion at December 31, 2023. The increase of $186.3 million, or 21%, compared to December 31, 2022 was due primarily to net asset growth from new and expanded client relationships and an executive order calling for theincrease in market values.
Wealth assets under administration amounted to review various U.S. financial laws$242.3 million at December 31, 2023 an increase of $43.8 million, or 22%, compared to December 31, 2022, resulting primarily from an increase in market values.
Impact of Inflation and regulations. Changing Prices
The full scopeCompany's asset and liability structure is substantially different from that of an industrial company in that virtually all assets and liabilities of the current administration's legislative agenda is not yet fully known, but it may include certain deregulatory measures for the banking industry, including the structure and powers of the CFPB and other areas under the Dodd-Frank Act,Company are monetary in addition to extensive corporate tax reform signed in December 2017. Accordingly, it is difficult to anticipate the continued impact that this expansive legislation, if or when fully enacted, will have on the Company, its customers and the financial industry generally. The impact could include, but is not limited to, subjecting the Company to additional operating, governance, and compliance costs, potentially influencing the Company's business decisions, or causing potential loss of revenue due tonature. Management believes the impact of inflation on financial results depends upon the changing regulatory structureCompany's ability to react to changes in interest rates and by such reaction, reduce the inflationary impact on performance. Interest rates do not necessarily move in the banking industrysame direction, or at the same magnitude, as a whole.
Various information shown elsewhere in respondingthis annual report will assist in the understanding of how well the Company is positioned to realreact to changing interest rates and suspectedinflationary trends. In particular, additional information security incidents. This includes unlawful, unauthorized, or unacceptable actions that involve a computer system or a computer network such as Distributed Denialrelated to the net interest margin sensitivity analysis is contained in Item 7A of Service attacks, Corporate Account Takeover schemes, or an event that has potentially compromised customers' non-public personal information. Additionally, an event that disrupts onethis Form 10-K below and other maturity and repricing information of the Bank's service channels, whether as a resultCompany's interest rate-sensitive assets and liabilities is contained in this Item 7, "Management's Discussion and Analysis of a security incident or not, is also considered an incident requiring a responseFinancial Condition and Results of Operations" of this Form 10-K under the heading "Financial Condition" in this program. The reaction to an incident aims to reduce potential damage and loss and to protect and restore confidence through timely communication and the restoration of normal operating conditions for computers, services and information.report.
Accounting Policies/Critical Accounting Estimates
The Company’sCompany's significant accounting policies are described in Note 1, "Summary of Significant Accounting Policies," to the consolidated financial statements contained in Item 8, "Financial Statements and Supplementary Data.Data," of this Form 10-K. In applying these accounting policies, management is required to exercise judgment in determining many of the methodologies, assumptions and estimates to be utilized. Certain of the critical accounting estimates are more dependent on such judgment and in some cases may contribute to volatility in the Company’sCompany's reported financial performance should the assumptions and estimates used be incorrect or change over time due to changes in circumstances. The three most significant areas in which management applies critical assumptions and estimates includeare: the areas described further below.estimates of the allowance for credit losses for loans, and available-for-sale securities, the reserve for unfunded commitments and the impairment review of goodwill.
60
The allowanceCECL methodology requires early recognition of credit losses using a lifetime credit loss measurement approach that takes into consideration reasonable and supportable forecasts. The ACL for loan losses is an estimate of probable credit risk inherent in the loan portfolio as of the specified balance sheet dates. The allowance for loan lossesloans is established through a provision for loancredit losses, recorded as a direct charge to earnings. LoanThe ACL for loans is a valuation account that is deducted from the amortized cost to present the net amount of the loan portfolio expected to be collected. Credit losses are charged against the allowanceACL for loans when management believes that the collectability of the loanamortized cost of the loan's principal balance is unlikely. Recoveries on loans previously charged-off are credited to the allowance. The Company maintainsACL for loans, generally at the allowance attime cash is received on a level that it deems adequate to absorb all reasonably anticipated probable losses from specifically known and other credit risks associated with the portfolio. charged-off account.
Arriving at an appropriate level of allowanceACL for loan lossesloans involves a high degree of management judgment.
judgement. The Company uses a systematic methodologyunderlying assumptions, estimates and assessments used to measureestimate the amount of estimated loan loss exposure inherent in the portfolio for purposes of establishing a sufficient allowance for loan losses. The methodology makes use of specific reservesACL for loans individually evaluatedreflects the Company’s best estimate of model assumptions and deemed impaired,forecasted conditions at that time. Changes in such estimates can significantly affect the ACL for loans and general reservesthe provision for larger groups of homogeneous loans, which are collectively evaluated relying on a combination of qualitative and quantitative factors that may affect credit quality of the pool.
The Company uses a systematic methodology to measure the amount of management.estimated credit losses. The methodology applies general reserves for larger groups of homogeneous loans segmented by loan type and specific reserves for loans individually evaluated.
Reserve for unfunded commitments
The reserve for unfunded commitments is included in the line item "Accrued expenses and other liabilities" on the Company’s Consolidated Balance Sheets. The estimate of credit loss incorporates assumptions for both the likelihood and amount of funding over the estimated life of the commitments, including adjustments for current conditions and reasonable and supportable forecasts. Management periodically reviews and updates its assumptions for estimated funding rates.
ACL for Available-for-Sale Securities
There are inherent risks associated with the Company’sCompany's investment activities that could adversely impact the fair market value and the ultimate collectability of the Company’sCompany's investments. Management regularly reviewsThe Company primarily invests in debt securities. At December 31, 2023, the portfolio forCompany also held immaterial amounts of equity securities withand FHLB stock.
The Company measures expected credit losses on available-for-sale securities based upon the unrealized losses to determine if anygain or loss position of the unrealized losses are OTTI. The determination of OTTI involves a high degree of judgment. While management uses available information to measure OTTI at the balance sheet date, future write-downs may be necessary based on extended duration of current unrealized losses, changing market conditions, or circumstances surrounding individual issuers.
61
between the security’s amortized cost basis and its fair value as a write-down of the investment balance with a charge to earnings. Otherwise, management’s analysis considers various factors, which include among other considerations (1) the present value of the cash flows expected to be collected compared to the amortized cost of the security, before recovery,(2) duration and magnitude of the decline in value, (3) the financial condition of the issuer or 3) a credit loss existsissuers, and (4) structure of the security. If the Company does not expect to recover the entire amortized cost. For debt securities that have a credit loss, any portioncost basis of the losssecurity, an allowance for credit losses for available-for-sale securities would be recorded, with a related charge to other factors is recorded in other comprehensive income. Once written-down,earnings, limited by the previous charge may not be recovered through earnings until sale or maturity, if in excess of its new cost basis. Any OTTI charges, depending upon the magnitudeamount of the charges, could have a material adverse effect onfair value of the Company’s financial condition and results of operations.
The Company is required to make future cash payments under various contractual obligations. The following table summarizes the contractual cash obligations at December 31, 2023:
| Payments Due by Period | ||||||||||||||||||||||||||||||||
| (Dollars in thousands) | Total | With-in 1 Year | >1 – 5 Years | >5 – 15 Years | After 15 Years | |||||||||||||||||||||||||||
| Contractual cash obligations: | ||||||||||||||||||||||||||||||||
| CDs | $ | 521,076 | $ | 494,320 | $ | 26,718 | $ | 38 | $ | — | ||||||||||||||||||||||
| FHLB borrowings | 2,830 | — | — | — | 2,830 | |||||||||||||||||||||||||||
| Other borrowings | 22,938 | 20,000 | 270 | — | 2,668 | |||||||||||||||||||||||||||
| Subordinated debt | 60,000 | — | — | — | 60,000 | |||||||||||||||||||||||||||
| Supplemental retirement plans | 1,387 | 276 | 992 | 119 | — | |||||||||||||||||||||||||||
| Operating lease obligations | 39,049 | 1,450 | 5,876 | 14,426 | 17,297 | |||||||||||||||||||||||||||
| Total contractual obligations | $ | 647,280 | $ | 516,046 | $ | 33,856 | $ | 14,583 | $ | 82,795 | ||||||||||||||||||||||
The Company is also party to financial instruments with off-balance sheet risk in the normal course of Goodwill
59
| Commitment Expiration — By Period | ||||||||||||||||||||||||||||||||
| (Dollars in thousands) | Total | With-in 1 Year | >1 – 5 Years | >5 – 15 Years | After 15 Years | |||||||||||||||||||||||||||
| Other Commitments: | ||||||||||||||||||||||||||||||||
| Unadvanced loans and lines | $ | 1,421,809 | $ | 840,491 | $ | 468,068 | $ | 111,664 | $ | 1,586 | ||||||||||||||||||||||
| Commitments to originate loans | 41,326 | 41,326 | — | — | — | |||||||||||||||||||||||||||
| Letters of credit | 15,610 | 13,338 | 2,232 | 40 | — | |||||||||||||||||||||||||||
| Commitments to sell loans | 200 | 200 | — | — | — | |||||||||||||||||||||||||||
Customer related interest-rate swaps notional amount(1) | 7,524 | — | — | 4,144 | 3,380 | |||||||||||||||||||||||||||
| Risk participation agreement notional amount | 46,910 | — | — | — | 46,910 | |||||||||||||||||||||||||||
| Total commitments | $ | 1,533,379 | $ | 895,555 | $ | 470,300 | $ | 115,848 | $ | 51,876 | ||||||||||||||||||||||
_______________________________________________
(1) Offsetting positions to $2.82these interest-rate swaps are entered into with a counterparty. Notional principal amounts are not actually exchanged.
Wealth Management
Wealth assets under management and wealth assets under administration are not carried as assets on the Company's consolidated balance sheets. The Company provides a wide range of wealth management services, including investment management, brokerage, annuities, trust, and 401(k) administration.
Wealth assets under management amounted to $1.08 billion at December 31, 2017.2023. The balance sheet composition and changes since December 31, 2016 are discussed below.
| December 31, | |||||||||||||||||||||
| 2017 | 2016 | 2015 | |||||||||||||||||||
| (Dollars in thousands) | Amount | Percent | Amount | Percent | Amount | Percent | |||||||||||||||
Federal agency obligations(1) | $ | 51,717 | 12.8 | % | $ | 75,069 | 20.0 | % | $ | 78,825 | 26.3 | % | |||||||||
Residential federal agency MBS(1) | 140,154 | 34.6 | % | 93,353 | 24.9 | % | 74,863 | 24.9 | % | ||||||||||||
Commercial federal agency MBS(1) | 66,500 | 16.4 | % | 70,278 | 18.7 | % | 23,545 | 7.8 | % | ||||||||||||
| Municipal securities | 134,346 | 33.2 | % | 111,803 | 29.8 | % | 98,511 | 32.8 | % | ||||||||||||
| Corporate bonds | 11,542 | 2.8 | % | 10,695 | 2.9 | % | 10,206 | 3.4 | % | ||||||||||||
Certificates of deposits (2) | 947 | 0.2 | % | 949 | 0.3 | % | 2,751 | 0.9 | % | ||||||||||||
| Total debt securities | 405,206 | 100.0 | % | 362,147 | 96.6 | % | 288,701 | 96.1 | % | ||||||||||||
| Equity investments | — | — | % | 12,643 | 3.4 | % | 11,657 | 3.9 | % | ||||||||||||
| Total investment securities, at fair value | $ | 405,206 | 100.0 | % | $ | 374,790 | 100.0 | % | $ | 300,358 | 100.0 | % | |||||||||
Impact of Inflation and 2015, respectively.Changing Prices
Accounting Policies/Critical Accounting Estimates
The Company's significant accounting for OTTI.
| Under 1 Year | >1 – 5 Years | >5 – 10 Years | Over 10 Years | |||||||||||||||||||||||||
| (Dollars in thousands) | Amount | Yield | Amount | Yield | Amount | Yield | Amount | Yield | ||||||||||||||||||||
| At amortized cost: | ||||||||||||||||||||||||||||
| Federal agency obligations | $ | 10,995 | 1.51 | % | $ | 40,774 | 1.96 | % | $ | — | — | % | $ | — | — | % | ||||||||||||
| Residential federal agency MBS | 160 | 2.19 | % | 677 | 3.54 | % | 14,987 | 2.19 | % | 125,230 | 2.61 | % | ||||||||||||||||
| Commercial federal agency MBS | — | — | % | 14,818 | 2.22 | % | 51,959 | 2.52 | % | — | — | % | ||||||||||||||||
| Municipal securities | 7,184 | 3.96 | % | 17,773 | 2.64 | % | 63,898 | 2.90 | % | 43,748 | 2.86 | % | ||||||||||||||||
| Corporate bonds | 756 | 1.69 | % | 7,239 | 2.48 | % | 3,551 | 2.90 | % | — | — | % | ||||||||||||||||
| Certificates of Deposit | — | — | % | 950 | 2.13 | % | — | — | % | — | — | % | ||||||||||||||||
| Total debt securities | $ | 19,095 | 2.45 | % | $ | 82,231 | 2.22 | % | $ | 134,395 | 2.68 | % | $ | 168,978 | 2.68 | % | ||||||||||||
| At fair value: | ||||||||||||||||||||||||||||
| Total debt securities | $ | 19,159 | $ | 82,255 | $ | 134,959 | $ | 168,833 | ||||||||||||||||||||
| December 31, | |||||||||||||||||||||||||||||||||||
| 2017 | 2016 | 2015 | 2014 | 2013 | |||||||||||||||||||||||||||||||
| (Dollars in thousands) | Amount | Percent | Amount | Percent | Amount | Percent | Amount | Percent | Amount | Percent | |||||||||||||||||||||||||
| Commercial real estate | $ | 1,201,351 | 52.9 | % | $ | 1,038,082 | 51.3 | % | $ | 936,921 | 50.3 | % | $ | 862,747 | 51.6 | % | $ | 820,299 | 53.8 | % | |||||||||||||||
| Commercial & industrial | 498,802 | 21.9 | % | 490,799 | 24.2 | % | 458,553 | 24.7 | % | 402,994 | 24.1 | % | 357,056 | 23.4 | % | ||||||||||||||||||||
| Commercial construction | 274,905 | 12.1 | % | 213,447 | 10.5 | % | 202,993 | 10.9 | % | 168,044 | 10.0 | % | 132,507 | 8.6 | % | ||||||||||||||||||||
| Total commercial loans | 1,975,058 | 86.9 | % | 1,742,328 | 86.0 | % | 1,598,467 | 85.9 | % | 1,433,785 | 85.7 | % | 1,309,862 | 85.8 | % | ||||||||||||||||||||
| Residential mortgages | 195,492 | 8.6 | % | 180,560 | 8.9 | % | 169,188 | 9.1 | % | 149,959 | 8.9 | % | 132,721 | 8.7 | % | ||||||||||||||||||||
| Home equity loans and lines | 91,706 | 4.0 | % | 91,065 | 4.5 | % | 83,373 | 4.4 | % | 80,018 | 4.8 | % | 74,354 | 4.9 | % | ||||||||||||||||||||
| Consumer | 10,293 | 0.5 | % | 10,845 | 0.6 | % | 10,747 | 0.6 | % | 10,708 | 0.6 | % | 8,643 | 0.6 | % | ||||||||||||||||||||
| Total retail loans | 297,491 | 13.1 | % | 282,470 | 14.0 | % | 263,308 | 14.1 | % | 240,685 | 14.3 | % | 215,718 | 14.2 | % | ||||||||||||||||||||
| Gross loans | 2,272,549 | 100.0 | % | 2,024,798 | 100.0 | % | 1,861,775 | 100.0 | % | 1,674,470 | 100.0 | % | 1,525,580 | 100.0 | % | ||||||||||||||||||||
| Deferred fees, net | (2,645 | ) | (2,069 | ) | (1,813 | ) | (1,866 | ) | (1,524 | ) | |||||||||||||||||||||||||
| Total loans | 2,269,904 | 2,022,729 | 1,859,962 | 1,672,604 | 1,524,056 | ||||||||||||||||||||||||||||||
| Allowance for loan losses | (32,915 | ) | (31,342 | ) | (29,008 | ) | (27,121 | ) | (26,967 | ) | |||||||||||||||||||||||||
| Net loans | $ | 2,236,989 | $ | 1,991,387 | $ | 1,830,954 | $ | 1,645,483 | $ | 1,497,089 | |||||||||||||||||||||||||
and available-for-sale securities, the reserve for unfunded commitments and the impairment review of goodwill.
60
| (Dollars in thousands) | Commercial real estate | Commercial & industrial | Commercial construction | |||||||||
Amounts due(1): | ||||||||||||
| One year or less, and demand notes | $ | 55,368 | $ | 244,485 | $ | 104,905 | ||||||
| After one year through five years | 219,941 | 148,518 | 66,976 | |||||||||
| Beyond five years | 926,042 | 105,799 | 103,024 | |||||||||
| $ | 1,201,351 | $ | 498,802 | $ | 274,905 | |||||||
| Interest rate terms on amounts due after one year: | ||||||||||||
| Fixed | $ | 32,113 | $ | 116,368 | $ | 13,619 | ||||||
| Adjustable | $ | 1,113,870 | $ | 137,949 | $ | 156,381 | ||||||
Arriving at an appropriate level of ACL for loans involves a high degree of management judgement. The underlying assumptions, estimates and economic conditions.assessments used to estimate the ACL for loans reflects the Company’s best estimate of model assumptions and forecasted conditions at that time. Changes in such estimates can significantly affect the ACL for loans and the provision for credit losses. In addition, various regulatory agencies, as an integral part of their examination process, periodically review the Company's ACL for loans. It is possible and likely that the Company will experience credit losses that are different from the current estimates.
The credit risk management function focuses onCompany uses a wide varietysystematic methodology to measure the amount of factors, including, among others, current and expected economic conditions, the real estate market, the financial condition of borrowers, the ability of borrowers to adapt to changing conditions or circumstances affecting their business and the continuity of borrowers’ management teams. Early detection of credit issues is critical to minimizeestimated credit losses. Accordingly,The methodology applies general reserves for larger groups of homogeneous loans segmented by loan type and specific reserves for loans individually evaluated.
In making its assessment on the adequacy of the general reserves of ACL for loans, management regularly monitors theseconsiders several quantitative and qualitative factors among others, through ongoing credit reviews byfrom internal and external sources relating to past events, current conditions, and reasonable and supportable forecasts, including: the Credit Department, an external loan review service, reviews by membersexpected duration of senior management, as well as reviews by the Loan Committee andloans segments, the Board of Directors. This review includes the assessment of internal credit quality indicators such as thetrends in risk classification of individual loans,loans; individual review of larger and higher risk problem assets, delinquent loans andassets; the level of delinquent, non-performing, loans, impaired and restructured loans,individually evaluated loans; the level of hardship loan modifications; foreclosure activity,activity; net charge-offs andcharge-offs; commercial concentrations by industry, and property type and by real estate location,location; the growth and composition of the loan portfolio; as well as trends in the general levels of these indicators and the growth and composition of the loan portfolio.indicators. In addition, management monitors expansion in the Company's geographic market areas,area, the experience level of lenders and any changes in underwriting criteria, and the strength of the local and national economy, including general conditions in the multi-family, commercial real estate and development and construction markets in the Company's local region.region as well as changes in current and forecasted economic conditions, such as changes in gross domestic product, the unemployment rate and new jobs created, real estate values, commercial vacancy rates, recession risk estimates and other relevant economic factors. Management also performs a qualitative assessment beyond model estimates and applies qualitative adjustments as management deems necessary, acknowledging that it can take time for economic results to work through the loan portfolio with charge-offs often occurring years after the economic downturn.
For loans individually evaluated, the Company generally requires an internal evaluation or independent appraisal of the collateral supporting the loan. However, these assessment methods are only an estimate of the value of the collateral at the time the assessment is made and involve estimates and assumptions. An error in fact, estimate or judgment could adversely affect the reliability of the valuation. Furthermore, changes in those estimates due to the economic environment and events occurring after the initial assessment, may cause the value of the collateral to differ significantly from the initial valuations.
Reserve for unfunded commitments
The reserve for unfunded commitments is included in the line item "Accrued expenses and other liabilities" on the Company’s Consolidated Balance Sheets. The estimate of credit loss incorporates assumptions for both the likelihood and amount of funding over the estimated life of the commitments, including adjustments for current conditions and reasonable and supportable forecasts. Management periodically reviews and updates its assumptions for estimated funding rates.
ACL for Available-for-Sale Securities
There are inherent risks associated with the Company's loan risk rating system classifies loans depending on risk of loss characteristics. The classifications range from "substantially risk free" forinvestment activities that could adversely impact the highest quality loans and loans that are secured by cash collateral, through a satisfactory range of "minimal,” "moderate," "better than average," and "average" risk, to the regulatory problem-asset classifications of “criticized,” for loans that may need additional monitoring,fair value and the ultimate collectability of the Company's investments. The Company primarily invests in debt securities. At December 31, 2023, the Company also held immaterial amounts of equity securities and FHLB stock.
The Company measures expected credit losses on available-for-sale securities based upon the unrealized gain or loss position of the security. For available-for-sale debt securities in an unrealized loss position, the Company evaluates qualitative criteria to determine any expected loss unless the Company intends to sell, or it is more severe adverse classifications of “substandard,” "doubtful," and "loss" based on criteria established under banking regulations. Loans which are evaluated to be of weaker credit quality are placed on the "watch credit list" and reviewed on a more frequent basis by management. Loans classified as "substandard" include those characterized by the distinct possibilitylikely than not that the Company will sustain some loss if the deficiencies are not corrected. Loans classified as "doubtful" have all the weaknesses inherent in a substandard rated loan with the added characteristic that the weaknesses make collection or full payment from liquidation, on the basis of currently existing facts,
61
between the security’s amortized cost basis and its fair value as a specific loss reserve or charge-off. Adversely classified loans may be accruing or in non-accrual status and may be additionally designated as impaired or restructured, or some combination thereof.
| December 31, | ||||||||||||||||||||
| (Dollars in thousands) | 2017 | 2016 | 2015 | 2014 | 2013 | |||||||||||||||
| Non-accrual loan summary: | ||||||||||||||||||||
| Commercial real estate | $ | 6,751 | $ | 4,876 | $ | 8,506 | $ | 9,714 | $ | 10,561 | ||||||||||
| Commercial and industrial | 1,294 | 3,174 | 4,323 | 5,950 | 5,743 | |||||||||||||||
| Commercial construction | 193 | 519 | 335 | 447 | 1,118 | |||||||||||||||
| Residential mortgages | 262 | 289 | 366 | 763 | 633 | |||||||||||||||
| Home equity loans and lines | 463 | 616 | 288 | 245 | 281 | |||||||||||||||
| Consumer | 34 | — | 19 | 16 | 7 | |||||||||||||||
| Total non-accrual loans | 8,997 | 9,474 | 13,837 | 17,135 | 18,343 | |||||||||||||||
| Overdrafts > 90 days past due | 35 | 11 | 8 | 1 | 3 | |||||||||||||||
| Total non-performing loans | 9,032 | 9,485 | 13,845 | 17,136 | 18,346 | |||||||||||||||
| OREO | — | — | — | 861 | 114 | |||||||||||||||
| Total non-performing assets | $ | 9,032 | $ | 9,485 | $ | 13,845 | $ | 17,997 | $ | 18,460 | ||||||||||
| Total Loans | $ | 2,269,904 | $ | 2,022,729 | $ | 1,859,962 | $ | 1,672,604 | $ | 1,524,056 | ||||||||||
| Accruing TDR loans not included above | $ | 17,356 | $ | 22,418 | $ | 10,053 | $ | 11,943 | $ | 11,438 | ||||||||||
| Delinquent loans 60-89 days past due and still accruing | $ | 1,026 | $ | 940 | $ | 2,021 | $ | 1,707 | $ | 2,638 | ||||||||||
| Loans 60-89 days past due and still accruing to total loans | 0.05 | % | 0.05 | % | 0.11 | % | 0.10 | % | 0.17 | % | ||||||||||
| Adversely classified loans to total loans | 1.16 | % | 1.70 | % | 1.33 | % | 1.70 | % | 1.83 | % | ||||||||||
| Non-performing loans to total loans | 0.40 | % | 0.47 | % | 0.74 | % | 1.02 | % | 1.20 | % | ||||||||||
| Non-performing assets to total assets | 0.32 | % | 0.38 | % | 0.61 | % | 0.89 | % | 1.00 | % | ||||||||||
| Allowance for loan losses | 32,915 | 31,342 | 29,008 | 27,121 | 26,967 | |||||||||||||||
| Allowance for loan losses to non-performing loans | 364.43 | % | 330.44 | % | 209.52 | % | 158.27 | % | 146.99 | % | ||||||||||
| Allowance for loan losses to total loans | 1.45 | % | 1.55 | % | 1.56 | % | 1.62 | % | 1.77 | % | ||||||||||
| Years Ended December 31, | ||||||||||||||||||||
| (Dollars in thousands) | 2017 | 2016 | 2015 | 2014 | 2013 | |||||||||||||||
| Balance at beginning of year | $ | 31,342 | $ | 29,008 | $ | 27,121 | $ | 26,967 | $ | 24,254 | ||||||||||
| Provision charged to operations | 1,430 | 2,993 | 3,267 | 1,395 | 3,279 | |||||||||||||||
| Recoveries on charged-off loans: | ||||||||||||||||||||
| Commercial real estate | 193 | 20 | 74 | 21 | 96 | |||||||||||||||
| Commercial and industrial | 550 | 681 | 279 | 616 | 80 | |||||||||||||||
| Commercial construction | — | — | 25 | 66 | 78 | |||||||||||||||
| Residential mortgages | — | — | — | — | 128 | |||||||||||||||
| Home equity loans and lines | 4 | 3 | 15 | 1 | 21 | |||||||||||||||
| Consumer | 8 | 5 | 16 | 31 | 12 | |||||||||||||||
| Total recovered | $ | 755 | $ | 709 | $ | 409 | $ | 735 | $ | 415 | ||||||||||
| Charged-off loans: | ||||||||||||||||||||
| Commercial real estate | 178 | 328 | 133 | 345 | 206 | |||||||||||||||
| Commercial and industrial | 348 | 980 | 1,571 | 1,363 | 670 | |||||||||||||||
| Commercial construction | — | 5 | — | 134 | — | |||||||||||||||
| Residential mortgages | — | — | — | 46 | 36 | |||||||||||||||
| Home equity loans and lines | — | 6 | — | 27 | 44 | |||||||||||||||
| Consumer | 86 | 49 | 85 | 61 | 25 | |||||||||||||||
| Total charged-off | $ | 612 | $ | 1,368 | $ | 1,789 | $ | 1,976 | $ | 981 | ||||||||||
| Net loans (recovered) charged-off | $ | (143 | ) | $ | 659 | $ | 1,380 | $ | 1,241 | $ | 566 | |||||||||
| Balance at December 31 | $ | 32,915 | $ | 31,342 | $ | 29,008 | $ | 27,121 | $ | 26,967 | ||||||||||
| Average loans outstanding | $ | 2,130,048 | $ | 1,919,826 | $ | 1,740,962 | $ | 1,586,062 | $ | 1,438,556 | ||||||||||
| Net loans (recovered) charged-off to average loans | (0.01 | )% | 0.03 | % | 0.08 | % | 0.08 | % | 0.04 | % | ||||||||||
| Recoveries to charge-offs | 123.37 | % | 51.83 | % | 22.86 | % | 37.20 | % | 42.30 | % | ||||||||||
| Net loans (recovered) charged-off to allowance | (0.43 | )% | 2.10 | % | 4.76 | % | 4.58 | % | 2.10 | % | ||||||||||
| December 31, | |||||||||||||||||||||||||||||||||||
| 2017 | 2016 | 2015 | 2014 | 2013 | |||||||||||||||||||||||||||||||
| (Dollars in thousands) | Allowance allocation | Loan category as % of gross loans | Allowance allocation | Loan category as % of gross loans | Allowance allocation | Loan category as % of gross loans | Allowance allocation | Loan category as % of gross loans | Allowance allocation | Loan category as % of gross loans | |||||||||||||||||||||||||
| Comm’l real estate | $ | 17,545 | 52.9 | % | $ | 14,902 | 51.3 | % | $ | 13,514 | 50.3 | % | $ | 12,664 | 51.6 | % | $ | 13,174 | 53.8 | % | |||||||||||||||
| Comm’l industrial | 9,669 | 21.9 | % | 11,204 | 24.2 | % | 9,758 | 24.7 | % | 9,245 | 24.1 | % | 8,365 | 23.4 | % | ||||||||||||||||||||
| Comm’l constr. | 3,947 | 12.1 | % | 3,406 | 10.5 | % | 3,905 | 10.9 | % | 3,384 | 10.0 | % | 3,493 | 8.6 | % | ||||||||||||||||||||
| Resid: mortg, cnstr and HELOCs | 1,512 | 12.6 | % | 1,594 | 13.4 | % | 1,601 | 13.5 | % | 1,597 | 13.7 | % | 1,710 | 13.6 | % | ||||||||||||||||||||
| Consumer | 242 | 0.5 | % | 236 | 0.6 | % | 230 | 0.6 | % | 231 | 0.6 | % | 225 | 0.6 | % | ||||||||||||||||||||
| Total | $ | 32,915 | 100.0 | % | $ | 31,342 | 100.0 | % | $ | 29,008 | 100.0 | % | $ | 27,121 | 100.0 | % | $ | 26,967 | 100.0 | % | |||||||||||||||
| December 31, 2017 | December 31, 2016 | December 31, 2015 | |||||||||||||||||||
| (Dollars in thousands) | Amount | % of Total | Amount | % of Total | Amount | % of Total | |||||||||||||||
| Non-interest bearing demand deposits | $ | 705,846 | 28.9 | % | $ | 646,115 | 28.5 | % | $ | 570,589 | 28.3 | % | |||||||||
| Interest-bearing checking | 391,111 | 16.0 | % | 372,696 | 16.4 | % | 313,674 | 15.5 | % | ||||||||||||
| Total checking | 1,096,957 | 44.9 | % | 1,018,811 | 44.9 | % | 884,263 | 43.8 | % | ||||||||||||
| Savings | 193,385 | 7.9 | % | 178,637 | 7.9 | % | 167,304 | 8.3 | % | ||||||||||||
| Money markets | 807,931 | 33.1 | % | 844,216 | 37.2 | % | 692,114 | 34.3 | % | ||||||||||||
| Total savings/money markets | 1,001,316 | 41.0 | % | 1,022,853 | 45.1 | % | 859,418 | 42.6 | % | ||||||||||||
| Certificates of deposit (CDs) | 195,599 | 8.0 | % | 167,895 | 7.4 | % | 167,697 | 8.3 | % | ||||||||||||
| Total customer deposits | 2,293,872 | 93.9 | % | 2,209,559 | 97.4 | % | 1,911,378 | 94.7 | % | ||||||||||||
Brokered deposits(1) | 147,490 | 6.1 | % | 59,362 | 2.6 | % | 106,770 | 5.3 | % | ||||||||||||
| Total deposits | $ | 2,441,362 | 100.0 | % | $ | 2,268,921 | 100.0 | % | $ | 2,018,148 | 100.0 | % | |||||||||
| (Dollars in thousands) | December 31, 2017 | December 31, 2016 | ||||||
| Due in three months or less | $ | 8,043 | $ | 16,063 | ||||
| Due in greater than three months through six months | 10,399 | 6,888 | ||||||
| Due in greater than six months through twelve months | 11,159 | 8,282 | ||||||
| Due in greater than twelve months | 15,553 | 11,082 | ||||||
| Total certificates of deposit | $ | 45,154 | $ | 42,315 | ||||
| Year ended December 31, | ||||||||||||||||||||||||||||||
| 2017 | 2016 | 2015 | ||||||||||||||||||||||||||||
| (Dollars in thousands) | Average Balance | Avg Rate | % of Total | Average Balance | Avg Rate | % of Total | Average Balance | Avg Rate | % of Total | |||||||||||||||||||||
| Non-interest demand | $ | 697,247 | — | % | 29.8 | % | $ | 632,950 | — | % | 29.5 | % | $ | 535,583 | — | % | 28.0 | % | ||||||||||||
| Interest checking | 357,252 | 0.14 | % | 15.3 | % | 324,820 | 0.09 | % | 15.2 | % | 283,579 | 0.07 | % | 14.9 | % | |||||||||||||||
| Savings | 195,465 | 0.15 | % | 8.3 | % | 181,453 | 0.13 | % | 8.5 | % | 166,358 | 0.12 | % | 8.7 | % | |||||||||||||||
| Money market | 827,867 | 0.32 | % | 35.4 | % | 758,944 | 0.27 | % | 35.4 | % | 639,800 | 0.27 | % | 33.5 | % | |||||||||||||||
| Total interest-bearing non-term deposits | 1,380,584 | 0.25 | % | 59.0 | % | 1,265,217 | 0.20 | % | 59.1 | % | 1,089,737 | 0.20 | % | 57.1 | % | |||||||||||||||
| Certificates of deposit | 170,427 | 0.84 | % | 7.3 | % | 169,213 | 0.68 | % | 7.9 | % | 171,213 | 0.59 | % | 9.0 | % | |||||||||||||||
| Total non-brokered deposits | 2,248,258 | 0.22 | % | 96.1 | % | 2,067,380 | 0.18 | % | 96.5 | % | 1,796,533 | 0.18 | % | 94.1 | % | |||||||||||||||
| Brokered deposits | 91,522 | 1.22 | % | 3.9 | % | 75,395 | 1.06 | % | 3.5 | % | 112,930 | 0.81 | % | 5.9 | % | |||||||||||||||
| Total | $ | 2,339,780 | 0.26 | % | 100.0 | % | $ | 2,142,775 | 0.21 | % | 100.0 | % | $ | 1,909,463 | 0.21 | % | 100.0 | % | ||||||||||||
| Year ended December 31, | |||||||||||||||||||||
| 2017 | 2016 | 2015 | |||||||||||||||||||
| (Dollars in thousands) | Average Balance | Average Cost | Average Balance | Average Cost | Average Balance | Average Cost | |||||||||||||||
| FHLB advances | $ | 49,546 | 1.19 | % | $ | 14,551 | 0.55 | % | $ | 10,731 | 0.36 | % | |||||||||
| Other borrowed funds | — | — | % | 107 | 0.61 | % | 36 | 0.61 | % | ||||||||||||
| Total borrowed funds | $ | 49,546 | 1.19 | % | $ | 14,658 | 0.55 | % | $ | 10,767 | 0.36 | % | |||||||||
Contractual Obligations and Commitments
The Company is required to make future cash payments under various contractual obligations. The following table summarizes the contractual cash obligations at December 31, 2017. 2023:
| Payments Due by Period | ||||||||||||||||||||||||||||||||
| (Dollars in thousands) | Total | With-in 1 Year | >1 – 5 Years | >5 – 15 Years | After 15 Years | |||||||||||||||||||||||||||
| Contractual cash obligations: | ||||||||||||||||||||||||||||||||
| CDs | $ | 521,076 | $ | 494,320 | $ | 26,718 | $ | 38 | $ | — | ||||||||||||||||||||||
| FHLB borrowings | 2,830 | — | — | — | 2,830 | |||||||||||||||||||||||||||
| Other borrowings | 22,938 | 20,000 | 270 | — | 2,668 | |||||||||||||||||||||||||||
| Subordinated debt | 60,000 | — | — | — | 60,000 | |||||||||||||||||||||||||||
| Supplemental retirement plans | 1,387 | 276 | 992 | 119 | — | |||||||||||||||||||||||||||
| Operating lease obligations | 39,049 | 1,450 | 5,876 | 14,426 | 17,297 | |||||||||||||||||||||||||||
| Total contractual obligations | $ | 647,280 | $ | 516,046 | $ | 33,856 | $ | 14,583 | $ | 82,795 | ||||||||||||||||||||||
| Payments Due By Period | ||||||||||||||||||||
| (Dollars in thousands) | Total | With-in 1 Year | >1 – 3 Years | >3 – 5 Years | After 5 Years | |||||||||||||||
| Contractual Cash Obligations: | ||||||||||||||||||||
| Certificates of deposit | $ | 343,089 | $ | 240,995 | $ | 88,833 | $ | 12,206 | $ | 1,055 | ||||||||||
| FHLB borrowings | 89,000 | 89,000 | — | — | — | |||||||||||||||
| Subordinated debt | 15,000 | — | — | — | 15,000 | |||||||||||||||
| Supplemental retirement plans | 3,043 | 276 | 552 | 552 | 1,663 | |||||||||||||||
| Operating lease obligations | 15,686 | 1,609 | 2,528 | 2,264 | 9,285 | |||||||||||||||
| Vendor contracts | 8,129 | 4,991 | 2,665 | 473 | — | |||||||||||||||
| Total contractual obligations | $ | 473,947 | $ | 336,871 | $ | 94,578 | $ | 15,495 | $ | 27,003 | ||||||||||
The Company is also party to financial instruments with off-balance sheet risk in the normal course of business to meet the financing needs of its customers. The instruments involve, to varying degrees, elements of credit risk in excess of the amount recognized in the consolidated balance sheets.Consolidated Balance Sheets. The contractual amounts of these instruments reflect the extent of involvement the Company has in the particular classes of financial instruments.
59
The following table summarizes the contractual commitments at December 31, 2017.2023:
| Commitment Expiration — By Period | ||||||||||||||||||||||||||||||||
| (Dollars in thousands) | Total | With-in 1 Year | >1 – 5 Years | >5 – 15 Years | After 15 Years | |||||||||||||||||||||||||||
| Other Commitments: | ||||||||||||||||||||||||||||||||
| Unadvanced loans and lines | $ | 1,421,809 | $ | 840,491 | $ | 468,068 | $ | 111,664 | $ | 1,586 | ||||||||||||||||||||||
| Commitments to originate loans | 41,326 | 41,326 | — | — | — | |||||||||||||||||||||||||||
| Letters of credit | 15,610 | 13,338 | 2,232 | 40 | — | |||||||||||||||||||||||||||
| Commitments to sell loans | 200 | 200 | — | — | — | |||||||||||||||||||||||||||
Customer related interest-rate swaps notional amount(1) | 7,524 | — | — | 4,144 | 3,380 | |||||||||||||||||||||||||||
| Risk participation agreement notional amount | 46,910 | — | — | — | 46,910 | |||||||||||||||||||||||||||
| Total commitments | $ | 1,533,379 | $ | 895,555 | $ | 470,300 | $ | 115,848 | $ | 51,876 | ||||||||||||||||||||||
| Commitment Expiration — By Period | ||||||||||||||||||||
| (Dollars in thousands) | Total | With-in 1 Year | >1 – 3 Years | >3 – 5 Years | After 5 Years | |||||||||||||||
| Other Commitments: | ||||||||||||||||||||
| Unadvanced loans and lines | $ | 767,896 | $ | 479,476 | $ | 174,267 | $ | 27,739 | $ | 86,414 | ||||||||||
| Commitments to originate loans | 13,830 | 13,830 | — | — | — | |||||||||||||||
| Letters of credit | 21,576 | 14,112 | 1,027 | 6,437 | — | |||||||||||||||
| Commitments to originate loans for sale | 2,078 | 2,078 | — | — | — | |||||||||||||||
| Commitments to sell loans | 2,286 | 2,286 | — | — | — | |||||||||||||||
Customer related interest-rate swaps notional amount (1) | 14,719 | — | — | 2,366 | 12,353 | |||||||||||||||
| Total commitments | $ | 822,385 | $ | 511,782 | $ | 175,294 | $ | 36,542 | $ | 98,767 | ||||||||||
_______________________________________________
(1) Offsetting positions to these interest rateinterest-rate swaps offered to commercial loan customers are entered into with a counterparty. Notional principal amounts are not actually exchanged.
sheets. The Company provides a wide range of investment advisory and wealth management services, including investment management, brokerage, annuities, trust, and investment management (together, "investment advisory services"). Also included in the investment401(k) administration.
Wealth assets under management total are customers' commercial sweep arrangements that are invested in third-party money market mutual funds.
| December 31, | ||||||||||||
| (Dollars in thousands) | 2017 | 2016 | 2015 | |||||||||
| Total assets | $ | 2,817,564 | $ | 2,526,269 | $ | 2,285,531 | ||||||
| Loans serviced for others | 89,059 | 80,996 | 71,272 | |||||||||
| Investment assets under management | 844,977 | 725,338 | 678,377 | |||||||||
| Total assets under management | $ | 3,751,600 | $ | 3,332,603 | $ | 3,035,180 | ||||||
Impact of Inflation and Changing Prices
The Company's asset and liability structure is substantially different from that of an industrial company in that virtually all assets and liabilities of the fourth quarter of 2017 was slightly higher than normal non-accrual interest income recognized from loan payoffs, as well asCompany are monetary in nature. Management believes the positive impact of recent interest rate increasesinflation on loan yields.
| December 31, | ||||||||||||||||||||||||||||||||
| 2017 vs 2016 | 2016 vs 2015 | |||||||||||||||||||||||||||||||
| Increase (Decrease) due to | Increase (Decrease) due to | |||||||||||||||||||||||||||||||
| (Dollars in thousands) | Net Change | Volume | Rate | Rate/ Volume | Net Change | Volume | Rate | Rate/ Volume | ||||||||||||||||||||||||
| Interest Income | ||||||||||||||||||||||||||||||||
| Loans and loans held for sale | $ | 11,169 | $ | 9,572 | $ | 1,429 | $ | 168 | $ | 7,444 | $ | 8,148 | $ | (393 | ) | $ | (311 | ) | ||||||||||||||
| Investment securities | 1,405 | 1,594 | 32 | (221 | ) | 1,294 | 1,639 | 77 | (422 | ) | ||||||||||||||||||||||
Other interest-earning assets (1) | 143 | (85 | ) | 327 | (99 | ) | 106 | 70 | 25 | 11 | ||||||||||||||||||||||
| Total from interest-earning assets | 12,717 | 11,081 | 1,788 | (152 | ) | 8,844 | 9,857 | (291 | ) | (722 | ) | |||||||||||||||||||||
| Interest Expense | ||||||||||||||||||||||||||||||||
| Interest checking, savings, and money market | 877 | 231 | 633 | 13 | 441 | 351 | — | 90 | ||||||||||||||||||||||||
| Certificates of deposit | 286 | 8 | 271 | 7 | 129 | (11 | ) | 154 | (14 | ) | ||||||||||||||||||||||
| Brokered CDs | 318 | 171 | 120 | 27 | (124 | ) | (304 | ) | 282 | (102 | ) | |||||||||||||||||||||
| Borrowed funds | 509 | 192 | 94 | 223 | 43 | 14 | 20 | 9 | ||||||||||||||||||||||||
| Subordinated debt | (3 | ) | 1 | (5 | ) | 1 | (143 | ) | (55 | ) | (92 | ) | 4 | |||||||||||||||||||
| Total on interest-bearing funding | 1,987 | 603 | 1,113 | 271 | 346 | (5 | ) | 364 | (13 | ) | ||||||||||||||||||||||
| Change in net interest income | $ | 10,730 | $ | 10,478 | $ | 675 | $ | (423 | ) | $ | 8,498 | $ | 9,862 | $ | (655 | ) | $ | (709 | ) | |||||||||||||
Various information shown elsewhere in this annual report will assist in the understanding of how well the Company is positioned to react to changing interest rates and average rates for the years ended December 31, 2017, 2016 and 2015.
| Average Balances, Interest and Average Yields | |||||||||||||||||||||||||||||||||
| Year ended December 31, 2017 | Year ended December 31, 2016 | Year ended December 31, 2015 | |||||||||||||||||||||||||||||||
| (Dollars in thousands) | Average Balance | Interest | Average Yield(1) | Average Balance | Interest | Average Yield (1) | Average Balance | Interest | Average Yield(1) | ||||||||||||||||||||||||
| Assets: | |||||||||||||||||||||||||||||||||
Loans and loans held for sale (2) | $ | 2,130,752 | $ | 96,559 | 4.59 | % | $ | 1,921,299 | $ | 85,390 | 4.50 | % | $ | 1,742,017 | $ | 77,946 | 4.52 | % | |||||||||||||||
Investment securities (3) | 379,324 | 8,045 | 2.70 | % | 320,057 | 6,640 | 2.69 | % | 258,441 | 5,346 | 2.66 | % | |||||||||||||||||||||
Other interest-earning assets (4) | 30,225 | 428 | 1.42 | % | 43,096 | 285 | 0.66 | % | 30,966 | 179 | 0.58 | % | |||||||||||||||||||||
| Total interest-earning assets | 2,540,301 | 105,032 | 4.27 | % | 2,284,452 | 92,315 | 4.18 | % | 2,031,424 | 83,471 | 4.23 | % | |||||||||||||||||||||
| Other assets | 107,729 | 104,686 | 93,184 | ||||||||||||||||||||||||||||||
| Total assets | $ | 2,648,030 | $ | 2,389,138 | $ | 2,124,608 | |||||||||||||||||||||||||||
| Liabilities and stockholders’ equity: | |||||||||||||||||||||||||||||||||
| Interest checking, savings and money market | $ | 1,380,584 | 3,448 | 0.25 | % | $ | 1,265,217 | 2,571 | 0.20 | % | $ | 1,089,737 | 2,130 | 0.20 | % | ||||||||||||||||||
| Certificates of deposit | 170,427 | 1,433 | 0.84 | % | 169,213 | 1,147 | 0.68 | % | 171,213 | 1,018 | 0.59 | % | |||||||||||||||||||||
| Brokered CDs | 91,522 | 1,114 | 1.22 | % | 75,395 | 796 | 1.06 | % | 112,930 | 920 | 0.81 | % | |||||||||||||||||||||
| Borrowed funds | 49,546 | 590 | 1.19 | % | 14,658 | 81 | 0.55 | % | 10,767 | 38 | 0.36 | % | |||||||||||||||||||||
Subordinated debt(5) | 14,840 | 925 | 6.23 | % | 14,828 | 928 | 6.26 | % | 15,631 | 1,071 | 6.85 | % | |||||||||||||||||||||
| Total interest-bearing funding | 1,706,919 | 7,510 | 0.44 | % | 1,539,311 | 5,523 | 0.36 | % | 1,400,278 | 5,177 | 0.37 | % | |||||||||||||||||||||
| Net interest rate spread | 3.83 | % | 3.82 | % | 3.86 | % | |||||||||||||||||||||||||||
| Demand deposits | 697,247 | — | 632,950 | — | — | 535,583 | — | — | |||||||||||||||||||||||||
| Total deposits, borrowed funds and subordinated debt | 2,404,166 | 7,510 | 0.31 | % | 2,172,261 | 5,523 | 0.25 | % | 1,935,861 | 5,177 | 0.27 | % | |||||||||||||||||||||
| Other liabilities | 17,919 | 15,896 | 14,998 | ||||||||||||||||||||||||||||||
| Total liabilities | 2,422,085 | 2,188,157 | 1,950,859 | ||||||||||||||||||||||||||||||
| Stockholders’ equity | 225,945 | 200,981 | 173,749 | ||||||||||||||||||||||||||||||
| Total liabilities and stockholders’ equity | $ | 2,648,030 | $ | 2,389,138 | $ | 2,124,608 | |||||||||||||||||||||||||||
| Net interest income | $ | 97,522 | $ | 86,792 | $ | 78,294 | |||||||||||||||||||||||||||
| Net interest margin (tax equivalent) | 3.97 | % | 3.94 | % | 3.97 | % | |||||||||||||||||||||||||||
Accounting Policies/Critical Accounting Estimates
The following table sets forth the componentsCompany's significant accounting policies are described in Note 1, "Summary of non-interest income and the related changes for the periods indicated.
| Year Ended December 31, | |||||||||||||||
| (Dollars in thousands) | 2017 | 2016 | Change | % Change | |||||||||||
| Investment advisory fees | $ | 5,149 | $ | 4,774 | $ | 375 | 8 | % | |||||||
| Deposit and interchange fees | 6,011 | 5,124 | 887 | 17 | % | ||||||||||
| Income on bank-owned life insurance, net | 701 | 747 | (46 | ) | (6 | )% | |||||||||
| Net gains on sales of investment securities | 716 | 802 | (86 | ) | (11 | )% | |||||||||
| Net gains on sales of loans | 460 | 601 | (141 | ) | (23 | )% | |||||||||
| Other income | 2,637 | 2,393 | 244 | 10 | % | ||||||||||
| Total non-interest income | $ | 15,674 | $ | 14,441 | $ | 1,233 | 9 | % | |||||||
| Year Ended December 31, | |||||||||||||||
| (Dollars in thousands) | 2017 | 2016 | Change | % Change | |||||||||||
| Salaries and employee benefits | $ | 48,379 | $ | 43,886 | $ | 4,493 | 10 | % | |||||||
| Occupancy and equipment expenses | 7,960 | 7,362 | 598 | 8 | % | ||||||||||
| Technology and telecommunications expenses | 6,372 | 6,080 | 292 | 5 | % | ||||||||||
| Advertising and public relations expenses | 2,855 | 2,833 | 22 | 1 | % | ||||||||||
| Audit, legal and other professional fees | 1,565 | 1,721 | (156 | ) | (9 | )% | |||||||||
| Deposit insurance premiums | 1,535 | 1,387 | 148 | 11 | % | ||||||||||
| Supplies and postage expenses | 999 | 965 | 34 | 4 | % | ||||||||||
| Other operating expenses | 6,480 | 6,094 | 386 | 6 | % | ||||||||||
| Total non-interest expense | $ | 76,145 | $ | 70,328 | $ | 5,817 | 8 | % | |||||||
60
The CECL methodology requires early recognition of Operations
The Company earned net income in 2016uses a systematic methodology to measure the amount of $18.8 million compared to $16.1 millionestimated credit losses. The methodology applies general reserves for 2015, an increaselarger groups of 16%. Diluted earnings per sharehomogeneous loans segmented by loan type and specific reserves for 2016 was $1.70 compared to $1.55 forloans individually evaluated.
In making its assessment on the prior year, which represented an increase of 10%. In 2016, earnings per share includes the dilutive effect from June 23rd to December 31stadequacy of the outstanding shares issuedgeneral reserves of ACL for loans, management considers several quantitative and qualitative factors from internal and external sources relating to past events, current conditions, and reasonable and supportable forecasts, including: the expected duration of the loans segments, the trends in risk classification of individual loans; individual review of larger and higher risk problem assets; the level of delinquent, non-performing, and individually evaluated loans; the level of hardship loan modifications; foreclosure activity; net charge-offs; commercial concentrations by industry, property type and real estate location; the growth and composition of the loan portfolio; as well as trends in the Company’s 2016 equity offering.general levels of these indicators. In addition, management monitors expansion in the Company's geographic market area, the experience level of lenders and any changes in underwriting criteria, the strength of the local and national economy, including general conditions in the multi-family, commercial real estate and development and construction markets in the Company's local region as well as changes in current and forecasted economic conditions, such as changes in gross domestic product, the unemployment rate and new jobs created, real estate values, commercial vacancy rates, recession risk estimates and other relevant economic factors. Management also performs a qualitative assessment beyond model estimates and applies qualitative adjustments as management deems necessary, acknowledging that it can take time for economic results to work through the loan portfolio with charge-offs often occurring years after the economic downturn.
Reserve for unfunded commitments
The reserve for unfunded commitments is included in the line item "Accrued expenses and other liabilities" on the Company’s net interest incomeConsolidated Balance Sheets. The estimate of credit loss incorporates assumptions for both the year ended December 31, 2016 was $86.8 million compared to $78.3 million for the year ended December 31, 2015, an increaselikelihood and amount of $8.5 million, or 11%. The increase in net interest incomefunding over the comparable year was due primarily to revenue generated from loan growth.estimated life of the commitments, including adjustments for current conditions and reasonable and supportable forecasts. Management periodically reviews and updates its assumptions for estimated funding rates.
The Company measures expected credit losses on available-for-sale securities based upon the unrealized gain or 36%,loss position of the security. For available-for-sale debt securities in an unrealized loss position, the Company evaluates qualitative criteria to determine any expected loss unless the Company intends to sell, or it is more likely than not that the Company will be required to sell before recovery of the amortized cost. In the latter two circumstances, the Company recognizes the entire difference
61
between the security’s amortized cost basis and the average rate increased 19 basis points.
| Year Ended December 31, | |||||||||||||||
| (Dollars in thousands) | 2016 | 2015 | Change | % Change | |||||||||||
| Investment advisory fees | $ | 4,774 | $ | 4,750 | $ | 24 | 1 | % | |||||||
| Deposit and interchange fees | 5,124 | 4,879 | 245 | 5 | % | ||||||||||
| Income on bank-owned life insurance, net | 747 | 553 | 194 | 35 | % | ||||||||||
| Net gains on sales of investment securities | 802 | 1,828 | (1,026 | ) | (56 | )% | |||||||||
| Net gains on sales of loans | 601 | 492 | 109 | 22 | % | ||||||||||
| Other income | 2,393 | 2,465 | (72 | ) | (3 | )% | |||||||||
| Total non-interest income | $ | 14,441 | $ | 14,967 | $ | (526 | ) | (4 | )% | ||||||
| Year Ended December 31, | |||||||||||||||
| (Dollars in thousands) | 2016 | 2015 | Change | % Change | |||||||||||
| Salaries and employee benefits | $ | 43,886 | $ | 40,285 | $ | 3,601 | 9 | % | |||||||
| Occupancy and equipment expenses | 7,362 | 7,308 | 54 | 1 | % | ||||||||||
| Technology and telecommunications expenses | 6,080 | 5,710 | 370 | 6 | % | ||||||||||
| Advertising and public relations expenses | 2,833 | 2,719 | 114 | 4 | % | ||||||||||
| Audit, legal and other professional fees | 1,721 | 1,657 | 64 | 4 | % | ||||||||||
| Deposit insurance premiums | 1,387 | 1,214 | 173 | 14 | % | ||||||||||
| Supplies and postage expenses | 965 | 988 | (23 | ) | (2 | )% | |||||||||
| Other operating expenses | 6,094 | 5,851 | 243 | 4 | % | ||||||||||
| Total non-interest expense | $ | 70,328 | $ | 65,732 | $ | 4,596 | 7 | % | |||||||
The Company has the option to perform either (i) a qualitative assessment of whether it is "more likely than not" that the reporting unit's fair value is less than its book value, or (ii) a quantitative assessment.
1.Management's qualitative assessment would take into consideration, among other items, macroeconomic conditions, industry and market considerations, cost or margin factors, financial performance and share price. Based on the qualitative assessment, if the Company were to conclude: (a) it is "more likely than not" that the fair value of a reporting unit exceeds its book value, goodwill is deemed not impaired, or (b) it is "more likely than not" that the fair value of a reporting unit is less than its book value, a quantitative goodwill analysis must be performed.
2.The Company may elect to forgo the qualitative assessment and perform the quantitative analysis even if management does not believe that is "more likely than not" that goodwill is impaired. The quantitative goodwill analysis compares the fair value of the reporting unit with its book value, including goodwill. If the fair value of the reporting unit equals or exceeds its book value, goodwill is deemed not impaired. If the book value of the reporting unit exceeds its fair value, a goodwill impairment loss is recognized for the difference between these amounts, not exceeding the goodwill carrying amount.
At December 31, 2023, based on the Company's qualitative analysis, goodwill was deemed not to be impaired.
Recent Accounting Pronouncements
See Note 1, "Summary of Significant Accounting Policies"Policies," Item (t)(w) "Recent Accounting Pronouncements," to the Company's consolidated financial statements, contained in Item 8 under the heading "Recent Accounting Pronouncements"of this Form 10-K below, for information regarding recent accounting pronouncements.
Interest Margin Sensitivity Analysis
The Company's primary market risk is interest rateinterest-rate risk. Oversight of interest rateinterest-rate risk management is the responsibility of the Board. Annually, the Board reviews and approves the Company's asset-liability management policy, which provides management with guidelines for controlling interest rateinterest-rate risk, as measured through net interest income sensitivity to changes in interest rates, within certain tolerance levels. The Board also establishes and monitors guidelines for the Company's liquidity, capital ratios and asset-liability management.
The Company's asset-liability management strategies and guidelines are reported to the Board on a periodic basis. These strategies and guidelines are revised based on changes in interest rateinterest-rate levels, general economic conditions, competition in the marketplace, the current interest rateinterest-rate risk position of the Company, anticipated growth and other factors.
One of the principal factors in maintaining planned levels of net interest income is the ability to design effective strategies to manage the impact of interest rate changes on future net interest income. Quarterly, management completes a net interest income sensitivity analysis and reports the results to the Board. This analysis includes a simulation of the Company's net interest income under various interest rate scenarios.interest-rate scenarios and assumes no future growth (i.e., static balance sheet). Variations in the interest rateinterest-rate environment affect numerous factors, including prepayment speeds, reinvestment rates, maturities of investments (due to call provisions), ability to attract deposits and other funding, and interest rates on various asset and liability accounts.
62
The Company can be subject to net interest margin compression depending on the economic environment, the shape of the yield curve and a mismatch in timing for yield changes on interest-earning assets and interest-bearing liabilities. Generally, the Company's margin generally performs slightly better over time in a rising rate environment, while it generally decreases in a declining rate environment and when the yield curve is flattening or inverted. The Company can be subject to margin compression depending on the economic environment and the shape of the yield curve.
In a flattening yield curve scenario, net interest margin compression occurs as the spread between the cost of funding and the yield on interest earninginterest-earning assets narrows. Under this scenario, the degree of net interest margin compression is highly dependent on the Company's ability to fund asset growth through lower cost deposits. However, if the curve is flattening, while short-term rates are rising, the adverse impact on margin may be somewhat delayed, as increases in the Prime Rate willprime lending rate may initially result in the Company's asset yields re-pricing more quickly than funding costs.
In an inverted yield curve situation, shorter-term rates exceed longer-term rates, and the impact on margin is similar but more adverse than the flat curve scenario. Again, however,However, the extent of the impact on margin is highly dependent on the Company's balance sheet mix.
In a declining rate environment, net interest margin compression will eventually occur aswhen the yield on interest earninginterest-earning assets decreases more rapidly than decreases in funding costs. The primary causes would be the impact of interest rate decreases (including
decreases in the Prime Rate)prime lending rate) on adjustable rateadjustable-rate loans and the fact that decreases in deposit rates may be limited or lag decreases in the Prime Rate. prime lending rate.
The following table below summarizes the projected cumulativeresults from the Company’s net interest income for a 24-month period as of December 31, 2017simulation model and compares the percent changes comparedchange in net interest income to the rates unchanged scenario, assuming parallel yield curve shiftsa static balance sheet for a 24-month period at December 31, 2023, 2022 and gradual interest rate changes applied during2021.
As shown in the period. Nettable, the Company's net interest income isat December 31, 2023 within the rising rate scenarios was projected to decrease in the first 24 months compared to an increase slightly over a 24 month period if rates rise 200 basis points,at December 31, 2022 and increase further if rates rise 400 basis points. This is2021, primarily due to a shift in deposit composition from non-interest-bearing account balances into interest-bearing account balances that have a higher level of interest rate sensitivity as well as a decrease in the impactCompany’s net short-term liquidity, which is defined as interest-earning deposits in banks less short-term wholesale borrowings.
Additionally, in the 200 basis point declining rate scenario noted, the percent decrease in net interest income was lower compared to the results at December 31, 2022. At December 31, 2023, deposit yields increased above the lower levels experienced at December 31, 2022 when deposit yields were closer to zero. The increase in deposit yields since December 31, 2022 results in an increased level of recentdeposit rate increases on adjustabledeclines in the 200 basis point declining rate loans.scenario, which improved net interest income sensitivity results, compared to the prior year period.
| (Dollars in thousands, except for percentage data) | December 31, 2023 | December 31, 2022 | December 31, 2021 | |||||||||||||||||||||||
| Net short-term liquidity | $ | (6,619) | $ | 227,472 | $ | 397,525 | ||||||||||||||||||||
| Changes in interest rates | Percentage Change | Percentage Change | Percentage Change | |||||||||||||||||||||||
| Rates Rise 400 Basis Points | (3.11) | % | 1.20 | % | 9.73 | % | ||||||||||||||||||||
| Rates Rise 200 Basis Points | (1.60) | % | 0.45 | % | 5.37 | % | ||||||||||||||||||||
| Rates Unchanged | — | % | — | % | — | % | ||||||||||||||||||||
| Rates Decline 200 Basis Points | (0.54) | % | (5.34) | % | (9.54) | % | ||||||||||||||||||||
63
| December 31, 2017 | |||||||
| (Dollars in thousands) | Net interest income | Percentage Change | |||||
| Changes in interest rates | |||||||
| Rates Rise 400 Basis Points | $ | 218,453 | 1.42 | % | |||
| Rates Rise 200 Basis Points | 216,575 | 0.55 | % | ||||
| Rates Unchanged | 215,396 | — | |||||
Item 8.Financial Statements and Supplementary Data
Index to Consolidated Financial Statements
| Page | |||||
64
ENTERPRISE BANCORP, INC.
Consolidated Balance Sheets
As of December 31,
| (Dollars in thousands) | December 31, 2017 | December 31, 2016 | ||||||||||||||||||||||||||
| (Dollars in thousands, except per share data) | (Dollars in thousands, except per share data) | 2023 | 2022 | |||||||||||||||||||||||||
| Assets | Assets | |||||||||||||||||||||||||||
| Cash and cash equivalents: | Cash and cash equivalents: | |||||||||||||||||||||||||||
| Cash and due from banks | $ | 40,310 | $ | 33,047 | ||||||||||||||||||||||||
| Interest-earning deposits | 14,496 | 17,428 | ||||||||||||||||||||||||||
| Interest-earning deposits with banks | ||||||||||||||||||||||||||||
| Total cash and cash equivalents | 54,806 | 50,475 | ||||||||||||||||||||||||||
| Investment securities at fair value | 405,206 | 374,790 | ||||||||||||||||||||||||||
| Total cash and cash equivalents | ||||||||||||||||||||||||||||
| Total cash and cash equivalents | ||||||||||||||||||||||||||||
| Investments: | ||||||||||||||||||||||||||||
| Debt securities at fair value (amortized cost of $763,981 and $940,227, respectively) | ||||||||||||||||||||||||||||
| Debt securities at fair value (amortized cost of $763,981 and $940,227, respectively) | ||||||||||||||||||||||||||||
| Debt securities at fair value (amortized cost of $763,981 and $940,227, respectively) | ||||||||||||||||||||||||||||
| Equity securities at fair value | ||||||||||||||||||||||||||||
| Total investment securities at fair value | ||||||||||||||||||||||||||||
| Federal Home Loan Bank stock | 5,215 | 2,094 | ||||||||||||||||||||||||||
| Loans held for sale | 208 | 1,569 | ||||||||||||||||||||||||||
| Loans, less allowance for loan losses of $32,915 at December 31, 2017 and $31,342 at December 31, 2016 | 2,236,989 | 1,991,387 | ||||||||||||||||||||||||||
| Loans: | ||||||||||||||||||||||||||||
| Total loans | ||||||||||||||||||||||||||||
| Total loans | ||||||||||||||||||||||||||||
| Total loans | ||||||||||||||||||||||||||||
| Allowance for credit losses | ||||||||||||||||||||||||||||
| Net loans | ||||||||||||||||||||||||||||
| Premises and equipment, net | 37,022 | 33,540 | ||||||||||||||||||||||||||
| Lease right-of-use asset | ||||||||||||||||||||||||||||
| Accrued interest receivable | 10,614 | 8,792 | ||||||||||||||||||||||||||
| Deferred income taxes, net | 10,751 | 17,020 | ||||||||||||||||||||||||||
| Bank-owned life insurance | 29,466 | 28,765 | ||||||||||||||||||||||||||
| Prepaid income taxes | 1,301 | 1,344 | ||||||||||||||||||||||||||
| Prepaid expenses and other assets | 20,330 | 10,837 | ||||||||||||||||||||||||||
| Goodwill | 5,656 | 5,656 | ||||||||||||||||||||||||||
| Total assets | $ | 2,817,564 | $ | 2,526,269 | ||||||||||||||||||||||||
| Liabilities and Stockholders’ Equity | ||||||||||||||||||||||||||||
| Liabilities and Shareholders' Equity | Liabilities and Shareholders' Equity | |||||||||||||||||||||||||||
| Liabilities | Liabilities | |||||||||||||||||||||||||||
| Deposits | $ | 2,441,362 | $ | 2,268,921 | ||||||||||||||||||||||||
| Deposits | ||||||||||||||||||||||||||||
| Deposits | ||||||||||||||||||||||||||||
| Borrowed funds | ||||||||||||||||||||||||||||
| Borrowed funds | ||||||||||||||||||||||||||||
| Borrowed funds | 89,000 | 10,671 | ||||||||||||||||||||||||||
| Subordinated debt | 14,847 | 14,834 | ||||||||||||||||||||||||||
| Lease liability | ||||||||||||||||||||||||||||
| Accrued expenses and other liabilities | 40,067 | 16,794 | ||||||||||||||||||||||||||
| Accrued interest payable | 478 | 263 | ||||||||||||||||||||||||||
| Total liabilities | 2,585,754 | 2,311,483 | ||||||||||||||||||||||||||
| Commitments and Contingencies | Commitments and Contingencies | |||||||||||||||||||||||||||
| Stockholders’ Equity | ||||||||||||||||||||||||||||
| Preferred stock, $0.01 par value per share; 1,000,000 shares authorized; no shares issued | — | — | ||||||||||||||||||||||||||
| Common stock $0.01 par value per share; 40,000,000 shares authorized; 11,609,853 shares issued and outstanding at December 31, 2017 and 11,475,742 shares issued and outstanding at December 31, 2016 | 116 | 115 | ||||||||||||||||||||||||||
| Shareholders' Equity | Shareholders' Equity | |||||||||||||||||||||||||||
| Preferred stock $0.01 par value per share; 1,000,000 shares authorized; no shares issued | ||||||||||||||||||||||||||||
| Common stock $0.01 par value per share; 40,000,000 shares authorized; 12,272,674 and 12,133,516 shares issued and outstanding, respectively | ||||||||||||||||||||||||||||
| Additional paid-in capital | 88,205 | 85,421 | ||||||||||||||||||||||||||
| Retained earnings | 143,073 | 130,008 | ||||||||||||||||||||||||||
| Accumulated other comprehensive income (loss) | 416 | (758 | ) | |||||||||||||||||||||||||
| Total stockholders’ equity | 231,810 | 214,786 | ||||||||||||||||||||||||||
| Total liabilities and stockholders’ equity | $ | 2,817,564 | $ | 2,526,269 | ||||||||||||||||||||||||
| Accumulated other comprehensive loss | ||||||||||||||||||||||||||||
| Total shareholders' equity | ||||||||||||||||||||||||||||
| Total liabilities and shareholders' equity | ||||||||||||||||||||||||||||
See accompanying notes to consolidated financial statements.
ENTERPRISE BANCORP, INC.
Consolidated Statements of Income
Years Ended December 31,
| (Dollars in thousands, except per share data) | 2023 | 2022 | 2021 | |||||||||||||||||
| Interest and dividend income: | ||||||||||||||||||||
| Loans and loans held for sale | $ | 172,535 | $ | 135,934 | $ | 133,208 | ||||||||||||||
| Investment securities | 18,575 | 18,965 | 15,143 | |||||||||||||||||
| Other interest-earning assets | 9,943 | 6,014 | 682 | |||||||||||||||||
| Total interest and dividend income | 201,053 | 160,913 | 149,033 | |||||||||||||||||
| Interest expense: | ||||||||||||||||||||
| Deposits | 44,389 | 5,711 | 3,922 | |||||||||||||||||
| Borrowed funds | 113 | 52 | 60 | |||||||||||||||||
| Subordinated debt | 3,467 | 3,352 | 3,495 | |||||||||||||||||
| Total interest expense | 47,969 | 9,115 | 7,477 | |||||||||||||||||
| Net interest income | 153,084 | 151,798 | 141,556 | |||||||||||||||||
| Provision for credit losses | 9,249 | 5,800 | 1,770 | |||||||||||||||||
| Net interest income after provision for credit losses | 143,835 | 145,998 | 139,786 | |||||||||||||||||
| Non-interest income: | ||||||||||||||||||||
| Wealth management fees | 6,730 | 6,533 | 6,787 | |||||||||||||||||
| Deposit and interchange fees | 8,475 | 8,196 | 6,971 | |||||||||||||||||
| Income on bank-owned life insurance, net | 1,264 | 1,202 | 821 | |||||||||||||||||
| Net (losses) gains on sales of debt securities | (2,419) | (1,973) | 128 | |||||||||||||||||
| Net gains on sales of loans | 34 | 30 | 833 | |||||||||||||||||
| Net gain on sale of OREO | — | — | 1,126 | |||||||||||||||||
| Net gain on sale of insurance commissions | — | 2,034 | — | |||||||||||||||||
| Loss on termination of swaps | — | — | (1,847) | |||||||||||||||||
| Gain (loss) on equity securities | 666 | (514) | 246 | |||||||||||||||||
| Other income | 2,859 | 2,954 | 3,042 | |||||||||||||||||
| Total non-interest income | 17,609 | 18,462 | 18,107 | |||||||||||||||||
| Non-interest expense: | ||||||||||||||||||||
| Salaries and employee benefits | 72,283 | 72,120 | 66,633 | |||||||||||||||||
| Occupancy and equipment expenses | 9,722 | 9,299 | 9,650 | |||||||||||||||||
| Technology and telecommunications expenses | 10,656 | 10,735 | 10,574 | |||||||||||||||||
| Advertising and public relations expenses | 2,786 | 2,758 | 2,373 | |||||||||||||||||
| Audit, legal and other professional fees | 2,945 | 2,949 | 2,347 | |||||||||||||||||
| Deposit insurance premiums | 2,712 | 1,783 | 1,910 | |||||||||||||||||
| Supplies and postage expenses | 998 | 912 | 819 | |||||||||||||||||
| Loss on extinguishment of subordinated debt | — | — | 713 | |||||||||||||||||
| Other operating expenses | 8,097 | 7,758 | 7,116 | |||||||||||||||||
| Total non-interest expense | 110,199 | 108,314 | 102,135 | |||||||||||||||||
| Income before income taxes | 51,245 | 56,146 | 55,758 | |||||||||||||||||
| Provision for income taxes | 13,187 | 13,430 | 13,587 | |||||||||||||||||
| Net income | $ | 38,058 | $ | 42,716 | $ | 42,171 | ||||||||||||||
| Basic earnings per share | $ | 3.11 | $ | 3.53 | $ | 3.51 | ||||||||||||||
| Diluted earnings per share | $ | 3.11 | $ | 3.52 | $ | 3.50 | ||||||||||||||
| Basic weighted average common shares outstanding | 12,223,626 | 12,103,033 | 12,005,838 | |||||||||||||||||
| Diluted weighted average common shares outstanding | 12,244,036 | 12,149,777 | 12,051,293 | |||||||||||||||||
| (Dollars in thousands, except per share data) | 2017 | 2016 | 2015 | |||||||||
| Interest and dividend income: | ||||||||||||
| Loans and loans held for sale | $ | 96,559 | $ | 85,390 | $ | 77,946 | ||||||
| Investment securities | 8,045 | 6,640 | 5,346 | |||||||||
| Other interest-earning assets | 428 | 285 | 179 | |||||||||
| Total interest and dividend income | 105,032 | 92,315 | 83,471 | |||||||||
| Interest expense: | ||||||||||||
| Deposits | 5,995 | 4,514 | 4,068 | |||||||||
| Borrowed funds | 590 | 81 | 38 | |||||||||
| Subordinated debt | 925 | 928 | 1,071 | |||||||||
| Total interest expense | 7,510 | 5,523 | 5,177 | |||||||||
| Net interest income | 97,522 | 86,792 | 78,294 | |||||||||
| Provision for loan losses | 1,430 | 2,993 | 3,267 | |||||||||
| Net interest income after provision for loan losses | 96,092 | 83,799 | 75,027 | |||||||||
| Non-interest income: | ||||||||||||
| Investment advisory fees | 5,149 | 4,774 | 4,750 | |||||||||
| Deposit and interchange fees | 6,011 | 5,124 | 4,879 | |||||||||
| Income on bank-owned life insurance, net | 701 | 747 | 553 | |||||||||
| Net gains on sales of investment securities | 716 | 802 | 1,828 | |||||||||
| Net gains on sales of loans | 460 | 601 | 492 | |||||||||
| Other income | 2,637 | 2,393 | 2,465 | |||||||||
| Total non-interest income | 15,674 | 14,441 | 14,967 | |||||||||
| Non-interest expense: | ||||||||||||
| Salaries and employee benefits | 48,379 | 43,886 | 40,285 | |||||||||
| Occupancy and equipment expenses | 7,960 | 7,362 | 7,308 | |||||||||
| Technology and telecommunications expenses | 6,372 | 6,080 | 5,710 | |||||||||
| Advertising and public relations expenses | 2,855 | 2,833 | 2,719 | |||||||||
| Audit, legal and other professional fees | 1,565 | 1,721 | 1,657 | |||||||||
| Deposit insurance premiums | 1,535 | 1,387 | 1,214 | |||||||||
| Supplies and postage expenses | 999 | 965 | 988 | |||||||||
| Other operating expenses | 6,480 | 6,094 | 5,851 | |||||||||
| Total non-interest expense | 76,145 | 70,328 | 65,732 | |||||||||
| Income before income taxes | 35,621 | 27,912 | 24,262 | |||||||||
| Provision for income taxes | 16,228 | 9,161 | 8,114 | |||||||||
| Net income | $ | 19,393 | $ | 18,751 | $ | 16,148 | ||||||
| Basic earnings per share | $ | 1.68 | $ | 1.71 | $ | 1.56 | ||||||
| Diluted earnings per share | $ | 1.66 | $ | 1.70 | $ | 1.55 | ||||||
| Basic weighted average common shares outstanding | 11,568,430 | 10,966,333 | 10,323,016 | |||||||||
| Diluted weighted average common shares outstanding | 11,651,763 | 11,039,511 | 10,389,934 | |||||||||
See accompanying notes to consolidated financial statements.
ENTERPRISE BANCORP, INC.
Consolidated Statements of Comprehensive Income
Years Ended December 31,
| (Dollars in thousands) | 2023 | 2022 | 2021 | |||||||||||||||||
| Net income | $ | 38,058 | $ | 42,716 | $ | 42,171 | ||||||||||||||
| Other comprehensive income (loss), net of taxes: | ||||||||||||||||||||
| Net change in fair value of debt securities | 16,444 | (100,869) | (19,554) | |||||||||||||||||
| Net change in fair value of cash flow hedges | — | — | 2,023 | |||||||||||||||||
| Total other comprehensive income (loss), net | 16,444 | (100,869) | (17,531) | |||||||||||||||||
| Total comprehensive income (loss), net | $ | 54,502 | $ | (58,153) | $ | 24,640 | ||||||||||||||
| (Dollars in thousands) | 2017 | 2016 | 2015 | |||||||||
| Net income | $ | 19,393 | $ | 18,751 | $ | 16,148 | ||||||
| Other comprehensive income (loss), net of taxes: | ||||||||||||
| Gross unrealized holding gains (losses) on investments arising during the period | 2,424 | (3,876 | ) | (518 | ) | |||||||
| Income tax (expense) benefit | (855 | ) | 1,357 | 216 | ||||||||
| Net unrealized holding gains (losses), net of tax | 1,569 | (2,519 | ) | (302 | ) | |||||||
| Less: Reclassification adjustment for net gains included in net income | ||||||||||||
| Net realized gains on sales of securities during the period | 716 | 802 | 1,828 | |||||||||
| Income tax expense | (247 | ) | (289 | ) | (637 | ) | ||||||
| Reclassification adjustment for gains realized, net of tax | 469 | 513 | 1,191 | |||||||||
| Total other comprehensive income (loss), net | 1,100 | (3,032 | ) | (1,493 | ) | |||||||
| Comprehensive income | $ | 20,493 | $ | 15,719 | $ | 14,655 | ||||||
See accompanying notes to consolidated financial statements.
ENTERPRISE BANCORP, INC.
Consolidated Statements of Changes in Stockholders’Shareholders' Equity
Years Ended December 31, 2017, 20162023, 2022 and 20152021
| Common Stock | Additional Paid-in Capital | Retained Earnings | Accumulated Other Comprehensive Income/(Loss) | Total Stockholders’ Equity | |||||||||||||||||||
| (Dollars in thousands, except share data) | Shares | Amount | |||||||||||||||||||||
| Balance at December 31, 2014 | 10,207,943 | $ | 102 | $ | 57,130 | $ | 105,951 | $ | 3,767 | $ | 166,950 | ||||||||||||
| Net income | 16,148 | 16,148 | |||||||||||||||||||||
| Other comprehensive (loss), net | (1,493 | ) | (1,493 | ) | |||||||||||||||||||
| Tax benefit from stock compensation | 217 | 217 | |||||||||||||||||||||
| Common stock dividend paid ($0.50 per share) | (5,158 | ) | (5,158 | ) | |||||||||||||||||||
| Common stock issued under dividend reinvestment plan | 58,529 | 1 | 1,276 | 1,277 | |||||||||||||||||||
| Common stock issued, other | 7,674 | — | 171 | 171 | |||||||||||||||||||
| Stock-based compensation | 65,015 | 1 | 1,783 | 1,784 | |||||||||||||||||||
| Stock options exercised, net | 38,626 | — | 431 | 431 | |||||||||||||||||||
| Balance at December 31, 2015 | 10,377,787 | $ | 104 | $ | 61,008 | $ | 116,941 | $ | 2,274 | $ | 180,327 | ||||||||||||
| Net income | 18,751 | 18,751 | |||||||||||||||||||||
| Other comprehensive (loss), net | (3,032 | ) | (3,032 | ) | |||||||||||||||||||
| Tax benefit from stock compensation | 789 | 789 | |||||||||||||||||||||
| Common stock dividend paid ($0.52 per share) | (5,684 | ) | (5,684 | ) | |||||||||||||||||||
| Common stock issued under dividend reinvestment plan | 53,516 | 1 | 1,380 | 1,381 | |||||||||||||||||||
| Common stock issued, under share offering, net and other | 932,522 | 9 | 19,793 | 19,802 | |||||||||||||||||||
| Stock-based compensation | 71,662 | 1 | 2,347 | 2,348 | |||||||||||||||||||
| Net settlement for employee taxes on restricted stock and options | (12,744 | ) | — | (442 | ) | (442 | ) | ||||||||||||||||
| Stock options exercised, net | 52,999 | — | 546 | 546 | |||||||||||||||||||
| Balance at December 31, 2016 | 11,475,742 | $ | 115 | $ | 85,421 | $ | 130,008 | $ | (758 | ) | $ | 214,786 | |||||||||||
| Net income | 19,393 | 19,393 | |||||||||||||||||||||
| Cumulative effect adjustment for adoption of new accounting pronouncements | 13 | (87 | ) | 74 | — | ||||||||||||||||||
| Other comprehensive income, net | 1,100 | 1,100 | |||||||||||||||||||||
| Common stock dividend paid ($0.54 per share) | (6,241 | ) | (6,241 | ) | |||||||||||||||||||
| Common stock issued under dividend reinvestment plan | 44,752 | — | 1,494 | 1,494 | |||||||||||||||||||
| Common stock issued, other | 2,798 | — | 96 | 96 | |||||||||||||||||||
| Stock-based compensation | 58,037 | 1 | 1,757 | 1,758 | |||||||||||||||||||
| Net settlement for employee taxes on restricted stock and options | (15,185 | ) | — | (931 | ) | (931 | ) | ||||||||||||||||
| Stock options exercised, net | 43,709 | — | 355 | 355 | |||||||||||||||||||
| Balance at December 31, 2017 | 11,609,853 | $ | 116 | $ | 88,205 | $ | 143,073 | $ | 416 | $ | 231,810 | ||||||||||||
| Common Stock | Additional Paid-in Capital | Retained Earnings | Accumulated Other Comprehensive Income/(Loss) | Total Shareholders’ Equity | ||||||||||||||||||||||||||||||||||
| (Dollars in thousands, except per share data) | Shares | Amount | ||||||||||||||||||||||||||||||||||||
| Balance at December 31, 2020 | 11,937,795 | $ | 119 | $ | 97,137 | $ | 214,977 | $ | 22,193 | $ | 334,426 | |||||||||||||||||||||||||||
| Net income | 42,171 | 42,171 | ||||||||||||||||||||||||||||||||||||
| Cumulative effect adjustment for CECL adoption | (6,510) | (6,510) | ||||||||||||||||||||||||||||||||||||
| Other comprehensive loss, net | (17,531) | (17,531) | ||||||||||||||||||||||||||||||||||||
| Common stock dividend declared ($0.74 per share) | (8,877) | (8,877) | ||||||||||||||||||||||||||||||||||||
| Common stock issued under dividend reinvestment plan | 36,651 | — | 1,250 | 1,250 | ||||||||||||||||||||||||||||||||||
| Common stock issued, other | 1,766 | — | 59 | 59 | ||||||||||||||||||||||||||||||||||
| Stock-based compensation, net | 63,329 | 1 | 2,093 | 2,094 | ||||||||||||||||||||||||||||||||||
| Net settlement for employee taxes on restricted stock and options | (10,029) | — | (346) | (346) | ||||||||||||||||||||||||||||||||||
| Stock option exercised, net | 8,870 | — | 159 | 159 | ||||||||||||||||||||||||||||||||||
| Balance at December 31, 2021 | 12,038,382 | $ | 120 | $ | 100,352 | $ | 241,761 | $ | 4,662 | $ | 346,895 | |||||||||||||||||||||||||||
| Net income | 42,716 | 42,716 | ||||||||||||||||||||||||||||||||||||
| Other comprehensive loss, net | (100,869) | (100,869) | ||||||||||||||||||||||||||||||||||||
| Common stock dividend declared ($0.82 per share) | (9,917) | (9,917) | ||||||||||||||||||||||||||||||||||||
| Common stock issued under dividend reinvestment plan | 40,640 | — | 1,396 | 1,396 | ||||||||||||||||||||||||||||||||||
| Common stock issued, other | 1,378 | — | 47 | 47 | ||||||||||||||||||||||||||||||||||
| Stock-based compensation, net | 59,338 | 1 | 2,313 | 2,314 | ||||||||||||||||||||||||||||||||||
| Net settlement for employee taxes on restricted stock and options | (11,713) | — | (433) | (433) | ||||||||||||||||||||||||||||||||||
| Stock options exercised, net | 5,491 | — | 118 | 118 | ||||||||||||||||||||||||||||||||||
| Balance at December 31, 2022 | 12,133,516 | $ | 121 | $ | 103,793 | $ | 274,560 | $ | (96,207) | $ | 282,267 | |||||||||||||||||||||||||||
| Net income | 38,058 | 38,058 | ||||||||||||||||||||||||||||||||||||
| Other comprehensive income, net | 16,444 | 16,444 | ||||||||||||||||||||||||||||||||||||
| Common stock dividend declared ($0.92 per share) | (11,238) | (11,238) | ||||||||||||||||||||||||||||||||||||
| Common stock issued under dividend reinvestment plan | 50,443 | 1 | 1,503 | 1,504 | ||||||||||||||||||||||||||||||||||
| Common stock issued, other | 1,474 | — | 44 | 44 | ||||||||||||||||||||||||||||||||||
| Stock-based compensation, net | 79,074 | 1 | 2,304 | 2,305 | ||||||||||||||||||||||||||||||||||
| Net settlement for employee taxes on restricted stock and options | (9,229) | — | (447) | (447) | ||||||||||||||||||||||||||||||||||
| Stock options exercised, net | 17,396 | — | 180 | 180 | ||||||||||||||||||||||||||||||||||
| Balance at December 31, 2023 | 12,272,674 | $ | 123 | $ | 107,377 | $ | 301,380 | $ | (79,763) | $ | 329,117 | |||||||||||||||||||||||||||
See accompanying notes to consolidated financial statements.
ENTERPRISE BANCORP, INCINC.
Consolidated Statements of Cash Flows
Years Ended December 31,
| (Dollars in thousands) | 2023 | 2022 | 2021 | |||||||||||||||||
| Cash flows from operating activities: | ||||||||||||||||||||
| Net income | $ | 38,058 | $ | 42,716 | $ | 42,171 | ||||||||||||||
| Adjustments to reconcile net income to net cash provided by operating activities: | ||||||||||||||||||||
| Provision for credit losses | 9,249 | 5,800 | 1,770 | |||||||||||||||||
| Depreciation and amortization | 6,188 | 7,036 | 7,809 | |||||||||||||||||
| Stock-based compensation expense | 2,269 | 2,316 | 2,060 | |||||||||||||||||
| Income on bank-owned life insurance, net | (1,264) | (1,202) | (821) | |||||||||||||||||
| Net losses (gains) on sales of debt securities | 2,419 | 1,973 | (128) | |||||||||||||||||
| Net (gains) losses on equity securities | (666) | 514 | (246) | |||||||||||||||||
| Mortgage loans originated for sale | (2,247) | (1,263) | (29,123) | |||||||||||||||||
| Proceeds from mortgage loans sold | 2,081 | 1,293 | 30,327 | |||||||||||||||||
| Net gains on sales of loans | (34) | (30) | (833) | |||||||||||||||||
| Net gains on sales of OREO | — | — | (1,126) | |||||||||||||||||
| Loss on termination of swaps | — | — | 1,847 | |||||||||||||||||
| Changes in: | ||||||||||||||||||||
| Net (increase) decrease in other assets | (12,818) | (11,322) | 9,324 | |||||||||||||||||
| Net increase (decrease) in other liabilities | 13,922 | 169 | (798) | |||||||||||||||||
| Net cash provided by operating activities | 57,157 | 48,000 | 62,233 | |||||||||||||||||
| Cash flows from investing activities: | ||||||||||||||||||||
| Proceeds from sales of debt securities | 84,779 | 69,620 | 3,059 | |||||||||||||||||
| Purchase of debt securities | — | (145,868) | (491,213) | |||||||||||||||||
| Proceeds from maturities, calls and pay-downs of debt securities | 88,176 | 82,834 | 87,347 | |||||||||||||||||
| Net purchases of equity securities | (2,123) | (2,998) | (793) | |||||||||||||||||
| Net purchases of FHLB capital stock | (59) | (179) | (259) | |||||||||||||||||
| Net (increase) decrease in loans | (387,218) | (260,073) | 146,812 | |||||||||||||||||
| Additions to premises and equipment, net | (6,019) | (4,838) | (4,187) | |||||||||||||||||
| Proceeds from OREO sales | — | — | 3,526 | |||||||||||||||||
| Purchase of bank-owned life insurance | — | — | (30,770) | |||||||||||||||||
| Net cash used in investing activities | (222,464) | (261,502) | (286,478) | |||||||||||||||||
| Cash flows from financing activities: | ||||||||||||||||||||
| Net (decrease) increase in deposits | (58,285) | 55,567 | 428,976 | |||||||||||||||||
| Advancements from long-term borrowings | 22,957 | 302 | 5,085 | |||||||||||||||||
| Repayments of long-term borrowings | (405) | (2,565) | (4,380) | |||||||||||||||||
| Repayment of subordinated debt | — | — | (15,600) | |||||||||||||||||
| Loss on extinguishment of subordinated debt | — | — | 713 | |||||||||||||||||
| Cash dividends paid, net of dividend reinvestment plan | (9,734) | (8,521) | (7,627) | |||||||||||||||||
| Proceeds from issuance of common stock | 44 | 47 | 59 | |||||||||||||||||
| Net settlement for employee taxes on restricted stock and options | (447) | (433) | (346) | |||||||||||||||||
| Net proceeds from stock option exercises | 180 | 118 | 159 | |||||||||||||||||
| Net cash (used in) provided by financing activities | (45,690) | 44,515 | 407,039 | |||||||||||||||||
| Net (decrease) increase in cash and cash equivalents | (210,997) | (168,987) | 182,794 | |||||||||||||||||
| Cash and cash equivalents at beginning of year | 267,589 | 436,576 | 253,782 | |||||||||||||||||
| Cash and cash equivalents at end of year | $ | 56,592 | $ | 267,589 | $ | 436,576 | ||||||||||||||
| (Dollars in thousands) | 2017 | 2016 | 2015 | |||||||||
| Cash flows from operating activities: | ||||||||||||
| Net income | $ | 19,393 | $ | 18,751 | $ | 16,148 | ||||||
| Adjustments to reconcile net income to net cash provided by operating activities: | ||||||||||||
| Provision for loan losses | 1,430 | 2,993 | 3,267 | |||||||||
| Depreciation and amortization | 7,028 | 6,081 | 5,603 | |||||||||
| Stock-based compensation expense | 1,753 | 2,380 | 1,803 | |||||||||
| Income on bank-owned life insurance, net | (701 | ) | (747 | ) | (553 | ) | ||||||
| Net gains on life insurance | — | — | (163 | ) | ||||||||
| Net gains on sales of investments | (716 | ) | (802 | ) | (1,828 | ) | ||||||
| Mortgage loans originated for sale | (19,820 | ) | (28,873 | ) | (23,673 | ) | ||||||
| Proceeds from mortgage loans sold | 21,641 | 29,614 | 24,827 | |||||||||
| Net gains on sales of loans | (460 | ) | (601 | ) | (492 | ) | ||||||
| Net gains on sales of OREO | — | — | (154 | ) | ||||||||
| Changes in: | ||||||||||||
| Decrease (increase) in other assets | 6,026 | (2,174 | ) | 64 | ||||||||
| Increase in other liabilities | 2,357 | 701 | 874 | |||||||||
| Net cash provided by operating activities | 37,931 | 27,323 | 25,723 | |||||||||
| Cash flows from investing activities: | ||||||||||||
| Proceeds from sales of investment securities | 133,736 | 4,800 | 25,115 | |||||||||
| Net (purchases) proceeds from FHLB capital stock | (3,121 | ) | 956 | 307 | ||||||||
| Proceeds from maturities, calls and pay-downs of investment securities | 32,643 | 30,930 | 26,731 | |||||||||
| Purchase of investment securities | (187,158 | ) | (118,255 | ) | (108,962 | ) | ||||||
| Net increase in loans | (247,032 | ) | (163,426 | ) | (188,738 | ) | ||||||
| Additions to premises and equipment, net | (8,211 | ) | (7,918 | ) | (3,938 | ) | ||||||
| Proceeds from OREO sales and payments | — | — | 1,015 | |||||||||
| Proceeds from bank-owned life insurance | — | 405 | — | |||||||||
| Purchase of bank-owned life insurance | — | — | (11,390 | ) | ||||||||
| Net cash used in investing activities | (279,143 | ) | (252,508 | ) | (259,860 | ) | ||||||
| Cash flows from financing activities: | ||||||||||||
| Net increase in deposits | 172,441 | 250,773 | 249,602 | |||||||||
| Net increase (decrease) in borrowed funds | 78,329 | (43,000 | ) | (5,229 | ) | |||||||
| Repayment of subordinated debt | — | — | (10,825 | ) | ||||||||
| Proceeds from the issuance of subordinated debt | — | — | 15,000 | |||||||||
| Cash dividends paid | (6,241 | ) | (5,684 | ) | (5,158 | ) | ||||||
| Proceeds from issuance of common stock, net of expenses | 1,590 | 21,183 | 1,448 | |||||||||
| Net settlement for employee taxes on restricted stock and options | (931 | ) | (442 | ) | — | |||||||
| Proceeds from stock option exercises | 355 | 546 | 431 | |||||||||
| Tax benefit from stock-based compensation | — | 789 | 217 | |||||||||
| Net cash provided by financing activities | 245,543 | 224,165 | 245,486 | |||||||||
| Net increase (decrease) in cash and cash equivalents | 4,331 | (1,020 | ) | 11,349 | ||||||||
| Cash and cash equivalents at beginning of year | 50,475 | 51,495 | 40,146 | |||||||||
| Cash and cash equivalents at end of year | $ | 54,806 | $ | 50,475 | $ | 51,495 | ||||||
| Supplemental financial data: | ||||||||||||
| Cash Paid For: Interest | $ | 7,295 | $ | 5,536 | $ | 5,467 | ||||||
| Cash Paid For: Income taxes | $ | 10,459 | $ | 10,868 | $ | 7,594 | ||||||
| Supplemental schedule of non-cash activity: | ||||||||||||
| Net purchases (sales) of investment securities not yet settled | $ | 9,154 | $ | (301 | ) | $ | 2,296 | |||||
| Bank owned life insurance proceeds not yet received | — | — | 403 | |||||||||
| Capital expenditures incurred not yet paid | — | — | 525 | |||||||||
See accompanying notes to consolidated financial statements.
ENTERPRISE BANCORP, INCINC.
Notes to the Consolidated Financial Statements
(a) Organization of Holdingthe Company and Basis of Presentation
The accompanying consolidated financial statements of Enterprise Bancorp, Inc. (the "Company," "Enterprise," "we," or "our"), a Massachusetts corporation, include the accounts of the Company and its wholly owned subsidiary, Enterprise Bank and Trust Company, commonly referred to as Enterprise Bank (the "Bank"). The Bank is a Massachusetts trust company and state chartered commercial bank organized in 1989. Substantially all of the Company’sCompany's operations are conducted through the Bank and its subsidiaries.
The Bank’sBank's subsidiaries include Enterprise Insurance Services, LLC and Enterprise Wealth Services, LLC, organized under the laws of the State of Delaware, for the purposes of engaging in insurance sales activities and offeringto offer non-deposit investment products and services, respectively.services. In addition, the Bank has the following subsidiaries that are incorporated in the Commonwealth of Massachusetts and classified as security corporations in accordance with applicable Massachusetts General Laws: Enterprise Security Corporation; Enterprise Security Corporation II; and Enterprise Security Corporation III. The security corporations, which hold various types of qualifying securities, are limited to conducting securities investment activities that the Bank itself would be allowed to conduct under applicable laws.
In February 2023, the Bank organized the EBTC NMTC Investment Fund - CHC, LLC (the "NMTC Investment Fund") under the laws of the State of Delaware for the purpose of investing in a local NMTC project which provides federal tax incentives for investments in distressed communities. The NMTC are discussed in Note 15, " Income Taxes"
The Company's headquarters and the Bank's main office are located at 222 Merrimack Street in Lowell, Massachusetts. At December 31, 2017,2023, the Company had 24 full service branches27 full-service branch banking offices serving the Greater Merrimack ValleyNorthern Middlesex, Northern Essex and North Central regionsNorthern Worcester counties of Massachusetts and Southern New Hampshire (Southern Hillsborough and Southern Rockingham counties). counties in New Hampshire.
Through the Bank and its subsidiaries, the Company offers a range of commercial, residential and consumer loan products, deposit products and cash management services, as well as investment advisoryelectronic and digital banking options. The Company also provides a range of wealth management trust and insurance services. The services offered through the Bank and its subsidiaries are managed as one strategic unit and represent the Company’sCompany's only reportable operating segment.
The Federal Deposit Insurance Corporation (the "FDIC")FDIC and the Massachusetts Division of Banks (the "Division") have regulatory authority over the Bank. The Bank is also subject to certain regulatory requirements of the Board of Governors of the Federal Reserve System (the "Federal Reserve Board") and, with respect to its New Hampshire branch operations, the New Hampshire Banking Department. The business and operations of the Company are subject to the regulatory oversight of the Federal Reserve Board. The Division also retains supervisory jurisdiction over the Company.
The accompanying audited consolidated financial statements and notes thereto have been prepared in accordance with U.S. generally accepted accounting principles ("GAAP")GAAP and the instructions for SEC Form 10-K through the rules and interpretive releases of the SEC under federal securities law. In the opinion of management, the accompanying audited consolidated financial statements reflect all necessary adjustments consisting of normal recurring accruals for a fair presentation. All significant intercompany balances and transactions have been eliminated in the accompanying audited consolidated financial statements. Certain previous years' amounts in the audited consolidated financial statements, and notes thereto, have been reclassified to conform to the current year's presentation.
The Company has evaluated subsequent events and transactions from December 31, 20172023, through the filing date of this Annual Report on Form 10-K was filed with the SEC for potential recognition or disclosure as required by GAAP and determined that there were no material subsequent events requiring recognition or disclosure.
(b) Uses of estimatesEstimates
In preparing the consolidated financial statements in conformity with GAAP, management is required to exercise judgment in determining many of the methodologies, assumptions and estimates to be utilized. These assumptions and estimates affect the reported values of assets and liabilities as of the balance sheet datedates and income and expenses for the years then ended. As future events and their effects cannot be determined with precision, actual results could differ significantly from these estimates should the assumptions and estimates used be incorrect or change over time due to changes in circumstances. Changes in those estimates resulting from continuing changechanges in the economic environment and other factors will be reflected in the consolidated
70
financial statements and results of operations in future periods. The three most significant areas in which management applies critical assumptions and estimates are the estimateestimates of the allowance for loancredit losses impairment review of investmentfor loans and available for sale securities, the reserve for unfunded commitments, and the impairment review of goodwill.goodwill, which are each discussed below.
(c) Cash and cash equivalentsCash Equivalents
Cash equivalents are defined as highly liquid investments with original maturities of three months or less, that are readily convertible to known amounts of cash and present insignificant risk of changes in value due to changes in interest rates. The Company's cash and cash equivalents ismay be comprised of cash on hand and cash items due from banks, interest-earning deposits with banks (deposit accounts, excess reserve cash balances, money markets, and money market mutual fund accounts) and overnight and term federal funds ("fed funds") sold.sold to money center banks. Balances in cash and cash equivalents will fluctuate due primarily to the timing of net depositcash flows borrowingfrom deposits, borrowings, loans and loan inflows and outflows, investment purchases and maturities, calls and sales proceeds,investments, and the immediate liquidity needs of the Company.
(d) Restricted Cash and Investments
Certain of the Company's derivative agreements contain provisions for collateral to be posted if the derivative exposure exceeds a threshold amount. When the Company has pledged cash as collateral for this purpose,in relation to certain derivatives, the cash is carried as restricted cash within cash and cash equivalents."Interest-earning deposits with banks." See Note 8,9, "Derivatives and Hedging Activities"Activities," to the Company's consolidated financial statements of this Form 10-K below for more information about the Company's collateral related to its derivatives.
As a member of the Federal Home Loan Bank of Boston ("FHLB"),FHLB, the Company is required to purchase certain levels of FHLB capital stock at par value in association with outstanding advances from the FHLB. From time-to-time, the FHLB may initiate the repurchase, at par value, of "excess" levels of its capital stock held by member banks. This stock is classified as a restricted investment and is carried at cost, which management believes approximates fair value. FHLB stock represents the only restricted investment held by the Company.
Management regularly reviews its holdings of FHLB stock for OTTI. Based on management’s periodic review,impairment, and as of December 31, 2023, the Company has not recorded any OTTI charges on this investment to date. If it was determined that no allowance for credit losses on FHLB stock was necessary.
(e) Investment Securities
Investments in debt securities that are intended to be held for indefinite periods of time, but which may not be held to maturity or on a long-term basis are considered to be "available-for-sale" and are carried at fair value.
Included as available-for-sale are debt securities that are purchased in connection with the Company's asset-liability risk management strategy and that may be sold in response to changes in interest rates, prepayment risk and other related factors. In instances where the Company has the positive intent to hold debt securities to maturity, these securities will be classified as held-to-maturity and carried at amortized cost. As of the balance sheet dates, all the Company's debt securities were classified as available-for-sale and carried at fair value.
Net unrealized appreciation and depreciation on debt securities available-for-sale, net of applicable income taxes, are recorded in the Company's Consolidated Statement of Comprehensive Income as a component of "Accumulated other comprehensive (loss) income." The net unrealized gain or loss in the Company's debt security portfolio fluctuates as market interest rates rise and fall. Due to the fixed rate nature of this portfolio, as market rates fall, the value of the portfolio rises, and as market rates rise, the value of the portfolio declines. The unrealized gains or losses on debt securities will also decline as the securities approach maturity.
The Company's equity securities are carried at fair value with changes in fair value recognized in the Company's Consolidated Income Statement as a component of "Other income." The net gains and losses on equity securities that will be recognized as a component of "Non-interest income" in the future will depend on the amount of dollars invested in equities, the magnitude of changes in equity markets and the amount of gains or losses realized through equity sales.
Investment securities' discounts are accreted and premiums are amortized over the period of estimated principal repayment using methods that approximate the interest method. Gains or losses on the sale of investment securities are recognized on the trade date on a specific identification basis.
71
ACL for Available-for-Sale Securities Methodology
In accordance with ASC "Financial Instruments—Credit Losses (Topic 326), the Company's expected credit losses on available-for-sale debt securities are presented as an allowance rather than as a write-down. The Company measures expected credit losses on available-for-sale securities based upon the unrealized gain or loss position of the security. For available-for-sale debt securities in an unrealized loss position, the Company evaluates qualitative criteria to determine any expected loss unless the Company intends to sell, or it is more likely than not that the Company will be required to sell before recovery of the amortized cost. In the latter two circumstances, the Company recognizes the entire difference between the security’s amortized cost basis and its fair value as a write-down of FHLB stock was required, impairment would be recognized throughthe investment balance with a charge to earnings. Otherwise, management’s analysis considers various factors, which include among other considerations (1) the present value of the cash flows expected to be collected compared to the amortized cost of the security, (2) duration and magnitude of the decline in value, (3) the financial condition of the issuer or issuers, and (4) structure of the security. If the Company does not expect to recover the entire amortized cost basis of the security, an allowance for credit losses for available-for-sale securities would be recorded, with a related charge to earnings, limited by the difference of the amortized cost of the security to its fair value. Subsequent measurements of the ACL for available-for-sale securities may result in a reversal the allowance for credit losses, not to exceed the amount initially recognized. In addition, the Company has elected to exclude accrued interest from the measurement of the allowance for credit losses for available-for-sale debt securities and to continue to write-off uncollectible accrued interest receivable by reversing interest income.
(f) Loans Held for Sale
Depending on the current interest rateinterest-rate environment, management projections of future interest rates and the overall asset-liability management program of the Company, management may elect to sell those fixed and adjustable rateadjustable-rate residential mortgage loans which are eligible for sale in the secondary market or hold some or all of this residential loan production for the Company's portfolio. Mortgage loans are generally not pooled for sale, but instead sold on an individual basis. Enterprise may retain or sell the servicing when selling the loans. Loans sold are subject to standard secondary market underwriting and eligibility representations and warranties over the life of the loan and are subject to an early payment default period covering the first four payments for certain loan sales. Loans held for sale are carried at the lower of aggregate amortized cost or market value. Marketfair value on a separate line on the balance sheet. Fair value is based on comparable market prices for loans with similar rates and terms. When loans are sold, a gain or loss is recognized to the extent that the sales proceeds plus unamortized fees and costs exceed, or are less than, the carrying value of the loans. Gains and losses are determined using the specific identification method.
(g) Loans
Loans made by the Company to businesses, non-profits and professional practices include commercial real estate mortgage loans, construction and land development loans, secured and unsecured commercial loans and lines of credit, and letters of credit. The Company also originates equipment lease financing for businesses. Loans made to individuals include conventional residential mortgage loans, home equity loans and lines, residential construction loans on owner-occupied primary and secondary residences, and secured and unsecured personal loans and lines of credit. Most loans granted by the Company are collateralized by real estate, equipment, or equipmentreceivables and/or are guaranteed by the principals of the borrower. The ability and willingness of the
Loans are reported at the principal amount outstanding, net of deferred origination fees and costs. The aggregate amountamounts of overdrawn deposit accounts are reclassified as loan balances. Loan origination fees received, offset by direct loan origination costs, are deferred and amortized using the straight linestraight-line method over three years to five years for lines of credit and demand notes or over the life of the related loans using the level-yield method for all other types of loans. When loans are paid off, the unamortized fees and costs are recognized as an adjustment to interest income.
Certain of the Company's directors, officers, principal shareholders, and their associates are credit customers of the Company in the ordinary course of business. In addition, certain directors are also directors, trustees, officers or shareholders of corporations and non-profit entities or members of partnerships that are customers of the Bank and that enter into loan and other transactions
72
with the Bank in the ordinary course of business. All loans and commitments included in such transactions are on such terms, including interest rates, repayment terms and collateral, as those prevailing at the time for comparable transactions with persons who are not affiliated with the Bank and do not involve more than a normal risk of collectability or present other features unfavorable to the Bank.
From time to time, the Company participates with other banks in the financing of certain commercial projects. In each case in which the Company participates in a loan,order to qualify for sale accounting under GAAP, the rights and obligations of each participating bank are divided proportionately among the participating banks in an amount equal to their share of ownership and with equal priority among all banks. Each participation is governed by individual participation agreements executed by the lead bank and the participants at loan origination. When thea participation qualifies as a sale under GAAP, the balances participated out to other institutions are not carried as assets on the Company's consolidated financial statements. When a participation does not qualify as a sale under GAAP, the loan is carried at gross principal outstanding and the balances participated out to other institutions are carried as secured borrowings on the Company's consolidated financial statements. The Company performs an independent credit analysis of each commitment and a review of the participating institution prior to participation in the loan, and an annual review thereafter of each participating institution. Loans originated by other banks in which the Company is the participating institution are carried in the loan portfolio at the Company's pro rata share of ownership. See also, "Commercial loans" under "Loan categories"Participating loans with other institutions provide banks the opportunity to retain customer relationships and reduce credit risk exposure among each participating bank, while providing customers with larger credit vehicles than the individual bank might be willing or able to offer independently.
The Company seeks to lessen its credit risk exposure by managing its loan portfolio to avoid concentration by industry, relationship size and source of repayment, and through sound underwriting practices and the credit risk management function; however, management recognizes that credit losses will occur and that the amount of these losses will fluctuate depending on the risk characteristics of the loan portfolio and economic conditions.
(h) Credit Risk Management and ACL for Loans Methodology
Inherent in Note 3, 'Loans" for further information aboutthe lending process is the risk of loss due to customer non-payment, or "credit risk." The Company's commercial lending focus may entail significant additional credit risks compared to long-term financing on existing, owner-occupied residential real estate. The credit risk management function focuses on a wide variety of factors and early detection of credit issues is critical to minimize credit losses. Accordingly, management regularly monitors these factors, among others, through ongoing credit reviews by the Company's participation loans.Credit Department, an external loan review service, reviews by members of senior management as well as reviews by the Board's Loan Committee and the Board. These reviews include the assessment of internal credit quality indicators such as, among others, the risk classification of loans, past due and non-accrual loans, loans individually evaluated or with hardship modifications, and the level of foreclosure activity.
The allowanceCompany's loan risk rating system classifies loans depending on risk of loss characteristics. The classifications range from "substantially risk free" for the highest quality loans and loans that are secured by cash collateral, through a satisfactory range of "minimal," "moderate," "better than average," and "average" risk, all of which are considered "pass" rated credits. The adverse classifications range from "special mention," for loans that may need additional monitoring, to the more severe classifications of "substandard," "doubtful," and "loss" based on criteria established under banking regulations. Loans classified as "substandard" include those characterized by the distinct possibility that the Company will sustain some loss if the deficiencies are not corrected. Loans classified as "doubtful" have all the weaknesses inherent in a substandard rated loan with the added characteristic that the weaknesses make collection or full payment from liquidation, based on existing facts, conditions, and values, highly questionable and improbable. Loans classified as "loss" are generally considered uncollectible at present, although long term recovery of part or all of loan proceeds may be possible. These "loss" loans would require a specific loss reserve or charge-off. Loans which are evaluated to be of weaker credit quality are classified as adverse and placed on the "watch asset list" and reviewed on a more frequent basis by management. Adversely classified loans may be accruing or in non-accrual status and may be additionally designated as individually evaluated or restructured, or some combination thereof.
Loans on which the accrual of interest has been discontinued are designated as non-accrual loans and the classified portions are credit downgraded to one of the adversely classified categories noted above. Accrual of interest on loans is generally discontinued when a loan becomes contractually past due, with respect to interest or principal, by 90 days, or when reasonable doubt exists as to the full and timely collection of interest or principal. When a loan is placed on non-accrual status, all interest previously accrued but not collected is reversed against current period interest income. Interest accruals are resumed on such loans only when payments are brought current and have remained current for a period of 180 days or when, in the judgment of
73
management, the collectability of both principal and interest is reasonably assured. Interest payments received on loans in a non-accrual status are generally applied to principal on the books of the Company.
Loans individually evaluated consist primarily of loans for which management considers it probable that not all amounts due (principals and interest) will be collected in accordance with the original contractual terms and, to a lesser extent, if applicable, loans that management deems as individually significant or with unique risk characteristics or for some other reason based on management’s judgement. Management considers the individual payment status, net worth and earnings potential of the borrower, and the value and cash flow of the collateral as factors to determine if a loan will be paid in accordance with its contractual terms.
Effective on January 1, 2023, the Company adopted ASU 2022-02, "Financial Instruments—Credit Losses (Topic 326), Troubled Debt Restructurings and Vintage Disclosures," which eliminated the accounting guidance for TDRs and enhanced the disclosure requirements for loan lossesrestructurings made with borrowers experiencing financial difficulty. The adoption did not have a significant impact on the financial statements.
The Company continues to work with loan customers experiencing financial difficulty and may enter into loan modifications to the extent deemed to be necessary or appropriate while attempting to achieve the best mutual outcome given the individual financial circumstances and future prospects of the borrower. An assessment of whether a borrower is an estimateexperiencing financial difficulty is made on the date of probablethe modification. Modifications made for borrowers experiencing financial difficulty may be concessions in the form of principal forgiveness, interest rate reductions, payment deferrals of principal, interest or both, or term extensions, or some combination thereof. When a debt has been previously modified, the Company considers the cumulative effect of modifications made within the prior twelve-month period before the current modification, when determining whether or not a delay in payment resulting from the current modification is insignificant.
Individually evaluated adversely classified loans will be considered for upgrade based on the borrower's sustained performance over time and their improving financial condition. Consistent with the criteria for returning non-accrual loans to accrual status, the borrower must demonstrate the ability to continue to service the loan in accordance with the original or modified terms and, in the judgment of management, the collectability of the remaining balances, both principal and interest, are reasonably assured.
A specific allowance is assigned to the loan for the amount of estimated credit risk inherentloss. Individually evaluated loans are charged-off, in whole or in part, when management believes that the recorded investment in the loan is uncollectible.
ACL for Loans Methodology
In accordance with ASC "Financial Instruments—Credit Losses (Topic 326)," the CECL methodology requires early recognition of credit losses using a lifetime credit loss measurement approach that also requires the consideration of reasonable and supportable forecasts in the estimate. The CECL methodology is applicable to the loan portfolio, measured at amortized cost. It also applies to off-balance sheet credit exposures such as unadvanced loan & line balances, commitments to originate loans, standby letters of credit, and other similar instruments, which are not unconditionally cancellable. Additionally, the Company has elected to continue to present the accrued interest receivable balance on loans separate from amortized costs, exclude accrued interest from the measurement of the specified balance sheet dates. The allowance for loancredit losses for loans and to continue to write-off uncollectible accrued interest receivable by reversing interest income.
The ACL for loans is established through a provision for loancredit losses, recorded as a direct charge to earnings. LoanThe ACL for loans is a valuation account that is deducted from the amortized cost to present the net amount of the loan portfolio expected to be collected. Credit losses are charged against the allowanceACL for loans when management believes that the collectability of the loanamortized cost of a loan's principal balance is unlikely. Recoveries on loans previously charged-off are credited to the allowance. The Company maintains the allowance at a level that it deems adequate to absorb all reasonably anticipated probable losses from specifically known and other credit risks associated with the portfolio.
Arriving at an appropriate level of qualitativeACL for loans involves a high degree of management judgement. The underlying assumptions, estimates and quantitative factors that may affect credit quality ofassessments used to estimate the pool.
74
On a quarterly basis, the Company makes an assessment to estimate the ACL for Loan Losses,"loans necessary to cover expected lifetime credit losses. The adequacy of the ACL for additional accounting policiesloans is reviewed and evaluated on a regular basis by an internal management committee, a sub-committee of the Company's Board of Directors (the "Board") and the full Board.
In making its assessment on the adequacy of the ACL for loans, management considers several quantitative and qualitative factors from internal and external sources relating to past events, current conditions, and reasonable and supportable forecasts.
The Company uses a systematic methodology to measure the amount of estimated loan losses. The methodology uses a two-tiered approach that applies general reserves for larger groups of homogeneous loans, segmented by loan type and specific reserves for loans individually evaluated.
Loans collectively evaluated
Management segments loans of similar risk characteristics using the Open Pool method by first calculating each segment's loss rate as net charge-offs over the expected average life of each segment, divided by the average loan balance over that same period. The historic loss factor is an average of the loss rate over a 5-year look-back period, which approximates the average age of charged-off loans. These historic loss factors are then adjusted up or down based on management's assessment of quantitative and qualitative factors. These key factors including quantitative facts about the loan portfolio such as: commercial concentrations by industry, property type and real estate location; the growth and composition of the loan portfolio; trends in risk classification of individual loans and higher risk problem assets; the level of delinquent, non-performing, and individually evaluated loans; the level of hardship loan modifications; foreclosure activity; net charge-offs; as well as trends in the general levels of these indicators. In addition, management monitors qualitative factors such as: expansion in the Company's geographic market area; the experience level of lenders and any changes in underwriting criteria; Market conditions, including general conditions in the multi-family, commercial real estate and construction and development markets in the Company's local region as well as changes in current and forecasted economic conditions, such as changes in gross domestic product, the unemployment rate and new jobs created, real estate values, commercial vacancy rates, recession risk estimates and other relevant economic factors. Management uses a two-year reasonable and supportable forecast, and for periods beyond the forecast period, reverts immediately to historical loss rates. Management weighs the current effect of each of these areas on each particular loan segment in determining the allowance allocation factors. Management must exercise significant judgment when evaluating the effect of these quantitative and qualitative factors on the amount of the ACL for loans as data may not be reasonably available or directly applicable to determine the precise impact of a factor on the collectability over the remaining average life. The methodology contemplates a range of acceptable levels for these factors due to the subjective nature of the factors and the qualitative considerations related to non-accrual, impaired and troubled debt restructuredthe credit risk in the portfolio.
Although there have been no material changes to the Company's ACL for loans methodology, underwriting practices, or credit risk management system used to estimate credit loss exposure since December 31, 2022, during the quarter ended September 30, 2023, the Company made a minor modification to its ACL estimation process used in the prior year. The Company streamlined its allowance estimation process to collectively evaluate all loans not individually evaluated as one cohort segmented by loan type. Previously, the Company separately evaluated non-classified loans and adversely classified loans. The change did not have a material impact on the ACL for loans at December 31, 2023.
Management recognizes that additional issues may also impact the estimate of expected credit losses to some degree. From time to time management will re-evaluate the qualitative factors, regulatory guidance, and industry data in use in order to consider the impact of other issues which, based on changing circumstances, may become more significant in the future.
Loans individually evaluated
For loans that are individually evaluated, as discussed above, management estimates the credit loss by comparing the loan's carrying value against either (i) the present value of the expected future cash flows discounted at the loan's effective interest-rate; (ii) the loan's observable market price; or (iii) the expected realizable fair value of the collateral, in the case of collateral dependent loans. A specific allowance is assigned to the allowanceloan for the amount of estimated credit loss. Individually evaluated loans are charged-off, in whole or in part, when management believes that the recorded investment in the loan losses.is uncollectible.
Reserve for unfunded commitments
The reserve for unfunded commitments is included in the line item "Accrued expenses and other liabilities" on the Company’s Consolidated Balance Sheets. Management applies the CECL methodology to off-balance sheet commitments in a manner consistent with on-balance sheet loan loss rates. Additionally, the estimate of credit loss incorporates assumptions for both the
75
likelihood and amount of funding over the estimated life of the commitments. Management periodically reviews and updates its assumptions for estimated funding rates.
(i) Other Real Estate Owned
Real estate acquired by the Company through foreclosure proceedings or the acceptance of a deed in lieu of foreclosure is classified as Other Real Estate Owned ("OREO").OREO. When property is acquired, it is generally recorded at the lesser of the loan’s remaining principal balance, net of unamortized deferred fees, or the estimated fair value of the property acquired, less estimated costs to sell, establishing a new cost basis.basis and carried on the Consolidated Balance Sheet in the line item "Prepaid expenses and other assets." The estimated fair value is based on market appraisals and the Company’sCompany's internal analysis. Any loan balance in excess ofmore than the estimated realizable fair
value on the date of transfer is charged to the allowance for loancredit losses on that date. All costs incurred thereafter in maintaining the property, as well as subsequent declines in fair value are charged to non-interest expense.
(j) Premises and Equipment
Land is carried at cost. PremisesAll other premises and equipment costs are stated at cost less accumulated depreciation and amortization. Depreciation or amortization is computed on a straight-line basis over the lesser of the estimated useful lives of the asset or the respective lease term (with(including renewal options reasonably assured renewal options)certain to be exercised) for leasehold improvements generally as follows:
| Bank premises, land improvements and leasehold improvements | 10 to 39 years | |||||||
| Computer software and equipment | 3 to 5 years | |||||||
| Furniture, fixtures and equipment | 3 to 10 years | |||||||
(k) Leases
The Company leases office space, space for ATM locations and certain branch locations under noncancellable operating leases, several of which have renewal options to extend lease terms. Upon commencement of a new lease, the Company will recognize a ROU asset and corresponding lease liability on the Consolidated Balance Sheet for all leases with terms longer than 12 months. The lease liability represents the present value of the future lease payments while the ROU asset represents the lease liability plus any lease prepayments and initial direct costs.
The Company’s operating lease agreements contain both lease and non-lease components (such as common area maintenance), which are generally accounted for separately. To calculate the lease liability, the Company uses its incremental borrowing rate as the discount rate to determine the net present value of the lease liability. In determining the term of a lease, the Company included option renewal periods that it considered reasonably certain to be exercised.
The Company recognizes lease expense on a straight-line basis in the "Occupancy and equipment expenses" line item within the non-interest expense section of the Consolidated Statement of Income.
(l) Bank Owned Life Insurance
The Company has purchased bank-owned life insurance ("BOLI')owns BOLI on certain current and former senior and executive officers.officers, utilizing the tax-exempt earnings on BOLI to offset the cost of the Company's benefit plans. The cash surrender value carriedof these policies is included as an asset on the consolidated balance sheets at December 31, 2017Consolidated Balance Sheet, and December 31, 2016 amounted to $29.5 million and $28.8 million, respectively. Thereany increases in cash surrender value are no associated surrender charges underrecorded as income on bank owned life insurance on the outstanding policies.Consolidated Statement of Income.
The Company reviews long-lived assets, including premises, equipment, and equipment,lease right of use assets for impairment on an ongoing basis or whenever events or changes in business circumstances indicate that the remaining useful life may warrant revision or that the carrying amount of the long-lived asset may not be fully recoverable. If impairment is determined to exist, any related impairment loss is recognized through a charge to earnings. Impairment losses on assets disposed of, if any, are based on the estimated proceeds to be received, less cost of disposal.
76
(n) Goodwill
Goodwill is carried on the Company’sCompany's consolidated financial statements was $5.7 million at both December 31, 2017andDecember 31, 2016. This asset is related to the Company’sCompany's acquisition of two branch offices in July 2000.
In accordance with GAAP, the Company does not amortize goodwill and instead, at least annually, evaluates whether the carrying value of goodwill has become impaired. Impairment of the goodwill may occur when the estimated fair value of the Company is less than its recorded book value. A determination that goodwill has become impaired results in an immediate write-down of goodwill to its determined value with a resulting charge to operations.the Company's Consolidated Statement of Income. Goodwill is evaluated at the reporting unit level. In the case of the Company, the services offered through the Bank and subsidiaries are managed as one strategic unit and represent the Company’s only reportable operating segment.
The annual impairment test begins withCompany has the option to perform either (i) a qualitative assessment of whether it is "more likely than not" that the reporting unit's fair value is less than its carrying amount. The assessment is performed at the reporting unit level. If an entity concludes it is not "more likely than not" that the fairbook value, ofor (ii) a reporting unit is less than its carrying amount, it need not perform a two-step impairment test. In the case of the Company, the services offered through the Bank and subsidiaries are managed as one strategic unit and represent the Company’s only reportable operating segment.quantitative assessment.
1.Management's qualitative assessment takeswould take into consideration, among other items, macroeconomic conditions, industry and market considerations, cost or margin factors, financial performance and share price. Based on thisthe qualitative assessment, if the Company determined thatwere to conclude: a) it is not "more likely than not" that the Company's fair value of a reporting unit exceeds its book value, goodwill is less than its carrying amount and therefore goodwill was determineddeemed not to be impaired, at December 31, 2017.
2.The Company may elect to forgo the qualitative assessment and perform the two-step impairment test to identify potentialquantitative analysis even if management believes that is "more likely than not" that goodwill impairment and measure the amount ofis not impaired. The quantitative goodwill impairment loss to be recognized, if any. The first step of the
At December 31, 2023, based on the implied fair value. Company's quantitative analysis, goodwill was deemed not impaired.
The Company recognizesrecords all derivatives as either assets or liabilities on its consolidatedthe balance sheet and measures those instruments at fair market value.
The Company may use interest-rate-contract swaps as part of its interest-rate risk management strategy. Interest-rate- swap agreements are entered into as hedges against future interest-rate fluctuations on specifically identified assets or liabilities. The Company did not have derivative fair value hedges or derivative cash flow hedges at December 31, 2017 or 2016.
Fair value hedges are considered a hedge of the exposure to changes in the fair value of an asset, liability or firm commitment attributable to a particular risk, such as interest rate risk. For derivatives designated and qualifying as fair value hedges, changes in the fair value are recognized in earnings.
Cash flow hedges are considered a hedge of the exposure to the variability in expected future cash flows, or other types of forecasted transactions. For derivatives designated and qualifying as cash flow hedges, changes in the fair value of derivative instruments that are highly effective are recorded in other comprehensive income (loss), net of tax and subsequently reclassified into earnings in the same period during which have an offsetting relationship, arethe hedged transaction affects earnings. Any hedge ineffectiveness is recognized directly in earnings. See Note 8, "Derivatives and Hedging Activities" for more information about the Company's derivatives.
77
For derivative instruments not designated as hedging instruments, such as back-to-back interest rate swaps and risk participation agreements, changes in fair value are recognized in earnings.
See Note 9, "Derivatives and Hedging Activities," to the Company's consolidated financial statements of this Form 10-K, contained below, for further information on the Company's derivative and hedging activities.
(q) Revenue Recognition
Interest and dividend income (primarily loan interest income from customers) are our primary sources of revenue and are outside of the scope of ASC 606, "Revenue from Contracts with Customers," and are accounted for under other ASC topics. The core principles of this standard require an entity to recognize revenue on the transfer of goods and services to customers as performance obligations are satisfied.
The primary areas of income for the Company within the scope of ASC 606 are wealth management fees and deposit and interchange fees which are components of non-interest income on the Company's Consolidated Statements of Income and are discussed below.
Wealth management fees consist of income generated through our wealth management services. Wealth management income is generated primarily by managing customers' financial assets. Revenue is recognized as our performance obligation is completed each month. Revenue earned through our wealth services platform is generated through a third-party arrangement to refer, manage and service customers. For new sales and referrals along with transactional type charges, the performance obligation is based on a point in time and the payment is received and revenue is recognized in the same month as the revenue generating activity. For managing and servicing customers, revenue is recognized when our performance obligation is completed each month.
Deposit and interchange fees are comprised of deposit account related charges and income generated from electronic payment interchanges. Deposit account charges consist of certain transactional analysis fees net of earning balance credits, monthly account service fees, and transactional fees such as overdraft fees. Analysis and monthly account services fees are recognized over the period the service is performed. For transactional fees, the performance obligation and the revenue are recognized at a point of time and payment is typically received as the service is rendered. Interchange income is generated primarily from retail debit card transactions processed through the card payment network. The performance obligation and the revenue are recognized when the service is performed.
The following non-interest income components are not subject to ASC 606: income on BOLI, net gains/losses on investment securities, and net gains on sales of loans, and are covered under other ASC topics. The remaining revenue items in non-interest income are not material.
(r) Stock-Based Compensation
The Company’sCompany currently has one active stock incentive plan: The Enterprise Bancorp, Inc. 2016 Stock Incentive Plan, as amended (the "2016 Plan"). The 2016 Plan permits the Board to grant, under various terms, both incentive and non-qualified stock options (for the purchase of newly issued shares of common stock), restricted stock, restricted stock units and stock appreciation rights to officers and other employees, and to non-employee directors and consultants. The 2016 Plan also allows for newly issued shares of common stock to be issued without restrictions to officers and other employees, and non-employee directors and consultants.
As of December 31, 2023, 370,680 common shares remained available for future grants under the 2016 Plan. Awards previously granted under an earlier, now expired plan remain outstanding and may be exercised through 2028.
Under terms of the 2016 Plan, options exercised and restricted stock awards vested may be net settled to cover payment for option costs and employee tax obligations, resulting in shares of common stock being reacquired by the Company and returned to the pool of shares reserved for issuance under the incentive plans. In accordance with Massachusetts law, shares reacquired by the Company will be treated as authorized but unissued shares.
The non-employee members of the Company's Board may opt to receive newly issued shares of the Company's common stock in lieu of cash compensation for attendance at Board and Board Committee meetings. These shares are issued annually each January for Board meetings held in the previous year. Directors must make an irrevocable election to receive shares of common
78
stock in lieu of cash fees prior to December 31st of the preceding year. Directors are granted shares of common stock in lieu ofcash fees based on an average quarterly close price of the Company's common stock on the NASDAQ Global Market during the year.
From time to time, the Company issues shares to community members for consulting on regional advisory councils and grants shares of fully vested stock as employee anniversary awards. These shares vest immediately and the cost, which is based on the market price on the date of grant and deemed to be immaterial, is expensed in the period in which the services are rendered.
The Company's consolidated financial statements include stock-based compensation expense for the portion of stock option awards and stock awards for which the requisite service has been rendered during the period.period or the estimate of achieving certain predefined performance objectives. The compensation expense has been recorded based on the estimated grant-date fair value of the stock option awards with no adjustment for estimated forfeitures, or in the case of stock awards, the market value of the common stock on the date of grant. Prior to the adoption of ASU 2016-09 "Compensation - Stock Compensation (Topic 718): Improvement to Employee Share-Based Payment Accounting," in January 2017, forfeitures were estimated and netted against the expense. Upon adoption of this ASU, expenseExpense adjustments are made for actual forfeitures as they occur. See "Recent Accounting pronouncements" below in this Note 1, for further information related to the adoption of ASU 2016-09, including the change in recording excess tax benefits and deficiencies.
The Company will recognize the remaining estimated compensation expense for the portion of outstanding awards and compensation expense for any future awards, net of actual forfeitures, as the requisite service is rendered (i.e., on a straight-line basis over the remaining vesting period of each award) or as performance objectives are met. Stock awards that do not require future service ("vested awards") will be expensed immediately. Stock-based compensation also includes Directordirector stock compensation for stock awards and stock in lieu of cash fees, both included in other operating expenses, described in more detail inexpenses.
See Note 12,14, "Stock-Based Compensation.Compensation," to the Company's consolidated financial statements of this Form 10-K, contained below, for further information on the Company's stock incentive plans and terms of outstanding awards and the Company's stock-based compensation.
The Company and its subsidiaries file income tax returns in the U.S. federal jurisdiction and invarious states, within the statesdirectives of Massachusetts and New Hampshire.the respective enacted tax legislation. The Company uses the asset and liability method of accounting for income taxes. Under this method, deferred tax assets and liabilities are recognized for the future tax expense or benefit attributable to differences between the financial statement carrying amounts and the tax basis of assets and liabilities. The deferred tax assets and liabilities are reflected at currently enacted income tax rates applicable to the period in which the deferred tax assets or liabilities are expected to be realized or settled. As changes in tax laws or rates are enacted, deferred tax assets and liabilities will be adjusted accordingly through the provision for income taxes in the period that includes the enactment date, which may be earlier than the effective date.
The Company’sCompany's policy is to classify interest resulting from underpayment of income taxes as income tax expense in the first period the interest would begin accruing according to the provisions of the relevant tax law. The Company classifies penalties resulting from underpayment of income taxes as income tax expense in the period for which the Company claims or expects to claim an uncertain tax position or in the period in which the Company’sCompany's judgment changes regarding an uncertain tax position.
The income tax provisions will differ from the expense that would result from applying the federal statutory rate to income before taxes, due primarily to the impact of state tax expense, tax-exempt interest from certain investment securities, loans and BOLI.BOLI and the tax impact from equity compensation activity.
As of December 31, 2023, the impact of the Tax Cuts and Jobs Acts (the "newCompany had one investment in a local NMTC project which provides federal tax bill").incentives for investments in distressed communities. The investment is accounted for using the proportional amortization method and will be amortized over seven years, which represents the period that the tax credits and other tax benefits will be utilized.
Basic earnings per share are calculated by dividing net income available to common stockholdersshareholders by the weighted average number of common shares outstanding (including participating securities) during the year. The Company's only participating
79
securities are unvested restricted stock awards that contain non-forfeitable rights to dividends. Diluted earnings per share reflects the effect on weighted average shares outstanding of the number of additional shares outstanding if dilutive stock options were converted into common stock using the treasury stock method.
Comprehensive income is defined as all changes to stockholder'sshareholders' equity except investments by and distributions to stockholders.shareholders. Net income is one component of comprehensive income, with other components referred to in the aggregate as other comprehensive income. The Company’s onlyCompany's other comprehensive income component iscomponents are the net unrealized holding gains or losses on investments available-for-sale,changes in fair value of debt securities and cash flow hedges, both net of deferred income taxes. Pursuant to GAAP, the Company initially excludes thesethe unrealized holding gains and losses from net income; however, they are later reported as reclassifications out of accumulated other comprehensive income into net income when the securities are sold. circumstances warrant.
When debt securities are sold, the reclassification of realized gains and losses on available-for-sale securities are included on the Consolidated Statements of Income under the "non-interest"Non-interest income" subheading on the line item "net"Net gains (losses) on sales of investmentavailable-for-sale debt securities" and the related income tax expense is included in the line item "provision"Provision for income taxes."
For cash flow hedges of interest rate risk, the change in fair value will be reclassified in the same period during which the hedged transaction affects earnings, to either interest expense as interest is incurred on the Company's hedge liability, or to interest income as interest is earned on the Company's hedge asset. The reclassification of gain or loss on the derivatives are included on the Consolidated Statements of Income under "Interest income" or "Interest expense" line item and the related income tax expense is included in the line item "Provision for income taxes," both of which are also detailed, along with other information, in Note 11, "Comprehensive Income (Loss)," of this Form 10-K.
(v) Dividends
Neither the Company nor the Bank may declare or pay dividends on its stock if the effect thereof would cause shareholders' equity to be reduced below applicable regulatory capital requirements or if such declaration and payment would otherwise violate regulatory requirements.
As the principal asset of the Company, the Bank currently provides the only source of cash for the payment of dividends by the Company. Under Massachusetts law, trust companies such as the Bank may pay dividends only out of "net profits" and only to the extent that such payments will not impair the Bank's capital stock. Any dividend payment that would exceed the total of the Bank's net profits for the current year plus its retained net profits of the preceding two years would require the Massachusetts Division of Banks' approval. Applicable provisions of the FDIC Improvement Act also prohibit a bank from paying any dividends on its capital stock if the bank is in default on the Consolidated Statementspayment of Comprehensive Incomeany assessment to the FDIC or if the payment of dividends would otherwise cause the bank to become "undercapitalized." Any restrictions, regulatory or otherwise, on the ability of the Bank to pay dividends to the Company may restrict the ability of the Company to pay dividends to the holders of its common stock.
The statutory term "net profits" essentially equates with the accounting term "net income" and is defined under the subheading "reclassification adjustment for net gains included in net income."Massachusetts banking statutes to mean the remainder of all earnings from current operations plus actual recoveries on loans and investments and other assets after deducting from such total all current operating expenses, actual losses, accrued dividends on any preferred stock and all federal and state taxes.
(w) Recent Accounting Pronouncements
Accounting pronouncements adopted by the Company
In March 2016, the Financial Accounting Standards Board (the "FASB") issued Accounting Standards Update ("ASU" or "Update") No. 2016-09, "Compensation - Stock Compensation (Topic 718): Improvement to Employee Share-Based Payment Accounting." The new standard was effective for fiscal years beginning after December 15, 2016, including interim periods within those fiscal years.
80
for sale securities. These strandedInvestments in Tax Credit Structures Using the Proportional Amortization Method." ASU 2023-02 permits reporting entities to elect to account for their tax effects,equity investments, regardless of the difference betweentax credit program from which the historicalincome tax ratecredits are received, using the proportional amortization method if certain conditions are met. The election can be made for each individual qualifying tax credit investment. Under the proportional amortization method, the initial cost of an investment is amortized in proportion to the amount of tax credits and other tax benefits received, with the amortization and tax credits recognized as a component of income tax expense. To qualify for the proportional amortization method, all of the following conditions must be met: (1) It is probable that the income tax credits allocated to the tax equity investor will be available; (2) The tax equity investor does not have the ability to exercise significant influence over the operating and financial policies of the underlying project; (3) Substantially all of the projected benefits are from income tax credits and other income tax benefits; (4) The tax equity investor's projected yield based solely on the cash flows from the income tax credits and other income tax benefits is positive; and (5) The tax equity investor is a limited liability investor in the limited liability entity for both legal and tax purposes, and the newly enacted tax rate,equity investor's liability is limited to its capital investment. Under the proportional amortization method, the investment shall be tested for impairment when events or changes in circumstances indicate that it is more likely than not that the carrying amount of the investment will not be reclassified from accumulated other comprehensive income to retained earnings. The amendmentrealized. An impairment loss shall be measured as the amount by which the carrying amount of an investment exceeds its fair value. A previously recognized impairment loss shall not be reversed. ASU 2023-02 is effective for all organizations forfiscal years, and interim periods within those fiscal years, beginning after December 15, 2018, and interim periods within those fiscal years. Early adoption is permitted for reporting periods in which financial statements had not been issued.2023. The Company chosehas elected to early adopt forASU 2022-01 effective on January 1, 2023, applying the year ended December 31, 2017, withnew guidance to a cumulative effect adjustment to retained earningsnew investment in NMTC made in the first quarter of 2023, and accumulated other comprehensive. Thisthe adoption did not have a materialsignificant impact on the Company's consolidated financial statements, resultsstatements.
In March 2022, the FASB issued ASU 2022-01, "Derivatives and Hedging (Topic 815): Fair Value Hedging — Portfolio Layer Method." This ASU clarifies the guidance on fair value hedge accounting of operations or disclosures upon adoption.interest rate risk for portfolios of financial assets. The ASU amends the guidance in ASU 2017-12, "Derivatives and Hedging (Topic 815): Targeted Improvements to Accounting for Hedging Activities," that, among other things, established the "last-of-layer" method for making the fair value hedge accounting for these portfolios more accessible. ASU 2022-01 renames that method the "portfolio layer" method and addresses feedback from stakeholders regarding its application. The Company adopted ASU 2022-01 effective on January 1, 2023 and the adoption did not have a significant impact on the financial statements.
In March 2022, the FASB issued ASU 2022-02, "Financial Instruments — Credit Losses (Topic 326), Troubled Debt Restructurings and Vintage Disclosures." This ASU eliminates the accounting guidance for troubled debt restructurings by creditors that have adopted the CECL methodology for estimating allowances for credit losses and enhances the disclosure requirements for loan restructurings made with borrowers experiencing financial difficulty. In addition, the amendments require a public business entity to disclose current-period gross charge-offs for financing receivables and net investment in leases by year of origination in the vintage disclosures. The Company adopted ASU 2022-02 effective on January 1, 2023, prospectively, and the adoption did not have a significant impact on the financial statements.
Accounting pronouncements not yet adopted by the Company (in order of effective date of implementation)
In May 2014,December 2023, the FASB issued ASU No. 2014-09, "Revenue from Contracts with Customers2023-09, "Income Taxes (Topic 606)740): Improvements to Income Tax Disclosures.". This ASU requires public business entities, on an annual basis, to disclose specific categories in the rate reconciliation and provide additional information for reconciling items that meet a quantitative threshold (if the effect of those reconciling items is intendedequal to create a single source of revenue guidance which is more principles basedor greater than current revenue guidance. The guidance affects any entity that either enters into contracts with customers to transfer goods or services, or enters into contracts for the transfer of non-financial assets, unless those contracts are within the scope of other standards. In August 2015, the FASB issued ASU 2015-14, "Revenue from Contracts with Customers (Topic 606): Deferral5 percent of the Effective Date" to amendamount computed by multiplying pretax income by the effective date ofapplicable statutory income tax rate). ASU 2014-09. The amendments in ASU 2014-09 are2023-09 is effective for annualfiscal years, and interim periods within those fiscal years beginning after December 15, 2017. Earlier2024, with early adoption was permitted only as of annual reporting periods beginning after December 15, 2016, including interim reporting periods within that reporting period. The FASB has since issued additional related ASUs amendments intended to clarify certain aspects and improve understanding of the implementation guidance of Topic 606 but do not change the core principles of the guidance in Topic 606. The effective date and transition requirements for the amendments are the same as the effective date and transition requirements of Topic 606.
In August 2016,November 2023, the FASB issued ASU No. 2016-15, "Statement of Cash flows2023-07, "Segment Reporting (Topic 230) - Classification of Certain Cash Receipts and Cash Payments.280): Improvements to Reportable Segment Disclosures." The amendments in this ASU are intended to reduce diversity in practice related to the presentation of eight specific cash flow issues.improve reportable segment disclosure requirements primarily through enhanced disclosures about significant segment expenses. For public business entities, that are SEC filers, such as the Company, the amendments in this Update are effective for fiscal years beginning after December 15, 2017, including interim periods within those fiscal years. Because this amendment primarily impacts the presentation and classification of information, the Company does not expect this ASU to have an impact on the Company's consolidated financial statements and results of operations. The Company is currently in the process of implementing this ASU for the first quarter of 2018.
2023. The Company is currently evaluating the effectsimpact of thisthe ASU on the Company'sCompany’s consolidated financial statements, results of operations and disclosures. Based onstatements.
In October 2023, the Company's evaluation to date, management believes the more significant implication of thisFASB issued ASU on the Company relates to operating leases of our facilities, mainly branch leases. As of December 31, 2017, the Company had leases on 17 of its locations, including branches and part of its main campus, and expects that upon adoption of this ASU the balance sheet will reflect both lease liabilities, equal2023-06, "Disclosure Improvements — Codification Amendments in Response to the present valueSEC’s Disclosure Update and Simplification Initiative." This ASU amends the ASC to incorporate certain disclosure requirements from SEC Release No. 33-10532—Disclosure Update and Simplification that was issued in 2018. The effective date for each amendment will be the date on which the SEC’s removal of lease payments, and right-of-use assets, equal to the lease liability plus payments made to lessorsthat related disclosure from Regulation S-X or
81
| 2017 | ||||||||||||||||
| (Dollars in thousands) | Amortized cost | Unrealized gains | Unrealized losses | Fair Value | ||||||||||||
Federal agency obligations(1) | $ | 51,769 | $ | 30 | $ | 82 | $ | 51,717 | ||||||||
Residential federal agency MBS(1) | 141,054 | 71 | 971 | 140,154 | ||||||||||||
Commercial federal agency MBS(1) | 66,777 | 9 | 286 | 66,500 | ||||||||||||
| Municipal securities | 132,603 | 2,097 | 354 | 134,346 | ||||||||||||
| Corporate bonds | 11,546 | 63 | 67 | 11,542 | ||||||||||||
Certificates of deposits (2) | 950 | — | 3 | 947 | ||||||||||||
Total investment securities, at fair value(3) | $ | 404,699 | $ | 2,270 | $ | 1,763 | $ | 405,206 | ||||||||
| 2016 | ||||||||||||||||
| (Dollars in thousands) | Amortized cost | Unrealized gains | Unrealized losses | Fair Value | ||||||||||||
Federal agency obligations(1) | $ | 74,682 | $ | 432 | $ | 45 | $ | 75,069 | ||||||||
Residential federal agency MBS(1) | 94,818 | 96 | 1,561 | 93,353 | ||||||||||||
Commercial federal agency MBS(1) | 71,993 | 15 | 1,730 | 70,278 | ||||||||||||
| Municipal securities | 112,401 | 922 | 1,520 | 111,803 | ||||||||||||
| Corporate bonds | 10,734 | 51 | 90 | 10,695 | ||||||||||||
Certificates of deposits (2) | 950 | — | 1 | 949 | ||||||||||||
| Total debt securities | 365,578 | 1,516 | 4,947 | 362,147 | ||||||||||||
| Equity investments | 10,413 | 2,532 | 302 | 12,643 | ||||||||||||
| Total investment securities, at fair value | $ | 375,991 | $ | 4,048 | $ | 5,249 | $ | 374,790 | ||||||||
(2)Investment Securities
As of December 31, 2023, and 2022 , the dates reflectedinvestment portfolio was comprised primarily of debt securities, with a small portion of the investment portfolio invested in the tables above, allequity securities.
Debt Securities
All of the Company's investmentdebt securities were classified as available-for-sale and carried at fair value.
| 2023 | ||||||||||||||||||||||||||
| (Dollars in thousands) | Amortized Cost | Unrealized Gains | Unrealized Losses | Fair Value | ||||||||||||||||||||||
| Federal agency obligations | $ | 5,006 | $ | — | $ | 28 | $ | 4,978 | ||||||||||||||||||
| U.S. treasury securities | 16,993 | — | 1,068 | 15,925 | ||||||||||||||||||||||
| Federal agency CMO | 396,665 | 33 | 61,947 | 334,751 | ||||||||||||||||||||||
| Federal agency MBS | 21,586 | 31 | 2,805 | 18,812 | ||||||||||||||||||||||
| Taxable municipal securities | 262,168 | 34 | 35,225 | 226,977 | ||||||||||||||||||||||
| Tax-exempt municipal securities | 45,548 | 156 | 285 | 45,419 | ||||||||||||||||||||||
| Corporate bonds | 4,058 | — | 92 | 3,966 | ||||||||||||||||||||||
| Subordinated corporate bonds | 11,957 | — | 1,672 | 10,285 | ||||||||||||||||||||||
| Total debt securities, at fair value | $ | 763,981 | $ | 254 | $ | 103,122 | $ | 661,113 | ||||||||||||||||||
| 2022 | ||||||||||||||||||||||||||
| (Dollars in thousands) | Amortized Cost | Unrealized Gains | Unrealized Losses | Fair Value | ||||||||||||||||||||||
| Federal agency obligations | $ | 5,014 | $ | — | $ | 37 | $ | 4,977 | ||||||||||||||||||
| U.S. treasury securities | 45,942 | — | 2,691 | 43,251 | ||||||||||||||||||||||
| Federal agency CMO | 474,777 | 3 | 67,798 | 406,982 | ||||||||||||||||||||||
| Federal agency MBS | 24,172 | 27 | 3,178 | 21,021 | ||||||||||||||||||||||
| Taxable municipal securities | 287,435 | 29 | 48,187 | 239,277 | ||||||||||||||||||||||
| Tax-exempt municipal securities | 84,457 | 66 | 870 | 83,653 | ||||||||||||||||||||||
| Corporate bonds | 6,480 | — | 186 | 6,294 | ||||||||||||||||||||||
| Subordinated corporate bonds | 11,950 | — | 1,303 | 10,647 | ||||||||||||||||||||||
| Total debt securities, at fair value | $ | 940,227 | $ | 125 | $ | 124,250 | $ | 816,102 | ||||||||||||||||||
Accrued interest receivable on available-for-sale debt securities, included in the "Accrued Interest Receivable" line item on the Company’s Consolidated Balance Sheets, amounted to $3.1 million and $4.0 million at December 31, 2023 and December 31, 2022, respectively.
At December 31, 2023, management performed its quarterly analysis of all securities with unrealized losses and determined that the losses were attributable to significant increases in market interest rates riserates. Management concluded that no ACL for available-for-sale securities was necessary as of December 31, 2023 and fall. Dueanticipates they will mature or be called at par value. The Company does not intend to sell these investments and has determined, based upon available evidence, that it is more likely than not that the predominantly fixed rate natureCompany will not be required to sell each security before the recovery of this portfolio, as market rates fall the value of the portfolio rises, and as market rates rise, the value of the portfolio declines. The unrealized gains or losses on debt securities will also decline as the securities approach maturity. Unrealized losses that are deemed OTTI are generally charged to earnings, as described further in Note 1, "Summary of Significant Accounting Policies," under Item (d) "Investments." Gains or losses will be recognized in the income statement if the securities are sold.its amortized cost basis.
82
The Company did not hold any available-for-sale equityfollowing tables summarize the duration of unrealized losses for debt securities at December 31, 2017.2023 and 2022:
| 2023 | ||||||||||||||||||||||||||||||||||||||||||||
| Less than 12 months | 12 months or longer | Total | ||||||||||||||||||||||||||||||||||||||||||
| (Dollars in thousands) | Fair Value | Unrealized Losses | Fair Value | Unrealized Losses | Fair Value | Unrealized Losses | # of Holdings | |||||||||||||||||||||||||||||||||||||
| Federal agency obligations | $ | 4,978 | $ | 28 | $ | — | $ | — | $ | 4,978 | $ | 28 | 1 | |||||||||||||||||||||||||||||||
| U.S. treasury securities | — | — | 15,925 | 1,068 | 15,925 | 1,068 | 4 | |||||||||||||||||||||||||||||||||||||
| Federal agency CMO | 8,810 | 18 | 311,221 | 61,929 | 320,031 | 61,947 | 86 | |||||||||||||||||||||||||||||||||||||
| Federal agency MBS | — | — | 17,114 | 2,805 | 17,114 | 2,805 | 10 | |||||||||||||||||||||||||||||||||||||
| Taxable municipal securities | 1,993 | 316 | 223,949 | 34,909 | 225,942 | 35,225 | 251 | |||||||||||||||||||||||||||||||||||||
| Tax-exempt municipal securities | 11,890 | 55 | 10,519 | 230 | 22,409 | 285 | 53 | |||||||||||||||||||||||||||||||||||||
| Corporate bonds | — | — | 3,966 | 92 | 3,966 | 92 | 18 | |||||||||||||||||||||||||||||||||||||
| Subordinated corporate bonds | — | — | 10,285 | 1,672 | 10,285 | 1,672 | 6 | |||||||||||||||||||||||||||||||||||||
| Total temporarily impaired debt securities | $ | 27,671 | $ | 417 | $ | 592,979 | $ | 102,705 | $ | 620,650 | $ | 103,122 | 429 | |||||||||||||||||||||||||||||||
| 2022 | ||||||||||||||||||||||||||||||||||||||||||||
| Less than 12 months | 12 months or longer | Total | ||||||||||||||||||||||||||||||||||||||||||
| (Dollars in thousands) | Fair Value | Unrealized Losses | Fair Value | Unrealized Losses | Fair Value | Unrealized Losses | # of Holdings | |||||||||||||||||||||||||||||||||||||
| Federal agency obligations | $ | 4,977 | $ | 37 | $ | — | $ | — | $ | 4,977 | $ | 37 | 1 | |||||||||||||||||||||||||||||||
| U.S. treasury securities | 2,878 | 109 | 40,373 | 2,582 | 43,251 | 2,691 | 6 | |||||||||||||||||||||||||||||||||||||
| Federal agency CMO | 164,391 | 13,004 | 233,051 | 54,794 | 397,442 | 67,798 | 102 | |||||||||||||||||||||||||||||||||||||
| Federal agency MBS | 9,923 | 797 | 9,165 | 2,381 | 19,088 | 3,178 | 11 | |||||||||||||||||||||||||||||||||||||
| Taxable municipal securities | 93,345 | 10,411 | 144,903 | 37,776 | 238,248 | 48,187 | 273 | |||||||||||||||||||||||||||||||||||||
| Tax-exempt municipal securities | 66,277 | 870 | — | — | 66,277 | 870 | 112 | |||||||||||||||||||||||||||||||||||||
| Corporate bonds | 6,294 | 186 | — | — | 6,294 | 186 | 31 | |||||||||||||||||||||||||||||||||||||
| Subordinated corporate bonds | 6,206 | 743 | 4,440 | 560 | 10,646 | 1,303 | 6 | |||||||||||||||||||||||||||||||||||||
| Total temporarily impaired debt securities | $ | 354,291 | $ | 26,157 | $ | 431,932 | $ | 98,093 | $ | 786,223 | $ | 124,250 | 542 | |||||||||||||||||||||||||||||||
| 2017 | |||||||||||||||||||||||||||
| Less than 12 months | 12 months or longer | Total | |||||||||||||||||||||||||
| (Dollars in thousands) | Fair Value | Unrealized Losses | Fair value | Unrealized Losses | Fair Value | Unrealized Losses | # of holdings | ||||||||||||||||||||
| Federal agency obligations | $ | 34,344 | $ | 82 | $ | — | $ | — | $ | 34,344 | $ | 82 | 9 | ||||||||||||||
| Residential federal agency MBS | 109,308 | 882 | 2,015 | 89 | 111,323 | 971 | 30 | ||||||||||||||||||||
| Commercial federal agency MBS | 35,859 | 205 | 5,190 | 81 | 41,049 | 286 | 11 | ||||||||||||||||||||
| Municipal securities | 16,983 | 129 | 10,210 | 225 | 27,193 | 354 | 50 | ||||||||||||||||||||
| Corporate bonds | 2,802 | 23 | 2,913 | 44 | 5,715 | 67 | 33 | ||||||||||||||||||||
| Certificates of deposits | 947 | 3 | — | — | 947 | 3 | 4 | ||||||||||||||||||||
| Total temporarily impaired investment securities | $ | 200,243 | $ | 1,324 | $ | 20,328 | $ | 439 | $ | 220,571 | $ | 1,763 | 137 | ||||||||||||||
| 2016 | |||||||||||||||||||||||||||
| Less than 12 months | 12 months or longer | Total | |||||||||||||||||||||||||
| (Dollars in thousands) | Fair Value | Unrealized Losses | Fair value | Unrealized Losses | Fair Value | Unrealized Losses | # of holdings | ||||||||||||||||||||
| Federal agency obligations | $ | 13,956 | $ | 45 | $ | — | $ | — | $ | 13,956 | $ | 45 | 3 | ||||||||||||||
| Residential federal agency MBS | 68,138 | 1,236 | 8,008 | 325 | 76,146 | 1,561 | 31 | ||||||||||||||||||||
| Commercial federal agency MBS | 60,060 | 1,730 | — | — | 60,060 | 1,730 | 18 | ||||||||||||||||||||
| Municipal securities | 60,436 | 1,520 | — | — | 60,436 | 1,520 | 107 | ||||||||||||||||||||
| Corporate bonds | 5,729 | 90 | — | — | 5,729 | 90 | 37 | ||||||||||||||||||||
| Certificates of deposit | 949 | 1 | — | — | 949 | 1 | 4 | ||||||||||||||||||||
| Equity investments | 1,185 | 20 | 2,743 | 282 | 3,928 | 302 | 3 | ||||||||||||||||||||
| Total temporarily impaired investment securities | $ | 210,453 | $ | 4,642 | $ | 10,751 | $ | 607 | $ | 221,204 | $ | 5,249 | 203 | ||||||||||||||
The contractual maturity distribution at December 31, 20172023 of total debt securities was as follows:
| (Dollars in thousands) | Amortized Cost | Fair Value | ||||||||||||
| Due in one year or less | $ | 30,657 | $ | 30,252 | ||||||||||
| Due after one, but within five years | 85,847 | 81,696 | ||||||||||||
| Due after five, but within ten years | 252,508 | 217,720 | ||||||||||||
| Due after ten years | 394,969 | 331,445 | ||||||||||||
| Total debt securities | $ | 763,981 | $ | 661,113 | ||||||||||
| (Dollars in thousands) | Amortized Cost | Fair Value | ||||||
| Due in one year or less | $ | 19,095 | $ | 19,159 | ||||
| Due after one, but within five years | 82,231 | 82,255 | ||||||
| Due after five, but within ten years | 134,395 | 134,959 | ||||||
| Due after ten years | 168,978 | 168,833 | ||||||
| Total available-for-sale securities | $ | 404,699 | $ | 405,206 | ||||
Scheduled contractual maturities shown above may not reflect the actual maturities of the investments. The actual MBS/CMO cash flows likely will be faster than presented above due to prepayments and amortization. Similarly, included in debt securitiesthe table above are callable securities, comprised of municipal securities and corporate bonds, with amortized costs anda fair valuesvalue of $74.5$133.4 million, and $75.7 million, respectively, at December 31, 2017, which can be redeemed by the issuers prior to the maturity presented above. Management considers these factors when evaluating the interest rateinterest-rate risk in the Company's asset-liability management program.
From time to time, the Company may pledge debt securities as collateral for deposit account balances of municipal customers, and for borrowing capacity with the FHLB and the Federal Reserve Bank of Boston (the "FRB").FRB. The fair value of debt securities pledged as collateral for these purposes was $383.1$650.8 million and $804.2 million at December 31, 20172023 and $361.2 million at December 31, 2016. 2022, respectively.
83
Sales of investments, including pending trades based on trade date, if applicable,debt securities, for the years ended December 31, 2017, 2016,2023, 2022 and 20152021 are summarized as follows:
| (Dollars in thousands) | 2023 | 2022 | 2021 | |||||||||||||||||
Amortized cost of debt securities sold(1) | $ | 87,198 | $ | 71,593 | $ | 2,931 | ||||||||||||||
| Gross realized gains on sales | — | 1,061 | 128 | |||||||||||||||||
| Gross realized losses on sales | (2,419) | (3,034) | — | |||||||||||||||||
| Total proceeds from sales of debt securities | $ | 84,779 | $ | 69,620 | $ | 3,059 | ||||||||||||||
| (Dollars in thousands) | 2017 | 2016 | 2015 | |||||||||
Amortized cost of investments sold (1) | $ | 145,472 | $ | 4,299 | $ | 23,287 | ||||||
| Gross realized gains on sales | 3,411 | 803 | 1,990 | |||||||||
| Gross realized losses on sales | (2,695 | ) | (1 | ) | (162 | ) | ||||||
| Total proceeds from sales of investments | $ | 146,188 | $ | 5,101 | $ | 25,115 | ||||||
(1) Amortized cost of investments sold is determined on a specific identification basis.basis and includes pending trades based on trade date, if applicable.
Tax-exempt interest earned on the municipal securities portfolio was $4.0amounted to $2.6 million for the year ended December 31, 2017, $3.62023, compared to $3.4 million for each of the yearyears ended December 31, 2016,2022 and $2.9 million for the year ended December 31, 2015.2021.
The average balance of tax-exempt investments was $111.6$64.1 million and $100.0$86.0 million for the years ended December 31, 20172023 and December 31, 2016,2022, respectively.
Equity Securities
At December 31, 2023, the Company held equity securities with a fair value of $7.1 million, which consisted of $4.4 million in management directed investments and $2.7 million in mutual funds held in conjunction with the Company's supplemental executive retirement and deferred compensation plan.
At December 31, 2022, the Company held equity securities with a fair value of $4.3 million, which consisted of $2.9 million in management directed investments and $1.4 million in mutual funds held in conjunction with the Company's supplemental executive retirement and deferred compensation plan.
Gains and losses on equity securities for the years ended December 31, 2023 and 2022 are summarized as follows:
| (Dollars in thousands) | 2023 | 2022 | ||||||||||||
| Net gains (losses) recognized during the period on equity securities | $ | 666 | $ | (514) | ||||||||||
| Less: Net losses realized on equity securities sold during the period | (5) | (17) | ||||||||||||
| Unrealized gains (losses) recognized during the reporting period on equity securities still held at the end of the period | $ | 671 | $ | (497) | ||||||||||
84
Contents
(3) Loans
The Company specializes in lending to business entities, non-profit organizations, professional practices and individuals. The Company’s primary lending focus is on the development of high quality commercial relationships achieved through active business development efforts, long-term relationships with established commercial developers, strong community involvement and focused marketing strategies. Loans made to businesses include commercial mortgage loans, construction and land development loans, secured and unsecured commercial loans and lines of credit, and letters of credit. The Company also originates equipment lease financing for businesses. Loans made to individuals include conventional residential mortgage loans, home equity loans and lines, residential construction loans on owner-occupied primary and secondary residences, and secured and unsecured personal loans and lines of credit. The Company manages its loan portfolio to avoid concentration by industry, relationship size and source of repayment to lessen its credit risk exposure.Loan Portfolio Classifications
See Note 4, "Allowance for Loan Losses," for information on the Company's credit risk management, non-accrual, impaired and troubled debt restructured loans and the allowance for loan losses.
Loan CategoriesAccrued interest receivable on loans amounted to $16.1 million and $13.1 million at December 31, 2023 and December 31, 2022, respectively, and was included in the "Accrued interest receivable" line item on the Company’s Consolidated Balance Sheets.
Commercial real estate loans include loans secured by both owner-use and non-owner occupied real estate. These loans are typically secured by a variety of commercial and industrial property types, including one-to-four family and multi-family apartment buildings, office, industrial or mixed-use facilities, strip shopping centers or other commercial properties, and are generally guaranteed by the principals of the borrower. Commercial real estate loans generally have repayment periods of approximately fifteen to twenty-five years. Variable interest rate loans have a variety of adjustment terms and underlying interest rate indices, and are generally fixed for an initial period before periodic rate adjustments begin.
Commercial and industrial loans include seasonal revolving lines of credit, working capital loans, equipment financing (including equipment leases), and term loans. Also included in commercial and industrial loans are loans partially guaranteed by the U. S. Small Business Administration ("SBA"), and loans under various programs and agencies. Commercial and industrial credits may be unsecured loans and lines to financially strong borrowers, loans secured in whole or in part by real estate unrelated to the principal purpose of the loan or secured by inventories,
ENTERPRISE BANCORP, INCNotes to the Consolidated Financial Statements
equipment, or receivables, and are generally guaranteed by the principals of the borrower. Variable rate loans and lines in this portfolio have interest rates that are periodically adjusted, with loans generally having fixed initial periods. Commercial and industrial loans have average repayment periods of one to seven years.
Commercial construction loans include the development of residential housing and condominium projects, the development of commercial and industrial use property, and loans for the purchase and improvement of raw land. These loans are secured in whole or in part by the underlying real estate collateral and are generally guaranteed by the principals of the borrowers. Construction lenders work to cultivate long-term relationships with established developers. The Company limits the amount of financing provided to any single developer for the construction of properties built on a speculative basis. Funds for construction projects are disbursed as pre-specified stages of construction are completed. Regular site inspections are performed, prior to advancing additional funds, at each construction phase, either by experienced construction lenders on staff or by independent outside inspection companies. Commercial construction loans generally are variable rate loans and lines with interest rates that are periodically adjusted and generally have terms of one to three years.
From time to time, the Company participates with other banks in the financing of certain commercial projects. Participating loans with other institutions provide banks the opportunity to retain customer relationships and reduce credit risk exposure among each participating bank, while providing customers with larger credit vehicles than the individual bank might be willing or able to offer independently. In some cases, the Company may act as the lead lender, originating and servicing the loans, but participating out a portion of the funding to other banks. In other cases, the Company may participate in loans originated by other institutions. In each case, the participating bank funds a percentage of the loan commitment and takes on the related pro-rata risk. In each case in which the Company participates in a loan, the rights and obligations of each participating bank are divided proportionately among the participating banks in an amount equal to their share of ownership and with equal priority among all banks. When the participation qualifies as a sale under GAAP, the balances participated out to other institutions are not carried as assets on the Company's consolidated financial statements. The Company performs an independent credit analysis of each commitment and a review of the participating institution prior to participation in the loan, and an annual review thereafter of each participating institution. Loans originated by other banks in which the Company is a participating institution are carried in the loan portfolio at the Company's pro-rata share of ownership. Loans originated by other banks in which the Company is a participating institutionownership and amounted to $91.6$126.6 million at December 31, 20172023 and $85.2$94.8 million at December 31, 2016.2022. See also "Loans serviced for others" below for information related to commercial loans participated out to various other institutions.
In addition, the Company participates in various community development loan funds in which local banks contribute to a loan pool which is independently managed. These loan pools make small dollar loans available to local businesses and start-ups that might otherwise not qualify for traditional small business loans directly from banks, with the potential risk spread among the participating banks. The goal of these partnerships with community development loan funds is to stimulate local economic development, create jobs, and help small businesses and entrepreneurs to become more viable, bankable and an integrated part of the local community.
Letters of credit are conditional commitments issued by the Company to guarantee the financial obligation or performance of a customer to a third party. The credit risk involved in issuing letters of credit is essentially the same as that involved in extending loan facilities to customers. If the letter of credit is drawn upon, a loan is created for the customer, generally a commercial loan, with the same criteria associated with similar commercial loans.
Residential mortgage loans
Enterprise originates conventional mortgage loans on one-to-four family residential properties. These properties may serve as the borrower's primary residence, or as vacation homes or investment properties. Loan-to-value limits vary, generally from 75% for multi-family, owner-occupied properties, up to 97% for single family, owner-occupied properties, with mortgage insurance coverage required for loan-to-value ratios greater than 80% based on program parameters. In addition, financing is provided for the construction of owner-occupied primary and secondary residences. Residential mortgage loans may have terms of up to 30 years at either fixed or adjustable rates of interest. Fixed and adjustable rate residential mortgage loans are generally originated using secondary market underwriting and documentation standards.
ENTERPRISE BANCORP, INCNotes to the Consolidated Financial Statements
Depending on the current interest rate environment, management projections of future interest rates and the overall asset-liability management program of the Company, management may elect to sell those fixed and adjustable rate residential mortgage loans which are eligible for sale in the secondary market, or hold some or all of this residential loan production for the Company's portfolio. Mortgage loans are generally not pooled for sale, but instead sold on an individual basis. The Company may retain or sell the servicing when selling the loans. Loans sold are subject to standard secondary market underwriting and eligibility representations and warranties over the life of the loan and are subject to an early payment default period covering the first four payments for certain loan sales. Loans classified as held for sale are carried as a separate line item on the consolidated balance sheet.
Home equity loans and lines of credit
Home equity term loans have in the past been originated for one-to-four family residential properties with maximum original loan-to-value ratios generally up to 80% of the automated valuation or appraised value of the property securing the loan. Home equity loan payments consist of monthly principal and interest based on amortization ranging from three to fifteen years. The rates may be variable or fixed.
The Company originates home equity revolving lines of credit for one-to-four family residential properties with maximum original loan-to-value ratios generally up to 80% of the automated valuation or appraised value of the property securing the loan. Home equity lines generally have interest rates that adjust monthly based on changes in the Wall Street Journal Prime Rate, although minimum rates may be applicable. Some home equity line rates may be fixed for a period of time and then adjusted monthly thereafter. The payment schedule for home equity lines requires interest only payments for the first ten years of the lines. Generally at the end of ten years, the line may be frozen to future advances, and principal plus interest payments are collected over a fifteen-year amortization schedule or, for eligible borrowers meeting certain requirements, the line availability may be extended for an additional interest only period.Consumer loans
Consumer loans consist primarily of secured or unsecured personal loans, loans under energy efficiency financing programs in conjunction with Massachusetts public utilities, and overdraft protection lines on checking accounts extended to individual customers. The aggregate amounts of overdrawn deposit accounts are reclassified as loan balances.
Certain of the Company's directors, officers, principal stockholders and their associates are credit customers of the Company in the ordinary course of business. In addition, certain directors are also directors, trustees, officers or stockholders of corporations and non-profit entities or members of partnerships that are customers of the Bank and that enter into loan and other transactions with the Bank in the ordinary course of business. All loans and commitments included in such transactions are on such terms, including interest rates, repayment terms and collateral, as those prevailing at the time for comparable transactions with persons who are not affiliated with the Bank and do not involve more than a normal risk of collectability or present other features unfavorable to the Bank.
ENTERPRISE BANCORP, INCNotes to the Consolidated Financial Statements
For additional information on unadvanced loansthe Company's loan accounting policies, Credit Risk monitoring, and lines, commitments to originate loans, lettersACL methodology.
Inherent in the lending process is the risk of loss due to customer non-payment, or "credit risk." The Company's commercial lending focus may entail significant additional credit risks compared to long-term financing on existing, owner-occupied residential real estate. The Company seeks to lessen its credit risk exposure by managing its loan portfolio to avoid concentration by industry, relationship size and source of repayment, and through sound underwriting practices and the credit risk management function; however, management recognizes that loan losses will occur and that the amount of these losses will fluctuate depending on the risk characteristics of the loan portfolio and economic conditions.
In making its assessment on the adequacy of the allowance, management considers several quantitative and qualitative factors that could have an effect on the credit quality of the portfolio including, individual review of larger and higher risk problem assets, the level of delinquent loans and non-performing loans, impaired loans, the level of net charge-offs, and the growth and composition of the loan portfolio, as well as trends in the general levels of these indicators. In addition management monitors expansion in geographic market area, the experience level of lenders and any changes in underwriting criteria, the strength of local and national economy, including general conditions in the multi-family, commercial real estate and development and construction markets in the local region.
Allowance for Probable Loan Losses Methodology
On a quarterlyThe following tables present the amortized cost basis management prepares an estimate of the allowance necessary to cover estimated probable credit losses. The Company uses a systematic methodology to measure the amount of estimatedCompany's loan loss exposure inherent in the portfolio for purposes of establishing a sufficient allowance for loan losses. The methodology makes use of specific reserves for loans individually evaluated and deemed impaired, and general reserves for larger groups of homogeneous loans, which are collectively evaluated relying on a combination of qualitative and quantitative factors that may affect credit quality of the pool.
Specific Reserves for loans individually evaluated for impairment
When a loan is deemed to be impaired, management estimates the credit lossrisk ratings within portfolio classifications, by comparing the loan's carrying value against either 1) the present value of the expected future cash flows discounted at the loan's effective interest rate; 2) the loan's observable market price;origination date, or 3) the expected realizable fair value of the collateral, in the case of collateral dependent loans. A specific allowance is assigned to the impaired loan for the amount of estimated credit loss. Impaired loans are charged-off, in whole or in part, when management believes that the recorded investment in the loan is uncollectible.
General Reserves for loans collectively evaluated for impairment
In assessing the general reserves management has segmented the portfolio for groups of loans with similar risk characteristics, by I. Non-classified loans, and II. Regulatory problem-asset segments. These groups are further subdivided by loan category or internal risk rating, respectively. The general loss allocation factors take into account the quantitative historic loss experience, qualitative or environmental factors such as those identified above, as well as regulatory guidance and industry data.
I.Non-classified loans by credit type:
Management has established the modified historic loss factor for non-classified loan segments by first calculating net charge-offs over a period of time, divided by the average loan balance over that same period. The time period utilized equates to the estimated loss emergence period for each loan segment. This average period may be changed from time to time to be reflective of the most appropriate corresponding conditions (market, economic, etc.). These historic loss factors are then adjusted up or down based on management’s assessment of current qualitative factors that are likely to cause estimated credit lossesrevolving status as of the evaluation date to differ from the segment’s historical loss experience. These key qualitative factors include the following broad categories:dates indicated:
Several key areas of expansion and growth, including geographic market, changes in lending staff, new or expanded product lines, changes in composition and portfolio concentrations;Changes in the credit trend and current volume and severity of past due loans, non-accrual loans and the severity of adversely classified and impaired loans compared to historical levels; andThe current economic environment and conditions (local, state and national) and their general implications to each loan category.
Management weighs the current effect of each of these areas on each particular non-classified loan segment in determining the allowance allocation factors. Management must exercise significant judgment when evaluating the effect of these qualitative factors on the amount of the allowance for loan losses on the non-classified segments because data may not be reasonably available or directly applicable to determine the precise impact of a factor on the collectability of the loan portfolio as of the evaluation date. The methodology contemplates a range of acceptable levels for these factors due to the subjective nature of the factors and the qualitative considerations related to the inherent credit risk in the portfolio.
II.Regulatory problem-assets segments by credit rating:
For determining the reserve percentages for problem-loans, management has segmented the portfolio following the regulatory problem-asset segments by risk rating: Criticized; Substandard; Doubtful; or Loss, after excluding
loans that are individually evaluated for impairment.
Management recognizes that additional issues may also impact the estimate of credit losses to some degree. From time to time management will re-evaluate the qualitative factors, regulatory guidance, and industry data in use in order to consider the impact of other issues which, based on changing circumstances, may become more significant in the future.
The balances of loans as of December 31, 2017 by segment and evaluation method are summarized as follows:
The balances of loans as of December 31, 2016 by segment and evaluation method are summarized as follows:
Credit Risk Management
As noted above, the credit risk management function focuses on a wide variety of factors and early detection of credit issues is critical to minimize credit losses. Accordingly, management regularly monitors these factors, among others, through ongoing credit reviews by the Credit Department, an external loan review service, reviews by members of senior management as well as reviews by the Loan Committee and the Board. This review includes the assessment of internal credit quality indicators such as, among others, the risk classification of adversely classified loans past dueamounted to $56.7 million, or 1.59% of total loans, at December 31, 2023, and non-accrual$47.0 million, or 1.48% of total loans, impaired and restructured loans, and the levelat December 31, 2022.
Contents
Credit Quality Indicators
Adversely classified loans
The Company's loan risk rating system classifies loans depending on risk of loss characteristics. The classifications range from "substantially risk free" for the highest quality loans and loans that are secured by cash collateral, through a satisfactory range of "minimal," "moderate," "better than average," and "average" risk, to the regulatory problem-asset classifications of "criticized," for loans that may need additional monitoring, and the more severe adverse classifications of "substandard," "doubtful," and "loss" based on criteria established under banking regulations. Loans which are evaluated to be of weaker credit quality are placed on the "watch credit list" and reviewed on a more frequent basis by management.Loans classified as substandard include those loans characterized by the distinct possibility that the Company will sustain some loss if the deficiencies are not corrected. These loans are inadequately protected by the sound net worth and paying capacity of the borrower; repayment has become increasingly reliant on collateral liquidation or reliance on guaranties; credit weaknesses are well-defined; borrower cash flow is insufficient to meet the required debt service specified in the loan terms and to meet other obligations, such as trade debt and tax payments.
Loans classified as doubtful have all the weaknesses inherent in a substandard rated loan with the added characteristic that the weaknesses make collection or full payment from liquidation, on the basis of currently existing facts, conditions, and values, highly questionable and improbable. The probability of loss is extremely high, but because of certain important and reasonably specific pending factors which may work to the advantage and strengthening of the loan, its classification as an estimated loss is deferred until more exact status may be determined.
Loans classified as loss are generally considered uncollectible at present, although long term recovery of part or all of loan proceeds may be possible. These "loss" loans would require a specific loss reserve or charge-off.
Adversely classified loans may be accruing or in non-accrual status and may be additionally designated as impaired or restructured, or some combination thereof.
The following tables present the Company's credit risk profile for each class of loan in its portfolio by internally assigned adverse risk rating category as of the periods indicated.
ENTERPRISE BANCORP, INCNotes to the Consolidated Financial Statements
Total adversely classified loans amounted to 1.16% of total loans at December 31, 2017, as compared to 1.70% at December 31, 2016.
Loans on which the accrual of interest has been discontinued are designated as non-accrual and the classified portions are credit downgraded to one of the adversely classified categories noted above. Accrual of interest on loans is generally discontinued when a loan becomes contractually past due, with respect to interest or principal, by 90 days, or when reasonable doubt exists as to the full and timely collection of interest or principal. Interest payments received on loans in a non-accrual status are generally applied to principal on the books of the Company. When a loan is placed on non-accrual status, all interest previously accrued but not collected is reversed against current period interest income. Interest accruals are resumed on such loans only when payments are brought current and have remained current for a period of 180 days and when, in the judgment of management, the collectability of both principal and interest is reasonably assured. Additionally, deposit accounts overdrawn for 90 or more days are included in the consumer non-accrual numbers below.
ENTERPRISE BANCORP, INCNotes to the Consolidated Financial Statements
Non-accrualamortized cost of non-accrual loans that were not adversely classified amounted to $21 thousand at December 31, 2017 and $220 thousand at December 31, 2016. These balances primarily represented the guaranteed portions of non-performing SBA loans. The majorityby portfolio classification as of the non-accrual loan balances were also carried as impaired loans duringdates indicated:
The Company's obligation to fulfill the additional funding commitments on impaired loans is generally contingent on the borrower's compliance with the terms of the credit agreement. If the borrower is not in compliance, additional funding commitments may or may not be made at the Company's discretion. At December 31, 2017,2023 and December 31, 2022, additional funding commitments for non-accrual loans on non-accrual status totaled $25 thousand.were not material.
Collateral dependent loansImpairedloans
The total recorded investment in collateral dependent loans amounted to $13.7 million at December 31, 2023 compared to $25.2 million at December 31, 2022. Total accruing collateral dependent loans amounted to $2.4 million, while non-accrual collateral dependent loans amounted to $11.3 million as of December 31, 2023. As of December 31, 2022, total accruing collateral dependent loans amounted to $19.5 million while non-accrual collateral dependent loans amounted to $5.7 million.Impaired
ENTERPRISE BANCORP, INCNotes to the Consolidated Financial Statements
over time and their improving financial condition. Consistent with the criteria for returning non-accrual loans to accrual status, the borrower must demonstrate the ability to continue to service the loan in accordance with the original or modified terms and, in the judgment of management, the collectability of the remaining balances, both principal and interest, are reasonably assured. In the case of TDR loans having had a modified interest rate, that rate must be at, or greater than, a market rate for a similar credit at the time of modification for an upgrade to be considered.
Impaired loans are individually evaluated for credit loss and a specific allowance reserve is assigned for the amount of the estimated probable credit loss. Refer to heading “Allowance for probable loan losses methodology” contained within this Note 4 for further discussion of management’s methodology used to estimate specific reserves for impaired loans.
The carrying value of impaired loans amounted to $26.3 million and $31.8 million at December 31, 2017 and December 31, 2016, respectively. Total accruing impaired loans amounted to $17.4 million and $22.4 million at December 31, 2017 and December 31, 2016, respectively, while non-accrual impaired loans amounted to $8.9 million and $9.4 million as of December 31, 2017 and December 31, 2016, respectively.
ENTERPRISE BANCORP, INCNotes to the Consolidated Financial Statements
The following table presents the average recorded investment in impaired loans and the related interest recognized during the year ends indicated:
All payments received on impaired loans in non-accrual status are applied to principal. Interest income that was not recognized on loans that were deemed impaired as of December 31, 2017, 2016 and 2015, amounted to $890 thousand, $858 thousand, and $688 thousand, respectively. At December 31, 2017, additional funding commitments for impaired loans totaled $416 thousand. The Company's obligation to fulfill the additional funding commitments on impairedindividually evaluated loans is generally contingent on the borrower's compliance with the terms of the credit agreement. If the borrower is not in compliance, additional funding commitments may or may not be made at the Company's discretion. At December 31, 2023 and December 31, 2022, additional funding commitments for individually evaluated collateral dependent loans were not material.
Troubled debt restructuringsLoan modifications to borrowers experiencing financial difficulty
Loans are designated as a TDR when, as partThe following table presents the amortized cost basis of an agreementloan modifications made to modifyborrowers experiencing financial difficulty by type of concession granted during the original contractual termsperiod indicated:
The following table presents the number and balance of loans modified as TDRs, by portfolio classification, during the periods indicated:
Loans modified as TDRsThe following table presents changes in the provision for credit losses on loans and unfunded commitments during the yearyears ended December 31 2017as indicated:
There were no subsequent charge-offs associated with the new TDRs noted in the table above during both 2017 and 2016.
Interest payments received on non-accruing 2017 and 2016 TDR loans which were applied to principal and not recognized as interest income were not material.
Payment defaults duringChanges in the allowance for credit losses for the years ended December 31, 20172023, 2022 and 2021 are summarized as follows:
Allowance for Loan Loss Activity
The allowance for loan losses is established through a provision for loan losses, a direct charge to earnings. Loan losses are charged against the allowance when management believes that the collectability of the loan principal is unlikely. Recoveries on loans previously charged-off are credited to the allowance.
The allowance for loan losses amounted to $32.9 million at December 31, 2017, compared to $31.3 million at December 31, 2016. For the years ended December 31, 2017 and 2016, the provision for loan losses amounted to $1.4 million and $3.0 million, respectively. The decrease in the provision for 2017 was due primarily to generally improved credit quality metrics and underlying collateral values, partially offset by increased loan growth compared to the prior year.The allowance for loan losses to total loans ratio was 1.45% at December 31, 2017, compared to 1.55% at December 31, 2016. Based on management’s judgment as to the existing credit risks inherent in the loan portfolio, as discussed above under the heading "Credit Quality Indicators," management believes that the Company’s allowance for loan losses is adequate to absorb probable losses from specifically known and other probable credit risks associated with the portfolio as of December 31, 2017.
(5) Premises and EquipmentChanges in the allowance for loan losses for the years ended December 31, are summarized as follows:
Changes in the allowance for loan losses by portfolio segment for the year ended December 31, 2017, are presented below:
Changes in the allowance for loan losses by portfolio segment for the year ended December 31, 2016, are presented below:
ENTERPRISE BANCORP, INCNotes to the Consolidated Financial Statements
Total rent expense$6.2 million for the yearsyear ended December 31, 2017, 20162021.
Atyears ended December 31, 2017, minimum lease payments for these operating leases were as follows:
The Company currently collects rent through leases for a small portion of the overall square-footage within its Lowell, MA campus headquarters2023, and at one of its branch locations. Rental income was $133 thousand2022 amounted to $1.6 million, respectively, and $1.5 million for the year ended December 31, 2017, $159 thousand2021. Variable lease costs and short-term lease expenses included in lease expense during this period were immaterial.
(7)Deposits
(1) Brokered CDs $250,000All of the Company's deposits outstanding, at both December 31, 2023 and under.
Total2022, were customer deposits, (deposits, excludingand the Company had no brokered deposits)deposits at either December 31, 2023 or 2022. Customer deposits include reciprocal balances from checking, money market deposits and CDs received from participating banks in nationwide deposit networks as a result ofdue to our customers electing to participate in Company offered programs which allow for fullthird-party enhanced FDIC deposit insurance. Essentially,Under this enhanced deposit insurance program, the equivalent of the customers' original deposited funds comes back to the Company as customer depositsand are carried within the appropriate category under total deposits on the consolidated balance sheet.deposits. The Company's balances in these reciprocal products were $249.6$835.0 million and $281.6$589.7 million at December 31, 20172023 and December 31, 2016,2022, respectively.
See Note 15, "Fair Value Measurements," below for further information regarding the Company's fair value measurements for deposits.
ENTERPRISE BANCORP, INCNotes to the Consolidated Financial Statements
FHLB borrowingsThe Company's borrowed funds at December 31, 2017 consisted2023, 2022 and 2021 were comprised of $39.0 millionovernight or short-term advances from the FRB through the BTFP, term advances related to specific lending projects under the FHLB's community development and affordable housing programs as well as borrowed funds from the NH BFA borrowing under a New Hampshire community development program. NH BFA advances are categorized as "Other borrowings" in overnight borrowings,the tables below.
The Company’s primary borrowing source is the FHLB, but the Company may choose to borrow from other established business partners. "Other borrowings" represents overnight advances from the FRB or federal funds purchased from correspondent banks.
See Note 2, "Investments," and Note 3, "Loans" above to these consolidated financial statements for further information regarding securities and loans pledged for borrowed funds.
ENTERPRISE BANCORP, INCNotes to the Consolidated Financial Statements
interest rate on the Notes will adjust monthly at an interest rate of 3.90% plus 30-day LIBOR.after which floating quarterly rates apply. Original debt issuance costs were $190 thousand$1.2 million and have been netted against the subordinated debt on the consolidated balance sheet in accordance with accounting guidance. These costs are being amortized to interest expense over the life of the Notes.subordinated notes.
In 2015,
See Note 15, "Fair Value Measurements," below for further information regarding the Company's fair value measurements for borrowed funds and subordinated debt.
Interest-rate lock commitments(1) Accrued interest balances related to the origination of mortgage loans that will be sold are considered derivative instruments. The commitments to sell loans are also considered derivative instruments. The Company generally does not pool mortgage loans for sale, but instead sells the loans on an individual basis. To reduce the netCompany’s interest rate exposure arising from its loan sale activity, the Company enters into the commitment to sell these loans at essentially the same time that the interest-rate lock commitment is quoted on the origination of the loan. The Company estimatesswaps are not included in the fair values above and are immaterial.
The Company may use interest-rate contract swaps as part of its interest-rate risk management strategy. Interest-rate swap agreements are entered into as hedges against future interest rate fluctuations on specifically identified assets or liabilities. The Company did not have derivativeCompany's fair value hedges or derivative cash floware used to manage its exposure to changes in the fair value of hedged items caused by changes in interest rates.
The transaction structure effectively minimizes the Bank's net risk exposure resulting from such transactions. Customer-related credit risk is minimized by the cross collateralizationEach Back-to-Back swap consists of the loantwo interest-rate swaps (a customer swap and theoffsetting counterparty swap) and amounted to a total number of four interest-rate swap agreement.
As detailed in Note 1 "Summary of Significant Accounting Policies," under Item (o) "Derivatives," Back-to-Back Swaps are not speculative but rather, result from a service the Company provides to certain commercial customers. Back-to-Back swaps do not meet hedge accounting requirementsoutstanding at December 31, 2023 and therefore changes in the fair value of both the customer swaps and the counterparty swaps, which have an offsetting relationship, are recognized directly in earnings.December 31, 2022. As a result of this offsetting relationship, there were no net gains or losses recognized in income on Back-to-Back Swapsswaps during the years ended December 31, 2017,2023, 2022, or 2021.
Each Back-to-Back swap transaction consists of two interest-rate2023, all the back-to-back swaps (a customer swapwith the counterparty were in asset positions and offsetting counterparty swap) and amounted to a total number of six and four interest-rate swaps outstanding at December 31, 2017 and December 31, 2016, respectively,2022, all the back-to-back swaps with an aggregate notional amountthe counterparty were in liability positions, therefore there was no netting reflected in the Company's Consolidated Balance Sheets as of $29.4 million and $26.7 million on thosethe respective dates.
Asset derivatives are included inRisk Participation Agreements
ENTERPRISE BANCORP, INCNotesCompany has assumed credit risk for customers' performance under interest-rate swap agreements related to the Consolidated Financial Statementscustomers' commercial loan and receives fee income commensurate with the risk assumed. The RPAs and the customers' loan are secured by the same collateral.
Credit RiskThe table below presents the fair value and classification of the Company’s derivative financial instruments for the periods presented:
Interest-rateThe Company has minimum collateral posting thresholds with certain of its derivative counterparties and as of December 31, 2023, the Company had no credit risk exposure relating to interest-rate swaps with counterparties compared to $782 thousand in credit risk exposure at December 31, 2022. At December 31, 2023, cash collateral posted by the counterparty are subjectCompany amounted to master netting agreements. The table below presents$570 thousand while counterparties posted cash collateral of $590 thousand. At December 31, 2022, the Company's asset derivative positions and the potential effectCompany posted no collateral in connection with these agreements while counterparties posted cash collateral of those netting arrangements on its financial position, as of the periods presented. Interest-rate swaps with customers are not subject to master netting agreements and therefore are not included in the table below.
$27 thousand.
Credit-risk-related Contingent Features
The Company also participates in loans originated by third-party banks, whereAs of December 31, 2023, the originating bank utilizesfair value of derivatives related to these agreements was at a back-to-back interest-rate swap structure; however, the Company is not a partynet liability position of $130 thousand, which excludes any adjustment for nonperformance risk.
See Note 9, "Commitments,
ENTERPRISE BANCORP, INCNotes to the Consolidated Financial Statements
(11)Comprehensive Income (Loss)
The Company issues stock options and restricted stock awards See Note 14, "Stock-Based Compensation," to officers and other employees and restricted stock awards and stock compensation in lieu of cash fees to non-employee directors. The restricted stock awards allow for the non-forfeitable receipt of dividends, and the voting of all shares, whether or not vested, throughout the vesting periods at the same proportional level as common shares outstanding. The unvested restricted stock awards are the Company's only participating securities and are included in shares outstanding. Unvested participating restricted awards amounted to 117,219 shares and 141,580 shares asconsolidated financial statements of December 31, 2017 and December 31, 2016, respectively. See Item (r) "Earnings per Share,"this Form 10-K, contained in Note 1, "Summary of Significant Accounting Policies,"
ENTERPRISE BANCORP, INCNotes to the Consolidated Financial Statements
for additional information regarding unvested participating restricted awards and the Company's earnings per share calculation.
Upon vesting, restricted stock awards may be net share-settled to cover payment for employee tax obligations, resulting in shares of common stock being reacquired by the Company. Chapter 156D of the Massachusetts General Laws, a statue known as the Massachusetts Business Corporation Act, which applies to Massachusetts corporations such as the Company, eliminates the concept of "treasury stock" and provides that shares a Massachusetts company reacquires will be treated as authorized but unissued shares.
See Note 12, "Stock-Based Compensation," below, for additional information regarding the Company's stock incentive plans.
The Company's stock incentive plans also allow for newly issued shares of common stock to be issued without restrictions to officers and other employees, non-employee directors and consultants. From time to time, the Company issues shares to community members for consulting on regional advisory councils and grants shares of fully vested stock as employee anniversary awards. These shares vest immediately and the cost, which is deemed to be immaterial, is expensed in the period in which the services are rendered and is based on the market price on the date of grant.
In addition to shares issued to employees, non-employee directors, and community members for consulting on regional advisory councils, and shares issued through equity offerings (see "Capital Raised and Capital Adequacy Requirements" below), the Company maintains a dividend reinvestment and direct stock purchase plan ("DRSPP") for stockholders and new investors to reinvest or purchase additional shares of common stock directly from the Company. See "Dividends" below for further information about the DRSPP.
In the second quarter of 2016, the Company completed a combined shareholder subscription rights offering and supplemental community offering (the "Offering"), at an offering price of $21.50 per share, under its $40 million shelf registration statement (Reg No. 333-190017). The Company issued 930,232 shares of common stock and received gross proceeds of $20.0 million ($19.7 million, net of offering costs). The Company contributed the net proceeds to the Bank to support future asset growth and for general corporate purposes. See Note 14, "Earnings Per Share," for further information regarding the impact of the offering on EPS.
Since January 1, 2015, the Company has been subject to increasing capital ratios, with a phase-in period that extends to January 2019, as a result of regulation adopted by the federal bank regulatory agencies known as the "Basel III Rules."
ENTERPRISE BANCORP, INCNotes to the Consolidated Financial Statements
(2) For the Bank to qualify as "well-capitalized," it must maintain at least the minimum ratios listed under the regulatory prompt corrective action framework. This framework does not apply to the Company.
Under the Basel III Rules, capital ratio requirements, for all banking organizations increased andwhich include a "capital conservation buffer,"buffer" of 2.50% above the regulatory minimum risk-based capital adequacy requirements shown above. The capital conservation buffer requirement began to be phased in beginning in January 2016 at 0.625% of risk-weighted assets and will increase by that amount each year until fully implemented in January 2019. If a banking organization
ENTERPRISE BANCORP, INCNotes to the Consolidated Financial Statements
For further information on the Basel III requirements see the “Supervision and Regulation” contained in Item 1, “Business” in this Form 10-K.
Dividends
NeitherSee also "Supervision and Regulation," contained in Item 1, "Business," of this Form 10-K for further information on the Company nor the Bank may declare or pay dividends on its stock if the effect thereof would cause stockholders’ equity to be reduced below applicable regulatoryCompany's Basel III and capital requirements or if such declaration and payment would otherwise violate regulatory requirements.
As the principal asset
The statutory term "net profits" essentially equates with the accounting term "net income" and is defined under the Massachusetts banking statutes to mean the remainder of all earnings from current operations plus actual recoveries on loans and investments and other assets after deducting from such total all current operating expenses, actual losses, accrued dividends on any preferred stock and all federal and state taxes.
The Company maintains a DRSPP which enables stockholders, at their discretion, to elect to reinvest cash dividends paid on their shares of the Company’s common stock by purchasing additional shares of common stock from the Company at a purchase price equal to fair market value. Under the DRSPP, stockholders and new investors also have the opportunity to purchase shares of the Company's common stock without brokerage fees, subject to monthly minimums and maximums.
Contents
Dividends
In 2016,2022, the Company declared and paid $5.7$9.9 million in cash dividends. Stockholdersdividends and shareholders utilized the dividend reinvestment portion of the DRSPP to purchase 53,516 shares of the Company’s common stock totaling $1.4 million. The direct purchase component of the DRSPP was used by stockholders to purchase 1,56240,640 shares of the Company's common stock totaling $38 thousand during the year ended December 31, 2016.
401(k) Defined Contribution Plan(13)Employee Benefit Plans
(1)Management utilizes the Moody's 20-year AA corporate bond rates to establish the reasonableness of the discount rate used. The Company reviews and periodically updates the discount rate to reflect changes in bond market rates. The impact of the discount rate change is reflected as the actuarial gain or loss.
BenefitsSERP benefits expected to be paid in each of the next five years and in the aggregate five years thereafter:
(1) Management utilizes the Moody's 20-year AA corporate bond rates to establish the reasonableness of the discount rate used. The Company reviews and periodically updates the discount rate to reflect changes in bond market rates. The impact of the discount rate change is reflected as the actuarial gain or loss.
See Note 12, "Stock-Based Compensation" below, for additional information regarding employee benefits offered in the form of stock options and stock awards.
(14)Stock-Based Compensation
In 2017, with the adoption of ASU 2016-09, related to employee share-based payment accounting, a tax benefit of approximately $922 thousand,Tax benefits associated with employee exercises and vesting of stock compensation was recorded as a reduction of the Company's income tax expense. Prior to 2017, the related tax benefits were recorded to additional paid-in-capital, and had no impact on the Company's income statements. Those tax benefits amounted to $789
ENTERPRISE BANCORP, INCNotes to the Consolidated Financial Statements
OptionsStock options granted generally vest 50% in year two and 50% in year four, on or about the anniversary date of the awards. Vested options are only exercisable while the employee remains employed with the Bank and for a limited time thereafter. For all awards, if a grantee’s employment or other service relationship, such as service as a director, is terminated for any reason, then any stock options granted that have not vested as of the time of such termination generally must be forfeited, unless the Compensation Committee or the Board of Directors, as the case may be, waives such forfeiture requirement.
ENTERPRISE BANCORP, INCNotes to the Consolidated Financial Statements
The aggregate intrinsic value in the table above represents the difference between the closing price of the Company’s common stock on December 31, 2017 and the exercise price, multiplied by the number of options. If the closing price was less than the exercise price of the option, no intrinsic value was assigned to the grant. At December 31, 2017, all of the vested and exercisable options were in-the money. The intrinsic value of stock options vested and exercisable represents the total pretax intrinsic value that would have been received by the stock option holders had all in-the-money vested stock option holders exercised their options on December 31, 2017. The intrinsic value will change based on the fair market value2023. At December 31, 2023, 103,568 of the Company’s stock.vested and exercisable stock options were in-the money.
The Company adopted ASU 2016-09 in January 2017 and elected to record forfeitures as they occur. Prior to the adoption of this standard, accounting guidance required that the stock-based compensation expense recognized in earnings be based on the amount of awards ultimately expected to vest; therefore, a forfeiture assumption had to be estimated at the time of grant and revised, if necessary, in subsequent periods if actual forfeitures differed from those estimates. In 2016 and 2015, the Company estimated forfeitures based on historical experience for the portion of the grant which had vested and/or grants already vested based on similarities in the type of options and employee group.
ENTERPRISE BANCORP, INCNotes to the Consolidated Financial Statements
If a grantee’s employment or other service relationship, such as service as a director, is terminated for any reason, then any shares of restricted stock granted that have not vested as of the time of such termination generally must be forfeited, unless the Compensation Committee or the Board of Directors, as the case may be, waives such forfeiture requirement.
Total directors' fee expense included in other operating expenses, amounted to $747was $218 thousand$661 thousand and $424 thousand for the yearsyear ended December 31, 2017, 2016 and 2015, respectively. Included in the 2017 expense was stock compensation of $281 thousand,2023, which represented 7,3267,224 shares issued to Directors in January 2018, at a fair market value price of $38.39 per share, which reflected2024, compared to $254 thousand for the fair value of the common stock on January 3, 2017. Included in the 2016 expense was stock compensation of $286 thousand,year ended December 31, 2022, which represented 12,9927,265 shares issued to Directors in January 2017, at a fair market value price of $22.04 per share, which reflected2023, and $252 thousand for the fair value of the common stock on January 4, 2016. Included in the 2015 expense was stock compensation of $254 thousand,year ended December 31, 2021, which represented 10,6577,375 shares issued to Directors in January 2016, at a fair market value price of $23.86 per share, which reflected the fair value of the common stock on January 2, 2015.2022. The total tax benefit recognized related to the expensestock in lieu of Director stock compensationdirectors' fees for meeting attendance was $115$61 thousand, $117 for the year ended December 31, 2023, and $71 thousand, and $102 thousand, for both of the years ended 2017, 2016December 31, 2022 and 2015, respectively.2021.
For further information regarding the Company's stock awards, see Note 10, "Stockholders' Equity," above under the caption "Shares authorized and share issuance."(15) Income Taxes
ENTERPRISE BANCORP, INCNotes to the Consolidated Financial Statements
The new federal tax bill enacted in December 2017 caused the Bank to revalue its net deferred tax assets based upon the lower rate at which they will be recovered. The value of the Company’s 2017 net deferred tax assets declined, due to the new lower federal tax rate, with the offset charged to Federal tax expense. This non-cash expense for the Company was approximately $4.8 million. The new federal tax bill will reduce the Bank’s federal tax rate in future periods, beginning in 2018, to 21% from its previous level of approximately 35%. Also in 2017, with the adoption of ASU 2016-09, related to employee share-based payment accounting, a tax benefit of approximately $922 thousand, associated with employee exercises and vesting of stock compensation, was recorded as a reduction of the Company's tax liability and income tax expense. Prior to 2017, the related tax benefits were recorded to additional paid-in-capital, and had no impact on the Company's income statements.
ENTERPRISE BANCORP, INCNotes to the Consolidated Financial Statements
Deferred income taxes are recognized based on the expected future tax consequences of differences between the financial statement and tax basis of assets and liabilities, calculated using currently enacted tax rates. Management records net deferred tax assets to the extent we believe these assets will more likely than not be realized. In making this determination, we consider all available positive and negative evidence, including recent financial operations and projected future taxable income. Management believes based upon positive historical and expected future earnings that it is more likely than not the Company will generate sufficient taxable income to realize the deferred tax asset existing at December 31, 2017.2023. However, factors beyond management’smanagement's control, such as the general state of the economy, can affect future levels of taxable income and there can be no assurances that sufficient taxable income will be generated to fully realize the deferred tax assets in the future.
ENTERPRISE BANCORP, INCNotes to the Consolidated Financial Statements(16)Earnings per Share
Basic and diluted weighted average common shares outstanding for the year ended December 31, 2017 include the full impact of the 930,232 shares of common stock issued in the Offering, while the respective weighted averages for the 2016 period was only affected by the Offering from the issue date of June 23, 2016 through period end.
See Note 10, "Stockholders' Equity," underThe Company issues stock options and restricted stock awards to officers and other employees and restricted stock awards and stock compensation in lieu of cash fees to non-employee directors. The restricted stock awards allow for the caption "Shares authorizednon-forfeitable receipt of dividends, and share issuance," for information regardingthe voting of all shares, whether or not vested, throughout the vesting periods at the same proportional level as common shares outstanding. The unvested restricted stock awards are the Company's only participating securities and see Item (r) "Earnings per Share," containedare included in Note 1, "Summaryshares outstanding. Unvested participating restricted awards amounted to 130,039 shares and 106,658 shares as of Significant Accounting Policies," for additional information regarding the earnings per share calculation.December 31, 2023 and December 31, 2022, respectively.
ENTERPRISE BANCORP, INC
Notes to the Consolidated Financial Statements
Impairedindividually evaluated collateral dependent loan balances in the table above represent those collateral dependent impaired commercial loans where management has estimated the probable credit loss by comparing the loan’sloan's carrying value against the expected realizable fair value of the collateral (appraised value, or internal analysis, less estimated cost to sell, adjusted as necessary for changes in relevant valuation factors subsequent to the measurement date). Certain inputs used in these assessments, and possible subsequent adjustments, are not always observable, and therefore, collateral dependent impaired loans are categorized as Level 3 within the fair value hierarchy. A specific allowance is assigned to the collateral dependent impaired loan for the amount of management’smanagement's estimated probable credit loss. The specific allowances assigned to the collateral dependent impairedindividually evaluated loans amounted to $872$2.8 million at December 31, 2023 compared to $298 thousand at December 31, 2017 compared to $1.9 million at December 31, 2016.2022.The fair values for the interest-rate swap assets and liabilities represent a FASB Level 2 measurement and are based on settlement values adjusted for credit risks and observable market interest rate curves. The settlement values are based
ENTERPRISE BANCORP, INCNotes to the Consolidated Financial Statements
on discounted cash flow analysis, a widely accepted valuation technique, reflecting the contractual terms of the derivatives, including the period to maturity, and uses observable market-based inputs, including interest rate curves. Credit risk adjustments consider factors such as the likelihood of default by the Company and its counterparties, its net exposures and remaining contractual life. The change in value of interest-rate swap assets and liabilities attributable to credit risk was not significant during the reported periods. Refer also to Note 8, “Derivatives and Hedging Activities,” for additional information on the Company's interest-rate swaps.
Notes to the Consolidated Financial Statements
ENTERPRISE BANCORP, INCNotes to the Consolidated Financial Statements
When determining fair values noted in the tables above, in cases where quoted fair values are not available, fair values are based upon estimates using various valuation techniques. Those techniques are significantly affected by the assumptions used, including the discount rate and estimates
Loans held for sale: Loans held for sale are recordedat the lower of aggregate amortized cost or market value. The fair value is based on comparable market prices for loans with similar rates and terms.
Contents
(18)Supplemental Cash Flow InformationLoans:
Financial liabilities: The fair values of certificates of deposit and borrowings were estimated using discounted cash flow analysis using rates offered by the Bank or advance rates offered by the FHLB on December 31, 2017 and December 31, 2016 for similar instruments. The fair value of subordinated debt was estimated using discounted cash flow analysis using a market rate of interest at December 31, 2017 and December 31, 2016.Limitations: The estimates of fair value of financial instruments were based on information available at December 31, 2017 and December 31, 2016 and are not indicative of the fair market value of those instruments as of the date of this Annual Report on Form 10-K. These estimates do not reflect any premium or discount that could result from offering for sale at one time the Company’s entire holdings of a particular financial instrument. The fair value of the Company's time deposit liabilities do not take into consideration the value of the Company's long-term relationships with depositors, which may have significant value.Because no active market exists for a portion of the Company’s financial instruments, fair value estimates were based on judgments regarding future expected loss experience, current economic conditions, risk characteristics of various financial instruments, and other factors. These estimates are subjective in nature and involve uncertainties and matters of significant judgment and therefore cannot be determined with precision. Changes in assumptions could significantly affect the estimates.Fair value estimates were based on existing on and off-balance sheet financial instruments without an attempt to estimate the value of anticipated future business and the value of assets and liabilities that are not considered financial instruments, including premises and equipment and foreclosed real estate, if any.In addition, the tax ramifications related to the realization of the unrealized appreciation and depreciation can have a significant effect on fair value estimates and have not been considered in any of the estimates. Accordingly, the aggregate fair value amounts presented do not represent the underlying value of the Company.
Contents
Balance Sheets
ENTERPRISE BANCORP, INCNotes to the Consolidated Financial Statements
Parent Company Only Financial Statements
ENTERPRISE BANCORP, INCNotes to the Consolidated Financial Statements
To the StockholdersShareholders and the Board of Directors of Enterprise Bancorp, Inc.
The Board of Directors and StockholdersEnterprise Bancorp, Inc.:
We have audited the accompanying consolidated balance sheet of Enterprise Bancorp, Inc. and its subsidiaries (the Company) as of December 31, 2015, and the related consolidated statements of income, comprehensive income, changes in stockholders’ equity, and cash flows for the year in the period ended December 31, 2015. These consolidated financial statements are the responsibility of the Company’s management. Our responsibility is to express an opinion on these consolidated financial statements based on our audit.
We conducted our audit in accordance with the standards of the Public Company Accounting Oversight Board (United States). Those standards require that we plan and perform the audit to obtain reasonable assurance about whether the financial statements are free of material misstatement. An audit includes examining, on a test basis, evidence supporting the amounts and disclosures in the financial statements. An audit also includes assessing the accounting principles used and significant estimates made by management, as well as evaluating the overall financial statement presentation. We believe that our audit provides a reasonable basis for our opinion.
In our opinion, the consolidated financial statements referred to above present fairly, in all material respects, the financial position of Enterprise Bancorp, Inc. and its subsidiaries as of December 31, 2015, and the results of their operations and their cash flows for the year in the period ended December 31, 2015, in conformity with U.S. generally accepted accounting principles.
We also have audited, in accordance with the standards of the Public Company Accounting Oversight Board (United States), the Company’s internal control over financial reporting as of December 31, 2015, based on criteria established in Internal Control - Integrated Framework (2013) issued by the Committee of Sponsoring Organizations of the Treadway Commission (COSO), and our report dated March 15, 2016, expressed an unqualified opinion on the effectiveness of the Company’s internal control over financial reporting.
/s/ KPMG LLP
Boston, MassachusettsMarch 15, 2016
REPORT OF INDEPENDENT REGISTERED PUBLIC ACCOUNTING FIRMON INTERNAL CONTROL OVER FINANCIAL REPORTINGTo the StockholdersShareholders and the Board of Directors of Enterprise Bancorp, Inc.
Item 9.Changes in and Disagreements with Accountants on Accounting and Financial Disclosure
Management’sManagement's Report on Internal Control Over Financial Reporting
None.
(1) Financial Statements
(2) Financial Statement Schedules
(3) Exhibits
4.1Renewal Rights Agreement dated as of December 11, 2007 by and between the Company and Computershare Trust Company, N.A., as Rights Agent, including Terms of Series A Junior Participating Preferred Stock, Summary of Rights to Purchase Shares of Series A Junior Participating Preferred Stock, and Form of Rights Certificate attached as Exhibits A, B and C thereto, incorporated by reference to Exhibit 4.5 to the Company’s Current Report on Form 8-K filed on December 13, 2007 (File No. 333-79135).
10.11.1.2 Amendment to the Enterprise Bank and Trust Company 2020 Variable Compensation Incentive Plan, incorporated by reference to the Company's Current Report on Form 8-K filed on November 16, 2020 (File No. 001-33912).
None None.
Item 16. Form 10-K Summary
None.None
144126
ENTERPRISE BANCORP, INCINC.
Notes to the Consolidated Financial Statements
(3) Loans
Major classifications of loans at amortized cost at the periods indicated were as follows:
| (Dollars in thousands) | December 31, 2023 | December 31, 2022 | ||||||||||||
| Commercial real estate | $ | 2,064,737 | $ | 1,921,410 | ||||||||||
| Commercial and industrial | 430,749 | 414,490 | ||||||||||||
| Commercial construction | 585,113 | 424,049 | ||||||||||||
| Total commercial loans | 3,080,599 | 2,759,949 | ||||||||||||
| Residential mortgages | 393,142 | 332,632 | ||||||||||||
| Home equity | 85,375 | 79,807 | ||||||||||||
| Consumer | 8,515 | 8,130 | ||||||||||||
| Total retail loans | 487,032 | 420,569 | ||||||||||||
| Total loans | 3,567,631 | 3,180,518 | ||||||||||||
| Allowance for credit losses | (58,995) | (52,640) | ||||||||||||
| Net loans | $ | 3,508,636 | $ | 3,127,878 | ||||||||||
| (Dollars in thousands) | December 31, 2017 | December 31, 2016 | ||||||
| Commercial real estate | $ | 1,201,351 | $ | 1,038,082 | ||||
| Commercial and industrial | 498,802 | 490,799 | ||||||
| Commercial construction | 274,905 | 213,447 | ||||||
| Total commercial loans | 1,975,058 | 1,742,328 | ||||||
| Residential mortgages | 195,492 | 180,560 | ||||||
| Home equity loans and lines | 91,706 | 91,065 | ||||||
| Consumer | 10,293 | 10,845 | ||||||
| Total retail loans | 297,491 | 282,470 | ||||||
| Gross loans | 2,272,549 | 2,024,798 | ||||||
| Deferred loan origination fees, net | (2,645 | ) | (2,069 | ) | ||||
| Total loans | 2,269,904 | 2,022,729 | ||||||
| Allowance for loan losses | (32,915 | ) | (31,342 | ) | ||||
| Net loans | $ | 2,236,989 | $ | 1,991,387 | ||||
Commercial loans
Related Party Loans
As of December 31, 20172023 and 20162022 , the outstanding loan balances to directors, officers, principal stockholdersshareholders, and their associates were $33.9$31.4 million and $18.6$33.5 million,, respectively. All loans to these related parties were current and accruing atas of those dates. Unadvanced portions of lines of credit available to these individuals were $16.8$35.7 million and $9.8$12.5 million,, as of December 31, 20172023 and 2016,2022, respectively. During 2017,2023, new loans and net increases in loan balances or lines of credit under existing commitments of $30.2$1.5 million were made and principal paydownspay-downs of $7.9$19.7 million were received. During 2016,2022, new loans and net increases in loan balances or lines of credit under existing commitments of $2.3$5.2 million were made and principal paydownspay-downs of $1.9$11.4 million were received.
Loans Servicedserviced for Othersothers
At December 31, 20172023 and 2016,2022, the Company was servicing residential mortgage loans owned by investors amounting to $18.4$7.7 million and $18.7$8.9 million,, respectively. Additionally, the Company was servicing commercial loans originated by the Company and participated out to various other institutions amounting to $70.7$69.8 million and $62.3$59.1 million at December 31, 20172023 and 2016,2022, respectively. See
85
ENTERPRISE BANCORP, INC.
Notes to the discussion above under the heading "Commercial loans" for further information regarding commercial participations.Consolidated Financial Statements
Loans Servingserving as Collateralcollateral
Loans designated as qualified collateral and pledged to the FHLB for borrowing capacity for the periods indicated are summarized below:
| (Dollars in thousands) | December 31, 2023 | December 31, 2022 | ||||||||||||
| Commercial real estate | $ | 495,831 | $ | 113,830 | ||||||||||
| Residential mortgages | 369,062 | 309,023 | ||||||||||||
| Home equity | 35,540 | 39,724 | ||||||||||||
| Total loans pledged to FHLB | $ | 900,433 | $ | 462,577 | ||||||||||
| (Dollars in thousands) | December 31, 2017 | December 31, 2016 | ||||||
| Commercial real estate | $ | 224,703 | $ | 247,664 | ||||
| Residential mortgages | 187,524 | 170,247 | ||||||
| Home equity loans and lines | 9,405 | 12,340 | ||||||
| Total loans pledged to FHLB | $ | 421,632 | $ | 430,251 | ||||
Tax-Exempt Interest
Tax-exempt interest earned on qualified commercial loans was $2.1$2.0 million for both the years ended December 31, 2017 and 2016 and $1.6 million for the year ended December 31, 2015, respectively.2023, $1.7 million for the year ended December 31, 2022 and $1.8 million for the year ended December 31, 2021. Average tax-exempt loan balances were $64.4$47.0 million and $63.9$63.9 million for the years ended December 31, 20172023 and 2016,2022, respectively.
(4) Credit Risk Management and ACL for Loans
See item (h) "Credit Risk Management and ACL for Loans Methodology" contained in Note 15, "Fair Value Measurements," below1, "Summary of Significant Accounting Policies" of this Form 10-K, for further information regarding the Company's fair value measurements for loans, and Note 8, "Derivatives and Hedging Activities," below for information regarding interest-rate-swap agreements related to certain commercial loans.
86
ENTERPRISE BANCORP, INCINC.
Notes to the Consolidated Financial Statements
| Balance at December 31, 2023 | ||||||||||||||||||||||||||||||||||||||||||||||||||||||||
| Term Loans By Origination Year | ||||||||||||||||||||||||||||||||||||||||||||||||||||||||
| (Dollars in thousands) | 2023 | 2022 | 2021 | 2020 | 2019 | Prior | Revolving Loans | Revolving Loans Converted to Term | Total | |||||||||||||||||||||||||||||||||||||||||||||||
| Commercial real estate | ||||||||||||||||||||||||||||||||||||||||||||||||||||||||
| Pass | $ | 215,679 | $ | 371,606 | $ | 367,011 | $ | 201,621 | $ | 217,055 | $ | 641,034 | $ | 12,130 | $ | 107 | $ | 2,026,243 | ||||||||||||||||||||||||||||||||||||||
| Special mention | 31 | 15,782 | — | — | 489 | 9,948 | — | — | 26,250 | |||||||||||||||||||||||||||||||||||||||||||||||
| Substandard | — | 1,311 | 631 | — | 969 | 8,883 | — | 450 | 12,244 | |||||||||||||||||||||||||||||||||||||||||||||||
| Total commercial real estate | 215,710 | 388,699 | 367,642 | 201,621 | 218,513 | 659,865 | 12,130 | 557 | 2,064,737 | |||||||||||||||||||||||||||||||||||||||||||||||
| Current period charge-offs | — | — | — | — | — | — | — | — | — | |||||||||||||||||||||||||||||||||||||||||||||||
| Commercial and industrial | ||||||||||||||||||||||||||||||||||||||||||||||||||||||||
| Pass | 73,608 | 51,990 | 45,278 | 24,778 | 23,724 | 44,609 | 156,465 | 3,402 | 423,854 | |||||||||||||||||||||||||||||||||||||||||||||||
| Special mention | — | — | — | 70 | 215 | 201 | 2,227 | 223 | 2,936 | |||||||||||||||||||||||||||||||||||||||||||||||
| Substandard | — | — | 18 | — | 1 | 209 | 316 | 3,415 | 3,959 | |||||||||||||||||||||||||||||||||||||||||||||||
| Total commercial and industrial | 73,608 | 51,990 | 45,296 | 24,848 | 23,940 | 45,019 | 159,008 | 7,040 | 430,749 | |||||||||||||||||||||||||||||||||||||||||||||||
| Current period charge-offs | 15 | 248 | — | — | 67 | 266 | — | — | 596 | |||||||||||||||||||||||||||||||||||||||||||||||
| Commercial construction | ||||||||||||||||||||||||||||||||||||||||||||||||||||||||
| Pass | 192,462 | 164,313 | 143,203 | 22,017 | 16,247 | 10,532 | 27,261 | — | 576,035 | |||||||||||||||||||||||||||||||||||||||||||||||
| Special mention | — | 7,905 | — | — | 1,173 | — | — | — | 9,078 | |||||||||||||||||||||||||||||||||||||||||||||||
| Total commercial construction | 192,462 | 172,218 | 143,203 | 22,017 | 17,420 | 10,532 | 27,261 | — | 585,113 | |||||||||||||||||||||||||||||||||||||||||||||||
| Current period charge-offs | — | — | — | — | — | — | — | — | — | |||||||||||||||||||||||||||||||||||||||||||||||
| Residential mortgages | ||||||||||||||||||||||||||||||||||||||||||||||||||||||||
| Pass | 82,848 | 107,222 | 69,979 | 46,674 | 19,205 | 65,311 | — | — | 391,239 | |||||||||||||||||||||||||||||||||||||||||||||||
| Special mention | — | — | — | — | — | 109 | — | — | 109 | |||||||||||||||||||||||||||||||||||||||||||||||
| Substandard | — | — | 236 | — | 1,055 | 503 | — | — | 1,794 | |||||||||||||||||||||||||||||||||||||||||||||||
| Total residential mortgages | 82,848 | 107,222 | 70,215 | 46,674 | 20,260 | 65,923 | — | — | 393,142 | |||||||||||||||||||||||||||||||||||||||||||||||
| Current period charge-offs | — | — | — | — | — | — | — | — | — | |||||||||||||||||||||||||||||||||||||||||||||||
| Home equity | ||||||||||||||||||||||||||||||||||||||||||||||||||||||||
| Pass | 1,203 | 775 | 561 | 444 | 317 | 1,738 | 79,421 | 636 | 85,095 | |||||||||||||||||||||||||||||||||||||||||||||||
| Substandard | — | — | — | — | — | 72 | — | 208 | 280 | |||||||||||||||||||||||||||||||||||||||||||||||
| Total home equity | 1,203 | 775 | 561 | 444 | 317 | 1,810 | 79,421 | 844 | 85,375 | |||||||||||||||||||||||||||||||||||||||||||||||
| Current period charge-offs | — | — | — | — | — | — | — | — | — | |||||||||||||||||||||||||||||||||||||||||||||||
| Consumer | ||||||||||||||||||||||||||||||||||||||||||||||||||||||||
| Pass | 3,705 | 1,652 | 1,371 | 722 | 623 | 442 | — | — | 8,515 | |||||||||||||||||||||||||||||||||||||||||||||||
| Total consumer | 3,705 | 1,652 | 1,371 | 722 | 623 | 442 | — | — | 8,515 | |||||||||||||||||||||||||||||||||||||||||||||||
| Current period charge-offs | 35 | — | — | — | — | 1 | — | — | 36 | |||||||||||||||||||||||||||||||||||||||||||||||
| Total loans | $ | 569,536 | $ | 722,556 | $ | 628,288 | $ | 296,326 | $ | 281,073 | $ | 783,591 | $ | 277,820 | $ | 8,441 | $ | 3,567,631 | ||||||||||||||||||||||||||||||||||||||
| Total current period charge-offs | $ | 50 | $ | 248 | $ | — | $ | — | $ | 67 | $ | 267 | $ | — | $ | — | $ | 632 | ||||||||||||||||||||||||||||||||||||||
87
| Balance at December 31, 2022 | ||||||||||||||||||||||||||||||||||||||||||||||||||||||||||||||||||||||||||||||||
| Term Loans by Origination Year | ||||||||||||||||||||||||||||||||||||||||||||||||||||||||||||||||||||||||||||||||
| (Dollars in thousands) | 2022 | 2021 | 2020 | 2019 | 2018 | Prior | Revolving Loans | Revolving Loans Converted to Term | Total | |||||||||||||||||||||||||||||||||||||||||||||||||||||||||||||||||||||||
| Commercial real estate | ||||||||||||||||||||||||||||||||||||||||||||||||||||||||||||||||||||||||||||||||
| Pass | $ | 391,515 | $ | 381,771 | $ | 204,125 | $ | 218,664 | $ | 114,175 | $ | 577,354 | $ | 1,347 | $ | 200 | $ | 1,889,151 | ||||||||||||||||||||||||||||||||||||||||||||||||||||||||||||||
| Special mention | — | — | — | 507 | 2,041 | 16,248 | — | — | 18,796 | |||||||||||||||||||||||||||||||||||||||||||||||||||||||||||||||||||||||
| Substandard | — | 289 | — | 1,160 | 1,404 | 10,610 | — | — | 13,463 | |||||||||||||||||||||||||||||||||||||||||||||||||||||||||||||||||||||||
| Total commercial real estate | 391,515 | 382,060 | 204,125 | 220,331 | 117,620 | 604,212 | 1,347 | 200 | 1,921,410 | |||||||||||||||||||||||||||||||||||||||||||||||||||||||||||||||||||||||
| Commercial and industrial | ||||||||||||||||||||||||||||||||||||||||||||||||||||||||||||||||||||||||||||||||
| Pass | 59,824 | 53,059 | 33,027 | 29,293 | 13,364 | 43,724 | 171,670 | 3,235 | 407,196 | |||||||||||||||||||||||||||||||||||||||||||||||||||||||||||||||||||||||
| Special mention | — | — | — | 11 | 66 | 278 | 3,132 | — | 3,487 | |||||||||||||||||||||||||||||||||||||||||||||||||||||||||||||||||||||||
| Substandard | — | 19 | — | 8 | 138 | 325 | 2,964 | 353 | 3,807 | |||||||||||||||||||||||||||||||||||||||||||||||||||||||||||||||||||||||
| Total commercial and industrial | 59,824 | 53,078 | 33,027 | 29,312 | 13,568 | 44,327 | 177,766 | 3,588 | 414,490 | |||||||||||||||||||||||||||||||||||||||||||||||||||||||||||||||||||||||
| Commercial construction | ||||||||||||||||||||||||||||||||||||||||||||||||||||||||||||||||||||||||||||||||
| Pass | 151,107 | 169,549 | 35,651 | 31,189 | 7,729 | 3,379 | 19,778 | 1,473 | 419,855 | |||||||||||||||||||||||||||||||||||||||||||||||||||||||||||||||||||||||
| Special mention | — | — | — | 3,900 | — | — | — | — | 3,900 | |||||||||||||||||||||||||||||||||||||||||||||||||||||||||||||||||||||||
| Substandard | — | 294 | — | — | — | — | — | — | 294 | |||||||||||||||||||||||||||||||||||||||||||||||||||||||||||||||||||||||
| Total commercial construction | 151,107 | 169,843 | 35,651 | 35,089 | 7,729 | 3,379 | 19,778 | 1,473 | 424,049 | |||||||||||||||||||||||||||||||||||||||||||||||||||||||||||||||||||||||
| Residential mortgages | ||||||||||||||||||||||||||||||||||||||||||||||||||||||||||||||||||||||||||||||||
| Pass | 112,804 | 73,955 | 49,549 | 20,140 | 18,799 | 54,620 | — | — | 329,867 | |||||||||||||||||||||||||||||||||||||||||||||||||||||||||||||||||||||||
| Special mention | — | — | — | — | — | 325 | — | — | 325 | |||||||||||||||||||||||||||||||||||||||||||||||||||||||||||||||||||||||
| Substandard | — | — | — | 1,060 | — | 1,380 | — | — | 2,440 | |||||||||||||||||||||||||||||||||||||||||||||||||||||||||||||||||||||||
| Total residential mortgages | 112,804 | 73,955 | 49,549 | 21,200 | 18,799 | 56,325 | — | — | 332,632 | |||||||||||||||||||||||||||||||||||||||||||||||||||||||||||||||||||||||
| Home equity | ||||||||||||||||||||||||||||||||||||||||||||||||||||||||||||||||||||||||||||||||
| Pass | 328 | 596 | 456 | 345 | — | 1,220 | 75,324 | 1,054 | 79,323 | |||||||||||||||||||||||||||||||||||||||||||||||||||||||||||||||||||||||
| Substandard | — | 273 | — | — | — | 211 | — | — | 484 | |||||||||||||||||||||||||||||||||||||||||||||||||||||||||||||||||||||||
| Total home equity | 328 | 869 | 456 | 345 | — | 1,431 | 75,324 | 1,054 | 79,807 | |||||||||||||||||||||||||||||||||||||||||||||||||||||||||||||||||||||||
| Consumer | ||||||||||||||||||||||||||||||||||||||||||||||||||||||||||||||||||||||||||||||||
| Pass | 3,144 | 1,852 | 1,063 | 1,045 | 606 | 420 | — | — | 8,130 | |||||||||||||||||||||||||||||||||||||||||||||||||||||||||||||||||||||||
| Total consumer | 3,144 | 1,852 | 1,063 | 1,045 | 606 | 420 | — | — | 8,130 | |||||||||||||||||||||||||||||||||||||||||||||||||||||||||||||||||||||||
| Total loans | $ | 718,722 | $ | 681,657 | $ | 323,871 | $ | 307,322 | $ | 158,322 | $ | 710,094 | $ | 274,215 | $ | 6,315 | $ | 3,180,518 | ||||||||||||||||||||||||||||||||||||||||||||||||||||||||||||||
The modified historic loss factor for problem loan segments was determined by first tracking a sampling of these loans over a period of time, to determine the ultimate resolution. Those balances resulting in charge-offs were calculated as a percentage of the segment's loan balance and an average was calculated over that same period. This average period may be changed from time to time to be reflective of the most appropriate corresponding conditions (market, economic, etc.). These historic loss factors are then adjusted up or down based on management’s assessment of current qualitative factors that are likely to cause estimated credit losses as of the evaluation date to differ from the segment’s historical loss experience. Management also utilizes regulatory guidance and industry data in relation to the Company's own portfolio statistics as atotal amortized cost basis for assessing the reasonableness of the allocation factors for each class of regulatory problem-assets.
| (Dollars in thousands) | Loans individually evaluated for impairment | Loans collectively evaluated for impairment | Gross Loans | |||||||||
| Commercial real estate | $ | 13,739 | $ | 1,187,612 | $ | 1,201,351 | ||||||
| Commercial and industrial | 10,096 | 488,706 | 498,802 | |||||||||
| Commercial construction | 1,624 | 273,281 | 274,905 | |||||||||
| Residential mortgages | 397 | 195,095 | 195,492 | |||||||||
| Home equity loans and lines | 371 | 91,335 | 91,706 | |||||||||
| Consumer | 35 | 10,258 | 10,293 | |||||||||
| Total gross loans | $ | 26,262 | $ | 2,246,287 | $ | 2,272,549 | ||||||
| (Dollars in thousands) | Loans individually evaluated for impairment | Loans collectively evaluated for impairment | Gross Loans | |||||||||
| Commercial real estate | $ | 14,261 | $ | 1,023,821 | $ | 1,038,082 | ||||||
| Commercial and industrial | 13,372 | 477,427 | 490,799 | |||||||||
| Commercial construction | 3,364 | 210,083 | 213,447 | |||||||||
| Residential mortgages | 289 | 180,271 | 180,560 | |||||||||
| Home equity loans and lines | 509 | 90,556 | 91,065 | |||||||||
| Consumer | 1 | 10,844 | 10,845 | |||||||||
| Total loans | $ | 31,796 | $ | 1,993,002 | $ | 2,024,798 | ||||||
88
Contents
ENTERPRISE BANCORP, INCINC.
Notes to the Consolidated Financial Statements
| December 31, 2017 | ||||||||||||||||||||
| (Dollars in thousands) | Adversely Classified | Not Adversely Classified | Gross Loans | |||||||||||||||||
| Substandard | Doubtful | Loss | ||||||||||||||||||
| Commercial real estate | $ | 12,895 | $ | — | $ | — | $ | 1,188,456 | $ | 1,201,351 | ||||||||||
| Commercial and industrial | 9,915 | 48 | 1 | 488,838 | 498,802 | |||||||||||||||
| Commercial construction | 1,624 | — | — | 273,281 | 274,905 | |||||||||||||||
| Residential mortgages | 1,355 | — | — | 194,137 | 195,492 | |||||||||||||||
| Home equity loans and lines | 513 | — | — | 91,193 | 91,706 | |||||||||||||||
| Consumer | 52 | 10 | — | 10,231 | 10,293 | |||||||||||||||
| Total gross loans | $ | 26,354 | $ | 58 | $ | 1 | $ | 2,246,136 | $ | 2,272,549 | ||||||||||
| December 31, 2016 | ||||||||||||||||||||
| (Dollars in thousands) | Adversely Classified | Not Adversely Classified | Gross Loans | |||||||||||||||||
| Substandard | Doubtful | Loss | ||||||||||||||||||
| Commercial real estate | $ | 16,003 | $ | — | $ | — | $ | 1,022,079 | $ | 1,038,082 | ||||||||||
| Commercial and industrial | 12,770 | 99 | 2 | 477,928 | 490,799 | |||||||||||||||
| Commercial construction | 3,364 | — | — | 210,083 | 213,447 | |||||||||||||||
| Residential mortgages | 1,414 | — | — | 179,146 | 180,560 | |||||||||||||||
| Home equity loans and lines | 666 | — | — | 90,399 | 91,065 | |||||||||||||||
| Consumer | 30 | — | — | 10,815 | 10,845 | |||||||||||||||
| Total gross loans | $ | 34,247 | $ | 99 | $ | 2 | $ | 1,990,450 | $ | 2,024,798 | ||||||||||
Past due and non-accrual loans
The following tables present an age analysis of past due loans by portfolio classification as of the dates indicated:
| Balance at December 31, 2023 | |||||||||||||||||||||||||||||||||||||||||
| (Dollars in thousands) | 30-59 Days Past Due | 60-89 Days Past Due | Past Due 90 Days or More | Total Past Due Loans(1) | Current Loans(1) | Total Loans | |||||||||||||||||||||||||||||||||||
| Commercial real estate | $ | 1,181 | $ | 774 | $ | 1,334 | $ | 3,289 | $ | 2,061,448 | $ | 2,064,737 | |||||||||||||||||||||||||||||
| Commercial and industrial | 660 | 64 | — | 724 | 430,025 | 430,749 | |||||||||||||||||||||||||||||||||||
| Commercial construction | — | — | — | — | 585,113 | 585,113 | |||||||||||||||||||||||||||||||||||
| Residential mortgages | 1,265 | — | 1,277 | 2,542 | 390,600 | 393,142 | |||||||||||||||||||||||||||||||||||
| Home equity | 53 | — | 97 | 150 | 85,225 | 85,375 | |||||||||||||||||||||||||||||||||||
| Consumer | 25 | 2 | — | 27 | 8,488 | 8,515 | |||||||||||||||||||||||||||||||||||
| Total loans | $ | 3,184 | $ | 840 | $ | 2,708 | $ | 6,732 | $ | 3,560,899 | $ | 3,567,631 | |||||||||||||||||||||||||||||
| Balance at December 31, 2017 | ||||||||||||||||||||||||||||||||||||||||||||||||||||||||||||||||||
| Balance at December 31, 2022 | ||||||||||||||||||||||||||||||||||||||||||||||||||||||||||||||||||
| Balance at December 31, 2022 | ||||||||||||||||||||||||||||||||||||||||||||||||||||||||||||||||||
| Balance at December 31, 2022 | ||||||||||||||||||||||||||||||||||||||||||||||||||||||||||||||||||
| (Dollars in thousands) | Past Due 30-59 Days | Past Due 60-89 Days | Past Due 90 Days or More | Total Past Due Loans | Current Loans | Gross Loans | Non-accrual Loans | |||||||||||||||||||||||||||||||||||||||||||||||||||||||||||
| Commercial real estate | $ | 4,200 | $ | 69 | $ | 3,569 | $ | 7,838 | $ | 1,193,513 | $ | 1,201,351 | $ | 6,751 | ||||||||||||||||||||||||||||||||||||||||||||||||||||
| Commercial real estate | ||||||||||||||||||||||||||||||||||||||||||||||||||||||||||||||||||
| Commercial real estate | ||||||||||||||||||||||||||||||||||||||||||||||||||||||||||||||||||
| Commercial and industrial | ||||||||||||||||||||||||||||||||||||||||||||||||||||||||||||||||||
| Commercial and industrial | ||||||||||||||||||||||||||||||||||||||||||||||||||||||||||||||||||
| Commercial and industrial | 374 | 527 | 327 | 1,228 | 497,574 | 498,802 | 1,294 | |||||||||||||||||||||||||||||||||||||||||||||||||||||||||||
| Commercial construction | 2,526 | 518 | — | 3,044 | 271,861 | 274,905 | 193 | |||||||||||||||||||||||||||||||||||||||||||||||||||||||||||
| Commercial construction | ||||||||||||||||||||||||||||||||||||||||||||||||||||||||||||||||||
| Commercial construction | ||||||||||||||||||||||||||||||||||||||||||||||||||||||||||||||||||
| Residential mortgages | 1,931 | 93 | 89 | 2,113 | 193,379 | 195,492 | 262 | |||||||||||||||||||||||||||||||||||||||||||||||||||||||||||
| Home equity loans and lines | 491 | 120 | 12 | 623 | 91,083 | 91,706 | 463 | |||||||||||||||||||||||||||||||||||||||||||||||||||||||||||
| Residential mortgages | ||||||||||||||||||||||||||||||||||||||||||||||||||||||||||||||||||
| Residential mortgages | ||||||||||||||||||||||||||||||||||||||||||||||||||||||||||||||||||
| Home equity | ||||||||||||||||||||||||||||||||||||||||||||||||||||||||||||||||||
| Home equity | ||||||||||||||||||||||||||||||||||||||||||||||||||||||||||||||||||
| Home equity | ||||||||||||||||||||||||||||||||||||||||||||||||||||||||||||||||||
| Consumer | 51 | 5 | 45 | 101 | 10,192 | 10,293 | 69 | |||||||||||||||||||||||||||||||||||||||||||||||||||||||||||
| Total gross loans | $ | 9,573 | $ | 1,332 | $ | 4,042 | $ | 14,947 | $ | 2,257,602 | $ | 2,272,549 | $ | 9,032 | ||||||||||||||||||||||||||||||||||||||||||||||||||||
| Consumer | ||||||||||||||||||||||||||||||||||||||||||||||||||||||||||||||||||
| Consumer | ||||||||||||||||||||||||||||||||||||||||||||||||||||||||||||||||||
| Total loans | ||||||||||||||||||||||||||||||||||||||||||||||||||||||||||||||||||
| Total loans | ||||||||||||||||||||||||||||||||||||||||||||||||||||||||||||||||||
| Total loans | ||||||||||||||||||||||||||||||||||||||||||||||||||||||||||||||||||
(1)The loan balances in the table above include loans designated as non-accrual despite their payment due status.
| Balance at December 31, 2016 | ||||||||||||||||||||||||||||
| (Dollars in thousands) | Past Due 30-59 Days | Past Due 60-89 Days | Past Due 90 Days or More | Total Past Due Loans | Current Loans | Gross Loans | Non-accrual Loans | |||||||||||||||||||||
| Commercial real estate | $ | 5,993 | $ | 923 | $ | 1,399 | $ | 8,315 | $ | 1,029,767 | $ | 1,038,082 | $ | 4,876 | ||||||||||||||
| Commercial and industrial | 267 | 4 | 1,544 | 1,815 | 488,984 | 490,799 | 3,174 | |||||||||||||||||||||
| Commercial construction | — | — | — | — | 213,447 | 213,447 | 519 | |||||||||||||||||||||
| Residential mortgages | 648 | — | 99 | 747 | 179,813 | 180,560 | 289 | |||||||||||||||||||||
| Home equity loans and lines | 270 | — | 269 | 539 | 90,526 | 91,065 | 616 | |||||||||||||||||||||
| Consumer | 94 | 13 | 11 | 118 | 10,727 | 10,845 | 11 | |||||||||||||||||||||
| Total gross loans | $ | 7,272 | $ | 940 | $ | 3,322 | $ | 11,534 | $ | 2,013,264 | $ | 2,024,798 | $ | 9,485 | ||||||||||||||
At December 31, 20172023 and December 31, 2016,2022, all loans past due 90 days or more were carried as non-accrual, however, not all non-accrual loans were 90 days or more past due in addition to those loanstheir payments. Loans that were less than 90 days past due where reasonable doubt existed as to the full and timely collection of interest or principal that have also been designated as non-accrual, despite their payment due status shown instatus.
The following tables present the tables above.
| Balance at December 31, 2023 | ||||||||||||||||||||||||||
| (Dollars in thousands) | Total Non-accrual Loans | Non-accrual Loans without a Specific Reserve | Non-accrual Loans with a Specific Reserve | Related Specific Reserve | ||||||||||||||||||||||
| Commercial real estate | $ | 5,369 | $ | 4,400 | $ | 969 | $ | 229 | ||||||||||||||||||
| Commercial and industrial | 4,262 | 736 | 3,526 | 2,658 | ||||||||||||||||||||||
| Commercial construction | — | — | — | — | ||||||||||||||||||||||
| Residential mortgages | 1,526 | 1,526 | — | — | ||||||||||||||||||||||
| Home equity | 257 | 257 | — | — | ||||||||||||||||||||||
| Consumer | — | — | — | — | ||||||||||||||||||||||
| Total loans | $ | 11,414 | $ | 6,919 | $ | 4,495 | $ | 2,887 | ||||||||||||||||||
89
ENTERPRISE BANCORP, INC.
Notes to the periods noted, and are discussed further below.Consolidated Financial Statements
| Balance at December 31, 2022 | |||||||||||||||||||||||||||||||||||||||||
| (Dollars in thousands) | Total Non-accrual Loans | Non-accrual Loans without a Specific Reserve | Non-accrual Loans with a Specific Reserve | Related Specific Reserve | |||||||||||||||||||||||||||||||||||||
| Commercial real estate | $ | 3,355 | $ | 2,317 | $ | 1,038 | $ | 298 | |||||||||||||||||||||||||||||||||
| Commercial and industrial | 730 | 348 | 382 | 382 | |||||||||||||||||||||||||||||||||||||
| Commercial construction | 294 | 294 | — | — | |||||||||||||||||||||||||||||||||||||
| Residential mortgages | 1,532 | 1,532 | — | — | |||||||||||||||||||||||||||||||||||||
| Home equity | 211 | 211 | — | — | |||||||||||||||||||||||||||||||||||||
| Consumer | — | — | — | — | |||||||||||||||||||||||||||||||||||||
| Total loans | $ | 6,122 | $ | 4,702 | $ | 1,420 | $ | 680 | |||||||||||||||||||||||||||||||||
The ratio of non-accrual loans to total loans amounted to 0.40%0.32% and 0.47%0.19% at December 31, 20172023 and December 31, 2016,2022, respectively.
The reduction in interest income for the years ended December 31, associated with non-accruing loans is summarized as follows:
| (Dollars in thousands) | 2023 | 2022 | 2021 | |||||||||||||||||
| Income that would have been recognized if non-accrual loans had been on accrual | $ | 1,285 | $ | 1,083 | $ | 2,028 | ||||||||||||||
| Less income recognized | 191 | 1,050 | 633 | |||||||||||||||||
| Reduction in interest income | $ | 1,094 | $ | 33 | $ | 1,395 | ||||||||||||||
| (Dollars in thousands) | 2017 | 2016 | 2015 | |||||||||
| Income in accordance with original loan terms | $ | 1,906 | $ | 1,585 | $ | 1,052 | ||||||
| Less income recognized | 990 | 722 | 426 | |||||||||
| Reduction in interest income | $ | 916 | $ | 863 | $ | 626 | ||||||
Collateral dependent loans
The total recorded investment in collateral dependent loans amounted to $13.7 million at December 31, 2023 compared to $25.2 million at December 31, 2022. Total accruing collateral dependent loans amounted to $2.4 million, while non-accrual collateral dependent loans amounted to $11.3 million as of December 31, 2023. As of December 31, 2022, total accruing collateral dependent loans amounted to $19.5 million while non-accrual collateral dependent loans amounted to $5.7 million.
Loans that have been individually evaluated and repayment is expected substantially from the operations or ultimate sale of the underlying collateral are deemed to be collateral dependent loans. Collateral dependent loans are individually significantadversely classified loans. These loans for which management considers it probable that not all amounts due (principal and interest) willmay be collected in accordance with the original contractual terms. The majority of impairedaccruing or on non-accrual status. Collateral dependent loans are included withincarried at the non-accrual balances; however, not everylower of the recorded investment in the loan on non-accrual status has been designatedor the estimated fair value. Underlying collateral will vary by type of loan, as impaired. Impaireddiscussed below.
Commercial real estate loans include loans that have been modified in a troubled debt restructuring ("TDR"), see "Troubled debt restructurings" below. Impairedsecured by both owner and non-owner occupied (investor) real estate. These loans are individually evaluatedtypically secured by a variety of commercial, residential investment, and exclude large groupsindustrial property types, including one-to-four and multi-family apartment buildings, office, industrial, or mixed-use facilities, strip shopping centers, or other commercial properties.
Commercial and industrial credits may be unsecured loans and lines to financially strong borrowers, loans secured in whole or in part by real estate unrelated to the principal purpose of smaller-balance homogeneousthe loan or secured by inventories, equipment, or receivables.
Commercial construction loans such asinclude the development of residential housing and condominium projects, the development of commercial and industrial use property, and loans for the purchase and improvement of raw land. These loans are secured in whole or in part by underlying real estate collateral.
Residential mortgage loans and consumerhome equity lines may be secured by one-to-four family residential properties serving as the borrower's primary residence, or as vacation homes or investment properties.
Consumer loans which are collectively evaluated for impairment,consist primarily of secured or unsecured personal loans, loans under energy efficiency financing programs in conjunction with Massachusetts public utilities, and loans that are measured at fair value, unlessoverdraft protection lines on checking accounts.
90
ENTERPRISE BANCORP, INC.
Notes to the loan is amended in a TDR.Consolidated Financial Statements
Management does not set any minimum delay of payments as a factor in reviewing for impaired classification.individual evaluation. Management considers the individual payment status, net worth and earnings potential of the borrower, and the value and cash flow of the collateral as factors to determine if a loan will be paid in accordance with its contractual terms. An impaired or TDR loan classification will be considered for upgrade based on the borrower's sustained performance
The following tables set forthpresent the recorded investment in impairedcollateral dependent individually evaluated loans and the related specific allowance allocatedby portfolio allocation as of the dates indicated:
| Balance at December 31, 2023 | ||||||||||||||||||||||||||||||||
| (Dollars in thousands) | Unpaid Contractual Principal Balance | Total Recorded Investment in Collateral Dependent Loans | Recorded Investment without a Specific Reserve | Recorded Investment with a Specific Reserve | Related Specific Reserve | |||||||||||||||||||||||||||
| Commercial real estate | $ | 8,703 | $ | 7,148 | $ | 6,180 | $ | 968 | $ | 229 | ||||||||||||||||||||||
| Commercial and industrial | 6,804 | 4,332 | 950 | 3,382 | 2,526 | |||||||||||||||||||||||||||
| Commercial construction | — | — | — | — | — | |||||||||||||||||||||||||||
| Residential mortgages | 2,117 | 1,902 | 1,902 | — | — | |||||||||||||||||||||||||||
| Home equity | 359 | 281 | 281 | — | — | |||||||||||||||||||||||||||
| Consumer | — | — | — | — | — | |||||||||||||||||||||||||||
| Total | $ | 17,983 | $ | 13,663 | $ | 9,313 | $ | 4,350 | $ | 2,755 | ||||||||||||||||||||||
| Balance at December 31, 2017 | ||||||||||||||||||||||||||||||||||||||||||||||||||||||||||||||||||||||||||||||||||||||
| Balance at December 31, 2022 | Balance at December 31, 2022 | |||||||||||||||||||||||||||||||||||||||||||||||||||||||||||||||||||||||||||||||||||||
| (Dollars in thousands) | Unpaid contractual principal balance | Total recorded investment in impaired loans | Recorded investment with no allowance | Recorded investment with allowance | Related specific allowance | (Dollars in thousands) | Unpaid Contractual Principal Balance | Total Recorded Investment in Collateral Dependent Loans | Recorded Investment without a Specific Reserve | Recorded Investment with a Specific Reserve | Related Specific Reserve | |||||||||||||||||||||||||||||||||||||||||||||||||||||||||||||||||||||||||||
| Commercial real estate | $ | 15,132 | $ | 13,739 | $ | 12,850 | $ | 889 | $ | 59 | ||||||||||||||||||||||||||||||||||||||||||||||||||||||||||||||||||||||||||||
| Commercial and industrial | 10,458 | 10,096 | 7,053 | 3,043 | 1,284 | |||||||||||||||||||||||||||||||||||||||||||||||||||||||||||||||||||||||||||||||||
| Commercial construction | 1,678 | 1,624 | 1,624 | — | — | |||||||||||||||||||||||||||||||||||||||||||||||||||||||||||||||||||||||||||||||||
| Residential mortgages | 511 | 397 | 262 | 135 | 5 | |||||||||||||||||||||||||||||||||||||||||||||||||||||||||||||||||||||||||||||||||
| Home equity loans and lines | 543 | 371 | 371 | — | — | |||||||||||||||||||||||||||||||||||||||||||||||||||||||||||||||||||||||||||||||||
| Residential mortgages | ||||||||||||||||||||||||||||||||||||||||||||||||||||||||||||||||||||||||||||||||||||||
| Residential mortgages | ||||||||||||||||||||||||||||||||||||||||||||||||||||||||||||||||||||||||||||||||||||||
| Home equity | ||||||||||||||||||||||||||||||||||||||||||||||||||||||||||||||||||||||||||||||||||||||
| Consumer | 36 | 35 | — | 35 | 35 | |||||||||||||||||||||||||||||||||||||||||||||||||||||||||||||||||||||||||||||||||
| Total | $ | 28,358 | $ | 26,262 | $ | 22,160 | $ | 4,102 | $ | 1,383 | ||||||||||||||||||||||||||||||||||||||||||||||||||||||||||||||||||||||||||||
| Balance at December 31, 2016 | ||||||||||||||||||||
| (Dollars in thousands) | Unpaid contractual principal balance | Total recorded investment in impaired loans | Recorded investment with no allowance | Recorded investment with allowance | Related specific allowance | |||||||||||||||
| Commercial real estate | $ | 16,010 | $ | 14,261 | $ | 12,444 | $ | 1,817 | $ | 370 | ||||||||||
| Commercial and industrial | 14,291 | 13,372 | 9,366 | 4,006 | 2,222 | |||||||||||||||
| Commercial construction | 3,408 | 3,364 | 3,051 | 313 | 28 | |||||||||||||||
| Residential mortgages | 388 | 289 | 289 | — | — | |||||||||||||||
| Home equity loans and lines | 665 | 509 | 509 | — | — | |||||||||||||||
| Consumer | 2 | 1 | — | 1 | 1 | |||||||||||||||
| Total | $ | 34,764 | $ | 31,796 | $ | 25,659 | $ | 6,137 | $ | 2,621 | ||||||||||
| December 31, 2017 | December 31, 2016 | December 31, 2015 | ||||||||||||||||||||||
| (Dollars in thousands) | Average recorded investment | Interest income (loss) recognized | Average recorded investment | Interest income (loss) recognized | Average recorded investment | Interest income recognized | ||||||||||||||||||
| Commercial real estate | $ | 14,473 | $ | 363 | $ | 12,988 | $ | 332 | $ | 13,827 | $ | 196 | ||||||||||||
| Commercial and industrial | 12,272 | 370 | 9,790 | 223 | 9,372 | 97 | ||||||||||||||||||
| Commercial construction | 1,818 | 92 | 3,137 | 150 | 2,202 | 83 | ||||||||||||||||||
| Residential mortgages | 320 | 2 | 301 | — | 449 | — | ||||||||||||||||||
| Home equity loans and lines | 482 | (1 | ) | 356 | (4 | ) | 174 | 1 | ||||||||||||||||
| Consumer | 25 | (1 | ) | 14 | — | 45 | — | |||||||||||||||||
| Total | $ | 29,390 | $ | 825 | $ | 26,586 | $ | 701 | $ | 26,069 | $ | 377 | ||||||||||||
| Twelve months ended | ||||||||||||||||||||||||||||||||||||||||||||||||||
| December 31, 2023 | ||||||||||||||||||||||||||||||||||||||||||||||||||
| (Dollars in thousands) | Payment Deferrals | % of Loan Class Total | ||||||||||||||||||||||||||||||||||||||||||||||||
| Commercial real estate | $ | 270 | 0.01 | % | ||||||||||||||||||||||||||||||||||||||||||||||
| Commercial and industrial | 177 | 0.04 | % | |||||||||||||||||||||||||||||||||||||||||||||||
| Residential mortgages | 31 | 0.01 | % | |||||||||||||||||||||||||||||||||||||||||||||||
| Total | $ | 478 | 0.01 | % | ||||||||||||||||||||||||||||||||||||||||||||||
The following table presents the financial effect of loan modifications made to borrowers experiencing financial difficulty during the loan as a resultperiod indicated:
91
ENTERPRISE BANCORP, INC.
Notes to the Consolidated Financial Statements
| Twelve months ended | ||||||||||||||||||||
| December 31, 2023 | ||||||||||||||||||||
| Weighted Average Payment Deferrals | ||||||||||||||||||||
| Commercial real estate | 0.5 years | |||||||||||||||||||
| Commercial and industrial | 0.5 years | |||||||||||||||||||
| Residential mortgages | 0.5 years | |||||||||||||||||||
The Company closely monitors the performance of the borrower, the Bank grants the borrower a concession on the terms, that would not otherwise be considered. Typically, such concessions may consist of a reduction in interest rate to a below market rate, taking into account the credit quality of the note, extension of additional credit based on receipt of adequate collateral, or a deferment or reduction of payments (principal or interest) which materially alters the Bank's position or significantly extends the note's maturity date, such that the present value of cash flows to be received is materially less than those contractually established at the loan's origination. All loans that are modified are reviewed byfor borrowers experiencing financial difficulty to understand the effectiveness of its modification efforts. The following table presents the performance status of loans that had been modified within the preceding twelve months for borrowers experiencing financial difficulty, at the period indicated.
| Balance at December 31, 2023 | ||||||||||||||||||||||||||||||||
| (Dollars in thousands) | Current | 30-59 Days Past Due | 60-89 Days Past Due | Past Due 90 Days or More | Total Past Due | |||||||||||||||||||||||||||
| Commercial real estate | $ | — | $ | — | $ | 270 | $ | — | $ | 270 | ||||||||||||||||||||||
| Commercial and industrial | 143 | — | 34 | — | 34 | |||||||||||||||||||||||||||
| Commercial construction | — | — | — | — | — | |||||||||||||||||||||||||||
| Residential mortgages | 31 | — | — | — | — | |||||||||||||||||||||||||||
| Home equity | — | — | — | — | — | |||||||||||||||||||||||||||
| Consumer | — | — | — | — | — | |||||||||||||||||||||||||||
| Total | $ | 174 | $ | — | $ | 304 | $ | — | $ | 304 | ||||||||||||||||||||||
During the year ended December 31, 2023, there were no subsequent defaults on loans that had been modified within the preceding twelve months for borrowers experiencing financial difficulty, and at December 31, 2023, additional funding commitments to borrowers experiencing financial difficulty who were party to a loan modification were immaterial.
Prior Period TDR Disclosures
Prior to adopting the new accounting standard on loan modifications, the Company accounted for modifications of loans to identifyborrowers experiencing financial difficulty as TDRs, when the modification resulted in a concession and specific reserves were charged to the ACL if a TDR has occurred. TDR loans are included in the impaired loan category and, as such, these loans are individually reviewed and evaluated and a specific reserve is assignednecessary for the amount of the estimated probable credit loss. The following discussion reflects loans that were considered TDRs prior to January 1, 2023. For further information on the Company's TDR accounting policies, see Note 1, "Summary of Significant Accounting Policies," to the Company's audited consolidated financial statements contained in the 2022 Form 10-K.
Total TDR loans included in the impaired loan balances above, as of amounted to $8.4 million at December 31, 2017 and 2022. At December 31, 2016, were $20.3 million and $27.0 million, respectively.2022, TDR loans on accrual status amounted to $17.4$6.0 million, and$22.4 million at December 31, 2017 and December 31, 2016, respectively. TDR loans included in non-performingnon-accrual loans amounted to $2.9 million and $4.6 million at December 31, 2017 and December 31, 2016, respectively. $2.4 million.
The Company continues to work with customers particularly commercial relationships, and enters into loan modifications (which may or may not be TDRs) to the extent deemed to be necessary or appropriate while attempting to achieve the best mutual outcome given the individual financial circumstances and future prospects of the borrower.
At December 31, 2017,2022, additional funding commitments for TDR loans totaled $391 thousand.were not material. The Company's obligation to fulfill the additional funding commitments on TDR loans is generally contingent on the borrower's compliance with the terms of the credit agreement. If the borrower is not in compliance, additional funding commitments may or may not be made at the Company's discretion.
92
The following table presents the number and balance of loans modified as TDRs, by portfolio classification, during the periods indicated:
| December 31, 2022 | ||||||||||||||||||||||||||||||||||||||
| (Dollars in thousands) | Number of Restructurings | Pre-modification Outstanding Recorded Investment | Post-modification Outstanding Recorded Investment | |||||||||||||||||||||||||||||||||||
| Commercial real estate | 6 | $ | 3,342 | $ | 2,563 | |||||||||||||||||||||||||||||||||
| Commercial and industrial | 2 | 225 | 246 | |||||||||||||||||||||||||||||||||||
| Total | 8 | $ | 3,567 | $ | 2,809 | |||||||||||||||||||||||||||||||||
There were no subsequent charge-offs of new TDRs noted in the table above during the year ended December 31, 2022.
Interest payments received on non-accruing 2022 TDR loans which were applied to principal and not recognized as interest income were not material.
Payment defaults by portfolio classification, during the year indicated, on loans modified as TDRs within the preceding twelve months are detailed below:
| December 31, 2022 | ||||||||||||||||||||||||||
| (Dollars in thousands) | Number of TDRs that Defaulted | Post-modification Outstanding Recorded Investment | ||||||||||||||||||||||||
| Commercial real estate | 3 | $ | 1,044 | |||||||||||||||||||||||
| Total | 3 | $ | 1,044 | |||||||||||||||||||||||
The following table sets forth the post modification balances of TDRs listed by type of modification for TDRs that occurred during the periods indicated.period indicated:
| December 31, 2022 | ||||||||||||||||||||||||||
| (Dollars in thousands) | Number of Restructurings | Amount | ||||||||||||||||||||||||
| Temporary interest-only payment plan | 3 | $ | 138 | |||||||||||||||||||||||
| Other payment concessions | 5 | 2,671 | ||||||||||||||||||||||||
| Total | 8 | $ | 2,809 | |||||||||||||||||||||||
| Allowance for credit losses associated with TDR loans listed above | $ | 298 | ||||||||||||||||||||||||
| December 31, 2017 | December 31, 2016 | |||||||||||||
| (Dollars in thousands) | Number of restructurings | Amount | Number of restructurings | Amount | ||||||||||
| Loan advances with adequate collateral | — | $ | — | 8 | $ | 10,533 | ||||||||
| Extended maturity date | 1 | 175 | 4 | 548 | ||||||||||
| Temporary payment reduction and payment re-amortization of remaining principal over extended term | 6 | 790 | — | — | ||||||||||
| Temporary interest-only payment plan | 4 | 191 | 7 | 1,697 | ||||||||||
| Total | 11 | $ | 1,156 | 19 | $ | 12,778 | ||||||||
| Amount of specific reserves included in the allowance for loan losses associated with TDRs listed above | $ | 155 | $ | 1,418 | ||||||||||
| (Dollars in thousands) | 2023 | 2022 | 2021 | ||||||||||||||||||||||||||
| Provision for credit losses on loans | $ | 6,460 | $ | 5,175 | $ | 543 | |||||||||||||||||||||||
| Provision for unfunded commitments | 2,789 | 625 | 1,227 | ||||||||||||||||||||||||||
| Total provision for credit losses | $ | 9,249 | $ | 5,800 | $ | 1,770 | |||||||||||||||||||||||
The ACL for loans amounted to $59.0 million and $52.6 million at December 31, 2023 and December 31, 2016 are detailed below.2022, respectively. The ACL for loans to total loans ratio was 1.65% and 1.66% at December 31, 2023 and December 31, 2022, respectively.
93
| December 31, 2017 | December 31, 2016 | |||||||||||||||||||||
| (Dollars in thousands) | Number of restructurings | Pre-modification outstanding recorded investment | Post-modification outstanding recorded investment | Number of restructurings | Pre-modification outstanding recorded investment | Post-modification outstanding recorded investment | ||||||||||||||||
| Commercial real estate | 3 | $ | 696 | $ | 674 | 8 | $ | 6,212 | $ | 7,534 | ||||||||||||
| Commercial and industrial | 6 | 386 | 346 | 11 | 5,231 | 5,244 | ||||||||||||||||
| Commercial construction | — | — | — | — | — | — | ||||||||||||||||
| Residential mortgages | 1 | 136 | 135 | — | — | — | ||||||||||||||||
| Home equity loans and lines | — | — | — | — | — | — | ||||||||||||||||
| Consumer | 1 | 1 | 1 | — | — | — | ||||||||||||||||
| Total | 11 | $ | 1,219 | $ | 1,156 | 19 | $ | 11,443 | $ | 12,778 | ||||||||||||
| (Dollars in thousands) | 2023 | 2022 | 2021 | |||||||||||||||||
| Balance at beginning of year | $ | 52,640 | $ | 47,704 | $ | 44,565 | ||||||||||||||
| CECL adjustment upon adoption | — | — | 6,560 | |||||||||||||||||
| Provision | 6,460 | 5,175 | 543 | |||||||||||||||||
| Recoveries | 527 | 272 | 363 | |||||||||||||||||
| Less: Charge-offs | 632 | 511 | 4,327 | |||||||||||||||||
| Balance at end of year | $ | 58,995 | $ | 52,640 | $ | 47,704 | ||||||||||||||
The following tables present changes in the ACL for loans by portfolio classification, during the periods presented below:
| (Dollars in thousands) | Commercial Real Estate | Commercial and Industrial | Commercial Construction | Residential Mortgage | Home Equity | Consumer | Total | |||||||||||||||||||||||||||||||||||||
| Beginning Balance at December 31, 2022 | $ | 36,564 | $ | 8,896 | $ | 3,961 | $ | 2,255 | $ | 633 | $ | 331 | $ | 52,640 | ||||||||||||||||||||||||||||||
| Provision for credit losses for loans | 1,510 | 2,292 | 2,825 | (103) | (66) | 2 | 6,460 | |||||||||||||||||||||||||||||||||||||
| Recoveries | — | 497 | 1 | — | 12 | 17 | 527 | |||||||||||||||||||||||||||||||||||||
| Less: Charge-offs | — | 596 | — | — | — | 36 | 632 | |||||||||||||||||||||||||||||||||||||
| Ending Balance at December 31, 2023 | $ | 38,074 | $ | 11,089 | $ | 6,787 | $ | 2,152 | $ | 579 | $ | 314 | $ | 58,995 | ||||||||||||||||||||||||||||||
| (Dollars in thousands) | Commercial Real Estate | Commercial and Industrial | Commercial Construction | Residential Mortgage | Home Equity | Consumer | Total | |||||||||||||||||||||||||||||||||||||
| Beginning Balance at December 31, 2021 | $ | 31,847 | $ | 9,574 | $ | 4,090 | $ | 1,405 | $ | 465 | $ | 323 | $ | 47,704 | ||||||||||||||||||||||||||||||
| Provision for credit losses for loans | 4,967 | (710) | (129) | 850 | 157 | 40 | 5,175 | |||||||||||||||||||||||||||||||||||||
| Recoveries | — | 242 | — | — | 11 | 19 | 272 | |||||||||||||||||||||||||||||||||||||
| Less: Charge-offs | 250 | 210 | — | — | — | 51 | 511 | |||||||||||||||||||||||||||||||||||||
| Ending Balance at December 31, 2022 | $ | 36,564 | $ | 8,896 | $ | 3,961 | $ | 2,255 | $ | 633 | $ | 331 | $ | 52,640 | ||||||||||||||||||||||||||||||
Reserve for unfunded commitments
The Company’s reserve for unfunded commitments amounted to $7.1 million as of December 31, 2016 on loans modified as TDRs within the preceding twelve months are detailed below.2023 and $4.3 million at December 31, 2022.
| December 31, 2017 | December 31, 2016 | |||||||||||||
| (Dollars in thousands) | Number of TDRs that defaulted | Post-modification outstanding recorded investment | Number of TDRs that defaulted | Post-modification outstanding recorded investment | ||||||||||
| Commercial real estate | — | $ | — | 1 | $ | 148 | ||||||||
| Commercial and industrial | 2 | 20 | — | — | ||||||||||
| Commercial construction | — | — | — | — | ||||||||||
| Residential mortgages | — | — | — | — | ||||||||||
| Home equity loans and lines | — | — | — | — | ||||||||||
| Consumer | — | — | — | — | ||||||||||
| Total | 2 | $ | 20 | 1 | $ | 148 | ||||||||
Other Real Estate Owned ("OREO")real estate owned
The Company carried no OREO at December 31, 20172023 or December 31, 2016. There2022. During the years ended December 31, 2023, and 2022, there were no additions to or sales or write downs onof OREO. During the year ended December 31, 2021, there was one addition to OREO, during 2017 or 2016. Therewhich was subsequently sold in the same year. For the years ended December 31, 2023, 2022 and 2021, there were $154 thousand gains on OREO sales and no subsequent write downs during 2015.write-downs of OREO.
At December 31, 2017,2023, the Company had $1.2 million in consumer mortgage loans secured by residential real estate properties for which formal foreclosure proceedings were in process according to local requirements of the applicable jurisdictions with carrying amounts totaling $101 thousand compared with $200 thousandjurisdictions. The Company had no such loans at December 31, 2016.2022.
94
(5) Premises and Equipment
| (Dollars in thousands) | 2017 | 2016 | 2015 | |||||||||
| Balance at beginning of year | $ | 31,342 | $ | 29,008 | $ | 27,121 | ||||||
| Provision | 1,430 | 2,993 | 3,267 | |||||||||
| Recoveries | 755 | 709 | 409 | |||||||||
| Less: Charge-offs | 612 | 1,368 | 1,789 | |||||||||
| Balance at end of year | $ | 32,915 | $ | 31,342 | $ | 29,008 | ||||||
| (Dollars in thousands) | Cmml Real Estate | Cmml and Industrial | Cmml Constr | Resid. Mortgage | Home Equity | Cnsmr | Total | |||||||||||||||||||||
| Beginning Balance, December 31, 2016 | $ | 14,902 | $ | 11,204 | $ | 3,406 | $ | 960 | $ | 634 | $ | 236 | $ | 31,342 | ||||||||||||||
| Provision | 2,628 | (1,737 | ) | 541 | (56 | ) | (30 | ) | 84 | 1,430 | ||||||||||||||||||
| Recoveries | 193 | 550 | — | — | 4 | 8 | 755 | |||||||||||||||||||||
| Less: Charge-offs | 178 | 348 | — | — | — | 86 | 612 | |||||||||||||||||||||
| Ending Balance, December 31, 2017 | $ | 17,545 | $ | 9,669 | $ | 3,947 | $ | 904 | $ | 608 | $ | 242 | $ | 32,915 | ||||||||||||||
| Ending allowance balance: | ||||||||||||||||||||||||||||
| Allocated to loans individually evaluated for impairment | $ | 59 | $ | 1,284 | $ | — | $ | 5 | $ | — | $ | 35 | $ | 1,383 | ||||||||||||||
| Allocated to loans collectively evaluated for impairment | $ | 17,486 | $ | 8,385 | $ | 3,947 | $ | 899 | $ | 608 | $ | 207 | $ | 31,532 | ||||||||||||||
| (Dollars in thousands) | Cmml Real Estate | Cmml and Industrial | Cmml Constr | Resid. Mortgage | Home Equity | Cnsmr | Total | |||||||||||||||||||||
| Beginning Balance, December 31, 2015 | $ | 13,514 | $ | 9,758 | $ | 3,905 | $ | 1,061 | $ | 540 | $ | 230 | $ | 29,008 | ||||||||||||||
| Provision | 1,696 | 1,745 | (494 | ) | (101 | ) | 97 | 50 | 2,993 | |||||||||||||||||||
| Recoveries | 20 | 681 | — | — | 3 | 5 | 709 | |||||||||||||||||||||
| Less: Charge-offs | 328 | 980 | 5 | — | 6 | 49 | 1,368 | |||||||||||||||||||||
| Ending Balance, December 31, 2016 | $ | 14,902 | $ | 11,204 | $ | 3,406 | $ | 960 | $ | 634 | $ | 236 | $ | 31,342 | ||||||||||||||
| Ending allowance balance: | ||||||||||||||||||||||||||||
| Allocated to loans individually evaluated for impairment | $ | 370 | $ | 2,222 | $ | 28 | $ | — | $ | — | $ | 1 | $ | 2,621 | ||||||||||||||
| Allocated to loans collectively evaluated for impairment | $ | 14,532 | $ | 8,982 | $ | 3,378 | $ | 960 | $ | 634 | $ | 235 | $ | 28,721 | ||||||||||||||
Premises and equipment at December 31, 2023, and 2022, are summarized as follows:
| (Dollars in thousands) | 2023 | 2022 | ||||||||||||
| Land and land improvements | $ | 9,090 | $ | 9,090 | ||||||||||
| Bank premises and leasehold improvements | 57,899 | 56,266 | ||||||||||||
| Computer software and equipment | 18,636 | 15,636 | ||||||||||||
| Furniture, fixtures, and equipment | 26,362 | 25,118 | ||||||||||||
| Total premises and equipment, before accumulated depreciation | 111,987 | 106,110 | ||||||||||||
| Less accumulated depreciation | (67,056) | (61,882) | ||||||||||||
| Total premises and equipment, net of accumulated depreciation | $ | 44,931 | $ | 44,228 | ||||||||||
| (Dollars in thousands) | 2017 | 2016 | ||||||
| Land | $ | 5,488 | $ | 5,201 | ||||
| Bank premises and leasehold improvements | 42,525 | 37,390 | ||||||
| Computer software and equipment | 9,303 | 9,250 | ||||||
| Furniture, fixtures and equipment | 20,347 | 18,243 | ||||||
| Total premises and equipment, before accumulated depreciation | 77,663 | 70,084 | ||||||
| Less accumulated depreciation | (40,641 | ) | (36,544 | ) | ||||
| Total premises and equipment, net of accumulated depreciation | $ | 37,022 | $ | 33,540 | ||||
Total depreciation expense related to premises and equipment amounted to $4.7$5.3 million, $4.4 million and $4.3 million for both of the years ended December 31, 2017, 20162023, 2022, and 2015, respectively.
(6) Leases
For the Company, material leases consist of operating leases on our facilities, mainly branch leases; leases 12-months or less and 2015 amounted to $1.4 million, $1.3 million and $1.2 million, respectively.immaterial equipment leases have been excluded.
As of December 31, 2023, the Company had 16 active operating real estate leases. The Company's leased facilities are contracted under various non-cancelable operating leases, most of which provide options to the Company to extend the lease periods and include periodic rent adjustments. While the Company typically exercises its option to extend lease terms, the lease contains provisions that allow the Company, upon notification, to terminate the lease at the end of the lease term, or any option period. Several real estate leases also provide the Company the right of first refusal should the property be offered for sale or purchase options at specified periods mutually agreeable tosale.
Lease expenses for the parties. In February 2017, the Company purchased, at fair market value, a property which was previously a leased branch location, the location remains an active full service banking branch.
| (Dollars in thousands) | |||
| Payable in: | |||
| 2018 | $ | 1,609 | |
| 2019 | 1,392 | ||
| 2020 | 1,136 | ||
| 2021 | 1,133 | ||
| 2022 | 1,131 | ||
| Thereafter | 9,285 | ||
| Total minimum lease payments | $ | 15,686 | |
The weighted average remaining lease term for the year endedoperating leases at December 31, 20162023 and $153 thousand for the year ended2022 was 28.4 years and 29.4 years, respectively. The weighted average discount rate was 3.55% and 3.51% at December 31, 2015.2023 and 2022, respectively.
At December 31, 2023, the remaining undiscounted cash flows by year of these lease liabilities were as follows:
| (Dollars in thousands) | Operating Leases | |||||||
| 2024 | $ | 1,450 | ||||||
| 2025 | 1,457 | |||||||
| 2026 | 1,468 | |||||||
| 2027 | 1,474 | |||||||
| 2028 | 1,477 | |||||||
| Thereafter | 31,723 | |||||||
| Total lease payments | $ | 39,049 | ||||||
| Less: Imputed interest | 14,608 | |||||||
| Total lease liability | $ | 24,441 | ||||||
95
(7)Deposits
Deposits at December 31, are summarized as follows:
| (Dollars in thousands) | 2023 | 2022 | ||||||||||||
| Non-interest checking | $ | 1,070,104 | $ | 1,361,588 | ||||||||||
| Interest-bearing checking | 697,632 | 678,715 | ||||||||||||
| Savings | 285,770 | 326,666 | ||||||||||||
| Money market | 1,402,939 | 1,381,645 | ||||||||||||
| CDs $250,000 or less | 295,789 | 187,758 | ||||||||||||
| CDs greater than $250,000 | 225,287 | 99,434 | ||||||||||||
| Deposits | $ | 3,977,521 | $ | 4,035,806 | ||||||||||
| (Dollars in thousands) | 2017 | 2016 | ||||||
| Non-interest bearing demand deposits | $ | 705,846 | $ | 646,115 | ||||
| Interest-bearing checking | 391,111 | 372,696 | ||||||
| Savings | 193,385 | 178,637 | ||||||
| Money market | 807,931 | 844,216 | ||||||
| Certificates of deposit $250,000 or less | 150,445 | 125,580 | ||||||
| Certificates of deposit more than $250,000 | 45,154 | 42,315 | ||||||
| Total customer deposits | 2,293,872 | 2,209,559 | ||||||
Brokered deposits (1) | 147,490 | 59,362 | ||||||
| Total deposits | $ | 2,441,362 | $ | 2,268,921 | ||||
The aggregate amountamounts of overdrawn deposits that have been reclassified as loan balances were $359$498 thousand and $558$490 thousand at December 31, 20172023 and 2016,2022, respectively.
The following table showspresents the scheduled maturities of certificates of deposit (including brokered deposits with weighted average remaining lives of less than 6 months at December 31, 2017 and approximately 1.5 yearsCDs as of December 31, 2016):of the years indicated:
| (Dollars in thousands) | 2023 | 2022 | ||||||||||||
| Due in less than twelve months | $ | 494,320 | $ | 227,658 | ||||||||||
| Due in over one year through two years | 23,737 | 51,392 | ||||||||||||
| Due in over two years through three years | 2,431 | 6,919 | ||||||||||||
| Due in over three years through four years | 371 | 400 | ||||||||||||
| Due in over four years through five years | 179 | 619 | ||||||||||||
| Due in over five years | 38 | 204 | ||||||||||||
| Total CDs | $ | 521,076 | $ | 287,192 | ||||||||||
(8)Borrowed Funds and Subordinated Debt
| (Dollars in thousands) | December 31, 2017 | December 31, 2016 | ||||||
| Due in less than twelve months | $ | 240,995 | $ | 136,695 | ||||
| Due in over one year through two years | 60,692 | 38,344 | ||||||
| Due in over two years through three years | 28,141 | 32,652 | ||||||
| Due in over three years through four years | 6,592 | 8,525 | ||||||
| Due in over four years through five years | 5,614 | 5,721 | ||||||
| Due in over five years | 1,055 | 5,320 | ||||||
| Total certificates of deposit | $ | 343,089 | $ | 227,257 | ||||
Borrowed funds and subordinated debt outstanding at December 31, for the years indicated are summarized as follows:
| 2023 | 2022 | 2021 | ||||||||||||||||||||||||||||||||||||
| (Dollars in thousands) | Amount | Average Rate | Amount | Average Rate | Amount | Average Rate | ||||||||||||||||||||||||||||||||
| FHLB advances | $ | 2,830 | 1.71 | % | $ | 2,913 | 1.71 | % | $ | 5,479 | 1.07 | % | ||||||||||||||||||||||||||
| FRB advances | 20,000 | 4.84 | % | — | — | % | — | — | % | |||||||||||||||||||||||||||||
| Other borrowings | 2,938 | 0.40 | % | 303 | — | % | — | — | % | |||||||||||||||||||||||||||||
| Total borrowed funds | $ | 25,768 | 3.99 | % | $ | 3,216 | 1.55 | % | $ | 5,479 | 1.07 | % | ||||||||||||||||||||||||||
| Subordinated debt | $ | 59,498 | 5.84 | % | $ | 59,182 | 5.66 | % | $ | 58,979 | 5.54 | % | ||||||||||||||||||||||||||
| 2017 | 2016 | 2015 | |||||||||||||||||||
| (Dollars in thousands) | Amount | Average Rate | Amount | Average Rate | Amount | Average Rate | |||||||||||||||
| FHLB borrowings | $ | 89,000 | 1.54 | % | $ | 10,671 | 0.80 | % | $ | 40,671 | 0.51 | % | |||||||||
| Other borrowings | — | — | % | — | — | % | 13,000 | 0.60 | % | ||||||||||||
| Total borrowed funds | $ | 89,000 | 1.54 | % | $ | 10,671 | 0.80 | % | $ | 53,671 | 0.53 | % | |||||||||
| Subordinated debt | 14,847 | 6.23 | % | 14,834 | 6.26 | % | 14,822 | 6.16 | % | ||||||||||||
| Total borrowed funds and subordinated debt | $ | 103,847 | 2.21 | % | $ | 25,505 | 3.98 | % | $ | 68,493 | 1.75 | % | |||||||||
96
At December 31, 2023, 2022 and 2021, the contractual maturity distribution of borrowed funds with athe weighted average rate of 1.59%, and short-term borrowings of $50.0 million, with a weighted average rate of 1.50%, that matured in January 2018.cost for each category is set forth below:
| 2023 | 2022 | 2021 | ||||||||||||||||||||||||||||||||||||
| (Dollars in thousands) | Balance | Rate | Balance | Rate | Balance | Rate | ||||||||||||||||||||||||||||||||
| Within 12 months | $ | 20,000 | 4.84 | % | $ | — | — | % | $ | 2,485 | 0.29 | % | ||||||||||||||||||||||||||
| Between 1 and 5 years | 270 | — | % | — | — | % | — | — | % | |||||||||||||||||||||||||||||
| Over 5 years | 5,498 | 1.09 | % | 3,216 | 1.55 | % | 2,994 | 1.70 | % | |||||||||||||||||||||||||||||
Maximum FHLB and other borrowings outstanding at any month endmonth-end period during 2017, 2016,2023 was $25.8 million, $4.2 million for 2022 and 2015 were $149.3$8.6 million $43.7 million, and $53.7 million, respectively.for 2021.
The following table summarizes the average balance and average cost of borrowed funds for the years indicated.indicated:
| Year ended December 31, | Year ended December 31, | |||||||||||||||||||||||||||||||||||||||||||||||||||||||||||||||||||||||||||||||
| 2017 | 2016 | 2015 | 2023 | 2022 | 2021 | |||||||||||||||||||||||||||||||||||||||||||||||||||||||||||||||||||||||||||
| (Dollars in thousands) | Average Balance | Average Cost | Average Balance | Average Cost | Average Balance | Average Cost | (Dollars in thousands) | Average Balance | Average Cost | Average Balance | Average Cost | Average Balance | Average Cost | |||||||||||||||||||||||||||||||||||||||||||||||||||||||||||||||||||
| FHLB advances | $ | 49,546 | 1.19 | % | $ | 14,551 | 0.55 | % | $ | 10,731 | 0.36 | % | FHLB advances | $ | 3,548 | 2.65 | 2.65 | % | $ | 3,266 | 1.59 | 1.59 | % | $ | 7,632 | 0.79 | 0.79 | % | ||||||||||||||||||||||||||||||||||||||||||||||||||||
| FRB advances | ||||||||||||||||||||||||||||||||||||||||||||||||||||||||||||||||||||||||||||||||
| FRB advances | ||||||||||||||||||||||||||||||||||||||||||||||||||||||||||||||||||||||||||||||||
| FRB advances | 534 | 3.39 | % | — | — | % | — | — | % | |||||||||||||||||||||||||||||||||||||||||||||||||||||||||||||||||||||||
| Other borrowings | — | — | % | 107 | 0.61 | % | 36 | 0.61 | % | Other borrowings | 1,008 | 0.13 | 0.13 | % | 20 | — | — | % | — | — | — | % | ||||||||||||||||||||||||||||||||||||||||||||||||||||||||||
| Total borrowed funds | $ | 49,546 | 1.19 | % | $ | 14,658 | 0.55 | % | $ | 10,767 | 0.36 | % | Total borrowed funds | $ | 5,090 | 2.23 | 2.23 | % | $ | 3,286 | 1.58 | 1.58 | % | $ | 7,632 | 0.79 | 0.79 | % | ||||||||||||||||||||||||||||||||||||||||||||||||||||
As a member of the FHLB, the Bank has the potential capacity to borrow an amount up to the value of its discounted qualified collateral. Borrowings from the FHLB are secured by certain securities from the Company’sCompany's investment portfolio not otherwise pledged and certain residential and commercial real estate loans. At December 31, 2017,2023, based on qualifying collateral less outstanding advances, the Bank had the capacity to borrow additional funds from the FHLB of up to approximately $415.0 million.$860.0 million. In addition, based on qualifying corporate and municipal bond collateral, the Bank had the capacity to borrow funds from the FRB Discount Window up to approximately $120.0$320.0 million at December 31, 2017.2023. The Bank also has pre-approved borrowing arrangements with large correspondent banks in order to provide overnight and short-term borrowing capacity.
The Company also carriedhad outstanding subordinated debt, of $14.8 million (netnet of deferred issuance costs)costs, of $59.5 million, and $59.2 million at December 31, 2017 December 31, 20162023, and December 31, 2015, which consisted2022, respectively. The debt consists of $15.0 millionfixed-to-floating rate notes due in aggregate principal amount of Fixed-to-Floating Rate Subordinated Notes (the "Notes"), issued in January 2015, in a private placement to an accredited investor.2030 and callable at the Company's option on or after July 15, 2025. The Notessubordinated notes are intended to qualify as Tier 2 capital for regulatory purposes, mature on January 30, 2030 (the "Maturity Date") and are callable by the Company, subject to regulatory approval, at a premium beginning January 30, 2020, and at par beginning January 30, 2025. purposes.
The Notessubordinated notes pay interest at a fixed rate of 6.00%5.25% per annum through January 30,July 15, 2025, and beginning on January 31, 2025 through the Maturity Date, or any early redemption date, the
97
(9)Derivatives and Hedging Activities
The tables below present a portionsummary of the proceeds fromCompany's derivative financial instruments, notional amounts and fair values for the $15.0 million in Notes, to redeem the $10.8 million junior subordinated debt previously held by the Company.periods presented:
| As of December 31, 2023 | ||||||||||||||||||||||||||
| (Dollars in thousands) | Asset Notional Amount | Asset Derivatives(1)(2) | Liability Notional Amount | Liability Derivatives(1)(2) | ||||||||||||||||||||||
| Derivatives designated as hedging instruments | ||||||||||||||||||||||||||
| Interest-rate contracts - pay fixed, receive floating | $ | — | $ | — | $ | 100,000 | $ | 760 | ||||||||||||||||||
| Total cash flow hedge interest-rate swaps | $ | — | $ | — | $ | 100,000 | $ | 760 | ||||||||||||||||||
| Derivatives not subject to hedge accounting | ||||||||||||||||||||||||||
| Interest-rate contracts - pay floating, receive fixed | $ | — | $ | — | $ | 7,524 | $ | 630 | ||||||||||||||||||
| Interest-rate contracts - pay fixed, receive floating | 7,524 | 630 | — | — | ||||||||||||||||||||||
| Risk participation agreements sold | — | — | 46,910 | 65 | ||||||||||||||||||||||
| Total derivatives not subject to hedge accounting | $ | 7,524 | $ | 630 | $ | 54,434 | $ | 695 | ||||||||||||||||||
| As of December 31, 2022 | ||||||||||||||||||||||||||
| (Dollars in thousands) | Asset Notional Amount | Asset Derivatives(1)(2) | Liability Notional Amount | Liability Derivatives(1)(2) | ||||||||||||||||||||||
| Derivatives not subject to hedge accounting | ||||||||||||||||||||||||||
| Interest-rate contracts - pay floating, receive fixed | $ | — | $ | — | $ | 7,777 | $ | 782 | ||||||||||||||||||
| Interest-rate contracts - pay fixed, receive floating | 7,777 | 782 | — | — | ||||||||||||||||||||||
| Risk participation agreements sold | — | — | 24,660 | 73 | ||||||||||||||||||||||
| Total back-to-back interest-rate swaps | $ | 7,777 | $ | 782 | $ | 32,437 | $ | 855 | ||||||||||||||||||
(2) The assets and liabilities related to the pay fixed, receive floating interest-rate contracts are subject to a master netting agreement and are presented net in the Consolidated Balance Sheet.
Derivatives designated as hedging instruments
Fair value of these derivatives based on current secondary mortgage market prices. At December 31, 2017 and 2016, the estimatedhedges
Derivatives designated as fair value hedges are utilized to mitigate the risk of the Company'sadverse interest-rate lock commitments and commitments to sell these mortgage loans were deemed immaterial.
During the year ended December 31, 2023, the Company entered into three pay fixed, receive float, interest rate swap agreements all with a 2-year term. As of December 31, 2023, these interest rate swap agreements had a combined notional value of $100.0 million. Each interest rate swap agreement was designated as a fair value hedge and involves the net settlement of receiving floating-rate payments from a counterparty in exchange for the Company making fixed-rate payments over the life of the agreements without exchange of the underlying notional amount.
The table below presents the carrying amount of hedged items and cumulative fair value hedging basis adjustments for the periods presented. There were no fair value hedges outstanding at December 31, 20172022.
| As of December 31, 2023 | ||||||||||||||||||||||||||
| (Dollars in thousands) | Balance Sheet Location of Hedged Item | Carrying Amount of Hedged Assets | Cumulative Amount of Fair Value Hedging Adjustment Included in the Carrying Amount of the Hedged Assets | |||||||||||||||||||||||
| Interest-rate contracts - loans | Loans | $ | 100,755 | $ | 755 | |||||||||||||||||||||
98
The table below presents the gains (losses) from interest rate derivatives accounted for as fair value hedges and 2016.the related hedged items.
| (Dollars in thousands) | Affected Income Statement Line Item | December 31, 2023 | ||||||||||||
| Derivatives designated as fair value hedges: | ||||||||||||||
| Fair value adjustments on derivatives | Net interest income | $ | (760) | |||||||||||
| Fair value adjustments on hedged instrument | Net interest income | 755 | ||||||||||||
| Total | $ | (5) | ||||||||||||
Derivatives not subject to hedge accounting
Interest-rate Contracts
The Company has a "Back-to-Back Swap" program whereby the Bank enters into an interest-rate swap with a qualified commercial banking customercustomers and simultaneously enters into an equal and opposite interest-rate swap with a swap counterparty. The customer interest-rate swap agreement allows commercial banking customers to convert a floating-rate loan payment to a fixed-rate payment.
Interest-rate swaps with the counterparty are subject to master netting agreements, while interest-rate swaps with customers are not. At December 31, 2016 or December 31, 2015.
The Company enters into RPAs for which the line item prepaid expenses and other assets and liability derivatives are included in the accrued expenses and other liabilities line item on the consolidated balance sheets, respectively.
Credit Risk
| As of December 31, 2017 | As of December 31, 2016 | |||||||||||||||
| (Dollars in thousands) | Asset Derivatives | Liability Derivatives | Asset Derivatives | Liability Derivatives | ||||||||||||
| Interest-rate contracts - pay floating, received fixed | $ | 25 | $ | 568 | $ | — | $ | 610 | ||||||||
| Interest-rate contracts - pay fixed, receive floating | 543 | — | 610 | — | ||||||||||||
| Total interest rate swaps | $ | 568 | $ | 568 | $ | 610 | $ | 610 | ||||||||
By using derivative financial instruments, the Company exposes itself to counterparty-creditcounterparty credit risk. Credit risk is the risk of failure by the counterparty to perform under the terms of the derivative contract. When the fair value of a derivative contract is positive, the counterparty owes the Company, which creates credit risk for the Company. When the fair value of a derivative is negative, the Company owes the counterparty and, therefore, it does not possess credit risk. The credit risk in derivative instruments is mitigated by entering into transactions with highly-ratedhighly rated counterparties that management believes to be creditworthy. The counterparty was rated A / A2 by S&P and Moody’s, respectively, at December 31, 2017. Additionally, counterparty interest-rate swaps contain provisions for collateral to be posted if the derivative exposure exceeds a threshold amount.
The Company had two active interest-rate swap institutional counterparties which were rated A and A+ by S&P Global Ratings, respectively, and both of which were rated A2 by Moody's Investor Services at December 31, 2023. When the Company has credit risk exposure, amounting to $543 thousand and $610 thousand at December 31, 2017 and December 31, 2016 respectively, relating to interest-rate swaps with counterparties. The Company held cash collateral of $480 thousand at December 31, 2017, and none at December 31, 2016. Collateral heldis posted by the Companycounterparty. Collateral posted by counterparties is restricted and not considered an asset of the Company. ThereforeCompany, therefore, it is not carried on the Company's consolidated balance sheet.Consolidated Balance Sheets. If the Company posts collateral, the restricted cash is carried on the Company's Consolidated Balance Sheets.
$27 thousand.
99
| As of December 31, 2017 | ||||||||||||
| (Dollars in thousands) | Gross Amounts of Recognized Asset | Gross Amounts Offset in the Statement of Financial Position | Net Amounts of Assets Presented in the Statement of Financial Position | |||||||||
| Asset Derivatives | ||||||||||||
| Interest-rate contracts - pay fixed, receive floating | $ | 568 | $ | 25 | $ | 543 | ||||||
| As of December 31, 2016 | ||||||||||||
| (Dollars in thousands) | Gross Amounts of Recognized Assets | Gross Amounts Offset in the Statement of Financial Position | Net Amounts of Assets Presented in the Statement of Financial Position | |||||||||
| Asset Derivatives | ||||||||||||
| Interest-rate contracts - pay fixed, receive floating | $ | 610 | $ | — | $ | 610 | ||||||
Credit-risk-related Contingent Features
The Company's interest-rate swaps with counterparties contain credit-risk-related contingent provisions. These provisions provide the counterparty with the right to terminate its derivative positions and require the Company to settle its obligations under the agreements if the Company defaults on certain of its indebtedness.
Other Derivative Related Activity
Interest-rate lock commitments related to the swap agreements. Underorigination of mortgage loans that will be sold are considered derivative instruments. The commitments to sell loans are also considered derivative instruments. At December 31, 2023 and December 31, 2022, the terms of the loan participations, the Company has accepted contingent liabilities that would only be realized if the swaps were terminated early and there were outstanding losses not covered by the underlying borrowers and the borrowers' pledged collateral. If applicable, the Company's swap-loss exposure would be equal to the percentageestimated fair value of the Company's participation in the underlying loan appliedinterest-rate lock commitments and commitments to the originating bank's swap loss. At December 31, 2017 and December 31, 2016, the Company had two such participationsell these mortgage loans and management considers the risk of material swap-loss exposure to be unlikely based on the borrower's financial and collateral strength.were deemed immaterial.
(10)Commitments, Contingencies and Financial Instruments with Off-Balance Sheet Risk and Concentrations of Credit Risk" for additional information on the Company's commitments and contingencies.
The Company is party to financial instruments with off-balance sheet risk in the normal course of business to meet the financing needs of its customers. These financial instruments include commitments to originate loans, letters of credit, and unadvanced portions of loans and lines of credit.
The instruments involve, to varying degrees, elements of credit risk in excess of the amount recognized in the consolidated balance sheets.Consolidated Balance Sheets. The contractual amounts of these instruments reflect the extent of involvement the Company has in the particular classes of financial instruments.
The Company’sCompany's exposure to credit loss in the event of nonperformance by the other party to the financial instrument for loan commitments and letters of credit is represented by the contractual amounts of those instruments. The Company uses the same credit policies in making commitments and conditional obligations as it does for on-balance sheet instruments.
Financial instruments with off-balance sheet credit risk at December 31, 20172023 and 20162022 are as follows:
| (Dollars in thousands) | 2023 | 2022 | ||||||||||||
| Commitments to originate loans | $ | 41,326 | $ | 27,148 | ||||||||||
| Commitments to originate residential mortgages loans for sale | — | 170 | ||||||||||||
| Commitments to sell residential mortgage loans | 200 | 170 | ||||||||||||
| Letters of credit | 15,610 | 25,081 | ||||||||||||
| Unadvanced portions of commercial real estate loans | 87,943 | 43,938 | ||||||||||||
| Unadvanced portions of commercial loans and lines | 633,702 | 629,531 | ||||||||||||
| Unadvanced portions of construction loans (commercial & residential) | 540,269 | 409,803 | ||||||||||||
| Unadvanced portions of home equity lines | 156,216 | 146,558 | ||||||||||||
| Unadvanced portions of consumer loans | 3,679 | 4,059 | ||||||||||||
| (Dollars in thousands) | 2017 | 2016 | ||||||
| Commitments to originate loans | $ | 13,830 | $ | 37,753 | ||||
| Commitments to originate residential mortgages loans for sale | 2,078 | 1,946 | ||||||
| Commitments to sell residential mortgage loans | 2,286 | 3,115 | ||||||
| Letters of credit | 21,576 | 21,497 | ||||||
| Unadvanced portions of commercial real estate loans | 26,947 | 56,952 | ||||||
| Unadvanced portions of commercial loans and lines | 432,731 | 399,833 | ||||||
| Unadvanced portions of construction loans (commercial & residential) | 209,916 | 151,757 | ||||||
| Unadvanced portions of home equity lines | 94,012 | 82,884 | ||||||
| Unadvanced portions of consumer loans | 4,290 | 3,043 | ||||||
Commitments to originate loans are agreements to lend to a customer provided there is no violation of any condition established in the contract. Commitments generally have fixed expiration dates or other termination clauses and may require payment of a fee by the customer. Since some of the commitments are expected to expire without being drawn upon, the total commitment amounts do not necessarily represent future cash requirements. The Company evaluates each customer’scustomer's credit worthiness on a case-by-case basis. The amount of collateral obtained, if deemed necessary by the Company upon extension of credit, is based on management’s credit evaluation of the borrower.
The Company originates residential mortgage loans intended for sale under agreements to sell such loans on an individual loan basis and may retain or sell the servicing when selling the loans. Loans sold are subject to standard secondary market underwriting and eligibility representations and warranties over the life of the loan and are subject to an early payment default period covering the first four payments for certain loan sales.
100
Letters of credit are conditional commitments issued by the Company to guarantee the financial obligation or performance of a customer to a third party.third-party. The credit risk involved in issuing letters of credit is essentially the same as that involved in extending loan facilities to customers. If the letter of credit is drawn upon, a loan is created for the customer, generally a commercial loan, with the same criteria associated with similar commercial loans.
Unadvanced portions of loans and lines of credit represent credit extended to customers but not yet drawn upon and are secured or guaranteed under preexisting loan agreements and credit evaluations having taken into consideration the full commitment amount.
See also Note 8,9, "Derivatives and Hedging Activities"Activities," and Note 1, "Summary of Significant Accounting Policies," under Item (p), "Derivatives," to the Company's consolidated financial statements of this Form 10-K, contained above, for information on the Company's interest-rate lock commitments,
interest-rate swaps, and participation in loans originated by third-party banks with potential contingent liabilities.
There are no material pending legal proceedings to which the Company or its subsidiaries are a party or to which any of its property is subject, other than ordinary and routine litigation incidental to the business of the Company. Management does not believe resolution of any present litigation will have a material adverse effect on the consolidated financial condition or results of operations of the Company.
(11)Comprehensive Income (Loss)
The following table presents a reconciliation of the changes in the components of other comprehensive income (loss) for the dates indicated, including the amount of income tax (expense) benefit allocated to each component of other comprehensive income (loss):
| Year ended December 31, 2023 | Year ended December 31, 2022 | |||||||||||||||||||||||||||||||||||||
| (Dollars in thousands) | Pre-Tax | Tax (Expense) Benefit | After Tax Amount | Pre-Tax | Tax Benefit | After Tax Amount | ||||||||||||||||||||||||||||||||
| Change in fair value of debt securities | $ | 18,838 | $ | (4,279) | $ | 14,559 | $ | (132,005) | $ | 29,782 | $ | (102,223) | ||||||||||||||||||||||||||
| Less: net security (losses) gains reclassified into non-interest income | (2,419) | 534 | (1,885) | (1,973) | 619 | (1,354) | ||||||||||||||||||||||||||||||||
| Net change in fair value of debt securities | 21,257 | (4,813) | 16,444 | (130,032) | 29,163 | (100,869) | ||||||||||||||||||||||||||||||||
| Total other comprehensive income (loss), net | $ | 21,257 | $ | (4,813) | $ | 16,444 | $ | (130,032) | $ | 29,163 | $ | (100,869) | ||||||||||||||||||||||||||
Information on the Company's accumulated other comprehensive loss, net of tax, is comprised of the following components as of the periods indicated:
| Year ended December 31, 2023 | Year ended December 31, 2022 | |||||||||||||||||||||||||||||||||||||
| (Dollars in thousands) | Unrealized Gains (Losses) on Debt Securities | Total | Unrealized Gains (Losses) on Debt Securities | Total | ||||||||||||||||||||||||||||||||||
| Accumulated other comprehensive (loss) income - beginning balance | $ | (96,207) | $ | (96,207) | $ | 4,662 | $ | 4,662 | ||||||||||||||||||||||||||||||
| Total other comprehensive income (loss), net | 16,444 | 16,444 | (100,869) | (100,869) | ||||||||||||||||||||||||||||||||||
| Accumulated other comprehensive loss - ending balance | $ | (79,763) | $ | (79,763) | $ | (96,207) | $ | (96,207) | ||||||||||||||||||||||||||||||
(12)Shareholders' Equity
Shares Authorized and Share Issuance
The Company’sCompany's authorized capital is divided into common stock and preferred stock. At the Company's annual meeting of shareholders held on May 2, 2017, shareholders voted to amend the Company's Restated Articles of Organization to increase the number of shares of common stock that the Company is authorized to issue from 20,000,000 shares to 40,000,000 shares. The Company is authorized to issue 1,000,00040,000,000 shares of preferred stock.
common stock, with a par value of $0.01 per share, and as of December 31, 2023 had 12,272,674 shares issued and outstanding. Holders of common stock are entitled to one vote per share and are entitled to receive dividends if, as and when declared by the Board. Dividend and liquidation rights of the common stock may be subject to the rights of any outstanding preferred stock. The Company is also authorized to issue 1,000,000 shares of preferred stock, with a par value of
101
$0.01 per share. No preferred stock has been issued as of the date of this Form 10-K.
The Company has a shareholdersshareholders' rights plan,plan. Under the terms of which were extended in January 2018. Under this extended plan, each share of common stock includes a right to purchase under certain circumstances one one-hundredth of a share of the Company’sCompany's Series A Junior Participating Preferred Stock, par value $0.01 per share, at a purchase price of $122.50 per one one-hundredth of a preferred share, subject to adjustment, or, in certain circumstances, to receive cash, property, shares of common stock or other securities of the Company. The rights are not presently exercisable and remain attached to the shares of common stock until the occurrence of certain triggering events that would ordinarily be associated with an unsolicited acquisition or attempted acquisition of 10% or more of the Company’sCompany's outstanding shares of common stock. The rights have no voting or dividend privileges, and unless and until they become exercisable, have no dilutive effect on the earnings of the Company. The rights will expire, unless earlier redeemed, exchanged, or otherwise rescinded by the Company, on January 13, 2028.
The Company's stock incentive plans permit the Board to grant, under various terms, stock options (for the purchase of newly issued shares of common stock), common stock, restricted stock awards, restricted stock units and stock appreciation rights to officers and other employees, non-employee directors and consultants.
Capital Raised and Capital Adequacy Requirements
Capital planning by the Company and the Bank considers current needs and anticipated future growth. Historically, the primary sources of capital for the Company and the Bank have been common stock issuances and proceeds from the issuance of subordinated debt. Ongoing sources of capital include the retention of earnings, less dividends paid, proceeds from the exercise of employee stock options and proceeds from purchases of shares pursuant to the Company’s dividend reinvestment planDRSPP. Additional sources of capital for the Company and directthe Bank have been proceeds from the issuance of common stock purchase plan (together,and proceeds from the "DRSPP").issuance of subordinated debt. The Company believes its current capital is adequate to support ongoing operations.
Management believes, as of December 31, 2017,2023, that the Company and the Bank met all capital adequacy requirements to which they were subject. As of December 31, 20172023 and December 31, 2016,2022, the Company met the definition of "well-capitalized" under the applicable Federal Reserve Board regulations and the Bank qualified as "well-capitalized" under the prompt corrective action regulations of Basel III and the FDIC.
The Company's and the Bank's actual capital amounts and ratios are presented as of December 31, 20172023 and December 31, 20162022 in the tables below:
| Actual | Minimum Capital for Capital Adequacy Purposes(1) | Minimum Capital to be Well-Capitalized(2) | ||||||||||||||||||||||||||||||||||||
| (Dollars in thousands) | Amount | Ratio | Amount | Ratio | Amount | Ratio | ||||||||||||||||||||||||||||||||
| As of December 31, 2023 | ||||||||||||||||||||||||||||||||||||||
| The Company | ||||||||||||||||||||||||||||||||||||||
| Total Capital to risk-weighted assets | $ | 511,692 | 13.12 | % | $ | 312,035 | 8.00 | % | N/A | N/A | ||||||||||||||||||||||||||||
| Tier 1 Capital to risk-weighted assets | 403,224 | 10.34 | % | 234,026 | 6.00 | % | N/A | N/A | ||||||||||||||||||||||||||||||
| Tier 1 Capital to average assets (or Leverage Ratio) | 403,224 | 8.74 | % | 184,471 | 4.00 | % | N/A | N/A | ||||||||||||||||||||||||||||||
| Common Equity Tier 1 Capital to risk-weighted assets | 403,224 | 10.34 | % | 175,520 | 4.50 | % | N/A | N/A | ||||||||||||||||||||||||||||||
| The Bank | ||||||||||||||||||||||||||||||||||||||
| Total Capital to risk-weighted assets | $ | 510,645 | 13.09 | % | $ | 312,035 | 8.00 | % | $ | 390,044 | 10.00 | % | ||||||||||||||||||||||||||
| Tier 1 Capital to risk-weighted assets | 461,675 | 11.84 | % | 234,026 | 6.00 | % | 312,035 | 8.00 | % | |||||||||||||||||||||||||||||
| Tier 1 Capital to average assets (or Leverage Ratio) | 461,675 | 10.01 | % | 184,471 | 4.00 | % | 230,589 | 5.00 | % | |||||||||||||||||||||||||||||
| Common Equity Tier 1 Capital to risk-weighted assets | 461,675 | 11.84 | % | 175,520 | 4.50 | % | 253,528 | 6.50 | % | |||||||||||||||||||||||||||||
102
| Actual | Minimum Capital for Capital Adequacy Purposes(1) | Minimum Capital to be Well-Capitalized(2) | ||||||||||||||||||||||||||||||||||||
| (Dollars in thousands) | Amount | Ratio | Amount | Ratio | Amount | Ratio | ||||||||||||||||||||||||||||||||
| As of December 31, 2022 | ||||||||||||||||||||||||||||||||||||||
| The Company | ||||||||||||||||||||||||||||||||||||||
| Total Capital to risk-weighted assets | $ | 476,307 | 13.49 | % | $ | 282,567 | 8.00 | % | N/A | N/A | ||||||||||||||||||||||||||||
| Tier 1 Capital to risk-weighted assets | 372,817 | 10.56 | % | 211,926 | 6.00 | % | N/A | N/A | ||||||||||||||||||||||||||||||
| Tier 1 Capital to average assets (or Leverage Ratio) | 372,817 | 8.10 | % | 184,194 | 4.00 | % | N/A | N/A | ||||||||||||||||||||||||||||||
| Common Equity Tier 1 Capital to risk-weighted assets | 372,817 | 10.56 | % | 158,944 | 4.50 | % | N/A | N/A | ||||||||||||||||||||||||||||||
| The Bank | ||||||||||||||||||||||||||||||||||||||
| Total Capital to risk-weighted assets | $ | 475,668 | 13.47 | % | $ | 282,567 | 8.00 | % | $ | 353,209 | 10.00 | % | ||||||||||||||||||||||||||
| Tier 1 Capital to risk-weighted assets | 431,359 | 12.21 | % | 211,926 | 6.00 | % | 282,567 | 8.00 | % | |||||||||||||||||||||||||||||
| Tier 1 Capital to average assets (or Leverage Ratio) | 431,359 | 9.37 | % | 184,194 | 4.00 | % | 230,243 | 5.00 | % | |||||||||||||||||||||||||||||
| Common Equity Tier 1 Capital to risk-weighted assets | 431,359 | 12.21 | % | 158,944 | 4.50 | % | 229,586 | 6.50 | % | |||||||||||||||||||||||||||||
(1) Before application of the capital conservation buffer of 2.50%. See discussion below.
(2) For the Bank to qualify as "well-capitalized," it must maintain at least the minimum ratios listed under the regulatory prompt corrective action framework. This framework does not apply to the Company.
| Actual | Minimum Capital for Capital Adequacy Purposes(1) | Minimum Capital To Be Well Capitalized(2) | |||||||||||||||||||
| (Dollars in thousands) | Amount | Ratio | Amount | Ratio | Amount | Ratio | |||||||||||||||
| As of December 31, 2017 | |||||||||||||||||||||
| The Company | |||||||||||||||||||||
| Total Capital (to risk weighted assets) | $ | 270,826 | 11.21 | % | $ | 193,327 | 8.00 | % | N/A | N/A | |||||||||||
| Tier 1 Capital (to risk weighted assets) | 225,738 | 9.34 | % | 144,995 | 6.00 | % | N/A | N/A | |||||||||||||
| Tier 1 Capital (to average assets) or Leverage Ratio | 225,738 | 8.22 | % | 109,838 | 4.00 | % | N/A | N/A | |||||||||||||
| Common equity tier 1 capital (to risk-weighted assets) | 225,738 | 9.34 | % | 108,747 | 4.50 | % | N/A | N/A | |||||||||||||
| The Bank | |||||||||||||||||||||
| Total Capital (to risk weighted assets) | $ | 270,150 | 11.18 | % | $ | 193,301 | 8.00 | % | $ | 241,626 | 10.00 | % | |||||||||
| Tier 1 Capital (to risk weighted assets) | 239,910 | 9.93 | % | 144,976 | 6.00 | % | 193,301 | 8.00 | % | ||||||||||||
| Tier 1 Capital (to average assets) or Leverage Ratio | 239,910 | 8.74 | % | 109,837 | 4.00 | % | 137,296 | 5.00 | % | ||||||||||||
| Common equity tier 1 capital (to risk-weighted assets) | 239,910 | 9.93 | % | 108,732 | 4.50 | % | 157,057 | 6.50 | % | ||||||||||||
| Actual | Minimum Capital for Capital Adequacy Purposes(1) | Minimum Capital To Be Well Capitalized(2) | |||||||||||||||||||
| (Dollars in thousands) | Amount | Ratio | Amount | Ratio | Amount | Ratio | |||||||||||||||
| As of December 31, 2016 | |||||||||||||||||||||
| The Company | |||||||||||||||||||||
| Total Capital (to risk weighted assets) | $ | 252,552 | 11.79 | % | $ | 171,337 | 8.00 | % | N/A | N/A | |||||||||||
| Tier 1 Capital (to risk weighted assets) | 209,887 | 9.80 | % | 128,503 | 6.00 | % | N/A | N/A | |||||||||||||
| Tier 1 Capital (to average assets) or Leverage Ratio | 209,887 | 8.34 | % | 100,628 | 4.00 | % | N/A | N/A | |||||||||||||
| Common equity tier 1 capital (to risk-weighted assets) | 209,887 | 9.80 | % | 96,377 | 4.50 | % | N/A | N/A | |||||||||||||
| The Bank | |||||||||||||||||||||
| Total Capital (to risk weighted assets) | $ | 250,893 | 11.71 | % | $ | 171,332 | 8.00 | % | $ | 214,166 | 10.00 | % | |||||||||
| Tier 1 Capital (to risk weighted assets) | 223,062 | 10.42 | % | 128,499 | 6.00 | % | 171,332 | 8.00 | % | ||||||||||||
| Tier 1 Capital (to average assets) or Leverage Ratio | 223,062 | 8.87 | % | 100,627 | 4.00 | % | 125,784 | 5.00 | % | ||||||||||||
| Common equity tier 1 capital (to risk-weighted assets) | 223,062 | 10.42 | % | 96,374 | 4.50 | % | 139,208 | 6.50 | % | ||||||||||||
dips into its capital conservation buffer it may be restricted in its activities, including its ability to pay dividends and discretionary bonus payments to its executive officers. Both the Company's and the Bank's actual ratios, as outlined in the table above, would exceedexceeded the Basel III risk-based capital requirement with fullthe capital conservation buffer as of December 31, 2017.2023.
The Basel III minimum capital ratio requirements as applicable to the Company and the Bank in 2019 afterwith the full phase-in periodcapital conservation buffer are summarized in the table below:
| Basel III Minimum for Capital Adequacy Purposes | Basel III Additional Capital Conservation Buffer | Basel III "Adequate" Ratio with Capital Conservation Buffer | ||||||||||||||||||
| Total Capital to RWA | 8.00% | 2.50% | 10.50% | |||||||||||||||||
| Tier 1 Capital to RWA | 6.00% | 2.50% | 8.50% | |||||||||||||||||
| Tier 1 Capital to AA, or Leverage Ratio | 4.00% | N/A | 4.00% | |||||||||||||||||
| Common equity tier 1 capital to RWA | 4.50% | 2.50% | 7.00% | |||||||||||||||||
| Basel III Minimum for Capital Adequacy Purposes | Basel III Additional Capital Conservation Buffer | Basel III "Adequate" Ratio with Capital Conservation Buffer | ||||
| Total Capital (to risk weighted assets) | 8.00% | 2.50% | 10.50% | |||
| Tier 1 Capital (to risk weighted assets) | 6.00% | 2.50% | 8.50% | |||
| Tier 1 Capital (to average assets) or Leverage Ratio | 4.00% | —% | 4.00% | |||
| Common equity tier 1 capital (to risk-weighted assets) | 4.50% | 2.50% | 7.00% | |||
Failure to meet minimum capital requirements can initiate or result in certain mandatory and possibly additional discretionary supervisory actions by regulators that, if undertaken, could have a material adverse effect on the Company’sCompany's consolidated financial statements. Under applicable capital adequacy requirements and the regulatory framework for prompt corrective action applicable to the Bank, the Company must meet specific capital guidelines that involve quantitative measures of the Company’sCompany's assets, liabilities, and certain off-balance sheet items as calculated under regulatory accounting practices. The Company’sCompany's capital amounts and classifications are also subject to qualitative judgments by the regulators about components, risk weightings, and other factors.
103
Contents
ENTERPRISE BANCORP, INCINC.
Notes to the Consolidated Financial Statements
Dividends
For the year ended December 31, 2017,2023, the Company declared and paid $6.2$11.2 million in cash dividends. Stockholdersdividends and shareholders utilized the dividend reinvestment portion of the DRSPP to purchase an aggregate of 44,75250,443 shares of the Company's common stock totaling $1.5 million. The direct purchase component of the DRSPP was used by stockholders to purchase 2,014 shares of the Company's common stock totaling $70 thousand duringDuring the year ended December 31, 2017.
$1.4 million. In 2015,2021, the Company declared and paid $5.2$8.9 million in cash dividends. Stockholdersdividends and shareholders utilized the dividend reinvestment portion of the DRSPP to purchase 58,529 shares of the Company’s common stock totaling $1.3 million. The direct purchase component of the DRSPP was used by stockholders to purchase 6,70036,651 shares of the Company's common stock totaling $150 thousand during$1.3 million. See "Shares Authorized and Share Issuance" above in this Note 12 of this Form 10-K for more information on the year ended December 31, 2015.DRSPP, including the direct stock purchase component of the plan.
Defined Contribution Plans
The Company has a 401(k) defined contribution employee benefit plan. The 401(k) plan allows eligible employees to contribute a percentage of their earnings to the plan. A portion of the employeean employee's contribution, as determined by the Compensation and Human Resources Committee of the Board of Directors, is matched by the Company. In 2017, 2016During the years ended December 31, 2023, 2022 and 2015,2021 the Company’sCompany's percentage match was 60%70% up to the first 6% contributed by the employee.
All eligible employees, at least 18 years of age and completing 1 hour of service, may participate in the 401(k) plan. Effective during the fourth quarter of 2017, vestingVesting for the Company’sCompany's 401(k) retirement plan matching contribution is based on years of service with participants becoming 25% vested on the anniversary of their hire date and each subsequent year until they are 100% vestingvested following four years of service. Unvested amounts not distributabledistributed to an employee following termination of employment are used to offset plan expenses and the Company's matching contributions.
The Company’sCompany's expense for the 401(k) plan match was $965 thousand, $938 thousand$2.1 million, $1.9 million, and $859 thousand,$1.7 million, respectively, for the years ended December 31, 2017, 2016,2023, 2022 and 2015.2021, respectively.
Additionally, the Company maintains the Enterprise Bank Supplemental Executive Retirement and Deferred Compensation Plan. The plan is unfunded and is maintained for the purpose of providing deferred compensation to a certain group of management employees. Total expenses for the deferred compensation plan were $315 thousand and $787 thousand for the years ended December 31, 2023 and 2022, respectively.
Supplemental Employee Retirement Plan ("SERP")
The Company has salary continuation agreements with two of its current executive officers and one former executive officer. These salary continuation agreements provide for predetermined fixed-cash supplemental retirement benefits to be provided for a period of 20 years after each individual reaches a defined “benefit"benefit age.”" The individuals covered under the SERP have reached the defined benefit age and are receiving payments under the plan.SERP. Additionally, the Company has not recognized service costs in the current or prior year as each officer had previously attained their individually defined benefit age and was fully vested under the plan.SERP.
This non-qualified plan represents a direct liability of the Company, and as such, the Company has no specific assets set aside to settle the benefit obligation. The funded status is the aggregate amount accrued, or the "accumulated benefit obligation," which is equal to the present value of the benefits to be provided to the employee or any beneficiary. Because the Company’sCompany's benefit obligations provide for predetermined fixed-cash payments, the Company does not have any unrecognized costs to be included as a component of accumulated other comprehensive income.
The amounts charged to expense for this planthe SERP are included in the table below. The Company anticipates accruing an additional $104$58 thousand to the SERP for the year ending December 31, 2018.2024.
104
The following table provides a reconciliation of the changes in the supplemental retirement benefit obligation and the net periodic benefit cost for the years ended December 31:
| (Dollars in thousands) | 2023 | 2022 | 2021 | |||||||||||||||||
| Reconciliation of benefit obligation: | ||||||||||||||||||||
| Benefit obligation at beginning of year | $ | 1,420 | $ | 1,708 | $ | 1,923 | ||||||||||||||
| Net periodic benefit cost: | ||||||||||||||||||||
| Interest cost | 69 | 74 | 61 | |||||||||||||||||
| Actuarial gain | (21) | (86) | — | |||||||||||||||||
| Net periodic benefit costs | $ | 48 | $ | (12) | $ | 61 | ||||||||||||||
| Benefits paid | (276) | (276) | (276) | |||||||||||||||||
| Benefit obligation at end of year | $ | 1,192 | $ | 1,420 | $ | 1,708 | ||||||||||||||
| Funded status: | ||||||||||||||||||||
| Accrued liability as of December 31 | $ | (1,192) | $ | (1,420) | $ | (1,708) | ||||||||||||||
Discount rate used for benefit obligation(1) | 5.25 | % | 4.75 | % | 3.25 | % | ||||||||||||||
| (Dollars in thousands) | 2017 | 2016 | 2015 | |||||||||
| Reconciliation of benefit obligation: | ||||||||||||
| Benefit obligation at beginning of year | $ | 2,502 | $ | 2,654 | $ | 2,844 | ||||||
| Net periodic benefit cost: | ||||||||||||
| Interest cost | 110 | 124 | 133 | |||||||||
| Actuarial loss (gain) | 36 | — | (47 | ) | ||||||||
| Net periodic benefit costs | $ | 146 | $ | 124 | $ | 86 | ||||||
| Benefits paid | (276 | ) | (276 | ) | (276 | ) | ||||||
| Benefit obligation at end of year | $ | 2,372 | $ | 2,502 | $ | 2,654 | ||||||
| Funded status: | ||||||||||||
| Accrued liability as of December 31 | $ | (2,372 | ) | $ | (2,502 | ) | $ | (2,654 | ) | |||
Discount rate used for benefit obligation(1) | 4.50 | % | 4.75 | % | 4.75 | % | ||||||
| (Dollars in thousands) | Payments | |||||||
| 2024 | $ | 276 | ||||||
| 2025 | 276 | |||||||
| 2026 | 276 | |||||||
| 2027 | 275 | |||||||
| 2028 | 165 | |||||||
| 2029-2033 | 119 | |||||||
| (Dollars in thousands) | |||
| 2018 | $ | 276 | |
| 2019 | 276 | ||
| 2020 | 276 | ||
| 2021 | 276 | ||
| 2022 | 276 | ||
| 2023-2027 | 1,380 | ||
Supplemental Life Insurance
The Company has provided supplemental life insurance through split-dollar life insurance arrangements for certain executive and senior officers on whom the Bank owns BOLI. See Item (k) “Bank(l), "Bank Owned Life Insurance”Insurance," in Note 1, “Summary"Summary of Significant Accounting Policies,”" to the Company's consolidated financial statements of this Form 10-K, contained above, for further information regarding BOLI.
These arrangements provide a death benefit to the officer's designated beneficiaries that extend to postretirementpost-retirement periods for some of the supplemental life insurance plans. The Company has recognized a liability for these future postretirementpost-retirement benefits.
These non-qualified plans represent a direct liability of the Company, and, as such, the Company has no specific assets set aside to settle the benefit obligation. The funded status is the aggregate amount accrued, or the "accumulated postretirementpost-retirement benefit obligation," which is the present value of the post-retirement benefits associated with this arrangement.
105
The following table provides a reconciliation of the changes in the post-retirement supplemental life insurance plan obligation and the net periodic benefit cost for the years ended December 31:
| (Dollars in thousands) | 2023 | 2022 | 2021 | |||||||||||||||||
| Reconciliation of benefit obligation: | ||||||||||||||||||||
| Benefit obligation at beginning of year | $ | 2,358 | $ | 2,620 | $ | 2,631 | ||||||||||||||
| Net periodic benefit cost: | ||||||||||||||||||||
| Service cost | (29) | (26) | (23) | |||||||||||||||||
| Interest cost | 115 | 105 | 83 | |||||||||||||||||
| Actuarial gain | (167) | (341) | (71) | |||||||||||||||||
| Total net period cost | $ | (81) | $ | (262) | $ | (11) | ||||||||||||||
| Benefit obligation at end of year | $ | 2,277 | $ | 2,358 | $ | 2,620 | ||||||||||||||
| Funded status: | ||||||||||||||||||||
| Accrued liability as of December 31 | $ | (2,277) | $ | (2,358) | $ | (2,620) | ||||||||||||||
Discount rate used for benefit obligation(1) | 5.25 | % | 4.75 | % | 3.25 | % | ||||||||||||||
| (Dollars in thousands) | 2017 | 2016 | 2015 | |||||||||
| Reconciliation of benefit obligation: | ||||||||||||
| Benefit obligation at beginning of year | $ | 1,895 | $ | 1,792 | $ | 1,723 | ||||||
| Net periodic benefit cost: | ||||||||||||
| Service cost | (11 | ) | (9 | ) | (56 | ) | ||||||
| Interest cost | 91 | 88 | 86 | |||||||||
| Actuarial loss | 57 | 24 | 39 | |||||||||
| Total net period cost | $ | 137 | $ | 103 | $ | 69 | ||||||
| Benefit obligation at end of year | $ | 2,032 | $ | 1,895 | $ | 1,792 | ||||||
| Funded status: | ||||||||||||
| Accrued liability as of December 31 | $ | (2,032 | ) | $ | (1,895 | ) | $ | (1,792 | ) | |||
Discount rate used for benefit obligation(1) | 4.50 | % | 4.75 | % | 4.75 | % | ||||||
The amounts charged to expense for the postretirement cost ofsupplemental life insurance for split dollar insurance coverage are included in the table above. The Company anticipates accruing an additional $178$105 thousand to the plan for the year ending December 31, 2018.2024.
(14)Stock-Based Compensation
The Company currently has two individualone active stock incentive plans: the 2009 plan,plan: The Enterprise Bancorp, Inc. 2016 Stock Incentive Plan, as amended in 2015, and the 2016 plan. The plans permit the Board of Directors to grant, under various terms, both incentive and non-qualified stock options (for the purchase of newly issued shares of common stock), restricted stock, restricted stock units and stock appreciation rights to officers and other employees, directors and consultants. Option exercises and restricted stock vesting may be net settled to cover option costs and employee tax obligations under the terms of the respective plan. These plans also allow for newly issued shares of common stock to be issued without restrictions to officers and other employees, directors and consultants. As of December 31, 2017, an aggregate of 465,198 shares remain available for future grants under the plans.amended.
The Company's stock-based compensation expense related to these plans includes stock options and stock awards to officers and other employees included in salary and benefits expense, and stock awards and stock compensation in lieu of cash fees to non-employee directors both included in other operating expenses.
Total stock-based compensation expense was $1.8$2.3 million, for the yearyears ended December 31, 2017, $2.42023, and 2022, respectively, and $2.1 million for the year ended December 31, 2016, and $1.8 million for the year ended December 31, 2015.2021. The total tax benefit recognized related to the stock-based compensation expense was $716$637 thousand,, $972 $651 thousand, and $720$579 thousand for the years ended 2017, 2016December 31, 2023, 2022 and 2015,2021, respectively.
$108 thousand, $147 thousand and $217$85 thousand for the years ended December 31, 20162023, 2022, and 2015,2021, respectively. For further information regarding the implementation of this update refer to Note 1, "Summary of Significant Accounting Policies," Item (t), "Recent Accounting Pronouncements" above.
Stock Option Awards
Under the terms of the plans, stock options may not be granted at less than 100% of the fair market value of the shares on the date of grant and may not have a term of more than ten10 years. Any shares of common stock reserved for issuance pursuant to options granted under the plans that are returned to the Company unexercised shall remain available for issuance under such plan, while the plan is effective. For participants owning 10% or more of the Company’s outstanding common stock (of which there are currently none), incentive stock options may not be granted at less than 110% of the fair market value of the shares on the date of grant and may not have an expiration term of more than five years.
The Company utilizes the Black-Scholes option valuation model in order to determine the per share grant date fair value of stock option grants.
106
The Company issued no stock options during the year ended December 31, 2023. The table below provides a summary of the stock options granted, including the weighted average fair value, the fair value as a percentage of the market value of the underlying stock at the date of grant and the average assumptions used in the model for the years indicated.indicated:
| Stock Option Awards | 2022 | 2021 | ||||||||||||||||||
| Stock options granted | 17,060 | 17,580 | ||||||||||||||||||
| Term in years | 10 | 10 | ||||||||||||||||||
| Weighted average assumptions used in the fair value model: | ||||||||||||||||||||
| Expected volatility | 44 | % | 44 | % | ||||||||||||||||
| Expected dividend yield | 3.05 | % | 3.01 | % | ||||||||||||||||
| Expected life in years | 6.5 | 6.5 | ||||||||||||||||||
| Risk-free interest rate | 2.20 | % | 1.28 | % | ||||||||||||||||
| Weighted average market price on date of grants | $ | 38.57 | $ | 32.73 | ||||||||||||||||
| Per share weighted average fair value | $ | 14.40 | $ | 11.95 | ||||||||||||||||
| Fair value as a percentage of market value at grant date | 37 | % | 36 | % | ||||||||||||||||
| Stock Option Awards | 2017 | 2016 | 2015 | |||||||||
| Options granted | 15,009 | 31,047 | 27,376 | |||||||||
| Term in years | 10.0 | 10.0 | 10.0 | |||||||||
| Weighted average assumptions used in the fair value model: | ||||||||||||
| Expected volatility | 40 | % | 42 | % | 47 | % | ||||||
| Expected dividend yield | 2.09 | % | 3.02 | % | 2.90 | % | ||||||
| Expected life in years | 7.0 | 7.0 | 7.0 | |||||||||
| Risk-free interest rate | 2.35 | % | 1.91 | % | 1.95 | % | ||||||
| Weighted average market price on date of grants | $ | 30.46 | $ | 21.91 | $ | 21.03 | ||||||
| Per share weighted average fair value | $ | 11.34 | $ | 7.91 | $ | 8.51 | ||||||
| Fair value as a percentage of market value at grant date | 37 | % | 36 | % | 40 | % | ||||||
The expected volatility is the anticipated variability in the Company’sCompany's share price over the expected life of the stock option and is based on the Company's historical volatility.
The expected dividend yield is the Company’sCompany's projected dividends based on historical annualized dividend yield to coincide with volatility divided by its share price at the date of grant.
The expected life represents the period of time that the stock option is expected to be outstanding. The Company utilized the simplified method, and under this method,which the expected term equals the vesting term plus the contractual term divided by 2.two.
The risk-free interest rate is based on the U.S. Department of the Treasury rate in effect at the time of grant for a period equivalent to the expected life of the stock option.
Stock option transactions during the year ended December 31, 20172023 are summarized as follows:
| (Dollars in thousands, except per share data) | Options | Weighted Average Exercise Price Per Share | Weighted Average Remaining Life in Years | Aggregate Intrinsic Value | ||||||||||||||||||||||
| Outstanding December 31, 2022 | 197,249 | $ | 26.33 | 4.4 | $ | 1,824 | ||||||||||||||||||||
| Granted | — | — | ||||||||||||||||||||||||
| Exercised | 33,998 | 17.87 | ||||||||||||||||||||||||
| Forfeited/Expired | 712 | 33.91 | ||||||||||||||||||||||||
| Outstanding December 31, 2023 | 162,539 | $ | 28.07 | 4.2 | $ | 824 | ||||||||||||||||||||
| Vested and Exercisable at December 31, 2023 | 126,161 | $ | 26.37 | 3.3 | $ | 777 | ||||||||||||||||||||
| (Dollars in thousands, except per share data) | Options | Weighted Average Exercise Price Per Share | Weighted Average Remaining Life in Years | Aggregate Intrinsic Value | |||||||||
| Outstanding December 31, 2016 | 259,779 | $ | 17.38 | 4.5 | $ | 5,243 | |||||||
| Granted | 15,009 | 30.46 | |||||||||||
| Exercised | 74,339 | 14.81 | |||||||||||
| Forfeited/Expired | 6,231 | 19.85 | |||||||||||
| Outstanding December 31, 2017 | 194,218 | $ | 19.29 | 5.0 | $ | 2,866 | |||||||
| Vested and Exercisable at December 31, 2017 | 123,669 | $ | 17.06 | 3.4 | $ | 2,101 | |||||||
Cash received from stock option exercises was $355amounted to $180 thousand, $546$118 thousand, and $431$159 thousand in 2017, 2016 during the years ended December 31, 2023,2022 and 2015,2021, respectively. The total intrinsic value of stock options exercised was $1.6 million, $1.0 millionamounted to $563 thousand, $93 thousand and $396$173 thousand in 2017, 2016 during the years ended December 31, 2023, 2022 and 2015,2021, respectively. Cash paid by the Company for the net settlement of stock options to cover employee tax obligations was $386amounted to $153 thousand, $8 thousand and $158$16 thousand in 2017during the years ended December 31, 2023, 2022 and 2016,2021, respectively. In 2015,
107
ENTERPRISE BANCORP, INC.
Notes to the amount paid by the Company for the net settlement of options to cover employee tax obligations was immaterial.Consolidated Financial Statements
Stock option activity during the year ended December 31, 20172023 for unvested options are summarized as follows:
| Unvested Options | Options | Weighted Average Grant Date Fair Value | ||||||||||||
| Unvested December 31, 2022 | 56,257 | $ | 11.34 | |||||||||||
| Granted | — | — | ||||||||||||
| Vested | 19,879 | 10.24 | ||||||||||||
| Forfeited | — | — | ||||||||||||
| Unvested December 31, 2023 | 36,378 | $ | 11.94 | |||||||||||
| Unvested Options | Options | Weighted Average Grant Date Fair Value | |||||
| Unvested December 31, 2016 | 94,034 | $ | 7.84 | ||||
| Granted | 15,009 | 11.34 | |||||
| Vested | 33,693 | 7.31 | |||||
| Forfeited | 4,801 | 8.30 | |||||
| Unvested December 31, 2017 | 70,549 | $ | 8.81 | ||||
The total fair value of stock options vested (based on grant date fair value) during the years ended December 31, 2017, December 31, 20162023, 2022 and December 31, 20152021, was $246$204 thousand, $237$186 thousand, and $359$171 thousand, respectivelyrespectively.
Compensation expense recognized in association with the stock option awards amounted to $204$175 thousand,, $267 $206 thousand and $318$187 thousand for the years ended 2017, 2016December 31, 2023, 2022 and 2015,2021, respectively. The total tax benefit recognized
related to the stock option expense was $83$49 thousand,, $109 $58 thousand, and $127$52 thousand for the years ended 2017, 2016,December 31, 2023, 2022 and 2015,2021, respectively.
As of December 31, 2017,2023, there was $339$202 thousand of unrecognized stock-based compensation expense related to non-vested stock options. That cost is expected to be recognized over the remaining weighted average vesting period of 2.31.8 years.
Restricted Stock Awards
Restricted stock awards are granted at the market price of the Company's common stock on the date of the grant. Employee restricted stock awards generally vest over four years in equal portions beginning on or about the first anniversary date of the restricted stock award or are performance based restricted stock awards that vest upon the Company achieving certain predefined performance objectives. Non-employee director restricted stock awards generally vest over two years in equal portions beginning on or about the first anniversary date of the restricted stock award.
The table below provides a summary of restricted stock awards granted during the years indicated:
| Restricted Stock Awards (number of underlying shares) | 2023 | 2022 | 2021 | |||||||||||||||||
| Two-year vesting | 9,915 | 8,823 | 8,109 | |||||||||||||||||
| Four-year vesting | 32,719 | 22,147 | 24,307 | |||||||||||||||||
| Performance-based vesting | 31,270 | 22,254 | 21,559 | |||||||||||||||||
| Total restricted stock awards | 73,904 | 53,224 | 53,975 | |||||||||||||||||
| Weighted average grant date fair value | $ | 32.04 | $ | 38.57 | $ | 32.73 | ||||||||||||||
| Restricted Stock Awards (no. of underlying shares) | 2017 | 2016 | 2015 | |||||||||
| Two year vesting | 6,944 | 9,060 | 7,276 | |||||||||
| Four year vesting | 16,253 | 18,298 | 17,775 | |||||||||
| Performance-based vesting | 25,623 | 35,071 | 30,262 | |||||||||
| Total restricted stock awards | 48,820 | 62,429 | 55,313 | |||||||||
| Weighted average grant date fair value | $ | 30.46 | $ | 21.90 | $ | 21.03 | ||||||
The restricted stock awards allow for the non-forfeitable receipt of dividends, and the voting of all shares, whether or not vested, throughout the vesting periods at the same proportional level as common shares outstanding.
Upon vesting, restricted stock awards may be net share-settledsettled to cover payment for employee tax obligations, resulting in shares of common stock being reacquired by the Company. In 2017During the years ended December 31, 2023, 2022 and 2016,2021 the Company paid $545$294 thousand, $425 thousand and $284$330 thousand, respectively, to net settle the vesting of restricted stock awards to cover employee tax obligations. In 2015, the amount paid by the Company for the net settlement of options to cover employee tax obligations was immaterial.
Any shares that are returned to the Company prior to vesting or as payment for employee tax obligations upon vesting shall remain available for issuance under such plan, while the plan is still effective.
108
The following table sets forth a summary of the activity for the Company’sCompany's restricted stock awards.awards:
| Restricted Stock | Weighted Average Grant Price Per Share | |||||||||||||
| Unvested December 31, 2022 | 106,658 | $ | 34.68 | |||||||||||
| Granted | 73,904 | 32.04 | ||||||||||||
| Vested/released | 47,822 | 33.20 | ||||||||||||
| Forfeited | 2,701 | 33.58 | ||||||||||||
| Unvested December 31, 2023 | 130,039 | $ | 33.75 | |||||||||||
| (Dollars in thousands, except per share data) | Restricted Stock | Weighted Average Grant Price Per Share | Weighted Average Remaining Life In Years | Aggregate Intrinsic Value | |||||||||
| Unvested December 31, 2016 | 141,580 | $ | 20.73 | 1.4 | $ | 5,318 | |||||||
| Granted | 48,820 | 30.46 | |||||||||||
| Vested/released | 69,336 | 20.07 | |||||||||||
| Forfeited | 3,845 | 23.28 | |||||||||||
| Unvested December 31, 2017 | 117,219 | $ | 25.09 | 1.4 | $ | 3,991 | |||||||
Stock-based compensation expense recognized in association with the restricted stock awards amounted to $1.3$1.9 million for both of the years ended December 31, 2023 and 2022, respectively and $1.6 million for the year ended December 31, 2017, $1.8 million for the year ended December 31, 2016, and $1.2 million for the year ended December 31, 2015.2021. The total tax benefit recognized related to restricted stock award compensation expense was $518$527 thousand, $746$522 thousand and $491$456 thousand for the years ended 2017, 2016,December 31, 2023, 2022 and 2015,2021, respectively.
As of December 31, 2017,2023, there remained $1.4$2.6 million of unrecognized compensation expense related to the restricted stock awards. That cost is expected to be recognized over the remaining weighted average vesting period of 2.12.3 years.
The total fair value of restricted stock awards vested (based on grant date fair value) during the years ended December 31, 2023, 2022 and 2021 was $1.6 million, $1.8 million and $1.7 million, respectively.
Stock in Lieu of Directors' Fees
In addition to the restricted stock awards discussed above, the non-employee members of the Company’sCompany's Board of Directors may opt to receive newly issued shares of the Company’sCompany's common in stock in lieu of cash compensation for attendance at Board and Board Committee meetings. Directors must make an irrevocable election to receiveThese shares are valued based on the Company's average quarterly close price and are issued in January of common stockthe following year.
Stock in lieu of cashdirectors' fees prior to December 31st of the preceding year. Directors are granted shares of common stock in lieu of cash fees at a per share price which reflects the market value of the common stock on the first business day of the year.
The components of income tax expense for the years ended December 31, were calculated using the asset and liability method as follows:
| (Dollars in thousands) | 2023 | 2022 | 2021 | |||||||||||||||||
| Current expense: | ||||||||||||||||||||
| Federal | $ | 10,424 | $ | 11,996 | $ | 10,786 | ||||||||||||||
| State | 4,763 | 4,606 | 3,771 | |||||||||||||||||
| Total current expense | 15,187 | 16,602 | 14,557 | |||||||||||||||||
| Deferred benefit: | ||||||||||||||||||||
| Federal | (1,425) | (2,027) | (945) | |||||||||||||||||
| State | (575) | (1,145) | (25) | |||||||||||||||||
| Total deferred benefit | (2,000) | (3,172) | (970) | |||||||||||||||||
| Total income tax expense | $ | 13,187 | $ | 13,430 | $ | 13,587 | ||||||||||||||
109
| (Dollars in thousands) | 2017 | 2016 | 2015 | |||||||||
| Current tax expense: | ||||||||||||
| Federal | $ | 8,222 | $ | 8,178 | $ | 6,808 | ||||||
| State | 2,271 | 2,244 | 1,712 | |||||||||
| Total current tax expense | 10,493 | 10,422 | 8,520 | |||||||||
| Deferred tax (benefit)/ expense: | ||||||||||||
| Federal | 5,646 | (984 | ) | (284 | ) | |||||||
| State | 89 | (277 | ) | (122 | ) | |||||||
| Total deferred tax (benefit)/ expense | 5,735 | (1,261 | ) | (406 | ) | |||||||
| Total income tax expense | $ | 16,228 | $ | 9,161 | $ | 8,114 | ||||||
The provision for income taxes differs from the amount computed by applying the statutory U.S. federal income tax rate of 35%21% for 2017, 20162023, 2022 and 20152021 to income before taxes as follows:
| (Dollars in thousands) | 2023 | 2022 | 2021 | |||||||||||||||||
| Computed income tax expense at statutory rate | $ | 10,761 | $ | 11,791 | $ | 11,709 | ||||||||||||||
| State income taxes, net of federal tax benefit | 3,309 | 2,734 | 2,959 | |||||||||||||||||
| Tax-exempt income, net of disallowance | (758) | (804) | (832) | |||||||||||||||||
| Bank-owned life insurance income, net | (265) | (252) | (172) | |||||||||||||||||
| Tax (benefit) expense from stock compensation | (108) | (147) | (85) | |||||||||||||||||
| New market tax credit | (135) | — | — | |||||||||||||||||
| Other | 383 | 108 | 8 | |||||||||||||||||
| Total income tax expense | $ | 13,187 | $ | 13,430 | $ | 13,587 | ||||||||||||||
| Effective income tax rate | 25.7 | % | 23.9 | % | 24.4 | % | ||||||||||||||
| (Dollars in thousands) | 2017 | 2016 | 2015 | |||||||||
| Computed income tax expense at statutory rate | $ | 12,467 | $ | 9,769 | $ | 8,492 | ||||||
| State income taxes, net of federal tax benefit | 1,534 | 1,279 | 1,034 | |||||||||
| Tax-exempt income, net of disallowance | (1,665 | ) | (1,559 | ) | (1,226 | ) | ||||||
| Bank-owned life insurance income, net | (245 | ) | (261 | ) | (251 | ) | ||||||
| Impact of change in federal statutory rate on deferred tax assets | 4,761 | — | — | |||||||||
| Tax benefit from stock compensation | (922 | ) | — | — | ||||||||
| Other | 298 | (67 | ) | 65 | ||||||||
| Total income tax expense | $ | 16,228 | $ | 9,161 | $ | 8,114 | ||||||
| Effective income tax rate | 45.6 | % | 32.8 | % | 33.4 | % | ||||||
At December 31, the tax effects of each type of income and expense item that give rise to deferred taxes are as follows:
| (Dollars in thousands) | 2023 | 2022 | ||||||||||||
| Deferred tax asset: | ||||||||||||||
| Allowance for credit losses | $ | 18,278 | $ | 15,822 | ||||||||||
| Depreciation | 3,524 | 3,270 | ||||||||||||
| Net unrealized losses on equity securities | 51 | 53 | ||||||||||||
| Net unrealized losses on debt securities | 23,105 | 27,918 | ||||||||||||
| Supplemental employee retirement plans | 330 | 932 | ||||||||||||
| Deferred compensation and benefits | 3,976 | 3,042 | ||||||||||||
| Non-accrual interest | 1,608 | 1,425 | ||||||||||||
| Stock-based compensation expense | 878 | 724 | ||||||||||||
| Lease liability | 6,757 | 6,781 | ||||||||||||
| Other | 6 | 1,049 | ||||||||||||
| Total | 58,513 | 61,016 | ||||||||||||
| Deferred tax liability: | ||||||||||||||
| Goodwill | 1,564 | 1,571 | ||||||||||||
| Deferred origination costs | 848 | 616 | ||||||||||||
| Lease ROU asset | 6,862 | 6,781 | ||||||||||||
| Other | 73 | 67 | ||||||||||||
| Total | 9,347 | 9,035 | ||||||||||||
| Net deferred tax asset | $ | 49,166 | $ | 51,981 | ||||||||||
| (Dollars in thousands) | 2017 | 2016 | ||||||
| Deferred tax asset: | ||||||||
| Allowance for loan losses | $ | 9,252 | $ | 12,753 | ||||
| Depreciation | 1,831 | 3,463 | ||||||
| Net unrealized loss on investment securities | — | 444 | ||||||
| Other-than-temporary impairment on equity securities | — | 22 | ||||||
| Supplemental employee retirement plans | 667 | 1,018 | ||||||
| Non-accrual interest | 460 | 1,145 | ||||||
| Stock-based compensation expense | 608 | 1,019 | ||||||
| Other | 323 | 390 | ||||||
| Total | 13,141 | 20,254 | ||||||
| Deferred tax liability: | ||||||||
| Goodwill | 1,590 | 2,301 | ||||||
| Net unrealized gains on investments securities | 90 | �� | ||||||
| Deferred origination costs | 710 | 933 | ||||||
| Total | 2,390 | 3,234 | ||||||
| Net deferred tax asset | $ | 10,751 | $ | 17,020 | ||||
The Company paid total estimated income taxes in 2017, 2016,during the years ended December 31, 2023, 2022 and 20152021 of $10.5$15.6 million,, $10.9 $17.0 million, and $7.6$12.3 million,, respectively.
110
The Company did not have any unrecognized tax benefits accrued as income tax liabilities or receivables or as deferred tax items at December 31, 20172023, or December 31, 2016.2022. The Company is generally subject to examinations by taxing authorities for the prior three tax years.
The Company invests in qualified affordable housing projects as a limited partner. In 2017, the Company estimated approximately $71 thousandAs of Federal Low Income Housing tax credits to be recognized. In both 2016 and 2015, December 31, 2023,the Company recognized $71 thousand ofno Federal Low Income Housing tax credits. The Company anticipates that it will receive additionalThere are no remaining tax credits related to thethese Federal Low Income Housing Tax Credit program in the amount of $319 thousand which are expected to be realizedrealized. During the years ended December 31, 2022 and 2021, the Company recognized $36 thousand and $71 thousand in Federal Low Income Housing tax credits.
In March 2023, the Bank made an equity contribution to its wholly owned subsidiary, the NMTC Investment Fund, in order to invest in a local NMTC project. The Bank invested $3.7 million in the Investment Fund and anticipates receiving $4.8 million of federal tax credits over seven years. The investment is accounted for using the next 5 years.proportional amortization method and will be amortized over seven years, which represents the period that the tax credits and other tax benefits will be utilized. The investment is carried within the line "Prepaid expenses and other assets" on the Company's Consolidated Balance Sheet and the investment amortization expense and tax credits are presented on a net basis within the line "Provision for income taxes" on the Company's Consolidated Statements of Income. During the year ended December 31, 2023, the related amortization expense amounted to $478 thousand and the related tax credits amounted to $613 thousand.
The table below presents the increase in average shares outstanding, using the treasury stock method, for the diluted earnings per share calculation for the years ended December 31st:indicated:
| 2017 | 2016 | 2015 | 2023 | 2022 | 2021 | |||||||||||||||||||||||||||||||||
| Basic weighted average common shares outstanding | 11,568,430 | 10,966,333 | 10,323,016 | |||||||||||||||||||||||||||||||||||
| Dilutive shares | 83,333 | 73,178 | 66,918 | |||||||||||||||||||||||||||||||||||
| Diluted weighted average common shares outstanding | 11,651,763 | 11,039,511 | 10,389,934 | |||||||||||||||||||||||||||||||||||
There were 14,67861,425, 34,291 and 31,677 stock options outstanding at December 31, 2023, 2022 and 2021, respectively, that were determined to be anti-dilutive and therefore excluded from the calculation of dilutive shares for the yearyears ended December 31, 2017.2023, 2022 and 2021. These stock options, which were not dilutive at that date, may potentially dilute earnings per share in the future.
(17) Fair Value Measurements
The FASB defines the fair value of an asset or liability to be the price which a seller would receive in an orderly transaction between market participants (an exit price) and also establishes a fair value hierarchy segregating fair value measurements using three levels of inputs: (Level 1) quoted market prices in active markets for identical assets or liabilities; (Level 2) significant other observable inputs, including quoted prices for similar items in active markets, quoted prices for identical or similar items in markets that are not active, inputs such as interest rates and yield curves, volatilities, prepayment speeds, credit risks and default rates which provide a reasonable basis for fair value determination or inputs derived principally from observed market data; and (Level 3) significant unobservable inputs for situations in which there is little, if any, market activity for the asset or liability. Unobservable inputs must reflect reasonable assumptions that market participants would use in pricing the asset or liability, which are developed based on the basis of the best information available under the circumstances.
111
The following tables summarize significant assets and liabilities carried at fair value and placement in the fair value hierarchy at the dates specified:
| December 31, 2017 | ||||||||||||||||||||||||||||||||||||||||||||||||||||||||||||||||||||||
| December 31, 2023 | December 31, 2023 | |||||||||||||||||||||||||||||||||||||||||||||||||||||||||||||||||||||
| Fair Value Measurements using: | Fair Value Measurements Using: | |||||||||||||||||||||||||||||||||||||||||||||||||||||||||||||||||||||
| (Dollars in thousands) | Fair Value | (Level 1) | (Level 2) | (Level 3) | (Dollars in thousands) | Fair Value | (Level 1) | (Level 2) | (Level 3) | |||||||||||||||||||||||||||||||||||||||||||||||||||||||||||||
| Assets measured on a recurring basis: | Assets measured on a recurring basis: | |||||||||||||||||||||||||||||||||||||||||||||||||||||||||||||||||||||
| Debt securities | $ | 405,206 | $ | — | $ | 405,206 | $ | — | ||||||||||||||||||||||||||||||||||||||||||||||||||||||||||||||
| Equity securities | ||||||||||||||||||||||||||||||||||||||||||||||||||||||||||||||||||||||
| FHLB stock | 5,215 | — | — | 5,215 | ||||||||||||||||||||||||||||||||||||||||||||||||||||||||||||||||||
| Interest-rate swaps | 568 | — | 568 | — | ||||||||||||||||||||||||||||||||||||||||||||||||||||||||||||||||||
| Assets measured on a non-recurring basis: | Assets measured on a non-recurring basis: | |||||||||||||||||||||||||||||||||||||||||||||||||||||||||||||||||||||
| Impaired loans (collateral dependent) | 2,696 | — | — | 2,696 | ||||||||||||||||||||||||||||||||||||||||||||||||||||||||||||||||||
| Individually evaluated loans (collateral dependent) | ||||||||||||||||||||||||||||||||||||||||||||||||||||||||||||||||||||||
| Liabilities measured on a recurring basis: | ||||||||||||||||||||||||||||||||||||||||||||||||||||||||||||||||||||||
| Liabilities measured on a recurring basis: | ||||||||||||||||||||||||||||||||||||||||||||||||||||||||||||||||||||||
| Liabilities measured on a recurring basis: | ||||||||||||||||||||||||||||||||||||||||||||||||||||||||||||||||||||||
| Interest-rate swaps | $ | 568 | $ | — | $ | 568 | $ | — | ||||||||||||||||||||||||||||||||||||||||||||||||||||||||||||||
| Interest-rate swaps | ||||||||||||||||||||||||||||||||||||||||||||||||||||||||||||||||||||||
| Interest-rate swaps | ||||||||||||||||||||||||||||||||||||||||||||||||||||||||||||||||||||||
| RPA sold | ||||||||||||||||||||||||||||||||||||||||||||||||||||||||||||||||||||||
| December 31, 2022 | ||||||||||||||||||||||||||
| Fair Value Measurements Using: | ||||||||||||||||||||||||||
| (Dollars in thousands) | Fair Value | (Level 1) | (Level 2) | (Level 3) | ||||||||||||||||||||||
| Assets measured on a recurring basis: | ||||||||||||||||||||||||||
| Debt securities | $ | 816,102 | $ | — | $ | 816,102 | $ | — | ||||||||||||||||||
| Equity securities | 4,269 | 4,269 | — | — | ||||||||||||||||||||||
| FHLB stock | 2,343 | — | 2,343 | — | ||||||||||||||||||||||
| Interest-rate swaps | 782 | — | 782 | — | ||||||||||||||||||||||
| Assets measured on a non-recurring basis: | ||||||||||||||||||||||||||
| Individually evaluated loans (collateral dependent) | $ | 740 | $ | — | $ | — | $ | 740 | ||||||||||||||||||
| Liabilities measured on a recurring basis: | ||||||||||||||||||||||||||
| Interest-rate swaps | $ | 782 | $ | — | $ | 782 | $ | — | ||||||||||||||||||
| RPA sold | 73 | 73 | ||||||||||||||||||||||||
| December 31, 2016 | ||||||||||||||||
| Fair Value Measurements using: | ||||||||||||||||
| (Dollars in thousands) | Fair Value | (Level 1) | (Level 2) | (Level 3) | ||||||||||||
| Assets measured on a recurring basis: | ||||||||||||||||
| Debt securities | $ | 362,147 | $ | — | $ | 362,147 | $ | — | ||||||||
| Equity securities | 12,643 | 12,643 | — | — | ||||||||||||
| FHLB stock | 2,094 | — | — | 2,094 | ||||||||||||
| Interest-rate swaps | 610 | — | 610 | — | ||||||||||||
| Assets measured on a non-recurring basis: | ||||||||||||||||
| Impaired loans (collateral dependent) | 3,481 | — | — | 3,481 | ||||||||||||
| Liabilities measured on a recurring basis: | ||||||||||||||||
| Interest-rate swaps | $ | 610 | $ | — | $ | 610 | $ | — | ||||||||
The Company did not transfer any assets between the fair value measurement levels during the yearyears ended December 31, 20172023 or the year ended December 31, 2016.2022.
All of the Company's debt and equity securities that are considered “available-for-sale”"available-for-sale" and are carried at fair value. The debt security category above includesmay include federal agency obligations, U.S. treasury securities, commercial and residential federal agency MBS, municipal securities, corporate bonds, and certificates of deposits,CDs, as held at those dates. The Company utilizes third-party pricing vendors to provide valuations on its debt securities. Fair values provided by the vendors were generally determined based upon pricing matrices utilizing observable market data inputs for similar or benchmark securities in active markets and/or based on a matrix pricing methodology which employs The Bond Market Association’sAssociation's standard calculations for cash flow and price/yield analysis, live benchmark bond pricing and terms/condition data available from major pricing sources. Therefore, management regards the inputs and methods used by third-party pricing vendors to be "Level 2 inputs and methods" as defined in the "fair value hierarchy." The Company periodically obtains a second price from an impartial third-party on debt securities to assess the reasonableness of prices provided by the primary independent pricing vendor.
The Company’sCompany's equity securities portfolio fair value is measured based on quoted market prices for the shares; therefore, these securities are categorized as Level 1 within the fair value hierarchy. As
112
ENTERPRISE BANCORP, INC.
Notes to the Company did not hold any available-for-sale equity securities.Consolidated Financial Statements
The Bank is required to purchase FHLB stock at par value in association with advances from the FHLB; thisFHLB. The stock is issued, redeemed, repurchased, and transferred by the FHLB only at their fixed par value. This stock is classified as a restricted investment and carried at costFHLB par value which management believes approximates fair value; therefore, these securities are categorized as Level 32 measures. See Note 1, "Summary
The fair values of Significant Accounting Policies," Item (e) "Restricted Investments,"derivative assets and liabilities, which are comprised of back-to-back swaps and risk participation agreements, represent a Level 2 measurement and are based on settlement values adjusted for further information regardingcredit risks and observable market interest-rate curves. The settlement values are determined using widely accepted valuation techniques including discounted cash flow analysis on the Company’sexpected cash flows of each derivative, reflecting the contractual terms of the derivatives, including the period to maturity, and uses observable market-based inputs, including interest-rate curves. Credit risk adjustments consider factors such as the likelihood of default by the Company and its counterparties, its net exposures and remaining contractual life. The change in value of derivative assets and liabilities attributable to credit risk was not significant during the reported periods.
The fair value assessment of FHLB capital stock.
Letters of credit are conditional commitments issued by the Company to guarantee the financial obligation or performance of a customer to a third party.third-party. The fair value of these commitments was estimated to be the fees charged to enter into similar agreements, and accordingly these fair value measures are deemed to be FASB Level 2 measurements. In accordance with the FASB, the estimated fair values of these commitments are carried on the consolidated balance sheetConsolidated Balance Sheet as a liability and amortized to income over the life of the letters of credit, which are typically one year. The estimated fair value of these commitments carried on the consolidated balance sheetConsolidated Balance Sheets at December 31, 20172023 and December 31, 20162022 were deemed immaterial.
Interest-rate lock commitments related to the origination of mortgage loans that will be sold are considered derivative instruments. The commitments to sell loans are also considered derivative instruments. The Company generally does not pool mortgage loans for sale, but instead sells the loans on an individual basis. To reduce the net interest rate exposure arising from its loan sale activity, the Company enters into the commitment to sell these loans at essentially the same time that the interest-rate lock commitment is quoted on the origination of the loan. The Company estimates the fair value of these derivatives based on current secondary mortgage market prices. These commitments are accounted for in accordance with FASB guidance. The fair values of the Company’sCompany's derivative instruments are deemed to be FASB Level 2 measurements. At December 31, 20172023 and December 31, 2016,2022, the estimated fair value of the Company’sCompany's interest-rate lock commitments and commitments to sell these mortgage loans were deemed immaterial.
The following table presents additional quantitative information about assets measured at fair value on a recurring and non-recurring basis for which the Company utilized Level 3 inputs (significant unobservable inputs for situations in which there is little, if any, market activity for the asset or liability) to determine fair value as of December 31, 2017.2023 and December 31, 2022:
| Fair Value | ||||||||||||||||||||||||||||||||
| (Dollars in thousands) | December 31, 2023 | December 31, 2022 | Valuation Technique | Unobservable Input | Unobservable Input Value or Range | |||||||||||||||||||||||||||
| Assets measured on a non-recurring basis: | ||||||||||||||||||||||||||||||||
| Individually evaluated loans (collateral dependent) | $ | 1,595 | $ | 740 | Appraisal of collateral | Appraisal adjustments(1) | 15% - 50% | |||||||||||||||||||||||||
(1) Appraisals may be adjusted by management for qualitative factors such as economic conditions and estimated liquidation expenses.
113
ENTERPRISE BANCORP, INC.
Notes to the Consolidated Financial Statements
Estimated Fair Values of Assets and Liabilities
In addition to disclosures regarding the measurement of assets and liabilities carried at fair value on the consolidated balance sheet,Consolidated Balance Sheet, the Company is also required to disclose fair value information about financial instruments for which it is practicable to estimate that value, whether or not recognized on the consolidated balance sheet.Consolidated Balance Sheet.
The carrying values, estimated fair values and placement in the fair value hierarchy of the Company’s consolidatedCompany's financial instruments for which fair value is only disclosed but not recognized on the consolidated balance sheetConsolidated Balance Sheets at the dates indicated are summarized as follows:
| December 31, 2023 | ||||||||||||||||||||||||||||||||
| Fair Value Measurement | ||||||||||||||||||||||||||||||||
| (Dollars in thousands) | Carrying Amount | Fair Value | Level 1 Inputs | Level 2 Inputs | Level 3 Inputs | |||||||||||||||||||||||||||
| Financial assets: | ||||||||||||||||||||||||||||||||
| Loans held for sale | $ | 200 | $ | 201 | $ | — | $ | 201 | $ | — | ||||||||||||||||||||||
| Loans, net | 3,508,636 | 3,353,968 | — | $ | — | 3,353,968 | ||||||||||||||||||||||||||
| Financial liabilities: | ||||||||||||||||||||||||||||||||
| CDs | 521,076 | 518,928 | — | 518,928 | — | |||||||||||||||||||||||||||
| Borrowed funds | 25,768 | 24,081 | — | 24,081 | — | |||||||||||||||||||||||||||
| Subordinated debt | 59,498 | 55,572 | — | 55,572 | — | |||||||||||||||||||||||||||
| December 31, 2017 | ||||||||||||||||||||||||||||||||||||||||||||||||||||||||||||||||||||||||||||||||||||||
| December 31, 2022 | December 31, 2022 | |||||||||||||||||||||||||||||||||||||||||||||||||||||||||||||||||||||||||||||||||||||
| Fair value measurement | Fair Value Measurement | |||||||||||||||||||||||||||||||||||||||||||||||||||||||||||||||||||||||||||||||||||||
| (Dollars in thousands) | Carrying Amount | Fair Value | Level 1 Inputs | Level 2 Inputs | Level 3 Inputs | (Dollars in thousands) | Carrying Amount | Fair Value | Level 1 Inputs | Level 2 Inputs | Level 3 Inputs | |||||||||||||||||||||||||||||||||||||||||||||||||||||||||||||||||||||||||||
| Financial assets: | ||||||||||||||||||||||||||||||||||||||||||||||||||||||||||||||||||||||||||||||||||||||
| Loans held for sale | $ | 208 | $ | 208 | $ | — | $ | 208 | $ | — | ||||||||||||||||||||||||||||||||||||||||||||||||||||||||||||||||||||||||||||
| Loans, net | ||||||||||||||||||||||||||||||||||||||||||||||||||||||||||||||||||||||||||||||||||||||
| Loans, net | ||||||||||||||||||||||||||||||||||||||||||||||||||||||||||||||||||||||||||||||||||||||
| Loans, net | 2,236,989 | 2,236,169 | — | — | 2,236,169 | |||||||||||||||||||||||||||||||||||||||||||||||||||||||||||||||||||||||||||||||||
| Financial liabilities: | ||||||||||||||||||||||||||||||||||||||||||||||||||||||||||||||||||||||||||||||||||||||
| Certificates of deposit (including brokered) | 343,089 | 341,765 | — | 341,765 | — | |||||||||||||||||||||||||||||||||||||||||||||||||||||||||||||||||||||||||||||||||
| CDs | ||||||||||||||||||||||||||||||||||||||||||||||||||||||||||||||||||||||||||||||||||||||
| CDs | ||||||||||||||||||||||||||||||||||||||||||||||||||||||||||||||||||||||||||||||||||||||
| CDs | ||||||||||||||||||||||||||||||||||||||||||||||||||||||||||||||||||||||||||||||||||||||
| Borrowed funds | ||||||||||||||||||||||||||||||||||||||||||||||||||||||||||||||||||||||||||||||||||||||
| Borrowed funds | ||||||||||||||||||||||||||||||||||||||||||||||||||||||||||||||||||||||||||||||||||||||
| Borrowed funds | 89,000 | 88,996 | — | 88,996 | — | |||||||||||||||||||||||||||||||||||||||||||||||||||||||||||||||||||||||||||||||||
| Subordinated debt | 14,847 | 14,208 | — | — | 14,208 | |||||||||||||||||||||||||||||||||||||||||||||||||||||||||||||||||||||||||||||||||
| December 31, 2016 | ||||||||||||||||||||
| Fair value measurement | ||||||||||||||||||||
| (Dollars in thousands) | Carrying Amount | Fair Value | Level 1 Inputs | Level 2 Inputs | Level 3 Inputs | |||||||||||||||
| Financial assets: | ||||||||||||||||||||
| Loans held for sale | $ | 1,569 | $ | 1,569 | $ | — | $ | 1,569 | $ | — | ||||||||||
| Loans, net | 1,991,387 | 1,997,887 | — | — | 1,997,887 | |||||||||||||||
| Financial liabilities: | ||||||||||||||||||||
| Certificates of deposit (including brokered) | 227,257 | 226,536 | — | 226,536 | — | |||||||||||||||
| Borrowed funds | 10,671 | 10,670 | — | 10,670 | — | |||||||||||||||
| Subordinated debt | 14,834 | 14,011 | — | — | 14,011 | |||||||||||||||
Excluded from the tables above are certain financial instruments with carrying values that approximated their fair value at the dates indicated, as they were short-term in nature or payable on demand. These include cash and cash equivalents, accrued interest and non-term deposit accounts. The respective carrying values of these instruments would all be considered to be classified within Level 1 of their fair value hierarchy.
Also excluded from these tables are the fair values of commitments for unused portions of lines of credit and commitments to originate loans that were short-term, at current market rates and estimated to have no significant change in fair value.
114
Contents
ENTERPRISE BANCORP, INCINC.
Notes to the Consolidated Financial Statements
(18)Supplemental Cash Flow Information
The fair value of loans was determined using discountedsupplemental cash flow analysis, using interest rates currently being offered byinformation for the Company. The incremental credit risk for adversely classified loans was consideredyears indicated is as follows:
| (Dollars in thousands) | 2023 | 2022 | 2021 | |||||||||||||||||
| Supplemental financial data: | ||||||||||||||||||||
| Cash paid for: interest | $ | 45,296 | $ | 8,647 | $ | 7,880 | ||||||||||||||
| Cash paid for: estimated income taxes | 15,610 | 16,983 | 12,335 | |||||||||||||||||
| Cash paid for: lease liability | 1,412 | 1,380 | 1,251 | |||||||||||||||||
| Supplemental schedule of non-cash activity: | ||||||||||||||||||||
| Transfer from loans to other real estate owned | — | — | 2,400 | |||||||||||||||||
ROU lease assets: operating leases(1) | 611 | 31 | 6,608 | |||||||||||||||||
(1)Represents net new ROU lease assets added in the determinationperiods indicated.
(19)Condensed Parent Company Only Financial Statements
Balance Sheets
| December 31, | ||||||||||||||
| (Dollars in thousands, except per share data) | 2023 | 2022 | ||||||||||||
| Assets | ||||||||||||||
| Cash | $ | 2,089 | $ | 1,929 | ||||||||||
| Investment in subsidiaries | 387,978 | 340,966 | ||||||||||||
| Other assets | — | — | ||||||||||||
| Total assets | $ | 390,067 | $ | 342,895 | ||||||||||
| Liabilities and Shareholders' Equity | ||||||||||||||
| Liabilities | ||||||||||||||
| Subordinated debt | $ | 59,498 | $ | 59,182 | ||||||||||
| Accrued interest payable | 1,444 | 1,444 | ||||||||||||
| Other liabilities | 8 | 2 | ||||||||||||
| Total liabilities | 60,950 | 60,628 | ||||||||||||
| Shareholders' equity: | ||||||||||||||
| Preferred stock, $0.01 par value per share; 1,000,000 shares authorized; no shares issued | — | — | ||||||||||||
| Common stock $0.01 par value per share; 40,000,000 shares authorized; 12,272,674 and 12,133,516 shares issued, respectively | 123 | 121 | ||||||||||||
| Additional paid-in capital | 107,377 | 103,793 | ||||||||||||
| Retained earnings | 301,380 | 274,560 | ||||||||||||
| Accumulated other comprehensive income | (79,763) | (96,207) | ||||||||||||
| Total shareholders' equity | 329,117 | 282,267 | ||||||||||||
| Total liabilities and shareholders' equity | $ | 390,067 | $ | 342,895 | ||||||||||
115
ENTERPRISE BANCORP, INCINC.
Notes to the Consolidated Financial Statements
| December 31, | ||||||||
| (Dollars in thousands) | 2017 | 2016 | ||||||
| Assets | ||||||||
| Cash | $ | 345 | $ | 497 | ||||
| Investment in subsidiaries | 245,982 | 227,960 | ||||||
| Other assets | 411 | 1,243 | ||||||
| Total assets | $ | 246,738 | $ | 229,700 | ||||
| Liabilities and Stockholders’ Equity | ||||||||
| Liabilities | ||||||||
| Subordinated debt | $ | 14,847 | $ | 14,834 | ||||
| Accrued interest payable | 78 | 78 | ||||||
| Other liabilities | 3 | 2 | ||||||
| Total liabilities | 14,928 | 14,914 | ||||||
| Stockholders' equity: | ||||||||
| Preferred stock, $0.01 par value per share; 1,000,000 shares authorized; no shares issued | — | — | ||||||
| Common stock $0.01 par value per share; 40,000,000 shares authorized; 11,609,853 shares issued and outstanding at December 31, 2017 and 11,475,742 shares issued and outstanding at December 31, 2016 | 116 | 115 | ||||||
| Additional paid-in capital | 88,205 | 85,421 | ||||||
| Retained earnings | 143,073 | 130,008 | ||||||
| Accumulated other comprehensive income (loss) | 416 | (758 | ) | |||||
| Total stockholders’ equity | 231,810 | 214,786 | ||||||
| Total liabilities and stockholders’ equity | $ | 246,738 | $ | 229,700 | ||||
Statements of Income
| For the years ended December 31, | ||||||||||||||||||||
| (Dollars in thousands) | 2023 | 2022 | 2021 | |||||||||||||||||
| Equity in undistributed net income of subsidiaries | $ | 30,315 | $ | 36,701 | $ | 22,985 | ||||||||||||||
| Dividends distributed by subsidiaries | 10,200 | 8,900 | 22,350 | |||||||||||||||||
| Total income | 40,515 | 45,601 | 45,335 | |||||||||||||||||
| Interest expense | 3,467 | 3,352 | 3,495 | |||||||||||||||||
| Other operating expenses | 347 | 270 | 891 | |||||||||||||||||
| Total operating expenses | 3,814 | 3,622 | 4,386 | |||||||||||||||||
| Income before income taxes | 36,701 | 41,979 | 40,949 | |||||||||||||||||
| Benefit from income taxes | (1,357) | (737) | (1,222) | |||||||||||||||||
| Net income | $ | 38,058 | $ | 42,716 | $ | 42,171 | ||||||||||||||
| For the years ended December 31, | ||||||||||||
| (Dollars in thousands) | 2017 | 2016 | 2015 | |||||||||
| Equity in undistributed net income of subsidiaries | $ | 16,922 | $ | 19,313 | $ | 17,277 | ||||||
| Dividends distributed by subsidiaries | 3,000 | 150 | — | |||||||||
| Loss distributed by divested subsidiary | — | — | (210 | ) | ||||||||
| Other income | — | — | 17 | |||||||||
| Total income | 19,922 | 19,463 | 17,084 | |||||||||
| Interest expense | 925 | 928 | 1,071 | |||||||||
| Other operating expenses | 245 | 194 | 500 | |||||||||
| Total operating expenses | 1,170 | 1,122 | 1,571 | |||||||||
| Income before income taxes | 18,752 | 18,341 | 15,513 | |||||||||
| Benefit from income taxes | (641 | ) | (410 | ) | (635 | ) | ||||||
| Net income | $ | 19,393 | $ | 18,751 | $ | 16,148 | ||||||
Statements of Cash Flows
| For the years ended December 31, | ||||||||||||||||||||
| (Dollars in thousands) | 2023 | 2022 | 2021 | |||||||||||||||||
| Cash flows from operating activities: | ||||||||||||||||||||
| Net income | $ | 38,058 | $ | 42,716 | $ | 42,171 | ||||||||||||||
| Adjustments to reconcile net income to net cash provided by operating activities: | ||||||||||||||||||||
| Equity in undistributed net income of subsidiaries | (30,315) | (36,701) | (22,985) | |||||||||||||||||
| Payment from subsidiary bank for stock compensation expense | 2,305 | 2,315 | 2,094 | |||||||||||||||||
| Changes in: | ||||||||||||||||||||
| Net decrease (increase) in other assets | (253) | 205 | 66 | |||||||||||||||||
| Net increase (decrease) in other liabilities | 322 | 202 | (25) | |||||||||||||||||
| Net cash provided by operating activities | 10,117 | 8,737 | 21,321 | |||||||||||||||||
| Cash flows from investing activities: | ||||||||||||||||||||
| Investment in subsidiary | — | — | — | |||||||||||||||||
| Net cash used in investing activities | — | — | — | |||||||||||||||||
| Cash flows from financing activities: | ||||||||||||||||||||
| Repayment of subordinated debt | — | — | (14,887) | |||||||||||||||||
| Proceeds from the issuance of subordinated debt | — | — | — | |||||||||||||||||
| Cash dividends paid, net of dividend reinvestment plan | (9,734) | (8,521) | (7,627) | |||||||||||||||||
| Proceeds from issuance of common stock | 44 | 47 | 59 | |||||||||||||||||
| Net settlement for employee tax withholding on restricted stock and options | (447) | (433) | (346) | |||||||||||||||||
| Net proceeds from exercise of stock options | 180 | 118 | 159 | |||||||||||||||||
| Net cash (used in) provided by financing activities | (9,957) | (8,789) | (22,642) | |||||||||||||||||
| Net (decrease) increase in cash and cash equivalents | 160 | (52) | (1,321) | |||||||||||||||||
| Cash at beginning of year | 1,929 | 1,981 | 3,302 | |||||||||||||||||
| Cash at end of year | $ | 2,089 | $ | 1,929 | $ | 1,981 | ||||||||||||||
| For the years ended December 31, | ||||||||||||
| (Dollars in thousands) | 2017 | 2016 | 2015 | |||||||||
| Cash flows from operating activities: | ||||||||||||
| Net income | $ | 19,393 | $ | 18,751 | $ | 16,148 | ||||||
| Adjustments to reconcile net income to net cash provided by operating activities: | ||||||||||||
| Equity in undistributed net income of subsidiaries | (16,922 | ) | (19,313 | ) | (17,277 | ) | ||||||
| Payment from subsidiary bank for stock compensation expense | 1,758 | 2,348 | 1,791 | |||||||||
| Changes in: | ||||||||||||
| Decrease (increase) in other assets | 832 | (697 | ) | (36 | ) | |||||||
| Decrease in other liabilities | 14 | 9 | (482 | ) | ||||||||
| Net cash provided by operating activities | 5,075 | 1,098 | 144 | |||||||||
| Cash flows from investing activities: | ||||||||||||
Investment in subsidiary(1) | — | (19,730 | ) | 781 | ||||||||
| Net cash (provided by) used in investing activities | — | (19,730 | ) | 781 | ||||||||
| Cash flows from financing activities: | ||||||||||||
Repayment of subordinated debt(2) | — | — | (10,825 | ) | ||||||||
Proceeds from the issuance of subordinated debt(2) | — | — | 15,000 | |||||||||
| Cash dividends paid | (6,241 | ) | (5,684 | ) | (5,158 | ) | ||||||
| Proceeds from issuance of common stock, net of expenses | 1,590 | 21,183 | 1,448 | |||||||||
| Net settlement for employee tax withholdings on restrict stock and options | (931 | ) | (442 | ) | — | |||||||
| Proceeds from exercise of stock options | 355 | 546 | 431 | |||||||||
| Tax benefit from stock-based compensation | — | 789 | 217 | |||||||||
| Net cash (used in) provided by financing activities | (5,227 | ) | 16,392 | 1,113 | ||||||||
| Net (decrease) increase in cash and cash equivalents | (152 | ) | (2,240 | ) | 2,038 | |||||||
| Cash and cash equivalents, beginning of year | 497 | 2,737 | 699 | |||||||||
| Cash and cash equivalents, end of year | $ | 345 | $ | 497 | $ | 2,737 | ||||||
The Parent Company’sCompany's Statements of Comprehensive Income and Statements of Changes in Stockholders’Shareholders' Equity are identical to the Consolidated Statements of Comprehensive Income and the Consolidated Statements of Changes in Stockholders’Shareholders' Equity and therefore are not presented here.
116
| 2017 | ||||||||||||||||
| (Dollars in thousands, except share data) | First Quarter | Second Quarter | Third Quarter | Fourth Quarter | ||||||||||||
| Interest and dividend income | $ | 24,364 | $ | 25,338 | $ | 27,045 | $ | 28,285 | ||||||||
| Interest expense | 1,517 | 1,803 | 1,911 | 2,279 | ||||||||||||
| Net interest income | 22,847 | 23,535 | 25,134 | 26,006 | ||||||||||||
| Provision for loan losses | 125 | 280 | 1,225 | (200 | ) | |||||||||||
| Net interest income after provision for loan losses | 22,722 | 23,255 | 23,909 | 26,206 | ||||||||||||
| Non-interest income | 3,594 | 3,710 | 3,728 | 3,926 | ||||||||||||
| Net gains (losses) on sales of investment securities | 540 | 229 | (284 | ) | 231 | |||||||||||
| Non-interest expense | 19,420 | 18,754 | 18,833 | 19,138 | ||||||||||||
| Income before income taxes | 7,436 | 8,440 | 8,520 | 11,225 | ||||||||||||
| Provision for income taxes | 1,864 | 2,845 | 3,014 | 8,505 | ||||||||||||
| Net income | $ | 5,572 | $ | 5,595 | $ | 5,506 | $ | 2,720 | ||||||||
| Basic earnings per share | $ | 0.48 | $ | 0.48 | $ | 0.48 | $ | 0.23 | ||||||||
| Diluted earnings per share | $ | 0.48 | $ | 0.48 | $ | 0.47 | $ | 0.23 | ||||||||
| 2016 | ||||||||||||||||
| (Dollars in thousands, except share data) | First Quarter | Second Quarter | Third Quarter | Fourth Quarter | ||||||||||||
| Interest and dividend income | $ | 22,465 | $ | 22,632 | $ | 23,191 | $ | 24,027 | ||||||||
| Interest expense | 1,382 | 1,343 | 1,374 | 1,424 | ||||||||||||
| Net interest income | 21,083 | 21,289 | 21,817 | 22,603 | ||||||||||||
| Provision for loan losses | 850 | 267 | 1,386 | 490 | ||||||||||||
| Net interest income after provision for loan losses | 20,233 | 21,022 | 20,431 | 22,113 | ||||||||||||
| Non-interest income | 3,204 | 3,519 | 3,402 | 3,514 | ||||||||||||
| Net gains on sales of investment securities | 2 | 63 | 546 | 191 | ||||||||||||
| Non-interest expense | 16,869 | 17,542 | 17,414 | 18,503 | ||||||||||||
| Income before income taxes | 6,570 | 7,062 | 6,965 | 7,315 | ||||||||||||
| Provision for income taxes | 2,257 | 2,291 | 2,251 | 2,362 | ||||||||||||
| Net income | $ | 4,313 | $ | 4,771 | $ | 4,714 | $ | 4,953 | ||||||||
| Basic earnings per share | $ | 0.41 | $ | 0.45 | $ | 0.41 | $ | 0.43 | ||||||||
| Diluted earnings per share | $ | 0.41 | $ | 0.45 | $ | 0.41 | $ | 0.43 | ||||||||
REPORT OF INDEPENDENT REGISTERED PUBLIC ACCOUNTING FIRM
Opinion on the Financial Statements
We have audited the accompanying consolidated balance sheets of Enterprise Bancorp, Inc. and its subsidiaries (the Company) as of December 31, 20172023 and 2016,2022, the related consolidated statements of income, comprehensive income, changes in stockholders'shareholders’ equity and cash flows for each of the twothree years in the period ended December 31, 2017,2023, and the related notes to the consolidated financial statements (collectively, the financial statements). In our opinion, the financial statements present fairly, in all material respects, the financial position of the Company as of December 31, 20172023 and 2016,2022, and the results of its operations and its cash flows for each of the twothree years in the period ended December 31, 2017,2023, in conformity with accounting principles generally accepted in the United States of America.
We have also audited, in accordance with the standards of the Public Company Accounting Oversight Board (United States) (PCAOB), the Company'sCompany’s internal control over financial reporting as of December 31, 2017,2023, based on criteria established in Internal Control -— Integrated Framework issued by the Committee of Sponsoring Organizations of the Treadway Commission in 2013, and our report dated March 13, 20188, 2024, expressed an unqualified opinion on the effectiveness of the Company'sCompany’s internal control over financial reporting.
Basis for Opinion
These financial statements are the responsibility of the Company’s management. Our responsibility is to express an opinion on the Company’s financial statements based on our audits. We are a public accounting firm registered with the PCAOB and are required to be independent with respect to the Company in accordance with U.S. federal securities laws and the applicable rules and regulations of the Securities and Exchange Commission and the PCAOB.
We conducted our audits in accordance with the standards of the PCAOB. Those standards require that we plan and perform the audits to obtain reasonable assurance about whether the financial statements are free of material misstatement, whether due to error or fraud. Our audits included performing procedures to assess the risks of material misstatement of the financial statements, whether due to error or fraud, and performing procedures that respond to those risks. Such procedures included examining, on a test basis, evidence regarding the amounts and disclosures in the financial statements. Our audits also included evaluating the accounting principles used and significant estimates made by management, as well as evaluating the overall presentation of the financial statements. We believe that our audits provide a reasonable basis for our opinion.
Critical Audit Matter
The critical audit matter communicated below is a matter arising from the current period audit of the financial statements that was communicated or required to be communicated to the audit committee and that: (1) relates to accounts or disclosures that are material to the financial statements and (2) involved our especially challenging, subjective or complex judgments. The communication of critical audit matter does not alter in any way our opinion on the financial statements, taken as a whole, and we are not, by communicating the critical audit matter below, providing separate opinions on the critical audit matter or on the accounts or disclosures to which it relates.
Allowance for Credit Losses for Loans
As described in Notes 1 and 4 of the consolidated financial statements, the Company’s allowance for credit losses for loans totaled $59.0 million as of December 31, 2023. The general reserve for larger groups of homogeneous loans collectively evaluated is evaluated on a pool basis. The Company has segmented the loan portfolio for groups of loans with similar risk characteristics by 1) loan type for pass-rated loans and 2) by internal risk rating for adversely classified loans not individually evaluated. The general reserve is comprised of a quantitative reserve based on the Company’s historical loss experience, a qualitative reserve based on management’s evaluation of several judgmental qualitative or environmental factors, andeconomic forecasts over the estimated life of the loan pools. The qualitative or environmental factors used by the Company include considerations such as commercial concentrations by industry, property type and real estate location; the growth and composition of the loan portfolio; trends in risk classification of individual loans and higher risk problem assets; the level of delinquent loans and non-performing loans; individually evaluated and restructured loans; the level of foreclosure activity; net charge-offs; and trends in the general levels of these indicators. In addition, the Company monitors expansion in the geographic market area; the experience level of lenders and any changes in underwriting criteria; and general conditionsand development markets in the Company's local region as well as changes in the current and forecasted economic conditions, such as changes in gross domestic product, the unemployment rate and new jobs created, real estate values, commercial vacancy rates, recession risk estimates and other relevant economic factors. The Company generally uses a two-year reasonable and supportable
117
forecast, and for periods beyond the forecast period, reverts to historical loss rates. The evaluation and measurement of the qualitative or environmental and economic forecasts requires management to apply a high degree of judgment and involves assumptions that are sensitive to change, for which future adjustments to the allowance may be necessary.
We identified the qualitative component of the general reserve for loans collectively evaluated in the allowance for credit losses for loans as a critical audit matter because auditing the underlying qualitative or environmental factors and economic forecasts used in establishing the general reserve involved a high degree of auditor judgment given the high degree of subjectivity exercised by management.
Our audit procedures related to management’s evaluation and establishment of the qualitative component of the general reserve for loans collectively evaluated in the allowance for credit losses for loans included the following, among others:
•We obtained an understanding of the relevant controls related to the qualitative or environmental factors and economic forecasts applied to the general reserve for loans collectively evaluated in the allowance for credit losses for loans and tested such controls for design and operating effectiveness, including controls over management’s establishment, review and approval of the qualitative or environmental factors and economic forecasts, including the data used in determining the qualitative or environmental factors and economic forecasts.
•We tested management’s process and significant judgments in the evaluation and establishment of the qualitative or environmental factors and economic forecasts used in the general reserve for loans collectively evaluated in the allowance for credit losses for loans, which included:
◦Validating the source of information used by management by comparing to the relevant internal or external information from which it was derived, as well as testing the completeness and accuracy of the source data used by management.
◦Evaluating the reasonableness of management’s judgments related to the qualitative or environmental factors and the correlation to potential losses by evaluating the adjustments in terms of magnitude and directional consistency based on the data utilized in the determination of the qualitative or environmental factors.
◦Evaluating the reasonableness of management’s indicators of current and forecasted economic factors, which include changes in gross domestic product, the unemployment rate and new jobs created, real estate values, commercial vacancy rates, recession risk estimates, among others, by comparing these forecasts to external and internal information sources.
/s/ RSM US LLP
We have served as the Company's auditor since 2015.
Boston, Massachusetts
March 13, 20188, 2024
118
REPORT OF INDEPENDENT REGISTERED PUBLIC ACCOUNTING FIRM
Opinion on the Internal Control overOver Financial Reporting
We have audited Enterprise Bancorp, Inc.'s’s (the Company) internal control over financial reporting as of December 31, 2017,2023, based on criteria established in Internal Control -— Integrated Framework issued by the Committee of Sponsoring Organizations of the Treadway Commission in 2013. In our opinion, the Company maintained, in all material respects, effective internal control over financial reporting as of December 31, 2017,2023, based on criteria established in Internal Control -— Integrated Framework issued by the Committee of Sponsoring Organizations of the Treadway Commission in 2013.
We have also audited, in accordance with the standards of the Public Company Accounting Oversight Board (United States) (PCAOB), the consolidated balance sheets of the Company as of December 31, 20172023 and 2016,2022, the related consolidated statements of income, comprehensive income, changes in stockholders'shareholders’ equity, and cash flows for each of the twothree years in the period ended December 31, 2017,2023, and the related notes to the consolidated financial statements (collectively, the financial statements) of the Company and our report dated March 13, 20188, 2024, expressed an unqualified opinion.
Basis for Opinion
The Company’s management is responsible for maintaining effective internal control over financial reporting and for its assessment of the effectiveness of internal control over financial reporting in the accompanying Management’s Report on Internal Control overOver Financial Reporting. Our responsibility is to express an opinion on the Company’s internal control over financial reporting based on our audit. We are a public accounting firm registered with the PCAOB and are required to be independent with respect to the Company in accordance with U.S. federal securities laws and the applicable rules and regulations of the Securities and Exchange Commission and the PCAOB.
We conducted our audit in accordance with the standards of the PCAOB. Those standards require that we plan and perform the audit to obtain reasonable assurance about whether effective internal control over financial reporting was maintained in all material respects. Our audit included obtaining an understanding of internal control over financial reporting, assessing the risk that a material weakness exists, and testing and evaluating the design and operating effectiveness of internal control based on the assessed risk. Our audit also included performing such other procedures as we considered necessary in the circumstances. We believe that our audit provides a reasonable basis for our opinion.
Definition and Limitations of Internal Control Over Financial Reporting
A company's internal control over financial reporting is a process designed to provide reasonable assurance regarding the reliability of financial reporting and the preparation of financial statements for external purposes in accordance with generally accepted accounting principles. A company's internal control over financial reporting includes those policies and procedures that (1) pertain to the maintenance of records that, in reasonable detail, accurately and fairly reflect the transactions and dispositions of the assets of the company; (2) provide reasonable assurance that transactions are recorded as necessary to permit preparation of financial statements in accordance with generally accepted accounting principles, and that receipts and expenditures of the company are being made only in accordance with authorizations of management and directors of the company; and (3) provide reasonable assurance regarding prevention or timely detection of unauthorized acquisition, use or disposition of the company's assets that could have a material effect on the financial statements.
Because of its inherent limitations, internal control over financial reporting may not prevent or detect misstatements. Also, projections of any evaluation of effectiveness to future periods are subject to the risk that controls may become inadequate because of changes in conditions, or that the degree of compliance with the policies or procedures may deteriorate.
/s/ RSM US LLP
Boston, Massachusetts
March 13, 20188, 2024
119
Item 9.Changes in and Disagreements with Accountants on Accounting and Financial Disclosure
None.
Evaluation of Disclosure Controls and Procedures
The Company maintains a set of disclosure controls and procedures and internal controls designed to ensure that the information required to be disclosed in reports that it files or furnishes to the SEC under the Securities Exchange Act of 1934, as amended (the "Exchange Act"), is recorded, processed, summarized, and reported within the time periods specified in the SEC’sSEC's rules and forms.
The Company carried out an evaluation as of the end of the period covered by this Form 10-K, under the supervision and with the participation of the Company’sCompany's management, including its principal executive officer and principal financial officer, of the effectiveness of the design and operation of the Company’sCompany's disclosure controls and procedures pursuant to Exchange Act Rule 13a-15(b). Based upon that evaluation, the Company’sCompany's principal executive officer and principal financial officer concluded that the Company’sCompany's disclosure controls and procedures are effective as of December 31, 2017.2023.
The Company’sCompany's management is responsible for establishing and maintaining adequate internal control over financial reporting. The Company’sCompany's internal control system was designed to provide reasonable assurance to the Company’sCompany's management and Board regarding the preparation and fair presentation of published financial statements. All internal control systems, however, no matter how well designed, have inherent limitations and may not prevent or detect misstatement. Also, projections of any evaluation of effectiveness to future periods are subject to the risk that controls may become inadequate because of changes in conditions, or that the degree of compliance with the policies or procedures may deteriorate. Therefore, even those systems determined to be effective can provide only reasonable assurance with respect to financial statement preparation and presentation.
The Company’sCompany's management assessed the effectiveness of the Company’sCompany's internal control over financial reporting as of December 31, 2017.2023. In making this assessment, it used the 2013 criteria set forth by the Committee of Sponsoring Organizations of the Treadway Commission in "Internal Control-Integrated Framework." Based on management’smanagement's assessment, the Company believes that, as of December 31, 2017,2023, the Company’sCompany's internal control over financial reporting is effective based on these criteria.
The Company’sCompany's independent registered public accounting firm has issued a report on the effectiveness of the Company’sCompany's internal control over financial reporting, which appears on page 137119 of this report.Form 10-K.
Changes in Internal Control Over Financial Reporting
There hashave been no changesignificant changes in the Company’sCompany's internal control over financial reporting that has occurred during the Company’sCompany's most recent fiscal quarter (i.e., the three months ended December 31, 2017)2023) that has materially affected, or is reasonably likely to materially affect, the Company's internal control over financial reporting.
Item 9B.Other Information
During the three months ended December 31, 2023, none of the directors or officers of the Company adopted or terminated a "Rule 10b5-1 trading arrangement" or a "non-Rule 10b5-1 trading arrangement," as each term is defined in Item 408 of Regulation S-K.
Item 9C. Disclosure Regarding Foreign Jurisdictions that Prevent Inspections.
Not applicable.
Part III
Items 10, 11, 12, 13 and 14.
The information required in Items 10, 11, 12, 13 and 14 of this partPart III of this Form 10-K is incorporated herein by reference to the Company’sCompany's definitive proxy statement for its annual meeting of stockholdersshareholders to be held on May 1, 2018,7, 2024, which it expects to
120
file with the SEC within 120 days of the end of the fiscal year covered by this report.Form 10-K. For additional information on availability of the Company’sCompany's corporate governance guidelines, see the section titled "Company Website," contained in Item 1, "Business," toof this report.Form 10-K.
Part IV
Item 15.Exhibits, Financial Statement Schedules
(a)The following documents are filed as part of this annual report:
(1) Financial Statements
See Index to Consolidated Financial Statements contained in Item 8 of this Form 10-K above.
(2) Financial Statement Schedules
None (information included in consolidated financial statements)
(3) Exhibits
Exhibit No. and Description
4.1Renewal Rights Agreement dated as of December 11, 2007 by and between the Company and Computershare Trust Company, N.A., as Rights Agent, including Terms of Series A Junior Participating Preferred Stock, Summary of Rights to Purchase Shares of Series A Junior Participating Preferred Stock, and Form of Rights Certificate attached as Exhibits A, B and C thereto, incorporated by reference to Exhibit 4.5 to the Company’s Current Report on Form 8-K filed on December 13, 2007 (File No. 333-79135).
121
10.7.1 Enterprise Bank and Trust Company Supplemental Life Insurance Plan adopted April 5, 2006, incorporated by reference to Exhibit 10.52 to the Company's Quarterly Report on Form 10-Q for the quarter ended September 30, 2006 (File No. 333-79135).
122
10.11.1.2 Amendment to the Enterprise Bank and Trust Company 2020 Variable Compensation Incentive Plan, incorporated by reference to the Company's Current Report on Form 8-K filed on November 16, 2020 (File No. 001-33912).
123 10.15.1 Enterprise Bank Supplemental Executive Retirement and Deferred Compensation Plan, incorporated by reference to Exhibit 10.17 to the Company's Annual Report on Form 10-K filed on March 13, 2019 (File No.001-33912). 10.15.7 Amendment to the Enterprise Bank Supplemental Executive Retirement and Deferred Compensation Plan, incorporated by reference to Exhibit 10.1 to the Company’s Current Report on Form 8-K filed on December 15, 2023 (File no. 001-33912) 23.0* Consent of RSM US LLP. 101* Interactive data files pursuant to Rule 405 of Regulation S-T: The following materials from Enterprise Bancorp, Inc.'s Annual Report on Form 10-K for the year ended December 31, 2023 were formatted in XBRL (eXtensible Business Reporting Language): |
(i) Consolidated Balance Sheets as of December 31, 20172023 and December 31, 2016,2022,
(ii) Consolidated Statements of Income for the years ended December 31, 2017, 20162023,2022 and 2015,2021,
(iii) Consolidated Statements of Comprehensive Income for the years ended December 31, 2017, 20162023, 2022 and 2015,2021,
(iv) Consolidated Statements of Changes in Equity for the years ended December 31, 2017, 20162023,2022 and 2015,2021,
(v) Consolidated Statements of Cash Flows for the years ended December 31, 2017, 20162023, 2022 and 2015,2021, and
(vi) Notes to Consolidated Financial Statements.
104*The cover page from the Company's Quarterly Report on Form 10-K for the year ended December 31, 2023 has been formatted in Inline XBRL and contained in Exhibit 101.
124
* Filed herewith
(b)Exhibits required by Item 601 of Regulation S-K
The exhibits listed above either have been previously filed and are incorporated herein by reference to the applicable prior filing or are filed herewith.
(c)Additional Financial Statement Schedules
Item 16. Form 10-K Summary
None.
ENTERPRISE BANCORP, INC.
SIGNATURES
Pursuant to the requirements of Section 13 or 15(d) of the Securities Exchange Act of 1934, the registrant has duly caused this report to be signed on its behalf by the undersigned thereunto duly authorized.
| ENTERPRISE BANCORP, INC. | |||||||||
| March | By: | /s/ | |||||||
| Executive Vice President, | |||||||||
| Chief Financial Officer and Treasurer | |||||||||
Pursuant to the requirements of the Securities Exchange Act of 1934, as amended, this report has been signed below by the following persons on behalf of the registrant and in the capacities and on the dates indicated.
| /s/ George L. Duncan | Chairman | March | |||||||||||||
| George L. Duncan | |||||||||||||||
| /s/ Kenneth S. Ansin | Director | March | |||||||||||||
| Kenneth S. Ansin | |||||||||||||||
| /s/ Gino J. Baroni | Director | March | |||||||||||||
| Gino J. Baroni | |||||||||||||||
| /s/ John P. Clancy, Jr. | Director, Chief Executive Officer | March | |||||||||||||
| John P. Clancy, Jr. | |||||||||||||||
| /s/ John R. Clementi | Director | March | |||||||||||||
| John R. Clementi | |||||||||||||||
| /s/ James F. Conway, III | Lead Director, Vice Chairman | March | |||||||||||||
| James F. Conway, III | |||||||||||||||
| /s/ Carole A. Cowan | Director | March | |||||||||||||
| Carole A. Cowan | |||||||||||||||
125
| /s/ Normand E. Deschene | Director | March | |||||||||||||
| Normand E. Deschene | |||||||||||||||
| /s/ John T. Grady, Jr. | Director | March | |||||||||||||
| John T. Grady, Jr. | |||||||||||||||
| /s/ Mary Jane King | Director | March | |||||||||||||
| Mary Jane King | |||||||||||||||
| /s/ John A. Koutsos | Director, Secretary | March | |||||||||||||
| John A. Koutsos | |||||||||||||||
| /s/ Joseph C. Lerner | Director | March | |||||||||||||
| Joseph C. Lerner | |||||||||||||||
| /s/ Shelagh E. Mahoney | Director | March | |||||||||||||
| Shelagh E. Mahoney | |||||||||||||||
| /s/ Richard W. Main | Director, President | March | |||||||||||||
| Richard W. Main | |||||||||||||||
| /s/Jacqueline F. Moloney | Director | March | |||||||||||||
| Jacqueline F. Moloney | |||||||||||||||
| /s/ Michael T. Putziger | Director | March | |||||||||||||
| Michael T. Putziger | |||||||||||||||
| /s/ Carol L. Reid | Director | March | |||||||||||||
| Carol L. Reid | |||||||||||||||
| /s/ Nickolas Stavropoulos | Director | March 8, 2024 | |||||||||||||
| Nickolas Stavropoulos | |||||||||||||||
| /s/ | |||||||||||||||
| Executive Vice President, Chief | March | ||||||||||||||
| Financial Officer and Treasurer | |||||||||||||||
| /s/ Michael K. Sullivan | Accounting Director | March | |||||||||||||
| Michael K. Sullivan | |||||||||||||||