United States
Securities and Exchange Commission
Washington, D.C. 20549
Form 10-K
[X]x ANNUAL REPORT PURSUANT TO SECTION 13 OR 15(d) OF THE SECURITIES EXCHANGE ACT OF 1934
For the Fiscal Year Ended December 31, 201127, 2014
Or
[ ]¨ TRANSITION REPORT PURSUANT TO SECTION 13 OR 15(d) OF THE SECURITIES EXCHANGE ACT OF 1934
For the transition period from _____________ to _____________
Commission File Number 0-6966
ESCALADE, INCORPORATED
(Exact name of registrant as specified in its charter)
Indiana (State of incorporation) | 13-2739290 (I.R.S. EIN) |
817 Maxwell Ave, Evansville, Indiana | ||
(Address of Principal Executive Office) | 47711 (Zip Code) |
812-467-4449
(Registrant’sRegistrant's Telephone Number)
Securities registered pursuant to Section 12(b) of the Act
Common Stock, No Par Value (Title of Class) | The NASDAQ Stock Market LLC | |
(Name of Exchange on Which Registered) |
Securities registered pursuant to section 12(g) of the Act: NONE
Indicate by check mark if the registrant is a well-known seasoned issuer, as defined in Rule 405 of the Securities
Yes [ ]¨ No [X]x
Indicate by check mark if the registrant is not required to file reports pursuant to Section 13 or Section 15(d) of the Act
Yes [ ]¨ No [X]x
Indicate by check mark whether the registrant (1) has filed all reports required to be filed by Section 13 or 15(d) of the Securities Exchange Act of 1934 during the preceding 12 months (or for such shorter period that the registrant was required to file such reports), and (2) has been subject to such filing requirements for the past 90 days. Yes [X]x No [ ]¨
Indicate by check mark whether the registrant has submitted electronically and posted on its corporate Web site, if any, every Interactive Data File required to be submitted and posted pursuant to Rule 405 of Regulation S-T during the preceding 12 months (or for such shorter period that the registrant was required to submit and post such files). Yes [X]x No [ ]¨
Indicate by check mark if disclosure of delinquent filers pursuant to Item 405 of Regulation S-K is not contained herein, and will not be contained, to the best of registrant’sregistrant's knowledge, in definitive proxy or information statements incorporated by reference in Part III of this Form 10-K or any amendment to this Form 10-K. [ ]¨
Indicate by check mark whether the registrant is a large accelerated filer, an accelerated filer, or a non-accelerated filer, or a smaller reporting company. See the definitions of “Large accelerated filer,” “accelerated filer” and “smaller reporting company” in Rule 12b-2 of the Exchange Act.
| Large accelerated filer | Accelerated filer |
| Non-accelerated filer | Smaller reporting company |
Indicate by checkmark whether the registrant is a shell company (as defined in Rule 12 b-2 of the Exchange Act).
Yes [ ]¨ No [X]x
Aggregate market value of common stock held by nonaffiliates of the registrant as of July 9, 201112, 2014 based on the closing sale price as reported on the NASDAQ Global Market: $53,085,149$170,640,965
The number of shares of Registrant’sRegistrant's common stock (no par value) outstanding as of February 6, 2012: 12,891,757.11, 2015: 14,013,809.
DOCUMENTS INCORPORATED BY REFERENCE
Certain portions of the registrant’sregistrant's Proxy Statement relating to its annual meeting of stockholders scheduled to be held onApril 27, 201224, 2015 are incorporated by reference into Part III of this Report.
Escalade, Incorporated and Subsidiaries
Table of Contents
General
Escalade, Incorporated (“Escalade”(Escalade, the Company, we, us or “Company”)our) now operates in twoone business segments:segment: Sporting Goods and Information Security and Print Finishing (or “Martin Yale Group”)(Escalade Sports). Escalade and its predecessors have more than 80 years of manufacturing and selling experience in thesethis industry. Previously, we operated in two industries.businesses segments: Sporting Goods (Escalade Sports) and Information Security and Print Finishing (Martin Yale Group). On October 1, 2014, the Company completed the sale of the Information Security business. The sale of the Information Security business, coupled with the previously announced sale of our Print Finishing business on June 30, 2014, represents the Company’s exit from the Information Security and Print Finishing segment. As a result, the Information Security and Print Finishing segment has been classified as discontinued operations for all periods presented and certain assets and liabilities in prior periods are classified as held for sale.
The following table presents the percentages contributed to Escalade’s net sales by each of its business segments:
| 2011 | 2010 | 2009 | 2014 | 2013 | 2012 | |||||||||||||||||||
| Sporting Goods | 72 | % | 71 | % | 66 | % | 87 | % | 81 | % | 76 | % | ||||||||||||
| Information Security and Print Finishing | 28 | % | 29 | % | 34 | % | ||||||||||||||||||
| Discontinued Operations | 13 | % | 19 | % | 24 | % | ||||||||||||||||||
| Total Net Sales | 100 | % | 100 | % | 100 | % | 100 | % | 100 | % | 100 | % | ||||||||||||
For additional segment information, see Note 14 – Operating Segment and Geographic Information in the consolidated financial statements.
Sporting Goods
Headquartered in Evansville, Indiana, Escalade Sports manufactures, imports, and distributes widely recognized sporting goods brands in familybasketball goals, archery, indoor and outdoor game recreation fitness, training, and huntingfitness products through major sporting goods retailers, specialty dealers, key on-line retailers, traditional department stores and mass merchandise retailers, and sporting goods specific retailers.merchants. Escalade is the world’s largest producer ofa leader in table tennis tables.tables, residential in-ground basketball goals and in archery bows. Some of the Company’s most recognized brands include:
| Product Segment | Brand Names | |
| Archery | Bear Archery®, Trophy Ridge®, Whisker Biscuit®, Cajun Bowfishing™ | |
| Table Tennis | STIGA®, Ping-Pong®, Prince®, | |
| Basketball | Goalrilla™, Goaliath®, Silverback® | |
| Play Systems | Woodplay®, Childlife® | |
| Fitness | The STEP®, USWeight™ | |
| Game Tables (Hockey and Soccer) | ||
| Darting | Unicorn®, Accudart®, Arachnid®, Nodor®, Winmau® | |
| Outdoor Games | Zume Games®, Pickleball Now |
In 2011,During 2014, 2013 and 2012 the Company hashad one customer, in the Sporting Goods segment, Dick’s Sporting Goods, which accounted for approximately16% 19%, 20% and 23%, respectively, of total consolidated gross revenues.the Company’s revenues from continuing operations.
As of December 27, 2014, the Company had approximately 23% of its total accounts receivable with Dick’s Sporting Goods. As of December 28, 2013 the Company had approximately 27% and 12% of its total accounts receivable with Dick’s Sporting Goods and The Sports Authority, respectively.
Escalade Sports manufactures in the USA and Mexico and imports product from Asia, where the Company utilizes a number of contract manufacturers.
Certain products produced by Escalade Sports are subject to regulation by the Consumer Product Safety Commission. The Company believes it is in material compliance with all applicable regulations.
Information Security and Print Finishing
Martin Yale Group has increasingly expanded its focus on the information security requirements of larger corporate customers, governments, and strategic business partners. The Company is particularly focused on addressing information security issues including the decommissioning or destruction of data stored on optical, solid state, magnetic, and traditional media like paper to meet the increasingly strict security standards set by the National Security Administration, National Institute of Standards and Technology, Deutsches Institut fur Normung (German Institute for Standardization), the European Union, and many other governments and organizations around the world. Martin Yale Group continues to focus on the print finishing sector with a particular focus on digital print applications.
Martin Yale Group has a worldwide presence with manufacturing facilities in Indiana and Germany and joint venture manufacturing facilities in the Czech Republic and Taiwan. Martin Yale Group has sales offices in the USA, Germany, United Kingdom, France, Spain, China, Italy, South Africa and Sweden.
Martin Yale Group products include: shredders, disintegrators, degaussers, paper folders, letter openers, and paper cutters/trimmers. The key Martin Yale Group brands include martin yale®, intimus®, and papermonster®.
Martin Yale Group products and services are sold directly to end-users as well as through retailers, wholesalers, catalogs, specialty dealers, and business partners. No single Martin Yale Group customer accounted for more than 10% of Information Security and Print Finishing sales during 2011.
Marketing and Product Development
The Company makes a substantial investment in product development and brand marketing to differentiate its product line from its competition. Each operating segment conductsWe conduct market research and development efforts to design products which satisfy existing and emerging consumer needs. On a consolidated basis, the Company incurred research and development costs of approximately $1.4$1.7 million, $1.9$1.2 million, and $2.0$1.0 million in 2011, 20102014, 2013 and 2009,2012, respectively.
The Company also makes investments in brand marketing to properly communicate the specific attributes and qualities of its products. The Company advertises directly to the consumer or end-user as well as through its retail partners in the form of advertising and other promotional allowances.
Competition
Escalade is subject to competition with various manufacturers in each product line produced or sold by Escalade.line. The Company is not aware of any other single company that is engaged in both the same industriesproduct lines as Escalade or that produces the same range of products as Escalade within such industries.Escalade. Nonetheless, competition exists for many Escalade products within both the Sporting Goods and Information Security and Print Finishing industries.products. Some competitors are larger and have substantially greater resources than the Company. Escalade believes that its long-term success depends on its ability to strengthen its relationship with existing customers, attract new customers and develop new products that satisfy the quality and price requirements of Sporting Goods and Information Security and Print Finishingsporting goods customers.
Licenses, Trademarks and Brand Names
The Company has an agreement and contract with STIGA Sports AB, a 50% owned joint venture, for the exclusive right and license to distribute and produce table tennis equipment under the brand name STIGA® for the United States and Canada. The Company also owns several registered trademarks and brand names including but not limited to Ping-Pong®, Bear Archery®, Goalrillaä, The Step®, and Wood Play® which are used in the Sporting Goods business segment and intimus® and papermonster® which are used in the Information Security and Print Finishing business segment..
Backlog and Seasonality
Sales are based primarily on standard purchase orders and in most cases orders are shipped within the same month received. Unshipped orders at the end of the fiscal year (backlog) were not material and therefore are not an indicator of future results. IncreasedDue to diversity in product categories, such as playground and basketball, over the past few years has helped the Company achieve more evenly distributed revenues in Sporting Goods. The Company does not expect Sporting Goods sales to be seasonal in the future. Demand for Information Security and Print Finishing hashave not been seasonal and isare not expected to be so in the future.
| 4 |
Employees
The number of employees at December 31, 201127, 2014 and December 25, 201028, 2013 for each business segment were as follows:
| 2011 | 2010 | 2014 | 2013 | |||||||||||||
| Sporting Goods | ||||||||||||||||
| USA | 281 | 284 | 372 | 356 | ||||||||||||
| Mexico | 105 | 98 | 83 | 106 | ||||||||||||
| Asia | 6 | 8 | 11 | 10 | ||||||||||||
| 392 | 390 | 466 | 472 | |||||||||||||
| Information Security and Print Finishing | ||||||||||||||||
| Discontinued Operations | ||||||||||||||||
| USA | 90 | 89 | — | 68 | ||||||||||||
| Europe | 126 | 121 | — | 91 | ||||||||||||
| Asia | 10 | 8 | — | 10 | ||||||||||||
| Africa | — | 7 | ||||||||||||||
| 226 | 218 | — | 176 | |||||||||||||
| Total | 618 | 608 | 466 | 648 | ||||||||||||
The I.U.E./C.W.A. (United Electrical Communication Workers of America, AFL-CIO) represents hourly rated employees at the Escalade Sports’ Evansville, Indiana distribution center. There are approximately 1318 covered employees at December 31, 2011.27, 2014. A 3-yearthree year labor contract was negotiated and renewed in April 2009; the new agreement2013 and expires on April 30, 2012.2016. Management believes it has satisfactory relations with its employees.
Sources of Supplies
Raw materials for Escalade’sEscalade's various product lines consist of wood, steel, aluminum, plastics, fiberglass and packaging. Escalade relies upon suppliers in various countries and upon various third party Asian manufacturers for certainmany of its game tables and non-security paper shredders.products. The Company believes that these sources will continue to provide adequate supplies as needed and that all other materials needed for the Company’s various operations are available in adequate quantities from a variety of domestic and foreign sources.
SEC Reports
The Company’s Internet site (www.escaladeinc.com) makes available free of charge to all interested parties the Company’s annual report on Form 10-K, quarterly reports on Form 10-Q, and current reports on Form 8-K, and all amendments to those reports, as well as all other reports and schedules filed electronically with the Securities and Exchange Commission (the “Commission”)Commission), as soon as reasonably practicable after such material is electronically filed with or furnished to the Commission. Interested parties may also find reports, proxy and information statements and other information on issuers that file electronically with the Commission at the Commission’sCommission's Internet site (http://www.sec.gov).at www.sec.gov.
Sales at Martin Yale Group increased but net loss grew in 2011 and net losses could continue to grow in 2012.
Overall sales in Information Security and Print Finishing increased, but net losses further declined. The increase in lossesOperating results may be impacted by our Martin Yale Group in 2011 over 2010 is due mainly to inefficiencies in bringing new products to the market, customer pricing pressures and high organizational costs. In addition, continued weaknesschanges in the economy that influence business and consumer spending.
Operating results are directly impacted by the health of the North American and to a lesser extent, European and Asian economies. While the global officeeconomy is experiencing some level of recovery from the recent downturn, we cannot predict how robust the recovery will be or whether or not it will be sustained. If the economic recovery slows, or if the economy experiences a prolonged period of decelerating or negative growth, the Company’s results of operations may be negatively impacted. In general, the Company’s sales depend on discretionary spending by consumers. Business and financial performance may be adversely affected by current and future economic conditions, including unemployment levels, energy costs, interest rates, recession, inflation, the impact of natural disasters and terrorist activities, and other matters that influence business and consumer spending.
Fluctuation in economic conditions could prevent the Company from accurately forecasting demand for its products channelwhich could adversely affect its operating results or market share.
Fluctuation in economic conditions and the government sales channel primarilymarket instability in the United States and the United Kingdom and prolonged economic weakness in Spain and certain other European countries continue to provide challenges. Sales in Information Security and Print Finishing may not continue to increase in 2012 and could decline. Improving profitability in the Information Security and Print Finishing segment will prove to be a challenge. The Company cannot provide any assurance thatglobally makes it will be able to maintain or increase sales levels in the future.
Ifdifficult for the Company, would lose significant customers in theand suppliers to accurately forecast future product demand trends, which could cause the Company may haveto produce excess products that can increase inventory carrying costs and result in obsolete inventory. Alternatively, this forecasting difficulty could cause a shortage of products, or materials used in replacing such lost revenues.products, that could result in an inability to satisfy demand for products and a loss of market share.
The Company has several large customers and historically has derived substantial revenues from those customers. The Company needs to continue to expand its customer base to minimize the effects of the loss of any single customer in the future. If sales to one or more significant customers would be lost or materially reduced, there can be no assurance that the Company will be able to replace such revenues, which losses could have a material adverse effect on the Company’s business, results of operations and financial condition.
Markets are highly competitive which could limit the Company’s growth and the Company may not continue to compete successfully.reduce profitability.
The market for sporting goods and information security and print finishing products is highly fragmented and intensely competitive. A majority of the Company’s products are in markets that are experiencing low growth rates. Escalade competes with a variety of regional, national and international manufacturers for customers, employees, products, services and other important aspects of the business. In Sporting Goods, theThe Company has historically sold a large percentage of its sporting goods products to mass merchandisers and has increasingly attempted to expand sales to specialty retailer and dealer markets. Similarly, the Company has traditionally sold information security and print finishing products to office products retailers, specialty machine dealers and government channels. In addition to competition for sales into those distribution channels, vendors also must compete in sporting goods with large format sporting goods stores, traditional sporting goods stores and chains, warehouse clubs, discount stores and department stores, and in information security and print finishing products with office supply superstores, computer and electronics superstores, contract stationers, and others.stores. Competition from on-line retailers may also impact sales. Some of the current and potential competitors are larger than Escalade and have substantially greater financial resources that may be devoted to sourcing, promoting and selling their products, and may discount prices more heavily than the Company can afford.
If the Company is unable to predict or effectively react to changes in consumer demand, it may lose customers and sales may decline.
Success depends in part on the ability to anticipate and respond in a timely manner to changing consumer demand and preferences regarding sporting goods and information security and print finishing products.goods. Products must appeal to a broad range of consumers whose preferences cannot be predicted with certainty and are subject to change. The Company often makes commitments to manufacture products months in advance of the proposed delivery to customers. If Escalade misjudges the market for products, sales may decline significantly. The Company may have to take significant inventory markdowns on unpopular products that are overproduced and/or miss opportunities for other products that may rise in popularity, both of which could have a negative impact on profitability. A major shift in consumer demand away from sporting goods or information security and print finishing products could also have a material adverse effect on the Company’s business, results of operations and financial condition.
The Company derives a substantial portion of its revenue from a few significant customers and loss of any of these customers could materially affect our results of operations and financial condition.
The Company has one major customer which accounted for more than ten percent of consolidated gross sales and several other large customers, none of which represent more than ten percent of consolidated gross sales, and historically has derived substantial revenues from these customers. The Company needs to continue to expand its customer base to minimize the effects of the loss of any single customer in the future. If sales to one or more of the large customers would be lost or materially reduced, there can be no assurance that the Company will be able to replace such revenues, which could have a material adverse effect on the Company's business, results of operations and financial condition.
Quarterly operating results are subject to fluctuation.
Operating results have fluctuated from quarter to quarter in the past, and the Company expects that they will continue to do so in the future. Earnings may not recover to historical levels and may fall short of either a prior fiscal period or market expectations. Factors that could cause these quarterly fluctuations include the following:international, national and local general economic and market conditions; the size and growth of the overall Sporting Goods and Information Security and Print Finishingsporting goods markets; intense competition among manufacturers, marketers, distributors and sellers of products; demographic changes; changes in consumer preferences; popularity of particular designs, categories of products and sports; seasonal demand for products; the size, timing and mix of purchases of products; fluctuations and difficulty in forecasting operating results; ability to sustain, manage or forecast growth and inventories; new product development and introduction; ability to secure and protect trademarks, patents and other intellectual property; performance and reliability of products; customer service; the loss of significant customers or suppliers; dependence on distributors; business disruptions; increased costs of freight and transportation to meet delivery deadlines; changes in business strategy or development plans; general risks associated with doing business outside the United States, including, without limitation: exchange rates, import duties, tariffs, quotas and political and economic instability; changes in government regulations; any liability and other claims asserted against the Company; ability to attract and retain qualified personnel; and other factors referenced or incorporated by reference in this Form 10-K and any other filings with the Securities and Exchange Commission.
Operating results may be impacted by changes in the economy that impact business and consumer spending.
In general, the Company’s sales depend on discretionary spending by consumers. The economic downturn experienced in both the United States and the global economy has resulted in reduced consumer demand and reduced selling price and adversely impacted sales. A continuance of this economic downturn could result in further declines in revenues and impair growth in 2012. Severely negative economic conditions could greatly impair the ability and willingness of consumers to buy products. Operating results are directly impacted by the health of the North American, European and Asian economies. Business and financial performance may be adversely affected by current and future economic conditions, including unemployment levels, energy costs, interest rates, recession, inflation, the impact of natural disasters and terrorist activities, and other matters that influence business and consumer spending.
If national and global financial markets do not improve, potential disruptions in the credit markets may adversely affect business, including the availability and cost of short-term funds for liquidity requirements and ability to meet long-term commitments, which could adversely affect results of operations, cash flows and financial condition.
If internal funds are not available from operations, the Company may be required to rely on the banking credit and equity markets to meet financial commitments and short-term liquidity needs. Disruptions in the capital and credit markets could adversely affect the Company’s ability to borrow pursuant to its Credit Agreement with JP Morgan Chase Bank, N.A. (Chase) or to borrow from other financial institutions. Access to funds under the Credit Agreement or pursuant to arrangements with other financial institutions is dependent on Chase’s or other financial institutions’ ability to meet funding commitments. Financial institutions, including Chase, may not be able to meet their funding commitments if they experience shortages of capital and liquidity or if they experience high volumes of borrowing requests from other borrowers within a short period of time. There can be no assurance that the Company would be able to replace its current Credit Agreement on favorable terms, if at all, in the event that replacement would become necessary or desirable.
Longer term disruptions in the capital and credit markets as a result of uncertainty, changing or increased regulation, reduced alternatives or failures of significant financial institutions could adversely affect access to the liquidity needed for business. Any disruption could require the Company to take measures to conserve cash until the markets stabilize or until alternative credit arrangements or other funding for our business needs can be arranged. Such measures could include deferring capital expenditures and reducing or eliminating future share repurchases, dividend payments or other discretionary uses of cash.
Current financial conditions in the United States and globally may have significant effects on customers and suppliers that would result in material adverse effects on business, operating results and stock price.
Current financial conditions in the United States and globally and concern that the worldwide economy may enter into a prolonged recessionary period may materially adversely affect customers’ access to capital or willingness to spend capital on products and/or their levels of cash liquidity with which to pay for products that they will order or have already ordered from the Company. In addition, current financial conditions may materially adversely affect suppliers’ access to capital and liquidity with which to maintain their inventories, production levels and/or product quality could cause them to raise prices, lower production levels or result in their ceasing operations. Continuing adverse economic conditions in the Company’s markets would also likely negatively impact business, which could result in: (1) reduced demand for products; (2) increased price competition for products; (3) increased risk of excess or obsolete inventories; (4) increased risk of collectability of cash from customers; (5) increased risk in potential reserves for doubtful accounts and write-offs of accounts receivable; (6) reduced revenues; and (7) higher operating costs as a percentage of revenues.
All of the foregoing potential consequences of current financial conditions are difficult to forecast and mitigate. As a consequence, operating results for a particular period are difficult to predict, and, therefore, prior results are not necessarily indicative of future results to be expected in future periods. Any of the foregoing effects could have a material adverse effect on the Company’s business, results of operations and financial condition and could adversely affect stock price.
Negative economic conditions could prevent the Company from accurately forecasting demand for its products which could adversely affect its operating results or market share.
The current negative economic conditions and market instability in the United States and globally makes it increasingly difficult for the Company, customers and suppliers to accurately forecast future product demand trends, which could cause the Company to produce excess products that can increase inventory carrying costs and result in obsolete inventory. Alternatively, this forecasting difficulty could cause a shortage of products, or materials used in products, that could result in an inability to satisfy demand for products and a loss of market share.
The Company may pursue strategic acquisitions, whichdivestitures, or investments and the failure of a strategic transaction to produce anticipated results or the inability to fully integrate an acquired company could have an adverse impact on itsthe Company’s business.
In the past, theThe Company has made acquisitions of complementary companies or businesses, which have been part of the strategic plan, and may continue to pursue acquisitions in the future from time to time. Acquisitions may result in difficulties in assimilating acquired companies, and may result in the diversion of capital and management’s attention from other business issues and opportunities. The Company may not be able to successfully integrate operations that it acquires, including personnel, financial systems, distribution, and operating procedures. If the Company fails to successfully integrate acquisitions, the Company’s business could suffer. In addition, acquisitions may result in the integrationincurrence of debt, contingent liabilities, amortization expense or write-offs of goodwill or other intangibles, any acquired business,of which could affect the Company’s financial position. The Company also has sometimes divested or discontinued certain operations, assets, and its financial results, may adversely affect operating results.products that did not perform to the Company’s expectations or no longer fit with the Company’s strategic objectives. Escalade will consider acquisitions, divestitures, and investments in the future, butone or more of which, individually or in the Company currently does not have any agreements with respectaggregate, could be material to any such acquisitions.the Company’s overall business, operations or financial position.
Growth may strain resources, which could adversely affect the Company’s business and financial performance.
Both the Sporting Goods and Information Security and Print Finishing businesses haveThe Company has grown in the past through strategic acquisitions. Growth places additional demands on management and operational systems. If the Company is not successful in continuing to support operational and financial systems, expanding the management team and increasing and effectively managing customers and suppliers, growth may result in operational inefficiencies and ineffective management of the Company’s business, which could adversely affect its business and financial performance.
The Company’s ability to operate and expand business and to respond to changing business and economic conditions will be dependent upon the availability of adequate capital.
The rate of expansion will also depend on the availability of adequate capital, which in turn will depend in large part on cash flow generated by the business and the availability of equity and debt capital. EscaladeThe Company can make no assurances that it will be able to obtain equity or debt capital on acceptable terms or at all, especially consideringall. Our current senior secured revolving credit facility contains provisions that limit our ability to incur additional indebtedness or make substantial asset sales, which might otherwise be used to finance our operations. In the current disruptionsevent of our insolvency, liquidation, dissolution or reorganization, the lenders under our senior secured revolving credit facility would be entitled to payment in the credit markets.full from our assets before distributions, if any, to our stockholders.
FailureThe Company could suffer if it fails to improve operational efficiencyattract and reduce administrative costs could have a material adverse effect on the Company’s liquidity, financial positionretain skilled management and results of operations.key personnel.
The Company’s success depends in large part on its ability to improve profit margins is largely dependent on the success of on-going initiatives to streamline infrastructure, improve operational efficiencyattract and the reduction of administrative costsretain highly qualified management executives and key personnel. Significant competition for qualified candidates exists in certain segments of the Company. Failure to continue to implement these initiatives successfully, or the failure of such initiatives to result in improved profitability, could have a material adverse effect on the Company’s liquidity, results ofbusiness lines and geographic locations. If the Company is not able to hire and retain its executives and key personnel, or if the compensation costs required to attract and retain such individuals becomes more expensive, the Company may suffer adverse consequences to its business, operations, and financial position.
condition.
The Company’s business may be adversely affected by the actions of and risks associated with third-party suppliers.
The raw materials that the Company purchases for manufacturing operations and many of the products that it sells are sourced from a wide variety of third-party suppliers. The Company cannot control the supply, design, function or cost of many of the products that are offered for sale and are dependent on the availability and pricing of key materials and products. Disruptions in the availability of raw materials used in production of these products may adversely affect sales and result in customer dissatisfaction. In addition, global sourcing of many of the products sold is an important factor in the Company’s financial performance. The ability to find qualified suppliers and to access products in a timely and efficient manner is a significant challenge, especially with respect to goods sourced outside the United States. Political instability, financial instability of suppliers, merchandise quality issues, trade restrictions, tariffs, currency exchange rates, transport capacity and costs, inflation and other factors relating to foreign trade are beyond the Company’s control.
Historically, instability in the political and economic environments of the countries in which the Company or its suppliers obtain products and raw materials has not had a material adverse effect on operations. However, the Company cannot predict the effect that future changes in economic or political conditions in such foreign countries may have on operations. In the event of disruptions or delays in supply due to economic or political conditions in foreign countries, such disruptions or delays could adversely affect results of operations unless and until alternative supply arrangements could be made. In addition, products and materials purchased from alternative sources may be of lesser quality or more expensive than the products and materials currently purchased abroad.
Deterioration in relationships with suppliers or in the financial condition of suppliers could adversely affect liquidity, results of operations and financial position.
Access to materials, parts and supplies is dependent upon close relationships with suppliers and the ability to purchase products from the principal suppliers on competitive terms. The Company does not enter into long-term supply contracts with these suppliers, and has no current plans to do so in the future. These suppliers are not required to sell to the Company and are free to change the prices and other terms. Any deterioration or change in the relationships with or in the financial condition of the Company’s significant suppliers could have an adverse impact on its ability to procure materials and parts necessary to produce products for sale and distribution. If any of the significant suppliers terminated or significantly curtailed its relationship with the Company or ceased operations, the Company would be forced to expand relationships with other suppliers, seek out new relationships with new suppliers or risk a loss in market share due to diminished product offerings and availability. Any change in one or more of these suppliers’ willingness or ability to continue to supply the Company with their products could have an adverse impact on the Company’s liquidity, results of operations and financial position.
Disruptions to our supply chain could have an adverse impact on our operations.
Many of the Company’s products are manufactured outside the United States. Those products must be transported by third parties over large geographic distances. Delays in the shipment or delivery of our products could occur due to work stoppages, port strikes, lack of availability of transportation, and other factors beyond the Company’s control. Such delays could impair our ability to timely and efficiently deliver our products, and could adversely impact our operating results.
EscaladeThe Company may be subject to product warranty claims that require the replacement or repair of the product sold. Such warranty claims could adversely affect Escalade’sthe Company’s financial position and relationships with its customers.
The Company manufactures and/or distributes a variety of products in both its Sporting Goods and Information Security and Print Finishing business segments.products. From time to time, such products may contain manufacturing defects or design flaws that are not detected prior to sale, particularly as to new product introductions or upon design changes to existing products. The failure to identify and correct manufacturing defects and product design issues prior to the sale of those products could result in product warranty claims that result in costs to replace or repair any such defective products. Because many of the Company’s products are sold to retailers for broad consumer distribution and/or to customers who buy in large quantities, the costs associated with product warranty claims could have a material adverse effect on the Company’s results of operations and financial position. Product warranty claims also could cause customer dissatisfaction that may have a material adverse effect on the Company’s reputation and on the Company’s relationships with its customers, which may result in lost or reduced sales.
| 8 |
EscaladeThe Company may be subject to product liability claimsvarious types of litigation and the Company’s insurance may not be sufficient to cover damages related to those claims.
From time to time the Company or its subsidiaries may be involved in lawsuits or other claims arising in the course of business, including those related to product liability, consumer protection, employment, intellectual property, torts and other matters, In addition, it may be subject to lawsuits relating to the design, manufacture or distribution of its products. The Company may be subject to lawsuits resulting from injuries associated with the use of sporting goods equipment that it sells and information security and print finishing products that it sells.sold prior to divesting that business. The Company may incur losses relating to these claims or the defense of these claims. There is a risk that claims or liabilities will exceed the Company’s insurance coverage. In addition, the Company may be unable to retain adequate liability insurance in the future. Further, the Company is subject to regulation by the Consumer Product Safety Commission and similar state regulatory agencies. If the Company fails to comply with government and industry safety standards, it may be subject to claims, lawsuits, fines, product recalls and adverse publicity that could have a material adverse effect on the Company’s business, results of operations and financial condition.
Intellectual property rights are valuable, and any inability to protect them could reduce the value of products.
The Company obtains patents, trademarks and copyrights for intellectual property, which represent important assets to the Company. If the Company fails to adequately protect intellectual property through patents, trademarks and copyrights, its intellectual property rights may be misappropriated by others, invalidated or challenged, and our competitors could duplicate the Company’s products or may otherwise limit any competitive design or manufacturing advantages. The Company believes that success is likely to depend upon continued innovation, technical expertise, marketing skills and customer support and services rather than on legal protection of intellectual property rights. However, the Company intends to aggressively assert its intellectual property rights when necessary.
The Company is subject to risks associated with laws and regulations related to health, safety and environmental protection.
Products, and the production and distribution of products, are subject to a variety of laws and regulations relating to health, safety and environmental protection. Laws and regulations relating to health, safety and environmental protection have been passed in several jurisdictions in which the Company operates in the United States and abroad. Although the Company does not anticipate any material adverse effects based on the nature of operations and the thrust of such laws, there is no assurance such existing laws or future laws will not have a material adverse effect on the Company’s business, results of operations and financial condition.
International operations expose the Company to the unique risks inherent in foreign operations.
The Company has operations in Mexico, Europe, S. Africa and Asia.Mexico. Foreign operations encounter risks similar to those faced by U.S. operations, as well as risks inherent in foreign operations, such as local customs and regulatory constraints, control over product quality and content, foreign trade policies, competitive conditions, foreign currency fluctuations and unstable political and economic conditions. The Company’s international operations headquartered in Germany and its business relationships in Asia further increase its exposure to these foreign operating risks, which could have an adverse impact on the Company’s international income and worldwide profitability.
The Company could be adversely affected by changes in currency exchange rates and/or the value of the United States dollar.
The Company is exposed to risks related to the effects of changes in foreign currency exchange rates and the value of the United States dollar. Changes in currency exchange rates and the value of the United States dollar can have a significant impact on earnings from international operations.earnings. While the Company carefully watches fluctuations in currency exchange rates, these types of changes can have material adverse effects on the Company’s business, results of operations and financial condition.
Failure to improve and maintain the quality of internal controls over financial reporting could materially and adversely affect the ability to provide timely and accurate financial information, which could harm the Company’s reputation and share price.
Management is responsible for establishing and maintaining adequate internal controls over financial reporting for the Company to provide reasonable assurance regarding the reliability of financial reporting and the preparation of financial statements in accordance with generally accepted accounting principles. Management cannot be certain that weaknesses and deficiencies in internal controls will not arise or be identified or that the Company will be able to correct and maintain adequate controls over financial processes and reporting in the future. Any failure to maintain adequate controls or to adequately implement required new or improved controls could harm operating results or cause failure to meet reporting obligations in a timely and accurate manner. Ineffective internal controls over financial reporting could also cause investors to lose confidence in reported financial information, which could adversely affect the trading price of the Company’s common stock.
Disclosure controls and procedures are designed to provide reasonable assurance of achieving their objectives. However, management, including the Chief Executive Officer and Chief Financial Officer, does not expect that disclosure controls and procedures will prevent all errors and all fraud. A control system, no matter how well conceived and operated, can provide only reasonable, not absolute, assurance that the objectives of the control system are met. Further, the design of a control system must reflect the fact that there are resource constraints, and the benefits of controls must be considered relative to their costs. Because of inherent limitations in all control systems, no evaluation of controls can provide absolute assurance that all control issues and instances of fraud, if any, have been detected.
Failure to effectively implement the Company’s global integrated information system could cause incorrect information or delays in getting information which could adversely affect the performance of the Company.
The Company converted its Enterprise Risk Planning (ERP) system from the Oracle E-Business suite to Epicor at its Martin Yale North America location at the beginning of 2011 and at its Escalade Sports North Carolina location at the beginning of 2012. The Company is in the process of converting its Enterprise Risk Planning (ERP) systems from legacy system in Germanysystems to Epicor during the second quarter of 2012.Epicor. Implementation has been completed for Raleigh, North Carolina, and Rosarito, Mexico locations. The Company intends to complete the conversion of its remaining sites over the next two years. There can be no assurance the Company will have the necessary funds or the staff to fully avail itself of the control features inherent in the system design. Without such utility, the Company management is faced with cumbersomelegacy systems and time consuming efforts to manually consolidate its financial information.
Problems with the Company’s information system software or hardware could disrupt operations and negatively impact financial results and materially adversely affect the Company’s business operations
The Company relies on a suite of applications and third party software to receive and process customer orders and for the core of its manufacturing, distribution, and accounting systems. These systems, if not functioning properly, could disrupt its operations, including the Company’s ability to receive and ship orders and to process financial information or engage in similar normal business activities. Any material disruption, malfunction or other similar problems in or with these systems could negatively impact our financial results and materially adversely affect our business operations.
The preparation of the Company’s financial statements requires the use of estimates that may vary from actual results.
The preparation of consolidated financial statements in conformity with accounting principles generally accepted in the United States requires management to make significant estimates that may affect financial statements. Due to the inherent nature of making estimates, actual results may vary substantially from such estimates, which could materially adversely affect the Company’s business, results of operations and financial condition. For more information on the Company’s critical accounting estimates, please see the Critical Accounting Estimates section of this Form 10-K.
| 10 |
Changes in accounting standards could impact reported earnings and financial condition.
The accounting standard setters, including the Financial Accounting Standards Board the International Accounting Standards Board,and the Securities and Exchange Commission, and the Public Company Accounting Oversight Board, periodically change the financial accounting and reporting standards that govern the preparation of the Company’s consolidated financial statements. These changes can be hard to predict and apply and can materially affect how the Company records and reports its financial condition and results of operations. In some cases, the Company could be required to apply a new or revised standard retrospectively, which may result in the restatement of prior period financial statements.
EffectiveThe Company’s effective tax rate may fluctuate.
The Company is a multi-national, multi-channel provider of sporting goods and, until October 2014, was a multi-national, multi-channel provider of information security and print finishing products. As a result, the Company’s effective tax rate is derived from a combination of applicable tax rates in the various countries, states and other jurisdictions in which the Company operates. The effective tax rate may be lower or higher than its tax rates have been in the past due to numerous factors, including the sources of income, any agreement with taxing authorities in various jurisdictions, the tax filing positions taken in various jurisdictions and changes in the political environment in the jurisdictions in which the Company operates. The Company bases estimates of an effective tax rate at any given point in time upon a calculated mix of the tax rates applicable to the Company and to estimates of the amount of business likely to be done in any given jurisdiction. The loss of one or more agreements with taxing jurisdictions, a change in the mix of business from year to year and from country to country, changes in rules related to accounting for income taxes, changes in tax laws and any of the multiple jurisdictions in which the Company operates, or adverse outcomes from tax audits that the Company may be subject to in any of the jurisdictions in which the Company operates, could result in an unfavorable change in the effective tax rate which could have an adverse effect on the Company’s business and results of operations.
The market price of Escalade’sthe Company’s common stock is likely to be highly volatile as the stock market in general can be highly volatile.
The public trading of Escalade’sthe Company’s common stock is based on many factors which could cause fluctuation in the Company’s stock price. These factors may include, among other things:
| · | General economic and market conditions; |
| · | Actual or anticipated variations in quarterly operating results; |
| · |
| · | Relatively low market capitalization resulting in low trading volume in the Company’s stock; |
| · | If securities analysts provide coverage, our inability to meet or exceed securities |
| · | Conditions or trends in the Company’s industries; |
| · | Changes in the market valuations of other companies in the Company’s industries; |
| · | Announcements by the Company or the Company’s competitors of significant acquisitions, strategic partnerships, divestitures, joint ventures or other strategic initiatives; |
| · | Capital commitments; |
| · | Additions or departures of key personnel; |
| · | Sales and repurchases of the Company’s common stock; and |
| · | The ability to maintain listing of the Company’s common stock on the NASDAQ Global Market. |
Many of these factors are beyond the Company’s control. These factors may cause the market price of the Company’s common stock to decline, regardless of operating performance.
| 11 |
Information securityIf we are unable to pay quarterly dividends at intended levels, our reputation and stock price may be compromised.harmed.
Our quarterly cash dividend is currently $0.10 per common share. The dividend program requires the use of a portion of our cash flow. Our ability to pay dividends will depend on our ability to generate sufficient cash flows from operations in the future. This ability may be subject to certain economic, financial, competitive and other factors that are beyond our control. Our Board of Directors (Board) may, at its discretion, increase or decrease the intended level of dividends or entirely discontinue the payment of dividends at any time. Any failure to pay dividends after we have announced our intention to do so may negatively impact our reputation, investor confidence in us and negatively impact our stock price.
Unauthorized disclosure of sensitive or confidential customer information could harm the Company’s business and its standing with its customers.
Through sales and marketing activities, the Company collects and stores certain information that customers provide to purchase products or services or otherwise communicate and interact with the Company. Despite instituted safeguards for the protection of such information, the Company cannot be certain that all of its systems are entirely free from vulnerability to attack. Computer hackers may attempt to penetrate the Company’s network security and, if successful, misappropriate confidential customer or business information. In addition, an employee, a contractor or other third party with whom the Company does business may attempt to circumvent the Company’s security measures in order to obtain such information or inadvertently cause a breach involving such information. Loss of customer or business information could disrupt operations, damage the Company’s reputation, and expose the Company to claims from customers, financial institutions, payment card associations and other persons, any of which could have an adverse effect on the Company’s business, results of operations and financial condition. In addition, compliance with tougher privacy and information security laws and standards may result in significant expense due to increased investment in technology and the development of new operational processes.
Terrorist attacks, or acts of war or natural disaster may seriously harm the Company’s business.
Among the chief uncertainties facing the nation and the world and, as a result, the business is the instability and conflict in the Middle East. Obviously, no one can predict with certainty what the overall economic impact will be as a result of these circumstances. Terrorist attacks may cause damage or disruption to the Company, employees, facilities and customers, which could significantly impact net sales, costs and expenses and financial condition. The potential for future terrorist attacks, the national and international responses to terrorist attacks, and other acts of war and hostility may cause greater uncertainty and cause business to suffer in ways the Company currently cannot predict.
In addition, any natural disaster or other serious disruption to one of the Company’s manufacturing or distribution sights due to fire, tornado, earthquake or any other causes could damage a material portion of inventory or impair our ability to provide product to our customers and could negatively affect our sales and profitability.
These risks are not exhaustive.
Other sections of this Form 10-K may include additional factors which could adversely impact the Company’s business and financial performance. Moreover, the Company operates in a very competitive and rapidly changing environment. New risk factors emerge from time to time and it is not possible for management to predict all risk factors, nor can the Company assess the impact of all factors on business or the extent to which any factor, or combination of factors, may cause actual results to differ materially from those contained in any forward-looking statements. Given these risks and uncertainties, investors should not place undue reliance on forward-looking statements as a prediction of actual results.
ITEM 1B—UNRESOLVED STAFF COMMENTS
None.
| 12 |
At December 31, 2011,27, 2014, the Company owned or operated from the following locations:
| Location | Square Footage | Owned or Leased | Use | |||||
| Evansville, Indiana, USA | 380,200 | Owned | Distribution; sales and marketing; administration | |||||
| Rosarito, Mexico | 174,700 | Owned | Manufacturing and distribution | |||||
| Olney, Illinois, USA | 108,500 | Leased | Manufacturing and distribution | |||||
| Gainesville, Florida, USA | 154,200 | Owned | Manufacturing and distribution | |||||
| Raleigh, N. Carolina, USA | 88,800 | Leased | Manufacturing and distribution | |||||
| Jacksonville, Florida, USA | 31,800 | |||||||
| Leased | Distribution; sales and marketing | |||||||
| 1,130 | Leased | Sales and | ||||||
| 141,000 | Owned | |||||||
At the end of 2010, the Company had one idle facility in Reynosa, Mexico. The sale of the Reynosa facility was completed in 2011. The Company believes that its remaining facilities are in satisfactory and suitable condition for their respective operations. The Company also believes that it is in material compliance with all applicable environmental regulations and is not subject to any proceeding by any federal, state or local authorities regarding such matters. The Company provides regular maintenance and service on its plants and machinery as required.
The Company is involved in litigation arising in the normal course of its business, but the Company does not believe that the disposition or ultimate resolution of such claims or lawsuits will have a material adverse affect on the business or financial condition of the Company.
The Company is not aware of any probable or levied penalties against the Company relating to the American Jobs Creation Act.
ITEM 4—MINE SAFETY DISCLOSURES
Not applicable.
| 13 |
ITEM 5—MARKET FOR THE REGISTRANT’SREGISTRANT'S COMMON EQUITY, RELATED STOCKHOLDER MATTERS AND ISSUER PURCHASES OF EQUITY SECURITIES
The Company’sCompany's common stock is traded under the symbol “ESCA” on the NASDAQ Global Market. The following table sets forth, for the calendar periods indicated, the high and low sales prices of the Common Stock as reported by the NASDAQ Global Market:
| Prices | High | Low | ||||||
| 2011 | ||||||||
| Fourth quarter ended December 31, 2011 | $ | 5.60 | $ | 4.26 | ||||
| Third quarter ended October 1, 2011 | 6.22 | 4.30 | ||||||
| Second quarter ended July 9, 2011 | 6.43 | 5.00 | ||||||
| First quarter ended March 19, 2011 | 7.10 | 5.30 | ||||||
| 2010 | ||||||||
| Fourth quarter ended December 25, 2010 | $ | 6.65 | $ | 4.27 | ||||
| Third quarter ended October 2, 2010 | 5.80 | 4.14 | ||||||
| Second quarter ended July 10, 2010 | 5.52 | 2.46 | ||||||
| First quarter ended March 20, 2010 | 3.00 | 2.21 | ||||||
| 2009 | ||||||||
| Fourth quarter ended December 26, 2009 | $ | 3.07 | $ | 1.96 | ||||
| Third quarter ended October 3, 2009 | 3.44 | 0.72 | ||||||
| Second quarter ended July 11, 2009 | 1.48 | 0.43 | ||||||
| First quarter ended March 21, 2009 | 1.15 | 0.30 | ||||||
| Prices | High | Low | ||||||
| 2014 | ||||||||
| Fourth quarter ended December 27, 2014 | $ | 14.47 | $ | 11.18 | ||||
| Third quarter ended October 4, 2014 | 16.77 | 11.78 | ||||||
| Second quarter ended July 12, 2014 | 16.83 | 12.58 | ||||||
| First quarter ended March 22, 2014 | 12.77 | 10.61 | ||||||
| 2013 | ||||||||
| Fourth quarter ended December 28, 2013 | $ | 12.41 | $ | 8.18 | ||||
| Third quarter ended October 5, 2013 | 8.70 | 6.32 | ||||||
| Second quarter ended July 13, 2013 | 6.48 | 5.72 | ||||||
| First quarter ended March 23, 2013 | 6.20 | 5.21 | ||||||
| 2012 | ||||||||
| Fourth quarter ended December 29, 2012 | $ | 5.54 | $ | 4.67 | ||||
| Third quarter ended October 6, 2012 | 6.09 | 5.05 | ||||||
| Second quarter ended July 14, 2012 | 6.10 | 5.15 | ||||||
| First quarter ended March 24, 2012 | 6.06 | 4.31 | ||||||
The closing market price on February 6, 201211, 2015 was $4.88$15.79 per share.
DependingDuring 2013, the Company’s Board of Directors adopted a dividend policy under which the Company intends to pay quarterly cash dividends on profitability and cash flows from operations,its common stock. At the August 2014 meeting of the Board of Directors, issues dividends. Based on the Company’s 2010 performance,Company established the Board declared a dividend in 2010 ofannual rate to be $0.40 per share, or $0.10 per share. As a result of the 2011 performance, the Board declared a dividend in August 2011 of $0.25 per share and in November 2011 of $0.07 per share.quarterly. Dividends issued/declared during 20102013 and 20112014 are as follows:
| Record Date | Payment Date | Amount per Common Share | ||||
| March 14, 2013 | March 20, 2013 | $ | 0.08 | |||
| June 13, 2013 | June 20, 2013 | $ | 0.08 | |||
| September 13, 2013 | September 20, 2013 | $ | 0.09 | |||
| December 13, 2013 | December 20, 2013 | $ | 0.09 | |||
| March 13, 2014 | March 20, 2014 | $ | 0.09 | |||
| June 12, 2014 | June 19, 2014 | $ | 0.09 | |||
| September 14, 2014 | September 21, 2014 | $ | 0.10 | |||
| December 12, 2014 | December 19, 2014 | $ | 0.10 | |||
There were approximately 186158 holders of record of the Company’sCompany's Common Stock at February 9, 2012.11, 2015. The approximate number of stockholders, including those held by depository companies for certain beneficial owners, was 1,250.1,931.
| 14 |
SHAREHOLDER RETURN PERFORMANCE GRAPH
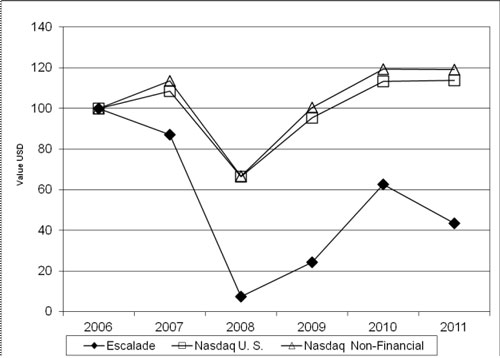
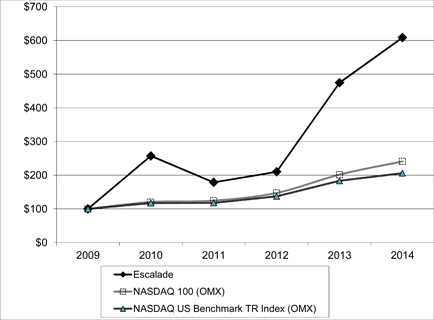
Set forth below is a line graph comparing the yearly percentage change in the cumulative total shareholder return on the Company’s common stock with that of the cumulative total return on the NASDAQ US Stock Market Index100 and the NASDAQ Non-Financial StocksUS Benchmark TR Index for the five year period ended December 31, 2011.2014. The following information is based on an investment of $100, on December 31, 2006,2009, in the Company’s common stock, the NASDAQ US Stock Market Index100 and the NASDAQ Non-Financial StocksUS Benchmark TR Index, with dividends reinvested.
COMPARISON OF FIVE YEAR CUMULATIVE TOTAL RETURN
| 2006 | 2007 | 2008 | 2009 | 2010 | 2011 | |||||||||||||||||||
| Escalade Common Stock | 100 | 87 | 7 | 24 | 63 | 43 | ||||||||||||||||||
| NASDAQ US Stock Index | 100 | 108 | 66 | 95 | 113 | 114 | ||||||||||||||||||
| NASDAQ Non-Financial Stock Index | 100 | 113 | 67 | 101 | 119 | 119 | ||||||||||||||||||
| 2009 | 2010 | 2011 | 2012 | 2013 | 2014 | |||||||||||||||||||
| Escalade Common Stock | 100 | 257 | 179 | 210 | 475 | 608 | ||||||||||||||||||
| NASDAQ 100 (OMX) | 100 | 120 | 125 | 147 | 202 | 241 | ||||||||||||||||||
| NASDAQ US Benchmark TR Index (OMX) | 100 | 118 | 118 | 137 | 183 | 206 | ||||||||||||||||||
The above performance graph does not constitute soliciting material and should not be deemed filed or incorporated by reference into any other Company filing under the Securities Act of 1933 or the Securities Exchange Act of 1934, except to the extent the Company specifically incorporates the performance graph by reference therein.
| 15 |
ISSUER PURCHASES OF EQUITY SECURITIES
| Period | (a) Total Number of Shares (or Units) Purchased | (b) Average Price Paid per Share (or Unit) | (c) Total Number of Shares (or Units) Purchased as Part of Publicly Announced Plans or Programs | (d) Maximum Number (or Approximate Dollar Value) of Shares (or Units) that May Yet Be Purchased Under the Plans or Programs |
| Share purchases prior to 10/01/2011 under the current repurchase program. | 982,916 | $8.84 | 982,916 | $ 2,273,939 |
Fourth quarter purchases: | ||||
| 10/02/2011 – 10/29/2011 | None | None | None | No Change |
| 10/30/2011 – 11/26/2011 | None | None | None | No Change |
| 11/27/2011 – 12/31/2011 | None | None | None | No Change |
| Total share purchases under the current program | 982,916 | $8.84 | 982,916 | $2,273,939 |
| Period | (a) Total Number of Shares (or Units) Purchased | (b) Average Price Paid per Share (or Unit) | (c) Total Number of Shares (or Units) Purchased as Part of Publicly Announced Plans or Programs | (d) Maximum Number (or Approximate Dollar Value) of Shares (or Units) that May Yet Be Purchased Under the Plans or Programs | ||||||||||||
| Share purchases prior to 10/4/2014 under the current repurchase program. | 982,916 | $ | 8.84 | 982,916 | $ | 2,273,939 | ||||||||||
| Fourth quarter purchases: | ||||||||||||||||
| 10/5/2014 – 11/01/2014 | None | None | None | No Change | ||||||||||||
| 11/2/2014 – 11/29/2014 | None | None | None | No Change | ||||||||||||
| 11/30/2014 – 12/27/2014 | None | None | None | No Change | ||||||||||||
| Total share purchases under the current program | 982,916 | $ | 8.84 | 982,916 | $ | 2,273,939 | ||||||||||
The Company has one stock repurchase program which was established in February 2003 by the Board of Directors and which initially authorized management to expend up to $3,000,000 to repurchase shares on the open market as well as in private negotiated transactions. In each of February 2005 and 2006, August 2007 and February 2008 the Board of Directors increased the remaining balance on this plan to its original level of $3,000,000. The repurchase plan has no termination date and there have been no share repurchases that were not part of a publicly announced program.
| 16 |
ITEM 6—SELECTED FINANCIAL DATA
(In thousands, except per share data)
| At and For Years Ended | December 31, 2011 | December 25, 2010 | December 26, 2009 | December 27, 2008 | December 29, 2007 | December 27, 2014 | December 28, 2013 | December 29, 2012 | December 31, 2011 | December 25, 2010 | ||||||||||||||||||||||||||||||
| Income Statement Data | ||||||||||||||||||||||||||||||||||||||||
| Net revenue | ||||||||||||||||||||||||||||||||||||||||
| Sporting Goods | $ | 96,971 | $ | 85,815 | $ | 76,807 | $ | 98,039 | $ | 129,788 | $ | 137,975 | $ | 132,991 | $ | 112,599 | $ | 96,971 | $ | 85,815 | ||||||||||||||||||||
| Information Security and Print Finishing | 37,279 | 34,841 | 39,192 | 50,647 | 55,788 | |||||||||||||||||||||||||||||||||||
| Discontinued Operations | 20,865 | 30,686 | 34,990 | 37,279 | 34,841 | |||||||||||||||||||||||||||||||||||
| Total net sales | 134,250 | 120,656 | 115,999 | 148,686 | 185,576 | 158,840 | 163,677 | 147,589 | 134,250 | 120,656 | ||||||||||||||||||||||||||||||
| Net income (loss) | 4,441 | 6,059 | 1,657 | (7,496 | ) | 9,255 | 11,817 | 9,805 | (4,930 | ) | 4,441 | 6,059 | ||||||||||||||||||||||||||||
| Weighted-average shares | 12,849 | 12,726 | 12,632 | 12,684 | 12,901 | 13,853 | 13,506 | 13,244 | 12,849 | 12,726 | ||||||||||||||||||||||||||||||
| Per Share Data | ||||||||||||||||||||||||||||||||||||||||
| Basic earnings (loss) per share | $ | 0.35 | $ | 0.48 | $ | 0.13 | $ | (0.59 | ) | $ | 0.72 | $ | 0.85 | $ | 0.73 | $ | (0.37 | ) | $ | 0.35 | $ | 0.48 | ||||||||||||||||||
| Cash dividends | $ | 0.32 | $ | 0.10 | $ | — | $ | 0.25 | $ | 0.22 | $ | 0.38 | $ | 0.34 | $ | 0.31 | $ | 0.32 | $ | 0.10 | ||||||||||||||||||||
| Balance Sheet Data | ||||||||||||||||||||||||||||||||||||||||
| Working capital | 29,496 | 24,132 | 9,688 | 4,842 | 31,442 | 37,105 | 37,537 | 32,656 | 29,496 | 24,132 | ||||||||||||||||||||||||||||||
| Total assets | 130,115 | 127,553 | 127,238 | 147,701 | 152,016 | 127,881 | 141,974 | 125,740 | 130,115 | 127,553 | ||||||||||||||||||||||||||||||
| Short-term bank debt | 16,947 | 11,407 | 27,644 | 46,525 | 13,033 | |||||||||||||||||||||||||||||||||||
| Long-term bank debt | 5,000 | 7,500 | — | — | 19,135 | |||||||||||||||||||||||||||||||||||
| Total stockholders’ equity | 87,565 | 87,030 | 82,764 | 78,790 | 91,742 | |||||||||||||||||||||||||||||||||||
| Short-term debt | 17,786 | 23,263 | 19,070 | 16,947 | 11,407 | |||||||||||||||||||||||||||||||||||
| Long-term debt | 3,360 | 4,946 | 3,500 | 5,000 | 7,500 | |||||||||||||||||||||||||||||||||||
| Total stockholders' equity | 89,779 | 87,955 | 80,457 | 87,565 | 87,030 | |||||||||||||||||||||||||||||||||||
Fiscal year 2014 was positively impacted by increased sales in the Sporting Goods segment. Net income was negatively impacted by the divestiture of the Information Security and Print Finishing segment of $9.6 million partially off-set by a tax benefit of $6.1 million.
Fiscal year 2013 was positively impacted by increased sales in the Sporting Goods segment, as well as improved margins resulting from higher sales volumes.
Fiscal year 2012 was positively impacted by increased sales in the Sporting Goods segment. Net income was negatively impacted by goodwill and intangible asset impairment in Martin Yale Group, which reduced net income by $13.4 million.
Fiscal year 2011 was positively impacted by increased sales in the Sporting Goods and Information Security and Print Finishing segments. Net income was negatively impacted by the accelerated write-off of the Oracle ERP system, which reduced net income by $2.7 million.
Fiscal year 2010 was positively impacted by increased sales in the Sporting Goods segment, as well as continued efforts at cost reduction, and improved margins resulting from higher sales volumes.
Fiscal year 2009 was positively impacted by significant cost reductions and consolidation of certain manufacturing and distributions facilities.
Fiscal year 2008 was negatively impacted by loss of sales to Sears, a major sporting goods retailer, impairment of certain long-lived assets and a general economic downturn.
Fiscal year 2007 was positively impacted by the sale of rights to license potential future intellectual property.
ITEM 7—MANAGEMENT’SMANAGEMENT'S DISCUSSION AND ANALYSIS OF FINANCIAL CONDITION AND RESULTS OF OPERATIONS
The following section should be read in conjunction with Item 1: Business; Item 1A: Risk Factors; Item 6: Selected Financial Data; and Item 8: Financial Statements and Supplementary Data.
Forward-Looking Statements
This report contains forward-looking statements relating to present or future trends or factors that are subject to risks and uncertainties. These risks include, but are not limited to, the impact of competitive products and pricing, product demand and market acceptance, new product development, Escalade’s ability to achieve its business objectives, especially with respect to its Sporting Goods business on which it has chosen to focus, Escalade’s ability to successfully achieve the anticipated results of strategic transactions, including the integration of the operations of acquired assets and businesses and the divestiture of its Information Security and Print Finishing segment, the continuation and development of key customer and supplier relationships, disruptions or delays in our supply chain, Escalade’s ability to control costs, general economic conditions, fluctuation in operating results, changes in foreign currency exchange rates, changes in the securities market, Escalade’s ability to obtain financing and to maintain compliance with the terms of such financing and other risks detailed from time to time in Escalade’s filings with the Securities and Exchange Commission. Escalade’s future financial performance could differ materially from the expectations of management contained herein. Escalade undertakes no obligation to release revisions to these forward-looking statements after the date of this report.
Overview
Escalade, Incorporated (“Escalade”(Escalade, the Company, we, us or “Company”) manufacturesour) has historically manufactured and distributesdistributed products for two industries: Sporting GoodsGoods; and Information Security and Print Finishing. Sporting Goods has expandedOn June 30, 2014, the Company announced the sale of its product offerings to include team training products.Print Finishing business. On October 1, 2014, the Company announced the sale of its Information Security business. The divestiture of these two divisions accomplishes the Company’s complete exit from the Information Security and Print Finishinghas increasingly focused its strategy on expanding segment.
Due to the securityplanned exit from the Information Security and Print Finishing segment, effective as of its second quarter ended July 12, 2014, the Company began reporting results of its Information Security and Print Finishing business as discontinued operations, which are excluded from the results of continuing operations. Under terms of the final agreement of the Information Security business divestiture, the Company contributed to assistits international Information Security operations, all claims related to intercompany debt of this operation prior to the divestiture. The Company also assumed the foreign tax liability related to this gain. The Company was able to utilize previously reserved net operating loss carry-forwards to offset the majority of this tax liability.
As a result of the divestiture of the Information Security and Print Finishing segment, the Company incurred a loss on disposal of assets of $9.6 million, income from reclassification of accumulated other comprehensive income from foreign currency translation adjustments of $2.6 million and a tax benefit of $6.1 million. For more information relating to the Information Security and Print Finishing segment, see Note 11 – Discontinued Operations, and Note 14 – Segment Information, to the financial statements included under Item 1 of this Form 10-K.
The Company is solely focused on growing its Sporting Goods segment through organic growth of existing categories, strategic acquisitions, and new product development now that the businesses comprising the Information Security and governments with their high security needsPrint Finishing segment have been divested. The Sporting Goods segment competes in a variety of categories including basketball goals, archery, indoor and outdoor game recreation and fitness products. Strong brands and on-going investment in product development provide a solid foundation for handling sensitivebuilding customer employeeloyalty and business documents and information, in addition to Martin Yale’s traditional product offerings.continued growth.
Within these industriesthe sporting goods industry, the Company has successfully built a robust market presence in several niche markets. This strategy is heavily dependent on expanding theour customer base, barriers to entry, brand recognition andstrong brands, excellent customer service.service and a commitment to innovation. A key strategic advantage is the Company’s established relationships with major customers that allow the Company to bring new products to market in a cost effective manner while maintaining a diversified product line and wide customer base.portfolio of products to meet the demands of consumers. In addition to strategic customer relations, the Company has substantial manufacturing and import experience that enable it to be a low cost supplier. Concentrated focus on the sporting goods industry will allow the Company to leverage its strength in these markets.
A majority of the Company’sCompany's products are in markets that are currently experiencing low growth rates. Where the Company enjoys a commanding market position, such as table tennis tables, in the Sporting Goods segment and paper folding machines in the Information Security and Print Finishing segment, revenue growth is expected to be roughly equal to general growth/decline in the economy. However, in markets that are fragmented and wheremacro-economic consumer trends.
To enhance growth opportunities, the Company is not the dominant leader, such as archery in the Sporting Goods segmenthas focused on promoting new product innovation and data security shredders in the Information Securitydevelopment and Print Finishing segment,brand marketing. In addition, the Company anticipates growth. To enhance internal growth, the Company has embarked on a strategy of acquiring companies or product lines that complement or expand the Company’sCompany's existing product lines.lines or provide expansion into new or emerging categories in sporting goods. A key objective is the acquisition of product lines with barriers to entry that the Company can take to market through its established distribution channels or through new market channels. Significant synergies are achieved through assimilation of acquired product lines into the existing companyCompany structure. The Company also sometimes divests or discontinues certain operations, assets, and products that do not perform to the Company's expectations or no longer fit with the Company's strategic objectives.
The Company’s decision to exit the Information Security and Print Finishing segment was influenced by low performance in this segment and lack of strategic fit. Management believes it can better achieve earnings growth through a more concentrated focus within the sporting goods equipment industry, including the traditional sports and emerging outdoor categories.
Management believes that key indicators in measuring the success of this strategythese strategies are revenue growth, earnings growth, new product introductions, and the expansion of channels of distribution. The following table sets forth the annual percentage change in revenues and net income (loss) over the past three years:
| 2011 | 2010 | 2009 | 2014 | 2013 | 2012 | |||||||||||||||||||
| Net revenue | ||||||||||||||||||||||||
| Sporting Goods | 13.0 | % | 11.7 | % | -21.7 | % | 3.7 | % | 18.1 | % | 16.1 | % | ||||||||||||
| Information Security and Print Finishing | 7.0 | % | -11.1 | % | -22.6 | % | ||||||||||||||||||
| Discontinued Operations | (32.0 | )% | (12.3 | )% | (6.1 | )% | ||||||||||||||||||
| Total | 11.3 | % | 4.0 | % | -22.0 | % | (3.0 | )% | 10.9 | % | 9.9 | % | ||||||||||||
| Net income | -26.7 | % | 265.6 | % | 122.1 | % | ||||||||||||||||||
| Net income (loss) | ||||||||||||||||||||||||
| Sporting Goods | 2.8 | % | 31.4 | % | 39.0 | % | ||||||||||||||||||
| Discontinued Operations | 45.2 | % | 82.2 | % | (1,602.8 | )% | ||||||||||||||||||
| Total | 20.5 | % | 298.9 | % | (211.0 | )% | ||||||||||||||||||
WithoutExcluding the accelerated depreciation expense onimpact of goodwill and intangible asset impairment in 2012, the replaced ERP system,annual percentage of change in total net income in 2011 would have increased by 19.5%.been an increase of 11.0% in 2013 and 23.6% in 2012.
Results of Operations
The following schedule sets forth certain consolidated statement of operations data (excluding Discontinued Operations) as a percentage of net revenue for the periods indicated:revenue:
| 2011 | 2010 | 2009 | ||||||||||
| Net revenue | 100.0 | % | 100.0 | % | 100.0 | % | ||||||
| Cost of products sold | 68.9 | % | 69.2 | % | 70.9 | % | ||||||
| Gross margin | 31.1 | % | 30.8 | % | 29.1 | % | ||||||
| Selling, administrative and general expenses | 26.8 | % | 22.9 | % | 25.4 | % | ||||||
| Amortization | 1.2 | % | 1.1 | % | 2.0 | % | ||||||
| Operating income | 3.1 | % | 6.8 | % | 1.7 | % | ||||||
Without the accelerated depreciation expense on the replaced ERP system, selling, administrative and general expenses would have been 23.5% and operating income would have been 6.4%.
| 2014 | 2013 | 2012 | ||||||||||
| Net revenue | 100.0 | % | 100.0 | % | 100.0 | % | ||||||
| Cost of products sold | 70.2 | % | 69.9 | % | 71.0 | % | ||||||
| Gross margin | 29.8 | % | 30.1 | % | 29.0 | % | ||||||
| Selling, administrative and general expenses | 16.6 | % | 16.1 | % | 16.4 | % | ||||||
| Amortization | 1.9 | % | 1.8 | % | 1.9 | % | ||||||
| Operating income (loss) | 11.3 | % | 12.2 | % | 10.7 | % | ||||||
Consolidated Revenue and Gross Margin
Sales growth across most sales channels of the Sporting Goods segment resulted in an overall increase of 13.0%3.7% in Sporting Goods net revenues for 20112014 compared to 2010. Revenues from the Information Security and Print Finishing business increased 7.0% in 2011 compared to 2010. Approximately 1% of the increase in Information Security and Print Finishing revenue is due to changes in foreign exchange rates.2013.
The overall gross margin percentage decreased slightly to 29.8% in 2011 was slightly higher than 2010. The Company experienced some stability2014 compared with 30.1% in manufacturing costs and some variances in product mix that resulted in margins slightly improved from prior year. Gross margins were up approximately 1% in the Sporting Goods segment and down approximately 1% in the Information Security and Print Finishing segment. Decreases in gross margin in the Information Security and Print Finishing segment were2013 due to manufacturing inefficiencies experienced inincreased research and development spending on new product offerings.products.
19 |
Consolidated Selling, General and Administrative Expenses
Consolidated selling,Selling, general and administrative expenses (“SG&A”)(SG&A) were $35.9$22.9 million in 20112014 compared to $27.7$21.5 million in 2010,2013, an increase of $8.2$1.4 million or 29.7%. In 2011, the Company began accelerating depreciation expense related to the replacement of its Oracle ERP system. Accelerated depreciation expense for the year of $4.4 million is included in SG&A. Without the additional depreciation expense, SG&A would have been $31.5 million, an increase of $3.8 million or 13.8%6.9%. SG&A as a percent of sales is 26.8%16.6% in 20112014 compared with 22.9%16.1% in 2010. Without the effects of the accelerated depreciation,2013. The increase in SG&A are primarily due to increased marketing efforts in new categories acquired during 2014 as a percent of sales would have been 23.5%well as new products to be introduced in 2011.future years.
Other Income
Other income increased in 20112014 to $4.7 million compared to 2010 due almost exclusively to increased profitability from the Stiga Sports, AB joint venture.with $2.9 million in 2013, an increase of 61.1%. Income from the non-marketable equity investments was $3.3$3.9 million in 20112014 compared with $2.0$2.9 million in 2010.2013. 2014 included $0.6 million of insurance proceeds due to roof damage that the company will use to make facility repairs in 2015. Operating losses for Escalade International, Ltd. equity method investment in 2013 was $0.6 million. This entity was fully liquidated in 2013.
Provision for Income Taxes
The effective income tax rate for 2014 is 2.8%. The lower 2014 tax rate is primarily driven by reductions in 2011 was slightly higher relative to 2010 primarilyvaluation allowance reserves for foreign net operating losses utilized in the divested Information Security and Print Finishing businesses due to cancelation of indebtedness and the foreign exchange gain on the sale of the Information Security investment. The higher 2013 tax rate of 41.2% is primarily driven by increases in valuation allowances onallowance reserves for foreign net operating losses generated in the European subsidiaries.Information Security and Print Finishing business. The effective income tax rate in 2012 was impacted by the goodwill and intangible asset impairment write-down which is not deductible for income tax purposes. Excluding the effect of the goodwill and intangible asset impairment, the effective tax rate for 2012 would have been 33.2% compared with 35.4% for 2011. The effective tax rate for 20112012 was 35.4% comparedlower due to 33.2% and 36.4% in 2010 and 2009 respectively. In addition, in 2010, the Company benefitted from a favorable audit settlement. The Company expects its future effective tax rates to approximate the effective tax rate achieved in 2011.release of valuation allowances on state credits.
Sporting Goods
Net revenues, operating income, and net income for the Sporting Goods business segment for the three years ended December 31, 201127, 2014 were as follows:
| In Thousands | 2011 | 2010 | 2009 | 2014 | 2013 | 2012 | ||||||||||||||||||
| Net revenue | $ | 96,971 | $ | 85,815 | $ | 76,807 | $ | 137,975 | $ | 132,991 | $ | 112,600 | ||||||||||||
| Operating income | 10,802 | 9,171 | 4,610 | 18,194 | 18,469 | 14,160 | ||||||||||||||||||
| Net income | 5,817 | 4,601 | 1,273 | 11,394 | 11,087 | 8,433 | ||||||||||||||||||
Net revenue increased 13.0%3.7% in 20112014 compared to 20102013 with growth coming from most sales channels in the Sporting Goods segment. The Company continues to aggressively pursue opportunities to increase revenue through introduction of new products, expansion of product distribution, acquisitions, and increased investment in consumer marketing. Sales channels are predominately mass market retail customers, specialty retailers, and dealers. During the fourth quarter, the Company strengthened its product offerings with the acquisition of the business and assets of Cue & Case Sales, Inc., a leader in specialty billiard accessories.
Gross margin and profitability increasedslightly decreased in 20112014 compared with 2010.2013. The gross margin ratio in 2011 improved2014 declined slightly to 28.2%29.8% compared to 27.2%30.1% in the prior year. The improvement isyear due to continued focusincreased research and development spending on production efficiencies and better factory absorption resulting from increased sales volume. As a result, operatingnew products. Operating income as a percentage of net revenue increaseddecreased to 11.1%13.2% in 20112014 compared to 10.7%13.9% in 2010.2013. Management anticipates that with additional sales growth in 2012, improvements in operating income will continue. Net income for 2011 increased from 2010 due primarily to increased revenue.2015.
Information Security and Print Finishing
Net revenue, operating income, and net income (loss) forOn June 30, 2014, the Company announced the sale of its Print Finishing business. On October 1, 2014, the Company announced the sale of its Information Security business. The divestiture of these two divisions accomplishes the Company’s complete exit from the Information Security and Print Finishing business segment forsegment. Due to the three years ended December 31, 2011 were as follows:
| In Thousands | 2011 | 2010 | 2009 | |||||||||
| Net revenue | $ | 37,279 | $ | 34,841 | $ | 39,192 | ||||||
| Operating income | 71 | 926 | 1,780 | |||||||||
| Net income (loss) | (921 | ) | (187 | ) | 1,077 | |||||||
Sales in the Information Security and Print Finishing business increased 7.0% in 2011 compared to 2010 primarily due to a specialty product sold to one customer. The Company has widened its product range to promote its opportunities in the information security and print finishing markets. Excluding the effect of changes in foreign exchange rates, 2011 sales were up 4.5%exit from 2010. Sales are direct to end users, including government agencies, as well as through office products retailers, wholesalers, specialty dealers, and business partners.
Profitability in the Information Security and Print Finishing segment, decreased in 2011effective as evidenced byof its second quarter ended July 12, 2014, the ratioCompany began reporting results of operating income to net revenuesits Information Security and Print Finishing business as discontinued operations, which declined to 0.2% in 2011 compared to 2.7% in 2010. The primary reasons for this decline in profitability are under-absorbed factory variances due to low sales and inefficiencies incurred on new product offerings. Management anticipates increased sales due toexcluded from the results of continuing operations.
As a broadeningresult of the product portfolio, enhanced focusdivestiture of the Information Security and Print Finishing segment, the Company incurred a loss on sales opportunitiesdisposal of assets of $9.6 million, income from reclassification of accumulated other comprehensive income from foreign currency translation adjustments of $2.6 million and improved manufacturing efficiencies in 2012 will help improve operating income.a tax benefit of $6.1 million. For more information relating to the Information Security and Print Finishing segment, see Note 11 – Discontinued Operations, and Note 14 – Segment Information, to the financial statements included under Item 1 of this Form 10-K.
Financial Condition and Liquidity
The current ratio, a basic measure of liquidity (current assets divided by current liabilities), increased to 2.2 in 2014 compared to 1.9 in 2011 from 1.82013. The Company was able to decrease receivable levels to $32.2 million in 2010. The primary reason for the increase2014 compared with $38.3 million in current ratio is2013 which was partially off-set by an increase in inventory partially offset by an increase in current debt. Inventory levels increased to $29.0$23.8 million in 2011 compared with $22.9 million in 2010. Total current and long-term debt increased to $21.9 million up2014 from $18.9 million in 2010.
The Company’s generation of cash was principally a result of increased profits resulting2013. Total notes payable and long-term debt decreased to $21.1 million, down from stronger sales mostly offset by increases in inventory levels and the distribution of shareholder dividends. The Company declared $4.1$28.2 million in dividends in 2011. Of the declared dividends, $3.2 million were paid in 2011.2013. Total bank debt for the year increased by $3.0 million. Total banknotes payable and long-term debt as a percentage of stockholders equity increasedimproved to 25.1%23.6% in 2011,2014, up from 21.7%32.1% in 2010.2013.
In 2012, the Company expects capital expenditures to be approximately $4.0 million which includes $1.1 million to complete implementation of its integrated information system at its Sporting Goods locations. The Company fully depreciated the remaining book value of its Oracle ERP system in 2011. This acceleration of depreciation resulted in additional pre-tax expense of $4.4 million, ($2.7 million net of tax) in 2011.
The Company’s working capital requirements are primarily funded through cash flows from operations and revolving credit agreements with its bank. During 2011,2014, the Company’s maximum borrowings under its primary revolving credit lines and overdraft facility totaled $26.4$30.6 million compared to $27.6$29.8 million in 2010.2013. Total notes payable and long-term debt decreased $7.1 million in 2014 as compared with 2013. The debt decrease was primarily driven by the proceeds received in the sale of the end of fiscal 2011 was $21.9 million compared with $18.9 million at the end of fiscal 2010.Information Security and Print Finished businesses. The overall effective interest rate in 20112014 was 2.9%3.0% which was reduceddown from the effective rate of 4.6%3.4% in 2010.2013. The lower interest rate is a result of improved interest rate terms and lower debt capacity. The Company’s Credit Agreementcredit agreement with its primary bank lender, JPMorgan Chase Bank, N.A., matures as of July 31, 2013. The Company also maintains a multicurrency overdraftAugust 27, 2016 for the senior revolving credit facility with its bank. The total amount outstanding underand the overdraft facility at the endterm loan matures as of fiscal 2011 was $2.2 million compared with $1.6 million at the end of fiscal 2010.
August 27, 2018. The Company has a long standing relationship with its primary bank lender and has met all financial covenants under the new agreement which was last amended as of April 14, 2011. November 13, 2013.
The amended termsCompany’s cash remains stable compared with prior year due to the utilization of the revolving credit agreement extendsfacility to fund working capital needs. Operating cash flows were used to fund the maturity date for repayment from May 31, 2012recent Cue & Case acquisition and to July 31, 2013 and provides for more favorable interest rates terms. As mentioned above,pay shareholder dividends.
In 2015, the Company increased its bank debt in 2011 byestimates capital expenditures to be approximately 16.0% to $21.9$7.0 million.
The Company expects improvements in its overall sales levels for fiscal year 2012, above those experienced in 2011,2015 compared with 2014 as a result of new product offerings and expanded customer base. The Company believes that cash generated from its projected 20122015 operations and the commitment of borrowings from its primary lender will provide it with sufficient cash flows for its operations.
It is possible that if the economic conditions deteriorate, this could have adverse effects on the Company’s ability to operate profitably during fiscal year 2012.2015. To the extent that occurs, management intends towill pursue additional cost reductionsreduction initiatives and to continue realigningconsider realignment of its infrastructure in an effort to match the Company’s overhead and cost structure with the sales level dictated by current market conditions.
New Accounting Pronouncements
Refer to Note 1 to the consolidated financial statements under the sub-heading “New Accounting Pronouncements”.
Off Balance Sheet Financing Arrangements
The Company has no financing arrangements that are not recorded on the Company’s balance sheet.
| 21 |
Contractual Obligations
The following schedule summarizes the Company’s material contractual obligations as of December 31, 2011:27, 2014:
| Amounts in thousands | Payments Due by Period | Total | 2015 | 2016 - 2017 | 2018 - 2019 | Thereafter | ||||||||||||||||||||||||||||||||||
| Contractual Obligations | Total | Less than 1 year | 1 –3 years | 3 – 5 years | More than 5 years | |||||||||||||||||||||||||||||||||||
| Debt | $ | 19,700 | $ | 14,700 | $ | 4,000 | $ | 1,000 | $ | — | $ | 21,146 | $ | 17,786 | $ | 2,610 | $ | 750 | $ | — | ||||||||||||||||||||
| Overdraft facility | 2,247 | 2,247 | — | — | — | |||||||||||||||||||||||||||||||||||
| Future interest payments (1) | 975 | 705 | 240 | 30 | — | 754 | 638 | 105 | 11 | — | ||||||||||||||||||||||||||||||
| Operating leases | 3,216 | 1,099 | 1,386 | 731 | — | 1,840 | 601 | 753 | 402 | 84 | ||||||||||||||||||||||||||||||
| Minimum payments under royalty and license agreements | 2,755 | 530 | 725 | 750 | 750 | 1,770 | 475 | 920 | 375 | — | ||||||||||||||||||||||||||||||
| Total | $ | 28,893 | $ | 19,281 | $ | 6,351 | $ | 2,511 | $ | 750 | $ | 25,510 | $ | 19,500 | $ | 4,388 | $ | 1,538 | $ | 84 | ||||||||||||||||||||
Notes:Note:
(1) Assumes that the Company will not increase borrowings under its long-term credit agreements and that the effective interest rate experienced in 20112014 of 2.9%3.0% will continue for the life of the agreements.
Critical Accounting Estimates
The methods, estimates and judgments used in applying the Company’s accounting policies have a significant impact on the results reported in its financial statements. Some of these accounting policies require difficult and subjective judgments, often as a result of the need to make estimates of matters that are inherently uncertain. The most critical accounting estimates are described below and in the Notes to the Consolidated Financial Statements.
Product Warranty
The Company provides limited warranties on certain of its products for varying periods. Generally, the warranty periods range from 90 days to one year. However, some products carry extended warranties of seven-year, ten-year, and lifetime warranties. The Company records an accrued liability and expense for estimated future warranty claims based upon historical experience and management’s estimate of the level of future claims. Changes in the estimated amounts recognized in prior years are recorded as an adjustment to the accrued liability and expensed in the current year. To the extent there are product defects in current products that are unknown to management and do not fall within historical defect rates, the product warranty reserve could be understated and the Company could be required to accrue additional product warranty costs thus negatively affecting gross margin.
Inventory Valuation Reserves
The Company evaluates inventory for obsolescence and excess quantities based on demand forecasts over specified time frames, usually one year. The demand forecast is based on historical usage, sales forecasts and current as well as anticipated market conditions. All amounts in excess of the demand forecast are deemed to be potentially excess or obsolete and a reserve is established based on the anticipated net realizable value. To the extent that demand forecasts are greater than actual demand and the Company fails to reduce manufacturing output accordingly, the Company could be required to record additional inventory reserves which would have a negative impact on gross margin.
Allowance for Doubtful Accounts
The Company provides an allowance for doubtful accounts based upon a review of outstanding receivables, historical collection information and existing economic conditions. Accounts receivable are ordinarily due between 30 and 60 days after the issuance of the invoice. Accounts are considered delinquent when more than 90 days past due. Delinquent receivables are reserved or written off based on individual credit evaluation and specific circumstances of the customer. To the extent that actual bad debt losses exceed the allowance recorded by the Company, additional reserves would be required which would increase selling, general and administrative costs.
Customer Allowances
Customer allowances are common practice in the industries in which the Company operates. These agreements are typically in the form of advertising subsidies, volume rebates and catalog allowances and are accounted for as a reduction to gross sales. The Company reviews such allowances on an ongoing basis and accruals are adjusted, if necessary, as additional information becomes available.
Impairment of Goodwill
The Company annually tests as of the last day of its fiscal yearreviews goodwill for impairment annually and whenever events or changes in circumstances indicate the carrying value of goodwill may not be recoverable, in accordance with guidance in FASB ASCFinancial Accounting Standards Board (FASB) Accounting Standard Codification (ASC) 350,Intangibles – Goodwill and Other. Management determined the assumptions and inputs utilized in the evaluation ofA qualitative assessment is first performed to determine if the fair value of the Company’s two separate reporting units, discussed below. The first phaseunit is "more likely than not" less than the carrying value. If so, we proceed to step one of the two-step goodwill impairment test, in which the fair value of the reporting unit is compared to its carrying value. If not, then performance of the second step of the goodwill impairment test requires thatis not necessary. If the carrying value of goodwill exceeds the implied estimated fair value calculated in the second step, an impairment charge to current operations is recorded to reduce the carrying value to the implied estimated fair value.
If the second step of the applicable reporting unit be compared with its recorded value. Thegoodwill impairment testing is required, the Company establishes fair value by using an income approach or a combination of a market approach and an income approach. The market approach uses the guideline-companies method to estimate the fair value of a reporting unit based on reported sales of publicly-held entities engaged in the same or a similar business as the reporting unit. The income approach uses the discounted cash flow method to estimate the fair value of a reporting unit by calculating the present value of the expected future cash flows of the reporting unit. The discount rate is based on a weighted average cost of capital determined using publicly-available interest rate information on the valuation date and data regarding equity, size and country-specific risk premiums/decrements compiled and published by a commercial source. The Company uses assumptions about expected future operating performance in determining estimates of those cash flows, which may differ from actual cash flows.
If the implied fair value of a reporting unit is less than the recorded value of net assets, management performs a phase-two analysis that allocates the fair value of the reporting unit calculated in phase one to the specific tangible and intangible assets and liabilities of the reporting unit and results in an implied fair value of goodwill. Goodwill is reduced by any shortfall of implied goodwill to its current carrying value.
Beginning in late 2009, and continuing going forward, two of the Company’s reporting units; Martin Yale North America and Martin Yale Europe, which comprise the Information Security and Print Finishing segment, have migrated toThe Company has one reporting unit as a result of consolidation of management and internal reporting. As of December 31, 2011, the Company had two reporting units that require separate goodwill impairment analysis. Those reporting units are Escalade Sports and Martin Yale Group. These reporting units areis identical to theour operating segments;segment, Sporting Goods and Information Security and Print Finishing, respectively. Significant assumptions and inputs used in each of the reporting units goodwill impairment testing are as follows:
Escalade Sports – The Company appraised the fair value of the invested capital of the Escalade Sports reporting unit using an income approach. The discount rate used in the 2011 discounted cash flow calculation was 12.5% compared to 11.5% for 2010. The increase in the discount rate is a result of increases in equity risk premium and size risk premium in 2011 compared with 2010. Projected revenues and costs for 2012 and beyond reflected the Company’s best view of the current global economic situation, demand for existing products, the status of new products and product improvements, and the projected cost of raw materials and manufacturing that are deemed material in projecting future outcomes.
Martin Yale Group – The Company appraised the fair value of the combined total invested capital of Martin Yale North America and Martin Yale Europe, as a combined reporting unit. The appraisal study utilized a combination income and market approach.The market approach was weighted 50% and the income approach was weighted 50% to arrive at the final fair value determination.The discount rate used in the 2011 discounted cash flow calculation was 12.0% compared to 11.5% for Martin Yale North America and 11% for Martin Yale Europe, respectively, for 2010. The discount rate was developed in accordance with the riskiness of the future revenues and expenses of Martin Yale as of December 31, 2011, and also reflects market participant rates of return; as such, the discount rate was calculated to be 50 to 100 basis points higher as of December 31, 2011 than as of December 25, 2010.The methodology used in 2011 is consistent with that used previously.Projected revenues and costs for 2012 and beyond reflect the Company’s best view of the current global economic situation, demand for existing products, the status of new products and product improvements, and the projected cost of raw materials and manufacturing that are deemed material in projecting future outcomes.
The Company’s testing determined that goodwill of each reporting unit was not impaired.Goods. Of the total recorded goodwill of $25.3$14.9 million at December 31, 2011, $12.0 million27, 2014, the entire amount was allocated to the Escalade Sports reporting unit; and $13.3 million was allocated to the Martin Yale Group reporting unit. The results of the qualitative impairment test forassessment of the Escalade Sports reporting unit indicated that the fair value of the invested capital exceeded the carrying value of the invested capital by a significant margin as of December 31, 2011. The results of the impairment test for the Martin Yale Group reporting unit indicated that the fair value of invested capital exceeded the carrying value of invested capital by approximately 5.1% as of December 31, 2011. Continued protracted declines in future cash flows for Martin Yale Group as well as adverse economic conditions could have a negative effect on fair value of this reporting unit.27, 2014.
Long Lived Assets
The Company evaluates the recoverability of certain long-lived assets whenever events or changes in circumstances indicate that the carrying amount may not be recoverable. Estimates of future cash flows used to test recoverability of long-lived assets include separately identifiable undiscounted cash flows expected to arise from the use and eventual disposition of the assets. Where estimated future cash flows are less than the carrying value of the assets, impairment losses are recognized based on the amount by which the carrying value exceeds the fair value of the assets.
The Company consolidated its Mexico operations into its Rosarito, Mexico facility during 2008 and ceased operations at its Reynosa, Mexico facility in February 2009. During 2008, the Company recorded an impairment loss of $2.6 million related to the Reynosa facility and since 2009 this facility has been listed as an idle. During 2011, the Company sold the Reynosa facility and recorded a pre-tax gain of $380 thousand and a combined Mexico and U.S. tax liability of $474 thousand for a net loss of $94 thousand.
Non-Marketable Equity Method Investments
The Company has minority equity positions in companies strategically related to the Company’s business, but does not have control over these companies. The accounting method employed is dependent on the level of ownership and degree of influence the Company can exert on operations. Where the equity interest is less than 20% and the degree of influence is not significant, the cost method of accounting is employed. Where the equity interest is greater than 20% but not more than 50%, the equity method of accounting is utilized. Under the equity method, the Company’s proportionate share of net income (loss) is recorded in other income on the consolidated statements of operations. The proportionate share of net income was $3.3$3.9 million, $2.0$2.9 million and $1.6$3.0 million in 2011, 20102014, 2013 and 2009,2012, respectively. Total cash dividends received from these equity investments amounted to $323$919 thousand, $0,$617 thousand, and $32$444 thousand in 2011, 20102014, 2013 and 2009,2012, respectively. The Company considers whether the fair values of any of its equity investments have declined below their carrying value whenever adverse events or changes in circumstances indicate that recorded values may not be recoverable. If the Company considers any such decline to be other than temporary (based on various factors, including historical financial results, product development activities and overall health of the investments’ industry), a write-down is recorded to estimated fair value. The
During 2013, the decision was made to cease operations and liquidate Escalade International, Ltd. Losses incurred include shutdown costs. As a result, the Company’s 50% portion of net loss for Escalade International, Ltd. for 2013 ($343) thousand and is included in other income on the Company’s statements of operations.
During 2012, one equity method investment, Escalade International, Ltd. performed below expectations, and this entity encountered unexpected attrition of certain significant customers as of the end of the third quarter 2012. Due to these events, the Company believes that there were no adverse events or changes in circumstances that would indicate a decline in carrying value; therefore,evaluated the economic and strategic benefits of continuing to hold this investment. Based on the review performed as of October 6, 2012, the Company determined that nothe fair value of this investment was less than its carrying value and that this impairment was indicated forother than temporary. As a result, the years ended December 31, 2011, December 25, 2010, and December 26, 2009.Company recognized other than temporary impairment of $382 thousand.
Effect of Inflation
The Company cannot accurately determine the precise effects of inflation. The Company attempts to pass on increased costs and expenses through price increases when necessary. The Company is working on reducing expenses; improving manufacturing technologies; and redesigning products to keep these costs under control.
Capital Expenditures
As of December 31, 2011,27, 2014, the Company had no material commitments for capital expenditures. However,In 2015, the Company expectsestimates capital expenditures to be approximately $7.0 million. We intend to continue the roll-outimplementation of the Epicor ERPintegrated information system which is expected to cost $1.1 million in 2012.During 2010, theat our remaining locations. The Company initiatedadopted a plan and implemented a replacementphased implementation of the Oracle ERPintegrated information system at its Martin Yaleto minimize the risk of business interruption. The implementation began in 2012 and to date the Raleigh, North America facility. TheCarolina, and Rosarito, Mexico are fully operational on the new system went live as of December 25, 2010 at an approximate cost of $0.7 million. During 2011, the Company implemented a replacement of the Oracle ERP system at its remaining Sporting Goods facility. This new system went live as of January 1, 2012 at an approximate cost of $0.5 million. In addition, during 2011 the Company began an implementation of Epicor at its Martin Yale Germany facility. The system is expected to go-live at the beginning of the second quarter of 2012. Costs incurred during 2011 for this site was $0.5 million. The remaining cost for this location is expected to be $0.1 million. The Company is currently evaluating the roll-out strategy for its remaining Sporting Goods locations and its remaining Martin Yale European locations.system.
ITEM 7A — QUANTITATIVE AND QUALITATIVE DISCLOSURES ABOUT MARKET RISK
The Company is exposed to financial market risks, including changes in currency exchange rates, interest rates and marketable equity security prices. The Company attempts to minimize these risks through regular operating and financing activities and, when considered appropriate, through the use of derivative financial instruments. During fiscal 2011,2014, there were no derivatives in use. The Company does not purchase, hold or sell derivative financial instruments for trading or speculative purposes.
Interest Rates
The Company’sexposure to market-rate risk for changes in interest rates relates primarily to its revolving variable rate bank debt which is based on bothLIBOR and EURIBOR interest rates.A hypothetical 1% or 100 basis point change in interest rates would not have a significant effect on our consolidated financial position or results of operation.
Foreign Currency
The Company conducts business in various countries around the world and is therefore subject to risks associated with fluctuating foreign exchange rates. Approximately 18% of consolidated revenueThe Sporting Goods foreign currency transactions are denominated primarily in Mexican Peso and Chinese Yuan. The Company has a 50% interest in a joint venture, Stiga, which is deriveddenominated in Swedish Krona. Revenue from sales outside of the U.S. This revenue isdiscontinued operations was generated from the operations of the Company’s subsidiaries in their respective countries and surrounding geographic areas and iswas primarily denominated in each subsidiary’s local functional currency. These former subsidiaries incurincurred most of their expenses (other than inter-company expenses) in their local functional currency and include the Euro, Great Britain Pound Sterling, South Africa Rand,Mexican Peso, Chinese Yuan, Swedish Krona Mexican Peso and Chinese Yuan.South African Rand.
The geographic areas outside the United States in which the Company operatesoperated are generally not considered by management to be highly inflationary. Nonetheless, the Company’s foreign operations are sensitive to fluctuations in currency exchange rates arising from, among other things, certain inter-company transactions that are denominated in currencies other than the respective functional currency. Operating results as well as assets and liabilities are also subject to the effect of foreign currency translation when the operating results, assets and liabilities of our foreign subsidiaries are translated into U.S. dollars in our consolidated financial statements. The unrealized effect of foreign currency translation in 2011 resulted in a$0.6 million loss that was recorded in stockholders’ equity as a decrease of other comprehensive income, compared to a $0.8 million loss that was recorded in stockholders’ equity as a decrease in other comprehensive income in 2010, and a $1.6 million gain in 2009. At December 31, 2011, a hypothetical change of 10% in foreign currency exchange rates would cause a $3.4 million change to stockholders’ equity on our consolidated balance sheet and a $167 thousand change to net income in our consolidated statement of operations.
The Company and its subsidiaries conduct substantially all theirbusiness intheir respective functional currencies to avoid theeffects effects of cross-border transactions.To protect against reductions in value and the volatility of future cash flows caused by changes in currency exchange rates, the Company carefully considers the use of transaction and balance sheet hedging programs such as matching assets and liabilities in the same currency. Such programs reduce, but do not entirely eliminate the impact of currency exchange rate changes. The Company has evaluated the use of currency exchange hedging financial instruments but has determined that it would not use such instruments under the current circumstances. Historical trendsChanges in currency exchanges indicate that it is reasonably possible that adverse changes in exchange rates of 20% formay be volatile and could affect the Euro could be experienced in the near term. A hypothetical adverse change of 20% would have resulted in a decline of 7.5% in net revenues and a 2.8% decrease in net income in 2011.Company’s performance.
ITEM 8 — FINANCIAL STATEMENTS AND SUPPLEMENTARY DATA
The financial statements and supplementary data required by Item 8 are set forth in Part IV, Item 15.
ITEM 9 — CHANGES IN AND DISAGREEMENTS WITH ACCOUNTANTS ON ACCOUNTING AND FINANCIAL DISCLOSURE
None.
ITEM 9A —CONTROLS AND PROCEDURES
Evaluation of Disclosure Controls and Procedures
Escalade maintains disclosure controls and procedures that are designed to ensure that information required to be disclosed in the Company’s Exchange Act reports is recorded, processed, summarized, and reported within the time periods specified in the SEC’s rules and forms, and that such information is accumulated and communicated to the Company’s management, including its Chief Executive Officer and Chief Financial Officer, as appropriate, to allow timely decisions regarding required disclosure based closely on the definition of “disclosure controls and procedures” in Rule 13a-14(c)Rules 13a-15(e) and 15d-15(e). In designing and evaluating the disclosure controls and procedures, management recognized that any controls and procedures, no matter how well designed and operated, could provide only reasonable assurance of achieving the desired control objectives, and management necessarily was required to apply its judgment in evaluating the cost-benefit relationship of possible controls and procedures. Also, the Company has investments in certain unconsolidated entities. As the Company does not control or manage these entities, its disclosure controls and procedures with respect to such entities are necessarily substantially more limited than those it maintains with respect to its consolidated subsidiaries.
The Company carried out an evaluation, under the supervision and with the participation of the Company’s management, including the Company’s Chief Executive Officer and Chief Financial Officer, of the effectiveness of the design and operation of the Company’s disclosure controls and procedures as of the end of the period covered by this report. Based on the foregoing, the Company’s Chief Executive Officer and Chief Financial Officer concluded that the Company’s disclosure controls and procedures were effective.
Management’s Report on Internal Control over Financial Reporting
Escalade’s management is responsible for establishing and maintaining adequate internal control over financial reporting for the Company. Escalade’s internal control system was designed to provide reasonable assurance regarding the reliability of financial reporting and the preparation of financial statements for external purposes in accordance with generally accepted accounting principles. Internal control over financial reporting of the Company includes those policies and procedures that:
(1) pertain to the maintenance of records that in reasonable detail accurately and fairly reflect the transactions of the Company;
(2) provide reasonable assurance that transactions are recorded as necessary to permit preparation of financial statements in accordance with generally accepted accounting principles, and that receipts and expenditures of the Company are being made only in accordance with authorizations of management and directors of the Company; and
(3) provide reasonable assurance regarding prevention or timely detection of unauthorized acquisition, use or disposition of the Company’s assets that could have a material effect on the Company’s financial statements.
All internal control systems, no matter how well designed, have inherent limitations, including the possibility of human error or circumvention through collusion or improper overriding of controls. Therefore, even those internal control systems determined to be effective can provide only reasonable assurance with respect to financial statement preparation. Further, because of changes in conditions, the effectiveness of internal control may vary over time.
The management of Escalade assessed the effectiveness of the Company’s internal control over financial reporting as of December 31, 2011.27, 2014. In making its assessment of internal control over financial reporting, management used the criteria set forth by the Committee of Sponsoring Organizations of the Treadway Commission (COSO) inInternal Control – Integrated Framework (published in 1992) and implemented a process to monitor and assess both the design and operating effectiveness of the Company’s internal controls. This assessment excluded internal control over financial reporting for the operations of Cue & Case Sales, Inc., as allowed by the SEC for current year acquisitions. Substantially all of the assets of Cue & Case Sales, Inc. were acquired on October 22, 2014 and represented 8.3% of assets as December 27, 2014 and 1.6% of consolidated nets sales for the year ended December 27 2014. Based on this assessment, management believes that, as of December 31, 2011,27, 2014, the Company’s internal control over financial reporting was effective.
This annual report on Form 10-K does not includeincludes an attestation report of the Company’s registered public accounting firm regarding internal control over financial reporting. Management’s report regarding internal control over financial reporting is not subject to attestation by the Company’s registered public accounting firm pursuant to rules of the Securities and Exchange Commission that permit the Company to provide only management’s report in this annual report on Form 10-K.Commission. In addition, this report by management regarding internal control over financial reporting is specifically not incorporated by reference into this annual report on Form 10-K or into any other filing by the Company under the Securities Act of 1933, as amended, or the Securities Exchange Act of 1934, as amended.
| /s/Robert J. Keller, Chief Executive Officer | /s/ |
Changes in Internal Control over Financial Reporting
Management of the Company has evaluated, with the participation of the Company’s Chief Executive Officer and Chief Financial Officer, changes in the Company’s internal controls over financial reporting (as defined in RuleRules 13a-15(f) and 15d-15(f) of the Exchange Act) during the fourth quarter of 2011.2014. In connection with such evaluation, there have been no changes to the Company’s internal control over financial reporting that occurred since the beginning of the Company’s fourth quarter of 20112014 that have materially affected, or are reasonably likely to materially affect, the Company’s internal control over financial reporting.
None.
| 26 |
None.
ITEM 10 — DIRECTORS, EXECUTIVE OFFICERS AND CORPORATE GOVERNANCE
Information required under this item with respect to Directors and Executive Officers is contained in the registrant’sregistrant's Proxy Statement relating to its annual meeting of stockholders scheduled to be held on April 27, 201224, 2015 under the captions “Certain Beneficial Owners,” “Election of Directors,” “Executive Officers of the Registrant,” “Board of Directors, Its Committees, Meetings and Functions,” and “Beneficial Ownership Reporting Compliance” and is incorporated herein by reference.
ITEM 11— EXECUTIVE COMPENSATION
Information required under this item is contained in the registrant’sregistrant's Proxy Statement relating to its annual meeting of stockholders scheduled to be held on April 27, 201224, 2015 under the captions “Compensation Discussion and Analysis,” “Compensation Committee Interlocks and Insider Participation,” “Compensation Committee Report”“Report of Compensation Committee” and “Executive Compensation” and is incorporated herein by reference, except that the information required by Item 407(e)(5) of Regulation S-K which appears under the caption “Report of Compensation Committee” is specifically not incorporated by reference into this Form 10-K or into any other filing by the registrant under the Securities Act of 1933 or the Securities Exchange Act of 1934.
ITEM 12—SECURITY OWNERSHIP OF CERTAIN BENEFICIAL OWNERS AND MANAGEMENT AND RELATED STOCKHOLDER MATTERS
Except for the information required by Item 201(d) of Regulation S-K, which is included below, information required by this item is contained in the registrant’s proxy statement relating to its annual meeting of stockholders scheduled to be held on April 27, 201224, 2015 under the captions “Certain Beneficial Owners” and “Election of Directors” and is incorporated herein by reference.
Equity Compensation Plan Information
| Plan Category | Number of Securities to be Issued Upon Exercise of Outstanding Options, Warrants and Rights | Weighted-Average Exercise Price of Outstanding Options, Warrants and Rights | Number of Securities Remaining Available for Future Issuance | Number of Securities to be Issued Upon Exercise of Outstanding Options, Warrants and Rights | Weighted-Average Exercise Price of Outstanding Options, Warrants and Rights | Number of Securities Remaining Available for Future Issuance Under Equity Compensation Plans | ||||||||||||||||||
| Equity compensation plans approved by security holders (1) | 984,649 | $ | 2.50 | 150,051 | 344,375 | $ | 6.08 | 1,179,662 | ||||||||||||||||
| Equity compensation plans not approved by security holders | — | — | — | — | — | — | ||||||||||||||||||
| Total | 984,649 | 150,051 | 344,375 | 1,179,662 | ||||||||||||||||||||
(1) These plans include the Company’s 1997 Incentive Stock Option Plan, the 1997 Director Stock Option Plan, the Escalade, Incorporated 2007 Incentive Plan, an additional 1,500,000 shares added under an amendment to the Escalade 2007 Incentive Plan which was approved at Escalade’s 2012 Annual Meeting of Stockholders, and a special grant of 10,000 options to Directors approved at the 2006 annual shareholders meeting.
| 27 |
ITEM 13—CERTAIN RELATIONSHIPS AND RELATED TRANSACTIONS AND DIRECTOR INDEPENDENCE
The information required by Item 407(a) of Regulation S-K is contained in the registrant’s proxy statement relating to its annual meeting of stockholders to be held on April 27, 201224, 2015 under the captions “Election of Directors” and “Board of Directors, Its Committees, Meetings and Functions” and is incorporated herein by reference. The information required by Item 404 of Regulation S-K is: None.is contained in the registrant’s proxy statement relating to its annual meeting of stockholders scheduled to be held on April 24, 2015 under the caption “Certain Relationships and Related Person Transactions” and is incorporated herein by reference.
ITEM 14 — PRINCIPAL ACCOUNTING FEES AND SERVICES
The information required by this item is contained in the registrant’s proxy statement relating to its annual meeting of stockholders scheduled to be held on April 27, 201224, 2015 under the caption “Principal Accounting Firm Fees” and is incorporated herein by reference.
ITEM 15—EXHIBITS, FINANCIAL STATEMENT SCHEDULES
(A) Documents filed as a part of this report:
| (A) | Documents filed as a part of this report: |
Report of Independent Registered Public Accounting Firm Consolidated financial statements of Escalade, Incorporated and subsidiaries: Consolidated balance sheets—December 27, 2014 and December 28, 2013 Consolidated statements of operations—fiscal years ended December 27, 2014, December 28, 2013, and December 29, 2012 Consolidated statements of comprehensive income (loss)—fiscal years ended December 27, 2014, December 28, 2013, and December 29, 2012 Consolidated statements of stockholders’ equity—fiscal years ended December 27, 2014, December 28, 2013, and December 29, 2012 Consolidated statements of cash flows—fiscal years ended December 27, 2014, December 28, 2013, and December 29, 2012 Notes to consolidated financial statements All other schedules are omitted because of the absence of conditions under which they are required or because the required information is given in the consolidated financial statements or notes thereto. Escalade, Incorporated and Subsidiaries Index to Financial Statements The following consolidated financial statements of the Registrant and its subsidiaries and Independent Accountants’ Reports are submitted herewith: Reports of Independent Registered Public Accounting Firms Audit Committee, Board of Directors and Stockholders Escalade, Incorporated Evansville, Indiana We have audited the accompanying consolidated balance sheets of Escalade, Incorporated (Company) as of December 27, 2014, and December 28, 2013, and the related consolidated statements of operations, comprehensive income (loss), stockholders’ equity and cash flows for each of the years in the three-year period ended December 27, 2014. The Company’s management is responsible for these financial statements. Our responsibility is to express an opinion on these financial statements based on our audits. We did not audit the 2013 and 2012 financial statements (consisting of the balance sheet and related statement of operations) of Martin Yale International, GmbH, a wholly owned subsidiary, which statements were presented on the basis of accounting principles generally accepted in Germany and reflect total assets of $12,102 and $13,194 and net sales of $15,000 and $15,226 (dollars in thousands) for 2013 and 2012, respectively, included in the related consolidated financial statement amounts as of and for the years ended December 28, 2013, and December 29, 2012, respectively. Those balance sheets and statements of operations for Martin Yale International, GmbH are based solely on the reports of the other accountants. Our audits also included auditing adjustments to convert the balance sheets and statements of operations of Martin Yale International, GmbH into accounting principles generally accepted in the United States of America for purposes of consolidation. Our audits also included auditing the amounts reflected in the consolidated statements of comprehensive income (loss), cash flows and stockholders’ equity for Martin Yale International, GmbH. We conducted our audits in accordance with the standards of the Public Company Accounting Oversight Board (United States). Those standards require that we plan and perform the audits to obtain reasonable assurance about whether the financial statements are free of material misstatement. Our audits included examining, on a test basis, evidence supporting the amounts and disclosures in the financial statements, assessing the accounting principles used and significant estimates made by management and evaluating the overall financial statement presentation. We believe our audits provide a reasonable basis for our opinion. In our opinion, the consolidated financial statements referred to above present fairly, in all material respects, the financial position of the Company as of December 27, 2014, and December 28, 2013, and the results of its operations and its cash flows for each of the years in the three-year period ended December 27, 2014, in conformity with accounting principles generally accepted in the United States of America. We also have audited, in accordance with the standards of the Public Company Accounting Oversight Board (United States), the Company’s internal control over financial reporting as of December 27, 2014, based on criteria established inInternal Control-Integrated Framework (1992 edition) issued by the Committee of Sponsoring Organizations of the Treadway Commission (COSO), and our report dated February 25, 2015, expressed an unqualified opinion on the effectiveness of the Company’s internal control over financial reporting. Report of Independent Registered Public Accounting Firm Audit Committee, Board of Directors and Stockholders Escalade, Incorporated Evansville, Indiana We have audited Escalade, Incorporated’s (Company) internal control over financial reporting as of December 27, 2014, based on criteria established in Internal Control -Integrated Framework (1992 edition) issued by the Committee of Sponsoring Organizations of the Treadway Commission (COSO). The Company’s management is responsible for maintaining effective internal control over financial reporting and for its assessment of the effectiveness of internal control over financial reporting, included in the accompanyingManagement’s Report on Internal Control on Internal Control over Financial Reporting. Our responsibility is to express an opinion on the Company’s internal control over financial reporting based on our audit. We conducted our audit in accordance with the standards of the Public Company Accounting Oversight Board (United States). Those standards require that we plan and perform the audit to obtain reasonable assurance about whether effective internal control over financial reporting was maintained in all material respects. Our audit included obtaining an understanding of internal control over financial reporting, assessing the risk that a material weakness exists and testing and evaluating the design and operating effectiveness of internal control based on the assessed risk. Our audit also included performing such other procedures as we considered necessary in the circumstances. We believe that our audit provides a reasonable basis for our opinion. A company’s internal control over financial reporting is a process designed to provide reasonable assurance regarding the reliability of financial reporting and the preparation of financial statements for external purposes in accordance with generally accepted accounting principles. A company’s internal control over financial reporting includes those policies and procedures that (1) pertain to the maintenance of records that, in reasonable detail, accurately and fairly reflect the transactions and dispositions of the assets of the company; (2) provide reasonable assurance that transactions are recorded as necessary to permit preparation of financial statements in accordance with generally accepted accounting principles, and that receipts and expenditures of the company are being made only in accordance with authorizations of management and directors of the company; and (3) provide reasonable assurance regarding prevention or timely detection of unauthorized acquisition, use or disposition of the company’s assets that could have a material effect on the financial statements. Because of its inherent limitations, internal control over financial reporting may not prevent or detect misstatements. Also, projections of any evaluation of effectiveness to future periods are subject to the risk that controls may become inadequate because of changes in conditions or that the degree of compliance with the policies or procedures may deteriorate. As permitted, the Company excluded the operations of Cue & Case Sales, Inc., a billiard accessories business acquired on October 20, 2014, from the scope of management’s report on internal control over financial reporting. As such, this entity has also been excluded from the scope of our audit of internal control over financial reporting. In our opinion, the Company maintained, in all material respects, effective internal control over financial reporting as of December 27, 2014, based on criteria established inInternal Control - Integrated Framework (1992 edition) issued by the Committee of Sponsoring Organizations of the Treadway Commission (COSO). We have also audited, in accordance with the standards of the Public Company Accounting Oversight Board (United States), the consolidated financial statements of the Company and our report dated February 25, 2015, expressed an unqualified opinion thereon. Escalade, Incorporated and Subsidiaries Consolidated Balance Sheets See notes to consolidated financial statements. Escalade, Incorporated and Subsidiaries Consolidated Statements of Operations Escalade, Incorporated and Subsidiaries Consolidated Statements of Comprehensive Income (Loss) See notes to consolidated financial statements. Consolidated Statements of Stockholders’ Equity See notes to consolidated financial statements. Escalade, Incorporated and Subsidiaries Consolidated Statements of Cash Flows See notes to consolidated financial statements. Note 1 — Nature of Operations and Summary of Significant Accounting Policies Nature of Operations Escalade, Incorporated and its wholly-owned subsidiaries (Escalade, the Company, we, us or our) are engaged in the manufacture and sale of sporting goods products. On June 30, 2014, the Company announced the sale of its Print Finishing business. On October 1, 2014, the Company announced the sale of its Information Security business. The divestiture of these two divisions accomplishes the Company’s complete exit from the Information Security and Print Finishing segment that is reported as discontinued operations. The Company is headquartered in Evansville, Indiana and has manufacturing facilities in the United States of America and Mexico. The Company sells products to customers primarily in North America with minimal sales throughout the remainder of the world. Principles of Consolidation The consolidated financial statements include the accounts of Escalade, Incorporated and its wholly-owned subsidiaries. All material inter-company accounts and transactions have been eliminated. Basis of Presentation The consolidated financial statements have been prepared in accordance with accounting principles generally accepted in the United States of America (GAAP). The books and records of subsidiaries located in foreign countries are maintained according to generally accepted accounting principles in those countries. Upon consolidation, the Company evaluates the differences in accounting principles and determines whether adjustments are necessary to convert the foreign financial statements to the accounting principles upon which the consolidated financial statements are based. As a result of this evaluation no material adjustments were identified. Fiscal Year End The Company’s fiscal year is a 52 or 53 week period ending on the last Saturday in December. Fiscal year Cash and Cash Equivalents Highly liquid financial instruments with insignificant interest rate risk and with original maturities of three months or less are classified as cash and cash equivalents. Accounts Receivable Revenue from the sale of the Company’s products is recognized as products are shipped to customers and accounts receivable are stated at the amount billed to customers. Interest and late charges billed to customers are not material and, because collection is uncertain, are not recognized until collected and are therefore not included in accounts receivable. The Company Inventories Inventory cost is computed on a currently adjusted standard cost basis (which approximates actual cost on a current average or first-in, first-out basis). Work in process and finished goods inventory are determined to be saleable based on a demand forecast within a specific time horizon, generally one year or less. Inventory in excess of saleable amounts is reserved, and the remaining inventory is valued at the lower of cost or market. This inventory valuation reserve totaled Additionally, the Company had inventory totaling zero and $9,366 that has been reclassified to assets held for sale at December 27, 2014 and December 28, 2013, respectively. Property, Plant and Equipment Property, plant and equipment are recorded at cost. Depreciation and amortization are computed for financial reporting purposes principally using the straight-line method over the following estimated useful lives: buildings, 20-30 years; leasehold improvements, term of the lease; machinery and equipment, 5-15 years; and tooling, dies and molds, 2-4 years. Property, plant and equipment consist of the following: The Company evaluates the recoverability of certain long-lived assets whenever events or changes in circumstances indicate that the carrying amount may not be recoverable. Estimates of future cash flows used to test recoverability of long-lived assets include separately identifiable undiscounted cash flows expected to arise from the use and eventual disposition of the assets. Where estimated future cash flows are less than the carrying value of the assets, impairment losses are recognized based on the amount by which the carrying value exceeds the fair value of the assets. No asset impairment was recognized during the years ended Additionally, the Company had property, plant and equipment totaling zero and $4,323 that has been reclassified to assets held for sale at December 27, 2014 and December 28, 2013, respectively. Investments Investments are composed of the following: Non-Marketable Equity Investments:TheCompany has a minority equity During 2013, the decision was made to cease operations and liquidate Escalade International, Ltd. Losses incurred include shutdown costs. As a result, the Company’s 50% portion of net loss for Escalade International, Ltd. for 2013 ($343) thousand and is included in other income on the Company’s statements of operations. During 2012, Escalade International, Ltd. performed below expectations, and this entity encountered unexpected attrition of certain significant customers as of the end of the third quarter 2012. Due to these events, the Company evaluated the economic and strategic benefits of continuing to hold this investment. Based on the review performed as of October 6, 2012, the Company determined that the fair value of this investment was less than its carrying value and that this impairment was other than temporary. As a result, the Company recognized other than temporary impairment of $382 thousand. Goodwill and Intangible Assets Goodwill represents the excess of the purchase price over fair value of net tangible and identifiable intangible assets of acquired businesses. Intangible assets consist of patents, consulting agreements, non-compete agreements, customer lists, and trademarks. Goodwill and trademarks are deemed to have indefinite lives and are not amortized, but are subject to impairment testing annually in accordance with guidance included in FASB ASC 350, Intangibles – Goodwill and Other. Other intangible assets are amortized using the straight-line method over the following lives: consulting agreements, the life of the agreement; customer lists, 5 to 13 years; non-compete agreements, the lesser of the term or 5 years; and patents, the lesser of the remaining life or 5 to The Company reviews goodwill for impairment annually and whenever events or changes in circumstances indicate the carrying value of goodwill may not be recoverable, in accordance with guidance in FASB ASC 350,Intangibles – Goodwill and Other. A qualitative assessment is first performed to determine if the fair value of the reporting unit is "more likely than not" less than the carrying value. If so, we proceed to step one of the two-step goodwill impairment test, in which the fair value of the reporting unit is compared to its carrying value. If not, then performance of the second step of the goodwill impairment test is not necessary. If the carrying value of goodwill exceeds the implied estimated fair value calculated in the second step, an impairment charge to current operations is recorded to reduce the carrying value to the implied estimated fair value. During the third quarter of fiscal 2012, the Company determined that sufficient indicators of potential impairment existed to require an interim goodwill impairment analysis for the Martin Yale Group reporting unit, which comprised the Information Security and Print Finishing operating segment that is reported as discontinued operations. These indicators included lower than expected operating profits and cash flows for the first nine months of 2012, coupled with continued economic weakness in the European and Asian markets. Based on this continuing trend, the earnings forecast for the next five years was revised resulting in a goodwill impairment loss of $13.2 million in the third quarter. In addition, the Company recorded an intangible asset impairment for the Information Security and Print Finishing segment related to other intangibles of $0.2 million. The goodwill impairment loss reduced to zero the carrying value of goodwill recorded as part of various acquisitions in the Information Security and Print Finishing segment for purchases from 2003 through 2008. Employee Incentive Plan During 2007, the Company replaced two stock-based compensation plans with a new incentive plan Foreign Currency Translation The functional currency for the foreign operations of Escalade is the local currency. The translation of foreign currencies into U.S. dollars is performed for balance sheet accounts using exchange rates in effect at the balance sheet dates and for revenue and expense accounts using a weighted average exchange rate during the year. The gains or losses resulting from the translation are included in Accumulated Other Comprehensive Cost of Products Sold Cost of products sold is comprised of those costs directly associated with or allocated to the products sold and include materials, labor and factory overhead. Other Income The components of Other Income are as follows: Provision for Income Taxes Income tax in the consolidated statement of operations includes deferred income tax provisions or benefits for all significant temporary differences in recognizing income and expenses for financial reporting and income tax purposes. A valuation allowance is established if it is more likely than not that a deferred tax asset will not be realized. Research and Development Research and development costs are charged to expense as incurred. Research and development costs incurred during Reclassifications Certain reclassifications have been made to prior year financial statements to conform to the current year financial statement presentation. These reclassifications had no effect on net earnings. New Accounting Pronouncements In In May 2014, the FASB issued ASU 2014-09 "Revenue from Contracts with Customers" (ASU 2014-09). ASU 2014-09 is a comprehensive new revenue recognition model requiring a company to recognize revenue to depict the transfer of goods or services to a customer at an amount reflecting the consideration it expects to receive in exchange for those goods or services. In adopting ASU 2014-09, companies may use either a full retrospective or a modified retrospective approach. ASU 2014-09 is effective for the Note 2 — Certain Significant Estimates The preparation of consolidated financial statements in conformity with GAAP requires management to make estimates and assumptions. These estimates and assumptions affect the reported amounts of assets and liabilities; the disclosure of contingent assets and liabilities at the date of the consolidated financial statements; and the reported amounts of revenues and expenses during the reporting period. These estimates and judgments are evaluated on an ongoing basis and are based on experience; current and expected future conditions; third party evaluations; and various other assumptions believed reasonable under the circumstances. The results of these estimates form the basis for making judgments about the carrying values of assets and liabilities as well as identifying and assessing the accounting treatment with respect to commitments and liabilities. Actual results may differ from the estimates and assumptions used in the financial statements and related notes. Listed below are certain significant estimates and assumptions related to the preparation of the consolidated financial statements: Goodwill and Intangible Assets In evaluating the recoverability of goodwill, it is necessary to estimate the fair values of the reporting Other intangible assets are amortized using the straight-line method over the following lives: consulting agreements, the life of the agreement; customer lists, 5 to 13 years; non-compete agreements, the lesser of the term or 5 years; and patents, the lesser of the remaining life or 5 to 9 years. Indefinite-lived intangible assets are reviewed for impairment annually, or whenever events or changes in circumstances indicate the carrying amount of an intangible asset may not be recoverable. There are inherent assumptions and judgments required in the analysis of goodwill and intangible impairment. Product Warranty The Company provides limited warranties on certain of its products, for varying periods. Generally, the warranty periods range from 90 days to one year. However, some products carry extended warranties of seven-year, ten-year, and lifetime warranties. The Company records an accrued liability and reduction in sales for estimated future warranty claims based upon historical experience and management’s estimate of the level of future claims. Changes in the estimated amounts recognized in prior years are recorded as an adjustment to the accrued liability and sales in the current year. Inventory Valuation Reserves The Company evaluates inventory for obsolescence and excess quantities based on demand forecasts based on specified time frames; usually one year. The demand forecast is based on historical usage, sales forecasts and current as well as anticipated market conditions. All amounts in excess of the demand forecast are deemed to be excess or obsolete and a reserve is established based on the anticipated net realizable value. Allowance for Doubtful Accounts The Company provides an allowance for doubtful accounts based upon a review of outstanding receivables, historical collection information and existing economic conditions. Accounts receivable are ordinarily due between 30 and 60 days after the issuance of the invoice. Accounts are considered delinquent when more than 90 days past due. Delinquent receivables are reserved or written off based on individual credit evaluation and specific circumstances of the customer. Customer Allowances Customer allowances are common practice in the industries in which the Company operates. These agreements are typically in the form of advertising subsidies, volume rebates and catalog allowances and are accounted for as a reduction to gross sales. The Company reviews such allowances on an ongoing basis and accruals are adjusted, if necessary, as additional information becomes available. Note 3 — Accrued Liabilities Accrued liabilities consist of the following: Note 4 — Operating Leases The Company leases warehouse and office space under non-cancelable operating leases that expire at various dates through At December Note 5 — Acquired Intangible Assets and Goodwill The carrying basis and accumulated amortization of recognized intangible assets are summarized in the following table: Amortization expense was Estimated future amortization expense All goodwill is allocated to the operating segment of the business. The changes in the carrying amount of goodwill were: The Company reviews goodwill for impairment annually and whenever events or changes in circumstances indicate the carrying value of goodwill may not be recoverable, in accordance with guidance in FASB ASC 350,Intangibles – Goodwill and Other. A qualitative assessment is first performed to determine if the fair value of the reporting unit is "more likely than not" less than the carrying value. If so, we proceed to step one of the two-step goodwill impairment test, in which the fair value of the reporting unit is compared to its carrying value. If not, then performance of the second step of the goodwill impairment test is not necessary. If the carrying value of goodwill exceeds the implied estimated fair value calculated in the second step, an impairment charge to current operations is recorded to reduce the carrying value to the implied estimated fair value. Note 6 — Equity Interest Investments The Company has a 50% interest in a joint venture, Stiga Sports AB (Stiga). The joint venture is accounted for under the equity method of accounting. Stiga, located in Sweden, is a global sporting goods company producing table tennis equipment and game products. Financial information for Stiga reflected in the table below has been translated from local currency to U.S. dollars using exchange rates in effect at the respective year-end for balance sheet amounts and using average exchange rates for income statement amounts. Certain differences exist between U.S. GAAP and local GAAP in Sweden, and the impact of these differences is not reflected in the summarized information reflected in the table below. The most significant difference relates to the accounting for goodwill for Stiga which is amortized over eight years in Sweden but is not amortized for U.S. GAAP reporting purposes. The effect on Stiga’s net assets resulting from the amortization of goodwill for the years ended In addition, the Company During 2013, the Company also had a 50% interest in Escalade International Ltd. During 2012, Escalade International, Ltd. performed below expectations, and the entity encountered unexpected attrition of certain significant customers through the end of the third quarter 2012. Due to these events, the Company evaluated the economic and strategic benefits of continuing to hold this investment. Based on the review as of October 6, 2012, the Company determined that the fair value of this investment was less than its carrying value and that this impairment was other than temporary. As a result, the Company recognized other than temporary impairment of $382 thousand. In accordance with Rule 8-03(b)(3) of Regulation S-X, summarized financial information for Stiga Sports AB balance sheets as of December 31, Note 7 — Borrowings On On June 30, 2014, the Company and each of its domestic subsidiaries entered into the Second Amendment to its First Amended and Restated Credit Agreement dated August 27, 2013 with its Lender. Under the terms of the Second Amendment to the Restated Credit Agreement, the Lender permitted Escalade to sell assets related to its Print Finishing business held by its subsidiary Martin Yale Industries, Inc. The Second Amendment to the Restated Credit Agreement also permitted Escalade and its subsidiaries that are parties to the Restated Credit Agreement to extend up to an additional €1.0 million in credit to Escalade’s former German subsidiary, intimus International GmbH. On November 13, 2013, the Company entered into the The existing term loan in the principal amount of The First Amendment to the Restated Credit Agreement also revised the definitions of “Fixed Charges” and “Fixed Charge Coverage Ratio” and expressly permitted the Company to complete its acquisition of certain assets of DMI Sports, Inc. The Restated Credit Agreement allows Escalade to request the issuance of letters of credit of up to $5,000,000, subject to the aggregate undrawn amount of a letter of credit issued by The Bank of New York Trust Company, N.A. for the account of Wedcor Holdings, Inc. Each loan, other than a Eurodollar Borrowing shall bear interest at the Alternate Base Rate plus the Applicable Base Rate. Loans comprising each Eurodollar Borrowing shall bear interest at the Adjusted LIBO Rate for the interest period in effect plus the Applicable Rate. Applicable Rate means the applicable rate per annum set forth below, based upon Escalade’s Funded Debt to Adjusted Ratio as of the most recent determination date: The Applicable Rate shall be determined as of the end of each quarter based upon the Company’s annual or quarterly consolidated financial statements and shall be effective during the period commencing the date of delivery to the agent. Indebtedness under the Restated Credit Agreement continues to be collateralized by liens on all of the present and future equity of each of the Company’s domestic subsidiaries and substantially all of the assets of the Company. In addition, each direct and indirect domestic subsidiary of Escalade has unconditionally guaranteed all of the indebtedness of Escalade arising under the Restated Credit Agreement and has secured its guaranty with a first priority security interest and lien on all of its assets. The Pledge and Security Agreement dated April 30, 2009 by and between Escalade and Chase, and each Pledge and Security Agreement dated April 30, 2009 by and between each such Escalade subsidiary and Chase continue in full force and effect, as amended by the Master Amendment to Pledge and Security Agreements dated May 31, 2010 entered into by Chase, Escalade and each such subsidiary. The Unlimited Continuing Guaranty dated April 30, 2009 applicable to each of Escalade’s domestic subsidiaries continues in full force and effect without change. During the first quarter 2013, the Company entered into a seller-financed agreement for the purchase of its formerly leased real estate in Mexico. The agreement requires sixteen quarterly installments of $156 thousand with a maturity date of Short-TermDebt Short-term debt at fiscal year-ends was as follows: The weighted average interest rate on short-term debt outstanding at December 27, 2014 and December 28, 2013 was 1.57% and 2.03%, respectively. Long-TermDebt Long-term debt at fiscal year-ends was as follows: Maturities of long-term debt outstanding at December Note 8 — Earnings Per Share The shares used in the computation of the Company’s basic and diluted earnings per common share are as follows: Weighted average common shares outstanding, assuming dilution, includes the incremental shares that would be issued upon the assumed exercise of stock options outstanding. Note 9 — Employee Benefit Plans The Company has an employee profit-sharing salary reduction plan, pursuant to the provisions of Section 401(k) of the Internal Revenue Code, for non-union employees. The Note 10 In April 2007, Shareholders approved the Escalade, Incorporated 2007 Incentive Plan The 2007 Incentive Plan is administered by the Board of Directors or a committee thereof, which is authorized to determine, among other things, the key employees, directors or consultants who will receive awards under the plan, the amount and type of award, exercise prices or performance criteria, if applicable, and vesting schedules. 2,981,491. Restricted Stock Units In The restricted stock units granted to directors vest immediately or within two years. All restricted stock units are payable in shares of the Company’s common stock upon vesting, subject to the deferral election arrangement, and are subject to forfeiture if on the vesting date the The Company issued no restricted stock units to employees or directors in When vesting is dependent on certain market criteria, the fair value of restricted stock units is determined by the use of Monte Carlo techniques. The market price of the Company’s stock on the grant date is used to value restricted stock units where vesting is not contingent on market criteria. In Stock Options Total compensation expense recorded in the The following table summarizes option activity for each of the three years ended The fair value of each option grant award is estimated on the grant date using the Black-Scholes-Merton option valuation model using the following assumptions: The following table summarizes stock option transactions for the three years ended The total intrinsic value of options exercised was $2.7 million, $929 thousand, and $2.4 million for 2014, 2013 and 2012, respectively. The following table summarizes information about stock options outstanding at December During the year ended December 27, 2014, the following activity occurred under the Company’s stock option plan: Note 11 — Discontinued Operations On October 1, 2014, the Company completed the sale of the Information Security business. The sale of the Information Security business, coupled with the previously announced sale of our Print Finishing business on June 30, 2014, represents the Company’s exit from the Information Security and Print Finishing segment. As a result, the Information Security and Print Finishing segment has been classified as discontinued operations for all periods presented and certain assets and liabilities in prior periods are classified as held for sale. As a result of the divestiture of the Information Security and Print Finishing segment, the Company incurred a loss on disposal of assets of $9.6 million, income from reclassification of accumulated other comprehensive income from foreign currency translation adjustments of $2.6 million and a tax benefit of $6.1 million. Under the terms of the final purchase agreement for the Information Security business divestiture, the Company contributed to its international Information Security operations, all claims related to intercompany debt of this operation prior to the divestiture operations. The Company also assumed the foreign tax liability related to this gain; however, it was able to utilize previously reserved net operating loss carry-forwards to offset the majority of the related tax liability. As of the second quarter of 2014, the Company determined the carrying value of the Information Security business assets was greater than their fair value, less the cost to sell the Information Security business, resulting in an impairment of certain accounts receivables, inventories, long-lived assets, intangible assets and other assets totaling $12.9 million. The impairment charge reduced the carrying value of intangible assets to fair value and the remaining assets to the lower of their carrying amount or fair value less cost to sell. The fair value for these assets was determined by estimating the most likely sale price with a third-party buyer based on market data. Because of the significance of the unobservable inputs and management’s judgment used in the assets held for sale analysis, these measurements were classified in level three of the valuation hierarchy. The results of operations presented as discontinued operations are summarized below. The assets and liabilities held for sale are summarized below. Note 12 — Other Comprehensive Income (Loss) The components of other comprehensive income (loss) The components of accumulated other comprehensive income (loss), net of tax, were as follows: Note 13 — Provision for Taxes Income before taxes and the provision for taxes consisted of the following: The provision for income taxes was computed based on financial statement income. A reconciliation of the provision for income taxes to the amount computed using the statutory rate follows: The provision for income taxes was computed based on financial statement income. In accordance with FASB ASC 740, the Company Interest costs and penalties related to income taxes are classified as interest expense and selling, general and administrative costs, respectively in the Company’s financial statements. The Company and its subsidiaries file income tax returns in the U.S. federal jurisdiction, and multiple state and foreign jurisdictions. The Company is subject to future examinations by federal, state and other tax authorities for all years after The components of the net deferred tax Deferred tax assets (liabilities) are included in the consolidated balance sheets as follows: The Company has federal and state unused net operating losses of approximately 2035. Note 14 — Operating Segment and Geographic Information The following table presents certain operatingsegment information. The Information Security and Print Finishing segment has been classified as discontinued operations for all periods presented. Each operating segment is individually managed and has separate financial results that are reviewed by the Company’s management. Each segment contains closely related products that are unique to the particular segment. There were no changes to the composition of segments in The Sporting Goods segment consists of home entertainment products such as table tennis tables and accessories; basketball goals; pool tables and accessories; outdoor playsets; soccer and hockey tables; archery equipment and accessories; and fitness, arcade and darting products. Customers include retailers, dealers and wholesalers located throughout North America, Europe and to a lesser the All Interest expense is allocated to operating segments based on working capital usage and the provision for taxes is allocated based on a combined federal and state statutory rate of 39.4% adjusted for actual taxes on foreign income. Permanent tax adjustments and timing differences are included in the all other segment. Identifiable assets are principally those assets used in each segment. The assets in the all other segment are principally cash and cash equivalents; deferred tax assets; and investments. As of December 27, 2014 the Company had a significant portion of its total accounts receivable with one customer. As of December 28, 2013 the Company had a significant portion of its total accounts receivable with two customers. The one customer accounted for approximately 23% of total accounts receivable at December 27, 2014, andapproximately 24% and 10% of total accounts receivable at December 28, 2013, respectively. As of December Raw materials for Escalade’s various product lines consist of wood, Identified assets by geographic region/country were as follows: Note 15 — Summary of Quarterly Results Certain amounts reported below have been changed from those previously reported on Forms 10-Q to reflect the impact of discontinued operations for all periods. Note 16 — Acquisitions All of the Company’s acquisitions have been accounted for using the purchase method of accounting. 2014 On October 22, 2014, the Company acquired substantially all the business and assets of Cue & Case Sales, Inc., a leader in specialty billiard accessories. The total purchase price of $10.4 million was paid in cash. The more significant assets acquired comprised of customer lists ($4,060), inventory ($3,260), goodwill ($1,633), tradenames ($987) and receivables ($372). 2013 In November 2013, the Company acquired substantially all of the business and assets of DMI Sports, Inc. relating to DMI’s indoor games and accessories such as darts, table tennis, game tables, and billiards. Escalade believes these assets, including the acquired brands and trade names, will complement Escalade’s existing product lines in this category. Escalade did not acquire the outdoor games business conducted by DMI Sports, which business was retained by DMI Sports. The total price of $6.1 million was paid in cash. The more significant assets acquired comprised of inventory ($2,705), goodwill ($1,095), patented technology ($706), customer lists ($569), non-compete ($300) and trademarks ($210). These acquisitions were not and would not have been material to the Company’s net sales, results of operations or total assets during the years ended December 27, 2014, December 28, 2013 and December 29, 2012, respectively. Accordingly, our consolidated results from operations do not differ materially from historical performance as a result of these acquisitions, and therefore, pro-forma results are not presented. Note 17 — Commitments and Contingencies The Company has obtained a letter of credit for the benefit of a certain mortgage holder. At December The Company is involved in litigation arising in the normal course of its business. The Company does not believe that the disposition or ultimate resolution of existing claims or lawsuits will have a material adverse effect on the business or financial condition of the Company. The Company has entered into various agreements whereby it is required to make royalty and license payments. At December Note 18 — Fair Values of Financial Instruments The following methods were used to estimate the fair value of all financial instruments recognized in the accompanying balance sheets at amounts other than fair values. Cash and Cash Equivalents and Time Deposits Fair values of cash and cash equivalents and time deposits approximate cost due to the short period of time to maturity. Notes Payable and Long-term Debt The Company believes the carrying value of short-term debt, including current portion of long-term debt, and long-term debt adequately reflects the fair value of these instruments. The following table presents estimated fair values of the Company’s financial instruments in accordance with FASB ASC 825 at December Signatures Pursuant to the requirements of Section 13 or 15(d) of the Securities Exchange Act of 1934, the Registrant has duly caused this report to be signed on its behalf by the undersigned, thereunto duly authorized. Pursuant to the requirements of the Securities Exchange Act of 1934, this report has been signed below by the following persons on behalf of the Registrant and in the capacities and on the dates indicated. (1) Financial Statements Report of Independent Registered Public Accounting FirmConsolidated financial statements of Escalade, Incorporated and subsidiaries:Consolidated balance sheets—December 31, 2011 and December 25, 2010Consolidated statements of operations—fiscal years ended December 31, 2011, December 25, 2010, and December 26, 2009Consolidated statements of stockholders’ equity—fiscal years ended December 31, 2011, December 25, 2010, and December 26, 2009Consolidated statements of cash flows—fiscal years ended December 31, 2011, December 25, 2010, and December 26, 2009(3) Exhibits 2.1 Agreement dated as of October 1, 2014 for the Sale and Purchase of all of the Shares in intimus International GmbH and Olympia Business Systems, Inc. among Wedcor Holdings, Inc. as Seller, Pitney Bowes Espana, S.A.U. as Buyer, and PHI Fund II, F.C.R. de Regimen Simplificado as Guarantor (without exhibits and schedules, which Escalade has determined are not material) (p) 2.2 Asset Sale and Purchase Agreement dated as of October 1, 2014 between Olympia Business Systems, Inc. as purchaser and Wedcor Holdings, Inc. as seller (without exhibits and schedules, which Escalade has determined are not material) (p) 3.1 Articles of Incorporation of Escalade, Incorporated (b) 3.2Amended By-Laws of Escalade, Incorporated (p)3.2 Amended By-Laws of Escalade, Incorporated (n) 4.1Form of Escalade, Incorporated’s4.1 Form of Escalade, Incorporated's common stock certificate (a) 10.1 Licensing agreement between Sweden Table Tennis AB and Indian Industries, Inc. dated January 1, 1995 (c) 10.2Credit Agreement dated as of April 30, 2009 among Escalade, Incorporated and JPMorgan Chase Bank, N.A. (without exhibits and schedules, which Escalade has determined are not material) (j)10.3Pledge and Security Agreement dated as of April 30, 200910.2 First Amended and Restated Credit Agreement dated as of August 27, 2013 by and between Escalade, Incorporated and JPMorgan Chase Bank, N.A. (without exhibits and schedules, which Escalade has determined are not material) (j)10.4Form of Pledge and Security Agreement dated as of April 30, 2009 with JPMorgan Chase Bank, N.A. (i) (k)10.5Form of Unlimited Continuing Guaranty dated as of April 30, 2009 in favor of JPMorgan Chase Bank, N.A. (j) (k)10.6First Amendment dated as of July 29, 200910.3 First Amendment dated as of November 13, 2013 to First Amended and Restated Credit Agreement by and between Escalade, Incorporated and JPMorgan Chase Bank, N.A. (l) 10.7Second Amendment dated as of September 30, 2009 to Credit Agreement by and between Escalade, Incorporated and JPMorgan Chase Bank, N.A. (m)10.4 Second Amendment dated as of June 30, 2014 to the First Amended and Restated Credit Agreement dated as of August 23, 2013 among Escalade, Incorporated and JP Morgan Chase Bank, N.A. (without exhibits and schedules, which Escalade has determined are not material) (o) 10.8Third Amendment dated as of October 30, 2009 to Credit Agreement by and between Escalade, Incorporated and JPMorgan Chase Bank, N.A. (n)10.5 Third Amendment dated as of October 1, 2014 to the First Amended and Restated Credit Agreement dated as of August 23, 2013 among Escalade, Incorporated and JPMorgan Chase Bank, N.A. (without exhibits and schedules, which Escalade has determined are not material) (p) 10.9Loan Agreement dated September 1, 1998 between Martin Yale Industries, Inc. and City of Wabash, Indiana (e)10.6 Pledge and Security Agreement dated as of April 30, 2009 by and between Escalade, Incorporated and JPMorgan Chase Bank, N.A. (without exhibits and schedules, which Escalade has determined are not material) (f) 10.7 Form of Pledge and Security Agreement dated as of April 30, 2009 with JPMorgan Chase Bank, N.A. (f) (g) 10.8 Form of Unlimited Continuing Guaranty dated as of April 30, 2009 in favor of JPMorgan Chase Bank, N.A. (f) (g) 10.9 Loan Agreement dated September 1, 1998 between Martin Yale Industries, Inc. and City of Wabash, Indiana (d) 10.10 Trust Indenture between the City of Wabash, Indiana and Bank One Trust Company, NA as Trustee dated September 1, 1998 relating to the Adjustable Rate Economic Development Revenue Refunding Bonds, Series 1998 (Martin Yale Industries, Inc. Project) (d) 28(4) 10.10Trust Indenture between the City of Wabash, Indiana and Bank One Trust Company, NA as Trustee dated September 1, 1998 relating to the Adjustable Rate Economic Development Revenue Refunding Bonds, Series 1998 (Martin Yale Industries, Inc. Project) (e)10.11Fourth Amendment dated as of March 1, 2010 to Credit Agreement by and between Escalade, Incorporated and JPMorgan Chase Bank, N.A. (o)10.12Fifth Amendment dated as of April 15, 2010 to Credit Agreement by and between Escalade, Incorporated and JPMorgan Chase Bank, N.A. (q)10.13Sixth Amendment to Credit Agreement dated as of May 31, 2010 by and between Escalade, Incorporated and JPMorgan Chase Bank, N.A. (r)10.14Overdraft Facility by and between Escalade, Incorporated and JPMorgan Chase Bank, N.A., London Branch (r)10.15Seventh Amendment to Credit Agreement dated as of April 14, 2011 by and between Escalade, Incorporated and JPMorgan Chase Bank, N.A. (t)(4)Executive Compensation Plans and Arrangements10.1710.11 Incentive Compensation Plan for Escalade, Incorporated and its subsidiaries (a) 10.12 Escalade Incorporated 2007 Incentive Plan, as amended, incorporated by reference herein from Annex 1 and 2 to the Registrant’s 2012 Definitive Proxy Statement (i) 10.13 Form of Stock Option Award Agreement utilized in Stock Option grants to employees pursuant to the Escalade, Incorporated 2007 Incentive Plan (h) 10.14 Form of Stock Option Award Agreement utilized in Stock Option grants to Directors pursuant to the Escalade, Incorporated 2007 Incentive Plan (h) 10.15 Form of Restricted Stock Unit Agreement utilized in Restricted Stock Unit grants pursuant to the Escalade Incorporated 2007 Incentive Plan. (e) 10.16 Executive Severance agreement, dated September 14, 2012 between Robert Keller and Escalade, Inc. (j) 10.17 Agreement and Release dated November 11, 2014 between Deborah J. Meinert and Escalade, Inc. (q) 10.18 Example of contributory deferred compensation agreement between Escalade, Incorporated and certain management employees allowing for deferral of compensation (a)10.191997 Director Stock Compensation and Option Plan (d)10.201997 Incentive Stock Option Plan (d)10.211997 Director Stock Compensation and Option Plan Certificate (f)10.221997 Incentive Stock Option Plan Certificate (f)10.23Escalade, Incorporated 2007 Incentive Plan, incorporated by reference herein from Annex 1 to the Registrant’s 2007 Definitive Proxy Statement. (g)10.24Employment offer letter dated July 23, 2007 between Robert Keller and Escalade, Inc. (h)10.25Form of Restricted Stock Unit Agreement utilized in Restricted Stock Unit grants pursuant to the Escalade Incorporated 2007 Incentive Plan. (i)10.26Escalade, Incorporated schedule of Directors Compensation 10.2710.19 Escalade, Incorporated schedule of Executive Officers Compensation 10.28Form of Stock Option Award Agreement utilized in Stock Option grants to employees pursuant to the Escalade, Incorporated 2007 Incentive Plan (s)10.29Form of Stock Option Award Agreement utilized in Stock Option grants to Directors pursuant to the Escalade, Incorporated 2007 Incentive Plan (s)21 Subsidiaries of the Registrant 23.1 Consent of BKD, LLP 23.2 Consent of FALK GmbH & Co KG 31.1 Chief Executive Officer Rule 13a-14(a)/15d-14(a) Certification 31.2 Chief Financial Officer Rule 13a-14(a)/15d-14(a) Certification 32.1 Chief Executive Officer Section 1350 Certification 32.2 Chief Financial Officer Section 1350 Certification (a) Incorporated by reference from the Company’s Form S-2 Registration Statement, File No. 33-16279, as declared effective by the Securities and Exchange Commission on September 2, 1987 (b)Incorporated by reference from the Company’s(b) Incorporated by reference from the Company's 2007 First Quarter Report on Form 10-Q (c)Incorporated by reference from the Company’s(c) Incorporated by reference from the Company's 1995 Annual Report on Form 10-K (d)Incorporated by reference from the Company’s 1997 Proxy Statement(e)Incorporated by reference from the Company’s(d) Incorporated by reference from the Company's 1998 Third Quarter Report on Form 10-Q (f)Incorporated by reference from the Company’s 2004 Annual Report on Form 10-K(g)Incorporated by reference from the Company’s 2007 Second Quarter Report on Form 10-Q(h)Incorporated by reference from the Company’s 2007 Third Quarter Report on Form 10-Q(i)Incorporated by reference from the Company’s Form 8-K filed on February 29,(e) Incorporated by reference from the Company's Form 8-K filed on March 3, 2008 (j)Incorporated by reference from the Company’s(f) Incorporated by reference from the Company's Form 8-K filed on May 6, 2009 (k)Each of Escalade’s eleven(g) Each of Escalade’s nine domestic subsidiaries has entered into the identical form of Pledge and Security Agreement and form of Unlimited Continuing Guaranty. Those eleven domestic subsidiaries are: Indian Industries, Inc.; Harvard Sports, Inc.; Martin Yale Industries, Inc.; Harvard Sports, Inc.; Wedcor Holdings, Inc..; U.S. Weight, Inc.; Bear Archery, Inc.; Escalade Sports Playground, Inc.; Schleicher & Co. America, Inc.; Olympia Business Systems, Inc.; EIM Company, Inc.; SOP Services, Inc.; and Escalade Insurance, Inc.(l)Incorporated by reference from the Company’s Form 8-K filed on July 30, 2009(m)Incorporated by reference from the Company’s Form 8-K filed on September 30, 200929(n)Incorporated by reference from the Company’s 2009 Third Quarter Report on Form 10-Q(o)Incorporated by reference from the Company’s Form 8-K filed on March 2, 2010(p)Incorporated by reference from the Company’s 2010 Second Quarter Report on Form 10-Q filed on August 2, 2010(q)Incorporated by reference from the Company’s 2010 First Quarter Report on Form 10-Q filed on April 16, 2010(r)Incorporated by reference from the Company’s Form 8-K filed on June 4, 2010(s)(h) Incorporated by reference from the Company’s 2009 Annual Report on Form 10-K filed on March 5, 2010 (t)Incorporated by reference from the Company’s Form 8-K filed on April 20, 2011(i) Incorporated by reference from the Company’s 2012 Proxy Statement (j) Incorporated by reference from the Company’s Form 8-K filed on September 19, 2012 (k) Incorporated by reference from the Company’s Form 8-K filed on August 28, 2013 (l) Incorporated by reference from the Company’s Form 8-K filed on November 14, 2013 (m) Incorporated by reference from the Company’s Form 8-K filed on November 25, 2013 (n) Incorporated by reference from the Company’s 2014 First Quarter Report on Form 10-Q filed on April 22, 2014 (o) Incorporated by reference from the Company’s Form 8-K filed on July 3, 2014 (p) Incorporated by reference from the Company’s Form 8-K filed on October 6, 2014 (q) Incorporated by reference from the Company’s Form 8-K filed on November 12, 2014 
/s/ BKD, LLP Evansville, Indiana February 25, 2015 /s/ BKD, LLP Evansville, Indiana February 25, 2015 March 5, 201232FALK & CoReports of Independent Registered Public Accounting FirmTo the Stockholders and Board of Directors ofMartin Yale International GmbH,Markdorf/GermanyWe have audited the accompanying balance sheet of Martin Yale International GmbH, Markdorf/Germany (the Company) as of December 31, 2011 and December 31, 2010 and the related statement of income for each of the three years in the three-year period ended December 31, 2011. The financial statements are the responsibility of the Company’s management. Our responsibility is to express an opinion on these financial statements based on our audit.We conducted our audit in accordance with the standards of the Public Company Accounting Oversight Board (United States). Those standards require that we plan and perform the audit to obtain reasonable assurance about whether the financial statements are free of material misstatement. An audit includes examining, on a test basis, evidence supporting the amounts and disclosures in the financial statements. An audit also includes assessing the accounting principles used and significant estimates made by management, as well as evaluating the overall financial statement presentation. We believe that our audit provides a reasonable basis for our opinion.In our opinion, based on our audit, the financial statements referred to above present fairly, in all material respects, the financial position of the Company as of December 31, 2011 and December 31, 2010 and the result of its operations for each of the three years in the three-year period ended December 31, 2011, in conformity with accounting principles generally accepted in Germany./s/ FALK GmbH & Co KGWirtschaftsprüfungsgesellschaftSteuerberatungsgesellschaftHeidelberg/Germany,March 5, 201233All Amounts in Thousands Except Share Information December 27,
2014 December 28,
2013 ASSETS Current Assets: Cash and cash equivalents $ 3,232 $ 1,091 Time deposits 1,450 1,700 Receivables, less allowances of $900 and $1,104 32,150 38,271 Inventories 23,775 18,941 Prepaid expenses 1,622 1,610 Deferred income tax benefit 925 2,189 Prepaid income tax 5,697 853 Assets held for sale — 16,561 TOTAL CURRENT ASSETS 68,851 81,216 Property, plant and equipment, net 11,596 10,635 Intangible assets 13,465 10,999 Goodwill 14,875 13,113 Investments 18,949 19,455 Other assets 145 86 Assets held for sale — 6,470 TOTAL ASSETS $ 127,881 $ 141,974 LIABILITIES AND STOCKHOLDERS’ EQUITY Current liabilities: Notes payable $ 16,200 $ 21,700 Current portion of long-term debt 1,586 1,563 Trade accounts payable 1,853 2,055 Accrued liabilities 12,107 11,521 Liabilities held for sale — 6,840 TOTAL CURRENT LIABILITIES 31,746 43,679 Long-term debt 3,360 4,946 Deferred income tax liability 2,996 5,394 TOTAL LIABILITIES 38,102 54,019 Commitments and contingencies — — Stockholders' equity: Preferred stock Authorized: 1,000,000 shares, no par value, none issued Common stock Authorized: 30,000,000 shares, no par value Issued and outstanding: 2014 —13,998,090 shares, 2013 —13,656,557 shares 13,998 13,657 Retained earnings 77,745 69,379 Accumulated other comprehensive income (loss) (1,964 ) 4,919 TOTAL STOCKHOLDERS’ EQUITY 89,779 87,955 TOTAL LIABILITIES AND STOCKHOLDERS’ EQUITY $ 127,881 $ 141,974 Years Ended All Amounts in Thousands Except Per Share Data December 27,
2014 December 28,
2013 December 29,
2012 Net Sales $ 137,975 $ 132,991 $ 112,600 Costs, Expenses and Other Income Cost of products sold 96,912 92,991 79,932 Selling, administrative and general expenses 22,938 21,453 18,450 Amortization 2,621 2,363 2,174 Operating Income 15,504 16,184 12,044 Interest expense 447 404 88 Other expense (income) (4,726 ) (2,934 ) (3,028 ) Equity method investment impairment — — 382 Income Before Income Taxes from Continuing Operations 19,783 18,714 14,602 Provision for Income Taxes from Continuing Operations 6,438 6,119 3,848 Net Income from Continuing Operations 13,345 12,595 10,754 Discontinued Operations Loss from operations (611 ) (2,026 ) (15,140 ) Loss on classification as held for sale (12,945 ) — — Gain on disposal (includes $2,565 of accumulated other comprehensive income reclassification from foreign currency translation adjustment) 5,929 — — Provision (benefit) for income taxes (6,099 ) 764 544 Net Loss from Discontinued Operations (1,528 ) (2,790 ) (15,684 ) Net Income (Loss) $ 11,817 $ 9,805 $ (4,930 ) Basic Earnings Per Share Data: Income from continuing operations $ 0.96 $ 0.93 $ 0.81 Loss from discontinued operations (0.11 ) (0.20 ) (1.18 ) Net Income (Loss) $ 0.85 $ 0.73 $ (0.37 ) Diluted Earnings Per Share Data: Income from continuing operations $ 0.95 $ 0.92 $ 0.80 Loss from discontinued operations (0.11 ) (0.20 ) (1.17 ) Net Income (Loss) $ 0.84 $ 0.72 $ (0.37 ) Years Ended All Amounts in Thousands December 27,
2014 December 28,
2013 December 29,
2012 Net Income (Loss) $ 11,817 $ 9,805 $ (4,930 ) Foreign currency translation adjustment before reclassifications (4,318 ) 826 760 Amounts reclassified from comprehensive income due to divesture (2,565 ) — — Comprehensive Income (Loss) $ 4,934 $ 10,631 $ (4,170 ) Accumulated Other Common Stock Retained Comprehensive All Amounts in Thousands Shares Amount Earnings Income (Loss) Total Balances at December 31, 2011 12,884 $ 12,884 $ 71,348 $ 3,333 $ 87,565 Other comprehensive income 760 760 Net loss (4,930 ) (4,930 ) Expense of stock options 574 574 Exercise of stock options 504 504 (63 ) 441 Settlement of restricted stock units 3 3 (3 ) — Dividends declared (4,150 ) (4,150 ) Stock issued to directors as compensation 36 36 161 197 Balances at December 29, 2012 13,427 $ 13,427 $ 62,937 $ 4,093 $ 80,457 Other comprehensive income 826 826 Net income 9,805 9,805 Expense of stock options 557 557 Exercise of stock options 184 184 452 636 Settlement of restricted stock units 17 17 (17 ) — Tax benefit from settlement of stock compensation 110 110 Dividends declared (4,622 ) (4,622 ) Stock issued to directors as compensation 29 29 157 186 Balances at December 28, 2013 13,657 $ 13,657 $ 69,379 $ 4,919 $ 87,955 Other comprehensive loss (6,883 ) (6,883 ) Net income 11,817 11,817 Expense of stock options 716 716 Exercise of stock options 301 301 1,085 1,386 Settlement of restricted stock units 34 34 (34 ) — Dividends declared (5,294 ) (5,294 ) Stock issued to directors as compensation 6 6 76 82 Balances at December 27, 2014 13,998 $ 13,998 $ 77,455 $ (1,964 ) $ 89,779 Years Ended All Amounts in Thousands December 27,
2014 December 28,
2013 December 29,
2012 Operating Activities: Net Income (Loss) $ 11,817 $ 9,805 $ (4,930 ) Reconciling adjustments: Depreciation and amortization 4,383 3,844 3,398 Equity method investment impairment charges — — 382 Provision for doubtful accounts (245 ) 317 88 Stock option and restricted stock unit expense 716 557 574 Equity in net income of joint venture investments (3,923 ) (2,934 ) (2,998 ) Deferred income taxes (1,197 ) 896 590 Additional discontinued operations activities 6,672 2,896 15,942 Gain from insurance proceeds for involuntary conversion (603 ) — — Loss (gain) on disposals of assets (10 ) — 39 Changes in Accounts receivable 6,739 (10,090 ) (6,574 ) Inventories (1,559 ) 3,086 (3,039 ) Prepaids (4,658 ) (548 ) 102 Other assets — 35 (166 ) Income tax payable — (710 ) 773 Accounts payable and accrued expenses 245 1,236 1,933 Net cash provided by operating activities 18,377 8,390 6,114 Investing Activities: Purchase of property and equipment (2,663 ) (2,169 ) (2,065 ) Acquisitions (10,630 ) (6,485 ) (1,250 ) Net sale (purchase) of short-term time deposits 250 (500 ) (250 ) Dividends received from equity method investments 919 617 444 Discontinued operations activities 5,700 (186 ) (358 ) Proceeds from insurance for involuntary conversion 603 — — Proceeds from sale of property and equipment 26 1 16 Net cash (used in) investing activities (5,795 ) (8,722 ) (3,463 ) Financing Activities: Dividends paid (5,294 ) (4,622 ) (5,076 ) Net (decrease) increase in overdraft facility — (2,452 ) 203 Net (decrease) increase in notes payable (5,500 ) 4,345 1,920 Proceeds from exercise of stock options 1,386 636 441 Proceeds from restated credit agreement — 1,000 — Change in long-term debt (1,563 ) 446 (1,500 ) Tax benefit from settlement of stock compensation — 110 — Director stock compensation 82 186 197 Net cash (used in) financing activities (10,889 ) (351 ) (3,815 ) Effect of Exchange Rate Changes on Cash and Cash Equivalents (807 ) 485 (113 ) Increase (Decrease) in Cash and Cash Equivalents 886 (198 ) (1,277 ) Cash and Cash Equivalents, beginning of year (includes $1,255, $1,050 and $1,003 respectively of cash reported as assets held for sale) 2,346 2,544 3,821 Cash and Cash Equivalents, end of year (includes zero, $1,255 and $1,050 respectively of cash reported as assets held for sale) $ 3,232 $ 2,346 $ 2,544 Supplemental Cash Flows Information Interest paid $ 600 $ 809 $ 640 Income taxes paid $ 5,208 $ 4,546 $ 3,364 Seller note issued in purchase of real estate — $ 2,300 — Dividends payable — — — The Company purchased substantially all of the business and assets of Cue & Case Sales, Inc. for $10.4 million. In conjunction with the acquisition, liabilities were assumed as follows: Fair value of assets acquired $ 10,577 Cash paid for assets 10,438 Liabilities assumed $ 139 Escalade, Incorporated and SubsidiariesAll Amounts in Thousands Except Share Information December 31, 2011 December 25, 2010 Assets Current assets Cash and cash equivalents $ 3,821 $ 1,536 Time deposits 950 1,250 Receivables, less allowances of $938 and $1,204 26,914 25,458 Inventories 29,035 22,888 Prepaid expenses 1,102 1,160 Deferred income tax benefit 1,478 1,502 Prepaid income tax 846 1,216 Total current assets 64,146 55,010 Property, plant and equipment, net 11,915 19,844 Intangible assets 14,064 15,678 Goodwill 25,285 25,397 Investments 14,397 11,624 Other assets 308 — Total assets $ 130,115 $ 127,553 Liabilities and Stockholders’ Equity Current liabilities Notes payable—bank $ 14,947 $ 10,992 Current portion of long-term debt 2,000 2,000 Trade accounts payable 3,293 3,751 Accrued liabilities 14,410 14,135 Total current liabilities 34,650 30,878 Long-term debt 5,000 7,500 Deferred income tax liability 2,900 2,145 Total liabilities 42,550 40,523 Commitments and contingencies — — Stockholders’ equity Preferred stock Authorized: 1,000,000 shares, no par value, none issued Common stock Authorized: 30,000,000 shares, no par value Issued and outstanding: 2011 —12,883,948 shares, 2010—12,780,372 shares 12,884 12,780 Retained earnings 71,348 70,329 Accumulated other comprehensive income 3,333 3,921 Total stockholders’ equity 87,565 87,030 Total liabilities and stockholders’ equity $ 130,115 $ 127,553 See notes to consolidated financial statements.34Escalade, Incorporated and SubsidiariesConsolidated Statements of Operations Years Ended All Amounts in Thousands Except Per Share Data December 31,
2011 December 25,
2010 December 26,
2009 Net Sales $ 134,250 $ 120,656 $ 115,999 Costs, Expenses and Other Income Cost of products sold 92,541 83,475 82,250 Selling, administrative and general expenses 35,942 27,704 29,484 Amortization 1,596 1,288 2,265 Operating Income 4,171 8,189 2,000 Interest expense (693 ) (1,163 ) (1,665 ) Other income 3,397 2,050 2,270 Income Before Income Taxes 6,875 9,076 2,605 Provision for Income Taxes 2,434 3,017 948 Net Income $ 4,441 $ 6,059 $ 1,657 Earnings Per Share Data Basic earnings per share $ 0.35 $ 0.48 $ 0.13 Diluted earnings per share $ 0.33 $ 0.46 $ 0.13 See notes to consolidated financial statements.35Escalade, Incorporated and SubsidiariesConsolidated Statements of Stockholders’ Equity Accumulated Other Common Stock Retained Comprehensive All Amounts in Thousands Shares Amount Earnings Income Total Balances at December 27, 2008 12,616 $ 12,616 $ 63,050 $ 3,124 $ 78,790 Comprehensive income Net income 1,657 1,657 Foreign currency translation adjustment 1,642 1,642 Total comprehensive income 3,299 Expense of stock options 588 588 Settlement of restricted stock units 7 7 (7 ) — Stock issued to directors as compensation 34 34 53 87 Balances at December 26, 2009 12,657 $ 12,657 $ 65,341 $ 4,766 $ 82,764 Comprehensive income Net income 6,059 6,059 Foreign currency translation adjustment (845 ) (845 ) Total comprehensive income 5,214 Expense of stock options 177 177 Exercise of stock options 75 75 (17 ) 58 Settlement of restricted stock units 12 12 (12 ) — Stock option forfeiture (32 ) (32 ) Dividends declared (1,285 ) (1,285 ) Stock issued to directors as compensation 36 36 98 134 Balances at December 25, 2010 12,780 $ 12,780 $ 70,329 $ 3,921 $ 87,030 Comprehensive income Net income 4,441 4,441 Foreign currency translation adjustment (588 ) (588 ) Total comprehensive income 3,853 Expense of stock options 548 548 Exercise of stock options 57 57 69 126 Settlement of restricted stock units 20 20 (20 ) — Dividends declared (4,138 ) (4,138 ) Stock issued to directors as compensation 27 27 119 146 Balances at December 31, 2011 12,884 $ 12,884 $ 71,348 $ 3,333 $ 87,565 See notes to consolidated financial statements.36Escalade, Incorporated and SubsidiariesConsolidated Statements of Cash Flows Years Ended All Amounts in Thousands December 31,
2011 December 25,
2010 December 26,
2009 Operating Activities Net income $ 4,441 $ 6,059 $ 1,657 Adjustments to reconcile net income to net cash provided by (used in) operating activities Depreciation and amortization 8,772 4,330 5,965 Provision for doubtful accounts (271 ) (247 ) 362 Stock option expense 548 177 641 Equity in net income of joint venture investments (3,328 ) (1,963 ) (1,598 ) Deferred income taxes 863 1,401 2,175 Provision for deferred compensation — — 110 Gain on disposals of assets (355 ) (1 ) (408 ) Changes in Accounts receivable (1,148 ) (1,752 ) 3,661 Inventories (6,302 ) (2,411 ) 9,059 Prepaids (249 ) 435 210 Other assets 405 (16 ) (503 ) Income tax payable 288 (55 ) 2,739 Accounts payable and accrued expenses (1,083 ) 2,895 (5,757 ) Net cash provided by operating activities 2,581 8,852 18,313 Investing Activities Purchase of property and equipment (2,375 ) (1,778 ) (1,894 ) (Purchase) sale of short-term time deposits 300 (500 ) (750 ) Proceeds from sale of property and equipment 3,428 13 269 Proceeds from sale of investments — — 1,645 Net cash provided by (used in) investing activities 1,353 (2,265 ) (730 ) Financing Activities Net increase (decrease) in notes payable—bank 3,293 (8,237 ) (18,880 ) Net increase in overdraft facility 662 1,406 — Proceeds from exercise of stock options 126 58 — Stock option forfeiture — (32 ) — Reduction of long-term debt (2,500 ) (500 ) — Cash dividends paid (3,212 ) (1,285 ) — Directors compensation 146 134 33 Net cash used in financing activities (1,485 ) (8,456 ) (18,847 ) Effect of Exchange Rate Changes on Cash and Cash Equivalents (164 ) 366 686 Increase (Decrease) in Cash and Cash Equivalents 2,285 (1,503 ) (578 ) Cash and Cash Equivalents, Beginning of Year 1,536 3,039 3,617 Cash and Cash Equivalents, End of Year $ 3,821 $ 1,536 $ 3,039 Supplemental Cash Flows Information Interest paid $ 683 $ 1,161 $ 1,802 Income taxes paid $ 1,316 $ 1,832 $ 184 Dividends payable $ 926 — — See notes to consolidated financial statements.37Note 1 — Nature of Operations and Summary of Significant Accounting PoliciesNature of OperationsEscalade, Incorporated and its wholly-owned subsidiaries (the “Company”) are engaged in the manufacture and sale of sporting goods and information security and print finishing products. The Company is headquartered in Evansville, Indiana and has manufacturing facilities in the United States of America, Mexico and Germany. The Company sells products to customers throughout the world.20112014 was 53 weeks long, ending on December 31, 2011. Fiscal years 2010 and 2009 were 52 weeks long, ending on December 25, 2010 and27, 2014. Fiscal year 2013 was 52 weeks long, ending on December 26, 2009 respectively.28, 2013. Fiscal year 2012 was 52 weeks long, ending on December 29, 2012.does not offer the right of return on any of its sales and the Company does not engage in consignment or contingency sales. The Company provides an allowance for doubtful accounts which is described in Note 2 – Certain Significant Estimates.$1.6 million$537 thousand and $1.8 million$469 thousand at fiscal year-end 20112014 and 2010,2013, respectively. Inventories, net of the valuation reserve, at fiscal year-ends were as follows:In Thousands 2011 2010 2014 2013 Raw materials $ 7,865 $ 5,973 $ 3,950 $ 3,317 Work in process 3,751 2,497 3,967 3,357 Finished goods 17,419 14,418 15,858 12,267 $ 29,035 $ 22,888 $ 23,775 $ 18,941 38 In Thousands 2011 2010 2014 2013 Land $ 1,783 $ 2,381 $ 2,049 $ 2,049 Buildings and leasehold improvements 17,542 20,672 16,951 16,028 Machinery and equipment 22,890 30,581 19,852 17,927 Total cost 42,215 53,634 38,852 36,004 Accumulated depreciation and amortization (30,300 ) (33,790 ) (27,256 ) (25,369 ) $ 11,915 $ 19,844 $ 11,596 $ 10,635 2011, 2010,2014, 2013, or 2009.2012.In Thousands 2011 2010 2014 2013 Non-marketable equity investments (equity method) $ 14,397 $ 11,624 $ 18,949 $ 19,455 positionsposition in companiesa company that strategically relatedrelates to the Company’s business, but does not have control over these companies.this company. The accounting method employed is dependent on the level of ownership and degree of influence the Company can exert on operations. Where the equity interest is less than 20% and the degree of influence is not significant, the cost method of accounting is employed. Where the equity interest is greater than 20% but not more than 50%, the equity method of accounting is utilized. Under the equity method, the Company’s proportionate share of net income (loss) is recorded in other income on the consolidated statement of income.operations. The proportionate share of net income was $3.3$3.9 million, $2.0$2.9 million and $1.6$3.0 million in 2011, 20102014, 2013 and 2009,2012, respectively. Total cash dividends received from these equity investments amounted to $323$919 thousand, $0,$617 thousand, and $32$444 thousand in 2011, 20102014, 2013 and 2009,2012, respectively. The Company considers whether the fair value of any of its equity investments have declined below their carrying value whenever adverse events or changes in circumstances indicate that recorded values may not be recoverable. If the Company considered any such decline to be other than temporary (based on various factors, including historical financial results, product development activities and overall health of the investments’ industry), a write-down is recorded to estimated fair value. There was no impairment loss recognized on equity method investments in 2011, 2010 or 2009.39 89 years. No impairment has been recognized on goodwill or intangible assets in 2011, 2010 or 2009.more fully explained in Note 11.10. The Company accounts for this plan under the recognition and measurement principles of FASB ASC 505,718,Equity Based Payments.39IncomeinIncome (Loss)in the Consolidated Statements of Stockholders’ Equity and are excluded from net income.income (loss). Gains or losses resulting from foreign currency transactions are included in selling, general and administrative expense in the Consolidated Statements of Operations and were insignificant in fiscal years 2011, 2010,2014, 2013, and 2009.2012.In Thousands 2011 2010 2009 2014 2013 2012 Income from non-marketable equity investments accounted for on the equity method $ 3,328 $ 1,963 $ 1,598 $ 3,923 $ 2,934 $ 2,998 Dividend and interest income from marketable equity securities available for sale — — 48 Gain on sale of marketable equity securities available for sale — — 432 Royalty income from patents 66 79 50 — — 30 Proceeds from insurance for involuntary conversion 603 — — Rent income from real estate 106 — — Other 3 8 142 94 — — $ 3,397 $ 2,050 $ 2,270 $ 4,726 $ 2,934 $ 3,028 2011, 20102014, 2013 and 20092012 were approximately $1.4$1.7 million, $1.9$1.2 million, and $2.0$1.0 million, respectively.May 2011,April 2014, the FASB issued Accounting Standards Update 2011-04,Fair Value Measurement, to develop common requirements for measuring fair valueASU 2014-08 “Reporting Discontinued Operations and for disclosing information about fair value measurements in accordance with Generally Accepted Accounting Principles and International Financial Reporting Standards.Disclosures of Disposals of Components of an Entity.” ASU 2014-08 provides a narrower definition of discontinued operations than under existing GAAP. The amendments in this Update explain how to measure fair value; they do not require additional fair value measurements and are not intended to establish valuation standardsstandard update requires that only disposals of components of an entity (or groups of components) that represent a strategic shift that has or affect valuation practices outside of financial reporting. The amendments are effective for annual periods beginning after December 15, 2011. The adoption of this standard is not expected towill have a material impactmajor effect on the Company’s consolidated financial statements.40In June 2011, FASB issued Accounting Standards Update 2011-05,Presentation of Comprehensive Income, to improve the comparability, consistency, and transparency of financial reporting and to increase the prominence of itemsentity’s operations are reported in other comprehensive income. The amendments in this Update allow companies to present the total of comprehensive income, the components of net income, and the components of other comprehensive income either in a single continuous statement of comprehensive income or in two separate but consecutive statements. The amendments do not change the items that must be reported in other comprehensive income or when an item of other comprehensive income must be reclassified to net income. The amendments are effective for fiscal years and interim periods within those years beginning after December 15, 2011 and thus are effective for the Company’s first quarter reporting in 2012. The adoption of this standard is not expected to have a material impact on the Company’s consolidated financial statements.In December 2011, FASB issued Accounting Standards Update 2011-12,Deferral of the Effective Date for Amendments to the Presentation of Reclassifications of Items Out of Accumulated Other Comprehensive Income in Accounting Standards Update No. 2011-05.The amendments in this Update defer only those changes in Update 2011-05 that relate to the presentation of reclassification adjustments. The amendments are being made to allow the FASB time to redeliberate whether to present on the face of the financial statements the effects of reclassifications out of accumulated other comprehensive incomeas discontinued operations. The standard also provides guidance on the financial statement presentations and disclosures of discontinued operations. The ASU is effective prospectively for disposals (or classifications of businesses as held-for-sale) of components of net income and other comprehensive income for all periods presented. The adoption of this standard is not expected to have a material impact on the Company’s consolidated financial statements.In September 2011, FASB issued Accounting Standards Update 2011-08,Testing Goodwill for Impairment, to simplify how entities test goodwill for impairment. The amendmentsan entity that occur in this Update permit companies to first assess qualitative factors to determine whether it is more likely than not that the fair value of a reporting unit is less than its carrying amount as a basis for determining whether it is necessary to perform the two-step goodwill impairment test described in ASC Topic 350,Intangibles – Goodwill and Other. The guidance in this Update is effective for fiscal years andannual or interim periods beginning after December 15, 20112014 and thusearly adoption is permitted. We early adopted ASU 2014-08 effective in the second quarter of 2014.Company’s first quarterinterim period within annual reporting in 2012. Theperiods beginning after December 15, 2016, and early adoption is not permitted. Management is evaluating the provisions of this statement and has not determined what impact the adoption of this standard is not expected toASU 2014-09 will have a material impact on the Company’s consolidatedCompany's financial statements.position or results of operations.units.unit. In making this assessment, the Company estimates the fair market values of the reporting unitsunit using a discounted cash flow model and comparable market value data for similar entities. Key assumptions and estimates used in the cash flow model include discount rate, internal sales growth, margins, capital expenditure requirements, and working capital requirements. Recent performance of the reporting unitsunit is an important factor, but not the only factor, in the assessment.41A reconciliation of the liability isChanges in product warranty were as follows:In Thousands 2011 2010 2009 2014 2013 2012 Beginning balance $ 656 $ 737 $ 896 $ 620 $ 523 $ 414 Additions 1,087 357 232 1,156 978 833 Deductions (874 ) (438 ) (391 ) (1,081 ) (881 ) (724 ) Ending balance $ 869 $ 656 $ 737 $ 695 $ 620 $ 523 A reconciliation of the reserve isChanges in inventory valuation reserves were as follows:In Thousands 2011 2010 2009 2014 2013 2012 Beginning balance $ 1,839 $ 3,152 $ 3,943 $ 469 $ 414 $ 378 Additions 458 189 1,042 287 426 179 Deductions (741 ) (1,502 ) (1,833 ) (219 ) (371 ) (143 ) Ending balance $ 1,556 $ 1,839 $ 3,152 $ 537 $ 469 $ 414 42 A reconciliation of theChanges in allowance isfor doubtful accounts were as follows:In Thousands 2011 2010 2009 2014 2013 2012 Beginning balance $ 1,204 $ 1,485 $ 1,114 $ 1,104 $ 787 $ 698 Additions 1,125 654 1,224 251 475 91 Deductions (1,391 ) (935 ) (853 ) (455 ) (158 ) (2 ) Ending balance $ 938 $ 1,204 $ 1,485 $ 900 $ 1,104 $ 787 A reconciliation of the liability is Changes in customer allowances were as follows:In Thousands 2011 2010 2009 Beginning balance $ 2,398 $ 2,749 $ 4,623 Additions 5,762 5,046 5,578 Deductions (5,555 ) (5,397 ) (7,452 ) Ending balance $ 2,605 $ 2,398 $ 2,749 42In Thousands 2014 2013 2012 Beginning balance $ 2,494 $ 1,787 $ 1,640 Additions 4,747 4,584 4,489 Deductions (5,086 ) (3,877 ) (4,342 ) Ending balance $ 2,155 $ 2,494 $ 1,787 In Thousands 2011 2010 2014 2013 Employee compensation $ 4,737 $ 4,696 $ 3,314 $ 3,800 Customer related allowances and accruals 4,551 3,982 5,055 5,334 Other accrued items 5,122 5,457 3,738 2,387 $ 14,410 $ 14,135 $ 12,107 $ 11,521 2016.2020. Terms of the leases, including renewals, taxes, utilities, and maintenance, vary by lease. Total rental expense included in the results of operations relating to all leases was $1.5 million, $1.5 million, and $1.7$0.7 million in 2011, 2010,2014, $.07 million in 2013, and 2009, respectively.$1.0 million in 2012.31, 2011,27, 2014, minimum rental payments under non-cancelable leases with terms of more than one year were as follows:In Thousands Amount Amount 2012 $ 1,099 2013 788 2014 598 2015 419 $ 601 2016 312 406 2017 347 2018 201 Thereafter 285 $ 3,216 $ 1,840 2011 2010 2014 2013 In Thousands Gross Carrying Amount Accumulated Amortization Gross Carrying Amount Accumulated Amortization Gross
Carrying
Amount Accumulated
Amortization Gross
Carrying
Amount Accumulated
Amortization Patents $ 22,369 $ 13,372 $ 22,369 $ 11,978 $ 24,220 $ 19,882 $ 24,356 $ 17,730 Consulting agreements 976 976 976 976 Non-compete agreements 2,197 2,121 2,197 2,073 2,367 2,053 2,352 1,943 Customer list 1,801 1,710 1,821 1,582 5,054 548 994 325 Trademarks 5,022 122 5,046 122 4,429 122 3,417 122 $ 32,365 $ 18,301 $ 32,409 $ 16,731 $ 36,070 $ 22,605 $ 31,119 $ 20,120 $1.6$2.6 million, $1.3$2.4 million and $2.3$2.2 million for 2011, 20102014, 2013 and 2009,2012, respectively.43 for each reporting segment is summarized in the following table:In Thousands 2012 2013 2014 2015 2016 Thereafter 2015 2016 2017 2018 2019 Thereafter Sporting Goods $ 2,099 $ 2,075 $ 1,938 $ 1,932 $ 989 $ 42 $ 2,777 $ 1,547 $ 748 $ 571 $ 471 $ 3,044 Information Security and Print Finishing 73 18 — — — — $ 2,172 $ 2,093 $ 1,938 $ 1,932 $ 989 $ 42 In Thousands Sporting Goods Information Security and Print Finishing Total Balance at December 26, 2009 $ 12,017 $ 14,198 $ 26,215 Foreign currency translation adjustment — (818 ) (818 ) Balance at December 25, 2010 12,017 13,380 25,397 Foreign currency translation adjustment — (112 ) (112 ) Balance at December 31, 2011 $ 12,017 $ 13,268 $ 25,285 In Thousands Sporting Goods Balance at December 29, 2012 12,017 Acquisition 1,096 Balance at December 28, 2013 $ 13,113 Acquisition 1,762 Balance at December 27, 2014 $ 14,875 20112014 and 20102013 are addbacks of $9.3$11.4 million and $7.6$13.1 million, respectively. These net differences are comprised of cumulative goodwill adjustments of $13.0$16.0 million offset by the related cumulative tax effect of $3.7$4.6 million as of December 31, 201127, 2014 and cumulative goodwill adjustments of $10.6$18.3 million offset by the related cumulative tax effect of $3.0$5.2 million as of December 25, 2010.28, 2013. The income statement impact of these goodwill and tax adjustments and other individually insignificant U.S. GAAP adjustments for the years ended December 31, 2011,27, 2014, December 25, 2010,28, 2013, and December 26, 200929, 2012 are to increase total Stiga net income by approximately $1.6$0.8 million, $1.8 million, and $1.7 million, and $1.3 million, respectively.hashad a 50% interest in two joint ventures, Escalade International, Ltd. in the United Kingdom and Neoteric Industries Inc. in Taiwan. The income and assets of Neoteric havehad no material impact on the Company’s financial reporting. During 2014, the decision was made to divested the Company’s 50% interest in Neoteric Industries Inc. in Taiwan as part of the divestiture of the Information Security and Print Finishing businesses.isthat was a sporting goods wholesaler, specializing in fitness equipment. The decision was made during 2013 to cease operations and liquidate Escalade International, Ltd. Losses incurred include shutdown costs. As a result, the Company’s 50% portion of net loss for Escalade International, Ltd. for 2013 was ($343) thousand and is included in other income on the Company’s statements of operations. The Company’s 50% portion of net income (loss) for Escalade International for the years ended December 31, 2011, December 25, 2010, and December 26, 200929, 2012, was ($103)137) thousand, $87 thousand, and $123 thousand respectively, and is included in other income on the Company’s statementstatements of operations. Additional information regarding these entities is considered immaterial and has not been included in the combined totals listed below.4420112014 and 2010,2013, and statements of operations for the years ended December 31, 2011, 20102014, 2013 and 20092012 is as follows:In Thousands 2011 2010 2014 2013 Current assets $ 23,451 $ 19,384 $ 30,539 $ 31,399 Non-current assets 9,460 11,338 8,082 8,967 Total assets 32,911 30,722 38,621 40,366 Current liabilities 10,033 9,599 7,669 10,019 Non-current liabilities 6,334 8,918 4,229 4,893 Total liabilities 16,367 18,517 11,898 14,912 Net assets $ 16,544 $ 12,205 $ 26,723 $ 25,454 2011 2010 2009 Net sales $ 45,588 $ 30,826 $ 25,833 Gross profit 21,746 13,953 12,166 Net income 5,223 2,044 1,615 2014 2013 2012 Net sales $ 52,583 $ 48,914 $ 41,957 Gross profit 25,737 23,636 20,756 Net income 7,537 4,914 4,534 April 14, 2011October 1, 2014, the Company and each of its domestic subsidiaries entered into the Third Amendment to its First Amended and Restated Credit Agreement dated August 27, 2013 (“Restated Credit Agreement”) with its issuing bank, JPMorgan Chase Bank, N.A., and the other lenders identified in the Restated Credit Agreement (collectively, the “Lender”). The Third Amendment was entered into to permit the Company to sell the Information Security Business and terminate the Euro overdraft facility line of €1.0 million.SeventhFirst Amendment to its First Amended and Restated Credit Agreement dated August 27, 2013 (Restated Credit Agreement) with its issuing bank, JP MorganJPMorgan Chase Bank, N.A. (Chase). The SeventhUnder the terms of the First Amendment amendsto the Restated Credit Agreement, originally dated as of April 30, 2009, and as amended had a maturity date of May 31, 2012. The Seventh Amendment now makesthe Lender has increased by $9.0 million the amount available to the Company aunder its senior revolving credit facility in the maximum principal amount of now up to $22 million with a$31.0 million. The Company is required to repay the outstanding principal balance of the senior revolving credit facility, including all accrued and unpaid interest thereon, on the maturity date of July 31, 2013August 27, 2016. The Company may prepay the senior revolving credit facility, in whole or in part, and areborrow prior to the maturity date.$8.5$5.0 million remains outstanding and the maturity date has been extended by two years to August 27, 2018. As amended, the Company is required to repay the outstanding principal balance of the term loan, including all accrued and unpaid interest thereon, on August 27, 2018. The Company is required to make repayments of the principal balance of the term loan in equal installments of $250 thousand per calendar quarter, with interest accrued thereon. Principal amounts repaid in respect of the term loan may not be re-borrowed. The credit facility and term debt are secured by substantially all assets of the Company.Funded Debt to
Adjusted EBITDA
Ratio Revolving
Eurodollar
Borrowing Term
Eurodollar
Borrowing ABR
Revolving
Borrowing ABR Term
Borrowing Letter of
Credit Fee Commitment
Fee Category 1
Greater than or equal to 2.50 to 1.0 2.50 % 2.75 % 0.50 % 0.75 % 2.50 % 0.45 % Category 2
Greater than or equal to 2.25 to 1.0 but less than 2.50 to 1.0 2.25 % 2.50 % 0.25 % 0.50 % 2.25 % 0.40 % Category 3
Greater than or equal to 2.00 to 1.0 but less than 2.50 to 1.0 2.00 % 2.25 % 0.00 % 0.25 % 2.00 % 0.35 % Category 4
Greater than or equal to 1.75 to 1.0 but less than 2.00 to 1.0 1.75 % 2.00 % (0.25 %) 0.00 % 1.75 % 0.30 % Category 5
Less than 1.75 to 1.0 1.50 % 1.75 % (0.50 %) (0.25 %) 1.50 % 0.30 % May 31, 2015.November 30, 2016. The term loan agreement requires the Company to make repayment of theoutstanding principal balance in equal installments of $0.5 million per quarter beginning in September 2010. A portion of the credit facility not in excess of $5 million is available for the issuance of commercial or standby letters of credit to be issued by Chase. The Credit Agreement Amendment also provides a Euro 2.0 million (approximately $2.6 million) overdraft facility. Asas of December 31, 2011 and December 25, 2010, the total amount outstanding on the overdraft facility27, 2014 was $2.2 million and $1.6 million, respectively.$1.2 million.In Thousands 2011 2010 Senior secured revolving credit facility of $22.0 million with a maturity of July 31, 2013. The loan bears an interest rate of the Alternative Base Rate plus or minus the applicable ABR spread, or LIBOR plus the applicable LIBOR Spread, determined quarterly and based on the Company’s leverage ratio. Secured by substantially all assets of the Company. The interest rates at December 31, 2011 ranged between 2.53% and 3.25%. $ 10,000 $ 6,707 Euro overdraft facility of approximately $2.6 million payable on demand. The facility bears on interest rate of LIBOR plus 2.5%. 2,247 1,585 Short-term debt 4,700 4,700 $ 16,947 $ 12,992 In Thousands 2014 2013 Senior secured revolving credit facility of $31.0 million with a maturity of August 27, 2016. The interest rates at December 27, 2014 was 1.688%. $ 13,500 $ 19,000 Short-term debt reclassified from long-term debt 4,286 4,263 $ 17,786 $ 23,263 45
47 In Thousands 2011 2010 2014 2013 Revolving term loan of $10.0 million, executed on May 31, 2010 with a term of 5 years, with payments of $0.5 million quarterly beginning with the calendar quarter ended September 30, 2010. The loan bears an interest rate of Alternative Base Rate plus or minus the applicable ABR Spread, or LIBOR plus the applicable LIBOR Spread, determined quarterly. The interest rate at December 31, 2011, was 2.7963%. $ 7,000 $ 9,500 Term loan of $5.0 million with a maturity date of August 27, 2018. The interest rate at December 27, 2014, was 1.9375%. $ 3,750 $ 4,750 Mortgage payable (Wabash, Indiana Adjustable Rate Economic Development Revenue Refunding Bonds), annual installments are optional, interest varies with short-term rates and is adjustable weekly based on market conditions, maximum rate is 10.00%, rate at December 31, 2011 is 0.35%, due September 2028, secured by plant facility, machinery and equipment, and a stand-by letter of credit 2,700 2,700 Mortgage payable (Wabash, Indiana Adjustable Rate Economic Development Revenue Refunding Bonds), annual installments are optional, interest varies with short-term rates and is adjustable weekly based on market conditions, maximum rate is 10.00%, rate at December 27, 2014 is 0.31%, due September 2028, secured by real estate and a stand-by letter of credit 2,700 2,700 Seller-financed agreement for real estate in Mexico. The agreement requires sixteen quarterly installments of $156 thousand each with a maturity date of November 30, 2016. This agreement has an interest rate of zero percent and is secured by the financed real estate in Mexico. 1,196 1,759 9,700 12,200 7,646 9,209 Portion classified as short-term debt (4,700 ) (4,700 ) (4,286 ) (4,263 ) $ 5,000 $ 7,500 $ 3,360 $ 4,946 31, 201127, 2014 are as follows: $4.7$4.3 million in 2012, $2.02015, $1.6 million in 2013, $2.0 million in 2014, and2016, $1.0 million in 2015.2017, and $0.7 million in 2018.In Thousands 2011 2010 2009 2014 2013 2012 Weighted average common shares outstanding 12,849 12,726 12,632 13,853 13,506 13,244 Dilutive effect of stock options 562 515 239 214 125 160 Weighted average common shares outstanding, assuming dilution 13,411 13,241 12,871 14,067 13,631 13,404 Number of anti-dilutive stock options — — 30 — 271 451 Company’sCompany's contribution is a matching percentage of the employee contribution as determined by the Board of Directors annually.The Company’sCompany's expense for the plan was $0.33 million, $0.18 million$532 thousand, $517 thousand and $0.13 million$446 thousand for 2011, 20102014, 2013 and 2009,2012, respectively.46 — Deferred Compensation PlanIn October 1985, the Board of Directors approved the adoption of a Contributory Deferred Compensation Plan pursuant to which some recipients of incentive compensation could elect to defer receipt thereof. For each dollar of deferred compensation, the Company provided a 75% matching amount. All deferrals allowed under this plan have been made and amounts deferred earn interest at the rate of 9%. Mr. Robert Griffin, Chairman of the Board, was the only remaining participant in the Plan at the beginning of 2010. During 2010, the entire balance owed to Mr. Griffin was disbursed in cash. The payment of this liability was recognized as an expense for tax purposes in 2010.Note 11 — Stock Compensation Plans(“2007(2007 Incentive Plan”)Plan), which is an incentive plan for key employees, directors and consultants with various equity-based incentives as described in the plan document. The 2007 Incentive Plan is a replacement for the 1997 Incentive Stock Option Plan and the 1997 Director Stock Compensation and Option Plan which expired at the end of April 2007. All options issued and outstanding under the expired plans will remain in effect until exercised, expired or forfeited.SubjectUnder the original terms of the plan and subject to various restrictions contained in the plan document, the total number of shares of common stock which may be issued pursuant to awards under the Plan may not exceed 1,481,491 shares.2009, 2008, and 2007,2014, the Company grantedawarded 50,000 restricted stock units to certain officers and directors of the Companyemployees at fair market value on the date of grant. The 2014 restricted stock units grantedawarded to employees vest over four years (one-third two years from grant date, one-third three years from grant date and one-third four years from grant date) provided that the employee is still employed by the Company and that the performance criteria related to the market price of the Company’s stock is satisfied. The criteria is for any 30 consecutive trading days on the NASDAQ Stock Market (or such other principal securities exchange on which the Company’s shares of common stock are then traded) during the period beginning on the grant date and ending on the fourth anniversary thereof, the cumulative average Volume Weighted Average Price per share is at least 15% higher than the closing price per share on the grant date plus any incremental dividends paid above the quarterly dividend rate on the grant date by the Company vest over threeduring such four year period. The performance criteria for the 2014 restricted stock units awarded to four years and are dependent on certain market criteria. employees was satisfied during the second quarter of 2014.employee is not employed or the director no longer holds a position with the Company.20102013 and 2011.2012. The following table presents a summary of non-vested restricted stock units granted to employees and directors as of December 31, 2011, and changes during the year ended December 31, 2011:27, 2014: Number of Shares Weighted-Average Grant Date Fair Value Number of
Shares Weighted
Average Grant
Date Fair Value Non-vested restricted stock units as of December 25, 2010 82,708 $ 5.78 Non-vested stock units as of December 28, 2013 — Granted — $ — 50,000 $ 10.49 Vested — $ — — Forfeited (82,708 ) $ 5.78 — Non-vested restricted stock units as of December 31, 2011 — Non-vested stock units as of December 27, 2014 50,000 $ 10.49 Vested but unsettled 53,479 4,500 Outstanding restricted stock units as of December 31, 2011 53,479
Outstanding non-vested restricted stock units as of December 27, 2014 45,500 2010, the Company recorded the impact of pre-vesting forfeitures of certain restricted stock units. The impact of these pre-vesting forfeitures was to reduce the stock compensation expense by $259 thousand. In 20112014, 2013, and 2010,2012 the Company recognized $35$191 thousand, $0, and ($48)$0 thousand respectively in compensation expense related to restricted stock units and as of December 31, 201127, 2014 and December 25, 2010,28, 2013, there was $0$334 thousand and $35 thousand$0 respectively, of unrecognized compensation expense related to restricted stock units.47statementstatements of operations for 2011, 20102014, 2013 and 20092012 relating to stock options was $513$525 thousand, $224$557 thousand and $84$574 thousand, respectively. As of December 27, 2014, there were $237 thousand of total unrecognized compensation costs related to stock options. These costs are expected to be recognized over a weighted average period of 1.5 years.AtDuring 2014, the February 24, 2011 meeting of the Board of Directors, the Board voted to approve directorCompany awarded 25,000 stock options of 37,500, and employee incentiveto directors. The stock options awarded to directors vest at the end of 200,000. The director and employee options have a one year and have an exercise price equal to the market price on the date of grant. Director stock options are subject to forfeiture, except for termination of services as a result of retirement, death or disability, if on the vesting and four year-tiered vesting, respectively, and alldate the director no longer holds a position with the Company. No stock options expire in five years.were awarded to employees during 2014.2011:2014: Incentive Stock Options Director Stock Options Granted Outstanding Granted Outstanding 2011 200,000 915,625 37,500 69,024 2010 299,000 877,500 30,000 51,524 2009 682,000 791,000 30,000 51,600 Incentive Stock Options Director Stock Options Granted Outstanding Granted Outstanding 2014 — 284,375 25,000 60,000 2013 120,000 559,950 37,500 80,000 2012 200,000 607,875 37,500 85,000 2011 2010 2009 �� Risk-free interest rates 1.51% 1.36% 1.15% to 1.38% Dividend yields 1.84% 0% 0% Volatility factors of expected market price of common stock 109.71% to 122.17% 97.64% to 116.63% 81.34% to 94.93% Weighted average expected life of the options 1-4 years 1-4 years 1-3 years 2014 2013 2012 Risk-free interest rates 0.68 % 0.52 % 0.84 % Dividend yields 4.23 % 5.97 % 5.50 % Volatility factors of expected market price of common stock 35.86 % 48.79% to 74.05 % 95.56% to 110.39 % Weighted average expected life of the options 1-4 years 1-4 years 1-4 years 2011:2014: 2011 2010 2009 2014 2013 2012 Shares Option Price Shares Option Price Shares Option Price Shares Option
Price Shares Option
Price Shares Option
Price Outstanding at beginning of year 929,024 $0.64 to $11.26 842,600 $0.64 to $13.40 390,867 $6.99 to $19.21 639,950 $0.64 to$6.07 692,875 $0.64 to 6.07 984,649 $0.64 to $9.35 Issued during year 237,500 $6.07 329,000 $2.56 712,000 $0.64 to $0.89 25,000 $11.86 157,500 $5.85 to $6.06 237,500 $5.28 to $5.66 Canceled or expired (125,625 ) (167,576 ) (260,267 ) (19,000 ) (27,000 ) (25,024 ) Exercised during year (56,250 ) $0.64 to $2.56 (75,000 ) $0.64 to $0.89 — (301,575 ) $0.64 to $6.07 (183,425 ) $0.64 to $6.07 (504,250 ) $0.64 to $2.56 Outstanding at end of year 984,649 $0.64 to $9.35 929,024 $0.64 to $11.26 842,600 $0.64 to $13.40 344,375 $2.56 to $11.86 639,950 $0.64 to $6.07 692,875 $0.64 to $6.07 Exercisable at end of year 69,399 87,524 191,850 158,875 198,825 192,625 Weighted-average fair value of options granted during the year $ 4.03 $ 1.80 $ 0.38 $ 3.06 $ 2.21 $ 3.12 4831, 2011:27, 2014: Options Outstanding Options Exercisable Range of Exercise Prices Number of Shares Weighted-Average Remaining Contractual Life Weighted-Average Exercise Price Number of Shares Weighted-Average Exercise Price $0.64 - $0.89 476,000 2.3 years $ 0.64 5,000 $ 0.89 $2.56 - $6.07 502,125 3.6 years $ 4.17 57,875 $ 2.56 $9.35 6,524 0.3 years $ 9.35 6,524 $ 9.35 984,649 69,399 Options Outstanding Options Exercisable Range of
Exercise Prices Number of
Shares Weighted-Average
Remaining
Contractual Life Weighted-Average
Exercise Price Number of
Shares Weighted-Average
Exercise Price $2.56 8,625 0.2 years $ 2.56 8,625 $ 2.56 $5.28 - $5.66 116,750 2.2 years $ 5.29 50,000 $ 5.30 $5.85 - $6.06 97,875 3.2 years $ 5.86 34,875 $ 5.90 $6.07 96,125 1.2 years $ 6.07 65,375 $ 6.07 $11.86 25,000 4.2 years $ 11.86 344,375 158,875 Number of
Options Weighted Average
Grant Date Fair
Value Nonvested balance, beginning of year 441,125 $ 2.79 Granted 25,000 $ 2.31 Vested (266,625 ) $ 2.69 Forfeited (14,000 ) $ 2.98 Nonvested balance, end of year 185,500 $ 2.85 Years Ended All Amounts in Thousands December 27,
2014 December 28,
2013 Net sales $ 20,865 $ 30,686 Cost of products sold 13,813 20,358 Selling, administrative and general expenses 7,535 11,997 Amortization — 18 Interest expense 98 335 Other expense 30 4 Loss Before Income Taxes (611 ) (2,026 ) Discontinued Operations Loss on classification as held for sale (12,945 ) — Gain on disposal 5,929 — Provision (benefit) for income taxes (6,099 ) 764 Net Loss from Discontinued Operations $ (1,528 ) $ (2,790 ) All Amounts in Thousands October 4,
2014 December 28,
2013 ASSETS Cash and cash equivalents $ — $ 1,255 Receivables, net — 5,480 Inventories — 9,366 Prepaid expenses — 429 Property, plant and equipment, net — 4,323 Intangible assets — 1,754 Investments — 331 Other assets — 93 Assets held for sale $ — $ 23,031 LIABILITIES Trade accounts payable $ — $ 428 Accrued liabilities — 6,412 Liabilities held for sale $ — $ 6,840 and related tax effects were as follows:In Thousands 2011 2010 2009 2014 2013 2012 Change in foreign currency translation adjustment $ (588 ) $ (845 ) $ 1,642 Change in foreign currency translation adjustment before reclassifications $ (4,318 ) $ 826 $ 760 Amounts reclassified from comprehensive income due to divesture $ (2,565 ) In Thousands 2011 2010 2009 Foreign currency translation adjustment $ 3,333 $ 3,921 $ 4,766 In Thousands 2014 2013 2012 Foreign currency translation adjustment $ (1,964 ) $ 4,919 $ 4,093 In Thousands 2011 2010 2009 Income (loss) before taxes: United States of America (USA) $ 8,481 $ 10,919 $ 3,359 Non USA (1,605 ) (1,843 ) (754 ) $ 6,875 $ 9,076 $ 2,605 Provision for taxes: Current Federal $ 965 $ 118 $ (906 ) State 38 180 (685 ) International 568 (194 ) 364 1,571 104 (1,227 ) Deferred Federal 163 2,802 1,686 State 621 59 964 International 79 52 (475 ) 863 2,913 2,175 $ 2,434 $ 3,017 $ 948 The Company has not provided for USA deferred taxes or foreign withholding taxes on undistributed earnings for non-USA subsidiaries where the Company intends to reinvest these earnings indefinitely in operations outside the USA.49In Thousands 2014 2013 2012 Income (loss) before taxes: United States of America (USA) $ 5,001 $ 19,803 $ 11,104 Non USA 7,155 (3,115 ) (11,642 ) $ 12,156 $ 16,688 $ (538 ) Provision for taxes: Current Federal $ 3 $ 5,060 $ 3,671 State 306 560 303 International 566 (26 ) 83 875 5,594 4,057 Deferred Federal (667 ) 299 397 State 131 616 15 International — 374 (77 ) (536 ) 1,289 335 $ 339 $ 6,883 $ 4,392 Continuing Operations $ 6,438 $ 6,119 $ 3,848 Discontinued Operations (6,099 ) 764 544 $ 339 $ 6,883 $ 4,392 In Thousands 2011 2010 2009 Income tax at statutory rate $ 2,338 $ 3,086 $ 886 Increase (decrease) in income tax resulting from Permanent differences (investment income, dividends, and captive insurance earnings) (292 ) (368 ) (162 ) State tax expense, net of federal effect 435 158 184 Effect of foreign tax rates (101 ) 484 (188 ) Other 54 (343 ) 228 Recorded provision for income taxes $ 2,434 $ 3,017 $ 948 In Thousands 2014 2013 2012 Income tax at statutory rate $ 4,255 $ 5,840 $ (188 ) Increase (decrease) in income tax resulting from State tax expense, net of federal effect 291 764 509 Federal true-ups 55 (18 ) (113 ) Federal tax credits (568 ) (256 ) (247 ) Effect of foreign tax rates (1,107 ) (362 ) (94 ) Valuation allowances (state and foreign) (1,406 ) 1,400 39 Goodwill impairment (worldwide) — — 4,684 Captive insurance earnings (398 ) (390 ) (379 ) Incentive stock options 155 130 152 Foreign exchange gain on sale of Information Security (898 ) — — Other (40 ) (225 ) 29 Recorded provision for income taxes $ 339 $ 6,883 $ 4,392 has recorded the following changes indoes not have any uncertain tax positions:positions as of and for the years ended December 27. 2014 and December 28, 2013.In Thousands 2011 2010 2014 2013 Balance, beginning of year $ 220 $ 536 $ — $ — Additions for current year tax positions — — — — Additions for prior year tax positions — — — — Settlements — (263 ) — — Reductions settlements — — — — Reductions for prior year tax positions (174 ) (53 ) — — Balance, end of year $ 46 $ 220 $ — $ — 2007.2010.assetsliabilities are as follows:In Thousands 2011 2010 Assets Employee benefits $ 55 $ 58 Valuation reserves 1,584 1,727 Property and equipment 356 — Stock based compensation 132 268 Federal and state credits 1,046 375 Net operating loss carry forward 7,132 7,584 Total assets 10,305 10,012 Liabilities Unrealized equity investment income (2,027 ) (1,627 ) Goodwill and intangible assets (2,535 ) (2,184 ) Prepaid insurance (90 ) — Property and equipment — (218 ) Total liabilities (4,652 ) (4,029 ) Valuation Allowance Beginning balance (6,626 ) (6,855 ) Increase (decrease) during period (449 ) 229 Ending balance (7,075 ) (6,626 ) $ (1,422 ) $ (643 ) 50In Thousands 2014 2013 Assets Employee benefits $ 120 $ 308 Valuation reserves 1,412 2,427 Property and equipment 566 57 Stock based compensation 191 195 Federal and state credits 878 165 Net operating loss carry forward 1,038 8,632 Total assets 4,205 11,784 Liabilities Unrealized equity investment income (3,079 ) (3,157 ) Goodwill and intangible assets (2,660 ) (2,708 ) Prepaid insurance (102 ) (175 ) Total liabilities (5,841 ) (6,040 ) Valuation Allowance Beginning balance (8,949 ) (7,264 ) Decrease (increase) during period 8,514 (1,685 ) Ending balance (435 ) (8,949 ) $ (2,071 ) $ (3,205 ) In Thousands 2011 2010 2014 2013 Deferred income tax asset - current $ 1,478 $ 1,502 $ 925 $ 2,283 Deferred income tax asset (liability) – long-term (2,900 ) (2,145 ) (2,996 ) (5,488 ) $ (1,422 ) $ (643 ) $ (2,071 ) $ (3,205 ) $5.1 million.$2.4 million and $3.7 million, respectively. All operating loss carry-forwards expire in various amounts through 2029. In addition, the Company has foreign unused net operating loss carry-forwards of approximately $20.6 million of which an estimated $19.7 million has been reserved as the Company does not expect to be able to utilize these carryforwards.In Thousands 2011 2010 2009 Sporting Goods Net revenue $ 96,971 $ 85,815 $ 76,807 Operating income 10,802 9,171 4,610 Interest expense 686 1,655 2,673 Provision for taxes 4,365 2,993 715 Net income 5,817 4,601 1,273 Identifiable assets 69,324 68,047 67,528 Non-marketable equity investments (equity method) — — — Depreciation & amortization 2,623 2,461 3,217 Capital expenditures 1,595 517 792 Information Security and Print Finishing Net revenue 37,279 34,841 39,192 Operating income 71 926 1,780 Interest expense 445 203 (208 ) Provision for taxes 551 913 988 Net income (loss) (921 ) (187 ) 1,077 Identifiable assets 40,396 37,713 40,105 Non-marketable equity investments (equity method) 318 321 341 Depreciation & amortization 974 1,114 1,576 Capital expenditures 780 1,261 640 All Other Net revenue — — — Operating loss (6,702 ) (1,908 ) (4,390 ) Interest expense (438 ) (695 ) (800 ) Benefit for taxes (2,482 ) (889 ) (755 ) Net income (loss) (455 ) 1,645 (693 ) Identifiable assets 20,395 21,793 19,605 Non-marketable equity investments (equity method) 14,079 11,303 8,815 Depreciation & amortization 5,175 755 1,172 Capital expenditures — — 462 Total Net revenue 134,250 120,656 115,999 Operating income 4,171 8,189 2,000 Interest expense 693 1,163 1,665 Provision for taxes 2,434 3,017 948 Net income 4,441 6,059 1,657 Identifiable assets 130,115 127,553 127,238 Non-marketable equity investments (equity method) 14,397 11,624 9,156 Depreciation & amortization 8,772 4,330 5,965 Capital expenditures 2,375 1,778 1,894 51In Thousands 2014 2013 2012 Sporting Goods Net revenue $ 137,975 $ 132,991 $ 112,600 Operating income 18,194 18,469 14,160 Interest expense (income) (17 ) 170 273 Provision for taxes 7,420 7,212 5,482 Net income 11,394 11,087 8,433 Identifiable assets 95,506 91,137 77,902 Non-marketable equity investments (equity method) — — — Depreciation & amortization 4,380 3,844 3,398 Capital expenditures 2,739 2,170 2,065 Discontinued Operations Net revenue 20,865 30,686 34,990 Operating loss (483 ) (1,687 ) (14,628 ) Interest expense 98 335 515 Provision (benefit) for taxes (6,099 ) 764 543 Net loss (1,528 ) (2,790 ) (15,683 ) Identifiable assets — 23,203 25,578 Non-marketable equity investments (equity method) — 331 323 Depreciation & amortization 373 774 924 Capital expenditures 246 185 358 All Other Net revenue — — — Operating loss (2,689 ) (2,285 ) (2,117 ) Interest expense 465 233 (186 ) Benefit for taxes (982 ) (1,093 ) (1,633 ) Net income 1,951 1,508 2,320 Identifiable assets 32,375 27,634 22,260 Non-marketable equity investments (equity method) 18,949 19,455 17,164 Depreciation & amortization — — — Capital expenditures — — — Total Net revenue 158,840 163,677 147,589 Operating income (loss) 15,022 14,497 (2,585 ) Interest expense 546 738 602 Provision (benefit) for taxes 339 6,883 4,392 Net income (loss) 11,817 9,805 (4,930 ) Identifiable assets 127,881 141,974 125,740 Non-marketable equity investments (equity method) 18,949 19,786 17,487 Depreciation & amortization 4,753 4,618 4,322 Capital expenditures 2,985 2,355 2,423 2011.2014, other than the divestiture of the Information Security and Print Finishing segment as discussed in this Note. The accounting policies of the reportable segments are the same as those described in the summary of significant accounting policies.United States and Europe.rest of the world.TheDiscontinued Operations contains the divested operations of the Information Security and Print Finishing segment. This segment consistsconsisted of products such as high-security data shredders, disintegrators and deguassers, and office machinery used in the office and graphic arts environment. Office environment products include folding machines; and paper trimmers and cutters. Customers include end-users, as well as, retailers, wholesalers, catalogs, specialty dealers and business partners.other segmentsOther consist of general and administrative expenses not specifically related to the operating business segments and includes investment income from equity investments.TheDuring 2014, 2013 and 2012 the Company hashad one customer in 2011 in the Sporting Goods segment whowhich accounted for approximately 16%, 16% and 18%, respectively, of the Company’s total consolidated total revenues and one customer in 2010 and 2009 who accounted for 15% and 15% of consolidated total revenues, respectively.revenues. No other customerscustomer accounted for 10% or more of consolidated total revenues. Within the Sporting Goods segment, this customer accounted for 22%approximately 19%, 21%20% and 22%23% of total revenues in 2011, 20102014, 2013 and 2009,2012, respectively.31, 2011,27, 2014, approximately 1318 employees of the Company’sCompany's labor force were covered by a collective bargaining agreement that expires April 30, 2012.2016.particleboard, slate,tempered glass, particle board, standard grades of steel and steel tubing, plastic, vinyl, steel cables,aluminum, engineering plastics, fiberglass and packaging.packaging materials. Escalade relies upon domestic, Mexico, and Asian suppliers in China for its requirement of billiard balls and slate utilized in the production of home pool tablesthese materials and upon various AsiaAsian manufacturers for certainmany of its table tennis needs and other items. Escalade sources its game table and billiard product lines in China.products.Revenues by geographic region/country were as follows:In Thousands 2011 2010 2009 North America $ 112,907 $ 100,921 $ 95,723 Europe 12,240 11,486 13,033 Other 9,103 8,249 7,243 $ 134,250 $ 120,656 $ 115,999 RevenuesNet sales are attributed to country based on location of customer and are for continuing operations. Net sales by geographic region/country were as follows:52In Thousands 2014 2013 2012 North America $ 135,585 $ 129,435 $ 109,043 Europe 1,408 1,946 1,940 Other 982 1,610 1,617 $ 137,975 $ 132,991 $ 112,600 In Thousands 2011 2010 2009 2014 2013 2012 North America $ 105,717 $ 103,277 $ 100,643 $ 127,881 $ 127,393 $ 110,977 Europe 24,398 24,276 26,595 — 14,581 14,763 $ 130,115 $ 127,553 $ 127,238 $ 127,881 $ 141,974 $ 125,740 In thousands, except per share data (unaudited) March 19 July 9 October 1 December 31 2011 Net sales $ 27,998 $ 40,850 $ 28,734 $ 36,668 Operating income (loss) 2,067 2,717 (855 ) 242 Net income (loss) 1,203 1,485 (380 ) 2,133 Basic earnings (loss) per share $ 0.09 $ 0.12 $ (0.03 ) $ 0.17 In thousands, except per share data (unaudited) March 20 July 10 October 2 December 25 2010 Net sales $ 25,169 $ 35,737 $ 28,565 $ 31,185 Operating income 1,409 3,450 2,359 971 Net income 802 1,862 1,172 2,223 Basic earnings per share $ 0.06 $ 0.15 $ 0.09 $ 0.18 In thousands, except per share data (unaudited) March 22 July 12 October 4 December 27 2014 Net Sales $ 27,721 $ 38,012 $ 31,599 $ 40,643 Operating Income 3,323 3,932 4,216 4,033 Net Income from continuing operations 2,264 2,767 3,837 4,477 Net income (loss) from discontinued operations (14 ) (10,851 ) 9,784 (447 ) Net income (loss) 2,250 (8,084 ) 13,621 4,030 Basic Earnings Per Share Data: Income from continuing operations $ 0.16 $ 0.20 $ 0.28 $ 0.32 Income (loss) from discontinued operations 0.00 (0.78 ) 0.70 (0.03 ) Net Income (loss) $ 0.16 $ (0.58 ) $ 0.98 $ 0.29 Diluted Earnings Per Share Data: Income from continuing operations $ 0.16 $ 0.20 $ 0.27 $ 0.32 Income (loss) from discontinued operations 0.00 (0.77 ) 0.69 (0.03 ) Net Income (loss) $ 0.16 $ (0.57 ) $ 0.96 $ 0.29 In thousands, except per share data (unaudited) March 23 July 13 October 5 December 28 2013 Net sales $ 25,265 $ 38,003 $ 31,559 $ 38,164 Operating income 3,499 6,007 3,987 2,691 Net income from continuing operations 2,241 3,851 3,375 3,128 Net loss from discontinued operations (617 ) (1,233 ) (862 ) (78 ) Net income 1,624 2,618 2,513 3,050 Basic Earnings Per Share Data: Income from continuing operations $ 0.16 $ 0.29 $ 0.25 $ 0.23 Loss from discontinued operations (0.04 ) (0.10 ) (0.06 ) 0.00 Net Income $ 0.12 $ 0.19 $ 0.19 $ 0.23 Diluted Earnings Per Share Data: Income from continuing operations $ 0.17 $ 0.28 $ 0.24 $ 0.23 Loss from discontinued operations (0.04 ) (0.09 ) (0.06 ) (0.01 ) Net Income $ 0.13 $ 0.19 $ 0.18 $ 0.22 31, 2011,27, 2014, the balance of the letter of credit was $2.7 million. It is to be used in the event of a default in either interest or principal payments.31, 2011,27, 2014, the Company had future estimated minimum non-cancelable royalty and license payments as follows:In Thousands Amount 2012 $ 530 2013 350 2014 375 2015 375 2016 375 Thereafter 750 $ 2,755 53In Thousands Amount 2015 $ 475 2016 460 2017 460 2018 375 2019 — Thereafter — $ 1,770 31, 201127, 2014 and December 25, 2010.28, 2013.In Thousands 2011 2010 Carrying Amount Fair Value Carrying Amount Fair Value Fair Value Measurements Using 2014
In Thousands Fair Value Quoted Prices in
Active Markets
for Identical
Assets (Level 1) Significant Other
Observable
Inputs (Level 2) Significant
Unobservable
Inputs (Level 3) Financial assets Cash and cash equivalents $ 3,821 $ 3,821 $ 1,536 $ 1,536 $ 3,232 $ 3,232 $ — $ — Time deposits $ 950 $ 950 $ 1,250 $ 1,250 $ 1,450 $ 1,450 $ — $ — Financial liabilities Note payable and Short-term debt $ 14,947 $ 14,947 $ 10,992 $ 10,992 $ 16,200 $ — $ 16,200 $ — Current portion of Long-term debt $ 2,000 $ 2,000 $ 2,000 $ 2,000 $ 1,586 $ — $ 1,586 $ — Long-term debt $ 5,000 $ 5,000 $ 7,500 $ 7,500 $ 3,360 $ — $ 3,360 $ — Note 19 — Subsequent Event Fair Value Measurements Using 2013
In Thousands Fair Value Quoted Prices in
Active Markets
for Identical
Assets (Level 1) Significant Other
Observable
Inputs (Level 2) Significant
Unobservable
Inputs (Level 3) Financial assets Cash and cash equivalents $ 2,346 $ 2,346 $ — $ — Time deposits $ 1,700 $ 1,700 $ — $ — Financial liabilities Note payable and Short-term debt $ 21,700 $ — $ 21,700 $ — Current portion of Long-term debt $ 1,563 $ — $ 1,563 $ — Long-term debt $ 4,946 $ — $ 4,946 $ — On March 1, 2012, the Board of Directors declared a dividend of $0.07 per share to shareholders of record on April 6, 2012, payable on April 16, 2012.54
60 ESCALADE, INCORPORATED By: /s/ Robert J. Keller March 5, 2012February 25, 2015Robert J. Keller President and Chief Executive Officer /s/ Robert E. Griffin Chairman and Director March 5, 2012February 25, 2015Robert E. Griffin /s/ Edward E. Williams Director March 5, 2012February 25, 2015Edward E. Williams /s/ Richard D. White Director March 5, 2012February 25, 2015Richard D. White /s/ George Savitsky Director March 5, 2012February 25, 2015George Savitsky /s/ Richard Baalmann, Jr. Director March 5, 2012February 25, 2015Richard Baalmann, Jr. /s/ Patrick Griffin Director and President Martin Yale Group March 5, 2012February 25, 2015Patrick Griffin /s/ Robert J. Keller Director and President and Chief Executive March 5, 2012February 25, 2015Robert J. Keller Executive Officer (Principal Executive Officer) /s/ Deborah J. MeinertStephen R. Wawrin Vice President and Chief Financial Officer March 5, 2012February 25, 2015Deborah J. MeinertStephen R. Wawrin (PrincipalOfficer (Principal Financial and Accounting Officer) 61