

UNITED STATES
SECURITIES AND EXCHANGE COMMISSION
WASHINGTON, DC 20549
FORM 10-K
ANNUAL REPORT UNDER SECTION 13 OR 15(d) OF THE
SECURITIES EXCHANGE ACT OF 1934
FOR THE YEAR ENDED DECEMBER 31, 20122013
COMMISSION FILE NUMBER 000-27467
ERF WIRELESS, INC.
(Exact name of registrant as specified in its charter)
| Nevada | 000-27467 | 76-0196431 | ||
| (State or other jurisdiction of incorporation) | (Commission File Number) | (IRS Employer Identification No.) |
2911 SOUTH SHORE BOULEVARD, SUITE 100, LEAGUE CITY, TEXAS 77573
(Address of principal executive offices) (Zip Code)
Registrant's telephone number, including area code:(281) 538-2101
Securities registered under Section 12(b) of the Exchange Act:
None.
Securities registered under Section 12(g) of the Exchange Act:
$.001 PAR VALUE COMMON STOCK
Check whether the issuer is not required to file report pursuant to Section 13
or 15(d) of the Exchange Acto
Indicate by check mark if the registrant is a well-known seasoned issuer, as defined in Rule 405 of the Securities Act. Yes¨ Nox
Indicate by check mark if the registrant is not required to file reports pursuant to Section 13 or Section 15(d) of the Act. Yes¨ Nox
Indicate by check mark whether the registrant (1) has filed all reports required to be filed by Section 13 or 15(d) of the Securities Exchange Act of 1934 during the preceding 12 months (or for such shorter period that the registrant was required to file such reports), and (2) has been subject to filing requirements for the past 90 days. Yesx No¨
Indicate by check mark whether the registrant has submitted electronically and posted on its corporate Web site, if any, every Interactive Data File required to be submitted and posted pursuant to Rule 405 of Regulation S-T (§ 232.405 of this chapter) during the preceding twelve months (or for such shorter period that the registrant was required to submit and post such files). Yesx No¨
Indicate by check mark that disclosure of delinquent filers pursuant to Item 405 of Regulation S-K is not contained herein, and will not be contained, to the best of registrant’s knowledge, in definitive proxy or information statements incorporated by reference in Part III of this Form 10-K or any amendment to this Form 10-K.x
Indicate by check mark whether the registrant is a large accelerated filer, an accelerated filer, a non-accelerated filer, or a smaller reporting company. See the definitions of “large accelerated filer,” “accelerated filer” and “smaller reporting company” in Rule 12b-2 of the Exchange Act.
| Large accelerated filer¨ | Accelerated filero | |
| Non-accelerated filer¨ (Do not check if a smaller reporting company) | Smaller reporting companyx |
Indicate by check mark whether the registrant is a shell company (as defined in Rule 12b-2 of the Act).Yes. Yes¨ Nox
As of June 30, 20122013 the aggregate market value of the shares of common stock held by non-affiliates (based on the closing price of $1.28$200.00 per share for the common stock as quoted on that date) was approximately $3,758,852.$5,122,852.
As of MarchApril 15, 2013,2014, the Company had outstanding 7,688,2621,001,743 shares of its $.001 par value common stock.
DOCUMENTS INCORPORATED BY REFERENCE
None.
TABLE OF CONTENTS
| ITEM | ||||
| NUMBER | CAPTION | PAGE | ||
| PART I | ||||
| ITEM 1. | Business | |||
| ITEM 1A. | Risk Factors | |||
| ITEM 1B. | Unresolved Staff Comments | |||
| ITEM 2. | Properties | |||
| ITEM 3. | Legal Proceedings | |||
| ITEM 4. | ||||
| PART II | ||||
| ITEM 5. | Market for Common Equity, Related Stockholder Matters and Issuer Purchases of Equity Securities | |||
| ITEM 6. | Selected Financial Data | |||
| ITEM 7. | Management's Discussion and Analysis of Financial Condition and Results of Operations | |||
| ITEM 7A. | Quantitative and Qualitative Disclosures About Market Risk | |||
| ITEM 8. | Financial Statements and Supplementary Data | |||
| ITEM 9. | Changes in and Disagreements with Accountants on Accounting and Financial Disclosure | 63 | ||
| ITEM 9A. | Controls and Procedures | 63 | ||
| ITEM 9B. | Other Information | |||
| PART III | ||||
| ITEM 10. | Directors, Executive Officers and Corporate Governance | 64 | ||
| ITEM 11. | Executive Compensation | |||
| ITEM 12. | Security Ownership of Certain Beneficial Owners and Management and Related Stockholder Matters | |||
| ITEM 13. | Certain Relationships and Related Transactions, and Director Independence | |||
| ITEM 14. | Principal Accountant Fees and Services | |||
| PART IV | ||||
| ITEM 15. | Exhibits and Financial Statement Schedules | |||
| i |
FORWARD LOOKING STATEMENTS
Except for the historical information and discussions contained herein, statements contained in this Annual Report on Form 10-K, may constitute forward-looking statements. These statements involve a number of risks, uncertainties and other factors that could cause actual results to differ materially, as discussed elsewhere in the ERF Wireless, Inc. ("Company" or "ERF"), filings with the U.S. Securities and Exchange Commission ("SEC"). The statements contained in this document that are not purely historical are forward-looking statements including without limitation statements regarding our expectations, beliefs, intentions or strategies regarding our business. This Annual Report on Form 10-K includes forward-looking statements about our business including, but not limited to, the level of our expenditures and savings for various expense items and our liquidity in future periods. We may identify these statements by the use of words such as "anticipate," "believe," "continue," "could," "estimate," "expect," "intend," "may," "might," "plan," "potential," "predict," "project," "should," "will," "would" and other similar expressions. All forward-looking statements included in this document are based on information available to us on the date hereof, and we assume no obligation to update any such forward-looking statements, except as may otherwise be required by law. Our actual results could differ materially from those anticipated in these forward-looking statements.
ITEM 1. BUSINESS
The Company
We are a leading provider of wireless broadband access solutions for the energy industry. Our primary business strategy is to develop and provide a long-term terrestrial wireless broadband solution for the exploration, drilling, and production sectors of the energy industry in rural and remote locations in North America that lack existing communications infrastructure. We offer our oil and gas customers a comprehensive and integrated package of wellsite information technology (“IT”) communications services, including high-speed low-latency terrestrial broadband connectivity utilizing both licensed and unlicensed spectrum, VOIPvoice over Internet Protocol (VOIP) telephone, facsimile service, wireless intercom systems, computer and other IT equipment rental, IT support services, and video security solutions.
Wireless broadband Internet systems consist of a radio transceiver that sends a signal on a combination of radio channels to other transceivers, categorized based upon the wireless technology utilized, and transmitted through licensed or unlicensed spectrum. We use a combination of WiMAX (“Worldwide interoperability for Microwave Access”) wireless broadband as well as other relevant wireless technology solutions to service our customers.
Our current focus is to expand our network in the middle-United States region, including Texas, Oklahoma, Arkansas, New Mexico, Louisiana, Colorado, Kansas, North Dakota, and Montana.Louisiana. The delivery of terrestrial broadband wireless directly to the wellsite is the primary benefit of our service - we believe the primary reason why our services are currently in demand throughout the remote oil and gas regions of North America. We have acquired 15 wireless broadband networks over eight years, built seven additional wireless networks, and contracted with 11 other wireless networks to create, what we believe to be, the largest North American terrestrial wireless network coverage- in excess of 450,000 square miles- in important oil and gas regions. We have combined our terrestrial wireless coverage with a fleet of more than 130 MBT’smobile broadband trailers being referred to as “MBT’s”, that are deployed by our field technicians to a drilling pad that provides a symmetrical 1.5Mb/s wireless circuit back to one of our fixed towers up to twenty five miles away, depending on the local terrain -providing wireless access anywhere within our coverage area. We are paid a daily rate for delivering this circuit to the wellsite while the well is being drilled. The terrestrial wireless solution offers a distinct advantage, in addition to the increased bandwidth, over the traditional very small aperture terminal, or VSAT, communications solution in that a VSAT adds almost one second of delay to the communications path (“latency”) while terrestrial broadband has no more than sixty thousands of a second of latency. Many of the current remote software programs utilized by oil and gas companies require less than one tenth of a second of latency to function properly. Once the drilling process has been completed our technicians reverse the deployment process and move our MBT’s along with the drilling rig to our customer’s next drilling site. We are paid on an hourly rate for the move, since distances can vary from only a few miles to hundreds of miles. Once our technician arrives at the new wellsite, the process is repeated. Some of our MBT’s have been following the same drilling rig for years. We believe that this low latency “nomadic” delivery solution, when combined with our provision of a technician at the wellsite within four hours of being notified of any issues anywhere in our North American service territory, affords us a competitive advantage and should allow us to expand our market share going forward.
While our focus is on providing broadband connectivity to the drilling sector of the oil and gas industry, we also provide wireless broadband services to a broad range of other residential and enterprise customers including banking, healthcare, and educational customers utilizing the same wireless network assets and personnel used in our oil and gas services business.
Corporate Information
We were incorporated in the State of Nevada in June 2004. Our principal executive offices are located at 2911 South Shore Blvd., Suite 100, League City, Texas 77573, and our telephone number is (281) 538-2101.We maintain web sites at www.erfwireless.com, www.energybroadband.com and www.erfwireless.net. The information on, or that may be accessed through, our websites are not incorporated by reference into this filing and should not be considered a part of this filing.
On October 1, 2013, shareholders of the Company holding approximately 98.5% of the Company’s voting stock (the “Majority Shareholders”), as of September 24, 2013 (the “Record Date”), consented in writing to, among other things, an amendment to the Company’s Articles of Incorporation to effect one or a series of forward or reverse splits (the “Stock Splits”) of the Company’s common stock only for the express purpose, if required, in connection with obtaining a listing on a national securities exchange. The Stock Splits were required to be at a ratio of not less than 2 and not greater than 400 with the exact ratio to be set within such range at the discretion of the Board of Directors, without further approval or authorization of the Company’s shareholders, provided that such Stock Splits were required to be effected no later than October 1, 2014 (the “Shareholder Approval”). Neither the (i) number of authorized shares or the par value of the shares of the Company’s common stock nor (ii) number of authorized, issued and outstanding, or any associated conversion ratio of the shares of Series A Preferred Stock were to be changed in connection with any such Stock Split.
| 1 |
Effective December 2, 2013, the Board of Directors of the Company, consistent with the Shareholder Approval for the Stock Splits, approved a reverse stock split in a ratio of 1:400 (the “Reverse Stock Split”) and the filing of a Certificate of Amendment (the “Amendment”) to effect such Reverse Stock Split with the secretary of state of Nevada, which amendment was filed on December 12, 2013, provided that such Amendment, pursuant to its terms, did not go effective with the State of Nevada until December 17, 2013. The Board of Directors also approved the rounding of fractional shares remaining after the Reverse Stock Split to the nearest whole share on a per shareholder basis, provided that any shareholders holding over ten (10) shares, but less than ninety-nine (99) shares after the Reverse Stock Split would have their shares automatically rounded up to 100 shares (the “Rounding”). The Reverse Stock Split became effective with FINRA and in the marketplace on December 18, 2013 (the “Effective Date”).
As a result of the Reverse Stock Split, the Company’s issued and outstanding shares of common stock decreased from approximately 34.2 million pre-Reverse Stock Split shares to approximately 85,452 post-Reverse Stock Split shares prior to effecting the Rounding described above.
Unless otherwise stated or the context would require otherwise, the effects of the Reverse Stock Split have been retroactively reflected throughout this report.
The Company owns 100% of the common stock of the following subsidiaries: (i) Wireless Bundled Services, Inc., a Texas corporation (“WBS”); (ii) Enterprise Network Services, Inc., a Texas corporation (“ENS”); and (iii) Wireless Messaging Services, Inc., a Texas corporation (“WMS”). In September 2011, we declared a stock dividend to our shareholders consisting of 5% of the existing common stock in Energy Broadband, Inc. (“EBI”) our then wholly owned subsidiary. The dividend resulted in the issuance to each common and preferred shareholder of record as of September 30, 2011, for each 200 shares of our common stock, including Series A Preferred Stock convertible into 200 common shares, (i) 100 shares of EBI common stock, (ii) one three-year warrant to purchase 100 shares of EBI common stock at a price of $4.00 per share, and (iii) a second three-year warrant to purchase 100 shares of EBI at a price of $6.00 per share. During the year ended 2012, we distributed 725,611 shares of EBI common stock to our shareholders (the “EBI Dividend”). As a result, as of December 31, 2012,2013, we owned 96.37% of EBI common stock and our shareholders owned an aggregate of 3.63% of EBI common stock. The Company intendsexpects to issue the remaining portion ofstock dividends in 2014. No stock dividends were issued during the dividend to its shareholders as soon as practicable.year ended December 31, 2013.
Our Industries
Oil and Gas Industry
As demand for energy produced in North America continues to grow, we believe that exploration and production will continue to move further away from civilization and into more remote environments. In particular, the recent discovery of certain new extraction techniques such as “fracking” has opened up multiple oil and gas shale regions in extremely remote areas of North America. As a result, oil and gas companies have been forced to change the way they communicate. One such approach is to achieve a “digital oilfield.” In a digital oilfield, new technologies such as process digitization, real time data collection, and intelligent controls are combined to improve recovery, accelerate production, reduce downtime, and reduce the number of on-site engineers and geologists required to oversee the operation. At the heart of a digital oilfield is a reliable, low latency, cost-effective means of communication. Oil and gas companies have historically relied on cellular and satellite communication to transmit data from the well site to the home office but these very remote locations are typically not within range of cellular communication and satellite communication suffers from extremely high latency - a delay of almost one second in data transmission. High latency can interrupt the fluency of voice communications and make machine to machine communications complex, ineffective and unreliable. Currently, we believe that the terrestrial wireless broadband network we offer in these remote areas is the only fully viable solution.
In addition to the increased rate of utilization by oil and gas companies of our low latency, terrestrial wireless broadband communications service, our business growth is also driven by the increased level of oil and gas drilling activities in North America, particularly in shale plays in Eagle Ford and Bakken.Cline Shale formations. We believe the following economic factors will positively impact our business strategy in the near future:
| · | The continued need for higher bandwidth, low latency communications to support the digital oilfield. This need is continually driven by the more bandwidth intensive software being developed by the major oil and gas service providers. We believe that the traditional satellite communications |
| · | Increased oil drilling activity and sustained higher oil prices. The average West Texas Intermediate oil price has increased |
| · | Favorable domestic natural gas drilling outlook. Domestic natural gas exploration and production companies are trending toward development of unconventional natural gas basins such as shale. These basins are known for large inventories of drilling locations and wells with high initial decline rates. These high initial decline rates typically result in more wells drilled over time in order to maintain production and lease positions. As producers gain experience in the nation’s shale gas plays, the efficiency of their drilling operations has improved immensely. Today, operators sink wells at a much quicker pace and have optimized their drilling and hydraulic fracturing techniques to maximize output.We believe these factors should result in high levels of domestic natural gas drilling activity, in particular in the Eagle Ford Shale and |
As a result of the above factors, we expect that there will continue to be a tight supply of, and high demand for, natural gas and oil in North America in the near future. We believe these trends will continue to support high levels of drilling activity which should equate to increased demand for our services.
Banking/Healthcare/Education
Many rural areas of the United States that need point-to-point broadband communications do not have any alternative other than to lease these services from the local telephone company. Because of the rural nature of these leased services, there is very little competition and thus higher than average pricing in many locations. We have developed a wireless model for replacing these leased wireline circuits with terrestrial wireless circuits that are typically owned by the customer and monitored and maintained by us. In particular, for the regional banking industry, we utilize our already owned terrestrial wireless networks to build fixed point-to-point spur networks from our towers to the individual bank branch locations up to twenty-five miles away. The banks typically purchase these spur networks and pay us to build the networks. In addition, we provide our patented security device CryptoVueTMCryptoVue™ to satisfy the regulatory requirements of a bank using a wireless network outside of the bank’s physical location. These new bank networks allow a bank to communicate voice and data among their various branches as well as the parent bank. Following the construction and commissioning of a bank network, we typically enter into a long term monitoring and maintenance contract with the bank. The advantage that the bank receives, in addition to higher transmission speeds, is a reduction of their communication costs as compared to leasing such services from the telephone company. To date we have constructed four such banking networks that serve almost one hundred branch locations across Texas and Louisiana.
The healthcare and educational application of our wireless technology is very similar to the banking model, except that we typically own the spur networks and the security requirements are not as stringent as compared to banks. Over the past five years we have completed such networks for four large school districts in Texas and are serving threefive healthcare facilities, most located in the State of Texas.
Commercial and Residential Wireless Broadband
The rural areas of the United States have not historically enjoyed the advantages of broadband that is now available in most urban areas. Currently many rural areas still receive their Internet service by way of a dial up telephone connection, a local cable company, or if they live near a more urban region, by DSL. Even though they are connected to the Internet they cannot enjoy its advantages because their connection speed is limited in bandwidth. For those who want or need an increased bandwidth offered by broadband, the only viable and economic solution is to purchase wireless broadband. The costs associated with providing connectivity these customers are directly related to the number of customers per square mile, and as a result, the margins for rural commercial and residential broadband can be quite small even when delivered in a wireless fashion. We have, however, been able to utilize our existing networks shared with oil and gas customers, banks, healthcare, and educational entities to also deliver wireless broadband to customers in these rural areas. We currently have approximately 3,2523,000 residential and commercial customers producing approximately $200,000 per month of recurring revenue while sharing our rural networks with our banking/healthcare/educational/ and oil and gas customers.
| 3 |
Our Services
Oil & Gas Industry Wireless Bandwidth and Related Support Services.Through our oil and gas industry division, we provide a wide range of wireless Internet bandwidth connectivity service solutions as well as a number of related products and services, which include the following:
| · | Nomadic terrestrial wireless broadband circuit connectivity to the wellsite:the term “nomadic” refers to our ability to provide portable trailer mounted fifty foot erectable communication |
| · | Wellsite communications equipment rental: rental of computers, printers, fax machines, monitors, and similar communications equipment directly to the wellsite customers. |
| · | Wellsite IT supportservices: software and driver loading, computer problem resolution, and IT troubleshooting. |
| · | Wellsite IT services over broadband: IT support services to allow wellsite customers to operate remote software and data solutions over the broadband connection. |
| · | Network monitoring and maintenance: monitoring of various customer devices over the broadband network and troubleshooting either remotely or in person at the wellsite. |
| · | Layer 2 secure communications connectivity products rental and services: secure Internet protocol layer 2 routing of customer circuits to improve security and reliability of broadband connection. |
| · | Fixed site terrestrial wireless broadband connectivity: wireless broadband circuit connectivity directly from our fixed network towers to customer fixed sites such as remote field offices. |
| · | Network design and construction: design of wireless networks for customers for implementation anywhere in the world. Implementation of our network designs for customers anywhere in North America. |
| · | Production field SCADA (supervisory control and data acquisition): connection of our fixed tower wireless networks via wireless circuits directly to oil and gas customer production fields to monitor and control the production process. |
| · | Midstream communications, monitoring, and security: connection of our fixed tower wireless networks via wireless circuits directly to gathering and transport pipeline facilities for monitoring and security purposes. |
In fiscal 20122013 and 2011,2012, these products and services resulted in revenues of $4,642,000$4,311,000 and $2,713,000$4,642,000 respectively, comprising 64%60% of our revenues in 20122013 and 51%63% of our revenues in 2011.2012.
Enterprise-Level Wireless Bandwidth Product and Services Through our enterprise network services division we provide a wide range of terrestrial wireless Internet bandwidth service solutions and related products to the regional banking, healthcare, and educational sectors primarily in the rural areas of North America within our existing coverage areas, including:
| · | Turnkey design and implementation of custom Internet wireless bandwidth solutions, including long-term maintenance and network monitoring; |
| · | Reselling arrangements, under which banks may sell wireless broadband services to private entities, cities, municipalities, and private citizens in specific coverage areas; and |
| · | Secure connectivity using our patented |
In fiscal 20122013 and 2011,2012, these products and services resulted in revenues of $380,000$404,000 and $407,000$380,000 respectively, comprising 6% of our revenues in 2013 and 5% of our revenues in 2012 and 8% of our revenues in 2011.2012.
Commercial and Residential Wireless Bandwidth, Products and Services Through our commercial and residential wireless bundled services division we provide a full range of terrestrial wireless Internet connectivity service solutions and products to commercial businesses and residential customers using our existing wireless networks. These services include high-speed Internet, VOIP service, network monitoring and maintenance, and video service. The bulk of our current commercial and residential customer base reside in Texas and Louisiana.
In fiscal 20122013 and 2011,2012, these products and services resulted in revenues of $2,283,000$2,441,000 and $2,178,000$2,306,000 respectively, comprising 34% of our revenues in 2013 and 31% of our revenues in 2012 and 41% of our revenues in 2011.2012.
| 4 |
Our Business Strategy
We intend to continue to build upon our market position in the areas in which we operate by offering an integrated and comprehensive package of services that will allow us to provide our oil and gas customers with wellsite IT communications services required throughout their drilling locations. We intend to continue to supplement our wellsite communications business with our enterprise, commercial and residential bandwidth delivery to maximize the return from our investment in network infrastructure throughout the regions in which we operate. We view the incremental steps in achieving this to include the following:
| · | Deploying our suite of communications services across existing North American land-based oil and gas operating areas. We believe that our existing terrestrial wireless networks combined with our nomadic wellsite bandwidth delivery system using our advanced fleet of 130 MBTs |
| · | Extend our oil and gas operations into new geographic areas.We intend to apply our expertise in wellsite communications services in markets where we currently do not operate and which provide an attractive platform for future growth. We believe our customers will continue to find value in our ability to provide services across multiple operating regions. We intend to continue to improve the ease with which our clients can use our services from one wellsite location to the next by expanding our service teams of field technicians that provide this service. We expect to support our customers’ entry into other new active drilling regions that are currently developing in the major oil shale regions of North America by introducing our service offerings in those regions. In addition, we intend to expand into new geographic areas where market conditions are favorable in order to attract new customers. Our major criteria for choosing new expansion regions are the availability of sufficient drilling rig density to justify the financial cost of building or acquiring the network. |
| · | Broaden the suite of services we provide.We have established what we believe to be solid working relationships with our oil and gas and enterprise customers, which we believe will allow us to work closely with our customers to define newservice offerings such as security, custom circuit configurations, and redundant communication configurations that meet specific customer needs in the areas where we operate. |
| · | Focus on service quality, business performance and safety. Our management team is responsible for assessing our service quality, performance and safety compliance and coordinates with our field offices to help ensure that our quality and performance metrics and safety standards are met at every level of our organization. |
| · | Continue to pursue strategic expansion opportunities to acquire coverage.We believe that the markets in which we operate remain fragmented and that there are consolidation opportunities within these markets. We completed 15 acquisitions between 2006 and 2010 and intend to continue pursuing strategic acquisitions which add to the scope and quality of our service portfolio. While our primary focus is to expand through organic growth, we intend to continue to evaluate the expansion of our coverage area through acquisitions. In evaluating such acquisitions, we consider a number of factors, including enhancing our current service offerings, geographic diversification, synergies with existing operations, and financial performance and acquisition costs taking into account all of our wireless customer base. As of the date hereof, we have not identified any particular acquisition candidate. |
| · | Capitalize on regional experience. One component of our acquisition and growth strategy is to acquire assets located in strategic operating areas for all of our wireless customers, but especially for our oil and gas customers, that include personnel with strong local leadership and regional experience. We believe that by having the administrative functions previously performed at the regional level centralized in and handled by our corporate office, we believe we have enhanced our controls environment and enabled our local management to focus on our customers, our employees and the effective management and deployment of our assets. |
Our Competitive Strengths
We believe our operations benefit from a number of competitive strengths addressed below:
| · | Extensive breadth of communications services throughout the wellsite life-cycle. We provide a broad array of wellsite broadband communications and IT services throughout each phase of the land-based drilling and production process. We believe this breadth of service strengthens our relationships with our customers and allows us to identify and cross-sell additional services. Our service offering starts with the exploration phase before any drilling when the oil and gas customers are using a variety of data producing devices to determine the best drilling locations. Our service continues with the delivery of our nomadic terrestrial wireless circuit delivery during the drilling process. In addition, during the drilling process we also provide computer, monitor, printer, fax, router, cellular repeater, and wireless intercom equipment rental as well as standard IT consulting services at the wellsite. After the drilling is completed there is another requirement for a nomadic wireless circuit and other services when crews return to the wellsite for the completions phase. Finally, after the well is producing there is a long-term communications need for monitoring and control. |
| 5 |
| · | Extensive geographic footprint in the oil and gas industry with a strong regional and local presence. Our regional operations are located in some of the most active onshore oil and natural gas drilling regions of the United States, including South Texas, the Texas Panhandle, |
| · | Leveraged to drilling activity. We believe that favorable supply and demand fundamentals will maintain the current level of drilling for oil and natural gas for the foreseeable future. Efforts to maintain current levels of production will, in turn, necessitate continued drilling, which should sustain demand for our services. In addition, as wellsite activities become more automated, and thus data intensive, we expect that the data being generated will continue to grow and will require low latency bandwidth to meet a customer’s requirements. Terrestrial based solutions currently address this need, and we believe we have the largest such wireless network in North America covering oil and gas drilling regions. |
| · | Experienced management team with proven track record and control environment. Our senior management team has extensive experience in the wireless communications industry and also has sound oil and natural gas industry experience. We believe that this background provides our management team with an in-depth understanding of our customers’ needs and enhances our ability to deliver customer driven solutions. While our primary emphasis is to focus on organic growth by the deployment of MBTs to provide nomadic coverage, our management also has substantial experience in identifying, completing and integrating acquisitions to acquire wireless coverage and, since our inception, we have acquired 15 businesses. We have also implemented a standardized control environment that includes accounting, safety, environmental and maintenance processes and controls. Our integrated systems allow us to monitor operating performance, maintain financial, accounting and asset management controls, integrate acquisitions, prepare timely financial reports and manage contractual risk. In addition, our control environment provides transparency for our management team to track regional and project level performance and reliability and frees our local personnel to focus on customer service and performance. |
Overview of our Divisions
We operate in the following areas of North America:
| 6 |

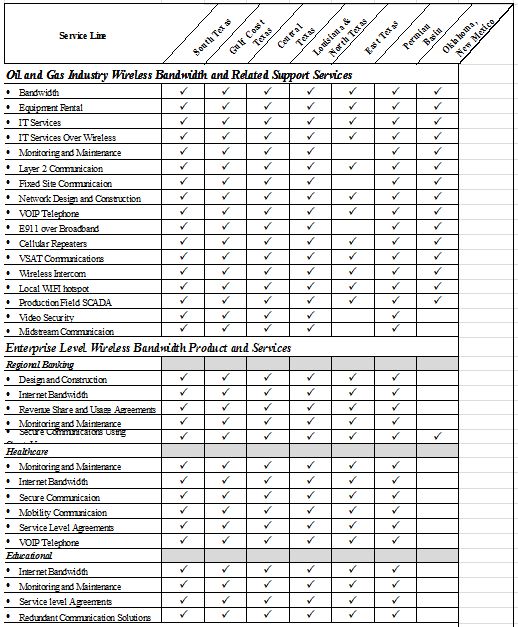
We manage our business through three major divisions: oil and gas services division, enterprise network services division, and wireless bundled services division. The following matrix illustrates the various products and services we provide throughout all of our different service regions from the three major divisions of our company:


| 7 |
Our revenues from our operating segments for the fiscal years ended December 31, 20122013 and 20112012 are set forth below.
| ($ in thousands) | Fiscal Year Ended December 31, | Fiscal Year Ended December 31, | ||||||||||||||||||||||||||||||||||||||||||||||
| Business Segment | 2012 | % of Total | 2011 | % of Total | $ Change | % Change | 2013 | % of Total | 2012 | % of Total | $ Change | % Change | ||||||||||||||||||||||||||||||||||||
| Energy Broadband, Inc. | $ | 4,642 | 64% | $ | 2,713 | 51% | $ | 1,929 | 71% | $ | 4,311 | 60% | $ | 4,642 | 63% | $ | (331 | ) | -7% | |||||||||||||||||||||||||||||
| Wireless Bundled Services | 2,283 | 31% | 2,178 | 41% | 105 | 5% | 2,441 | �� | 34% | 2,306 | 32% | 135 | 6% | |||||||||||||||||||||||||||||||||||
| Enterprise Network Services | 380 | 5% | 407 | 8% | (27 | ) | -7% | 404 | 6% | 380 | 5% | 24 | 6% | |||||||||||||||||||||||||||||||||||
| Wireless Messaging Services | 23 | 0% | 22 | 0% | 1 | 5% | ||||||||||||||||||||||||||||||||||||||||||
| Total Sales | $ | 7,328 | 100% | $ | 5,320 | 100% | $ | 2,008 | 38% | $ | 7,156 | 100% | $ | 7,328 | 100% | $ | (172 | ) | -2% | |||||||||||||||||||||||||||||
Sales and Marketing
Our sales and marketing activities are generally performed through local operations in each geographic region. We believe our local field sales personnel understand basic issues and customer operating procedures and, therefore, can effectively target marketing activities. We also have a corporate sales office located in our League City, Texas headquarters that supplements our field sales efforts and focuses on large accounts and selling our complementary services.
Operating Risks and Insurance
Our operations are subject to a limited number of hazards inherent in the land based oil and natural gas industry. Our enterprise, commercial, and residential customers present operating risks similar to those found in many business environments of the communications industry. We maintain industry standard insurance in amounts that we believe to be adequate.
Third Party Suppliers
We procure substantially all of the equipment we use to provide our terrestrial broadband services from third-party suppliers pursuant to multi-year agreements. The equipment we procure consists of commercial off-the-shelf components, which management believes could be obtained from other third-parties on commercially reasonable terms in the event that supply from our current suppliers is interrupted. Our suppliers generally warrant the products distributed by us and allow returns of defective products, including those that have been returned to us by our customers. We do not independently warrant the products that our suppliers distribute, but we do provide warranty services on behalf of the suppliers if and when required.
Competition
We operate in competitive markets with low barriers to entry. To compete successfully in those markets, a company must provide high-quality, reliable services that meet the specific needs of our customers at competitive prices. In the oil and gas industry division, our terrestrial broadband communications competes primarily with the traditional VSAT communications that are provided by a wide range of other providers. With respect to our enterprise network service division and our commercial and residential bundled service division, we compete mainly with the more established telephone and cable companies.
TheThe oil and gas remote communications services industry is highly competitive. We expect competition in the markets that we serve to continue, increase and change, consistent with recent industry consolidation and introductions of new 4G LTE technologies. We face varying degrees of competition from a wide variety of companies, including new potential entrants from providers to adjacent vertical markets and from forward integration by some of our suppliers deeper in the industry value chain, since successful service and system development is not necessarily dependent upon substantial financial resources.
Our primary North American competitors in upstream oil and gas include Harris CapRock Communiations,Communications, RigNet, Inmarsat plc’s Inmarsat Solutions, Stallion Oilfield Services, Datacom, Digital Networks and Sound & Cellular marketed under the brand Drillcom. The VSAT industry sector has experienced consolidation with Harris Corporation’s acquisitions of CapRock Communications, Inc. and Schlumberger Ltd’s Global Connectivity Services division. More recently, 4G LTE start-up companies including Infrastructure Networks and Texas Energy Networks have acquired spectrum assets and begun constructing 4G LTE networks in certain oil and gas territories. In addition, there are a range of regional providers serving smaller customers. Specifically in North America, we also face competition from drilling instrumentation providers, living-quarters companies, and other pure-play providers that have a similar operating strategy.
Our oil and gas customers generally choose their provider(s) based on the quality and reliability of the service and the ability to restore service quickly when there is an outage. Pricing and breadth of service offerings is also a factor. The oil and gas industry depends on maximum reliability, quality and continuity of products and service. Established relationships with customers and proven performance serve as significant barriers to entry. Our competitive advantage over traditional VSAT providers that have dominated the industry historically results from being able to provide a T-1 equivalent 1.5Mb circuit with a service level agreement of less than 70 milliseconds of latency as compared to 600-700 milliseconds latency for VSAT providers. This increased speed and lower latency allows for better dependability of voice transmissions and quality as well as enabling utilization of the oil and gas operators drilling and measurement applications on a real-time basis.
| 8 |
For our non-oil and gas operations, the Internet services industry is extremely competitive. We compete for revenues with multiple companies providing Internet services on a nationwide basis, discount ISPs (Internet service providers) and smaller regional ISPs. We also compete with companies that provide Internet access via narrowband and broadband technologies, such as Internet access providers, cable companies and telephone companies, most of which offer the same Internet connectivity services. While there is still significant competition, we are utilizing a strategy of focusing on marketing to underserved geographic areas –areas with less competition or technically inferior services available that also contain oil and gas exploration and drilling operations. We believe residential Internet competition in these areas is generally from locally owned wireless broadband operators who lack the operating scale and monitoring systems. These operators often have significantly higher prices or inefficient operations. These local wireless broadband operators offer little competition for our oil and gas customers since they are generally not equipped, financially or otherwise, to offer the required service.
Finally we believe that the principal competitive factors in the market areas that we serve are quality of service, low latency, reputation for safety and technical expertise, availability and price. While we attempt to be price competitive, we believe that many of our customers select our services based primarily on our professional, reliable and comprehensive provision of services in each of our service areas and the experience of our service professionals who deliver those services.
Safety Program
In the wellsite support services industry, an important competitive factor in establishing and maintaining long-term customer relationships is having an experienced and skilled work force. In recent years, many of our larger customers have placed an emphasis not only on pricing, but also on safety records and quality management systems of contractors. We believe that these factors will gain further importance in the future. We plan to apply adequate resources toward employee safety and quality management training programs.
Intellectual Property, Proprietary Rights and Licenses
With respect to our Internet services, we believe that our success is more dependent upon technical, marketing and customer service expertise than upon our proprietary rights. With respect to our enterprise network services division, we have been issued three patents and we have two patent applications pending on our CryptoVueTMCryptoVue™ technology. The abstract of the patent application filing included the secure, triple-controlled system for data over a network, which protects against data theft or alteration by one or more ("e.g., two") corrupt insiders working together with outsiders. A combination of dual-control tamper-resistant routers, physical hardware keys and encryption keys enforces what we believe to be best practice security protocols with thorough auditing. A remote monitoring center provides a third level of control along with remote auditing and detailed change-control alerts. We can provide no assurance that the remaining two patents will be issued.
All spectrum in the US and generally internationally is controlled by each country's equivalent of the Federal Communications Commission (“FCC”). In some cases and some countries portions of the spectrum are set aside for general use such as license-free networks. Part of the spectrum in most countries is controlled for military use, public safety and commercial services. Only the entities so entitled may use the frequency bands they have rights to. We currently operate in all bands of the unlicensed spectrum, and have licensed spectrum in the 3.65 gigahertz, 6.6 gigahertz, and 11 gigahertz bands.
Although we believe our products and services are unique and do not infringe upon the proprietary rights of others, there is no assurance that infringement claims will not be brought against us in the future. Any such claim could result in costly litigation or have a material adverse effect on our business, operating results and financial condition.
Governmental Regulation
Our wireless Internet access products currently operate in a combination of licensed and unlicensed spectrums. We provide Internet access, in part, using telecommunications services provided by third-party carriers. Terms, conditions and prices for telecommunications services are subject to economic regulation by state and federal agencies. As an Internet access provider, we are not currently subject to direct economic regulation by the FCC Federal Communications Commission (FCC) or any state regulatory body, other than the type and scope of regulation that is applicable to businesses generally. In April 1998, the FCC reaffirmed that Internet access providers should be classified as unregulated "information service providers" rather than regulated "telecommunications providers" under the terms of the 1996 Telecommunications Act (the "1996 Act"). As a result, we are not subject to federal regulations applicable to telephone companies and similar carriers merely because we provide our services using telecommunications services provided by third-party carriers. To date, no state has attempted to exercise economic regulation over Internet access providers.
| 9 |
Governmental regulatory approaches and policies to Internet access providers and others that use the Internet to facilitate data and communication transmissions are continuing to develop and, in the future, we could be exposed to regulation by the FCC or other federal agencies or by state regulatory agencies or bodies. In this regard, the FCC has expressed an intention to consider whether to regulate providers of voice and fax services that employ the Internet, or IP, switching as "telecommunications providers," even though Internet access itself would not be regulated. The FCC is also considering whether providers of Internet-based telephone services should be required to contribute to the universal service fund, which subsidizes telephone service for rural and low-income consumers, or should pay carrier access charges on the same basis as applicable to regulated telecommunications providers. To the extent that we engage in the provision of Internet or Internet protocol-based telephony or fax services, we may become subject to regulations promulgated by the FCC or states with respect to such activities. We cannot assure you that these regulations, if adopted, would not adversely affect our ability to offer certain enhanced business services in the future. Due to the increasing popularity and use of the Internet by broad segments of the population, it is possible that laws and regulations may be adopted with respect to the Internet pertaining to content of Web sites, privacy, pricing, encryption standards, consumer protection, electronic commerce, taxation, and copyright infringement and other intellectual property issues. No one is able to predict the effect, if any, that any future regulatory changes or developments may have on the demand for our Internet access or other Internet-related services. Changes in the regulatory environment relating to the Internet access industry, including the enactment of laws or promulgation of regulations that directly or indirectly affect the costs of telecommunications access or that increase the likelihood or scope of competition from national or regional telephone companies, could materially and adversely affect our business, operating results and financial condition.
The FCC has granted direct broadcast satellite (“DBS”) and multi-channel, multi-point distribution service (“MMDS”) operator rights on a national basis similar to the mandatory access provided to franchise cable operators in some state and local jurisdictions. The FCC has adopted rules prohibiting homeowners associations, manufactured housing parks and state and local governments from imposing any restriction on a property owner that impairs the owner's installation, maintenance or use of DBS and MMDS antennas one meter or less in diameter or diagonal measurement. We do not believe our business will be significantly impacted by these rights.
Certain wireless broadband services are subject to regulation by the FCC. At the federal level, the FCC has jurisdiction over wireless transmissions over the electromagnetic spectrum, all interstate and foreign telecommunications services, and many aspects of intrastate telecommunications. State and municipalities also may regulate many aspects of intrastate telecommunications. Broadband Internet-related regulatory policies are continuing to develop and it is possible that our services could be subject to additional regulations in the future. The extent of regulations and their impact on its business and its ability to compete are currently unknown.
Due to the increasing popularity and use of the Internet, it is possible that additional laws, regulations or legal precedent may be adopted with respect to the Internet, covering issues such as content, privacy, pricing, unsolicited email, encryption standards, consumer protection, electronic commerce, taxation, copyright infringement and other intellectual property issues. We cannot predict the impact, if any, that any future legal or regulatory changes or developments may have on our business, prospects, financial condition and results of operations. Changes in the legal or regulatory environment relating to the Internet access industry, including changes that directly or indirectly affect telecommunication costs or increase the likelihood or scope of competition from regional telephone companies, cable operators or others, could have a material adverse effect on its business, financial condition and results of operations.
We are also subject to the requirements of the federal Occupational Safety and Health Act (“OSHA”) and comparable state statutes that regulate the protection of the health and safety of workers. In addition, the OSHA hazard communication standard requires that information be maintained about hazardous materials used or produced in operations and that this information be provided to employees, state and local government authorities and citizens. We believe that our operations are in substantial compliance with the OSHA requirements, including general industry standards, record keeping requirements, and monitoring of occupational exposure to regulated substances.
Employees
As of December 31, 2012,2013, we employed 7059 people, 4433 of which were sales, general and administrative employees located in our Houston headquarters, and 26 of which were field workers and others employed in regional operations. Approximately 44%51% of our employees are on salary and 56%49% of our employees are employed on an hourly basis. Our future success will depend in part on our ability to attract, retain and motivate qualified personnel. We are not a party to any collective bargaining agreements, and we consider our relations with our employees to be satisfactory.
Customers
In our oil and gas division, we serve numerous major and independent oil and natural gas companies, operators and drilling contractors that are active in our core areas of operations. None of our oil and gas industry customers have long-term contracts, as all arrangements are terminable upon 30 daysdays’ notice or less. As of December 31, 2012,2013, we have in excess of 2567 customers and during the year ended December 31, 20122013 and 2011,2012, we had two customers that accounted for 10% or more of our revenues, and one customer that accounted for 10% or more of our revenues, respectively.
| 10 |
In our enterprise network services division,we service four major regional banking organizations with banking locations covering much of western and central Louisiana and western Texas. In addition, we service four major school districts in Texas as well as five hospitals and numerous clinics mainly located in Texas. Most of these contracts are one-year or more in duration. For the years ended December 31, 2013 and 2012, and 2011, we had nodid not have any customers in the division that accounted for 10% or more of our revenues.
In our wireless bundles servicesdivision we service approximately 3,2523,000 individual commercial and residential customers with most of these customers currently being located in Texas. None accounted for 10% or more of our revenues during the fiscal years ended December 31, 20122013 and 2011.2012. All of these customers are subject to contractual arrangements terminable upon 30-days30-days’ notice.
Research and Development
During the two previous fiscal years we have not incurred research and development cost and do not anticipate incurring any such costs in the current fiscal year.
Patents, trademarks, licenses
The company has three issued patents on its CryptoVue bank network routing device and operates this product in customer networks both in Texas and Louisiana. The company also maintains a number of registered trademarks and utilizes these trademarks in product literature and markings. The company also utilized numerous FCC licensed frequencies throughout its networks in multiple states.
ITEM 1A. RISK FACTORS
Risks Related to Our Business
We have a history of significant losses, expect future losses and cannot assure you that we will achieve profitability.
We have experienced net losses and negative cash flows from operating activities since inception and we expect such losses and negative cash flows to continue in the foreseeable future. As of December 31, 20122013 and 2011,2012, we had a working capital deficit of $2,460,000,$4,500,000 and working capital of $170,000,$2,460,000, respectively, and stockholders’ deficit of $2,915,000$6,989,000 and $2,091,000,$2,915,000, respectively. For the years ended December 31, 20122013 and 2011,2012, we incurred net losses attributable to ERF Wireless, Inc. of $7,264,000, and $4,814,000, and $3,379,000.respectively. As of December 31, 2012,2013, we had an aggregate accumulated deficit of $56,012,000.$63,276,000. We cannot guarantee that we will achieve sufficient revenues for profitability. Even if we achieve profitability, we cannot guarantee that we can sustain or increase profitability on a quarterly or annual basis in the future.
We have a limited cash and liquidity position and may need to raise additional funds to fund operations.
As of December 31, 2012,2013, we had cash and cash equivalent balances of $118,000,$42,000, a working capital deficit of $2,460,000,$4,500,000, total liabilities of $9,186,000$12,061,000 including notes payable, debt and capital leases in the aggregate amount of $6,328,000,$8,914,000, of which $1,527,000$3,435,000 matures on or prior to December 31, 2013.2014. Revenues generated from our operations are not presently sufficient to sustain our operations. There can be no assurance that additional funds will be available when needed from any source or, if available, will be available on favorable terms, or terms that are acceptable to us. We may be required to pursue sources of additional capital through various means, including debt or equity financings. Future financings through equity investments are likely to be dilutive to existing stockholders. Also, the terms of securities we may issue in future capital transactions may be more favorable for our new investors. Newly issued securities may include preferences, superior voting rights, the issuance of warrants or other derivative securities, and the issuances of incentive awards under equity employee incentive plans, which may have additional dilutive effects. Further, we may incur substantial costs in pursuing future capital and/or financing, including investment banking fees, legal fees, accounting fees, printing and distribution expenses and other costs. We may also be required to recognize non-cash expenses in connection with certain securities we may issue, such as convertible notes and warrants, which will adversely impact our financial condition. Our ability to obtain needed financing may be impaired by such factors as the capital markets and our history of losses, which could impact the availability or cost of future financings. If the amount of capital we are able to raise from financing activities, together with our revenues from operations, is not sufficient to satisfy our capital needs, even to the extent that we reduce our operations accordingly, we may be required to cease operations.
We have incurred significant indebtedness and a default of the terms of our significant debt obligations may subject us to the risk of foreclosure on certain of our assets.
As of December 31, 2012,2013, we had current liabilities of $4,385,000$6,582,000 that included $1,527,000$3,435,000 of notes payable and current portion of long-term debt, $1,226,000$1,299,000 of accounts payable, $1,120,000$1,158,000 of accrued expenses, $20,000$13,000 deferred revenue and $492,000$677,000 of non-cash derivative liabilities. As of December 31, 2012,2013, we had long-term debt outstanding in the amount of $3,168,000$4,281,000 on our unsecured Angus Capital Partners, a related party line of credit, bearing interest at a rate of 12%3% per annum and maturing December 30, 2015, and $1,384,00031, 2017, $1,024,000 owed on our debt agreement with Dakota Capital Fund, LLC, a $2.0 million, with an option for an additional $1,000,000 of funding, secured equipment credit facility, bearing interest at a rate of 18% per annum and maturing March 31, 2016, and long-term capital leases of $174,000 payable to various capital lease agreements, bearing interest rates ranging from 6.75% to 42% per annum and maturing from September 30, 2014 to July 31, 2016.
| 11 |
Subsequent to December 31, 2012,2013, the investor financing agreement was modified in January 2014, extending the maturity date to April 15, 2014. Both parties have renegotiated the subset interest rate from .5% interest per day on a 360 day calendar year to 12% rate per annum retroactive to March 23, 2013. The Company entered intoalso agreed to additional consideration of 5,000 shares of Series A Preferred Stock to be issued as long as the note remains unpaid and a three-month unsecured credit facility with$50,000 penalty to be added to principal in January 2014.
Subsequent to December 31, 2013, TCA Global Credit Master Fund, effective March 25, 2014, has agreed to restructure the loan agreement and extend the maturity date to November 15th, 2014. The Company in consideration has agreed to a financial institution, under which the lender, at its option, may advance up$75,000 restructuring fee to $500,000be added to the Company. The Company borrowed $100,000 undersum of the facility, which was repaid onprincipal balance including a $40,791 interest charge to be paid in March 12, 2013. Additionally, on March 5, 2013, the Company issued a six month convertible secured promissory note in the original principal amount of $650,000 and original issue discount and prepaid interest of $141,500.2014 nd nominal legal fees.
Our level of indebtedness increases the possibility that we may be unable to generate cash sufficient to pay, when due, the principal of, interest on or other amounts due in respect of the indebtedness. Our indebtedness, combined with other financial obligations and contractual commitments, could:
| · | make it more difficult for us to satisfy our obligations with respect to the indebtedness and any failure to comply with the obligations under any of our debt instruments, including restrictive covenants, could result in events of default under the loan agreements and instruments governing the indebtedness; |
| · | require us to dedicate a substantial portion of our cash flow from operations to payments on indebtedness, thereby reducing funds available for working capital, capital expenditures, acquisitions, research and development and other corporate purposes; |
| · | increase our vulnerability to adverse economic and industry conditions, which could place us at a competitive disadvantage compared to competitors that have relatively less indebtedness; |
| · | limit our flexibility in planning for, or reacting to, changes in business and the industry in which we operate; and |
| · | limit our ability to borrow additional funds, or to dispose of assets to raise funds, if needed, for working capital, capital expenditures, acquisitions, research and development and other corporate purposes. |
Some of our existing debt involves variable rate debt, thus exposing us to risk of fluctuations in interest rates. In addition, as of December 31, 2012,2013, certain operating assets, and furniture are pledged as collateral on outstanding notes andcapital leases. The occurrence of an event of default under any of our obligations might subject us to foreclosure by the lenders to the extent necessary to repay any amounts due. If a foreclosure were to occur on our assets, it would likely have a material adverse effect on our business, prospects, financial condition and results of operation.
We may incur significant additional indebtedness in the future. If we incur a substantial amount of additional indebtedness, the related risks that we face could become more significant. Additionally, the terms of any future debt that we may incur may impose requirements or restrictions that further affect our financial and operating flexibility or subject us to other events of default.
During 20122013 and 2011,2012, a majority of our revenue was generated from short-term agreements and we expect that these arrangements will continue for the foreseeable future.
For the year ended December 31, 20122013 and 2011,2012, the majority of our revenues resulted from short-term, terminable-at-will, arrangements. We had two customers that provided revenue in excess of 10% (32% and 12% of the gross sales during 2012the year ended December 31, 2013) and one customertwo customers that accounted for revenues in excess of 10% (42% and 13% of the gross sales during 2011.the year ended December 31, 2012). We expect that for the foreseeable future a majority of our revenue will continue to be earned pursuant to short-term terminable-at-will, arrangements with our customers. There is no assurance that our customers will continue to conduct business with us in the future, the failure of which could have a material adverse effect on our business, prospects, financial condition and results of operation.
We may be adversely affected by our dependence on network infrastructure, telecommunications providers and other vendors.
We may experience problems with the installation, maintenance and pricing of our communications network, and delays in equipment delivery orloss of our equipment suppliers could impair the quality of our services and any growth. If our network infrastructure is disrupted, we may lose customers or incur additional liabilities. We may experience interruptions in service as a result of fire, natural disasters, power loss, or the accidental or intentional actions of service users, and others. Although we have implemented disaster recovery, security and service continuity protection measures, including the physical protection of our offices and equipment, we cannot guarantee that such measures are sufficient to avoid future interruptions of service or losses of data.
| 12 |
We may not be able to increase our customer base at the expected rate, which is dependent upon our growth strategies.
In order to become profitableand obtain consistent positive operating cash flow, we need to both retain existing customers and continue to add new customers. We may encounter difficulties, including but not limited to
| · | we may not retain customers for a variety of reasons, including competition from other providers, existing customers electing to develop their own services, and customers going out of business; |
| · | we may not succeed in adding customers if our sales and marketing plan is unsuccessful. As part of our growthstrategy, |
| · | we compete with other companies for acquisition opportunities and cannot make assurances that we will be able tosuccessfully negotiate future acquisitions or strategic alliances; |
| · | we often use a combination of cash, debt, and common stock as consideration for our acquisitions, and futureacquisition targets may not agree to accept the form(s) of consideration offered; and |
| · | we may not be able to acquire companies or their assets at prices that are consistent with our strategy. |
While our current business plan is to expand primarily through organic growth, we plan to effect acquisitions of broadband coverage if and when necessary. Consummating acquisitions could also result in the incurrence of additional debt and related interest expense, aswell as unforeseen contingent liabilities, all of which could have a material adverse effect on our business, prospects, financial condition and results of operations.
If our security measures are breached, or if our services are subject to attacks that degrade or deny the ability of customers to access our network, our products and services may be perceived as not being secure and customers may curtail or stop using our services, and we may incur significant legal and financial exposure.
Concerns about the security of information transmitted through the use of our services and the privacy of users may inhibit our growth. With respect to our enterprise customers, we rely upon our CryptoVueTMCryptoVue™ technology as well as an Internet protocol layer “2” device to provide secure transmissions of certain customer information and various firewall systems to protect our databases and computer systems. Security breaches at our enterprise customer installations could expose us to litigation and potential liability. Our security measures may be breached due to the actions of outside parties, employee error, malfeasance, security flaws in the third party products or services that we rely upon or otherwise, and, as a result, an unauthorized party may obtain access to our data or data transferred over our network. Additionally, outside parties may attempt to fraudulently induce employees to disclose sensitive information in order to gain access to our enterprise customers’ data or data transferred over our network. Because the techniques used to obtain unauthorized access, disable or degrade service, or sabotage systems change frequently and often are not recognized until launched against a target, we may be unable to anticipate these techniques or to implement adequate preventative measures. If an actual or perceived breach of our security occurs, the market perception of the effectiveness of our security measures, such as the CryptoVueTMCryptoVue™ technology, could be harmed and we could lose customers.
We may be subject to significant liability for our technology.
If our technology contains defects, we may be subject to significant liability claims from subscribers and other users of our technology and incur significant unexpected expenses or lost revenues. Our technology is complex and may contain undetected errors or failures. We also have exposure to significant liability claims from our customers because our technology is designed to provide critical communications services. Our product liability insurance and contractual limitations in our customer agreements may not cover all potential claims resulting from a defect in our technology. Failure of our technology to perform satisfactorily could cause us to lose revenue, as well as to experience delay in or loss of market acceptance and sales, product returns, diversion of research and development resources, injury to our reputation or increased service and warranty costs.
Our current services may become obsolete due to the highly competitive and continued advancement of the communications industry. Larger service providers may provide services at lower costs.
Intense competition in the Internet services market and inherent limitations in existing technology may negatively affect the number of our subscribers. Competition in the market for Internet technology services is intense, and we expect the level of competition to intensify in the future. The market for Internet services and technology is characterized by rapid change, evolving industry standards and frequent introductions of new technological developments. These new standards and developments could make our existing or future services obsolete. Many of our current and potential competitors have longer operating histories, greater brand name recognition, larger subscriber bases and substantially greater financial, technical, marketing and other resources than we have. Therefore, they may be able to respond more quickly than we can respond to new or changing opportunities, technologies, standards or subscriber requirements. Our effort to keep pace with the introduction of new standards and technological developments and effectively compete with larger service providers could result in additional costs or the effort could prove difficult or impossible. The failure to keep pace with these changes and to continue to enhance and improve the responsiveness, functionality and features of our services could harm our ability to attract and retain users, which could lead to a loss of revenues.
| 13 |
Interruption or failure of our networks, which in certain rural markets are often subject to severe weather such as hurricanes,lightning storms or tornados, could impair our ability to provide our services, which could damage our reputation and harm operating results.
We provide our services in remote areas of North America, including the Gulf coast, which are more prone to severe weather such as hurricanes, lightning storms and tornados. Any disruption in our services arising from these or other natural disasters or catastrophic events including wildfires and other fires, excessive rain, terrorist attacks and wars, could disrupt the continued operation of our networks and have a material adverse effect on our business, prospects, results of operation and financial condition.
Although we believe our insurance coverage is adequate to address the variety of potential liabilities we face, our insurance coverage is subject to deductibles and coverage limits. Upon an occurrence of a significant natural disaster, or manmade problems such as computer viruses, civil war, terrorism, blackout or disruptions to the economies of the United States and other countries, such coverage may not be adequate or continue to be available at commercially reasonable rates and terms. In the event of a major disaster affecting one or more of our sites, our operations could be significantly disrupted, delayed or prevented for the time required to transfer production, repair, rebuild or replace the affected site. This time frame could be lengthy, and result in significant expenses for repair and related costs.
We may not be able to successfully upgrade our existing network infrastructure.
If the number of customers using our network and the complexity of our services increase, we will require more infrastructure, network and customer service resources tomaintain the quality of our services. We may experience quality deficiencies, cost overruns and delays in implementing network improvements and expansion, in maintenance and upgrade projects, including slower than anticipated technology migrations. If we do not implement necessary developments and network upgrades successfully, or if it experiences inefficiencies, operational failures, or unforeseen costs during implementation, we may lose customers or incur additional liabilities.
We compete with many companies that are larger and better capitalized than us, and we expect such competition to continue. An inability to overcome competition from alternative communication systems could adversely affect our results of operations.
We face competition from many entities with significantly greater financial resources, well-established brand names and larger customer bases. The internetInternet services market is extremely competitive in every segment including competing technologies such as VSAT and long-term evolution (marketed as 4G LTE). We may become subject to price competition for our services as companies seek to enter our industry or current competitors attempt to gain market share.We expect competition to intensify in the future and expect significant competition from traditional and new telecommunications companies primarily consisting of cable modem, Internet, DSL, microwave, mobile and satellite data providers. For example, the performance and coverage area of our wireless systems are dependent on certain factors that are outside of our control, including features of the environment inwhich the systems are deployed, such as the amount of clutter (natural terrain features and man-made obstructions) and the radio frequency available. Depending on specific customer needs, these obstacles may make our technology less competitive in comparison with other technologies and make other technologies less expensive or more suitable. Our business may also compete in the future with products and services based on other wireless technologies and other technologies that have yet to be developed. If we are unable to make or keep our services competitively priced and attain a larger market share in the markets in which we compete, our levels of sales and our ability to achieve profitability may suffer.
To the extent we elect to enter into marketing or reseller agreements with third parties to expand our network, and our dependence on such relationships may adversely affect our business.
Our business strategy for increasing the size of our networks may depend on our ability to enter into marketing or reseller agreements with other companies, similar to our exclusive reseller agreements withSchlumberger Technology Corporation and Schlumberger Canada Limited entered into in 2009.companies. Supporting diligence activities conducted by potential partners and negotiating the financial and other terms of these agreements are long and complex processes with uncertain results. Even if we are successful entering into one or more marketing or reseller agreements, such arrangements can involve greater uncertainty for us, as we may have limited or no control over certain aspects of the programs. We may determine that continuing the relationships under the terms provided is not in our best interest, and we may terminate the agreements. Similarly, these third parties could delay or terminate their agreements with us, further delaying the execution of our business plan.
| 14 |
In addition, we could have disputes with our marketing and reselling partners, such as the interpretation of terms in our agreements. For example, we are currently involved in arbitration proceedings withSchlumberger Technology Corporation and Schlumberger Canada Limited, where we are pursuing a breach of contract claim relating to the minimum purchase requirements under the 2009 reseller agreements. This pending action, and any such future disagreements with our partners, could lead to delays in the execution of our business plan or could result in time-consuming and expensive litigation or arbitration, which may not be resolved in our favor.
The ongoing weakness in the global economic environment may have significant effects on our customers and suppliers that could result in material adverse effects on our business, prospects, financial condition and results of operations.
Notwithstanding the increased potential for economic recovery, the ongoing weakness in the global economic environment – which has included, among other things, significant reductions in available capital and liquidity from banks and other providers of credit, substantial reductions and/or fluctuations in equity and currency values worldwide, significant decreases in consumer confidence and consumer and business spending, high rates of unemployment and concerns that the worldwide economy may continue to experience significant challenges – may materially adversely affect our customers’ access to capital or willingness to spend capital on our products, and/or their levels of cash liquidity with which to pay for our products. In addition, our suppliers’ access to capital and liquidity may continue to be affected, which may in turn adversely impact their ability to maintain inventories, production levels, and/or product quality, or cause them to raise prices or lower production levels, or result in their ceasing operation.
Future acquisitions could prove difficult to integrate, disrupt our business, dilute stockholder value and strain our resources.
We have completed 15 acquisitions since 2004, and we plan to continue to engage in strategic acquisitions that further expand our wireless broadband footprint and coverage areas in key oil and gas markets.The structure of our acquisitions and investments involve numerous risks, including:
| · | difficulties inintegrating operations, technologies, services, accounting and personnel; |
| · | difficulties insupporting current customers of our acquired companies; |
| · | ability tomaintain sufficient internal controls; |
| · | diversion offinancial and management resources from existing operations; |
| · | if wefinance acquisitions by issuing convertible debt or equity securities, our existing stockholders may be diluted,which dilution could adversely affect the market price of our stock; |
| · | assumption of contingent liabilities; |
| · | recording of goodwill and other intangible assets, which are subject to potential impairments in the future that could harm ouroperating results; and |
| · | inability togenerate sufficient revenues to offset acquisition or investment costs. |
Acquisitions also frequently result in recording of goodwill and other intangible assets, which are subject to potential impairments in the future that could harm ouroperating results. It is also possible that at some point in the future we may decide to enter new markets, thus subjecting ourselves to new risks associated with those markets. If we fail to achieve the anticipated benefits of any acquisitions we may complete, our business, prospects, financial condition and results of operationmayoperation may be impaired.
We may notbe able to effectively manage our growth, which may harm our financial condition.
Our strategy envisions building and expanding our business in the oil and gas industry through organic growth and acquisition of broadband. While we anticipate that most of our growth will be through the deployment of the MBT’s in rural areas to transmit wireless data for oil and gas companies, we may determine that the acquisition of broadband coverage in existing and rural areas may be an attractive and strategic solution. Growth may place a strain on our management systems and resources. We must continue to refine and expand our business development capabilities, our systems and processes and our access to financing sources. As we grow, we must continue to hire, train, supervise and manage new employees. We cannot assure you that we will be able to:
| · | expand our systems effectively or efficiently or in a timely manner; |
| · | optimally allocate our human resources; or |
| · | identify and hire qualified employees or retain valued employees. |
If we are unable to manage our growth and our operations, ourbusiness, prospects, financial condition and results of operation could be adversely affected.
Our business may suffer if wedo not attract and retain talented personnel.
Our success will depend in large measure on the abilities, expertise, judgment, discretion, integrity and good faith of our management and other personnel in conducting our business. The loss of any of our executive officers or our inability to attract qualified board members could adversely impact our business. We may also experience difficulties in certain jurisdictions in our efforts to obtain suitably qualified staff and to retain staffs that are willing to work in that jurisdiction. We do not currently carry “key man” life insurance on, nor do we have employment agreements with, certain of our executive officers.
| 15 |
Our success depends on the ability of our management and employees to successfully implement our business strategy. As we grow, we intend to hire additional personnel. Our future personnel may not continue their association or employment with us, and we may not be able to findreplacement personnel with comparable skills. If we are unable to attract and retain key personnel, ourbusiness, prospects, financial condition and results of operation may be adversely affected.
Risks relating to our intellectual property
We depend upon our intellectual property and our failure to protect existing intellectual property or secure and enforce such rights for new proprietary technology could adversely affect our future growth and success.
We seek to protect our intellectual property rights by relying on a combination of patent, trade secret, copyright and trademark laws. We also use confidentiality and other provisions in our agreements that restrict access to and disclosure of our confidential know-how and trade secrets.
We have been issued three patents and have two patent applications pending with the United States Patent and Trademark Office relating to our CryptoVueTMCryptoVue™ hardware and software utilized by our enterprise banking and healthcare customers. However, we cannot provide any assurances that these applications will ultimately result in issued patents or, if patents are issued or in the case of our issued patents, that they will provide sufficient protections for our technology against competitors. Outside of these issued patents and patent applications, we seek to protect our technology as trade secrets and technical know-how. However, trade secrets and technical know-how are difficult to maintain and do not provide the same legal protections provided by patents. In particular, only patents will allow us to prohibit others from using independently developed technology that is similar. If competitors develop knowledge substantially equivalent or superior to our trade secrets and technical know-how, or gain access to our knowledge through other means such as observation of our technology that embodies trade secrets at customer sites which we do not control, the value of our trade secrets and technical know-how would be diminished.
While we strive to maintain systems and procedures to protect the confidentiality and security of our trade secrets and technical know-how, these systems and procedures may fail to provide an adequate degree of protection. For example, although we generally enter into agreements with our employees, consultants, advisors, and strategic partners restricting the disclosure and use of trade secrets, technical know-how and confidential information, we cannot provide any assurance that these agreements will be sufficient to prevent unauthorized use or disclosure. In addition, some of the technology deployed at customer sites in the future, which we do not control, may be readily observable by third parties who are not under contractual obligations of non-disclosure, which may limit or compromise our ability to continue to protect such technology as a trade secret.
While we are not currently aware of any infringement or other violation of our intellectual property rights, monitoring and policing unauthorized use and disclosure of intellectual property is difficult. If we learned that a third party was in fact infringing or otherwise violating our intellectual property, we may need to enforce our intellectual property rights through litigation. Litigation relating to our intellectual property may not prove successful and might result in substantial costs and diversion of resources and management attention.
We may be accused of infringing upon the intellectual property rights of third parties, which is costly to defend and could limit their ability to use certain technologies in the future.
We may face claims asserting that our technology or the commercial use of such technology infringes or otherwise violates the intellectual property rights of others. We have not conducted infringement, freedom to operate or landscape analyses, and as a result we cannot be certain that our technologies and processes do not violate the intellectual property rights of others. We may also face infringement claims from the employees, consultants, agents and outside organizations we have engaged to develop our technology. While we have sought to protect ourselves against such claims through contractual means, we cannot provide any assurance that such contractual provisions are adequate, and any of these parties might claim full or partial ownership of the intellectual property in the technology that they were engaged to develop.
If we were found to be infringing or otherwise violating the intellectual property rights of others, we could face significant costs to implement work-around methods, and we cannot provide any assurance that any such work-around would be available or technically equivalent to our current technology. In such cases, we might need to license a third party’s intellectual property, although any required license might not be available on acceptable terms, or at all. If we are unable to work around such infringement or obtain a license on acceptable terms, we might face substantial monetary judgments against us or an injunction against continuing to license our technology, which might cause us to cease operations.
| 16 |
In addition, even if we are not infringing or otherwise violating the intellectual property rights of others, we could nonetheless incur substantial costs in defending ourselves in suits brought against us for alleged infringement. Also, if any agreements provide that we will defend and indemnify our customer for claims against them relating to any alleged infringement of the intellectual property rights of third parties in connection with such customer’s use of our technologies, we may incur substantial costs defending and indemnifying any customer to the extent they are subject to these types of claims. Such suits, even if without merit, would likely require our management team to dedicate substantial time to addressing the issues presented. Any party bringing claims might have greater resources than we do, which could potentially lead to us settling claims against which we might otherwise prevail on the merits.
Any claims brought against us or any customers alleging that we have violated the intellectual property of others could have negative consequences for our business, prospects, financial condition and results of operation.
Risks Relating to Our Industry
We are subject to the volatility of the global oil and gas industry and our business is likely to fluctuate with the level of global activity for oil and natural gas exploration, development and production.
A substantial amount of our revenues are derived from services rendered to companies engaged in the oil and gas industry.Demand for our remote communication services and collaborative applications depends on our customers’ willingness to make operating and capital expenditures to explore, develop and produce oil and natural gas in the regions in which we operate or may operate. Our business will suffer if these expenditures decline. Our customers’ willingness to explore, develop and produce oil and natural gas depends largely upon prevailing market conditions that are influenced by numerous factors over which we have no control, including:
| · | the supply and demand for oil and natural gas; |
| · | oil and natural gas prices and expectations about future prices; |
| · | the expected rate of decline in production; |
| · | the discovery rate of new oil and gas reserves; |
| · | the ability of the Organization of Petroleum Exporting Countries, or OPEC, to influence and maintain production levels and pricing; |
| · | the level of production in non-OPEC countries; |
| · | the worldwide political and military environment, including uncertainty or instability resulting from an escalation or additional outbreak of armed hostilities or other crises in oil or natural gas producing areas of the Middle East and other crude oil and natural gas producing regions or further acts of terrorism in the United States, or elsewhere; |
| · | the impact of changing regulations and environmental and safety rules and policies, including changes to regulations, rules and policies, following oil spills and other pollution by the oil and gas industry, and legislative and regulatory interest to limit or further regulate drilling and hydraulic fracturing activities; |
| · | advances in exploration, development and production technology; |
| · | the global economic environment; |
| · | the political and legislative framework governing the activities of oil and natural gas companies; and |
| · | the price and availability of alternative fuels. |
The level of activity in the oil and natural gas exploration and production industry has historically been volatile and cyclical. Although we believe our customers will be dependent upon real-time voice and data communication services to optimize their oil and gas production and development in an environment with lower energy prices, a prolonged significant reduction in the price of oil and natural gas will likely affect oil and natural gas production levels and therefore affect demand for the communication services we provide. In addition, a prolonged significant reduction in the price of oil and natural gas could make it more difficult for us to collect outstanding account receivables from our customers. A material decline in oil and natural gas prices or oil and natural gas exploration, development or production activity levels could have an adverse effect on our business, prospects, results of operation and financial condition.
| 17 |
Oil and gas operations are subject to comprehensive regulation which may impact drilling operations, causing an adverse effect on us.
Oil and gas operations are subject to national and local laws and regulations relating to the protection of the environment, including laws regulating removal of natural resources from the ground and the discharge of materials into the environment. Oil and gas operations are also subject to national and local laws and regulations which seek to maintain health and safety standards by regulating the design and use of drilling methods and equipment. Environmental standards imposed by national or local authorities may be changed and any such changes may have material adverse effects on our oil and gas industry customers. Accordingly, if changes in regulations cause current or potential oil and gas industry customers to curtail drilling operations, ourbusiness, prospects, financial condition and results of operation will be negatively impacted as a majority of our sales result from oil and gas industry customers.
Privacy concerns may prevent customers from using our services.
We and our customers are subject to laws and regulations protecting personal and other confidential information in connection with the exchange of such information by these customers using our services. At present, in the United States, interactive Internet-based service providers have substantial legal protection for the transmission of third-party content that is infringing, defamatory, pornographic or otherwise illegal. We cannot guarantee that a U.S. court would not conclude that we do not qualify for these protections as an interactive service provider. We do not and cannot screen all of the content generated, sent and received by users of our services or the recipients of messages delivered through our services. Additionally, a small portion of our customers use our services in Canada, in which case we would be subject to its laws and regulations relating to internetInternet privacy. While Canadian Internet law continues to evolve, our services are currently largely unregulated. We cannot guarantee, however, that this regulatory environment will continue, and future legislation in Canada affecting Internet service providers could adversely impact our operations.
We utilize a combination of licensed and unlicensed spectrum, which is subject to intense competition, low barriers of entry and potential interference from multiple competing users.
We presently utilize unlicensed spectrum in connection with our broadband service offerings. While unlicensed spectrum is regulated by the FCC, it is available tomultiple simultaneous users and may be subject to interference, which may reduce the quality of the service provided to subscribers. The availability of unlicensed spectrum is limited, and others do not need to obtain permits or licenses to utilize the same unlicensed spectrum used by us currently or which we may in the future utilize. Accordingly, utilization of unlicensed spectrum could threaten our ability to reliably deliver services.
We are subject to extensive regulation that could limit or restrict our activities. If we fail to comply with these regulations, we may be subject to penalties, including fines and suspensions, and past due fees and interest, which may adversely affect our financial condition and results of operations.
Our business, including the acquisition, lease, maintenance, and use of spectrum licenses, is extensively regulated by federal, state and local governmental authorities. A number of federal, state and local privacy, security and consumer laws also apply to our business. These regulations andtheir application are subject to continual change as new legislation, regulations or amendments to existing regulations are adopted from time to time by governmental or regulatory authorities, including as a result of judicial interpretations of such laws and regulations. Current regulations directly affect the breadth of services we are able to offer and may impact the rates, terms and conditions of our services. Regulation of companies that offer competing services, such as cable and DSL providers and telecommunications carriers, also affects our business.
Certain wireless broadband services are subject to regulation by the FCC. At the federal level, the FCC has jurisdiction over wireless transmissions over the electromagnetic spectrum, all interstate and foreign telecommunications services, and many aspects of intrastate telecommunications. Wirelessbroadband services may become subject to greater state or federal regulation in the future. We cannot predict the impact, if any, that any future legal or regulatory changes or developments may have on our business, prospects, financial condition and results of operation. Changes in the legal or regulatory environment relating to the Internet access industry, including changes that directly or indirectly affect telecommunication costs or increase the likelihood or scope of competition from regional telephone companies, cable operators or others, could have a material adverse effect on its business, financial condition and results of operations.
Much of the law related to the liability of Internet service providers remains unsettled. For example, many jurisdictions have adopted laws related to unsolicited commercial email or “spam” in the last several years. Other legal issues, such as the sharing of copyrighted information, transborder data flow,universal service, and liability for software viruses could become subjects of additional legislation and legal development. We cannot predict the impact of these changes on them. Regulatory changes could have a material adverse effect on our business, financial condition or results of operations.
| 18 |
The industry in which we operate is continually evolving. Our services may become obsolete, and may not be able to offer or develop competitive services on a timely basis or at all.
The broadband Internet and wireless services industries are characterized by rapid technological change, competitive pricing,frequent new service introductions, evolving industry standards and regulatory requirements. We believe that our success depends on our ability to anticipate and adapt to these challenges and to offer competitive services on a timely basis. We face a number of difficulties and uncertainties associated with our reliance on technological development, such as:
| · | competition |
| · | competition from better capitalized service providers using more efficient, less expensive technologies, including services not yet invented or developed to our targeted markets; |
| · | ourinability to develop a spectrum portfolio, if necessary, and offer advanced data services in a timely and cost efficient manner; and |
| · |
As the services offered by the companies and their competitors develop, our customers may not accept our services as a commercially viable alternative to other means of delivering broadband or wireless broadband services. As a result, our services may become obsolete, and we may be unable to develop competitive services on a timely basis, or at all.
If the wireless broadband market does not evolve as we anticipate, our business may be adversely affected.
If we fail to properly assess and address the broadband wireless market or if our services fail to achieve market acceptance for any reason, our business, prospects, financial condition and results of operation would be materially adversely affected. Since the market for our products is still evolving, it is difficult to assessthe competitive environment or the size of the market that may develop. In addition, technologies, customer requirements and industry standards may change rapidly. If we cannot improve or augment our services and products as rapidly as existing technologies, customer requirements and industry standards evolve, our products or services could become obsolete. The introduction of new or technologically superior products by competitors could also make our services less competitive or obsolete. As a result of any of these factors, our position in existing markets or potential markets could be eroded.
Risks Related to Our Securities
There is currently a limited market for our shares of common stock, and any trading market that exists in our shares may be highly illiquid and may not reflect the underlying value of our net assets or business prospects.
Trading in our common stock continues to be conducted on the electronic bulletin board in the over-the-counter market. As a result, an investor may find it difficult to dispose of or to obtain accurate quotations as to the market value of our common stock, and our common stock may be less attractive for margin loans, for investment by financial institutions, as consideration in future capital raising transactions or other purposes.
The terms of our Series APreferred Stock include super-majority voting provision.
Each share of our Series A Preferred Stock votes on the basis of 100 votes for each share of common stock into which the Series A Preferred Stock is convertible. This provision may limit us in raising additional capital, competing effectively, or taking advantage of new business opportunities.
Because certain of our stockholders control a significant number of shares of our voting capital stock, they have effective control over actionsrequiring stockholder approval.
As of December 31, 2012,2013, Dr. H. Dean Cubley, our Chief Executive Officer and Chairman, had voting control over 96.4%95.5% of our outstanding shares of Series A Preferred Stock, or 97.3%95.4% of the total voting power.power of the Company. As a result, Dr. Cubley has the ability to control the outcome of matters submitted to our stockholders for approval, including the election of directors and any merger, consolidation or sale of all or substantially all of our assets. In addition, Mr.Dr. Cubley has the ability to control the management and affairs of our company. Accordingly,any investors who purchase shares will be minority shareholders and as such will have little to no say in the direction of us and the election of directors. Additionally,this concentration of ownership might harm the market price of our common stock by:
| 19 |
| · | delaying, deferring orpreventing a change in corporate control; |
| · | impeding a merger,consolidation, |
| · | discouraging a potentialacquirer from making a tender offer or otherwise attempting to obtain control of us. |
The market price of our common stock is very volatile and the value of your investment may be subject to sudden decreases.
The trading price for our common stock has been, and we expect it to continue to be, volatile. For example, the closing price of our stock fluctuated between $.57$3.10 per share and $2.95$456.00 (Post-Split) per share during the year ended December 31, 2012.2013. The price at which our common stock trades depends upon a number offactors,, including our historical and anticipated operating results and general market and economic conditions, which are beyond our control, including:
| · | current economic conditions in the oil and gas industry; |
| · | technological innovations or new commercial products and services by us or our competitors; |
| · | intellectual property disputes; |
| · | additions or departures of key personnel; |
| · | sales of our common stock; |
| · | our ability to integrate operations, products and services; |
| · | our ability to execute our business plan; |
| · | operating results below expectations; |
| · | loss of any strategic relationship; |
| · | industry developments; |
| · | general economic and other external factors; |
| · | changes in governmental regulations; and |
| · | period-to-period fluctuations in our financial results. |
In addition, the stock market has, from time to time, experienced extreme price and volume fluctuations. These broad market fluctuations may lower the market price of our common stock. Moreover, during periods of stock market price volatility, share prices of many companies have often fluctuated in a manner not necessarily related to their operating performance. Accordingly, our common stock may be subject to greater price volatility than the stock market as a whole.
Our stock is traded over the counter on the OTCBB, and is often thin and characterized by wide fluctuations in trading prices, due to many factors that may have little to do with a company's operations or business prospects. This volatility could depress themarket price of our common stock for reasons unrelated to our business or operating performance. Moreover, trading is often more sporadic than the trading of securities listed on a quotation system like the NASDAQ or a stock exchange like the NYSE Euronext. There is no guarantee that we will obtain a listing on a national stock exchange, and accordingly, shareholders may have difficulty reselling any of their shares of common stock.
A significant number of shares of common stock may be issued during the next 12 months. The issuance of these shares will have a dilutive effect on our common stock and may lower our stock price.
We have reserved for issuance the following shares of common stock as of December 31, 2012:2013:
| · |
| · |
| · |
| · |
| 20 |
Further, we may issue shares to reduce our debt obligations. Accordingly, the issuance of these shares will have a dilutive effect from both a net tangible book value per share basis and from a number of shares of common stock outstanding basis. This overhang could have a depressiveeffect on our common stock price.
Our revenue and operating results may fluctuate significantly from quarter to quarter, and fluctuations in operating results could cause our stock price to decline.
Our revenue andoperating results may vary significantly from quarter to quarter due to a number of factors. In future quarters, operating results may be below the expectations of investors, and the price of our common stock may decline. Factors that could cause quarterly fluctuations include:
| · | the ability to raise the necessary capital to implement our strategic plan; |
| · | the ability to keepcurrent customers and secure new customers; |
| · | the ability to acquire existing rural wireless broadband networks throughout North America and the ability to secure customers in therural regions in which we acquire these wireless broadband networks; and |
| · | the ability tosecure new regional banking network customers for both the construction and design of new broadband networks and for the maintenance and monitoring of these broadband networks. |
Accordingly, the failure to obtain significant future revenue, lower than expected revenue in the future, increased losses in the future, and decreased working capital couldadversely affect our stock price and liquidity.
If our common stock remains subject to the SEC's penny stock rules, broker-dealers may experience difficulty in completingcustomer transactions and trading activity in our securities may be adversely affected.
Unless our securities are listed on a national securities exchange, or we have net tangible assets of $5,000,000 or more and our common stock has a market price per share of $5.00 or more, transactions in our common stock will be subject to the SEC's "penny stock"rules. rules. If our common stock remains subject to the "penny stock" rules promulgated under the Securities Exchange Act of 1934, broker-dealers may find it difficult to effectuate customer transactions and trading activity in our securities may be adversely affected.
Underthese rules, broker-dealers who recommend such securities to persons other than institutional accredited investors must:
| · | make a special written suitability determination for the purchaser; |
| · | receive thepurchaser's written agreement to the transaction prior to sale; |
| · | provide thepurchaser with risk disclosure documents which identify certain risks associated with investing in "penny stocks" and which describe the market for these "penny stocks" as well as a purchaser's legal remedies; and |
| · | obtain a signed and datedacknowledgment from the purchaser demonstrating that the purchaser has actually received the required risk disclosure document before a transaction in a "penny stock" can be completed. |
As a result, if our common stock becomes or remains subject to the penny stock rules, the market price of our securities may be depressed, and you may find it more difficult to sell our securities.
We do not expect to pay dividends on our common stock for the foreseeablefuture. Any return on investment may be limited to the value of our common stock.
No cash dividends have been paid on our common stock. We expect that any income received from operations will be devoted to our future operations and growth. We do not expect to pay cash dividends on our common stock in the near future. Payment of dividends would depend upon our profitability at the time, cash available for those dividends, and other factors as our board of directors may consider relevant. In addition, our Series A Preferred Stock limits our ability to pay dividends upon any shares of common stock unless we declare and pay a dividend upon the then outstanding shares of Series A Preferred Stock in the same amount per share of Series A Preferred Stock as would be declared payable upon the number of shares of common stock into which each share of Series A Preferred Stock could then be converted to holders of our Series A Preferred Stock. If we do not pay dividends, our common stock may be less valuable because a return on an investor's investment will only occur if our stock price appreciates. Investors in our common stock should not rely on an investment in us if they require dividend income.
| 21 |
If securities or industry analysts do not publish research or reports about our business, or if they change their recommendations regardingour stock adversely, our stock price and trading volume could decline.
The trading market for our common stock will be influenced by the research and reports that industry or securities analysts publish about us or our business. We do not currently have and may never obtain research coverage by industry or financial analysts. If no or few analysts commence coverage of us, the trading price of our stock would likely decrease. Even if we do obtain analyst coverage, if one or more of the analysts who cover us downgrade our stock, our stock price would likely decline. If one or more of these analysts cease coverage of our company or fail to regularly publish reports on us, we could lose visibility in the financial markets, which in turn could cause our stock price or trading volume to decline.
Nevada law and our corporate charter contain anti-takeover provisions that could delay or discourage takeover attemptsthat stockholders may consider favorable.
Provisions in our Articles of Incorporation, as amended, may have the effect of delaying or preventing a change of control or changes in our management. For example, our Board of Directors have the authority to issue up to 25,000,000 shares of preferred stock in one or more series (of which 8,426,9829,930,982 shares of Series A Preferred Stock have been issued as of December 31, 2012)2013) and to fix the powers, preferences and rights of each series without stockholder approval. The ability to issue preferred stock could discourage unsolicited acquisition proposals or make it more difficult for a third party to gain control of our company, or otherwise could adversely affect the market price of our common stock.
Additionally, our Articles of Incorporation, as amended, and Bylaws, as applicable, provide, subject to applicable Nevada law, that (i) our board of directors with the ability to alter our Bylaws without stockholder approval, (ii) a director may be removed only for cause and by the affirmative vote of the holders of 60%67% of the combined voting power; (iii) that vacancies on our board of directors resulting from death, resignation (except where such resignation is to take place at a future time), disqualification, or removal may be filled by a majority of directors in office, although less than a quorum, and (iv) provide for a staggered board, in which the board members are divided into three classes to serve for a period of three years from the date of their respective appointment or election. Our Series A Preferred Stock Designation also provides that each share Series A Preferred Stock entitles the holder to 100 votes on all matters submitted to a vote of the shareholders of the Company. The Designation further provides that the Series A Preferred Stock will have a preference as to dividends and liquidation. Such provisions may have the effect of discouraging a third-party from acquiring us, even if doing so would be beneficial to our stockholders. These provisions are intended to enhance the likelihood of continuity and stability in the composition of our board of directors and in the policies formulated by them, and to discourage some types of transactions that may involve an actual or threatened change in control of our company. These provisions are designed to reduce our vulnerability to an unsolicited acquisition proposal and to discourage some tactics that may be used in proxy fights. We believe that the benefits of increased protection of our potential ability to negotiate with the proponent of an unfriendly or unsolicited proposal to acquire or restructure our company outweigh the disadvantages of discouraging such proposals because, among other things, negotiation of such proposals could result in an improvement of their terms. However, these provisions could have the effect of discouraging others from making tender offers for our shares that could result from actual or rumored takeover attempts. These provisions also may have the effect of preventing changes in our management.
A sale of a substantial number of shares of our common stock may cause the price of our common stock to finance futureacquisitions to decline and may impair our ability to raise capital in the future.
Our common stock is traded on the OTCBB and, despite certain increases of trading volume from time to time, there have been periods when it could be considered "thinly-traded," meaning that the number of persons interested in purchasing our common stock at or near bid prices at any given time may be relatively small or non-existent. Finance transactions, as well as shares that may be issued to finance future acquisitions resulting in a large amount of newly issued shares that become readily tradable, or other events that causecurrent stockholders to sell shares, could place downward pressure on the trading price of our stock. In addition, the lack of a robust resale market may require a stockholder who desires to sell a large number of shares of common stock to sell the shares in increments over time to mitigate any adverse impact of the sales on the market price of our stock.
If our stockholders sell, or the market perceives that our stockholders intend to sell for various reasons, including the ending of restriction on resale, substantial amounts of our common stock in the public market, including shares issued upon the exercise of outstandingoptions or warrants, the market price of our common stock could fall. Sales of a substantial number of shares of our common stock may make it more difficult for us to sell equity or equity-related securities in the future at a time and price that we deem reasonable or appropriate. We may become involved in securities class action litigation that could divert management's attention and harm our business.
| 22 |
If we fail to comply with the rules under the Sarbanes-Oxley Act of 2002 related to disclosure controls and procedures, or, if we discover material weaknesses and other deficiencies in our internal control and accounting procedures, our stock price could decline significantly and raising capital could be more difficult.
If we fail to comply with the rules under the Sarbanes-Oxley Act of 2002 related to disclosure controls and procedures, or, if we discover material weaknesses and other deficiencies in our internal control and accounting procedures, our stock price could decline significantly and raising capital could be more difficult. Moreover, effective internal controls are necessary for us to produce reliable financial reports and are important to helping prevent financial fraud. If we cannot provide reliable financial reports or prevent fraud, our business and operating results could be harmed, investors could lose confidence in our reported financial information, and the trading price of our common stock could drop significantly. In addition, we cannot be certain that material weaknesses or significant deficiencies in our internal controls will not be discovered in the future.
ITEM 1B. UNRESOLVED STAFF COMMENTS
Not applicable to smaller reporting companies.
ITEM 2. PROPERTIES
Our principal executive offices are located at 2911 South Shore Blvd., League City, Texas 77573. As of December 31, 2012,2013, we conducted our business from ninesix field offices, two of which we own and sevenfour of which we lease. The two properties that we own are a warehouse facility and an office facility in Pampa, Texas. Our leased facilities range from approximately 2,000 square feet to 24,700 square feet underlying leases that range from 30-day to 43 years and have rental rates that we believe to reflect market prices. Each field office typically includes a yard, administrative office and maintenance facility. Our ninesix field offices are located in Texas, Colorado, and North Dakota.Texas. We believe that our leased and owned properties are adequate for our current needs.
Our interests in our communications sites are comprised of operating leases created by long-term lease agreements at market rates. A typical tower site consists of a compound enclosing the tower site, a tower structure, and an equipment shelter that houses a variety of transmitting, receiving and switching equipment.
The Company occupies office and tower facilities under several non-cancelable operating lease agreements expiring at various dates through December 2018, and requiring payment of property taxes, insurance, maintenance and utilities.
ITEM 3. LEGAL PROCEEDINGS
From time to time, we are a party to litigation or other legal proceedings that we consider to be a part of the ordinary course of our business. We are not currently involved in any legal proceedings that could reasonably be expected to have a material adverse affect on our financial condition or results of operations.
On January 13, 2009, weERF Wireless entered into exclusive reseller agreements with Schlumberger Technology Corporation and Schlumberger Canada Limited (“Schlumberger”). for all of North America. The contracts completed their three year initial terms in January 2012. During the fourth quarter of 2010, we entered intoERF Wireless initiated a contractual mediation with Schlumberger to attempt to resolve various financial issues in the reseller agreements. Mediation was unsuccessful, and in 2011 weERF Wireless availed ourselvesitself of the right to submit a claim against Schlumberger Technology Corporation in binding arbitration as mandated in the parties’ reseller agreement. The hearings and other associated formal submittals of this arbitration were completed in June 2013 and a ruling by the three members of the arbitration panel which is the final phase of the arbitration process was announced on September 11, 2013. The ruling of the arbitrators is still pendingthat no award will be made to ERF Wireless and is scheduledthat each party will be responsible for hearing by summer 2013. A separate mediation proceeding hastheir own legal expenses and one-half of the arbitrator fees. In the case of ERF Wireless, all expenses associated with the arbitration have already been commenced recently against Schlumberger Canada Limited.reported and no additional expenses will be incurred.
ITEM 4. MINE SAFETY DISCLOSURES
Not applicable.
PART II
ITEM 5. MARKET FOR COMMON EQUITY, RELATED STOCKHOLDER MATTERS AND ISSUER PURCHASES OF EQUITY SECURITIES
Market Price Information
Our common stock currently trades over the counter on the OTCBB under the symbol ERFB. The following table shows the reported high and low bid quotations per share for our common stock for the last threetwo fiscal years based on information provided by the OTCBB. Such over-the-counter market quotations reflect inter-dealer prices, without markup, markdown or commissions and may not necessarily represent actual transactions or a liquid trading market, as the market for our common stock is limited, sporadic and highly volatile. The information below gives effect to all reverse splits affecting our common stock asduring the periods presented.
| High | Low | |||||||||||||||
| Fiscal 2013 | High | Low | ||||||||||||||
| Fourth Quarter | $ | 76.00 | $ | 3.10 | ||||||||||||
| Third Quarter | $ | 312.00 | $ | 50.00 | ||||||||||||
| Second Quarter | $ | 320.00 | $ | 163.00 | ||||||||||||
| First Quarter | $ | 456.00 | $ | 146.00 | ||||||||||||
| Fiscal 2012 | High | Low | ||||||||||||||
| Fourth Quarter | $ | 1.27 | $ | 0.52 | $ | 508.00 | $ | 208.00 | ||||||||
| Third Quarter | $ | 2.20 | $ | 0.98 | $ | 880.00 | $ | 392.00 | ||||||||
| Second Quarter | $ | 2.60 | $ | 1.11 | $ | 1,040.00 | $ | 444.00 | ||||||||
| First Quarter | $ | 2.98 | $ | 1.98 | $ | 1,192.00 | $ | 792.00 | ||||||||
| Fiscal 2011 | ||||||||||||||||
| Fourth Quarter | $ | 5.00 | $ | 2.00 | ||||||||||||
| Third Quarter | $ | 4.50 | $ | 0.25 | ||||||||||||
| Second Quarter | $ | 9.00 | $ | 2.95 | ||||||||||||
| First Quarter | $ | 20.50 | $ | 4.60 | ||||||||||||
| Fiscal 2010 | ||||||||||||||||
| Fourth Quarter | $ | 20.50 | $ | 4.50 | ||||||||||||
| Third Quarter | $ | 48.75 | $ | 12.50 | ||||||||||||
| Second Quarter | $ | 76.00 | $ | 15.75 | ||||||||||||
| First Quarter | $ | 140.00 | $ | 70.00 | ||||||||||||
Stockholders
The closing price of our common stock on the OTCBB on December 31, 20122013 was $1.01$3.10 per share. As of December 31, 2012,2013, we had 523552 stockholders of record of our common stock.
Dividends
We have never declared cash dividends on our common stock. We currently do not plan to declare cash dividends on shares of our common stock in the foreseeable future. We expect to retain our future earnings, if any, for use in the operation and expansion of our business. In addition, our Series A Preferred Stock limits our ability to pay dividends upon any shares of common stock unless we declare and pay a dividend upon the then outstanding shares of Series A Preferred Stock in the same amount per share of Series A Preferred Stock as would be declared payable upon the number of shares of common stock into which each share of Series A Preferred Stock could then be converted to holders of our Series A Preferred Stock. Subject to the foregoing, the payment of cash dividends in the future, if any, will be at the discretion of our board of directors and will depend upon such factors as earnings levels, capital requirements, our overall financial condition and any other factors deemed relevant by our board of directors.
Equity Compensation Plan Information
The following table sets forth certain information, as of December 31, 2012,2013, concerning securities authorized for issuance under our plans;
| Number of Securities to be Issued Upon Exercise of Outstanding Options, Warrants & Rights | Weighted Averaged Exercise Price of Outstanding Options, Warrants & Rights | Number of Securities Remaining Available for Future Issuance Under Stock Option Plans (Excluding Securities Reflected in Column (a) | Number of Securities to be Issued Upon Exercise of Outstanding Options, Warrants & Rights | Weighted Averaged Exercise Price of Outstanding Options, Warrants & Rights | Number of Securities Remaining Available for Future Issuance Under Stock Option Plans (Excluding Securities Reflected in Column (a) | |||||||||||||||||||
| (a) | (b) | (c) | (a) | (b) | (c) | |||||||||||||||||||
| Equity compensation plans approved by security holders: | ||||||||||||||||||||||||
| None | – | – | – | - | - | - | ||||||||||||||||||
| Equity compensation plans not approved by security holders: | ||||||||||||||||||||||||
| May 2011, The 2011 Stock Option Plan | – | – | 134 | |||||||||||||||||||||
| April 2012, The 2012 Employee Stock Option Plan | – | – | 279 | |||||||||||||||||||||
| December 2012, The 2013 Stock Option Plan | – | – | 431,880 | |||||||||||||||||||||
| May 2013, The 2013-A Stock Option Plan | 529 | $ | 315.39 | – | ||||||||||||||||||||
| Total | – | $ | – | 432,293 | 529 | $ | 315.39 | – | ||||||||||||||||
The Company’s Board of Directors in May 2013 has adopted the following equity incentive plans, the 2011 Stock Option Plan (the “2011 Plan”), 2012plan, 2013-A Employee Stock Option Plan (the “2012 Plan”) and the 2013 Stock Option Plan (the “2013“2013-A Plan”). The Plans each providePlan provides for equity awards to be issued to certain employees and consultants for services rendered. The Plans are eachPlan is administered by the Compensation Committee of the Company and if there is no Compensation Committee, by the entire board of directors. The Plans allowPlan allows for the issuance stock option grants, performance stock awards, restricted stock awards, and stock appreciation rights ("SAR") as determined by the Committee.
The 2011 Plan was adopted by the Board of Directors in May 2011, wherebyDuring 2013, the Company could issue upentered into a convertible promissory note with Tonaquint, Inc. for $791,500 and issued five-year warrants to 100,000purchase 371 shares of common stock at $320.00 per share, expiring March 2018, in connection with awards made under the 2011 Plan. such convertible promissory note.
During 2011,2013, the Company entered into a convertible promissory note with Willow Creek Capital for $244,200 and issued 99,866 shares of restricted common stock under the 2011 Plan. The 2012 Plan was adopted by the Board of Directors in April 2012, whereby the Company could issue upfive-year warrants to 250,000purchase 122 shares of common stock at $300.00 per share, expiring April 2018, in connection with awards made under the 2012 Plan. such convertible promissory note.
During 2012,2013, the Company entered into a convertible promissory note with Vista Capital for $60,500 and issued 249,721 shares of restricted common stock under the 2012 Plan. The 2013 Plan was adopted by the Board of Directors in December 2013, whereby the Company could issue upfive year warrants to 450,000purchase 36 shares of common stock at $320.00 per share, expiring April 2018, in connection with awards made under the 2013 Plan. During 2012, the Company issued 18,120 shares of restricted common stock under the 2013 Plan.such convertible promissory note.
Recent Sales of Unregistered Securities
Set forth below is certain information concerning issuances of common stock that were not registered under the Securities Act that occurred in the fourth quarter of fiscal 2012.2013.
Common Stock Issued for Cash Consideration
| · | No shares were issued for cash consideration for the |
Common Stock Issued for Debt Conversions and Services Rendered
| · | In October |
| · | In November 2013, 19,745 shares of common stock at a weighted average price of $11.29 per share were issued for debt conversions and interest. |
| · | In December 2013, 24,763 shares of common stock were issued for debt conversions and interest. |
Common Stock Issued Upon Conversion of Series A Preferred Stock
| · | On |
| · | On December |
| 25 |
The issuances referenced above were completedexempt from registration pursuant to either Section 4(2) of the Securities Act or Regulation D of the Securities Act Rules.Act. With respect to issuances made pursuant to Section 4(2) of the Securities Act, the transactions did not involve any public offering and were sold or issued to a limited group of persons. Each recipient either received adequate information about ERF Wireless or had access, through employment or other relationships, to such information, and ERF Wireless determined that each recipient had such knowledge and experience in financial and business matters that they were able to evaluate the merits and risks of an investment in the Company.
With respect to issuances made pursuant to Regulation D of the Securities Act, ERF Wireless determined that each purchaser was an "accredited investor" as defined in Rule 501(a) under the Securities Act, or if such investor was not an accredited investor, that such investor received the information required by Regulation D.
Except as otherwise noted, all sales of the Company's securities were made by officers of the Company who received no commission or other remuneration for the solicitation of any person in connection with the respective sales of securities described above. The recipients of securities represented their intention to acquire the securities for investment only and not with a view to or for sale in connection with any distribution thereof and appropriate legends were affixed to the share certificates and other instruments issued in such transactions.
Equity Repurchases by Issuer
The Company did not affect any common stock repurchases during fiscal 20122013 and 2011.2012.
ITEM 6. SELECTED FINANCIAL DATA
Not applicable to smaller reporting companies.companies
.
ITEM 7. MANAGEMENT'S DISCUSSION AND ANALYSIS OF FINANCIAL CONDITION AND RESULTS OF OPERATIONS
This Management's Discussion and Analysis of Financial Condition and Results of Operations (MD&A) should be read in conjunction with the other sections of this annual report on Form 10-K, including the financial statements.
Overview
We are a leading provider of wireless broadband access solutions for the energy industry. Our primary business strategy is to develop and provide a long-term terrestrial wireless broadband solution for the exploration, drilling, and production sectors of the energy industry in rural and remote locations in North America that lack existing communications infrastructure. We intend to continue to build upon our market position in the areas in which we operate by offering an integrated and comprehensive package of services that will allow us to provide our oil and gas customers with wellsite IT communications services required throughout their drilling locations. We intend to continue to supplement our wellsite communications business with our enterprise, commercial and residential bandwidth delivery to maximize the return from our investment in network infrastructure throughout the regions in which we operate.
Historically, our revenues have been generated primarily from Internet and construction services. Our Internet revenues result from our offering of broadband and basic communications services to residential and enterprise customers. Our construction revenues result from the construction of bank networks and other services associated with providing wireless products and services to the regional banking industry. During fiscal 2012,2013, approximately 31%34% of our revenues were generated from internet services, 64%60% of our revenues were generated from providing broadband services to the energy industry and 5%6% of our revenues were generated from construction services. We expect that the most growth during fiscal 20132014 will continue to come from devoting significant capital resources to developing the oil and gas market utilizing wireless services.
| 26 |
The Company's financial condition improved dramaticallydeclined in 20122013 as compared to the prior fiscal year ended December 31, 2011. Such improvements are highlighted2012, as follows:
| · | The Company reported revenues of |
| · | We reported gross profit of |
| · | The Company reported total comprehensive loss of |
| · | The Company's Energy Broadband, Inc. subsidiary reported revenues of |
| · | The Company reported an increase of |
| · | Lastly, the Company invested |
Critical Accounting Policies
Revenue Recognition
Our revenue is generated primarily from the sale of wireless communications products and services on a nationwide basis, including providing enterprise-class wireless broadband services. We recognize revenue when persuasive evidence of an arrangement exists, delivery has occurred, the sales price is fixed or determinable, and collectibility is probable.
We record revenues from itsour fixed-price, long-term contracts using the percentage-of-completion method. Revenues are recorded based on construction costs incurred to date as a percentage of estimated total cost at completion. The percentage-of-completion, determined by using total costs incurred to date as a percentage of estimated total costs at completion, reflects the actual physical completion of the project. If the current projected costs on a fixed fee contract exceed projected revenue, the entire amount of the loss is recognized in the period such loss is identified.
We recognize product sales generally at the time the product is shipped. Concurrent with the recognition of revenue, we provide for the estimated cost of product warranties and reduce revenue for estimated product returns. Sales incentives are generally classified as a reduction of revenue and are recognized at the later of when revenue is recognized or when the incentive is offered. Shipping and handling costs are included in cost of goods sold.
Service revenue is principally derived from wireless broadband services, including internet,Internet, voice, and data and monitoring service. Subscriber fees are recorded as revenues in the period during which the service is provided.
Property and Equipment
Property and equipment are stated at cost less accumulated depreciation. Major renewals and improvements are capitalized; minor replacements, maintenance and repairs are charged to current operations. Depreciation is computed by applying the straight-line method over the estimated useful lives which are generally three to seven years.
Long-Lived Assets
We review our long-lived assets, to include intangible assets subject to amortization, for recoverability whenever events or changes in circumstances indicate that the carrying amount of such long-lived asset or group of long-lived assets (collectively referred to as "the asset") may not be recoverable. Such circumstances include, but are not limited to:
| · | a significant decrease in the market price of the asset; |
| · | a significant change in the extent or manner in which the asset is being used; |
| · | a significant change in the business climate that could affect the value of the asset; |
| · | a current period loss combined with projection of continuing loss associated with use of the asset; and |
| · | a current expectation that, more likely than not, the asset will be sold or otherwise disposed of before the end of its previously estimated useful life. |
We continually evaluate whether such events and circumstances have occurred. When such events or circumstances exist, the recoverability of the asset's carrying value shall be determined by estimating the undiscounted future cash flows (cash inflows less associated cash outflows) that are directly associated with and that are expected to arise as a direct result of the use and eventual disposition of the asset. To date, no such impairment has occurred. To the extent such events or circumstances occur that could affect the recoverability of our long-lived assets, we may incur charges for impairment in the future.
| 27 |
Derivative Instruments
In connection with the sale of debt or equity instruments, we may sell options or warrants to purchase our common stock. In certain circumstances, these options or warrants may be classified as derivative liabilities, rather than as equity. Additionally, the debt or equity instruments may contain embedded derivative instruments, such as embedded derivative features which in certain circumstances may be required to be bifurcated from the associated host instrument and accounted for separately as a derivative instrument liability.
Our derivative instrument liabilities are re-valued at the end of each reporting period, with changes in the fair value of the derivative liability recorded as charges or credits to income in the period in which the changes occur. For options, warrants and bifurcated embedded derivative features that are accounted for as derivative instrument liabilities, we estimate fair value using either quoted market prices of financial instruments with similar characteristics or other valuation techniques. The valuation techniques require assumptions related to the remaining term of the instruments and risk-free rates of return, our current common stock price and expected dividend yield, and the expected volatility of our common stock price over the life of the option. Because of the limited trading history for our common stock, we estimate the future volatility of our common stock price based on not only the history of our stock price but also the experience of other entities considered comparable to us.
Recent Accounting Pronouncements
Management does not anticipate that the recently issued but not yet effective accounting pronouncements will materially impact our financial condition. Additionally, the Company made significant progress with its strategic business plan in 2012 as evidenced by the completion and announcement of numerous agreements and business developments. These include:
Results of Operations
Year Ended December 31, 2012,2013, Compared to Year Ended December 31, 20112012
The following table sets forth summarized consolidated financial information for the years ended December 31, 20122013 and 2011:2012:
| Fiscal Year Ended December 31, | ||||||||||||||||||||||||||||||||
| Fiscal Year Ended December 31, | ||||||||||||||||||||||||||||||||
| ($ in thousands) | 2012 | 2011 | $ Change | % Change | 2013 | 2012 | $ Change | % Change | ||||||||||||||||||||||||
| Total sales | $ | 7,328 | $ | 5,320 | $ | 2,008 | 38% | $ | 7,156 | $ | 7,328 | $ | (172 | ) | -2% | |||||||||||||||||
| Cost of goods sold | 3,975 | 3,502 | 473 | 14% | ||||||||||||||||||||||||||||
| Total Cost of goods sold | 4,159 | 3,975 | 184 | 5% | ||||||||||||||||||||||||||||
| Gross profit | 3,353 | 1,818 | 1,535 | 84% | 2,997 | 3,353 | (356 | ) | -11% | |||||||||||||||||||||||
| Percent of total sales | 46% | 34% | 42% | 46% | ||||||||||||||||||||||||||||
| Total operating expenses | 6,957 | 5,518 | 1,439 | 26% | 7,515 | 6,957 | 558 | 8% | ||||||||||||||||||||||||
| Loss from operations | (3,604 | ) | (3,700 | ) | 96 | -3% | (4,518 | ) | (3,604 | ) | (914 | ) | 25% | |||||||||||||||||||
| Total other income/(expense) | (1,189 | ) | 399 | (1,588 | ) | -398% | (2,742 | ) | (1,189 | ) | (1,553 | ) | 131% | |||||||||||||||||||
| Loss from continuing operations | (4,793 | ) | (3,301 | ) | (1,492 | ) | -45% | |||||||||||||||||||||||||
| Loss from discontinued operations | – | (78 | ) | 78 | 100% | |||||||||||||||||||||||||||
| Net income attributable to non-controlling interest | (21 | ) | – | (21 | ) | 100% | ||||||||||||||||||||||||||
| Consolidated net loss | (7,260 | ) | (4,793 | ) | (2,467 | ) | 51% | |||||||||||||||||||||||||
| Net loss attributable to non-controlling interest | (4 | ) | (21 | ) | 17 | -81% | ||||||||||||||||||||||||||
| Other comprehensive loss | (7 | ) | (25 | ) | 18 | -100% | – | (7 | ) | 7 | -100% | |||||||||||||||||||||
| Total comprehensive loss | $ | (4,821 | ) | $ | (3,404 | ) | $ | (1,417 | ) | 42% | $ | (7,264 | ) | $ | (4,821 | ) | $ | (2,443 | ) | 51% | ||||||||||||
For the year ended December 31, 2012,2013, the Company's business operations reflected an increase in sales for its EBI, WBS and WMSENS subsidiaries that wereand offset by a decrease sales in sales by the ENSEBI subsidiary. For the year ended December 31, 2012,2013, the Company's consolidated operations generated net sales of $7,328,000$7,156,000 compared to prior-year period net sales of $5,320,000 for the year ended December 31, 2011.$7,328,000. The $2,008,000 increase$172,000 decrease in nettotal sales is primarily attributable to $1,929,000 increased$331,000 decreased sales in EBI from declining deployment of our MBT’sMobile Broadband Trailers (MBT’s) in the oil and gas regions. ServicesService sales increased $2,151,000decreased $160,000 and product sales decreased $143,000$12,000 for a total increasenet decrease of $2,008,000, the sales increase is primarily attributable to EBI’s deployment of MBT’s in the oil and gas regions.$172,000. For the year ended December 31, 2012,2013, the Company had a gross profit margin of 46%42%, compared to a gross profit margin of 34%46% for the prior year.year period. The $1,535,000 increase$356,000 decrease in gross profit margin is primarily attributed to; (i) approximately $1,138,000 increase$171,000 decrease in gross margin in EBI attributable to increaseddecreased sales associated with deployment of MBT’s in the oil and gas regions, (ii) $391,000 increase$150,000 decrease in gross margins in WBS primarily relateddue to decrease third party serviceincreased depreciation and depreciationtower rent cost, and (iii) $18,000 increase$35,000 decrease in gross margin in ENS primarily related to decrease in material and supplies cost and (iv) offset with $12,000 decrease in gross margins in WMS due to increase third party cost.tower rent.
| 28 |
Sales Information
Set forth below is a table presenting summarized sales information for our business segments for the years ended December 31, 20122013 and 2011:2012:
| ($ in thousands) | Fiscal Year Ended December 31, | Fiscal Year Ended December 31, | ||||||||||||||||||||||||||||||||||||||||||||||
| Business Segment | 2012 | % of Total | 2011 | % of Total | $ Change | % Change | 2013 | % of Total | 2012 | % of Total | $ Change | % Change | ||||||||||||||||||||||||||||||||||||
| Energy Broadband, Inc. | $ | 4,642 | 64% | $ | 2,713 | 51% | $ | 1,929 | 71% | $ | 4,311 | 60% | $ | 4,642 | 63% | $ | (331 | ) | -7% | |||||||||||||||||||||||||||||
| Wireless Bundled Services | 2,283 | 31% | 2,178 | 41% | 105 | 5% | 2,441 | 34% | 2,306 | 32% | 135 | 6% | ||||||||||||||||||||||||||||||||||||
| Enterprise Network Services | 380 | 5% | 407 | 8% | (27 | ) | -7% | 404 | 6% | 380 | 5% | 24 | 6% | |||||||||||||||||||||||||||||||||||
| Wireless Messaging Services | 23 | 0% | 22 | 0% | 1 | 5% | ||||||||||||||||||||||||||||||||||||||||||
| Total Sales | $ | 7,328 | 100% | $ | 5,320 | 100% | $ | 2,008 | 38% | $ | 7,156 | 100% | $ | 7,328 | 100% | $ | (172 | ) | -2% | |||||||||||||||||||||||||||||
For the year ended December 31, 2012,2013, net sales increaseddecreased to $7,328,000$7,156,000 from $5,320,000$7,328,000 for the year ended December 31, 2011.2012. The overall increasedecrease of 38%2% was attributable to an increasedecreased sales of $1,929,000$331,000 in EBI offset by increased sales of $105,000$135,000 in WBS and increased sales in WMS of $1,000, offset with decreased sales in ENS of $27,000.$24,000. The $2,008,000 increase$172,000 decrease in net sales is primarily attributable to $1,929,000 increased$331,000 decreased sales in EBI from declining deployment of our MBT’s in the oil and gas regions.regions, offset by $135,000 increased sales in recurring retail wireless services.
Cost of Goods Sold
The following tables set forth summarized cost of goods sold information for the years ended December 31, 20122013 and 2011: 2012:
| ($ in thousands) | Fiscal Year Ended December 31, | |||||||||||||||||||||||
| Business Segment | 2012 | % of Total | 2011 | % of Total | $ Change | % Change | ||||||||||||||||||
| Energy Broadband, Inc. | $ | 2,460 | 62% | $ | 1,669 | 48% | $ | 791 | 47% | |||||||||||||||
| Wireless Bundled Services | 1,108 | 28% | 1,394 | 40% | (286 | ) | -21% | |||||||||||||||||
| Enterprise Network Services | 383 | 9% | 428 | 12% | (45 | ) | -11% | |||||||||||||||||
| Wireless Messaging Services | 24 | 1% | 11 | 0% | 13 | 118% | ||||||||||||||||||
| Total cost of sales | $ | 3,975 | 100% | $ | 3,502 | 100% | $ | 473 | 14% | |||||||||||||||
| ($ in thousands) | Fiscal Year Ended December 31, | |||||||||||||||||||||||
| Business Segment | 2013 | % of Total | 2012 | % of Total | $ Change | % Change | ||||||||||||||||||
| Energy Broadband, Inc. | $ | 2,299 | 55% | $ | 2,460 | 62% | $ | (161 | ) | -7% | ||||||||||||||
| Wireless Bundled Services | 1,418 | 34% | 1,132 | 28% | 286 | 25% | ||||||||||||||||||
| Enterprise Network Services | 442 | 11% | 383 | 10% | 59 | 15% | ||||||||||||||||||
| Total cost of sales | $ | 4,159 | 100% | $ | 3,975 | 100% | $ | 184 | 5% | |||||||||||||||
| Fiscal Year Ended December 31, | ||||||||||||||||
| ($ in thousands) | 2012 | 2011 | $ Change | % Change | ||||||||||||
| Products and integration service | $ | 1,846 | $ | 1,664 | $ | 182 | 11% | |||||||||
| Rent and maintenance | 700 | 441 | 259 | 59% | ||||||||||||
| Depreciation | 1,429 | 1,397 | 32 | 2% | ||||||||||||
| Total cost of sales | $ | 3,975 | $ | 3,502 | $ | 473 | 14% | |||||||||
| Fiscal Year Ended December 31, | ||||||||||||||||
| ($ in thousands) | 2013 | 2012 | $ Change | % Change | ||||||||||||
| Products and integration service | $ | 1,571 | $ | 1,846 | $ | (275 | ) | -15% | ||||||||
| Rent and maintenance | 853 | 700 | 153 | 22% | ||||||||||||
| Depreciation | 1,735 | 1,429 | 306 | 21% | ||||||||||||
| Total cost of sales | $ | 4,159 | $ | 3,975 | $ | 184 | 5% | |||||||||
For the year ended December 31, 2012,2013, cost of goods sold increased by $473,000,$184,000, or 14%,5% to $3,975,000$4,159,000 from $3,502,000$3,975,000 as compared to the year ended December 31, 2011.2012. The increase of $473,000$184,000 in cost of goods sold is primarily attributable to an increase ofa decreased cost of $791,000$161,000 in EBI due to increased depreciation,decreased sales affecting a reduction in our third party services and tower rents for deployment of MBT’s in the oil and gas regions, offset by increased cost in WMS of $13,000 offset with decreased costs in WBS of $286,000 due to decreasing third party cost andincreased depreciation and decreased coststower rents for expansion and upgrade of networks and increased cost in ENS of $45,000.$59,000 due to banking network construction project.
OperationsOperating Expenses
The following table sets forth summarized operating expense information for the years ended December 31, 20122013 and 2011:2012:
| Fiscal Year Ended December 31, | Fiscal Year Ended December 31, | |||||||||||||||||||||||||||||||
| ($ in thousands) | 2012 | 2011 | $ Change | % Change | 2013 | 2012 | $ Change | % Change | ||||||||||||||||||||||||
| Employment expenses | $ | 3,887 | $ | 2,949 | $ | 938 | 32% | $ | 4,197 | $ | 3,887 | $ | 310 | 8% | ||||||||||||||||||
| Professional services | 1,457 | 1,103 | 354 | 32% | 1,604 | 1,457 | 147 | 10% | ||||||||||||||||||||||||
| Rent and maintenance | 437 | 346 | 91 | 26% | 458 | 437 | 21 | 5% | ||||||||||||||||||||||||
| Depreciation and amortization | 214 | 246 | (32 | ) | -13% | |||||||||||||||||||||||||||
| Depreciation | 200 | 214 | (14 | ) | -7% | |||||||||||||||||||||||||||
| Other general and administrative | 962 | 874 | 88 | 10% | 1,056 | 962 | 94 | 10% | ||||||||||||||||||||||||
| Total operating expenses | $ | 6,957 | $ | 5,518 | $ | 1,439 | 26% | $ | 7,515 | $ | 6,957 | $ | 558 | 8% | ||||||||||||||||||
For the year ended December 31, 2012,2013, operating expenses increased by 26%8% to $6,957,000,$7,515,000, as compared to $5,518,000$6,957,000 for the year ended December 31, 2011. The2012, resulting from the changes that occurred, as evidenced by the immediately preceding table, are discussed below:
| · | A |
| · | A |
| · | A |
| · | A |
| · | A |
Other (Income) Expense, Net
For the year ended December 31, 2012, the2013, total other expense, net increased to $2,742,000 from $1,189,000 as compared to year ended December 31, 2012. The increase in total other expense of $1,588,000$1,553,000 from the prior year period is primarily attributable to an increase in our interest expense, net on debt obligations totaling $1,524,000$2,000,000 and offset withby an increase in our net derivative income of $335,000$380,000 and gain on sale of assets of $67,000 as compared to interest expense, net of 817,000$1,524,000 and offset withby derivative income of $33,000 and a gain on sale of assets of $1,183,000$335,000 for the year ended December 31, 2011.2012. The derivative expenseexpense/income represents the net unrealized (non-cash) charge during the yearsyear ended December 31, 20122013 and 2011,2012, in the fair value of our derivative instrument liabilities related to warrants and embedded derivatives in our debt instruments that have been bifurcated and accounted for separately.
COMPREHENSIVE LOSS
For the year ended December 31, 2012,2013, our total comprehensive loss was $4,821,000$7,264,000 compared to comprehensive loss of $3,404,000$4,821,000 for the year ended December 31, 2011.2012. The increased comprehensive loss for the year ended December 31, 20122013 as compared to the comprehensive loss for the year ended December 31, 20112012 is primarily attributable to the factors described above.
Cash Flows
The Company's operating activities decreasedincreased net cash used by operating activities to $2,550,000 in the year ended December 31, 2013, compared to net cash used of $1,439,000 in the year ended December 31, 2012, compared to net cash used of $2,822,000 in the year ended December 31, 2011.2012. The decreaseincrease in net cash used by operating activities was primarily attributable to increases in the Company’s net loss, accounts payable, accrued and derivative liabilities compared to the prior year.
The Company's investing activities used net cash of $312,000 in the year ended December 31, 2013, compared to net cash used of $1,427,000 in the year ended December 31, 2012, compared to net cash provided of $566,000 in the year ended December 31, 2011.2012. The decrease in cash providedused by investing activities is primarily attributable to the expansiona slower rollout of targeted oil and gas networks to utilize our MBTs to provide service to our customers and the cash received from the sale of non-core assets of our North and Central Texas network during February 2011 in the amount of $2,700,000 and of gain on sale assets of $7,000 during 2011.upgrades.
The Company's financing activities provided net cash of $2,393,000$2,786,000 in the year ended December 31, 2012,2013, compared to $2,804,000$2,393,000 of cash provided in year ended December 31, 2011.2012. The cash provided in the year ended December 31, 2012,2013, was primarily associated with proceeds from debt financing of $3,116,000 and the line of credit, net.net of 1,148,000.
Liquidity and Capital Resources
General
At December 31, 2012,2013, the Company's current assets totaled $1,925,000$2,082,000 (including cash and cash equivalents of $118,000)$42,000) total current liabilities were $4,385,000,$6,582,000, resulting in negative working capital of $2,460,000.$4,500,000. The Company has funded operations to date primarily through a combination of utilizing cash on hand and borrowings. The Company’s operations for the year ended December 31, 2012,2013, were primarily funded by the Company's line of credit, net totaling $823,000, debt of $1,481,000$1,148,000 and convertible debt financing of $1,193,000.$3,116,000.
Current Debt Facilities and Instruments
DuringIn December 2012,2013, the Company extended itsthe maturity date of its $12.0 million unsecured revolving credit facility with Angus Capital Partners, a related party, maturing from December 31, 20132015 to December 30, 2015. At December 31, 2012, the Company had an outstanding principal balance of $3,168,000 on this line of credit. The remaining balance available on the revolving credit facility was approximately $8,832,000 at December 31, 2012.2017. The terms of the unsecured revolving credit facility will allow usthe Company to draw upon the facility as financing requirements dictate and providesprovide for quarterly interest payments on outstandingat a 3% rate per annum. The payment of principal may be paid in cash, common shares or preferred shares at an annual ratethe lender’s election. The payment of 12% per annum.interest may only be paid in cash. The loan may be prepaid without penalty or repaid at maturity. DuringAt December 31, 2013 the outstanding balance on the line of credit totaled $4,281,000. The remaining line of credit available at December 31, 2013 was $7,719,000.
| 30 |
For the year ended December 31, 2012,2013, the Company issued 2,222,19836,784 shares of its Common Stockcommon stock for the settlement of $2,589,000$1,808,739 of principal and $349,261 of accrued interest for a total principal and interest amount of $2,158,000 owed to Angus Capital Partners. The Company issued Common Stockcommon stock at an average price of $1.17$58.67 per share calculated based on the closing price the day the debt was settled. At December 31, 2013, Angus Capital Partners and ERF Wireless, Inc. both agreed to reduce the interest rate from the current 12% per annum to 3% per annum retroactive to January 1, 2013 and extend the maturity date of the revolving note to December 31, 2017, while maintaining the maximum Line of Credit of $12 million. The Company in consideration has accepted the return and cancellation of 36,784 common shares (post-split) of Company common stock issued for the Line of Credit conversions during 2013. The Company has accordingly reversed the payment of principal and interest of $2,158,000 in December 2013 and subsequently received the canceled shares in February 2014. Additionally duringfor the year ended December 31, 2012,2013, the Company issued 118,0951,763,000 shares of its Series A Preferred Stock to Angus Capital for the settlement of principal amount of $124,000 owed to Angus Capital Partners$35,260 of debt. The Company issued Series Preferred A Stock at an average price of $1.05$.02 per share or $8.00 (post-split) per share calculated based on the closing price of the Common Stockcommon stock the day the debt was settled.
In November 2011, we entered into a debt financing agreement with Dakota Capital Fund LLC for financing of up to $3,000,000. During the fourth quarter of 2011, the Company received proceeds of $2,000,000 and had the option of additional funding of $1,000,000 for equipment purchases. This debt facility is secured by certain ERF Wireless assets and there is no prepayment penalty. At December 31, 2012,2013, the outstanding principal balance on the facility totaled $1,763,000$1,494,000 and we have elected not to request any additional funds under this credit facility. The payment terms are $178,031 per quarter including interest, at an annual rate of 18% per annum plus 10% of positive operational cash flow as determined on a quarterly basis for repayment of additional principal beginning July 1, 2012. The funding was utilized to purchase equipment to build out networks in major oil and gas exploration regions of North America.
Between July 2011 andDuring the year ended December 2012,31, 2013, we issued to certain accredited investors a principal amount of $1,193,000$325,000 of E-Series bonds (the "Bonds") in addition to the $30,000 which. A balance of $687,000 was outstanding at December 31, 2011.2012. At December 31, 2012,2013, the outstanding principal balance of the Bonds totaled $687,000.$311,000. The Bonds are due and payable upon maturity, a three-year period from the issuance date. Interest on the Bonds is payable at the rate of 7.5% per annum, and is payable semiannually. The Bondholder may require the Company to convert the Bond (including any unpaid interest) into shares of Common Stockcommon stock at any time only during the first year. If the Bonds are converted under this option, the Company will issue shares representing 100% of the Bond principal and unpaid interest calculated through maturity. The Common Stockcommon stock issued under this option will be valued at the average closing price average of the Common Stockcommon shares for the five days prior to the notification. If the Bond is converted within the first year the Company will issue a three yearthree-year warrant expiring December 31, 2014, to purchase one share of EBI common stock at a price of $4.00 for every $2.00 of Bond principal.
At our Company's discretion at any time after the first year, the Bonds, including the interest payments calculated through the date of conversion may be redeemed in cash or in shares of our Common Stock,common stock, valued at the average last sales price over the 20-trading-day period preceding any payment date. If we choose to issue Common Stockcommon stock as redemption of the Bond principal, we will issue shares representing a value equal to 125% of the Bond principal and shares representing a value equal to 100% of the Bond interest through redemption date. During the fiscal year ended December 31, 2012,2013, we did not redeem any Bonds.
On July 13, 2012, the Company entered into a $1,000,000three-month secured debt financing agreement that matures on January 1, 2013, bearingwith individuals for $1,000,000 with an interest at the annual rate of 12% per annum. Under a subsequent modified agreement dated January 2014, as amended, the maturity date has been extended to April 15, 2014. Both parties under the amendment agreed to apply the Dakota Capital Fund payment of $181,235 including interest as a subset to the bridge note. The Company has also renegotiated the subset interest rate from .5% interest per day on a 360 day calendar year to 12% rate per annum retroactive to March 23, 2013. The Company in consideration has accepted the return and cancellation of 796 common shares (post-split) of Company common stock issued during the third quarter of 2013 for interest. The Company also agreed to additional consideration of 5,000 of preferred A shares to be issued as long as the note remains unpaid and a $50,000 penalty to be added to principal in January 2014 for the consideration of the extension of the note. The Company has accordingly reversed the payment of interest of $159,259 in December 2013. At December 31, 2012,2013, the outstanding principal balance totaled $473,000.
On March 5, 2013, the Company entered into a six-month secured convertible promissory note debt financing agreement with Tonaquint, Inc. (“holder”), for $791,500, bearing interest at a rate of 12% per annum and maturing September 5, 2013. At December 31, 2013, the outstanding principal balance of the Tonaquint convertible promissory note totaled $793,000. The note includes an original issue discount (“OID”) of $65,000 based on the lineconsideration funded, prepaid interest of credit$71,500 and $5,000 in legal and other expense. The Company also paid holder an origination fee in the amount of $227,500 in 144 Stock (711 post-split shares) at the closing bid price on March 5, 2013, plus 125 post-split shares (valued at $40,000) of the Company’s common stock. The holder may require the Company to convert the outstanding principal balance (including any unpaid interest) into shares of restricted common stock at any time after the six-month term of the note. The common stock issued will be valued using a conversion factor of 80% of the average of the lowest two (2) trading prices for common shares during the twenty (20) trading day period ending on the latest complete trading day prior to the conversion date. If the average two (2) lowest trading prices is less than $0.33, then the conversion factor will be reduced to 70%. The holder received the option to purchase five-year warrants expiring March 5, 2018 to purchase 371 shares of ERF common stock at an exercise price of $320.00 or the per-share price at which the common stock is sold in an underwritten public offering that closes on or before the date that is six (6) months from the issue date, as may be adjusted from time to time pursuant to the terms and conditions of this warrant. The Company is not in compliance with all the provisions of the note causing an automatic acceleration of the outstanding balance of $791,500 to $949,800. The note will accrue interest at a rate of 12% from September 5, 2013 until the March 4, 2014 and thereafter at a rate of 18% per annum. The note is recorded as a current liability and has been reduced subsequently by a payment of $49,000.
| 31 |
On March 20, 2013, the Company entered into a one year unsecured promissory note debt financing agreement with JMJ Financial for (“JMJ”) up to $500,000 at the sole discretion of additional consideration with the Lender. The note includes a 10% original issue discount that is prorated based on the consideration funded. The Company also paid holder an origination fee in the amount of $40,500 in restricted Stock (125 post-split shares) at the closing bid price of the Company’s common stock. As of December 31, 2013 the Company has received funding of $300,000, bearing interest at a rate of 12% per annum and maturing in one year from the effective date of each payment. At December 31, 2013, the outstanding principal balance of the JMJ Financial convertible promissory note totaled $765,000.$232,000 including OID. The conversion price is the lesser of $0.59 or 60% of the lowest trade price in the 25 trading days previous to the conversion. The note is recorded as a current liability and has been reduced subsequently by a payment of $51,000.
On April 2, 2013, the Company entered into a nine month secured convertible promissory note debt financing agreement with Willow Creek Capital, LLC, for $244,200, bearing interest at a rate of 12% per annum and maturing October 1, 2013. The note also includes a 10% OID of $20,000 based on the consideration funded, prepaid interest of $22,200 and $2,000 in legal and other expense. The Company also paid holder an origination fee in the amount of $109,890 in 144 Stock (366 post-split shares) at the closing bid price of the Company’s common stock. The holder may require the Company to convert the outstanding principal balance (including any unpaid interest) into shares of restricted common stock at any time after the six months term of the note. The common stock issued will be valued using a conversion factor of 80% the average of the lowest two (2) trading prices common shares during the twenty (20) trading day period ending on the latest complete trading day prior to the conversion date. If the average two (2) lowest trading prices is less than $0.33, then the conversion factor will be reduced to 70%. The holder will be entitled to purchase from the Company five year warrants expiring April 2, 2018 to purchase 122 post-split shares of ERF common stock at an exercise price of $300.00 or the per-share price at which the common stock is sold in an underwritten public offering that closes on or before the date that is six (6) months from the issue date, as may be adjusted from time to time pursuant to the terms and conditions of this Warrant. The note is recorded as a current liability and has been reduced subsequently by a payment of $31,000.
On April 4, 2013, the Company entered into a six month convertible promissory note secured debt financing agreement with Vista Capital Investments, LLC, for $60,500, bearing interest at a rate of 12% per annum and maturing October 4, 2013. The note also includes a 10% OID of $5,000 based on the consideration funded and prepaid interest of $5,500. The Company also paid holder an origination fee in the amount of $21,175 in 144 Stock (84 post-split shares) at the closing bid price of the Company’s common stock. The holder may require the Company to convert the outstanding principal balance (including any unpaid interest) into shares of restricted common stock at any time after the six months term of the note. The common stock issued will be valued using a conversion factor of 80% the average of the lowest two (2) trading prices common shares during the twenty (20) trading day period ending on the latest complete trading day prior to the conversion date. If the average two (2) lowest trading prices is less than $0.33, then the conversion factor will be reduced to 70%. The holder will be entitled to purchase from the Company five year warrants expiring April 4, 2018 to purchase 36 post-split shares of ERF common stock at an exercise price of $320.00 or the per-share price at which the common stock is sold in an underwritten public offering that closes on or before the date that is six (6) months from the issue date, as may be adjusted from time to time pursuant to the terms and conditions of this Warrant.
On June 28, 2013, the Company entered into a twelve month convertible promissory note secured debt financing agreement with TCA Global Credit Master Fund for $1,500,000, bearing interest at a rate of 12% per annum and maturing July 28, 2014. At December 31, 2013, the outstanding principal balance of the TCA Global convertible promissory note totaled $1,019,000. The note also includes $153,300 in commitment fees; due diligence fees; document review fees; service fees; legal; and other expense. The holder may require the Company to convert the outstanding principal balance (including any unpaid interest) into shares of restricted common stock at any time during the twelve months term of the note or thereafter. The common stock issued will be valued using a conversion factor of 85% the average VWAP trading price during the five (5) trading day period ending on the latest complete trading day prior to the conversion date.
| 32 |
On October 3, 2013, the Company entered into a twelve month convertible promissory note unsecured debt financing agreement with Group 10 Holdings, LLC, for $157,500, bearing interest at a rate of 12% per annum and maturing October 2, 2014. The note also includes a 5% OID of $7,500 based on the consideration funded. The Company also paid holder a commitment fee in the amount of $45,000 in 144 Stock (1,125 post-split shares) at the closing bid price of the Company’s common stock. The holder may require the Company to convert the outstanding principal balance (including any unpaid interest) into shares of restricted common stock at any time after the twelve months term of the note. The common stock issued will be valued using a conversion factor of 55% multiplied by the lowest closing bid price of the (20) trading days prior to the conversions, which represents a discount rate of 45%.
Issuance of Common Stock and Preferred Stock
During the year ended December 31, 2012,2013, we issued to various accredited investors (i) 2,788,23598,000 shares for services rendered and debt conversions, and (ii) 270,00010,000 shares upon conversion of Series A Preferred Stock. We relied on Section 4(2) of the Securities Act in effecting these transactions.During the year ended December 31, 2012, we issued 267,841 shares of common stock to employees and business consultants, for aggregate consideration of $365,617 of services rendered, pursuant to a registration statement on Form S-8.
Use of Working Capital
We believe our cash and available credit facilities afford us adequate liquidity for the balance of fiscal 2013.2014. We anticipate that we will need additional capital in the future to continue to expand our business operations. We have historically financed our operations through private equity and debt financings. We do not have any commitments for equity or debt funding at this time, and additional funding may not be available to us on favorable terms, if at all. As such there is no assurance that we can raise additional capital from external sources, the failure of which could cause us to curtail operations.
Contractual Obligations
The following table sets forth contractual obligations as of December 31, 2012:2013:
| Payments Due by Period | ||||||||||||||||||||
| Total | Less than 1 Year | 1-3 Years | 3-5 Years | More than 5 Years | ||||||||||||||||
| Contractual obligations: | ||||||||||||||||||||
| Long-term debt obligations | $ | 7,469 | $ | 2,161 | $ | 4,952 | $ | 356 | $ | – | ||||||||||
| Capital lease obligations | 435 | 206 | 229 | – | – | |||||||||||||||
| Operating lease obligations | 1,679 | 478 | 808 | 393 | – | |||||||||||||||
| Total contractual obligations | $ | 9,583 | $ | 2,845 | $ | 5,989 | $ | 749 | $ | – | ||||||||||
| Payments Due by Period | ||||||||||||||||||||
| Total | Less than 1 Year | 1-3 Years | 3-5 Years | More than 5 Years | ||||||||||||||||
| Contractual obligations: | ||||||||||||||||||||
| Long-term debt obligations | $ | 9,960 | $ | 4,233 | $ | 1,330 | $ | 4,397 | $ | – | ||||||||||
| Capital lease obligations | 557 | 335 | 222 | – | – | |||||||||||||||
| Operating lease obligations | 2,221 | 780 | 1,316 | 125 | – | |||||||||||||||
| Total contractual obligations | $ | 12,738 | $ | 5,348 | $ | 2,868 | $ | 4,522 | $ | – | ||||||||||
The Company's contractual obligations consist of long-term debt of $5,977,000$8,914,000 net of unamortized discount of $623,000,$628,000, and interest expense of $1,492,000$1,046,000 as set forth in Note 1211 to the Company's financial statements, Notes Payable and Long-Term Debt. The capital lease obligations consist of $383,000$426,000 and interest expense of $52,000$131,000 as set forth in Note 1211 in the future minimum lease payments schedule and certain obligations for operating leases requiring future minimal commitments under non-cancelable leases set forth in Note 1312 - Commitments.
Off-Balance Sheet Arrangements
As of December 31, 2012,2013, the Company did not have any significant off-balance-sheet arrangements other than certain office and tower facility operating leases requiring minimal commitments under non-cancelable leases disclosed in the table above.
Critical Accounting Policies and Estimates
Property and Equipment
Property and equipment are stated at cost less accumulated depreciation. Major renewals and improvements are capitalized; minor replacements, maintenance and repairs are charged to current operations. Depreciation is computed by applying the straight-line method over the estimated useful lives which are generally three to seven years.
| 33 |
Long-Lived Assets
We review our long-lived assets, to include intangible assets subject to amortization, for recoverability whenever events or changes in circumstances indicate that the carrying amount of such long-lived asset or group of long-lived assets (collectively referred to as "the asset") may not be recoverable. Such circumstances include, but are not limited to:
| · | a significant decrease in the market price of the asset; |
| · | a significant change in the extent or manner in which the asset is being used; |
| · | a significant change in the business climate that could affect the value of the asset; |
| · | a current period loss combined with projection of continuing loss associated with use of the asset; |
| · | a current expectation that, more likely than not, the asset will be sold or otherwise disposed of before the end of its previously estimated useful life; |
We continually evaluate whether such events and circumstances have occurred. When such events or circumstances exist, the recoverability of the asset's carrying value shall be determined by estimating the undiscounted future cash flows (cash inflows less associated cash outflows) that are directly associated with and that are expected to arise as a direct result of the use and eventual disposition of the asset. To date, no such impairment has occurred. To the extent such events or circumstances occur that could affect the recoverability of our long-lived assets, we may incur charges for impairment in the future.
Derivative Instruments
In connection with the sale of debt or equity instruments, the Company may sell options or warrants to purchase our common stock. In certain circumstances, these options or warrants may be classified as derivative liabilities, rather than as equity. Additionally, the debt or equity instruments may contain embedded derivative instruments, such as embedded derivative features which in certain circumstances may be required to be bifurcated from the associated host instrument and accounted for separately as a derivative instrument liability.
The Company's derivative instrument liabilities are re-valued at the end of each reporting period, with changes in the fair value of the derivative liability recorded as charges or credits to income in the period in which the changes occur. For options, warrants and bifurcated embedded derivative features that are accounted for as derivative instrument liabilities, the Company estimates fair value using either quoted market prices of financial instruments with similar characteristics or other valuation techniques. The valuation techniques require assumptions related to the remaining term of the instruments and risk-free rates of return, our current common stock price and expected dividend yield, and the expected volatility of our common stock price over the life of the option. Because of the limited trading history for our common stock, the Company estimates the future volatility of its common stock price based on not only the history of its stock price but also the experience of other entities considered comparable to the Company.
Recent Accounting Pronouncements
Management does not anticipate that the recently issued but not yet effective accounting pronouncements will materially impact the Company’s financial condition.
ITEM 7A. QUANTITATIVE AND QUALITATIVE DISCLOSURES ABOUT MARKET RISK.
Not applicable.
| 34 |
ITEM 8. FINANCIAL STATEMENTS
LBB & ASSOCIATES LTD., LLP
10260 Westheimer Road, Suite 310
Houston, TX 77042
Phone: (713) 800-4343 Fax: (713) 456-2408
Report of Independent Registered Public Accounting Firm
To the Board of Directors of
ERF Wireless, Inc.
League City, Texas
We have audited the accompanying consolidated balance sheets of ERF Wireless, Inc. (the “Company”) as of December 31, 20122013 and 2011,2012, and the related consolidated statements of operations, shareholders' deficit, and cash flows for the years then ended. These consolidated financial statements are the responsibility of the Company's management. Our responsibility is to express an opinion on these consolidated financial statements based on our audits.
We conducted our audits in accordance with the standards of the Public Company Accounting Oversight Board (United States). Those standards require that we plan and perform the audit to obtain reasonable assurance about whether the financial statements are free of material misstatement. The Company is not required to have, nor were we engaged to perform, an audit of its internal control over financial reporting. Our audits included consideration of internal control over financial reporting as a basis for designing audit procedures that are appropriate in the circumstances, but not for the purpose of expressing an opinion on the effectiveness of the Company’s internal control over financial reporting. Accordingly, we express no such opinion. An audit also includes examining, on a test basis, evidence supporting the amounts and disclosures in the financial statements, assessing the accounting principles used and significant estimates made by management, as well as evaluating the overall financial statement presentation. We believe that our audits provide a reasonable basis for our opinion.
In our opinion, the consolidated financial statements referred to above present fairly, in all material respects, the consolidated financial position of ERF Wireless, Inc. as of December 31, 20122013 and 2011,2012, and the results of its operations and its cash flows for the years then ended in conformity with accounting principles generally accepted in the United States of America.
/s/ LBB & Associates Ltd., LLP
LBB & Associates Ltd., LLP
Houston, Texas
March 21, 2013April 14, 2014
| 35 |
ERF WIRELESS, INC.
CONSOLIDATED BALANCE SHEETS
DECEMBER 31, 20122013 and 20112012
($ in thousands except share data)
| December 31, | December 31, | |||||||
| 2012 | 2011 | |||||||
| ASSETS | ||||||||
| Current assets | ||||||||
| Cash and cash equivalents | $ | 118 | $ | 591 | ||||
| Securities held for resale | – | 7 | ||||||
| Accounts receivable, net | 828 | 596 | ||||||
| Accounts receivable, other | 346 | 310 | ||||||
| Inventories | 377 | 358 | ||||||
| Costs and estimated earnings in excess of billings on uncompleted contracts | 35 | – | ||||||
| Prepaid expenses and other current assets | 221 | 285 | ||||||
| Total current assets | 1,925 | 2,147 | ||||||
| Property and equipment | ||||||||
| Property and equipment | 11,644 | 9,932 | ||||||
| Less: accumulated depreciation | (7,511 | ) | (5,868 | ) | ||||
| Net property and equipment | 4,133 | 4,064 | ||||||
| Goodwill | 176 | 176 | ||||||
| Other assets | 37 | 63 | ||||||
| Total assets | $ | 6,271 | $ | 6,450 | ||||
| LIABILITIES AND SHAREHOLDERS’ DEFICIT | ||||||||
| Current liabilities: | ||||||||
| Notes payable and current portion of long-term debt | $ | 1,358 | $ | 259 | ||||
| Current portion of long-term capital leases | 169 | 126 | ||||||
| Accounts payable | 1,226 | 694 | ||||||
| Accrued expenses | 1,120 | 661 | ||||||
| Derivative liabilities | 492 | 27 | ||||||
| Deferred revenue | 20 | 210 | ||||||
| Total current liabilities | 4,385 | 1,977 | ||||||
| Line of credit (LOC) | 3,168 | 4,592 | ||||||
| Long-term debt, net of current portion | 1,419 | 1,667 | ||||||
| Long-term capital leases, net of current portion | 214 | 305 | ||||||
| Total liabilities | 9,186 | 8,541 | ||||||
| Commitments | ||||||||
| Shareholders’ deficit: | ||||||||
| Preferred stock - $0.001 par value, 25,000,000 authorized | ||||||||
| Series A designated 10,000,000 shares issued and outstanding at December 31, 2012 and December 31, 2011, 8,426,982 and 8,578,887, respectively | 8 | 9 | ||||||
| Common stock - $0.001 par value | ||||||||
| Authorized 975,000,000 shares issued and outstanding at December 31, 2012 and December 31, 2011, 5,487,072 and 2,160,996, respectively | 6 | 2 | ||||||
| Additional paid in capital | 52,987 | 49,121 | ||||||
| Accumulated deficit | (56,012 | ) | (51,198 | ) | ||||
| Accumulated other comprehensive loss | (32 | ) | (25 | ) | ||||
| Total ERF wireless, Inc. shareholders’ deficit | (3,043 | ) | (2,091 | ) | ||||
| Non-controlling interest | 128 | – | ||||||
| Total shareholders’ deficit | (2,915 | ) | (2,091 | ) | ||||
| Total liabilities and shareholders' deficit | $ | 6,271 | $ | 6,450 | ||||
| December 31, | December 31, | |||||||
| 2013 | 2012 | |||||||
| ASSETS | ||||||||
| Current assets | ||||||||
| Cash and cash equivalents | $ | 42 | $ | 118 | ||||
| Accounts receivable, net | 1,001 | 828 | ||||||
| Accounts receivable, other | 489 | 346 | ||||||
| Inventories | 264 | 377 | ||||||
| Costs and estimated earnings in excess of billings on uncompleted contracts | – | 35 | ||||||
| Prepaid expenses and other current assets | 286 | 221 | ||||||
| Total current assets | 2,082 | 1,925 | ||||||
| Property and equipment | ||||||||
| Property and equipment | 12,142 | 11,644 | ||||||
| Less: accumulated depreciation | (9,365 | ) | (7,511 | ) | ||||
| Net property and equipment | 2,777 | 4,133 | ||||||
| Goodwill | 176 | 176 | ||||||
| Other assets | 37 | 37 | ||||||
| Total assets | $ | 5,072 | $ | 6,271 | ||||
| LIABILITIES AND SHAREHOLDERS’ DEFICIT | ||||||||
| Current liabilities: | ||||||||
| Notes payable and current portion of long-term debt | $ | 3,183 | $ | 1,358 | ||||
| Current portion of long-term capital leases | 252 | 169 | ||||||
| Accounts payable | 1,299 | 1,226 | ||||||
| Accrued expenses | 1,158 | 1,120 | ||||||
| Derivative liabilities | 677 | 492 | ||||||
| Deferred revenue | 13 | 20 | ||||||
| Total current liabilities | 6,582 | 4,385 | ||||||
| Line of credit (LOC) | 4,281 | 3,168 | ||||||
| Long-term debt, net of current portion | 1,024 | 1,419 | ||||||
| Long-term capital leases, net of current portion | 174 | 214 | ||||||
| Total liabilities | 12,061 | 9,186 | ||||||
| Commitments | ||||||||
| Shareholders’ deficit: | ||||||||
Preferred stock - $0.001 par value, 25,000,000 authorized Series A designated 10,000,000 shares Issued and outstanding at December 31, 2013 and December 31, 2012, 9,930,982 and 8,426,982 shares, respectively | 10 | 8 | ||||||
| Common stock - $0.001 par value Authorized 975,000,000 shares Issued and outstanding at December 31, 2013 and December 31, 2012, 111,633 and 13,718 shares, respectively | – | – | ||||||
| Additional paid in capital | 56,177 | 52,993 | ||||||
| Accumulated deficit | (63,276 | ) | (56,012 | ) | ||||
| Accumulated other comprehensive loss | (32 | ) | (32 | ) | ||||
| Total ERF Wireless, Inc. shareholders’ deficit | (7,121 | ) | (3,043 | ) | ||||
| Non-controlling interest | 132 | 128 | ||||||
| Total shareholders’ deficit | (6,989 | ) | (2,915 | ) | ||||
| Total liabilities and shareholders' deficit | $ | 5,072 | $ | 6,271 | ||||
See accompanying notes to consolidated financial statements.
| 36 |
ERF WIRELESS, INC.
CONSOLIDATED STATEMENTS OF OPERATIONS
FOR THE YEARS ENDED DECEMBER 31, 20122013 AND 20112012
($ in thousands except share data and loss per share)
| December 31, | ||||||||
| 2012 | 2011 | |||||||
| Sales: | ||||||||
| Products | $ | 102 | $ | 245 | ||||
| Services | 7,226 | 5,075 | ||||||
| Total sales | 7,328 | 5,320 | ||||||
| Costs of goods sold: | ||||||||
| Products and integration services | 1,846 | 1,664 | ||||||
| Rent, repairs and maintenance | 700 | 441 | ||||||
| Depreciation | 1,429 | 1,397 | ||||||
| Total costs of goods sold | 3,975 | 3,502 | ||||||
| Gross profit | 3,353 | 1,818 | ||||||
| Operating expenses: | ||||||||
| Selling, general and administrative | 6,743 | 5,272 | ||||||
| Depreciation and amortization | 214 | 246 | ||||||
| Total operating expenses | 6,957 | 5,518 | ||||||
| Operating loss from continuing operations | (3,604 | ) | (3,700 | ) | ||||
| Other income (expenses): | ||||||||
| Interest expense, net | (1,524 | ) | (817 | ) | ||||
| Gain on sale of assets | – | 1,183 | ||||||
| Derivative income | 335 | 33 | ||||||
| Total other (expense) income | (1,189 | ) | 399 | |||||
| Loss from continuing operations | (4,793 | ) | (3,301 | ) | ||||
| Loss from discontinued operations | – | (78 | ) | |||||
| Consolidated net loss | (4,793 | ) | (3,379 | ) | ||||
| Net loss attributable to non-controlling interest | (21 | ) | – | |||||
| Net loss attributable to ERF Wireless, Inc. | (4,814 | ) | (3,379 | ) | ||||
| Other comprehensive loss: | ||||||||
| Unrealized loss on securities held for resale | (7 | ) | (25 | ) | ||||
| Total other comprehensive loss | (7 | ) | (25 | ) | ||||
| Total comprehensive loss | $ | (4,821 | ) | $ | (3,404 | ) | ||
| Basic loss per common share: | ||||||||
| Loss from continuing operations | $ | (1.38 | ) | $ | (2.41 | ) | ||
| Loss from discontinued operations | $ | – | $ | (0.06 | ) | |||
| Net loss | $ | (1.39 | ) | $ | (2.47 | ) | ||
| Diluted loss per common share: | ||||||||
| Loss from continuing operations | $ | (1.38 | ) | $ | (2.41 | ) | ||
| Loss from discontinued operations | $ | – | $ | (0.06 | ) | |||
| Net loss | $ | (1.39 | ) | $ | (2.47 | ) | ||
| 2013 | 2012 | |||||||
| Sales: | ||||||||
| Products | $ | 90 | $ | 102 | ||||
| Services | 7,066 | 7,226 | ||||||
| Total sales | 7,156 | 7,328 | ||||||
| Cost of goods sold: | ||||||||
| Products and integration services | 1,571 | 1,846 | ||||||
| Rent, repairs and maintenance | 853 | 700 | ||||||
| Depreciation | 1,735 | 1,429 | ||||||
| Total cost of goods sold | 4,159 | 3,975 | ||||||
| Gross profit | 2,997 | 3,353 | ||||||
| Operating expenses: | ||||||||
| Selling, general and administrative | 7,315 | 6,743 | ||||||
| Depreciation | 200 | 214 | ||||||
| Total operating expenses | 7,515 | 6,957 | ||||||
| Loss from operations | (4,518 | ) | (3,604 | ) | ||||
| Other income (expenses): | ||||||||
| Interest expense, net | (3,524 | ) | (1,524 | ) | ||||
| Derivative income | 715 | 335 | ||||||
| Gain on sale of assets | 67 | – | ||||||
| Total other (expense) income | (2,742 | ) | (1,189 | ) | ||||
| Consolidated net loss | (7,260 | ) | (4,793 | ) | ||||
| Net loss attributable to non-controlling interest | (4 | ) | (21 | ) | ||||
| Net loss attributable to ERF Wireless, Inc. | (7,264 | ) | (4,814 | ) | ||||
| Other comprehensive loss: | ||||||||
| Unrealized loss on securities held for resale | – | (7 | ) | |||||
| Total other comprehensive loss | – | (7 | ) | |||||
| Total comprehensive loss | $ | (7,264 | ) | $ | (4,821 | ) | ||
| Basic and diluted loss per common share: | ||||||||
| Net loss | $ | (207.54 | ) | $ | (534.89 | ) | ||
See accompanying notes to consolidated financial statements.
ERF WIRELESS, INC.
CONSOLIDATED STATEMENTS OF SHAREHOLDERS' DEFICIT
FOR THE YEARS ENDED DECEMBER 31, 20122013 AND 20112012
($ and shares in thousands)
| Common Stock | Preferred Stock | Additional Paid in | Accumulated | Accumulated Comprehensive | Non-controlling | Total Shareholders’ | Common Stock | Preferred Stock | AdditionalPaid in | Accumulated | Accumulated Comprehensive | Non-controlling | Total Shareholders’ | |||||||||||||||||||||||||||||||||||||||||||||||||||||||||||
| Shares | Value | Shares | Value | Capital | Deficit | Income | Interest | Deficit | Shares | Value | Shares | Value | Capital | Deficit | Income | Interest | Deficit | |||||||||||||||||||||||||||||||||||||||||||||||||||||||
| Total shareholders’ deficit as of December 31, 2010 | 785 | $ | 1 | 4,613 | $ | 5 | $ | 45,091 | $ | (47,819 | ) | $ | – | $ | – | $ | (2,722 | ) | ||||||||||||||||||||||||||||||||||||||||||||||||||||||
| Total shareholders’ deficit as of December 31, 2011 | 5 | $ | – | 8,579 | $ | 9 | $ | 49,123 | $ | (51,198 | ) | $ | (25 | ) | $ | – | $ | (2,091 | ) | |||||||||||||||||||||||||||||||||||||||||||||||||||||
| Net loss | – | – | – | – | – | (3,379 | ) | – | – | (3,379 | ) | – | – | – | – | – | (4,814 | ) | – | 21 | (4,793 | ) | ||||||||||||||||||||||||||||||||||||||||||||||||||
| New stock issued to shareholders: | ||||||||||||||||||||||||||||||||||||||||||||||||||||||||||||||||||||||||
| Conversion of preferred stock to common stock | 441 | – | (1,404 | ) | (1 | ) | 1 | – | – | – | – | 1 | – | (270 | ) | (1 | ) | 1 | – | – | – | – | ||||||||||||||||||||||||||||||||||||||||||||||||||
| For services, compensation and interest | 203 | – | – | – | 1,023 | – | – | – | 1,023 | 1 | – | – | – | 621 | – | – | – | 621 | ||||||||||||||||||||||||||||||||||||||||||||||||||||||
| For retirement of debt | 88 | – | – | – | 369 | – | – | – | 369 | 1 | – | – | – | 535 | – | – | – | 535 | ||||||||||||||||||||||||||||||||||||||||||||||||||||||
| Conversion of LOC and interest to preferred stock | – | – | 5,370 | 5 | 392 | – | – | – | 397 | – | – | 118 | – | 124 | – | – | – | 124 | ||||||||||||||||||||||||||||||||||||||||||||||||||||||
| Stock based compensation | – | – | – | – | – | – | – | – | – | |||||||||||||||||||||||||||||||||||||||||||||||||||||||||||||||
| Conversion of LOC and interest to common stock | 644 | 1 | – | – | 2,378 | – | – | – | 2,379 | 6 | – | – | – | 2,589 | – | – | – | 2,589 | ||||||||||||||||||||||||||||||||||||||||||||||||||||||
| Dividend declared | – | – | – | – | (133 | ) | – | – | – | (133 | ) | |||||||||||||||||||||||||||||||||||||||||||||||||||||||||||||
| Transfer of subsidiary equity to non-controlling interest | – | – | – | – | – | – | – | 107 | 107 | |||||||||||||||||||||||||||||||||||||||||||||||||||||||||||||||
| Unrealized loss on securities held for resale | – | – | – | – | – | – | (25 | ) | – | (25 | ) | – | – | – | – | – | – | (7 | ) | – | (7 | ) | ||||||||||||||||||||||||||||||||||||||||||||||||||
| Total shareholders’ deficit as of December 31, 2011 | 2,161 | 2 | 8,579 | 9 | 49,121 | (51,198 | ) | (25 | ) | – | (2,091 | ) | ||||||||||||||||||||||||||||||||||||||||||||||||||||||||||||
| Total shareholders’ deficit as of December 31, 2012 | 14 | – | 8,427 | 8 | 52,993 | (56,012 | ) | (32 | ) | 128 | (2,915 | ) | ||||||||||||||||||||||||||||||||||||||||||||||||||||||||||||
| Net loss | – | – | – | – | – | (4,814 | ) | – | 21 | (4,793 | ) | – | – | – | – | – | (7,264 | ) | – | 4 | (7,260 | ) | ||||||||||||||||||||||||||||||||||||||||||||||||||
| New stock issued to shareholders: | ||||||||||||||||||||||||||||||||||||||||||||||||||||||||||||||||||||||||
| Conversion of preferred stock to common stock | 270 | – | (270 | ) | (1 | ) | 1 | – | – | – | – | 10 | – | (259 | ) | – | – | – | – | – | – | |||||||||||||||||||||||||||||||||||||||||||||||||||
| For services, compensation, interest and prepaids | 440 | 1 | – | – | 620 | – | – | – | 621 | 16 | – | – | – | 1,314 | – | – | – | 1,314 | ||||||||||||||||||||||||||||||||||||||||||||||||||||||
| For retirement of debt | 393 | 1 | – | – | 534 | – | – | – | 535 | 36 | – | – | – | 1,528 | – | – | – | 1,528 | ||||||||||||||||||||||||||||||||||||||||||||||||||||||
| Conversion of LOC and interest to preferred stock | – | – | 118 | – | 124 | – | – | – | 124 | – | – | 1,763 | 2 | 33 | – | – | – | 35 | ||||||||||||||||||||||||||||||||||||||||||||||||||||||
| Conversion of LOC and interest to common stock | 2,223 | 2 | – | – | 2,587 | – | – | – | 2,589 | 36 | – | – | – | – | – | – | – | – | ||||||||||||||||||||||||||||||||||||||||||||||||||||||
| Transfer of subsidiary equity to non-controlling interest | – | – | – | – | – | – | – | 107 | 107 | |||||||||||||||||||||||||||||||||||||||||||||||||||||||||||||||
| Unrealized loss on securities held for resale | – | – | – | – | – | – | (7 | ) | – | (7 | ) | |||||||||||||||||||||||||||||||||||||||||||||||||||||||||||||
| Total shareholders’ deficit as of December 31, 2012 | 5,487 | $ | 6 | 8,427 | $ | 8 | $ | 52,987 | $ | (56,012 | ) | $ | (32 | ) | $ | 128 | $ | (2,915 | ) | |||||||||||||||||||||||||||||||||||||||||||||||||||||
| Derivative liability | – | – | – | – | 309 | – | – | – | 309 | |||||||||||||||||||||||||||||||||||||||||||||||||||||||||||||||
| Total shareholders’ deficit as of December 31, 2013 | 112 | $ | – | 9,931 | $ | 10 | $ | 56,177 | $ | (63,276 | ) | $ | (32 | ) | $ | 132 | $ | (6,989 | ) | |||||||||||||||||||||||||||||||||||||||||||||||||||||
See accompanying notes to consolidated financial statements.
ERF WIRELESS, INC.
CONSOLIDATED STATEMENTS OF CASH FLOWS
FOR THE YEARS ENDED DECEMBER 31, 20122013 AND 20112012
($ in thousands)
| December 31, | ||||||||||||||||
| 2012 | 2011 | |||||||||||||||
| 2013 | 2012 | |||||||||||||||
| Cash flows from operating activities | ||||||||||||||||
| Loss from continuing operations | $ | (4,793 | ) | $ | (3,301 | ) | ||||||||||
| Loss from discontinued operations | – | (78 | ) | |||||||||||||
| Net loss | (4,793 | ) | (3,379 | ) | $ | (7,260 | ) | $ | (4,793 | ) | ||||||
| Adjustments to reconcile net loss to net cash used by operating activities: | ||||||||||||||||
| Gain on sale of assets | – | (1,183 | ) | (67 | ) | – | ||||||||||
| Amortization of debt discount | 290 | 26 | 1,958 | 290 | ||||||||||||
| Depreciation and amortization | 1,643 | 1,698 | ||||||||||||||
| Depreciation | 1,935 | 1,643 | ||||||||||||||
| Stock issued for services rendered, interest and compensation | 621 | 887 | 1,314 | 621 | ||||||||||||
| Derivative income | (335 | ) | (33 | ) | (715 | ) | (335 | ) | ||||||||
| Bad debt expense | 13 | – | 54 | 13 | ||||||||||||
| Changes in: | ||||||||||||||||
| Accounts receivable, net | (245 | ) | (198 | ) | (227 | ) | (245 | ) | ||||||||
| Accounts receivable, other | (36 | ) | 114 | (143 | ) | (36 | ) | |||||||||
| Inventories | (19 | ) | (156 | ) | 107 | (19 | ) | |||||||||
| Prepaid expenses and other current assets | 82 | (123 | ) | 2 | 82 | |||||||||||
| Costs and profits in excess of billings | (35 | ) | – | 35 | (35 | ) | ||||||||||
| Accounts payable | 532 | (167 | ) | 73 | 532 | |||||||||||
| Accrued expenses | 1,033 | (18 | ) | 391 | 1,033 | |||||||||||
| Deferred liability and revenue | (190 | ) | (290 | ) | ||||||||||||
| Total adjustment | 3,354 | 557 | ||||||||||||||
| Deferred revenue | (7 | ) | (190 | ) | ||||||||||||
| Total adjustments | 4,710 | 3,354 | ||||||||||||||
| Net cash used by operating activities | (1,439 | ) | (2,822 | ) | (2,550 | ) | (1,439 | ) | ||||||||
| Cash flows from investing activities | ||||||||||||||||
| Purchase of property and equipment | (1,453 | ) | (2,114 | ) | (346 | ) | (1,453 | ) | ||||||||
| Proceeds from sale of assets | – | 2,707 | 34 | – | ||||||||||||
| Change in other assets | 26 | (27 | ) | – | 26 | |||||||||||
| Net cash (used by) provided by investing activities | (1,427 | ) | 566 | |||||||||||||
| Net cash used by investing activities | (312 | ) | (1,427 | ) | ||||||||||||
| Cash flows from financing activities | ||||||||||||||||
| Net proceeds from line of credit | 823 | 1,554 | 1,148 | 823 | ||||||||||||
| Proceeds from long-term debt obligations | 2,674 | 2,700 | 3,116 | 2,674 | ||||||||||||
| Payment of long-term debt obligations | (950 | ) | (980 | ) | (1,283 | ) | (950 | ) | ||||||||
| Payment on capital lease obligations | (154 | ) | (470 | ) | (195 | ) | (154 | ) | ||||||||
| Net cash provided by financing activities | 2,393 | 2,804 | 2,786 | 2,393 | ||||||||||||
| Net change in cash and cash equivalents | (473 | ) | 548 | (76 | ) | (473 | ) | |||||||||
| Cash and cash equivalents at the beginning of the period | 591 | 43 | ||||||||||||||
| Cash and cash equivalents at the end of the period | $ | 118 | $ | 591 | ||||||||||||
| Cash and cash equivalents at the beginning of the year | 118 | 591 | ||||||||||||||
| Cash and cash equivalents at the end of the year | $ | 42 | $ | 118 | ||||||||||||
| Supplemental disclosure of cash flow information: | ||||||||||||||||
| Net cash paid during the period for: | ||||||||||||||||
| Net cash paid during the year for: | ||||||||||||||||
| Interest | $ | 364 | $ | 123 | $ | 308 | $ | 364 | ||||||||
| Income taxes | $ | – | $ | – | $ | – | $ | – | ||||||||
| Supplemental non-cash investing and financing activities: | ||||||||||||||||
| Conversion of debt through issuance of common stock | $ | 535 | $ | 369 | $ | 1,528 | $ | 535 | ||||||||
| Conversion of preferred stock to common stock | $ | 270 | $ | – | ||||||||||||
| Conversion of LOC and interest through issuance of preferred stock | $ | 124 | $ | 397 | $ | 35 | $ | 124 | ||||||||
| Conversion of LOC and interest through issuance of common stock | $ | 2,589 | $ | 2,379 | $ | – | $ | 2,589 | ||||||||
| Common stock issuance for prepaids | $ | – | $ | 136 | ||||||||||||
| Dividend declared | $ | – | $ | 133 | ||||||||||||
| Unrealized loss on securities held for resale | $ | 7 | $ | 25 | $ | – | $ | 7 | ||||||||
| Transfer of subsidiary equity to non-controlling interest | $ | 107 | $ | – | $ | – | $ | 107 | ||||||||
| Property and equipment financed with debt and capital leases | $ | 260 | $ | – | $ | 238 | $ | 260 | ||||||||
See accompanying notes to consolidated financial statements.
| 39 |
ERF WIRELESS, INC.
NOTES TO THE CONSOLIDATED FINANCIAL STATEMENTS
DECEMBER 31, 20122013
NOTE 1 - BASIS OF PRESENTATION
Nature of the Company
ERF Wireless, Inc. (“Company” or “ERF Wireless”) provides critical infrastructure wireless broadband communications products and services to a broad spectrum of customers in primarily rural oil and gas exploration areas of North America. We also provide high quality broadband services and critical communications services to residential, oil and gas, educational, health care, and regional banks in rural areas utilizing our Company owned and operated wireless networks. As a total comprehensive solutions provider we offer a wide array of critical communications services including high speed broadband, voice over Internet Protocol (VOIP) telephone and facsimile service, and video security.
Historically, our revenues have been generated primarily from wireless internetInternet and network construction services. Our Internet revenues have resulted from our offering of broadband and basic communications services to residential and enterprise customers. Our construction revenues typically have consisted of revenues generated from the construction of bank, , educational, , and healthcare networks and other services associated with providing wireless products and services to the regional banking, educational and healthcare industries.
Our internetInternet revenues are recorded in “ERF Wireless Bundled Services, Inc. (WBS)”, construction of bank, healthcare and educational networks in our “ERF Enterprise Network Services, Inc. (ENS)” and other construction in “ERF Wireless Messaging Services, Inc. (WMS)” and wireless broadband products and services to rural oil and gas locations are recorded in “Energy Broadband, Inc. (EBI)”. Please refer to segment footnote 1615 for additional information regarding segment operations.
Basis of Accounting
The Company maintains its accounts on the accrual method of accounting in accordance with accounting principles generally accepted in the United States of America. The accompanying financial statements of the Company have been prepared in accordance with accounting principles generally accepted in the United States of America and the rules of the Securities and Exchange Commission (“SEC”). In the opinion of management, all adjustments, consisting of normal recurring adjustments, necessary for a fair presentation of financial position and the results of operations have been reflected herein.
Principles of Consolidation
The consolidated financial statements include the accounts of the Company and its subsidiaries. All significant inter-company transactions and balances have been eliminated in consolidation. The consolidated financial statements have been prepared in conformity with accounting principles generally accepted in the United States of America.
Securities Held for Resale
Investments in public companies are classified as available-for-sale and are adjusted to their fair market value with unrealized gains and losses, net of tax, recorded as a component of accumulated other comprehensive income. Upon disposition of these investments, the specific identification method is used to determine the cost basis in computing realized gains or losses, which are reported in other income and expense. Declines in value that are judged to be other than temporary are reported in other comprehensive income and expense.
Reclassification
Certain amounts in the 20112012 financial statements have been reclassified to conform to the 20122013 financial presentation. These reclassifications have no impact on net loss.
Use of Estimates
The preparation of financial statements in conformity with accounting principles generally accepted in the United States of America requires management to make estimates and assumptions that affect the reported amounts of assets and liabilities at the date of the balance sheet. Actual results could differ from those estimates.
ERF WIRELESS, INC.
NOTES TO THE CONSOLIDATED FINANCIAL STATEMENTS
DECEMBER 31, 20122013
Cash and Cash Equivalents
Cash and cash equivalents include cash and all highly liquid financial instruments with original purchased maturities of three months or less at the date of purchase. At various times during the year, the Company maintained cash balances in excess of FDIC insurable limits. Management feels this risk is mitigated due to the longstanding reputation of these banks. The Company has not experienced any losses related to these deposits.
Credit Risk
In the normal course of business, the Company extends unsecured credit to the majority of its customers. The Company controls credit risk associated with its receivables through credit checks, approvals, and monitoring procedures. Generally, the Company requires no collateral from its customers.
Operating Leases
We recognize lease expense on a straight-line basis over the minimum lease terms which expire at various dates through 2018. These leases are for office and radio tower facilities and are classified as operating leases. For leases that contain predetermined, fixed escalations of the minimum rentals, we recognize the rent expense on a straight-line basis and record the difference between the rent expense and the rental amount payable in liabilities.
Leasehold improvements made at the inception of the lease are amortized over the shorter of the asset life or the initial lease term as described above. Leasehold improvements made during the lease term are also amortized over the shorter of the asset life or the remaining lease term.
On December 15, 2006, the Company entered into an agreement with Southwest Enhanced Network Services, LP, a wireless broadband company, to assume multiple tower and office leases in the greater Lubbock, Texas area. As part of the agreement the Company received $825,000 in cash to offset certain of the future operating lease costs. This payment was recorded as a deferred leased liability and recognized as a reduction to rent expense on a straight-line basis over the lease term as described above. At the end of December 2010 the $150,000 deferred lease liability remaining balance was amortized completely by the end of December 31, 2011.
Assets Held under Capital Leases
Assets held under capital leases are recorded at the lower of the net present value of the minimum lease payments or the fair value of the leased asset at the inception of the lease. Amortization expense is computed using the straight-line method over the shorter of the estimated useful lives of the assets or the period of the related lease. We utilize various leasing facilities including tower sites, offices sites and the purchase of tower and radio network equipment. When we enter into a lease agreement, we review the terms to determine the appropriate classification of the lease as a capital lease or operating lease based on the factors listed in FASB ASC Topic 840 “Leases”.
Allowance for Doubtful Accounts
The Company uses the allowance method to account for uncollectible accounts receivable. The Company's estimate is based on historical collection experience and a review of the current status of accounts receivable. The Company reviews its accounts receivable balances by customer for accounts greater than 90 days old and makes a determination regarding the collectibility of the accounts based on specific circumstances and the payment history that exists with such customers. The Company also takes into account its prior experience, the customer's ability to pay and an assessment of the current economic conditions in determining the net realizable value of its receivables. The Company also reviews its allowances for doubtful accounts in aggregate for adequacy following this assessment. Accordingly, the Company believes that its allowances for doubtful accounts fairly represent the underlying collectibility risks associated with its accounts receivable.
Deferred Revenues
Revenues that are billed in advance of services being completed are deferred until the conclusion of the period of the service for which the advance billing relates. Deferred revenues are included on the balance sheet in current and long-term liabilities until the service is performed and then recognized in the period in which the service is completed. The Company's deferred revenues consist of billings in advance for services being rendered for its wireless broadband and, accordingly, are deferred and recognized monthly as earned. The Company had deferred revenues in current liabilities of approximately $20,000$13,000 and $210,000$20,000 as of December 31, 20122013 and December 31, 2011,2012, respectively.
ERF WIRELESS, INC.
NOTES TO THE CONSOLIDATED FINANCIAL STATEMENTS
DECEMBER 31, 20122013
Advertising Costs
Advertising costs are expensed when incurred. For the periodsyears ended December 31, 20122013 and 2011,2012, the Company expensed $66,000$52,000 and $67,000,$66,000, respectively.
Stock-Based Compensation
Stock-based compensation expense is recorded for stock and stock options awarded in return for services rendered. The expense is measured at the grant-date fair value of the award and recognized as compensation expense on a straight-line basis over the service period, which is the vesting period. The Company estimates forfeitures that it expects will occur and records expense based upon the number of awards expected to vest.
Non-controlling Interest
Non-controlling interest in our majority owned subsidiary EBI, is included in the equity section of the consolidated balance sheets. Non-controlling interest represents 3.63% of the equity of EBI and any transfer of value from ERF to non-controlling interest holders. Non-controlling interest is adjusted for the non-controlling interest holders’ proportionate share of the earnings or losses of EBI. Any excess losses applicable to the non-controlling interests have been and are borne by the Company as there is no obligation of the non-controlling interests to fund any losses in excess of their original investment. There is also no obligation or commitment on the part of the Company to fund operating losses of any subsidiary whether wholly-owned or majority-owned.
Derivative Instruments
In connection with the sale of debt or equity instruments, the Company may sell options or warrants to purchase our common stock. In certain circumstances, these options or warrants may be classified as derivative liabilities, rather than as equity. Additionally, the debt or equity instruments may contain embedded derivative instruments, such as embedded derivative features which in certain circumstances may be required to be bifurcated from the associated host instrument and accounted for separately as a derivative instrument liability.
The Company's derivative instrument liabilities are re-valued at the end of each reporting period, with changes in the fair value of the derivative liability recorded as charges or credits to income in the period in which the changes occur. For options, warrants and bifurcated embedded derivative features that are accounted for as derivative instrument liabilities, the Company estimates fair value using either quoted market prices of financial instruments with similar characteristics or other valuation techniques. The valuation techniques require assumptions related to the remaining term of the instruments and risk-free rates of return, our current common stock price and expected dividend yield, and the expected volatility of our common stock price over the life of the option. Because of the limited trading history for our common stock, the Company estimates the future volatility of its common stock price based on not only the history of its stock price but also the experience of other entities considered comparable to the Company.
InventoriesInventory
Inventories areInventory is valued at the lower of cost or market. The cost is determined by using the average cost method. Inventories consistInventory consists of the following items as of December 31, 20122013 and 20112012 (in thousands):
| December 31, | December 31, | December 31, | December 31, | |||||||||||||
| 2012 | 2011 | 2013 | 2012 | |||||||||||||
| Raw material | $ | 46 | $ | 44 | $ | 45 | $ | 46 | ||||||||
| Work in process | 115 | 116 | 65 | 115 | ||||||||||||
| Finished goods | 216 | 198 | 154 | 216 | ||||||||||||
| Total inventory | $ | 377 | $ | 358 | $ | 264 | $ | 377 | ||||||||
Property and Equipment
Property and equipment are stated at cost less accumulated depreciation. Major renewals and improvements are capitalized; minor replacements, maintenance and repairs are charged to current operations. Depreciation is computed by applying the straight-line method over the estimated useful lives which are generally three to seven years.
ERF WIRELESS, INC.
NOTES TO THE CONSOLIDATED FINANCIAL STATEMENTS
DECEMBER 31, 20122013
Goodwill
Goodwill represents the excess of the cost of businesses acquired over the fair value of their net assets at the dates of acquisition. Under current accounting pronouncements, the Company is required to annually assess the carrying value of goodwill associated with each of its distinct business units that comprise its business segments of the Company to determine if impairment in value has occurred.
Intangible Assets
Intangible assets are amortized using methods that approximate the benefit provided by the utilization of the assets. The Company continually evaluates the amortization period and carrying basis of intangible assets to determine whether subsequent events and circumstances warrant a revised estimated useful life or impairment in value. To date, no such impairment has occurred. To the extent such events or circumstances occur that could affect the recoverability of our intangible assets, we may incur charges for impairment in the future.
Long-Lived Assets
We review our long-lived assets, which include intangible assets subject to amortization, for recoverability whenever events or changes in circumstances indicate that the carrying amount of such long-lived asset or group of long-lived assets (collectively referred to as "the asset") may not be recoverable. Such circumstances include, but are not limited to:
| · | a significant decrease in the market price of the asset; |
| · | a significant change in the extent or manner in which the asset is being used; |
| · | a significant change in the business climate that could affect the value of the asset; |
| · | a current period loss combined with projection of continuing loss associated with use of the asset; |
| · | a current expectation that, more likely than not, the asset will be sold or otherwise disposed of before the end of its previously estimated useful life. |
We continually evaluate whether such events and circumstances have occurred. When such events or circumstances exist, the recoverability of the asset's carrying value shall be determined by estimating the undiscounted future cash flows (cash inflows less associated cash outflows) that are directly associated with and that are expected to arise as a direct result of the use and eventual disposition of the asset. To date, no such impairment has occurred. To the extent such events or circumstances occur that could affect the recoverability of our long-lived assets, we may incur charges for impairment in the future.
Revenue Recognition
The Company's revenue is generated primarily from the sale of wireless communications products and services on a nationwide basis, including providing enterprise-class wireless broadband services. The Company recognizes revenue when persuasive evidence of an arrangement exists, delivery has occurred, the sales price is fixed or determinable, and collectibility is probable.
The Company records revenues from itsour fixed-price, long-term contracts using the percentage-of-completion method. Revenues are recorded based on construction costs incurred to date as a percentage of estimated total cost at completion. The percentage-of-completion, determined by using total costs incurred to date as a percentage of estimated total costs at completion, reflects the actual physical completion of the project. If the current projected costs on a fixed fee contract exceed projected revenue, the entire amount of the loss is recognized in the period such loss is identified.
The Company recognizes product sales generally at the time the product is shipped. Concurrent with the recognition of revenue, the Company provides for the estimated cost of product warranties and reduces revenue for estimated product returns. Sales incentives are generally classified as a reduction of revenue and are recognized at the later of when revenue is recognized or when the incentive is offered. Shipping and handling costs are included in cost of goods sold.
Service revenue is principally derived from wireless broadband services, including internet, voice, and data and monitoring service. Subscriber fees are recorded as revenues in the period during which the service is provided.
ERF WIRELESS, INC.
NOTES TO THE CONSOLIDATED FINANCIAL STATEMENTS
DECEMBER 31, 20122013
Warranty
The Company's suppliers generally warrant the products distributed by the Company and allow returns of defective products, including those that have been returned to the Company by its customers. The Company does not independently warrant the products that it distributes, but it does provide warranty services on behalf of the supplier.
Fair Value Estimates
Pursuant to the Accounting Standards Codification (“ASC”) No. 820, “Disclosures About Fair Value of Financial Instruments”, the Company records its financial assets and liabilities at fair value. ASC No. 820 provides a framework for measuring fair value, clarifies the definition of fair value and expands disclosures regarding fair value measurements. Fair value is defined as the price that would be received to sell an asset or paid to transfer a liability (an exit price) in an orderly transaction between market participants at the reporting date. ASC No. 820 establishes a three-tier hierarchy, which prioritizes the inputs used in the valuation methodologies in measuring fair value:
Level 1—Inputs are unadjusted, quoted prices in active markets for identical assets or liabilities at the measurement date.
Level 2—Inputs (other than quoted prices included in Level 1) are either directly or indirectly observable for the asset or liability through correlation with market data at the measurement date and for the duration of the asset/liability’s anticipated life.
Level 3—Inputs reflect management’s best estimate of what market participants would use in pricing the asset or liability at the measurement date. Consideration is given to the risk inherent in the valuation technique and the risk inherent in the inputs to the model.
The carrying values for cash and cash equivalents, accounts receivable, prepaid assets, accounts payable and accrued liabilities approximate their fair value due to their short maturities.
Research and development
Research and development expense consists of costs attributable to employees and or consultants who focus their time on the design, engineering and process development of our CryptoVue technology. During the two previous fiscal years2013 and 2012, we have not incurred research and development cost and do not anticipate incurring any such costs in the current fiscal year.costs.
Income Taxes
Income taxes are computed using the asset and liability method. Under the asset and liability method, deferred income tax assets and liabilities are determined based on the differences between the financial reporting and tax bases of assets and liabilities and are measured using the currently enacted tax rates and laws. A valuation allowance is provided for the amount of deferred tax assets that, based on available evidence, are not expected to be realized.
Fair Value of Financial Instruments
The Company's financial instruments consist of cash and cash equivalents, inventory, accounts receivable and debt. The carrying amount of these financial instruments approximates fair value due either to length of maturity or interest rates that approximate prevailing market rates unless otherwise disclosed in these consolidated financial statements.
Basic and Diluted Loss per Share
The Company is required to provide basic and dilutive earnings (loss) per common share information.
The basic net loss per common share is computed by dividing the net loss by the weighted average number of common shares outstanding.
Diluted net loss per common share is computed by dividing the net loss, adjusted on an "as if converted" basis, by the weighted average number of common shares outstanding plus potential dilutive securities. For the periodsyears ended December 31, 2012,2013, and December 31, 2011,2012, potential dilutive securities had an anti-dilutive effect and were not included in the calculation of fully diluted net loss per common share.
Recent Accounting Pronouncements
Management does not anticipate that the recently issued but not yet effective accounting pronouncements will materially impact the Company’s financial condition.
ERF WIRELESS, INC.
NOTES TO THE CONSOLIDATED FINANCIAL STATEMENTS
DECEMBER 31, 20122013
NOTE 2 - ACCOUNTS RECEIVABLE, NET
Accounts receivable consists of the following (in thousands):
| December 31, | December 31, | December 31, | December 31, | |||||||||||||
| 2012 | 2011 | 2013 | 2012 | |||||||||||||
| Accounts receivable | $ | 838 | $ | 628 | $ | 1,061 | $ | 838 | ||||||||
| Allowance for doubtful accounts | (10 | ) | (32 | ) | (60 | ) | (10 | ) | ||||||||
| Accounts receivable, net | $ | 828 | $ | 596 | $ | 1,001 | $ | 828 | ||||||||
NOTE 3 - PROPERTY AND EQUIPMENT, NET
Components of property and equipment consist of the following items (in thousands):
| December 31, | December 31, | December 31, | December 31, | |||||||||||||
| 2012 | 2011 | 2013 | 2012 | |||||||||||||
| Vehicles | $ | 742 | $ | 501 | $ | 776 | $ | 742 | ||||||||
| Operating equipment | 9,636 | 7,388 | 10,183 | 9,636 | ||||||||||||
| Office furniture and equipment | 237 | 236 | 245 | 237 | ||||||||||||
| Leasehold improvements | 70 | 70 | 70 | 70 | ||||||||||||
| Computer equipment | 392 | 316 | 398 | 392 | ||||||||||||
| Building | 29 | 29 | 29 | 29 | ||||||||||||
| Land | 37 | 37 | 37 | 37 | ||||||||||||
| Construction in progress | 501 | 1,355 | 404 | 501 | ||||||||||||
| Total property and equipment | 11,644 | 9,932 | 12,142 | 11,644 | ||||||||||||
| Less accumulated depreciation | (7,511 | ) | (5,868 | ) | (9,365 | ) | (7,511 | ) | ||||||||
| Net property and equipment | $ | 4,133 | $ | 4,064 | $ | 2,777 | $ | 4,133 | ||||||||
Depreciation expense was $1,643,000$1,935,000 and $1,643,000 for the years ended December 31, 2013 and 2012, and 2011, respectively. The depreciation expense from discontinued operations was $43,000 for the year ended December 31, 2011.
Operating equipment under construction in progress is primarily due to the accumulation of mobile broadband trailers (MBT’s) to be deployed in the Oil and Gas regions by our subsidiary EBI.
The Company has pledged substantially all the operating equipment and some furniture and vehicles as collateral against outstanding notes and capital leases.
NOTE 4 - GOODWILL
At December 31, 20122013 and 2011,2012, goodwill totaled $176,000. In February 2011, the Company reduced goodwill of $1,079,000 as part of the sale of the Central Texas and North Texas network to KeyOn. The remaining goodwill of $176,000 is attributable to the acquisition of the assets of Crosswind, Inc. on January 11, 2008.
ERF WIRELESS, INC.
NOTES TO THE CONSOLIDATED FINANCIAL STATEMENTS
DECEMBER 31, 2012
NOTE 5 - INTANGIBLE ASSETS, NET
Intangible assets have been fully amortized and consist of the following at December 31, 2012 and 2011 (in thousands):
Useful Life (in years) | Gross Carrying Amount | Accumulated Amortization | Net Carrying Amount | |||||||||||||
| Customer relationships | 3.0 | $ | 502 | $ | 502 | $ | – | |||||||||
| Workforce in place | 3.0 | 125 | 125 | – | ||||||||||||
| Non-compete agreement | 3.0 | 100 | 100 | – | ||||||||||||
| Developed technology | 3.0 | 20 | 20 | – | ||||||||||||
| $ | 747 | $ | 747 | $ | – | |||||||||||
On June 1, 2009, the Company acquired from Frontier Internet, LLC and iTEXAS Net, a customer list which was valued at $283,000 and was being amortized over three years. In February 2011, the Company divested the remaining net book value amount of intangibles of $122,000 as part of the sale of the North Texas network to KeyOn.
NOTE 6 - DEBT CONVERSION
(a) LINE OF CREDIT
For the year ended December 31, 2012,2013, the Company issued 2,222,19836,784 shares of its Common Stock (as defined below)common stock for the settlement of $2,122,385$1,808,739 of principal and $466,615$349,261 of accrued interest for a total principal and interest amount of $2,158,000 owed to Angus Capital Partners. The Company issued common stock at an average price of $58.67 per share calculated based on the closing price the day the debt was settled. At December 31, 2013, Angus Capital Partners and ERF Wireless, Inc. both agreed to reduce the interest rate from the current 12% per annum to 3% per annum retroactive to January 1, 2013 and extend the maturity date of the revolving note to December 31, 2017, while maintaining the maximum Line of Credit of $12 million. The Company in consideration has accepted the return and cancellation of 36,784 common shares (post-split) of Company common stock issued from the Line of Credit conversions during 2013. The Company has accordingly reversed the payment of principal and interest of $2,158,000 in December 2013 and subsequently received the canceled shares in February 2014. See Note 11 for additional information on this facility.
Additionally for the year ended December 31, 2013, the Company issued 1,763,000 shares of its Series A Preferred Stock to Angus Capital for the settlement of principal amount of $35,260 of debt. The Company issued Series Preferred A Stock at an average price of $.02 per share or $8.00 (post-split) per share calculated based on the closing price of the common stock the day the debt was settled.
| 45 |
ERF WIRELESS, INC.
NOTES TO THE CONSOLIDATED FINANCIAL STATEMENTS
DECEMBER 31, 2013
Under current accounting standards ASC 470-50-40-2, the extinguishment of related party debt for equity securities is considered a capital transaction and, accordingly, no gain or loss on the extinguishment is recognized in the statement of operations. If this was not a related party transaction, a loss of $299,710 would have been recognized for the year ended December 31, 2013.
For the year ended December 31, 2012, the Company issued 5,556 shares of its common stock for the settlement of $2,122,385 and $466,615 of accrued interest, for a total of principal amount of $2,589,000 owed to Angus Capital Partners. The Company issued Common Stockcommon stock at an average price of $1.17$465.98 per share calculated based on the closing price the day the debt was settled. See Note 1211 for additional information on this facility.
Additionally for the year ended December 31, 2012, the Company issued 118,095 shares of its Series A Preferred Stock (as define below) to Angus Capital for the settlement of principal amount of $124,000 of debt. The Company issued Series Preferred A Stock at an average price of $1.05 per share calculated based on the closing price of the Common Stockcommon stock the day the debt was settled.
Under current accounting standards ASC 470-50-40-2, the extinguishment of related party debt for equity securities is considered a capital transaction and, accordingly, no gain or loss on the extinguishment is recognized in the statement of operations. If this was not a related party transaction, a gain of $10,850 would have been recognized for the year ended December 31, 2012.
For the year ended December 31, 2011, the Company issued 643,781 shares of its Common Stock (as defined below) for the settlement of $1,837,006 of principal and $541,468 of accrued interest for a total principal and interest amount of $2,378,474 owed to Angus Capital Partners. The Company issued Common Stock at an average price of $3.69 per share calculated based on the closing price the day the debt was settled. See Note 12 for additional information on this facility
Additionally for the year ended December 31, 2011, the Company issued 5,370,304 shares of its Series A Preferred Stock (as define below) to Angus Capital for the settlement of $350,000 principal and $47,017 of accrued interest for a total amount of $397,017. The Company issued Series Preferred A Stock at an average price of $.0739 per share or $1.84 (post split) per share calculated based on the closing price of the Common Stock the day the debt was settled.
Under current accounting standards ASC 470-50-40-2, the extinguishment of related party debt for equity securities is considered a capital transaction and, accordingly, no gain or loss on the extinguishment is recognized in the statement of operations. If this was not a related party transaction, a gain of $37,763 would have been recognized for the year ended December 31, 2011.
ERF WIRELESS, INC.
NOTES TO THE CONSOLIDATED FINANCIAL STATEMENTS
DECEMBER 31, 2012
(b) OTHER DEBT
During the year ended December 31, 2012,2013, the Company issued 393,042 and 6,58544,705 shares of its Common Stockcommon stock for the settlement of $535,000$1,527,699 principal and $8,004$538,574 of accrued interest, respectively, for a total amount of $543,004.$2,066,272. The Company issued Common Stockcommon stock at an average price of $1.36$46.22 per share calculated based on the closing price the day the debt was settled.
During the year ended December 31, 20112012, the Company issued 92,755999 shares of its Common Stockcommon stock for the settlement of $369,147 of$535,000 principal and $24,604$8,004 of accrued interest, respectively, for a total amount of $393,751.$543,004. The Company issued Common Stockcommon stock at an average price of $4.25$543.55 per share calculated based on the closing price the day the debt was settled.
NOTE 76 - COMMON STOCK, PREFERRED STOCK AND WARRANTS
The total number of shares of stock of all classes which the Company shall have the authority to issue is 1,000,000,000, of which 25,000,000 shall be shares of preferred stock with a par value of $0.001 per share ("Preferred Stock"), and 975,000,000 shall be shares of common stock with a par value of $0.001 per share ("Common Stock").
On August 5, 2011December 18, 2013 the Company's board of directors and stockholders with a majority of the Company's voting power approved an amendment to the Company's Articles of Incorporation to affect a reverse split of the Company's common stock at a ratio of 1 for 500. Any whole number400. The Board of outstandingDirectors also approved the rounding of fractional shares between and including 2 and 500 would be combined into one share of common stock, at a ratio selected by the board. There was no change to the authorized shares of common stock of the Company as a result ofremaining after the reverse stock split andto the nearest whole common share on a per shareholder basis, provided that any fractionalshareholder holding over ten (10) shares, werebut less than ninety-nine (99) shares after the reverse stock split will have their shares automatically rounded up.up to 100 shares. The ratio of1 for 500400 reverse split affected 682,917,968 common35.9 million pre-stock split to .090 million post-split shares prior(prior to affecting the split and were converted into 1,366,311 shares of $0.001 par value common stock.rounding describe above). The reverse stock split has been applied retroactively to all financial statements and footnotes presented herein.
Common Stock
As of December 31, 2012,2013, there were 5,487,072111,633 shares of its $.001 par value common stock issued and outstanding.
During the year ended December 31, 2012,2013, the Company issued 3,056,07698,000 shares of common stock which was valued at the closing market price on the date of issuance of such shares, which were issued in lieu of cash as payment for the following (in thousands):
| December 31, 2012 | Supplemental Non-Cash Disclosure | |||||||
| December 31, 2013 | Supplemental Disclosure | |||||||
| Professional fees | $ | 198 | $ | 412 | ||||
| Services and compensation | 309 | 350 | ||||||
| Other services rendered | 114 | |||||||
| Total for services, and compensation | $ | 621 | ||||||
| Other services rendered and interest | 552 | |||||||
| Total for services, compensation and interest | $ | 1,314 | ||||||
| Notes payable | $ | 535 | $ | 1,528 | ||||
| Line of credit and interest | $ | 2,589 | $ | – | ||||
ERF WIRELESS, INC.
NOTES TO THE CONSOLIDATED FINANCIAL STATEMENTS
DECEMBER 31, 2013
As of December 31, 2011,2012, there were 2,160,99613,718 shares of its $.001 par value common stock issued and outstanding.
ERF WIRELESS, INC.
NOTES TO THE CONSOLIDATED FINANCIAL STATEMENTS
DECEMBER 31, 2012
During the year ended December 31, 2011,2012, the Company issued 934,4647,640 shares of common stock which was valued at the closing market price on the date of issuance of such shares, which were issued in lieu of cash as payment for the following (in thousands):
| December 31, 2011 | Supplemental Non-Cash Disclosure | |||||||
| December 31, 2012 | Supplemental Non-Cash Disclosure | |||||||
| Professional fees | $ | 541 | $ | 198 | ||||
| Services and compensation | 294 | 309 | ||||||
| Interest expense | 25 | |||||||
| Other services rendered | 27 | 114 | ||||||
| Total for services, interest, and compensation | $ | 887 | ||||||
| Prepaids | $ | 136 | ||||||
| Total for services, and compensation | $ | 621 | ||||||
| Notes payable | $ | 369 | $ | 535 | ||||
| Line of credit and interest | $ | 2,379 | $ | 2,589 | ||||
Preferred Stock
The Company has 25,000,000 shares of Preferred Stock authorized of which 10,000,000 shares had been designated as Series A Preferred Stock (“Series A Preferred Stock”). There were 8,426,9829,930,982 and 8,578,8878,426,982 Series A preferred shares issued and outstanding at December 31, 20122013 and December 31, 2011,2012, respectively. With respect to the Series A Preferred Stock outstanding at December 31, 2012,2013, the Company would be required to issue 8,426,9829,930,982 shares of its common stock upon conversion.Duringconversion.During the year ended December 31, 2012, 270,0002013, 259,000 Series A Preferred Stock were converted into 270,00010,000 shares of common stock.
For the year ended December 31, 2012,2013, the Company issued 118,0951,763,000 shares of its Series A Preferred Stock (as define below) to Angus Capital for the settlement of principal amount of $124,000$35,260 of debt. The Company issued Series Preferred A Stock at an average price of $1.05$.02 per share or $8.00 (post-split) per share calculated based on the closing price of the Common Stockcommon stock the day the debt was settled.
The Company's board of directors approved an amendment to the Company's Articles of Incorporation stating that due to a combination or reverse split each share of Series A Preferred Stock issued and outstanding may convert into 1 new share of common stock.As of August 5, 2011 the Company affecteda reverse split of the Company's common stock at a ratio of 1 for 500 thus subsequent conversionsof each Series A Preferred Stock is convertible at holder's option for 1 share of common stock. Prior to August 2011 each share of Series A Preferred Stock was converted at holder’s option for 18.676347 shares of common stock. The holder of Series A Preferred Stock is required to give a 65-day notice of conversion to the Company. The holders of the Series A Preferred Stock are entitled to receive out of funds of the Company legally available, dividends at the same rate as dividends are paid with respect to outstanding shares of common stock.
Holders of shares of the Series A Preferred Stock are entitled to vote, together with the holders of our common stock, on all matters submitted to a vote of the Company’s stockholders. Each share of Series A Preferred Stock entitles the holder thereof to 100 votes on all matters submitted to a vote of the Company’s stockholders.
Holders of the Series A Preferred Stock are also entitled to elect one director at any meeting of the Company’s stockholder at which such directors are to be elected. The right of the holders of the Series A Preferred Stock to elect such additional director shall cease when all outstanding shares of Series A Preferred Stock have been converted or are no longer outstanding. The shares of the Series A Preferred Stock are not redeemable by the Company.
In the event of any liquidation, the holders of shares of the Series A Preferred Stock are entitled to receive out of the assets of the Company available for distribution to the Company’s stockholders, before any distribution of assets is made to holders of any other class of capital stock of the Company, an amount equal to the purchase price per share, plus accumulated and unpaid dividends thereon to the date fixed for distribution.
ERF WIRELESS, INC.
NOTES TO THE CONSOLIDATED FINANCIAL STATEMENTS
DECEMBER 31, 2013
ERF Wireless, IncInc. Distribution of EBI Equities to Non-controlling Interest
For the year ended December 31, 2012, the Company had issued 725,611 shares of EBI as a stock dividend and a three-year warrant expiring December 31, 2014 to purchase 725,611 shares of EBI Common Stockcommon stock at an exercise price of $4.00 per share and three year warrant expiring December 31, 2014 to purchase 725,611 shares of EBI Common Stockcommon stock at an exercise price of $6.00;$6.00 per share; such issuances are valued at $107,000. The Company expects to issue the remaining stock dividends in 2013.
ERF WIRELESS, INC.
NOTES TO THE CONSOLIDATED FINANCIAL STATEMENTS
DECEMBER2014. No stock dividends were issued during the year ended December 31, 20122013.
EBI Declared Stock Dividend
During the year ended December 31, 2011, the Company declared a stock dividend to ERF Wireless shareholders of up to 5% of the existing common stock in Energy Broadband, the Company's then wholly owned oil and gas private subsidiary. ERF Wireless declared for each 200 shares of ERF Wireless common stock, that a shareholder owns as of September 30, 2011, the shareholder will receive one unit of Energy Broadband securities consisting of 100 Energy Broadband common shares, one warrant to purchase 100 shares of Energy Broadband at a fixed price of $4.00 per share and one warrant to purchase an additional 100 shares of Energy Broadband at a fixed price of $6.00 per share. The Company has estimated the stock dividend to be 900,000 shares of EBI stock which may not be confirmed for up to 180 days.stock. The stock dividend was recorded based on our historical cost. The EBI shares were originally acquired by ERF at par of $0.001 for a total historical cost of $900. ERF acquired the warrants from EBI on September 30, 2011 at fair value for a total cost of $132,302.
Warrants
The Company’s remaining warrants outstanding to third parties to purchase 3,117 shares of common stock expired duringDuring the year ended December 31, 2012.
During 2009,2013, the Company issuedentered into a convertible promissory notesnote with Tonaquint, Inc. for $1,390,000 to accredited investors$791,500 and issued five-year warrants to purchase 3,117371 shares of common stock at $225$320.00 per share, expiredexpiring March 2012.2018.
During the year ended December 31, 2013, 2013, the Company entered into a convertible promissory note with Willow Creek Capital for $244,200 and issued five-year warrants to purchase 122 shares of common stock at $300.00 per share, expiring April 2018.
During the year ended December 31, 2013, 2013, the Company entered into a convertible promissory note with Vista Capital for $60,500 and issued five year warrants to purchase 36 shares of common stock at $320.00 per share, expiring April 2018.
The following tables set forth summarized warrants that are issued, outstanding and exercisable for the years ended December 31, 20122013 and 2011:2012:
| Warrants Outstanding | ||||||||||||||||||||||||
| Weighted Average Exercise Price | Expiration Date | December 31, 2011 | Issued | Exercised | Expired | December 31, 2012 | ||||||||||||||||||
| $ | 225.00 | Mar-12 | 3,117 | – | – | 3,117 | – | |||||||||||||||||
| Warrants Outstanding | ||||||||||||||||||||||||
| Weighted Average Exercise | Expiration | December 31, | December 31, | |||||||||||||||||||||
| Price | Date | 2012 | Issued | Exercised | Expired | 2013 | ||||||||||||||||||
| $ | 320.00 | Mar-18 | – | 371 | – | – | 371 | |||||||||||||||||
| $ | 320.00 | Apr-18 | – | 36 | – | – | 36 | |||||||||||||||||
| $ | 300.00 | Apr-18 | – | 122 | – | – | 122 | |||||||||||||||||
| Total Warrants | – | 529 | – | – | 529 | |||||||||||||||||||
| Warrants Outstanding | ||||||||||||||||||||||||
| Weighted Average Exercise Price | Expiration Date | December 31, 2010 | Issued | Exercised | Expired | December 31, 2011 | ||||||||||||||||||
| $ | 225.00 | Mar-12 | 3,117 | – | – | – | 3,117 | |||||||||||||||||
| $ | 125.00 | Feb-15 | 500 | – | – | 500 | – | |||||||||||||||||
| $ | 40.00 | Jul-15 | 250 | – | – | 250 | – | |||||||||||||||||
| 3,867 | – | – | 750 | 3,117 | ||||||||||||||||||||
ERF WIRELESS, INC.
NOTES TO THE CONSOLIDATED FINANCIAL STATEMENTS
DECEMBER 31, 20122013
NOTE 8 -7 – STOCK PLAN AND EMPLOYEE STOCK OPTIONS
In May 2013, the board of directors adopted a non-qualified stock option plan whereby 2,500 shares were reserved for issuance. As of December 31, 2013, 2,500 shares of common stock were issued and outstanding to certain employees and consultants for services rendered under the plan. This plan is for key employees, officers, directors, and consultants of ERF Wireless, Inc.
| Non-Qualified Stock Option Plan, May 2013 | 2013-A | |||
| Plan | ||||
| Shares initially reserved | 2,500 | |||
| Shares issued during 2013 | 2,500 | |||
| Remaining shares available to be issued at December 31, 2013 | – | |||
| Shares issued and outstanding as of December 31, 2013 | 2,500 | |||
In December 2012, the board of directors adopted a non-qualified stock option plan whereby 450,0001,125 shares were reserved for issuance. As of December 31, 2012, 18,1202013, 1,125 shares of Common Stockcommon stock were issued and outstanding to certain employees and consultants for services rendered under the plan. This plan is for key employees, officers, directors, and consultants of ERF Wireless, Inc.
| Non-Qualified Stock Option Plan, December 2012 | 2013 | |||
| Plan | ||||
| Shares initially reserved | ||||
| Shares issued during 2012 and 2013 | ||||
| Remaining shares available to be issued at December 31, | ||||
| Shares issued and outstanding as of December 31, | ||||
In April 2012, the board of directors adopted a non-qualified stock option plan whereby 250,000625 shares were reserved for issuance. As of December 31, 2012, 249,721625 shares of Common Stockcommon stock were issued and outstanding to certain employees and consultants for services rendered under the plan. This plan is for key employees, officers, directors, and consultants of ERF Wireless, Inc.
| Non-Qualified Stock Option Plan, April 2012 | 2012 | |||
| Plan | ||||
| Shares initially reserved | ||||
| Shares issued during 2012 | ||||
| Remaining shares available to be issued at December 31, 2012 | ||||
| Shares issued and outstanding as of December 31, 2012 | ||||
In May 2011, the board of directors increased the shares reserved under the 2011 Non-Qualified Stock Option Plan from 50,000 shares to 100,000. As of December 31, 2011, 99,866 shares were issued and outstanding to certain employees and consultants for services rendered. This Plan is for key employees, officers, directors, and consultants of ERF Wireless, Inc.
| ||||
In January 2011, the Board of directors adopted a Non-Qualified Stock Option Plan whereby 50,000 shares were reserved for issuance. As of June 30, 2011, all 50,000 shares were issued to certain employees and consultants for services rendered under the 2011 Non-Qualified Stock Option Plan.
ERF WIRELESS, INC.
NOTES TO THE CONSOLIDATED FINANCIAL STATEMENTS
DECEMBER 31, 20122013
The Company did not grant any options for the year ended December 31, 2012. The Company had granted to a certain officer 400 and 250 stock options whereby holder has elected to cancel the stock options as of December 31, 2011. Option activity was as follows for the year ended December 31, 2011:
| Shares | Weighted-Average Exercise Price | |||||||
| Outstanding at beginning of year | 650 | $ | 135 | |||||
| Granted | – | – | ||||||
| Exercised | – | – | ||||||
| Forfeited/cancelled | (650 | ) | (135 | ) | ||||
| Outstanding at the end of period | – | $ | – | |||||
| Exercisable at December 31, 2011 | – | $ | – | |||||
NOTE 98 - INCOME TAXES
The Company adopted the provisions of ASC Topic 740, "Income Taxes." Implementation of ASC Topic 740 did not have a material cumulative effect on prior periods nor did it result in a change to the current year's provision.
The effective tax rate for the Company is reconcilable to statutory tax rates as follows:
| December 31, 2012 | December 31, 2011 | December 31, 2013 | December 31, 2012 | |||||||||||||||||||||
| U. S. Federal statutory tax rate | % | 34 | % | 34 | % | 34 | % | 34 | ||||||||||||||||
| U.S. valuation difference | (34 | ) | (34 | ) | (34 | ) | (34 | ) | ||||||||||||||||
| Effective U. S. tax rate | – | – | – | – | ||||||||||||||||||||
Income tax expense (benefit) attributable to income from continuing operations differed from the amounts computed by applying the U.S. Federal income tax of 34% to pretax income from continuing operations as a result of the following (in thousands):
| December 31, 2012 | December 31, 2011 | December 31, 2013 | December 31, 2012 | |||||||||||||
| Computed expected tax expense (benefit) | $ | 1,630 | $ | 1,149 | $ | 2,468 | $ | 1,630 | ||||||||
| Change in valuation allowance | (1,630 | ) | (1,149 | ) | (2,468 | ) | (1,630 | ) | ||||||||
| Income tax expense | $ | – | $ | – | $ | – | $ | – | ||||||||
The tax effects of temporary differences that give rise to significant portions of the deferred tax assets and deferred tax liabilities at December 31, 2012,2013, and 2011,2012, are presented below (in thousands):
| December 31, 2012 | December 31, 2011 | December 31, 2013 | December 31, 2012 | |||||||||||||
| Deferred tax assets: | ||||||||||||||||
| Net operating loss carry forwards | $ | 18,283 | $ | 16,653 | $ | 20,751 | $ | 18,283 | ||||||||
| Less valuation allowance | (18,283 | ) | (16,653 | ) | (20,751 | ) | (18,283 | ) | ||||||||
| Net deferred tax assets | $ | – | $ | – | $ | – | $ | – | ||||||||
The Company has determined that a valuation allowance of $18,283,000$20,751,000 at December 31, 2012,2013, is necessary to reduce the deferred tax assets to the amount that will more than likely than not be realized. The change in valuation allowance for 20122013 was approximately $1,630,000.$2,468,000. As of December 31, 2012,2013, the Company has a net operating loss carry-forward of $51,628,000,$58,888,000, which is available to offset future federal taxable income, if any, with expiration beginning 20132019 and ending 2033.
ERF WIRELESS, INC.
NOTES TO THE CONSOLIDATED FINANCIAL STATEMENTS
DECEMBER 31, 20122013
NOTE 109 - EARNINGS PER SHARE
The following table sets forth the computation of basic and diluted earnings per share (in thousands, except per share amount):
| For the twelve months ended December 31, 2012 | ||||||||||||
| Net loss | Shares | Per-Share | ||||||||||
| (Numerator) | (Denominator) | Amount | ||||||||||
| Basic EPS: | ||||||||||||
| Loss from continuing operations | $ | (4,793 | ) | 3,462 | $ | (1.38 | ) | |||||
| Loss attributable to non-controlling interest | $ | (21 | ) | 3,462 | $ | (0.01 | ) | |||||
| Net loss attributable to ERF Wireless, Inc. | $ | (4,814 | ) | 3,462 | $ | (1.39 | ) | |||||
| Diluted EPS: | ||||||||||||
| Effect of dilutive securities | – | – | – | |||||||||
| Loss from continuing operations | $ | (4,793 | ) | 3,462 | $ | (1.38 | ) | |||||
| Loss attributable to non-controlling interest | $ | (21 | ) | 3,462 | $ | (0.01 | ) | |||||
| Net loss attributable to ERF Wireless, Inc. | $ | (4,814 | ) | 3,462 | $ | (1.39 | ) | |||||
| For the twelve months ended December 31, 2013 | ||||||||||||
| Net loss | Shares | Per-Share | ||||||||||
| (Numerator) | (Denominator) | Amount | ||||||||||
| Basic and diluted EPS: | ||||||||||||
| Net loss | $ | (7,264 | ) | 35 | $ | (207.54 | ) | |||||
| For the twelve months ended December 31, 2011 | ||||||||||||
| Net loss | Shares | Per-Share | ||||||||||
| (Numerator) | (Denominator) | Amount | ||||||||||
| Basic EPS: | ||||||||||||
| Loss from continuing operations | $ | (3,301 | ) | 1,368 | $ | (2.41 | ) | |||||
| Loss from discontinued operations | $ | (78 | ) | 1,368 | $ | (0.06 | ) | |||||
| Net loss attributable to ERF Wireless, Inc. | $ | (3,379 | ) | 1,368 | $ | (2.47 | ) | |||||
| Diluted EPS: | ||||||||||||
| Effect of dilutive securities | – | – | – | |||||||||
| Loss from continuing operations | $ | (3,301 | ) | 1,368 | $ | (2.41 | ) | |||||
| Loss from discontinued operations | $ | (78 | ) | 1,368 | $ | (0.06 | ) | |||||
| Net loss attributable to ERF Wireless, Inc. | $ | (3,379 | ) | 1,368 | $ | (2.47 | ) | |||||
| For the twelve months ended December 31, 2012 | ||||||||||||
| Net loss | Shares | Per-Share | ||||||||||
| (Numerator) | (Denominator) | Amount | ||||||||||
| Basic and diluted EPS: | ||||||||||||
| Net loss | $ | (4,814 | ) | 9 | $ | (534.89 | ) | |||||
Diluted earnings per share reflect the potential dilution of securities that could share in the earnings of an entity, such as convertible preferred stock, stock options, warrants or convertible securities.
The calculation of diluted earnings per share for the year ended December 31, 20122013 does not include 680,198100,323 shares of Common Stockcommon stock underlying the Bonds (as define below); and 8,426,982529 of warrants underlying promissory convertible debt, 471,260 shares of Common Stockcommon stock underlying promissory convertible debt and 9,930,982 shares of common stock underlying the Series A Preferred Stock, due to their anti-dilutive effect.
ERF WIRELESS, INC.
NOTES TO THE CONSOLIDATED FINANCIAL STATEMENTS
DECEMBER 31, 2012
NOTE 1110 - MAJOR CUSTOMERS
The Company had gross sales of approximately $7,328,000$7,156,000 and $5,320,000$7,328,000 for the years ended December 31, 20122013 and 2011,2012, respectively. The Company had two customers that met the required disclosure of 10% that represented 32% and 12% of the gross sales during the year ended December 31, 2013. Additionally the Company had two customers that met the required disclosure of 10% that represented 42% and 13% of the gross sales during the year ended December 31, 2012. Additionally the Company had one customer that met the required disclosure of 10% that represented 33% of the gross sales during the year ended December
ERF WIRELESS, INC.
NOTES TO THE CONSOLIDATED FINANCIAL STATEMENTS
DECEMBER 31, 2011.2013
NOTE 1211 - NOTES PAYABLE, LONG-TERM DEBT, LINE OF CREDIT AND CAPITAL LEASES
Notes payable, long-term debts and capital leases consist of the following as of December 31, 20122013 (in thousands):
| Terms | Maturity Date | Interest Rate | Gross Balance | Debt Discount | Balance | Terms | Maturity Date | Interest Rate | Gross Balance | Debt Discount | Balance | |||||||||||||||||||||||||||||
| Banc leasing, Inc. | $10,660 / Month including interest | January-15 | 11.62% | $ | 227 | $ | – | $ | 227 | $10,660 / Month including interest | January-15 | 11.62% | $ | 130 | $ | – | $ | 130 | ||||||||||||||||||||||
| Advantage leasing associates | $7,186 / Month including interest | Various | Various | 156 | – | 156 | $8,269 / Month including interest | Various | Various | 115 | – | 115 | ||||||||||||||||||||||||||||
| Legacy laser services Dallas, LLC | $9,947 / Month including interest | May-16 | 42.00% | 181 | – | 181 | ||||||||||||||||||||||||||||||||||
| MP Nexlevel LLC | $7,043 / Month including interest | May-14 | 10.00% | 111 | – | 111 | $7,043 / Month including interest | May-14 | 10.00% | 34 | – | 34 | ||||||||||||||||||||||||||||
| Tonaquint | $950,400 / Lump sum payment including interest | Immediately due and payable | 12.00% | 793 | – | 793 | ||||||||||||||||||||||||||||||||||
| JMJ Financial | $330,000 / Lump sum payment including interest | March-14 | 12.00% | 232 | 174 | 58 | ||||||||||||||||||||||||||||||||||
| Vista capital | $72,600 / Lump sum payment including interest | Immediately due and payable | 12.00% | 51 | – | 51 | ||||||||||||||||||||||||||||||||||
| Willow creek capital | $293,040 / Lump sum payment including interest | Immediately due and payable | 12.00% | 228 | – | 228 | ||||||||||||||||||||||||||||||||||
| TCA global line of credit | $139,523 / Month including interest | July-14 | 12.00% | 1,019 | 104 | 915 | ||||||||||||||||||||||||||||||||||
| Group 10 | $157,500 / Month including interest | July-14 | 12.00% | 157 | 143 | 14 | ||||||||||||||||||||||||||||||||||
| Investor financing | $765,000 / Lump sum payment including interest | January-13 | 12.00% | 765 | – | 765 | $495,000 / Lump sum payment including interest | April-14 | 12.00% | 473 | – | 473 | ||||||||||||||||||||||||||||
| Premium assignment | $1,495 / Month including interest | July-13 | 6.00% | 17 | – | 17 | $2,063 / Month including interest | September-14 | 5.68% | 18 | – | 18 | ||||||||||||||||||||||||||||
| Dakota capital equipment financing | $178,031 / Quarterly including interest | March-16 | 18.00% | 1,820 | 57 | 1,763 | $178,031 / Quarterly including interest | March-16 | 12.00% | 1,519 | 25 | 1,494 | ||||||||||||||||||||||||||||
| E-bond investor notes | 3 years/ Semiannual interest (See below) | Various | 7.50% | 687 | 566 | 121 | 3 years/ Semiannual interest (See below) | Various | 7.50% | 311 | 182 | 129 | ||||||||||||||||||||||||||||
| Line of credit | 2 years/ Quarterly interest (See below) | December-15 | 12.00% | 3,168 | – | 3,168 | 2 years/ Quarterly interest (See below) | December-16 | 3.00% | 4,281 | – | 4,281 | ||||||||||||||||||||||||||||
| Total debt | $ | 6,951 | $ | 623 | 6,328 | $ | 9,542 | $ | 628 | 8,914 | ||||||||||||||||||||||||||||||
| Less current maturities | (1,527 | ) | (3,435 | ) | ||||||||||||||||||||||||||||||||||||
| Long-term debt | $ | 4,801 | $ | 5,479 | ||||||||||||||||||||||||||||||||||||
The grossnet maturities of these debts are $1,527,000, $3,857,000, $611,000$3,541,000, $702,000, $390,000 and $333,000$4,281,000 for the years ended December 31, 2013, 2014, 2015, 2016 and 2016,2017, respectively.
Notes payable, long-term debt and capital leases consist of the following as of December 31, 20112012 (in thousands):
| Terms | Maturity Date | Interest Rate | Gross Balance | Debt Discount | Balance | |||||||||||||||
| Bancleasing, Inc. | $10,660 / Month including interest | January-15 | 11.62% | $ | 323 | $ | – | $ | 323 | |||||||||||
| Advantage leasing associates | $3,758 / Month including interest | September-14 | 14.21% | 102 | – | 102 | ||||||||||||||
| Agility capital lease | $5,804 / Month including interest | January-12 | 18.82% | 6 | – | 6 | ||||||||||||||
| Premium assignment | $1,495 / Month including interest | July-12 | 7.45% | 10 | – | 10 | ||||||||||||||
| Dakota capital line of credit | $58,750 / Month including interest | March-16 | 18.00% | 2,000 | 87 | 1,913 | ||||||||||||||
| E-bond investor notes | 3 years/ Semiannual interest (See below) | Various | 7.50% | 30 | 27 | 3 | ||||||||||||||
| Line of credit | 2 years/ Quarterly interest (See below) | December-13 | 12.00% | 4,592 | – | 4,592 | ||||||||||||||
| Total debt | $ | 7,063 | $ | 114 | 6,949 | |||||||||||||||
| Less current maturities | (385 | ) | ||||||||||||||||||
| Long-term debt | $ | 6,564 | ||||||||||||||||||
| Terms | Maturity Date | Interest Rate | Gross Balance | Debt Discount | Balance | |||||||||||||||
| Banc leasing, Inc. | $10,660 / Month including interest | January-15 | 11.62% | $ | 227 | $ | – | $ | 227 | |||||||||||
| Advantage leasing associates | $7,186 / Month including interest | Various | Various | 156 | – | 156 | ||||||||||||||
| MP Nexlevel LLC | $7,043 / Month including interest | May-14 | 10.00% | 111 | – | 111 | ||||||||||||||
| Investor financing | $765,000 / Lump sum payment including interest | January-13 | 12.00% | 765 | – | 765 | ||||||||||||||
| Premium assignment | $1,495 / Month including interest | July-13 | 6.00% | 17 | – | 17 | ||||||||||||||
| Dakota capital equipment financing | $178,031 / Quarterly including interest | March-16 | 18.00% | 1,820 | 57 | 1,763 | ||||||||||||||
| E-bond investor notes | 3 years/ Semiannual interest (See below) | Various | 7.50% | 687 | 566 | 121 | ||||||||||||||
| Line of credit | 2 years/ Quarterly interest (See below) | December-15 | 12.00% | 3,168 | – | 3,168 | ||||||||||||||
| Total debt | $ | 6,951 | $ | 623 | 6,328 | |||||||||||||||
| Less current maturities | (1,527 | ) | ||||||||||||||||||
| Long-term debt | $ | 4,801 | ||||||||||||||||||
Line of Credit
DuringIn December 2012,2013, the Company extended its maturity date of itsthe $12.0 million unsecured revolving credit facility with Angus Capital Partners, a related party, maturingwas extended from December 31, 20132015 to December 30, 2015.31, 2017. The Company also renegotiated the interest rate from 12% per annum to 3% per annum retroactive to January 1, 2013. The Company in consideration has accepted the return and cancellation of 36,784 common shares (post-split) of Company common stock issued for the Line of Credit conversions during 2013. The Company has accordingly reversed the payment of principal and interest of $2,158,000 in December 2013 and subsequently received the canceled shares in February 2014. The terms of the unsecured revolving credit facility allow the Company to draw upon the facility as financing requirements dictate and provide for quarterly interest payments at a 12%3% rate per annum. The payment of principal and interest may be paid in cash, common shares or preferred shares at the Company’sLender’s election. The payment of interest may only be paid in cash. At December 31, 2012and 2011,2013 and 2012, the outstanding balance on the line of credit totaled $3,168,000$4,281,000 and $4,592,000,$3,168,000, respectively. The remaining line of credit available at December 31, 2013 and 2012 was $7,719,000 and 2011 was $8,832,000, and $7,408,000, respectively.
For the year ended December 31, 2012, the Company issued 2,222,198 shares of its Common Stock for the settlement of $2,122,385 of principal and $466,615 of accrued interest for a total principal and interest amount of $2,589,000 owed to Angus Capital Partners. The Company issued Common Stock at an average price of $1.17 per share calculated based on the closing price the day the debt was settled.
Additionally for the year ended December 31, 2012,2013, the Company issued 118,0951,763,000 shares of its Series A Preferred Stock to Angus Capital for the settlement of principal amount of $124,000$35,260 of debt. The Company issued Series Preferred A Stock at an average price of $1.05$.02 per share or $8.00 (post-split) per share calculated based on the closing price of the Common Stockcommon stock the day the debt was settled.
ERF WIRELESS, INC.
NOTES TO THE CONSOLIDATED FINANCIAL STATEMENTS
DECEMBER 31, 2012
Under current accounting standards ASC 470-50-40-2, the extinguishment of related party debt for equity securities is considered a capital transaction and, accordingly, no gain or loss on the extinguishment is recognized in the statement of operations. If this was not a related party transaction, a gainloss of $10,850$299,710 would have been recognized for the year ended December 31, 2012.2013.
| 52 |
ERF WIRELESS, INC.
NOTES TO THE CONSOLIDATED FINANCIAL STATEMENTS
DECEMBER 31, 2013
Certain family related trusts are participants in the Angus Capital revolving credit facility. H. Dean Cubley holds the investment and voting power over certain of these family related trusts while Scott Cubley and Brian Cubley, the sons of H. Dean Cubley, have the investment and voting power over other of the remaining other family trusts.
E-Series Bond Investor Note
During the year ended December 31, 2012,2013, the Company issued to certain accredited investors a principal amount of $1,193,000$325,000 of E-Series bonds (the "Bonds") in addition to the $30,000 which. A balance of $687,000 was outstanding at December 31, 2011.2012. At December 31, 2012,2013, the outstanding principal balance of the Bonds totaled $687,000.$311,000. The Bonds are due and payable upon maturity, a three-year period from the issuance date. Interest on the Bonds is payable at the rate of 7.5% per annum, and is payable semiannually. The Bondholder may require the Company to convert the Bond (including any unpaid interest) into shares of Common Stockcommon stock at any time only during the first year. If the Bonds are converted under this option, the Company will issue shares representing 100% of the Bond principal and unpaid interest calculated through maturity. The Common Stockcommon stock issued under this option will be valued at the average closing price average of the common shares for the five days prior to the notification. If the Bond is converted within the first year the Company will issue a three yearthree-year warrant expiring December 31, 2014 to purchase one share of EBI Common Stockcommon stock at a price of $4.00 for every $2.00 of Bond principal.
At the Company's discretion at any time after the first year, the Bonds, including the interest payments calculated through the date of conversion may be redeemed in cash or in shares of our Common Stock,common stock, valued at the average last sales price over the 20-trading-day period preceding any payment date. If the Company chooses to issue Common Stockcommon stock as redemption of the Bond principal, we will issue shares representing a value equal to 125% of the Bond principal and shares representing a value equal to 100% of the Bond interest through redemption date.
The Bonds were determined to include various embedded derivative liabilities. The derivative liabilities are the conversion feature and the redemption option (compound embedded derivative liability). At the date of issuance of the Bond, compound embedded derivative liabilities were measured at fair value using either quoted market prices of financial instruments with similar characteristics or other valuation techniques. These derivative liabilities will be marked-to-market each quarter with the change in fair value recorded in the income statement. The Company uses the effective interest method to record interest expense from the accretion of the debt discount and accretes the unamortized discount upon conversion which totaled $260,638$182,238 for the twelve monthsyear ended December 31, 2012.2013. The estimated debt accretion for subsequent years is $123,350, $216,714$92,678, $88,013 and $225,490$1,547 for years ending December 31, 2013, 2014, 2015 and 2015,2016, respectively.
The following table summarizes the convertible debt activity for the period from January 1, 2012, thru2013 through December 31, 2012:2013:
| Description | Bonds | Compound Derivative Liability | Total | |||||||||
| Fair value at December 31, 2011 | $ | 2,682 | $ | 27,346 | $ | 30,028 | ||||||
| Fair value issuances during 2012 (principal amount) | 1,193,000 | – | 1,193,000 | |||||||||
| Fair value issuances during 2012 (debt discount) | (960,781 | ) | 960,781 | – | ||||||||
| 01-01-12 to 03-31-12 change in fair value | 107,270 | 3,786 | 111,056 | |||||||||
| 03-01-12 to 06-30-12 change in fair value | 31,691 | 5,083 | 36,774 | |||||||||
| 07-01-12 to 09-30-12 change in fair value | 74,981 | 22,848 | 97,829 | |||||||||
| 10-01-12 to12-31-12 change in fair value | 208,603 | (79,453 | ) | 129,150 | ||||||||
| Conversions during 2012 | (536,000 | ) | (448,348 | ) | (984,348 | ) | ||||||
| Fair value at December 31, 2012 | $ | 121,446 | $ | 492,043 | $ | 613,489 | ||||||
| Description | Bonds | Compound Derivative Liability | Total | |||||||||
| Fair value at December 31, 2012 | $ | 121,446 | $ | 492,043 | $ | 613,489 | ||||||
| Fair value of issuances during 2013 (principal amount) | 325,000 | – | 325,000 | |||||||||
| Fair value of issuances during 2013 (debt discount) | (139,216 | ) | 139,216 | – | ||||||||
| Change in fair value | 522,532 | (147,918 | ) | 374,614 | ||||||||
| Conversions | (701,000 | ) | (443,611 | ) | (1,144,611 | ) | ||||||
| Fair value at December 31, 2013 | $ | 128,762 | $ | 39,730 | $ | 168,492 | ||||||
The Company recorded a net change in fair value of derivatives of $47,736$147,918 and a gain on debt redemption of $287,179$156,791 for a total net derivative income of $334,915$304,709 for the year ended December 31, 2012.
ERF WIRELESS, INC.
NOTES TO THE CONSOLIDATED FINANCIAL STATEMENTS
DECEMBER 31, 2012
The following table summarizes the convertible debt activity for the period July 29, 2011, thru December 31, 2011:
| Description | Bonds | Compound Derivative Liability | Total | |||||||||
| Fair value issuance at inception | $ | 15,443 | $ | 84,557 | $ | 100,000 | ||||||
| 07-29-11 to 09-30-11 change in fair value | 650 | 11,210 | 11,860 | |||||||||
| 10-01-11 to 12-31-11 change in fair value | 56,589 | (7,394 | ) | 49,195 | ||||||||
| Conversions during 2011 | (70,000 | ) | (61,027 | ) | (131,027 | ) | ||||||
| Fair value at December 31, 2011 | $ | 2,682 | $ | 27,346 | $ | 30,028 | ||||||
The Company recorded a net change in fair value of derivatives of $3,816 and a gain on debt redemption of $23,063 for a total net derivative income of $19,247 for the year ended December 31, 2011.
Bridge Financing
During 2009, the Company borrowed $1,390,000 from certain accredited investors. These notes are unsecured, bear interest at 10% and are due within one year. During the year ended December 31, 2011 all remaining principal and interest were repaid in full.
In connection with the issuance of the promissory notes, the investors will be issued common stock purchase warrants to purchase up to 3,117 shares of common stock that are exercisable at $225, which expired March 2012.Based on the guidance in ASC 815-10 and ASC 815-40-15, the Company concluded the warrants are required to be accounted for as derivatives as of the issue date due to a reset feature on the exercise price.At the date of issuance the convertible subordinated financing, warrant derivative liabilities were measured at fair value using either quoted market prices of financial instruments with similar characteristics or other valuation techniques.The Company records the fair value of these derivatives on its balance sheet at fair value with changes in the values of these derivatives reflected in the consolidated statements of operations as “Gain (loss) on derivative liabilities.” These derivative instruments are not designated as hedging instruments under ASC 815-10 and are disclosed on the balance sheet under Derivative Liabilities.
The following table summarizes the convertible debt activity for the period January 1, 2011 to December 31, 2011 (in thousands):
| Description | Bridge Note | Warrant Liabilities | Total | |||||||||
| Fair value at January 01, 2011 | $ | 225 | $ | 13 | $ | 238 | ||||||
| 01-01-11 to 03-31-11 change in fair value | – | (13 | ) | (13 | ) | |||||||
| Repayment | (225 | ) | – | (225 | ) | |||||||
| Fair value at December 31, 2011 | $ | – | $ | – | $ | – | ||||||
For the year ended December 31, 2011, net derivative income was $13,000.
The lattice methodology was used to value the warrants issued in the bridge financing, with the following assumptions.
| Warrants | ||||||||
| Assumptions | 3/31/2011 | 6/30/2011 | 9/30/2011 | 12/31/2011 | ||||
| Dividend yield | 0.00% | 0.00% | 0.00% | 0.00% | ||||
| Risk-free rate for term | 0.21% | 0.25% | 0.22% | 0.20% | ||||
| Volatility | 130.00% | 130.00% | 130.00% | 130.00% | ||||
| Maturity date | 1.34 years | 1.01 years | .67 years | .34 years | ||||
Bridge Loan Promissory Note
On September 30, 2011, the Company entered into a six-month secured bridge loan with individuals for $300,000 with an interest rate of eighteen percent (18%). On November 1, 2011 the note was increased to $600,000. During November 2011, the note was repaid in full from the proceeds of an equipment loan from Dakota Capital Fund LLC.
ERF WIRELESS, INC.
NOTES TO THE CONSOLIDATED FINANCIAL STATEMENTS
DECEMBER 31, 20122013.
Dakota Capital Fund LLC Equipment Financing
In November 2011, the Company entered into debt financing agreement with Dakota Capital Fund LLC, for financing of up to $3,000,000. During the fourth quarter of 2011, the Company received proceeds of $2,000,000 and had the option of additional funding of $1,000,000 for equipment purchases. This debt facility is secured by certain ERF Wireless assets and there is no prepayment penalty.At year ended December 31, 2013 and 2012, the outstanding balance on the debt financing agreement totaled $1,494,000 and $1,763,000, andrespectively. Also the Company has elected not to request any additional funds under this credit facility.The payment terms are $178,031 per quarter including interest, at an annual rate of 18% per annum plus 10% of positive operational cash flow as determined on a quarterly basis for repayment of additional principal beginning July 1, 2012. The funding was utilized to purchase equipment to build out networks in oil and gas exploration regions of North America.
| 53 |
ERF WIRELESS, INC.
NOTES TO THE CONSOLIDATED FINANCIAL STATEMENTS
DECEMBER 31, 2013
The Company issued 30,000 shares of Common Stockcommon stock for the consummation of the initial $2,000,000 debt financing agreement from Dakota Capital Fund LLC resulting in a debt discount of $93,600. The Company uses the effective interest method to record interest expense from the accretion of the debt discount and accretes the unamortized discount upon conversion which totaled $29,205$33,014 and $6,770$29,205 for the years ended December 31, 20122013 and 2011,2012, respectively. The estimated debt accretion is $33,014 and $24,611 for yearsyear ending December 31, 2013 and 2014, respectively.2014.
Investor Bridge Loan
On March 20, 2012, the Company entered into a three-month secured bridge financing agreement with certain individuals for $300,000 with and interest rate of 12% per annum. During the second quarter of 2012, the Company was loaned an additional $100,000 increasing the note to $400,000 due July 1, 2012. The note was repaid from a new secured $1,000,000 Investor Financing agreement from these same individuals.
Investor Financing Loan
On July 13, 2012, the Company entered into a three-month secured debt financing agreement with certain individuals for $1,000,000 with an interest rate of 12% per annum. Under thea subsequent modified agreement dated January 2014, as amended, the maturity date washas been extended to January1, 2013.April 15, 2014. Both parties under the amendment agreed to apply the Dakota Capital Fund payment of $181,235.29$181,235 including interest as a subset to the bridge note incurring annote. The Company has also renegotiated the subset interest rate atfrom .5% interest per day on a 360 day calendar year.year to 12% rate per annum retroactive to March 23, 2013. The Company in consideration has accepted the return and cancellation of 796 common shares (post-split) of Company common stock issued during the third quarter of 2013 for interest. The Company also agreed to additional consideration of 5,000 of preferred A shares to be issued as long as the note remains unpaid and a $50,000 penalty to be added to principal in January 2014 for the consideration of the extension of the note. The Company has accordingly reversed the payment of interest of $159,259 in December 2013. At December 31, 2013 and 2012, the outstanding principal balance totaled $765,000.$473,000 and $765,000, respectively.
MP Nexlevel
On July 1, 2012, the Company issued a note to MP Nexlevel LLC., totaling $152,613 bearing interest at 10% per annum and is payable in twenty-four monthly payments of $7,043, including interest. At December 31, 2013 and 2012, the outstanding balance totaled $111,000.$34,000 and $111,000, respectively.
Centramedia, Inc.Tonaquint Convertible Promissory Note
On December 31, 2008,March 5, 2013, the Company issuedentered into a six-month secured convertible promissory note to Centramedia,secured debt financing agreement with Tonaquint, Inc. (“holder”), totaling $600,000for $791,500, bearing interest at 7.5%a rate of 12% per annum and maturing September 5, 2013. At December 31, 2013, the outstanding principal balance of the Tonaquint convertible promissory note totaled $793,000. The note includes an original issue discount (“OID”) of $65,000 based on the consideration funded, prepaid interest of $71,500 and $5,000 in legal and other expense. The Company also paid holder an origination fee in the amount of $227,500 in 144 Stock (711 post-split shares) at the closing bid price on March 5, 2013, plus 125 post-split shares (valued at $40,000) of the Company’s common stock. The holder may require the Company to convert the outstanding principal balance (including any unpaid interest) into shares of restricted common stock at any time after the six-month term of the note. The common stock issued will be valued using a conversion factor of 80% of the average of the lowest two (2) trading prices for common shares during the twenty (20) trading day period ending on the latest complete trading day prior to the conversion date. If the average two (2) lowest trading prices is secured byless than $0.33, then the equipment acquired, payableconversion factor will be reduced to 70%. The holder received the option to purchase five-year warrants expiring March 5, 2018 to purchase 371 shares of ERF common stock at an exercise price of $320.00 or the per-share price at which the common stock is sold in twelve quarterly paymentsan underwritten public offering that closes on or before the date that is six (6) months from the issue date, as may be adjusted from time to time pursuant to the terms and conditions of $56,342 including interest. Duringthis warrant. The Company is not in compliance with all the provisions of the note causing an automatic acceleration of the outstanding balance of $791,500 to $949,800. The note will accrue interest at a rate of 12% from September 5, 2013 until the March 4, 2014 and thereafter at a rate of 18% per annum. The note is recorded as a current liability.
The Tonaquint promissory note was determined to include various embedded derivative liabilities. The derivative liabilities are the conversion feature; conversion price reset feature and the redemption option (compound embedded derivative liability). At the date of issuance of the Tonaquint note, compound embedded derivative liabilities were measured at fair value using either quoted market prices of financial instruments with similar characteristics or other valuation techniques. These derivative liabilities will be marked-to-market each quarter with the change in fair value recorded in the statement of operations. The Company uses the effective interest method to record interest expense from the accretion of the debt discount, which totaled $588,724 for the year ended December 31, 2011, all remaining principal and interest were repaid in full.2013.
| 54 |
Frontier Internet, LLC.The following table summarizes the convertible debt activity for the period from March 5, 2013 through December 31, 2013:
On June 1, 2009, the
| Description | Tonaquint | Warrant Compound Derivative Liability | Compound Derivative Liability | Total | ||||||||||||
| Fair value of issuances at inception | $ | 950,400 | $ | – | $ | – | $ | 950,400 | ||||||||
| Fair value of issuances during 2013 (debt discount) | (588,724 | ) | 16,400 | 256,224 | (316,100 | ) | ||||||||||
| Change in fair value | 588,724 | (16,304 | ) | (175,655 | ) | 396,765 | ||||||||||
| Conversions | (157,032 | ) | – | (157,032 | ) | |||||||||||
| Fair value at December 31, 2013 | $ | 793,368 | $ | 96 | $ | 80,569 | $ | 874,033 | ||||||||
The Company issuedrecorded a note to Frontier Internet LLC., totaling $369,000 bearing interest at 6.0% and is secured by the equipment acquired, payablenet change in twelve quarterly paymentsfair value of $33,846 including interest. Duringderivative income of $26,426 for the year ended December 31, 2011, all remaining principal and interest were repaid in full.2013.
Ronnie D. FranklinJMJ Financial Convertible Promissory Note
On June 1, 2009,March 20, 2013, the Company issuedentered into a one year unsecured promissory note debt financing agreement with JMJ Financial for (“JMJ”) up to Ronnie D. Franklin., totaling $66,000$500,000 at the sole discretion of additional consideration with the Lender. The note includes a 10% original issue discount that is prorated based on the consideration funded. The Company also paid holder an origination fee in the amount of $40,500 in 144 Stock (125 post-split shares) at the closing bid price of the Company’s common stock. As of December 31, 2013 the Company has received funding of $300,000, bearing interest at 6.0%a rate of 12% per annum and maturing in one year from the effective date of each payment. At December 31, 2013, the outstanding principal balance of the JMJ Financial convertible promissory note totaled $232,000 including OID. The conversion price is secured by the equipment acquired, payablelesser of $0.59 or 60% of the lowest trade price in twelve quarterly paymentsthe 25 trading days previous to the conversion. The note is recorded as a current liability.
The JMJ promissory note was determined to include various embedded derivative liabilities. The derivative liabilities are the conversion feature; conversion price reset feature and the redemption option (compound embedded derivative liability). At the date of $6,054 including interest. . Duringissuance of the JMJ note, compound embedded derivative liabilities were measured at fair value using either quoted market prices of financial instruments with similar characteristics or other valuation techniques. These derivative liabilities will be marked-to-market each quarter with the change in fair value recorded in the statement of operations. The Company uses the effective interest method to record interest expense from the accretion of the debt discount and from the accretion of unamortized discount upon conversion which totaled $156,683 for the year ended December 31, 20112013. The estimated debt accretion for the subsequent year is $209,581 for year ending December 31, 2014.
The following table summarizes the convertible debt activity for the period from March 20, 2013 through December 31, 2013:
| Description | JMJ | Compound Derivative Liability | Total | |||||||||
| Fair value of issuances at inception | $ | 330,000 | $ | – | $ | 330,000 | ||||||
| Fair value of issuances during 2013 (debt discount) | (330,000 | ) | 382,260 | 52,260 | ||||||||
| Change in fair value | 156,683 | (248,147 | ) | (91,464 | ) | |||||||
| Conversions | (98,320 | ) | – | (98,320 | ) | |||||||
| Fair value at December 31, 2013 | $ | 58,363 | $ | 134,113 | $ | 192,476 | ||||||
The Company recorded a net change in fair value of derivative income of $162,865 and a loss on debt redemption of $13,819 for a total net derivative income of $149,046 for the year ended December 31, 2013.
Willow Creek Capital Convertible Promissory Note
On April 2, 2013, the Company entered into a nine-month secured convertible promissory note debt financing agreement with Willow Creek Capital, LLC, for $244,200, bearing interest at a rate of 12% per annum and maturing October 1, 2013. The note also includes a 10% OID of $20,000 based on the consideration funded, prepaid interest of $22,200 and $2,000 in legal and other expense. The Company also paid holder an origination fee in the amount of $109,890 in 144 Stock (366 post-split shares) at the closing bid price of the Company’s common stock. The holder may require the Company to convert the outstanding principal balance (including any unpaid interest) into shares of restricted common stock at any time after the six months term of the note. The common stock issued will be valued using a conversion factor of 80% the average of the lowest two (2) trading prices common shares during the twenty (20) trading day period ending on the latest complete trading day prior to the conversion date. If the average two (2) lowest trading prices is less than $0.33, then the conversion factor will be reduced to 70%. The holder will be entitled to purchase from the Company five year warrants expiring April 2, 2018 to purchase 122 post-split shares of ERF common stock at an exercise price of $300.00 or the per-share price at which the common stock is sold in an underwritten public offering that closes on or before the date that is six (6) months from the issue date, as may be adjusted from time to time pursuant to the terms and conditions of this Warrant.
| 55 |
ERF WIRELESS, INC.
NOTES TO THE CONSOLIDATED FINANCIAL STATEMENTS
DECEMBER 31, 2013
The Willow Creek promissory note was determined to include various embedded derivative liabilities. The derivative liabilities are the conversion feature; conversion price full ratchet reset feature and the redemption option (compound embedded derivative liability). At the date of issuance of the Willow Creek note, compound embedded derivative liabilities were measured at fair value using either quoted market prices of financial instruments with similar characteristics or other valuation techniques. These derivative liabilities will be marked-to-market each quarter with the change in fair value recorded in the statement of operations. The Company uses the effective interest method to record interest expense from the accretion of the debt discount and from the accretion of unamortized discount upon conversion which totaled $244,200 for the year ended December 31, 2013. The Company is not in compliance with all remainingthe provisions of the note causing an automatic acceleration of the outstanding balance of $244,200 to $293,040. The note will accrue interest at a rate of 12% from October 1, 2013 until April 1, 2014 and thereafter at a rate of 18% per annum. The note is recorded as a current liability.
The following table summarizes the convertible debt activity for the period from April 2, 2013 through December 31, 2013:
| Description | Willowcreek | Compound Derivative Liability | Total | |||||||||
| Fair value of issuances at inception | $ | 293,040 | $ | – | $ | 293,040 | ||||||
| Fair value of issuances during 2013 (debt discount) | (244,200 | ) | 255,000 | 10,800 | ||||||||
| Change in fair value | 244,200 | (203,724 | ) | 40,476 | ||||||||
| Conversions | (65,240 | ) | – | (65,240 | ) | |||||||
| Fair value at December 31, 2013 | $ | 227,800 | $ | 51,276 | $ | 279,076 | ||||||
The Company recorded a net change in fair value of derivative income of $133,589 for the year ended December 31, 2013.
Vista Capital Convertible Promissory Note
On April 4, 2013, the Company entered into a six-month secured convertible promissory note debt financing agreement with Vista Capital Investments, LLC, for $60,500, bearing interest at a rate of 12% per annum and maturing October 4, 2013. The note also includes a 10% OID of $5,000 based on the consideration funded and prepaid interest of $5,500. The Company also paid holder an origination fee in the amount of $21,175 in 144 Stock (84 post-split shares) at the closing bid price of the Company’s common stock. The holder may require the Company to convert the outstanding principal balance (including any unpaid interest) into shares of restricted common stock at any time after the six months term of the note. The common stock issued will be valued using a conversion factor of 80% the average of the lowest two (2) trading prices common shares during the twenty (20) trading day period ending on the latest complete trading day prior to the conversion date. If the average two (2) lowest trading prices is less than $0.33, then the conversion factor will be reduced to 70%. The holder will be entitled to purchase from the Company five year warrants expiring April 4, 2018 to purchase 36 post-split shares of ERF common stock at an exercise price of $320.00 or the per-share price at which the common stock is sold in an underwritten public offering that closes on or before the date that is six (6) months from the issue date, as may be adjusted from time to time pursuant to the terms and conditions of this Warrant.
The Vista promissory note was determined to include various embedded derivative liabilities. The derivative liabilities are the conversion feature; conversion price full ratchet reset feature and the redemption option (compound embedded derivative liability). At the date of issuance of the Vista note, compound embedded derivative liabilities were measured at fair value using either quoted market prices of financial instruments with similar characteristics or other valuation techniques. These derivative liabilities will be marked-to-market each quarter with the change in fair value recorded in the statement of operations. The Company uses the effective interest method to record interest expense from the accretion of the debt discount and from the accretion of unamortized discount upon conversion which totaled $60,500 for the year ended December 31, 2013. The Company is not in compliance with all the provisions of the note causing an automatic acceleration of the outstanding balance of $60,500 to $72,600. The note will accrue interest at a rate of 12% from October 4, 2013 until April 3, 2014 and thereafter at a rate of 18% per annum.
ERF WIRELESS, INC.
NOTES TO THE CONSOLIDATED FINANCIAL STATEMENTS
DECEMBER 31, 2013
The following table summarizes the convertible debt activity for the period from April 4, 2013 through December 31, 2013:
| Description | Vista | Compound Derivative Liability | Total | |||||||||
| Fair value of issuances at inception | $ | 72,600 | $ | – | $ | 72,600 | ||||||
| Fair value of issuances during 2013 (debt discount) | (60,500 | ) | 70,967 | 10,467 | ||||||||
| Change in fair value | 60,500 | (33,451 | ) | 27,049 | ||||||||
| Conversions | (22,042 | ) | – | (22,042 | ) | |||||||
| Fair value at December 31, 2013 | $ | 50,558 | $ | 37,516 | $ | 88,074 | ||||||
The Company recorded a net change in fair value of derivatives income of $8,731 for the year ended December 31, 2013.
TCA Global Convertible Promissory Note
On June 28, 2013, the Company entered into a twelve-month secured convertible promissory note debt financing agreement with TCA Global Credit Master Fund for $1,500,000, bearing interest at a rate of 12% per annum and maturing July 28, 2014. Under a subsequent modified agreement dated March 25, 2014, TCA has agreed to restructure the agreement and extend the maturity date to November 15th, 2014. The Company in consideration has agreed to a $75,000 restructuring fee to be added to the sum of the principal balance including a $40,791 interest charge to be paid in March and nominal legal fees. The monthly principal and interest payments will be $149,609 per month. At December 31, 2013, the outstanding principal balance of the TCA Global convertible promissory note totaled $1,019,000. The note also includes $153,300 in commitment fees; due diligence fees; document review fees; service fees; legal; and other expense. The holder may require the Company to convert the outstanding principal balance (including any unpaid interest) into shares of restricted common stock at any time during the twelve months term of the note or thereafter. The common stock issued will be valued using a conversion factor of 85% the average VWAP trading price during the five (5) trading day period ending on the latest complete trading day prior to the conversion date.
The TCA Global promissory note was determined to include various embedded derivative liabilities. The derivative liabilities are the conversion feature and the redemption option (compound embedded derivative liability). At the date of issuance of the TCA Global note, compound embedded derivative liabilities were repaidmeasured at fair value using either quoted market prices of financial instruments with similar characteristics or other valuation techniques. These derivative liabilities will be marked-to-market each quarter with the change in full.fair value recorded in the statement of operations. The Company uses the effective interest method to record interest expense from the accretion of the debt discount and from the accretion of unamortized discount upon conversion which totaled $33,989 for the year ended December 31, 2013. The estimated debt accretion for subsequent years is $69,168 and $35,155 for years ending December 31, 2014 and 2015, respectively.
The following table summarizes the convertible debt activity for the period from June 28, 2013 through December 31, 2013:
| Description | TCA Global | Compound Derivative Liability | Total | |||||||||
| Fair value of issuances at inception | $ | 1,500,000 | $ | – | $ | 1,500,000 | ||||||
| Fair value of issuances during 2013 (debt discount) | (138,312 | ) | 138,312 | – | ||||||||
| Change in fair value | 33,989 | (109,596 | ) | (75,607 | ) | |||||||
| Conversions | (480,237 | ) | – | (480,237 | ) | |||||||
| Fair value at December 31, 2013 | $ | 915,440 | $ | 28,716 | $ | 944,156 | ||||||
The Company recorded a net change in fair value of derivatives income of $109,596 for the year ended December 31, 2013.
Group 10 Holdings Convertible Promissory Note
On October 3, 2013, the Company entered into a twelve-month unsecured convertible promissory note debt financing agreement with Group 10 Holdings, LLC, for $157,500, bearing interest at a rate of 12% per annum and maturing October 2, 2014. The note also includes a 5% OID of $7,500 based on the consideration funded. The Company also paid holder a commitment fee in the amount of $45,000 in 144 Stock (1,125 post-split shares) at the closing bid price of the Company’s common stock. The holder may require the Company to convert the outstanding principal balance (including any unpaid interest) into shares of restricted common stock at any time after the twelve months term of the note. The common stock issued will be valued using a conversion factor of 55% multiplied by the lowest closing bid price of the (20) trading days prior to the conversions, which represents a discount rate of 45%.
| 57 |
ERF WIRELESS, INC.
NOTES TO THE CONSOLIDATED FINANCIAL STATEMENTS
DECEMBER 31, 2013
The Group 10 Holdings promissory note was determined to include various embedded derivative liabilities. The derivative liabilities are the conversion feature; conversion price full ratchet reset feature and the redemption option (compound embedded derivative liability). At the date of issuance of the Group 10 note, compound embedded derivative liabilities were measured at fair value using either quoted market prices of financial instruments with similar characteristics or other valuation techniques. These derivative liabilities will be marked-to-market each quarter with the change in fair value recorded in the statement of operations. The Company uses the effective interest method to record interest expense from the accretion of the debt discount and from the accretion of unamortized discount upon conversion which totaled $14,155 for the year ended December 31, 2013. The note will accrue interest at a rate of 12% from October 3, 2013 until October 2, 2014 and thereafter at a rate of 18% per annum.
The following table summarizes the convertible debt activity for the period from October 3, 2013 through December 31, 2013:
| Description | Group 10 | Compound Derivative Liability | Total | |||||||||
| Fair value of issuances at inception | $ | 157,500 | $ | – | $ | 157,500 | ||||||
| Fair value of issuances during 2013 (debt discount) | (157,500 | ) | 304,519 | 147,019 | ||||||||
| Change in fair value | 14,155 | – | 14,155 | |||||||||
| Conversions | – | – | – | |||||||||
| Fair value at December 31, 2013 | $ | 14,155 | $ | 304,519 | $ | 318,674 | ||||||
The Company recorded a net change in fair value of derivatives expense of $51,996 for the year ended December 31, 2013.
Capital Leases
Agility Lease Fund, LLC Included in property and equipment at December 31, 2012, the capitalized equipment is fully amortized. The equipment and one of the Company's bank accounts were the primary collateral securing the financing along with a guarantee by the Company. This lease was repaid in January 2012.
ERF WIRELESS, INC.
NOTES TO THE CONSOLIDATED FINANCIAL STATEMENTS
DECEMBER 31, 2012
Banc Leasing Inc.,Included in property and equipment at December 31, 2012,2013, the cost of the equipment was $610,900 and the accumulated amortization was $493,811. Amortization of assets under capital leases is $239,269 capitalized equipment, net of amortization.included in depreciation expense. The equipment is the primary collateral securing the financing.
Advantage Leasing Inc., Included in vehicles at December 31, 2013, the cost of the vehicles was $273,443 and the accumulated amortization was $157,082. Amortization of assets under capital leases is included in depreciation expense. The vehicles are the primary collateral securing the financing.
Legacy Laser Services Dallas, LLC Included in property and equipment at December 31, 2012,2013, the cost of the equipment was $155,348 and the accumulated amortization was $32,364. Amortization of assets under capital leases is $158,991 capitalized equipment, net of amortization.included in depreciation expense. The equipment is the primary collateral securing the financing.
The following is a schedule by years of future minimum lease payments under capital leases together with the present value of the net minimum lease payments as of December 31, 20122013 (in thousands):
| Year Ending December 31, | ||||
| 2013 | $ | 206 | ||
| 2014 | 203 | |||
| 2015 | 26 | |||
| Thereafter | – | |||
| Total minimum lease payments | 435 | |||
| Less amount representing interest | (52 | ) | ||
| Present value of net minimum lease payments | 383 | |||
| Current maturities of capital lease obligations | (169 | ) | ||
| Long-term portion of capital lease obligations | $ | 214 | ||
| Year Ending December 31, | ||||
| 2014 | $ | 335 | ||
| 2015 | 159 | |||
| 2016 | 63 | |||
| Thereafter | – | |||
| Total minimum lease payments | 557 | |||
| Less amount representing interest | (131 | ) | ||
| Present value of net minimum lease payments | 426 | |||
| Current maturities of capital lease obligations | (252 | ) | ||
| Long-term portion of capital lease obligations | $ | 174 | ||
ERF WIRELESS, INC.
NOTES TO THE CONSOLIDATED FINANCIAL STATEMENTS
DECEMBER 31, 2013
NOTE 1312 - COMMITMENTS
Leases and License Agreements
For the years ended December 31, 20122013 and 2011,2012, rental expenses of approximately $1,058,000$1,253,000 and $722,000,$1,058,000, respectively, were incurred. The Company accounts for rent expense under leases that provide for escalating rentals over the related lease term on a straight-line method. The Company occupies office and tower facilities under several non-cancelable operating lease agreements expiring at various dates through December 2018, and requiring payment of property taxes, insurance, maintenance and utilities.
Future minimum lease payments under non-cancelable operating leases at December 31, 20122013 were as follows:
Year Ending December 31, | Amount | |||||
| 2013 | 478 | |||||
| 2014 | 407 | |||||
| 2015 | 401 | |||||
| 2016 | 385 | |||||
| Thereafter | 7 | |||||
| Total | $ | 1,678 | ||||
| Year Ending December 31, | Amount | |||
| 2014 | 779 | |||
| 2015 | 707 | |||
| 2016 | 610 | |||
| 2017 | 116 | |||
| Thereafter | 9 | |||
| Total | $ | 2,221 | ||
Banc Leasing Inc.,
During August 2007, the Company entered into a contract with Banc Leasing Inc. to fund the Company’s US-Banknet System. Each funding is collateralize by the equipment and normally is repaid over a seven year period with interest established at the date of the inception of the lease. Each lease has a $1 buyout provision. The details of the capital lease are included in Note 12.11.
Purchase Commitment – Mobile Broadband Trailers
On March 15, 2011, the Company entered into a settlement agreement with the current manufacturer of mobile broadband trailers (MBT’s). Under the terms of this settlement the Company agreed to purchase an additional 158 MBT’s and replacement inventory on a delivery schedule which terminates October 1, 2013. At December 31, 2012, the Company has 77 MBT’s to be purchased through October 1, 2013.
ERF WIRELESS, INC.
NOTES TO THE CONSOLIDATED FINANCIAL STATEMENTS
DECEMBER 31, 2012
NOTE 14 -13 – COSTS AND ESTIMATED EARINGSEARNINGS IN EXCESS OF BILLINGS ON UNCOMPLETED CONTRACTS
Costs and estimated earnings in excess of billings on uncompleted contracts for the yearyears ended December 31, 2013 and 2012 are summarized as follows (in thousands):
| December 31, | December 31, | December 31, | ||||||||||
| 2012 | 2013 | 2012 | ||||||||||
| Costs incurred on uncompleted contracts | $ | 21 | $ | 51 | $ | 21 | ||||||
| Estimated profit | 14 | 57 | 14 | |||||||||
| Gross revenue | 35 | 108 | 35 | |||||||||
| Less: billings to date | – | 108 | – | |||||||||
| Costs and profit in excess of billings | $ | 35 | $ | – | $ | 35 | ||||||
Such amounts are included in the accompanying balance sheets at December 31, 2013 and 2012, are summarized as follows (in thousands):
| December 31, | December 31, | December 31, | ||||||||||
| 2012 | 2013 | 2012 | ||||||||||
| Cost and estimated earnings in excess of billings on uncompleted contracts | $ | 35 | $ | – | $ | 35 | ||||||
| Billings in excess of costs and estimated earnings on uncompleted contracts | – | – | – | |||||||||
| $ | 35 | $ | – | $ | 35 | |||||||
ERF WIRELESS, INC.
NOTES TO THE CONSOLIDATED FINANCIAL STATEMENTS
DECEMBER 31, 2013
NOTE 1514 - RELATED PARTY TRANSACTIONS
In January 2011, the Company entered into an agreement for annual professional services with Synchton Incorporated (“Synchton”), an affiliate of Scott Cubley, the adult son of Dr. Cubley, for consulting services. The agreement requires Synchton to provide a minimum commitment of 50 hours per month and we are obligated to pay Synchton $3,000 per month plus an additional $120 per hour for excess hours greater than the required 50 hours per month in cash or shares of common stock. This agreement is automatically renewable on each anniversary date and can be terminated by us by providing a notice of termination at least ninety days prior to the anniversary date. For the years ended December 31, 2012, 20112013 and 2010,2012, total fees incurred by the Company under the agreement were $36,000, $36,000$66,000 and $55,722,$36,000, respectively.
During 2010, Brian Cubley was issued options to purchase a total of 400 shares of common stock at an average exercise price of $85.00 expiring March 31, 2015 for services rendered. These options were cancelled in December 2011. Brian Cubley was compensated in cash and shares of common stock for services rendered for fiscal 2011 and 2010 in the amount of $150,000 and $135,000, respectively. In January 2012, the Company and Brian Cubley, the adult son of Dr. Cubley, entered into an employment agreement pursuant to which he would serve as the director of administration through December 31, 2015, during which time he will be paid an annual salary of $150,000, $24,000 of which will be paid through the issuance of Company common stock. During the year ended December 31, 2012,2013, Mr. Cubley was paid $150,000$131,000 cash, $24,000$19,000 of which will bewas paid through the issuance of 67 post-split shares of Company common stock. During the year ended December 31, 2012, Mr. Cubley was paid $130,000$150,000 cash and $20,000$24,000 of equity through issuance of 11,18528 post-split shares of common stock. Mr. Cubley will also be eligible to earn up to 210,000525 shares of common stock and a warrant to purchase up to 375,000938 shares of common stock upon us achieving certain financial milestones. If Mr. Cubley’ agreement is terminated by us without cause, Mr. Cubley will be entitled to receive the remainder of the salary due under the agreement for the remainder of the term, automatic vesting of all equity awards, and three-year options to purchase up to 150,000 shares of our common stock. At December 31, 2013, Mr. Cubley was paid a $7,000 bonus for achieving certain financial milestones.
In May 2013, the Company entered into a capital lease agreement with Legacy Laser Services Dallas, LLC and (Affiliate). Manny M. Carter is a Managing Member of Legacy Laser Services and a current Board Member of ERF Wireless Inc. At December 31, 2013, the outstanding balance on the capital leases totaled $181,000. The payment terms are $9,947 per month including interest, at a rate of 42% per annum. The capital leased equipment is to be utilized in our networks in oil and gas exploration regions. The equipment is the primary collateral securing the financing.
For the year ended December 31, 2012,2013, the Company issued 2,222,19836,784 post-split shares of its Common Stockcommon stock for the settlement of $2,122,385$1,808,739 of principal and $466,615$349,261 of accrued interest for a total principal and interest amount of $2,589,000$2,158,000 owed to Angus Capital Partners. The Company issued Common Stockcommon stock at an average price of $1.17$58.67 per share calculated based on the closing price the day the debt was settled. At December 31, 2013, Angus Capital Partners and ERF Wireless, Inc. both agreed to reduce the interest rate from the current 12% per annum to 3% per annum retroactive to January 1, 2013 and extend the maturity date of the revolving note to December 31, 2017, while maintaining the maximum Line of Credit of $12 million. The Company in consideration has accepted the return and cancellation of 36,784 common shares (post-split) of Company common stock issued for the Line of Credit conversions during 2013. The Company has accordingly reversed the payment of principal and interest of $2,158,000 in December 2013 and subsequently received the canceled shares in February 2014. See Note 1211 for additional information on this facility.
Additionally for the year ended December 31, 2013, the Company issued 1,763,000 shares of its Series A Preferred Stock to Angus Capital for the settlement of principal amount of $35,260 of debt. The Company issued Series Preferred A Stock at an average price of $.02 per share or $8.00 (post-split) per share calculated based on the closing price of the common stock the day the debt was settled.
Under current accounting standards ASC 470-50-40-2, the extinguishment of related party debt for equity securities is considered a capital transaction and, accordingly, no gain or loss on the extinguishment is recognized in the statement of operations. If this was not a related party transaction, a loss of $299,710 would have been recognized for the year ended December 31, 2013.
For the year ended December 31, 2012, the Company issued 5,556 post-split shares of its common stock for the settlement of $2,122,385 of principal amount of $2,589,000 owed to Angus Capital Partners. The Company issued common stock at an average price of $465.98 per share calculated based on the closing price the day the debt was settled.
Additionally for the year ended December 31, 2012, the Company issued 118,095 shares of its Series A Preferred Stock to Angus Capital for the settlement of principal amount of $124,000 of debt. The Company issued Series Preferred A Stock at an average price of $1.05 per share calculated based on the closing price of the Common Stockcommon stock the day the debt was settled.
ERF WIRELESS, INC.
NOTES TO THE CONSOLIDATED FINANCIAL STATEMENTS
DECEMBER 31, 2012
Under current accounting standards ASC 470-50-40-2 the extinguishment of related party debt for equity securities is considered a capital transaction and, accordingly, no gain or loss on the extinguishment is recognized in the statement of operations. If this was not a related party transaction, a gain of $10,850 would have been recognized for the year ended December 31, 2012.
| 60 |
For the year ended DecemberERF WIRELESS, INC.
NOTES TO THE CONSOLIDATED FINANCIAL STATEMENTS
DECEMBER 31, 2011, the Company issued 643,781 shares of its Common Stock for the settlement of $1,837,006 of principal and $541,468 of accrued interest for a total principal and interest amount of $2,378,474 owed to Angus Capital Partners. The Company issued Common Stock at an average price of $3.69 per share calculated based on the closing price the day the debt was settled. See Note 12 for additional information on this facility2013
Additionally for the year ended December 31, 2011, the Company issued 5,370,304 shares of its Series A Preferred Stock to Angus Capital for the settlement of $350,000 principal and $47,017 of accrued interest for a total amount of $397,017. The Company issued Series Preferred A Stock at an average price of $.0739 per share or $1.84 (post split) per share calculated based on the closing price of the Common Stock the day the debt was settled.
Under current accounting standards ASC 470-50-40-2 the extinguishment of related party debt for equity securities is considered a capital transaction and, accordingly, no gain or loss on the extinguishment is recognized in the statement of operations. If this was not a related party transaction, a gain of $37,763 would have been recognized for the year ended December 31, 2011.
Certain family related trusts are participants in the Angus Capital revolving credit facility. H. Dean Cubley holds the investment and voting power over certain of these family related trusts while Scott Cubley and Brian Cubley, the sons of H. Dean Cubley, have the investment and voting power over other of the remaining other family trusts.
NOTE 1615 - INDUSTRY SEGMENTS
This summary reflects the Company's current segments, as described below.
Energy Broadband, Inc. (EBI)
EBI provides wireless connectivity to rural oil and gas locations primarily via MBT’s. EBI provides wireless broadband products and services focusing primarily on commercial customers providing high speed bandwidth to rural North America to serve the oil and gas sector. All sales from external customers are located within the United States and Canada.
Wireless Bundled Services Division (WBS)
WBS provides wireless broadband products and services to commercial and individual customers throughout the wireless industry. The Company is in the early stages of building and acquiring a seamless wireless broadband network in certain regions of North America to serve private entities, cities, municipalities and the general public. All sales from external customers are located within the United States.
Enterprise Network Services (ENS)
ENS provides product and service to operate an enterprise-class encrypted wireless banking network business. Also, ENS provides the CryptoVue System consisting of software, site-based hardware devices and servers to perform network encryption; contracts for the construction, operation, monitoring and maintenance of fixed wireless networks for banking, healthcare and educational customers; trade names, equipment and software, including the software architecture and design.
Wireless Messaging Services Division (WMS)
WMS principally manufactures paging transmitter equipment, repairs and maintains paging infrastructure equipment and supplies high-power paging transmitters toFor the wireless messaging industry. All sales from external customers are located within the United States as well as certain international locations.year ended December 31, 2013 (in thousands)
| Year Ended December 31, 2013 | EBI | WBS | ENS | Total Segment | ERF Corporate | Total Consolidated | ||||||||||||||||||
| Revenue | $ | 4,311 | $ | 2,441 | $ | 404 | $ | 7,156 | $ | – | $ | 7,156 | ||||||||||||
| Segment income (loss) from operations | 124 | (1,316 | ) | (42 | ) | (1,234 | ) | (3,284 | ) | (4,518 | ) | |||||||||||||
| Total assets | 3,002 | 1,352 | 385 | 4,739 | 333 | 5,072 | ||||||||||||||||||
| Capital expenditures | 361 | 211 | – | 572 | 12 | 584 | ||||||||||||||||||
| Depreciation | 855 | 814 | 234 | 1,903 | 32 | 1,935 | ||||||||||||||||||
For the year ended December 31, 2012 (in thousands)
| Year Ended December 31, 2012 | EBI | WBS | ENS | Total Segment | ERF Corporate | Total Consolidated | ||||||||||||||||||
| Revenue | $ | 4,642 | $ | 2,306 | $ | 380 | $ | 7,328 | $ | – | $ | 7,328 | ||||||||||||
| Segment income (loss) from operations | 609 | (534 | ) | (238 | ) | (163 | ) | (3,441 | ) | (3,604 | ) | |||||||||||||
| Total assets | 3,284 | 2,030 | 675 | 5,989 | 282 | 6,271 | ||||||||||||||||||
| Capital expenditures | 789 | 905 | 5 | 1,699 | 13 | 1,712 | ||||||||||||||||||
| Depreciation | 707 | 654 | 234 | 1,595 | 48 | 1,643 | ||||||||||||||||||
| Reconciliation of Segment Assets to Total Assets | December 31, 2013 | December 31, 2012 | ||||||
| Total segment assets | $ | 4,739 | $ | 5,989 | ||||
| Total corporate assets | 333 | 282 | ||||||
| Total assets | $ | 5,072 | $ | 6,271 | ||||
ERF WIRELESS, INC.
NOTES TO THE CONSOLIDATED FINANCIAL STATEMENTS
DECEMBER 31, 20122013
For the year ended December 31, 2012 (in thousands)
| For the year ended December 31, 2012 | EBI | WBS | ENS | WMS | Total Segment | ERF Corporate | Total Consolidated | |||||||||||||||||||||
| Revenue | $ | 4,642 | $ | 2,283 | $ | 380 | $ | 23 | $ | 7,328 | $ | – | $ | 7,328 | ||||||||||||||
| Operating income (loss) from continuing operations | 609 | (505 | ) | (238 | ) | (29 | ) | (163 | ) | (3,441 | ) | (3,604 | ) | |||||||||||||||
| Total assets | 3,284 | 2,022 | 675 | 8 | 5,989 | 282 | 6,271 | |||||||||||||||||||||
| Capital expenditures | 789 | 905 | 5 | – | 1,699 | 13 | 1,712 | |||||||||||||||||||||
| Depreciation and amortization | 707 | 654 | 234 | – | 1,595 | 48 | 1,643 | |||||||||||||||||||||
For the year ended December 31, 2011 (in thousands)
| For the year ended December 31, 2011 | EBI | WBS | ENS | WMS | Total Segment | ERF Corporate | Total Consolidated | |||||||||||||||||||||
| Revenue | $ | 2,713 | $ | 2,178 | $ | 407 | $ | 22 | $ | 5,320 | $ | – | $ | 5,320 | ||||||||||||||
| Operating income (loss) from continuing operations | 259 | (678 | ) | (75 | ) | (28 | ) | (522 | ) | (3,178 | ) | (3,700 | ) | |||||||||||||||
| Total assets | 2,817 | 1,953 | 908 | 6 | 5,684 | 766 | 6,450 | |||||||||||||||||||||
| Capital expenditures | 1,528 | 542 | 115 | – | 2,185 | 40 | 2,225 | |||||||||||||||||||||
| Depreciation and amortization | 424 | 931 | 219 | – | 1,574 | 69 | 1,643 | |||||||||||||||||||||
For the year ended December 31, 2011 (in thousands)
| Reconciliation of Segment Assets to Total Assets | December 31, 2012 | December 31, 2011 | ||||||
| Total segment assets | $ | 5,989 | $ | 5,684 | ||||
| Total corporate assets | 282 | 766 | ||||||
| Total assets | $ | 6,271 | $ | 6,450 | ||||
The accounting policies of the reportable segments are the same as those described in Footnote 1. The Company evaluates the performance of its operating segments based on income before net interest expense, income taxes, depreciation and amortization expense, accounting changes and non-recurring items.
For the year ended December 31, 20122013 one customer accounted for $165,000 of ENS revenues and two customers accounted for $3,084,000 of EBI Division revenues. One customer accounted for $104,000 of ENS revenues and two customers accounted for $4,086,000 of EBI Division revenues. One customer accounted for $194,000 of ENS revenues and two customers accounted for $2,158,000 of EBI revenues for the year ended December 31, 2011.2012.
ERF WIRELESS, INC.
NOTES TO THE CONSOLIDATED FINANCIAL STATEMENTS
DECEMBER 31, 2012
NOTE 17 - ASSET PURCHASE AND SALE AGREEMENT
On February 14, 2011, the Company sold its North and Central Texas operations and assets for $2,700,000, in cash, settlement holdback receivable of $300,000 and 100,000 common shares of KeyOn Communications, a public company. The holdback receivable of $300,000 was paid in full, net of any settlement expenses.
The asset sale to KeyOn Communication Holding; Inc. on February 14, 2011, was as follows (in thousands):
| KeyOn Communications asset sale | ||||
| Gain on sale of assets to KeyOn Communications Holdings Inc. | $ | 1,176 | ||
| Inventory | 53 | |||
| Deposits | 134 | |||
| Property and equipment | 489 | |||
| Goodwill | 1,079 | |||
| Identifiable intangible assets | 122 | |||
| Accounts payable | (17 | ) | ||
| Accrued expenses | (4 | ) | ||
| Asset selling price | 3,032 | |||
| Holdback settlement receivable | (300 | ) | ||
| Equity securities | (32 | ) | ||
| Proceeds from sale assets | $ | 2,700 | ||
As a condition of the closing of the asset purchase and sale agreement, the Company paid off $431,000 of notes payable and capital leases during the year ended December 31, 2011.
NOTE 1816 - SUBSEQUENT EVENTS
During the first fiscal quarter 2013,of 2014, the Company issued 2,201,190698,788 shares of common stock valued at approximately $40,500 for services rendered, debt, exchange of liabilities, and conversion of preferred stock.
Subsequent to December 31, 2012,2013, the investor financing agreement was modified January 2014, extending the maturity date to April 15, 2014. Both parties have renegotiated the subset interest rate from .5% interest per day on a 360 day calendar year to 12% rate per annum retroactive to March 23, 2013. The Company entered intoalso agreed to additional consideration of 5,000 of Preferred A shares to be issued as long as the note remains unpaid and a three-month unsecured credit facility with$50,000 penalty to be added to principal in January 2014.
Subsequent to December 31, 2013, TCA Global Credit Master Fund, effective March 25, 2014, has agreed to restructure the loan agreement and extend the maturity date to November 15th, 2014. The Company in consideration has agreed to a financial institution, under which the lender, at its option, may advance up$75,000 restructuring fee to $500,000be added to the Company. The Company borrowed $100,000 undersum of the facility, which was repaid onprincipal balance including a $40,791 interest charge to be paid in March 12, 2013. Additionally, on March 5,and nominal legal fees.
Subsequent to December 31, 2013, the Company, received conversion notices from the various debt holders and made conversions toward the Tonaquint, JMJ, and Willow Creek convertible promissory notes of $49,000, $51,000, and $31,000, respectively and issued a six month convertible secured promissory note in the original principal amountstock of $650,00045,674, 108,500 and original issue discount and prepaid interest of $141,500.37,148, respectively.
ITEM 9. CHANGES IN AND DISAGREEMENTS WITH ACCOUNTANTS ON ACCOUNTING AND FINANCIAL DISCLOSURE
None.
ITEM 9A. CONTROLS AND PROCEDURES
Evaluation of Disclosure Controls and Procedures
We maintain disclosure controls and procedures that are designed to ensure that information required to be disclosed in our Exchange Act reports is recorded, processed, summarized and reported within the time periods specified in the Securities and Exchange Commission’s rules and forms and that such information is accumulated and communicated to our management, including our Chief Executive Officer and Chief Financial Officer, as appropriate, to allow for timely decisions regarding required disclosure. In designing and evaluating the disclosure controls and procedures, management recognizes that any controls and procedures, no matter how well designed and operated, can provide only reasonable assurance of achieving the desired control objectives, and management is required to apply its judgment in evaluating the cost-benefit relationship of possible controls and procedures. Our disclosure controls and procedures were designed to provide reasonable assurance that the controls and procedures would meet their objectives.
As required by SEC Rule 13a-15(b), we carried out an evaluation, under the supervision and with the participation of our management, including our Chief Executive Officer and Chief Financial Officer, of the effectiveness of the design and operation of our disclosure controls and procedures as of the end of the period covered by this report. Based on the foregoing, our Chief Executive Officer and Chief Financial Officer concluded that as of December 31, 2012,2013, our disclosure controls and procedures were effective at the reasonable assurance level.
Management’s Annual Report on Internal Control over Financial Reporting
Internal control over financial reporting refers to the process designed by, or under the supervision of, our Chief Executive Officer and Chief Financial Officer, and effected by our board of directors, management and other personnel, to provide reasonable assurance regarding the reliability of financial reporting and the preparation of financial statements for external purposes in accordance with generally accepted accounting principles, and includes those policies and procedures that:
(1) Pertain to the maintenance of records that in reasonable detail accurately and fairly reflect the transactions and dispositions of our assets;
(2) Provide reasonable assurance that transactions are recorded as necessary to permit preparation of financial statements in accordance with generally accepted accounting principles, and that our receipts and expenditures are being made only in accordance with authorization of our management and directors; and
(3) Provide reasonable assurance regarding prevention or timely detection of unauthorized acquisitions, use or disposition of our assets that could have a material effect on the financial statements.
Internal control over financial reporting cannot provide absolute assurance of achieving financial reporting objectives because of its inherent limitations. Internal control over financial reporting is a process that involves human diligence and compliance and is subject to lapses in judgment and breakdowns resulting from human failures. Internal control over financial reporting also can be circumvented by collusion or improper management override. Because of such limitations, there is a risk that material misstatements may not be prevented or detected on a timely basis by internal control over financial reporting. However, these inherent limitations are known features of the financial reporting process. Therefore, it is possible to design into the process safeguards to reduce, though not eliminate, this risk. Management is responsible for establishing and maintaining adequate internal control over financial reporting for the Company.
Management has used the framework set forth in the report entitledInternal Control-Integrated Framework published by the Committee of Sponsoring Organizations of the Treadway Commission, known as COSO, to evaluate the effectiveness of our internal control over financial reporting. Based on this assessment, management has concluded that our internal control over financial reporting was effective as of December 31, 2012.2013.
This Annual Report does not include an attestation report of our independent registered public accounting firm regarding internal control over financial reporting. Management's report was not subject to attestation by our registered public accounting firm pursuant to the Dodd-Frank Wall Street Reform and Consumer Protection Act, which permanently exempts non-accelerated filers (generally issuers with a public float under $75 million) from complying with Section 404(b) of the Sarbanes-Oxley Act of 2002.
| 63 |
There has been no change in our internal controls over financial reporting during our most recent fiscal quarter that has materially affected, or is reasonably likely to materially affect, our internal controls over financial reporting.
ITEM 9B. OTHER INFORMATION
None.
PART III
ITEM 10. DIRECTORS, EXECUTIVE OFFICERS, AND CORPORATE GOVERNANCE
Executive Officers and Directors
Our directorsThe members of our Board of Directors (“Board”) and executive officers and their ages as of MarchApril 15, 2013,2014, are shown below.
| Name | Age | Position |
| H. Dean Cubley | Chairman of the Board of Directors and Chief Executive Officer | |
| Director and Chief Financial Officer | ||
| Timothy A. Maxson | Chief Operations Officer | |
| Director | ||
| Bartus H. Batson | Director | |
| Manny M. Carter | Director | |
| Director and Chairman of the Audit Committee |
Dr. H. Dean Cubleyhas served as our Chairman since May 2004 and as Chief Executive Officer since October 2006. Between March 1996 and September 2006, Dr. Cubley served as a director of Eagle Broadband, Inc. (“Eagle Broadband”), a provider of broadband Internet and video over fiber-to-the-home, paging and mobile high power wireless transmitter and receiver equipment, and various communications products and services. Dr. Cubley also served as Chief Executive Officer of Eagle Broadband from 1995 through September 2003, and as chief technology officer from September 2003 to September 2004. Dr. Cubley has been involved in forming, funding and operating wireless enterprises for over 30 years. Dr. Cubley holds a bachelor’s and master’s degree in electrical engineering from the University of Texas at Austin and a Ph.D. in electrical engineering from the University of Houston. Dr. Cubley’ executive leadership and his extensive experience in the broadband services industry and related wireless business, qualifies Dr. Cubley to serve as a member of our Board.
Richard R. RoyallGreg Smith has served as a member of our Board since August 2004 and as of March 2014 accepted the position as Chief Financial Officer. Mr. Smith also served as our Executive Vice President of ENS from March 2008 to September 2010, as Chief Financial Officer sincefrom August 2004 to March 2008.2008, as the Chief Executive Officer from August 2004 to October 2006 and as a consultant from September 2010 to March 2014. Mr. Royall is a certified public accountant and since 1972, has been engaged in the private practice of accounting concentration of expertise in accounting, mergers, acquisitions and SEC registrations and filings including implementation of SOX 404 compliance. Mr. Royall has been a partner in Royall & Fleschler since 1987, a private accounting firm focused on taxation and professional services to emerging companies.Mr. RoyallSmith holds a bachelor of business administration with a concentration on accountingin finance from the UniversitySam Houston State University. Mr. Smith's professional background also includes over 33 years of Texas at Austin.Mr. Royall’s Chief Financial Officer experiencedexecutive management and expertise in public company accounting provides him with valuable financial and accounting expertisecorporate finance experience, which the Board believes qualifies him to serve as a member of our Board.
Timothy A. Maxson has served as our Chief Operating Officer since January 2013. Prior to joining ERF Wireless, Mr. Maxson served as President and General Manager of Manitex Load King, Inc. from March of 2008 through 2011. Mr. Maxson is a decorated Gulf war veteran and served in the United States Air Force from December 1985 to December 1995. Mr. Maxson holds a bachelor’s degree from The Ohio State University. TimMr. Maxson serves on several boards and committees all of which are privately held corporations or organizations. TimMr. Maxson has also held several senior leadership roles in various manufacturing and technology based businesses.
| 64 |
N. Thomas WiedebushRichard R. Royall served as our Chief Financial Officer from March 2008 to March 2014 and has served as a member of ourthe Board since December 2011 and as Chief Operating Officer from July 2012 to December 2012. Between 2002 and 2004,March 2008. Since March 2013, Mr. WiedebushRoyall has served as the Chief OperatingFinancial Officer of Stearns Financial Services,Coil Tubing Technology, Inc. Mr. Royall is a diversified financial organization,certified public accountant and as group executivesince 1972, has been engaged in the private practice of western regionaccounting concentration of Marquette Banks,expertise in accounting, mergers, acquisitions and SEC registrations and filings including implementation of SOX 404 compliance. Mr. Royall has been a banking organization with operationspartner in eight states. Mr. WiedebushRoyall & Fleschler since 1987, a private accounting firm focused on taxation and professional services to emerging companies.Mr. Royall holds a bachelor’s degreebachelor of business administration with a concentration on accounting from Northern State University. Mr. Wiedebush has over 36 yearsthe University of Texas at Austin.Mr. Royall’s Chief Financial Officer experience and expertise in the banking industry,public company accounting provides him with valuable financial and accounting expertise which the Board believes qualifies him to serve as a member of our Board.
R. Greg Smith has served as a member of our Board since August 2004 and as a consultant since September 2010. Mr. Smith also served as our Executive Vice President of ENS from July 2008 to September 2010, as Chief Financial Officer from October 2006 to March 2008, and as the Chief Executive Officer from August 2004 to October 2006. Mr. Smith holds a bachelor of business administration in finance from Sam Houston State University. Mr. Smith's professional background also includes over 30 years of executive management and corporate finance experience, which the Board believes qualifies him to serve as a member of our Board.
Dr. Bartus H. Batson has served as an independent member of our Board since January 2005. Dr. Batson has served as President, Chief Executive Officer and Chairman of X-Analog Communications, Inc., a telecommunications company from March 1992 until July 2009, and as a consultant and expert technical witness since 2009. Dr. Batson holds a bachelor of science in electrical engineering from Arlington State College (now the University of Texas at Arlington) in 1963, holds a master of science and a Ph.D. degree in electrical engineering from the University of Houston in 1967 and 1972, respectively. Dr. Batson has over 40 years of experience in all fields of telecommunications with a major focus in satellite communications and wireless systems, which the Board believes qualifies him to serve as a member of our Board.
Manny M. Carter joined as an independent member of our Board in October 2012.2012 and Chairman of the Compensation Committee January 2014. Mr. Carter has been retired since November 2004. Between November 2001 and November 2004, Mr. Carter served as the President and Chief Operating Officer of Eagle Broadband. Prior to 2001, Mr. Carter served in a number of executive level positions, including Executive Vice President International of Pennzoil Products division and executive vice president of MPSI, Inc. Mr. Carter also spent nearly 30 years with Mobil Oil Corporation, where he held positions of increasing responsibility, the most recent of which was general manager of international marketing from 1986 to 1990. Mr. Carter holds a bachelor of business administration from the University of Texas at Austin. The Board believes that Mr. Carter’s executive leadership experience and background in financial reporting qualifies him to serve as a member of our Board.
J. Bruce LancasterRick Zachardy joined as an independent member of our Board and Chairman of the Audit Committee in February 2013. From December 2012 to current, Mr. Lancaster now serves as Controller of Forum Energy Technologies (NYSE:FET) formerly Dynacon. Between December 2011 and NovemberMarch 2014. Since 2012, Mr. LancasterZachardy has served as an Independent Consultant providing CFO, Controller and Tax services to clients in various industries. Mr. Zachardy served as a Senior Tax Manager of Deloitte Tax, LLP National Partnership Solutions between 2010 and 2011. Prior to 2010, Mr. Zachardy served in several executive positions, including Chief Financial Officer of Dynacom, Inc. From April 2011 and November 2011, Mr. Lancaster served as ControllerTabani Group, Inc and Chief Financial Officer of Groundforce Building Systems. Between June 2007RM Crowe. Mr. Zachardy over the last 15 years has held positions of increasing responsibilities of Controller and February 2011,Director of accounting including Real Estate Senior Tax Manager with KPMG, LLP/ Arthur Anderson, LLP. Mr. Lancaster served on the Board of Directors at OI Corporation, a NASDAQ listed Company, while concurrently serving as Chief Executive Officer and Chief Financial Officer. In early 2007 Mr. Lancaster had joined OI and served as Vice President and Chief Financial Officer. Mr. Lancaster served as Director, Executive Vice President and CFO for Boss Holdings, Inc., (OTCBB: BSHI) from 1998 to 2006. Mr. Lancaster previously served as Vice President of Finance and Administration for Acme Boot Co. During 1996 and 1997 and Vice President of Finance for the former Kinark Corporation, an AMEX listed company, from 1989 to 1995. Mr. LancasterZachardy holds both a bachelor’s and master’s degree of businessscience administration from Texas A&MRegis University and a master’s of taxation from the University of Denver and is a Certified Public Accountant. The Board believes that Mr. Lancaster’sZachardy’s executive leadership, accounting experience and consulting background provides our Board of Directors with valuable financial reporting, compliance, accounting and controls experience.
Family Relationships
None.
Board Leadership Structure
Our Board of Directors has the responsibility for selecting the appropriate leadership structure for the Company. In making leadership structure determinations, the Board of Directors considers many factors, including the specific needs of the business and what is in the best interests of the Company’s stockholders. Our current leadership structure is comprised of a combined Chairman of the Board and Chief Executive Officer (“CEO”), Dr. Cubley. The Board of Directors believes that this leadership structure is the most effective and efficient for the Company at this time. Dr. Cubley possesses detailed and in-depth knowledge of the issues, opportunities, and challenges facing the Company, and is thus best positioned to develop agendas that ensure that the Board of Directors’ time and attention are focused on the most critical matters. Combining the Chairman of the Board and CEO roles promotes decisive leadership, fosters clear accountability and enhances the Company’s ability to communicate its message and strategy clearly and consistently to our stockholders, particularly during periods of turbulent economic and industry conditions.
Risk Oversight
Effective risk oversight is an important priority of the Board of Directors. Because risks are considered in virtually every business decision, the Board of Directors discusses risk throughout the year generally or in connection with specific proposed actions. The Board of Directors’ approach to risk oversight includes understanding the critical risks in the Company’s business and strategy, evaluating the Company’s risk management processes, allocating responsibilities for risk oversight among the full Board of Directors, and fostering an appropriate culture of integrity and compliance with legal responsibilities.
| 65 |
The Board exercises direct oversight of strategic risks to the Company. The Audit Committee reviews and assesses the Company’s processes to manage business and financial risk and financial reporting risk. It also reviews the Company’s policies for risk assessment and assesses steps management has taken to control significant risks. The Compensation Committee oversees risks relating to compensation programs and policies. In each case management periodically reports to our Board or relevant committee, which provides the relevant oversight on risk assessment and mitigation.
Arrangements between Officers and Directors
To our knowledge, there is no arrangement or understanding between any of our officers and any other person, including directors, pursuant to which the officer was selected to serve as an officer.
Committees of the Board & Director Independence
Our board of directors is currently composed of six directors, with Messrs. Batson, Carter and LancasterZachardy qualifying as independent directors based on the definition of an independent director set forth in Section 240.10 A-3Rule 10A-3 of the SecuritiesExchange Actand the NASDAQ listing standards, even though the NASDAQ listing standards are not currently applicable. to the Company, because the Company’s common stock is listed on the OTCBB, not NASDAQ. We are not currently subject to corporate governance rules that require that a board of directors be composed of a majority of independent directors. The Board has not established any committeesan audit and accordingly, the Board serves as the audit, compensation and nomination committees.committee. We believe that Mr. Carter and Mr. Lancaster qualifiesZachardy qualify as an “Audit Committee Financial Expert.” WeExperts” (as defined in the SEC rules) because they have not adopted any procedures regarding stockholders nominating directors. There have been no changesthe following attributes: (i) an understanding of generally accepted accounting principles in the United States of America (“GAAP”) and financial statements; (ii) the ability to assess the general application of such principles in connection with accounting for estimates, accruals and reserves; (iii) experience analyzing and evaluating financial statements that present a breadth and level of complexity of accounting issues that are generally comparable to the proceduresbreadth and complexity of issues that can reasonably be expected to be raised by our financial statements; (iv) an understanding of internal control over financial reporting; and (v) an understanding of audit committee functions.
Audit Committee
The board has established an audit committee, which security holders may recommend nomineesis comprised of Rick Zachardy, Manny M. Carter and Dr. Batson. The audit committee considers and has approval authority over all engagements of the independent auditors. All of the engagements resulting in the fees disclosed above for fiscal 2013-2012 were approved by the audit committee prior to the engagement.
Compensation Committee
The compensation committee has the primary authority to determine the Company’s compensation philosophy and to establish compensation for the Company’s senior executive officers. Manny Carter, Dr. Batson, and Rick Zachardy compose the compensation committee with Manny Carter being its chairman. The compensation committee oversees the Company’s compensation and benefit plans and policies; administers the Company’s stock option plans; reviews the compensation components provided to officers, employees, and consultants; grants equity compensation to our officers, employees, and consultants; and reviews and makes recommendations to the Board regarding all forms of compensation to be provided to the members of the Board.
The compensation committee generally sets the initial compensation of each senior executive. The compensation committee annually reviews and in some cases adjusts compensation for senior executives. Although, the chief executive officer provides recommendations to the compensation committee regarding the compensation of the senior executive officers, the compensation committee has full authority over all compensation matters relating to senior executive officers. The chief executive officer has full authority over compensation for all other company employees and contractors other than senior executive officers.
Board of Directors Meetings
During the fiscal year that ended on December 31, 2013, the Board held six meetings and took various other actions via the unanimous written consent of the Board of Directors. All directors attended at least 75% of the Board of Directors meetings and committee meetings relating to the committees on which each director served during fiscal year 2013. The Company did not hold an annual stockholders meeting in 2012 or 2013. Each director of the Company is expected to be present at annual meetings of stockholders, absent exigent circumstances that prevent their attendance. Where a director is unable to attend an annual meeting in person but is able to do so by electronic conferencing, the Company will arrange for the director’s participation by means where the director can hear, and be heard, by those present at the meeting.
| 66 |
Stockholder Communications with the Board
Our stockholders and other interested parties may communicate with members of the Board by submitting such communications in writing to our CEO, 2911 South Shore Boulevard, Suite 100, League City, Texas 77573, who, upon receipt of any communication other than one that is clearly marked “Confidential,” will note the date the communication was received, open the communication, make a copy of it for our files and promptly forward the communication to the director(s) to whom it is addressed. Upon receipt of any communication that is clearly marked “Confidential,” our CEO will not open the communication, but will note the date the communication was received and promptly forward the communication to the director(s) to whom it is addressed. If the correspondence is not addressed to any particular Board member or members, the communication will be brought to the attention of the entire Board.
Section 16(A) Beneficial Ownership Reporting Compliance
Section 16(a) of the Exchange Act requires the Company's directors and executive officers, and persons who own beneficially more than ten percent of the common stock of the Company, to file reports of ownership and changes of ownership with the Securities and Exchange Commission. Based solely on the reports received by the Company and on written representations from certain reporting persons, the Company believes that the directors, executive officers, and greater than ten percent beneficial owners have complied with all applicable filing requirements.
Code of Ethics
Our Company has adopted a Code of Business Conduct and Ethics (the “Code”) applicable to our Company’s directors, officers (including the Chief Executive Officer and Chief Financial Officer and persons performing similar functions), employees, agents and consultants. Our Code satisfies the requirements of a “code of ethics” within the meaning of Section 406 of the Sarbanes-Oxley Act of 2002 and the rules issued by the Securities and Exchange Commission thereunder. Amendments to, or waivers from, a provision of our Code that apply to our Company’s directors or executive officers, including the Chief Executive Officer and Chief Financial Officer and persons performing similar functions, may be made only by the Company’s board of directors. This Code is publicly available on the Company’s website at erfwireless.com. The Company intends to disclose future amendments to, or waivers from, certain provisions of its Code of Ethics on its website in accordance with applicable SEC requirements.
ITEM 11. EXECUTIVE COMPENSATION
Compensation Discussion and Analysis
Objectives of Our Executive Compensation Program
The compensation committee of our Board administers our executive compensation program. The general philosophy of our executive compensation program is to align executive compensation with the Company’s business objectives and the long-term interests of our stockholders. To that end, the compensation committee believes executive compensation packages provided by the Company to its executives, including the named executive officers should include both cash and stock-based compensation that reward performance as measured against established goals. In addition, the Company strives to provide compensation that is competitive with other peer group companies and that will allow us to attract, motivate, and retain qualified executives with superior talent and abilities. Our executive compensation is designed to reward achievement of the Company’s corporate goals.
The Role of the Compensation Committee
The compensation committee has the primary authority to determine the Company’s compensation philosophy and to establish compensation for the Company’s senior executive officers. Dr. Cubley, Dr. Batson, and N. Thomas Wiedebush compose the compensation committee with Dr. Cubley being its chairman. The compensation committee oversees the Company’s compensation and benefit plans and policies; administers the Company’s stock option plans; reviews the compensation components provided to officers, employees, and consultants; grants equity compensation to our officers, employees, and consultants; and reviews and makes recommendations to the Board regarding all forms of compensation to be provided to the members of the Board.
The compensation committee generally sets the initial compensation of each senior executive. The compensation committee annually reviews and in some cases adjusts compensation for senior executives. Although, the chief executive officer provides recommendations to the compensation committee regarding the compensation of the senior executive officers, the compensation committee has full authority over all compensation matters relating to senior executive officers. The chief executive officer has full authority over compensation for all other company employees and contractors other than senior executive officers.
Elements of Executive Compensation
Although the compensation committee has not adopted any formal guidelines for allocating total compensation between equity compensation and cash compensation, it strives to maintain a strong link between executive incentives and the creation of stockholder value. Executive compensation consists of the following elements:
Base Salary. Base salaries for our executives are generally established based on the scope of their responsibilities, taking into account competitive market compensation paid by other companies for similar positions and recognizing cost of living considerations. Prior to making its recommendations and determinations, the compensation committee reviews each executive’s:
| · | historical pay levels; |
| · | past performance; and |
| · | expected future contributions. |
The compensation committee does not use any particular indices or formulae to arrive at each executive’s recommended pay level.
Equity Award. We also use long-term incentives primarily in the form of stock grants. Employees and executive officers generally receive stock grants at the commencement of employment, the majority of which, if not all, vest upon the attainment of corporate goals. We believe that stock grants are instrumental in aligning the long-term interests of the Company’s employees and executive officers with those of the stockholders.
Compensation Committee Interlocks and Insider Participation
None of the members of our compensation committee is an officer or employee of our company. None of our executive officers currently serves, or in the past year has served, as a member of the board of directors or compensation committee of any entity that has one or more executive officers serving on our board of directors or compensation committee.
Summary Compensation Table
The following table sets forth certain information regarding our Chief Executive Officer and two of our most highly-compensated executive officers whose total annual salary and bonus for the fiscal year ended December 31, 20122013 exceeded $100,000.
| Name and Principal Position | Fiscal Year | Salary ($) | Bonus ($) | Stock Awards ($) | Stock Option Awards ($) | All Other Compensation ($) | Total ($) | Fiscal Year | Salary | Bonus ($) | Stock Awards ($) | Stock Option Awards ($) | All Other ($) | Total ($) | ||||
| H. Dean Cubley | 2012 | 135,000 | – | 21,270 | (1) | – | 156,270 | 2013 | 135,000 | – | 24,000 | (1) | – | 159,000 | ||||
| Chairman of the Board and CEO | 2011 | 135,000 | – | 4,200 | (1) | – | 139,200 | 2012 | 135,000 | – | 21,270 | (1) | – | 156,270 | ||||
| Richard R Royall | 2012 | 11,781 | – | 13,150 | (2) | – | 24,931 | (5) | 2013 | 160,933 | – | 19,150 | (2) | – | 180,083 | |||
| Director and CFO | 2011 | 11,781 | – | 200,000 | (3) | – | 211,781 | 2012 | 197,300 | – | 13,150 | (3) | – | 210,450 | ||||
| Brian Cubley | 2012 | 130,000 | – | 20,000 | (4) | 150,000 | ||||||||||||
| Director of Administration | 2011 | 126,000 | – | 24,000 | (4) | 150,000 | ||||||||||||
| Timothy A. Maxson | 2013 | 165,000 | – | 20,000 | (4) | 185,000 | ||||||||||||
| Chief Operations Officer | ||||||||||||||||||
* Does not include perquisites and other personal benefits or property, unless the aggregate amount of such compensation is more than $10,000. No executive officer earned any non-equity incentive plan compensation or nonqualified deferred compensation during the periods reported above. The Stock Award column in the table above represents the fair value of certain shares of common stock (as described in the footnotes below) issued to the executives as calculated in accordance with Financial Accounting Standards Board Accounting Standards Codification Topic 718.
| (1) | Amount represents shares of our common stock received by Dr. Cubley for compensation for serving as a director and as a member of the Compensation Committee. The amount reflects the value of the number of shares issued using the closing market price on the date of issuance. |
| (2) | Amount represents shares of our common stock received by Mr. Royall for compensation in the amount of |
| (3) | Amount represents shares of our common stock received by Mr. Royall for compensation in the amount of |
| (4) | Amount represents shares of our common stock received by Mr. |
| (5) | Richard Royall effective on March 14, 2014, tendered his resignation as CFO of ERF Wireless, Inc. in order to devote more time to his accounting practice in Houston on a full time basis. |
| 68 |
Outstanding Equity Awards at December 31, 20122013
None of our named executive officers held outstanding stock options to purchase shares of our common stock or unvested shares of our common stock at December 31, 2012.2013. None of our named executive officers held stock awards or shares issued by us with vesting restrictions in 2012.2013. During 2012,2013, no named executive officer exercised any stock options issued by us.
Employment and Consulting Agreements
We have previously entered into employment agreements with the following named executive officers:
Timothy Maxson. Mr. Maxson’s employment is a two year agreement beginning January 2013 and expiring December 31, 2014, servingpursuant to which Mr. Maxson serves as Chief Operations Officer. During the term of his employment, Mr. Maxson is entitled to (i) base salary of $175,000 per year, (ii) standard benefits that are available to other Company executive officers, (iii) stock grants of up to 60,000150 shares meeting certain vesting requirements within first year and (iiii) receives cash performance based bonuses up to 65% of annual cash salary over the next two years when meeting certain specific financial profitability goals as reported in the Company’s Quarterly Reports on Form 10-Q and Annual Reports on Form 10-K..
Brian Cubley Mr. Cubley’s, employment is a four year agreement beginning January 2012 expiring December 31, 2015, serving as Director of Administration. During the term of his employment, Mr. Cubley is entitled to (i) a base salary of $150,000 per year, (ii) standard benefits that are available to other Company executive officers, and (iii) stock grants of up to 210,000525 shares common stock and a warrant to purchase up to 375,000938 shares of common stock upon us achieving certain financial milestones.
We have not entered into employment agreements with the following named executive officers. We have not entered into employment agreements with Dr. Cubley or Mr. Royall. We haveSmith. During 2013 we entered into a verbal consulting arrangement with Greg Smith, a member of our Board, pursuant to which Mr. Smith is paid $150,000 annually. During the year ended December 31, 2012,2013, Mr. Smith was paid $146,000$150,000 pursuant to this consulting arrangement, and received $20,000 for services previously rendered.
In July 2012, the Company and N. Thomas Wiedebush entered into an agreement pursuant to which Mr. Wiedebush would serve as our Chief Operating Officer, on an interim basis, for a period of ninety days. Under the agreement, Mr. Wiedebush was entitled to receive a monthly salary of $10,000 and a number of shares of our common stock per month equal to $12,000 (based upon the closing price of our common stock on the last day of such month). The agreement was terminable at will by either party, provided that upon termination of the agreement by us, Mr. Wiedebush would be entitled to receive the remainder of his salary for the entire term of the agreement. In October 2012, the Company and Mr. Wiedebush verbally agreed to extend the term of the agreement through December 31, 2012, at a reduced monthly salary of $5,000 and a number of shares of common stock equal to $6,000 per month. During the year ended December 31, 2012, Mr. Wiedebush was paid an aggregate of $59,000, consisting of $18,000 of cash and $41,000 through the issuance of 26,222shares of our common stock.arrangement.
Director Compensation
Set forth below is information regarding compensation paid to each director during 2012.2013. Additionally, we reimburse our directors for travel and lodging expenses in connection with their attendance at board meetings.
| Name | Fees Earned or Paid in Cash ($) | Stock Awards ($)(1) | Option Awards ($) | Non-Equity Incentive Plan Compensation ($) | Change in Pension Value and Nonqualified Deferred Compensation Earnings ($) | All Other Compensation ($) | Total ($) | Fees Earned or Paid in Cash ($) | Stock Awards ($) | (1) | Option Awards ($) | Non-Equity Incentive Plan Compensation ($) | Change in Pension Value and Nonqualified Deferred Compensation Earnings ($) | All Other Compensation ($) | Total ($) | |||||||||||
| H. Dean Cubley | – | 21,270 | – | 21,270 | 24,130 | - | - | - | - | 24,130 | ||||||||||||||||
| Richard R. Royall | – | 13,150 | – | 13,150 | - | 19,150 | - | - | - | - | 19,150 | |||||||||||||||
| N. Thomas Wiedebush | – | 17,210 | – | 17,210 | ||||||||||||||||||||||
| R. Greg Smith | – | 13,150 | – | 166,000 | (2) | 179,150 | - | 19,150 | - | - | - | 150,000 | (2) | 169,150 | ||||||||||||
| Bartus H. Batson | – | 17,210 | – | 17,210 | - | 27,640 | - | - | - | - | 27,640 | |||||||||||||||
| Manny M. Carter | 8,250 | - | - | - | - | - | 8,250 | |||||||||||||||||||
| J. Bruce Lancaster | 6,750 | (4) | - | - | - | - | 6,750 | |||||||||||||||||||
| N. Thomas Wiedebush | - | 23,715 | (5) | - | - | - | 18,000 | (3) | 41,715 | |||||||||||||||||
| (1) | Amounts in this column represent the |
| (2) | Represents consulting fees paid to Mr. Smith during |
| (3) | Represents consulting fees paid to Mr. Wiedebush during 2013. |
| (4) | N. Thomas Wiedebush effective on November 25, 2013, resigned from his position as a Director for personal reasons. |
| (5) | J. Bruce Lancaster effective on August 6, 2013, resigned from his position as a Director for personal reasons. |
Committees of the Board & Director Independence
Our board of directors is currently composed of six directors, with Messrs. Batson, Carter and Lancaster qualifying as independent directors based on the definition of an independent director set forth in Section 240.10A-3 of the Securities Actand the NASDAQ listing standards, even though the NASDAQ listing standards are not currently applicable. We are not currently subject to corporate governance rules that require that a board of directors be composed of a majority of independent directors. The Board has not established any committees and, accordingly, the Board serves as the audit, compensation, and nomination committees. We believe that Mr. Carter and Mr. Lancaster qualify as an “Audit Committee Financial Expert.” We have not adopted any procedures regarding stockholders nominating directors. There have been no changes to the procedures by which security holders may recommend nominees to the Board of Directors.
| 69 |
Involvement in Certain Legal Proceedings
In November 2007, Eagle Broadband filed voluntary petitions for reorganization under Chapter 11 of the U.S. Bankruptcy Code. Dr. Cubley served as a director of Eagle Broadband until September 2006. Except for the preceding disclosure, to our knowledge, during the last ten years, none of our directors, executive officers (including those of our subsidiaries), promoters or control persons have;
| · | had a bankruptcy petition filed by or against any business of which such person was a general partner or executive officer either at the time of the bankruptcy or within two years prior to that time; | |
| · | been convicted in a criminal proceeding or been subject to a pending criminal proceeding, excluding traffic violations and other minor offenses; | |
| · | was the subject of, or a party to, any Federal or State judicial or administrative order, judgment, decree, or finding, not subsequently reversed, suspended or vacated, relating to an alleged violation of (i) any Federal or State securities or commodities law or regulation; or (ii) any law or regulation respecting financial institutions or insurance companies including, but not limited to, a temporary or permanent injunction, order of disgorgement or restitution, civil money penalty or temporary or permanent cease-and-desist order, or removal or prohibition order; or (iii) any law or regulation prohibiting mail or wire fraud or fraud in connection with any business entity; | |
| · | been found by a court of competent jurisdiction (in a civil action), the SEC, or the Commodities Futures Trading Commission to have violated a federal or state securities or commodities law, and the judgment has not been reversed, suspended or vacated; and | |
| · | been the subject to, or a party to, any sanction or order, not subsequently reverse, suspended or vacated, of any self-regulatory organization, any registered entity, or any equivalent exchange, association, entity or organization that has disciplinary authority over its members or persons associated with a member. |
ITEM 12. SECURITY OWNERSHIP OF CERTAIN BENEFICIAL OWNERS AND MANAGEMENT AND RELATED STOCKHOLDER MATTERS
As of March 15, 2013, 7,688,26231, 2014, 1,001,743 shares of common stock were outstanding and 8,426,9829,380,129 shares of Series A Preferred Stock were outstanding. The following table sets forth, as of such date, information with respect to shares beneficially owned by:
| · | each person who is known by us to be the beneficial owner of more than 5% of our outstanding shares of common stock; |
| · | each of our directors; |
| · | each of our named executive officers; and all of our directors and executive officers as a group. |
Beneficial ownership has been determined in accordance with Rule 13d-3 of the Exchange Act. Under this rule, shares may be deemed to be beneficially owned by more than one person (if, for example, persons share the power to vote or the power to dispose of the shares). In addition, shares are deemed to be beneficially owned by a person if the person has the right to acquire shares (for example, upon exercise of an option) within 60 days of the date of this table. In computing the percentage ownership of any person, the amount of shares includes the amount of shares beneficially owned by the person by reason of these acquisition rights. As a result, the percentage of outstanding shares of any person does not necessarily reflect the person's actual voting power.
To our knowledge, except as indicated in the footnotes to this table and pursuant to applicable community property laws, the persons named in the table have sole voting and investment power with respect to all shares of common stock shown as beneficially owned by them. Unless otherwise indicated, the business address of the individuals and entities listed is 2911 South Shore Blvd., Suite 100, League City, Texas 77573.
| SHARES OF COMMON STOCK BENEFICIALLY OWNED (1) | SHARES OF SERIES A PREFERRED STOCK BENEFICIALLY OWNED | TOTAL PERCENTAGE OF VOTING POWER (2) | SHARES OF COMMON STOCK (1) | SHARES OF SERIES A PREFERRED STOCK BENEFICIALLY OWNED | TOTAL PERCENTAGE OF VOTING POWER (2) | |||||||||||||||||||||||||
| NAME AND ADDRESS OF BENEFICIAL OWNER | NUMBER | % | NUMBER | % | NUMBER | % | NUMBER | % | NUMBER | % | NUMBER | % | ||||||||||||||||||
| Officers and Directors | ||||||||||||||||||||||||||||||
| Dr. H. Dean Cubley | 16,437 | (3) | * | 8,199,692 | (4) | 97.30% | 819,985,676 | (5) | 96.4% | 1,802 | (3) | * | 9,112,692 | (4) | 97.15% | 911,271,041 | (5) | 97.0% | ||||||||||||
| Richard R. Royall | 8,845 | * | - | - | 8,845 | * | 100 | * | - | - | 100 | * | ||||||||||||||||||
| R. Greg Smith | 57,057 | (6) | 0.74% | - | - | 57,057 | * | 206 | (6) | * | - | - | 206 | * | ||||||||||||||||
| Dr Bartus H. Batson | 10,586 | * | - | - | 10,586 | * | 120 | * | - | - | 120 | * | ||||||||||||||||||
| N. Thomas Wiedebush | 29,222 | * | - | - | 29,222 | * | ||||||||||||||||||||||||
| Manny M. Carter | - | * | - | - | - | * | 100 | * | - | - | 100 | * | ||||||||||||||||||
| Tim Maxson | 100 | * | - | - | 100 | * | ||||||||||||||||||||||||
| All Executives Officers and Directors as a group | 122,147 | 1.59% | 8,199,692 | 97.3% | 820,091,386 | 96.4% | 2,428 | 0.24% | 9,112,692 | 97.1% | 911,271,667 | 97.0% | ||||||||||||||||||
| (6 persons) | ||||||||||||||||||||||||||||||
| 5% or more shareholders | ||||||||||||||||||||||||||||||
| STJV Trust | 7,220 | * | 6,478,852 | 76.88% | 647,892,428 | (7) | 77.5% | 18 | * | 7,391,852 | 78.80% | 739,185,226 | (7) | 78.7% | ||||||||||||||||
| Carson Family Trust | 674 | * | 458,068 | 5.44% | 45,807,474 | (8) | 5.3% | 2 | * | 458,068 | 4.88% | 45,806,802 | (8) | 4.9% | ||||||||||||||||
| Systom Trust | 647 | * | 458,006 | 5.43% | 45,801,224 | (9) | 5.3% | 2 | * | 458,006 | 4.88% | 45,800,579 | (9) | 4.9% | ||||||||||||||||
| Pauline Trust | 1,084 | * | 429,331 | 5.09% | 42,934,184 | (10) | 5.0% | 3 | * | 429,331 | 4.58% | 42,933,103 | (10) | 4.6% | ||||||||||||||||
* Less than 1%
| (1) | This column does not include the shares of common stock issuable upon conversion of the Series A Preferred Stock. Each share of Series A Preferred Stock converts into one share of common stock. |
| (2) | This column includes the Series A Preferred Stock shares, which are provided the right to 100 votes on all matters in which the common stockholders and preferred stockholders vote together. For purposes of calculating the percentage of total voting power, we assumed voting of |
| (3) | Consists of (i) |
| (4) | Consists of (i) |
| (5) | Consists of (i) |
| (6) | Shares reported as beneficially owned by Mr. Smith are held by Lariat Financial, Inc. Mr. Smith has sole voting and investment power of the shares held by Lariat Financial, Inc. |
| (7) | Consists of (i) |
| (8) | Consists of (i) |
| (9) | Consists of (i) |
| (10) | Consists of (i) |
ITEM 13. CERTAIN RELATIONSHIPS AND RELATED TRANSACTIONS, AND DIRECTOR INDEPENDENCE
Angus Credit Facility
In 2006, we entered into an unsecured revolving credit facility with Angus Capital Partners (“Angus”) maturing on December 31, 2015. Angus serves as the investment manager for the HC-1 Trust and the Sealink Trust, the funding entities of the Angus credit facility (“Funding Trusts”). Since 2010, amounts owed under the facility were repaid directly to the Funding Trusts and the STJV Trust, entities that have funded the revolving credit facility (“Receiving Trusts”), at the direction of Angus. Brian Cubley, the adult son of Dr. Cubley, is the trustee of the HC-1 Trust and the Sealink Trust. Dr. Cubley is the trustee of the STJV Trust. Dr. Cubley and his adult sons Brian Cubley and Scott Cubley are sole beneficiaries under the Receiving Trusts. The terms of the unsecured revolving credit facility allow us to draw up to $12 million as financing as requirements dictate. All borrowing under the credit facility accrues interest at an annual 12% rate and is unsecured. The outstanding principal and any accrued interest under the facility may be paid in cash, common stock, or shares of Series A Preferred Stock, at ourAngus’ election.
On January 1, 2010, there was a principal amount of $5,448,811 and accrued interest of $1,816 outstanding under the Angus credit facility. During 2010, an aggregate of $3,026,134 was advanced by the Funding Trusts under the Angus credit facility, and we repaid the Receiving Trusts an aggregate of $2,403,926 ($421,238 of which was accrued interest) through the issuance of 6,140,121 shares of its Series A Preferred Stock. The Series A Preferred Stock was valued at an average price of $0.3915 per share determined upon the settlement date and based upon the market price of our common stock.
During 2011, an aggregate of $1,553,557 was advanced by the Funding Trusts under the Angus credit facility, and we repaid the Receiving Trusts an aggregate of (i) $397,017 ($47,017 of which was accrued interest) through the issuance of 5,370,304 shares of its Series A Preferred Stock and (ii) $2,378,474 ($541,468 of which was accrued interest) through the issuance of 643,7811,609 post-split shares of its common stock. In connection with these payments, we agreed to amend the Series A Preferred Stock designation to increase the voting rights of each preferred share from 50 votes to 100 votes on all matters in which the common stock holders and preferred stock holders vote together. The Series A Preferred Stock was valued at an average price of $0.0739 per share determined upon the settlement date and based upon the market price of our common stock) and the common stock was valued at an average price of $3.69 per share; each such valuation determined upon the settlement date and based upon the market price of our common stock.
During the year ended December 31, 2012, an aggregate of $822,852 was advanced by the Funding Trusts under the Angus credit facility, and we repaid the Receiving Trusts an aggregate of (i) $124,000 through the issuance of 118,095 shares of its Series A Preferred Stock and (ii) $2,589,000 ($466,615 of which was accrued interest) through the issuance 2,222,1985,556 post-split shares of its common stock. The Series A Preferred Stock was valued at an average price of $1.05 per share and the common stock was valued at an average price of $1.17$465.98 per share; each such valuation determined upon the settlement date. At December 31, 2012, we had an outstanding principal balance of $3,168,000, and accrued interest of $4,226 under the Angus credit facility.
During the year ended December 31, 2013, an aggregate of $1,164,969 was advanced by the Funding Trusts under the Angus credit facility, and we repaid the Receiving Trusts an aggregate of $35,260 through the issuance of 1,763,000 shares of our Series A Preferred Stock. The Series A Preferred Stock was valued at an average price of $.02 per share or $8.00 (post-split) per share with each such valuation determined upon the settlement date. At December 31, 2013, we had an outstanding principal balance of $4,281,000, and accrued interest of $123,809 under the Angus credit facility.
Dakota Credit Facility
In November 2011, we borrowed $2,000,000, and had the option of additional funding at $1,000,000 for equipment financing, pursuant to a debt financing agreement with Dakota. This debt facility is secured by certain of our assets.Dennis Batteen, an executive officer of Dakota, is the brother-in-law of N. Thomas Wiedebush, who servesserved as a member of our board in 2013 and as Chief Operating Officer.Officer in 2012. At December 31, 2012,2013, the outstanding balance on the facility totaled $1,763,000,$1,494,000, bearing interest at an annual rate of 18%, and we have elected not to request any additional funds under this credit facility. Thepayment terms are $178,031 per quarter including interest, plus 10% of positive operational cash flow as determined on a quarterly basis for repayment of additional principal beginning July 1, 2012, with all outstanding amounts due and payable on September 30, 2014. The funding was utilized to purchase equipment to build out networks in major oil and gas exploration regions of North America.
Synchton Incorporated
In January 2011, the Company entered into an agreement for annual professional services with Synchton Incorporated (“Synchton”), an affiliate of Scott Cubley, the adult son of Dr. Cubley, for consulting services. The agreement requires Synchton to provide a minimum commitment of 50 hours per month and we are obligated to pay Synchton $3,000 per month plus an additional $120 per hour for excess hours greater than the required 50 hours per month in cash or shares of common stock. This agreement is automatically renewable on each anniversary date and can be terminated by us by providing a notice of termination at least ninety days prior to the anniversary date. For the years ended December 31, 2013, 2012, 2011 and 2010, total fees incurred by the Company under the agreement were $36,000,$66,000,$36,000, $36,000 and $55,722, respectively.
| 72 |
Energy Broadband
In September 2011, we declared a stock dividend to our shareholders consisting of 5% of the existing common stock in Energy Broadband, our wholly owned subsidiary. The EBI Dividend resulted in the issuance to each shareholder of record as of September 30, 2011, for each 200 shares of our common stock, including Series A Preferred Stock convertible into 200 common shares, (i) 100 shares of Energy Broadband common stock, (ii) one three-year warrant to purchase 100 shares of Energy Broadband common stock at a price of $4.00 per share, and (iii) a second three-year warrant to purchase 100 shares of Energy Broadband at a price of $6.00 per share. Each of our officers, directors, and 5% or more shareholders who held shares of our common stock or preferred stock received their pro-rata portion of the dividend.
Payment of Consulting Fees
During 2010, we paid Greg Smith, a director of the Company, an aggregate of $130,039 for services rendered, of which $50,000 was for services rendered as a consultant subsequent to his resignation as an executive officer of the Company in August 2010. During 2011, we paid Mr. Smith $150,000 for consulting services rendered to the Company, consisting of $147,300 cash and 300,000 shares of our common stock valued at $0.009 per share (as of the grant date). During the year ended December 31, 2012, Mr. Smith was paid $146,000 pursuant to this consulting arrangement, and received $20,000 for services previously rendered. During the year ended December 31, 2013, Mr. Smith was paid $150,000 pursuant to this consulting arrangement.
Other Agreements
During 2010, Brian Cubley, was issued options to purchase a totalthe adult son of 400 shares of common stock at an average exercise price of $85.00 expiring March 31, 2015 for services rendered. These options were cancelled in December 2011. BrianDr. Cubley, was compensated in cash and shares of common stock for services rendered for fiscal 2011 and 2010 in the amount of $150,000 and $135,000, respectively. In January 2012, the Company and Brian Cubley entered into an employment agreement pursuant to which he would serve as the director of administration through December 31, 2015, during which he will be paid an annual salary of $150,000, $24,000 of which will be paid through the issuance of Company common stock. During the year ended December 31, 2013, Mr. Cubley was paid $131,000 cash, $19,000 of which was paid through the issuance of 67 post-split shares of Company common stock. During the year ended December 31, 2012, Mr. Cubley was paid $130,000 cash and $20,000 equity through issuance of 11,18528 post-split shares of common stock.stock. Mr. Cubley will also be eligible to earn up to 210,000525 shares of common stock and a warrant to purchase up to 375,000938 shares of common stock upon us achieving certain financial milestones. If Mr. Cubley’ agreement is terminated by us without cause, Mr. Cubley will be entitled to receive the remainder of the salary due under the agreement for the remainder of the term, automatic vesting of all equity awards, and three-year options to purchase up to 150,000375 shares of our common stock.
In May 2013, the Company entered into a capital lease agreement with Legacy Laser Services Dallas, LLC and (Affiliate). Manny M. Carter is a Managing Member of Legacy Laser Services and a current Board Member of ERF Wireless Inc. At December 31, 2013, the outstanding balance on the capital leases totaled $181,000. The payment terms are $9,947 per month including interest, at an annual rate of 42% per annum. The capital leased equipment is to be utilized in our networks in oil and gas exploration regions. The equipment is the primary collateral securing the financing.
Review and Approval of Related Party Transactions
We review all relationships and transactions in which we and certain related persons, including our directors, named executive officers, and their immediate family members, are participants, to determine whether such persons have a direct or indirect material interest. The entire Board has responsibility for the development and implementation of processes and controls to obtain information from the directors and named executive officers with respect to related party transactions and for then determining, based upon the facts and circumstances, whether we or a related party has a direct or indirect material interest in the transaction. As required under SEC rules, transactions that are determined to be directly or indirectly material to us or the related party are disclosed in our periodic filings. In addition, a disinterested majority of the full Board reviews and approves any related party transaction that is required to be disclosed.
ITEM 14. PRINCIPAL ACCOUNTANT FEES AND SERVICES
General
During the fiscal years ended December 31, 2012,2013, and December 31, 2011,2012, the aggregate fees billed by LBB & Associates Ltd., LLP, were as follows:
| December 31, | December 31, | December 31, | December 31, | |||||||||||||
| 2012 | 2011 | 2013 | 2012 | |||||||||||||
| Audit fees | $ | 126,647 | $ | 112,684 | $ | 128,637 | $ | 126,647 | ||||||||
| Audit related fees | $ | – | $ | 2,560 | $ | – | $ | – | ||||||||
| Tax fees | $ | – | $ | – | $ | – | $ | – | ||||||||
| All other fees | $ | – | $ | – | $ | – | $ | – | ||||||||
Audit Fees
Consist of fees billed for professional services rendered for the audit of our annual consolidated financial statements and review of the quarterly condensed consolidated financial statements and services that are normally provided by LBB & Associates Ltd., LLP, in connection with statutory and regulatory filings or engagements.
Audit-Related Fees
Consist of fees billed for assurance and related services that are reasonably related to the performance of the audit or review of our consolidated financial statements and are not reported under "Audit Fees."
Tax Fees
Consist of fees billed for professional services for tax compliance, tax advice and tax planning.
All Other Fees
Consist of fees for products and services other than the services reported above.
Audit Committee Pre-approval Policies and Procedures
Other than Dr. Batson, N. Thomas WiedebushMr. Carter and J. Bruce Lancaster,Mr. Zachardy, none of the directors are independent as defined by Rule 10A-3 of the Exchange Act. The board has established an audit committee, which is comprised of J. Bruce Lancaster, N. Thomas Wiedebush,Rick Zachardy, Manny M. Carter and Dr. Batson. The audit committee considers and has approval authority over all engagements of the independent auditors. All of the engagements resulting in the fees disclosed above for fiscal 2012-20112013-2012 were approved by the audit committee prior to the engagement.
| 74 |
ITEM 15. EXHIBITS AND FINANCIAL STATEMENT SCHEDULES
(a) The following documents are filed as part of this Form 10-K:
1. Financial Statements
The following financial statements are included in Part II, Item 8 of this Form 10-K:
| · | Report of Independent Registered Public Accounting Firm |
| · | Consolidated Balance Sheets as of December 31, |
| · | Consolidated Statements of Operations for the Years Ended December 31, |
| · | Consolidated Statements of Shareholders’ Deficit for the Years Ended December 31, |
| · | Consolidated Statements of Cash Flows for the Years Ended December 31, |
| · | Notes to the Consolidated Financial Statements |
2. Exhibits
The exhibits listed in the Exhibit Index, which appears immediately following the signature page, are incorporated herein by reference, and are filed as part of this Form10-K.Form 10-K.
3. Financial Statement Schedules
Financial statement schedules are omitted because they are not required or are not applicable, or the required information is provided in the consolidated financial statements or notes described in Item 15(a) (1) above.
SIGNATURES
Pursuant to the requirements of Section 13 or 15(d) of the Securities Exchange Act of 1934, the registrant has duly caused this report to be signed on its behalf by the undersigned, thereunto duly authorized.
| ERF WIRELESS, INC. | |
| By: | |
Name: Dr. H. Dean Cubley Title: Chief Executive Officer (Principal Executive Officer) Date:
|
Pursuant to the requirements of the Securities Exchange Act of 1934, this report has been signed below by the following persons on behalf of the registrant and in the capacities and on the dates indicated.
| Signature | Title | Date |
| /S/ Dr. H. Dean Cubley | Chairman of the Board of Directors Principal Executive Officer, and Director | |
| Dr. H. Dean Cubley | ||
| /S/ | Director, Chief Financial Officer, | |
| Principal Financial Officer and Principal Accounting Officer | ||
| /S/ Richard R. | Director | |
| Richard R. | ||
| /S/ Dr. Bartus H. Batson | Director | |
| Dr. Bartus H. Batson | ||
| /S/ Manny M. Carter | Director | |
| Manny M. Carter | ||
| /S/ | Director | |
Exhibit Index
Exhibit Index
Exhibit No. | Description of Exhibit | |
| 2.1 | Agreement and Plan of Merger between Fleetclean Systems, Inc. and ERF Wireless, Inc. (incorporated by reference to Exhibit 2.l of the Company’s Form 10-QSB for the period ended September 30, 2004) | |
| 2.2 | Articles of Merger (incorporated by reference to Exhibit 2.2 of the Company’s Form 10-QSB for the period ended September 30, 2004) | |
| 3.1 | Articles of Incorporation of ERF Wireless, Inc. (incorporated by reference to Exhibit 3.1(i) of the Company’s Form 10-QSB for the period ended September 30, 2004) | |
| 3.2 | Certificate of Amendment to Articles of Incorporation of ERF Wireless, Inc. (incorporated by reference to Exhibit 3.1.1(i) of the Company’s Form 10-QSB for the period ended September 30, 2004) | |
| 3.3 | Certificate of Amendment to Articles of Incorporation of ERF Wireless, Inc. (incorporated by reference to Exhibit 3.1 of the Company’s Form 8-K filed December 14, 2012. | |
| 3.4 | Certificate of Amendment to Articles of Incorporation of ERF Wireless, Inc. (incorporated by reference to Exhibit 3.2 of the Company’s Form 8-K filed December 14, 2012. | |
| 3.5 | Amended and Restated Certificate of Designation of ERF Wireless, Inc. (incorporated by reference to Exhibit 4.4 of the Company’s Form 8-K filed December 10, 2010). | |
| 3.6 | Bylaws of ERF Wireless, Inc. (incorporated by reference to Exhibit 3.2(i) of the Company’s Form 10-QSB for the period ended September 30, 2004) | |
| 3.7 | Designation of Preferences (incorporated by reference to Exhibit 4.1 of the Company’s Form 10-QSB for the period ended September 30, 2004) | |
| 3.8 | Amendment to Designation of Preferences (incorporated by reference to Exhibit 4.1 of the Company’s Form 10-QSB for the period ended March 31, 2005) | |
| 3.9 | Amended and Restated Designation of Series A Preferred Stock (incorporated by reference to Exhibit 4.3 of the Company’s Form SB-2 filed on December 12, 2005) | |
| 3.10 | Certificate of Amendment To Articles of Incorporation (December 2013) (incorporated by reference to Exhibit 3.1 of the Company’s Form 8-K filed on December 18, 2013) | |
| 10.1 | Description of consulting arrangement by and between the Company and R. Greg Smith (incorporated by reference to Exhibit 10.1 of the Company’s Form S-1 filed on December 24, 2012) | |
| 10.2 | Independent Contractor Agreement by and between the Company and N. Thomas Wiedebush dated July 13, 2012 (incorporated by reference to Exhibit 10.2 of the Company’s Form S-1 filed on December 24, 2012) | |
| 10.3 | Asset and Liability Contribution Agreement dated March 31, 2004 between Fleetclean Systems, Inc. and Fleetclean Chemicals, Inc. (incorporated by reference to Exhibit 10.5 of the Company’s Form 10-QSB for March 31, 2004) | |
| 10.4 | Stock Purchase Agreement dated May 15, 2004 between Systom Trust Joint Venture and Kenneth A. Phillips et. al. (incorporated by reference to Exhibit 10.1 of the Company’s Form 8-K filed May 28, 2004) | |
| 10.5 | Acquisition Agreement dated May 15, 2004 between Kenneth A. Phillips and Fleetclean Systems, Inc. (incorporated by reference to Exhibit 10.3 of the Company’s Form 8-K filed May 28, 2004) | |
| 10.6 | Second Addendum to Debt Conversion and Funding Agreement effective July 1, 2005 between ERF Wireless, Inc., Eagle R.F. International and Investors. (incorporated by reference to Exhibit 10.1 of the Company’s Form 10-QSB/A for the period ended June 30, 2005) | |
| 10.7 | 2010 Stock Option Plan (incorporated by reference from the Form S-8 filed on June 24, 2010) | |
| 10.8 | 2012 Stock Option Plan (incorporated by reference to Exhibit 4.1 to the Company's Registration Statement of Form S-8 filed on March 30, 2012). | |
| 10.9 | 2013 Stock Option Plan (incorporated by reference to Exhibit 4.1 of the Company’s Form S-8 filed December 17, 2012) | |
| 10.10 | 2013-A Stock Option Plan (incorporated by reference to Exhibit 4.1 of the Company’s Form S-8 Registration Statement filed on May 13, 2014) | |
| 10.11 | Series A Preferred Conversion Restriction Agreement (incorporated by reference to Exhibit 10.15 of the Company’s Form SB-2 filed on December 12, 2005) |
| 10.12 | Loan Agreement by and between the Company and Dakota Capital Fund, LLC (incorporated by reference to Exhibit 10.1 of the Company’s Form 8-K filed November 15, 2011) | |
| Amendment of Angus Capital (incorporated by reference to Exhibit 10.19 of the Company’s Form 10-KSB for the fiscal year ended December 31, 2006) | ||
| Amended and Restated Acquisition Purchase Agreement (incorporated by reference to Exhibit 10.19 of the Company’s Form 8-K filed on December 20, 2006) | ||
| Form of E-Bond Agreement (incorporated by reference to Exhibit 10.14 of the Company’s Form S-1 filed on December 24, 2012) | ||
| Employment agreement by and between the Company and Timothy A. Maxson dated December 12, 2012 | ||
| 14.1 | Code of Business Conduct and Ethics (incorporated by reference to Exhibit 10.25 of the Company’s Form 8-K for the fiscal year ended December 31, 2011) | |
| 21.1 | List of | |
| 23.1 | Consent of Independent Registered Public Accounting Firm* | |
| 31.1 | Certification of Chief Executive Officer Pursuant to Section 302 of the Sarbanes-Oxley Act of | |
| 31.2 | Certification of Chief Financial Officer Pursuant to Section 302 of the Sarbanes-Oxley Act of | |
| 32.1 | Certification of Chief Executive Officer Pursuant to 18 U.S.C. Section 1350 as Adopted Pursuant to Section 906 of the Sarbanes-Oxley Act of | |
| 32.2 | Certification of Chief Financial Officer Pursuant to 18 U.S.C. Section 1350 as Adopted Pursuant to Section 906 of the Sarbanes-Oxley Act of | |
| 101(1) | The following financial information | |
* Filed herewith ** Furnished herewith. | ||
| (1) | The XBRL related information in Exhibit 101 to this Annual Report on Form 10-K shall not be deemed “filed” for purposes of Section 18 of the Securities Exchange Act of 1934, as amended, or otherwise subject to liability of that section and shall not be incorporated by reference into any filing or other document pursuant to the Securities Act of 1933, as amended, except as shall be expressly set forth by specific reference in such filing or document. |
* Filed herewith
(1)The XBRL related information in Exhibit 101 to this Annual Report on Form 10-K shall not be deemed “filed” for purposes of Section 18 of the Securities Exchange Act of 1934, as amended, or otherwise subject to liability of that section and shall not be incorporated by reference into any filing or other document pursuant to the Securities Act of 1933, as amended, except as shall be expressly set forth by specific reference in such filing or document.
76
| 78 |