UNITED STATES
SECURITIES AND EXCHANGE COMMISSION
Washington, D.C. 20549
FORM 10-K
ANNUAL REPORT PURSUANT TO SECTION 13 OR 15(d) OF
THE SECURITIES EXCHANGE ACT OF 1934
For the Fiscal Year Ended December 31, 20022003
Commission File Number 0-753
PENN VIRGINIA CORPORATION
Incorporated in VIRGINIA | I.R.S. Employer Identification Number 23-1184320 |
OneThree Radnor Corporate Center, Suite 200230
100 Matsonford Road
Radnor, PA 19087
Registrant’s telephone number, including area code: (610) 687-8900
|
| |
|
|
Securities registered pursuant to section 12(b) of the Act:
None
Securities Registered pursuant to Section 12(g) of the Act:
Title of Each Class | Name of Exchange on which registered | |
Common Stock, $6.25 Par Value | New York Stock Exchange |
Indicate by check mark whether the registrant (1) has filed all reports required to be filed by Section 13 or 15 (d) of the Securities Exchange Act of 1934 during the preceding 12 months (or for such shorter period that the registrant was required to file such reports), and (2) has been subject to such filing requirements for the past 90 days. Yes x No ¨
Indicate by check mark if disclosure of delinquent filers pursuant to Item 405 of Regulation S-K is not contained herein, and will not be contained, to the best of registrant’s knowledge, in definitive proxy or information statements incorporated by reference in Part III of this Form 10-K or any amendment to this Form 10-K. x¨
Indicate by check mark whether registrant is an accelerated filer (as defined in Rule 12b-2 of the Act). Yes x No ¨
State the aggregate market value of the voting and non-voting common equity held by non-affiliates computed by reference to the price at which the common equity was last sold, or the average bid and asked price of such common equity, as of the last business day of the registrant’s most recently completed second fiscal quarter. $348,612,796.$386,346,400.
As of February 27, 2003, 8,947,418March 4, 2004, 9,114,277 shares of common stock of the registrant were issued and outstanding.
DOCUMENTS INCORPORATED BY REFERENCE:
Part Into Which Incorporated | ||
(1) Proxy Statement for Annual Shareholders Meeting on May | Part |
Penn Virginia Corporation and SubsidiariesPENN VIRGINIA CORPORATION AND SUBSIDIARIES
Part I | ||||
1. | 3 | |||
2. | 14 | |||
3. | 18 | |||
4. | 18 | |||
Part II | ||||
5. | Market for the Registrant’s Common Stock and Related Shareholder Matters | 19 | ||
6. | 20 | |||
7. | Management’s Discussion and Analysis of Financial Condition and Results of Operations | 21 | ||
8. | 41 | |||
9. | Changes In and Disagreements with Accountants on Accounting and Financial Disclosure | 73 | ||
Part III | ||||
10. | 73 | |||
11. | 73 | |||
12. | Security Ownership of Certain Beneficial Owners and Management | 73 | ||
13. | 73 | |||
14. | 73 | |||
Part IV | ||||
15. | Exhibits, Financial Statement Schedules, and Reports on Form 8-K | 74 |
Page 2
Part 1PART I
ITEM 1 –BUSINESSItem 1—Business
General
Penn Virginia Corporation (“Penn Virginia” or the “Company”) is a Virginia corporation founded in 1882. We are engaged in the exploration, development and production of crude oil and natural gas primarily in the eastern and Gulf Coast onshore areas of the United States. We also collect royalties on various oil and gas properties in which we own a mineral fee interest. At December 31, 2002,2003, we had proved reserves of approximately 5.46.6 million barrels of oil and condensate and 241283 billion cubic feet (Bcf)(“Bcf”) of natural gas, or 273323 billion cubic feet equivalent (“Bcfe”).
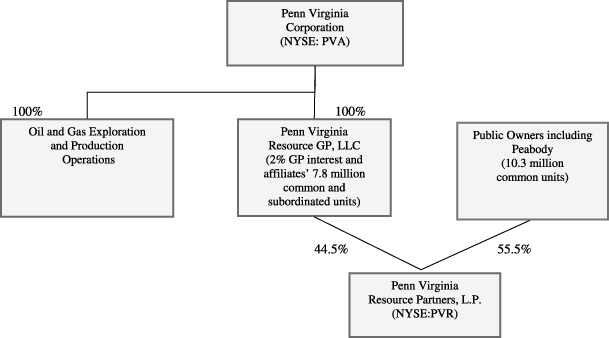
Until October 30, 2001, we also engaged directly in the leasing and management of coal properties in the Centralcentral Appalachian region of the United States. In September 2001, we transferred our coal properties and related assets and liabilities to Penn Virginia Resource Partners, L.P. (the “Partnership” or “PVR”), a newly formed Delaware limited partnership. On October 30, 2001, the Partnership completed its initial public offering (“IPO”) of approximately 7.5 million common units at $21.00 per unit, which are traded on the New York Stock Exchange under the symbol PVR. At December 31, 2002,2003, the Partnership owned approximately 615588 million tons of proven and probable coal reserves including approximately 120 million tons of such reserves that were acquired in December 2002 related to a strategic alliance with Peabody Energy Corporation (“Peabody”). The Partnership’s coal reserves are located on 241,000 acres in Virginia, West Virginia, New Mexico and eastern Kentucky. The Partnership does not operate any mines, but has leased its reserves under 5153 leases to 2829 different operators who mine coal at 6154 mines in exchange for royalty payments to PVR. Lessees other than those which are affiliates of Peabody (the “Peabody Lessees”) are generally required to make royalty payments to the Partnership based on the amount of coal they produce from the Partnership’s properties and the price at which they sell the coal, subject to fixed minimum royalty rates per ton. The Peabody Lessees are required to make payments based on fixed royalty rates which escalate annually. In managing its properties, PVR actively works with its lessees to develop efficient methods to exploit reserves and to maximize production from properties. Additionally, the Partnership provides fee-based coal preparation and transportation facilities to some of its lessees to generate coal service revenues. The Partnership also generates revenues from the sale of standing timber sales from timber owned.on its properties. The Partnership owned approximately 168166 million board feet (“MMbf”) of timber at December 31, 2002.2003.
Our wholly owned subsidiary, Penn Virginia Resource GP, LLC, a Delaware limited liability company, serves as general partner of the Partnership. As of December 31, 2002,2003, we owned approximately 45 percent of the Partnership, consisting of a two percent general partner interest 42and 43 percent subordinated units, and one percent common units.limited partner interest. As part of our ownership of PVR’s general partner, we also own the rights, referred to as Incentive Distribution Rights,“incentive distribution rights”, to receive an increasing percentage of the Partnership’s quarterly distributiondistributions of available cash from operating surplus after certain levels of cash distributions have been achieved. See Item 1 – Business – 1—Business—Corporate and Other for more information on Incentive Distribution Rights.incentive distribution rights.
Financial Information
We operate in two primary business segments. We are in the crude oil and natural gas exploration and production business and, through our interests in PVR, we are in the coal royalty and land management business. For financial statement purposes, the assets, liabilities and earnings of PVR are included in our consolidated financial statements, with the public unitholders’ ownership interest reflected as a minority interest. See Note 19 (Segment Information)20. Segment Information of the Notes to the Consolidated Financial Statements for financial information concerning our business segments.
Oil and Gas Operations
General
Our oil and gas properties are located primarily in the eastern and onshore Gulf Coast onshore areas of the United States. At December 31, 2002,2003, we had 273323 Bcfe of proved reserves, (88of which 88 percent was natural gas) including 226 Bcfe held through various working interests and 47 Bcfe held by royalty interests.gas. Seventy-eight percent or those proved reserves were proved developed reserves. During 2002, 3492003, 625 thousand barrels of oil and condensate and 18.720.1 Bcf of natural gas, net to our interest, were produced from continuing operations compared with 164349 thousand barrels and 13.118.7 Bcf in 2001. In addition, there were approximately 18 thousand barrels of oil and condensate and 16 million cubic feet (“MMcf”) of natural gas produced from properties which were sold in 2002 and reflected as discontinued operations.2002. We received average prices of $23.63$26.91 and $22.94
1
$23.63 per barrel for crude oil and $5.31 and $3.35 and $4.06 per thousand cubic feet (“Mcf”) for crude oil and natural gas sales in 20022003 and 2001,2002, respectively. We also drilled 96
Page 3
180 gross (65.5(132.1 net) wells in 2002,2003, of which 90162 gross (60.9(118.0 net) wells were development and 618 gross (4.6(14.1 net) wells were exploratory. A total of 3 gross (1.6(2.9 net) exploratory wells were not successful.successful and 10 gross (10 net) exploratory wells were under evaluation at December 31, 2003.
Transportation
The majority of our natural gas production is transported to market primarily on threefive major pipeline or transmission systems. NiSource Inc., Dominion Transmission, Inc., Duke Energy Inc., Nisource, Inc.Corporation, Exxon Mobil Corporation and DominionCrosstex Energy Inc.Services LTD transported 3921 percent, 2420 percent, 19 percent, 12 percent and 208 percent, respectively, of our 20022003 natural gas production. The remainder was divided among several pipeline companies in Texas, Louisiana and West Virginia. In almost all cases, our natural gas is sold at the interconnects with the transmission pipelines. For additional information, see Item 1 – 1—Risks Associated with Business Activities – Activities—Oil and Gas – Gas—Transportation.
Marketing and Hedging
We generally sell our natural gas using the spot market and short-term fixed price physical contracts. For the year ended December 31, 2003, three customers of the oil and gas segment, Dominion Transmission, Inc., El Paso Corporation and Duke Energy Corporation accounted for approximately 19 percent, 13 percent and 12 percent, respectively, of our total revenues. From time to time, we enter into commodity derivative contracts or fixed price physical contracts to mitigate the risk associated with the volatility of natural gas prices. Recently, we have utilized swaps and costless collars in connection with our hedging activities. Gains and losses from hedging activities are included in revenues when the hedged production is sold. We recognized a loss of $1.0$6.1 million on settled hedging activities in 2003, a loss of $1.1 million in 2002 and a gain of $1.9 million in 2001, and no gain or loss in 2000.2001. In 2002,2003, we hedged approximately 4445 percent of our natural gas base production at an average NYMEX Henry Hub floor price of $2.98$3.64 per MMbtu and a ceiling price of $3.53$5.61 per MMbtu.MMbtu for costless collars, and an average $4.70 per MMbtu for swaps. For crude oil, we hedged approximately 7626 percent of our 20022003 crude oil production at an average floor price or $21.31of $23.00 per barrel and a ceiling price of $25.72$28.75 per barrel.barrel for costless collars, and an average $26.82 per barrel for swaps. See Item 7 – Management’s Discussion and Analysis of Financial Condition and Results of Operations –7A.— Quantitative and Qualitative Disclosures about Market Risk for information about our price risk management positions for 2003, 2004 and the first quarter of 2005.
Coalbed Methane Drilling Venture
In August 2002, we entered into an agreement with CDX Gas, LLC (“CDX”), a private owner of proprietary horizontal drilling technology, to explore for and develop coalbed methane (“CBM”) in 16,000 square miles of property located in Central Appalachia as well as in the Devonian Shale formation. Our agreement with CDX is generally for five years and provides that we and CDX will have a 60 percent and 40 percent working interest, respectively, in future CBM projects conducted on property owned by us and subject to the agreement. On future projects conducted on property not owned by us, we and CDX will generally each have a 50 percent working interest.
Coal Royalty and Land Management Operations
OverviewGeneral
At December 31, 2002,2003, the Partnership ownedproperties contained approximately 588 million tons of proven and leased approximatelyprobable coal reserves located on 241,000 acres in Virginia, West Virginia, New Mexico and eastern Kentucky containing approximately 615 million tons of coal reserves.Kentucky. The Partnership earns coal royalty revenue,revenues, based on long-term lease agreements, from 28 coal-mining29 coal mining operators actively mining under 5153 separate leases at 6154 mines. CoalApproximately 72 percent of PVR’s 2003 coal royalty revenues under non-Peabody leases areand 99 percent of its 2002 coal royalty revenues were based on the higher of a percentage of the gross sales price or a fixed price per ton of coal sold, with pre-established minimum monthly or annual payments. Under the Peabody leases,The balance of PVR’s 2003 and 2002 coal royalty revenues arewas based on fixed royalty rates which escalate annually, also with pre-established monthly minimums. The Partnership does not operate coal mines. The Partnership provides fee-based coal preparation and transportation facilities to some of its lessees to enhance their production levels and generate additional coal service revenues.
The Partnership’s timber assets consist of various hardwoods, primarily red oak, white oak, yellow poplar and black cherry. The Partnership owned approximately 168166 million board feet of standing saw timber at December 31, 2002.2003. The Partnership’s timber inventory only includes timber that can be harvested and is greater than 12 inches in diameter.
2
In 2002, the Partnership made two reserve acquisitions as well as an infrastructure acquisition. In December 2002, the Partnership announced the formation of an important strategic alliance withacquired from Peabody Energy Corporation the largest private sector coal company in the world. Central to the transaction was the purchase from and leaseback to Peabody of(“Peabody”) approximately 120 million tons of proven and probable coal reserves located in New Mexico (80 million tons) and northern West Virginia (40 million tons) (the “Peabody Acquisition”). As a result of the Peabody Acquisition, the Partnership’s total reserves increased by approximately 25 percent to 615 million tons. The Peabody Acquisition was funded with $72.5 million in cash and the issuance by the Partnership to
Page 4
Peabody of 1,522,325 common units and 1,240,833 Class B common units. Of the Class B common units issued, 293,700 are currently being held in escrow pending certain approvals from the State of New Mexico and Peabody’s acquisition and transfer to PVR of certain reserves. As a result of the escrow arrangement, approximately five million tons of coal reserves were excluded from reserve totals and 293,700 Class B common units were excluded from units issued in the Partnership’s financial statements for the year ended December 31, 2002.
The alliance with Peabody accomplishes several strategically important goals. It provides geographic diversity by exposing the Partnership to new markets in the western United States and northern Appalachia. The inclusion of affiliates of Peabody as a significant part of the Partnership’s lessee mix adds additional strength and stability to its lessee group. Peabody is incentivized to source additional assets to the Partnership in the future. This incentive is derived not only from Peabody’s ownership of approximately 15 percent of the Partnership’s common units, but also from its right to share in the general partner’s incentive distribution rights if Peabody sells additional coal assets to the Partnership in the future. See Item 1 – Corporate and Other – Partnership Distributions, Incentive Distribution Rights for more information.
In addition to the Peabody Acquisition, in August 2002, the Partnership purchased approximately 16 million tons of proven and probable coal reserves located on the Upshur properties in northern Appalachia for $12 million. This acquisition(the “Upshur Acquisition”). The Upshur Acquisition was the Partnership’sPVR’s first investment outside of central Appalachia. The properties, which include approximately 18,000 mineral acres, contain predominately high sulfur, high BTU coal reserves.
In June 2001, the Partnership acquired the Fork Creek property in West Virginia, purchasing approximately 53 million tons of coal reserves for $33.1 million. In early 2002, the operator at Fork Creek filed for bankruptcy protection under Chapter 11 of the U.S. Bankruptcy Code and operations at the mine were idled on March 4, 2002. The operator continued to pay minimum royalties until the Partnership recovered its lease on August 31, 2002. In November 2002, the Partnership also purchased various infrastructure atlocated on its West Coal River property (formerly know as Fork Creek for $5.1 million plusCreek) including a 900 ton per hour coal preparation plant, a unit train loadout facility and a railroad-granted rebate on coal loaded through the assumption of certain reclamation liabilities and stream mitigation obligations. With control of the reserves, permits and the critical infrastructure, PVR’s management is working diligently to put a new, financially stable operator in place at Fork Creek. As is customary in the Partnership’s operations, PVR intends to assign all related reclamation liabilities to the new operator.facility.
Coal Royalties
The Partnership’s lessees mined approximately 14.326.5 million tons of coal in 20022003 from PVR’s properties and paid an average royalty of $2.20$1.90 per ton, compared with approximately 15.314.3 million tons mined in 20012002 at an average royalty of $2.11$2.20 per ton.
Timber Sales
Timber is harvestedThe Partnership harvests timber in advance of lessee mining to prevent loss of the resource. Timber is sold as individual parcels in competitive bid sales or on a contract basis, where PVR pays independent contractors to harvest timber while PVR directly markets the product. The Partnership sold approximately 5.3 MMbf in 2003, compared with 8.3 MMbf in 2002 at an average price of $187 per thousand board feet (“Mbf”), compared with 8.7 MMbf at an average price of $168 per Mbf in 2001.2002.
Coal Services
The Partnership generates coal service revenues from fees charged to lessees for the use of the Partnership’s coal preparation and transportation facilities. The majority of these fees have been generated by the Partnership’s unit train loadout facility located on its Wise property, which was completed in April 1999 at a cost of $5.2 million. This facility accommodates up to 108-car unit trains, which can be loaded in approximately four hours. Lessees utilize the unit train loadout facility to reduce delivery costs incurred by their customers. The Partnership recognized $1.7$2.1 million in coal service revenues in 2002 and 2001.2003, compared to $1.7 million in 2002. Such amounts are reported inas other revenues in the Consolidated Statements of Income included herein.
Corporate and Other
Partnership Distributions
Cash Distributions. The Partnership paid cash distributions of $2.06 per common and subordinated unit during the year ended December 31, 2003. In 2004, the Partnership expects to make distributions of $2.08 or more per common and subordinated unit.
We are entitled, through our wholly owned subsidiaries, to receive certain cash distributions payable with respect to the subordinated and common units of PVR held by such subsidiaries as well as certain cash distributions payable with respect to general partner incentive distribution rights held by our general partner subsidiary.
Page 5
Cash Distributions. The Partnership made its first cash distributionCompany received distributions from PVR of $0.34 per common$16.8 million and subordinated unit$14.9 million in February2003 and 2002, for the period October 30, 2001 through December 31, 2001. For 2002, the Partnership made quarterly cash distributions of $0.50 per common unit and subordinated unit. The Partnership intends to increase quarterly cash distributions to $0.52 per common unit and subordinated unit beginning with the distribution payable in May 2003 with respect to the first quarter of 2003.respectively.
Incentive Distribution Rights. Our wholly owned subsidiary is the general partner of PVR and, as such, holds certain incentive distribution rights which represent the right to receive an increasing percentage of quarterly distributions of available cash from operating surplus after the Partnership has paid minimum quarterly distributions and certain target distribution levels have been achieved. The minimum quarterly distribution is $0.50 per unit ($2.00 per unit on an annual basis). The incentive distributions rights are payable as follows:
If for any quarter:
3
then, PVR will distribute any additional available cash from operating surplus for that quarter among the unitholders and our general partner subsidiary in the following manner:
In each case, the amount of the target distribution set forth above is exclusive of any distributions to common unitholders to eliminate any cumulative arrearages in payment of the minimum quarterly distribution on the common units. In conjunction with the Peabody Acquisition, and if PVR purchases additional assets from Peabody in the future, our general partner subsidiary has issued a special membership interest which entitles Peabody to receive increased percentages, starting at zero and increasing up to 40 percent, of payments PVR makes to our general partner subsidiary with respect to incentive distribution rights if PVR purchases additional assets from Peabody in the future.rights.
Investments
During 2001, we sold 3,307,200 shares of Norfolk Southern Corporation (NYSE: NSC) common stock. The shares were sold in open market transactions on the New York Stock Exchange at an average price of $17.39 per share. Our 3,307,200 common shares of Norfolk Southern Corporation generated dividends of $0.2 million in 2001 and $2.6 million in 2000.2001. We received a quarterly dividend of $0.06 per share in 2001, which was a reduction from the $0.20 per share realized in 2000.2001. We had no available-for-sale securities at December 31, 20022003 and 2001.2002. See Note 5 (Investments5. Investments and Dividend Income)Income of the Notes to the Consolidated Financial Statements for additional information.
Page 6
Risks Associated with Business Activities
Oil and Gas
Oil and Gas
Competition
The oil and natural gas industry is very competitive. Competition is particularly intense in the acquisition of prospective oil and natural gas properties and oil and gas reserves. Our competitive position depends on our geological, geophysical and engineering expertise, our financial resources, our ability to develop properties and our ability to select, acquire and develop proved reserves. We compete with a substantial number of other companies having larger technical staffs and greater financial and operational resources. Many such companies not only engage in the acquisition, exploration, development and production of oil and natural gas reserves, but also carry on refining operations, electricity generation and the marketing of refined products. We also compete with major and independent oil and gas companies in the marketing and sale of oil and natural gas, and the oil and natural gas industry in general competes with other industries supplying energy and fuel to industrial, commercial and individual consumers. We compete with other oil and natural gas companies in attempting to secure drilling rigs and other equipment necessary for drilling and completion of wells. Such equipment may be in short supply from time to time.
4
Price Volatility
Historically, natural gas and crude oil prices have been volatile. These prices rise and fall based on changes in market demand and changes in the political, regulatory and economic climate and other factors that affect commodities markets that are generally outside of our control. Some of our projections and estimates are based on assumptions as to the future prices of natural gas and crude oil. These price assumptions are used for planning purposes. We expect our assumptions will change over time and that actual prices in the future may differ from our estimates. Any substantial or extended decline in the actual prices of natural gas and/or crude oil could have a material adverse effect on the Company’s financial position and results of operations (including reduced cash flow and borrowing capacity), the quantities of natural gas and crude oil reserves that we can economically produce, the quantity of estimated proved reserves that may be attributed to our properties and our ability to fund our capital program.
Drilling and Operating Risks
Our drilling operations are subject to various risks common in the industry, including cratering, explosions, fires and uncontrollable flows of oil, gas or well fluids. Our drilling operations are also subject to the risk that no commercially productive natural gas or oil reserves will be encountered. The cost of drilling, completing and operating wells is often uncertain, and drilling operations may be curtailed, delayed or canceled as a result of a variety of factors, including drilling conditions, high pressure or irregularities in formations, equipment failures or accidents and adverse weather conditions.
Transportation
We transport our natural gas to market on various gathering and transmission pipeline systems owned by third parties. Gathering fees are primarily paid by the purchaser of the natural gas. The majority of natural gas sales contracts are one year or less in duration and contain relevant monthly index pricing provisions. Interruptible gathering rates have increased over the years as pipelines have implemented the mandatory unbundling of gathering services (Federal Energy Regulatory Commission Order 636) from other transportation services. In 2002, Duke Energy,2003, NiSource Inc. gathered and transported approximately 3921 percent of our natural gas, Nisource,Dominion Transmission, Inc. (formerly Columbia Gas Transmission) approximately 2420 percent, Duke Energy Corporation approximately 19 percent, Exxon Mobil Corporation approximately 12 percent, and DominionCrosstex Energy Inc.Services LTD approximately 208 percent, with the remainder divided among several pipeline companies in Texas, Louisiana and West Virginia and Louisiana.Virginia. Production could be adversely affected by shutdownsdisruptions or curtailments of the operations of pipelines for maintenance or replacement as transportation options are limited.
Regulation
State Regulatory MattersMatters.. Various aspects of our oil and natural gas operations are regulated by administrative agencies under statutory provisions of the states where such operations are conducted. All of the jurisdictions in which we own or operate producing crude oil and natural gas properties have statutory provisions regulating the exploration for and production of crude oil and natural gas. These provisions include the permitting for the drilling of wells, maintaining bonding requirements in order to drill or operate wells, provisions relating to the location of wells, the method of drilling and casing wells, the surface use and restoration of properties upon which wells are drilled, and the plugging and abandoning of wells. Our operations are also subject to various conservation laws and regulations. These include the regulation of the size of drilling and spacing units or proration units, the number of wells that may be
Page 7
drilled in an area, and the unitization or pooling of crude oil and natural gas properties. In addition, state conservation laws establish maximum rates of production from crude oil and natural gas wells, generally prohibit the venting or flaring of natural gas, and impose certain requirements regarding the ratability or fair apportionment of production from fields and individual wells. The effect of these regulations is to limit the amounts of crude oil and natural gas we can produce from our wells, and to limit the number of wells or the locations at which we can drill.
5
Federal Energy Regulatory Commission. The Federal Energy Regulatory Commission (“FERC”) regulates the transportation and sale for resale of natural gas in interstate commerce under the Natural Gas Act of 1938 (“NGA”) and the Natural Gas Policy Act of 1978 (“NGPA”). In the past, the Federal government has regulated the prices at which oil and gas could be sold. The Natural Gas Wellhead Decontrol Act of 1989 (the “Decontrol Act”) removed all NGA and NGPA price and nonprice controls affecting producers’ wellhead sales of natural gas effective January 1, 1993. While sales by producers of their own natural gas production, and all sales of crude oil, condensate and natural gas liquids can currently be made at market prices, Congress could reenact price controls in the future.
Commencing in April 1992, the FERC issued Order Nos. 636, 636-A, 636-B and 636-C (“Order No. 636”), which require interstate pipelines to provide transportation separate, or “unbundled,” from the pipelines’ salessale of gas. Also, Order No. 636 requires pipelines to provide open-access transportation on a basis that is equal for all gas supplies. Although Order No. 636 does not directly regulate gas producers like Penn Virginia, Corporation, the FERC has stated that it intends for Order No. 636 to foster increased competition within all phases of the natural gas industry. The courts have largely affirmed the significant features of Order No. 636 and numerous related orders pertaining to the individual pipelines, although certain appeals remain pending and the FERC continues to review and modify its open access regulations. In particular, the FERC has issued Order No.Nos. 637, 637-A and 637-B which, among other things, (i) permitspermit pipelines to charge different maximum cost-based rates for peak and off-peak times,periods, (ii) encouragesencourage auctions for pipeline capacity, (iii) requiresrequire pipelines to implement imbalance management services, and (iv) restrictsrestrict the ability of pipelines to impose penalties for imbalances, overruns, and non-compliance with operational flow orders. In addition, the FERC has implemented regulations governingin place that govern the procedure for obtaining authorization to construct new pipeline facilities and has issued a policy statement, which it largely affirmed in a recent order on rehearing, establishing a presumption in favor of requiring owners of newnewly constructed pipeline facilities to charge rates based solely on the incremental costs associated with such new pipeline facilities.
While any additional FERC action on these matters would affect us only indirectly, these changes are intended to further enhance competition in natural gas markets. We cannot predict what further action the FERC will take on these matters, nor can we predict whether the FERC’s actions will achieve its stated goal of increasing competition in natural gas markets. However, we do not believe that we will be treated materially differently than other natural gas producers and markets with which we compete.
Environmental Matters. Extensive federal, state and local laws govern oil and natural gas operations, regulate the discharge of materials into the environment or otherwise relate to the protection of the environment. Numerous governmental departments issue rules and regulations to implement and enforce such laws that are often difficult and costly to comply with and which carry substantial administrative, civil and even criminal penalties for failure to comply. Some laws, rules and regulations relating to protection of the environment may, in certain circumstances, impose “strict liability” for environmental contamination, rendering a person liable for environmental and natural resource damages and cleanup costs without regard to negligence or fault on the part of such person. Other laws, rules and regulations may restrict the rate of oil and natural gas production below the rate that would otherwise exist or even prohibit exploration or production activities in sensitive areas. In addition, state laws often require some form of remedial action to prevent pollution from former operations, such as closure of inactive pits and plugging of abandoned wells. The regulatory burden on the oil and natural gas industry increases its cost of doing business and consequently affects its profitability. These laws, rules and regulations affect our operations, as well as the oil and gas exploration and production industry in general. We believe that we are in substantial compliance with current applicable environmental laws, rules and regulations and that continued compliance with existing requirements will not have a material adverse impact on us. Nevertheless, changes in existing environmental laws or the adoption of new environmental laws have the potential to adversely affect our operations.
Page 86
Coal Royalty and Land Management
Although the Partnership intendsexpects to make quarterly cash distributions of $0.52 or more per common unit, it can only do so to the extent it has sufficient cash from operations after payment of fees and expenses. In addition, quarterly distributions are payable on our subordinated units only after each common unit has received a distribution of $0.52$0.50 plus any arrearages due from prior quarters. Incentive distributions are payable to our general partner subsidiary after cash distributions per unit exceed $0.55 in any quarter. The Partnership’s revenues and its ability to make quarterly and incentive distributions are subject to several risks, including those described below.
Competition
The coal industry is intensely competitive primarily as a result of the existence of numerous producers. The Partnership’s lessees compete with coal producers in various regions of the U.S. for domestic sales. The industry has undergone significant consolidation that has led to some of the competitors of the Partnership’s lessees located in Appalachia to have significantly larger financial and operating resources than the Partnership’s lessees do. The Partnership’s lessees primarily compete with both large and small producers in Appalachia as well as the western United States. They compete on the basis of coal price at the mine, coal quality (including sulfur content), transportation cost from the mine to the customer and the reliability of supply. Continued demand for the Partnership’s coal and the prices that the Partnership’s lessees obtain are also affected by demand for electricity, environmental and government regulations, technological developments and the availability and price of alternative fuel supplies, including nuclear, natural gas, oil and hydroelectric power. Demand for the Partnership’s low sulfur coal and the prices the Partnership’s lessees will be able to obtain for it will also be affected by the price and availability of high sulfur coal, which can be marketed in tandem with emissions allowances in order to meet federal Clean Air Act requirements.
Operating Risks
General Regulation. The Partnership’s lessees are obligated to conduct mining operations in compliance with all applicable federal, state and local laws and regulations. These laws and regulations include matters involving the discharge of materials into the environment, employee health and safety, mine permits and other licensing requirements, reclamation and restoration of mining properties after mining is completed, management of materials generated by mining operations, surface subsidence from underground mining, water pollution, legislatively mandated benefits for current and retired coal miners, air quality standards, protection of wetlands, plant and wildlife protection, limitations on land use, storage of petroleum products and substances which are regarded as hazardous under applicable laws, and management of electrical equipment containing polychlorinated biphenyls, or PCBs. Because of extensive and comprehensive regulatory requirements, violations during mining operations are not unusual in the industry and, notwithstanding compliance efforts, we do not believe violations by the Partnership’s lessees can be eliminated completely. However, none of the violations to date, or the monetary penalties assessed, have been material to us, to the Partnership or, to our knowledge, to the Partnership’s lessees. We do not currently expect that future compliance will have a material adverse effect on us or the Partnership.
While it is not possible to quantify the costs of compliance by the Partnership’s lessees with all applicable federal and state laws, those costs have been and are expected to continue to be significant. The lessees post performance bonds pursuant to federal and state mining laws and regulations for the estimated costs of reclamation and mine closing, including the cost of treating mine water discharge when necessary. The Partnership does not accrue for such costs because its lessees are contractually liable for all costs relating to their mining operations, including the costs of reclamation and mine closure. However, the Partnership does require some smaller lessees to deposit certain funds into escrow for reclamation and mine closure costs or post performance bonds for these costs. Although the lessees typically accrue adequate amounts for these costs, their future operating results wouldmight be adversely affected if they later determined these accruals to be insufficient. Compliance with these laws has substantially increased the cost of coal mining for all domestic coal producers.
7
In addition, the electric utility industry, which is the most significant end-user of coal, is subject to extensive regulation regarding the environmental impact of its power generation activities which could affect demand for the Partnership’s lessees’ coal. The possibility exists that new legislation or regulations may be adopted which may have a significant impact on the mining operations of the Partnership’s lessees or their customers’ ability to use coal and may require the Partnership, its lessees or their customers to change operations significantly or incur substantial costs.
Page 9
RegulationCertain Regulatory and Legal Matters.
Clean Air Act. The Clean Air Act affects the end-users of coal and could significantly affect the demand for the Partnership’s coal and reduce the Partnership’s coal royalty revenues. The Clean Air Act and corresponding state and local laws extensively regulate the amount of sulfur dioxide, particulate matter, nitrogen oxides and other compounds emitted from industrial boilers and power plants, including those that use the Partnership’s coal. These regulations together constitute a significant burden on coal customers and stricter regulation could further adversely impact the demand for and price of the Partnership’s coal, resulting in lower coal royalty revenues.
In July 1997, the U.S. Environmental Protection Agency (“EPA”) adopted more stringent ambient air quality standards for particulate matter and ozone. Particulate matter includes small particles that are emitted during the combustion process. In a February 2001 decision, the U.S. Supreme Court largely upheld the EPA’s position, although it remanded the EPA’s ozone implementation policy for further consideration. Details regarding the new particulate standard itself are still subject to judicial challenge. These ozone restrictions will require electric power generators to further reduce nitrogen oxide emissions. Nitrogen oxides are naturally occurring byproducts of coal combustion that lead to the formation of ozone. Further reduction in the amount of particulate matter that may be emitted by power plants could also result in reduced coal consumption by electric power generators. Future regulations regarding ozone, particulate matter and other ambient air standards could restrict the market for coal and the development of new mines by the Partnership’s lessees. This in turn may result in decreased production by the Partnership’s lessees and a corresponding decrease in the Partnership’s coal royalty revenues. These decreases could adversely effectaffect the distributions we receive from the Partnership.
The Clean Air Act also imposes standards on sources of hazardous air pollutants. These standards have not yet been extended to coal mining operations, or by-productsbut in January 2004, EPA proposed regulations to control emissions of coal combustion, but consideration is now being given to regulating certainmercury, a hazardous air pollutant componentsfrom power plants that combust coal, as well as nitrogen oxides and sulfur dioxide, which are found in coal combustion exhaust, including mercury.also power plant pollutants, Like other environmental regulations, these standards and future standards could result in a decreased demand for coal.
Surface Mining Control and Reclamation Act of 1977. The Surface Mining Control and Reclamation Act of 1977 (“SMCRA”) and similar state statutes impose on mine operators the responsibility of restoring the land to its original state or compensating the landowner for types of damages occurring as a result of mining operations, and require mine operators to post performance bonds to ensure compliance with any reclamation obligations. Regulatory authorities may attempt to assign the liabilities of the Partnership’s lessees to the Partnership if any of the lessees are not financially capable of fulfilling those obligations. In conjunction with mining the property, the Partnership’s lessees are contractually obligated under the terms of their leases to comply with all laws, including SMCRA and equivalent state and local laws, which obligations include reclaiming and restoring the mined areas by grading, shaping and reseeding the soil. Upon completion of the mining, reclamation generally is completed by seeding with grasses or planting trees for use as pasture or timberland, as specified in the approved reclamation plan.
CERCLA. The Partnership could become liable under federal and state Superfund and waste management statutes if its lessees are unable to pay environmental cleanup costs. The Comprehensive Environmental Response, Compensation and Liability Act, known as CERCLA or “Superfund,” and similar state laws create liabilities for the investigation and remediation of releases and threatened releases of hazardous substances to the environment and damages to natural resources. As a landowner, the Partnership is potentially subject to liability for these investigation and remediation obligations.
8
Mountaintop Removal LitigationSurface Mining Valley Fills.. On January 29, 2003, Over the United States Fourth Circuit Court of Appeals (the “Circuit Court”) vacated an injunction issued in May 2002 by the United States District Court for the Southern District of West Virginia (the “District Court”). This injunction had prohibited the Huntington, West Virginia officecourse of the U.S. Army Corpslast several years, opponents of Engineers (the “Corps”) from issuingsurface mining have filed three lawsuits challenging the legality of permits under Section 404 of the Clean Water Act forauthorizing the construction of valley fills for the disposal of coal mining overburden. These valleys typically contain steamsoverburden under federal and state laws applicable to surface mining activities. Although two of these challenges were successful in the United States District Court for the southern District of West Virginia (the “District Court”), the United States Court of Appeals for the Fourth Circuit overturned both of those decisions in Bragg v. Robertson in 2001 and in Kentuckians For The Commonwealth v. Rivenburgh in 2003.
On October 23, 2003, a third lawsuit involving the disposal of coal mining overburden was filed under the name of Ohio Valley Environmental Coalition v. Bulen. In this case, which was also filed in the District Court, several public interest group plaintiffs have alleged that underthe Army Corps of Engineers violated the Clean Water Act are considered navigable waters of the United States. The District Court had found that the Corp’s permitting of overburden valley fills under Section 404 was(“CWA”) and other federal regulations when it issued Nationwide Permit 21, a violation of the Clean Water Act since Section 404 allows only the permitting of fill material depositedgeneral permit for a beneficial purpose and not for mere waste disposal such as the disposal of coal overburden. The Circuit Court reversedmining overburden into United States waters. This most recent suit also challenges certain individual discharge authorizations in West Virginia, including several involving the mining activities of the Partnership’s lessees. If the plaintiffs prevail in this finding, concluding, instead, that overburden valley fillslatest lawsuit, lessees who have received authorization for discharges pursuant to Nationwide Permit 21 could be prevented from undertaking future discharges until they receive individual CWA permits, and future operations could require individual permits. Obtaining these individual permits is likely to substantially increase both the time and the costs of obtaining CWA permits for our lessees and other coal mining operators throughout the industry where any such unfavorable ruling may be permitted under Section 404 and remandedapplied. These increases could adversely affect our coal royalty revenues. Although the case backPartnership expects that any ruling for the plaintiffs would be appealed to the Fourth Circuit, the coal mining industry, including the operations of our lessees, could be significantly adversely impacted by the initial effects of an adverse decision while any appeal is pending.
West Virginia Anti-degradation Policy.As a result of a September 2003 decision by the District Court for further proceedingsin Ohio Valley Environmental Coalition v. Whitman, the State of West Virginia is currently implementing the CWA without an EPA-approved anti-degradation implementation policy, which would apply in cases of pollutant discharges into waters that have been designated as high quality waters by the State. In this case, the District Court vacated EPA’s previous approval of the West Virginia anti-degradation policy after the District Court determined that the State’s policy did not inconsistentcomply with the Circuit Court’s opinion.requirements of the CWA. The West Virginia anti-degradation policy had included a number of exceptions, including one for parties holding general CWA permits, from anti-degradation review requirements. The EPA has reportedly decided not to appeal this decision and is instead proceeding with a policy review. Were PVA’s lessees to seek permits to discharge coal overburden into high quality waters under a new policy which does not include such an exception, permit applications will likely be required to undergo the public and intergovernmental scrutiny associated with an anti-degradation review, which may either delay the issuance or reissuance of CWA permits, require the use of more costly control measures or lead to the denial of these permits. The delay, denial or added costs of complying with these permits may increase the costs of coal production, potentially reducing PVR’s royalty revenues and adversely affecting our Partnership distributions.
Mine Health and Safety Laws.Stringent safety and health standards have been imposed by federal legislation since the adoption of the Mine Health and Safety Act of 1969. The Mine Health and Safety Act of 1969 resulted in increased operating costs and reduced productivity. The Mine Safety and Health Act of 1977, which significantly expanded the enforcement of health and safety standards of the Mine Health and Safety Act of 1969, imposes comprehensive safety and health standards on all mining operations. In addition, as part of the Mine Health and Safety Acts of 1969 and 1977, the Black Lung Acts require payments of benefits by all businesses conducting current mining operations to coal miners with black lung and to some survivors of a miner who dieshas died from this disease.
Page 10
Mining Permits and Approvals.Numerous governmental permits or approvals are required for mining operations. In connection with obtaining these permits and approvals, the Partnership’s lessees may be required to prepare and present to federal, state or local authorities data pertaining to the effect or impact that any
9
proposed production of coal may have upon the environment. The requirements imposed by any of these authorities may be costly and time consuming and may delay commencement or continuation of mining operations.
In order to obtain mining permits and approvals from state regulatory authorities, mine operators, including the Partnership’s lessees, must submit a reclamation plan for restoring, upon the completion of mining operations, the mined property to its prior condition, productive use or other permitted condition. Typically, lessees submit the necessary permit applications between 12 and 18 months before they plan to begin mining a new area. In the Partnership’s experience, permits generally are approved within 12 months after a completed application is submitted. In the past, lessees have generally obtained their mining permits without significant delay. The Partnership’s lessees have obtained or applied for permits to mine a majority of the reserves that are currently planned to be mined by lesseesthem over the next five years. The Partnership’s lessees are also in the planning phase for obtaining permits for the remainingadditional reserves planned to be mined over the nextfollowing five years. However, they cannot makegive any assurances that they will not experience difficulty in obtaining mining permits in the future.
Timber Regulations.The Partnership’s timber operations are subject to federal, state and local laws and regulations, including those related to the environment, protection of endangered species, foresting activities and health and safety. The Partnership believes it is managing its timberlands in substantial compliance with applicable federal and state regulations.
Employees
We had 104116 employees at December 31, 2002,2003, including 3032 employees who directly provide services for PVR through its general partner. We consider our relations with our employees to be good.
Available Information
The Company’s Internet address is www.pennvirginia.com. We make available free of charge on or through our Internet website our Governance Principles, Code of Business Conduct and Ethics, Executive and Financial Officer Code of Ethics and the charters of each of our Audit Committee, Nominating and Governance Committee, Compensation and Benefits Committee and Oil and Gas Committee. We also make available free of charge on or through our Internet website our annual report on Form 10-K, quarterly reports on Form 10-Q, reports on Form 8-K and amendments to those reports filed or furnished pursuant to Section 13(a) or 15(d) of the Securities Exchange Act of 1934 as soon as reasonably practicable after we electronically file such material with, or furnish it to, the Securities and Exchange Commission. To date, we have inadvertently not made so available on our website any current reports on Form 8-K. We will provide, free of charge upon request, electronic or paper copies of all current reports on Form 8-K which were filed from November 15, 2002 to February 15, 2003. We will make available, free of charge, on or through our internet website, all reports on Form 8-K and amendments to those reports filed after February 15, 2003 as soon as reasonably practicable after we electronically file such reports with, or furnish them to, the Securities and Exchange Commission.
Page 11
Executive Officers of the Company
The following table sets forth information concerning our executive officers. Each officer is elected annually by the Board of Directors and serves at the pleasure of the Board of Directors.
Name | Age | Position with the Company | ||
A. James Dearlove |
| President and Chief Executive Officer | ||
Frank A. Pici |
| Executive Vice President and Chief Financial Officer | ||
|
| Executive Vice President | ||
|
| Executive Vice President | ||
Nancy M. Snyder |
| Senior Vice President, General Counsel and Secretary | ||
Dana |
| Vice President and Controller | ||
Ronald K. Page | 53 | Vice President, Corporate Development |
10
A. James Dearlove – Dearlove—Mr. Dearlove has served in various capacities with the Company since 1977, including as President and Chief Executive Officer and a Director of the Company since May 1996, President and Chief Operating Officer of the Company from 1994 to May 1996, Senior Vice President of the Company form 1992 to 1994 and Vice President of the Company from 1986 to 1992. He is also Chief Executive Officer and Chairman of the Board of Penn Virginia Resource GP, LLC, the general partner of Penn Virginia Resource Partners, L.P. He also serves as director of the Powell River Project and the National Council of Coal Lessors.
Frank A. Pici – Pici—Mr. Pici is the Executive Vice President and Chief Financial Officer of the Company, which he joined in September 2001. Mr. Pici is also the Vice President and Chief Financial Officer and a Director of Penn Virginia Resource, GP LLC. From 1996 to August 2001, Mr. Pici was Vice President of Finance and Chief Financial Officer of Mariner Energy, Inc., an oil and gas exploration and production company. Prior to 1996, he served in various capacities with Cabot Oil & Gas Corporation, including Corporate Controller from 1994 to 1996, Director, Internal Audit from 1992 to 1994, and regional accounting manager from 1989 to 1992. From 1982 to 1989, he held financial management positions with companies in the oil and gas and coal industries.
Keith D. Horton – Mr. Horton has served in various capacities with the Company since 1981, including Executive Vice President and a Director of the Company since December 2000, Vice President – Eastern Operations of the Company from May 1996 to May 1997, President of Penn Virginia Coal Company from April 1996 to October 2001, Vice President of Penn Virginia Coal Company from March 1994 to February 1996, Vice President from January 1990 to December 1998, and Manager, Coal Operations from July 1982 to December 1989, of Penn Virginia Resources Corporation. He is also the President and Chief Operating Officer and a Director of Penn Virginia Resource, GP LLC. Additionally, Mr. Horton is Chairman of the Central Appalachian Section of the Society of Mining Engineers. He also serves as a director of the Virginia Mining Association, Powell River Project and Virginia Coal Council.
H. Baird Whitehead – Whitehead—Mr. Whitehead is an Executive Vice President of the Company, which he joined in January 2001. Prior to joining Penn Virginia, Mr. Whitehead served in various positions with Cabot Oil & Gas Corporation. From 1998 to 2001, he served as Senior Vice President during which time he oversaw Cabot’s drilling, production, and exploration activity in the Appalachia, Rocky Mountains, Mid-Continent and the Texas and Louisiana Gulf Coast areas. From 1992 to 1998, he was Vice President and Regional Manager of Cabot’s Appalachian business unit and from 1989 to 1992, he was Vice President and Regional Manager of Cabot’s Anadarko business unit. From 1987 to 1989, he served as Vice President of Engineering for Cabot. From 1972 to 1987, he held various engineering and supervisory positions with Texaco, Columbia Gas Transmission and Cabot.
Keith D. Horton—Mr. Horton has served in various capacities with the Company since 1981, including Executive Vice President and a Director of the Company since December 2000, Vice President—Eastern Operations of the Company from February 1999 to December 2000, President of Penn Virginia Coal Company from February 1996 to October 2001, Vice President of Penn Virginia Coal Company from March 1994 to February 1996, Vice President from January 1990 to December 1998, and Manager, Coal Operations from July 1982 to December 1989, of Penn Virginia Resources Corporation. He is also the President and Chief Operating Officer and a Director of Penn Virginia Resource, GP LLC. Additionally, Mr. Horton is Chairman of the Central Appalachian Section of the Society of Mining Engineers. He also serves as a director of the Virginia Mining Association, Powell River Project and Virginia Coal Council.
Nancy M. Snyder – Snyder—Ms. Snyder has served as Senior Vice President of the Company since February 2003 as Vice President since December 2000 and as General Counsel and Corporate Secretary of the Company since 1997. She was a Vice President of the Company from December 200 to February 2003. Ms. Snyder is also the Vice President, General Counsel and a Director of Penn Virginia Resource GP, LLC. From 1993 to 1997, Ms. Snyder was a solo practitioner representing clients generally in connection with mergers and acquisitions and general corporate matters. From 1990 to 1993, Ms. Snyder served as general counsel to Nan Duskin, Inc. and its affiliated companies, which were in the businesses of womens’women’s’ retail fashion and real estate. From 1983 to 1989, Ms. Snyder was an associate at the law firm of Duane Morris, where she practiced securities, banking and general corporate law.
Dana G. Wright – G Wright—Mr. Wright joined the Company in July 2002 and serves as Vice President and Controller. Prior to joining Penn Virginia, he was employed for 26 years with Atlantic Richfield Company, and most recently with its publicly traded subsidiary, Vastar Resources, Inc. During that time he held a variety of financial, accounting and treasury related positions.
Ronald K. Page—Mr. Page 12has served as Vice President, Corporate Development since joining the Company in July 2003. From January 1998 to May 2003, Mr. Page served in various positions with El Paso Field Services Company, including Vice President of Commercial Operations—Texas Pipelines and Processing, Vice
11
President of Business Development, Director of Business Development and Consultant. From October 1995 through December 1997, Mr. Page was employed as Vice President of Business Development by TPC Corporation (formerly Texas Power Corporation). For 17 years prior to 1995, Mr. Page served in various positions at Seagull Energy Corporation, including Vice President of Operations at Seagull’s Enstar Natural Gas Company, Vice President of Pipelines and Marketing and Manager of Engineering.
The following terms have the meanings indicated below when used in this report.
| means a standard barrel of 42 U.S. gallons liquid volume | |
| means one billion cubic feet | |
| means one billion cubic feet equivalent with one barrel of oil or condensate converted to six thousand cubic feet of natural gas based on the estimated relative energy content | |
| acre or well means an acre or well in which a working interest is owned | |
| means one thousand barrels | |
| means one thousand board feet | |
| means one thousand cubic feet | |
| means one million board feet | |
| means one million British thermal units | |
| means one million cubic feet | |
| acres or wells is determined by multiplying the gross acres or wells by the owned working interest in those gross acres or wells | |
| New York Mercantile Exchange | |
Present value of proved | means the present value (discounted at 10%) of estimated future cash flows from proved oil and natural gas reserves, as estimated by our independent engineers, reduced by additional estimated future operating expenses, development expenditures and abandonment costs (net of salvage value) associated therewith (before income taxes). | |
Probable Coal | means those reserves for which quantity and grade and/or quality are computed from information similar to that used for proven reserves, but the sites for inspection, sampling and measurement are farther apart or are otherwise less adequately spaced. The degree of assurance, although lower than that for proven reserves, is high enough to assume continuity between points of observation. | |
Proved | means those estimated quantities of crude oil, condensate and natural gas that geological and engineering data demonstrate with reasonable certainty to be recoverable in future years from known oil and gas reservoirs under existing economic and operating | |
Proven Coal | means those reserves for which: (a) quantity is computed from dimensions revealed in outcrops, trenches, workings or drill holes; |
12
grade and/or quality are computed from the results of detailed sampling; and (b) the sites for inspection, sampling and measurement are spaced so closely, and the geologic character is so well defined, that the size, shape, depth and mineral content of reserves are well-established. | |
Standardized | means present value of proved reserves further reduced by the present value (discounted at 10%) of estimated future income taxes on cash | |
Working | means a cost-bearing interest under an oil and gas lease that gives the holder the right to develop and produce the minerals under the |
Page 13
ITEM 2 –PROPERTIESItem 2—Properties
Facilities
We are headquartered in Radnor, Pennsylvania with additional offices in Kingsport, Tennessee, Houston, Texas and Charleston, West Virginia. All of our office facilities are leased. We believe that our properties are adequate for our current needs.
Title to Properties
We believe that we have satisfactory title to all of our properties and the associated oil and gas reserves in accordance with standards generally accepted in the oil and natural gas and coal royalty and land management industries.
As is customary in the oil and gas industry, we make only a cursory review of title to farmout acreage and to undeveloped oil and gas leases upon execution of any contracts. Prior to the commencement of drilling operations, a thorough title examination is conducted and curative work is performed with respect to significant defects. To the extent title opinions or other investigations reflect defects, we cure such title defects. If we were unable to remedy or cure any title defect of a nature such that it would not be prudent to commence drilling operations on a property, we could suffer a loss of our investment in the property. Prior to completing an acquisition of producing oil and gas assets, we obtain title opinions on all material leases. Our oil and gas properties are subject to customary royalty interests, liens for current taxes and other burdens that we believe do not materially interfere with the use or materially affect the value of such properties.
Of the 615588 million tons of proven and probable coal reserves to which the Partnership hashad rights as of December 31, 2002,2003, PVR owned the mineral rightsinterests and the majority of related surface rights to 572544 million tons, or 93 percent, and leased the remaining 4344 million tons, or 7 percent, from unaffiliated third parties. In addition to the revenues the Partnership receives from its coal business, it also earns revenues from the sale of timber. At December 31, 2002, the Partnership owned 114,500 surface acres of timberland containing 168 million board feet of inventory.
Page 1413
Information Regarding Oil and Gas Properties
Production and Pricing
The following table sets forth production, average sales prices and production costs with respect to our properties for the years ended December 31, 2003, 2002 2001 and 2000.2001.
2002 | 2001 | 2000 | 2003 | 2002 | 2001 | ||||||||||||||||
Production | |||||||||||||||||||||
Oil and condensate (Mbbls)* |
| 349 |
|
| 164 |
| 31 | 625 | 349 | 164 | |||||||||||
Natural gas (MMcf)* |
| 18,697 |
|
| 13,130 |
| 11,645 | 20,094 | 18,697 | 13,130 | |||||||||||
Total production (MMcfe)* |
| 20,791 |
|
| 14,114 |
| 11,831 | 23,844 | 20,791 | 14,114 | |||||||||||
Average sales price | |||||||||||||||||||||
Oil and condensate ($/Bbl) | $ | 23.63 |
| $ | 22.94 | $ | 26.84 | $ | 26.91 | $ | 23.63 | $ | 22.94 | ||||||||
Natural gas ($/Mcf) | $ | 3.35 |
|
| 4.06 |
| 3.95 | $ | 5.31 | $ | 3.35 | $ | 4.06 | ||||||||
Production cost ($/Mcfe) | |||||||||||||||||||||
Lease operating expense | $ | 0.45 |
| $ | 0.40 | $ | 0.38 | $ | 0.51 | $ | 0.45 | $ | 0.40 | ||||||||
Taxes other than income |
| 0.27 |
|
| 0.31 |
| 0.24 | 0.40 | 0.27 | 0.31 | |||||||||||
General and Administrative Expense |
| 0.40 |
|
| 0.38 |
| 0.22 | ||||||||||||||
General and administrative expense | 0.33 | 0.40 | 0.38 | ||||||||||||||||||
Total production cost | $ | 1.12 |
| $ | 1.09 | $ | 0.84 | $ | 1.24 | $ | 1.12 | $ | 1.09 | ||||||||
Hedging Summary | |||||||||||||||||||||
Natural gas prices ($/Mcf): | |||||||||||||||||||||
Actual price received for production | $ | 3.39 |
| $ | 3.92 | $ | 3.95 | $ | 5.59 | $ | 3.39 | $ | 3.92 | ||||||||
Effect of derivative hedging activities |
| (0.04 | ) |
| 0.14 |
| — | (0.28 | ) | (0.04 | ) | 0.14 | |||||||||
Average realized price | $ | 3.35 |
| $ | 4.06 | $ | 3.95 | $ | 5.31 | $ | 3.35 | $ | 4.06 | ||||||||
Crude oil prices ($/Bbl): | |||||||||||||||||||||
Actual price received for production | $ | 24.39 |
| $ | 22.45 | $ | 26.84 | $ | 27.77 | $ | 24.39 | $ | 22.45 | ||||||||
Effect of derivative hedging activities |
| (0.76 | ) |
| 0.49 |
| — | (0.86 | ) | (0.76 | ) | 0.49 | |||||||||
Average realized price | $ | 23.63 |
| $ | 22.94 | $ | 26.84 | $ | 26.91 | $ | 23.63 | $ | 22.94 | ||||||||
| * | Production for 2002 does not include approximately 16 Mbbls of oil condensate and 18 MMcf of natural gas production, or 114 MMcfe, related to discontinued operations. Production volumes for the related properties sold were insignificant in 2001. |
*Production for 2002 does not include approximately 16 Mbbls of oil condensate and 18 MMcf of natural gas production, or 114 MMcfe, related to discontinued operations. 2001 production volumes for properties sold were insignificant.
Page 1514
Proved Reserves
We hadThe following table presents certain information regarding our proved reserves as of 241 BcfDecember 31, 2003, 2002 and 2001. The proved reserve estimates presented below were prepared by Wright and Company, Inc., independent petroleum engineers. For additional information regarding estimates of natural gasproved reserves, the preparation of such estimates by Wright and 5.4 million barrels of crudeCompany, Inc. and other information about our oil and condensate at December 31, 2002. The present valuegas reserves, see Note 23. Supplemental Information on Oil and Gas Producing Activities (Unaudited) of the estimated future cash flows discounted at 10 percent (pre-tax SEC PV10 Value) at December 31, 2002, was $481 million. At December 31, 2002, we had 195 gross (128.3 net)Notes to the Consolidated Financial Statements. Our estimates of proved undeveloped drilling locations.reserves in the table above are consistent with those filed by us with other federal agencies.
Oil and Condensate (MMbbls) | Natural Gas (Bcf) | Natural Gas Equivalents (Bcfe) | Pre-tax SEC PV10Value ($MM) | Year-end Weighted Average Prices Used | ||||||||||||||||||||||||||
$ / Bbl | $ / Mmbtu | Oil and Condensate | Natural Gas | Natural Equivalents | Pre-tax SEC PV10 Value | Year-end Prices Used | ||||||||||||||||||||||||
| (MMbbls) | (Bcf) | (Bcfe) | ($ millions) | $ / Bbl | $ /MMbtu | |||||||||||||||||||||||||
2003 | ||||||||||||||||||||||||||||||
Developed | 3.3 | 231 | 251 | $ | 570 | |||||||||||||||||||||||||
Undeveloped | 3.3 | 52 | 72 | 126 | ||||||||||||||||||||||||||
Total | 6.6 | 283 | 323 | $ | 696 | $ | 32.52 | $ | 5.97 | |||||||||||||||||||||
2002 | ||||||||||||||||||||||||||||||
Developed | 2.9 | 199 | 216 | $ | 404 | 2.9 | 199 | 216 | $ | 404 | ||||||||||||||||||||
Undeveloped | 2.5 | 42 | 57 |
| 77 | 2.5 | 42 | 57 | 77 | |||||||||||||||||||||
Total | 5.4 | 241 | 273 | $ | 481 | $ | 31.13 | $ | 4.74 | 5.4 | 241 | 273 | $ | 481 | $ | 31.13 | $ | 4.74 | ||||||||||||
2001 | ||||||||||||||||||||||||||||||
Developed | 2.2 | 183 | 196 | $ | 202 | 2.2 | 183 | 196 | $ | 202 | ||||||||||||||||||||
Undeveloped | 1.7 | 46 | 56 |
| 40 | 1.7 | 46 | 56 | 40 | |||||||||||||||||||||
Total | 3.9 | 229 | 252 | $ | 242 | $ | 20.40 | $ | 2.65 | 3.9 | 229 | 252 | $ | 242 | $ | 20.40 | $ | 2.65 | ||||||||||||
2000 | ||||||||||||||||||||||||||||||
Developed | 0.1 | 146 | 147 | $ | 540 | |||||||||||||||||||||||||
Undeveloped | — | 28 | 28 |
| 104 | |||||||||||||||||||||||||
Total | 0.1 | 174 | 175 | $ | 644 | $ | 23.31 | $ | 9.91 | |||||||||||||||||||||
The standardized measure of discounted future net cash flows, which represents the present value of future net revenues after income taxes discounted at ten percent, was $512 million, $355 million and $189 million and $467 million atas of December 31, 2003, 2002 2001 and 2000,2001, respectively. For information on the changes in standardized measure of discounted future net cash flows. Seeflows, see Note 22 (Supplementary23. Supplemental Information on Oil and Gas Producing Activities (Unaudited)) of the Notes to the Consolidated Financial Statements, for more information.Statements.
In accordance with the Securities and Exchange Commission’s guidelines, the engineers’ estimates of future net revenues from our properties and the pre-tax SEC PV10 value thereof are made using oil and natural gas sales prices in effect as of December 31, 2002.2003. The prices are held constant throughout the life of the properties except where such guidelines permit alternate treatment, including the use of fixed and determinable contractual price escalations. Net proved oil and gas reserves for the three years ended December 31, 2002 were estimated by Wright and Company, Inc. Prices for oil and gas are subject to substantial seasonal fluctuations and prices for each are subject to substantialas well as fluctuations as a result ofresulting from numerous other factors. See Item 7 – 7—Management’s Discussion and Analysis of Financial Condition and Results of Operations.
Proved reserves are the estimated quantities of natural gas, crude oil and condensate that geological and engineering data demonstrate with reasonable certainty to be recoverable in future years from known reservoirs under existing economic and operating conditions. Proved developed reserves are proved reserves that can be expected to be recovered through existing wells with existing equipment and operating methods. There are numerous uncertainties inherent in estimating quantities of proved reserves and in projecting future rates of production and timing of development expenditures, including many factors beyond our control. Reserve engineering is a subjective process of estimating underground accumulations of oil and natural gas that cannot be measured in an exact manner, and the accuracy of any reserve estimate is a function of the quality of available data and of engineering and geological interpretation and judgment. The quantities of crude oil and natural gas
15
that are ultimately recovered, production and operating costs, the amount and timing of future development expenditures and future crude oil and natural gas sales prices may all differ from those assumed in these estimates. Therefore, neither the pre-tax nor after-tax SEC PV10 value amounts shown above should not be
construed as the current market value of the estimated oil and natural gas reserves attributable to our properties. The information set forth in the foregoing tables includes revisions of certain volumetric reserve estimates attributable to proved properties included in the preceding year’s estimates. Such revisions are the result of additional information from subsequent completions and production history from the
Page 16
properties involved or the result of a decrease (or increase) in the projected economic life of such properties resulting from changes in production prices.
Acreage
The following table sets forth our developed and undeveloped acreage at December 31, 2002.2003. The acreage is located in the eastern and southern portionsGulf Coast areas of the United States.
Gross Acreage | Net Acreage | Gross Acreage | Net Acreage | |||||
(in thousands) | (in thousands) | |||||||
Developed | 611 | 487 | 669 | 531 | ||||
Undeveloped | 246 | 131 | 408 | 231 | ||||
Total | 857 | 618 | 1,077 | 762 | ||||
Wells Drilled
The following table sets forth the gross and net number of exploratory and development wells drilled during the last three years. The number of wells drilled refers to the number of wells spud at any time during the respective year. Net wells equal the number of gross wells multiplied by our working interest in each of the gross wells. Productive wells represent either wells which were producing or which were capable of commercial production.
2002 | 2001 | 2000 | 2003 | 2002 | 2001 | |||||||||||||||||||
Gross | Net | Gross | Net | Gross | Net | Gross | Net | Gross | Net | Gross | Net | |||||||||||||
Development | ||||||||||||||||||||||||
Productive | 87 | 58.4 | 125 | 96.1 | 99 | 75.3 | 161 | 117.0 | 87 | 58.4 | 125 | 96.1 | ||||||||||||
Non-productive | 3 | 2.5 | 5 | 5.0 | 1 | 0.9 | 1 | 1.0 | 3 | 2.5 | 5 | 5.0 | ||||||||||||
90 | 60.9 | 130 | 101.1 | 100 | 76.2 | 162 | 118.0 | 90 | 60.9 | 130 | 101.1 | |||||||||||||
Exploratory | ||||||||||||||||||||||||
Productive | 3 | 3.0 | 19 | 14.5 | 1 | 0.2 | 5 | 1.2 | 3 | 3.0 | 19 | 14.5 | ||||||||||||
Non-productive | 3 | 1.6 | 5 | 3.5 | 5 | 1.3 | 3 | 2.9 | 3 | 1.6 | 5 | 3.5 | ||||||||||||
Under evaluation | — | — | — | — | 3 | 1.4 | 10 | 10.0 | — | — | — | — | ||||||||||||
6 | 4.6 | 24 | 18.0 | 9 | 2.9 | 18 | 14.1 | 6 | 4.6 | 24 | 18.0 | |||||||||||||
Total | 96 | 65.5 | 154 | 119.1 | 109 | 79.1 | 180 | 132.1 | 96 | 65.5 | 154 | 119.1 | ||||||||||||
The ten exploratory wells under evaluation represent coalbed methane (“CBM”) wells drilled and completed in the Cherokee Basin in Chase County, Kansas. The Company expects to determine the commercial viability of the Cherokee basin program during the first half of 2004.
16
Productive Wells
The number of productive oil and gas wells in which we had a working interest at December 31, 20022003 is set forth below. Productive wells are producing wells or wells capable of commercial production.
Operated Wells | Operated Wells | Non-Operated Wells | Total | Operated Wells | Non-Operated Wells | Total | ||||||||||||||
Gross | Net | Gross | Net | Gross | Net | Net | Gross | Net | Gross | Net | ||||||||||
692 | 668 | 430 | 63 | 1,122 | 731 | |||||||||||||||
794 | 769.7 | 493 | 77.7 | 1,287 | 847.4 | |||||||||||||||
In addition to the above working interest wells, Penn Virginia owns royalty interests in 2,346 gross wells.
Page 17
Information Regarding Coal Royalty and Land Management Properties
The Partnership’s coal reserves at December 31, 20022003 covered 241,000 acres, including fee and leased acreage, in Virginia, West Virginia, New Mexico and eastern Kentucky. The coal reserves are in various surface and underground seams.
The Partnership’s As of December 31, 2003, the Partnership had approximately 588 million tons of proven and probable coal reserves, which are estimated at 615 million tons as of December 31, 2002. found in the following six separate properties:
Reserves are coal tons that can be economically extracted or produced at the time of determination considering legal, economic and technical limitations. Proven coal reserves are reserves for which (a) the quantity is computed from dimensions revealed in outcrops, trenches, working or drill holes; grade and/orand quality are computed from the results of detailed sampling; and (b) the sites for inspection, sampling and measurement are spaced so closely, and the geologic character is so well defined,well-defined, that the size, shape, and depth and mineral content of reserves are well-established. Probable coal reserves are reserves for which quantity and grade and/or quality are computed from information similar to that used for proven reserves, but the sites for inspection, sampling and measurement are farther apart or are otherwise less adequately spaced. The degree of assurance, although lower than that for proven reserves, is high enough to assume continuity between points of observation.
In areas where geologic conditions indicate potential inconsistencies related to coal reserves, the Partnership performs additional drilling to ensure the continuity and mineablility of coal reserves. Consequently, sampling in those areas involves drill holes that are spaced closer together than those distances cited above.
Reserve estimates are adjusted annually for production, unmineable areas, acquisitions and sales of coal in place. The majority of PVR’s reserves are high in energy content, low in sulfur and suitable for either the steam or metallurgical markets.market.
The amount of coal a lessee can profitably mine at any given time is subject to several factors and may be substantially different from “proven and probable reserves.” Included among the factors that influence profitability are the existing market price, coal quality and operating costs.
17
The following table sets forth production data and reserve information with respect to each of the Partnership’s six properties:
Production Year Ended December | Proven and Probable December 31, 2003 | |||||||||||
Property | 2003 | 2002 | 2001 | Under- ground | Surface | Total | ||||||
| (tons in millions) | ||||||||||||
Wise | 9.3 | 8.9 | 9.0 | 186.5 | 25.2 | 211.7 | ||||||
Coal River | 3.9 | 2.5 | 4.0 | 128.0 | 73.2 | 201.2 | ||||||
New Mexico | 6.3 | 0.2 | — | — | 73.3 | 73.3 | ||||||
Northern Appalachia | 5.1 | 0.5 | — | 46.5 | 2.5 | 49.0 | ||||||
Spruce Laurel | 1.5 | 1.8 | 1.7 | 35.4 | 15.9 | 51.3 | ||||||
Buchanan | 0.4 | 0.4 | 0.6 | 1.6 | 0.1 | 1.7 | ||||||
Total | 26.5 | 14.3 | 15.3 | 398.0 | 190.2 | 588.2 | ||||||
The following table sets forth the coal reserves the Partnership owns and leases with respect to each of its coal properties as of December 31, 2003:
| Owned | ||||||||
Property | Surface and Mineral Interests | Mineral Interests Only | Leased | Total | ||||
| (tons in millions) | ||||||||
Wise | 203.4 | 8.3 | 0.0 | 211.7 | ||||
Coal River | 145.7 | 20.3 | 35.2 | 201.2 | ||||
New Mexico | 0.0 | 69.4 | 3.9 | 73.3 | ||||
Northern Appalachia | 0.0 | 49.0 | 0.0 | 49.0 | ||||
Spruce Laurel | 47.8 | 0.0 | 3.5 | 51.3 | ||||
Buchanan | 0.0 | 0.6 | 1.1 | 1.7 | ||||
Total | 396.9 | 147.6 | 43.7 | 588.2 | ||||
At December 31, 2003, the Partnership’s coal reserve estimates were prepared from geological data assembled and analyzed by PVR’s general partner’s geologists and engineers. These estimates were compiled using geological data taken from thousands of drill holes, adjacent mine workings, outcrop prospect openings and other sources. These estimates also take into account legal, qualitative technical and economic limitations that may keep coal from being mined. Reserve estimates will change from time to time due to mining activities, analysis of new engineering and geological data, acquisition or divestment of reserve holdings, modification of mining plans or mining methods and other factors
The Partnership’s timber assets consist of various hardwoods, primarily red oak, white oak, yellow poplar and black cherry. At December 31, 2002,2003, the Partnership owned an estimated 168166 MMbf of standing saw timber.
ITEM 3 –LEGAL PROCEEDINGSItem 3—Legal Proceedings
We are involved in various legal proceedings arising in the ordinary course of business. While the ultimate results of these cannot be predicted with certainty, management believes these claims will not have a material effect on our financial position, liquidity or operations.
ITEM 4 –SUBMISSION OF MATTERS TO A VOTE OF SECURITY HOLDERSItem 4—Submission of Matters to a Vote of Security Holders
There were no matters submitted to a vote of security holders during the fourth quarter of 2002.2003.
Page 18
PART II
ITEM 5 –MARKET FOR THE COMPANY’S COMMON STOCK AND RELATED STOCKHOLDER MATTERSItem 5—Market for the Company’s Common Stock and Related Stockholder Matters
Common Stock Market Prices And Dividends
High and low closing stocksales prices and dividends for the last two years were:
2002 | 2001 | 2003 | 2002 | |||||||||||||||||||||||||||||||||
Sales Price | Cash Dividends Paid | Sales Price | Cash Dividends Paid | Sales Price | Cash Dividends Paid | Sales Price | Cash Dividends Paid | |||||||||||||||||||||||||||||
High | Low | High | Low | High | Low | High | Low | |||||||||||||||||||||||||||||
Quarter Ended: | ||||||||||||||||||||||||||||||||||||
March 31 | $ | 40.15 | $ | 26.84 | $ | 0.225 | $ | 37.39 | $ | 30.00 | $ | 0.225 | $ | 39.90 | $ | 34.09 | $ | 0.225 | $ | 40.30 | $ | 26.03 | $ | 0.225 | ||||||||||||
June 30 | $ | 41.87 | $ | 32.58 | $ | 0.225 | $ | 45.10 | $ | 31.10 | $ | 0.225 | $ | 45.05 | $ | 37.40 | $ | 0.225 | $ | 42.00 | $ | 32.15 | $ | 0.225 | ||||||||||||
September 30 | $ | 38.98 | $ | 30.30 | $ | 0.225 | $ | 38.41 | $ | 27.15 | $ | 0.225 | $ | 45.65 | $ | 39.65 | $ | 0.225 | $ | 39.25 | $ | 29.50 | $ | 0.225 | ||||||||||||
December 31 | $ | 36.90 | $ | 30.35 | $ | 0.225 | $ | 38.50 | $ | 27.90 | $ | 0.225 | $ | 57.75 | $ | 44.05 | $ | 0.225 | $ | 37.25 | $ | 30.15 | $ | 0.225 | ||||||||||||
The Company’s common stock is traded on the New York Stock Exchange under the symbol PVA.
Page 19
ITEM 6 –SELECTED FINANCIAL DATAItem 6—Selected Financial Data
Five Year Selected Financial Data
Year Ended December 31, | 2002 | 2001 | 2000 | 1999 | 1998 | ||||||||||
(in thousands except share data) | |||||||||||||||
Revenues | $ | 110,957 | $ | 96,571 | $ | 105,998 | $ | 47,697 | $ | 38,324 | |||||
Operating income (a,b) | $ | 30,791 | $ | 1,563 | $ | 65,684 | $ | 20,715 | $ | 10,273 | |||||
Net income (c) | $ | 12,104 | $ | 34,337 | $ | 39,265 | $ | 14,504 | $ | 9,591 | |||||
Per common share: | |||||||||||||||
Net income, basic | $ | 1.35 | $ | 3.92 | $ | 4.76 | $ | 1.73 | $ | 1.15 | |||||
Net income, diluted | $ | 1.34 | $ | 3.86 | $ | 4.69 | $ | 1.71 | $ | 1.13 | |||||
Dividends paid | $ | 0.90 | $ | 0.90 | $ | 0.90 | $ | 0.90 | $ | 0.90 | |||||
Weighted average shares outstanding, basic |
| 8,930 |
| 8,770 |
| 8,241 |
| 8,406 |
| 8,310 | |||||
Weighted average shares outstanding, diluted |
| 8,974 |
| 8,896 |
| 8,371 |
| 8,480 |
| 8,463 | |||||
Total assets (d) | $ | 586,292 | $ | 457,102 | $ | 268,766 | $ | 274,011 | $ | 256,931 | |||||
Long-term debt(e) | $ | 106,887 | $ | 46,887 | $ | 47,500 | $ | 78,475 | $ | 37,967 | |||||
Minority interest in PVR | $ | 192,770 | $ | 144,039 | $ | — | $ | — | $ | — | |||||
Shareholders’ equity | $ | 187,956 | $ | 185,454 | $ | 171,162 | $ | 154,343 | $ | 170,259 | |||||
| 2003 | 2002 | 2001 | 2000 | 1999 | |||||||||||
| (in thousands except share data) | |||||||||||||||
Year Ended December 31, | |||||||||||||||
Revenues | $ | 181,284 | $ | 110,957 | $ | 96,571 | $ | 105,998 | $ | 47,697 | |||||
Operating income(a,b) | $ | 62,101 | $ | 30,791 | $ | 1,563 | $ | 65,684 | $ | 20,715 | |||||
Net income(c) | $ | 28,522 | $ | 12,104 | $ | 34,337 | $ | 39,265 | $ | 14,504 | |||||
Per common share: | |||||||||||||||
Net income, basic | $ | 3.17 | $ | 1.35 | $ | 3.92 | $ | 4.76 | $ | 1.73 | |||||
Net income, diluted | $ | 3.15 | $ | 1.34 | $ | 3.86 | $ | 4.69 | $ | 1.71 | |||||
Dividends paid | $ | 0.90 | $ | 0.90 | $ | 0.90 | $ | 0.90 | $ | 0.90 | |||||
Weighted average shares outstanding, basic | 8,988 | 8,930 | 8,770 | 8,241 | 8,406 | ||||||||||
Weighted average shares outstanding, diluted | 9,056 | 8,974 | 8,896 | 8,371 | 8,480 | ||||||||||
Total assets(d) | $ | 683,733 | $ | 586,292 | $ | 457,102 | $ | 268,766 | $ | 274,011 | |||||
Long-term debt(e) | $ | 154,286 | $ | 106,887 | $ | 46,887 | $ | 47,500 | $ | 78,475 | |||||
Minority interest in PVR | $ | 190,508 | $ | 192,770 | $ | 144,039 | $ | — | $ | — | |||||
Shareholders’ equity | $ | 211,648 | $ | 187,956 | $ | 185,454 | $ | 171,162 | $ | 154,343 | |||||
| (a) | Certain reclassifications have been made to conform to the current year presentation. |
| (b) | Operating income in 2003, 2002 |
| (c) | Net income in 2001 included a $54.7 million ($35.6 million after tax) gain on the sale of Norfolk Southern Corporation common stock. |
| (d) | Total assets |
| (e) | Long-term debt in |
Page 2019
ITEM 7 –MANAGEMENT’S DISCUSSION AND ANALYSIS OF FINANCIAL CONDITION AND RESULTS OF OPERATIONSItem 7—Management’s Discussion and Analysis of Financial Condition and Results of Operations
The following reviewanalysis of operationsfinancial condition and financial conditionresults of operations of Penn Virginia Corporation and subsidiaries should be read in conjunction with the Consolidated Financial Statements and Notes thereto.
Overview
Penn Virginia Corporation (“Penn Virginia” or the “Company”) is an independent energy company that is engaged in two primary business segments. Our oil and gas segment explores for, develops, produces and producessells crude oil, condensate and natural gas primarily in the eastern and Gulf Coast onshore areas of the United States. Our coal royalty and land management segment operates through our 44.5 percent ownership in Penn Virginia Resource Partners, L.P. (the “Partnership” or “PVR”), a Delaware limited partnership, see Note 2 (Penn. Penn Virginia Resource Partners, L.P.)and PVR are both publicly traded on the New York Stock Exchange under the symbols PVA and PVR, respectively. Due to our control of the Notesgeneral partner of PVR, the financial results of the Partnership are included in our consolidated financial statements. However, PVR functions with a capital structure that is independent of the Company, consisting of its own debt instruments and publicly traded common units. The following diagram depicts our ownership of PVR:
As a result of our ownership in the Partnership, we receive cash payments from PVR in the form of quarterly cash distributions. We received approximately $16.8 million of cash distributions from PVR during 2003. As part of our ownership of PVR’s general partner, we also own the rights, referred to the Consolidated Financial Statements.as incentive distribution rights, to receive an increasing percentage of quarterly distributions of available cash from operating surplus after certain levels of cash distributions have been achieved. See Item 1—Business—Corporate and Other for more information on incentive distribution rights. As of December 31, 2003, PVR had not achieved a level of distribution to allow us to receive an increased percentage of available cash.
We are committed to increasing value to our shareholders by conducting a balanced program of investment in our two business segments. In the oil and gas segment, we intendexpect to execute a program combining relatively low risk, moderate return development drilling in the eastAppalachian region of Virginia and West Virginia with higher risk, higher return exploration and development drilling in the onshore Gulf Coast, supplemented periodically with acquisitions. In addition to our continuing conventional development program, we are
20
expanding our eastern presence by developing coalbed methane (“CBM”) gas reserves in Appalachia. By employing horizontal drilling techniques, we expect to increase production ratesthe value from coalbed methanethe CBM reserves we own. We are also committed to expanding our onshore Gulf Coast oil and gas reserves and production internally through our exploratory and development drilling programprograms and by acquiring reserves with favorable return potential.returns.
In 2002, these efforts resulted in a 47 percentthe coal royalty and land management segment, PVR continually evaluates acquisition opportunities that could increase in oilto cash available for distribution to PVR unit holders, of which we are the largest single unitholder. These opportunities include, but are not limited to, acquiring additional coal properties and gas production from 2001, and we expect an increase in 2003 oil and gas production of at least 30 percent, with a corresponding increase in operating cash flow. In January 2003, we completed an acquisition of approximately 31.8 Bcfe of proved reserves, in the South Texas area of the onshore Gulf Coast regionacquiring or constructing assets for $32.5 million,coal services which willwould provide a significant part offee-based revenue stream and acquiring mid-stream hydrocarbon-related transportation assets and other operating units that would strategically fit within the expected growth in 2003 production.Partnership.
Our oil and gas capital expenditures for 2003, including the January 2003 South Texas acquisition,2004 are expected to be $110 to $120approximately $100 million. Borrowings against our $140 million credit facility were $16$64 million out of $150 million available as of December 31, 2002,2003, and we expect to fund our 20032004 capital expenditures with a combination of internal cash flow and credit facility borrowings.
During 2002, PVR completed its first two coal reserve acquisitions since its initial public offering in October 2001. In December 2002, PVR announced the formation of a strategic alliance with Peabody, resulting from the purchase from and leaseback to Peabody of approximately 120 million tons of coal reserves in New Mexico and northern West Virginia for $72.5 million in cash and a total of 2.76 million common units and Class B common units. The Peabody Acquisition significantly expanded PVR’s geographic diversity and included incentives for Peabody to source additional assets to the Partnership in the future. In August 2002, PVR also purchased approximately 16 million tons of coal reserves in northern West Virginia for $12.0 million. The two acquisitions are expected to contribute 12.3 million to 12.9 million tons of production and $16.5 million to $17.5 million of cash flow from operations to PVR in 2003.
Coal-related capital expenditures on existing properties in 20032004 are expected to be $3.0 to $3.3 million for the construction of new coal service-related projects for which PVR will collect a fee.less than $0.5 million. As of December 31, 2002,2003, PVR had borrowed $90.9$91.8 million against its credit facility, and it is currently attempting to refinance those borrowings with a more permanent form of debt. The Partnership expects to complete the refinancing during the first quarter of 2003.debt facilities. Cash flow from operations, supplemented with credit facility borrowings, areis expected to be adequate for PVR to fund 20032004 capital expenditures and distributions to unitholders.
2003 Performance—Oil and Gas Segment
In 2003, we increased our oil and gas production to 23.8 Bcfe, a 14 percent increase over 20.8 Bcfe produced in 2002. This increase resulted from a January 2003 acquisition in south Texas, the Company’s horizontal CBM drilling program in central Appalachia and additional drilling of the Selma Chalk wells in Mississippi. These increases were offset in part by natural field declines. Average daily oil and gas production increased to 67.1 MMcfe in the fourth quarter of 2003 compared to 57.8 MMcfe in the fourth quarter of 2002.
Commodity prices, in particular for natural gas, were the largest single factor affecting our financial results in 2003. Price volatility in the natural gas market has been high in the last few years. Throughout 2002 and 2003, the NYMEX futures market reported unprecedented natural gas contract prices. Our realized natural gas price in 2003 was $5.31 per Mcf, net of $0.28 per Mcf hedging loss. We use financial instruments to hedge natural gas and, to a lesser extent, oil prices. The use of financial hedging instruments is an integral part of our risk management strategy, but in 2003 we realized a lower price per Mcf as a result of hedging.
Our total oil and gas reserves at the end of 2003 were 323 Bcfe, an increase of 18 percent over 2002. Approximately 88 percent of our reserves at year-end 2003 were natural gas. We replaced 308 percent of our production during 2003 at a reserve replacement cost of $1.81 per Mcfe. We drilled a total of 180 gross (132.1 net) wells during 2003, including 162 gross (118.0 net) development wells with a 99 percent success rate, and 18 gross (14.1 net) exploratory wells with a success rate of 63 percent.
During 2003, we continued to expand our CBM production and reserve base in central Appalachia through acquisitions and the use of a proprietary horizontal drilling technology owned by CDX Gas, LLC (“CDX”). Under our agreement with CDX, we have the right to use the technology to drill CBM wells in a 16,000 square mile area of mutual interest (AMI) covering virtually all of central Appalachia. We acquired over 131,000 acres during 2003 and now own over 619,000 acres of CBM-prospective leasehold within the AMI. By greatly accelerating production from these heretofore long-lived reserves, we believe that this drilling technique should result in superior rates of return, with very low geological risk. This technique was used to drill and complete 12 gross (4.6 net) horizontal CBM wells during 2003, more than doubling our horizontal CBM production to 1.1 Bcfe from 0.5 Bcfe in 2002. In 2004, our capital budget includes $20 million to continue to develop horizontal CBM reserves in central Appalachia and to build additional pipeline infrastructure to transport the additional production, which is expected to become an increasingly significant part of our production base.
21
We are also conducting a conventional CBM pilot project in the Cherokee Basin of southeastern Kansas, where we control over 40,000 acres of potentially prospective CBM property, and we expect to know by mid-2004 whether this project is commercially viable.
We continued to employ a low-risk development strategy in our other core areas during 2003. In Appalachia, we drilled 54 gross (31.2 net) conventional wells. In Mississippi, we drilled 77 gross (75.7 net) wells and acquired new Selma Chalk acreage to complement existing positions, adding to this area two to three more years of potential low-risk drilling locations. Our 2004 budget includes approximately $13 million to drill 57 gross (44 net) development wells in Appalachia and Mississippi. In early 2003, we also acquired a combination of proved producing and proved undeveloped reserves in Kingsville, a south Texas field. We participated in the drilling of 11 wells to partially develop the field. In December 2003, we entered into a joint venture giving us access to a potentially large number of low-risk, long-lived development drilling locations in over 17,000 acres in the Cotton Valley play of east Texas. We are also active on the Louisiana side of the Cotton Valley play. We expect to spend approximately $14 million to drill and operate as many as 18 gross (10.5 net) wells in the east Texas / north Louisiana corridor during 2004.
To balance the low risk portion of our portfolio with a number of higher risk, potentially higher reward projects, we expanded our drilling efforts along the Gulf Coast during 2003. We drilled a successful field extension well in the Broussard field in south Louisiana. We also drilled seven gross (3.1 net) exploratory wells in the Gulf Coast region, including five gross (1.2 net) successful exploratory wells in as many attempts in the Stella and south Creole fields in south Louisiana. Including follow-up development drilling, as of mid-January 2004, these fields were contributing over eight MMcfe, or more than ten percent of our total daily production. Approximately $25 million has been budgeted in 2004 to drill 22 gross (12 net) exploratory wells. We expect to drill a total of eight gross (four net) wells in our higher risk, higher impact Esperanza and Kingsville prospects in south Texas and our Bayou Sale prospect in south Louisiana. Lower and moderate risk projects comprise the remainder of the 2004 exploratory drilling budget and include new prospects in the south Creole, Stella and Fannett areas along the Gulf Coast, a southeastern Louisiana Miocene play and a new CBM prospect in northern West Virginia.
The ability to internally generate exploration and development prospects is important to our approach in maximizing value. Toward that goal, we continued to hire technically proficient professionals and to acquire seismic data and leaseholds during 2003. We have assembled a high quality staff of both internal and consulting explorationists, and late in 2003, we acquired access to 5,000 square miles of high quality 3-D seismic data along the onshore Gulf Coast areas of Texas and Louisiana, which will more than double our seismic data inventory over the next year. To support this effort, approximately 15 percent of our 2004 capital budget has been allocated to the acquisition of seismic data and new leaseholds.
2003 Performance—Coal Royalty and Land Management Segment (PVR)
In 2003, coal royalty revenues increased 60 percent to $50.3 million from $31.4 million in 2002. This increase was driven by an 85 percent increase in coal production from PVR properties to 26.5 million tons in 2003 from 14.3 million tons in 2002. This production increase was primarily due to the late 2002 acquisition of 120 million tons of coal reserves from Peabody Energy Corporation (“the Peabody Acquisition”), Production from the Peabody Acquisition-related properties contributed 10.6 million tons in 2003. The average royalty rate received for coal produced from these properties during 2003 was $1.33 per ton. Excluding the property acquired from Peabody, production in West Virginia increased 34 percent due to the start up of new mining operations on PVR’s Coal River property, including sub-leased operations on which PVR receives a relatively smaller margin per ton of coal mined. Tonnage mined from PVR’s Virginia properties was up approximately three percent in 2003 from 2002.
Coal prices, especially in central Appalachia where the majority of PVR’s production is located, have increased significantly since the beginning of 2003. The price increase stems from several causes including increased electricity demand and decreasing coal production in central Appalachia.
22
In May 2003, PVR agreed to a new lease on its West Coal River property (formerly known as Fork Creek) with an established operator, who has over 25 years of experience as a successful miner in Appalachia. Production from the idled property commenced in July 2003 and is expected to increase over the next couple of years.
PVR also collects fees and railroad rebates related to its ownership of the coal preparation plant and coal loading facility on the West Coal River property. This new facility and several smaller modular coal preparation plants are resulting in additional coal services revenues, supplementing revenues from the Shober loading facility in Virginia. PVR also spent approximately $4.0 million to construct a third large-scale coal loading facility on its Coal River property, which began operating in February 2004. Coal services revenues increased to $2.1 million in 2003 from $1.7 million in 2002, and are expected to increase further in 2004. PVR believes that these types of fee-based infrastructure assets provide exceptional investment and cash flow opportunities to the Partnership, and it continues to look for additional investments of this type and in other qualified, primarily fee-based assets, including oil and gas midstream assets.
As part of its coal land management business, PVR owns approximately 166 million board feet of standing timber. The Partnership typically sells cutting rights to various contractors who cut in advance of a mining project. Timber revenues in 2003 were $1.0 million, down from $1.6 million in 2002.
Critical Accounting Policies and Estimates
Oil and Gas Properties.We useThe process of preparing financial statements in accordance with Generally Accepted Accounting Principals (“GAAP”) requires the successful efforts method of accounting for our oil and gas operations. Under this method of accounting, costs to acquire mineral interests in oil and gas properties and to drill and equip development wells (including development dry holes) are capitalized and amortized on a unit-of-production basis over the remaining life of proved developed reserves and proved reserves, respectively. Costs of drilling exploratory wells are initially capitalized, and later charged to expense upon determination that the well does not justify commercial development. Other exploratory costs, including annual delay rentals and geological and geophysical costs, are charged to expense when incurred.
Page 21
The costs of unproved leaseholds are capitalized pending the results of exploration efforts. Unproved leasehold costs are assessed periodically, on a property-by-property basis, and a loss is recognized to the extent, if any, the costmanagement of the property has been impaired. As unproved leaseholds are determinedCompany to make estimates and judgments regarding certain items and transactions. It is possible that materially different amounts could be productive,recorded if these estimates and judgments change or if the related costs are transferred to proved leaseholds. As of December 31, 2002, we had approximately $57.6 million of unproved leasehold costs included in oilactual results differ from these estimates and gas properties on our consolidated balance sheet.judgments. We expect to complete an evaluation of our unproved leaseholds overconsider the next two to three years.
Other Property and Equipment.Other property and equipment is carried at cost and includes expenditures for additions and improvements, which substantially increase the productive lives of existing assets. Maintenance and repair costs are expensed as incurred. Depreciation of property and equipment is generally computed using the straight-line method over their estimated useful lives, varying from 3 years to 20 years. Coal properties are depleted on an area-by-area basis at a rate based upon the cost of the mineral properties and estimated proven and probable tonnage therein. When an asset is retired or sold, its cost and related accumulated depreciation are removed from the accounts. The difference between undepreciated cost and proceeds from disposition is recorded as a gain or loss.
Impairment of Long-Lived Assets.We review our long-lived assets to be held and used, including proved oil and gas properties and the Partnership’s coal properties, whenever events or circumstances indicate that the carrying value of those assets may not be recoverable. An impairment loss must be recognized when the carrying amount of an asset exceeds the sum of the undiscounted estimated future cash flows. In this circumstance, we would recognize an impairment loss equal to the difference between the carrying value and the fair value of the asset. Fair value is estimatedfollowing to be the expected present value of future net cash flows from proved reserves, discounted utilizing a risk-free interest rate commensurate withmost critical accounting policies which involve the remaining lives for the respective oil and gas properties.
Oil and Gas Revenues.Oil and gas sales revenues are recognized when crude oil and natural gas volumes are produced and sold for our account. Each working interest owner in a well generally has the right to a specific percentage of production, and often actual production sold for any particular owner will differ from such owner’s ownership percentage. When, under contract terms, these differences are settled in cash, revenues are adjusted accordingly.
Coal Royalties. Coal royalty revenues are recognized on the basis of tons of coal sold by the Partnership’s lessees and the corresponding revenue from those sales. Coal leases other than those with Peabody affiliates are based on minimum monthly or annual payments, a minimum dollar royalty per ton and/or a percentage of the gross sales price. Peabody leases are leased on fixed royalties which escalate annually and also provide for minimum monthly payments.
Coal Services.Coal services revenues are recognized when lessees use the Partnership’s facilities for the processing and transportation of coal. Coal services revenues consist of fees collected from the Partnership’s lessees for the use of the Partnership’s loadout facility, coal preparation plant, dock loading facility.
Timber.Timber revenues are recognized as timber is sold on a contract basis where independent contractors harvest and sell the timber and, from time to time, in a competitive bid process involving sales of standing timber on individual parcels. Title and risk of loss pass to the independent contractors upon the execution of the contract. In addition, if the contractors do not harvest the timber within the specified time period, the title of the timber reverts back to the Partnership with no refund of original payment.
Minimum Rentals. Most of the Partnership’s lessees must make minimum monthly or annual payments that are generally recoupable over certain time periods. These minimum payments are recorded as deferred income. If the lessee recoups a minimum payment through production, the deferred income attributable to the minimum payment is recognized as coal royalty revenues. If a lessee fails to meet its minimum production for certain pre-determined time periods (the recoupment period), the deferred income attributable to the minimum payment is recognized as minimum rental revenues. Revenues associated with minimum rentals are included in other revenues.
Price Risk Management Activities.From time to time, we enter into derivative financial instruments to mitigate our exposure to natural gas and crude oil price volatility. The derivative financial instruments, which are placed with major financial institutions that we believe are minimum credit risks, take the form of costless collars and swaps. All derivative instruments are recorded on the balance sheet at fair value. If the derivative does not qualify as a hedge or is not designated as a hedge, the gain or loss on the derivative is recognized currently in earnings. To qualify for hedge accounting, the derivative must qualify either as a fair value hedge, cash flow hedge or foreign currency hedge. Currently, we are utilizing only cash flow hedges and the remaining discussion will relate exclusively to this type of derivative instrument. All hedge transactions are subject to our risk management policy, which has been reviewed and approved by the Board of Directors. We formally document all relationships between hedging instruments and hedged items, as well as its risk-management objective and strategy for undertaking various hedge transactions. This process includes linking
Page 22
all derivatives that are designated as cash flow hedges to forecasted transactions. We also formally assess, both at inception of the hedge and on an ongoing basis, whether the derivatives that are used in hedging transactions are highly effective in offsetting changes in cash flows of hedged transactions. We measure hedge effectiveness on a period basis. When it is determined that a derivative is not highly effective as a hedge, or that it has ceased to be a highly effective hedge, we discontinue hedge accounting prospectively. When hedge accounting is discontinued because it is probable that a forecasted transaction will not occur, the derivative will continue to be carried on the balance sheet at its fair value, and gains and losses that were accumulated in other comprehensive income will be recognized in earnings immediately. In all other situations in which hedge accounting is discontinued, the derivative will be carried at its fair value on the balance sheet, with changes in its fair value recognized in earnings prospectively. Gains and losses on hedging instruments when settled are included in natural gas or crude oil production revenues in the period that the related production is delivered. The fair valuesjudgment of our hedging instruments are determined based on third party forward price quotes for NYMEX Henry Hub and West Texas Intermediate closing prices.management.
Reserves.The estimates of oil and gas reserves are probably the single most critical estimate included in our financial statements. There are many uncertainties inherent in estimating crude oil and natural gas reserve quantities including projecting the total quantities in place, future production rates and projecting the timing of future development expenditures. In addition, reserve estimates of new discoveries are more impreciseless precise than those of producing properties withdue to the lack of a production history. Accordingly, these estimates are subject to change as additional information becomes available.
Proved reserves are the estimated quantities of crude oil, condensate and natural gas that geological and engineering data demonstrate with reasonable certainty to be recoverable in future years from known reservoirs under existing economic and operating conditions at the end of the respective years. Proved developed reserves are those reserves expected to be recovered through existing equipment and operating methods. Proved undeveloped reserves are those quantities that require additional capital investment through drilling or well recompletion techniques.
Reserve estimates become the basis for determining depletive write-off rates, recoverability of historical cost investments, and the fair value of properties subject to potential impairments.
ResultsThere are several factors which could change our estimates of Operationsoil and gas reserves. Significantly higher or lower product prices could lead to changes in the amount of reserves due to economic limits. An additional factor that could result in a change of recorded reserves is the reservoir decline rates being different than those assumed when the reserves were initially recorded. Estimation of future production and development costs is also subject to change partially due to factors beyond our control, such as energy costs and inflation or deflation of oil field service costs. Additionally, we perform impairment tests pursuant to Statement of Financial Accounting Standards (“SFAS”) No. 144 when significant events occur, such as a market move to a lower price environment or a material revision to our reserve estimates. We have recognized non-cash pretax charges of $0.4 million, $0.8
23
million and $33.6 million for 2003, 2002 and 2001, respectively, related to the impairment of oil and gas properties.
Depreciation and depletion of oil and gas producing properties is determined by the unit-of-production method and could change with revisions to estimated proved recoverable reserves.
Oil and Gas Revenues.Oil and gas sales revenues are recognized when crude oil and natural gas volumes are produced and sold for our account. As a result of the numerous requirements necessary to gather information from purchasers or various measurement locations, calculate volumes produced, perform field and wellhead allocations and distribute and disburse funds to various working interest partners and royalty owners, the collection of revenues from oil and gas production may take up to 60 days following the month of production. Therefore, accruals for revenues and accounts receivable are made based on estimates of our share of production, particularly from properties that are operated by our partners. Since the settlement process may take 30 to 60 days following the month of actual production, our financial results will include estimates of production and revenues for the related time period. Any differences between the actual amounts ultimately received and the original estimates are recorded in the period they become finalized.
Selected Financial Data – ConsolidatedCoal Royalties. Coal royalty revenues are recognized on the basis of tons of coal sold by the Partnership’s lessees and the corresponding revenues from those sales. Since PVR is not the mine operator, it does not have the actual production and revenues amounts until approximately 30 days following the month of production. Therefore, the financial results of the Partnership will include estimated revenues and accounts receivable for this 30 day period. Any differences between the actual amounts ultimately received and the original estimates are recorded in the period they become finalized.
2002 | 2001 | 2000 | |||||||
(in millions, except share data) | |||||||||
Revenues | $ | 111.0 | $ | 96.6 | $ | 106.0 | |||
Operating costs and expenses |
| 80.2 |
| 95.0 |
| 40.3 | |||
Operating income |
| 30.8 |
| 1.6 |
| 65.7 | |||
Net income |
| 12.1 |
| 34.3 |
| 39.3 | |||
Net income per share, basic |
| 1.35 |
| 3.92 |
| 4.76 | |||
Net income per share, diluted |
| 1.34 |
| 3.86 |
| 4.69 | |||
Cash flows provided by operating activities |
| 65.8 |
| 44.2 |
| 41.7 | |||
Consolidated Net IncomeOil and gas properties.We use the successful efforts method to account for our oil and gas properties. Under this method, costs of acquiring properties, costs of drilling successful exploration wells and development costs are capitalized. Annual lease rentals, exploration costs, geological, geophysical and seismic costs and exploratory dry-hole costs are expensed as incurred.
A portion of the carrying value of the Company’s oil and gas properties is attributable to unproved properties. At December 31, 2003, the costs attributable to unproved properties were approximately $60 million. These costs are not currently being depreciated or depleted. As exploration work progresses and the reserves on these properties are proven, capitalized costs of the properties will be subject to depreciation and depletion. If the exploration work is unsuccessful, the capitalized costs of the properties related to the unsuccessful work will be expensed. The timing of any writedowns of these unproven properties, if warranted, depends upon the nature, timing and extent of future exploration and development activities and their results.
Asset retirement obligations.In accordance with SFAS No. 143, we make estimates of the timing and future costs of plugging and abandoning wells. Estimated abandonment dates will be revised in the future based on changes to related economic lives, which vary with product prices and production costs. Estimated plugging costs may also be adjusted to reflect changing industry experience. Increases in operating costs and decreases in product prices would increase the estimated amount of our plugging and abandonment obligations and increase depletion expense. Our cash flows would not be affected until costs to plug and abandon were actually incurred.
Acquisitions
OurOil and gas
On January 22, 2003, we acquired a 25 percent non-operating working interest in properties located in a producing field in south Texas (“the south Texas acquisition”). The properties were acquired in a cash transaction with a private investor group for $33.5 million. The acquisition, which was effective December 31, 2002, was financed with the Company’s existing credit facility. Nine producing wells were acquired at the time of the
24
acquisition. Ten successful development wells and one development dry hole have been drilled in the field since the acquisition date. Additional wells are expected to be drilled over the next few years to fully develop the field.
Coal Royalty and Land Management
In PVR’s December 2002 Peabody Acquisition, the Partnership acquired two properties containing approximately 120 million tons of coal reserves from Peabody for 1,522,325 million common units, 1,240,833 million Class B common units (a combined common unit value of $57.0 million) and $72.5 million in cash. The acquisition included approximately $6.1 million, or 293,700 Class B units, held in escrow pending certain title transfers at December 31, 2002. As a result of the units held in escrow, approximately five million tons of coal reserves and 293,700 common units were not included in property, plant and equipment or partners’ capital, respectively, at December 31, 2002. In July 2003, 241,000 Class B common units were released from escrow in exchange for certain title transfers in New Mexico. In July 2003, all of the Class B common units were converted to common units, in accordance with their terms, upon the approval of our common unitholders. As of December 31, 2003, 52,700 common units remained in escrow pending Peabody acquiring and transferring to us certain of the West Virginia reserves we purchased. As a result of the units held in escrow, approximately one million tons of coal reserves and 52,700 common units were not included in property, plant and equipment or partners’ capital, respectively, at December 31, 2003. Approximately two-thirds of the reserves purchased from Peabody are located on the Lee Ranch property in New Mexico, which Peabody continues to operate as a surface mining operation. The balance of the reserves is in northern West Virginia, which Peabody also continues to operate. All of these reserves are being leased back to Peabody for royalty rates which escalate annually over the life of the property’s production. As part of the transaction, Peabody will receive the right to share in the general partner’s incentive distribution rights, if any, in exchange for additional properties Peabody may source to the Partnership in the future. The cash portion of the transaction was funded with long-term debt and $26.4 million in proceeds from the sale of U.S. Treasury notes. The acquired coal reserves had existing productive operations that have been included in the Partnership’s statements of income since the closing date.
In PVR’s August 2002 Upshur Acquisition, the Partnership acquired the coal mineral interests to approximately 16 million tons of coal reserves located on the Upshur properties in northern Appalachia for $12.3 million in cash. The Upshur Acquisition was the Partnership’s first exposure outside of central Appalachia. The properties, which include approximately 18,000 mineral acres, contain predominantly high sulfur, high BTU coal reserves.
In May 2001, the Partnership acquired the Fork Creek property in West Virginia, which is now referred to as the West Coal River property, by purchasing approximately 53 million tons of coal reserves for $33 million in cash. In early 2002, the operator at West Coal River filed for bankruptcy protection under Chapter 11 of the U.S. Bankruptcy Code. West Coal River’s operations were subsequently idled on March 4, 2002. The operator continued to pay minimum royalties to the Partnership until it recovered its lease on August 31, 2002. In November 2002, the Partnership purchased various infrastructure at West Coal River, including a 900-ton per hour coal preparation plant and a unit train loadout facility and a railroad-granted rebate on coal loaded through the facility for $5.1 million, and it assumed approximately $2.4 million in reclamation liabilities and approximately $0.6 million of stream mitigation obligations. The Partnership leased this property in May 2003 and has assigned all reclamation and mitigation liabilities to the new lessee, which agreed to be responsible for those liabilities. The new lessee began operations in the third quarter of 2003.
25
Results of Operations
Selected Financial Data—Consolidated
| 2003 | 2002 | 2001 | |||||||
| (in millions, except share data) | |||||||||
Revenues | $ | 181.3 | $ | 111.0 | $ | 96.6 | |||
Operating costs and expenses | $ | 119.2 | $ | 80.2 | $ | 95.0 | |||
Operating income | $ | 62.1 | $ | 30.8 | $ | 1.6 | |||
Net income | $ | 28.5 | $ | 12.1 | $ | 34.3 | |||
Earnings per share, basic | $ | 3.17 | $ | 1.35 | $ | 3.92 | |||
Earnings per share, diluted | $ | 3.15 | $ | 1.34 | $ | 3.86 | |||
Cash flows provided by operating activities | $ | 109.7 | $ | 65.8 | $ | 44.2 | |||
Included in net income for 2003 was $12.1$1.4 million, compared with $34.3 millionor $0.15 per diluted share, related to the adoption of Statement of Financial Accounting Standards No. 143, “Accounting for Asset Retirement Obligations.” This amount is included in 2001the oil and $39.3 million in 2000. Revenues for 2002 were $111.0 million, compared with $96.6 million and $106.0 million in 2001 and 2000, respectively.gas segment’s contribution to net income.
The 2001 results included a pre-tax gain on the sale of securities of approximately $54.7 million ($35.5 million after tax). This amount is included in “Corporate and Other”. Also included in the 2001 results was the impairment of certain oil and gas properties, for which we recorded a $33.6 million ($21.8 million after tax) impairment charge. In addition to the gain on sale of securities, net of the impairment charge noted above, the decrease in 2002 net income from 2001This amount was primarily due to lower natural gas prices and the minority interest resulting from the ownership change of our coal reserves in connection with the initial public offering of the Partnership’s common unitsincluded in the fourth quarter of 2001.
In 2000, we recorded a pre-tax gain of $23.9 million ($15.5 million after tax) on the sale of non-strategic naturaloil and gas properties located in Kentucky and West Virginia. The decrease in 2001segment’s contribution to net income from 2000 was primarily due to increased exploration, operating and general and administrative expenses as a result of the acquisition of Gulf Coast properties in 2001.
Corporate and Otherincome.
Dividends.Consolidated Net Income In April 2001, we sold 3.3 million shares of common stock of Norfolk Southern Corporation at an average selling price of $17.39 per share. Proceeds, net of commissions, totaled approximately $57.4 million. As a result, dividend income decreased from $2.6 million in 2000 to $0.2 million in 2001. No dividends were received during 2002.
Page 23Net income for the Company totaled $28.5 million in 2003, an increase of 136 percent over 2002. The increase was driven by higher oil and gas production volumes and increased market prices for crude oil and natural gas.
Oil and Gas Segment
In our oil and gas segment, we explore for, develop and produce crude oil and natural gas in the eastern and Gulf Coast onshore regions of the United States.
We use the successful efforts method of accounting for our oil and gas operations. Under this method of accounting, costs to acquire mineral interests in oil and gas properties and to drill and equip development wells (including development dry holes) are capitalized and amortized on a unit-of-production basis over the remaining life of proved developed reserves and proved reserves, respectively. Costs of drilling exploratory wells are initially capitalized, and later charged to expense upon determination that the well does not justify commercial development. Other exploratory costs, including annual delay rentals and geological and geophysical costs, are charged to expense when incurred.
The costs of unproved leaseholds are capitalized pending the results of exploration efforts. Unproved leasehold costs are assessed periodically, on a property-by-property basis, and a loss is recognized to the extent, if any, the cost of the property has been impaired. As unproved leaseholds are determined to be productive, the related costs are transferred to proved leaseholds.
Oil and natural gas revenues are generally recorded using the entitlement method in which we recognize our ownership interest in the production as revenue. Each working interest owner in a well generally has the right to a specific percentage of production, although actual production sold may differ from an ownership percentage. Using entitlement accounting, a receivable is recorded when sales are less than our entitlement and deferred revenue is recognized when sales are greater than our entitlement.
We review our long-lived assets, including proved oil and natural gas properties, for possible impairment whenever events or circumstances indicate that the carrying value of those assets may not be recoverable. An impairment loss must be recognized when the carrying amount of an asset exceeds the sum of the undiscounted estimated future cash flows. In this circumstance, we would recognize an impairment loss equal to the difference between the carrying value and the fair value of the asset. Fair value is estimated using the expected present value of future net cash flows from proved reserves, utilizing a risk-free interest rate.
Our revenues, profitability and future rate of growth are highly dependent on the prevailing prices for oil and natural gas, which are affected by numerous factors that are generally beyond the Company’s control. Crude oil prices are generally determined by global supply and demand. Natural gas prices are influenced by national and regional supply and demand. A substantial or extended decline in the prices of oil or natural gas could have a material adverse effect on our revenues, profitability and cash flow and could, under certain circumstances, result in an impairment of our oil and natural gas properties.
Our future profitability and growth is also highly dependent on the results of our exploratory and development drilling programs.
Page 2426
Selected Financial and Operating Data – Data—Oil and Gas
2002 | 2001 | 2000 | |||||||||
(in thousands, except as noted) | |||||||||||
Revenues | |||||||||||
Oil and condensate | $ | 8,246 |
| $ | 3,762 |
| $ | 832 | |||
Natural gas | $ | 62,552 |
|
| 53,263 |
|
| 46,019 | |||
Other |
| 714 |
|
| 753 |
|
| 24,554 | |||
Total Revenues | $ | 71,512 |
| $ | 57,778 |
| $ | 71,405 | |||
Expenses | |||||||||||
Lease operating |
| 9,253 |
|
| 5,631 |
|
| 4,562 | |||
Exploration |
| 7,549 |
|
| 11,514 |
|
| 5,080 | |||
Taxes other than income |
| 5,618 |
|
| 4,439 |
|
| 2,809 | |||
General and administrative |
| 8,381 |
|
| 5,330 |
|
| 2,656 | |||
Operating expenses before non-cash charges |
| 30,801 |
|
| 26,914 |
|
| 15,107 | |||
Depreciation, depletion and amortization |
| 26,336 |
|
| 16,418 |
|
| 9,883 | |||
Impairment of properties |
| 796 |
|
| 33,583 |
|
| — | |||
Total Operating Expenses |
| 57,933 |
|
| 76,915 |
|
| 24,990 | |||
Operating Income (Loss) | $ | 13,579 |
| $ | (19,137 | ) | $ | 46,415 | |||
Production | |||||||||||
Oil and condensate (Mbbls) * |
| 349 |
|
| 164 |
|
| 31 | |||
Natural gas (MMcf) * |
| 18,697 |
|
| 13,130 |
|
| 11,645 | |||
Total production (MMcfe) * |
| 20,791 |
|
| 14,114 |
|
| 11,831 | |||
Realized prices | |||||||||||
Oil and condensate ($/Bbl) | $ | 23.63 |
| $ | 22.94 |
| $ | 26.84 | |||
Natural gas ($/Mcf) |
| 3.35 |
|
| 4.06 |
|
| 3.95 | |||
Production cost ($/Mcfe) | |||||||||||
Lease operating expense | $ | 0.45 |
| $ | 0.40 |
| $ | 0.38 | |||
Taxes other than income |
| 0.27 |
|
| 0.31 |
|
| 0.24 | |||
General and administrative expense |
| 0.40 |
|
| 0.38 |
|
| 0.22 | |||
Total production cost | $ | 1.12 |
| $ | 1.09 |
| $ | 0.84 | |||
Hedging Summary | |||||||||||
Natural gas prices ($/Mcf): | |||||||||||
Actual price received for production | $ | 3.39 |
| $ | 3.92 |
|
| 3.95 | |||
Effect of hedging activities |
| (0.04 | ) |
| 0.14 |
|
| — | |||
Average realized price | $ | 3.35 |
| $ | 4.06 |
| $ | 3.95 | |||
Crude oil prices ($/Bbl): | |||||||||||
Actual price received for production | $ | 24.39 |
| $ | 22.45 |
| $ | 26.84 | |||
Effect of hedging activities |
| (0.76 | ) |
| 0.49 |
|
| — | |||
Average realized price | $ | 23.63 |
| $ | 22.94 |
| $ | 26.84 | |||
Revenues Oil and condensate Natural gas Other Total Revenues Expenses Lease operating Exploration Taxes other than income General and administrative Operating expenses before non-cash charges Depreciation, depletion and amortization Impairment of properties Total Operating Expenses Operating Income (Loss) Production Oil and condensate (Mbbls) * Natural gas (MMcf) * Total production (MMcfe) * Prices Oil and condensate ($/Bbl) Natural gas ($/Mcf) Production cost ($/Mcfe) Lease operating expense Taxes other than income General and administrative expense Total production cost Hedging Summary Natural gas prices ($/Mcf): Actual price received for production Effect of hedging activities Average realized price Crude oil prices ($/Bbl): Actual price received for production Effect of hedging activities Average realized price* 2003 2002 2001 (in thousands, except as noted) $ 16,816 $ 8,246 $ 3,762 106,615 62,552 53,263 1,391 714 753 $ 124,822 $ 71,512 $ 57,778 12,115 9,253 5,631 15,503 7,549 11,514 9,515 5,618 4,439 7,804 8,381 5,330 44,937 30,801 26,914 33,164 26,336 16,418 406 796 33,583 78,507 57,933 76,915 $ 46,315 $ 13,579 $ (19,137 ) 625 349 164 20,094 18,697 13,130 23,844 20,791 14,114 $ 26.91 $ 23.63 $ 22.94 $ 5.31 $ 3.35 $ 4.06 $ 0.51 $ 0.45 $ 0.40 0.40 0.27 0.31 0.33 0.40 0.38 $ 1.24 $ 1.12 $ 1.09 $ 5.59 $ 3.39 $ 3.92 (0.28 ) (0.04 ) 0.14 $ 5.31 $ 3.35 $ 4.06 $ 27.77 $ 24.39 $ 22.45 (0.86 ) (0.76 ) 0.49 $ 26.91 $ 23.63 $ 22.94
| * | Production for 2002 does not include 16 Mbbls of oil and condensate and 18 MMcf of natural gas production, or 114 MMcfe, related to discontinued operations. 2001 production volumes for the related properties sold were insignificant. |
27
Year Ended December 31, 2003 Compared to Year Ended December 31, 2002
Revenues. Oil and gas total revenues increased $53.3 million to $124.8 million in 2003 from $71.5 million in 2002.
Crude oil and natural gas production increased to 23.8 Bcfe in 2003, a 14 percent increase over 20.8 Bcfe in 2002. The increase was primarily due to the south Texas acquisition in January 2003 and the drilling programs in 2003 and 2002. Increased oil and natural gas production accounted for approximately $11.2 million, or 114 MMcfe,21 percent, of the $53.3 million increase in total oil and gas revenues from 2002 to 2003.
Approximately 84 percent of our 2003 production was natural gas, for which the average natural gas price received during 2003 was $5.31 per Mcf compared with $3.35 per Mcf in 2002, a 59 percent increase. The average oil price received was $26.91 per barrel for 2003, up 14 percent from $23.63 per barrel in 2002. Increased oil and natural gas prices accounted for approximately $41.4 million, or 78 percent, of the $53.3 million increase in total oil and gas revenues from 2002 to 2003.
Due to the volatility of crude oil and natural gas prices, we will hedge the price received for sales volumes through the use of swaps and costless collars in accordance with our Corporate policy. Gains and losses from hedging activities are included in revenues when the hedged production occurs. We recognized a loss on settled hedging activities of $6.1 million in 2003 and a loss of $1.1 million in 2002.
Operating expenses. Lease operating expenses increased from $9.3 million in 2002 to $12.1 million in 2003. The increase related to discontinued operations. 2001 production volumes for properties soldoperations associated with the south Texas acquisition in January 2003 and new producing wells resulting from successful drilling activities over the last twelve months. In addition to new operations, there were insignificant.increased well workover costs associated with various fields.
Page 25Exploration expenses for the years ended December 31, 2003 and 2002 consisted of the following (in thousands):
| 2003 | 2002 | |||||
Seismic | $ | 8,713 | $ | 4,892 | ||
Dry hole costs | 5,186 | 1,357 | ||||
Leasehold amortization | 802 | 899 | ||||
Other | 802 | 401 | ||||
Total | $ | 15,503 | $ | 7,549 | ||
Exploration expenses increased from $7.5 million in 2002 to $15.5 million in 2003. The increase was primarily due to unsuccessful exploratory wells and the additional purchase of seismic data to evaluate both existing and new prospects during 2003 compared to 2002. There were three unsuccessful exploratory attempts in both years; however, the location, type and depth of the wells drilled changed between years. The unsuccessful wells in 2003 were primarily in the Gulf Coast region, while the unsuccessful wells in 2002 were in the Appalachia region, which has smaller, less costly drilling projects than the Gulf Coast region.
Taxes other than income taxes increased from $5.6 million in 2002 to $9.5 million in 2003. The increased taxes were a result of the increased revenues due to the higher prices received for natural gas and crude oil as well as increased production in 2003 as compared to 2002.
Oil and gas depreciation, depletion and amortization (“DD&A”) expense increased from $26.3 million in 2002 to $33.2 million in 2003. This increase was primarily due to higher production, as discussed earlier, and an increase in the weighted average DD&A rate from $1.27 per Mcfe in 2002 to $1.39 per Mcfe in 2003. The increase in the weighted average DD&A rate was the result of a greater percentage of production coming from fields which carry higher reserve replacement cost averages.
28
Year Ended December 31, 2002 Compared to Year Ended December 31, 2001
Revenues.Oil and gas total revenues increased $13.7 million to $71.5 million in 2002 from $57.8 million in 2001 primarily due to an increase in crude oil and natural gas production.production, offset by a decrease in average realized prices.
Crude oil and natural gas production increased to 20.8 Bcfe in 2002, a 47 percent increase over 14.1 Bcfe in 2001. The increase was primarily due to the inclusion of a full year of production from the Gulf Coast oil and gas properties acquired in July 2001 and development drilling success in connection with our Gulf Coast, Mississippi and Appalachian assets. Approximately 90 percent of our 2002 production was natural gas.
The average natural gas price received during 2002 was $3.35 per Mcf compared with $4.06 per Mcf in 2001, a 17 percent decrease. The average oil price received was $23.63 per barrel for 2002, up three percent from $22.94 per barrel in 2001.
Due to the volatility of crude oil and natural gas prices, we sometimes hedge the price received for sales volumes through the use of swaps and costless collars. Gains and losses from hedging activities are included in revenues when the hedged production occurs. We recognized a loss on settled hedging activities of $1.0$1.1 million in 2002 and a gain of $1.9 million in 2001.
Operating expenses. Production costsLease operating expenses increased from $5.6 million in 2001 to $9.3 million in 2002. The increase was primarily attributable to the full year impact of operating costs related to our acquisition of certain Gulf Coast oil and gas properties in late July of 2001.
Exploration expenses for the years ended December 31, 2002 and 2001 consisted of the following (in thousands):
| 2002 | 2001 | |||||
Seismic | $ | 4,892 | $ | 2,381 | ||
Dry hole costs | 1,357 | 5,973 | ||||
Leasehold amortization | 899 | 2,980 | ||||
Other | 401 | 180 | ||||
Total | $ | 7,549 | $ | 11,514 | ||
Exploration expenses decreased from $11.5 million in 2001 to $7.5 million in 2002 primarily due to loweramounts expensed for three unsuccessful exploratory dry hole costs incurred this year. Seismic expenditures were $4.7 millionwells in 2002 up from $2.2 millioncompared to five in 2001. The impact of these higher costs was offset by2001, and the reduced write-offs of unproved property in 2002.2002 compared to 2001. Offsetting these decreases were additional seismic expenditures of $4.9 million in 2002, up from $2.4 million in 2001.
Taxes other than income taxes increased by $1.2from $4.4 million in 2001 to $5.6 million in 2002. The increased taxes were a result of the higher production and revenue levels in 2002.
General and administrative (“G&A”) expenses increased to $8.4 million in 2002 from $5.3 million in 2001. The increase was primarily attributable to our acquisition of the Gulf Coast oil and gas properties in July 2001 and related personnel expenses.
Oil and gas depreciation, depletion and amortization (“DD&A”)&A expense increased to $26.3 million in 2002 from $16.4 million in 2001. This increase was primarily due to increasedhigher production, relatedas discussed earlier, and an increase in the weighted average DD&A rate from $1.16 per Mcfe in 2001 to the Gulf Coast assets acquired$1.27 per Mcfe in July 2001, as well as2002. The increased DD&A rates due to changesrate resulted from revisions in reserve estimates and additional capital additions.investment.
Year Ended December 31, 2001 Compared to Year Ended December 31, 2000
Revenues.Oil and gas revenues increased $10.2 million to $57.0 million in 2001 from 2000 primarily due to an increase in crude oil and natural gas production.
Crude oil and natural gas sales combined increased 22 percent to $57.0 million due to a 19 percent increase in production. The increase was primarily due to production related to our acquisition of certain Gulf Coast oil and gas properties in July 2001 and to increased production from the Gwinville Field, offset in part by production lost from properties disposed of in the fourth quarter of 2000. Approximately 93 percent of our 2001 production was natural gas. The average natural gas price received during 2001 was $4.06 per Mcf compared with $3.95 per Mcf in 2000, a three percent increase. The average oil price received was $22.94 per barrel for 2001, down 15 percent from $26.84 per barrel in 2000. We recognized a gain of $1.9 million in 2001 on hedging activities with no gain or loss recognized in 2000.
Operating expenses. Production costs, consisting of lease operating expense and taxes other than income, increased from $7.4 million in 2000 to $10.0 million in 2001. Production costs increased from $0.62 per Mcfe in 2000 to $0.71 per Mcfe in 2001. The increase was primarily attributable to the acquisition of certain Gulf Coast oil and gas properties in July 2001.
Exploration expenses increased from $5.1 million in 2000 to $11.5 million in 2001. The $11.5 million in 2001 consisted of $2.4 million in seismic expenditures, charges relating to five gross (3.5 net) nonproductive exploratory wells and the impairment of unproved leasehold costs. Our increased seismic expenditures for the year, compared with 1.7 million in 2000, represented a continued effort to establish a balanced exploratory program.
Page 2629
G&A expenses increased to $5.3 million in 2001 from $2.7 million in 2000. The increase was attributable to the acquisition of certain Gulf Coast oil and gas properties in late July of 2001 and related personnel expenses.
Oil and gas DD&A increased to $16.4 million in 2000 from $9.9 million in 2000. This increase was primarily due to increased production and a higher cost basis in the producing assets. The acquisition of certain Gulf Coast oil and gas properties in July 2001 was completed when crude oil and natural gas future prices were higher than forecasted prices at year-end 2001. As a result of low commodity prices in the fourth quarter 2001, we subjected all properties to impairment testing and recognized a pretax impairment charge related primarily to our Texas properties of $33.6 million ($21.8 million after tax).
Coal Royalty and Land Management Segment (PVR)
The coal royalty and land management segment includes PVR’s mineral rights to coal reserves, its timber assets and its other land assets. The assets, liabilities and earnings of PVR are fully consolidated in our financial statements, with the public unitholders’ interest reflected as a minority interest.
The Partnership enters into leases with various third-party operators for the right to mine coal reserves on the Partnership’s properties in exchange for royalty payments. CoalApproximately 72 percent of the Partnership’s 2003 coal royalty revenues under non-Peabody leases areand 99 percent of its 2002 coal royalty revenues were based on the higher of a percentage of the gross sales price or a fixed price per ton of coal sold, with pre-established minimum monthly or annual payments. UnderThe balance of the Peabody leases,Partnership’s 2003 and 2002 coal royalty revenues arewere based on fixed royalty rates which escalate annually, also with pre-established monthly minimums. In addition to coal royalty revenues, the Partnership generates coal service revenues from fees charged to lessees for the use of coal preparation and transportation facilities. The Partnership also generates revenues from the sale of timber on its properties.
The coal royalty stream is impacted by several factors, which PVR generally cannot control. The number of tons mined annually is determined by an operator’s mining efficiency, labor availability, geologic conditions, access to capital, ability to market coal and ability to arrange reliable transportation to the end-user. The possibility exists that new legislation or regulations may be adopted which may have a significant impact on the mining operations of the Partnership’s lessees or their customers’ ability to use coal and may require PVR, its lessees or its lessee’s customers to change operations significantly or incur substantial costs.
Page 2730
Selected Financial and Operating Data – Data—Coal Royalty and Land Management
2002 | 2001 | 2000 | 2003 | 2002 | 2001 | ||||||||||||||||
(in thousands, except as noted) | (in thousands, except as noted) | ||||||||||||||||||||
Revenues | |||||||||||||||||||||
Coal royalties | $ | 31,358 | $ | 32,365 | $ | 24,308 | $ | 50,312 | $ | 31,358 | $ | 32,365 | |||||||||
Timber |
| 1,640 |
| 1,732 |
| 2,388 | 1,020 | 1,640 | 1,732 | ||||||||||||
Coal services |
| 1,704 |
| 1,660 |
| 1,385 | 2,111 | 1,704 | 1,660 | ||||||||||||
Other |
| 3,906 |
| 1,756 |
| 2,108 | 2,199 | 3,906 | 1,756 | ||||||||||||
Total Revenues |
| 38,608 |
| 37,513 |
| 30,189 | 55,642 | 38,608 | 37,513 | ||||||||||||
Expenses | |||||||||||||||||||||
Operating |
| 3,807 |
| 3,812 |
| 3,480 | 5,491 | 3,807 | 3,812 | ||||||||||||
General and administrative |
| 6,419 |
| 5,459 |
| 4,847 | 7,013 | 6,419 | 5,459 | ||||||||||||
Operating expenses before non-cash charges |
| 10,226 |
| 9,271 |
| 8,327 | |||||||||||||||
Operating Expenses Before Non-cash Charges | 12,504 | 10,226 | 9,271 | ||||||||||||||||||
Depreciation, depletion and amortization |
| 3,955 |
| 3,084 |
| 2,047 | 16,578 | 3,955 | 3,084 | ||||||||||||
Total Operating Expenses |
| 14,181 |
| 12,355 |
| 10,374 | 29,082 | 14,181 | 12,355 | ||||||||||||
Operating Income | $ | 24,427 | $ | 25,158 | $ | 19,815 | 26,560 | 24,427 | 25,158 | ||||||||||||
Interest expense | (4,986 | ) | (1,758 | ) | (269 | ) | |||||||||||||||
Interest income and other | 1,223 | 2,017 | 1,388 | ||||||||||||||||||
Income from operations before minority interest, income taxes and cumulative effect of change in accounting principle | 22,797 | 24,686 | 26,277 | ||||||||||||||||||
Minority interest | (12,510 | ) | (11,896 | ) | (1,763 | ) | |||||||||||||||
Contribution to income from operations before income taxes and cumulative effect of change in accounting principle | 10,287 | 12,790 | 24,514 | ||||||||||||||||||
Production | |||||||||||||||||||||
Royalty coal tons produced by lessees (thousands) |
| 14,281 |
| 15,306 |
| 12,536 | 26,463 | 14,281 | 15,306 | ||||||||||||
Timber sales (Mbf) |
| 8,345 |
| 8,741 |
| 8,545 | 5,250 | 8,345 | 8,741 | ||||||||||||
Prices | |||||||||||||||||||||
Royalty per ton | $ | 2.20 | $ | 2.11 | $ | 1.94 | $ | 1.90 | $ | 2.20 | $ | 2.11 | |||||||||
Timber sales price per Mbf | $ | 187 | $ | 168 | $ | 257 | $ | 179 | $ | 187 | $ | 168 | |||||||||
Year Ended December 31, 2003 Compared to Year Ended December 31, 2002
Revenues. Coal royalty and land management segment revenues for the year ended December 31, 2003 were $55.6 million compared to $38.6 million for the year ended December 31, 2002, an increase of $17 million, or 44 percent.
Coal royalty revenues for the year ended December 31, 2003 were $50.3 million compared to $31.4 million for the year ended December 31, 2001, an increase of $18.9 million, or 60 percent. Average gross royalties per ton decreased from $2.20 in 2002 to $1.90 in 2003 as a result of the lower royalty rates attributable to the Peabody Acquisition in December 2002. Over these same periods, production increased by 12.2 million tons, or 85 percent, from 14.3 million tons to 26.5 millions tons. These variances were primarily due to the following factors:
31
Timber revenues decreased to $1.0 million for the year ended December 31, 2003 from $1.6 million for the year ended December 31, 2002, a decrease of $0.6 million, or 38 percent. Volume sold declined 3.1 MMbf, or 37 percent, to 5.3 MMbf in 2003, compared to 8.3 MMbf for 2002. The decrease in volume sold was due to the timing of parcel sales.
Coal services revenues for the year ended December 31, 2003 were $2.1 million compared to $1.7 million for the year ended December 31, 2002, an increase of $0.4 million, or 24 percent. The increase was a direct result of our West Coal River preparation and transportation facility beginning operations in July 2003 and the addition of one of PVR’s three modular preparation plants.
Other revenues were $2.2 million for the year ended December 31, 2003 compared to $3.9 million for the year ended December 31, 2002, a decrease of $1.7 million, or 44 percent. The decrease was primarily due to reduction of minimum rental revenues. The decrease in minimum rental revenues was due to a lessee rejecting PVR’s lease in bankruptcy in 2002; consequently, $0.8 million of deferred revenues from this respective lessee was recognized as income in 2002. Additionally, a railroad rebate received for the use of a specific portion of railroad by one of PVR’s lessees was paid in full in the fourth quarter of 2002.
Operating expenses.Operating expenses, which include both lease operating expenses and taxes other than income, increased to $5.5 million for the year ended December 31, 2003 compared to $3.8 million for the year ended December 31, 2002, representing a 44 percent increase. Lease operating expenses were $4.2 million for the year ended December 31, 2003 compared to $2.9 million for the year ended December 31, 2002, an increase of $1.3 million, or 45 percent. The increase was primarily due to maintenance costs for idled mines on the West Coal River property. PVR leased its West Coal River property in May 2003, and the on-going maintenance costs were assumed by the new lessee as of that date. The remainder of the variance is primarily attributable to increased production by lessees on subleased properties. Aggregate production from subleased properties increased to 2.0 million tons for the year ended December 31, 2003 from 1.8 million tons for the year ended December 31, 2002, an increase of 0.2 million tons, or 11 percent. Taxes other than income for the year ended December 31, 2003 were $1.3 million compared to $0.9 million for the year ended December 31, 2002, an increase of $0.4 million, or 40 percent. The variance was attributable to increased property taxes as a result of assuming the property tax obligation on the West Coal River property upon re-acquiring the lease from the bankrupt lessee. The West Coal River property was leased in May 2003, and the on-going property taxes were assumed by the new lessee as of that date.
32
G&A expenses increased to $7.0 million for the year ended December 31, 2003 compared to $6.4 million for the year ended December 31, 2002, representing a 9 percent increase. The increase was primarily attributable to increased payroll, an increase in insurance premiums and additional recurring expenses associated with the Peabody Acquisition and costs related to the secondary offering of units for Peabody.
DD&A expense for the year ended December 31, 2003 was $16.6 million compared to $4.0 million for the year ended December 31, 2002, an increase of $12.6 million, or 319 percent. The increase was a result of higher depletion rates caused by higher cost bases relative to reserves added as well as increased production, both of which related primarily to the Peabody and Upshur Acquisitions completed in the last half of 2002.
Interest expense.Interest expense was $5.0 million for the year ended December 31, 2003 compared with $1.8 million for the same period in 2002, an increase of $3.2 million, or 184 percent. The higher interest expense was primarily due to the increase in PVR’s long-term borrowings in connection with the Peabody Acquisition in December 2002.
Interest income.Interest income was $1.2 million for the year ended December 31, 2003 compared with $2.0 million for the year ended December 31, 2002, a decrease of $0.8 million, or 39 percent. The decrease was primarily due to the liquidation of $43.4 million of U.S. Treasury notes in the last half of 2002.
Minority interest.Minority interest was $12.5 million for the year ended December 31, 2003 compared with $11.9 million for the year ended December 31, 2002, an increase of $0.6 million, or 5 percent. The increase was primarily due to an increase in the public’s ownership percentage in the Partnership, offset by a decrease in the Partnership’s net income for the comparable years.
Year Ended December 31, 2002 Compared to Year Ended December 31, 2001
Revenues. Coal royalty and land management segment revenues for the year ended December 31, 2002 were $38.6 million compared to $37.5 million for the year ended December 31, 2001, an increase of $1.1 million, or three percent.
Coal royalty revenues for the year ended December 31, 2002 were $31.4 million compared to $32.4 million for the year ended December 31, 2001, a decrease of $1.0 million, or three percent. Over these same periods, production decreased by 1.0 million tons, or seven percent, from 15.3 million tons to 14.3 millions tons. These decreases were primarily due to weaker coal demand in 2002 in general, and more specifically, the idling of production at the Fork CreekWest Coal River property caused by the lessee’s bankruptcy.
Timber revenues decreased to $1.6 million for the year ended December 31, 2002 from $1.7 million for the year ended December 31, 2001, a decrease of $0.1 million, or five percent. Volume sold declined 396 thousand board feet (Mbf),0.4 MMbf, or five percent, to 8,345 Mbf8.3 MMbf in 2002, compared to 8,741 Mbf8.7 MMbf for 2001.
Coal services revenues remained constant at $1.7 million for the years ended December 31, 2002 and 2001. Slight increases in revenues generated from PVR’s modular preparation plants and dock loadout facility were offset by a minor reduction in revenues from its unit-train loadout facility.
Other revenues were $3.9 million for the year ended December 31, 2002 compared to $1.8 million for the year ended December 31, 2001, an increase of $2.1 million, or 122 percent. The increase was primarily due to the recognition of minimum rental payments received from the Partnership’s lessees which are no longer recoupable by the lessee. Two of PVR’s lessees, Horizon Resources, Inc. (formerly AEI Resources, Inc.) and Pen Holdings, Inc., both of which filed Chapter 11 bankruptcies during 2002, accounted for $1.9 million of minimum rental income in 2002.
Page 2833
Operating expenses.Operating expenses, which include both lease operating expenses and taxes other than income, were $3.8 million for the years ended December 31, 2002 and 2001. Lease operating expenses were $2.9 million for the year ended December 31, 2002 compared to $3.2 million for the year ended December 31, 2001, a decrease of $0.3 million, or nine percent. This decrease iswas primarily due to a decrease in production by lessees on the Partnership’s subleased properties, offset by temporary mine maintenance costs on its Coal River property. Aggregate production from subleased properties decreased to 1.8 million tons for the year ended December 31, 2002 from 2.3 million tons for the year ended December 31, 2001. Taxes other than income for the year ended December 31, 2002 was $0.9 million compared to $0.6 million for the year ended December 31, 2001, an increase of $0.3 million, or 45 percent. The increase was primarily due to an increase in state franchise taxes resulting from the Partnership’s change from a corporate to a partnership structure in late 2001. Prior to the initial formation of the Partnership, franchise taxes were calculated based on filing as a corporation.
G&A expenses increased to $6.4 million for the year ended December 31, 2002 compared to $5.5 million for the year ended December 31, 2001, representing an 18 percent increase. The increase was primarily attributable to a full year of fees and expenses associated with the Partnership being a publicly traded entity.
Depreciation and depletion expenseDD&A for the year ended December 31, 2002 was $4.0 million compared to $3.1 million for the year ended December 31, 2001, an increase of $0.9 million, or 28 percent. The increase in depreciation, depletion and amortization resulted from an increase in the depletive write-off rate per ton caused by a downward revision of coal reserves in the late 2001, higher cost coal properties being added to the depletable base as a result of recent acquisitions and additional depreciation related to coal services capital projects.
Year Ended December 31, 2001 Compared to Year Ended December 31, 2000Interest Expense.
Revenues. Coal royalty and land management segment revenues were $37.5 million in 2001 and $30.2 million in 2000, representing a 24 percent increase.
Coal royalty revenues increased $8.1 million from $24.3 million in 2000 to $32.4 million in 2001. Production increases were the primary factor related to the increase in revenues. Royalty tons increased 2.8 million from 12.5 million in 2000 to 15.3 million in 2001, or 22 percent. These production increases were attributable to the start up of five new mines, the June 2001 acquisition of new properties and the completion of a capital project on another lease.
Timber revenues decreased to $1.7 million for the year ended December 31, 2001 from $2.4 million for the year ended December 31, 2000, a decrease of $0.7 million, or 27 percent. The decrease is primarily attributable to a decrease in the average price received for the timber from $257 per Mbf for the year ended December 31, 2000 to $168 per Mbf for the year ended December 31, 2001. The decrease reflects overall market conditions as well as the sale of lower priced species and lower quality timber.
Coal services revenues increased to $1.7 million for the year ended December 31, 2001 from $1.4 million in 2000, an increase of $0.3 million, or 20 percent. The increase is a direct result of the addition of a small preparation plant put into service during 2001 and additional usage of the Partnership’s existing coal service facilities.
Other revenues wereInterest expense was $1.8 million for the year ended December 31, 20012002 compared with $2.1$0.3 million for the same period in 2001, an increase of $1.5 million. The increase was primarily due to Partnership’s long-term borrowings in connection with its creation in October 2001. See additional discussion of the Partnership’s credit facilities below in Capital Resources and Liquidity.
Interest Income.Interest income was $2.0 million for the year ended December 31, 2000, a decrease of $0.3 million, or 17 percent. The decrease was primarily due to gains from the sale of property and equipment in 2000, offset by the recognition of minimum rental payments received from lessees which are no longer recoupable.
Operating expenses.Operating expenses were $3.8 million for the year ended December 31, 20012002 compared with $3.5$1.4 million for the year ended December 31, 2000, an increase of $0.3 million, or 10 percent. This variance is primarily due to an increase in production by lessees on PVR’s subleased properties resulting in royalty expense incurred. Production from subleased properties increased from 2.1 million tons for the year ended December 31, 2000 to 2.3 million tons for the year ended December 31, 2001, an increase of 0.2 million tons, or 10 percent.$0.6 million. The increase in interest income was due to the U.S. Treasury Notes purchased by the Partnership in conjunction with the closing of its initial public offering in October 2001, and securing its own credit facility.
G&A expenses increased to $5.5Minority interest.Minority interest was $11.9 million for the year ended December 31, 2002 compared with $1.8 million for the year ended December 31, 2001, comparedan increase of $10.1 million. The minority interest share of the Partnership’s net income was only attributable to $4.8 million for the year endedearnings subsequent to its creation in October 2001.
34
Corporate and Other
The Corporate and Other segment primarily consists of oversight and administrative functions.
Selected Financial and Operating Data—Corporate and Other
| 2003 | 2002 | 2001 | ||||||||||
| (in thousands, except as noted) | ||||||||||||
Revenues | ||||||||||||
Other | $ | 820 | $ | 837 | $ | 1,280 | ||||||
Total Revenues | $ | 820 | $ | 837 | $ | 1,280 | ||||||
Expenses | ||||||||||||
Lease operating | 600 | 607 | 601 | |||||||||
Exploration | — | 166 | 174 | |||||||||
Taxes other than income | 551 | 291 | 378 | |||||||||
General and administrative | 10,076 | 6,640 | 4,508 | |||||||||
Operating expenses before non-cash charges | 11,227 | 7,704 | 5,661 | |||||||||
Depreciation, depletion and amortization | 367 | 348 | 77 | |||||||||
Total Operating Expenses | 11,594 | 8,052 | 5,738 | |||||||||
Operating Loss | $ | (10,774 | ) | $ | (7,215 | ) | $ | (4,458 | ) | |||
Interest expense | (318 | ) | (358 | ) | (2,184 | ) | ||||||
Interest income and other | 8 | 15 | 188 | |||||||||
Gain on sale of securities | — | — | 54,688 | |||||||||
Contribution to income from operations before income taxes and cumulative effect of change in accounting principle | $ | (11,084 | ) | $ | (7,558 | ) | $ | 48,234 | ||||
Year Ended December 31, 2000. This2003 Compared to Year Ended December 31, 2002
G&A expenses increased to $10.1 million in 2003 from $6.6 million in 2002. The $3.5 million increase iswas primarily attributable to feesconsulting and advisory services related to the consideration of various shareholder proposals, higher insurance premiums and a general increase in staffing levels.
In conjunction with the acquisition of oil and gas properties during 2001, considerable unproved leasehold costs were recorded. Interest costs associated with tax preparationnon-producing leases were capitalized during 2003 and public reporting by the Partnership.
Page 29
Depreciation and depletion expense for the year ended December 31, 2001 was $3.1 million compared with2002 as activities were in progress to bring projects to their intended use. We capitalized $2.0 million forand $1.0 million of interest costs in 2003 and 2002, respectively. Interest expense not capitalized in the year ended December 31, 2000, an increaseCorporate and Other segment related to amortization of $1.1 million, or 51 percent. This increase primarily resulted from coal production increases of 22 percent. Depreciation and depletion expense increased, on a per ton basis, to $0.20 per ton for the year ended December 31, 2001 from $0.16 for the year ended December 31, 2000. The $0.04 increase on a per ton basis results from increased production from the Coal River property, which has a significantly higher cost basis.debt issuance costs.
Year Ended December 31, 2002 Compared to Year Ended December 31, 2001
Other revenue decreased to $0.8 million in 2002 from $1.3 million in 2001. The $0.5 million decrease was due to the absence of dividend and other income in 2002, which existed in 2001. Dividends on the Norfolk Southern Corporation stock were a source of income to the Company for part of the 2001 year. The balance of other revenue during these years consisted primarily of railcar rental revenues.
G&A expenses increased to $6.6 million in 2002 from $4.5 million in 2001. The $2.1 million increase was primarily attributable to consulting and advisory services and legal fees related to the consideration of various shareholder proposals.
In conjunction with the acquisition of oil and gas properties during 2001, considerable unproved leasehold costs were recorded. Interest costs associated with non-producing leases were capitalized during 2002 and 2001 as activities were in progress to bring projects to their intended use. We capitalized $1.0 million and $1.1 million of interest costs in 2002 and 2001, respectively. Interest expense reflected in the Corporate and Other segment during 2002 and 2001 related to amortization of debt issuance costs.
35
In April 2001, we sold all of our 3.3 million common share position in Norfolk Southern Corporation and other stocks classified as available-for-sale. The Norfolk Southern Corporation shares were sold at an average price of $17.39 per share. Proceeds from the sales, net of commissions, total approximately $57.4 million. We recorded a pre-tax gain on sale of securities of $54.7 million.
Reserves
Oil and Gas Reserves
Our total proved reserves at December 31, 20022003 were 273.4323 Bcfe, compared with 252.8273 Bcfe at December 31, 2001.2002. At December 31, 2002,2003, proved developed reserves comprised 7978 percent of our total proved reserves, compared with 7879 percent at December 31, 2001.2002. We havehad 152 net proved undeveloped drilling locations at December 31, 2003, compared with 128 net proved undeveloped drilling locations at December 31, 2002, compared with 93 locations at December 31, 2001.2002.
2002 | 2001 | 2000 | 2003 | 2002 | 2001 | |||||||||||||||||||
Proved reserves | ||||||||||||||||||||||||
Crude oil (Mbbls) |
| 5,361 |
|
| 3,920 |
|
| 71 |
| |||||||||||||||
Natural gas (MMcf) |
| 241,255 |
|
| 229,253 |
|
| 174,247 |
| |||||||||||||||
Oil and condensate (MMbbls) | 6.6 | 5.4 | 3.9 | |||||||||||||||||||||
Natural gas (Bcf) | 283.1 | 241.3 | 229.3 | |||||||||||||||||||||
Total proved reserves (Bcfe) | 322.9 | 273.4 | 252.8 | |||||||||||||||||||||
Proved developed reserves | ||||||||||||||||||||||||
Crude oil (Mbbls) |
| 2,943 |
|
| 2,212 |
|
| 71 |
| |||||||||||||||
Natural gas (MMcf) |
| 198,733 |
|
| 183,134 |
|
| 145,930 |
| |||||||||||||||
Oil and condensate (MMbbls) | 3.3 | 2.9 | 2.2 | |||||||||||||||||||||
Natural gas (Bcf) | 231.0 | 198.7 | 183.1 | |||||||||||||||||||||
Total proved developed reserves (Bcfe) | 251.0 | 216.4 | 196.4 | |||||||||||||||||||||
Finding and development cost (a), ($/Mcfe) | ||||||||||||||||||||||||
Current year | $ | 1.34 |
| $ | 3.26 |
| $ | 0.82 |
| $ | 1.96 | $ | 1.34 | $ | 3.26 | |||||||||
Three year weighted average |
| 1.81 |
|
| 2.66 |
|
| 1.56 |
| $ | 2.10 | $ | 1.81 | $ | 2.66 | |||||||||
Reserve replacement cost (b), ($/Mcfe) | ||||||||||||||||||||||||
Current year | $ | 1.32 |
| $ | 2.22 |
| $ | 0.92 |
| $ | 1.81 | $ | 1.32 | $ | 2.22 | |||||||||
Three year weighted average |
| 1.60 |
|
| 1.70 |
|
| 1.08 |
| $ | 1.89 | $ | 1.60 | $ | 1.70 | |||||||||
Reserve replacement percentage (c), ($/Mcfe) | ||||||||||||||||||||||||
Current year |
| 206 | % |
| 660 | % |
| 556 | % | 308 | % | 206 | % | 660 | % | |||||||||
Three year weighted average |
| 432 | % |
| 544 | % |
| 332 | % | 357 | % | 432 | % | 544 | % | |||||||||
Finding and development cost, reserve replacement cost and reserve replacement percentage are not measures presented in accordance with generally accepted accounting principles (“GAAP”)GAAP and are not intended to be used in lieu of GAAP presentation. These measures are commonly used within the industry as a measurement to determine the performance of a company’s oil and gas activities.
| (a) | Finding and development cost is calculated by dividing 1) costs incurred in certain oil and gas activities (exclusive of asset retirement obligation) less proved property acquisitions, by 2) reserve extensions, discoveries and other additions and revisions. The 2001 finding and development costs used in this calculation included $62.2 million for unproved property acquisition costs (including the impact of deferred income taxes) related to the purchase of certain Gulf Coast oil and gas properties in the third quarter of 2001. No proved reserves were recorded relative to these unproved property acquisition costs, for which future exploration and development activities will be conducted. Had the unproved property acquisition costs been excluded from the 2001 finding and development cost calculations, 2001 and three year weighted average cost per Mcfe as of December 31, 2001 would have been $1.41 and $1.24, respectively. |
| (b) | Reserve replacement cost is calculated by dividing 1) costs incurred in certain oil and gas activities, including acquisitions, by 2) reserve purchases, extensions, discoveries and other additions and revisions. The 2001 reserve replacement costs used in this calculation included $62.2 million for unproved property acquisition costs described in footnote (a) |
Page 3036
| (c) | Reserve replacement percentage is calculated by dividing 1) reserve purchases, revisions, extensions, discoveries and other additions, by 2) oil and gas production. |
Proven and Probable Coal Reserves
The Partnership’s proven and probable coal reserves were 588 million tons at December 31, 2003 compared with 615 million tons at December 31, 2002 compared with 493 million tons at December 31, 2001.2002. Royalties were collected for 14.326.5 million tons mined on the Partnership’s properties in 2002.2003.
Capital Resources and Liquidity
Prior to 2001, the Companywe satisfied itsour working capital requirements and funded itsour capital expenditure and dividend payments with cash generated from operations and credit facility borrowings. In 2001, theour acquisition of Gulf Coast properties was funded with credit facility borrowings that were subsequently repaid with proceeds from PVR’s initial public offering. Although results are consolidated for financial reporting, the resultant change in ownership structure of PVR causedhas resulted in the Company and PVR to operateoperating with independent capital structures. The Company and PVR have separate credit facilities, for whichand neither entity guarantees the debt of the other. Since PVR’s public offering, with the exception of cash distributions received by the Company from PVR, the cash needs of each entity have been met independently with a combination of operating cash flows, credit facility borrowings and, in the case of PVR’s Peabody Acquisition, issuance of new partnership units. We expect that our cash needs and the cash needs of the Company and PVR will continue to be met independently of each other with a combination of these funding sources. Below are summarized cash flow statements for 2003 and 2002 consolidating the oil and gas (and corporate) and the coal royalty and land management (PVR) segments.
37
For the year ended December 31, 2003 (in thousands) | Oil and Gas & Corporate | Coal Royalty & Land Mgmt (PVR) | Consolidated | |||||||||
Cash flows from operating activities: | ||||||||||||
Net income contribution | $ | 22,455 | $ | 6,067 | $ | 28,522 | ||||||
Adjustments to reconcile net income to net cash provided by operating activities (summarized) | 55,552 | 29,673 | 85,225 | |||||||||
Net change in operating assets and liabilities | (9,380 | ) | 5,337 | (4,043 | ) | |||||||
Net cash provided by operating activities | 68,627 | 41,077 | 109,704 | |||||||||
Cash flows from investing activities: | ||||||||||||
Additions to property and equipment | (122,891 | ) | (5,291 | ) | (128,182 | ) | ||||||
Other | 800 | 580 | 1,380 | |||||||||
Net cash used in investing activities | (122,091 | ) | (4,711 | ) | (126,802 | ) | ||||||
Cash flows from financing activities: | ||||||||||||
PVA dividends paid | (8,092 | ) | — | (8,092 | ) | |||||||
PVR distributions received/(paid) | 16,828 | (36,708 | ) | (19,880 | ) | |||||||
PVA debt proceeds, net of repayments | 47,948 | — | 47,948 | |||||||||
PVR debt proceeds, net of repayments | — | 1,613 | 1,613 | |||||||||
Other | 2,001 | (1,825 | ) | 176 | ||||||||
Net cash provided by (used in) financing activities | 58,685 | (36,920 | ) | 21,765 | ||||||||
Net increase, (decrease) in cash and cash equivalents | 5,221 | (554 | ) | 4,667 | ||||||||
Cash and cash equivalents—beginning of year | 3,721 | 9,620 | 13,341 | |||||||||
Cash and cash equivalents—end of year | $ | 8,942 | $ | 9,066 | $ | 18,008 | ||||||
For the year ended December 31, 2002 (in thousands) | Oil and Gas & Corporate | Coal Royalty & Land Mgmt (PVR) | Consolidated | |||||||||
Cash flows from operating activities: | ||||||||||||
Net income (loss) contribution | $ | 4,028 | $ | 8,076 | $ | 12,104 | ||||||
Adjustments to reconcile net income to net cash provided by operating activities (summarized) | 39,533 | 16,161 | 55,694 | |||||||||
Net change in operating assets and liabilities | (8,115 | ) | 6,105 | (2,010 | ) | |||||||
Net cash provided by operating activities | 35,446 | 30,342 | 65,788 | |||||||||
Cash flows from investing activities: | ||||||||||||
Additions to property and equipment | (51,924 | ) | (92,817 | ) | (144,741 | ) | ||||||
Other | 1,420 | 43,841 | 45,261 | |||||||||
Net cash used in investing activities | (50,504 | ) | (48,976 | ) | (99,480 | ) | ||||||
Cash flows from financing activities: | ||||||||||||
PVA dividends paid | (8,040 | ) | — | (8,040 | ) | |||||||
PVR distributions received/(paid) | 14,936 | (28,723 | ) | (13,787 | ) | |||||||
PVA debt proceeds, net of repayments | 11,317 | — | 11,317 | |||||||||
PVR debt proceeds, net of repayments | — | 47,500 | 47,500 | |||||||||
Other | (720 | ) | 1,142 | 422 | ||||||||
Net cash provided by financing activities | 17,493 | 19,919 | 37,412 | |||||||||
Net increase in cash and cash equivalents | 2,435 | 1,285 | 3,720 | |||||||||
Cash and cash equivalents—beginning of year | 1,286 | 8,335 | 9,621 | |||||||||
Cash and cash equivalents—end of year | $ | 3,721 | $ | 9,620 | $ | 13,341 | ||||||
38
Except where noted, the following discussion of cash flows and contractual obligations relates to consolidated results of the Company and PVR.
Cash flows from Operating Activities
NetConsolidated net cash provided from operating activities was $109.7 million in 2003, compared with $65.8 million in 2002,2002. The oil and gas and corporate segment’s net cash provided by operations was $68.6 million in 2003 and $35.4 million in 2002. The increase was primarily due to increased prices received for, and higher production of natural gas and crude oil. Cash in excess of working capital needs for both years was used to help fund the respective year’s capital expenditures. Cash provided by operations of the coal royalty and land management segment was $41.1 million in 2003, compared with $44.2$30.3 million in 2001 and $41.7 million2002. The increase was primarily due to increased production attributable to the Peabody Acquisition in 2000. Our consolidated cash balance increased to $13.3 million in 2002 compared with $9.6 million in 2001 and $0.7 million in 2000, respectively. As a result of PVR’s public offering, approximately $9.6 million and $8.3 million of the consolidated cash balance as of December 31, 2002 and 2001, respectively, was held by PVR primarily for working capital requirements.2002.
Cash flows from Investing Activities
CashConsolidated net cash used in investing activities was $126.8 million in 2003, compared with $99.5 million in 2002. During 2003 and 2002, compared with $179.4 million in 2001 and $3.3 million in 2000. Cash waswe used during these periodscash primarily for capital expenditures for oil and gas development and exploration activities and acquisitions of oil and gas andproperties. During 2002, PVR acquired approximately 136 million tons of coal properties, offsetreserves in part by proceeds from sales of securities and non-strategic oil and gas properties.two transactions.
Page 31
Capital expenditures totaled $204.8$138.8 million in 2003, compared with $203.8 million in 2002 compared withand $241.7 million in 2001 and $61.4 million in 2000.2001. The following table sets forth capital expenditures by segment, made during the periods indicated.
Year ended December 31, | Year ended December 31, | |||||||||||||||||
2002 | 2001 | 2000 | 2003 | 2002 | 2001 | |||||||||||||
(in thousands) | (in thousands) | |||||||||||||||||
Oil and gas | ||||||||||||||||||
Development Drilling | $ | 39,014 | $ | 30,123 | $ | 18,317 | ||||||||||||
Exploration Drilling |
| 2,485 |
| 11,253 |
| 3,200 | ||||||||||||
Development drilling | $ | 59,551 | $ | 39,014 | $ | 30,123 | ||||||||||||
Exploration drilling | 11,931 | 2,485 | 11,253 | |||||||||||||||
Seismic and other |
| 5,358 |
| 2,561 |
| 1,925 | 9,470 | 5,358 | 2,561 | |||||||||
Lease Acquisitions |
| 7,346 |
| 161,631 |
| 36,916 | ||||||||||||
Field Projects |
| 2,736 |
| 1,422 |
| 244 | ||||||||||||
Lease acquisitions(a) | 44,152 | 6,336 | 161,631 | |||||||||||||||
Field projects | 7,770 | 2,736 | 1,422 | |||||||||||||||
Total |
| 56,939 |
| 206,990 |
| 60,602 | 132,874 | 55,929 | 206,990 | |||||||||
Coal royalty and land management | ||||||||||||||||||
Lease acquisitions |
| 138,450 |
| 32,992 |
| — | ||||||||||||
Coal royalty and land management (PVR) | ||||||||||||||||||
Lease acquisitions(b) | 1,361 | 138,450 | 32,992 | |||||||||||||||
Support equipment and facilities |
| 9,085 |
| 677 |
| 485 | 3,930 | 9,085 | 677 | |||||||||
Total |
| 147,535 |
| 33,669 |
| 485 | 5,291 | 147,535 | 33,669 | |||||||||
Other |
| 343 |
| 1,074 |
| 281 | 621 | 343 | 1,074 | |||||||||
Total capital expenditures | $ | 204,817 | $ | 241,733 | $ | 61,368 | $ | 138,786 | $ | 203,807 | $ | 241,733 | ||||||
| (a) | 2001 amounts include $43.1 million of deferred tax liabilities related to our acquisition of Gulf Coast oil and gas properties. |
| (b) | 2002 amounts include $50.9 million of noncash items related to equity issued in the form of PVR common units in connection with PVR’s Peabody Acquisition. |
The capital expenditures noted above include noncash items related to equity issued in the form of PVR common units in connection with PVR’s Peabody Acquisition in 2002 and deferred taxes related to the Company’s acquisition of Gulf Coast properties in 2001.
Management isWe are committed to expanding itsour oil and natural gas operations over the next several years through a combination of exploitation, exploration, development and acquisition of new properties. We have a portfolio of assets which balancebalances relatively low risk, moderate return development projects in Appalachia Mississippi and west TexasMississippi with relatively moderate risk, with potentially higher return development projects and exploration prospects in south Texas and south Louisiana.
39
Oil and gas segment capital expenditures for 2003, including our January 2003 acquisition of properties in South Texas for $32.5 million,2004 are estimated to be $110 to $120approximately $100 million. Approximately $53 to $57$49 million of the planned oil and gas capital expenditures are expected to be for development drilling projects, including horizontal coalbed methane drilling in Appalachia, developmentexploitation of the South Texas properties acquired in January 2003 and continued drilling in our Mississippi Selma Chalk assets, drilling within our core assets in southern West Virginia and westdrilling Cotton Valley wells in east Texas fields.and northern Louisiana. Exploration drilling is expected to be approximately $11 to $13$25 million of the planned expenditures, concentrated primarily in south Louisiana and south Texas. Expenditures to build our library of 3-D seismic data for drilling prospect generation is expected to be approximately $6 to $7$10 million, and lease acquisition and field project expenditures are expected to be $8 to $10approximately $15 million. Capital expenditures for 2003 in the coal royalty and land management segment are expected to be up to $3 million for the construction of fee-based infrastructure facilities. We continually review drilling and other capital expenditure plans and may change these amounts based on industry conditions and the availability of capital. We believe our cash flow from operations and sources of debt financing are sufficient to fund our 20032004 planned capital expenditureexpenditures program.
Cash flows from Financing Activities
NetConsolidated net cash provided by (used in) financing activities was $21.8 million in 2003 compared with $37.4 million in 2002, compared with $144.1 million in 2001 and ($38.4) million in 2000.2002. Credit facility borrowings provided approximately $58.8$47.9 million of cash from financing activities during 2002, offset in part by $8.02003 and $11.3 million of dividend payments and distributions to PVR’s minority unitholders of $13.8 million. In 2001, proceeds to the Company of $142.4 million from PVR’s initial public offering allowed the Company to repay borrowings made for acquisitions after $7.9cash in 2002. We also received $16.8 million of dividend payments. In 2000, operating cash flows allowed the Company to repay debtdistributions in 2003 and $14.9 million of $30.3 million and to fund dividendscash distributions in 2002 for our ownership of $7.4 million.PVR units. Funds from both of these sources were primarily used for capital expenditure needs.
Page 32
The Company has a $150$300 million secured revolving credit facility (the “Revolver”) with a syndicate of major banks led by J.P. Morgan Chase Bank One NA (as the Administrative Agent), with a final maturity of October 2004.December 2007. The credit facilityRevolver is secured by a portion of our proved oil and gas reserves. It has aan initial commitment of $150 million which can be expanded at our option to our current approved borrowing base of $140 million and the$200 million. The Company had borrowings of $16.0 million and $3.5$64.0 million against the facilityRevolver as of December 31, 2002 and 2001, respectively.2003, giving us approximately $86 million of borrowing capacity available under the Revolver as of that date. The Revolver containsis governed by a borrowing base calculation and will be redetermined semi-annually. We have the option to elect interest at (i) LIBOR plus a Eurodollar margin ranging from 1.25 to 2.00 percent, based on the percentage of the borrowing base outstanding or (ii) the greater of the prime rate or federal funds rate plus a margin ranging from 0.30 to 0.50 percent. The Revolver allows for issuance of up to $20 million of letters of credit. At December 31, 2003, letters of credit issued were $0.3 million. The financial covenants requiring the Companyrequire us to maintain certain levels of net worth, debt-to-capitalizationdebt-to-earnings and dividend limitation restrictions, among other requirements.restrictions. We are currently in compliance with all of our covenants.
We have a $5 million line of credit, with a financial institution due in March 2003,which had no borrowings against it as of December 31, 2003. The line of credit is effective through June 2004 and is renewable annually. We have thean option to elect either a fixed rate LIBOR loan, or floating rate LIBOR loan or base rate (as determined by the financial institution) loan.
In connection withAs of December 31, 2003, the closingPartnership had outstanding borrowings of its initial public offering in 2001, PVR$91.8 million, consisting of $2.5 million borrowed against a $100 million revolving credit facility and $89.3 million attributable to the Partnership’s senior unsecured notes ($90.0 million offset by $0.7 million fair value of interest rate swap).
On October 31, 2003, the Partnership entered into a three-yearan amendment to our revolving credit agreementfacility (the “PVR Revolver”) to increase the facility from $50 million to $100 million and to extend the maturity date to October 2006. The Revolver is with a syndicate of financial institutions led by PNC Bank, National Association.Association, as its agent. Based primarily on the total debt to consolidated EBITDA covenant and subsequent to the issuance of PVR senior unsecured notes, as described below, available borrowing capacity under the PVR Revolver as of December 31, 2003 was approximately $17 million. The credit agreement consists of two facilities, a revolving credit facility of $50.0 million (the “PVR Revolver”) and a term loan facility of up to $43.4 million (the “PVR Term Loan”). Both credit facilities mature in October 2004. The PVR Revolver is available for general partnership purposes, including working capital, capital expenditures and acquisitions, and includes a $5.0 million distribution sublimit that is available for working capital needs and distributions and a $5.0 million sublimit for the issuance of letters of credit. In connection with
At the closing of its initial public offering, PVR borrowed $43.4 millionPartnership’s option, indebtedness under the PVR Term Loan and purchased and pledged $43.4 million of U.S. Treasury notes, which secured the term loan facility. In 2002, the U.S. Treasury Notes were liquidated for the purpose of funding acquisitions, and as of December 31, 2002, the obligations under the PVR Term Loan facility were unsecured. Total borrowings of as of December 31, 2002 against the PVR Revolver and PVR Term Loan were $47.5 million and $43.4 million, respectively. The PVR credit agreement contains financial covenants requiring the Partnership to certain levels of net worth and of debt to EBITDA (as defined by the credit agreement). The Partnership has the option to electbears interest at i) LIBOR plus a Euro-rate margineither (i) the higher of 0.5 percent, based on certain financial data, or (ii) the greater of the prime rate or federal funds rate plus .05 percent.0.50 percent or the prime rate as announced by PNC Bank, National Association or (ii) the Eurodollar rate plus an applicable margin which ranges from 1.25 percent to 2.25 percent based on the
40
Partnership’s ratio of consolidated indebtedness to consolidated EBITDA (as defined in the PVR Revolver) for the four most recently completed fiscal quarters. The Partnership will incur a commitment fee on the unused portion of the PVR Revolver at a rate per annum ranging from 0.40 percent to 0.50 percent based upon the ratio of the Partnership’s consolidated indebtedness to consolidated EBITDA for the four most recently completed fiscal quarters. When the PVR Revolver matures in October 2006, it will terminate and all outstanding amounts thereunder will be due and payable. The Partnership may prepay the PVR Revolver at any time without penalty. The Partnership is currently attemptingrequired to refinance upreduce all working capital borrowings under the working capital sublimit under the PVR Revolver to zero for a period of at least 15 consecutive days once each calendar year.
The PVR Revolver prohibits the Partnership from making distributions to unitholders and distributions in excess of available cash if any potential default or event of default, as defined in the PVR Revolver, occurs or would result from the distribution. In addition, the PVR Revolver contains various covenants that limit, among other things, the Partnership’s ability to incur indebtedness, grant liens, make certain loans, acquisitions and investments, make any material change to the nature of the Partnership’s business, acquire another company or enter into a merger or sale of assets, including the sale or transfer of interests in our subsidiaries. At December 31, 2003, the Partnership was in compliance with the covenants in the PVR Revolver.
In March 2003, the Partnership closed a private placement of $90 million of borrowings against its credit agreementsenior unsecured notes payable (the “ PVR Notes”). The PVR Notes bear interest at a fixed rate of 5.77 percent and mature over a ten year period ending in March 2013, with more permanent debt. This refinancing is expectedsemi-annual interest payments through March 2004 followed by semi-annual principal and interest payments beginning in September 2004. Proceeds of the Notes after the payment of expenses related to be completed by March 31, 2003, with proceedsthe offering were used to repay and retire the $43.4 million PVR Term Loan and to repay mostthe majority of the borrowingsdebt outstanding on the PVR Revolver. If
In conjunction with the refinancingPVR Notes, the Partnership entered into an interest rate swap agreement with a notional amount of $30 million, to hedge a portion of the fair value of the PVR Notes. This swap is not completeddesignated as a fair value hedge and has been reflected as a decrease in long-term debt of $0.7 million as of December 31, 2003. Under the terms of the interest rate swap agreement, the counterparty pays the Partnership a fixed annual rate of 5.77 percent on a total notional amount of $30 million, and the Partnership pays the counterparty a variable rate equal to the floating interest rate which will be determined semi-annually and will be based on the six month London Interbank Offering Rate plus 2.36 percent.
Future Capital Needs and Commitments. In 2004, we anticipate making total capital expenditures, excluding acquisitions, of approximately $100 million. Nearly all of these expenditures are expected to be made in our oil and gas segment, and are expected to be funded primarily by Marchoperating cash flow. Additional funding will be provided as needed from our Revolver, under which we had $86 million of borrowing capacity as of December 31, 2003.
In our coal royalty and land management segment, PVR anticipates making total capital expenditures, excluding acquisitions, of approximately $0.2 million for coal services related projects. Part of PVR’s strategy is to make acquisitions which increase cash available for distribution to its unitholders. PVR’s ability to make these acquisitions in the future will depend in part on the availability of debt financing and on its ability to periodically use equity financing through the issuance of new units. Since completing the Peabody Acquisition in late 2002, PVR’s ability to incur additional debt has been restricted due to limitations in its debt instruments. As of December 31, 2003, PVR will be requiredhad approximately $17 million of borrowing capacity available under the PVR Revolver. This limitation may have the effect of necessitating the issuance of new units by PVR, as opposed to provide securityusing debt, to fund acquisitions in the syndicate of financial institutions in its credit agreement for all borrowings against its credit agreement.future.
Management believes its sources of funding are sufficient to meet short and long-term liquidity needs not funded by cash flows from operations.
Page 3341
Contractual Obligations
Our contractual cash obligations as of December 31, 2002, are2003 were as follows:
Total | Payments Due by Period | Thereafter | |||||||||||||
Less Than 1 Year | 1-3 Years | 4-5 Years | |||||||||||||
(in thousands) | |||||||||||||||
Penn Virginia revolver | $ | 16,000 | $ | — | $ | 16,000 | $ | — | $ | — | |||||
PVR revolver |
| 47,500 |
| — |
| 47,500 |
| — |
| — | |||||
PVR term loan |
| 43,387 |
| — |
| 43,387 |
| — |
| — | |||||
Line of credit |
| 52 |
| 52 |
| — |
| — |
| — | |||||
Rental commitments (1) |
| 8,081 |
| 2,855 |
| 3,237 |
| 1,989 |
| — | |||||
Total contractual cash obligations | $ | 115,020 | $ | 2,907 | $ | 110,124 | $ | 1,989 | $ | — | |||||
| Payments Due by Period | |||||||||||||||
| Total | Less Than 1 Year | 1-3 Years | 4-5 Years | Thereafter | |||||||||||
| (in thousands) | |||||||||||||||
Penn Virginia Corporation Revolver | $ | 64,000 | $ | — | $ | — | $ | 64,000 | $ | — | |||||
PVR Revolver | 2,500 | — | 2,500 | — | — | ||||||||||
PVR Notes | 90,000 | 1,500 | 13,100 | 23,700 | 51,700 | ||||||||||
Rental commitments(1) | 5,888 | 1,861 | 2,347 | 1,280 | 400 | ||||||||||
Total contractual cash obligations | $ | 162,388 | $ | 3,361 | $ | 17,947 | $ | 88,980 | $ | 52,100 | |||||
| (1) | Rental commitments primarily relate to equipment |
Environmental Matters
Our businesses are subject to various environmental hazards. Several federal, state and local laws, regulations and rules govern the environmental aspects of our businesses. Noncompliance with these laws, regulations and rules can result in substantial penalties or other liabilities. We do not believe our environmental risks are materially different from those of comparable companies nor that cost of compliance will have a material adverse effect on our profitability, capital expenditures, cash flows or competitive position.
However, there is no assurance that future changes in or additions to laws, regulations or rules regarding the protection of the environment will not have such an impact. We believe we are materially in compliance with environmental laws, regulations and rules.
In conjunction with the Partnership’s leasing of property to coal operators, environmental and reclamation liabilities are generally the responsibilities of the Partnership’s lessees. Lessees post performance bonds pursuant to federal and state mining laws and regulations for the estimated costs of reclamation and mine closing, including the cost of treating mine water discharge when necessary.
Recent Accounting Pronouncements
In June 2001, the Financial Accounting Standards Board (“FASB”) issued SFAS No. 143,Accounting “Accounting for Asset Retirement Obligations, whichObligations”. This statement addresses financial accounting and reporting for obligations associated with the retirement of tangible long-lived assets and the associated asset retirement costs. The Standard applies to legal obligations associated with the retirement of long-lived assets that result from the acquisition, construction, development or normal use of the asset.
SFAS No. 143This statement requires that the fair value of a liability for an asset retirement obligation be recognized in the period in which it is incurred if a reasonable estimate of fair value can be made.incurred. The fair valueassociated asset retirement costs are capitalized as part of the liability is also added to the carrying amount of the associated asset and this additional carrying amount is depreciated over the lifecost of the asset. The liability is accreted at the end of each period through charges to operating expense. If the obligation is settled for other than the carrying amount of the liability, we will recognize a gain or loss on settlement.
We will adopt the provisions ofadopted SFAS No. 143 effectiveon January 1, 2003. We identified all required2003 and recognized, and recorded an asset retirement obligationsof $1.3 million, a related liability of $2.7 million and determined the fair value of these obligationsa cumulative effect on the date of adoption. The determination of fair value was based upon regional market and specific well or mine type information. In conjunction with the initial application of SFAS No. 143, it is expected we will record a cumulative-effect of change in accounting principle neton prior years of $1.4 million (net of taxes of approximately $0.5$0.7 million). During 2003, the company recognized a net $0.7 million of additions to $1.5the liability and a net $0.6 million of additions to the asset cost basis as an increase toa result of adopting SFAS No. 143.
Page 34
income, which will be reflected in the Company’s results of operations for 2003. In addition, it is expected we will record an asset retirement obligation of approximately $2.3 to $3.3 million.
In April 2002, the FASB issued SFAS No. 145,Rescission of FASB Statements No. 4, 44, and 64, Amendment of FASB Statement No. 13, and Technical Corrections.This Statement rescinds SFAS No. 4,Reporting Gains and Losses from Extinguishment of Debt,which required all gains and losses from extinguishment of debt to be aggregated and, if material, classified as an extraordinary item of debt to be aggregated and, if material, classified as an extraordinary item, net of income taxes. As a result, the criteria in Accounting Principles Board Opinion (APB) Opinion No. 30 will now be used to classify those gains and losses. Any gain or loss on the extinguishment of debt that was classified as an extraordinary item in prior periods presented that does not meet the criteria in APB Opinion No. 30 for classification as an extraordinary item shall be reclassified. The provisions of this Statement are effective for fiscal years beginning after January 1, 2003. The initial adoption of SFAS No. 145 did not have a material effect on the financial position, results of operations or liquidity of the Company.
In June 2002, the FASB issued SFAS No. 146,Accounting for Costs Associated with Exit or Disposal Activities. This statement requires the recognition of costs associated with exit or disposal activities when they are incurred rather than at the date of a commitment to an exit or disposal plan. The provisions of this statement are effective for exit or disposal activities initiated after December 31, 2002.
In November 2002, the FASB issued Interpretation No. 45 ( FIN 45),Guarantor’s “Guarantor’s Accounting and Disclosure Requirements forGuarantees, Including Indirect Guarantees of the Indebtedness of Others,Others”, which clarifies the requirements of SFAS No. 5,“Accounting for Contingencies,Contingencies”, relating to a guarantor’s accounting for and disclosuresdisclosure of certain guarantees issued. FIN 45 requires enhanced disclosures for certain guarantees. It also will require certain guarantees that are issued or modified after December 31, 2002, including certain third-party
42
guarantees, to be initially recorded on the balance sheet at fair value. For guarantees issued on or before December 31, 2002, liabilities are recorded when and if payments become probable and estimable. The financial statement recognition provisions are effective prospectively, andprospectively. The Company has no outstanding guarantees that meet the Company cannot reasonably estimate the impactrecognition requirements of adopting FIN 45 until guaranteesas of December 31, 2003.
In December 2003, the FASB issued FASB Interpretation No. 46 (revised December 2003) (“FIN 46R), “Consolidation of Variable Interest Entities” replacing FASB Interpretation No. 46 (“FIN 46”), “Consolidation of Variable Interest Entities, an interpretation of ARB No. 51” issued in January 2003. FIN 46R was issued to replace FIN 46 and to provide clarification of key terms, additional exemptions for application and an extended initial application period. FIN 46R requires certain variable interest entities to be consolidated by the primary beneficiary of the entity if the equity investors in the entity do not have the characteristics of a controlling financial interest or do not have sufficient equity at risk for the entity to finance its activities without additional subordinated financial support from other parties. FIN 46 was effective for all variable interest entities created or acquired after January 31, 2003. For variable interest entities created or acquired prior to February 1, 2003, the provisions of FIN 46 was required to be applied for the first interim or annual period beginning after June 15, 2003. We are required to adopt FIN 46R no later than the end of the first reporting period ending after March 15, 2003, which is March 31, 2003. We do not expect the initial adoption of FIN 46R to have a material effect on our financial position, results of operations or cash flow.
A reporting issue has arisen regarding the application of certain provisions of SFAS No. 141, “Business Combinations” and SFAS No. 142, “Goodwill and Other Intangible Assets” to companies in the extractive industries, including oil and gas and coal industry companies. The issue is whether SFAS No. 142 requires registrants to classify the costs of mineral rights as intangible assets in the balance sheet, apart from other capitalized oil and gas property and coal property costs, and provide specific footnote disclosures. The Emerging Issues Task Force has added the treatment of oil and gas and coal mineral rights to an upcoming agenda, which may result in a change in how we are currently classifying these assets.
Oil and Gas Mineral Rights.Historically, we have included the costs of mineral rights associated with extracting oil and gas as a component of oil and gas properties under SFAS No. 19 “Financial Accounting and Reporting by Oil and Gas Producing Companies”. If it is ultimately determined that SFAS No. 142 requires oil and gas companies to classify costs of mineral rights associated with extracting oil and gas as a separate intangible assets line item on the balance sheet, we would be required to reclassify approximately $157 million and $136 million as of December 31, 2003 and December 31, 2002, respectively, out of oil and gas properties and into a separate line item for intangible assets. Our cash flows and results of operations would not be affected since such intangible assets would continue to be depleted and assessed for impairment in accordance with successful efforts accounting rules. Further, we do not believe the classification of the costs of mineral rights associated with extracting oil and gas as intangible assets would have any impact on our compliance with covenants under our debt agreements.
Coal Mineral Rights.Historically, we have included both owned and leased mineral interests of PVR as a component of property and equipment on the balance sheet. However, based on the application of certain provisions of SFAS No. 141 and SFAS No. 142 to the coal industry, we have begun to classify costs associated with PVR’s leasing of coal reserves after June 30, 2001 as an intangible asset on the balance sheet, apart from other capitalized property costs. As of December 31, 2003, coal mineral rights of $4.9 million are included in other assets on the accompanying balance sheet. The transition provisions of SFAS No. 141 and SFAS No. 142 only require the reclassification of rights which were acquired after June 30, 2001 unless previously maintained records make it possible to reclassify rights acquired prior to that date. Prior to June 30, 2001, the Partnership did not separately allocate acquisition costs between owned coal mineral interests (tangible property) and leased coal mineral rights (intangible property), as such interests were part of the same coal seams. Accordingly, we have only classified coal mineral rights acquired after June 30, 2001 as an intangible asset and report them in Other assets in the accompanying consolidated balance sheet.
43
In May 2003, the FASB issued SFAS No. 150 “Accounting for Certain Financial Instruments with Characteristics of both Liabilities and Equity.” SFAS No. 150 establishes standards on how companies classify and measure certain financial instruments with characteristics of both liabilities and equity. The statement requires that we classify as liabilities the fair value of all mandatorily redeemable financial instruments that had previously been recorded as equity or elsewhere in the consolidated financial statements. This statement is effective for financial instruments entered into or modified after May 31, 2003, and otherwise effective for all existing financial instruments beginning in futurethe third quarter of 2003. The initial adoption of this Statement did not have a material effect on the financial position, results of operations or liquidity of the Company. The Company has no outstanding guarantees as of December 31, 2003.
In December 2003, the FASB issued SFAS No. 132 (revised 2003), “Employers’ Disclosures about Pensions and Other Postretirement Benefits” to enhance the disclosures about pension plans and other postretirement benefit plans. The Statement retains the disclosures required by the original SFAS No. 132. Additional disclosures have been added to those disclosures including information describing the types of plan assets, investment strategy, measurement date(s), plan obligations, cash flows, and components of net periodic benefit costs recognized during interim periods. The provisions of this Statement are effective for financial statements with fiscal years ending after December 15, 2003. The interim-period disclosures required by this Statement are effective for interim periods at which time their results will be initially reportedbeginning after December 15, 2003. We have included the required additional disclosures of the revised Statement in the financial statements. See Note 15. Pension Plans and Other Post-retirement Benefits.
On December 8, 2003, a new law was enacted which expands Medicare, primarily adding a prescription drug benefit for Medicare-eligible retirees starting in 2006. We anticipate that the benefits we pay after 2006 could be lower as a result of the new Medicare provisions; however, at this time the retiree medical obligations and costs reported do not reflect any changes as a result of this legislation. Deferring the recognition of the new Medicare provisions’ impact is permitted by FASB Staff Position 106-1, “Accounting and Disclosure Requirements Related to the Medicare Prescription Drug, Improvement and Modernization Act of 2003”, due to open questions about some of the new Medicare provisions and a lack of authoritative accounting guidance about certain matters. The final accounting guidance could require changes to previously reported information. We do not believe that this regulation will have a material adverse effect on our financial position, results of operations or cash flows.
Quantitative and Qualitative Disclosures about Market Risk
Interest Rate Risk. The carrying value of our debt approximates fair value. At December 31, 2002, we had $16.0 million of long-term debt represented by a secured revolving credit facility (the “PVA Revolver”). The PVA Revolver matures in October 2004 and is governed by a borrowing base calculation that is redetermined semi-annually. We have the option to elect interest at (i) LIBOR plus a Eurodollar margin ranging from 1.375 to 1.875 percent, based on the percentage of the borrowing base outstanding or (ii) the greater of the prime rate or federal funds rate plus a margin ranging from 0.375 to 0.875 percent. As a result, our 2003 interest costs will fluctuate based on short-term interest rates relating to the PVA Revolver.
Additionally, PVR had outstanding borrowings of $90.9 million, consisting of $47.5 million borrowed against its $50 million revolving credit facility (the “PVR Revolver”) and $43.4 million of a fully-drawn term loan (the “PVR Term Loan”). Both the PVR Revolver and PVR Term Loan mature in October 2004. Regarding the unsecured PVR Revolver, PVR has the option to elect interest at (i) LIBOR plus a Euro-rate margin ranging from 1.25 to 1.75 percent, based upon certain financial data, or (ii) the greater of the prime rate or federal funds rate plus 0.5 percent. Regarding the PVR Term Loan, PVR has the option to elect interest at (i) LIBOR plus a Euro-rate margin of 0.5 percent, based upon certain financial data or (ii) the greater of the prime rate or federal funds rate plus 0.5 percent. As a result of both instruments, PVR’s interest costs will fluctuate based on short-term interest rates.
Page 35
Price Risk Management.Our price risk management program permits the utilization of derivative financial instruments (such as futures, forwards, option contracts and swaps) to mitigate the price risks associated with fluctuations in natural gas and crude oil prices as they relate to our anticipated production. These contracts and/or financial instruments are designated as cash flow hedges and accounted for in accordance with Statement of Financial Accounting Standards (“SFAS”) No. 133, as amended by SFAS No. 137 and SFAS No. 138. See Note 9 (Price Risk Management Activities) of the Notes to the Consolidated Financial Statements, for more information. The derivative financial instruments are placed with major financial institutions that we believe are of minimum credit risk. The fair value of our price risk management assets are significantly affected by energy price fluctuations. As of February 14, 2003, our open commodity price risk management positions on average daily volumes were as follows:
Natural gas hedging positions | Costless Collars | Swaps | |||||||||||
MMBtu Per Day | Price / MMBtu (a) | MMBtu Per Day | Price /MMBtu | ||||||||||
Floor | Ceiling | ||||||||||||
First Quarter 2003 | 15,000 | $ | 3.15 | $ | 5.05 | 3,164 | $ | 4.70 | |||||
Second Quarter 2003 | 21,500 | $ | 3.39 | $ | 5.36 | 3,399 | $ | 4.70 | |||||
Third Quarter 2003 | 21,500 | $ | 3.39 | $ | 5.36 | 2,570 | $ | 4.70 | |||||
Fourth Quarter 2003 | 19,500 | $ | 3.49 | $ | 5.46 | 2,034 | $ | 4.70 | |||||
First Quarter 2004 | 19,500 | $ | 3.54 | $ | 5.51 | 1,800 | $ | 4.70 | |||||
Second Quarter 2004 | 14,137 | $ | 3.56 | $ | 5.70 | 1,533 | $ | 4.70 | |||||
Third Quarter 2004 | 1,348 | $ | 3.72 | $ | 6.97 | 1,367 | $ | 4.70 | |||||
Fourth Quarter 2004 | — | $ | — | $ | — | 1,234 | $ | 4.70 | |||||
First Quarter 2005 (January) | — | $ | — | $ | — | 1,100 | $ | 4.70 | |||||
Crude oil hedging positions | Costless Collars | Swaps | |||||||||||
Barrels Per Day | Price / Barrel | Barrels Per Day | Price /Barrel | ||||||||||
Floor | Ceiling | ||||||||||||
First Quarter 2003 | 500 | $ | 23.00 | $ | 28.75 | 150 | $ | 26.93 | |||||
Second Quarter 2003 | 500 | $ | 23.00 | $ | 28.75 | 170 | $ | 26.93 | |||||
Third Quarter 2003 | — | $ | — | $ | — | 250 | $ | 26.76 | |||||
Fourth Quarter 2003 | — | $ | — | $ | — | 220 | $ | 26.74 | |||||
First Quarter 2004 | — | $ | — | $ | — | 207 | $ | 26.73 | |||||
Second Quarter 2004 | — | $ | — | $ | — | 193 | $ | 26.71 | |||||
Third Quarter 2004 | — | $ | — | $ | — | 63 | $ | 26.93 | |||||
Fourth Quarter 2004 | — | $ | — | $ | — | 57 | $ | 26.93 | |||||
First Quarter 2005 (January) | — | $ | — | $ | — | 50 | $ | 26.93 | |||||
Page 36
Forward-Looking Statements
Statements included in this report which are not historical facts (including any statements concerning plans and objectives of management for future operations or economic performance, or assumptions related thereto) are forward-looking statements within the meaning of Section 21E of the Securities Exchange Act of 1934, as amended, and Section 27A of the Securities Act of 1933, as amended.forward-looking. In addition, we and our representatives may from time to time make other oral or written statements that are also forward-looking statements.
Such forward-looking statements may include, among other things, statements regarding development activities, capital expenditures, acquisitions and dispositions, drilling and exploration programs, expected commencement dates and projected quantities of oil, gas, or coal production, as well as projected demand or supply for coal, andcrude oil and natural gas, all of which may affect sales levels, prices and royalties realized by Penn Virginiaus and PVR.
These forward-looking statements are made based upon management’s current plans, expectations, estimates, assumptions and beliefs concerning future events impacting Penn Virginiaus and PVR and, therefore, involve a number of risks and uncertainties. Penn Virginia cautionsWe caution that forward-looking statements are not guarantees and that actual results could differ materially from those expressed or implied in the forward-looking statements.
44
Important factors that could cause the actual results of our operations or financial condition of Penn Virginia to differ materially from those expressed or implied in the forward-looking statements include, but are not necessarily limited to:
45
Many of such factors are beyond Penn Virginia’sour ability to control or accurately predict. Readers are cautioned not to put undue reliance on forward-looking statements.
While Penn Virginiawe periodically reassessesreassess material trends and uncertainties affecting Penn Virginia’sour results of operations and financial condition in connection with the preparation of Management’s Discussion and Analysis of Results of Operations and Financial Condition and certain other sections contained in Penn Virginia’sour quarterly, annual orand other reports filed with the Securities and Exchange Commission, Penn Virginia doesSEC, we do not undertake any obligation to review or update any particular forward-looking statement, whether as a result of new information, future events or otherwise.
Page 37Item 7A—Quantitative and Qualitative Disclosures About Market Risk
Interest Rate Risk. At December 31, 2003, we had $64.0 million of long-term debt borrowed against our Revolver. The Revolver matures in December 2007 and is governed by a borrowing base calculation that is re-determined semi-annually. We have the option to elect interest at (i) LIBOR plus a Eurodollar margin ranging from 1.25 to 2.00 percent, based on the percentage of the borrowing base outstanding or (ii) the greater of the prime rate or federal funds rate plus a margin ranging from 0.30 to 0.50 percent. As a result, our 2004 interest costs will fluctuate based on short-term interest rates relating to the PVA Revolver.
Additionally, PVR refinanced $90.0 million of credit facility borrowings with ten year, senior unsecured notes payable which have a 5.77 percent fixed interest rate throughout their term. However, PVR executed an interest rate swap transaction for $30.0 million to hedge a portion of the fair value of its senior unsecured notes. The interest rate swap is accounted for as a fair value hedge. PVR executed the transaction in a method that achieved hedge accounting in compliance with SFAS No. 133, “Accounting for Derivative Instruments and Hedging Activities”, as amended by SFAS No. 137 and SFAS No. 138. The debt PVR incurs in the future under its credit facility will bear variable interest at either the applicable base rate or a rate based on LIBOR.
Price Risk Management.Our price risk management program permits the utilization of derivative financial instruments (such as futures, forwards, option contracts and swaps) to mitigate the price risks associated with fluctuations in natural gas and crude oil prices as they relate to our anticipated production. These contracts and/or financial instruments are designated as cash flow hedges and accounted for in accordance with SFAS No. 133, as amended by SFAS No. 137, SFAS No. 138 and SFAS No. 139. See Note 9. Hedging Activities of the Notes to the Consolidated Financial Statements for more information. The derivative financial instruments are placed with major financial institutions that we believe are of minimum credit risk. The fair value of our price risk management assets are significantly affected by energy price fluctuations. As of February 16, 2004, our open commodity price risk management positions on average daily volumes were as follows:
Natural gas hedging positions
| Costless Collars | Swaps | ||||||||||||
Average Per Day | Average Price / MMbtu(a) | Average Per Day | Average /MMbtu | ||||||||||
| Floor | Ceiling | ||||||||||||
First Quarter 2004 | 22,500 | $ | 3.67 | $ | 5.70 | 1,800 | $ | 4.70 | |||||
Second Quarter 2004 | 21,495 | $ | 3.78 | $ | 6.11 | 1,533 | $ | 4.70 | |||||
Third Quarter 2004 | 20,500 | $ | 4.05 | $ | 6.12 | 1,367 | $ | 4.70 | |||||
Fourth Quarter 2004 | 19,837 | $ | 4.13 | $ | 6.54 | 1,234 | $ | 4.70 | |||||
First Quarter 2005 | 13,656 | $ | 4.00 | $ | 6.52 | 379 | $ | 4.70 | |||||
Second Quarter 2005 (April only) | 14,000 | $ | 4.00 | $ | 6.40 | — | $ | — | |||||
| (a) | The costless collar natural gas prices per MMbtu per quarter include the effects of basis differentials, if any, that may be hedged. |
46
Crude oil hedging positions
| Swaps | |||||
Average Per Day | Average /Barrel | ||||
First Quarter 2004 | 404 | $ | 28.62 | ||
Second Quarter 2004 | 493 | $ | 29.07 | ||
Third Quarter 2004 | 413 | $ | 30.03 | ||
Fourth Quarter 2004 | 407 | $ | 30.08 | ||
First Quarter 2005 (January only) | 400 | $ | 30.13 | ||
47
SIGNATURES
Pursuant to the requirements of Section 13 or 15(d) of the Securities Exchange Act of 1934, the Registrant has duly caused this report to be signed on its behalf by the undersigned, thereunto duly authorized.
| ||||||||
March | By: | /s/ | ||||||
(Frank A. Pici, Executive Vice President and Chief Financial Officer) | ||||||||
|
| |||||||
| March 9, 2004 | By: | /s/ | ||||||
(Dana Vice President and
| ||||||||
Pursuant to the requirements of Section 13 or 15(d) of the Securities Exchange Act of 1934, the Registrant has duly caused this report to be signed on its behalf by the undersigned, thereunto duly authorized.
/s/ (Robert Garrett) | Chairman of the Board and Director | March | ||
/s/ (Edward B. Cloues, II) | Director | March | ||
/s/ A. (A. James Dearlove) | Director and Chief Executive Officer | March | ||
/s/ H. (H. Jarrell Gibbs) | Director | March | ||
/s/ (Keith D. Horton) | Director and Executive Vice President | March | ||
/s/ (Marsha R. Perelman) | Director | March | ||
/s/ (Joe T. Rye) | Director | March | ||
/s/ (Gary K. Wright) | Director | March | ||
Page 38
48
CERTIFICATIONS
I, A. James Dearlove, PresidentItem 8—Financial Statements and Chief Executive Officer of Penn Virginia Corporation (the “Registrant”), certify that:
|
|
|
|
Page 39
I, Frank A. Pici, Executive Vice President and Chief Financial Officer of Penn Virginia Corporation (the “Registrant”), certify that:
|
|
|
|
Page 40
ITEM 8 –FINANCIAL STATEMENTS AND SUPPLEMENTARY DATASupplementary Data
Penn Virginia Corporation and SubsidiariesPENN VIRGINIA CORPORATION AND SUBSIDIARIES
Index to Financial SectionINDEX TO FINANCIAL SECTION
| ||
| 50 | ||
| ||
| 51 | ||
|
Page 4149
Management’s Report on Financial InformationMANAGEMENT’S REPORT ON FINANCIAL INFORMATION
Management of Penn Virginia Corporation (the “Company”) is responsible for the preparation and integrity of the financial information included in this annual report. The financial statements have been prepared in accordance with accounting principles generally accepted in the United States of America, which involve the use of estimates and judgments where appropriate.
The Company has a system of internal accounting controls designed to provide reasonable assurance that assets are safeguarded against loss or unauthorized use and to produce the records necessary for the preparation of financial information. The system of internal control is supported by the selection and training of qualified personnel, the delegation of management authority and responsibility, and dissemination of policies and procedures. There are limits inherent in all systems of internal control based on the recognition that the costs of such systems should be related tocommensurate with the benefits to be derived. We believe the Company’s systems provide this appropriate balance.
The Company’s independent public accountants, KPMG LLP, have developed an understanding of our accounting and financial controls and have conducted such tests as they consider necessary to support their opinion on the 20022003 financial statements. Their report contains an independent, informed judgment as to the corporation’s reported results of operations and financial position for 2002.2003.
The Board of Directors pursues its oversight role for the financial statements through the Audit Committee, which consists solely of outside directors. The Audit Committee meets regularly with management, the internal auditor and KPMG LLP, jointly and separately, to review management’s process of implementation and maintenance of internal controls, and auditing and financial reporting matters. The independent and internal auditors have unrestricted access to the Audit Committee.
A. James Dearlove | Frank A. Pici | |
President and Chief Executive Officer |
Executive Vice President and Chief Financial Officer |
Page 4250
To the Shareholders of Penn Virginia Corporation:
We have audited the accompanying consolidated balance sheetsheets of Penn Virginia Corporation (a Virginia corporation) and subsidiaries as of December 31, 2003 and 2002, and the related consolidated statements of income, shareholders’ equity and comprehensive income and cash flows for the yearyears then ended. These consolidated financial statements are the responsibility of the Company’s management. Our responsibility is to express an opinion on these consolidated financial statements based on our audit.audits. The 2001 and 2000 consolidated financial statements of Penn Virginia Corporation and subsidiaries were audited by other auditors who have ceased operations. Those auditors expressed an unqualified opinion on those financial statements in their report dated February 18, 2002.
We conducted our auditaudits in accordance with auditing standards generally accepted in the United States of America. Those standards require that we plan and perform the audit to obtain reasonable assurance about whether the financial statements are free of material misstatement. An audit includes examining, on a test basis, evidence supporting the amounts and disclosures in the financial statements. An audit also includes assessing the accounting principles used and significant estimates made by management, as well as evaluating the overall financial statement presentation. We believe that our audit providesaudits provide a reasonable basis for our opinion.
In our opinion, the consolidated financial statements referred to above present fairly, in all material respects, the financial position of Penn Virginia Corporation and subsidiaries as of December 31, 2003 and 2002, and the results of their operations and their cash flows for the yearyears then ended in conformity with accounting principles generally accepted in the United States of America.
As discussed in Note 11 to the consolidated financial statements, effective January 1, 2003, the Company changed its method of accounting for asset retirement obligations.
KPMG LLP
Houston, Texas
February 14, 200316, 2004
Page 4351
THIS REPORT IS A COPY OF A REPORT PREVIOUSLY ISSUED BY ARTHUR ANDERSEN LLP. THE REPORT HAS NOT BEEN REISSUED BY ARTHERARTHUR ANDERSEN LLP, NOR HAS ARTHUR ANDERSEN LLP PROVIDED A CONSENT TO THE INCLUSION OF ITS REPORT IN THIS FORM 10-K.
REPORT OF INDEPENDENT PUBLIC ACCOUNTANTS
To the Shareholders of Penn Virginia Corporation:
We have audited the accompanying consolidated balance sheets of Penn Virginia Corporation (a Virginia corporation) and subsidiaries as of December 31, 2001 and 2000, and the related consolidated statements of income, shareholders’ equity and cash flows for each of the three years in the period ended December 31, 2001. These financial statements are the responsibility of the Company’s management. Our responsibility is to express an opinion on these financial statements based on our audits.
We conducted our audits in accordance with auditing standards generally accepted in the United States. Those standards require that we plan and perform the audit to obtain reasonable assurance about whether the financial statements are free of material misstatement. An audit includes examining, on a test basis, evidence supporting the amounts and disclosures in the financial statements. An audit also includes assessing the accounting principles used and significant estimates made by management, as well as evaluating the overall financial statement presentation. We believe that our audits provide a reasonable basis for our opinion.
In our opinion, the financial statements referred to above present fairly, in all material respects, the financial position of Penn Virginia Corporation and subsidiaries as of December 31, 2001 and 2000, and the results of their operations and their cash flows for each of the three years in the period ended December 31, 2001, in conformity with accounting principles generally accepted in the United States.
Arthur AndersenARTHUR ANDERSEN LLP
Houston, Texas
February 18, 2002
Page 4452
PENN VIRGINIA CORPORATION AND SUBSIDIARIES
CONSOLIDATED STATEMENTS OF INCOME
(in thousands, except share data)
Year Ended December 31, | ||||||||||||
2002 | 2001 | 2000 | ||||||||||
Revenues | ||||||||||||
Oil and condensate | $ | 8,246 |
| $ | 3,762 |
| $ | 832 |
| |||
Natural gas |
| 62,552 |
|
| 53,263 |
|
| 46,019 |
| |||
Coal royalties |
| 31,358 |
|
| 32,365 |
|
| 24,308 |
| |||
Timber |
| 1,640 |
|
| 1,732 |
|
| 2,388 |
| |||
Dividends |
| — |
|
| 198 |
|
| 2,646 |
| |||
Gain (loss) on the sale of properties |
| (5 | ) |
| 492 |
|
| 24,795 |
| |||
Other |
| 7,166 |
|
| 4,759 |
|
| 5,010 |
| |||
| 110,957 |
|
| 96,571 |
|
| 105,998 |
| ||||
Expenses | ||||||||||||
Lease operating |
| 12,754 |
|
| 9,284 |
|
| 7,629 |
| |||
Exploration |
| 7,733 |
|
| 11,832 |
|
| 5,660 |
| |||
Taxes other than income |
| 6,804 |
|
| 5,433 |
|
| 3,648 |
| |||
General and administrative |
| 21,440 |
|
| 15,297 |
|
| 11,350 |
| |||
Impairment of oil and gas properties |
| 796 |
|
| 33,583 |
|
| — |
| |||
Depreciation, depletion and amortization |
| 30,639 |
|
| 19,579 |
|
| 12,027 |
| |||
| 80,166 |
|
| 95,008 |
|
| 40,314 |
| ||||
Operating Income |
| 30,791 |
|
| 1,563 |
|
| 65,684 |
| |||
Other income (expense) | ||||||||||||
Interest expense |
| (2,116 | ) |
| (2,453 | ) |
| (7,926 | ) | |||
Interest income |
| 2,038 |
|
| 1,602 |
|
| 1,458 |
| |||
Gain on the sale of securities |
| — |
|
| 54,688 |
|
| — |
| |||
Other |
| 1 |
|
| 14 |
|
| 14 |
| |||
Income from continuing operations before minority interest and income taxes and discontinued operations |
| 30,714 |
|
| 55,414 |
|
| 59,230 |
| |||
Minority interest |
| 11,896 |
|
| 1,763 |
|
| — |
| |||
Income tax expense |
| 6,935 |
|
| 19,314 |
|
| 19,965 |
| |||
Income from continuing operations |
| 11,883 |
|
| 34,337 |
|
| 39,265 |
| |||
Income from discontinued operations (including gain on sale and net of taxes) |
| 221 |
|
| — |
|
| — |
| |||
Net Income | $ | 12,104 |
| $ | 34,337 |
| $ | 39,265 |
| |||
Income from continuing operations per share, basic | $ | 1.33 |
| $ | 3.92 |
| $ | 4.76 |
| |||
Income from discontinued operations per share, basic |
| 0.02 |
|
| — |
|
| — |
| |||
Net income per share, basic | $ | 1.35 |
| $ | 3.92 |
| $ | 4.76 |
| |||
Income from continuing operation per share, diluted | $ | 1.32 |
| $ | 3.86 |
| $ | 4.69 |
| |||
Income from discontinued operations per share, diluted |
| 0.02 |
|
| — |
|
| — |
| |||
Net income per share, diluted | $ | 1.34 |
| $ | 3.86 |
| $ | 4.69 |
| |||
Weighted average shares outstanding, basic |
| 8,930 |
|
| 8,770 |
|
| 8,241 |
| |||
Weighted average shares outstanding, diluted |
| 8,974 |
|
| 8,896 |
|
| 8,371 |
| |||
The accompanying notes are an integral part of these consolidated financial statements.
PENN VIRGINIA CORPORATION AND SUBSIDIARIES
CONSOLIDATED BALANCE SHEETS
(in thousands, except share data)
December 31, | |||||||
2002 | 2001 | ||||||
Assets | |||||||
Current assets | |||||||
Cash and cash equivalents | $ | 13,341 |
| $ | 9,621 | ||
Accounts receivable |
| 20,366 |
|
| 12,334 | ||
Current portion of long-term notes receivable |
| 527 |
|
| 599 | ||
Price risk management assets |
| — |
|
| 3,674 | ||
Other |
| 1,503 |
|
| 1,105 | ||
Total current assets |
| 35,737 |
|
| 27,333 | ||
Property and equipment | |||||||
Oil and gas properties (successful efforts method) |
| 383,360 |
|
| 335,494 | ||
Other property and equipment |
| 265,180 |
|
| 117,789 | ||
| 648,540 |
|
| 453,283 | |||
Less: Accumulated depreciation, depletion and amortization |
| 102,588 |
|
| 72,095 | ||
Net property and equipment |
| 545,952 |
|
| 381,188 | ||
Restricted U.S. Treasury Notes |
| — |
|
| 43,387 | ||
Other assets |
| 4,603 |
|
| 5,194 | ||
Total assets | $ | 586,292 |
| $ | 457,102 | ||
Liabilities and Shareholders’ Equity | |||||||
Current liabilities | |||||||
Current maturities of long-term debt | $ | 52 |
| $ | 1,235 | ||
Accounts payable |
| 5,670 |
|
| 3,987 | ||
Accrued liabilities |
| 16,508 |
|
| 10,762 | ||
Price risk management liabilities |
| 1,621 |
|
| — | ||
Total current liabilities |
| 23,851 |
|
| 15,984 | ||
Other liabilities |
| 12,674 |
|
| 8,877 | ||
Deferred income taxes |
| 62,154 |
|
| 55,861 | ||
Long-term debt |
| 106,887 |
|
| 46,887 | ||
Minority interest |
| 192,770 |
|
| 144,039 | ||
Commitments and contingencies (Note 20) | |||||||
Shareholders’ equity | |||||||
Preferred stock of $100 par value – authorized 100,000 shares; none issued |
| — |
|
| — | ||
Common stock of $6.25 par value – 16,000,000 shares authorized; 8,946,651 | |||||||
and 8,921,866 shares issued at December 31, 2002 and 2001 respectively |
| 55,915 |
|
| 55,762 | ||
Paid-in capital |
| 11,436 |
|
| 9,869 | ||
Retained earnings |
| 123,189 |
|
| 119,125 | ||
Accumulated other comprehensive income |
| (1,661 | ) |
| 1,756 | ||
| 188,879 |
|
| 186,512 | |||
Less: 23,765 shares of common stock held in treasury, at cost on December 31, 2001 |
| — |
|
| 599 | ||
Unearned compensation and ESOP |
| 923 |
|
| 459 | ||
Total shareholders’ equity |
| 187,956 |
|
| 185,454 | ||
Total liabilities and shareholders’ equity | $ | 586,292 |
| $ | 457,102 | ||
| Year Ended December 31, | ||||||||||||
| 2003 | 2002 | 2001 | ||||||||||
Revenues | ||||||||||||
Oil and condensate | $ | 16,816 | $ | 8,246 | $ | 3,762 | ||||||
Natural gas | 106,615 | 62,552 | 53,263 | |||||||||
Coal royalties | 50,312 | 31,358 | 32,365 | |||||||||
Timber | 1,020 | 1,640 | 1,732 | |||||||||
Other | 6,521 | 7,161 | 5,449 | |||||||||
| 181,284 | 110,957 | 96,571 | ||||||||||
Expenses | ||||||||||||
Lease operating | 16,864 | 12,754 | 9,284 | |||||||||
Exploration | 15,589 | 7,733 | 11,832 | |||||||||
Taxes other than income | 11,322 | 6,804 | 5,433 | |||||||||
General and administrative | 24,893 | 21,440 | 15,297 | |||||||||
Depreciation, depletion and amortization | 50,109 | 30,639 | 19,579 | |||||||||
Impairment of oil and gas properties | 406 | 796 | 33,583 | |||||||||
| 119,183 | 80,166 | 95,008 | ||||||||||
Operating Income | 62,101 | 30,791 | 1,563 | |||||||||
Other income (expense) | ||||||||||||
Interest expense | (5,304 | ) | (2,116 | ) | (2,453 | ) | ||||||
Interest income | 1,237 | 2,038 | 1,602 | |||||||||
Gain on the sale of securities | — | — | 54,688 | |||||||||
Other | 1 | 1 | 14 | |||||||||
Income from continuing operations before minority interest, income taxes, discontinued operations and cumulative effect of change in accounting principle | 58,035 | 30,714 | 55,414 | |||||||||
Minority interest | 12,510 | 11,896 | 1,763 | |||||||||
Income tax expense | 18,366 | 6,935 | 19,314 | |||||||||
Income from continuing operations before discontinued operations and cumulative effect of change in accounting principle | 27,159 | 11,883 | 34,337 | |||||||||
Income from discontinued operations (including gain on sale and net of taxes) | — | 221 | — | |||||||||
Cumulative effect of change in accounting principle, net of taxes of $734 thousand | 1,363 | — | — | |||||||||
Net Income | $ | 28,522 | $ | 12,104 | $ | 34,337 | ||||||
Income from continuing operations before discontinued operations and cumulative effect of change in accounting principle, basic | $ | 3.02 | $ | 1.33 | $ | 3.92 | ||||||
Income from discontinued operations, basic | — | 0.02 | — | |||||||||
Cumulative effect of change in accounting principle, basic | 0.15 | — | — | |||||||||
Net income per share, basic | $ | 3.17 | $ | 1.35 | $ | 3.92 | ||||||
Income from continuing operations before discontinued operations and cumulative effect of change in accounting principle, diluted | $ | 3.00 | $ | 1.32 | $ | 3.86 | ||||||
Income from discontinued operations per share, diluted | — | 0.02 | — | |||||||||
Cumulative effect of change in accounting principle, diluted | 0.15 | — | — | |||||||||
Net income per share, diluted | $ | 3.15 | $ | 1.34 | $ | 3.86 | ||||||
Weighted average shares outstanding, basic | 8,988 | 8,930 | 8,770 | |||||||||
Weighted average shares outstanding, diluted | 9,056 | 8,974 | 8,896 | |||||||||
The accompanying notes are an integral part of these consolidated financial statements.
Page 4653
PENN VIRGINIA CORPORATION AND SUBSIDIARIES
CONSOLIDATED STATEMENTS OF SHAREHOLDERS’ EQUITYBALANCE SHEETS
(in thousands, except share data)
Accumulated | Total | |||||||||||||||||||||||||||||||||
Other | Unearned | Stockholders’ | ||||||||||||||||||||||||||||||||
Shares | Common | Paid-in | Retained | Comprehensive | Treasury | Compensation | Comprehensive | Comprehensive | ||||||||||||||||||||||||||
Outstanding | Stock | Capital | Earnings | Income | Stock | And ESOP | Equity | Income (Loss) | ||||||||||||||||||||||||||
Balance at December 31, 1999 | 8,423,628 |
| $ | 55,762 | $ | 8,096 |
| $ | 60,860 |
| $ | 42,017 |
| $ | (11,142 | ) | $ | (1,250 | ) | $ | 154,343 |
| $ | (9,464 | ) | |||||||||
Dividends paid ($0.90 per share) | — |
|
| — |
| — |
|
| (7,407 | ) |
| — |
|
| — |
|
| — |
|
| (7,407 | ) | ||||||||||||
Purchase of treasury stock | (363,430 | ) |
| — |
| — |
|
| — |
|
| — |
|
| (6,761 | ) |
| — |
|
| (6,761 | ) | ||||||||||||
Stock issued as compensation | 11,163 |
|
| — |
| — |
|
| — |
|
| — |
|
| 226 |
|
| — |
|
| 226 |
| ||||||||||||
Exercise of stock options | 326,397 |
|
| — |
| (63 | ) |
| — |
|
| — |
|
| 6,703 |
|
| — |
|
| 6,640 |
| ||||||||||||
Allocation of ESOP shares | — |
|
| — |
| 67 |
|
| — |
|
| — |
|
| — |
|
| 200 |
|
| 267 |
| ||||||||||||
Net income | — |
|
| — |
| — |
|
| 39,265 |
|
| — |
|
| — |
|
| — |
|
| 39,265 |
|
| 39,265 |
| |||||||||
Other comprehensive loss, net of tax | — |
|
| — |
| — |
|
| — |
|
| (15,411 | ) |
| — |
|
| — |
|
| (15,411 | ) |
| (15,411 | ) | |||||||||
Balance at December 31, 2000 | 8,397,758 |
|
| 55,762 |
| 8,100 |
|
| 92,718 |
|
| 26,606 |
|
| (10,974 | ) |
| (1,050 | ) |
| 171,162 |
|
| 23,854 |
| |||||||||
Dividends paid ($0.90 per share) | — |
|
| — |
| — |
|
| (7,930 | ) |
| — |
|
| — |
|
| — |
|
| (7,930 | ) | ||||||||||||
Purchase of treasury stock | (33,991 | ) |
| — |
| — |
|
| — |
|
| (638 | ) |
| — |
|
| (638 | ) | |||||||||||||||
Stock issued as compensation | 8,281 |
|
| — |
| 142 |
|
| — |
|
| — |
|
| 188 |
|
| — |
|
| 330 |
| ||||||||||||
Exercise of stock options | 526,053 |
|
| — |
| 1,417 |
|
| — |
|
| — |
|
| 11,216 |
|
| — |
|
| 12,633 |
| ||||||||||||
Allocation of ESOP shares | — |
|
| — |
| 210 |
|
| — |
|
| — |
|
| (391 | ) |
| 591 |
|
| 410 |
| ||||||||||||
Net income | — |
|
| — |
| — |
|
| 34,337 |
|
| — |
|
| — |
|
| — |
|
| 34,337 |
|
| 34,337 |
| |||||||||
Other comprehensive loss, net of tax | — |
|
| — |
| — |
|
| — |
|
| (24,850 | ) |
| — |
|
| — |
|
| (24,850 | ) |
| (24,850 | ) | |||||||||
Balance at December 31, 2001 | 8,898,101 |
|
| 55,762 |
| 9,869 |
|
| 119,125 |
|
| 1,756 |
|
| (599 | ) |
| (459 | ) |
| 185,454 |
|
| 9,487 |
| |||||||||
Dividends paid ($0.90 per share) | — |
|
| — |
| — |
|
| (8,040 | ) |
| — |
|
| — |
|
| — |
|
| (8,040 | ) | ||||||||||||
Purchase of treasury stock | (15,202 | ) |
| — |
| — |
|
| — |
|
| — |
|
| (557 | ) |
| — |
|
| (557 | ) | ||||||||||||
Stock issued as compensation | 6,752 |
|
| 8 |
| 84 |
|
| — |
|
| — |
|
| 157 |
|
| — |
|
| 249 |
| ||||||||||||
Penn Virginia Resource Partners, L.P. units issued as compensation, net | — |
|
| — |
| 806 |
|
| — |
|
| — |
|
| — |
|
| (664 | ) |
| 142 |
| ||||||||||||
Exercise of stock options | 57,000 |
|
| 145 |
| 470 |
|
| — |
|
| — |
|
| 999 |
|
| — |
|
| 1,614 |
| ||||||||||||
Allocation of ESOP shares | — |
|
| — |
| 207 |
|
| — |
|
| — |
|
| — |
|
| 200 |
|
| 407 |
| ||||||||||||
Net income | — |
|
| — |
| — |
|
| 12,104 |
|
| — |
|
| — |
|
| — |
|
| 12,104 |
|
| 12,104 |
| |||||||||
Other comprehensive loss, net of tax | — |
|
| — |
| — |
|
| — |
|
| (3,417 | ) |
| — |
|
| — |
|
| (3,417 | ) |
| (3,417 | ) | |||||||||
Balance at December 31, 2002 | 8,946,651 |
| $ | 55,915 | $ | 11,436 |
| $ | 123,189 |
| $ | (1,661 | ) | $ | — |
| $ | (923 | ) | $ | 187,956 |
| $ | 8,687 |
| |||||||||
| December 31, | ||||||||
| 2003 | 2002 | |||||||
Assets | ||||||||
Current assets | ||||||||
Cash and cash equivalents | $ | 18,008 | $ | 13,341 | ||||
Accounts receivable | 31,789 | 20,366 | ||||||
Other | 2,108 | 2,030 | ||||||
Total current assets | 51,905 | 35,737 | ||||||
Property and Equipment | ||||||||
Oil and gas properties (successful efforts method) | 503,290 | 383,360 | ||||||
Other property and equipment | 267,378 | 265,180 | ||||||
| 770,668 | 648,540 | |||||||
Less: Accumulated depreciation, depletion and amortization | 149,734 | 102,588 | ||||||
Net property and equipment | 620,934 | 545,952 | ||||||
Other assets | 10,894 | 4,603 | ||||||
Total assets | $ | 683,733 | $ | 586,292 | ||||
Liabilities and Shareholders’ Equity | ||||||||
Current liabilities | ||||||||
Current maturities of long-term debt | $ | 1,500 | $ | 52 | ||||
Accounts payable | 9,911 | 5,670 | ||||||
Accrued liabilities | 19,153 | 16,508 | ||||||
Hedging liabilities | 2,678 | 1,621 | ||||||
Total current liabilities | 33,242 | 23,851 | ||||||
Other liabilities | 15,188 | 12,230 | ||||||
Hedging liabilities | 998 | 444 | ||||||
Deferred income taxes | 77,863 | 62,154 | ||||||
Long-term debt of the Company | 64,000 | 16,000 | ||||||
Long-term debt of PVR. | 90,286 | 90,887 | ||||||
Minority interest in PVR | 190,508 | 192,770 | ||||||
Commitments and contingencies (Note 21) | ||||||||
Shareholders’ equity | ||||||||
Preferred stock of $100 par value—authorized 100,000 shares; none issued | — | — | ||||||
Common stock of $6.25 par value—16,000,000 shares authorized; 9,052,416 and 8,946,651 shares issued and outstanding at December 31, 2003 and 2002, respectively | 56,576 | 55,915 | ||||||
Paid-in capital | 14,497 | 11,436 | ||||||
Retained earnings | 143,619 | 123,189 | ||||||
Accumulated other comprehensive income | (2,250 | ) | (1,661 | ) | ||||
| 212,442 | 188,879 | |||||||
Less: Unearned compensation and ESOP | 794 | 923 | ||||||
Total shareholders’ equity | 211,648 | �� | 187,956 | |||||
Total liabilities and shareholders’ equity | $ | 683,733 | $ | 586,292 | ||||
The accompanying notes are an integral part of these consolidated financial statements.
54
PENN VIRGINIA CORPORATION AND SUBSIDIARIES
CONSOLIDATED STATEMENTS OF SHAREHOLDERS’ EQUITY AND COMPREHENSIVE INCOME
(in thousands, except share data)
| Shares Outstanding | Common Stock | Paid-in Capital | Retained Earnings | Accumulated Other Comprehensive Income | Treasury Stock | Unearned Compensation And ESOP | Total Stockholders’ Comprehensive Equity | Comprehensive Income (Loss) | |||||||||||||||||||||||||
Balance at December 31, 2000 | 8,397,758 | $ | 55,762 | $ | 8,100 | $ | 92,718 | $ | 26,606 | $ | (10,974 | ) | $ | (1,050 | ) | $ | 171,162 | ||||||||||||||||
Dividends paid ($0.90 per share) | — | — | — | (7,930 | ) | — | — | — | (7,930 | ) | |||||||||||||||||||||||
Purchase of treasury stock | (33,991 | ) | — | — | — | — | (638 | ) | — | (638 | ) | ||||||||||||||||||||||
Stock issued as compensation | 8,281 | — | 142 | — | — | 188 | — | 330 | |||||||||||||||||||||||||
Exercise of stock options | 526,053 | — | 1,417 | — | — | 11,216 | — | 12,633 | |||||||||||||||||||||||||
Allocation of ESOP shares | — | — | 210 | — | — | (391 | ) | 591 | 410 | ||||||||||||||||||||||||
Net income | — | — | — | 34,337 | — | — | — | 34,337 | $ | 34,337 | |||||||||||||||||||||||
Other comprehensive loss, net of tax | — | — | — | — | (24,850 | ) | — | — | (24,850 | ) | (24,850 | ) | |||||||||||||||||||||
Balance at December 31, 2001 | 8,898,101 | 55,762 | 9,869 | 119,125 | 1,756 | (599 | ) | (459 | ) | 185,454 | $ | 9,487 | |||||||||||||||||||||
Dividends paid ($0.90 per share) | — | — | — | (8,040 | ) | — | — | — | (8,040 | ) | |||||||||||||||||||||||
Purchase of treasury stock | (15,202 | ) | — | — | — | — | (557 | ) | — | (557 | ) | ||||||||||||||||||||||
Stock issued as compensation | 6,752 | 8 | 84 | — | — | 157 | — | 249 | |||||||||||||||||||||||||
PVR units issued as compensation, net | — | — | 806 | — | — | — | (664 | ) | 142 | ||||||||||||||||||||||||
Exercise of stock options | 57,000 | 145 | 470 | — | — | 999 | — | 1,614 | |||||||||||||||||||||||||
Allocation of ESOP shares | — | — | 207 | — | — | — | 200 | 407 | |||||||||||||||||||||||||
Net income | — | — | — | 12,104 | — | — | — | 12,104 | $ | 12,104 | |||||||||||||||||||||||
Other comprehensive loss, net of tax | — | — | — | — | (3,417 | ) | — | — | (3,417 | ) | (3,417 | ) | |||||||||||||||||||||
Balance at December 31, 2002 | 8,946,651 | 55,915 | 11,436 | 123,189 | (1,661 | ) | — | (923 | ) | 187,956 | $ | 8,687 | |||||||||||||||||||||
Dividends paid ($0.90 per share) | — | — | — | (8,092 | ) | — | — | — | (8,092 | ) | |||||||||||||||||||||||
Stock issued as compensation | 6,710 | 42 | 229 | — | — | — | — | 271 | |||||||||||||||||||||||||
PVR units issued as compensation, net | — | — | 172 | — | — | — | (71 | ) | 101 | ||||||||||||||||||||||||
Exercise of stock options | 99,055 | 619 | 2,364 | — | — | — | — | 2,983 | |||||||||||||||||||||||||
Allocation of ESOP shares | — | — | 296 | — | — | — | 200 | 496 | |||||||||||||||||||||||||
Net income | — | — | — | 28,522 | — | — | — | 28,522 | $ | 28,522 | |||||||||||||||||||||||
Other comprehensive loss, net of tax | — | — | — | — | (589 | ) | — | — | (589 | ) | (589 | ) | |||||||||||||||||||||
Balance at December 31, 2003 | 9,052,416 | $ | 56,576 | $ | 14,497 | $ | 143,619 | $ | (2,250 | ) | $ | — | $ | (794 | ) | $ | 211,648 | $ | 27,933 | ||||||||||||||
The accompanying notes are an integral part of these consolidated financial statements
Page 4755
PENN VIRGINIA CORPORATION AND SUBSIDIARIES
CONSOLIDATED STATEMENTS OF CASH FLOWS
(in thousands)
Year ended December 31, | Year ended December 31, | |||||||||||||||||||||||
2002 | 2001 | 2000 | 2003 | 2002 | 2001 | |||||||||||||||||||
Cash flows from operating activities: | ||||||||||||||||||||||||
Net income | $ | 12,104 |
| $ | 34,337 |
| $ | 39,265 |
| $ | 28,522 | $ | 12,104 | $ | 34,337 | |||||||||
Adjustments to reconcile net income to net cash provided (used) by operating activities: | ||||||||||||||||||||||||
Adjustments to reconcile net income to net cash provided by operating activities: | ||||||||||||||||||||||||
Depreciation, depletion and amortization |
| 30,639 |
|
| 19,579 |
|
| 12,027 |
| 50,109 | 30,639 | 19,579 | ||||||||||||
Deferred income taxes | 15,292 | 8,133 | (1,888 | ) | ||||||||||||||||||||
Minority interest | 12,510 | 11,896 | 1,763 | |||||||||||||||||||||
Dry hole and unproved leasehold expense | 5,989 | 2,255 | 8,953 | |||||||||||||||||||||
Impairment of oil and gas properties |
| 796 |
|
| 33,583 |
|
| — |
| 406 | 796 | 33,583 | ||||||||||||
Loss (gain) on the sale of property and equipment |
| 5 |
|
| (492 | ) |
| (24,795 | ) | |||||||||||||||
Gain on sale of securities |
| — |
|
| (54,688 | ) |
| — |
| — | — | (54,688 | ) | |||||||||||
Deferred income taxes |
| 8,133 |
|
| (1,888 | ) |
| 7,006 |
| |||||||||||||||
Tax benefit from stock option exercises |
| 230 |
|
| 2,933 |
|
| 1,049 |
| |||||||||||||||
Dry hole and unproved leasehold expense |
| 2,255 |
|
| 8,953 |
|
| 3,154 |
| |||||||||||||||
Minority interest |
| 11,896 |
|
| 1,763 |
|
| — |
| |||||||||||||||
Noncash interest expense |
| 666 |
|
| 285 |
|
| 112 |
| |||||||||||||||
Cumulative effect of change in accounting principle | (1,363 | ) | — | — | ||||||||||||||||||||
Other |
| 1,074 |
|
| 194 |
|
| 28 |
| 2,282 | 1,975 | 2,920 | ||||||||||||
| 67,798 |
|
| 44,559 |
|
| 37,846 |
| ||||||||||||||||
Changes in operating assets and liabilities: | ||||||||||||||||||||||||
Accounts receivable |
| (5,695 | ) |
| 592 |
|
| (6,046 | ) | (11,423 | ) | (5,695 | ) | 592 | ||||||||||
Other current assets |
| (646 | ) |
| (2,041 | ) |
| 161 |
| 239 | (646 | ) | (2,041 | ) | ||||||||||
Accounts payable and accrued liabilities |
| 6,849 |
|
| 4,986 |
|
| 2,723 |
| 4,785 | 6,849 | 4,986 | ||||||||||||
Taxes on income |
| — |
|
| (7,296 | ) |
| 7,296 |
| — | — | (7,296 | ) | |||||||||||
Other assets and liabilities |
| (2,518 | ) |
| 3,391 |
|
| (240 | ) | 2,356 | (2,518 | ) | 3,391 | |||||||||||
Net cash flows provided by operating activities |
| 65,788 |
|
| 44,191 |
|
| 41,740 |
| 109,704 | 65,788 | 44,191 | ||||||||||||
Cash flows from investing activities: | ||||||||||||||||||||||||
Proceeds from the sale of securities |
| — |
|
| 57,525 |
|
| — |
| — | — | 57,525 | ||||||||||||
Proceeds from the sale of property and equipment |
| 1,319 |
|
| 1,416 |
|
| 55,208 |
| 850 | 1,319 | 1,416 | ||||||||||||
Payments received on long-term notes receivable |
| 555 |
|
| 1,052 |
|
| 926 |
| 530 | 555 | 1,052 | ||||||||||||
Sale of restricted U. S. Treasury Notes |
| 43,387 |
|
| — |
|
| — |
| — | 43,387 | — | ||||||||||||
Purchase of restricted U.S. Treasury Notes |
| — |
|
| (43,387 | ) |
| — |
| — | — | (43,387 | ) | |||||||||||
Additions to property and equipment |
| (144,741 | ) |
| (196,038 | ) |
| (59,443 | ) | (128,182 | ) | (144,741 | ) | (196,038 | ) | |||||||||
Net cash flows used in investing activities |
| (99,480 | ) |
| (179,432 | ) |
| (3,309 | ) | (126,802 | ) | (99,480 | ) | (179,432 | ) | |||||||||
Cash flows from financing activities: | ||||||||||||||||||||||||
Dividends paid |
| (8,040 | ) |
| (7,930 | ) |
| (7,407 | ) | (8,092 | ) | (8,040 | ) | (7,930 | ) | |||||||||
Distributions paid to minority interest holders of subsidiary |
| (13,787 | ) |
| — |
|
| — |
| |||||||||||||||
Proceeds from borrowings |
| 22,046 |
|
| 147,895 |
|
| 33,240 |
| |||||||||||||||
Repayment of borrowings |
| (10,729 | ) |
| (191,400 | ) |
| (63,509 | ) | |||||||||||||||
Proceeds from Penn Virginia Resource Partners, L.P. revolver |
| 47,500 |
|
| — |
|
| — |
| |||||||||||||||
Proceeds from Penn Virginia Resource Partners, L.P. term loan |
| — |
|
| 43,387 |
|
| — |
| |||||||||||||||
Distributions paid to minority interest holders of PVR | (19,880 | ) | (13,787 | ) | — | |||||||||||||||||||
Proceeds from borrowings of the Company | 108,398 | 22,046 | 147,895 | |||||||||||||||||||||
Repayment of borrowings of the Company | (60,450 | ) | (10,729 | ) | (191,400 | ) | ||||||||||||||||||
Proceeds from PVR borrowings | 90,000 | 47,500 | 43,387 | |||||||||||||||||||||
Repayments of PVR borrowings | (88,387 | ) | — | — | ||||||||||||||||||||
Payments for debt issuance costs | (2,824 | ) | — | — | ||||||||||||||||||||
Proceeds from initial public offering, net |
| — |
|
| 142,373 |
|
| — |
| — | — | 142,373 | ||||||||||||
Purchases of treasury stock |
| (557 | ) |
| (638 | ) |
| (6,761 | ) | — | (557 | ) | (638 | ) | ||||||||||
Purchase of units of Penn Virginia Resource Partners, L.P. |
| (1,067 | ) |
| — |
|
| — |
| |||||||||||||||
Purchase of PVR units | — | (1,067 | ) | — | ||||||||||||||||||||
Issuance of stock |
| 2,046 |
|
| 10,440 |
|
| 6,084 |
| 3,000 | 2,046 | 10,440 | ||||||||||||
Net cash flows provided by (used in) financing activities |
| 37,412 |
|
| 144,127 |
|
| (38,353 | ) | |||||||||||||||
Net cash flows provided by financing activities | 21,765 | 37,412 | 144,127 | |||||||||||||||||||||
Net increase in cash and cash equivalents |
| 3,720 |
|
| 8,886 |
|
| 78 |
| 4,667 | 3,720 | 8,886 | ||||||||||||
Cash and cash equivalents – beginning of year |
| 9,621 |
|
| 735 |
|
| 657 |
| |||||||||||||||
Cash and cash equivalents—beginning of year | 13,341 | 9,621 | 735 | |||||||||||||||||||||
Cash and cash equivalents – end of year | $ | 13,341 |
| $ | 9,621 |
| $ | 735 |
| |||||||||||||||
Cash and cash equivalents—end of year | $ | 18,008 | $ | 13,341 | $ | 9,621 | ||||||||||||||||||
Supplemental disclosures: | ||||||||||||||||||||||||
Cash paid during the year for: | ||||||||||||||||||||||||
Interest (net of amount capitalized) | $ | 1,213 |
| $ | 3,131 |
| $ | 8,304 |
| $ | 3,810 | $ | 1,213 | $ | 3,131 | |||||||||
Income taxes | $ | 125 |
| $ | 28,772 |
| $ | 4,614 |
| $ | 6,529 | $ | 125 | $ | 28,772 | |||||||||
Noncash additions to property and equipment: | ||||||||||||||||||||||||
Issuance of Penn Virginia Resource Partners, L.P. units for acquisitions | $ | 50,920 |
| $ | — |
| $ | — |
| |||||||||||||||
Noncash investing and financing activities: | ||||||||||||||||||||||||
Issuance of PVR units for acquisitions | $ | 4,969 | $ | 50,920 | $ | — | ||||||||||||||||||
Working capital and assumed liabilities for acquisitions, net | $ | 3,805 |
| $ | — |
| $ | — |
| $ | — | $ | 3,805 | $ | — | |||||||||
Deferred tax liabilities related to acquisition, net | $ | — |
| $ | 43,137 |
| $ | — |
| $ | — | $ | — | $ | 43,137 | |||||||||
The accompanying notes are an integral part of these consolidated financial statements.
Page 4856
PENN VIRGINIA CORPORATION AND SUBSIDIARIES
NOTES TO CONSOLIDATED FINANCIAL STATEMENTS
1. Nature of Operations
Penn Virginia Corporation (“Penn Virginia” or the “Company”) is an independent energy company that is engaged in two primary lines of business. We explore for, develop and produce crude oil, condensate and natural gas in the eastern and southern portionsGulf Coast onshore areas of the United States. In addition, we conduct our coal operations through our ownership in Penn Virginia Resource Partners, L.P. (the “Partnership” or “PVR”);, a Delaware limited partnership. See Note 2 (Penn2. Penn Virginia Resource Partners, L.P.).
The Partnership enters into leases with various third-party operators for the right to mine coal reserves on the Partnership’s property in exchange for royalty payments. CoalApproximately 72 percent of the Partnership’s 2003 coal royalty revenues under non-Peabody Leases areand 99 percent of its 2002 coal royalty revenues were based on the higher of a percentage of the gross sales price or a fixed price per ton of coal sold, with pre-established minimum monthly or annual payments. UnderThe balance of the Peabody leases,Partnership’s 2003 and 2002 coal royalty revenues arewere based on fixed royalty rates which escalate annually, also with pre-established monthly minimums. The Partnership also sells timber growing on its land and provides fee-based infrastructure facilities to certain lessees to enhance coal production and to generate additional coal services revenues.
2. Penn Virginia Resource Partners, L.P.
Penn Virginia Resource Partners, L.P. was formed in July 2001 to own and operate the coal land management business of Penn Virginia.
The Partnership completed its initial public offering of 7,475,000 common units at a price of $21.00 per unit on October 30, 2001. Total proceeds for the 7,475,000 units were $157.0 million before offering costs and underwriters’ commissions. Effective with the closing of the initial public offering, Penn Virginia, through its wholly owned subsidiaries, received 174,880 common units, 7,649,880 subordinated units and a 2 percent general partnership interest in the ownership of the Partnership. In addition, concurrent with the closing of the initial public offering, the Partnership borrowed $43.4 million under its term loan credit facility with PNC Bank, National Association and other lenders.
In conjunction with the formation of the Partnership, Penn Virginia contributed to the Partnership net assets totaling $39.1 million. Concurrent with the initial public offering, the Partnership paid $141.5 million to Penn Virginia for repayment of debt and the purchase of 975,000 common units held by Penn Virginia. The Partnership’s note receivable from Penn Virginia was forgiven as well as the remaining portion of the Partnership’s note payable to Penn Virginia.
The common units have preferences over the subordinated units with respect to cash distributions, accordingly, we accounted for the sale of the Partnership units as a sale of a minority interest. At the time our subordinated units convert to common units, we will recognize any gain or loss computed at that time, as paid-in capital. Our subordinated units automatically convert to common units on September 30, 2006, but a portion of the subordinated units may convert after September 30, 2004 if the Partnership meets certain financial tests, namely operating surpluses that exceed the minimum quarterly distributions.
In December 2002, the Partnership acquired approximately 120 million tons of coal reserves from subsidiaries of Peabody Energy Corporation (“Peabody”). In conjunction with the acquisition, the Partnership issued 1,522,325 common units and 1,240,833 Class B common units, of which 293,700 Class B common units are held in escrow pending certain title transfers. All Class B common units share in income and distributions on the same basis as the common units, but they are not listed on the New York Stock Exchange. Subject to the approval of our common unitholders, the Class B common units will automatically convert into an equal number of common units; however, if the conversion is denied, Peabody, as holder of the Class B units, would have the right to receive 115 percent of the amount of distributions paid on the common units. Adoption of the proposed conversion requires the affirmative vote of a majority of the votes cast at a special meeting of unitholders to be held in 2003, provided that the total votes cast represent over 50 percent in interest of all common units entitled to vote.tests.
The general partner of the Partnership is Penn Virginia Resource GP, LLC, (the “general partner”), a wholly owned subsidiary of Penn Virginia.
57
PENN VIRGINIA CORPORATION AND SUBSIDIARIES
NOTES TO CONSOLIDATED FINANCIAL STATEMENTS—(Continued)
3. Summary of Significant Accounting Policies
Principles of Consolidation
The consolidated financial statements include the accounts of Penn Virginia, all wholly-owned subsidiaries and the Partnership in which we have an approximate 45 percent ownership interest as of December 31, 2002.2003. Penn Virginia Resource GP, LLC, a wholly-owned subsidiary of Penn Virginia, serves as the Partnership’s sole general partner and controls the Partnership. We own and operate
Page 49
our undivided oil and gas reserves through our wholly-owned subsidiaries. We account for our undivided interest in oil and gas properties using the proportionate consolidation method, whereby our share of assets, liabilities, revenues and expenses is included in the appropriate classification in the financial statements. Intercompany balances and transactions have been eliminated in consolidation. In the opinion of management, all adjustments have been reflected that are necessary for a fair presentation of the consolidated financial statements. Certain amounts have been reclassified to conform to the current year’s presentation.
Use of Estimates
Preparation of the accompanying consolidated financial statements in conformity with accounting principles generally accepted in the United States of America requires management to make estimates and assumptions that affect the reported amounts of assets and liabilities in the consolidated financial statements and the reported amounts of revenues and expenses during the reporting period. Actual results could differ from those estimates.
Cash and Cash equivalents/Restricted U.S. Treasury Notesequivalents
We consider all highly liquid investments purchased with an original maturity of three months or less to be cash equivalents. As of December 31, 2001, the Partnership had restricted cash in the form of U.S. Treasury Notes, which were used to secure the Partnership’s term loan facility. See Note 11 (Long-Term Debt). In 2002, the Partnership sold the U.S. Treasury Notes and used the proceeds to purchase property and equipment.
Investments
During 2001 and 2000, we held investments that consisted of publicly traded equity securities. We classify our equity securities as available-for-sale. Available-for-sale securities are recorded at fair value based upon market quotations. Unrealized holding gains and losses, net of the related tax effect, on these securities are excluded from earnings and are reported as a separate component of stockholders’ equity. See Note 18 (Accumulated Other Comprehensive Income). A decline in the market value of any available-for-sale security below cost that is deemed other than temporary, is charged to earnings in the period it occurs resulting in the establishment of a new cost basis for the security. Dividend income is recognized when received. Realized gains and losses for securities classified as available-for-sale are included in earnings and are derived using the specific identification method for determining the cost of securities sold. See Note 5 (Investments and Dividend Income).
Note Receivable
The note receivable is recorded at cost and adjusted for amortization of discounts. Discounts are amortized over the life of the note receivable using the effective interest rate method.
Oil and Gas Properties
We use the successful efforts method of accounting for our oil and gas operations. Under this method of accounting, costs to acquire mineral interests in oil and gas properties and to drill and equip development wells (including development dry holes) are capitalized and amortized on a unit-of-production basis over the remaining life of proved developed reserves and proved reserves, respectively. CostCosts of drilling exploratory wells are initially capitalized, and later charged to expense if upon determination that the well doeswells do not justify commercial development. Other exploratoryexploration costs, including annual delay rentals and geological and geophysical costs, are charged to expense when incurred.
The costs of unproved leaseholds, incudingincluding capitalized interest, are capitalized pending the results of exploration efforts. During 2003, 2002 and 2001, interest costs associated with non-producing leases were capitalized for the period activities were in progress to bring projects to their intended use. We capitalized $2.0 million, $1.0 million and $1.1 million of interest costs in 2003, 2002 and 2001, respectively. No interest costs were capitalized in 2000. Unproved leasehold costs are assessed periodically, on a property-by-property basis, and a loss is recognized to the extent, if any, the cost of the property has been impaired. As unproved leaseholds are determined to be productive, the related costs
58
PENN VIRGINIA CORPORATION AND SUBSIDIARIES
NOTES TO CONSOLIDATED FINANCIAL STATEMENTS—(Continued)
are transferred to proved leaseholds.leaseholds and amortized on a unit-of-production basis. As of December 31 2003 and 2002, unproved leasehold costs amounted to $60.0 million and $57.6 million, respectively.
Other Property and Equipment
Other property and equipment primarily represent PVR’s ownership in coal fee mineral interests. Other property and equipment is carried at cost and includes expenditures for additions and improvements, such as roads and land improvements, which substantially increase the productive lives of existing assets. Maintenance and repair costs are expensed as incurred. Depreciation of property and equipment is generally computed using the straight-line methodor declining balance methods over theirthe estimated useful lives of such property and equipment, varying from 3 years to 20 years. Coal properties are depleted on an area-by-area basis at a rate based upon the cost of the mineral properties and estimated proven and probable tonnage therein. When an asset is retired or sold, its cost and related accumulated depreciation are removed from the accounts. The difference between undepreciated costnet book value and proceeds from disposition is recorded as a gain or loss.
Impairment of Long-Lived Assets
We review our long-lived assets to be held and used, including proved oil and gas properties and the Partnership’s coal properties, whenever events or circumstances indicate that the carrying value of those assets may not be recoverable. An impairment loss must be recognized when the carrying amount of an asset exceeds the sum of the undiscounted estimated future cash flows. In this circumstance, we would recognize an impairment loss equal to the difference between the carrying value and the fair value of the asset.
Page 50
Fair value is estimated to be the expected present value of future net cash flows from proved reserves, discounted utilizing a risk-free interest rate commensurate with the remaining lives for the respective oil and gas properties.
Concentration of Credit Risk
Substantially all of our accounts receivable at December 31, 20022003 result from oil and gas sales and joint interest billings to third party companies in the oil and gas industry. This concentration of customers and joint interest owners may impact our overall credit risk, either positively or negatively, in that these entities may be similarly affected by changes in economic or other conditions. In determining whether or not to require collateral from a customer or joint interest owner, we analyze the entity’s net worth, cash flows, earnings and credit ratings. Receivables are generally not collateralized. Historical credit losses incurred on receivables have not been significant.
Substantially all of the Partnership’s accounts receivable at December 31, 2002,2003, result from billings to third party companies in the coal industry.accrued revenues from lessee production. This concentration of customers may impact the Partnership’s overall credit risk, either positively or negatively, in that these entities may be similarly affected by changes in economic or other conditions. In determining whether or not to require collateral from a lessee, the Partnership analyzes the entity’s net worth, cash flows, earnings and credit ratings. Receivables are generally not collateralized. Historical credit losses incurred by the Partnership on receivables have not been significant.
Risk Factors
Our revenues, profitability, cash flow and future growth rates are substantially dependent upon the price of and demand for natural gas and crude oil and to a lesser extent coal. Prices for natural gas and crude oil are subject to wide fluctuations in response to relatively minor changes in the supply of and demand for natural gas and crude oil, market uncertainty and a variety of additional factors that are beyond our control. We are also dependent upon the continued success of our exploratory drilling program. Other factors that could affect
59
PENN VIRGINIA CORPORATION AND SUBSIDIARIES
NOTES TO CONSOLIDATED FINANCIAL STATEMENTS—(Continued)
revenues, profitability, cash flow and future growth rates include the inherent uncertainties in crude oil, natural gas and coal reserves, hedging of our crude oil and natural gas production with derivative instruments, the ability to replace crude oil, natural gas and coal reserves and the ability to finance future capital spending requirements.
Fair Value of Financial Instruments
Our financial instruments consist of cash and cash equivalents, marketable securities, accounts receivable, notes receivables, U.S. Treasury Notes, accounts payable, derivative instruments and long-term debt. The carrying values of cash marketable securities,and cash equivalents, accounts receivables, U.S. Treasury Notes, accounts payables, derivative instruments and long-term debt approximate fair value. The fair value of PVR senior unsecured debt at December 31, 2003 and 2002 was $88.9 million and $90.9 million, respectively. The fair value of notes receivable at December 31, 2003 and 2002 and 2001 was $3.4$2.3 million and $4.6$3.4 million, respectively.
Revenues
Oil and Gas.Oil Revenues associated with sales of crude oil, condensate, natural gas, and natural gas liquids are recorded when title passes to the customer. Natural gas sales revenues from properties in which the Company has an interest with other producers are recognized on the basis of our net working interest (“entitlement” method of accounting). Natural gas imbalances occur when crude oil andthe Company sells more or less than its entitled ownership percentage of total natural gas volumes are produced and sold for our account. Each working interest ownerproduction. Any amount received in excess of the Company’s share is treated as deferred revenues. If the Company takes less than it is entitled to take, the under-delivery is recorded as a well generally has the right to a specific percentage of production, and often actual production sold for any particular owner will differ from their ownership percentage. When, under contract terms, these differences are settled in cash, revenues are adjusted accordingly.receivable.
Coal Royalties.Royalties. Coal royalty revenues are recognized on the basis of tons of coal sold by the Partnership’s lessees and the corresponding revenuerevenues from those sales. MostApproximately 70 percent of PVR’s 2003 coal leases areroyalty revenues and all of the 2002 coal royalty revenues received from PVR’s coal lessees were based on minimum monthly or annual payments, a minimum dollar royalty per ton and/or a percentage of the gross sales price.price, with minimum monthly or annual rental payments. The remainder of PVR’s 2003 coal royalty revenues were derived from fixed royalty rate leases, which escalate annually, with pre-established minimum monthly payments. Coal royalty revenues are accrued on a monthly basis, based on PVR’s best estimates of coal mined on its properties.
Coal Services.Coal services revenues are recognized when lessees use the Partnership’s facilities for the processing, andloading and/or transportation of coal. Coal services revenues consist of fees collected from the Partnership’s lessees for the use of the Partnership’s loadout facility, coal preparation plant and dock loading facility. Revenues associated with coal services for the years ended December 31, 2003, 2002 and 2001 were approximately $2.1 million, $1.7 million for both years,and $1.7 million, respectively, and are included in other revenues.
Timber.Timber revenues are recognized aswhen timber is sold on a contract basis where independent contractors harvest and sell the timber and, from time to time, in a competitive bid process involving sales of standing timber on individual parcels.parcels and, from time to time, on a contract basis where independent contractors harvest and sell the timber. Timber revenues are recognized when the timber parcel has been sold or when the timber is harvested by the independent contractors. Title and risk of loss pass to the independent contractors upon the execution of the contract. In addition, if the contractors do not harvest the timber within the specified time period, the title of the timber reverts back to the Partnership with no refund of original payment.previous amounts received by us.
Minimum Rentals. Most of the Partnership’s lessees mustare required to make minimum monthly or annual payments that are generally recoupable over certain time periods. These minimum payments are recorded as deferred income. If the lessee recoups a minimum payment through production, the deferred income attributable to the minimum payment is recognized as coal royalty revenues. If a lessee fails to meet its minimum production
60
PENN VIRGINIA CORPORATION AND SUBSIDIARIES
NOTES TO CONSOLIDATED FINANCIAL STATEMENTS—(Continued)
for certain pre-determined time periods (thethe recoupment period),period, the deferred income attributable to the minimum payment is recognized as minimum rental revenues. Revenues associated with minimum rentals arerevenues and is included in other revenues.
Page 51
Income Tax
We account for income taxes in accordance with the provisions of SFAS No. 109,Accounting for Income Taxes. This Statement requires a company to recognize deferred tax liabilities and assets for the expected future tax consequences of events that have been recognized in a company’s financial statements or tax returns. Using this method, deferred tax liabilities and assets are determined based on the difference between the financial statement carrying amounts and tax bases of assets and liabilities using enacted tax rates.
Stock-based CompensationHedging Activities
We have stock compensation plans that allow, among other grants, incentive and nonqualified stock options to be granted to key employees and officers and nonqualified stock options to be granted to directors. See Note 17 (Stock Compensation and Stock Ownership Plans). We account for those plans under the recognition and measurement principles of APB Opinion No. 25,Accounting for Stock Issued to Employees, and related Interpretations. No stock-based employee compensation cost related to stock options is reflected in net income, as all options granted under those plans had an exercise price equal to the market value of the underlying common stock on the date of grant. The following table illustrates the effect on net income and earnings per share if we had applied the fair value recognition provision of SFAS No. 123,Accounting for Stock-Based Compensation, to stock-based employee options.
Year ended December 31, | ||||||||||||
2002 | 2001 | 2000 | ||||||||||
Net income, as reported | $ | 12,104 |
| $ | 34,337 |
| $ | 39,265 |
| |||
Add: Stock-based employee compensation expense included in reported net income related to restricted units and director compensation, net of related tax effects |
| 424 |
|
| 215 |
|
| 147 |
| |||
Less: Total stock-based employee compensation expense determined under fair value based method for all awards, net of related tax effects |
| (1,268 | ) |
| (900 | ) |
| (320 | ) | |||
Pro forma net income | $ | 11,260 |
| $ | 33,652 |
| $ | 39,092 |
| |||
Net income per share | ||||||||||||
Basic – as reported | $ | 1.35 |
| $ | 3.92 |
| $ | 4.76 |
| |||
Basic – pro forma | $ | 1.26 |
| $ | 3.84 |
| $ | 4.74 |
| |||
Diluted – as reported | $ | 1.34 |
| $ | 3.86 |
| $ | 4.69 |
| |||
Diluted – pro forma | $ | 1.25 |
| $ | 3.78 |
| $ | 4.67 |
| |||
New Accounting Standards
In June 2001, the Financial Accounting Standards Board (“FASB”) issued SFAS No. 143,Accounting for Asset Retirement Obligations, which addresses financial accounting and reporting for obligations associated with the retirement of tangible long-lived assets and the associated asset retirement costs. The Standard applies to legal obligations associated with the retirement of long-lived assets that result from the acquisition, construction, development or normal use of the asset.
SFAS No. 143 requires that the fair value of a liability for an asset retirement obligation be recognized in the period in which it is incurred if a reasonable estimate of fair value can be made. The fair value of the liability is also added to the carrying amount of the associated asset and this additional carrying amount is depreciated over the life of the asset. The liability is accreted at the end of each period through charges to operating expense. If the obligation is settled for other than the carrying amount of the liability, we will recognize a gain or loss on settlement.
We will adopt the provisions of SFAS No. 143 effective January 1, 2003. We identified all required asset retirement obligations and determined the fair value of these obligations on the date of adoption. The determination of fair value was based upon regional market and specific well or mine type information. In conjunction with the initial application of SFAS No. 143, it is expected we will record a cumulative-effect of change in accounting principle, net of taxes, of approximately $0.5 to $1.5 million as an increase to income, which will be reflected in the Company’s results of operations for 2003. In addition, it is expected we will record an asset retirement obligation of approximately $2.3 to $3.3 million.
Effective January 1, 2002 we adopted SFAS No. 144,Accounting for the Impairment or Disposal of Long-Lived Assets. This Statement supersedes SFAS No. 121,Accounting for the Impairment of Long-Lived Assets and for Long-Lived Assets to Be Disposed Of, and the accounting and reporting provisions of APB No. 30,Reporting the Results of Operations – Reporting the Effects of Disposal of a Segment of a Business, and Extraordinary, Unusual and Infrequently Occurring Events and Transactions, for the
Page 52
disposal of a segment of a business. SFAS No. 144 addresses financial accounting and reporting for the impairment or disposal of long-lived assets. See Note 15 (Discontinued Operations) for current year disclosures related to our adoption.
In April 2002, the FASB issued SFAS No. 145,Rescission of FASB Statements No. 4, 44, and 64, Amendment of FASB Statement No. 13, and Technical Corrections. This Statement rescinds SFAS No. 4,Reporting Gains and Losses from Extinguishment of Debt, which required all gains and losses from extinguishment of debt to be aggregated and, if material, classified as an extraordinary item of debt to be aggregated and, if material, classified as an extraordinary item, net of income taxes. As a result, the criteria in Accounting Principles Board Opinion (APB) Opinion No. 30 will now be used to classify those gains and losses. Any gain or loss on the extinguishment of debt that was classified as an extraordinary item in prior periods presented that does not meet the criteria in APB Opinion No. 30 for classification as an extraordinary item shall be reclassified. The provisions of this Statement are effective for fiscal years beginning after January 1, 2003. The initial adoption of SFAS No. 145 did not have a material effect on the financial position, results of operations or liquidity of the Company.
In June 2002, the FASB issued SFAS No. 146,Accounting for Costs Associated with Exit or Disposal Activities. This Statement requires the recognition of costs associated with exit or disposal activities when they are incurred rather than at the date of a commitment to an exit or disposal plan. The provisions of this Statement are effective for exit or disposal activities initiated after December 31, 2002.
In November 2002, the FASB issued Interpretation No. 45 ( FIN 45),Guarantor’s Accounting and Disclosure Requirements for Guarantees, Including Indirect Guarantees of the Indebtedness of Others, which clarifies the requirements of SFAS No. 5,Accounting for Contingencies, relating to a guarantor’s accounting for and disclosures of certain guarantees issued. FIN 45 requires enhanced disclosures for certain guarantees. It also will require certain guarantees that are issued or modified after December 31, 2002, including certain third-party guarantees, to be initially recorded on the balance sheet at fair value. For guarantees issued on or before December 31, 2002, liabilities are recorded when and if payments become probable and estimable. The financial statement recognition provisions are effective prospectively, and the Company cannot reasonably estimate the impact of adopting FIN 45 until guarantees are issued or modified in future periods, at which time their results will be initially reported in the financial statements
4. Acquisitions
Oil and gas
On January 22, 2003, we acquired a 25 percent non-operated working interest in properties located in a producing field in south Texas. Proved reserves of 31.8 billion cubic feet equivalent of (unaudited) were acquired in a cash transaction with a private investor group for $32.5 million. The acquisition, which was effective January 1, 2003, was financed with the Company’s existing credit facility. Nine wells are currently producing and comprise approximately one-third of the total proved reserves acquired. As of January 22, 2003, daily production net to the Company was approximately 11.4 million cubic feet (MMcf) of natural gas and 570 barrels of oil, or 14.8 MMcf equivalents (unaudited). Additional wells are expected to be drilled over the next two to three years to fully develop the field.
On July 23, 2001, we acquired all of the outstanding stock of Synergy Oil & Gas, Inc., a Texas corporation. Synergy was a privately owned independent exploration and production company with operations primarily in the Texas onshore Gulf Coast and West Texas areas. Cash consideration for the stock was approximately $112 million, which was funded by advances under our revolving credit facility and available cash on hand. The total purchase price was allocated to the assets purchased and the liabilities assumed in the Synergy transaction based upon the fair values on the date of acquisition, as follows (in thousands):
Value of oil and gas properties acquired | $ | 157,120 |
| |
Net assets acquired, excluding oil and gas properties |
| 351 |
| |
Deferred income tax liability |
| (45,271 | ) | |
Cash paid, net of cash acquired | $ | 112,200 |
| |
Page 53
The following unaudited Pro Forma results of operations have been prepared as though the acquisition had been completed on January 1, 2000. The unaudited Pro Forma results of operations for the years ended December 31, 2001 and 2000 are as follows (in thousands, except share data):
2001 | 2000 | |||||
Revenues | $ | 114,629 | $ | 128,127 | ||
Net income | $ | 40,026 | $ | 33,773 | ||
Net income per share, diluted | $ | 4.50 | $ | 4.03 | ||
Coal Royalty and Land Management
In December 2002, the Partnership acquired two properties containing approximately 120 million tons of coal reserves from Peabody for 1,522,325 million common units, 1,240,833 million Class B common units (a combined common unit value of $57.0 million) and $72.5 million in cash. The acquisition includes approximately $6.1 million, or 293,700 Class B units, which are currently held in escrow pending certain title transfers. As a result of the units held in escrow, approximately five million tons of coal reserves and 293,700 Class B common units were not included in property, plant and equipment or partners’ capital, respectively, at December 31, 2002. The Class B common units will be converted to common units upon approval by the common unitholders. Approximately two-thirds of the reserves are located in New Mexico, which Peabody will continue to operate as a surface mining operation. Approximately one third of the acquired reserves are in northern West Virginia, which Peabody will also continue to operate. Each set of reserves is being leased back to Peabody for royalty rates which escalate annually over the life of the property’s production. As part of the transaction, Peabody will receive the right to share in cash distributed with respect to the general partner’s incentive distribution rights, if any, in exchange for additional properties Peabody may source to the Partnership in the future. The cash portion of the transaction was funded with long-term debt and $26.4 million in proceeds from the sale of U.S. Treasury notes. The acquired coal reserves had existing productive operations that have been included in the Partnership’s statements of income since the closing date.
In November 2002, the Partnership completed the acquisition of certain infrastructure-related equipment and other assets integral to mining on its Fork Creek property in West Virginia. The purchased assets included a 900-ton per hour coal preparation plant, a unit-train loading facility and a railroad-granted rebate on coal loaded through the facility. The Partnership acquired the assets from Pen Holdings, Inc. and its lessors for $5.1 million in cash, which was funded with the proceeds from the sale of U.S. Treasury notes, plus the assumption of approximately $2.4 million in reclamation liabilities and approximately $0.6 million of stream mitigation obligations. The Partnership is actively seeking a new lessee and, as is customary in its operations, intends to assign all reclamation liabilities to such lessee. These assets did not have existing productive operations.
In August 2002, the Partnership acquired the mineral rights to approximately 16 million tons of coal reserves (unaudited) located in West Virginia for $12.3 million. The acquisition, which was purchased from an independent private entity, was funded with the proceeds from the sale of U.S. Treasury notes. The acquired mineral rights had existing productive operations that have been included in the Partnership’s statements of income since the closing date.
In June 2001, the Partnership completed a $33.1 million acquisition from Pen Holdings, Inc., an unrelated third party. The acquisition contained 53 million tons of coal reserves in West Virginia (unaudited). Theproperty had existing productive operations that have been included in the Partnership’s statements of income since the closing date.
The factors used by the Partnership to determine the fair market value of acquisitions include, but are not limited to, discounted future net cash flows on a risked-adjusted basis, geographic location, quality of resources, potential marketability and financial condition of the lessees.
5. Investments and Dividend Income
In April 2001, we sold 3.3 million shares of the common stock of Norfolk Southern Corporation and other stocks which had been classified as available-for-sale. The Norfolk Southern Corporation shares were sold at an average price of $17.39 per share. Proceeds from the sales, net of commissions, totaled approximately $57.4 million. We recorded a pre-tax gain on the stock sale transactions of approximately $54.7 million.
Dividend income from our investment in Norfolk Southern Corporation was $0.2 million for the year ended December 31, 2001 and $2.6 million for the year ended December 31, 2000.
Page 54
6. Notes Receivable
At December 31, 2002, we had one note receivable outstanding, which relates to the sale of coal properties located in Virginia in 1986. The note has a stated interest rate of 6.0 percent per annum and had an original principal amount of $15.0 million pursuant to which we receive quarterly payments through July 1, 2005. In addition, we own a 50 percent residual interest in any royalty income generated from the coal properties sold which are mined after July 1, 2005.
At December 31, 2001, we had an additional note relating to the sale of property and equipment in 1999 for which we received a $1.3 million note for a portion of the proceeds. This note was repaid in full in 2002.
Our note receivable is collateralized by property and equipment. Maturities of notes receivable are as follows (in thousands):
December 31, | ||||||
2002 | 2001 | |||||
Current | $ | 527 | $ | 599 | ||
Due after one year through five years |
| 1,274 |
| 1,757 | ||
Total | $ | 1,801 | $ | 2,356 | ||
7. Property and Equipment
Property and equipment includes (in thousands):
December 31, | ||||||||
2002 | 2001 | |||||||
Oil and gas properties | ||||||||
Unproved | $ | 57,575 |
| $ | 57,813 |
| ||
Proved |
| 325,785 |
|
| 277,681 |
| ||
Total oil and gas properties |
| 383,360 |
|
| 335,494 |
| ||
Other property and equipment: | ||||||||
Land and timber |
| 1,979 |
|
| 1,961 |
| ||
Coal properties |
| 244,702 |
|
| 106,270 |
| ||
Other equipment |
| 18,499 |
|
| 9,558 |
| ||
Total property and equipment |
| 648,540 |
|
| 453,283 |
| ||
Less: Accumulated depreciation, depletion and amortization |
| (102,588 | ) |
| (72,095 | ) | ||
Net property and equipment | $ | 545,952 |
| $ | 381,188 |
| ||
8. Impairment of Oil and Gas Properties
In accordance with SFAS No. 144,Accounting for the Impairment of Disposal or Long-Lived Assets,we review oil and gas properties for impairment when events and circumstances indicate a decline in the recoverability of the carrying value of such properties, such as a downward revision of the reserve estimates. We estimate the future cash flows expected in connection with the properties and compare such future cash flows to the carrying amount of the properties to determine if the carrying amount is recoverable. When we find that the carrying amounts of the properties exceed their estimated undiscounted future cash flows, we adjust the carrying amount of the properties to their fair value as determined by discounting its estimated future cash flows. For the twelve months ended December 31, 2002, we recognized a pretax charge of $0.8 million ($0.5 million after tax) related to the impairment of such properties. The factors used to determine fair value included, but were not limited to, estimates of proved reserves, future commodity prices, and timing of future production, future capital expenditures and a discount rate commensurate with the risk-free interest rate reflective of the lives remaining for the respective oil and gas properties.
Due to a low commodity price environment at the end of 2001, we recognized a non-cash pre-tax charge of $33.6 million ($21.8 million after tax) related to the impairment of oil and gas properties in the fourth quarter of 2001. There were no impairments of oil and gas properties in 2000.
Page 55
9. Price Risk Management Activities
From time to time, we enter into derivative financial instruments to mitigate our exposure to natural gas and crude oil price volatility. The derivative financial instruments, which are placed with major financial institutions that we believe are minimum credit risks, take the form of costless collars and swaps. All derivative financial instruments are recognized in the financial statements at fair value in accordance with SFAS No. 133, as amended by SFAS No. 137 and SFAS No. 138.
All derivative instruments are recorded on the balance sheet at fair value. See Note 9. Hedging Activities. If the derivative does not qualify as a hedge or is not designated as a hedge, the gain or loss on the derivative is recognized currently in earnings. To qualify for hedge accounting, the derivative must qualify either as a fair value hedge, cash flow hedge or foreign currency hedge. Currently, we are utilizing only cash flow hedges and the remaining discussion will relate exclusively to this type of derivative instrument. All hedge transactions are subject to our risk management policy, which has been reviewed and approved by theour Board of Directors.
We formally document all relationships between hedging instruments and hedged items, as well as itsthe risk-management objective and strategy for undertaking various hedge transactions. This process includes linking all derivatives that are designated as cash flow hedges to forecasted transactions. We also formally assess, both at inception of the hedge and on an ongoing basis, whether the derivatives that are used in hedging transactions are highly effective in offsetting changes in cash flows of hedged transactions. We measure hedge effectiveness on a period basis. When it is determined that a derivative is not highly effective as a hedge, or that it has ceased to be a highly effective, hedge, we discontinue hedge accounting prospectively.
When hedge accounting is discontinued because it is probable that a forecasted transaction will not occur, the derivative will continue to be carried on the balance sheet at its fair value, and gains and losses that were accumulated in other comprehensive income will be recognized in earnings immediately. In all other situations in which hedge accounting is discontinued, the derivative will be carried at its fair value on the balance sheet, with changes in its fair value recognized in earnings prospectively.
Gains and losses on hedging instruments when settled are included in natural gas or crude oil production revenues in the period that the related production is delivered.
The fair values of our hedging instruments are determined based on third party forward price quotes for NYMEX Henry Hub gas and West Texas Intermediate crude oil closing prices.
Income Tax
We account for income taxes in accordance with the provisions of Statement of Financial Accounting Standards (“SFAS”) No. 109,Accounting for Income Taxes. This Statement requires a company to recognize deferred tax liabilities and assets for the expected future tax consequences of events that have been recognized in a company’s financial statements or tax returns. Using this method, deferred tax liabilities and assets are determined based on the difference between the financial statement carrying amounts and tax bases of assets and liabilities using enacted tax rates.
Stock-based Compensation
We have stock compensation plans that allow, among other grants, incentive and nonqualified stock options to be granted to key employees and officers and nonqualified stock options to be granted to directors. See
61
PENN VIRGINIA CORPORATION AND SUBSIDIARIES
NOTES TO CONSOLIDATED FINANCIAL STATEMENTS—(Continued)
Note 18. Stock Compensation and Stock Ownership Plans. We account for those plans under the recognition and measurement principles of APB Opinion No. 25,Accounting for Stock Issued to Employees, and related Interpretations. No stock-based employee compensation cost related to stock options is reflected in net income, as all options granted under those plans had an exercise price equal to the market value of the underlying common stock on the date of grant. The following table illustrates the effect on net income and earnings per share if we had applied the fair value recognition provision of SFAS No. 123,Accounting for Stock-Based Compensation, to stock-based employee options.
| Year ended December 31, | ||||||||||||
| 2003 | 2002 | 2001 | ||||||||||
Net income, as reported | $ | 28,522 | $ | 12,104 | $ | 34,337 | ||||||
Add: Stock-based employee compensation expense included in reported net income related to restricted units and director compensation, net of related tax effects | 332 | 424 | 215 | |||||||||
Less: Total stock-based employee compensation expense determined under fair value based method for all awards, net of related tax effects | (1,119 | ) | (1,268 | ) | (900 | ) | ||||||
Pro forma net income | $ | 27,735 | $ | 11,260 | $ | 33,652 | ||||||
Earnings per share | ||||||||||||
Basic—as reported | $ | 3.17 | $ | 1.35 | $ | 3.92 | ||||||
Basic—pro forma | $ | 3.09 | $ | 1.26 | $ | 3.84 | ||||||
Diluted—as reported | $ | 3.15 | $ | 1.34 | $ | 3.86 | ||||||
Diluted—pro forma | $ | 3.06 | $ | 1.25 | $ | 3.78 | ||||||
New Accounting Standards
In June 2001, the Financial Accounting Standards Board (“FASB”) issued SFAS No. 143, “Accounting for Asset Retirement Obligations”. This statement addresses financial accounting and reporting for obligations associated with the retirement of tangible long-lived assets and the associated asset retirement costs. This statement requires that the fair value of a liability for an asset retirement obligation be recognized in the period in which it is incurred. The associated asset retirement costs are capitalized as part of the carrying cost of the asset. We adopted SFAS No. 143 on January 1, 2003 and recognized, and recorded an asset of $1.3 million, a related liability of $2.7 million and a cumulative effect on change in accounting principle on prior years of $1.4 million (net of taxes of $0.7 million). During 2003, the company recognized a net $0.7 million of additions to the liability and a net $0.6 million of additions to the asset cost basis as a result of adopting SFAS No. 143.
In November 2002, the FASB issued Interpretation No. 45 ( FIN 45), “Guarantor’s Accounting and Disclosure Requirements for Guarantees, Including Indirect Guarantees of the Indebtedness of Others”, which clarifies the requirements of SFAS No. 5, “Accounting for Contingencies,” relating to a guarantor’s accounting for and disclosure of certain guarantees issued. FIN 45 requires enhanced disclosures for certain guarantees. It also will require certain guarantees that are issued or modified after December 31, 2002, including certain third-party guarantees, to be initially recorded on the balance sheet at fair value. For guarantees issued on or before December 31, 2002, liabilities are recorded when and if payments become probable and estimable. The financial statement recognition provisions are effective prospectively. The Company has no outstanding guarantees that meet the recognition requirements of FIN 45 as of December 31, 2003.
In December 2003, the FASB issued FASB Interpretation No. 46 (revised December 2003) (“FIN 46R), “Consolidation of Variable Interest Entities” replacing FASB Interpretation No. 46 (“FIN 46”), “Consolidation of
62
PENN VIRGINIA CORPORATION AND SUBSIDIARIES
NOTES TO CONSOLIDATED FINANCIAL STATEMENTS—(Continued)
Variable Interest Entities, an interpretation of ARB No. 51” issued in January 2003. FIN 46R was issued to replace FIN 46 and to provide clarification of key terms, additional exemptions for application and an extended initial application period. FIN 46R requires certain variable interest entities to be consolidated by the primary beneficiary of the entity if the equity investors in the entity do not have the characteristics of a controlling financial interest or do not have sufficient equity at risk for the entity to finance its activities without additional subordinated financial support from other parties. FIN 46 was effective for all variable interest entities created or acquired after January 31, 2003. For variable interest entities created or acquired prior to February 1, 2003, the provisions of FIN 46 was required to be applied for the first interim or annual period beginning after June 15, 2003. We are required to adopt FIN 46R no later than the end of the first reporting period ending after March 15, 2003, which is March 31, 2003. We do not expect the initial adoption of FIN 46R to have a material effect on our financial position, results of operations or cash flow.
A reporting issue has arisen regarding the application of certain provisions of SFAS No. 141, “Business Combinations” and SFAS No. 142, “Goodwill and Other Intangible Assets” to companies in the extractive industries, including oil and gas and coal industry companies. The issue is whether SFAS No. 142 requires registrants to classify the costs of mineral rights as intangible assets in the balance sheet, apart from other capitalized oil and gas property and coal property costs, and provide specific footnote disclosures. The Emerging Issues Task Force has added the treatment of oil and gas and coal mineral rights to an upcoming agenda, which may result in a change in how we are currently classifying these assets.
Oil and Gas Mineral Rights.Historically, we have included the costs of mineral rights associated with extracting oil and gas as a component of oil and gas properties under SFAS No. 19 “Financial Accounting and Reporting by Oil and Gas Producing Companies”. If it is ultimately determined that SFAS No. 142 requires oil and gas companies to classify costs of mineral rights associated with extracting oil and gas as a separate intangible assets line item on the balance sheet, we would be required to reclassify approximately $157 million and $136 million as of December 31, 2003 and December 31, 2002, respectively, out of oil and gas properties and into a separate line item for intangible assets. Our cash flows and results of operations would not be affected since such intangible assets would continue to be depleted and assessed for impairment in accordance with successful efforts accounting rules. Further, we do not believe the classification of the costs of mineral rights associated with extracting oil and gas as intangible assets would have any impact on our compliance with covenants under our debt agreements.
Coal Mineral Rights.Historically, we have included both owned and leased mineral interests of PVR as a component of property and equipment on the balance sheet. However, based on the application of certain provisions of SFAS No. 141 and SFAS No. 142 to the coal industry, we have begun to classify costs associated with PVR’s leasing of coal reserves after June 30, 2001 as an intangible asset on the balance sheet, apart from other capitalized property costs. As of December 31, 2003, coal mineral rights of $4.9 million are included in other assets on the accompanying balance sheet. The transition provisions of SFAS No. 141 and SFAS No. 142 only require the reclassification of rights which were acquired after the June 30, 2001 unless previously maintained records make it possible to reclassify rights acquired prior to that date. Prior to June 30, 2001, the Partnership did not separately allocate acquisition costs between owned coal mineral interests (tangible property) and leased coal mineral rights (intangible property), as such interests were part of the same coal seams. Accordingly, we have only classified coal mineral rights acquired after June 30, 2001 as an intangible asset and report them in Other assets in the accompanying consolidated balance sheet.
In May 2003, the FASB issued SFAS No. 150 “Accounting for Certain Financial Instruments with Characteristics of both Liabilities and Equity.” SFAS No. 150 establishes standards on how companies classify and measure certain financial instruments with characteristics of both liabilities and equity. The statement
63
PENN VIRGINIA CORPORATION AND SUBSIDIARIES
NOTES TO CONSOLIDATED FINANCIAL STATEMENTS—(Continued)
requires that we classify as liabilities the fair value of all mandatorily redeemable financial instruments that had previously been recorded as equity or elsewhere in the consolidated financial statements. This statement is effective for financial instruments entered into or modified after May 31, 2003, and otherwise effective for all existing financial instruments beginning in the third quarter of 2003. The initial adoption of this Statement did not have a material effect on the financial position, results of operations or liquidity of the Company. The Company has no outstanding guarantees as of December 31, 2003.
In December 2003, the FASB issued SFAS No. 132 (revised 2003), “Employers’ Disclosures about Pensions and Other Postretirement Benefits” to enhance the disclosures about pension plans and other postretirement benefit plans. The Statement retains the disclosures required by the original SFAS No. 132. Additional disclosures have been added to those disclosures including information describing the types of plan assets, investment strategy, measurement date(s), plan obligations, cash flows, and components of net periodic benefit costs recognized during interim periods. The provisions of this Statement are effective for financial statements with fiscal years ending after December 15, 2003. The interim-period disclosures required by this Statement are effective for interim periods beginning after December 15, 2003. We have included the required additional disclosures of the revised Statement in the financial statements. See Note 15. Pension Plans and Other Post-retirement Benefits.
On December 8, 2003, a new law was enacted which expands Medicare, primarily adding a prescription drug benefit for Medicare-eligible retirees starting in 2006. We anticipate that the benefits we pay after 2006 could be lower as a result of the new Medicare provisions; however, at this time the retiree medical obligations and costs reported do not reflect any changes as a result of this legislation. Deferring the recognition of the new Medicare provisions’ impact is permitted by FASB Staff Position 106-1, “Accounting and Disclosure Requirements Related to the Medicare Prescription Drug, Improvement and Modernization Act of 2003”, due to open questions about some of the new Medicare provisions and a lack of authoritative accounting guidance about certain matters. The final accounting guidance could require changes to previously reported information. We do not believe that this regulation will have a material adverse effect on our financial position, results of operations or cash flows.
4. Acquisitions
Oil and gas
On January 22, 2003, we acquired a 25 percent non-operating working interest in properties located in a producing field in south Texas (“the south Texas acquisition”). The properties were acquired in a cash transaction with a private investor group for $33.5 million. The acquisition, which was effective December 31, 2002, was financed with the Company’s existing credit facility. Nine producing wells were acquired at the time of the acquisition. Ten successful development wells and one development dry hole have been drilled in the field since the acquisition date. Additional wells are expected to be drilled over the next two to three years to fully develop the field.
64
PENN VIRGINIA CORPORATION AND SUBSIDIARIES
NOTES TO CONSOLIDATED FINANCIAL STATEMENTS—(Continued)
On July 23, 2001, we acquired all of the outstanding stock of Synergy Oil & Gas, Inc., a Texas corporation. Synergy was a privately owned independent exploration and production company with operations primarily in the Texas onshore Gulf Coast and West Texas areas. Cash consideration for the stock was approximately $112 million, which was funded by advances under our revolving credit facility and available cash on hand. The total purchase price was allocated to the assets purchased and the liabilities assumed in the Synergy transaction based upon the fair values on the date of acquisition, as follows (in thousands):
Value of oil and gas properties acquired | $ | 157,120 | ||
Net assets acquired, excluding oil and gas properties | 351 | |||
Deferred income tax liability | (45,271 | ) | ||
Cash paid, net of cash acquired | $ | 112,200 | ||
The following unaudited Pro Forma results of operations have been prepared as though the acquisition had been completed on January 1, 2001. The unaudited Pro Forma results of operations for the years ended December 31, 2001 are as follows (in thousands, except share data):
| 2001 | |||
Revenues | $ | 114,629 | |
Net income | $ | 40,026 | |
Net income per share, diluted | $ | 4.50 | |
Coal Royalty and Land Management
In December 2002, the Partnership acquired two properties containing approximately 120 million tons of coal reserves (unaudited) from Peabody for 1,522,325 million common units, 1,240,833 million Class B common units (a combined common unit value of $57.0 million) and $72.5 million in cash plus closing costs. The $130.5 million acquisition included approximately $6.1 million, or 293,700 Class B units, held in escrow pending certain title transfers at December 31, 2002. As a result of the units held in escrow, approximately five million tons of coal reserves (unaudited) and 293,700 common units were not included in property, plant and equipment or partners’ capital, respectively, at December 31, 2002. In July 2003, 241,000 Class B common units were released from escrow in exchange for certain title transfers in New Mexico. In July 2003, all of the class B common units were converted, in accordance with their terms, upon the approval of our common unitholders. As of December 31, 2003, 52,700 common units remained in escrow pending Peabody acquiring and transferring to us certain of the West Virginia reserves we purchased. As a result of the units held in escrow, approximately one million tons of coal reserves and 52,700 common units were not included in property, plant and equipment or partners’ capital, respectively, at December 31, 2003. Approximately two-thirds of the reserves are located on the Lee Ranch property in New Mexico, which Peabody continues to operate as a surface mining operation. Approximately one third of the acquired reserves are in northern West Virginia, which Peabody also continues to operate. Each set of reserves are being leased back to Peabody for royalty rates which escalate annually over the life of the property’s production. As part of the transaction, Peabody will receive the right to share in the general partner’s Incentive Distribution Rights, if any, in exchange for additional properties Peabody may source to the Partnership in the future. The cash portion of the transaction was funded with long-term debt and $26.4 million in proceeds from the sale of U.S. Treasury notes. The acquired coal reserves had existing productive operations that have been included in the Partnership’s statements of income since the closing date.
In November 2002, the Partnership completed the acquisition of certain infrastructure-related equipment and other assets integral to mining on one of our West Virginia properties. The purchased assets included a 900-
65
PENN VIRGINIA CORPORATION AND SUBSIDIARIES
NOTES TO CONSOLIDATED FINANCIAL STATEMENTS—(Continued)
ton per hour coal preparation plant, a unit-train loading facility and a railroad-granted rebate on coal loaded through the facility. The Partnership acquired the assets from Pen Holdings, Inc. and its lessors for $5.1 million in cash, which was funded with the proceeds from the sale of U.S. Treasury notes, plus the assumption of approximately $2.4 million in reclamation liabilities and approximately $0.6 million of stream mitigation obligations. These assets did not have existing productive operations at the time of acquisition. In 2003, the Partnership leased the property and related infrastructure to a third party who is actively operating on the property. Consequently, all of the reclamation and stream mitigation liabilities were assigned to the new lessee.
In August 2002, the Partnership acquired the coal mineral interests to approximately 16 million tons of coal reserves located in West Virginia for $12.3 million. The acquisition, which was purchased from an independent private entity, was funded with the proceeds from the sale of U.S. Treasury notes. The acquired coal mineral interests had existing productive operations that have been included in the Partnership’s statements of income as of the closing date.
The factors used by the Partnership to determine the fair market value of acquisitions include, but are not limited to, discounted future net cash flows on a risked-adjusted basis, geographic location, quality of resources, potential marketability and financial condition of the lessees.
5. Investments and Dividend Income
In April 2001, we sold 3.3 million shares of the common stock of Norfolk Southern Corporation and other stocks which had been classified as available-for-sale. The Norfolk Southern Corporation shares were sold at an average price of $17.39 per share. Proceeds from the sales, net of commissions, totaled approximately $57.4 million. We recorded a pre-tax gain on the stock sale transactions of approximately $54.7 million.
Dividend income from our investment in Norfolk Southern Corporation was approximately $0.2 million for the year ended December 31, 2001.
6. Notes Receivable
At December 31, 2003 and 2002, the Partnership had one note receivable outstanding, which relates to the sale of coal properties located in Virginia in 1986. The note has a stated interest rate of 6.0 percent per annum and had an original principal amount of $15.0 million pursuant to which we receive quarterly payments through July 1, 2005. In addition, the Partnership owns a 50 percent residual interest in any royalty income generated from the coal properties sold which are mined after July 1, 2005.
The note receivable is collateralized by property and equipment. Maturities of notes receivable are as follows (in thousands):
| December 31, | ||||||
| 2003 | 2002 | |||||
Current | $ | 767 | $ | 527 | ||
Due after one year through July 1, 2005 | 504 | 1,274 | ||||
Total | $ | 1,271 | $ | 1,801 | ||
66
PENN VIRGINIA CORPORATION AND SUBSIDIARIES
NOTES TO CONSOLIDATED FINANCIAL STATEMENTS—(Continued)
7. Property and Equipment
Property and equipment includes (in thousands):
| December 31, | ||||||
| 2003 | 2002 | |||||
Oil and gas properties | ||||||
Proved | $ | 443,248 | $ | 325,785 | ||
Unproved | 60,042 | 57,575 | ||||
Total oil and gas properties | 503,290 | 383,360 | ||||
Other property and equipment: | ||||||
Coal mineral interest | 244,881 | 244,702 | ||||
Other equipment | 20,518 | 18,499 | ||||
Land and timber | 1,979 | 1,979 | ||||
Total property and equipment | 770,668 | 648,540 | ||||
Less: Accumulated depreciation, depletion and amortization | 149,734 | 102,588 | ||||
Net property and equipment | $ | 620,934 | $ | 545,952 | ||
8. Impairment of Oil and Gas Properties
In accordance with SFAS No. 144,Accounting for the Impairment of Disposal or Long-Lived Assets,we review oil and gas properties for impairment when events and circumstances indicate a decline in the recoverability of the carrying value of such properties, such as a downward revision of the reserve estimates or commodity prices. We estimate the future cash flows expected in connection with the properties and compare such future cash flows to the carrying amount of the properties to determine if the carrying amount is recoverable. When we find that the carrying amounts of the properties exceed their estimated undiscounted future cash flows, we adjust the carrying amount of the properties to their fair value as determined by discounting their estimated future cash flows. The factors used to determine fair value included, but were not limited to, estimates of proved reserves, future commodity prices, and timing of future production, future capital expenditures and a discount rate commensurate with the risk-free interest rate reflective of the lives remaining for the respective oil and gas properties.
For the year ended December 31, 2003, we recognized a pretax charge of $0.4 million ($0.2 million after tax) related to the impairment of certain south Texas properties. These impairments were a result of downward reserve revisions on these properties caused by the poor performance of these wells near the end of their productive lives.
Due to reserve revisions in 2002, we recognized a pretax charge of $0.8 million ($0.5 million after tax) related to the impairment of oil and gas properties for the year ended December 31, 2002.
Due to a low commodity price environment at the end of 2001, we recognized a pre-tax charge of $33.6 million ($21.8 million after tax) related to the impairment of oil and gas properties in the fourth quarter of 2001.
67
9. Hedging Activities
Commodity Cash Flow Hedges
From time to time, we enter into derivative financial instruments to mitigate our exposure to natural gas and crude oil price volatility. The derivative financial instruments, which are placed with major financial institutions that we believe are minimum credit risks, take the form of costless collars and swaps. All derivative financial instruments are recognized in the financial statements at fair value in accordance with SFAS No. 133, as amended by SFAS No. 137, SFAS No. 138 and SFAS No. 149 and related interpretations.
All derivative instruments are recorded on the balance sheet at fair value. If the derivative does not qualify as a hedge or is not designated as a hedge, the gain or loss on the derivative is recognized currently in earnings. To qualify for hedge accounting, the derivative must qualify either as a fair value hedge, cash flow hedge or foreign currency hedge. Currently, we utilize only cash flow hedges and the remaining discussion relates exclusively to this type of derivative instrument. All hedge transactions are subject to our risk management policy, which has been reviewed and approved by our Board of Directors.
We formally document all relationships between hedging instruments and hedged items, as well as the risk-management objective and strategy for undertaking various hedge transactions. This process includes linking all derivatives that are designated as cash flow hedges to forecasted transactions. We also formally assess, both at inception of the hedge and on an ongoing basis, whether the derivatives that are used in hedging transactions are highly effective in offsetting changes in cash flows of hedged transactions. We measure hedge effectiveness on a period basis. When it is determined that a derivative is not highly effective as a hedge, or that it has ceased to be highly effective, we discontinue hedge accounting prospectively.
When hedge accounting is discontinued because it is probable that a forecasted transaction will not occur, the derivative will continue to be carried on the balance sheet at its fair value, and gains and losses that were accumulated in other comprehensive income will be recognized in earnings immediately. In all other situations in which hedge accounting is discontinued, the derivative will be carried at its fair value on the balance sheet, with changes in its fair value recognized in earnings prospectively.
Gains and losses on hedging instruments when settled are included in natural gas or crude oil production revenues in the period that the related production is delivered.
68
PENN VIRGINIA CORPORATION AND SUBSIDIARIES
NOTES TO CONSOLIDATED FINANCIAL STATEMENTS—(Continued)
The fair values of our hedging instruments are determined based on third party forward price quotes for NYMEX Henry Hub gas and West Texas Intermediate crude oil closing prices as of December 31, 2002.2003. The following table sets forth our positions as of December 31, 2002:2003:
Notional | |||||||||||
Time Period | Quantities | Effective Floor/Ceiling Price | Fair Value | ||||||||
(in thousands) | |||||||||||
Natural Gas | (MMbtu per Day | ) |
| (Per Mmbtu | ) | ||||||
Costless collars | |||||||||||
January 1 – March 31, 2003 | 10,000 |
| $ | 3.01 / $5.01 |
| $ | (168 | ) | |||
January 1 – September 30, 2003 | 5,000 |
| $ | 3.37 / $5.05 |
|
| (240 | ) | |||
April 1 – October 31, 2003 | 5,000 |
| $ | 2.92 / $4.42 |
|
| (535 | ) | |||
October 2003 | 3,000 |
| $ | 3.50 / $5.00 |
|
| (32 | ) | |||
November 1, 2003 – April 30, 2004 | 8,000 |
| $ | 3.50 / $5.00 |
|
| (501 | ) | |||
April 1 2003 – June 30, 2004 | 7,500 |
| $ | 3.50 / $5.28 |
|
| (445 | ) | |||
Crude Oil | (Bbls per Day | ) | |||||||||
Costless collars | |||||||||||
January 1 – June 30, 2003 | 500 |
| $ | 23.00 /$28.75 |
|
| (144 | ) | |||
Total | $ | (2,065 | ) | ||||||||
Time Period | Notional Quantities | Effective Floor /Ceiling Price | Swap Price | Fair Value | |||||||
| (in thousands) | |||||||||||
| (MMbtu per Day) | ($ per MMbtu) | ($ per MMbtu) | |||||||||
Natural Gas | |||||||||||
Costless collars | |||||||||||
January 1 – April 30, 2004 | 8,000 | $3.50 / $5.00 | $ | (701 | ) | ||||||
January 1 – June 30, 2004 | 7,500 | $3.50 / $5.28 | (660 | ) | |||||||
January 1 – July 31, 2004 | 4,000 | $3.72 / $6.97 | (69 | ) | |||||||
January 1 – December 31, 2004 | 3,000 / 6,000 | $4.50 / $6.95 | 77 | ||||||||
May 1 – November 30, 2004 | 6,500 | $4.00 / $6.87 | (1 | ) | |||||||
July 1 – October 31, 2004 | 7,000 | $4.00 / $5.24 | (345 | ) | |||||||
August 1 – October 31, 2004 | 4,000 | $4.00 / $5.25 | (151 | ) | |||||||
November 1, 2004 – January 31, 2005 | 5,000 / 11,500 / 11,000 | $4.00 / $6.82 | (156 | ) | |||||||
November 1, 2004 – April 30, 2005 | 2,000 / 14,000 | $4.00 / $6.40 | (317 | ) | |||||||
Swaps | |||||||||||
January 1 2004 – January 31, 2005 | 1,900 / 1,100 | $ | 4.70 | (367 | ) | ||||||
| (Bbls per Day) | ($ per barrel) | ||||||||||
Crude Oil | |||||||||||
Swaps | |||||||||||
January 1, 2004 – January 31, 2005 | 90 to 50 | $ | 26.93 | (91 | ) | ||||||
January 1, 2004 – June 30, 2004 | 120 | $ | 26.58 | (104 | ) | ||||||
Total | $ | (2,885 | ) | ||||||||
Based upon our assessment of our derivative contracts designated as cash flow hedges at December 31, 2002,2003, we reported (i) an approximatea hedging liability of $2.1approximately $3.0 million, a hedging asset of approximately $0.1 million and (ii) a loss in accumulated other comprehensive income of $1.3$1.9 million, net of a related income taxestax benefit of $0.8$1.0 million. In connection with monthly settlements, we recognized net hedging losses in natural gas and oil revenues of $1.0$6.1 million for the year ended December 31, 2002.2003. Based upon future oil and natural gas prices as of December 31, 2002, $1.62003, $2.6 million of hedging losses are expected to be realized within the next 12 months. The amounts ultimately realized will vary due to changes in the fair value of the open derivative contracts prior to settlement. We recognized net hedging losses of $1.1 million and net hedging gains of $1.9 million for the yearyears ended December 31, 2001. We had no outstanding derivative financial instruments at December 31, 2000.2002 and 2001, respectively.
Page 5669
PENN VIRGINIA CORPORATION AND SUBSIDIARIES
NOTES TO CONSOLIDATED FINANCIAL STATEMENTS—(Continued)
As of February 14, 200316, 2004 our open commodity price risk managementhedge positions on average daily volumes were as follows:
Natural gas hedging positions | Costless Collars | Swaps | |||||||||||
MMBtu | Price / MMBtu (a) | MMBtu | Price | ||||||||||
Per Day | Floor | Ceiling | Per Day | /MMBtu | |||||||||
First Quarter 2003 | 15,000 | $ | 3.15 | $ | 5.05 | 3,164 | $ | 4.70 | |||||
Second Quarter 2003 | 21,500 | $ | 3.39 | $ | 5.36 | 3,399 | $ | 4.70 | |||||
Third Quarter 2003 | 21,500 | $ | 3.39 | $ | 5.36 | 2,570 | $ | 4.70 | |||||
Fourth Quarter 2003 | 19,500 | $ | 3.49 | $ | 5.46 | 2,034 | $ | 4.70 | |||||
First Quarter 2004 | 19,500 | $ | 3.54 | $ | 5.51 | 1,800 | $ | 4.70 | |||||
Second Quarter 2004 | 14,137 | $ | 3.56 | $ | 5.70 | 1,533 | $ | 4.70 | |||||
Third Quarter 2004 | 1,348 | $ | 3.72 | $ | 6.97 | 1,367 | $ | 4.70 | |||||
Fourth Quarter 2004 | — | $ | — | $ | — | 1,234 | $ | 4.70 | |||||
First Quarter 2005 (January) | — | $ | — | $ | — | 1,100 | $ | 4.70 | |||||
Natural gas hedging positions
| Costless Collars | Swaps | ||||||||||||
Average MMbtu Per Day | Average Price / MMbtu (a) | Average MMbtu Per Day | Average Price /MMbtu | ||||||||||
| Floor | Ceiling | ||||||||||||
First Quarter 2004 | 22,500 | $ | 3.67 | $ | 5.70 | 1,800 | $ | 4.70 | |||||
Second Quarter 2004 | 21,495 | $ | 3.78 | $ | 6.11 | 1,533 | $ | 4.70 | |||||
Third Quarter 2004 | 20,500 | $ | 4.05 | $ | 6.12 | 1,367 | $ | 4.70 | |||||
Fourth Quarter 2004 | 19,837 | $ | 4.13 | $ | 6.54 | 1,234 | $ | 4.70 | |||||
First Quarter 2005 | 13,656 | $ | 4.00 | $ | 6.52 | 379 | $ | 4.70 | |||||
Second Quarter 2005 (April only) | 14,000 | $ | 4.00 | $ | 6.40 | — | $ | — | |||||
| (a) | The costless collar natural gas prices per |
Crude oil hedging positions | Costless Collars | Swaps | |||||||||||
Barrels | Price /Barrel | Barrels | Price | ||||||||||
Per Day | Floor | Ceiling | Per Day | /Barrel | |||||||||
First Quarter 2003 | 500 | $ | 23.00 | $ | 28.75 | 150 | $ | 26.93 | |||||
Second Quarter 2003 | 500 | $ | 23.00 | $ | 28.75 | 170 | $ | 26.93 | |||||
Third Quarter 2003 | — | $ | — | $ | — | 250 | $ | 26.76 | |||||
Fourth Quarter 2003 | — | $ | — | $ | — | 220 | $ | 26.74 | |||||
First Quarter 2004 | — | $ | — | $ | — | 207 | $ | 26.73 | |||||
Second Quarter 2004 | — | $ | — | $ | — | 193 | $ | 26.71 | |||||
Third Quarter 2004 | — | $ | — | $ | — | 63 | $ | 26.93 | |||||
Fourth Quarter 2004 | — | $ | — | $ | — | 57 | $ | 26.93 | |||||
First Quarter 2005 (January) | — | $ | — | $ | — | 50 | $ | 26.93 | |||||
Crude oil hedging positions
| Swaps | |||||
| Average Barrels Per Day | Average Price / Barrel | ||||
First Quarter 2004 | 404 | $ | 28.62 | ||
Second Quarter 2004 | 493 | $ | 29.07 | ||
Third Quarter 2004 | 413 | $ | 30.03 | ||
Fourth Quarter 2004 | 407 | $ | 30.08 | ||
First Quarter 2005 (January only) | 400 | $ | 30.13 | ||
Interest Rate Swap
In March 2003, PVR entered into an interest rate swap agreement with a notional amount of $30 million to hedge a portion of the fair value of its 5.77 percent senior unsecured notes which mature over a ten year period. This swap is designated as a fair value hedge and has been reflected as a decrease of long-term debt of approximately $0.7 million as of December 31, 2003, with a corresponding increase in long-term hedging liabilities. Under the terms of the interest rate swap agreement, the counterparty pays PVR a fixed annual rate of 5.77 percent on a total notional amount of $30 million, and PVR pays the counterparty a variable rate equal to the floating interest rate which will be determined semi-annually and will be based on the six month London Interbank Offering Rate (“LIBOR”) plus 2.36 percent. See Note 13. Long-Term Debt for a description of the underlying debt instrument to which the interest rate swap applies.
70
PENN VIRGINIA CORPORATION AND SUBSIDIARIES
NOTES TO CONSOLIDATED FINANCIAL STATEMENTS—(Continued)
10. Accrued Liabilities
Accrued expenses are summarized as follows (in thousands):
December 31, | ||||||||||||
2002 | 2001 | December 31, | ||||||||||
| 2003 | 2002 | |||||||||||
Drilling costs | $ | 4,877 | $ | 1,481 | ||||||||
Royalties | 3,277 | 2,654 | ||||||||||
Production, payroll and franchise taxes | 2,850 | 2,834 | ||||||||||
Compensation | 2,659 | 2,286 | ||||||||||
Deferred income | $ | 2,829 | $ | — | 1,610 | 2,829 | ||||||
Taxes other than income |
| 2,809 |
| 2,700 | ||||||||
Accrued oil and gas royalties |
| 2,513 |
| 2,042 | ||||||||
Compensation |
| 2,286 |
| 1,949 | ||||||||
Accrued drilling costs |
| 1,481 |
| 1,641 | ||||||||
Accrued professional services |
| 2,328 |
| 53 | ||||||||
Interest | 1,382 | 164 | ||||||||||
Professional services | 598 | 2,594 | ||||||||||
Post-retirement healthcare |
| 160 |
| 160 | 160 | 160 | ||||||
Pension |
| 140 |
| 140 | 140 | 140 | ||||||
Other |
| 1,962 |
| 2,077 | 1,600 | 1,366 | ||||||
Total | $ | 16,508 | $ | 10,762 | $ | 19,153 | $ | 16,508 | ||||
11. Asset Retirement Obligation
Page 57Effective January 1, 2003, we adopted SFAS No. 143, “Accounting for Asset Retirement Obligations” (SFAS No. 143), which addresses financial accounting and reporting for obligations associated with the retirement of tangible long-lived assets and the associated asset retirement costs. The Standard applies to legal obligations associated with the retirement of long-lived assets that result from the acquisition, construction, development or normal use of assets.
The fair value of a liability for an asset retirement obligation is recognized in the period in which it is incurred if a reasonable estimate of fair value can be made. The fair value of the liability is also added to the carrying amount of the associated asset and is depreciated over the life of the asset. The liability is accreted at the end of each period through charges to accretion expense, which are recorded as additional depreciation, depletion and amortization. If the obligation is settled for other than the carrying amount of the liability, we will recognize a gain or loss on settlement.
We identified all required asset retirement obligations and determined the fair value of these obligations on the date of adoption. The determination of fair value was based upon regional market and specific well or mine type information. In conjunction with the initial application of SFAS No. 143, we recorded a cumulative effect of change in accounting principle, net of taxes, of approximately $1.4 million as an increase to income. In addition, we recorded an asset retirement obligation of approximately $2.7 million. Below is a reconciliation of the beginning and ending aggregate carrying amount of our asset retirement obligations as of December 31, 2003 (in thousands).
Balance, January 1, 2003 | $ — | |||
Liability recorded upon initial adoption | 2,685 | |||
Liabilities incurred in the current period | 666 | |||
Liabilities settled in the current period | (120 | ) | ||
Accretion expense | 158 | |||
Balance, December 31, 2003 | $ | 3,389 | ||
71
11.PENN VIRGINIA CORPORATION AND SUBSIDIARIES
NOTES TO CONSOLIDATED FINANCIAL STATEMENTS—(Continued)
The following table summarizes the pro forma net income and earnings per share for the years ended December 31, 2003 and 2002 had the change in accounting been implemented on January 1:
| December 31, | ||||||
| 2002 | 2001 | |||||
Net income | ||||||
As reported | $ | 12,104 | $ | 34,337 | ||
Pro forma | $ | 12,185 | $ | 34,495 | ||
Net income per share—reported | ||||||
Basic | $ | 1.35 | $ | 3.92 | ||
Diluted | $ | 1.34 | $ | 3.86 | ||
Net income per share—pro forma | ||||||
Basic | $ | 1.36 | $ | 3.93 | ||
Diluted | $ | 1.35 | $ | 3.88 | ||
12. Other Liabilities
Other liabilities are summarized in the following table (in thousands):
| December 31, | ||||||
| 2003 | 2002 | |||||
Deferred income | $ | 6,028 | $ | 2,488 | ||
Asset retirement obligation | 3,389 | 871 | ||||
Pension | 2,242 | 2,237 | ||||
Post-retirement health care | 2,102 | 2,129 | ||||
Reclamation environmental liabilities | 1,413 | 4,478 | ||||
Other | 14 | 27 | ||||
Total | $ | 15,188 | $ | 12,230 | ||
13. Long-Term Debt
Long-term debt as of December 31, 20022003 and 20012002 consisted of the following (in thousands):
December 31, | ||||||||||||||||
2002 | 2001 | December 31, | ||||||||||||||
Penn Virginia revolving credit facility, variable rate of 2.8% at December 31, 2002, due in 2004 | $ | 16,000 |
| $ | 3,500 |
| ||||||||||
PVR revolving credit facility, variable rate of 3.2% at December 31, 2002, due in 2004 |
| 47,500 |
|
| — |
| ||||||||||
PVR Term loan, variable rates of 1.9% to 2.7% at December 31, 2002, due in 2004 |
| 43,387 |
|
| 43,387 |
| ||||||||||
| 2003 | 2002 | |||||||||||||||
Penn Virginia revolving credit facility, variable rate of 2.4% at December 31, 2003, due in 2007 | $ | 64,000 | $ | 16,000 | ||||||||||||
PVR revolving credit facility, variable rate of 2.9% at December 31, 2003, due in 2006 | 2,500 | 47,500 | ||||||||||||||
PVR senior unsecured notes* | 89,286 | — | ||||||||||||||
PVR Term loan | — | 43,387 | ||||||||||||||
Line of credit |
| 52 |
|
| 1,235 |
| — | 52 | ||||||||
| 106,939 |
|
| 48,122 |
| 155,786 | 106,939 | |||||||||
Less: current maturities |
| (52 | ) |
| (1,235 | ) | (1,500 | ) | (52 | ) | ||||||
Total long-term debt | $ | 106,887 |
| $ | 46,887 |
| $ | 154,286 | $ | 106,887 | ||||||
| * | Includes negative fair value adjustment of $714 thousand related to interest rate swap designated as a fair value hedge. See Note 9. Hedging Activities. |
72
PENN VIRGINIA CORPORATION AND SUBSIDIARIES
The aggregate maturities applicable to outstanding debt at December 31, 2002 are $52 thousand in 2003 and $106.9 million in 2004.NOTES TO CONSOLIDATED FINANCIAL STATEMENTS—(Continued)
Penn Virginia Revolving Credit Facility
We haveIn December 2003, we entered into a $150.0$300 million secured revolving credit facility (the “Revolver”) with a group of major banks andled by Bank One NA, which has a borrowing base of $140$200 million whichand a $150 million initial commitment, and expires in October 2004.December 2007.
The Revolver is governed by a borrowing base calculation and will be redetermined semi-annually. We have the option to elect interest at (i) LIBOR plus a Eurodollar margin ranging from 1.3751.25 to 1.8752.00 percent, based on the percentage of the borrowing base outstanding or (ii) the greater of the prime rate or federal funds rate plus a margin ranging from 0.3750.30 to 0.8750.50 percent. The weighted average interest rate on borrowings incurred during the year ended December 31, 20022003 was approximately 3.02.91 percent. The Revolver allows for issuance of letters of credit that are limited to no more than $10$20 million. At December 31, 2002,2003, letters of credit issued were $0.3 million. The financial covenants require us to maintain levels of net worth, debt-to-earnings and dividend limitation restrictions. We are currently in compliance with all of our covenants.
Line of Credit
We have a $5 million line of credit with a financial institution effective through June 2004, renewable annually. We have an option to elect either a fixed rate LIBOR loan, floating rate LIBOR loan or base rate (as determined by the financial institution) loan. At December 31, 2003 we had no outstanding borrowings against the line of credit.
PVR Revolving Credit Facility
TheIn October 2003, the Partnership has a $50.0 million unsecuredentered into an amendment to its revolving credit facility (the “Partnership“PVR Revolver”) to increase the facility from $50 million to $100 million and to extend the maturity date to October 2006. The PVR Revolver is with a groupsyndicate of major banks, which expires in October 2004.financial institutions led by PNC Bank, National Association as its agent. The Partnership hasPVR Revolver is available for general partnership purposes, including working capital, capital expenditures and acquisitions, and includes a $5.0 million sublimit that is available for working capital needs and distributions and a $5.0 million sublimit for the issuance of letters of credit.
At the Partnership’s option, to electindebtedness under the PVR Revolver will bear interest at either (i) LIBORthe Eurodollar rate plus a Euro-ratean applicable margin rangingwhich ranges from 1.25 percent to 1.752.25 percent based on certain financial dataour ratio of consolidated indebtedness to consolidated EBITDA (as defined in the Revolver) for the four most recently completed fiscal quarters, or (ii) the greaterhigher of the prime rate or federal funds rate plus 0.5 percent.0.50 percent or the prime rate as announced by PNC Bank, National Association. The Partnership Revolver allows for working capital draws of no more than $5.0 million and issuance ofhad utilized letters of credit which are limited to $2 million. Atof $1.6 million as of December 31, 2002, letters of credit issued were $1.6 million.2003 and 2002. The financial covenants of the PartnershipPVR Revolver include, but are not limitedrequire PVR to maintaining: (i) a ratiomaintain levels of not more than 2.5:1.0 of total debt to consolidated EBITDA (as defined by the credit agreement) and (ii) a ratio of not less than 4.00:1.00 of consolidated EBITDA to interest. The financial covenants restricted PVR’s borrowing capacity under the PVR Revolver to approximately $17 million as of December 31, 2003. As of December 31, 2003, the Partnership is currentlywas in compliance with all of its covenants.
PVR Term Loansenior unsecured notes
In conjunctionMarch 2003, the Partnership closed a private placement of $90 million of senior unsecured notes (the “PVR Notes”). The PVR Notes bear interest at a fixed rate of 5.77 percent and mature over a ten year period ending in March 2013, with semi-annual interest payments through March 2004 followed by semi-annual principal and interest payments beginning in September 2004. Proceeds of the PVR Revolver, the Partnership borrowed an additional $43.4 million in the form of a term loan. The term loan expires in October 2004. The Partnership has the option to elect interest at (i) LIBOR plus a Euro-rate margin 0.5 percent, based on certain financial data or (ii) the greater of the prime rate or federal funds rate plus 0.5 percent. The term loan was originally secured with U.S. Treasuries, but is currently unsecured,Notes, after the Treasuriespayment of expenses related to the offering, were used to fundrepay and retire the Peabody Acquisition. $43.4 million PVR Term Loan and to repay the majority of debt outstanding on the PVR Revolver.
73
PENN VIRGINIA CORPORATION AND SUBSIDIARIES
NOTES TO CONSOLIDATED FINANCIAL STATEMENTS—(Continued)
The term loan is subjectPVR Notes contain various covenants similar to those contained in the same covenants asPVR Revolver. However, the Revolver. TheNotes do not limit the Partnership’s ability to incur additional indebtedness. As of December 31, 2003, the Partnership is currentlywas in compliance with all of itsthe covenants.
Line of CreditDebt Maturities
We have a $5 million lineAggregate maturities of credit with a financial institution due in March 2003, renewable annually. We have an option to elect either a fixed rate LIBOR loan, floating rate LIBOR loan or base rate (as determined by the financial institution) loan.principle amounts of long-term debt for the next five years and thereafter are as follows (in thousands):
2004 | $ | 1,500 | ||
2005 | 4,800 | |||
2006 | 10,800 | |||
2007 | 75,000 | |||
2008 | 12,700 | |||
Thereafter | 51,700 | |||
| $ | 156,500 | |||
Less: interest rate swap | (714 | ) | ||
Total debt, including current maturities | $ | 155,786 | ||
Anticipated PVR Refinancing
The Partnership is currently attempting to refinance up to $90 million of its credit facility borrowings with more permanent debt. This refinancing is expected to be completed by March 31, 2003. If the refinancing is not completed by March 31, 2002, PVR will be required to provide security for all borrowings against its credit facility and term loan.
Page 58
12.14. Income Taxes
The provision for income taxes from continuing operations is comprised of the following (in thousands):
| Year ended December 31, | |||||||||||
| 2003 | 2002 | 2001 | |||||||||
Current income taxes | |||||||||||
Federal | $ | 2,067 | $ | (320 | ) | $ | 21,160 | ||||
State | 1,007 | (878 | ) | 42 | |||||||
Total current | 3,074 | (1,198 | ) | 21,202 | |||||||
Deferred income taxes | |||||||||||
Federal | 12,090 | 5,236 | (3,167 | ) | |||||||
State | 3,202 | 2,897 | 1,279 | ||||||||
Total deferred | 15,292 | 8,133 | (1,888 | ) | |||||||
Total income tax expense | $ | 18,366 | $ | 6,935 | $ | 19,314 | |||||
Year ended December 31, | |||||||||||
| 2002 |
|
| 2001 |
|
| 2000 | ||||
Current income taxes | |||||||||||
Federal | $ | (320 | ) | $ | 21,160 |
| $ | 10,463 | |||
State |
| (878 | ) |
| 42 |
|
| 2,496 | |||
Total current |
| (1,198 | ) |
| 21,202 |
|
| 12,959 | |||
Deferred income taxes | |||||||||||
Federal |
| 5,236 |
|
| (3,167 | ) |
| 6,951 | |||
State |
| 2,897 |
|
| 1,279 |
|
| 55 | |||
Total deferred |
| 8,133 |
|
| (1,888 | ) |
| 7,006 | |||
Total income tax expense | $ | 6,935 |
| $ | 19,314 |
| $ | 19,965 | |||
74
PENN VIRGINIA CORPORATION AND SUBSIDIARIES
NOTES TO CONSOLIDATED FINANCIAL STATEMENTS—(Continued)
The difference between the taxes computed by applying the statutory tax rate to income from operations before income taxes and our reported income tax expense is as follows (in thousands):
Year ended December 31, | Year ended December 31, | |||||||||||||||||||||||||||||||||||||||||
2002 | 2001 | 2000 | 2003 | 2002 | 2001 | |||||||||||||||||||||||||||||||||||||
Computed at federal statutory tax rate | $ | 6,586 |
| 35.0 | % | $ | 18,777 |
| 35.0 | % | $ | 20,731 |
| 35.0 | % | $ | 15,933 | 35.0 | % | $ | 6,586 | 35.0 | % | $ | 18,777 | 35.0 | % | |||||||||||||||
State income taxes, net of federal income tax benefit |
| 1,312 |
| 7.0 | % |
| 859 |
| 1.6 | % |
| 1,658 |
| 2.8 | % | 2,611 | 5.7 | % | 1,312 | 7.0 | % | 859 | 1.6 | % | ||||||||||||||||||
Dividends received deduction |
| — |
| — |
|
| (49 | ) | (0.1 | %) |
| (648 | ) | (1.1 | %) | — | — | — | — | (49 | ) | (0.1 | )% | |||||||||||||||||||
Non-conventional fuel source credit |
| (926 | ) | (4.9 | %) |
| (721 | ) | (1.3 | %) |
| (1,570 | ) | (2.7 | %) | — | — | (926 | ) | (4.9 | )% | (721 | ) | (1.3 | )% | |||||||||||||||||
Other, net |
| (37 | ) | (0.2 | %) |
| 448 |
| 0.8 | % |
| (206 | ) | (0.3 | %) | (178 | ) | (0.4 | )% | (37 | ) | (0.2 | )% | 448 | 0.8 | % | ||||||||||||||||
Total Income tax expense | $ | 6,935 |
| 36.9 | % | $ | 19,314 |
| 36.0 | % | $ | 19,965 |
| 33.7 | % | |||||||||||||||||||||||||||
Total income tax expense | $ | 18,366 | 40.3 | % | $ | 6,935 | 36.9 | % | $ | 19,314 | 36.0 | % | ||||||||||||||||||||||||||||||
The principal components of our net deferred income tax liability are as follows (in thousands):
December 31, | ||||||||||||||
| December 31, | ||||||||||||||
| 2003 | 2002 | |||||||||||||
Deferred tax liabilities: | ||||||||||||||
Notes receivable | $ | 428 | $ | 668 | ||||||||||
Oil and gas properties | 81,927 | 66,092 | ||||||||||||
Other property and equipment | 859 | 635 | ||||||||||||
Total deferred tax liabilities | 83,214 | 67,395 | ||||||||||||
2002 | 2001 | |||||||||||||
Deferred tax assets: | ||||||||||||||
Pension and post-retirement benefits | $ | 1,826 |
| $ | 1,513 |
| 1,626 | 1,826 | ||||||
Deferred income – coal properties |
| 965 |
|
| 1,294 |
| ||||||||
Alternative minimum tax credits |
| — |
|
| 439 |
| ||||||||
Deferred income—coal properties | 564 | 965 | ||||||||||||
Net operating loss carryforwards |
| 1,392 |
|
| 1,154 |
| 2,057 | 1,392 | ||||||
Other |
| 1,058 |
|
| 74 |
| 1,104 | 1,058 | ||||||
Total deferred tax assets |
| 5,241 |
|
| 4,474 |
| 5,351 | 5,241 | ||||||
Deferred tax liabilities: | ||||||||||||||
Notes receivable |
| (668 | ) |
| (747 | ) | ||||||||
Investments |
| — |
|
| — |
| ||||||||
Oil and gas properties |
| (66,092 | ) |
| (56,675 | ) | ||||||||
Other property and equipment |
| (635 | ) |
| (2,108 | ) | ||||||||
Other |
| — |
|
| (805 | ) | ||||||||
Total deferred tax liabilities |
| (67,395 | ) |
| (60,335 | ) | ||||||||
Net deferred tax liability | $ | (62,154 | ) | $ | (55,861 | ) | $ | 77,863 | $ | 62,154 | ||||
As of December 31, 2002,2003, we have various net operating loss carryforwards for state tax purposes of approximately $27.7$39.1 million which, if unused, will expire from 20092004 to 2022.
Page 5975
PENN VIRGINIA CORPORATION AND SUBSIDIARIES
13.NOTES TO CONSOLIDATED FINANCIAL STATEMENTS—(Continued)
15. Pension Plans and Other Post-retirement Benefits
We provide early retirement programs for eligible employees. Benefits are recorded based on the employee’s average annual compensation and yearly services. We provided a noncontributory, defined benefit pension plan, which was frozen in 1996 and terminated in 2001.
We also sponsor a defined benefit post-retirement plan that covers employees hired prior to January 1, 1991 who retire from active service. The plan provides medical benefits for the retirees and dependents and life insurance for the retirees. The medical coverage is noncontributory for retirees who retired prior to January 1, 1991 and may be contributory for retirees who retired after December 31, 1990.
We use a December 31 measurement date for these plans.
A reconciliation of the changes in the benefit obligations and fair value of assets for the two years ended December 31, 20022003 and 20012002 and a statement of the funded status at December 31, 20022003 and 20012002 is as follows (in thousands):
Pension | Post-retirement Healthcare | Pension | Post-retirement Healthcare | |||||||||||||||||||||||||||||
2002 | 2001 | 2002 | 2001 | 2003 | 2002 | 2003 | 2002 | |||||||||||||||||||||||||
Reconciliation of benefit obligation: | ||||||||||||||||||||||||||||||||
Obligation – beginning of year | $ | 2,375 |
| $ | 10,467 |
| $ | 3,468 |
| $ | 2,853 |
| ||||||||||||||||||||
Obligation—beginning of year | $ | 2,377 | $ | 2,375 | $ | 4,960 | $ | 3,468 | ||||||||||||||||||||||||
Service cost |
| — |
|
| 43 |
|
| 10 |
|
| 11 |
| — | — | 24 | 10 | ||||||||||||||||
Interest cost |
| 164 |
|
| 744 |
|
| 311 |
|
| 251 |
| 153 | 164 | 285 | 311 | ||||||||||||||||
Benefits paid |
| (260 | ) |
| (1,754 | ) |
| (618 | ) |
| (577 | ) | (253 | ) | (260 | ) | (490 | ) | (618 | ) | ||||||||||||
Change in benefit assumption |
| — |
|
| — |
|
| 1,039 |
|
| — |
| — | — | — | 1,039 | ||||||||||||||||
Settlements |
| — |
|
| (7,879 | ) |
| — |
|
| — |
| ||||||||||||||||||||
Actuarial (gain) loss |
| 98 |
|
| 797 |
|
| 750 |
|
| 930 |
| 105 | 98 | (289 | ) | 750 | |||||||||||||||
Other |
| — |
|
| (43 | ) |
| — |
|
| — |
| ||||||||||||||||||||
Obligation – end of year |
| 2,377 |
|
| 2,375 |
|
| 4,960 |
|
| 3,468 |
| ||||||||||||||||||||
Obligation—end of year | 2,382 | 2,377 | 4,490 | 4,960 | ||||||||||||||||||||||||||||
Reconciliation of fair value of plan assets: | ||||||||||||||||||||||||||||||||
Fair value – beginning of year |
| — |
|
| 9,941 |
|
| 518 |
|
| 975 |
| ||||||||||||||||||||
Fair value—beginning of year | — | — | — | 518 | ||||||||||||||||||||||||||||
Actual return on plan assets |
| — |
|
| 368 |
|
| 5 |
|
| 138 |
| — | — | — | 5 | ||||||||||||||||
Settlements |
| (7,879 | ) |
| — |
|
| — |
| |||||||||||||||||||||||
Employer contributions |
| 260 |
|
| 259 |
|
| 96 |
|
| 10 |
| 253 | 260 | — | 96 | ||||||||||||||||
Participant contributions |
| — |
|
| 11 |
|
| 11 |
| — | 11 | |||||||||||||||||||||
Benefit payments |
| (260 | ) |
| (1,754 | ) |
| (609 | ) |
| (588 | ) | (253 | ) | (260 | ) | — | (609 | ) | |||||||||||||
Administrative expenses |
| — |
|
| (190 | ) |
| (21 | ) |
| (28 | ) | — | — | — | (21 | ) | |||||||||||||||
Transfer to 401 K |
| — |
|
| (186 | ) |
| — |
|
| — |
| ||||||||||||||||||||
Reversion to Penn Virginia |
| — |
|
| (559 | ) |
| — |
|
| — |
| ||||||||||||||||||||
Fair value – end of year |
| — |
|
| — |
|
| — |
|
| 518 |
| ||||||||||||||||||||
Fair value—end of year | — | — | — | — | ||||||||||||||||||||||||||||
Funded status: | ||||||||||||||||||||||||||||||||
Funded status – end of year |
| (2,377 | ) |
| (2,375 | ) |
| (4,960 | ) |
| (2,950 | ) | ||||||||||||||||||||
Funded status—end of year | (2,382 | ) | (2,377 | ) | (4,490 | ) | (4,960 | ) | ||||||||||||||||||||||||
Unrecognized transition obligation |
| 16 |
|
| 20 |
|
| — |
|
| — |
| 13 | 16 | — | — | ||||||||||||||||
Unrecognized prior service cost |
| 36 |
|
| 42 |
|
| 1,112 |
|
| 79 |
| 30 | 36 | 1,024 | 1,112 | ||||||||||||||||
Unrecognized (gain) loss |
| 491 |
|
| 405 |
|
| 1,559 |
|
| 930 |
| 577 | 491 | 1,208 | 1,559 | ||||||||||||||||
Net amount recognized | $ | (1,834 | ) | $ | (1,908 | ) | $ | (2,289 | ) | $ | (1,941 | ) | $ | (1,762 | ) | $ | (1,834 | ) | $ | (2,258 | ) | $ | (2,289 | ) | ||||||||
Page 6076
PENN VIRGINIA CORPORATION AND SUBSIDIARIES
NOTES TO CONSOLIDATED FINANCIAL STATEMENTS—(Continued)
The following table provides the amounts recognized in the statements of financial position at December 31, 20022003 and 20012002 (in thousands):
Pension | Post-retirement Healthcare | Pension | Post-retirement Healthcare | |||||||||||||||||||||||||||||
2002 | 2001 | 2002 | 2001 | 2003 | 2002 | 2003 | 2002 | |||||||||||||||||||||||||
Accrued benefit liability | $ | (2,377 | ) | $ | (2,375 | ) | $ | (2,289 | ) | $ | (1,941 | ) | $ | (2,382 | ) | $ | (2,377 | ) | $ | (2,258 | ) | $ | (2,289 | ) | ||||||||
Other long-term assets |
| 52 |
|
| 62 |
|
| — |
|
| — |
| 43 | 52 | — | — | ||||||||||||||||
Accumulated other comprehensive income |
| 491 |
|
| 405 |
|
| — |
|
| — |
| 577 | 491 | — | — | ||||||||||||||||
Obligation – end of year | $ | (1,834 | ) | $ | (1,908 | ) | $ | (2,289 | ) | $ | (1,941 | ) | ||||||||||||||||||||
Obligation—end of year | $ | (1,762 | ) | $ | (1,834 | ) | $ | (2,258 | ) | $ | (2,289 | ) | ||||||||||||||||||||
The following table provides the components of net periodic benefit cost for the plans for the two years ended December 31, 20022003 and 20012002 (in thousands):
Pension | Post-retirement Healthcare | Pension | Post-retirement Healthcare | |||||||||||||||||||||||||
2002 | 2001 | 2002 | 2001 | 2003 | 2002 | 2003 | 2002 | |||||||||||||||||||||
Service cost | $ | — | $ | 43 |
| $ | 10 |
| $ | 11 |
| $ | — | $ | — | $ | 24 | $ | 10 | |||||||||
Interest cost |
| 164 |
| 745 |
|
| 311 |
|
| 251 |
| 153 | 164 | 285 | 311 | |||||||||||||
Expected return on plan assets |
| — |
| (901 | ) |
| (8 | ) |
| (23 | ) | — | — | — | (8 | ) | ||||||||||||
Amortization of prior service cost |
| 6 |
| 6 |
|
| 119 |
|
| 6 |
| 6 | 6 | 88 | 6 | |||||||||||||
Amortization of transitional obligation |
| 3 |
| 3 |
|
| — |
|
| — |
| 3 | 3 | — | — | |||||||||||||
Recognized actuarial (gain) loss |
| 12 |
| 8 |
|
| — |
|
| 32 |
| 19 | 12 | 45 | 113 | |||||||||||||
Net periodic benefit cost | $ | 185 | $ | (96 | ) | $ | 432 |
| $ | 277 |
| $ | 181 | $ | 185 | $ | 442 | $ | 432 | |||||||||
The assumptions used in the measurement of our benefit obligation were as follows:
Pension | Post-retirement Healthcare | |||||||||||
2002 | 2001 | 2002 | 2001 | |||||||||
Discount rate | 6.75 | % | 7.25 | % | 6.75 | % | 7.25 | % | ||||
Expected return on plan assets | — |
| 9.50 |
| — |
| 3.00 |
| ||||
| Pension | Post-retirement Healthcare | |||||||||||
| 2003 | 2002 | 2003 | 2002 | |||||||||
Discount rate | 6.25 | % | 6.75 | % | 6.25 | % | 6.75 | % | ||||
For measurement purposes, a 9.59.0 percent annual rate increase in the per capita cost of covered health care benefits was assumed for 2002.2003. The rate is assumed to decrease gradually to 5.0 percent for 2011 and remain at that level thereafter.
Assumed health care cost trend rates have a significant effect on the amounts reported for post-retirement benefits. A one percent change in assumed health care cost trend rates would have the following effects for 2002 (in thousands):
One percent Increase | One percent Decrease | One percent Increase | One percent Decrease | |||||||||||
Effect on total of service and interest cost components | $ | 14 | $ | (12 | ) | $ | 13 | $ | (13 | ) | ||||
Effect on post-retirement benefit obligation |
| 157 |
| (144 | ) | 204 | (196 | ) | ||||||
Page 6177
14. Other LiabilitiesPENN VIRGINIA CORPORATION AND SUBSIDIARIES
Other liabilities are summarized in the following table (in thousands):NOTES TO CONSOLIDATED FINANCIAL STATEMENTS—(Continued)
December 31, | ||||||
2002 | 2001 | |||||
Reclamation/environmental liabilities | $ | 5,349 | $ | 1,154 | ||
Post-retirement health care |
| 2,129 |
| 1,781 | ||
Deferred income |
| 2,488 |
| 3,658 | ||
Pension |
| 2,237 |
| 2,234 | ||
Other |
| 471 |
| 50 | ||
Total | $ | 12,674 | $ | 8,877 | ||
15.16. Discontinued Operations
During the second quarter of 2002, we sold certain oil and gas properties, which included various interests in south Texas properties acquired in the third quarter of 2001. The operations of these properties were insignificant in 2001. The net carrying amount of properties sold was approximately $0.5 million. Accordingly, under the provisions of SFAS No. 144 the components of discontinued operations were as follows for the year ended December 31, 2002 (in thousands).
Production | ||||
Oil and condensate (Mbbls) | 16 | |||
Natural gas (MMcf) | 18 | |||
Total production (MMcfe) | 114 | |||
Revenues | ||||
Natural gas | $ | 48 | ||
Oil and condensate | 332 | |||
Total revenues | 380 | |||
Expenses | ||||
Operating expenses | 352 | |||
Depreciation, depletion and amortization | 25 | |||
Total expenses | 377 | |||
Income from discontinued operations | 3 | |||
Gain on sale of properties | 337 | |||
| 340 | ||||
Income taxes | (119 | ) | ||
Net income from discontinued operations | $ | 221 | ||
Page 6278
PENN VIRGINIA CORPORATION AND SUBSIDIARIES
16.NOTES TO CONSOLIDATED FINANCIAL STATEMENTS—(Continued)
17. Earnings Per Share
The following is a reconciliation of the numerators and denominators used in the calculation of basic and diluted earnings per share (“EPS”) for net income for the three years ended December 31, 20022003 (in thousands, except per share data.)
2002 | 2001 | 2000 | 2003 | 2002 | 2001 | |||||||||||||
Income from continuing operations | $ | 11,883 | $ | 34,337 | $ | 39,265 | $ | 27,159 | $ | 11,883 | $ | 34,337 | ||||||
Income from discontinued operations |
| 221 |
| — |
| — | — | 221 | — | |||||||||
Cumulative effect of change in accounting principle | 1,363 | — | — | |||||||||||||||
Net income | $ | 12,104 | $ | 34,337 | $ | 39,265 | $ | 28,522 | $ | 12,104 | $ | 34,337 | ||||||
Weighted average shares, basic |
| 8,930 |
| 8,770 |
| 8,241 | 8,988 | 8,930 | 8,770 | |||||||||
Effect of dilutive securities: | ||||||||||||||||||
Stock options |
| 44 |
| 126 |
| 130 | 68 | 44 | 126 | |||||||||
Weighted average shares, diluted |
| 8,974 |
| 8,896 |
| 8,371 | 9,056 | 8,974 | 8,896 | |||||||||
Income from continuing operations per share, basic | $ | 1.33 | $ | 3.92 | $ | 4.76 | $ | 3.02 | $ | 1.33 | $ | 3.92 | ||||||
Income from discontinued operations per share, basic |
| 0.02 |
| — |
| — | — | 0.02 | — | |||||||||
Cumulative effect of change in accounting principle, basic | 0.15 | — | — | |||||||||||||||
Net income per share, basic | $ | 1.35 | $ | 3.92 | $ | 4.76 | $ | 3.17 | $ | 1.35 | $ | 3.92 | ||||||
Income from continuing operations per share, diluted | $ | 1.32 | $ | 3.86 | $ | 4.69 | $ | 3.00 | $ | 1.32 | $ | 3.86 | ||||||
Income from discontinued operations per share, diluted |
| 0.02 |
| — |
| — | — | 0.02 | — | |||||||||
Cumulative effect of change in accounting principle, diluted | 0.15 | — | — | |||||||||||||||
Net income per share, diluted | $ | 1.34 | $ | 3.86 | $ | 4.69 | $ | 3.15 | $ | 1.34 | $ | 3.86 | ||||||
Page 63Not included in calculation of the denominator for diluted earnings per share for the years ended December 31, 2003, 2002 and 2001 were options with an exercise price that exceeded the average price of the underlying securities, and as such these options are not considered to be dilutive.
17.18. Stock Compensation and Stock Ownership Plans`Plans
Stock Compensation Plans
We have several stock compensation plans (collectively known as the “Stock Compensation Plans”) that allow, among other grants, incentive and nonqualified stock options to be granted to key employees and officers and nonqualified stock options to be granted to directors. Options granted under the Stock Compensation Plans may be exercised at any time after one year and prior to ten years following the grant, subject to special rules that apply in the event of death, retirement and/or termination of the employment of an optionee. The exercise price of all options granted under the Stock Compensation Plans is at the fair market value of the Company’s stock on the date of the grant. At December 31, 20022003 there were approximately 134,000116,000 and 416,000361,000 shares available for issuance to directors and employees, respectively, pursuant to the Stock Compensation Plans.
79
PENN VIRGINIA CORPORATION AND SUBSIDIARIES
NOTES TO CONSOLIDATED FINANCIAL STATEMENTS—(Continued)
The following table summarizes information with respect to the common stock options awarded under the Stock Option Plans and grants described above.
2002 | 2001 | 2000 | 2003 | 2002 | 2001 | |||||||||||||||||||||||||
Shares Under Options | Weighted Avg. Exercise Price | Shares Under Options | Weighted Avg Exercise Price | Shares Under Options | Weighted Avg Exercise Price | Shares Under Options | Weighted Avg. Exercise Price | Shares Under Options | Weighted Avg Exercise Price | Shares Under Options | Weighted Avg Exercise Price | |||||||||||||||||||
Outstanding at beginning of year | 359,450 | $ | 25.97 | 725,403 | $ | 19.38 | 1,014,500 | $ | 18.74 | 403,850 | $ | 29.39 | 359,450 | $ | 25.97 | 725,403 | $ | 19.38 | ||||||||||||
Granted | 113,400 | $ | 36.91 | 160,100 | $ | 32.02 | 46,300 | $ | 16.65 | 103,000 | $ | 37.41 | 113,400 | $ | 36.91 | 160,100 | $ | 32.02 | ||||||||||||
Exercised | 57,000 | $ | 24.45 | 526,053 | $ | 23.35 | 326,397 | $ | 17.13 | 104,900 | $ | 23.70 | 57,000 | $ | 24.45 | 526,053 | $ | 23.35 | ||||||||||||
Cancelled | 12,000 | $ | 21.38 | — |
| — | 9,000 | $ | 18.99 | |||||||||||||||||||||
Cancelled / forfeited | 1,000 | $ | 36.59 | 12,000 | $ | 21.38 | — | — | ||||||||||||||||||||||
Outstanding at end of year | 403,850 | $ | 29.39 | 359,450 | $ | 25.97 | 725,403 | $ | 19.38 | 400,950 | $ | 32.92 | 403,850 | $ | 29.39 | 359,450 | $ | 25.97 | ||||||||||||
Weighted average of fair value of options granted during the year | $ | 10.17 | $ | 10.55 | $ | 5.02 | $ | 10.51 | $ | 10.17 | $ | 10.55 | ||||||||||||||||||
The fair value of the options granted during 2003 is estimated on the date of grant using the Black-Scholes option-pricing model with the following assumptions: a) dividend yield of 1.98 percent to 2.59 percent, b) expected volatility of 27.9 percent, c) risk-free interest rate 3.7 percent and d) expected life of eight years.
The fair value of the options granted during 2002 is estimated on the date of grant using the Black-Scholes option-pricing model with the following assumptions: a) dividend yield of 2.37 percent to 2.66 percent, b) expected volatility of 28.6 percent, c) risk-free interest rate 3.8 percent and d) expected life of eight years.
The fair value of the options granted during 2001 is estimated on the date of grant using the Black-Scholes option-pricing model with the following assumptions: a) dividend yield of 2.71 percent to 2.92 percent, b) expected volatility of 32.3 percent, c) risk-free interest rate of 5.1 percent and d) expected life of eight years.
The fair value of the options granted during 2000 is estimated on the date of grant using the Black-Scholes option-pricing model with the following assumptions: a) dividend yield of 5.2 percent to 5.4 percent, b) expected volatility of 37.0 percent, c) risk-free interest rate of 6.9 percent to 7.0 percent and d) expected life of eight years.
The following table summarizes certain information regarding stock options outstanding at December 31, 2002:2003:
Options Outstanding | Options Exercisable | |||||||||
Range of Exercise Price | Number Outstanding at 12/31/02 | Weighted Avg. Remaining Contractual Life | Weighted Avg. Exercise Price | Number Exercisable at 12/31/02 | Weighted Avg. Exercise Price | |||||
$15 to $19 | 44,800 | 5.9 | $17.76 | 44,800 | $17.76 | |||||
$20 to $24 | 88,500 | 4.9 | $21.87 | 88,500 | $21.87 | |||||
$25 to $29 | 23,050 | 6.0 | $27.09 | 23,050 | $27.09 | |||||
$30 to $34 | 145,300 | 8.8 | $32.43 | 134,100 | $32.27 | |||||
$35 to $39 | 102,200 | 9.4 | $37.19 | — | $ — | |||||
Page 64
Options Outstanding | Options Exercisable | |||||||||
Range of | Number | Weighted Avg. | Weighted Avg. | Number | Weighted Avg. | |||||
| $15 to $19 | 800 | 5.5 | $17.69 | 800 | $17.69 | |||||
| $20 to $24 | 58,700 | 4.0 | $21.65 | 58,700 | $21.65 | |||||
| $25 to $29 | 18,150 | 5.0 | $27.05 | 18,150 | $27.05 | |||||
| $30 to $34 | 139,100 | 8.0 | $32.53 | 129,100 | $32.36 | |||||
| $35 to $39 | 173,200 | 8.9 | $37.07 | 92,200 | $37.20 | |||||
| $40 to $44 | 11,000 | 9.7 | $43.39 | — | $ — | |||||
Employees’ Stock Ownership Plan
In 1996, the Board of Directors extended the Employees’ Stock Ownership Plan (“ESOP”). All employees with one year of service are participants. The ESOP is designed to enable employees to accumulate stock ownership. While there are no employee contributions, participants receive an allocation of stock which has been contributed by the Company. Compensation costs are reported when such shares are released to employees. The ESOP borrowed $2.0 million from the Company in 1996 and used the proceeds to purchase treasury stock. Under the terms of the ESOP, we will make annual contributions over a 10-year period. At December 31, 2002,2003, the unearned portion of the ESOP of approximately ($0.30.1 million) is reported as a component of Shareholders’
80
PENN VIRGINIA CORPORATION AND SUBSIDIARIES
NOTES TO CONSOLIDATED FINANCIAL STATEMENTS—(Continued)
Equity entitled “Unearned Compensation-ESOP.” The ESOP will be merged with and into the Penn Virginia Corporation and Affiliated Companies’ Employees’ 401(k) Plan effective July 1, 2004.
Shareholder Rights Plan
In February 1998, the Board of Directors adopted a Shareholder Rights Plan (the “Plan”) designed to prevent an acquirer from gaining control of the Company without offering a fair price to all shareholders. The Plan was amended in March 2002. Each right entitles the holder to purchase from the Company one one-thousandth of a share of Series A Junior Participating Preferred Stock, $100 par value, at a price of $100 subject to adjustment. The rights are not exercisable or transferable apart from the common stock until after a person or affiliated group has acquired or obtained the right to acquire fifteen percent or more (or ten percent or more if such person or group has been deemed to an “adverse person” as defined in the Plan), of our common stock. Each right will entitle the holder, under certain circumstances, to acquire at half the value, either common stock of the Company, a combination of cash, other property, or common stock or other securities of the Company, or common stock of an acquiring person. Any such event would also result in any rights owned beneficially by the acquiring person or its affiliates becoming null and void. The rights expire in February 2008 and are redeemable under certain circumstances.
Restricted Units of PVR
The general partner granted 37,50012,950 restricted units to directors and officers of the general partner in 2002.2003. A restricted unit entitles the grantee to receive a common unit upon the vesting of the restricted unit. Restricted units vest upon terms established by the Partnership Compensation Committee, but in no case earlier than the conversion to common units of the Partnership’s outstanding subordinated units. In addition, the restricted units will vest upon a change of control of the general partner or the Company. If a grantee’s employment with or membership on the Partnership’s Board of Directors of the general partner terminates for any reason, the grantee’s restricted units will be automatically forfeited unless, and to the extent, the compensation committee provides otherwise. Common units to be delivered upon the vesting of restricted units may be common units acquired by the general partner in the open market, common units already owned by the general partner, common units acquired by the general partner directly from the Partnership or any other person or any combination of the foregoing. The general partner will be entitled to reimbursement by the Partnership for the cost incurred in acquiring such common units. Distributions payable with respect to restricted units may, at the Partnership’s Compensation Committee’s request, be paid directly to the grantee or held by the Partnership and made subject to a risk of forfeiture during the applicable restriction period.
The following table summarizes information with respect to restricted units awarded by the general partner.
2002 | 2003 | |||||||||
Restricted Units | Fair Value | Restricted Units | Fair Value/unit | |||||||
Outstanding at beginning of year | — | $ | — | 33,500 | $ | 24.50 | ||||
Granted | 37,500 | $ | 24.50 | 12,950 | $ | 23.97 | ||||
Vested | 4,000 | $ | 24.50 | — | — | |||||
Forfeited | — |
| — | — | — | |||||
Outstanding at end of year | 33,500 | $ | 24.50 | 46,450 | $ | 24.30 | ||||
Page 65Compensation expense related to restricted units totaled $0.2 million, and $0.4 million for the years ended December 31, 2003 and 2002. There was no compensation expense related to restricted units in 2001.
81
PENN VIRGINIA CORPORATION AND SUBSIDIARIES
18.NOTES TO CONSOLIDATED FINANCIAL STATEMENTS—(Continued)
19. Accumulated Other Comprehensive Income
Comprehensive income represents certain changes in equity during the reporting period, including net income and other comprehensive income, which includes, but is not limited to, unrealized gains and losses from marketable securities, price risk management assets and minimum pension liability adjustments. Reclassification adjustments represent gains or losses realized in net income for each respective year. For the three years ended December 31, 2002,2003, the components of accumulated other comprehensive income are as follows (in thousands):
Net unrealized holding gain – Investments | Price risk management assets | Minimum pension liability | Accumulated other comprehensive income | |||||||||||||
Balance at December 31, 1999 | $ | 42,235 |
| $ | — |
| $ | (218 | ) | $ | 42,017 |
| ||||
Unrealized holding loss, net of tax of $8,308 |
| (15,429 | ) |
| — |
|
| — |
|
| (15,429 | ) | ||||
Pension plan adjustment, net of tax of $10 |
| — |
|
| — |
|
| 18 |
|
| 18 |
| ||||
Balance at December 31, 2000 |
| 26,806 |
|
| — |
|
| (200 | ) |
| 26,606 |
| ||||
Investment holding gain, net of tax of $1,383 |
| 8,741 |
|
| — |
|
| — |
|
| 8,741 |
| ||||
Investment reclassification adjustment, net of tax of $19,140 |
| (35,547 | ) |
| — |
|
| — |
|
| (35,547 | ) | ||||
Price risk management unrealized gain, net of tax of $1,940 |
| — |
|
| 3,603 |
|
| — |
|
| 3,603 |
| ||||
Price risk management reclassification adjustment, net of tax of $853 |
| — |
|
| (1,584 | ) |
| — |
|
| (1,584 | ) | ||||
Pension plan adjustment, net of tax of $34 |
| — |
|
| — |
|
| (63 | ) |
| (63 | ) | ||||
Balance at December 31, 2001 |
| — |
|
| 2,019 |
|
| (263 | ) |
| 1,756 |
| ||||
Price risk management unrealized loss, net of tax of $2,160 |
| — |
|
| (4,012 | ) |
| — |
|
| (4,012 | ) | ||||
Price risk management reclassification adjustment, net of tax of $350 |
| — |
|
| 651 |
|
| — |
|
| 651 |
| ||||
Pension plan adjustment, net of tax of $30 |
| — |
|
| — |
|
| (56 | ) |
| (56 | ) | ||||
Balance at December 31, 2002 | $ | — |
| $ | (1,342 | ) | $ | (319 | ) | $ | (1,661 | ) | ||||
Page 66
| Net Unrealized Holding Gain- Investments | Price Risk Management Assets | Minimum Pension Liability | Accumulated Other Comprehensive Income | |||||||||||||
Balance at December 31, 2000 | $ | 26,806 | $ | — | $ | (200 | ) | $ | 26,606 | |||||||
Investment holding gain, net of tax of $1,383 | 8,741 | — | — | 8,741 | ||||||||||||
Investment reclassification adjustment, net of tax of $19,140 | (35,547 | ) | — | — | (35,547 | ) | ||||||||||
Hedging unrealized gain, net of tax of $1,940 | — | 3,603 | — | 3,603 | ||||||||||||
Hedging reclassification adjustment, net of tax of $853 | — | (1,584 | ) | — | (1,584 | ) | ||||||||||
Pension plan adjustment, net of tax of $34 | — | — | (63 | ) | (63 | ) | ||||||||||
Balance at December 31, 2001 | — | 2,019 | (263 | ) | 1,756 | |||||||||||
Hedging unrealized loss, net of tax of $2,160 | — | (4,012 | ) | — | (4,012 | ) | ||||||||||
Hedging reclassification adjustment, net of tax of $350 | — | 651 | — | 651 | ||||||||||||
Pension plan adjustment, net of tax of $30 | — | — | (56 | ) | (56 | ) | ||||||||||
Balance at December 31, 2002 | — | (1,342 | ) | (319 | ) | (1,661 | ) | |||||||||
Hedging unrealized loss, net of tax of $2,428 | — | (4,509 | ) | — | (4,509 | ) | ||||||||||
Hedging reclassification adjustment, net of tax of $2,141 | — | 3,976 | — | 3,976 | ||||||||||||
Pension plan adjustment, net of tax of $30 | — | — | (56 | ) | (56 | ) | ||||||||||
Balance at December 31, 2003 | $ | — | $ | (1,875 | ) | $ | (375 | ) | $ | (2,250 | ) | |||||
19.20. Segment Information
Segment information has been prepared in accordance with SFAS No. 131Disclosure about Segments of an Enterprise and Related Information. Under SFAS No. 131, operating segments are defined as components of an enterprise about which separate financial information is available and is evaluated regularly by the chief decision maker, or decision-making group, in assessing performance. Our chief operating decision-making group consists of the Chief Executive Officer and other senior officials. This group routinely reviews and makes operating and resource allocation decisions among our oil and gas operations and its coal royalty and land management operations. Accordingly, our reportable segments are as follows:
Oil and Gas – Gas—crude oil and natural gas exploration, development and production.
Coal Royalty and Land Management – Management—the leasing of mineral rightsinterests and subsequent collection of royalties and the development and harvesting of timber.
All Other – Corporate and Other—primarily represents corporate functions.
Oil and Gas | Coal Royalty and Land Management | All Other | Consolidated | ||||||||||||
(in thousands) | |||||||||||||||
December 31, 2002 | |||||||||||||||
Revenues | $ | 71,512 |
| $ | 38,608 | $ | 837 |
| $ | 110,957 |
| ||||
Operating costs and expenses |
| 30,801 |
|
| 10,226 |
| 7,704 |
|
| 48,731 |
| ||||
Depreciation, depletion and amortization |
| 26,336 |
|
| 3,955 |
| 348 |
|
| 30,639 |
| ||||
Impairment of oil and gas properties |
| 796 |
|
| — |
| — |
|
| 796 |
| ||||
Operating income (loss) | $ | 13,579 |
| $ | 24,427 | $ | (7,215 | ) |
| 30,791 |
| ||||
Interest expense |
| (2,116 | ) | ||||||||||||
Interest income |
| 2,038 |
| ||||||||||||
Other |
| 1 |
| ||||||||||||
Income before minority interest and taxes | $ | 30,714 |
| ||||||||||||
Total assets | $ | 314,284 |
| $ | 266,576 | $ | 5,432 |
| $ | 586,292 |
| ||||
Capital expenditures | $ | 51,581 |
| $ | 92,817 | $ | 343 |
| $ | 144,741 |
| ||||
December 31, 2001 | |||||||||||||||
Revenues | $ | 57,778 |
| $ | 37,513 | $ | 1,280 |
| $ | 96,571 |
| ||||
Operating costs and expenses |
| 26,914 |
|
| 9,271 |
| 5,661 |
|
| 41,846 |
| ||||
Depreciation, depletion and amortization |
| 16,418 |
|
| 3,084 |
| 77 |
|
| 19,579 |
| ||||
Impairment of oil and gas properties |
| 33,583 |
|
| — |
| — |
|
| 33,583 |
| ||||
Operating income (loss) | $ | (19,137 | ) | $ | 25,158 | $ | (4,458 | ) |
| 1,563 |
| ||||
Gain on sale of securities |
| 54,688 |
| ||||||||||||
Interest expense |
| (2,453 | ) | ||||||||||||
Interest income |
| 1,602 |
| ||||||||||||
Other |
| 14 |
| ||||||||||||
Income before minority interest and taxes | $ | 55,414 |
| ||||||||||||
Total assets | $ | 289,379 |
| $ | 162,638 | $ | 5,085 |
| $ | 457,102 |
| ||||
Capital expenditures | $ | 161,295 |
| $ | 33,669 | $ | 1,074 |
| $ | 196,038 |
| ||||
December 31, 2000 | |||||||||||||||
Revenues | $ | 71,405 |
| $ | 30,189 | $ | 4,404 |
| $ | 105,998 |
| ||||
Operating costs and expenses |
| 15,107 |
|
| 8,327 |
| 4,853 |
|
| 28,287 |
| ||||
Depreciation, depletion and amortization |
| 9,883 |
|
| 2,047 |
| 97 |
|
| 12,027 |
| ||||
Operating income (loss) | $ | 46,415 |
| $ | 19,815 | $ | (546 | ) |
| 65,684 |
| ||||
Interest expense |
| (7,926 | ) | ||||||||||||
Interest income |
| 1,458 |
| ||||||||||||
Other |
| 14 |
| ||||||||||||
Income before taxes | $ | 59,230 |
| ||||||||||||
Total assets | $ | 142,613 |
| $ | 79,803 | $ | 46,350 |
| $ | 268,766 |
| ||||
Capital expenditures | $ | 58,677 |
| $ | 485 | $ | 281 |
| $ | 59,443 |
| ||||
82
PENN VIRGINIA CORPORATION AND SUBSIDIARIES
Page 67
| Oil and Gas | Coal Royalty and Land Management | Corporate and Other | Consolidated | ||||||||||||
| (in thousands) | |||||||||||||||
December 31, 2003 | |||||||||||||||
Revenues | $ | 124,822 | $ | 55,642 | $ | 820 | $ | 181,284 | |||||||
Operating costs and expenses | 44,937 | 12,504 | 11,227 | 68,668 | |||||||||||
Depreciation, depletion and amortization | 33,164 | 16,578 | 367 | 50,109 | |||||||||||
Impairment of oil and gas properties | 406 | — | — | 406 | |||||||||||
Operating income (loss) | $ | 46,315 | $ | 26,560 | $ | (10,774 | ) | 62,101 | |||||||
Interest expense | (5,304 | ) | |||||||||||||
Interest income | 1,237 | ||||||||||||||
Other | 1 | ||||||||||||||
Income before minority interest and taxes | $ | 58,035 | |||||||||||||
Total assets | $ | 405,753 | $ | 259,892 | $ | 18,088 | $ | 683,733 | |||||||
Additions to property and equipment | $ | 122,270 | $ | 5,291 | $ | 621 | $ | 128,182 | |||||||
December 31, 2002 | |||||||||||||||
Revenues | $ | 71,512 | $ | 38,608 | $ | 837 | $ | 110,957 | |||||||
Operating costs and expenses | 30,801 | 10,226 | 7,704 | 48,731 | |||||||||||
Depreciation, depletion and amortization | 26,336 | 3,955 | 348 | 30,639 | |||||||||||
Impairment of oil and gas properties | 796 | — | — | 796 | |||||||||||
Operating income (loss) | $ | 13,579 | $ | 24,427 | $ | (7,215 | ) | 30,791 | |||||||
Interest expense | (2,116 | ) | |||||||||||||
Interest income | 2,038 | ||||||||||||||
Other | 1 | ||||||||||||||
Income before minority interest and taxes | $ | 30,714 | |||||||||||||
Total assets | $ | 314,284 | $ | 266,576 | $ | 5,432 | $ | 586,292 | |||||||
Additions to property and equipment | $ | 51,581 | $ | 92,817 | $ | 343 | $ | 144,741 | |||||||
December 31, 2001 | |||||||||||||||
Revenues | $ | 57,778 | $ | 37,513 | $ | 1,280 | $ | 96,571 | |||||||
Operating costs and expenses | 26,914 | 9,271 | 5,661 | 41,846 | |||||||||||
Depreciation, depletion and amortization | 16,418 | 3,084 | 77 | 19,579 | |||||||||||
Impairment of oil and gas properties | 33,583 | — | — | 33,583 | |||||||||||
Operating income (loss) | $ | (19,137 | ) | $ | 25,158 | $ | (4,458 | ) | 1,563 | ||||||
Gain on sale of securities | 54,688 | ||||||||||||||
Interest expense | (2,453 | ) | |||||||||||||
Interest income | 1,602 | ||||||||||||||
Other | 14 | ||||||||||||||
Income before minority interest and taxes | $ | 55,414 | |||||||||||||
Total assets | $ | 289,379 | $ | 162,638 | $ | 5,085 | $ | 457,102 | |||||||
Additions to property and equipment | $ | 161,295 | $ | 33,669 | $ | 1,074 | $ | 196,038 | |||||||
Operating loss for the Oil Gas segment in 2001 includes a $33.6 million impairment on properties see Note 9 (Impairment8. Impairment of Oil and Gas Properties). Operating income for 2000 includes a gain on sale of property of $23.9 million.Properties.
83
PENN VIRGINIA CORPORATION AND SUBSIDIARIES
NOTES TO CONSOLIDATED FINANCIAL STATEMENTS—(Continued)
Operating income is total revenuerevenues less operating expenses. Operating income does not include certain other income items, gain (loss) on sale of securities, interest expense, minority interest and income taxes.
For the year ended December 31, 2003, three customers of the oil and gas segment accounted for approximately $34.8 million, $24.2 million and $21.9 million or 19 percent, 13 percent and 12 percent, respectively, of our consolidated net revenues.
For the year ended December 31, 2002, two customers of the oil and gas segment accounted for approximately $29.4 million and $17.7 million, or 26 percent and $17.7 million, or 1619 percent, respectively, of our consolidated net revenues.
For the year ended December 31, 2001, two customers of the oil and gas segment accounted for approximately $20.8 million and $11.4 million, or 22 percent and $11.4 million, or 12 percent, respectively, of our consolidated net revenues.
20.21. Commitments and Contingencies
Rental Commitments
Minimum rental commitments under all non-cancelable operating leases primarily real estate, in effect at December 31, 20022003 were as follows (in thousands):
Year ending December 31, | ||||||
2003 | $ | 2,855 | ||||
2004 |
| 1,729 | $ | 1,861 | ||
2005 |
| 1,508 | 1,413 | |||
2006 |
| 1,388 | 934 | |||
2007 |
| 601 | 847 | |||
2008 | 433 | |||||
Total minimum payments | $ | 8,081 | $ | 5,488 | ||
Rental commitments primarily relate to equipment, car and building leases. Also included are the Partnership’s rental commitments, which primarily relate to reserve-based properties which are, or are intended to be, subleased by the Partnership to third parties. The obligation expires when the property has been mined to exhaustion or the lease has been canceled. The timing of mining by third party operators is difficult to estimate due to numerous factors. We believe the obligation after five years cannot be reasonably estimated; however, based on current knowledge, we believe the Partnership will incur approximately $0.4 million in rental commitments in perpetuity until the reserves have been exhausted.
Legal
We are involved, from time to time, in various legal proceedings arising in the ordinary course of business. While the ultimate results of these proceedings cannot be predicted with certainty, management believes these claims will not have a material effect on the financial position, liquidity or operations.
84
PENN VIRGINIA CORPORATION AND SUBSIDIARIES
NOTES TO CONSOLIDATED FINANCIAL STATEMENTS—(Continued)
Environmental Compliance
Extensive federal, state and local laws govern oil and natural gas operations, regulate the discharge of materials into the environment or otherwise relate to the protection of the environment. Numerous governmental departments issue rules and regulations to implement and enforce such laws that are often difficult and costly to comply with and which carry substantial administrative, civil and even criminal penalties for failure to comply. Some laws, rules and regulations relating to protection of the environment may, in certain circumstances, impose “strict liability” for environmental contamination, rendering a person liable for environmental and natural resource damages and cleanup costs without regard to negligence or fault on the part of such person. Other laws, rules and regulations may restrict the rate of oil and natural gas production below the rate that would otherwise exist or even prohibit exploration or production activities in sensitive areas. In addition, state laws often require some form of remedial action to prevent pollution from former operations, such as closure of inactive pits and plugging of abandoned wells. The regulatory burden on the oil and natural gas industry increases its cost of doing business and consequently affects its profitability. These laws, rules and regulations affect our
Page 68
operations, as well as the oil and gas exploration and production industry in general. We believe that we are in substantial compliance with current applicable environmental laws, rules and regulations and that continued compliance with existing requirements will not have a material adverse impact on us. Nevertheless, changes in existing environmental laws or the adoption of new environmental laws have the potential to adversely affect our operations.
The operations of the Partnership’s lessees are subject to environmental laws and regulations adopted by various governmental authorities in the jurisdictions in which these operations are conducted. The terms of the Partnership’s coal property leases impose liability for all environmental and reclamation liabilities arising under those laws and regulations on the relevant lessees. The lessees are bonded and have indemnified the Partnership against any and all future environmental liabilities. The Partnership regularly visits the coal property leases to monitor its lessee’s compliance with environmental laws and regulations, as well as to review miningreviewing mine activities. Management believes that the Partnership’s lessees will be able to comply with existing regulations and does not expect any material impact on its financial condition or results of operations as a result of environmental regulations.operations.
WithAs of December 31, 2003, the Partnership has reclamation bonding requirements with respect to certain of its unleased and inactive properties, the Partnership has some reclamation bonding requirements.properties. In conjunction with the November 2002 purchase of equipment at the Fork Creek property,(see Note 4. Acquisitions), the Partnership assumed reclamation and mitigation liabilities of approximately $3.0 million. TheIn 2003, the Partnership is currently pursuing a potential lessee for thisleased the property and asrelated infrastructure to a third party who is customary in its operations,actively operating on the Partnership intendsproperty. Consequently, all of the reclamation and stream mitigation liabilities were assigned to assign all reclamation liabilities to suchthe new lessee. As of December 31, 20022003 and 2001,2002, the Partnership’s environmental liabilities totaled $1.6 million and $4.6 million, and zero, respectively. The environmental liabilities are not covered by the indemnification agreement with Penn Virginia.
85
PENN VIRGINIA CORPORATION AND SUBSIDIARIES
21.NOTES TO CONSOLIDATED FINANCIAL STATEMENTS—(Continued)
22. Quarterly Financial Information (Unaudited)
Summarized Quarterly Financial Data:
2002 Quarters Ended | 2001 Quarters Ended | ||||||||||||||||||||||||
Mar. 31 | June 30 | Sept. 30 | Dec. 31 | Mar. 31 | June 30(a) | Sept. 30 | Dec. 31(b) | ||||||||||||||||||
(in thousands, except share data) | |||||||||||||||||||||||||
Revenues | $ | 24,383 | $ | 25,648 | $ | 28,754 | $ | 32,172 | $ | 27,121 | $ | 24,741 | $ | 24,031 | $ | 20,678 |
| ||||||||
Operating | |||||||||||||||||||||||||
Income (loss) (c) | $ | 8,778 | $ | 7,076 | $ | 7,949 | $ | 6,988 | $ | 16,958 | $ | 13,461 | $ | 6,841 | $ | (35,697 | ) | ||||||||
Net income | $ | 3,370 | $ | 3,163 | $ | 3,208 | $ | 2,363 | $ | 10,710 | $ | 43,018 | $ | 4,247 | $ | (23,638 | ) | ||||||||
Net income from continuing operations per share (d) | |||||||||||||||||||||||||
Basic | $ | 0.38 | $ | 0.33 | $ | 0.36 | $ | 0.26 | $ | 1.25 | $ | 4.88 | $ | 0.48 | $ | (2.66 | ) | ||||||||
Diluted | $ | 0.37 | $ | 0.33 | $ | 0.36 | $ | 0.26 | $ | 1.22 | $ | 4.79 | $ | 0.47 | $ | (2.63 | ) | ||||||||
Net income from per share (d) | |||||||||||||||||||||||||
Basic | $ | 0.38 | $ | 0.35 | $ | 0.36 | $ | 0.26 | $ | 1.25 | $ | 4.88 | $ | 0.48 | $ | (2.66 | ) | ||||||||
Diluted | $ | 0.37 | $ | 0.35 | $ | 0.36 | $ | 0.26 | $ | 1.22 | $ | 4.79 | $ | 0.47 | $ | (2.63 | ) | ||||||||
Weighted average shares outstanding: | |||||||||||||||||||||||||
Basic |
| 8,909 |
| 8,927 |
| 8,944 |
| 8,945 |
| 8,549 |
| 8,820 |
| 8,869 |
| 8,890 |
| ||||||||
Diluted |
| 9,007 |
| 8,984 |
| 8,982 |
| 8,984 |
| 8,755 |
| 8,982 |
| 9,007 |
| 8,989 |
| ||||||||
| 2003 Quarters Ended | 2002 Quarters Ended | |||||||||||||||||||||||
| (in thousands, except share data) | ||||||||||||||||||||||||
| Mar. 31 | June 30 | Sept. 30 | Dec. 31 | Mar. 31 | June 30 | Sept.30 | Dec.31 | |||||||||||||||||
Revenues | $ | 48,016 | $ | 43,703 | $ | 42,021 | $ | 47,544 | $ | 24,383 | $ | 25,648 | $ | 28,754 | $ | 32,172 | ||||||||
Operating Income (loss) | $ | 18,813 | $ | 14,807 | $ | 12,756 | $ | 15,725 | $ | 8,778 | $ | 7,076 | $ | 7,949 | $ | 6,988 | ||||||||
Net income | $ | 10,486 | $ | 6,362 | $ | 5,443 | $ | 6,231 | $ | 3,370 | $ | 3,163 | $ | 3,208 | $ | 2,363 | ||||||||
Net income from continuing operations per share(a) | ||||||||||||||||||||||||
Basic | $ | 1.02 | $ | 0.71 | $ | 0.61 | $ | 0.69 | $ | 0.38 | $ | 0.33 | $ | 0.36 | $ | 0.26 | ||||||||
Diluted | $ | 1.01 | $ | 0.70 | $ | 0.60 | $ | 0.68 | $ | 0.37 | $ | 0.33 | $ | 0.36 | $ | 0.26 | ||||||||
Net income from per share(a) | ||||||||||||||||||||||||
Basic | $ | 1.17 | $ | 0.71 | $ | 0.61 | $ | 0.69 | $ | 0.38 | $ | 0.35 | $ | 0.36 | $ | 0.26 | ||||||||
Diluted | $ | 1.16 | $ | 0.70 | $ | 0.60 | $ | 0.68 | $ | 0.37 | $ | 0.35 | $ | 0.36 | $ | 0.26 | ||||||||
Weighted average shares outstanding: | ||||||||||||||||||||||||
Basic | 8,952 | 8,976 | 8,996 | 9,027 | 8,909 | 8,927 | 8,944 | 8,945 | ||||||||||||||||
Diluted | 8,996 | 9,047 | 9,069 | 9,110 | 9,007 | 8,984 | 8,982 | 8,984 | ||||||||||||||||
| (a) |
| The sum of the quarters may not equal the total of the respective year’s net income per share due to changes in the weighted average shares outstanding throughout the year. |
Page 69
22. Supplementary23. Supplemental Information on Oil and Gas Producing Activities (Unaudited)
The following supplementarysupplemental information regarding the oil and gas producing activities is presented in accordance with the requirements of the Securities and Exchange Commission (SEC) and SFAS No. 69 “Disclosures about Oil and Gas Producing Activities”. The amounts shown include our net working and royalty interest in all of our oil and gas operations.
Capitalized Costs Relating to Oil and Gas Producing Activities
Year Ended December 31, | Year Ended December 31, | |||||||||||||||||||||||
2002 | 2001 | 2000 | 2003 | 2002 | 2001 | |||||||||||||||||||
(in thousands) | (in thousands) | |||||||||||||||||||||||
Proved properties | $ | 73,606 |
| $ | 75,152 |
| $ | 64,107 |
| $ | 123,302 | $ | 93,744 | $ | 87,198 | |||||||||
Unproved properties |
| 57,575 |
|
| 57,813 |
|
| 2,425 |
| 60,042 | 57,575 | 57,813 | ||||||||||||
Wells, equipment and facilities |
| 248,746 |
|
| 199,670 |
|
| 105,283 |
| 316,257 | 228,608 | 187,624 | ||||||||||||
Support equipment |
| 3,433 |
|
| 2,859 |
|
| 2,689 |
| 3,689 | 3,433 | 2,859 | ||||||||||||
| 383,360 |
|
| 335,494 |
|
| 174,504 |
| 503,290 | 383,360 | 335,494 | |||||||||||||
Accumulated depreciation and depletion |
| (86,586 | ) |
| (60,073 | ) |
| (43,720 | ) | (116,998 | ) | (86,586 | ) | (60,073 | ) | |||||||||
Net capitalized costs | $ | 296,774 |
| $ | 275,421 |
| $ | 130,784 |
| $ | 386,292 | $ | 296,774 | $ | 275,421 | |||||||||
In accordance with SFAS No. 143, as of January 1, 2003 the cost basis of oil and gas wells were grossed up by approximately $1.0 million. During 2003, an additional $0.4 million was added to the cost basis of oil and gas wells for wells drilled.
86
PENN VIRGINIA CORPORATION AND SUBSIDIARIES
NOTES TO CONSOLIDATED FINANCIAL STATEMENTS—(Continued)
Costs Incurred in Certain Oil and Gas Activities
Year Ended December 31, | Year Ended December 31, | |||||||||||||||||
2002 | 2001 | 2000 | 2003 | 2002 | 2001 | |||||||||||||
(in thousands) | (in thousands) | |||||||||||||||||
Proved property acquisition costs | $ | 517 | $ | 97,143 | $ | 35,999 | $ | 35,131 | $ | 517 | $ | 97,143 | ||||||
Unproved property acquisition costs |
| 6,829 |
| 64,488 |
| 917 | 9,021 | 5,819 | 64,488 | |||||||||
Exploration costs |
| 7,843 |
| 13,814 |
| 5,125 | 21,401 | 7,843 | 13,814 | |||||||||
Development costs and other |
| 41,750 |
| 31,545 |
| 18,561 | 67,783 | 41,750 | 31,545 | |||||||||
Total costs incurred | $ | 56,939 | $ | 206,990 | $ | 60,602 | $ | 133,336 | $ | 55,929 | $ | 206,990 | ||||||
Costs for the year ended December 31, 2001, include deferred income taxes of $45.3 million provided for the book versus tax basis difference related to the acquired Synergy Oil and Gas properties, $27.2 million of which is included in proved property acquisition costs and $18.1 million is included in unproved property acquisition costs.
Results of Operations for Oil and Gas Producing Activities
The following schedule includes results solely from the production and sale of oil and gas and a non-cash charge for property impairments. It excludes corporate related general and administrative expenses and gains or losses on property dispositions. The income tax expense is calculated by applying the statutory tax rates to the revenues after deducting costs, which include depletion allowances and giving effect to oil and gas related permanent differences and tax credits.
Year Ended December 31, | Year Ended December 31, | ||||||||||||||||||||
2002 | 2001 | 2000 | 2003 | 2002 | 2001 | ||||||||||||||||
(in thousands) | (in thousands) | ||||||||||||||||||||
Revenues | $ | 71,178 | $ | 57,024 |
| $ | 46,851 | $ | 123,431 | $ | 71,178 | $ | 57,024 | ||||||||
Production expenses |
| 15,390 |
| 10,069 |
|
| 7,226 | 21,928 | 15,390 | 10,069 | |||||||||||
Exploration expenses |
| 7,614 |
| 11,514 |
|
| 5,080 | 15,503 | 7,614 | 11,514 | |||||||||||
Depreciation and depletion expense |
| 26,361 |
| 16,418 |
|
| 9,883 | 33,164 | 26,361 | 16,418 | |||||||||||
Impairment of oil and gas properties |
| 796 |
| 33,583 |
|
| — | 406 | 796 | 33,583 | |||||||||||
| 21,017 |
| (14,560 | ) |
| 24,662 | 52,430 | 21,017 | (14,560 | ) | |||||||||||
Income tax expense (benefit) |
| 6,566 |
| (5,817 | ) |
| 8,309 | (21,338 | ) | 6,566 | (5,817 | ) | |||||||||
Results of operations | $ | 14,451 | $ | (8,743 | ) | $ | 16,353 | $ | 31,092 | $ | 14,451 | $ | (8,743 | ) | |||||||
Page 70In accordance with SFAS No. 143, the combined depletion and accretion expense recognized during 2003 in depreciation and depletion expense was approximately $0.2 million. Had SFAS No. 143 been implemented on January 1, 2001 the net combined effect on depreciation and depletion expense for the years ended December, 31. 2002 and 2001 would have been favorable adjustments of approximately $0.1 million and $0.2 million, respectively.
Oil and Gas Reserves
The following schedule presents the estimated oil and gas reserves owned by us. This information includes our royalty and net working interest share of the reserves in oil and gas properties. Net proved oil and gas reserves for the three years ended December 31, 2002,2003, were estimated by Wright and Company, Inc. All reserves are located in the United States.
87
PENN VIRGINIA CORPORATION AND SUBSIDIARIES
NOTES TO CONSOLIDATED FINANCIAL STATEMENTS—(Continued)
There are many uncertainties inherent in estimating proved reserve quantities, and projecting future production rates and the timing of future development expenditures. In addition, reserve estimates of new discoveries are more imprecise than those of properties with a production history. Accordingly, these estimates are subject to change as additional information becomes available. Proved oil and gas reserves are the estimated quantities of crude oil, condensate and natural gas that geological and engineering data demonstrate with reasonable certainty to be recoverable in future years from known reservoirs under existing economic and operating conditions at the end of the respective years. Proved developed oil and gas reserves are those reserves expected to be recovered through existing equipment and operating methods.
Net quantities of proved reserves and proved developed reserves during the periods indicated are set forth in the tables below:
The following table sets forth the standardized measure of the discounted future net cash flows attributable to our proved oil and gas reserves. Future cash inflows were computed by applying year-end prices of oil and gas to the estimated future production of proved oil and gas reserves. Natural gas prices were escalated only where existing contracts contained fixed and determinable escalation clauses. Contractually provided natural gas prices in excess of estimated market clearing prices were used in computing the future cash inflows only if we expect to continue to receive higher prices under legally enforceable contract terms. Future prices actually received may materially differ from current prices or the prices used in the standardized measure.
88
PENN VIRGINIA CORPORATION AND SUBSIDIARIES
NOTES TO CONSOLIDATED FINANCIAL STATEMENTS—(Continued)
Future production and development costs represent the estimated future expenditures (based on current costs) to be incurred in developing and producing the proved reserves, assuming continuation of existing economic conditions. Future income tax expenses were computed by applying statutory income tax rates to the difference between pre-tax net cash flows relating to our proved oil and gas reserves and the tax basis of proved oil and gas properties. In addition, the effects of statutory depletion in excess of tax basis, available net operating loss carryforwards and alternative minimum tax credits were used in computing future income tax expense. The resulting annual net cash inflows were then discounted using a 10 percent annual rate.
| Year Ended December 31, | ||||||||||||
| 2003 | 2002 | 2001 | ||||||||||
| (in thousands) | ||||||||||||
Future cash inflows | $ | 1,965,224 | $ | 1,372,935 | $ | 722,203 | ||||||
Future production costs | (392,193 | ) | (263,705 | ) | (178,533 | ) | ||||||
Future development costs | (70,105 | ) | (51,151 | ) | (39,145 | ) | ||||||
Future net cash flows before income tax | 1,502,926 | 1,058,079 | 504,525 | |||||||||
Future income tax expense | (407,411 | ) | (285,633 | ) | (127,277 | ) | ||||||
Future net cash flows | 1,095,515 | 772,446 | 377,248 | |||||||||
10% annual discount for estimated timing of cash flows | (583,823 | ) | (417,523 | ) | (188,305 | ) | ||||||
Standardized measure of discounted future net cash flows | $ | 511,692 | $ | 354,923 | $ | 188,943 | ||||||
Changes in Standardized Measure of Discounted Future Net Cash Flows
| Year Ended December 31, | ||||||||||||
| 2003 | 2002 | 2001 | ||||||||||
| (in thousands) | ||||||||||||
Sales of oil and gas, net of production costs | $ | (101,503 | ) | $ | (55,788 | ) | $ | (47,191 | ) | |||
Net changes in prices and production costs | 92,640 | 203,588 | (483,009 | ) | ||||||||
Extensions, discoveries and other additions | 142,921 | 82,808 | 37,907 | |||||||||
Development costs incurred during the period | 15,503 | 16,393 | 13,771 | |||||||||
Revisions of previous quantity estimates | (10,380 | ) | (6,513 | ) | (7,710 | ) | ||||||
Purchase of minerals-in-place | 68,071 | 2,901 | 70,294 | |||||||||
Sale of minerals-in-place | (36 | ) | (328 | ) | (906 | ) | ||||||
Accretion of discount | 48,114 | 24,254 | 64,363 | |||||||||
Net change in income taxes | (57,942 | ) | (72,614 | ) | 122,636 | |||||||
Other changes | (40,619 | ) | (28,721 | ) | (48,605 | ) | ||||||
Net increase (decrease) | 156,769 | 165,980 | (278,450 | ) | ||||||||
Beginning of year | 354,923 | 188,943 | 467,393 | |||||||||
End of year | $ | 511,692 | $ | 354,923 | $ | 188,943 | ||||||
As required by SFAS No. 69, “Disclosures about Oil and Gas Producing Activities,” changes in standardized measure relating to sales of reserves are calculated using prices in effect as of the beginning of the period and changes in standardized measure relating to purchases of reserves are calculated using prices in effect at the end of the period. Accordingly, the changes in standardized measure for purchases and sales of reserves reflected above do not necessarily represent the economic reality of such transactions. See the disclosure of “Costs incurred in Certain Oil and Gas Activities” and the statements of cash flows in the financial statements.
89
Item9—Changes in and Disagreements with Accountants on Accounting and Financial Disclosure
Effective May 3, 2002, the Audit Committee of the Board of Directors of our Company dismissed Arthur Andersen LLP (“Andersen”) as the Company’s independent public accountants and engaged KPMG to serve as the Company’s independent public accountants for 2002.
None of Andersen’s reports on the Company’s consolidated financial statements for either of the past two fiscal years contained an adverse opinion or disclaimer of opinion or were qualified or modified as to uncertainty, audit scope or accounting principles.
During the Company’s two most recent fiscal years, there were no disagreements with Andersen on any matter of accounting principles or practices, financial statement disclosure or auditing scope or procedure, which disagreements, if not resolved to the satisfaction of Andersen, would have caused Andersen to make reference to the subject matter of the disagreements in connection with Andersen’s report; and during such period there were no “reportable events” of the kind listed in Item 304(a)(1)(v) of Regulation S-K.
The Company disclosed the foregoing information on a Current Report on Form 8-K dated May 3, 2002 (the “Form 8-K”). The Company provided Andersen with a copy of the foregoing disclosure and requested Andersen to furnish the Company with a letter addressed to the Securities and Exchange Commission stating whether Andersen agreed with the statements by the Company in the foregoing disclosure and, if not, stating the respects in which it did not agree. Andersen’s letter stated that it had read the pertinent paragraphs of the Form 8-K and was in agreement with the statements contained therein. Andersen’s letter is incorporated herein by reference to Exhibit 16.1 of the Form 8-K.
During the Company’s two most recent fiscal years and through the date of this Annual Report on Form 10-K, the Company did not consult KPMG with respect to the application of accounting principles to a specified transaction, either completed or proposed, or the type of audit opinion that might be rendered on the Company’s consolidated financial statements, or any other matters or reportable events listed in Items 304(a)(2)(i) and (ii) of Regulation S-K.
Item 9A—Controls and Procedures (a) Evaluation of Disclosure Controls and Procedures The Company, under the supervision and with the participation of its management, including its principal executive officer and principal financial officer, performed an evaluation of the design and operation of the Company’s disclosure controls and procedures (as defined in Exchange Act Rules 13a-15(e) and 15d-15(e)) as of the end of the period covered by this report. Based on that evaluation, the Company’s principal executive officer and principal financial officer concluded that such disclosure controls and procedures are effective to ensure that material information relating to the Company, including its consolidated subsidiaries, is accumulated and communicated to the Company’s management and made known to the principal executive officer and principal financial officer, particularly during the period for which this periodic report was being prepared. (b) Changes in Internal Controls No changes were made in the Company’s internal control over financial reporting that occurred during our last fiscal quarter that have materially affected, or are reasonably likely to materially affect, our internal control over financial reporting. 90ITEMS 10, 11, 12 AND 13 –DIRECTORS AND EXECUTIVE OFFICERS OF THE COMPANY,EXECUTIVE COMPENSATION,SECURITY OWNERSHIP OF CERTAIN BENEFICIAL OWNERS AND MANAGEMENT AND RELATED STOCKHOLDER MATTERS ANDCERTAIN RELATIONSHIPS AND RELATED TRANSACTIONS
PART III
Items 10, 11, 12 and 13—Directors and Executive Officers of the Company, Executive Compensation, Security Ownership of Certain Beneficial Owners and Management and Related Stockholder Matters and Certain Relationships and Related Transactions
Except for information concerning executive officers of the Company included as an unnumbered item in Part I hereof, in accordance with General Instruction G(3), reference is hereby made to the Company’s definitive proxy statement to be filed within 120 days after the end of the fiscal year covered by this report.
Item 14—Principal Accountant Fees and Services
The following table presents fees for professionals audit services rendered by KPMG LLP for the audit of the Company’s annual financial statements for 2003 and 2002, and fees billed for other services rendered by KPMG, LLP.
| 2003 | 2002 | |||||
Audit fees(1) | $ | 557,350 | $ | 299,400 | ||
Audit related fees(2) | 10,000 | — | ||||
Tax fees(3) | 66,529 | 22,390 | ||||
Total Fees | $ | 633,879 | $ | 321,790 | ||
| (1) | Includes $277,950 and $122,200 of fees related to the Partnership for the years ended December 31, 2003 and 2002, respectively. The Partnership reimbursed the Company |
| (2) | Audit-related fees pertain to debt compliance letters issued by KPMG under the Company’s
|
| (3) | Comprised of fees for tax consulting and
|
Policy on Audit Committee Pre-Approval of Audit and Permissible Non-Audit Services of Independent Auditors
The Audit Committee’s policy is to pre-approve all audit and audit-related services provided by the independent auditors. These services may include audit services, audit-related services, tax services and other services. The Audit Committee may also pre-approve particular services on a case-by-case basis. The independent auditors are required to periodically report to the Audit Committee regarding the extent of services provided by the independent auditors in accordance with such pre-approval. The Audit Committee may also delegate pre-approval authority to one or more of its members. Such member(s) must report any decisions to the Audit Committee at the next scheduled meeting.
91
PART IV
ITEMItem 15 –EXHIBITS, FINANCIAL STATEMENT SCHEDULES AND REPORTS ON FORM—Exhibits, Financial Statement Schedules and Reports on Form 8-K
(a) Financial Statements
| 1. | Financial | |||
|
| ||||
2. | All schedules are omitted because they are not required, inapplicable or the information is included in the consolidated financial statements or the notes | ||||
3. | Exhibits | ||||
|
| Articles of Incorporation of Penn Virginia Corporation (incorporated by reference to Exhibit 3.1 to Registrant’s Annual Report on Form 10-K for the year ended December 31, 1999). | |||
|
| Articles of Amendment of Articles of Incorporation of Penn Virginia Corporation (incorporated by reference to Exhibit 3.2 to Registrant’s Annual Report on Form 10-K for the year ended December 31, 1999). | |||
|
| Amended bylaws of Registrant (incorporated by reference to Exhibit 3.1 to Registrant’s Report on Form 8-K filed on March 28, 2002). | |||
|
| Rights Agreement dated as of February 11, 1998 between Penn Virginia Corporation and American Stock Transfer & Trust Company, as Agent (incorporated by reference to Exhibit 1.1 to Registrant’s Registration Statement on Form 8-A filed on February 20, 1998). | |||
|
| Amendment No. 1 to Rights Agreement dated March 27, 2002 by and between Penn Virginia Corporation and American Stock Transfer & Trust Company (incorporated by reference to Exhibit 4.1 of Registrant’s Report on Form 8-K filed on March 28, 2002). | |||
| (10.1) |
|
| Amended and Restated Credit Agreement dated as of | ||
|
| Penn Virginia Corporation and Affiliated Companies Employees’ Stock Ownership Plan, as amended (incorporated by reference to Exhibit 10.2 of Registrant’s Annual Report on Form 10-K for the year ended December 31, 2001). | |||
|
| Penn Virginia Corporation and Affiliated Companies’ Employees’ 401(k) Plan, as amended (incorporated by reference to Exhibit 10.3 of Registrant’s Annual Report on Form 10-K for the year ended December 31, 2001). | |||
|
| Penn Virginia Corporation 1995 Third Amended and Restated Directors’ Stock Compensation | |||
|
| Penn Virginia Corporation Amended 1999 Employee Stock Incentive | |||
|
| Omnibus Agreement (“Omnibus Agreement”) dated October 30, 2001 among Penn Virginia Corporation, Penn Virginia Resource GP, LLC, Penn Virginia Operating Co., LLC and Penn Virginia Resource Partners, L.P. (incorporated by reference to Exhibit 10.2 to Registrant’s Report on Form 8-K filed on November 14, 2001). | |||
92
| |||
| |||
| (10.9) | Amendment | ||
|
| Penn Virginia Corporation 1994 Stock Option Plan, as amended (incorporated by reference to Exhibit 10.5 to Registrant’s Annual Report on Form 10-K for the year ended December 31, 1999). | |
|
| Change of Control Severance Agreement dated May 7, 2002 between Penn Virginia Corporation and A. James Dearlove (incorporated by reference to Exhibit 10.1 of Registrant’s Report on Form 10-Q for the period ended March 31, 2002). | |
|
| Change of Control Severance Agreement dated May 7, 2002 between Penn Virginia Corporation and Frank A. Pici (incorporated by reference to Exhibit 10.2 of Registrant’s Report on Form 10-Q for the period ended March 31, 2002). | |
|
| Change of Control Severance Agreement dated May 7, 2002 between Penn Virginia Corporation and Nancy M. Snyder (incorporated by reference to Exhibit 10.3 of Registrant’s Report on Form 10-Q for the period ended March 31, 2002). | |
|
| Change of Control Severance Agreement dated May 7, 2002 between Penn Virginia Corporation and H. Baird Whitehead (incorporated by reference to Exhibit 10.4 of Registrant’s Report on Form 10-Q for the period ended March 31, 2002). | |
|
| Change of Control Severance Agreement dated May 7, 2002 between Penn Virginia Corporation and Keith D. Horton (incorporated by reference to Exhibit 10.5 of Registrant’s Report on Form 10-Q for the period ended March 31, 2002). | |
| (12) |
| ||
| (14) |
| ||
| (16) | Letter dated May 8, 2002 from Arthur Andersen LLP to the Securities and Exchange Commission (incorporated by reference to Exhibit 16.1 of Registrant’s Current Report on Form 8K filed May 9, 2002). | ||
| (21) | Subsidiaries of Registrant. | ||
|
| Consent of KPMG LLP. | |
| (23.2) |
| ||
| (31.1) |
| ||
| (31.2) | Certification Pursuant to 18 U.S.C. Section 1350, as Adopted Pursuant to Section 302 of the Sarbanes-Oxley Act of 2002. | ||
| (32.1) | Certification Pursuant to 18 U.S.C. Section 1350, as Adopted Pursuant to Section 906 of the Sarbanes-Oxley Act of 2002. | ||
|
| Certification Pursuant to 18 U.S.C. Section 1350, as Adopted Pursuant to Section 906 of the Sarbanes-Oxley Act of 2002. | |
Page 74(b) Reports on Form 8-K
|
| |||
| ||||
|
Page 75On October 30, 2002, Registrant filed a report on Form 8-K. The report involved the resignation of a director of Registrant’s Board of Directors.
On December 6, 2002, Registrant filed a report on Form 8-K. The report involved the election of a director to Registrant’s Board of Directors.
93