UNITED STATES SECURITIES AND EXCHANGE COMMISSION
WASHINGTON, D. C. 20549
FORM 10-K
| | | | | |
| ☒ | ANNUAL REPORT PURSUANT TO SECTION 13 OR 15(d) OF THE SECURITIES EXCHANGE ACT OF 1934 |
For the Fiscal Year Ended: December 31, 20202023
OR
| | | | | |
| ☐ | TRANSITION REPORT PURSUANT TO SECTION 13 OR 15(d) OF THE SECURITIES EXCHANGE ACT OF 1934 |
Commission File Number: 001-14733
Lithia Motors, Inc.
(Exact name of registrant as specified in its charter)
| | | | | | | | | | | |
| Oregon | | 001-1473393-0572810 |
| (State or other jurisdiction of incorporation or organization) | | (Commission File Number) (I.R.S. Employer Identification No.) |
| 150 N. Bartlett Street, | Medford, | Oregon | 97501 |
| (Address of principal executive offices) | (Zip Code) |
(541) 776-6401
(Registrant’s telephone number including area code)
Securities registered pursuant to Section 12(b) of the Act:
| | | | | | | | | | | | | | |
| Title of each class | | Trading Symbol(s) | | Name of each exchange on which registered |
Class A commonCommon stock without par value | | LAD | | The New York Stock Exchange |
Securities registered pursuant to Section 12(g) of the Act: None
Indicate by check mark if the registrant is a well-known seasoned issuer, as defined in Rule 405 of the Securities Act. Yes ☒ No ☐
Indicate by check mark if the registrant is not required to file reports pursuant to Section 13 or Section 15(d) of the Act. Yes ☐ No ☒
Indicate by check mark whether the registrant: (1) has filed all reports required to be filed by Section 13 or 15(d) of the Securities Exchange Act of 1934 during the preceding 12 months (or for such shorter period that the registrant was required to file such reports); and (2) has been subject to such filing requirements for the past 90 days. Yes ☒ No ☐
Indicate by check mark whether the registrant has submitted electronically every Interactive Data File required to be submitted pursuant to Rule 405 of Regulation S-T (§232.405 of this chapter) during the preceding 12 months (or for such shorter period that the registrant was required to submit and post such files). Yes ☒ No ☐
Indicate by check mark whether the registrant is a large accelerated filer, an accelerated filer, a non-accelerated filer, a smaller reporting company, or an emerging growth company. See the definitions of “large accelerated filer,” “accelerated filer,” “smaller reporting company,” and “emerging growth company” in Rule 12b-2 of the Exchange Act.
| | | | | | | | | | | | | | |
| Large accelerated filer | Non-accelerated filer | Accelerated filer | Smaller reporting company | Emerging growth company |
| ☒ | ☐ | ☐ | ☐ | ☐ |
If an emerging growth company, indicate by check mark if the registrant has elected not to use the extended transition period for complying with any new or revised financial accounting standards provided pursuant to Section 13(a) of the Exchange Act. ☐
Indicate by check mark whether the registrant has filed a report on and attestation to its management’s assessment of the effectiveness of its internal control over financial reporting under Section 404(b) of the Sarbanes-Oxley Act (15 U.S.C. 7262(b)) by the registered public accounting firm that prepared or issued its audit report. ☒
If securities are registered pursuant to Section 12(b) of the Act, indicated by check mark whether the financial statements of the registrant included in the filing reflect the correction of an error to previously issued financial statements. ☐
Indicate by check mark whether any of those error corrections are restatements that required a recovery analysis of incentive-based compensation received by any of the registrant’s executive officers during the relevant recovery period pursuant to §240.10D-1(b). ☐
Indicate by check mark whether the registrant is a shell company (as defined in Rule 12b-2 of the Act). Yes ☐ No ☒
The aggregate market value of the voting and non-voting common equity held by non-affiliates of the Registrant was approximately $3,392,434,000$8,371,919,000 computed by reference to the last sales price ($151.33)304.11) as reported by the New York Stock Exchange for the Registrant’s Class A common stock, as of the last business day of the Registrant’s most recently completed second fiscal quarter (June 30, 2020)2023). As of February 19, 2021,23, 2024, there were 26,432,37627,530,936 shares of the registrant’s Class A common stock outstanding and 200,000 shares of the registrant’s Class B common stock outstanding.
DOCUMENTS INCORPORATED BY REFERENCE
The Registrant has incorporated into Part III of Form 10-K, by reference, portions of its Proxy Statement for its 20212024 Annual Meeting of Shareholders.
LITHIA MOTORS, INC.
20202023 FORM 10-K ANNUAL REPORT
TABLE OF CONTENTS
| | | | | | | | |
| Item Number | Item | Page |
| | |
| | |
| | |
| | |
| | None |
| Item 1C. | Cybersecurity | |
| | |
| | |
| | Not applicable |
| | |
| | |
| | |
| | |
| | | Not applicable
| The company has early adopted the removal of the disclosure required by this item, as permitted by SEC rule changes effective February 10, 2021. | |
| | |
| Results of operations | |
| Liquidity and capital resources | |
| Critical accounting estimates | |
| | |
| | |
| | None |
| | |
| | None |
| | Not applicable |
| | |
| | |
| | |
| | |
| | |
| | |
| | |
| | |
| | |
| | |
| | |
| | |
| Item 16. | Form 10-K Summary | None |
| | |
| SIGNATURES | | |
PART I
Item 1. Business
As used in this Annual Report, the terms “Lithia,” “Lithia and Driveway,” “LAD,” “the Company,” “we,” “us,” and “our” refer collectively to Lithia Motors, Inc. and its subsidiaries, unless otherwise required by the context. Our store operations are conducted by our subsidiaries.
Forward-Looking Statements
Certain statements in this Annual Report, including in the sections entitled “Risk Factors,” Management’s“Management’s Discussion and Analysis of Financial Condition and Results of Operations” and “Business” constitute forward-looking statements within the meaning of the “Safe Harbor” provisions of the Private Securities Litigation Reform Act of 1995. Generally, you can identify forward-looking statements by terms such as “project”,“project,” “outlook,” “target”,“target,” “may,” “will,” “would,” “should,” “seek,” “expect,” “plan,” “intend,” “forecast,” “anticipate,” “believe,” “estimate,” “predict,” “potential,” “likely,” “goal,” “strategy,” “future,” “maintain,” and “continue” or the negative of these terms or other comparable terms. Examples of forward-looking statements in this Form 10-K include, among others, statements we make regarding:
•Future market conditions, including anticipated vehiclecar and other sales levels;levels and the supply of inventory
•Anticipated impacts of the continued COVID-19 pandemic on the U.SOur business strategy and local economies in which we operate,plans, including our business operationsachieving our 2025 Plan and consumer demand;related targets
•ContinuationThe growth, expansion, make-up, and success of our salesnetwork, including our finding accretive acquisitions and services, including in-store appointments and home deliveries;acquiring additional stores
•Expectations regarding our inventory levels and manufacturer and lender incentives;Annualized revenues from acquired stores
•ExpectedThe growth fromand performance of our Driveway e-commerce home solutionssolution and digital strategies;Driveway Finance Corporation (DFC), their synergies and other impacts on our business and our ability to meet Driveway and DFC-related targets
•The impact of sustainable vehicles and other market and regulatory changes on our business
•Our capital allocations and uses and levels of capital expenditures in the future
•Expected operating results, such as improved store performance;performance, continued improvement of selling, general and administrative expenses (SG&A) as a percentage of gross profit and all projections;any projections
•Anticipated integration, success and growth of acquired stores;
•Anticipated ability to capture additional market share;
•Anticipated ability to find accretive acquisitions;
•Expected revenues from acquired stores;
•Anticipated synergies, ability to monetize our investment in digital innovation;
•Anticipated additions of dealership locations to our portfolio in the future;
•AnticipatedOur anticipated financial condition and liquidity, including from our cash and the future availability onof our credit facilities, and unfinanced real estate;estate, and other financing sources
•Anticipated use of proceeds fromOur continuing to purchase shares under our financings;share repurchase program
•Anticipated allocations, uses and levels of capital expenditures in the future;
•Expectations regardingOur compliance with financial and restrictive covenants in our credit facilityfacilities and other debt agreements;
•Statements regarding furloughed employees and cost reductions;agreements
•Our strategies for customer retention, growth, market position, financial results and risk management; and
•Expectations regarding programs and initiatives for employee recruitment, training, and retention.retention
•Our strategies and targets for customer retention, growth, market position, operations, financial results, and risk management
Because forward-looking statements relate to the future, they are subject to inherent uncertainties, risks and changes in circumstances that are difficult to predict and many of which are outside of our control. Forward-looking statements are not guarantees of future performance, and our actual results of operations, financial condition and liquidity and development of the industry in which we operate may differ materially from those made in or suggested by the forward-looking statements in this Annual Report. Therefore, you should not rely on any of these forward-looking statements. The risks and uncertainties that could cause actual results to differ materially from estimated or projected results include, without limitation, the factors as discussed in Part I, Item 1A. Risk Factors, and in Part II, Item 7. Management’s Discussion and Analysis of Financial Condition and Results of Operations, and, from time to time, in our other filings we make with the Securities and Exchange Commission (SEC).
Any forward-looking statement made by us in this Annual Report is based only on information currently available to us and speaks only as of the date on which it is made. Except as required by law, we undertake no obligation to publicly update any forward-looking statement, whether written or oral, that may be made from time to time, whether as a result of new information, future developments or otherwise.
Business Overview
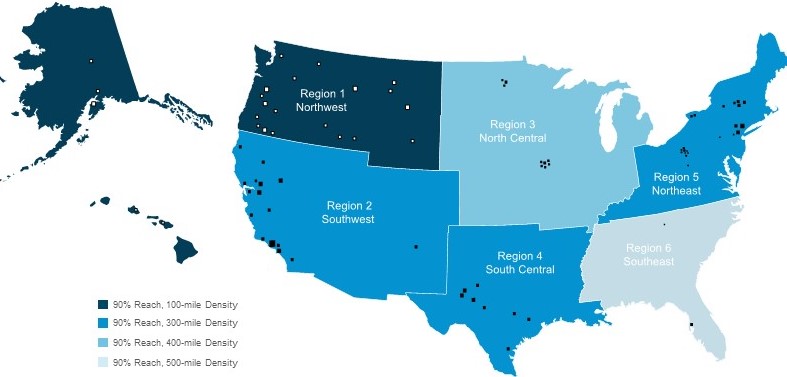
Lithia Motors, Inc. is a growth company powered by people and innovation with a long-term plan to profitably consolidateone of the largest retail sectorglobal automotive retailers providing an array of products and services throughout the vehicle ownership lifecycle. Convenient and hassle-free experiences are offered through our comprehensive network of physical locations, e-commerce platforms, captive finance solutions and other synergistic adjacencies. We have delivered consistent profitable growth in our country. As a leading provider of personal transportation solutions reaching 100% of the United States within 400 miles, we are among the fastest growing companies in the Fortunemassive and unconsolidated industry. Our highly
500 (ranked #252 ondiversified and competitively differentiated design provides us the Fortune 500 list for 2020).flexibility and scale to pursue our vision to modernize personal transportation solutions wherever, whenever and however consumers desire. As of December 31, 2020,2023, we operated 209344 locations representing 3347 brands in 22 states. All of our revenues are generated withinacross the U.S.United States, United Kingdom, and all of our property and equipment is located within the U.S.Canada.
| | | | | | | | | | | |
| Year Ended December 31, |
| 2023 |
| Total Revenue | | Total Gross Profit |
| United States | 90 | % | | 92 | % |
| United Kingdom | 6 | % | | 5 | % |
| Canada | 4 | % | | 3 | % |
| | | |
| | | |
| | | |
| | | |
| | | |
| | | |
| | | |
| | | |
| | | |
| | | |
| | | |
| | | |
| | | |
| | | |
We offerLithia and Driveway (LAD) offers a wide array of products and services fulfilling the entire vehicle ownership lifecycle including new and used vehicles, finance and insurance products and automotive repair and maintenance. We strive for diversification in our products, services, brands and geographic locations to reduce dependence on any one manufacturer, reduce susceptibility to changing consumer preferences, manage market risk and maintain profitability. Our diversification, along with our operating structure, provides a resilient and nimble business model.
Our omni-channel strategy pragmatically disrupts the industry by leveraging our experienced teams, massive selection of owned inventories, technology and physical logistics network. We seek to provide customers with a seamless experience across online and physical offerings, broad selection and access to specialized expertise and knowledge. Our physical logistics network enables us to provide convenient touch points for customers and provide services throughout the entire ownership life cycle. We use digital technologies to further activate our physical network and generate additional revenues. This unique growth model generates significant cash flows, which funds innovation and the expansion of our nationwide network, creating personal transportation solutions wherever, whenever and however consumers desire.
Founded in 1946 and incorporated in Oregon in 1968, we completed our initial public offering in 1996.
Business Strategy
We seek to provide customers choice with a seamless, blended online and physical retail experience, with broad selection and access to specialized expertise and knowledge. Our physicalcomprehensive network enables us to provide convenient touch points for customers and provide services throughout the vehicle life cycle. We seek to increase market share and optimize profitability by focusing on the consumer experience and applying proprietary performance measurement systems fueled by data science. In July 2020, we introducedto drive high performance. Our Driveway aand GreenCars brands compliment our in-store experiences and provide convenient, simple, and transparent platform,platforms that servesserve as our e-commerce home solution andsolutions. Diversifying our business with Driveway Finance Corporation (DFC), our captive auto finance division, allows us to deliver differentiated, proprietary digital experiences. We believe Driveway will allow us to further activateprovide financing solutions for customers and diversify our physical network and capture additional earnings.business model with an adjacent product.
Our long-term strategy to create value for our customers, employees and shareholders includes the following elements:
Driving operational excellence, innovation and diversification
We remain focusedLAD builds magnetic brand loyalty in our 344 stores and with Driveway, our e-commerce home delivery experience, and GreenCars, our electric vehicle learning resource and marketplace. Operational excellence is achieved by focusing the business on achieving performance through increasingconvenient and transparent consumer experiences supported by proprietary data science to improve market share, consumer loyalty, and profitability at each of our locations.profitability. By promoting an entrepreneurial model with our in-store experiences, we build strong businesses responsive to each of our local markets. Utilizing performance-based action plans, we strive to increase market share, drive operational performance, develop high-performing teams and foster manufacturer relationships.
In response to evolving consumer preferences, we invest in modernization that supports and expands our core business. These digital strategies combine our experienced, knowledgeable workforce with our owned inventory and physical network of stores, enabling us to be agile and adapt to consumer preferences and market specific conditions. Additionally, we systematically explore transformative adjacencies, which are identified to be synergistic and complementary to our existing business such as DFC, our captive auto loan portfolio.
Our investments in modernization are well under way and are taking hold with our teams as they provide digital shopping experiences including finance, contactless test drives and home delivery or curbside pickup for vehicle purchases. Our people and these solutions power our national brands, overlaying our physical footprint in a way that we believe attracts a larger population of digital consumers seeking transparent, empowered, flexible and simple buying and servicing experiences.
Our performance-based culture is geared toward an incentive-based compensation structure for a majority of our personnel. We develop pay plans that are measured based upon various factors such as customer satisfaction, profitability and individual performance metrics. These plans serve to reward team members for creating customer
loyalty, achieving store potential, developing high-performing talent, meeting and exceeding manufacturer requirements and living our core values.
We have centralized many administrative functions to drive efficiencies and streamline store-level operations. The reduction of administrative functions at our stores allows our local managers to focus on customer-facing opportunities to increase revenues and gross profit. Our operations are supported by regional and corporate
management, as well as dedicated training and personnel development programs which allow us to share best practices across our network and develop management talent.
Growth through acquisition and network optimization
Our acquisition growth strategy has been successful both financially and culturally. Our disciplined approach focuses on acquiring new vehicle franchises, which operate in markets ranging from mid-sized regional markets to metropolitan markets. Acquisition of these businesses increases our proximity to consumers throughout North America and the United States.Kingdom. While we target annual after tax return of more than 15% for our acquisitions, we have averaged over a 25% return by the third year of ownership due to a disciplined approach focusing on accretive, cash flow positive targets at reasonable valuations. We have a greater than 95% acquisition employee retention rate, demonstrating the valuable career opportunities we provide to our employees. In addition to being financially accretive, acquisitions aim to drive network growth that improves our ability to serve customers through vast selection, greater density and access to customers and ability to leverage national branding and advertising.
As we focus on expanding our physical network of stores, one of the criteria we evaluate is a valuation multiple between 3x to 7x of investment in intangibles to estimated annualized adjusted EBITDA, with various factors including location, ability to expand our network and talent considered in determining value. We also target an investment in intangibles as a percentage of annualized revenues in the range of 15% to 30%.
During 2020,2023, we acquired thirty56 stores and divested fiveeight stores. We invested $1.2$1.1 billion, net of floor plan debt, to acquire these stores and we expectanticipate these acquisitions to add over $3.5nearly $3.8 billion in annualannualized revenues. We invested approximately $861 million in intangibles, implying a 6.0x multiple of estimated annualized adjusted EBITDA and an investment in intangibles as a percentage of annualized revenues of 24% without taking into account any synergies. The remaining amount invested of approximately $340 million related to real estate purchased, used vehicle inventory acquired, and other assets and liabilities.
We regularly optimize and balance our network through strategic divestitures to ensure continued high performance. We believe our disciplined approach provides us with attractive acquisition opportunities and expanded coast-to-coast coverage.
Thoughtful capital allocation
We manage our liquidity and available cash to support our long-term plan focused on growth through acquisitions and investments in Driveway, our national e-commerce home solution, and support for our existing business.business, technology and adjacencies that expand and diversify our business model. Our capitalfree cash flow deployment strategy targets an allocation of 65% investment in acquisitions, 25% investment in capital expenditures, innovation, and diversification and 10% in shareholder return in the form of dividends and share repurchases. During 2020,2023, we invested in our facilities, utilizing $167.8utilized $230.2 million for capital expenditures investing in our existing business and paid $29.1$52.8 million in dividends. As of December 31, 2020,2023, we had available liquidity of $1.4$1.7 billion, which was comprised of $160.2$825.0 million in cash and $1.2 billion$870.4 million availability on our credit facilities and unfloored new vehicle inventory.facilities. In addition, our unfinanced real estate could provide additional liquidity of approximately $471 million.$0.4 billion.
Marketing
One of ourLithia & Driveway’s core values, Earnvalue, “Earn Customers for Life, definesLife”, drives our marketmarketing strategy by appealing to empower consumers throughout the vehicle ownership lifecycle. To place ease and value at our consumers’ desire for affordability, transparencycustomers’ fingertips, we are constantly evolving the retail experience where customers can choose transparent, convenient ways to buy, sell, or service their vehicles wherever, whenever, and convenience. We employhowever they desire.
Our national, regional, and local brands to connect with consumers withthrough advertising tailored to the individual brand and market. Utilizing data analysis and multi-channelomnichannel communications, we strive to attractcreate deeper and retain customersricher offerings to build lifelong loyalty throughout the vehicle ownership life cycle.
With a vast selection represented by the nation’s third-largestlargest U.S. new and preowned vehicle inventory for sale online, we employ search engine optimization, search engine marketing, online display, re-targeting,retargeting, social advertising, and traditional media, and direct marketing to reach consumers. Websites for each
Most consumers begin their shopping, buying, or selling activity on our store websites, Driveway, and GreenCars. With the importance of keeping consumer communications relevant, based on where they are in the shopping process or lifecycle of ownership, we have built a proprietary customer lifecycle communication platform. In an
industry where the competition often relies on third parties to manage their customer data, we manage our locations and Driveway,data internally. This goes beyond automotive needs, allowing us to leverage our e-commerce home solution,customer insights across many revenue streams.
These online channels provide customers with simple, transparent ways to manage their vehicle ownership including:including search new and usednew-and-used inventories, view current pricing, discountsapply incentives and specials,offers, calculate payments for purchase or lease, apply for financing, buy online, sell their vehicle, offering the consumer to schedule service appointments both in store or at home, schedule vehicle pick-up and delivery, and provide us feedback about their experience. During 2020,In 2023, our unique visitors increased 31%.over 30% on a same store basis from 2022.
Driveway, our online experience, puts customers in control of every aspect of their car ownership. They can browse a vast nationwide inventory of new, used, and certified pre-owned vehicles (CPO), then get a vehicle shipped straight to their driveway or pick it up from one of Lithia’s 300+ stores. In 2023, approximately 31.5 million unique users visited Driveway.com, a 46% increase from 2022. We believe no-haggle pricing transparency and a 7-day money-back guarantee make Driveway the better way to buy, sell, finance, or trade in a car online.
With the industry transitioning to more sustainable practices and alternative-fuel vehicles, we are excited that GreenCars, our online education resource for sustainable mobility, had approximately 5.9 million unique visitors in 2023 at GreenCars.com, a 58% increase from 2022. GreenCars is a leading source of knowledge designed to promote the acceleration of electric vehicle (EV) adoption by educating the consumer on such topics as (1) fuel-efficient offerings from model comparisons, (2) personalized incentives, and (3) local rebates to charging network. GreenCars even connects consumers with the largest new-and-preowned inventory for when they are ready to purchase their sustainable vehicle.
Total advertising expense, net of manufacturer credits, was $97.4$248.2 million in 2020, $111.92023, $253.6 million in 20192022 and $108.7$162.2 million in 2018. In 2020, we2021. Over 82% of our advertising spent 87%in 2023 was on digital, social, listings, and one-to-one owner communications while 13% was spent in traditional media.communications. In all of our communications, we seek to convey the promise of a positive customer experience,
competitive pricing, and wide selection. We expect the portion of spending in digital channels to continue to increase as traditional media evolves to online consumption models.
Our manufacturer partners influence a significant portion of our advertising expense. Certain advertising and marketing expenditures are offset by manufacturer cooperative programs, which require us to submit requests for reimbursement to manufacturers for qualifying advertising expenditures. These advertising credits are not tied to specific vehicles and are earned as qualifying expenses are incurred. These reimbursements are recognized as a reduction of advertising expense. Manufacturer cooperative advertising credits were $23.9$54.2 million in 2020, $27.92023, $46.3 million in 20192022 and $25.5$35.6 million in 2018.2021.
Franchise Agreements
Each of our stores operates under a separate franchise agreement (a “Franchise Agreement”) with the manufacturer of the new vehicle brand it sells.
Typical automobile Franchise Agreementsvehicle franchise agreements specify the locations within a designated market area at which the store may sell vehicles and related products and perform approved services. The designation of the market areas and the allocation of new vehicles among stores are at the discretion of the manufacturer. Franchise Agreementsagreements do not, however, guarantee exclusivity within a specified territory.
A Franchise Agreementfranchise agreement may impose requirements on the store with respect to:
•facilities and equipment;
•inventories of vehicles and parts;
•minimum working capital;
•training of personnel; and
•performance standards for market share and customer satisfaction.
Each manufacturer closely monitors compliance with these requirements and requires each store to submit monthly financial statements. Franchise Agreementsagreements also grant a store the right to use and display manufacturers’ trademarks, service marks and designs in the manner approved by each manufacturer.
We have determined the useful life of a Franchise Agreementfranchise agreement is indefinite, even though certain Franchise Agreementsfranchise agreements are renewed after one to six years. In our experience, agreements are routinely renewed without substantial cost and there are legal remedies to help prevent termination. Certain Franchise Agreementsfranchise agreements have no termination date. In addition, state franchise laws protect franchised automotive retailers. Under certain laws, a manufacturer may not
terminate or fail to renew a franchise without good cause or prevent any reasonable changes in the capital structure or financing of a store.
TheOur typical Franchise Agreementfranchise agreement provides for early termination or non-renewal by the manufacturer upon:
•a change of management or ownership without manufacturer consent;
•insolvency or bankruptcy of the dealer;
•death or incapacity of the dealer/manager;
•conviction of a dealer/manager or owner of certain crimes;
•misrepresentation of certain sales or inventory information by the store, dealer/manager or owner to the manufacturer;
•failure to adequately operate the store;
•failure to maintain any license, permit or authorization required for the conduct of business;
•poor market share; or
•low customer satisfaction index scores.
Franchise Agreementsagreements generally provide for prior written notice before a franchise may be terminated under most circumstances. We also sign master framework agreements with most manufacturers that impose additional requirements. See Item 1A. Risk Factors.
Competition
The retail automotive business is highly competitive. Currently, there are approximatelymore than 16,500 new vehicle franchise dealers in the United States, many4,500 in the UK, and 3,400 in Canada. Many of whichthese franchised dealers are independent stores managed by individuals, families or small retail groups. We compete primarily with other automotive retailers, both publicly- and privately-held and other onlineused-only automotive retailers such as CarMax, Carvana, Shift and Vroom.
Vehicle manufacturers have designated specific marketing and sales areas within which only one dealer of a vehicle brand may operate. In addition, our Franchise Agreementsfranchise agreements typically limit our ability to acquire multiple dealerships of a given brand within a particular market area. Certain state franchise laws also restrict us from relocating our dealerships, or establishing new dealerships of a particular brand, within any area that is served by another dealer with the same brand. To the extent that a market has multiple dealers of a particular brand, as certain markets we operate in do, we are subject to significant intra-brand competition.
We are larger and have more financial resources than most private automotive retailers with which we currently compete in the majority of our regional markets. We compete directly with retailers with similar or greater resources in our existing metro and non-metro markets. We also compete based on dealer reputation in the various markets. If we enter other new markets, we may face competitors that are larger or have access to greater financial resources.resources or have strong brands. We do not have any cost advantage in purchasing new vehicles from manufacturers. We rely on advertising and merchandising, pricing, our customer guarantees and sales model, our sales expertise, service reputation and the location of our stores to sell new vehicles.
Regulation
Automotive and Other Laws and Regulations
We operate in a highly regulated industry. A number of state and federal laws and regulations affect our business. In every state in which we operate, we must obtain various licenses to operate our businesses, including dealer, sales and finance and insurance licenses issued by state regulatory authorities. Numerous laws and regulations govern our business, including those relating to our sales, operations, financing, insurance, advertising and employment practices. These laws and regulations include state franchise laws and regulations, consumer protection laws, privacy laws, escheatment laws, anti-money laundering laws and federal and state wage-hour, anti-discrimination and other employment practices laws.
Our financing activities with customers are subject to numerous federal, state and local laws and regulations. In recent years, there has been an increase in activity related to oversight of consumer lending by the Consumer Financial Protection Bureau (CFPB), which has broad regulatory powers. The CFPB has supervisory authority over large non-bank auto finance companies, including DFC. The CFPB can use this authority to conduct supervisory examinations to ensure compliance with various federal consumer protection laws. The CFPB does not have direct authority over automotive dealers; however, its regulation of larger automotive finance companies and other financial institutions could affect our financing activities. Claims arising out of actual or alleged violations of law may
be asserted against us or our stores by individuals, a class of individuals, or governmental entities. These claims may expose us to significant damages or other penalties, including revocation or suspension of our licenses to conduct store operations and fines.
The vehicles we sell are also subject to rules and regulations of various federal and state regulatory agencies.
Environmental, Health, and Safety Laws and Regulations
Our operations involve the use, handling, storage and contracting for recycling and/or disposal of materials such as motor oil and filters, transmission fluids, antifreeze, refrigerants, paints, thinners, batteries, cleaning products, lubricants, degreasing agents, tires and fuel. Consequently, our business is subject to a complex variety of federal, state and local requirements that regulate the environment and public health and safety.
Most of our stores use above ground storage tanks, and, to a lesser extent, underground storage tanks, primarily for petroleum-based products. Storage tanks are subject to periodic testing, containment, upgrading and removal under the Resource Conservation and Recovery Act and its state law counterparts. Clean-up or other remedial action may be necessary in the event of leaks or other discharges from storage tanks or other sources. In addition, water quality protection programs under the federal Water Pollution Control Act (commonly known as the Clean Water Act), the Safe Drinking Water Act and comparable state and local programs govern certain discharges from our operations. Similarly, certain air emissions from operations, such as auto body painting, may be subject to the federal Clean Air Act and related state and local laws. Health and safety standards promulgated by the Occupational Safety and Health Administration of the United States Department of Labor and related state agencies also apply.
Certain stores may become a party to proceedings under the Comprehensive Environmental Response, Compensation, and Liability Act, or CERCLA, typically in connection with materials that were sent to former recycling, treatment and/or disposal facilities owned and operated by independent businesses. The remediation or clean-up of facilities where the release of a regulated hazardous substance occurred is required under CERCLA and other laws.
We incur certain costs to comply with environmental, health and safety laws and regulations in the ordinary course of our business. We do not anticipate, however, that the costs of compliance will have a material adverse effect on our business, results of operations, cash flows or financial condition, although such outcome is possible given the nature of our operations and the extensive environmental, public health and safety regulatory framework. We may become aware of minor contamination at certain of our facilities, and we conduct investigations and remediation at properties as needed. In certain cases, the current or prior property owner may conduct the investigation and/or remediation or we have been indemnified by either the current or prior property owner for such contamination. We do not currently expect to incur significant costs for remediation. However, no assurances can be givenwe cannot provide assurance that material environmental commitments or contingencies will not arise in the future, or that they do not already exist but are unknown to us.
Human Capital
As a company drivenInspired by our mission statement, “Growth Powered by People,” we place a high degreeprioritize the importance of value in each of our team membersevery Lithia & Driveway associate’s professional success, well-being, and their individual professional success. Promotingsafety. Our approach to attracting, retaining, rewarding, and hiringdeveloping the best talent available,includes defining clear expectations, providing excellentexceptional training, and rewarding performance helps us buildrecognizing employee milestones and metrics. These efforts are integral to building dynamic teams to serve our customers.who will “Earn Customers for Life” and drive operational excellence. We cultivatefoster an entrepreneurial, high-performance, customer-centric culture designed to encourage internal promotions, develop leadership skills, and strive to develop leaders from within. We continue to develop tools, training andoffer professional growth opportunities that accelerate the depth of our talent.opportunities.
As of December 31, 2020, we2023, our subsidiaries employed approximately 14,53827,446 persons on a full-time equivalent basis in our nationwideglobal network of 209344 retail locations. Our total workforce was comprised of approximately 20%21% female employees and approximately 43% of our workforce was comprised45% of minorities. More than 98%Our management consisted of approximately 21% females and approximately 36% minorities in leadership positions. In both 2023 and 2022, approximately 97% of our workforce earned above minimum wage and our voluntary turnover rate was less than 8% during 2020.wage.
Some examples of our key employee-focused programs and initiatives that are focused on attracting, retaining and developing our high performing workforce include:
•AMP program (Accelerate My Potential), which beganIn 2023, we launched a company-wide Culture Poll to amplify the employee voice. With an 80% participation rate, the survey revealed engagement scores surpassing benchmarks, indicating positive
progress in 2016,creating a positive workplace experience. The survey also offered valuable insights, leading to the development of action plans by managers to address opportunities to “Improve Constantly.”
•The DART (Develop, Analyze, Research, and Transform) Program started in 2020 to build high-performing leaders who aid in achieving our goal to redefine the automotive industry by providing transportation solutions wherever, whenever, and however consumers desire. The DART Program is designed to deepengive on-the-job exposure to various areas of the knowledgeorganization through rotations while providing supplemental training necessary to grow internal talent into leadership roles. The program identifies data-centric, customer-focused, proactive people who will push stores to be their best for our customers. DART participants learn the ins and outs of future leaders in all aspects of our businessperformance standards and develop leadership skillsbuild relationships cross-functionally to better position participants for a future as a general manager in one of our stores.achieve milestones and accelerate their careers.
•Lithia Women Lead, which beganLaunched in 2016, the AMP (Accelerate My Potential) Program initially targeted general manager readiness. Since 2021, it has evolved to focus on preparing high performers for various leadership roles beyond general manager.
•Introduced in 2015, provides an avenuethe Women LEAD (Learn, Explore, Achieve, and Develop) Program offers a platform for women inwithin the organization to connect, learn, and develop. The program includesgrow together. Featuring events throughout the year, that provide women in the organization the opportunityprogram facilitates networking, role modeling, and learning opportunities aimed to network, act as role models and inspire one another’s growth.foster professional development.
•Talent development. Lithia promotesOur learning and development initiatives are dedicated to promoting employee professional developmentgrowth through various programs includingcurated content paths, specialized curriculums, and tuition reimbursement programs covering up to 75% of an employee’s undergraduate or graduate tuition costs;costs. Additional programs provide Master Automotive Service Excellence (ASE) training and certification, andalong with Original Equipment Manufacturer (OEM) training for our technicians; and daily on-the-job training resources through our Learning Center.technicians.
During 2020,As one of the largest global automotive retailers, we also investedare committed to ongoing investments in and expandedexpanding the roles and capabilitiesskills of our workforce to drive the developmentcustomer excellence and support of our e-commerce and digital technology capabilities. We believe there is a competitive advantage to integrate and develop individuals with these skill sets and they are an integral part of supporting our five year growth plan and launch of Driveway.operational performance. As our business evolves, we will remain focusedcontinues to evolve, our unwavering focus remains on havingensuring that our human capital capabilities, systems, and processes are well-aligned with and in place to support of our strategic objectives and align with our strategy.growth plans.
Seasonality and Quarterly Fluctuations
In a stable environment, the automotive industry has generally experienced higher volumes of vehicle unit sales in the second and third quarters of each year due to consumer buying trends and the introduction of new vehicle models and, accordingly, we expect our revenues and operating results to generally be higher during these periods. In addition, we generally experience higher volume of luxury vehicles, which have higher average selling prices and gross profit per vehicle, during the fourth quarter. The timing of our acquisition activity, which varies, and ability to integrate stores into our existing cost structure has moderated this seasonality. However, if conditions occur that weaken automotive sales, such as severe weather in the geographic areas in which our dealerships operate, war, high fuel costs, depressed economic conditions including unemployment or weakened consumer confidence or similar adverse conditions, or if our ability to acquire stores changes, our revenues for the year may be disproportionately adversely affected.
Available Information and NYSE Compliance
We make available free of charge, on our website at www.lithiainvestorrelations.com, our annual reports on Form 10-K, quarterly reports on Form 10-Q, current reports on Form 8-K, and amendments to those reports filed or furnished pursuant to Section 13(a) or 15(d) of the Exchange Act, as soon as reasonably practicable after they are filed electronically with the SEC. The information found on our website is not part of this Annual Report on Form 10-K. You may also obtain copies of these reports by contacting Investor Relations at 877-331-3084.
Item 1A. Risk Factors
You should carefully consider the risks described below before making an investment decision. The risks described below are not the only ones facing our company. Additional risks not presently known to us, or that we currently deem immaterial, may also impair our business operations.
Risks relatedRelated to our businessOur Business
The automotive retail industry is sensitive to changing economic conditions and various other factors. Our business and results of operations are substantially dependent on new vehicle sales levels in the United
States and in our particular geographic markets and the level of gross profit margins that we can achieve on our sales of new vehicles, all of which are very difficult to predict.
Our business is heavily dependent on consumer demand and preferences. A downturn in overall levels of consumer spending may materially and adversely affect our revenues and gross profit margins. Retail vehicle sales are cyclical and historically have experienced periodic downturns characterized by weak demand. These cycles are often dependent on general economic conditions and consumer confidence, as well as the level of discretionary personal income and credit availability. Additionally, other economic factors, such as rising and sustained periods of high crude oil and fuel prices, may impact consumer demand and preferences. As we operate in 21 states,internationally, including across the U.S., Canada, and the U.K., changes in and the severity of economic conditions may vary by market. Economic conditions may be anemic for an extended period of time, or deteriorate in the future. This would have a material adverse effect on our retail business, particularly sales of new and used vehicles.
The economies of the United States, Canada and the United Kingdom have recently experienced heightened inflationary pressures, impacting the costs of labor, fuel and other costs. Additionally, recent increases in interest rates have impacted new and used vehicle sales and vehicle affordability due to the direct relationship between interest rates and monthly loan payments, a critical factor for many vehicle buyers, and the impact interest rates have on customers’ borrowing capacity and disposable income. Consumer demand may be further adversely impacted if interest rates continue to increase or are sustained at current levels. In an inflationary environment, depending on automotive industry and other economic conditions, we may be unable to raise prices to keep up with the rate of inflation, which would reduce our profit margins. A period of sustained inflationary and interest rate pressures could impact our profitability.
Approximately 14.615.6 million, 17.113.9 million, and 17.315.1 million new vehicles were sold in the United States in 2020, 2019,2023, 2022, and 2018,2021, respectively. Certain industry analysts have predicted that new vehicle sales will be approximately 1615.7 million for 2021.2024. If new vehicle production exceeds the rate at which new vehicles are sold, our gross profit per vehicle could be adversely affected by this excess and any resulting changes in manufacturer incentive and marketing programs. See the risk factor “If manufacturers or distributors discontinue or change sales incentives, warranties and other promotional programs, our business, results of operations, financial condition and cash flows may be materially adversely affected” below. Economic conditions and the other factors described above may also materially adversely impact our sales of used vehicles, parts and repair and maintenance services, and automotive finance and insurance products.
The novel coronavirus has had and may continue to have an adverse effect our business, financial condition, results of operations and cash flows.
The novel coronavirus (COVID-19) pandemic has resulted in governmental authorities implementing measures to reduce the spread of COVID-19, which have adversely affected workforces, customers, supply chains, consumer sentiment, economies, and financial markets, including in states and regions in which we operate. We have modified certain business practices to conform to government restrictions and best practices encouraged by government and regulatory authorities, and implemented risk mitigation plans for critical items and services required to continue our operations. We are monitoring and managing our cash flows and have enacted cost saving measures to respond to the volatile environment. In addition, we continue to assess our capital deployment strategy. However, these measures may not be sufficient to prevent adverse impacts on our business and financial condition from COVID-19. Ongoing disruptions in our operations due to the COVID-19 pandemic may continue to adversely impact our business, results of operations, financial condition and cash flows. The impact of the COVID-19 pandemic on our business and financial performance will depend on future developments, including the duration, severity and any resurgences of the pandemic, which are uncertain and cannot be predicted.
Natural disasters, and adverse weather conditions, and public health emergencies can disrupt our business.
Our dealerships are in states and regions in the U.S.United States, Canada, and the U.K. in which actual or threatened natural disasters and severe weather events (such as hurricanes, earthquakes, fires, floods, landslides, wind and/or hail storms) or other extraordinary events have in the past, and may in the future, disrupt our dealership operations and impair the value of our dealership property. A disruption in our operations may adversely impact our business, results of operations, financial condition and cash flows. In addition to business interruption, the automotive retailing business is subject to substantial risk of property loss due to the significant concentration of property at dealership locations. The exposure on any single claim under our property and casualty insurance, medical insurance and workers’ compensation insurance varies based upon type of coverage. Our maximum exposure on any single claim is $5.5 million, subject to certain aggregate limit thresholds. Under our self-insurance programs, we retain various levels of aggregate loss limits, per claim deductibles and claims-handling expenses. Costs in excess of these retained risks may be insured under various contracts with third-party insurance carriers. As of December 31, 2023, we had total reserve amounts associated with these programs of $77.1 million.
The occurrence of regional epidemics or a global pandemic such as COVID-19 may adversely impact our business, results of operations, financial condition and cash flows. The extent to which global pandemics impact our business going forward will depend on factors such as the duration and scope of the pandemic; governmental, business, and individuals' actions in response to the pandemic; and the impact on economic activity, including the possibility of recession or financial market instability.
The automotive manufacturing supply chain spans the globe. As such, supply chain disruptions resulting from natural disasters, and adverse weather events, or public health emergencies may affect the flow of inventory or parts to us or our manufacturing partners. Such disruptions could have a material adverse effect on our business, financial condition, results of operations, or cash flows.
Increasing competition among automotive retailers reduces our profit margins on vehicle sales and related businesses. Further, the use of the Internet in the car purchasing process could materially adversely affect us.
AutomobileVehicle retailing is a highly competitive business. Our competitors include publicly and privately-owned dealerships, of which certain competitors are larger and have greater financial and marketing resources than we have.dealerships. Many of our competitors sell the same or similar makes of new and used vehicles that we offer in our markets at competitive prices. We do not have any cost advantage in purchasing new vehicles from manufacturers due to the volume of purchases or otherwise.
Our finance and insurance business and other related businesses, which have higher margins than sales of new and used vehicles, are subject to strong competition from various financial institutions and others.
The Internet has become a significant part of the sales process in our industry. Customers are using the Internet to compare pricing for vehicles and related finance and insurance services, which may further reduce margins for new and used vehicles and profits for related finance and insurance services. If Internet new vehicle sales are allowed to be conducted without the involvement of franchised dealers, our business could be materially adversely affected. In addition, other franchise groups have aligned themselves with services offered on the Internet or are investing heavily in the development of their own Internet capabilities, which could materially adversely affect our business, results of operations, financial condition and cash flows.
Our Franchise Agreementsfranchise agreements do not grant us the exclusive right to sell a manufacturer’s product within a given geographic area. Our revenues or profitability could be materially adversely affected if any of our manufacturers award franchises to others in the same markets where we operate or if existing franchised dealers increase their market share in our markets.
In addition, we may face increasingly significant competition as we strive to gain market share through acquisitions or otherwise. Our operating margins may decline over time as we expand into markets where we do not have a leading position.
Changes to the automotive industry and consumer views on car ownership could materially adversely affect our business, results of operations, financial condition and cash flows.
The automotive industry is predicted to experience rapid change in the years to come, including increases in ride-sharing services, advances in electric vehicle production, driverless technology, co-ownership and driverless technology. Ride-sharing services such as Uber and Lyft provide consumers with mobility options outside of the traditional car ownership and lease alternatives.subscription business models. Certain manufacturers and statesgovernments have declared commitments to various electric vehicle and zero emissions goals, such as the state of California’s executive order to require all new cars and passenger trucks sold in the state to be zero-emission vehicles by 2035. In addition, the U.K. government has proposed a ban on the sale of gasoline engines in new cars and new vans that would take effect as early as 2030 and a ban on the sale of gasoline hybrid engines in new cars and new vans as early as 2035. The overall impact of these options on the automotive industry is uncertain, and may include costly compliance challenges and lower levels of new vehicle sales.sales or sales through channels that do not include us.
Manufacturers continue to invest in increasing production and quality of BEVs (battery-electric vehicles)electric vehicles, including Battery-Electric Vehicles (BEVs), whichHybrid Electric Vehicles, and Plug-in Hybrid Electric Vehicles. BEVs generally require less maintenance than traditional cars and trucks. The effects of BEVs on the automotive industry are uncertain and may include reduced parts and service revenues, as well as changes in the level of sales of certain Finance and Insurance (F&I) products such as extended warranty and lifetime lube, oil and filter contracts.
Technological advances are also facilitating the development of driverless vehicles. The eventual timing of availability of driverless vehicles is uncertain due to regulatory requirements, technological hurdles, and uncertain consumer acceptance of these technologies. The effect of driverless vehicles on the automotive industry is uncertain and could include changes in the level of new and used vehicle sales, the price of new vehicles, and the role of franchised dealers, any of which could materially and adversely affect our business.
We compete in a dynamic industry, and we may invest significant resources to pursue strategies and develop new offerings that do not prove effective.
The vehicle retailing industry is experiencing significant changes as the expectations and behaviors of customers are shifting, and e-commerce and digital technology have become a more significant part of the sales process. We have made and may continue to make significant investments to drive the development of and support of e-commerce and digital technology capabilities, including the launch of Driveway, our e-commerce home solution, and DFC, our in-house consumer financing business. Changes or additions to our offerings may not attract or engage our customers or prove sufficiently profitable, and may reduce confidence in our brands, expose us to increased market or legal risks, subject us to new laws and regulations, or otherwise harm our business.
Customers may prefer other channels for vehicle sales and related finance and insurance services, because they may offer different or superior platforms, or because customers find those platforms easier to use, faster, or more cost effective than our services. We may not successfully anticipate or keep pace with industry changes, and we have and may continue to invest considerable financial resources, personnel, or other resources to pursue strategies that do not ultimately prove effective. A failure to capture the anticipated benefits of such investments could harm our results of operations and financial condition.
A decline of affordable and available vehicle financing in the lending market may adversely affect our vehicle sales volume.sales.
A significant portion of buyers finance their vehicle purchases. One of theThe primary finance sources used by consumersour customers use in connection with the purchase of a new or used vehicle is theare manufacturer captive finance company.companies, DFC, and sub-prime lenders. These captive finance companiesconsumer vehicle financing sources rely to a certain extent on the public debtfinancing markets and sources to provide the capital necessary to support their financing programs. In addition, the captive finance companiesthese financing sources, including DFC, will occasionally change their loan underwriting criteria to alter the risk profile of their loan portfolio. In addition, sub-prime lenders have historically providedthe event that the cost to customers to finance vehicles becomes more expensive, due to increases in interest rates by the financing for consumers who, for a varietysources or their sources of reasons, including poor credit histories and lack of down payment, do not have access to more traditional finance sources. Ifcapital, lenders tighten their credit standards, or there is a decline in the availability of credit in the lending market, the ability ofavailable vehicle financing declines, consumers may be unable or less willing to purchase vehicles, could be limited, which could have a material adverse effect on our business, results of operations, financial condition and cash flows.
Adverse conditions affecting one or more key manufacturers may negatively affect our business, results of operations, financial condition and cash flows.
We depend on our manufacturers to provide a supply of vehicles which supports expected sales levels. Any event that adversely affects a manufacturer’s ability to timely deliver new vehicles may adversely affect us by reducing our supply of popular new vehicles, leading to lower sales in our stores during those periods than would otherwise occur. For example, the shortage of chip supply and labor disruptions in 2021 and 2022 caused a significant constraint in the supply of new cars resulting in reduced volumes and increased gross profit margins on retail vehicle sales. As new vehicle availability continues to improve, volumes may improve; however, gross profit margins may be impacted. We depend on our manufacturers to deliver high-quality, defect-free vehicles. If a manufacturer experiences quality issues, our sales and financial performance may be adversely impacted. In addition, the discontinuance of a particular brand that is profitable to us could negatively impact our revenues and profitability.
Vehicle manufacturers would be adversely affected by economic downturns or recessions, adverse fluctuations in currency exchange rates, significant declines in the sales of their new vehicles, increases in interest rates, declines in their credit ratings, port closures, labor strikes or similar disruptions (including within their major suppliers), supply shortages or rising raw material costs, rising employee benefit costs, adverse publicity that may reduce consumer demand for their products, product defects, vehicle recall campaigns, litigation, poor product mix or unappealing vehicle design, or other adverse events. These and other risks could materially adversely affect any manufacturer and limit its ability to profitably design, market, produce or distribute new vehicles, which, in turn, could materially adversely affect our business, results of operations, financial condition and cash flows.
We are subject to a concentration of risk in the event of financial distress, including potential reorganization or bankruptcy, of a major vehicle manufacturer. We purchase substantially all of our new vehicles from various manufacturers or distributors at the prevailing prices available to all franchised dealers. Our sales volume could be materially adversely impacted by a manufacturer’s or distributor’s inability to supply our stores with an adequate supply of vehicles.
In the event of a manufacturer or distributor bankruptcy, we could be held liable for damages related to product liability claims, intellectual property suits or other legal actions. These legal actions are typically directed towards the vehicle manufacturer and it is customary for manufacturers to indemnify us from exposure related to any judgments associated with the claims. However, if damages could not be collected from the manufacturer or distributor, we could be named in lawsuits and judgments could be levied against us.
Many new manufacturers are entering the automotive industry. New companies have raised capital to produce fully electric vehicles or to license battery technology to existing manufacturers. Tesla hasand Rivian have demonstrated the ability to successfully introduce electric vehicles to the marketplace. Foreign manufacturers from China and India are
producing significant volumes of new vehicles and are entering the U.S.United States and selecting partners to distribute their products. Because the automotive market in the U.S.United States is mature and the overall level of new vehicle sales may not increase in the coming years, the success of new competitors will likely be at the expense of other, established brands. This could have a material adverse impact on our success in the future.
Federal regulations around fuel economy standards and “greenhouse gas” emissions have continued to increase. New requirements may adversely affect any manufacturer’s ability to profitably design, market, produce and distribute vehicles that comply with such regulations. We could be adversely impacted in our ability to market and sell these vehicles at affordable prices and in our ability to finance these inventories. These regulations could have a material adverse effect on our business, results of operations, financial condition and cash flows.
If manufacturers or distributors discontinue or change sales incentives, warranties and other promotional programs, our business, results of operations, financial condition and cash flows may be materially adversely affected.
We depend upon the manufacturers and distributors for sales incentives, warranties and other programs that are intended to promote new vehicle sales or supplement dealer income. Manufacturers and distributors routinely make changes to their incentive programs. Key incentive programs include:
•customer rebates;
•dealer incentives on new vehicles;
•special financing rates on certified, pre-owned cars; and
•below-market financing on new vehicles and special leasing terms.
Our financial condition could be materially adversely impacted by a discontinuation or change in our manufacturers’ or distributors’ incentive programs. In addition, certain manufacturers use criteria such as a dealership’s manufacturer-determined customer satisfaction index (CSI score), facility image compliance, employee training, digital marketing and parts purchase programs as factors governing participation in incentive programs. To the extent we do not meet minimum score requirements, we may be precluded from receiving certain incentives, which could materially adversely affect our business, results of operations, financial condition and cash flows.
Franchised automotive retailers perform factory authorized service work and sell original replacement parts on vehicles covered by warranties issued by the automotive manufacturer. For the year ended December 31, 2020,2023, approximately 25%21% of our service, body and parts revenue was for work covered by manufacturer warranties or manufacturer-sponsored maintenance services. To the extent a manufacturer reduces the labor rates or markup of replacement parts for such warranty work, our service, body and parts sales volume could be adversely affected.
The ability of our stores to make new vehicle sales depends in large part upon the franchise agreements with manufacturers and, therefore, any disruption or change in our relationships could impact our business.
We depend on the manufacturers to provide us with a desirable mix of new vehicles. The most popular vehicles usually produce the highest profit margins and are frequently in short supply. If we cannot obtain sufficient quantities of the most popular models, our profitability may be adversely affected. Sales of less desirable models may reduce our profit margins.
Each of our stores operates pursuant to a Franchise Agreementfranchise agreement with each of the respective manufacturers for which it serves as franchisee. Each of our stores may obtain new vehicles from manufacturers, service vehicles, sell new vehicles, and display vehicle manufacturers’ brand only to the extent permitted under these agreements. As a result
of the terms of our Franchise Agreements,franchise agreements, manufacturers exert significant control over the day-to-day operations at our stores. Such agreements contain provisions for termination or non-renewal for a variety of causes, including service retention, facility compliance, customer satisfaction and sales and financial performance. From time to time, certain of our stores have failed to comply with certain provisions of their Franchise Agreements,franchise agreements, and we cannot ensure that our stores will be able to comply with these provisions in the future.
Our Franchise Agreementsfranchise agreements expire at various times, and there can be no assurances that we will be able to renew these agreements on a timely basis or on acceptable terms or at all. Actions taken by a manufacturer to exploit its bargaining position in negotiating the terms of renewals of Franchise Agreementsfranchise agreements or otherwise could also have a material adverse effect on our revenues and profitability. If a manufacturer terminates or fails to renew one or more
of our significant Franchise Agreementsfranchise agreements or a large number of our Franchise Agreements,franchise agreements, such action could have a material adverse effect on our business, results of operations, financial condition and cash flows.
Our Franchise Agreementsfranchise agreements also specify that, except in certain situations, we cannot operate a franchise by another manufacturer in the same building as the manufacturer’s franchised store. This may require us to build new facilities at a significant cost. Moreover, our manufacturers generally require that the store meet defined image standards. These commitments could require us to make significant capital expenditures.
Our Franchise Agreementsfranchise agreements do not give us the exclusive right to a given geographic area. Manufacturers may be able to establish new franchises or relocate existing franchises, subject to applicable state franchise laws. The establishment of or relocation of franchises in our markets could have a material adverse effect on the business, financial condition and results of operations of our stores in the market in which the action is taken.
Our indebtedness and lease obligations could materially adversely affect our financial health, limit our ability to finance future acquisitions and capital expenditures and prevent us from fulfilling our financial obligations. Much of our debt is secured by a substantial portion of our assets. Much of our debt has a variable interest rate component that may significantly increase our interest costs in a rising rate environment.
Our indebtedness and lease obligations could have important consequences to us, including the following:
•limitations on our ability to make acquisitions;
•impaired ability to obtain additional financing for acquisitions, capital expenditures, working capital or general corporate purposes;
•reduced funds available for our operations and other purposes, as a larger portion of our cash flow from operations would be dedicated to the payment of principal and interest on our indebtedness; and
•exposure to the risk of increasing interest rates as certain borrowings are, and will continue to be, at variable rates of interest.
In addition, our loan agreements and our senior note indentures contain covenants that limit our discretion with respect to business matters, including incurring additional debt, granting additional security interests in our assets, acquisition activity, disposing of assets and other business matters. Other covenants are financial in nature, including current ratio, fixed charge coverage and leverage ratio calculations. A breach of any of these covenants could result in a default under the applicable agreement. In addition, a default under one agreement could result in a default and acceleration of our repayment obligations under the other agreements under the cross-default provisions in such other agreements.
We have granted a security interest in a substantial portion of our assets to certain of our lenders and other secured parties, including those under our $2.8$4.6 billion syndicated credit facility and $1.1 billion CAD Canadian syndicated credit facility. If we default on our obligations under those agreements, the secured parties may be able to foreclose upon their security interests and otherwise be entitled to obtain or control those assets.
Certain debt agreements contain subjective acceleration clauses based on a lender deeming itself insecure or if a “material adverse change” in our business has occurred. If these clauses are implicated, and the lender declares that an event of default has occurred, the outstanding indebtedness would likely be immediately due and owing.
If these events were to occur, we may not be able to pay our debts or borrow sufficient funds to refinance them. Even if new financing were available, it may not be on terms acceptable to us. As a result of this risk, we could be
forced to take actions that we otherwise would not take, or not take actions that we otherwise might take, in order to comply with these agreements.
In addition, the lenders’ obligations to make loans or other credit accommodations under certain credit agreements is subject to the satisfaction of certain conditions precedent including, for example, the satisfaction of financial covenants and conditions and that our representations and warranties in the agreement are true and correct in all material respects as of the date of the proposed credit extension. If any of our representations and warranties in those agreements are not true and correct in all material respects as of the date of a proposed credit extension, or if other conditions precedent are not satisfied, we may not be able to request new loans or other credit accommodations under those credit facilities, which could have a material adverse impact on our business, results of operations, financial condition and cash flows.
Additionally, at various times in the future, we will need to refinance portions of our debt. At the time we must refinance, the market for new debt, or our financial condition or asset valuations, might not be favorable. It is possible that financing to replace or renew our debt may be unfavorable, which would adversely affect our financial condition and results of operations. In certain cases, we may turn to equity or other alternative financing.
Our floor plan notes payable, credit facilities and a portion of our real estate debt are subject to variable interest rates. As of December 31, 2020, 49%2023, 63% of our total debt was variable rate. In the event interest rates increase, our borrowing costs may increase substantially. Additionally, fixed rate debt that matures may be renewed at interest rates significantly higher than current levels. As a result, this could have a material adverse impact on our business, results of operations, financial condition and cash flows. We may use interest rate derivatives to hedge a portion of our variable rate debt, when appropriate, based upon market conditions. See Note 12,11 – Derivative Financial Instruments, related to current hedge activity.
We may not be able to satisfy our debt obligations upon the occurrence of a change in control under our debt instruments.
Upon the occurrence of a change in control as defined in our credit agreement, the agent under the credit agreement will have the right to declare all outstanding obligations immediately due and payable and to terminate the availability of future advances to us. Upon the occurrence of a change in control, as defined in the indentures governing our senior notes, the holders of our senior notes will have the right to require us to purchase all or any part of such holders’ notes at a price equal to 101% of the principal amount thereof, plus accrued and unpaid interest, if any. There can be no assurance that we would have sufficient resources available to satisfy all of our obligations under the credit agreement in the event of a change in control or fundamental change. In the event we were unable to satisfy these obligations, it could have a material adverse impact on our business and our common stock holders. A “change in control” as defined in our credit agreement includes, among other events, the acquisition by any person, or two or more persons acting in concert, in either case other than Lithia Holdings Company, L.L.C., Sid DeBoer or Bryan DeBoer, of beneficial ownership (within the meaning of Rule 13d-3 of the SEC under the Securities Exchange Act of 1934) of 20%35% or more of the outstanding shares of our voting stock on a fully diluted basis.
We may experience greater credit losses in DFC’s portfolio of auto loan and lease receivables than anticipated.
Customers who finance a vehicle purchase or lease a vehicle through a DFC auto loan or lease may be unable to repay the loans based on the original terms and that the fair value of the vehicles used as collateral against the loans may not be sufficient to ensure full repayment. Credit and residual value losses are an inherent risk of our auto loan and lease portfolio and could result in a material adverse effect on our results of operations.
We estimate an allowance for loan losses based on a variety of assumptions about DFC’s portfolio of auto loan receivables and lease receivables. Although management prepares an estimate it believes appropriate based on available information, this allowance may not be a sufficient reserve for loan and lease losses. For example, sudden economic changes such as an economic downturn or a change in consumer spending may result in additional losses incurred that we did not estimate in our original allowance. Losses in excess of our allowance for losses could have a material adverse effect on our business and results of operations.
The growth and success of our DFC business is dependent upon obtaining sufficient capital to grow our auto loan portfolio.
Changes in the availability or cost of financing to support our auto loan portfolio under DFC could adversely affect our results of operations. Our auto loan portfolio is funded through a combination of free cash flows from operations and securitized funding, including asset-backed securitization. Changes in the condition of the asset backed securitization market may result in increased costs to access funds in the market or require us to explore new financing options to fund new auto loans. In the event that there is no alternative financing available, we may be forced to pause our auto loan financing business for a period of time. The impact of reducing or pausing our auto loan financing business could result in a material adverse effect on our results of operations.
Risks associated with our international operations may negatively affect our business, results of operations and financial condition.
We operate dealerships in the United States, Canada, and the U.K. While our operations outside of the United States currently represent a small portion of our revenue, we anticipate that our international operations will expand. We face regulatory, operational, political and economic risks and uncertainties with respect to our international operations that may be different from those in the United States. These risks may include, but are not limited to, the following:
•fluctuations in foreign currency translations within our financial statements driven by exchange rate volatility;
•inability to obtain or preserve franchise rights in the foreign countries in which we operate;
•changes in distribution models in the foreign countries in which we operate;
•compliance with changing laws and regulations;
•compliance with United States Foreign Corrupt Practices Act and other anti-corruption laws;
•wage inflation;
•treatment of revenue from international sources and changes to tax rules, including being subject to foreign tax laws;
•difficulties in managing foreign operations and dealing with different customs, practices and local regulations with which we are less familiar;
•large uncertainties, timing delays and expenses associated with tariffs, labor matters, import or export licenses and other trade barriers; and
•changes in a country’s economic or political conditions, including inflation, recession and interest rate fluctuations, and exposure to regional or global public health issues, pandemics, or epidemics, such as the outbreak of the COVID-19 pandemic.
Technology and Cybersecurity Risks
Changes to the retail delivery model and increased digital retailere-commerce and omni-channel competition could adversely affect our business, results of operations, financial condition and cash flows.
The automotive industry is beginning to experience change and disruption in the retail delivery model, including growing competition in the used vehicle market from companies with a primarily online e-commerce business model. Competition in this market includes companies such as CarMax, Carvana, Vroom and Shift.Cazoo. In addition, larger traditional automotive retailers are also moving in this direction,transforming their models to support omni-channel retail experiences, providing consumers with vehicle purchasing experiences outside of the traditional brick and mortar automotive dealership model.
We continue to develop our own internal technology solutions to further expand the reach of our nationwide networkthe networks of service and delivery points.points in our geographic markets. We may face increased competition for market share with these other delivery models and digitalomni-channel retailers over time which could materially and adversely affect our results of operations. There can be no assurance that our initiatives will be successful or that the amount we invest in these initiatives will result in our maintaining market share and continued or improved financial performance.
Breaches in our data security systems or in systems used by our vendor partners, including cyber-attacks or unauthorized data distribution by employees or affiliated vendors, or disruptions to access and connectivity of our information systems could impact our operations or result in the loss or misuse of customers’ proprietary information.
Our information technology systems are important to operating our business efficiently. We employ information technology systems, including websites, that allow for the secure handling and processing of customers’ proprietary information. The failure of our information technology systems, and those of our partner software and technology vendors, to perform as we anticipate could disrupt our business and could expose us to a risk of loss or misuse of this information, litigation and potential liability.
Aspects of our operations are subject to privacy, data use and data security regulations, which impact the way we use and handle data. In addition, regulatorsWe collect, process, share, disclose, transfer, and otherwise use personal information about identifiable individuals including, but not limited to, our customers, employees, partners, and vendors, and so are proposingsubject to US and adopting newinternational laws orand regulations, that could require us to adopt certain cybersecurityregarding data privacy and data handling practices. The changing privacy laws (e.g.security such as the California Consumer Privacy Act) create new individualAct and the UK General Data Protection Regulation. These laws impose comprehensive data privacy compliance obligations in relation to our processing of personal data, including providing privacy rights to the individuals whose data we process and impose increased obligations on companies handling personal data.introducing requirements to maintain policies, processes, and procedures regarding our data handing practices. Additionally, our expansion into Canada and the United Kingdom subjects us to additional privacy and security regulations which also impact the way we handle and secure data across borders.
We collect, process, and retain personally identifiable information regarding customers, associates and vendors in the normal course of our business. Our internal and third-party systems are at risk from hackershave been and may in the future be subject to cyber-attacks, viruses, malicious software, ransomware, break-ins, theft, computer hacking, phishing, exploitation of system vulnerabilities or misconfigurations, employee error, or malfeasance or other individuals with malicious intent to gain unauthorized access to our systems. Cyber-attacks are growing in number and sophistication thus presenting an ongoing threat to systems, whether internalsecurity breaches or external, used to operate the business on a day-to-day basis.loss of service. We invest in commercially reasonable commercial security technology to protect our data and business processes against many of these risks. We also purchase insurance to mitigate the potential financial impact of many of these risks. Despite the security measures we have in place, our facilities and systems, and those of our third-party service providers, could be vulnerable to security breaches, computer viruses, lost or misplaced data, programming errors, human errors, acts of vandalism, or other events. Any security breach or event resulting in the misappropriation, loss, or other unauthorized disclosure of confidential information, or degradation of services provided by critical business systems, whether by us directly or our third-party service providers, could adversely affect our business operations, sales, reputation with current and potential customers, associates or vendors, as well as other operational and financial impacts derived from investigations, litigation, imposition of penalties or other means.
Regulatory Risks
IfOur dealerships and our new vehicle sales model may not be protected if state dealer laws are repealed or weakened, our dealerships will be more susceptiblea manufacturer becomes bankrupt or there is a shift to termination, non-renewal or renegotiation of their Franchise Agreements. Additionally, federal bankruptcy law can override protections afforded under state dealer laws.other sales models.
State and provincial dealer laws generally provide that a manufacturer may not terminate or refuse to renew a franchise agreement unless it has first provided the dealer with written notice setting forth good cause and stating the grounds for termination or non-renewal. Certain United States state dealer laws allow dealers to file protests or petitions or attempt to comply with the manufacturer’s criteria within the notice period to avoid the termination or non-renewal. If dealer laws are repealed in the states where we operate, manufacturers may be able to terminate our franchises without providing advance notice, an opportunity to cure or a showing of good cause. In Canada, although laws differ by province, provincial law generally provides that both a manufacturer and dealer each has a common law and statutory duty of good faith and fair dealing in performance and enforcement of any franchise agreement. Disputes are generally handled through the National Automobile Dealer Arbitration Program (NADAP). If a manufacturer wished to terminate a franchise, there is no guaranty that we would win such a dispute. Without the protection of state and provincial dealer laws, it may also be more difficult to renew our Franchise Agreementsfranchise agreements upon expiration or on terms acceptable to us.
In addition, these laws restrict the ability of automobile manufacturers to directly enter the retail market in the future. Manufacturer lobbying efforts and lawsuits may lead to the repeal or revision of these laws. For example, Tesla has received a favorable ruling in certain states allowing direct to consumer sales and service. If manufacturers obtain the ability to directly retail vehicles and do so in our markets, such competition could have a material adverse effect on our business, results of operations, financial condition and cash flows.
As evidenced by the bankruptcy proceedings of both Chrysler and GM in 2009, state dealer laws do not afford continued protection from manufacturer terminations or non-renewal of Franchise Agreements.franchise agreements. No assurances can be given that a manufacturer will not seek protection under bankruptcy laws, or that, in this event, they will not seek to terminate franchise rights held by us.
In addition, state dealer laws restrict the ability of vehicle manufacturers to directly enter the retail market. Manufacturer lobbying efforts and lawsuits may lead to the repeal or revision of these laws. For example, Tesla has
received a favorable ruling in certain states allowing direct to consumer sales and service. In addition, many states have recently passed or are introducing legislation to permit direct to consumer auto sales in certain circumstances, allowing additional electric vehicle manufacturers such as Rivian to enter the market. If manufacturers obtain the ability to directly retail vehicles in our markets, such competition could negatively impact our sales and have a material adverse effect on our business, results of operations, financial condition and cash flows.
Further, changes by manufacturers to their distribution models may impact our operations in the U.K. Certain manufacturers are moving to an agency model in other countries, whereby the consumer places an order directly with the manufacturer and names a preferred delivery dealer. The agency model is being used by manufacturers such as Volkswagen in Germany for all EVs and Mercedes-Benz in the U.K. and other European regions. Under an agency model, our dealerships receive a fee for facilitating the sale by the manufacturer of a new vehicle but do not hold the vehicle in inventory. The agency model will reduce reported revenues (as only the fee we receive, and not the price of the vehicle, will be reported as revenue), reduce SG&A expenses, and reduce floorplan interest expense, although the other impacts to our results of operations remain uncertain. If the agency model or another new model is implemented in the U.K. or other countries and regions in which we operate for the sale of electric or other vehicles, it could negatively affect our revenues, results of operations and financial condition.
Our U.K. dealerships are subject to different regulatory frameworks than our U.S. and Canada operations, and changes to these regulatory frameworks could negatively affect our results of operations.
The majority of our dealerships in the U.K. operate under franchise agreements with vehicle manufacturers, however, unlike in the United States, the U.K. generally does not have automotive dealership franchise laws and, as a result, our U.K. dealerships operate without these types of specific protections that exist in the United States. In addition, our U.K. dealerships are also subject to U.K. antitrust regulations prohibiting certain restrictions on the sale of new vehicles and spare parts and on the provision of repairs and maintenance. For instance, authorized dealers are generally able to, subject to manufacturer facility requirements, relocate or add additional facilities throughout the European Union, offer multiple brands in the same facility, allow the operation of service facilities independent of new car sales facilities and ease restrictions on cross supplies (including on transfers of dealerships) between existing authorized dealers within the European Union. However, under the EU Motor Vehicle Block Exemption Regulation, which was retained in U.K. law following U.K.’s exit from the European Union on January 31, 2020, certain restrictions on dealerships are permissible in franchise agreements provided certain conditions are met. In October 2022, the Competition and Markets Authority of the U.K. published recommendations to introduce an updated U.K. equivalent broadly similar to the EU Motor Vehicle Block Exemption Regulations, however, changes to these protections or rules could negatively affect our revenues, results of operations and financial condition.
Import product restrictions, currency valuations, and foreign trade risks may impair our ability to sell foreign vehicles or parts profitably.
A significant portion of the vehicles we sell are manufactured outside of the U.S.,geographic regions in which we operate, and all of the vehicles we sell include parts manufactured outside of the U.S.geographic regions in which we operate. As a result, our operations are subject to customary risks of importing merchandise, including currency fluctuation, import duties, exchange rates, trade restrictions, work stoppages, transportation costs, natural or man-made disasters, and general political and socioeconomic conditions in other countries. The U.S.United States or the countries from which our products are imported, may, from time to time, impose new quotas, duties, tariffs or other restrictions, or adjust presently prevailing quotas, duties or tariffs, which may affect our operations and our ability to purchase imported vehicles and/or parts at reasonable prices. Changes in U.S.United States trade policies, including the U.S.-Mexico-CanadaUnited States-Mexico-Canada Agreement or policies intended to penalize foreign manufacturing or imports, and policies of foreign countries in reaction to those changes, could increase the prices we pay for some
of the new vehicles and parts we sell. Any changes that increase the costs of vehicles and parts generally, to the extent passed on to customers, could negatively affect customer demand and our revenues and profitability. If not passed on to our customers, any cost increases will adversely affect our profitability. Any cost increase that disproportionately applies to manufacturers that sell to us could adversely affect our business compared to other automobilevehicle retailers.
Our operations are subject to extensive governmental laws and regulations. If we are found to be in violation of or subject to liabilities under any of these laws, or if new laws or regulations are enacted that adversely affect our operations, our business, operating results, and prospects could suffer.
We are subject to federal, state and local laws and regulations in the statesgeographic regions in which we operate, such as those relating to franchising, motor vehicle sales, retail installment sales, leasing, finance and insurance, marketing, licensing, consumer protection, consumer privacy, escheatment, anti-money laundering, environmental, vehicle emissions and fuel economy, and health and safety. In addition, with respect to employment practices, we are subject to various laws and regulations, including complex federal, state and local wage and hour and anti-discrimination laws. New laws and regulations are enacted on an ongoing basis. With the number of stores we operate, the number of personnel we employ and the large volume of transactions we handle, it is possible that technical mistakes will be made. These regulations affect our profitability and require ongoing training. Current practices in stores may become prohibited. We are responsible for ensuring that continued compliance with laws is maintained. If there are unauthorized activities, the state and federal authorities have the power to impose civil penalties and sanctions, suspend or withdraw dealer licenses or take other actions. These actions could materially impair our activities or our ability to acquire new stores in those states where violations occurred. Further, private causes of action on behalf of individuals or a class of individuals could result in significant damages or injunctive relief.
We may be involved in legal proceedings arising from the conduct of our business, including litigation with customers, employee-related lawsuits, class actions, purported class actions and actions brought by or on behalf of governmental authorities. Claims arising out of actual or alleged violations of law may be asserted against us or any of our dealers by individuals, either individually or through class actions, or by governmental entities in civil or criminal investigations and proceedings. Such actions may expose us to substantial monetary damages and legal defense costs, injunctive relief, criminal and civil fines and penalties and damage our reputation and sales.
Our financing activities are subject to federal truth-in-lending, consumer leasing and equal credit opportunity laws and regulations, as well as state and local motor vehicle finance laws, installment finance laws, insurance laws, usury laws and other installment sales laws and regulations. Some states regulate finance, documentation and administrative fees that may be charged in connection with vehicle sales. In recent years, private plaintiffs and state attorneys general in the U.S.United States have increased their scrutiny of advertising, sales, and finance and insurance activities in the sale and leasing of motor vehicles. These activities have led many lenders to limit the amounts that may be charged to customers as fee income for these activities. If these or similar activities were to significantly restrict our ability to generate revenue from arranging financing for our customers, we could be adversely affected.
If we or any of our employees at any individual dealership violate or are alleged to violate laws and regulations applicable to them or protecting consumers generally, we could be subject to individual claims or consumer class actions, administrative, civil or criminal investigations or actions and adverse publicity. Such actions could expose us to substantial monetary damages and legal defense costs, injunctive relief and criminal and civil fines and penalties, including suspension or revocation of our licenses and franchises to conduct dealership operations.
Environmental laws and regulations govern, among other things, discharges into the air and water, storage of petroleum substances and chemicals, the handling and disposal of wastes and remediation of contamination arising from spills and releases. In addition, we may also have liability in connection with materials that were sent to third-party recycling, treatment and/or disposal facilities under federal and state statutes. These federal and state statutes impose liability for investigation and remediation of contamination without regard to fault or the legality of the conduct that contributed to the contamination. Similar to many of our competitors, we have incurred and expect to continue to incur capital and operating expenditures and other costs in complying with such federal and state statutes. In addition, we may be subject to broad liabilities arising out of contamination at our currently and formerly owned or operated facilities, at locations to which hazardous substances were transported from such facilities, and at such locations related to entities formerly affiliated with us. Although for some such potential liabilities we believe we are entitled to indemnification from other entities, we cannot assure you that such entities will view their
obligations as we do or will be able or willing to satisfy them. Failure to comply with applicable laws and regulations, or significant additional expenditures required to maintain compliance therewith, may have a material adverse effect on our business, results of operations, financial condition, cash flows and prospects.
Structural and Organizational Risks
Our ability to increase revenues and profitability through acquisitions depends on our ability to acquire and successfully integrate additional stores.new vehicle franchises.
General
The U.S. automobilevehicle industry in the United States, Canada, and the United Kingdom is considered a mature industry in which minimal growth is expected in unit sales of new vehicles. Accordingly, a principal component of our growth in salesstrategy is to make dealership acquisitions in our existing markets and in new geographic markets. To completeRestrictions by our manufacturers and limitations on our access to capital resources may directly or indirectly limit our ability to acquire additional dealerships. In addition, increased competition for acquisitions, including from other national, regional and local dealership groups, and other strategic and financial buyers, some of which may have greater financial resources than us, could result in fewer acquisition opportunities for us and higher acquisition prices in the acquisition of additional stores, we need to successfully address at least each of the following challenges.future.
Manufacturers
We are required to obtain consent from the applicable manufacturer prior to the acquisition of a franchised store.store, which typically takes 60 to 90 days. In determining whether to approve an acquisition, a manufacturer considers many factors including our financial condition, ownership structure, the number of such manufacturers’ stores currently owned, ownership of stores in contiguous markets, performance of existing stores, frequency of acquisitions, and our performance with those stores. Obtaining manufacturer approval of acquisitions also takes a significant amount of time, typically 60 to 90 days.financial condition. In the past, manufacturers have not consented to our purchase of franchised stores due to the performance of existing stores. Weand we cannot assure you that manufacturers will approve future acquisitions timely, if at all, which could significantly impair the execution of our acquisition strategy.
Most major manufacturers have now established limitations or guidelines on the:
•number of such manufacturers’ stores that may be acquired by a single owner;
•number of stores that may be acquired in any market or region;
•percentage of market share that may be controlled by one automotive retailer group;
•ownership of stores in contiguous markets;
•performance requirements for existing stores; and
•frequency of acquisitions.
In addition, those manufacturers generally require that no other manufacturers’ brands be sold from the same store location, and many manufacturers have site control agreements in place that limit our ability to change the use of the facility without their approval.
A manufacturer also considers our past performance as measured by the Minimum Sales Responsibility (MSR) scores, CSI scores and Sales Satisfaction Index (SSI) scores at our existing stores. At any point in time, certain stores may have scores below the manufacturers’ sales zone averages or have achieved sales below the targets manufacturers have set. Our failure to maintain satisfactory scores and to achieve market share performance goals could restrict our ability to complete future store acquisitions.
Acquisition Risks
We face risks commonly encountered with growth through acquisitions. These risks include, without limitation:
•failing to assimilate the operations and personnel of acquired dealerships;
•straining our existing systems, procedures, structures and personnel;
•failing to achieve predicted sales levels;
•incurring significantly higher capital expenditures and operating expenses, which could substantially limit our operating or financial flexibility;
•entering new, unfamiliar markets;
•encountering undiscovered liabilities and operational difficulties at acquired dealerships;
•disrupting our ongoing business;
•diverting our management resources;
•failing to maintain uniform standards, controls and policies;
•impairing relationships with employees, manufacturers and customers as a result of changes in management;
•incurring increased expenses for accounting and computer systems, as well as integration difficulties;
•failing to obtain a manufacturer’s consent to the acquisition of one or more of its dealership franchises or renew the franchise agreement on terms acceptable to us;
•incorrectly valuing entities to be acquired; and
•incurring additional facility renovation costs or other expenses required by the manufacturer.
In addition, we may not adequately anticipate all of the demands that growth will impose on our systems, procedures and structures.
Consummation and Competition
We may not be able to complete future acquisitions at acceptable prices and terms or identify suitable candidates. In addition, increased competition in the future for acquisition candidates could result in fewer acquisition opportunities for us and higher acquisition prices. The magnitude, timing, pricing and nature of future acquisitions will depend upon various factors, including:
•the availability of suitable acquisition candidates;
•competition with other dealer groups for suitable acquisitions;
•the negotiation of acceptable terms with sellers and with manufacturers;
•our financial capabilities and ability to obtain financing on acceptable terms;
•our stock price;
•our ability to maintain required financial covenant levels after the acquisition; and
•the availability of skilled employees to manage the acquired businesses.
Operating and Financial Condition
Although we conduct what we believe to be a prudent level of investigation, an unavoidable level of risk remains regarding the actual operating condition of acquired stores and we may not have an accurate understanding of each acquired store’s financial condition and performance. Similarly, most of the dealerships we acquire do not have financial statements audited or prepared in accordance with U.S. generally accepted accounting principles. We may not have an accurate understanding of the historical financial condition and performance of our acquired businesses. Until we assume control of the business, we may not be able to ascertain the actual value or understand the potential liabilities of the acquired businesses and their earnings potential. These risks may not be adequately mitigated by the indemnification obligations we negotiated with sellers.
Limitations on Our Capital Resources
We make a substantial capital investment when we acquire dealerships. Limitations on our capital resources would restrict our ability to complete new acquisitions or could limit our operating or financial flexibility.
We finance acquisitions activity with cash flows from our operations, borrowings under our credit arrangements, proceeds from our offering of senior notes, proceeds from mortgage financing and the issuance of shares of Class A common stock. The size of our acquisition activity in recent years magnifies risks associated with debt service obligations. These risks include potential lower earnings per share, our inability to pay dividends and potential negative impacts to the debt covenants we negotiated under our credit agreement.
If we fail In addition, issuances of equity securities could result in dilution to meet the covenants in our credit facility or the indentures governing our senior notes, or if some other event occurs that results in a default or an acceleration of our repayment obligations under our debt instruments, we may not be able to refinance our debt on terms acceptable to us or at all. We may not be able to obtain financing in
the future due to the market price of our Class A common stock and overall market conditions. Additionally, a substantial amount of assets of our dealerships are pledged to secure the indebtedness under our credit facility and our other floor plan financing indebtedness. These pledges may limit our ability to borrow from other sources in order to fund our acquisitions.existing shareholders.
We are subject to substantial risk of loss under our various self-insurance programs including property and casualty, open lot vehicle coverage, workers’ compensation and employee medical coverage. Our insurance does not fully cover all of our operationalface other risks and changes in the cost of insurance or the availability of insurance could materially increase our insurance costs or result in a decrease in our insurance coverage.commonly encountered with growth through acquisitions. These risks include, without limitation:
We have a significant concentration•failing to identify suitable acquisition candidates and negotiate acceptable terms;
•failing to assimilate the operations and personnel of acquired dealerships;
•straining our property values at each dealership location,existing systems, procedures, structures and personnel, including vehicleby disrupting our ongoing business and parts inventoriesdiverting our management resources;
•failing to achieve expected performance levels;
•incurring significantly higher capital expenditures and our facilities. Natural disasters and severe weather events (such as hurricanes, earthquakes, fires, floods, landslides and wind or hail storms)operating expenses, including incurring additional facility renovation costs or other extraordinary events subject usexpenses required by the manufacturer;
•entering new, unfamiliar markets;
•encountering undiscovered liabilities and operational difficulties at acquired dealerships;
•failing to property lossmaintain uniform standards, controls and business interruption. Illegalpolicies;
•impairing relationships with employees, manufacturers and customers; and
•overvaluing entities to be acquired.
Our failure to address these risks or unethical conduct by employees, customers, vendors and unaffiliated third parties can also impact our business. Other potential liabilities arising out of our operations may involve claims by employees, customers or third parties for personal injury or property damage and potential fines and penaltiesother problems encountered in connection with alleged violations of regulatory requirements.
Under our self-insurance programs, we retain various levels of aggregate loss limits, per claim deductibles and claims-handling expenses. Costs in excessacquisitions could cause us to fail to realize the anticipated benefits of these retainedacquisitions, cause us to incur unanticipated liabilities and otherwise harm our business. Any of these risks, may be insured under various contracts with third-party insurance carriers. As of December 31, 2020, we had total reserve amounts associated with these programs of $39.1 million.
The level of risk we retain may change in the future as insurance market conditions or other factors affecting the economics of our insurance purchasing change. The operation of automobile dealerships is subject to a broad variety of risks. In certain instances, our insurance may not fully cover an insured loss depending on the magnitudeif realized, could materially and nature of the claim. Accordingly, we cannot assure you that we will not be exposed to uninsured or underinsured losses that could have a material adverse effect onadversely affect our business, financial condition and results of operations or cash flows. Additionally, changes in the cost of insurance or the availability of insurance in the future could substantially increase our costs to maintain our current level of coverage or could cause us to reduce our insurance coverage and increase the portion of our risks that we self-insure.operations.
The loss of key personnel or the failure to attract additional qualified management personnel could adversely affect our operations and growth.
Our success depends to a significant degree on the efforts and abilities of our senior management. Further, we have identified Bryan B. DeBoer in most of our store Franchise Agreementsfranchise agreements as the individual who controls the franchises and upon whose financial resources and management expertise the manufacturers may rely when awarding or approving the transfer of any franchise. If we lose these key personnel, our business may suffer.
In addition, as we expand into new markets and develop our digital e-commerce solutions, we will need to hire additional managers, engineers, data scientists and other employees. The market for qualified employees in the
automotive and technology-related industries is highly competitive and may subject us to increased labor costs during periods of low unemployment. The loss of the services of key employees or the inability to attract additional qualified personnel could have a material adverse effect on our business, results of operations, financial condition and cash flows. In addition, the lack of qualified managers or other employees employed by potential acquisition candidates may limit our ability to consummate future acquisitions.
Risks relatedRelated to investingInvesting in our Class A common stockOur Common Stock
Oregon law and our Restated Articles of Incorporation may impede or discourage a takeover, which could impair the market price of our Class A common stock.
We are an Oregon corporation, and certain provisions of Oregon law and our Restated Articles of Incorporation may have anti-takeover effects. These provisions could delay, defer or prevent a tender offer or takeover attempt that a shareholder might consider to be in his or her best interest. These provisions may also affect attempts that might result in a premium over the market price for the shares held by shareholders and may make removal of the incumbent management and directors more difficult, which, under certain circumstances, could reduce the market price of our Class A common stock.
Our issuance of preferred stock could adversely affect holders of Class A common stock.
Our Board of Directors is authorized to issue a series of preferred stock without any action on the part of our holders of Class A common stock. Our Board of Directors also has the power, without shareholder approval, to set the terms of any such series of preferred stock that may be issued, including voting powers, preferences over our Class A common stock with respect to dividends or if we voluntarily or involuntarily dissolve or distribute our assets, and other terms. If we issue preferred stock in the future that has preference over our Class A common stock with respect to the payment of dividends or upon our liquidation, dissolution or winding up, or if we issue preferred stock with voting rights that dilute the voting power of our Class A common stock, the rights of holders of our Class A common stock or the price of our Class A common stock could be adversely affected.
Item 1C. Cybersecurity
Assessing, identifying, and managing material risks from cybersecurity threats
We are committed to maintaining robust cybersecurity practices to safeguard our information assets and ensure the confidentiality, integrity, and availability of our operations. We employ a comprehensive approach to assess, identify, and manage material risks arising from cybersecurity threats. The identification and oversight of material cybersecurity risks is included in continuous Enterprise Risk Management (ERM) Committee and Board of Directors meetings and reporting.
We complete regular cybersecurity assessments to identify potential vulnerabilities and threats, analyzing our infrastructure, systems, and data. Assessments are conducted both internally and by third parties and consider internal and external factors, technological changes, regulatory requirements, and emerging cyber threats. Our cybersecurity program adheres to widely recognized standards for managing cybersecurity risk, including the National Institute of Standards and Technology Cybersecurity Framework, Center for Internet Security Controls and UK Cyber Essentials.
We use advanced threat detection tools and technologies to identify potential cybersecurity risks. This includes continuous monitoring, intrusion detection systems, and anomaly detection mechanisms, to promptly identify any unusual activities or security breaches. Threat intelligence sharing with industry partners helps ensure we stay informed about the latest cybersecurity threats.
We assess cybersecurity risks for their potential impact on our operations, data, and reputation. Risks are prioritized based on their severity and likelihood of occurrence before implementing appropriate controls, safeguards, and mitigation measures to address and manage these risks effectively.
We have developed a well-defined and frequently updated information security incident response plan that outlines procedures to be followed in the event of a cybersecurity incident. The plan is periodically drilled with incident response team members and includes robust processes for identification, categorization, escalation and reporting of incidents. Employees are regularly trained on key cybersecurity subjects to ensure awareness.
While no company can or will be completely immune from cybersecurity threats, especially as they relate to vendors and government agencies that we rely on, we know of no cybersecurity incident that has or is likely to materially affect us, our business strategy, or our results of operations, or financial condition.
Board of Directors Cybersecurity Oversight
Our Board of Directors oversees our cybersecurity and data protection strategy and appoints a director to lead the Board’s efforts. Our Board is briefed on our cybersecurity posture, current and future risks and potential incidents or vulnerabilities on a quarterly basis. Board members and executives participate in engagements on cybersecurity, such as simulated cyber incident response and crisis management exercises. Our Board also regularly receives and reviews third-party cybersecurity assessments, which include assessments of our cyber maturity and cyber risk.
Management’s Assessment and Response to Material Risks from Cybersecurity Threats
Our information security team and its leadership have primary responsibility for assessing and managing cybersecurity risks, within the scope of the overall ERM Committee. Such individuals collectively have over 80 years of prior work experience in various roles involving managing information security, developing cybersecurity strategy, and implementing effective information and cybersecurity programs. Cybersecurity threats are reported to management through robust and documented incident reporting processes. Our ERM Committee is comprised of Information Security, Legal, Treasury and other key executive stakeholders. The committee meets on a quarterly basis or as necessary to assess and respond to enterprise risks, including cybersecurity. The ERM Committee reports updates to the Board of Directors when appropriate and at least on an annual basis.
Item 2. Properties
Our stores and other facilities consist primarily of vehicle showrooms, display lots, service facilities, collision repair and paint shops, supply facilities, vehicle storage lots, parking lots and offices in 21 statesacross the U.S., Canada, and the U.K. in the locations shown in the mapmaps under the Overview section of Item 7. Management’s Discussion and Analysis of Financial Condition and Results of Operations. We believe our facilities are currently adequate for our needs and are in good repair. Some of our facilities do not currently meet manufacturer image or size requirements and we are actively working to find a mutually acceptable outcome in terms of timing and overall cost. We own our corporate headquarters in Medford, Oregon, and numerous other properties used in our operations. Certain of our owned properties are mortgaged.mortgaged or secured as part of commitments on our various real estate credit facilities. As of December 31, 2020,2023, we had outstanding mortgage debt of $611.5 million.$624.4 million, and $295.8 million outstanding on our real estate credit facilities. We also lease certain properties, providing future flexibility to relocate our retail stores as demographics, economics, traffic patterns or sales methods change. Most leases provide us the option to renew the lease for one or more lease extension periods. We also hold certain vacant facilities and undeveloped land for future expansion.
Our corporate headquarters is LEED certified and incorporates roof-mounted solar panels to offset energy usage. Two of our stores are also LEED certified, and we have completed solar projects at four others. Our stores also integrate energy-saving practices and materials. This includes practices such as recycling used tires, used engine oil and used oil filters; the use of waste oil heaters and carwash reclaim systems; using biodegradable products in our detail services and interior and exterior LED lighting. We also provide a complimentary, nationwide electric vehicle (EV) charging network, an important aspect in increasing the number of EVs on the road and thereby reducing emissions.
Item 3. Legal Proceedings
We are party to numerous legal proceedings arising in the normal course of our business. Although we do not anticipate that the resolution of legal proceedings arising in the normal course of business will have a material adverse effect on our business, results of operations, financial condition, or cash flows, we cannot predict this with certainty.
PART II
Item 5. Market for Registrant’s Common Equity, Related Stockholder Matters and Issuer Purchases of Equity Securities
Our Class A common stock trades on the New York Stock Exchange under the symbol LAD.
The number of shareholders of record and approximate number of beneficial holders of Class A common stock as of February 19, 202123, 2024 was 466428 and 63,557,90,497, respectively. All shares of Lithia’s Class B common stock are held by Lithia Holding Company, L.L.C. Sidney B. DeBoer Trust U.T.A.D. January 30, 1997 (the “Trust”) is the manager of Lithia Holding Company, L.L.C., and Sidney DeBoer, as the trustee of the Trust, has the authority to vote all of the issued and outstanding shares of our Class B common stock. As of December 31, 2020, Lithia Holding Company, L.L.C., held 200,000 shares of our Class B common stock.
Equity Compensation Plan Information
Information regarding securities authorized for issuance under equity compensation plans is included in Item 12.
Repurchases of Equity Securities
We made the following repurchases of our common stock during the fourth quarter of 2020:2023:
| | Total number of shares purchased(2) | | Average price paid per share | | Total number of shares purchased as part of publicly announced plan(1) | | Maximum dollar value of shares that may yet be purchased under publicly announced plan (in thousands)(1) |
| For the full calendar month of | | For the full calendar month of | | Total number of shares purchased (1) | | Average price paid per share | | Total number of shares purchased as part of publicly announced plan (2) | | Maximum dollar value of shares that may yet be purchased under publicly announced plan (in thousands) |
| October | October | | — | | | $ | — | | | — | | | $ | 187,522 | |
| November | November | | 184 | | | 229.57 | | | — | | | 187,522 | |
| December | December | | 293 | | | 294.69 | | | — | | | 187,522 | |
| Total | Total | | 477 | | | 269.57 | | | — | | | 187,522 | |
(1)On October 22, 2018, our Board of Directors approved a $250 million repurchase authorization. This authorization does not have an expiration date.
(2)The66 shares repurchased in the fourth quarter of 20202023 were related to tax withholdingswithholding on the vesting of RSUs.
(2)On November 1, 2022, our Board of Directors approved an additional $450 million repurchase authorization of our common stock. This authorization was in addition to the amount previously authorized by the Board for repurchase. There is no expiration date for this share repurchase authorization.
Stock Performance Graph
The stock performance graph and table that follow compare the cumulative total stockholder return on Lithia Motors, Inc.’s Class A common stock with the cumulative total return of the Standard & Poor’s 500 Stock Index (S&P 500 Index), the Russell 2000,and an auto peer group index composed of Penske Automotive Group, AutoNation, Sonic Automotive, Group 1 Automotive, and Asbury Automotive Group, and a new auto peer group index which adds CarMax to the previously utilized auto peer group index for the five years ended December 31, 2020.2023. The peer group indexes utilize the same methods of presentation and assumptions for the total return calculation as does Lithia Motors and the S&P 500 Index, and the Russell 2000.Index. All companies in the peer group indexes are weighted in accordance with their market capitalizations.1(1)
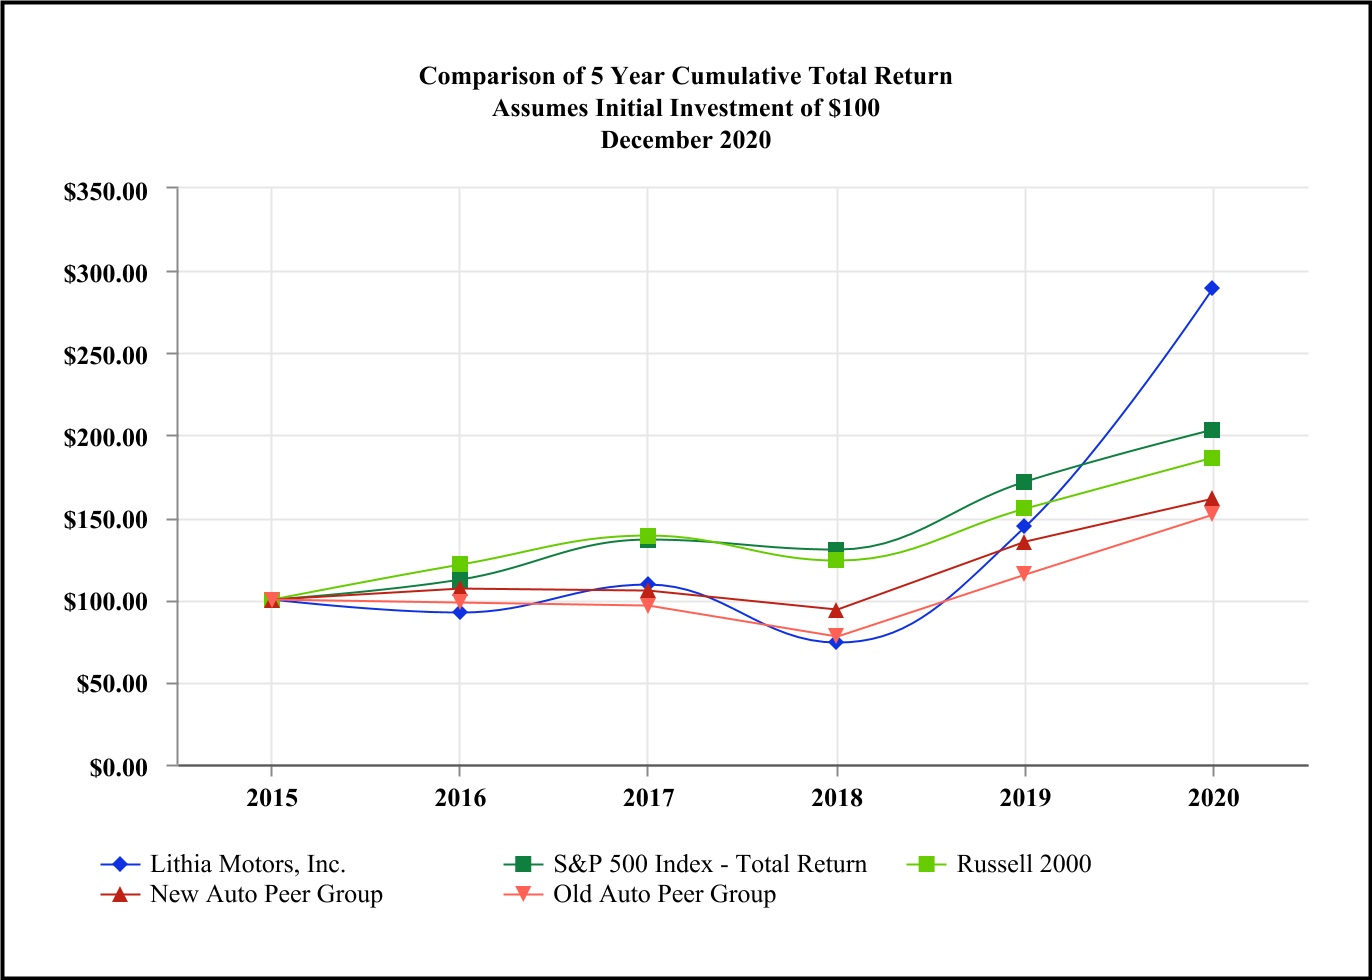

| | Base Period | | Indexed Returns for the Year Ended |
| | Base Period | | | | Base Period | | Indexed Returns for the Year Ended |
| Company/Index | Company/Index | | 2015 | | 2016 | | 2017 | | 2018 | | 2019 | | 2020 | Company/Index | | 2018 | | 2019 | | 2020 | | 2021 | | 2022 | | 2023 |
| Lithia Motors, Inc. | Lithia Motors, Inc. | | $100.00 | | | $ | 91.82 | | | $ | 108.85 | | | $ | 74.05 | | | $ | 144.08 | | | $ | 289.31 | |
| S&P 500 Index - Total Return | S&P 500 Index - Total Return | | 100.00 | | 111.96 | | | 136.40 | | | 130.42 | | | 171.49 | | | 203.04 | |
| Russell 2000 | | 100.00 | | 121.31 | | | 139.08 | | | 123.76 | | | 155.35 | | | 186.36 | |
| New Auto Peer Group | | 100.00 | | 106.83 | | | 105.69 | | | 93.69 | | | 135.19 | | | 161.25 | |
| Old Auto Peer Group | | 100.00 | | 98.08 | | | 96.45 | | | 77.22 | | | 115.38 | | | 151.46 | |
| Auto Peer Group | |
1(1)The graph and table assume that $100 was invested on the last day of trading for the calendar year ended December 31, 20152018 in Lithia Motors, Inc’s Class A common stock, the S&P 500 Index, the Russell 2000, and peer group indexes, and that all dividends were reinvested. The Russell 2000 Index was presented as a comparison in the 2019 Form 10-K stock performance graph as a broad market index. We have added the S&P 500 Index as a new broad market index, which represents large capitalization industry performance across major industrial sectors. We have also added CarMax to our peer group index, to update our peer group index moving forward.
Item 7. Management’s Discussion and Analysis of Financial Condition and Results of Operations
You should read the following discussion in conjunction with Item 1. Business, Item 1A. Risk Factors, and our Consolidated Financial Statements and Notes thereto.
Overview
We are one of the largesta global automotive franchises in the United States and wereretailer ranked #252#145 on the Fortune 500 in 2020.2023. As of February 19, 2021,23, 2024, we offered 3347 brands of new vehicles and all brands of used vehicles in 210344 stores in the United States, Canada, and the United Kingdom and online at over 200nearly 360 websites. We offer a wide range of products and services including new and used vehicles, finance and insurance products and automotivevehicle repair and maintenance.
REGIONAL REACH & DENSITY MAP
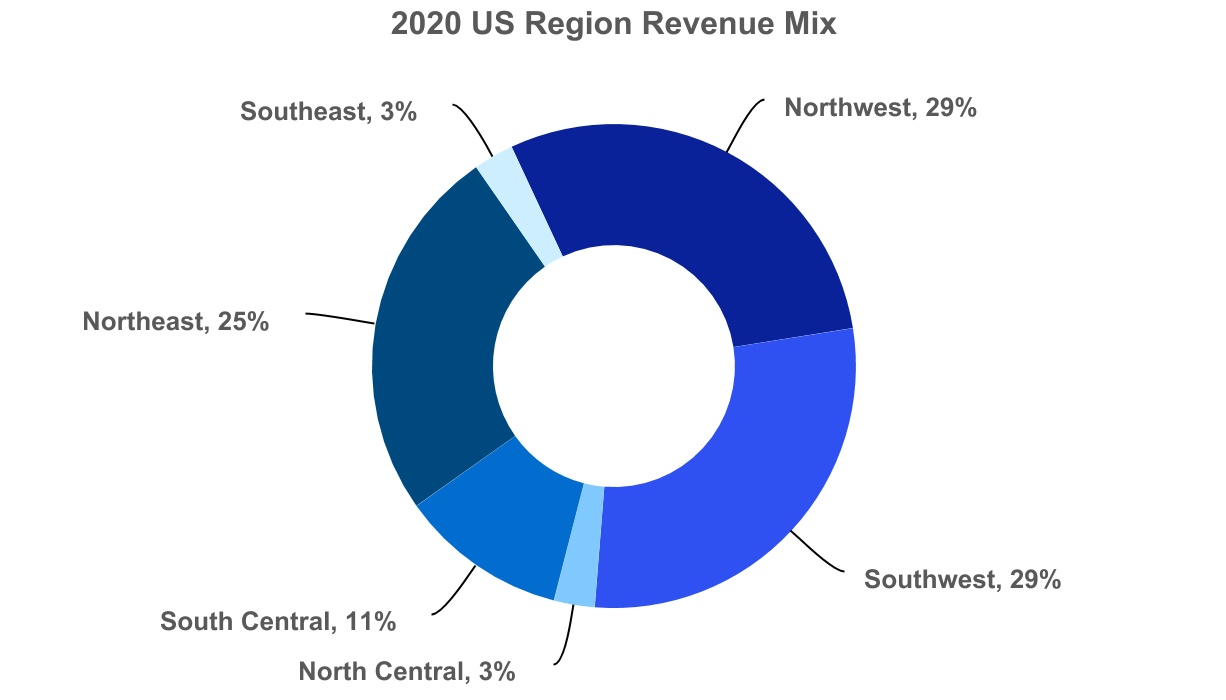
During the year ended December 31, 2020, we had net income of $470.3 million, or $19.53 per diluted share, compared to net income of $271.5 million, or $11.60 per diluted share, during 2019. We experienced growth of revenue and gross profit in all major business lines in 20202023 compared to 2019,2022, primarily driven by increases in volume related to acquisitions, complimented by organic growth in usednew vehicles, finance and insurance and service, body and parts sales. On a same store basis, new and used vehicle revenues andretail gross profits experienced headwinds with plateauing national new vehicle salesdeclines primarily driven by decreases in gross profit per unit as margins normalize to pre-pandemic levels. Net income decline was primarily driven by this margin normalization, increased interest expense, and declining manufacturer incentives. For the year ended December 31, 2020, new vehicle sales accounted for approximately 52%increased SG&A as a percentage of our revenue and approximately 21% of our gross profit. Used vehicle retail sales accounted for approximately 31% of our revenue and approximately 20% of our gross profit. Our parts and service and finance and insurance operations accounted for approximately 15% of our revenue and contributed approximately 58% of our gross profit.
Liquidity
As of December 31, 2020,2023, we had available liquidity of $1.4$1.7 billion, which was comprised of $160.2 million$0.8 billion in cash and $1.2$0.9 billion availability on our credit facilities and unfloored new vehicle inventory. In addition, our unfinanced real estate could provide additional liquidity of approximately $471 million.$0.4 billion. For further discussion of our liquidity, please refer to “Liquidity and Capital Resources” below.
Segments
ResultsWe operate in two reportable segments: Vehicle Operations and Financing Operations. Our Vehicle Operations segment consists of all aspects of our auto merchandising and service operations, excluding financing provided by our Financing Operations segment. Our Financing Operations segment provides financing to customers buying and leasing retail vehicles from our Vehicle Operations segment.
For the year ended December 31, 2020, we reported net income of $470.3 million, or $19.53 per diluted share. For the years ended December 31, 2019 and 2018, we reported net income of $271.5 million, or $11.60 per diluted share, and $265.7 million, or $10.86 per diluted share, respectively.
| | | | | | | | | | | | | | | | | | | | | | | | | | | | | | | | | | | | | | | | | | | | |
| | Year Ended December 31, |
| | | | | | 2020 vs. 2019 | | | | 2019 vs. 2018 |
| ($ in millions, except per vehicle data) | | 2020 | | 2019 | | Change | | % | | 2018 | | Change | | % |
| Revenues | | | | | | | | | | | | | | |
| New vehicle retail | | $ | 6,773.9 | | | $ | 6,799.1 | | | $ | (25.2) | | | (0.4) | % | | $ | 6,602.8 | | | $ | 196.3 | | | 3.0 | % |
| Used vehicle retail | | 3,998.4 | | | 3,527.2 | | | 471.2 | | | 13.4 | | | 3,079.0 | | | 448.2 | | | 14.6 | |
| Finance and insurance | | 579.8 | | | 518.6 | | | 61.2 | | | 11.8 | | | 454.8 | | | 63.8 | | | 14.0 | |
| Service, body and parts | | 1,348.7 | | | 1,325.1 | | | 23.6 | | | 1.8 | | | 1,222.3 | | | 102.8 | | | 8.4 | |
| Total revenues | | 13,124.3 | | | 12,672.7 | | | 451.6 | | | 3.6 | | | 11,821.4 | | | 851.3 | | | 7.2 | |
| | | | | | | | | | | | | | |
| Gross profit | | | | | | | | | | | | | | |
| New vehicle retail | | $ | 461.0 | | | $ | 385.6 | | | $ | 75.4 | | | 19.6 | % | | $ | 385.1 | | | $ | 0.5 | | | 0.1 | % |
| Used vehicle retail | | 446.0 | | | 367.5 | | | 78.5 | | | 21.4 | | | 322.9 | | | 44.6 | | | 13.8 | |
| Finance and insurance | | 579.8 | | | 518.6 | | | 61.2 | | | 11.8 | | | 454.8 | | | 63.8 | | | 14.0 | |
| Service, body and parts | | 716.8 | | | 667.6 | | | 49.2 | | | 7.4 | | | 600.7 | | | 66.9 | | | 11.1 | |
| Total gross profit | | 2,225.6 | | | 1,953.8 | | | 271.8 | | | 13.9 | | | 1,777.0 | | | 176.8 | | | 9.9 | |
| | | | | | | | | | | | | | |
| Gross profit margins | | | | | | | | | | | | | | |
| New vehicle retail | | 6.8 | % | | 5.7 | % | | 110 bp | | | | 5.8 | % | | -10 bp | | |
| Used vehicle retail | | 11.2 | | | 10.4 | | | 80 bp | | | | 10.5 | | | -10 bp | | |
| Finance and insurance | | 100.0 | | | 100.0 | | | 0 bp | | | | 100.0 | | | 0 bp | | |
| Service, body and parts | | 53.1 | | | 50.4 | | | 270 bp | | | | 49.1 | | | 130 bp | | |
| Total gross profit margin | | 17.0 | | | 15.4 | | | 160 bp | | | | 15.0 | | | 40 bp | | |
| | | | | | | | | | | | | | |
| Retail units sold | | | | | | | | | | | | | | |
| New vehicle retail | | 171,168 | | | 180,532 | | | (9,364) | | | (5.2) | % | | 184,601 | | | (4,069) | | | (2.2) | % |
| Used vehicle retail | | 183,230 | | | 170,423 | | | 12,807 | | | 7.5 | | | 151,234 | | | 19,189 | | | 12.7 | |
| | | | | | | | | | | | | | |
| Average selling price per retail unit | | | | | | | | | | | | | | |
| New vehicle retail | | $ | 39,575 | | | $ | 37,661 | | | $ | 1,914 | | | 5.1 | % | | $ | 35,768 | | | $ | 1,893 | | | 5.3 | % |
| Used vehicle retail | | 21,822 | | | 20,697 | | | 1,125 | | | 5.4 | | | 20,359 | | | 338 | | | 1.7 | |
| | | | | | | | | | | | | | |
| Average gross profit per retail unit | | | | | | | | | | | | | | |
| New vehicle retail | | $ | 2,693 | | | $ | 2,136 | | | $ | 557 | | | 26.1 | % | | $ | 2,086 | | | $ | 50 | | | 2.4 | % |
| Used vehicle retail | | 2,434 | | | 2,156 | | | 278 | | | 12.9 | | | 2,135 | | | 21 | | | 1.0 | |
| Finance and insurance | | 1,636 | | | 1,478 | | | 158 | | | 10.7 | | | 1,354 | | | 124 | | | 9.2 | |
Vehicle Operations
| | | | | | | | | | | | | | | | | | | | | | | | | | | | | | | | | | | | | | | | | | | | |
| | Year Ended December 31, |
| | | | | | 2023 vs. 2022 | | | | 2022 vs. 2021 |
| ($ in millions, except per vehicle data) | | 2023 | | 2022 | | Change | | % | | 2021 | | Change | | % |
| Revenues | | | | | | | | | | | | | | |
| New vehicle retail | | $ | 15,154.2 | | | $ | 12,894.5 | | | $ | 2,259.7 | | | 17.5 | % | | $ | 11,197.7 | | | $ | 1,696.8 | | | 15.2 | % |
| Used vehicle retail | | 9,570.2 | | | 9,425.0 | | | 145.2 | | | 1.5 | | | 7,255.3 | | | 2,169.7 | | | 29.9 | |
| | | | | | | | | | | | | | |
| Finance and insurance | | 1,337.0 | | | 1,285.4 | | | 51.6 | | | 4.0 | | | 1,051.3 | | | 234.1 | | | 22.3 | |
| Service, body and parts | | 3,197.1 | | | 2,738.8 | | | 458.3 | | | 16.7 | | | 2,110.9 | | | 627.9 | | | 29.7 | |
| | | | | | | | | | | | | | |
| Total revenues | | 31,042.3 | | | 28,187.8 | | | 2,854.5 | | | 10.1 | | | 22,831.7 | | | 5,356.1 | | | 23.5 | |
| | | | | | | | | | | | | | |
| Gross profit | | | | | | | | | | | | | | |
| New vehicle retail | | $ | 1,394.1 | | | $ | 1,579.7 | | | $ | (185.6) | | | (11.7) | % | | $ | 1,218.5 | | | $ | 361.2 | | | 29.6 | % |
| Used vehicle retail | | 721.4 | | | 825.4 | | | (104.0) | | | (12.6) | | | 826.7 | | | (1.3) | | | (0.2) | |
| | | | | | | | | | | | | | |
| Finance and insurance | | 1,337.0 | | | 1,285.4 | | | 51.6 | | | 4.0 | | | 1,051.3 | | | 234.1 | | | 22.3 | |
| Service, body and parts | | 1,751.4 | | | 1,463.1 | | | 288.3 | | | 19.7 | | | 1,110.5 | | | 352.6 | | | 31.8 | |
| | | | | | | | | | | | | | |
| Total gross profit | | 5,228.9 | | | 5,152.4 | | | 76.5 | | | 1.5 | | | 4,259.0 | | | 893.4 | | | 21.0 | |
| | | | | | | | | | | | | | |
| Gross profit margins | | | | | | | | | | | | | | |
| New vehicle retail | | 9.2 | % | | 12.3 | % | | -310 bp | | | | 10.9 | % | | 140 bp | | |
| Used vehicle retail | | 7.5 | | | 8.8 | | | -130 bp | | | | 11.4 | | | -260 bp | | |
| | | | | | | | | | | | | | |
| Finance and insurance | | 100.0 | | | 100.0 | | | — bp | | | | 100.0 | | | — bp | | |
| Service, body and parts | | 54.8 | | | 53.4 | | | 140 bp | | | | 52.6 | | | 80 bp | | |
| | | | | | | | | | | | | | |
| Total gross profit margin | | 16.8 | | | 18.3 | | | -150 bp | | | | 18.7 | | | -40 bp | | |
| | | | | | | | | | | | | | |
| Retail units sold | | | | | | | | | | | | | | |
| New vehicle retail | | 314,116 | | | 271,596 | | | 42,520 | | | 15.7 | % | | 260,738 | | | 10,858 | | | 4.2 | % |
| Used vehicle retail | | 325,764 | | | 311,764 | | | 14,000 | | | 4.5 | | | 275,495 | | | 36,269 | | | 13.2 | |
| | | | | | | | | | | | | | |
| Average selling price per retail unit | | | | | | | | | | | | | | |
| New vehicle retail | | $ | 48,244 | | | $ | 47,477 | | | $ | 767 | | | 1.6 | % | | $ | 42,946 | | | $ | 4,531 | | | 10.6 | % |
| Used vehicle retail | | 29,378 | | | 30,231 | | | (853) | | | (2.8) | | | 26,336 | | | 3,895 | | | 14.8 | |
| | | | | | | | | | | | | | |
| Average gross profit per retail unit | | | | | | | | | | | | | | |
| New vehicle retail | | $ | 4,438 | | | $ | 5,816 | | | $ | (1,378) | | | (23.7) | % | | $ | 4,673 | | | $ | 1,143 | | | 24.5 | % |
| Used vehicle retail | | 2,215 | | | 2,648 | | | (433) | | | (16.4) | | | 3,001 | | | (353) | | | (11.8) | |
| Finance and insurance | | 2,090 | | | 2,203 | | | (113) | | | (5.1) | | | 1,960 | | | 243 | | | 12.4 | |
Total vehicle (1) | | 5,367 | | | 6,300 | | | (933) | | | (14.8) | | | 5,855 | | | 445 | | | 7.6 | |
(1)Includes the sales and gross profit related to new, used retail, used wholesale and finance and insurance and unit sales for new and used retail
Same Store Operating Data
We believe that same store comparisons are an important indicator of our financial performance. Same store measures demonstrate our ability to grow operations in our existing locations. Therefore, we have integrated same store measures into the discussion below.
Same store measures reflect results for stores that were operating in each comparison period, and only include the months when operations occurred in both periods. For example, a store acquired in November 20192022 would be included in same store operating data beginning in December 2020,2023, after its first complete comparable month of operations. The fourth quarter operating results for the same store comparisons would include results for that store in only the period of December for both comparable periods.
| | | | | | | | | | | | | | | | | | | | | | | | | | | | | | | | | | | | | | | | | | | | | | | | | | |
| | Year Ended December 31, |
| | | | | | 2020 vs. 2019 | | | | | | 2019 vs. 2018 |
| ($ in millions, except per vehicle data) | | 2020 | | 2019 | | Change | | % | | 2019 | | 2018 | | Change | | % |
| Revenues | | | | | | | | | | | | | | | | |
| New vehicle retail | | $ | 5,943.6 | | | $ | 6,548.6 | | | $ | (605.0) | | | (9.2) | % | | $ | 6,324.4 | | | $ | 6,220.5 | | | $ | 103.9 | | | 1.7 | % |
| Used vehicle retail | | 3,594.8 | | | 3,390.7 | | | 204.1 | | | 6.0 | | | 3,296.1 | | | 2,890.7 | | | 405.4 | | | 14.0 | |
| Finance and insurance | | 504.2 | | | 499.8 | | | 4.4 | | | 0.9 | | | 486.2 | | | 429.1 | | | 57.1 | | | 13.3 | |
| Service, body and parts | | 1,188.8 | | | 1,271.0 | | | (82.2) | | | (6.5) | | | 1,230.8 | | | 1,144.0 | | | 86.8 | | | 7.6 | |
| Total revenues | | 11,611.5 | | | 12,193.8 | | | (582.3) | | | (4.8) | | | 11,810.8 | | | 11,111.4 | | | 699.4 | | | 6.3 | |
| | | | | | | | | | | | | | | | |
| Gross profit | | | | | | | | | | | | | | | | |
| New vehicle retail | | $ | 411.8 | | | $ | 373.5 | | | $ | 38.3 | | | 10.3 | % | | $ | 359.7 | | | $ | 362.9 | | | $ | (3.2) | | | (0.9) | % |
| Used vehicle retail | | 405.9 | | | 357.3 | | | 48.6 | | | 13.6 | | | 348.5 | | | 308.5 | | | 40.0 | | | 13.0 | |
| Finance and insurance | | 504.2 | | | 499.8 | | | 4.4 | | | 0.9 | | | 486.2 | | | 429.1 | | | 57.1 | | | 13.3 | |
| Service, body and parts | | 626.2 | | | 640.6 | | | (14.4) | | | (2.2) | | | 620.6 | | | 564.2 | | | 56.4 | | | 10.0 | |
| Total gross profit | | 1,968.6 | | | 1,885.7 | | | 82.9 | | | 4.4 | | | 1,829.0 | | | 1,678.1 | | | 150.9 | | | 9.0 | |
| | | | | | | | | | | | | | | | |
| Gross profit margins | | | | | | | | | | | | | | | | |
| New vehicle retail | | 6.9 | % | | 5.7 | % | | 120 bp | | | | 5.7 | % | | 5.8 | % | | -10 bp | | |
| Used vehicle retail | | 11.3 | | | 10.5 | | | 80 bp | | | | 10.6 | | | 10.7 | | | -10 bp | | |
| Finance and insurance | | 100.0 | | | 100.0 | | | — bp | | | | 100.0 | | | 100.0 | | | — bp | | |
| Service, body and parts | | 52.7 | | | 50.4 | | | 230 bp | | | | 50.4 | | | 49.3 | | | 110 bp | | |
| Total gross profit margin | | 17.0 | | | 15.5 | | | 150 bp | | | | 15.5 | | | 15.1 | | | 40 bp | | |
| | | | | | | | | | | | | | | | |
| Retail units sold | | | | | | | | | | | | | | | | |
| New vehicle retail | | 149,203 | | | 173,561 | | | (24,358) | | | (14.0) | % | | 167,660 | | | 173,214 | | | (5,554) | | | (3.2) | % |
| Used vehicle retail | | 165,097 | | | 163,443 | | | 1,654 | | | 1.0 | | | 159,078 | | | 141,145 | | | 17,933 | | | 12.7 | |
| | | | | | | | | | | | | | | | |
| Average selling price per retail unit | | | | | | | | | | | | | | | | |
| New vehicle retail | | $ | 39,836 | | | $ | 37,731 | | | $ | 2,105 | | | 5.6 | % | | $ | 37,722 | | | $ | 35,912 | | | $ | 1,810 | | | 5.0 | % |
| Used vehicle retail | | 21,774 | | | 20,745 | | | 1,029 | | | 5.0 | | | 20,720 | | | 20,480 | | | 240 | | | 1.2 | |
| | | | | | | | | | | | | | | | |
| Average gross profit per retail unit | | | | | | | | | | | | | | | | |
| New vehicle retail | | $ | 2,760 | | | $ | 2,152 | | | $ | 608 | | | 28.3 | % | | $ | 2,145 | | | $ | 2,095 | | | $ | 50 | | | 2.4 | % |
| Used vehicle retail | | 2,459 | | | 2,186 | | | 273 | | | 12.5 | | | 2,191 | | | 2,186 | | | 5 | | | 0.2 | |
| Finance and insurance | | 1,604 | | | 1,483 | | | 121 | | | 8.2 | | | 1,488 | | | 1,365 | | | 123 | | | 9.0 | |
| | | | | | | | | | | | | | | | | | | | | | | | | | | | | | | | | | | | | | | | | | | | | | | | | | |
| | Year Ended December 31, |
| | | | | | 2023 vs. 2022 | | | | | | 2022 vs. 2021 |
| ($ in millions, except per vehicle data) | | 2023 | | 2022 | | Change | | % | | 2022 | | 2021 | | Change | | % |
| Revenues | | | | | | | | | | | | | | | | |
| New vehicle retail | | $ | 13,197.3 | | | $ | 12,562.0 | | | $ | 635.3 | | | 5.1 | % | | $ | 10,009.9 | | | $ | 10,607.9 | | | $ | (598.0) | | | (5.6) | % |
| Used vehicle retail | | 8,173.4 | | | 9,182.3 | | | (1,008.9) | | | (11.0) | | | 7,779.6 | | | 6,896.3 | | | 883.3 | | | 12.8 | |
| | | | | | | | | | | | | | | | |
| Finance and insurance | | 1,205.0 | | | 1,253.9 | | | (48.9) | | | (3.9) | | | 1,016.5 | | | 999.1 | | | 17.4 | | | 1.7 | |
| Service, body and parts | | 2,803.1 | | | 2,657.4 | | | 145.7 | | | 5.5 | | | 2,207.8 | | | 2,009.0 | | | 198.8 | | | 9.9 | |
| | | | | | | | | | | | | | | | |
| Total revenues | | 26,708.4 | | | 27,454.4 | | | (746.0) | | | (2.7) | | | 22,378.3 | | | 21,673.0 | | | 705.3 | | | 3.3 | |
| | | | | | | | | | | | | | | | |
| Gross profit | | | | | | | | | | | | | | | | |
| New vehicle retail | | $ | 1,205.3 | | | $ | 1,541.9 | | | $ | (336.6) | | | (21.8) | % | | $ | 1,221.7 | | | $ | 1,163.6 | | | $ | 58.1 | | | 5.0 | % |
| Used vehicle retail | | 614.1 | | | 801.1 | | | (187.0) | | | (23.3) | | | 663.7 | | | 784.2 | | | (120.5) | | | (15.4) | |
| | | | | | | | | | | | | | | | |
| Finance and insurance | | 1,205.0 | | | 1,253.9 | | | (48.9) | | | (3.9) | | | 1,016.5 | | | 999.1 | | | 17.4 | | | 1.7 | |
| Service, body and parts | | 1,533.5 | | | 1,424.0 | | | 109.5 | | | 7.7 | | | 1,193.4 | | | 1,058.0 | | | 135.4 | | | 12.8 | |
| | | | | | | | | | | | | | | | |
| Total gross profit | | 4,554.2 | | | 5,018.8 | | | (464.6) | | | (9.3) | | | 4,082.0 | | | 4,055.6 | | | 26.4 | | | 0.7 | |
| | | | | | | | | | | | | | | | |
| Gross profit margins | | | | | | | | | | | | | | | | |
| New vehicle retail | | 9.1 | % | | 12.3 | % | | -320 bp | | | | 12.2 | % | | 11.0 | % | | 120 bp | | |
| Used vehicle retail | | 7.5 | | | 8.7 | | | -120 bp | | | | 8.5 | | | 11.4 | | | -290 bp | | |
| | | | | | | | | | | | | | | | |
| Finance and insurance | | 100.0 | | | 100.0 | | | — bp | | | | 100.0 | | | 100.0 | | | — bp | | |
| Service, body and parts | | 54.7 | | | 53.6 | | | 110 bp | | | | 54.1 | | | 52.7 | | | 140 bp | | |
| | | | | | | | | | | | | | | | |
| Total gross profit margin | | 17.1 | | | 18.3 | | | -120 bp | | | | 18.2 | | | 18.7 | | | -50 bp | | |
| | | | | | | | | | | | | | | | |
| Retail units sold | | | | | | | | | | | | | | | | |
| New vehicle retail | | 272,780 | | | 264,510 | | | 8,270 | | | 3.1 | % | | 208,185 | | | 246,186 | | | (38,001) | | | (15.4) | % |
| Used vehicle retail | | 285,708 | | | 303,037 | | | (17,329) | | | (5.7) | | | 257,968 | | | 259,978 | | | (2,010) | | | (0.8) | |
| | | | | | | | | | | | | | | | |
| Average selling price per retail unit | | | | | | | | | | | | | | | | |
| New vehicle retail | | $ | 48,381 | | | $ | 47,492 | | | $ | 889 | | | 1.9 | % | | $ | 48,082 | | | $ | 43,089 | | | $ | 4,993 | | | 11.6 | % |
| Used vehicle retail | | 28,607 | | | 30,301 | | | (1,694) | | | (5.6) | | | 30,157 | | | 26,527 | | | 3,630 | | | 13.7 | |
| | | | | | | | | | | | | | | | |
| Average gross profit per retail unit | | | | | | | | | | | | | | | | |
| New vehicle retail | | $ | 4,419 | | | $ | 5,829 | | | $ | (1,410) | | | (24.2) | % | | $ | 5,868 | | | $ | 4,726 | | | $ | 1,142 | | | 24.2 | % |
| Used vehicle retail | | 2,149 | | | 2,643 | | | (494) | | | (18.7) | | | 2,573 | | | 3,017 | | | (444) | | | (14.7) | |
| Finance and insurance | | 2,158 | | | 2,209 | | | (51) | | | (2.3) | | | 2,181 | | | 1,974 | | | 207 | | | 10.5 | |
Total vehicle (1) | | 5,383 | | | 6,312 | | | (929) | | | (14.7) | | | 6,175 | | | 5,907 | | | 268 | | | 4.5 | |
New Vehicles
Under our business strategy, we believe that our new vehicle sales create incremental profit opportunities through certain manufacturer incentive programs, provideproviding used vehicle inventory through trade-ins, arranging of third partythird-party financing, vehicle service and insurance contracts, future resale of used vehicles acquired through trade-in and parts and service work.
2023 vs. 2022
New vehicle revenue grew 17.5%, resulting from a 15.7% increase in unit sales due to our accelerated growth through strategic acquisitions, complemented by a 1.6% increase in average selling prices. Same store new vehicle revenue was primarily impacted by a 3.1% increase in unit sales, supplemented by an increase in average selling prices of 1.9%. Market demand continued to increase in 2023 off a depressed base last year.
During 2020, volumes were impactedNew vehicle gross profit declined 11.7%, primarily due to a 23.7% decrease in average gross profit per unit, partially offset by sheltera 15.7% increase in place policies and restrictions enactedunit sales driven by various states, counties and local governments in response to the COVID-19 pandemic. Throughout the year, the impact of the pandemic on each of our markets varied. We experienced initial declines of approximately 50% on average in late March and early April. In our most restrictive states, such as Pennsylvania and Vermont, our locations had few or no sales during those weeks. As restrictions eased during the second quarter,acquisitions. On a same store basis, gross profit per new vehicle sales begandecreased 24.2%, continuing to improve with period over period declines gradually decreasing.normalize to pre-pandemic levels.
2022 vs. 2021
New vehicle revenues and gross profit grew 15.2% and 29.6%, respectively. These improvements resulted from our accelerated growth through acquisitions.
The decrease in same store new vehicle revenues for 2020 compared to 2019 was driven by thea decrease in unit volume of 14.0%15.4%, partially offset by an increase in average selling prices of 5.6%11.6%. As the national new vehicle market plateaus, our stores focus on improving gross profit per new vehicle sold. On a sameSame store basis, gross profit per new vehicle increased 28.3% during 2020 compared to 2019. Our recently acquired stores are also focused on improving gross profit per24.2%, driven by demand from prior year shortages of available new vehicle as total company gross profit per unit increased 26.1% during 2020 compared to 2019. Pent-up demand and reduced inventory levels related to short-term production closures combined with increased manufacturer partner incentives contributed to these improvementsvehicles for sale, resulting from certain component shortages in gross profit per unit. We believe these increases in gross profit per unit will return to normalized levels in 2021.
The same store new vehicle sales increase in 2019 over 2018 of 1.7% included an increase of 5.0% in average selling prices, offset by a decrease in volume of 3.2%.the manufacturers’ supply chains.
Used Vehicles
Our used vehicle operations provide an opportunity to generate sales to customers unable or unwilling to purchase a new vehicle, sell brands other than the store’s new vehicle franchise(s), access additional used vehicle inventory through trade-ins and increase sales from finance and insurance products and parts and service.
Used vehicle retail sales are a strategic focus for organic growth. We offer three categories of used vehicles: manufacturer certified pre-owned (CPO) vehicles; core vehicles, which are late-model vehicles with lower mileage; and value autos, which are vehicles with over 80,000 miles. We have established a company-wide target of achieving a per store average of 100 used retail units per month. Strategies to achieve this target include reducing wholesale sales and selling the full spectrum of used units, from late model CPO modelsvehicles to vehicles over ten years old. During 2020,2023, our stores sold an average of 7882 used vehicles per store per month. This compares to 7791 used vehicles per store per month in 20192022 and 6992 in 2018.2021. Used vehicle operations are generally an opportunity area for recently acquired and opened locations. As we acquired 56 and 32 locations in 2023 and 2022, respectively, this decrease in 2023 was due to the volume of stores recently acquired still being integrated into our existing operational strategies as well as the result of supply constraints of new vehicles during the pandemic period impacting late model availability today.
2023 vs. 2022
Used vehicle revenues increased 1.5%, due to increased volume from acquisitions, offset by decreased volume at our seasoned stores. On a same store basis, used vehicle revenues decreased 11.0%, due to a 5.7% decrease in unit volume and a 5.6% decrease in average selling price per retail unit. The same store revenue decrease in 2023 was driven by a decrease in our core vehicles of 14.9% and decreases in value auto and CPO vehicle categories of 12.4% and 0.7%, respectively. The decrease in our core vehicle category includes a 10.3% decrease in volume and a 5.1% decrease in average selling price per vehicle.
Used vehicle gross profits decreased 12.6%, due to a 16.4% decrease in average gross profit per unit. On a same store basis, used vehicle gross profit decreased 23.3%, led by a decrease in our CPO vehicles of 35.0% with additional declines in our core and value auto vehicle categories of 20.4% and 11.6%, respectively. The decrease in our CPO vehicle category was driven by a decrease in gross profit per unit of 38.2% to $2,321, offset by an increase in unit volume of 5.2%. Gross profit per unit in our core vehicle category, which accounted for 58.2% of our used vehicle unit sales, decreased 11.3% to $1,992. The decrease in same store gross profit in our value auto category was driven by a 8.9% decrease in gross profit per unit to $2,433.
2022 vs. 2021
Used vehicle revenues increased 13.4% during 2020 compared to 2019 and 14.6% in 2019 compared to 2018. These increases are29.9%, due to a combination of increased volume from acquisitions and organic growth in our core and value autoall categories of used vehicle sales at our seasoned stores. Excluding the impact of acquisitions, on a same store basis, used vehicle revenues increased 6.0% during 2020 and included12.8%, due to a 1.0% increase in unit volume and a 5.0%13.7% increase in average selling price per retail unit, compared to 2019. The revenue increase in 2020 was driven by increases in our core and value auto categories of 10.1% and 7.2%, respectively,partially offset by a 0.8% decrease in CPO vehicle revenues of 3.0%. The increase in our core vehicle category includes a 4.6% increase in volume, complimented by a 5.3% increase in average selling price per vehicle. The increase in our value auto category is due to an increase in unit sales of 1.5% and an increase in average selling price per vehicle of 5.6%.volume.
Used vehicle gross profits increased 21.4% during 2020 compareddecreased 0.2%, due to 2019 and 13.8%an 11.8% decrease in 2019 compared to 2018.average gross profit per unit, mostly offset by a 13.2% increase in units sold. On a same store basis, used vehicle gross profit increased 13.6% in 2020 compared to 2019,decreased 15.4%, led by the performance in our core and value auto categories with increases of 15.2% and 14.5%, respectively, complimented by an increase in our CPO vehicles of 8.8%. The increase in our core vehicle category was primarily driven by an increase in gross profit per unit. Gross profit per unit in our core vehicle category, which accounted for 57.0% of our used vehicle unit sales in 2020, increased 10.1%, from $2,239 in 2019 to $2,465 in 2020. The increase in same store gross profit in our value auto category was driven by a 12.8% increase in gross profit per unit from $2,211 in 2019 to $2,494 in 2020. Our CPO category experienced a decrease in volume, with unit sales decreasing 7.9% in 2020 compared to 2019, but saw an increase inaverage gross profit per unit of 18.1%, from $2,040 in 2019 to $2,408 in 2020.14.7%.
Similar to new vehicles, volumes were impacted by the shelter in place policies and restrictions enacted. Initial declines were similar to new vehicles; however, we experienced improvements during the second quarter of 2020,
which accelerated into the third quarter of 2020. We believe our used inventory performance will return to normalized levels in 2021.
Used vehicle revenues increased 14.0% in 2019 compared to 2018 on a same store basis due to increases in unit volume and average selling prices of 12.7% and 1.2%, respectively. Same store used vehicle gross profit also increased 13.0% in 2019 compared to 2018.
Our used vehicle operations provide an opportunity to generate sales to customers unable or unwilling to purchase a new vehicle, sell brands other than the store’s new vehicle franchise(s), access additional used vehicle inventory through trade-ins and increase sales from finance and insurance products and parts and service.
Third-Party Finance and Insurance
We believe that arranging timely vehicle financing is an important part of providing personal transportation solutions, and we attempt to arrange financing for every vehicle we sell. We also offer related products such as extended warranties, insurance contracts and vehicle and theft protection. Third-party extended warranty and insurance contracts yield higher profit margins than vehicle sales and contribute significantly to our profitability.
The increases in2023 vs. 2022
Finance and insurance revenue increased 4.0%, primarily due to increased volume related to acquisitions. On a same store basis, finance and insurance revenue decreased 3.9%, to $2,158 per unit. This decrease was driven by lower finance reserve paid per unit from third-party lenders as a result of the higher interest rate environment. We also experienced a partial decrease in 2020 compared to 2019the volume of third-party financing as a result of increased penetration rates associated with our Financing Operations and in 2019 compared to 2018, werethe growth of our captive auto loan and lease portfolio businesses.
2022 vs. 2021
Finance and insurance revenue increased 22.3%, primarily due to increased volume related to acquisitions, combined with expanded product offerings and increasing penetration rates. Third party extended warranty and insurance contracts yield higher profit margins than vehicle sales and contribute significantly to our profitability. During 2020, finance and insurance sales accounted for 4.4% of total revenues and 26.1% of total gross profits. On a same store basis, finance and insurance sales accounted for 4.3% of total revenues and 25.6% of total gross profits in 2020. Same store finance and insurance revenuesrevenue increased 0.9% during 2020 compared1.7%, to 2019 and 13.3% during 2019 compared to 2018. These increases were driven by increases in finance and insurance revenues$2,181 per retail unit, combined with increases in used vehicle unit volume, offset by decreases in new vehicle unit volume. On a same store basis, our finance and insurance revenues per retail unit increased $121 per unit to $1,604 in 2020 compared to 2019 and $123 per unit to $1,488 in 2019 compared to 2018. The increase in 2020 compared to 2019 was primarily due to increases in service contract and financing penetration rates of 80 basis points and 70 basis points, respectively, from 47.9% to 48.7% and from 73.7% to 74.4%, respectively.unit.
Service, bodyBody and partsParts
We provide service, body and parts for the new vehicle brands sold by our stores, as well as service and repairs for most other makes and models. Our parts and service operations are an integral part of our customer retention and the largest contributor to our overall profitability. Earnings from service, body and parts have historically been more resilient during economic downturns, when owners have tended to repair their existing vehicles rather than buy new vehicles.
Our service, body and parts revenue grew in customer pay and warranty work in 2020 compared to 2019 and in all areas in 2019 compared to 2018, primarily due to acquisitions. With more late-model units in operation, from 2010 to 2016continued increase of vehicles in operation, and a plateauing new vehicle market, we believe the increased number of units in operation will continue to benefit our service, body and parts revenue in the coming years as more late-model vehicles age, necessitating repairs and maintenance. We focus on retaining customers by offering competitively-priced routine maintenance and through our marketing efforts.
2023 vs. 2022
Our service, body and parts revenue grew in all areas, primarily due to our strategic acquisition growth. On a same store basis, service, body and parts revenue declined 6.5% during 2020,increased 5.5%, primarily driven by decreasesan increase in customer pay and warranty revenues of 4.8% and 6.3%, respectively, primarily as a result of shelter in place policies in effect during the first half of 2020.5.2%. Performance in parts wholesale and body shop also saw decreasesan increase of 10.6% and 11.7%, respectively, compared to the same period of 2019.
8.0%. Same store service, body and parts gross profit decreased 2.2% during 2020 compared to 2019 and increased 10.0% during 2019 compared to 2018. These changes were also driven by customer pay and warranty work.7.7%. Our gross margins continue to increase as our mix has shifted towards customer pay, which has higher margins than other service work.
| | | | | | | | | | | | | | |
|  | | 25 | |
SegmentsFinancing Operations
Certain financial
In the United States, Financing Operations is a captive lender, originating loans only from stores and Driveway. In Canada, Financing Operations originates loans and leases from both our Canadian stores and third-party dealerships. Our stores do not exclusively finance vehicles through Financing Operations, rather originations are earned on a competitive basis with other lenders.
Financing Operations provides an opportunity to capture additional profits, cash flows, and sales while managing our reliance on third-party finance sources. Management regularly analyzes Financing Operations’ results by assessing profitability, the performance of the finance receivables, including trends in credit losses and delinquencies, and expenses directly related to Financing Operations. This information by segment is as follows:used to assess Financing Operations performance and make operating decisions, including resource allocation.
| | | | | | | | | | | | | | | | | | | | | | | | | | | | | | | | | | | | | | | | | | | | |
| | Year Ended December 31, |
| | | | | | 2020 vs. 2019 | | | | 2019 vs. 2018 |
| (Dollars in millions) | | 2020 | | 2019 | | Change | | % | | 2018 | | Change | | % |
| Revenues: | | | | | | | | | | | | | | |
| Domestic | | $ | 4,503.0 | | | $ | 4,382.4 | | | $ | 120.6 | | | 2.8 | % | | $ | 4,215.0 | | | $ | 167.4 | | | 4.0 | % |
| Import | | 5,448.8 | | | 5,267.8 | | | 181.0 | | | 3.4 | | | 5,038.1 | | | 229.7 | | | 4.6 | |
| Luxury | | 3,152.0 | | | 2,991.9 | | | 160.1 | | | 5.4 | | | 2,560.3 | | | 431.6 | | | 16.9 | |
| | 13,103.8 | | | 12,642.1 | | | 461.7 | | | 3.7 | | | 11,813.4 | | | 828.7 | | | 7.0 | |
| Corporate and other | | 20.5 | | | 30.6 | | | (10.1) | | | NM | | 8.0 | | | 22.6 | | | NM |
| | $ | 13,124.3 | | | $ | 12,672.7 | | | $ | 451.6 | | | 3.6 | % | | $ | 11,821.4 | | | $ | 851.3 | | | 7.2 | % |
NM - Not meaningful
| | | | | | | | | | | | | | | | | | | | | | | | | | | | | | | | | | | | | | | | | | | | |
| | Year Ended December 31, |
| | | | | | 2020 vs. 2019 | | | | 2019 vs. 2018 |
| (Dollars in millions) | | 2020 | | 2019 | | Change | | % | | 2018 | | Change | | % |
| Segment income*: | | | | | | | | | | | | | | |
| Domestic | | $ | 230.0 | | | $ | 123.4 | | | $ | 106.6 | | | 86.4 | % | | $ | 97.6 | | | $ | 25.8 | | | 26.4 | % |
| Import | | 249.8 | | | 153.9 | | | 95.9 | | | 62.3 | | | 116.2 | | | 37.7 | | | 32.4 | |
| Luxury | | 98.5 | | | 57.1 | | | 41.4 | | | 72.5 | | | 43.9 | | | 13.2 | | | 30.1 | |
| Total segment income for reportable segments | | $ | 578.3 | | | $ | 334.4 | | | $ | 243.9 | | | 72.9 | % | | $ | 257.7 | | | $ | 76.7 | | | 29.8 | % |
*Segment incomeOur proprietary credit model performs a return on investment (ROI) calculation for each application, ensuring that the return obtained is appropriately balanced with the consumer’s credit risk. On a fully discounted basis, we target earnings at least three times the net finance income earned from third party lenders (finance reserve less commissions paid) over the life of the segments is a Non-GAAP measure defined as Income from operations before income taxes, depreciationloan. Actual return of the loans may differ based on the changing risk profile of originations, economic conditions, and amortization, other interest expenserates of recovery for charged off vehicles. Actions taken during 2022 to adjust ROI targets in the context of the uncertain macroeconomic environment, along with the acquisition of dealerships whose brands attract relatively more credit-worthy consumers, resulted in loans and other income, net.
Reconciliation of total segment income for reportable segments to our consolidated income before income taxes:
| | | | | | | | | | | | | | | | | | | | | | | | | | | | | | | | | | | | | | | | | | | | |
| | Year Ended December 31, |
| | | | | | 2020 vs. 2019 | | | | 2019 vs. 2018 |
| (Dollars in millions) | | 2020 | | 2019 | | Change | | % | | 2018 | | Change | | % |
| Total segment income for reportable segments | | $ | 578.3 | | | $ | 334.4 | | | $ | 243.9 | | | 72.9 | % | | $ | 257.7 | | | $ | 76.7 | | | 29.8 | % |
| Corporate and other | | 176.7 | | | 170.2 | | | 6.5 | | | 3.8 | | | 202.3 | | | (32.1) | | | (15.9) | |
| Depreciation and amortization | | (92.3) | | | (82.4) | | | 9.9 | | | 12.0 | | | (75.4) | | | 7.0 | | | 9.3 | |
| Other interest expense | | (73.1) | | | (60.6) | | | 12.5 | | | 20.6 | | | (56.0) | | | 4.6 | | | 8.2 | |
| Other income, net | | 58.9 | | | 13.8 | | | 45.1 | | | NM | | 8.9 | | | 4.9 | | | NM |
| Income before income taxes | | $ | 648.5 | | | $ | 375.4 | | | $ | 273.1 | | | 72.7 | % | | $ | 337.5 | | | $ | 37.9 | | | 11.2 | % |
NM - Not meaningful
| | | | | | | | | | | | | | | | | | | | | | | | | | | | | | | | | | | | | | | | | | | | |
| | Year Ended December 31, |
| | | | | | 2020 vs. 2019 | | | | 2019 vs. 2018 |
| | 2020 | | 2019 | | Change | | % | | 2018 | | Change | | % |
| Retail new vehicle retail unit sales: | | | | | | | | | | | | | | |
| Domestic | | 48,421 | | | 53,262 | | | (4,841) | | | (9.1) | % | | 55,653 | | | (2,391) | | | (4.3) | % |
| Import | | 93,111 | | | 98,365 | | | (5,254) | | | (5.3) | | | 102,454 | | | (4,089) | | | (4.0) | |
| Luxury | | 30,087 | | | 29,238 | | | 849 | | | 2.9 | | | 26,915 | | | 2,323 | | | 8.6 | |
| | 171,619 | | | 180,865 | | | (9,246) | | | (5.1) | | | 185,022 | | | (4,157) | | | (2.2) | |
| Allocated to management | | (451) | | | (333) | | | (118) | | | (35.4) | | | (421) | | | 88 | | | 20.9 | |
| | 171,168 | | | 180,532 | | | (9,364) | | | (5.2) | % | | 184,601 | | | (4,069) | | | (2.2) | % |
We typically use securitizations, warehouse facilities, and internal capital to fund loans and leases originated by our Financing Operations. Financing Operations income reflects the interest, fee, and lease income generated by the portfolio of auto loan and lease receivables less the interest expense associated with the debt utilized to fund the lending, including internal capital, a provision for estimated loan and lease losses, depreciation on vehicles leased via operating leases and directly-related expenses.
Total interest margin reflects the spread between interest, fee, and lease charges to consumers and our funding costs. Changes in the interest margin on new originations affect Financing Operations income over time. Increases or decreases in interest rates, which affect Financing Operations’ funding costs, or other competitive pressures on consumer rates, could result in compression or expansion in the interest margin on new originations. Changes in the provision for loan and lease losses as a percentage of ending managed receivables reflect the effect of changes in loss experience, economic factors, and asset-specific risks on our outlook for net losses expected to occur over the remaining contractual life of the loans and leases receivable.
Domestic
A summary of financial information for our Domestic segment follows:
| | | | | | | | | | | | | | | | | | | | | | | | | | | | | | | | | | | | | | | | | | | | |
| | Year Ended December 31, |
| | | | | | 2020 vs. 2019 | | | | 2019 vs. 2018 |
| (Dollars in millions) | | 2020 | | 2019 | | Change | | % | | 2018 | | Change | | % |
| Revenue: | | | | | | | | | | | | | | |
| New vehicle retail | | $ | 2,235.0 | | | $ | 2,287.5 | | | $ | (52.5) | | | (2.3) | % | | $ | 2,290.1 | | | $ | (2.6) | | | (0.1) | % |
| Used vehicle retail | | 1,461.0 | | | 1,264.7 | | | 196.3 | | | 15.5 | | | 1,107.4 | | | 157.3 | | | 14.2 | |
| Used vehicle wholesale | | 104.1 | | | 113.6 | | | (9.5) | | | (8.4) | | | 134.9 | | | (21.3) | | | (15.8) | |
| Finance and insurance | | 199.0 | | | 184.2 | | | 14.8 | | | 8.0 | | | 166.4 | | | 17.8 | | | 10.7 | |
| Service, body and parts | | 456.7 | | | 477.5 | | | (20.8) | | | (4.4) | | | 451.4 | | | 26.1 | | | 5.8 | |
| Fleet and other | | 47.2 | | | 54.9 | | | (7.7) | | | (14.0) | | | 64.8 | | | (9.9) | | | (15.3) | |
| | $ | 4,503.0 | | | $ | 4,382.4 | | | $ | 120.6 | | | 2.8 | | | $ | 4,215.0 | | | $ | 167.4 | | | 4.0 | |
| Segment income | | $ | 230.0 | | | $ | 123.4 | | | $ | 106.6 | | | 86.4 | | | $ | 97.6 | | | $ | 25.8 | | | 26.4 | |
| Retail new vehicle retail unit sales | | 48,421 | | | 53,262 | | | (4,841) | | | (9.1) | % | | 55,653 | | | (2,391) | | | (4.3) | % |
Total Revenue in our Domestic segment increased 2.8% in 2020 compared to 2019. New vehicle unit sales decreased 9.1%, 10.3% on a same store basis, in 2020 compared to 2019, primarily due to decreases in Chrysler and Ford. However, Domestic segment revenues benefited from improved used vehicle retail sales due to an 8.4% increase in volume and a 14.1% increase in gross profit per vehicle in 2020 compared to 2019. Finance and Insurance revenue also contributed to the overall increase in Domestic segment revenue, driven by the increased used vehicle retail volume, combined with a 7.9% increase in finance and insurance income per retail unit sold to $1,765 per unit.
Strong performance in used vehicle retail, service, body and parts, and finance and insurance revenues in 2019 contributed to the 4.0% increase in revenue over 2018.
Our Domestic segment income increased 86.4% in 2020 compared to 2019 due to gross profit growth of 12.1% with declines in SG&A and floor plan interest expense of 0.4% and 42.3%, respectively. As a percentage of gross profit, SG&A decreased 820 basis points in 2020 compared to 2019.
Our Domestic segment income increased 26.4% in 2019 compared to 2018 due to gross profit growth of 8.7% with only minimal increases in SG&A and floor plan interest expense of 5.8% and 2.2%, respectively. As a percentage of gross profit, SG&A decreased 210 basis points in 2019 compared to 2018.
Import
A summary of financial information for our Import segment follows:
| | | | | | | | | | | | | | | | | | | | | | | | | | | | | | | | | | | | | | | | | | | | |
| | Year Ended December 31, |
| | | | | | 2020 vs. 2019 | | | | 2019 vs. 2018 |
| (Dollars in millions) | | 2020 | | 2019 | | Change | | % | | 2018 | | Change | | % |
| Revenue: | | | | | | | | | | | | | | |
| New vehicle retail | | $ | 2,881.0 | | | $ | 2,920.8 | | | $ | (39.8) | | | (1.4) | % | | $ | 2,933.1 | | | $ | (12.3) | | | (0.4) | % |
| Used vehicle retail | | 1,610.4 | | | 1,448.5 | | | 161.9 | | | 11.2 | | | 1,283.4 | | | 165.1 | | | 12.9 | |
| Used vehicle wholesale | | 126.0 | | | 112.1 | | | 13.9 | | | 12.4 | | | 123.4 | | | (11.3) | | | (9.2) | |
| Finance and insurance | | 281.5 | | | 247.4 | | | 34.1 | | | 13.8 | | | 220.3 | | | 27.1 | | | 12.3 | |
| Service, body and parts | | 517.2 | | | 496.2 | | | 21.0 | | | 4.2 | | | 453.8 | | | 42.4 | | | 9.3 | |
| Fleet and other | | 32.7 | | | 42.8 | | | (10.1) | | | (23.6) | | | 24.1 | | | 18.7 | | | 77.6 | |
| | $ | 5,448.8 | | | $ | 5,267.8 | | | $ | 181.0 | | | 3.4 | | | $ | 5,038.1 | | | $ | 229.7 | | | 4.6 | |
| Segment income | | $ | 249.8 | | | $ | 153.9 | | | $ | 95.9 | | | 62.3 | | | $ | 116.2 | | | $ | 37.7 | | | 32.4 | |
| Retail new vehicle retail unit sales | | 93,111 | | | 98,365 | | | (5,254) | | | (5.3) | % | | 102,454 | | | (4,089) | | | (4.0) | % |
Revenues in our Import segment increased in used vehicle retail, finance and insurance, and service, body and parts in 2020 compared to 2019. New vehicle unit sales in our Import segment decreased 5.3%, 15.9% on a same store basis, primarily related to decreases in Toyota and Honda. However, Import segment revenues benefited from improved used vehicle sales due to a 6.3% increase in volume, increases in finance and insurance revenues as a result of increased volume combined with a 13.8% increase in finance and insurance income per retail unit sold to $1,559 per unit, and improved service, body and parts revenues.
The increase in our Import segment revenue in 2019 comparedFinancing Operations income does not include any allocation of corporate overhead costs. Although Financing Operations benefits from certain overhead expenditures, we have not allocated corporate overhead costs to 2018 was driven by increases inFinancing Operations to avoid making subjective allocation decisions. Examples of corporate overhead costs not allocated to Financing Operations include general corporate and data processing expenses.
See Note 18 – Segments for additional information on Financing Operations income and Note 5 – Finance Receivables for information on auto loans receivable, including credit quality.
Selected Financing Operations Financial Information
| | | | | | | | | | | | | | | | | | | | | | | | | | | | | | | | | | | | | |
| Year Ended December 31, |
| ($ in millions) | 2023 | | % (1) | | 2022 | | % (1) | | 2021 | | % (1) | | |
| Interest margin: | | | | | | | | | | | | | |
| Interest, fee, and lease income | $ | 268.5 | | | 9.6 | | | $ | 134.1 | | | 8.7 | | | $ | 45.9 | | | 9.2 | | | |
| Interest expense | (170.5) | | | (6.1) | | | (52.2) | | | (3.4) | | | (4.8) | | | (1.0) | | | |
| Total interest margin | $ | 98.0 | | | 3.5 | | | $ | 81.9 | | | 5.3 | | | $ | 41.1 | | | 8.2 | | | |
| | | | | | | | | | | | | |
| | | | | | | | | | | | | |
| Provision for loan and lease losses | $ | (98.8) | | | (3.5) | | | $ | (44.4) | | | (2.9) | | | $ | (9.4) | | | (1.9) | | | |
| | | | | | | | | | | | | |
| Financing operations (loss) income | $ | (45.9) | | | (1.6) | | | $ | (4.0) | | | (0.3) | | | $ | 11.0 | | | 2.2 | | | |
| | | | | | | | | | | | | |
| | | | | | | | | | | | | |
| Total average managed finance receivables | $ | 2,802.8 | | | | | $ | 1,542.6 | | | | | $ | 501.5 | | | | | |
(1)Percent of total average managed finance receivables.
Portfolio Information(1)
| | | | | | | | | | | | | | | | | |
| Year Ended December 31, |
| ($ in millions) | 2023 | | 2022 | | 2021 |
| Loan origination information | | | | | |
| Net loans originated | $ | 2,118.5 | | | $ | 1,933.9 | | | $ | 703.7 | |
| Vehicle units financed | 70,154 | | | 59,604 | | | 21,357 | |
Total penetration rate (2) | 11.0 | % | | 10.2 | % | | 4.0 | % |
| Weighted average contract rate | 9.6 | % | | 7.7 | % | | 8.4 | % |
Weighted average credit score (3) | 732 | | | 718 | | | 674 | |
Weighted average FE LTV (4) | 95.5 | % | | 99.4 | % | | 104.9 | % |
Weighted average term (in months) | 73 | | | 73 | | | 73 | |
| | | | | |
| Loan performance information | | | | | |
| Total ending managed receivables | $ | 3,177.6 | | | $ | 2,109.4 | | | $ | 724.9 | |
| Total average managed receivables | $ | 2,643.5 | | | $ | 1,417.2 | | | $ | 449.8 | |
| Allowance for loan losses | $ | 102.2 | | | $ | 65.1 | | | $ | 22.5 | |
| Allowance for loan losses as a percentage of ending managed receivables | 3.2 | % | | 3.1 | % | | 3.1 | % |
| Net credit losses on managed receivables | 62.0 | | | 42.9 | | | 7.8 | |
| Net credit losses as a percentage of total average managed receivables | 2.3 | % | | 3.0 | % | | 1.7 | % |
Past due accounts as a percentage of ending managed receivables (5) | 4.6 | % | | 5.4 | % | | 4.9 | % |
Average recovery rate (6) | 49.8 | % | | 59.3 | % | | 74.9 | % |
(1)Excludes Canadian portfolio
(2)Units financed as a percentage of total new and used vehicle retail financeunits sold.
(3)The credit scores represent FICO scores and insurance, and service, body and parts. New vehicle unit salesreflect only receivables with obligors that have a FICO score at the time of application. For receivables with co-borrowers, the FICO score is the primary borrower’s. FICO scores are not a significant factor in our Import segment decreased 4.0%. However, Import segment revenues benefitedproprietary credit model, which relies on information from improved usedcredit bureaus and other application information as discussed in Note 5 – Finance Receivables.
(4)Front-end loan-to-value represents the ratio of the amount financed to the total collateral value, which is measured as the vehicle retailselling price plus applicable taxes, title and fees.
(5)Past due is defined as loans that have been on the books greater than or equal to 3 months and are 30 or more days delinquent
(6)The average recovery rate represents the average percentage of the outstanding principal balance we receive when a 10.4% increase in volume, increases in financevehicle is repossessed and insurance revenues as a result of increased volume combined with a 10.1% increase in finance and insurance income per retail unit sold to $1,370 per unit, and improved service, body and parts revenues.liquidated, generally at wholesale auctions.
Our Import segment incomeFinancing operations loss increased 62.3% in 2020 comparedfrom 2022 to 20192023 primarily due to gross profit growth of 15.2% with only a minimalspread compression, decreasing net interest margin from 5.3% in 2022 to 3.5% in 2023. In response to the rapid increase in SG&A expensefunding costs in the first half of 7.0% and a decrease in floor planthe year, we have focused on improving net interest expense of 28.3%. As a percentage of gross profit, SG&A decreased 550 basis points in 2020 comparedmargin by passing along higher contract rates to 2019.consumers
Our Import segment income increased 32.4%while maintaining credit quality, resulting in 2019 compared to 2018a stabilization and improvement in the metric in recent quarters. The growth in the portfolio also negatively impacted results due to gross profit growththe upfront recognition of 10.4% with only minimal increases in SG&Aloan and floor plan interest expenselease loss provisions on new loans outpacing the release of 6.5%such provisions on more seasoned loans and 6.1%, respectively. As a percentage of gross profit, SG&A decreased 280 basis points in 2019 compared to 2018.
Luxury
A summary of financial information for our Luxury segment follows:
| | | | | | | | | | | | | | | | | | | | | | | | | | | | | | | | | | | | | | | | | | | | |
| | Year Ended December 31, |
| | | | | | 2020 vs. 2019 | | | | 2019 vs. 2018 |
| (Dollars in millions) | | 2020 | | 2019 | | Change | | % | | 2018 | | Change | | % |
| Revenue: | | | | | | | | | | | | | | |
| New vehicle retail | | $ | 1,659.4 | | | $ | 1,588.8 | | | $ | 70.6 | | | 4.4 | % | | $ | 1,397.8 | | | $ | 191.0 | | | 13.7 | % |
| Used vehicle retail | | 927.9 | | | 813.3 | | | 114.6 | | | 14.1 | | | 688.1 | | | 125.2 | | | 18.2 | |
| Used vehicle wholesale | | 78.2 | | | 75.3 | | | 2.9 | | | 3.9 | | | 72.9 | | | 2.4 | | | 3.3 | |
| Finance and insurance | | 94.7 | | | 77.1 | | | 17.6 | | | 22.8 | | | 62.0 | | | 15.1 | | | 24.4 | |
| Service, body and parts | | 358.7 | | | 335.3 | | | 23.4 | | | 7.0 | | | 298.9 | | | 36.4 | | | 12.2 | |
| Fleet and other | | 33.1 | | | 102.1 | | | (69.0) | | | (67.6) | | | 40.6 | | | 61.5 | | | 151.5 | |
| | $ | 3,152.0 | | | $ | 2,991.9 | | | $ | 160.1 | | | 5.4 | | | $ | 2,560.3 | | | $ | 431.6 | | | 16.9 | |
| Segment income | | $ | 98.5 | | | $ | 57.1 | | | $ | 41.4 | | | 72.5 | | | $ | 43.9 | | | $ | 13.2 | | | 30.1 | |
| Retail new vehicle retail unit sales | | 30,087 | | | 29,238 | | | 849 | | | 2.9 | % | | 26,915 | | | 2,323 | | | 8.6 | % |
The increase in our Luxury segment revenuenet credit losses was driven by the growth in 2020the portfolio, as net credit losses as a percentage of total averaged managed receivables, along with delinquencies, decreased compared to 2019 resulted from increases in all major business lines. New vehicle unit salesthe prior year, driven by increased 2.9%, but decreased 14.3% on a same store basis, mainly related to our BMW, Acura, and Audi franchises. Our Luxury segment revenues also benefited from a 9.3% increase in used vehicle unit sales, a 15.9% increase in finance and insurance revenues per retail unit to $1,541 per unit and growth in service, body and parts during 2020 compared to 2019.credit quality.
Our Luxury segment revenue increasedThe decline in 2019 compared to 2018 across all major business lines. New vehicle unit sales increased 8.6% over the prior year. Our Luxury segment revenues also benefited from an 18.7% increase inaverage recovery rate was driven by used vehicle unit sales, a 9.7% increase in finance and insurance revenues per retail unit to $1,330 per unit and growth in service, body and parts during 2019 compared to 2018.
Our Luxury segment income increased 72.5% in 2020 compared to 2019. This increase wasprice depreciation outpacing the amortization of the principal balance on loan principal balances, due to gross profit growththe relatively limited seasoning of 14.2% and decreased floor plan interest expense of 26.6%, offset by an increase in SG&A of 8.0%. As a percentage of gross profit, SG&A decreased 430 basis points in 2020 compared to 2019.
Our Luxury segment income increased 30.1% in 2019 compared to 2018. This increase was due to gross profit growth of 14.6%, offset by an increase in SG&A of 12.0% and an increase in floor plan interest expense of 17.9%. As a percentage of gross profit, SG&A decreased 180 basis points in 2019 compared to 2018.the portfolio.
Corporate and Other
Revenue attributable to Corporate and other includes the results of operations of our stand-alone collision centers, offset by certain unallocated reserve and elimination adjustments.
| | | | | | | | | | | | | | | | | | | | | | | | | | | | | | | | | | | | | | | | | | | | |
| | Year Ended December 31, |
| | | | | | 2020 vs. 2019 | | | | 2019 vs. 2018 |
| (Dollars in millions) | | 2020 | | 2019 | | Change | | % | | 2018 | | Change | | % |
| Revenue, net | | $ | 20.5 | | | $ | 30.6 | | | $ | (10.1) | | | NM | | $ | 8.0 | | | $ | 22.6 | | | NM |
| Segment income | | 176.7 | | | 170.2 | | | 6.5 | | | 3.8 | % | | 202.4 | | | (32.2) | | | (15.9) | % |
NM - not meaningful
The decrease in Corporate and other revenues in 2020 compared to 2019 was primarily affected by our reserve for revenue reversals associated with unwound vehicle sales. Corporate and other revenues were affected in 2019 by a decrease in internal corporate vehicle purchases and leases with our stores resulting in positive revenues compared to 2018.
Internal corporate expense allocations are also used to increase comparability of our dealerships and reflect the capital burden a stand-alone dealership would experience. Examples of these internal allocations include internal rent expense, internal floor plan financing charges, and internal fees charged to offset employees within our corporate headquarters who perform certain dealership functions.
The increase in Corporate and other segment income in 2020 compared to 2019 is primarily due to an increase in gains on the divestiture of stores. The decrease in Corporate and other segment income in 2019 compared to 2018 was primarily due decreased gains on the divestiture of stores and an increase in certain insurance reserves.
See Note 17 of Notes to Consolidated Financial Statements included in Part II, Item 8. Financial Statements and Supplementary Financial Data of this Form 10-K for additional information.
Asset Impairments
Asset impairments recorded as a component of operations consist of the following:
| | | | | | | | | | | | | | | | | | | | |
| | Year Ended December 31, |
| (Dollars in millions) | | 2020 | | 2019 | | 2018 |
| Franchise value | | $ | 4.4 | | | $ | 0.4 | | | $ | — | |
| Goodwill | | 3.5 | | | 1.7 | | | — | |
| Long-lived assets | | — | | | 0.5 | | | 1.3 | |
| Total asset impairments | | $ | 7.9 | | | $ | 2.6 | | | $ | 1.3 | |
Goodwill and franchise value for our reporting units are tested for impairment annually as of October 1 or more frequently when events or changes in circumstances indicate that impairment may have occurred. We elected to perform qualitative franchise value and goodwill impairment tests as of October 1 each year. These non-cash impairment charges are included in the “Corporate and Other” category of our segment information.
During the second quarter of 2020, there were indications of a triggering event at certain reporting units. We tested the goodwill and franchise value for these locations. As a result, we identified certain reporting units where it was more likely than not the fair values were less than the carrying amounts, and we recorded non-cash impairment charges of $4.4 million and $3.5 million, which was equal to the difference between the fair value and the carrying value for franchise value and goodwill, respectively. One of these locations was subsequently sold in the fourth quarter of 2020.
In the first quarter of 2019, we recorded an asset impairment of $0.5 million associated with certain real properties. The long-lived assets were tested for recoverability and were determined to have a carrying value exceeding their fair value. The impaired long-lived asset was subsequently sold in the second quarter of 2019.
As a result of our 2019 annual impairment testing, we identified certain reporting units where it was more likely than not the fair value was less than the carrying amount, and recorded non-cash impairment charges of $0.4 million and $1.7 million for franchise value and goodwill, respectively.
In 2018, we recorded an asset impairment of $1.3 million associated with certain real properties. The long-lived assets were tested for recoverability and were determined to have a carrying value exceeding their fair value.
See Note 1, Note 4 and Note 13 of Notes to Consolidated Financial Statements included in Part II, Item 8. Financial Statements and Supplementary Financial Data of this Annual Report.Operating Expenses
Selling, General, and Administrative (SG&A)
SG&A includes salaries and related personnel expenses, advertising (net of manufacturer cooperative advertising credits), rent, facility costs, and other general corporate expenses.
| | Year Ended December 31, |
| | 2020 vs. 2019 | | 2019 vs. 2018 |
| (Dollars in millions) | | 2020 | | 2019 | | Change | | % | | 2018 | | Change | | % |
| | Year Ended December 31, | | | | Year Ended December 31, |
| | | | | | 2023 vs. 2022 | | | | | | | | 2023 vs. 2022 | | | | 2022 vs. 2021 |
| ($ in millions) | | ($ in millions) | | 2023 | | 2022 | | Change | | % | | 2021 | | Change | | % |
| Personnel | Personnel | | $ | 983.7 | | | $ | 911.2 | | | $ | 72.5 | | | 8.0 | % | | $ | 824.8 | | | $ | 86.4 | | | 10.5 | % | Personnel | | $ | 2,163.1 | | | $ | | $ | 2,086.3 | | | $ | | $ | 76.8 | | | 3.7 | | 3.7 | % | | $ | 1,737.9 | | | $ | | $ | 348.4 | | | 20.0 | | 20.0 | % |
| Advertising | Advertising | | 97.4 | | | 111.9 | | | (14.5) | | | (13.0) | | | 108.7 | | | 3.2 | | | 2.9 | |
| Rent | Rent | | 41.4 | | | 41.3 | | | 0.1 | | | 0.2 | | | 43.3 | | | (2.0) | | | (4.6) | |
| Facility costs | Facility costs | | 81.1 | | | 77.4 | | | 3.7 | | | 4.8 | | | 72.0 | | | 5.4 | | | 7.5 | |
| Gain on sale of assets | Gain on sale of assets | | (18.2) | | | (9.7) | | | (8.5) | | | 87.6 | | | (14.8) | | | 5.1 | | | (34.5) | | Gain on sale of assets | | (34.1) | | | (66.0) | | (66.0) | | | 31.9 | | 31.9 | | | NM | | NM | | (2.3) | | | (63.7) | | (63.7) | | | NM | | NM |
| Other | Other | | 242.9 | | | 241.7 | | | 1.2 | | | 0.5 | | | 219.3 | | | 22.4 | | | 10.2 | |
| Total SG&A | Total SG&A | | $ | 1,428.3 | | | $ | 1,373.8 | | | $ | 54.5 | | | 4.0 | % | | $ | 1,253.3 | | | $ | 120.5 | | | 9.6 | % | Total SG&A | | $ | 3,294.8 | | | $ | | $ | 3,044.1 | | | $ | | $ | 250.7 | | | 8.2 | | 8.2 | % | | $ | 2,480.8 | | | $ | | $ | 563.3 | | | 22.7 | | 22.7 | % |
| | | | | | | | | | | | | | | | | | | | | | | | | | | | | | | | |
| | Year Ended December 31, |
| | | | | | 2020 vs. 2019 | | | | 2019 vs. 2018 |
| As a % of gross profit | | 2020 | | 2019 | | Change | | 2018 | | Change |
| Personnel | | 44.2 | % | | 46.6 | % | | (240) | bps | | 46.4 | % | | 20 | bps |
| Advertising | | 4.4 | | | 5.7 | | | (130) | | | 6.1 | | | (40) | |
| Rent | | 1.9 | | | 2.1 | | | (20) | | | 2.4 | | | (30) | |
| Facility costs | | 3.6 | | | 4.0 | | | (40) | | | 4.1 | | | (10) | |
| Gain on sale of assets | | (0.8) | | | (0.5) | | | (30) | | | (0.8) | | | 30 | |
| Other | | 10.9 | | | 12.4 | | | (150) | | | 12.3 | | | 10 | |
| Total SG&A | | 64.2 | % | | 70.3 | % | | (610) | bps | | 70.5 | % | | (20) | bps |
| | | | | | | | | | | | | | | | | | | | | | | | | | | | | | | | |
| | Year Ended December 31, |
| | | | | | 2023 vs. 2022 | | | | 2022 vs. 2021 |
| As a % of gross profit | | 2023 | | 2022 | | Change | | 2021 | | Change |
| Personnel | | 41.4 | % | | 40.5 | % | | 90 | bps | | 40.8 | % | | (30) | bps |
| Advertising | | 4.7 | | | 4.9 | | | (20) | | | 3.8 | | | 110 | |
| Rent | | 1.7 | | | 1.4 | | | 30 | | | 1.3 | | | 10 | |
| Facility costs | | 3.5 | | | 2.9 | | | 60 | | | 2.7 | | | 20 | |
| Gain on sale of assets | | (0.7) | | | (1.3) | | | 60 | | | (0.1) | | | (120) | |
| Other | | 12.4 | | | 10.7 | | | 170 | | | 9.7 | | | 100 | |
| Total SG&A | | 63.0 | % | | 59.1 | % | | 390 | bps | | 58.1 | % | | 100 | bps |
2023 vs. 2022
SG&A increased 4.0%8.2%, or $54.5$250.7 million, in 2020 compared to 2019. Overall increases in SG&A were primarily due to increased personnel and other costs resulting from our growth through acquisitions, offset by decreases in advertising spend and gains on sales of assets.acquisitions. Other expenses in 20202023 included acquisition expenses of $3.1$27.2 million compared to $2.5 million in 2019 and $6.1$5.4 million of storm related insurance charges, compared to $9.5 million in 2019. Gainscharges. We also recognized a gain on the sale of stores were $16.6 million and $9.7 million in 2020 and 2019, respectively.of $31.2 million.
On a same store basis and excluding non-core charges, adjusted SG&A as a percentage of gross profit was 64.4% in 2020 compared to 69.4% in 2019, which included decreasesincreased across all categories.categories to 62.3% from 59.8% in the prior year.
2022 vs. 2021
SG&A increased 9.6%22.7%, or $120.5$563.3 million, in 2019 compared to 2018. Overall increases in SG&A were primarily due to increased personnel costs which resulted from our growth through acquisitions, increased losses related to storm insurance reserve charges, and a decrease in gains on disposal of stores.acquisitions. Other expenses in 20192022 included acquisition expenses of $2.5$15.0 million compared to $4.3 million in 2019 and $9.5$4.9 million of storm related insurance charges, compared to $3.2 million in 2018. Gains on the sale of stores were $9.7 million and $15.1 million in 2019 and 2018, respectively.charges.
On a same store basis and excluding non-core charges, adjusted SG&A as a percentage of gross profit was 69.8%increased across all categories to 61.5% from 57.5% in 2019 compared to 70.5% in 2018. Decreases were seen in advertising, rent, facility costs, and data processing, partially offset by increases in personnel costs.the prior year.
SG&A adjusted for non-core charges was as follows:
| | Year Ended December 31, |
| | 2020 vs. 2019 | | 2019 vs. 2018 |
| (Dollars in millions) | | 2020 | | 2019 | | Change | | % | | 2018 | | Change | | % |
| | Year Ended December 31, | | | | Year Ended December 31, |
| | | | | | 2023 vs. 2022 | | | | | | | | 2023 vs. 2022 | | | | 2022 vs. 2021 |
| ($ in millions) | | ($ in millions) | | 2023 | | 2022 | | Change | | % | | 2021 | | Change | | % |
| Personnel | Personnel | | $ | 983.7 | | | $ | 911.2 | | | $ | 72.5 | | | 8.0 | % | | $ | 824.8 | | | $ | 86.4 | | | 10.5 | % | Personnel | | $ | 2,163.1 | | | $ | | $ | 2,086.3 | | | $ | | $ | 76.8 | | | 3.7 | | 3.7 | % | | $ | 1,737.9 | | | $ | | $ | 348.4 | | | 20.0 | | 20.0 | % |
| Advertising | Advertising | | 97.4 | | | 111.9 | | | (14.5) | | | (13.0) | | | 108.7 | | | 3.2 | | | 2.9 | |
| Rent | Rent | | 41.4 | | | 41.3 | | | 0.1 | | | 0.2 | | | 43.3 | | | (2.0) | | | (4.6) | |
| Facility costs | Facility costs | | 81.1 | | | 77.4 | | | 3.7 | | | 4.8 | | | 72.0 | | | 5.4 | | | 7.5 | |
| Adjusted loss (gain) on sale of assets | | (1.6) | | | 0.0 | | | (1.6) | | | NM | | 0.5 | | | (0.5) | | | (100.0) | |
| Adjusted other | | 233.8 | | | 229.7 | | | 4.1 | | | 1.8 | | | 214.6 | | | 15.1 | | | 7.0 | |
| Total adjusted SG&A | | $ | 1,435.8 | | | $ | 1,371.5 | | | $ | 64.3 | | | 4.7 | % | | $ | 1,263.9 | | | $ | 107.6 | | | 8.5 | % |
Adjusted gain on sale of assets (1) | | Adjusted gain on sale of assets (1) | | (2.9) | | | 0.0 | | | (2.9) | | | NM | | (2.3) | | | 2.3 | | | NM |
Adjusted other (1) | |
Total adjusted SG&A (1) | | Total adjusted SG&A (1) | | $ | 3,279.1 | | | $ | 3,090.2 | | | $ | 188.9 | | | 6.1 | % | | $ | 2,454.8 | | | $ | 635.4 | | | 25.9 | % |
| | | | | | | | | | | | | | | | | | | | | | | | | | | | | | | | |
| | Year Ended December 31, |
| | | | | | 2020 vs. 2019 | | | | 2019 vs. 2018 |
| As a % of gross profit | | 2020 | | 2019 | | Change | | 2018 | | Change |
| Personnel | | 44.2 | % | | 46.6 | % | | (240) | bps | | 46.4 | % | | 20 | bps |
| Advertising | | 4.4 | | | 5.7 | | | (130) | | | 6.1 | | | (40) | |
| Rent | | 1.9 | | | 2.1 | | | (20) | | | 2.4 | | | (30) | |
| Facility costs | | 3.6 | | | 4.0 | | | (40) | | | 4.1 | | | (10) | |
| Adjusted loss (gain) on sale of assets | | (0.1) | | | — | | | (10) | | | 0.0 | | | — | |
| Adjusted other | | 10.5 | | | 11.8 | | | (130) | | | 12.1 | | | (30) | |
| Total adjusted SG&A | | 64.5 | % | | 70.2 | % | | (570) | bps | | 71.1 | % | | (90) | bps |
See “Non-GAAP Reconciliations” for more details.
Depreciation and Amortization
Depreciation and amortization is comprised of depreciation expense related to buildings, significant remodels or improvements, furniture, tools, equipment and signage and amortization related to tradenames.
| | | | | | | | | | | | | | | | | | | | | | | | | | | | | | | | | | | | | | | | | | | | |
| | Year Ended December 31, |
| | | | | | 2020 vs. 2019 | | | | 2019 vs. 2018 |
| (Dollars in millions) | | 2020 | | 2019 | | Change | | % | | 2018 | | Change | | % |
| Depreciation and amortization | | $ | 92.3 | | | $ | 82.4 | | | $ | 9.9 | | | 12.0 | % | | $ | 75.4 | | | $ | 7.0 | | | 9.3 | % |
Acquisition activity contributed to the increases in depreciation and amortization in 2020 compared to 2019 and in 2019 compared to 2018. We acquired approximately $241 million and $63 million of depreciable property as part of our 2020 and 2019 acquisitions, respectively. Capital expenditures totaled $167.8 million and $124.9 million, respectively, in 2020 and 2019. These investments increase the amount of depreciable assets. See the discussion under “Liquidity and Capital Resources” for additional information.
Operating Income
Operating income as a percentage of revenue, or operating margin, was as follows:
| | | | | | | | | | | | | | | | | | | | |
| | Year Ended December 31, |
| | 2020 | | 2019 | | 2018 |
| Operating margin | | 5.3 | % | | 3.9 | % | | 3.8 | % |
| Operating margin adjusted for non-core charges(1) | | 5.3 | | | 3.9 | | | 3.7 | |
| | | | | | | | | | | | | | | | | | | | | | | | | | | | | | | | |
| | Year Ended December 31, |
| | | | | | 2023 vs. 2022 | | | | 2022 vs. 2021 |
| As a % of gross profit | | 2023 | | 2022 | | Change | | 2021 | | Change |
| Personnel | | 41.4 | % | | 40.5 | % | | 90 | bps | | 40.8 | % | | (30) | bps |
| Advertising | | 4.7 | | | 4.9 | | | (20) | | | 3.8 | | | 110 | |
| Rent | | 1.7 | | | 1.4 | | | 30 | | | 1.3 | | | 10 | |
| Facility costs | | 3.5 | | | 2.9 | | | 60 | | | 2.7 | | | 20 | |
Adjusted gain on sale of assets (1) | | (0.1) | | | — | | | (10) | | | (0.1) | | | 10 | |
Adjusted other (1) | | 11.5 | | | 10.3 | | | 120 | | | 9.0 | | | 130 | |
Total adjusted SG&A (1) | | 62.7 | % | | 60.0 | % | | 270 | bps | | 57.5 | % | | 250 | bps |
(1)See “Non-GAAP Reconciliations” for additional information.more details.
In 2020, our operating margin increased 140 basis points compared to 2019. In 2020, the increase in our operating margin was driven by a decrease in SG&A as a percentage of gross profit and increased total gross margin.
In 2019, our operating margin increased 10 basis points compared to 2018. Adjusting for non-core charges, including storm related insurance charges and acquisition expenses, our operating margin increased 20 basis points in 2019 compared to 2018. In 2019, the increase in our operating margin was driven by a decrease in SG&A as a percentage of gross profit and increased total gross margin.
Floor Plan Interest Expense and Floor Plan Assistance
FloorWe have floor plan agreements with both manufacturer-affiliated finance companies and as part of our syndicated credit facilities for certain new vehicles and vehicles that are designated for use as service loaners. The interest expense decreased $38.4 million in 2020 compared to 2019, primarily due to our ability to pay off our higher interest raterates on these floor plan notes payable with the surplus liquidity generated from our senior notecommitments vary by lender and equity offerings in 2020. This changed the overall mix in our interest rates on our floor plan facilities, decreasing floor plan interest expense $19.4 million for pre-existing locations. Acquisition volume increased floor plan interest expense $1.0 million, while overall decreases in inventory financed with floor plan decreased floor plan interest expense $20.0 million.are variable rates.
2023 vs. 2022
Floor plan interest expense increased $10.5$112.1 million, in 2019 compared to 2018, primarily due to changes in our interest rates. Changes in thehigher interest rates, on our floorincreases in new vehicle inventory levels from acquisitions as well as existing locations recovering from prior year inventory shortages. Floor plan facilitiesinterest expense increased expense $10.9 million,51.3% related to acquisition volume and 49.2% for existing locations.
2022 vs. 2021
Floor plan interest expense increased expense $1.4$16.5 million, primarily due to increases in new vehicle inventory levels at existing locations and decreases in average outstanding balances on our floor plan facilities decreased the expense $1.8 million during 2019 compared to 2018.growth through acquisitions.
Floor plan assistance is provided by manufacturers to support store financing of new vehicle inventory. Under accounting standards, floor plan assistance is recorded as a component of new vehicle gross profit when the specific vehicle is sold. However, because manufacturers provide this assistance to offset inventory carrying costs, we believe a comparison of floor plan interest expense to floor plan assistance is a useful measure of the efficiency of our new vehicle sales relative to stocking levels.
The following tables detail the carrying costs for new vehicles and include new vehicle floor plan interest net of floor plan assistance earned:
| | Year Ended December 31, |
| | 2020 vs. 2019 | | 2019 vs. 2018 |
| (Dollars in millions) | | 2020 | | 2019 | | Change | | % | | 2018 | | Change | | % |
| | Year Ended December 31, | | | | Year Ended December 31, |
| | | | | | 2023 vs. 2022 | | | | | | | | 2023 vs. 2022 | | | | 2022 vs. 2021 |
| ($ in millions) | | ($ in millions) | | 2023 | | 2022 | | Change | | % | | 2021 | | Change | | % |
| Floor plan interest expense (new vehicles) | Floor plan interest expense (new vehicles) | | $ | 34.4 | | | $ | 72.8 | | | $ | (38.4) | | | (52.7) | % | | $ | 62.3 | | | $ | 10.5 | | | 16.9 | % | Floor plan interest expense (new vehicles) | | $ | 150.9 | | | $ | | $ | 38.8 | | | $ | | $ | 112.1 | | | 288.9 | | 288.9 | % | | $ | 22.3 | | | $ | | $ | 16.5 | | | 74.0 | | 74.0 | % |
| Floor plan assistance (included as an offset to cost of sales) | Floor plan assistance (included as an offset to cost of sales) | | (72.8) | | | (69.0) | | | (3.8) | | | 5.5 | | | (66.9) | | | (2.1) | | | 3.1 | |
| Net new vehicle carrying costs (benefit) | Net new vehicle carrying costs (benefit) | | $ | (38.4) | | | $ | 3.8 | | | $ | (42.2) | | | NM | | $ | (4.6) | | | $ | 8.4 | | | (182.6) | % |
Depreciation and Amortization
Depreciation and amortization is comprised of depreciation expense related to buildings, significant remodels or improvements, furniture, tools, equipment and signage and amortization related to non-compete agreements.
| | | | | | | | | | | | | | | | | | | | | | | | | | | | | | | | | | | | | | | | | | | | |
| | Year Ended December 31, |
| | | | | | 2023 vs. 2022 | | | | 2022 vs. 2021 |
| ($ in millions) | | 2023 | | 2022 | | Change | | % | | 2021 | | Change | | % |
| Depreciation and amortization | | $ | 195.8 | | | $ | 163.2 | | | $ | 32.6 | | | 20.0 | % | | $ | 124.8 | | | $ | 38.4 | | | 30.8 | % |
Acquisition activity contributed to the increases in depreciation and amortization in 2023 compared to 2022 and in 2022 compared to 2021. We acquired approximately $260.5 million and $236.9 million of depreciable property as part of our 2023 and 2022 acquisitions, respectively. Capital expenditures totaled $230.2 million and $303.1 million, respectively, in 2023 and 2022. These investments increase the amount of depreciable assets. See the discussion under “Liquidity and Capital Resources” for additional information.
Operating Income
Operating income as a percentage of revenue, or operating margin, was as follows:
| | | | | | | | | | | | | | | | | | | | | | | | | | |
| | Year Ended December 31, |
| | 2023 | | | | | 2022 | | | | | 2021 |
| Operating margin | | 5.5 | % | | | | | 6.9 | % | | | | | 7.3 | % |
Operating margin adjusted for non-core charges (1) | | 5.5 | | | | | | 6.7 | | | | | | 7.4 | |
(1)See “Non-GAAP Reconciliations” for additional information
2023 vs. 2022
Our operating margin decreased 140 basis points compared to the prior year, driven by a decline in gross profit per new and used unit sold. Adjusting for non-core charges, including acquisition expenses, one-time contract buyouts, and storm related insurance charges, offset by a net disposal gain on sale of stores, our operating margin decreased 120 basis points.
2022 vs. 2021
Our operating margin decreased 40 basis points compared to the prior year, driven by an increase in SG&A as a percentage of gross profit. Adjusting for non-core charges, including storm insurance charges and acquisition expenses, offset by a net disposal gain on sale of stores, our operating margin decreased 70 basis points.
Non-Operating Expenses
Asset Impairments
Asset impairments recorded as a component of operations consist of the following:
| | | | | | | | | | | | | | | | | | | | |
| | Year Ended December 31, |
| ($ in millions) | | 2023 | | 2022 | | 2021 |
| Franchise value | | $ | — | | | $ | — | | | $ | 1.9 | |
| Goodwill | | — | | | — | | | — | |
| | | | | | |
| Total asset impairments | | $ | — | | | $ | — | | | $ | 1.9 | |
Goodwill and franchise value are tested for impairment annually as of October 1 or more frequently when events or changes in circumstances indicate that impairment may have occurred. We elected to perform qualitative franchise value and goodwill impairment tests as of October 1 each year. These non-cash impairment charges are included in the “Corporate and Other” category of our segment information.
No impairment charges were recorded in 2023 or 2022.
During the third quarter of 2021, there was an indication of a triggering event at a certain reporting unit. We tested the goodwill and franchise value for this location. As a result, we identified it was more likely than not the fair values were less than the carrying amounts, and we recorded a non-cash impairment charge of $1.9 million, which was equal to the difference between the fair value and the carrying value for franchise value. This location was subsequently sold in the fourth quarter of 2021.
See Note 1 – Summary of Significant Accounting Policies, Note 4 – Property and Equipment, Note 6 – Goodwill and Franchise Value, and Note 14 – Fair Value Measurements of Notes to Consolidated Financial Statements included in Part II, Item 8. Financial Statements and Supplementary Financial Data of this Annual Report.
Other Interest Expense
Other interest expense includes interest on debt incurred related to acquisitions, real estate mortgages, our used and service loaner vehicle inventory financing commitments, our revolving lines of credit, and issued senior notes.
| | Year Ended December 31, |
| | 2020 vs. 2019 | | 2019 vs. 2018 |
| (Dollars in millions) | | 2020 | | 2019 | | Change | | % | | 2018 | | Change | | % |
| | Year Ended December 31, | | | | Year Ended December 31, |
| | | | | | 2023 vs. 2022 | | | | | | | | 2023 vs. 2022 | | | | 2022 vs. 2021 |
| ($ in millions) | | ($ in millions) | | 2023 | | 2022 | | Change | | % | | 2021 | | Change | | % |
| Mortgage interest | Mortgage interest | | $ | 26.2 | | | $ | 27.5 | | | $ | (1.3) | | | (4.7) | % | | $ | 25.0 | | | $ | 2.5 | | | 10.0 | % | Mortgage interest | | $ | 35.8 | | | $ | | $ | 25.9 | | | $ | | $ | 9.9 | | | 38.2 | | 38.2 | % | | $ | 24.9 | | | $ | | $ | 1.0 | | | 4.0 | | 4.0 | % |
| Other interest | Other interest | | 48.5 | | | 35.4 | | | 13.1 | | | 37.0 | | | 32.3 | | | 3.1 | | | 9.6 | |
| Capitalized interest | Capitalized interest | | (1.6) | | | (2.3) | | | 0.7 | | | (30.4) | | | (1.3) | | | (1.0) | | | 76.9 | |
| Total other interest expense | Total other interest expense | | $ | 73.1 | | | $ | 60.6 | | | $ | 12.5 | | | 20.6 | % | | $ | 56.0 | | | $ | 4.6 | | | 8.2 | % | Total other interest expense | | $ | 201.2 | | | $ | | $ | 129.1 | | | $ | | $ | 72.1 | | | 55.8 | | 55.8 | % | | $ | 103.4 | | | $ | | $ | 25.7 | | | 24.9 | | 24.9 | % |
2023 vs. 2022
The increase in other interest expense in 2020 compared to 2019 was due to the issuances of $400 million in aggregate principal amount of 4.625% senior notes due 2027 in December 2019higher interest rates and $550 million in aggregate principal amount of 4.375% senior notes due 2031 in October 2020, offset by decreases in our averageincreased borrowings on our credit facility.facilities. See also Note 69 – Credit Facilities and Long-Term Debt of Notes to Consolidated Financial Statements for additional information.
2022 vs. 2021
The increase in other interest expense in 2019 compared to 2018 was due to increased average borrowingshigher interest rates on our credit facility,facilities and the issuancefull year impact of $400our $800 million in aggregate principal amount of 4.625%3.875% senior notes due 20272029 issued in December 2019, and increases in mortgage borrowings related to acquisitions.May 2021.
Other Income (Expense), Net
Other income (expense), net primarily includes other income associated with investment income and other non-recurring transactions.
| | | | | | | | | | | | | | | | | | | | | | | | | | | | | | | | | | | | | | | | | | | | |
| | Year Ended December 31, |
| | | | | | 2022 vs. 2021 | | | | 2021 vs. 2020 |
| ($ in millions) | | 2023 | | 2022 | | Change | | % | | 2021 | | Change | | % |
| Other income (expense), net | | $ | 22.0 | | | $ | (43.2) | | | $ | 65.2 | | | NM | | $ | (52.0) | | | $ | 8.8 | | | NM |
2023 vs. 2022
The improvement in other income (expense), net was primarily due to a $1.7 million investment loss related to equity investments compared to a $39.2 million loss in the prior year. Other notable items included a $5.1 million unrealized gain on foreign currency translations, $4.7 million of interest income from foreign currency deposit accounts, and $2.6 million net pension benefit recognized in 2023.
2022 vs. 2021
The improvement in other income (expense), net was primarily due to a $39.2 million investment loss related to equity investments compared to a $66.4 million loss in the prior year. We also recognized a $16.8 million unrealized loss on foreign currency translations in 2022.
Income Tax Provision
Our effective income tax rate was as follows:
| | Year Ended December 31, |
| 2020 | | 2019 | | 2018 |
| | Year Ended December 31, | | | | Year Ended December 31, |
| | 2023 | | | | 2023 | | 2022 | | 2021 |
| Effective income tax rate | Effective income tax rate | | 27.5 | % | | 27.7 | % | | 21.3 | % | Effective income tax rate | | 25.7 | % | | 27.1 | % | | 28.4 | % |
| Effective income tax rate excluding non-core items(1) | | 27.6 | | | 27.6 | | | 25.6 | |
Effective income tax rate excluding non-core items (1) | |
(1)See “Non-GAAP Reconciliations” for more details
Our effective income tax rate in 2020was 25.7% for 2023 compared to 27.1% for 2022. Our effective income tax rate was positively affected by ana reduction in the current and deferred state tax rate, due to changing state mix, as well as a reduction in valuation allowance. Our 2023 effective income tax rate was negatively affected by non-deductible acquisition costs recorded during the period.
Adjusting for non-deductible acquisition costs and valuation allowance activity recorded during 2023, our effective income tax rate excluding non-core items is 25.6%, a decrease of 90 basis points compared to the effective income tax rate excluding non-core items for 2022.
Our effective income tax rate in 2022 was negatively affected by a valuation allowance established for certain deferred tax assets not expected to be realized. The increase in pre-tax income, excess tax benefits on stockrate was offset by share-based awards vesting in the current period and a reduction in non-deductible expenses. Ourthe current and deferred state tax rate due to legislative updates and changing state mix.
Global Implementation of Pillar Two
We are subject to corporation tax on profits in the United States, Canada, and the UK. The Organization for Economic Co-operation and Development (OECD) and the G20 Inclusive Framework on Base Erosion and Profit Shifting has developed the Pillar Two global minimum tax regime. The Pillar Two rules provide a coordinated system to ensure that multinational enterprises with revenues above €750 million pay a minimum effective tax rate was negatively impacted byof 15% on the enactmentincome arising in each of the Oregon Corporate Activity Tax beginning January 1, 2020,jurisdictions in which was partially offset by favorable changes in our state rate due to acquisitions.they operate.
On March 27, 2020,June 20, 2023, the Coronavirus Aid, Relief, and Economic Security Act (CARES Act)UK’s Finance (No. 2) Bill 2023 was enacted, which represents the UK’s introduction of a Pillar Two regime, effective for annual reporting periods beginning on or after December 31, 2023. On August 4, 2023, Canada released draft legislation to implement the primary taxing rule in response to the COVID-19 pandemic. The CARES Act, among other items, includes modifications to federal net operating loss rules, the business interest deduction limitation, and the bonus depreciation eligibility of qualified improvement property. An analysis of bonus depreciation eligibility of qualified improvement property was completed and recorded during the year. OnPillar Two for fiscal periods beginning on or after December 27, 2020, the Consolidated Appropriations Act 2021 (CAA) was signed into law. We will continue to monitor the potential impacts of these legislative changes on future periods.31, 2023.
Our effective incomeWe analyzed the expected tax rate in 2019 was negatively affected by excess tax deficiencies on stock awards vesting in the current period, an increase in non-deductible expenses, and an increase in the current state effective income tax rate, primarily due to enactment of combined reporting in New Jersey beginning January 1, 2019.
Our effective income tax rate in 2018 was positively affected by the enactment of tax legislation commonly known as the Tax Cuts and Jobs Act (the "Act"), signed into law on December 22, 2017, which reduced the Federal corporate income tax rate to 21.0%. Our effective income tax rate in 2018 benefited from return to provision adjustments to our income tax receivable and deferred taxes as a result of finalizing calculations supporting our 2017 federal income tax return. These adjustments are the result of tax planning undertaken in 2018 to change certain established tax accounting methods. Additionally, our effective income tax rate in 2018 was positively affected by excess tax benefits related to our stock-based compensation and the revaluation of certain acquired deferred tax liabilities. Partially offsetting these benefits was the negative impact from an increasing presence in states with higher income tax rates, including the impact of New Jersey Assembly Bill 4202.the Pillar Two regime based on available guidance and expect these rules to have an immaterial impact on our overall effective tax rate.
Non-GAAP Reconciliations
Non-GAAP measures do not have definitions under GAAP and may be defined differently by and not comparable to similarly titled measures used by other companies. As a result, we review any non-GAAP financial measures in connection with a review of the most directly comparable measures calculated in accordance with GAAP. We caution you not to place undue reliance on such non-GAAP measures, but also to consider them with the most directly comparable GAAP measures. We believe each of the non-GAAP financial measures below improves the transparency of our disclosures, provides a meaningful presentation of our results from the core business operations because they exclude items not related to our ongoing core business operations and other non-cash items, and improves the period-to-period comparability of our results from the core business operations. We use these measures in conjunction with GAAP financial measures to assess our business, including our compliance with covenants in our credit facilityfacilities and in communications with our Board of Directors concerning financial performance. These measures should not be considered an alternative to GAAP measures.
The following tables reconcile certain reported non-GAAP measures to the most comparable GAAP measure from our Consolidated Statements of Operations (in millions, except per share amounts):Operations:
| | Year Ended December 31, 2020 |
| (Dollars in millions) | | As reported | | Net disposal gain on sale of stores | | Asset impairment | | Investment gains | | Insurance reserves | | Acquisition expenses | | | Tax attribute | | Adjusted |
| Asset impairments | | $ | 7.9 | | | $ | — | | | $ | (7.9) | | | $ | — | | | $ | — | | | $ | — | | | | $ | — | | | $ | — | |
| | Year Ended December 31, 2023 | |
| | Year Ended December 31, 2023 | |
| | Year Ended December 31, 2023 | |
| ($ in millions, except per share amounts) | | ($ in millions, except per share amounts) | | As reported | | Net disposal gain on sale of stores | | | | Investment loss | | Insurance reserves | | Acquisition expenses | | Contract buyouts | | | | Adjusted |
| | Selling, general and administrative | Selling, general and administrative | | 1,428.3 | | | 16.6 | | | — | | | — | | | (6.1) | | | (3.0) | | | | — | | | 1,435.8 | |
| Selling, general and administrative | |
| Selling, general and administrative | |
| Operating income (loss) | |
| Other income, net | |
| | Operating income (loss) | | 697.1 | | | (16.6) | | | 7.9 | | | — | | | 6.1 | | | 3.0 | | | | — | | | 697.5 | |
| | Other income (expense), net | | 58.9 | | | — | | | — | | | (43.8) | | | — | | | — | | | | — | | | 15.1 | |
| | Income (loss) before income taxes | |
| Income (loss) before income taxes | |
| Income (loss) before income taxes | Income (loss) before income taxes | | $ | 648.5 | | | $ | (16.6) | | | $ | 7.9 | | | $ | (43.8) | | | $ | 6.1 | | | $ | 3.0 | | | | $ | — | | | $ | 605.1 | |
| Income tax (provision) benefit | Income tax (provision) benefit | | (178.2) | | | 4.6 | | | (2.3) | | | 12.1 | | | (1.6) | | | (0.8) | | | | (0.8) | | | (167.0) | |
| Net income (loss) | Net income (loss) | | $ | 470.3 | | | $ | (12.0) | | | $ | 5.6 | | | $ | (31.7) | | | $ | 4.5 | | | $ | 2.2 | | | | $ | (0.8) | | | $ | 438.1 | |
| Net income attributable to non-controlling interest | |
| Net income attributable to redeemable non-controlling interest | |
| Net income (loss) attributable to Lithia Motors, Inc. | |
| | Diluted net income (loss) per share | | $ | 19.53 | | | $ | (0.50) | | | $ | 0.23 | | | $ | (1.32) | | | $ | 0.19 | | | $ | 0.09 | | | | $ | (0.03) | | | $ | 18.19 | |
| Diluted earnings (loss) per share attributable to Lithia Motors, Inc. | |
| Diluted earnings (loss) per share attributable to Lithia Motors, Inc. | |
| Diluted earnings (loss) per share attributable to Lithia Motors, Inc. | |
| Diluted share count | Diluted share count | | 24.1 | | | | |
| | | | | | | | | | | | | | | | | | | | | | | | | | | | | | | | | | | | | | | | | | | | |
| | Year Ended December 31, 2019 |
| (Dollars in millions) | | As
reported | | Net disposal gain on sale of stores | | Asset impairment | | | | Insurance reserves | | Acquisition expenses | | | | | | Adjusted |
| Asset impairments | | $ | 2.6 | | | $ | — | | | $ | (2.6) | | | | | $ | — | | | $ | — | | | | | | | $ | — | |
| | | | | | | | | | | | | | | | | | |
| Selling, general and administrative | | 1,373.8 | | | 9.7 | | | — | | | | | (9.5) | | | (2.5) | | | | | | | 1,371.5 | |
| | | | | | | | | | | | | | | | | | |
| Operating income (loss) | | 495.0 | | | (9.7) | | | 2.6 | | | | | 9.5 | | | 2.5 | | | | | | | 499.9 | |
| | | | | | | | | | | | | | | | | | |
| | | | | | | | | | | | | | | | | | |
| | | | | | | | | | | | | | | | | | |
| Income (loss) before income taxes | | $ | 375.4 | | | $ | (9.7) | | | $ | 2.6 | | | | | $ | 9.5 | | | $ | 2.5 | | | | | | | $ | 380.3 | |
| Income tax (provision) benefit | | (103.9) | | | 2.8 | | | (0.7) | | | | | (2.6) | | | (0.7) | | | | | | | (105.1) | |
| Net income (loss) | | $ | 271.5 | | | $ | (6.9) | | | $ | 1.9 | | | | | $ | 6.9 | | | $ | 1.8 | | | | | | | $ | 275.2 | |
| | | | | | | | | | | | | | | | | | |
| Diluted net income (loss) per share | | $ | 11.60 | | | $ | (0.30) | | | $ | 0.08 | | | | | $ | 0.30 | | | $ | 0.08 | | | | | | | $ | 11.76 | |
| Diluted share count | | 23.4 | | | | | | | | | | | | | | | | | |
| | | | | | | | | | | | | | | | | | | | | | | | | | | | | | | | | | | | | | | | | | | | |
| | Year Ended December 31, 2022 |
| ($ in millions, except per share amounts) | | As
reported | | Net disposal gain on sale of stores | | | | Investment loss | | Insurance reserves | | Acquisition expenses | | | | | | Adjusted |
| | | | | | | | | | | | | | | | | | |
| Selling, general and administrative | | 3,044.1 | | | 66.0 | | | | | — | | | (4.9) | | | (15.0) | | | | | | | 3,090.2 | |
| Operating income (loss) | | 1,941.1 | | | (66.0) | | | | | — | | | 4.9 | | | 15.0 | | | | | | | 1,895.0 | |
| Other (expense) income, net | | (43.2) | | | — | | | | | 39.2 | | | — | | | — | | | | | | | (4.0) | |
| | | | | | | | | | | | | | | | | | |
| Income (loss) before income taxes | | $ | 1,730.0 | | | $ | (66.0) | | | | | $ | 39.2 | | | $ | 4.9 | | | $ | 15.0 | | | | | | | $ | 1,723.1 | |
| Income tax (provision) benefit | | (468.4) | | | 19.1 | | | | | — | | | (1.3) | | | (4.0) | | | | | | | (454.6) | |
| Net income (loss) | | 1,261.6 | | | $ | (46.9) | | | | | 39.2 | | | 3.6 | | | 11.0 | | | | | | | 1,268.5 | |
| Net income attributable to non-controlling interest | | (4.8) | | | — | | | | | — | | | — | | | — | | | | | | | (4.8) | |
| Net income attributable to redeemable non-controlling interest | | (5.8) | | | — | | | | | — | | | — | | | — | | | | | | | (5.8) | |
| Net income (loss) attributable to Lithia Motors, Inc. | | $ | 1,251.0 | | | $ | (46.9) | | | | | $ | 39.2 | | | $ | 3.6 | | | $ | 11.0 | | | | | | | $ | 1,257.9 | |
| | | | | | | | | | | | | | | | | | |
| Diluted earnings (loss) per share attributable to Lithia Motors, Inc. | | $ | 44.17 | | | $ | (1.65) | | | | | $ | 1.38 | | | $ | 0.13 | | | $ | 0.39 | | | | | | | $ | 44.42 | |
| Diluted share count | | 28.3 | | | | | | | | | | | | | | | | | |
| | | | | | | | | | | | | | | | | | | | | | | | | | | | | | | | | | | | | | | | | | | | | | | | |
| | Year Ended December 31, 2018 |
| (Dollars in millions) | | As
reported | | Net disposal gain on sale of stores | | Asset impairment | | | | Insurance reserves | | Acquisition expenses | | | | Tax attribute | | Adjusted |
| Asset impairments | | $ | 1.3 | | | $ | — | | | $ | (1.3) | | | | | $ | — | | | $ | — | | | | | $ | — | | | $ | — | |
| | | | | | | | | | | | | | | | | | |
| Selling, general and administrative | | 1,253.3 | | | 15.4 | | | — | | | | | (1.5) | | | (3.3) | | | | | — | | | 1,263.9 | |
| | | | | | | | | | | | | | | | | | |
| Operating income (loss) | | 447.0 | | | (15.4) | | | 1.3 | | | | | 1.5 | | | 3.3 | | | | | — | | | 437.7 | |
| | | | | | | | | | | | | | | | | | |
| | | | | | | | | | | | | | | | | | |
| | | | | | | | | | | | | | | | | | |
| Income (loss) before income taxes | | $ | 337.5 | | | $ | (15.4) | | | $ | 1.3 | | | | | $ | 1.5 | | | $ | 3.3 | | | | | $ | — | | | $ | 328.2 | |
| Income tax (provision) benefit | | (71.8) | | | 4.0 | | | (0.3) | | | | | (0.4) | | | (0.9) | | | | | (14.8) | | | (84.2) | |
| Net income (loss) | | $ | 265.7 | | | $ | (11.4) | | | $ | 1.0 | | | | | $ | 1.1 | | | $ | 2.4 | | | | | $ | (14.8) | | | $ | 244.0 | |
| | | | | | | | | | | | | | | | | | |
| Diluted net income (loss) per share | | $ | 10.86 | | | $ | (0.47) | | | $ | 0.04 | | | | | $ | 0.05 | | | $ | 0.10 | | | | | $ | (0.60) | | | $ | 9.98 | |
| Diluted share count | | 24.5 | | | | | | | | | | | | | | | | | |
| | | | | | | | | | | | | | | | | | | | | | | | | | | | | | | | | | | | | | | | | | | | | | | | |
| | Year Ended December 31, 2021 |
| ($ in millions, except per share amounts) | | As
reported | | | | Asset impairment | | Investment loss | | Insurance reserves | | Acquisition expenses | | Loss on redemption of senior notes | | | | Adjusted |
| Asset impairment | | $ | 1.9 | | | | | $ | (1.9) | | | $ | — | | | $ | — | | | $ | — | | | $ | — | | | | | $ | — | |
| Selling, general and administrative | | 2,480.8 | | | | | — | | | — | | | (5.8) | | | (20.2) | | | — | | | | | 2,454.8 | |
| Operating income | | 1,662.5 | | | | | 1.9 | | | — | | | 5.8 | | | 20.2 | | | — | | | | | 1,690.4 | |
| Other (expense) income, net | | (52.0) | | | | | — | | | 66.4 | | | — | | | — | | | 10.3 | | | | | 24.7 | |
| | | | | | | | | | | | | | | | | | |
| Income before income taxes | | $ | 1,484.8 | | | | | $ | 1.9 | | | $ | 66.4 | | | $ | 5.8 | | | $ | 20.2 | | | $ | 10.3 | | | | | $ | 1,589.4 | |
| Income tax (provision) benefit | | (422.1) | | | | | (0.5) | | | 6.6 | | | (1.6) | | | (5.1) | | | (2.7) | | | | | (425.4) | |
| Net income | | $ | 1,062.7 | | | | | $ | 1.4 | | | $ | 73.0 | | | $ | 4.2 | | | $ | 15.1 | | | $ | 7.6 | | | | | $ | 1,164.0 | |
| Net income attributable to non-controlling interest | | (1.7) | | | | | — | | | — | | | — | | | — | | | — | | | | | (1.7) | |
| Net income attributable to redeemable non-controlling interest | | (0.9) | | | | | — | | | — | | | — | | | — | | | — | | | | | (0.9) | |
| Net income attributable to Lithia Motors, Inc. | | $ | 1,060.1 | | | | | $ | 1.4 | | | $ | 73.0 | | | $ | 4.2 | | | $ | 15.1 | | | $ | 7.6 | | | | | $ | 1,161.4 | |
| | | | | | | | | | | | | | | | | | |
| Diluted earnings per share attributable to Lithia Motors, Inc. | | $ | 36.54 | | | | | $ | 0.05 | | | $ | 2.52 | | | $ | 0.14 | | | $ | 0.52 | | | $ | 0.26 | | | | | $ | 40.03 | |
| Diluted share count | | 29.0 | | | | | | | | | | | | | | | | | |
Liquidity and Capital Resources
We manage our liquidity and capital resources in the context of our overall business strategy, continually forecasting and managing our cash, working capital balances and capital structure to meet the short-term and long-term obligations of our business while maintaining liquidity and financial flexibility. Our capitalfree cash flow deployment strategy targets an allocation of 65% investment in acquisitions, 25% investment in capital expenditures, innovation, and diversification and 10% in shareholder return in the form of dividends and share repurchases.
We believe we have sufficient sources of funding to meet our business requirements for the next 12 months and in the longer term. Cash flows from operations and borrowings under our credit facilities are our main sources for liquidity. In addition to the above sources of liquidity, potential sources to fund our business strategy include financing of real estate and proceeds from debt or equity offerings. We evaluate all of these options and may select one or more of them depending on overall capital needs and the availability and cost of capital, although no assurances can be provided that these capital sources will be available in sufficient amounts or with terms acceptable to us.
Available Sources
Below is a summary of our immediately available funds:
| | | | | | | | | | | | | | | | | | | | | | | | | | |
| | As of December 31, | | | | |
| (Dollars in millions) | | 2020 | | 2019 | | Change | | % |
| Cash and cash equivalents | | $ | 160.2 | | | $ | 84.0 | | | $ | 76.2 | | | 90.7 | % |
| | | | | | | | |
| | | | | | | | |
| | | | | | | | |
| Available credit on the credit facilities | | 1,237.1 | | | 574.5 | | | 662.6 | | | 115.3 | |
| Total current available funds | | $ | 1,397.3 | | | $ | 658.5 | | | $ | 738.8 | | | 112.2 | % |
| | | | | | | | |
| | | | | | | | |
NM - Not meaningful.
In October 2020, we raised additional capital through the issuance of $550 million aggregate principal amount of 4.375% senior notes due 2031 and gross proceeds of $805 million from the issuance of Class A Common stock. Combined, these transactions provided for $1.3 billion of available liquidity, net of applicable transaction costs. | | | | | | | | | | | | | | | | | | | | | | | | | | |
| | As of December 31, | | | | |
| ($ in millions) | | 2023 | | 2022 | | Change | | % Change |
| Cash | | $ | 825.0 | | | $ | 168.1 | | | $ | 656.9 | | | 390.8 | % |
| Available credit on the credit facilities | | 870.4 | | | 1,415.6 | | | (545.2) | | | (38.5) | % |
| Total current available funds | | $ | 1,695.4 | | | $ | 1,583.7 | | | $ | 111.7 | | | 7.1 | % |
Information about our cash flows, by category, is presented in our Consolidated Statements of Cash Flows. The following table summarizes our cash flows:
| | | | | | | | | | | | | | | | | | | | |
| | Year Ended December 31, |
| (Dollars in millions) | | 2020 | | 2019 | | 2018 |
| Net cash provided by operating activities | | $ | 542.2 | | | $ | 524.5 | | | $ | 519.7 | |
| Net cash used in investing activities | | (1,605.8) | | | (463.0) | | | (557.1) | |
| Net cash provided by (used in) financing activities | | 1,139.7 | | | (9.1) | | | 11.7 | |
| | | | | | | | | | | | | | | | | | | | |
| | Year Ended December 31, |
| ($ in millions) | | 2023 | | 2022 | | 2021 |
| Net cash (used in) provided by operating activities | | $ | (472.4) | | | $ | (610.1) | | | $ | 1,797.2 | |
| Net cash used in investing activities | | (1,270.3) | | | (1,329.8) | | | (2,890.4) | |
| Net cash provided by financing activities | | 2,409.8 | | | 2,035.9 | | | 1,106.7 | |
Operating Activities
Cash provided byused in operating activities increased $17.7decreased $137.7 million in 20202023 compared to 2019,2022, primarily as a result of improved profitability, lowermaturation of our financing receivables portfolio and an increase in manufacturer floor plan financing related to recovering new vehicle inventory turns compared to the prior yearlevels, partially offset by reduced net income and growthan increase in our business through acquisitions.trade receivables.
Borrowings from and repayments to our syndicated credit facilityfacilities related to our new vehicle inventory floor plan financing are presented as financing activities. Additionally,To better understand the impact of changes in inventory, other assets, and the associated financing, we also consider our adjusted net cash paid for inventory purchased as part of an acquisition is presented as an investing activity, while the subsequent flooring of the inventory is included inprovided by operating activities to include borrowings or repayments associated with our new vehicle floor plan notes payable cash activities. Atcommitment and exclude the endimpact of 2020, we had excess cash from the proceeds received from our debt and equity offerings and utilized some of those funds to temporarily pay down outstanding floor plan debt.financing receivables activity.
To better understand the impact of these items, adjusted net cash provided by operating activities, a non-GAAP measure, is presented below:
| | | | | | | | | | | | | | | | | | | | | | | | | | | | | | | | |
| | Year Ended December 31, |
| | | | | | 2020 vs. 2019 | | | | 2019 vs. 2018 |
| (Dollars in millions) | | 2020 | | 2019 | | Change | | 2018 | | Change |
| Net cash provided by operating activities – as reported | | $ | 542.2 | | | $ | 524.5 | | | $ | 17.7 | | | $ | 519.7 | | | $ | 4.8 | |
| Less: Net repayments on floor plan notes payable: non-trade | | (20.6) | | | (54.6) | | | 34.0 | | | (21.9) | | | (32.7) | |
| Add: Temporary pay down of outstanding borrowings on floor plan notes payable: non-trade | | 113.4 | | | — | | | 113.4 | | | | | — | |
| Less: Borrowings on floor plan notes payable: non-trade associated with acquired new vehicle inventory | | (255.0) | | | (80.0) | | | (175.0) | | | (120.0) | | | 40.0 | |
| Net cash provided by operating activities – adjusted | | $ | 380.0 | | | $ | 389.9 | | | $ | (9.9) | | | $ | 377.8 | | | $ | 12.1 | |
| | | | | | | | | | | | | | | | | | | | | | | | | | | | | | | | |
| | Year Ended December 31, |
| | | | | | 2023 vs. 2022 | | | | 2022 vs. 2021 |
| ($ in millions) | | 2023 | | 2022 | | Change | | 2021 | | Change |
| Net cash (used in) provided by operating activities – as reported | | $ | (472.4) | | | (610.1) | | | $ | 137.7 | | | $ | 1,797.2 | | | $ | (2,407.3) | |
| Add (less): Net borrowings (repayments) on floor plan notes payable: non-trade | | 878.7 | | | 737.9 | | | 140.8 | | | (685.3) | | | 1,423.2 | |
| Less: Borrowings on floor plan notes payable: non-trade associated with acquired new vehicle inventory | | (109.2) | | | (116.5) | | | 7.3 | | | (355.5) | | | 239.0 | |
| Adjust: Financing receivables activity | | 1,045.5 | | | 1,363.0 | | | (317.5) | | | 640.8 | | | 722.2 | |
| Net cash provided by operating activities – adjusted | | $ | 1,342.6 | | | $ | 1,374.3 | | | $ | (31.7) | | | $ | 1,397.2 | | | $ | (22.9) | |
| | | | | | | | | | |
Inventories are one of the most significant component of our cash flow from operations. As of December 31, 2020,2023, our new vehicle days’ supply was 5065 days, or 2118 days lowerhigher than our days’ supply as of December 31, 2019.2022. Our days’ supply of used vehicles was 6564 days, which was the same assix days higher than our days’ supply as of December 31, 2019.2022. We calculate days’ supply of inventory based on current inventory levels, excludingincluding in-transit vehicles, and a 30-day historical cost of sales level. We have continued to focus on managing our unit mix and maintaining an appropriate level of new and used vehicle inventory.
Investing Activities
Net cash used in investing activities totaled $1.6$1.3 billion and $463.0 million,$1.3 billion, respectively, for 20202023 and 2019.2022. Cash flows from investing activities relate primarily to capital expenditures, acquisition and divestiture activity and sales of property and equipment. Our surplus of cash as of December 31, 2023, has been made available to fund upcoming acquisition activity.
Below are highlights of significant activity related to our cash flows from investing activities:
| | Year Ended December 31, |
| | 2020 vs. 2019 | | 2019 vs. 2018 |
| (Dollars in millions) | | 2020 | | 2019 | | Change | | 2018 | | Change |
| | Year Ended December 31, | | | | Year Ended December 31, |
| | | | | | 2023 vs. 2022 | | | | | | | | 2023 vs. 2022 | | | | 2022 vs. 2021 |
| ($ in millions) | | ($ in millions) | | 2023 | | 2022 | | Change | | 2021 | | Change |
| Capital expenditures | Capital expenditures | | $ | (167.8) | | | $ | (124.9) | | | $ | (42.9) | | | $ | (158.0) | | | $ | 33.1 | |
| Cash paid for acquisitions, net of cash acquired | Cash paid for acquisitions, net of cash acquired | | (1,503.3) | | | (366.6) | | | (1,136.7) | | | (373.8) | | | 7.2 | |
| Cash paid for other investments | | (11.2) | | | (7.2) | | | (4.0) | | | (62.7) | | | 55.5 | |
| | Proceeds from sales of stores | Proceeds from sales of stores | | 57.5 | | | 46.7 | | | 10.8 | | | 34.3 | | | 12.4 | |
| Proceeds from sales of stores | |
| Proceeds from sales of stores | |
Capital Expenditures
Below is a summary of our capital expenditure activities:
| | | | | | | | | | | | | | | | | | | | |
| | Year Ended December 31, |
| (Dollars in millions) | | 2020 | | 2019 | | 2018 |
| Post-acquisition capital improvements | | $ | 32.5 | | | $ | 33.9 | | | $ | 59.0 | |
| Facilities for open points | | — | | | 5.4 | | | 8.4 | |
| Purchases of previously leased facilities | | 29.6 | | | 3.1 | | | 7.9 | |
| Existing facility improvements | | 48.7 | | | 50.2 | | | 53.5 | |
| Maintenance | | 57.0 | | | 32.3 | | | 29.2 | |
| Total capital expenditures | | $ | 167.8 | | | $ | 124.9 | | | $ | 158.0 | |
Many manufacturers provide assistance in the form of additional incentives or assistance if facilities meet manufacturer image standards and requirements. We expect that certain facility upgrades and remodels will generate additional manufacturer incentive payments. Also, tax laws allowing accelerated deductions for capital expenditures reduce the overall investment needed and encourage accelerated project timelines.
We expect to use a portion of our future capital expenditures to upgrade facilities that we recently acquired. This additional capital investment is contemplated in our initial evaluation of the investment return metrics applied to each acquisition and is usually associated with manufacturer image standards and requirements.
If we undertake a significant capital commitment in the future, we expect to pay for the commitment out of existing cash balances, construction financing and borrowings on our credit facility.facilities. Upon completion of the projects, we believe we would have the ability to secure long-term financing and general borrowings from third party lenders for 70% to 90% of the amounts expended, although no assurances can be provided that these financings will be available to us in sufficient amounts or on terms acceptable to us.
Acquisitions
Growth through acquisitions is a key component of our long-term strategy that enables us to increase our network of locations, support maintaining a diverse franchise and geographic mix and improve our ability to serve customers through wider selection and improved proximity. Our disciplined approach focuses on acquiring new vehicle franchises that are accretive and cash flow positive at reasonable valuations.
We are able to subsequently floor new vehicle inventory acquired as part of an acquisition; however, the cash generated by these transactions are recorded as borrowings on floor plan notes payable, non-trade. Adjusted net cash paid for acquisitions, a non-GAAP measure, as well as certain other acquisition-related information is presented below:
|
|
| | Year Ended December 31, |
| | Year Ended December 31, |
| (Dollars in millions) | | 2020 | | 2019 | | 2018 |
| ($ in millions) | | ($ in millions) | | 2023 | | 2022 | | 2021 |
| Number of stores acquired | Number of stores acquired | | 30 | | | 9 | | | 17 | |
| Number of stores opened | Number of stores opened | | — | | | — | | | 1 | |
| Number of franchises added | | — | | | 1 | | | — | |
| | Cash paid for acquisitions, net of cash acquired | |
| | Cash paid for acquisitions, net of cash acquired | |
| | Cash paid for acquisitions, net of cash acquired | Cash paid for acquisitions, net of cash acquired | | $ | (1,503.3) | | | $ | (366.6) | | | $ | (373.8) | |
| Add: Borrowings on floor plan notes payable: non-trade associated with acquired new vehicle inventory | Add: Borrowings on floor plan notes payable: non-trade associated with acquired new vehicle inventory | | 255.0 | | | 80.0 | | | 120.0 | |
| | Cash paid for acquisitions, net of cash acquired – adjusted | Cash paid for acquisitions, net of cash acquired – adjusted | | $ | (1,248.3) | | | $ | (286.6) | | | $ | (253.8) | |
We evaluate potential capital investments primarily based on targeted rates of return on assets and return on our net equity investment.
Financing Activities
NetAdjusted net cash provided by financing activities, a non-GAAP measure, which is adjusted for borrowingborrowings and repayments on floor plan facilities: non-trade and borrowings and repayments associated with our Financing Operations segment was as follows:
| | | | | | | | | | | | | | | | | | | | |
| | Year Ended December 31, |
| (Dollars in millions) | | 2020 | | 2019 | | 2018 |
| Cash provided by (used in) financing activities, as reported | | $ | 1,139.7 | | | $ | (9.1) | | | $ | 11.7 | |
| Add: Net repayments on floor plan notes payable: non-trade | | 20.6 | | | 54.6 | | | 21.9 | |
| | | | | | |
| Cash provided by financing activities, as adjusted | | $ | 1,160.3 | | | $ | 45.5 | | | $ | 33.6 | |
| | | | | | | | | | | | | | | | | | | | |
| | Year Ended December 31, |
| ($ in millions) | | 2023 | | 2022 | | 2021 |
| Cash provided by financing activities, as reported | | $ | 2,409.8 | | | 2,035.9 | | | $ | 1,106.7 | |
| Add (less): Net (borrowings) repayments on floor plan notes payable: non-trade | | (878.7) | | | (737.9) | | | 685.3 | |
| Less: Net borrowings on non-recourse notes payable | | (1,283.4) | | | (104.6) | | | (317.6) | |
| Cash provided by financing activities, as adjusted | | $ | 247.7 | | | $ | 1,193.4 | | | $ | 1,474.4 | |
| | | | | | |
| | | | | | |
Below are highlights of significant activity related to our cash flows from financing activities, excluding net (repayments) borrowings and repayments on floor plan notes payable: non-trade and non-recourse notes payable, which are discussed above:
| | Year Ended December 31, |
| | 2020 vs. 2019 | | 2019 vs. 2018 |
| (Dollars in millions) | | 2020 | | 2019 | | Change | | 2018 | | Change |
| Net (repayments) borrowings on lines of credit | | $ | (110.0) | | | $ | (314.6) | | | $ | 204.6 | | | $ | 191.8 | | | $ | (506.4) | |
| | Year Ended December 31, | | | | Year Ended December 31, |
| | | | | | 2023 vs. 2022 | | | | | | | | 2023 vs. 2022 | | | | 2022 vs. 2021 |
| ($ in millions) | | ($ in millions) | | 2023 | | 2022 | | Change | | 2021 | | Change |
| Net borrowings on lines of credit | |
| Principal payments on long-term debt and finance lease liabilities, other | Principal payments on long-term debt and finance lease liabilities, other | | (6.3) | | | (11.0) | | | 4.7 | | | (26.1) | | | 15.1 | |
| Proceeds from the issuance of long-term debt | Proceeds from the issuance of long-term debt | | 606.5 | | | 420.3 | | | 186.2 | | | 62.1 | | | 358.2 | |
| Proceeds from the issuance of common stock | Proceeds from the issuance of common stock | | 790.4 | | | 11.0 | | | 779.4 | | | 10.1 | | | 0.9 | |
| | Payment of debt issuance costs | |
| Repurchases of common stock | Repurchases of common stock | | (50.6) | | | (3.2) | | | (47.4) | | | (148.9) | | | 145.7 | |
| Dividends paid | Dividends paid | | (29.1) | | | (27.6) | | | (1.5) | | | (27.7) | | | 0.1 | |
|
Borrowing and Repayment Activity
During 2020,2023, we raised net proceeds of $606.5$79.8 million through the issuance of $550.0 million in aggregate principal amountdebt, and had net borrowings of 4.375% senior notes due 2031 and $56.5 million through mortgages, and repaid $110.0 million, net,$0.3 billion on our lines of credit. These funds were primarily used for acquisitions, share repurchases and capital expenditures.
Our debt to total capital ratio, excluding floor plan notes payable, was 44.5%47.1% at December 31, 20202023 compared to 50.0%49.5% at December 31, 2019.2022.
Equity Transactions
In October 2020,During 2023, we completed the public offeringrepurchased over 142,700 shares at a weighted average price of 3,659,091 million shares of$240.81 under our Class A common stock, no par value per share, which included the exercise in full by the underwriters of their option to purchase up to 477,272 additional shares of our Class A common stock, for total net proceeds of approximately $777.6 million.
Ourcurrent share repurchase program, authorized by our Board of Directors, allows us to repurchase up to $250authorization, with approximately $467.0 million of our Class A common stock. As of December 31, 2020, we had $187.5 million available for repurchase under the program. The authority to repurchase does not have an expiration date.remaining.
During 2020,2023, we paid dividends on our Class A and Class B Common Stockcommon stock as follows:
| | | | | | | | | | | | | | |
| Dividend paid: | | Dividend amount per share | | Total amount of dividend (in millions) |
| March 2020 | | $ | 0.30 | | | $ | 7.0 | |
| May 2020 | | 0.30 | | | 6.8 | |
| August 2020 | | 0.31 | | | 7.1 | |
| November 2020 | | 0.31 | | | 8.2 | |
| | | | | | | | | | | | | | |
| Dividend paid: | | Dividend amount per share | | Total amount of dividend (in millions) |
| March 2023 | | $ | 0.42 | | | $ | 11.5 | |
| May 2023 | | 0.50 | | | 13.8 | |
| August 2023 | | 0.50 | | | 13.8 | |
| November 2023 | | 0.50 | | | 13.7 | |
We evaluate performance and make a recommendation to the Board of Directors on dividend payments on a quarterly basis.
Summary of Outstanding Balances on Credit Facilities and Long-Term Debt
Below is a summary of our outstanding balances on credit facilities and long-term debt:
| | (Dollars in millions) | | Outstanding as of December 31, 2020 | | Remaining Available as of December 31, 2020 | |
| ($ in millions) | |
| Floor plan notes payable: non-trade | |
| Floor plan notes payable: non-trade | |
| Floor plan notes payable: non-trade | Floor plan notes payable: non-trade | | $ | 1,563.0 | | | $ | — | | (1) | | $ | 2,288.5 | | | $ | | $ | — | | (1) | (1) |
| Floor plan notes payable | Floor plan notes payable | | 234.2 | | | — | | |
| Used and service loaner vehicle inventory financing commitments | Used and service loaner vehicle inventory financing commitments | | — | | | 491.0 | | (2) |
| Used and service loaner vehicle inventory financing commitments | |
| Used and service loaner vehicle inventory financing commitments | | | 902.8 | | | 25.5 | | (2) |
| Revolving lines of credit | Revolving lines of credit | | 39.0 | | | 632.7 | | (2),(3) | Revolving lines of credit | | 1,620.7 | | | 829.6 | | 829.6 | | (2),(3) | (2),(3) |
| Real estate mortgages | | 611.5 | | | — | | |
| Finance lease obligations | | 246.4 | | | — | | |
| 5.250% Senior notes due 2025 | | 300.0 | | | — | | |
| Warehouse facilities | | Warehouse facilities | | 587.0 | | | 15.4 | | (2) |
| Non-recourse notes payable | |
| 4.625% Senior notes due 2027 | |
| 4.625% Senior notes due 2027 | |
| 4.625% Senior notes due 2027 | 4.625% Senior notes due 2027 | | 400.0 | | | — | | |
| 4.375% Senior notes due 2031 | 4.375% Senior notes due 2031 | | 550.0 | | | — | | |
| Other debt | | 2.4 | | | — | | |
| 4.375% Senior notes due 2031 | |
| 4.375% Senior notes due 2031 | |
| 3.875% Senior notes due 2029 | |
| 3.875% Senior notes due 2029 | |
| 3.875% Senior notes due 2029 | |
| Real estate mortgages, finance lease obligations, and other debt | |
| Real estate mortgages, finance lease obligations, and other debt | |
| Real estate mortgages, finance lease obligations, and other debt | |
| Unamortized debt issuance costs | |
| Unamortized debt issuance costs | |
| Unamortized debt issuance costs | Unamortized debt issuance costs | | (18.6) | | | — | | (4) | | (31.8) | | | — | | — | | (4) | (4) |
| Total debt | Total debt | | $ | 3,927.9 | | | $ | 1,123.7 | | |
(1)As of December 31, 2020,2023, we had a $2.1 billion new vehicle floor plan commitment as part of our USB credit facility, and a $500 million CAD wholesale floorplan commitment as part of our BNS credit facility.
(2)The amounts available on the credit facilities are limited based on borrowing base calculations and fluctuates monthly.
(3)Available credit is based on the borrowing base amount effective as of November 30, 2020.2023. This amount is reduced by $18.2$37.0 million for outstanding letters of credit.
(4)Debt issuance costs are presented on the balance sheet as a reduction from the carrying amount of the related debt liability. See Note 69 – Credit Facilities and Long-Term Debt of Notes to Consolidated Financial Statements included in Part II, Item 8 of this Annual Report.
Credit Facility
Contractual Obligations
Our syndicated credit facility (credit facility) is comprised of 19 financial institutions, including seven manufacturer-affiliated finance companies, with a maturity date of January 2025.cash requirements greater than twelve months from contractual obligations and commitments include:
We haveDebt Obligations and Interest Payments
Refer to Note 9 – Credit Facilities and Long-Term Debt of the optionnotes to reallocate the commitments, provided that the used vehicle inventory floor plan financing commitment does not exceed 16.5%consolidated financial statements for further information of aggregate commitments, the revolving loan commitment does not exceed 18.75% of aggregate commitments, the service loaner floor plan financing commitment does not exceed $100 million,our obligations and the sumtiming of these commitments plus the new vehicle inventory floor plan financing commitment does not exceed the aggregate total financing commitment of $2.8 billion. Additionally, we may request an increase in the aggregate new vehicle floor plan commitment of up to $400 million provided that the aggregate commitment does not exceed $3.2 billion total availability. All borrowings from, and repayments to, our lending group are presented in the Consolidated Statements of Cash Flows as financing activities.expected payments.
Our obligations under our credit facility are secured by a substantial amountContract Obligations
Refer to Note 8 – Commitments and Contingencies of the notes to the consolidated financial statements for further information of our assets, including our inventory (including newobligations and used vehicles, parts and accessories), equipment, accounts receivable (and other rights to payment) and our equity interests in certainthe timing of our subsidiaries. Under our credit facility, our obligations relating to new vehicle floor plan loans are secured only by collateral owned by borrowers of new vehicle floor plan loans under the credit facility.expected payments.
The interest rate on the credit facility varies based on the type of debt, with the rate of one-month LIBOR plus 1.10% for new vehicle floor plan financing, one-month LIBOR plus 1.40% for used vehicle floor plan financing;Operating and a variable interest rate on the revolving financing ranging from the one-month LIBOR plus 1.00%Finance Leases
Refer to 2.00%, depending on our leverage ratio. The annual interest rate associated with our new vehicle floor plan commitment was 1.24% at December 31, 2020. The annual interest rate associated with our used vehicle inventory financing commitment was 1.54% at December 31, 2020. The annual interest rate associated with our service loaner inventory financing commitment was 1.34% at December 31, 2020. The annual interest rate associated with our revolving line of credit was 1.14% at December 31, 2020.
Under the terms of our credit facility we are subject to financial covenantsNote 8 – Commitments and restrictive covenants that limit or restrict our incurring additional indebtedness, making investments, selling or acquiring assets and granting security interests in our assets.
Under our credit facility, we are required to maintain the ratios detailed in the following table:
| | | | | | | | | | | | | | |
Debt Covenant Ratio | |
Requirement | | As of December 31, 2020 |
Current ratio | | Not less than 1.10 to 1 | | 1.48 to 1 |
Fixed charge coverage ratio | | Not less than 1.20 to 1 | | 3.91 to 1 |
Leverage ratio | | Not more than 5.75 to 1 | | 2.74 to 1 |
As of December 31, 2020, we were in compliance with all covenants. We expect to remain in compliance with the financial and restrictive covenants in our credit facility and other debt agreements. However, no assurances can be provided that we will continue to remain in compliance with the financial and restrictive covenants.
If we do not meet the financial and restrictive covenants and are unable to remediate or cure the condition or obtain a waiver from our lenders, a breach would give rise to remedies under the agreement, the most severe of which are the termination of the agreement, acceleration of the amounts owed and the seizure and sale of our assets comprising the collateral for the loans. A breach would also trigger cross-defaults under other debt agreements.
Although we refer to the lenders’ obligations to make loans as “commitments,” each lender’s obligations to make any loan or other credit accommodations under the credit facility is subject to the satisfaction of the conditions precedent specified in the credit agreement including, for example, that our representations and warranties in the agreement are true and correct in all material respects as of the date of each credit extension. If we are unable to satisfy the applicable conditions precedent, we may not be able to request new loans or other credit accommodations under our credit facility.
Other Lines of Credit
Our other lines of credit include commitments of up to $80.0 million, secured by certain assets from select Chrysler locations and all Ford locations. These other lines of credit mature in 2021 and have interest rates up to 5.70%. As of December 31, 2020, no amounts were outstanding on these other lines of credit.
On July 14, 2020, we entered into a five-year real estate backed facility with eight financial institutions, including two manufacturer affiliated finance companies, maturing in July 2025. The real-estate backed credit facility provides a total financing commitment of up to $251.5 million in working capital financing for general corporate purposes, including acquisitions and working capital, collateralized by real estate and certain other assets owned by us. The interest rate on this credit facility uses one-month LIBOR plus a margin ranging from 2.00%-2.50% based on our leverage ratio, or a base rate of 0.75% plus a margin. The facility includes financial and restrictive covenants typical of such agreements, lending conditions, and representations and warranties by us. Financial covenants include requirements to maintain minimum current and fixed charge coverage ratios, and a maximum leverage ratio, consistent with those under our existing syndicated credit facility with U.S. Bank National Association as administrative agent. As of December 31, 2020, no amounts were outstanding on the real estate backed facility.
On July 31, 2020, we entered into a securitization facility which provides initial commitments for borrowings of up to $150.0 million and matures in July 2022. As of December 31, 2020, we had $39.0 million drawn on the securitization facility.
Floor Plan Notes Payable
We have floor plan agreements with manufacturer-affiliated finance companies for certain new vehicles and vehicles that are designated for use as service loaners. As discussed above in “Operating Activities,” during 2019 we entered a floor plan agreement with Chrysler Capital. This facility provides floor plan financing for new vehicle inventory at select Chrysler stores. This facility adds to our existing facility with Ford Motor Credit Company. The interest rates on these floor plan notes payable commitments vary by manufacturer and are variable rates. As of December 31, 2020, $234.2 million was outstanding on these agreements at interest rates ranging up to 5.25%. Borrowings from and repayments to manufacturer-affiliated finance companies are classified as operating activities in the Consolidated Statements of Cash Flows.
Real Estate Mortgages, Finance Lease Obligations, and Other Debt
We have mortgages associated with our owned real estate. Interest rates related to this debt ranged from 1.9% to 5.3% at December 31, 2020. The mortgages are payable in various installments through August 1, 2038. As of December 31, 2020, we had fixed interest rates on 76.2% of our outstanding mortgage debt.
We have finance lease obligations with some of our leased real estate. Interest rates related to this debt ranged from 1.9% to 8.5% at December 31, 2020. The leases have terms extending through August 2037.
Our other debt includes sellers’ notes. The interest rates associated with our other debt ranged from 4.4% to 5.3% at December 31, 2020. This debt, which totaled $2.4 million at December 31, 2020, is due in various installments through August 2037.
5.250% Senior Notes Due 2025
On July 24, 2017, we issued $300.0 million in aggregate principal amount of 5.250% senior notes due 2025 to eligible purchasers in a private placement under Rule 144A and Regulation S of the Securities Act of 1933. Interest accrues on the notes from July 24, 2017 and is payable semiannually on February 1 and August 1. We may redeem the notes in whole or in part at any time prior to August 1, 2020 at a price equal to 100% of the principal amount plus a make-whole premium set forth in the indenture and accrued and unpaid interest. After August 1, 2020, we may redeem some or allContingencies of the notes subject to the redemption prices set forth in the indenture. If we experience specific kinds of changes of control, as described in the indenture, we must offer to repurchase the notes at 101% of their principal amount plus accrued and unpaid interest to the date of purchase.
4.625% Senior Notes Due 2027
On December 9, 2019, we issued $400.0 million in aggregate principal amount of 4.625% senior notes due 2027 to eligible purchasers in a private placement under Rule 144A and Regulation S of the Securities Act of 1933. Interest accrues on the notes from December 9, 2019 and is payable semiannually on June 15 and December 15. We may redeem the notes in whole or in part, on or after December 15, 2022, at the redemption prices set forth in the indenture. Prior to December 15, 2022, we may redeem the notes, in whole or in part, at a price equal to 100% of the principal amount thereof plus a make-whole premium set forth in the indenture. In addition, prior to December 15, 2022, we may redeem up to 40% of the notes from the proceeds of certain equity offerings. Upon certain change of control events (as set forth in the indenture), the holders of the notes may require us to repurchase all or a portion of the notes at a purchase price of 101% of their principal amount plus accrued and unpaid interest, if any, to the date of purchase.
4.375% Senior Notes Due 2031
On October 9, 2020, we issued $550.0 million in aggregate principal amount of 4.375% senior notes due 2031 to eligible purchasers in a private placement under Rule 144A and Regulation S of the Securities Act of 1933. Interest accrues on the notes from October 9, 2020 and is payable semiannually on January 15 and July 15. We may redeem the notes in whole or in part, on or after October 15, 2025, at the redemption prices set forth in the indenture. Prior to October 15, 2025, we may redeem the notes, in whole or in part, at a price equal to 100% of the principal amount thereof plus a make-whole premium set forth in the indenture. In addition, prior to October 15, 2025, we may redeem up to 40% of the notes from the proceeds of certain equity offerings. Upon certain change of control events (as set forth in the indenture), the holders of the notes may require us to repurchase all or a portion of the notes at a purchase price of 101% of their principal amount plus accrued and unpaid interest, if any, to the date of purchase.
Contractual Payment Obligations
A summaryconsolidated financial statements for further information of our contractual commitments and obligations as of December 31, 2020, was as follows:
| | | | | | | | | | | | | | | | | | | | | | | | | | | | | | | | |
| | Payments Due By Period |
| (Dollars in millions) | |
Total | | 2021 | | 2022 and 2023 | | 2024 and 2025 | | 2026 and beyond |
| Contractual Obligation: | | | | | | | | | | |
Floor plan notes payable: non-trade(1) | | $ | 1,563.0 | | | $ | 1,563.0 | | | $ | — | | | $ | — | | | $ | — | |
Floor plan notes payable(1) | | 234.2 | | | 234.2 | | | — | | | — | | | — | |
Used and service loaner vehicle inventory financing commitments(1) | | — | | | — | | | — | | | — | | | — | |
Revolving lines of credit(1)(3) | | 39.0 | | | — | | | 39.0 | | | — | | | — | |
Real estate mortgages, including interest(3) | | 716.3 | | | 81.0 | | | 149.0 | | | 150.3 | | | 336.0 | |
Finance lease obligations(2) | | 275.5 | | | 11.9 | | | 118.0 | | | 112.8 | | | 32.8 | |
5.250% Senior notes due 2025, including interest(3) | | 378.8 | | | 15.8 | | | 31.5 | | | 331.5 | | | — | |
4.625% Senior notes due 2027, including interest(3) | | 679.5 | | | 18.5 | | | 37.0 | | | 37.0 | | | 587.0 | |
4.375% Senior notes due 2031, including interest(3) | | 808.1 | | | 17.5 | | | 48.1 | | | 48.1 | | | 694.4 | |
| Other debt, including interest | | 1,252.8 | | | 0.7 | | | 1.3 | | | 300.5 | | | 950.3 | |
| Charge-backs on various contracts | | 67.0 | | | 39.9 | | | 24.6 | | | 2.5 | | | — | |
Operating leases(2) | | 414.6 | | | 40.5 | | | 73.8 | | | 65.3 | | | 235.0 | |
| Self-insurance programs | | 39.1 | | | 21.4 | | | 10.9 | | | 3.6 | | | 3.2 | |
| | $ | 6,467.9 | | | $ | 2,044.4 | | | $ | 533.2 | | | $ | 1,051.6 | | | $ | 2,838.7 | |
(1)Amounts for new vehicle floor plan commitment, floor plan notes payable, the used and service loaner vehicle inventory financing commitments and the revolving linestiming of credit do not include estimated interestexpected payments. See Note 1 and Note 6 of Notes to Consolidated Financial Statements.
(2)Amounts for operating lease commitments do not include sublease income, and certain operating expenses such as maintenance, insurance and real estate taxes. See Note 7 and Note 11of Notes to Consolidated Financial Statements.
(3)Balances exclude net impact of debt issuance costs. See Note 6 of Notes to Consolidated Financial Statements.
Off-Balance Sheet Arrangements
We do not have any off-balance sheet arrangements that have or are reasonably likely to have a material current or future effect on our financial condition, changes in financial condition, revenues or expenses, results of operations, liquidity, capital expenditures or capital resources.
Inflation and Changing Prices
Inflation and changing prices did not have a material impact on our revenues or income from operations in the years ended December 31, 2020, 2019 and 2018.
Critical Accounting Policies and Estimates
The preparation of financial statements in conformity with U.S.United States generally accepted accounting principles requires us to make certain estimates, judgments and assumptions that affect the reported amounts of assets and liabilities, the disclosure of contingent assets and liabilities and reported amounts of revenues and expenses at the date of the financial statements. Certain accounting policies require us to make difficult and subjective judgments on matters that are inherently uncertain. The following accounting policies involve critical accounting estimates because they are particularly dependent on assumptions made by management. While we have made our best estimates based on facts and circumstances available to us at the time, different estimates could have been used in the current period. Changes in the accounting estimates we used are reasonably likely to occur from period to period, which may have a material impact on the presentation of our financial condition and results of operations.
Our most critical accounting estimates include those related to goodwill and franchise value, and acquisitions. We also have other key accounting policies for valuation of accounts receivablefinance receivables and expense accruals. However, these policies either do not meet the definition of critical accounting estimates described above or the policies are not currently material items in our financial statements. We review our estimates, judgments and assumptions periodically and reflect the effects of revisions in the period that they are deemed to be necessary. We believe that these estimates are reasonable. However, actual results could differ materially from these estimates.
Goodwill and Franchise Value
We are required to test our goodwill and franchise value for impairment at least annually on October 1, or more frequently if conditions indicate that an impairment may have occurred. Goodwill is tested for impairment at the reporting unit level. Our reporting units for goodwill impairment testing are individual retail automotive stores as this is the level at which discrete financial information is availableNorth America Vehicle Operations, United Kingdom Vehicle Operations, and for which operating results are regularly reviewed by our chief operating decision maker to allocate resourcesUS and assess performance.
Canada Financing Operations. We have the option to qualitatively or quantitatively assess goodwill for impairment and, in 2020,2023, we evaluated our goodwill using a qualitative assessment process. If the qualitative factors determine that it is more likely than not that the fair value of the reporting unit exceeds the carrying amount, goodwill is not impaired. If the qualitative assessment determines it is more likely than not the fair value is less than the carrying amount, we would further evaluate for potential impairment.
As of December 31, 2020,2023, we had $593.0 million$1.9 billion of goodwill on our balance sheet associated with 192our reporting units. No reporting unit accounted for more than 2.8% of our total goodwill as of December 31, 2020. During the second quarter of 2020, there were indications of a triggering event at certain reporting units. We tested the goodwill values for these locations, and, as a result, we recorded an impairment charge of $3.5 million. The annual goodwill impairment analysis which we perform as of October 1 of each year, resulted in no indications of impairment in 20202023, 2022 or 2018. In 2019, our annual analysis resulted in an impairment charge of $1.7 million.2021.
We have determined the appropriate unit of accounting for testing franchise rights for impairment is on an individual store basis. We have the option to qualitatively or quantitatively assess indefinite-lived intangible assets for impairment. In 2020,2023, we evaluated our indefinite-lived intangible assets using a qualitative assessment process. If the qualitative factors determine that it is more likely than not that the fair value of the individual store’s franchise value exceeds the carrying amount, the franchise value is not impaired, and the second step is not necessary. If the qualitative assessment determines it is more likely than not that the fair value is less than the carrying amount, then a quantitative valuation of our franchise value is performed. An impairment charge is recorded to the extent the fair value is less than the carrying value.
As of December 31, 2020,2023, we had $350.2 million$2.4 billion of franchise value on our balance sheet associated with 192 stores.303 locations. No individual storelocation accounted for more than 5.2%2.8% of our total franchise value as of December 31, 2020. During the second quarter of 2020, there were indications of a triggering event at certain reporting units. We tested the franchise values for these locations, and as a result we recorded an impairment charge of $4.4 million.2023. The annual franchise value impairment analysis, which we perform as of October 1 each year, resulted in no indications of impairment in 20202023, 2022, or 2018. In 2019, our annual analysis2021. During the third quarter of 2021, there were indications of impairment at a certain location. We tested the franchise value for this location, which resulted in an impairment charge of $0.4$1.9 million.
We are subject to financial statement risk to the extent that our goodwill or franchise rights become impaired due to decreases in the fair value. A future decline in performance, decreases in projected growth rates or margin assumptions or changes in discount rates could result in a potential impairment, which could have a material adverse impact on our financial position and results of operations. Furthermore, if a manufacturer becomes insolvent, we may be required to record a partial or total impairment on the franchise value and/or goodwill related to that manufacturer. No individual manufacturer accounted for more than 19.5%2.1% of our total franchise value and goodwill as of December 31, 2020.2023.
See Note 1 – Summary of Significant Accounting Policies and Note 56 – Goodwill and Franchise Value of Notes to Consolidated Financial Statements included in Part II, Item 8. Financial Statements and Supplementary Financial Data of this Annual Report.
Acquisitions
We account for acquisitions using the purchase method of accounting which requires recognition of assets acquired and liabilities assumed at fair value as of the date of the acquisition. Determination of the estimated fair value assigned to each assetsasset acquired or liability assumed can materially impact the net income in subsequent periods through depreciation and amortization and potential impairment charges.
The most significant items we generally acquire in a transaction are inventory, long-lived assets, intangible franchise rights and goodwill. The fair value of acquired inventory is based on manufacturer invoice cost and market data. We estimate the fair value of property and equipment based on a market valuation approach. Additionally, we may use a cost valuation approach to value long-lived assets when a market valuation approach is unavailable. We apply an
income approach for the fair value of intangible franchise rights which discounts the projected future net cash flow using an appropriate discount rate that reflects the risks associated with such projected future cash flow.
See Note 1 – Summary of Significant Accounting Policies and Note 1516 – Acquisitions of Notes to Consolidated Financial Statements included in Part II, Item 8. Financial Statements and Supplementary Financial Data of this Annual Report.
Item 7A. Quantitative and Qualitative Disclosures About Market Risk
We are exposed to market risks relating to market fluctuations in interest rates, foreign currency exchange rates, and equity values. We do not acquire our market risk sensitive instruments for trading purposes.
Variable Rate Debt
Our syndicated credit facility,facilities, other floor plan notes payable, and certain real estate mortgages are structured as variable rate debt. The interest rates on our variable rate debt are tied to either the one-day Secured Overnight Financing Rate (SOFR), one-month LIBOR, 3-month LIBOR,Canadian Dollar Offered Rate (CDOR), or the prime rate. These debt obligations, therefore, expose us to variability in interest payments due to changes in these rates. Certain floor plan debt is based on open-ended lines of credit tied to each individual store from the various manufacturer finance companies.
Our variable-rate floor plan notes payable, variable rate mortgage notes payable and other credit line borrowings subject us to market risk exposure. As of December 31, 2020,2023, we had $2.0$6.9 billion outstanding under such agreements at a weighted average interest rate of 1.46%6.8% per annum. A 10% increase in interest rates, or 14.668.1 basis points, would increase annual interest expense by approximately $2.1$34.8 million, net of tax, based on amounts outstanding as of December 31, 2020.2023.
As of December 31, 2022, we had $5.0 billion outstanding under such agreements at a weighted average interest rate of 4.1% per annum. A 10% increase in interest rates, or 40.8 basis points, would increase annual interest expense by approximately $15.1 million, net of tax, based on amounts outstanding as of December 31, 2022.
Fixed Rate Debt
The fair value of our long-term fixed interest rate debt is subject to interest rate risk. Generally, the fair value of fixed interest rate debt will increase as interest rates fall because we would expect to be able to refinance for a lower rate. Conversely, the fair value of fixed interest rate debt will decrease as interest rates rise. The interest rate changes affect the fair value but do not impact earnings or cash flows.
As of December 31, 2020,2023, we had $2.0$4.1 billion of long-term fixed interest rate debt outstanding and recorded on the balance sheet, with maturity dates between January 1, 20202024 and AugustDecember 31, 2038.2050. Based on discounted cash flows using current interest rates for comparable debt, we have determined that the fair value of this long-term fixed interest rate debt was approximately $2.0$3.9 billion as of December 31, 2020.2023.
Equity Price Risk
We are subject to equity price riskAs of December 31, 2022, we had $2.7 billion of long-term fixed interest rate debt outstanding and recorded on the balance sheet, with respect to our equity investment in Shift Technologies, Inc. (Shift), which has a readily determinable fair value following Shift going public in a reverse-merger deal with Insurance Acquisition, a special purpose acquisition company, inmaturity dates between May 28, 2023 and December 31, 2050. Based on discounted cash flows using then current interest rates for comparable debt, we determined that the fourth quarter of 2020. During the period that we hold this equity investment, unrealized gains and losses will be recorded as the fair market value of this security changes over time. The fair value of this equity securitylong-term fixed interest rate debt was $107.3 million atapproximately $2.3 billion as of December 31, 2020. A hypothetical 10% change2022.
Foreign Currency Exchange Risk
We have foreign currency risks related to our foreign subsidiaries’ operating activities denominated in currencies other than the equity price of this security would result in an approximate changeU.S. dollar, including the Canadian dollar and the British pound sterling. Our exposure to unrealized gain or loss of $11 million. The selected 10% hypothetical change in the equity price is not intended to reflect a best or worst case scenario, as equity price changes could be smaller or larger duefluctuating exchange rates relates to the natureeffects of equity markets.translating financial statements of those subsidiaries into our reporting currency, which we do not hedge against based on our investment strategy in these foreign operations. A 10% devaluation in average exchange rates would have resulted in a $303.1 million and $105.7 million decrease to our revenues for the years ended December 31, 2023, and 2022, respectively.
Risk Management Policies
We assess interest rate cash flow risk by identifying and monitoring changes in interest rate exposures that may adversely impact expected future cash flows and by evaluating hedging opportunities. Our policy is to manage this risk through monitoring our mix of fixed rate and variable rate debt. We currently utilize bank debt, mortgage financing, high-yield debt and internally generated cash flows for growth and investment. We monitor our credit ratings and evaluate the benefit and cost of various debt types to manage, and minimize as best as possible, our interest cost.
We maintain risk management controls to monitor interest rate cash flow attributable to both our outstanding and forecasted debt obligations, as well as our offsetting hedge positions. The risk management controls include assessing the impact to future cash flows of changes in interest rates.
Item 8. Financial Statements and Supplementary Financial Data
The financial statements and notes thereto required by this item begin on page F-1 as listed in Item 15. Exhibits and Financial Statement Schedules of Part IV of this document.
Item 9A. Controls and Procedures
Evaluation of Disclosure Controls and Procedures
Our management evaluated, with the participation and under the supervision of our Chief Executive Officer and Chief Financial Officer, the effectiveness of our disclosure controls and procedures as of the end of the period covered by this Annual Report on Form 10-K. Based on this evaluation, our Chief Executive Officer and our Chief Financial Officer concluded that our disclosure controls and procedures are effective to ensure that information we are required to disclose in reports that we file or submit under the Securities Exchange Act of 1934 is accumulated and communicated to our management, including our Chief Executive Officer and our Chief Financial Officer, as appropriate to allow timely decisions regarding required disclosure and that such information is recorded, processed, summarized and reported within the time periods specified in SEC rules and forms.
Changes in Internal Control Over Financial Reporting
There was no change in our internal control over financial reporting that occurred during our last fiscal quarter that has materially affected or is reasonably likely to materially affect our internal control over financial reporting.
Management’s Report on Internal Control Over Financial Reporting
Our management is responsible for establishing and maintaining adequate internal control over financial reporting. Our internal control over financial reporting is designed to provide reasonable assurance regarding the reliability of financial reporting and the preparation of financial statements for external purposes in accordance with generally accepted accounting principles.
Our management assessed the effectiveness of our internal control over financial reporting as of December 31, 2020.2023. In making this assessment, we used the criteria set forth in Internal Control – Integrated Framework (2013) issued by the Committee of Sponsoring Organizations of the Treadway Commission.
In accordance with guidance issued by the SEC, companies are permitted to exclude acquisitions from their final assessment of internal controls over financial reporting during the year of the acquisition while integrating the acquired operations. Management’s evaluation of internal control over financial reporting excludes the operations of the thirty56 stores acquired in 2020,2023, which represented 13%11% of consolidated total assets as of December 31, 20202023 and 7%8% of consolidated revenues for the year ended December 31, 2020.2023.
Based on our assessment, our management concluded that, as of December 31, 2020,2023, our internal control over financial reporting was effective.
KPMG LLP, our Independent Registered Public Accounting Firm, has issued an attestation report on our internal control over financial reporting as of December 31, 2020,2023, which is included in Item 8. Financial Statements and Supplementary Financial Data of this Form 10-K.
PART III
Item 10. Directors, Executive Officers and Corporate Governance
Information required by this item will be included in our Proxy Statement for our 20212024 Annual Meeting of Shareholders and, upon filing with the SEC within 120 days of December 31, 2020,2023, is incorporated herein by reference.
Item 11. Executive Compensation
Information required by this item will be included in our Proxy Statement for our 20212024 Annual Meeting of Shareholders and, upon filing with the SEC within 120 days of December 31, 2020,2023, is incorporated herein by reference.
Item 12. Security Ownership of Certain Beneficial Owners and Management and Related Stockholder Matters
Equity Compensation Plan Information
The following table summarizes equity securities authorized for issuance as of December 31, 2020.2023.
|
Plan Category |
Plan Category | |
Number of securities to be issued upon exercise of outstanding options, warrants and rights (a) | |
Weighted average exercise price of outstanding options, warrants and rights (b) | | Number of securities remaining available for future issuance under equity compensation plans (excluding securities reflected in column (a)) (c) (2) |
Plan Category | |
Plan Category | |
| Equity compensation plans approved by shareholders | |
| Equity compensation plans approved by shareholders | |
| Equity compensation plans approved by shareholders | Equity compensation plans approved by shareholders | | 519,612 | | | $ | — | | (1) | | 2,430,949 | |
| Equity compensation plans not approved by shareholders | Equity compensation plans not approved by shareholders | | — | | | — | | | — | |
| Equity compensation plans not approved by shareholders | |
| Equity compensation plans not approved by shareholders | |
| Total | Total | | 519,612 | | | $ | — | | | | 2,430,949 | |
| Total | |
| Total | |
(1)There is no exercise price associated with our restricted stock units.
(2)Includes 1,018,222718,731 shares available pursuant to our 2013 Amended and Restated Stock Incentive Plan and 1,412,7271,027,692 shares available pursuant to our Employee Stock Purchase Plan.
The additional information required by this item will be included in our Proxy Statement for our 20212024 Annual Meeting of Shareholders and, upon filing with the SEC within 120 days of December 31, 2020,2023, is incorporated herein by reference.
Item 13. Certain Relationships and Related Transactions, and Director Independence
Information required by this item will be included in our Proxy Statement for our 20212024 Annual Meeting of Shareholders and, upon filing with the SEC within 120 days of December 31, 2020,2023, is incorporated herein by reference.
Item 14. Principal Accounting Fees and Services
Our independent registered public accounting firm is KPMG LLP, Portland, OR, Auditor Firm ID: 185.
Information required by this item will be included in our Proxy Statement for our 20212024 Annual Meeting of Shareholders and, upon filing with the SEC within 120 days of December 31, 2020,2023, is incorporated herein by reference.
PART IV
Item 15. Exhibits and Financial Statement Schedules
Financial Statements and Schedules
The Consolidated Financial Statements, together with the reports thereon of KPMG LLP, Independent Registered Public Accounting Firm, are included on the pages indicated below:
| | | | | | | | |
| | |
| | |
| | |
| | Page |
| Report of Independent Registered Public Accounting Firm | | |
Consolidated Balance Sheets as of December 31, 20202023 and 20192022 | | |
Consolidated Statements of Operations for the years ended December 31, 2020, 20192023, 2022 and 20182021 | | |
Consolidated Statements of Comprehensive Income for the years ended December 31, 2020, 20192023, 2022 and 20182021 | | |
Consolidated Statements of Changes in Stockholders’ Equity and Redeemable Non-controlling Interest for the years ended December 31, 2020, 20192023, 2022 and 20182021 | | |
Consolidated Statements of Cash Flows for the years ended December 31, 2020, 20192023, 2022 and 20182021 | | |
| Notes to Consolidated Financial Statements | | |
| |
There are no schedules required to be filed herewith.
Exhibit Index
The following exhibits are filed herewith. An asterisk (*) beside the exhibit number indicates the exhibits containing a management contract, compensatory plan or arrangement.
| | | | | |
Exhibit | Description |
| |
| Restated Articles of Incorporation of Lithia Motors, Inc. (incorporated by reference to exhibit 3.1 to the Company’s Form 10-Q filed July 26, 2019). |
| |
| Second Amended and Restated Bylaws of Lithia Motors, Inc. (incorporated by reference to exhibit 3.2 to the Company’s Form 8-K filed April 25, 2019). |
| |
| Indenture, dated as of July 24, 2017, among Lithia Motors, Inc., the Guarantors and the Trustee (incorporated by reference to exhibit 4.1 to Form 8-K dated July 24, 2017 and filed with the Securities and Exchange Commission on July 24, 2017). |
| |
| Form of 5.250% Senior Notes due 2025 (included as part of exhibit 4.1)(incorporated by reference to exhibit 4.1 to Form 8-K dated July 24, 2017 and filed with the Securities and Exchange Commission on July 24, 2017). |
| |
| Indenture, dated as of December 9, 2019, among Lithia Motors, Inc., the Guarantors and the Trustee (incorporated by reference to exhibit 4.1 to Form 8-K dated December 9, 2019 and filed with the Securities and Exchange Commission on December 13, 2019). |
| |
| Form of 4.625% Senior Notes due 2027 (included as part of exhibit 4.1)(incorporated by reference to exhibit 4.1 to Form 8-K dated December 9, 2019 and filed with the Securities and Exchange Commission on December 13, 2019). |
| |
| Indenture, dated as of October 9, 2020, among Lithia Motors, Inc., the Guarantors and the Trustee (incorporated by reference to exhibit 4.1 to Form 8-K dated October 9, 2020 and filed with the Securities and Exchange Commission on October 9, 2020). |
| |
| Form of 4.375% Senior Notes due 2031 (included as part of exhibit 4.1)(incorporated by reference to exhibit 4.1 to Form 8-K dated October 9, 2020 and filed with the Securities and Exchange Commission on October 9, 2020). |
| |
| Description of the Registrant’s Securities under Section 12 of the Exchange Act of 1934 (incorporated by reference to exhibit 4.5 to the Company’s Form 10-K for the year ended December 31, 2019) |
| |
| Amended and Restated 2009 Employee Stock Purchase Plan (incorporated by reference to exhibit 10.1 to Form 8-K dated April 25, 2019 and filed with the Securities and Exchange Commission on April 25, 2019) |
| |
| | | | | | | | | | | | | | | | | | | | | | | | | | | | | | | | | | | | | | |
| | | | Incorporated by Reference | | Filed or Furnished Herewith |
| Exhibit Number | | Exhibit Description | | Form | | File Number | | Exhibit | | Filing Date | |
| | Restated Articles of Incorporation of Lithia Motors, Inc. | | 10-Q | | 001-14733 | | 3.1 | | 07/28/21 | | |
| | Second Amended and Restated Bylaws of Lithia Motors, Inc. | | 8-K | | 001-14733 | | 3.2 | | 04/25/19 | | |
| | Indenture, dated as of December 9, 2019, among Lithia Motors, Inc., the Guarantors and the Trustee | | 8-K | | 001-14733 | | 4.1 | | 12/13/19 | | |
| | Form of 4.625% Senior Notes due 2027 | | 8-K | | 001-14733 | | 4.1 | | 12/13/19 | | |
| | Indenture, dated as of October 9, 2020, among Lithia Motors, Inc., the Guarantors and the Trustee | | 8-K | | 001-14733 | | 4.1 | | 10/09/20 | | |
| | Form of 4.375% Senior Notes due 2031 | | 8-K | | 001-14733 | | 4.1 | | 10/09/20 | | |
| | Indenture, dated as of May 27, 2021, among Lithia Motors, Inc., the Guarantors and the Trustee | | 8-K | | 001-14733 | | 4.1 | | 05/27/21 | | |
| | Form of 3.875% senior notes due 2029 | | 8-K | | 001-14733 | | 4.1 | | 05/27/21 | | |
| | Description of the Registrant’s Securities under Section 12 of the Exchange Act of 1934 | | 10-K | | 001-14733 | | 4.7 | | 02/18/22 | | |
| | Amended and Restated 2009 Employee Stock Purchase Plan | | | | | | | | | | X |
| | Lithia Motors, Inc. 2013 Amended and Restated Stock Incentive Plan | | 8-K | | 001-14733 | | 10.1 | | 05/02/13 | | |
| | RSU Deferral Plan | | 10-K | | 001-14733 | | 10.3.1 | | 02/24/12 | | |
| | Amendment to RSU Deferral Plan | | 10-K | | 001-14733 | | 10.2.2 | | 03/02/15 | | |
| | Restricted Stock Unit (RSU) Deferral Election Form | | 10-K | | 001-14733 | | 10.2.3 | | 03/02/15 | | |
| | Form of Restricted Stock Unit Agreement (2020 Performance- and Time-Vesting) (for Senior Executives) | | 10-K | | 001-14733 | | 10.3.3 | | 02/21/20 | | |
| | Form of Restricted Stock Unit Agreement (2021 Performance- and Time-Vesting) (for Senior Executives) | | 10-K | | 001-14733 | | 10.3.3 | | 02/19/21 | | |
| | Form of Restricted Stock Unit Agreement (2022 Performance- and Time-Vesting) (for Senior Executives) | | 10-K | | 001-14733 | | 10.3.3 | | 02/18/22 | | |
| | Form of Restricted Stock Unit Agreement (Performance-Vesting) for awards beginning in 2023 | | 10-K | | 001-14733 | | 10.3.3 | | 02/24/23 | | |
| | Form of Restricted Stock Unit Agreement (Time-Vesting) for awards beginning in 2023 | | 10-K | | 001-14733 | | 10.3.4 | | 02/24/23 | | |
| | Form of Restricted Stock Unit Agreement (Time-Vesting) for awards beginning in 2023 (for Directors) | | 10-Q | | 001-14733 | | 10.2 | | 04/28/23 | | |
| | Lithia Motors, Inc. Short-Term Incentive Plan | | 8-K | | 001-14733 | | 10.1 | | 12/22/20 | | |
| | Form of Outside Director Nonqualified Deferred Compensation Agreement | | 10-K | | 001-14733 | | 10.20 | | 03/08/06 | | |
| | | | | |
Exhibit | Description |
| |
| Lithia Motors, Inc. 2013 Amended and Restated Stock Incentive Plan (incorporated by reference to exhibit 10.1 to the Company’s Form 8-K filed May 2, 2013) |
| |
| RSU Deferral Plan (incorporated by reference to exhibit 10.3.1 to the Company’s Form 10-K for the year ended December 31, 2011) |
| |
| Amendment to RSU Deferral Plan (incorporated by reference to exhibit 10.2.2 to the Company’s Form 10-K for the year ended December 31, 2014) |
| |
| Restricted Stock Unit (RSU) Deferral Election Form (incorporated by reference to exhibit 10.2.3 to the Company’s Form 10-K for the year ended December 31, 2014) |
| |
| Form of Restricted Stock Unit Agreement (2018 Performance- and Time-Vesting) (for Senior Executives) (incorporated by reference to exhibit 10.3.2 to the Company’s Form 10-K for the year ended December 31, 2017) |
| |
| Form of Restricted Stock Unit Agreement (2019 Performance- and Time-Vesting) (for Senior Executives)(incorporated by reference to exhibit 10.3.3 to the Company’s Form 10-K for the year ended December 31, 2018) |
| |
| Form of Restricted Stock Unit Agreement (2020 Performance- and Time-Vesting) (for Senior Executives)(incorporated by reference to exhibit 10.3.3 to the Company’s Form 10-K for the year ended December 31, 2019) |
| |
| Form of Restricted Stock Unit Agreement (2021 Performance- and Time-Vesting) (for Senior Executives) |
| |
| Form of Restricted Stock Unit Agreement (Time-Vesting) |
| |
| Lithia Motors, Inc. Performance Bonus Plan (incorporate by reference to exhibit 10.3 to the Company’s Form 10-Q filed April 28, 2017). |
| |
| Form of Outside Director Nonqualified Deferred Compensation Agreement (incorporated by reference to exhibit 10.20 to the Company’s Form 10-K for the year ended December 31, 2005) |
| |
| Third Amended and Restated Loan Agreement, dated December 9, 2019, among Lithia Motors, Inc., the subsidiaries of Lithia Motors, Inc. listed on the signature pages of the agreement or that thereafter become borrowers thereunder, the lenders party thereto from time to time, and U.S. Bank National Association (incorporated by reference to exhibit 10.1 to the Company’s Form 8-K filed December 13, 2019) |
| |
| Amended and Restated Split-Dollar Agreement (incorporated by reference to exhibit 10.17 to the Company’s Form 10-K for the year ended December 31, 2012) |
| |
| Form of Indemnity Agreement for each Named Executive Officer (incorporated by reference to exhibit 10.1 to the Company’s Form 8-K filed May 29, 2009) |
| |
| Form of Indemnity Agreement for each non-management Director (incorporated by reference to exhibit 10.2 to the Company’s Form 8-K filed May 29, 2009) |
| |
| Executive Management Non-Qualified Deferred Compensation and Long-Term Incentive Plan (incorporated by reference to exhibit 10.1 to the Company’s Form 10-Q for the quarter ended March 31, 2016) |
| |
| Form of Executive Management Non-Qualified Deferred Compensation and Long-Term Incentive Plan – Notice of Discretionary Contribution Award for Sidney DeBoer (incorporated by reference to exhibit 10.22.1 to the Company’s Form 10-K for the year ended December 31, 2010) |
| |
| Form of Executive Management Non-Qualified Deferred Compensation and Long-Term Incentive Plan – Notice of Discretionary Contribution Award (incorporated by reference to exhibit 10.22.2 to the Company’s Form 10-K for the year ended December 31, 2010) |
| |
| Amendment to Executive Management Non-Qualified Deferred Compensation and Long-Term Incentive Plan (Executive Management Non-Qualified Deferred Compensation and Supplemental Executive Retirement Plan)(incporated by reference to exhibit 10.10.3 to the Company’s Form 10-K filed February 21, 2019) |
| |
| Transition Agreement dated September 14, 2015 between Lithia Motors, Inc. and Sidney B. DeBoer (incorporated by reference to exhibit 10.1 to the Company’s Form 8-K filed September 17, 2015) |
| |
| | | | | | | | | | | | | | | | | | | | | | | | | | | | | | | | | | | | | | |
| | | | Incorporated by Reference | | Filed or Furnished Herewith |
| Exhibit Number | | Exhibit Description | | Form | | File Number | | Exhibit | | Filing Date | |
| | Amended and Restated Split-Dollar Agreement | | 10-K | | 001-14733 | | 10.17 | | 02/22/13 | | |
| | Form of Indemnity Agreement for each Named Executive Officer | | 8-K | | 001-14733 | | 10.1 | | 05/29/09 | | |
| | Form of Indemnity Agreement for each non-management Director | | 8-K | | 001-14733 | | 10.2 | | 05/29/09 | | |
| | Executive Management Non-Qualified Deferred Compensation and Long-Term Incentive Plan | | 10-Q | | 001-14733 | | 10.1 | | 04/29/16 | | |
| | Form of Executive Management Non-Qualified Deferred Compensation and Long-Term Incentive Plan – Notice of Discretionary Contribution Award for Sidney DeBoer | | 10-K | | 001-14733 | | 10.22.1 | | 03/07/11 | | |
| | Form of Executive Management Non-Qualified Deferred Compensation and Long-Term Incentive Plan – Notice of Discretionary Contribution Award | | 10-K | | 001-14733 | | 10.22.2 | | 03/07/11 | | |
| | Amendment to Executive Management Non-Qualified Deferred Compensation and Long-Term Incentive Plan (Executive Management Non-Qualified Deferred Compensation and Supplemental Executive Retirement Plan) | | 10-K | | 001-14733 | | 10.10.3 | | 02/25/19 | | |
| | Transition Agreement dated September 14, 2015 between Lithia Motors, Inc. and Sidney B. DeBoer | | 8-K | | 001-14733 | | 10.1 | | 09/17/15 | | |
| | Amendment to Transition Agreement dated January 22, 2019 between Lithia Motors, Inc. and Sidney B. DeBoer | | 8-K | | 001-14733 | | 10.1 | | 01/25/19 | | |
| | Director Service Agreement effective January 1, 2016 between Lithia Motors, Inc. and Sidney B. DeBoer | | 8-K | | 001-14733 | | 10.2 | | 09/17/15 | | |
| | Form of Employment and Change in Control Agreement dated February 4, 2016 between Lithia Motors, Inc. and Bryan DeBoer | | 8-K | | 001-14733 | | 10.1 | | 02/05/16 | | |
| | Fourth Amended and Restated Loan Agreement, dated April 29, 2021, among Lithia Motors, Inc., the subsidiaries of Lithia Motors, Inc. listed on the signature pages of the agreement or that thereafter become borrowers thereunder, the lenders party thereto from time to time, and U.S. Bank National Association. | | 8-K | | 001-14733 | | 10.1 | | 05/04/21 | | |
| | First Amendment to Fourth Amended and Restated Loan Agreement, dated February 7, 2022, among Lithia Motors, Inc., the subsidiaries of Lithia Motors, Inc. listed on the signature pages of the agreement or that thereafter become borrowers thereunder, the lenders party thereto from time to time, and U.S. Bank National Association. | | 10-K | | 001-14733 | | 10.13.1 | | 02/24/23 | |
|
| | Second Amendment to Fourth Amended and Restated Loan Agreement, dated June 2, 2022, among Lithia Motors, Inc., the subsidiaries of Lithia Motors, Inc. listed on the signature pages of the agreement or that thereafter become borrowers thereunder, the lenders party thereto from time to time, and U.S. Bank National Association. | | 8-K | | 001-14733 | | 10.1 | | 06/08/22 | | |
| | Third Amendment to Fourth Amended and Restated Loan Agreement, dated November 21, 2022, among Lithia Motors, Inc., the subsidiaries of Lithia Motors, Inc. listed on the signature pages of the agreement or that thereafter become borrowers thereunder, the lenders party thereto from time to time, and U.S. Bank National Association. | | 10-K | | 001-14733 | | 10.13.3 | | 02/24/23 | |
|
| | Fourth Amendment to Fourth Amended and Restated Loan Agreement, dated February 9, 2023, among Lithia Motors, Inc., the subsidiaries of Lithia Motors, Inc. listed on the signature pages of the agreement or that thereafter become borrowers thereunder, the lenders party thereto from time to time, and U.S. Bank National Association. | | 8-K | | 001-14733 | | 10.1 | | 02/15/23 | | |
| | Amended and Restated Loan Agreement, dated December 31, 2020, among SCFC Business Services LLC, Driveway Finance Corporation, the lenders party thereto from time to time, and JPMorgan Chase Bank, N.A. | | 8-K | | 001-14733 | | 10.1 | | 06/09/21 | | |
| | Amendment No. 1 to Amended and Restated Loan Agreement, dated June 4, 2021, among SCFC Business Services LLC, Chariot Funding LLC and JPMorgan Chase Bank, N.A. | | 8-K | | 001-14733 | | 10.2 | | 06/09/21 | | |
| | Amendment No. 2 to Amended and Restated Loan Agreement, dated September 14, 2021, among SCFC Business Services LLC, Chariot Funding LLC and JPMorgan Chase Bank, N.A. | | 10-Q | | 001-14733 | | 10.1 | | 10/27/22 | | |
| | Amendment No. 3 to Amended and Restated Loan Agreement, dated November 10, 2021, among SCFC Business Services LLC, Chariot Funding LLC and JPMorgan Chase Bank, N.A. | | 10-Q | | 001-14733 | | 10.2 | | 10/27/22 | | |
| | | | | |
Exhibit | Description |
| |
| Amendment to Transition Agreement dated January 22, 2019 between Lithia Motors, Inc. and Sidney B. DeBoer (incorporated by reference to exhibit 10.1 to the Company’s Form 8-K filed January 25, 2019) |
| |
| Class B Conversion Agreement dated January 22, 2019 between Lithia Motors, Inc. and Sidney B. DeBoer (incorporated by reference to exhibit 10.2 to the Company’s Form 8-K filed January 25, 2019) |
| |
| Director Service Agreement effective January 1, 2016 between Lithia Motors, Inc. and Sidney B. DeBoer (incorporated by reference to exhibit 10.2 to the Company’s Form 8-K filed September 17, 2015) |
| |
| Form of Employment and Change in Control Agreement dated February 4, 2016 between Lithia Motors, Inc. and Bryan DeBoer (incorporated by reference to exhibit 10.1 to the Company’s Form 8-K filed February 5, 2016)(1)
|
| |
| Credit Agreement, dated July 14, 2020, among Lithia Motors, Inc., the subsidiaries of Lithia Motors Inc. party thereto from time to time, the lenders party thereto from time to time, and Wells Fargo Bank, National Association (incorporated by reference to exhibit 10.1 to Form 8-K filed July 16, 2020). |
| |
| Lithia Motors, Inc. Short-Term Incentive Plan (incorporated by reference to exhibit 10.1 to the Company’s Form 8-K filed December 22, 2020). |
| |
| Subsidiaries of Lithia Motors, Inc. |
| |
| Consent of KPMG LLP, Independent Registered Public Accounting Firm |
| |
| Certification of Chief Executive Officer pursuant to Rule 13a-14(a) or Rule 15d-14(a) of the Securities Exchange Act of 1934. |
| |
| Certification of Chief Financial Officer pursuant to Rule 13a-14(a) or Rule 15d-14(a) of the Securities Exchange Act of 1934. |
| |
| Certification of Chief Executive Officer pursuant to Rule 13a-14(b) or Rule 15d-14(b) of the Securities Exchange Act of 1934 and 18 U.S.C. Section 1350. |
| |
| Certification of Chief Financial Officer pursuant to Rule 13a-14(b) or Rule 15d-14(b) of the Securities Exchange Act of 1934 and 18 U.S.C. Section 1350. |
| |
101.INS | Inline XBRL Instance Document - the instance document does not appear in the Interactive Data File because its XBRL tags are embedded within the Inline XBRL document. |
| |
101.SCH | Inline XBRL Taxonomy Extension Schema Document. |
| |
101.CAL | Inline XBRL Taxonomy Extension Calculation Linkbase Document. |
| |
101.DEF | Inline XBRL Taxonomy Extension Definition Linkbase Document. |
| |
101.LAB | Inline XBRL Taxonomy Extension Label Linkbase Document. |
| |
101.PRE | Inline XBRL Taxonomy Extension Presentation Linkbase Document. |
| |
104 | Cover page formatted as Inline XBRL and contained in Exhibit 101. |
| | | | | | | | | | | | | | | | | | | | | | | | | | | | | | | | | | | | | | |
| | | | Incorporated by Reference | | Filed or Furnished Herewith |
| Exhibit Number | | Exhibit Description | | Form | | File Number | | Exhibit | | Filing Date | |
| | Amendment No. 4 to Amended and Restated Loan Agreement, dated February 8, 2022, among SCFC Business Services LLC, Chariot Funding LLC and JPMorgan Chase Bank, N.A. | | 10-Q | | 001-14733 | | 10.3 | | 10/27/22 | | |
| | Amendment No. 5 to Amended and Restated Loan Agreement, dated June 23, 2022, among SCFC Business Services LLC, Chariot Funding LLC and JPMorgan Chase Bank, N.A. | | 10-Q | | 001-14733 | | 10.4 | | 10/27/22 | | |
| | Amendment No. 6 to Amended and Restated Loan Agreement, dated July 29, 2022, among SCFC Business Services LLC, Chariot Funding LLC and JPMorgan Chase Bank, N.A. | | 10-Q | | 001-14733 | | 10.5 | | 10/27/22 | | |
| | Amendment No. 7 to Amended and Restated Loan Agreement, dated September 26, 2022, among SCFC Business Services LLC, Chariot Funding LLC and JPMorgan Chase Bank, N.A. | | 10-Q | | 001-14733 | | 10.6 | | 10/27/22 | | |
| | Amendment No. 8 to Amended and Restated Loan Agreement, dated November 17, 2022, among SCFC Business Services LLC, Chariot Funding LLC and JPMorgan Chase Bank, N.A. | | 10-K | | 001-14733 | | 10.14.8 | | 02/24/23 | | |
| | Omnibus Amendment #1 to Amended and Restated Loan Agreement, dated July 20, 2023, among SCFC Business Services LLC, Driveway Finance Corporation, the lenders from time to time parties hereto, the agents from time to time parties hereto, and JPMorgan Chase Bank, N.A. | | 10-Q | | 001-14733 | | 10.1 | | 10/27/23 | | |
| | Credit Agreement, dated June 3, 2022, among Lithia Master LP Company, LP, the subsidiaries of Lithia Motors, Inc. listed on the signature pages of the agreement or that thereafter become borrowers thereunder, Lithia Master GP Company, Inc. and the other general partners of the Borrowers, the lenders party thereto from time to time, and The Bank of Nova Scotia. | | 8-K | | 001-14733 | | 10.2 | | 06/08/22 | | |
| | Loan Agreement, dated November 1, 2022, among DFC Business Services, LLC, Driveway Finance Corporation, the lenders party thereto from time to time, the agents from time to time party thereto, and Mizuho Bank, Ltd. | | 8-K | | 001-14733 | | 10.1 | | 11/04/22 | | |
| | Omnibus Amendment #1 to Loan Agreement, dated July 20, 2023, among DFC Business Services, LLC, Driveway Finance Corporation, the lenders party thereto from time to time, the agents from time to time party thereto, and Mizuho Bank, Ltd. | | 10-Q | | 001-14733 | | 10.2 | | 10/27/23 | | |
| | Subsidiaries of Lithia Motors, Inc. | | | | | | | | | | X |
| | Consent of KPMG LLP, Independent Registered Public Accounting Firm | | | | | | | | | | X |
| | Certification of Chief Executive Officer pursuant to Rule 13a-14(a) of the Securities Exchange Act of 1934. | | | | | | | | | | X |
| | Certification of Chief Financial Officer pursuant to Rule 13a-14(a) of the Securities Exchange Act of 1934. | | | | | | | | | | X |
| | Certification of Chief Executive Officer pursuant to Rule 13a-14(b) of the Securities Exchange Act of 1934 and 18 U.S.C. Section 1350. | | | | | | | | | | X |
| | Certification of Chief Financial Officer pursuant to Rule 13a-14(b) of the Securities Exchange Act of 1934 and 18 U.S.C. Section 1350. | | | | | | | | | | X |
| | Lithia Motors, Inc. Clawback Policy | | | | | | | | | | X |
| 101 | | Inline XBRL Document Set for the consolidated financial statements and accompanying notes to consolidated financial statements | | | | | | | | | | X |
| 104 | | Cover page formatted as Inline XBRL and contained in Exhibit 101. | | | | | | | | | | X |
(1)†Substantially similar agreements exist between Lithia Motors, Inc. and each of Michael Cavanaugh, Mark DeBoer,Adam Chamberlain, John Criddle, Tom Dobry, Diana du Preez, Gary Glandon, Scott Hillier, George Hines, Christopher S. Holzshu, Edward Impert, Charles Lietz, Tina Miller, Thomas Naso, Bryan Osterhout, Eric Pitt, Kelly Porter, Jodi Rasor,Ross Sherman, and David Stork. The “Cash Change in Control Benefits” under the agreements with Michael Cavanaugh, Mark DeBoer,John Criddle, Diana du Preez, Gary Glandon, Edward Impert, Charles Lietz, Eric Pitt, Kelly Porter, Jodi Rasor, and David StorkRoss Sherman provide for 12 months of base salary rather than 24 months.
†† Certain confidential and immaterial terms redacted pursuant to Item 601(b)(10)(iv) of Regulation S-K.
SIGNATURES
Pursuant to the requirements of Section 13 or 15(d) of the Securities Exchange Act of 1934, the Registrant has duly caused this report to be signed on its behalf by the undersigned, thereunto duly authorized.
| | | | | | | | |
Date: February 19, 202123, 2024 | LITHIA MOTORS, INC. |
| Registrant |
| | |
| By: | /s/ Bryan B. DeBoer |
| | Bryan B. DeBoer |
| | Chief Executive Officer, President, Director, and Principal Executive Officer |
Pursuant to the requirements of the Securities Exchange Act of 1934, this report has been signed below by the following persons on behalf of the Registrant and in the capacities indicated on February 19, 2021:23, 2024:
| | | | | | | | |
| /s/ Bryan B. DeBoer | | /s/ Tina Miller |
| Bryan B. DeBoer | | Tina Miller |
| Chief Executive Officer, President, Director, and Principal Executive Officer | | Chief Financial Officer, Senior Vice President, and Principal Accounting Officer |
| | |
| /s/ Sidney B. DeBoer | | /s/ Susan O. Cain |
| Sidney B. DeBoer | | Susan O. Cain |
| Chairman of the Board and Director | | Director |
| | |
| /s/ James E. Lentz | | /s/ Stacy Loretz-Congdon |
| James E. Lentz | | Stacy Loretz-Congdon |
| Director | | Director |
| | |
| /s/ Shauna McIntyre | | /s/ Louis P. Miramontes |
| Shauna McIntyre | | Louis P. Miramontes |
| Director | | Director |
| | |
| /s/ Kenneth E. Roberts | | /s/ David J. Robino |
| Kenneth E. Roberts | | David J. Robino |
| Director | | Director |
Report of Independent Registered Public Accounting Firm
To the Stockholders and Board of Directors
Lithia Motors, Inc.:
Opinion on the Consolidated Financial Statements
We have audited the accompanying consolidated balance sheets of Lithia Motors, Inc. and subsidiaries (the Company) as of December 31, 20202023 and 2019,2022, the related consolidated statements of operations, comprehensive income, changes in stockholders’ equity and redeemable non-controlling interest, and cash flows for each of the years in the three-year period ended December 31, 2020,2023, and the related notes (collectively, the consolidated financial statements). In our opinion, the consolidated financial statements present fairly, in all material respects, the financial position of the Company as of December 31, 20202023 and 2019,2022, and the results of its operations and its cash flows for each of the years in the three-year period ended December 31, 2020,2023, in conformity with U.S. generally accepted accounting principles.
We also have audited, in accordance with the standards of the Public Company Accounting Oversight Board (United States) (PCAOB), the Company’s internal control over financial reporting as of December 31, 2020,2023, based on criteria established in Internal Control – Integrated Framework (2013) issued by the Committee of Sponsoring Organizations of the Treadway Commission, and our report dated February 19, 202123, 2024 expressed an unqualified opinion on the effectiveness of the Company’s internal control over financial reporting.
Change in Accounting Principle
As discussed in Note 11 to the consolidated financial statements, the Company changed its method of accounting for leases in 2019 due to the adoption of ASC Topic 842 - Leases.
Basis for Opinion
These consolidated financial statements are the responsibility of the Company’s management. Our responsibility is to express an opinion on these consolidated financial statements based on our audits. We are a public accounting firm registered with the PCAOB and are required to be independent with respect to the Company in accordance with the U.S. federal securities laws and the applicable rules and regulations of the Securities and Exchange Commission and the PCAOB.
We conducted our audits in accordance with the standards of the PCAOB. Those standards require that we plan and perform the audit to obtain reasonable assurance about whether the consolidated financial statements are free of material misstatement, whether due to error or fraud. Our audits included performing procedures to assess the risks of material misstatement of the consolidated financial statements, whether due to error or fraud, and performing procedures that respond to those risks. Such procedures included examining, on a test basis, evidence regarding the amounts and disclosures in the consolidated financial statements. Our audits also included evaluating the accounting principles used and significant estimates made by management, as well as evaluating the overall presentation of the consolidated financial statements. We believe that our audits provide a reasonable basis for our opinion.
Critical Audit Matter
The critical audit matter communicated below is a matter arising from the current period audit of the consolidated financial statements that was communicated or required to be communicated to the audit committee and that: (1) relates to accounts or disclosures that are material to the consolidated financial statements and (2) involved our especially challenging, subjective, or complex judgments. The communication of a critical audit matter does not alter in any way our opinion on the consolidated financial statements, taken as a whole, and we are not, by communicating the critical audit matter below, providing a separate opinion on the critical audit matter or on the accounts or disclosures to which it relates.
Assessment of the Company’s impairment tests over goodwill and franchise value intangible assets
As disclosed in Note 1 and Note 56 to the consolidated financial statements, the Company had goodwill and indefinite-livedindefinite- lived franchise value intangible assets with a book value of $593.0$2,402 million and $350.2 million, respectively, atas of December 31, 2020. As described in Note 1 to the consolidated financial statements, the2023. The Company tested its goodwill and franchise value intangiblesintangible assets for impairment using a qualitative assessment as of October 1, 2020. During the second quarter of 2020, the Company identified indications of a triggering event at certain locations. Management tested the goodwill and franchise value for these locations and recorded non-cash impairment charges of $3.5 million and $4.4 million, which were equal to the difference
between the fair value and the carrying value for goodwill and franchise value, respectively. The impairment charges for both goodwill and franchise value reduced the carrying value to zero at these locations. The qualitative annual assessment was performed at each individual store level as of October 1, 2020 and the2023. The Company determined that no additional impairment existed in 2020.2023.
We identified the assessment of the Company’s qualitative impairment teststest over goodwill and franchise value intangible assets for stores whose current operating results indicate a higher risk of potential impairment as a critical audit matter. The tests included the qualitative evaluation of qualitative factors such as future revenue growth and profitability for stores with
recent losses as well as for stores with declining gross margin, and comparable dealership sales, thatdivestitures, which required especially subjective auditor judgment.
The following are the primary procedures we performed to address this critical audit matter. We evaluated the design and tested the operating effectiveness of certain internal controls over the Company’s goodwill and franchise value impairment assessment processes,process, including controls related to the identification and development of relevant qualitative factors. We comparedevaluated future profitability assumptions by comparing key financial metrics across stores with similar demographics, including historical and future dealership level revenue growth and profitability, and evaluated differences for potential indicators of impairments. We evaluated the Company’s intent and ability to carry out a particular course of action by evaluating the Company’s past history of carrying out its stated intentions. Additionally, we evaluated information about recent comparable dealership salesdivestitures to identify potential indicators of impairment.
/s/ KPMG LLP
We have served as the Company’s auditor since 1993.
Portland, Oregon
February 19, 202123, 2024
Report of Independent Registered Public Accounting Firm
To the Stockholders and Board of Directors
Lithia Motors, Inc.:
Opinion on Internal Control Over Financial Reporting
We have audited Lithia Motors, Inc. and subsidiaries’subsidiaries' (the Company) internal control over financial reporting as of December 31, 2020,2023, based on criteria established in Internal Control – Integrated Framework (2013) issued by the Committee of Sponsoring Organizations of the Treadway Commission. In our opinion, the Company maintained, in all material respects, effective internal control over financial reporting as of December 31, 2020,2023, based on criteria established in Internal Control – Integrated Framework (2013) issued by the Committee of Sponsoring Organizations of the Treadway Commission.
We also have audited, in accordance with the standards of the Public Company Accounting Oversight Board (United States) (PCAOB), the consolidated balance sheets of the Company as of December 31, 20202023 and 2019,2022, the related consolidated statements of operations, comprehensive income, changes in stockholders’ equity and redeemable non- controlling interest, and cash flows for each of the years in the three-year period ended December 31, 2020,2023, and the related notes (collectively, the consolidated financial statements), and our report dated February 19, 202123, 2024 expressed an unqualified opinion on those consolidated financial statements.
The Company acquired thirtyfifty-six stores during 2020,2023, and management excluded from its assessment of the effectiveness of the Company’s internal control over financial reporting as of December 31, 2020,2023, all of these acquired stores’ internal control over financial reporting. The total assets of these thirtyfifty-six stores represented approximately 13%11% of consolidated total assets as of December 31, 20202023 and approximately 7%8% of consolidated revenues for the year ended December 31, 2020.2023. Our audit of internal control over financial reporting of the Company also excluded an evaluation of the internal control over financial reporting of these thirtyfifty- six stores.
Basis for Opinion
The Company’s management is responsible for maintaining effective internal control over financial reporting and for its assessment of the effectiveness of internal control over financial reporting, included in the accompanying Management’sManagement's Report on Internal Control Over Financial Reporting. Our responsibility is to express an opinion on the Company’s internal control over financial reporting based on our audit. We are a public accounting firm registered with the PCAOB and are required to be independent with respect to the Company in accordance with the U.S. federal securities laws and the applicable rules and regulations of the Securities and Exchange Commission and the PCAOB.
We conducted our audit in accordance with the standards of the PCAOB. Those standards require that we plan and perform the audit to obtain reasonable assurance about whether effective internal control over financial reporting was maintained in all material respects. Our audit of internal control over financial reporting included obtaining an understanding of internal control over financial reporting, assessing the risk that a material weakness exists, and testing and evaluating the design and operating effectiveness of internal control based on the assessed risk. Our audit also included performing such other procedures as we considered necessary in the circumstances. We believe that our audit provides a reasonable basis for our opinion.
Definition and Limitations of Internal Control Over Financial Reporting
A company’s internal control over financial reporting is a process designed to provide reasonable assurance regarding the reliability of financial reporting and the preparation of financial statements for external purposes in accordance with generally accepted accounting principles. A company’s internal control over financial reporting includes those policies and procedures that (1) pertain to the maintenance of records that, in reasonable detail, accurately and fairly reflect the transactions and dispositions of the assets of the company; (2) provide reasonable assurance that transactions are recorded as necessary to permit preparation of financial statements in accordance with generally accepted accounting principles, and that receipts and expenditures of the company are being made only in accordance with authorizations of management and directors of the company; and (3) provide reasonable assurance regarding prevention or timely detection of unauthorized acquisition, use, or disposition of the company’s assets that could have a material effect on the financial statements.
Because of its inherent limitations, internal control over financial reporting may not prevent or detect misstatements. Also, projections of any evaluation of effectiveness to future periods are subject to the risk that controls may
become inadequate because of changes in conditions, or that the degree of compliance with the policies or procedures may deteriorate.
/s/ KPMG LLP
Portland, Oregon
February 19, 202123, 2024
| | CONSOLIDATED BALANCE SHEETS | CONSOLIDATED BALANCE SHEETS | CONSOLIDATED BALANCE SHEETS |
| December 31, |
| (In millions) | 2020 | | 2019 |
| December 31, | | | December 31, |
| ($ in millions) | | ($ in millions) | 2023 | | 2022 |
| Assets | Assets | | | |
| Current assets: | Current assets: | |
| Cash and cash equivalents | $ | 160.2 | | | $ | 84.0 | |
| Accounts receivable, net of allowance for doubtful accounts of $5.9 and $7.3 | 614.0 | | | 505.0 | |
| Current assets: | |
| Current assets: | |
| Cash and restricted cash | |
| Cash and restricted cash | |
| Cash and restricted cash | |
| Accounts receivable, net of allowance for doubtful accounts of $7.1 and $3.1 | |
| Inventories, net | Inventories, net | 2,492.9 | | | 2,433.7 | |
| | Other current assets | Other current assets | 70.5 | | | 47.8 | |
| | Other current assets | |
| Other current assets | |
| Total current assets | Total current assets | 3,337.6 | | | 3,070.5 | |
| | Property and equipment, net of accumulated depreciation of $338.0 and $284.3 | 2,197.5 | | | 1,611.7 | |
| Property and equipment, net of accumulated depreciation of $646.7 and $526.8 | |
| Property and equipment, net of accumulated depreciation of $646.7 and $526.8 | |
| Property and equipment, net of accumulated depreciation of $646.7 and $526.8 | |
| Operating lease right-of-use assets | Operating lease right-of-use assets | 264.0 | | | 251.9 | |
| Finance receivables, net of allowance for estimated losses of $106.4 and $69.3 | |
| Goodwill | Goodwill | 593.0 | | | 454.6 | |
| Franchise value | Franchise value | 350.2 | | | 306.7 | |
| | Other non-current assets | Other non-current assets | 1,159.8 | | | 388.5 | |
| Total assets | Total assets | $ | 7,902.1 | | | $ | 6,083.9 | |
| | Liabilities and stockholders’ equity | |
| Liabilities and equity | |
| Liabilities and equity | |
| Liabilities and equity | |
| Current liabilities: | Current liabilities: | |
| Current liabilities: | |
| Current liabilities: | |
| Floor plan notes payable | |
| Floor plan notes payable | |
| Floor plan notes payable | Floor plan notes payable | $ | 234.2 | | | $ | 425.2 | |
| Floor plan notes payable: non-trade | Floor plan notes payable: non-trade | 1,563.0 | | | 1,642.4 | |
| Current maturities of long-term debt | Current maturities of long-term debt | 66.0 | | | 39.3 | |
| Current maturities of non-recourse notes payable | |
| Trade payables | Trade payables | 158.2 | | | 125.3 | |
| Accrued liabilities | Accrued liabilities | 458.3 | | | 336.9 | |
| | Total current liabilities | |
| Total current liabilities | |
| Total current liabilities | Total current liabilities | 2,479.7 | | | 2,569.1 | |
| | Long-term debt, less current maturities | Long-term debt, less current maturities | 2,064.7 | | | 1,430.6 | |
| Long-term debt, less current maturities | |
| Long-term debt, less current maturities | |
| Non-recourse notes payable, less current maturities | |
| Deferred revenue | Deferred revenue | 155.7 | | | 137.9 | |
| Deferred income taxes | Deferred income taxes | 146.3 | | | 131.1 | |
| Non-current operating lease liabilities | Non-current operating lease liabilities | 246.7 | | | 238.5 | |
| Other long-term liabilities | Other long-term liabilities | 147.5 | | | 109.0 | |
| Total liabilities | Total liabilities | 5,240.6 | | | 4,616.2 | |
| | Stockholders’ equity: | |
| Preferred stock - no par value; authorized 15.0 shares; NaN outstanding | 0 | | | 0 | |
| Class A common stock - no par value; authorized 100.0 shares; issued and outstanding 26.3 and 22.6 | 788.2 | | | 20.5 | |
| Class B common stock - no par value; authorized 25.0 shares; issued and outstanding 0.2 and 0.6 | 0 | | | 0.1 | |
| Redeemable non-controlling interest | |
| Redeemable non-controlling interest | |
| Redeemable non-controlling interest | |
| | Equity: | |
| Equity: | |
| Equity: | |
| Preferred stock - no par value; authorized 15.0 shares; none outstanding | |
| Preferred stock - no par value; authorized 15.0 shares; none outstanding | |
| Preferred stock - no par value; authorized 15.0 shares; none outstanding | |
| Common stock - no par value; authorized 125.0 shares; issued and outstanding 27.4 and 27.3 | |
| Additional paid-in capital | Additional paid-in capital | 41.4 | | | 46.0 | |
| | Accumulated other comprehensive loss | (6.3) | | | (0.7) | |
Accumulated other comprehensive income (loss) | |
| Retained earnings | Retained earnings | 1,838.2 | | | 1,401.8 | |
| Total stockholders’ equity | 2,661.5 | | | 1,467.7 | |
| Total liabilities and stockholders’ equity | $ | 7,902.1 | | | $ | 6,083.9 | |
| Total stockholders’ equity - Lithia Motors, Inc. | |
| Non-controlling interest | |
| Total equity | |
| Total liabilities, redeemable non-controlling interest and equity | |
See accompanying notes to consolidated financial statements.
| | CONSOLIDATED STATEMENTS OF OPERATIONS | CONSOLIDATED STATEMENTS OF OPERATIONS | CONSOLIDATED STATEMENTS OF OPERATIONS |
| Year Ended December 31, |
| (In millions, except per share amounts) | 2020 | | 2019 | | 2018 |
| Year Ended December 31, | | | Year Ended December 31, |
| ($ in millions, except per share amounts) | | ($ in millions, except per share amounts) | 2023 | | 2022 | | 2021 |
| Revenues: | Revenues: | | | | | |
| New vehicle retail | |
| New vehicle retail | |
| New vehicle retail | New vehicle retail | $ | 6,773.9 | | | $ | 6,799.1 | | | $ | 6,602.8 | |
| Used vehicle retail | Used vehicle retail | 3,998.4 | | | 3,527.2 | | | 3,079.0 | |
| Used vehicle wholesale | Used vehicle wholesale | 308.7 | | | 301.2 | | | 331.3 | |
| Finance and insurance | Finance and insurance | 579.8 | | | 518.6 | | | 454.8 | |
| Service, body and parts | Service, body and parts | 1,348.7 | | | 1,325.1 | | | 1,222.3 | |
| Fleet and other | Fleet and other | 114.8 | | | 201.5 | | | 131.2 | |
| Total revenues | Total revenues | 13,124.3 | | | 12,672.7 | | | 11,821.4 | |
| Cost of sales: | Cost of sales: | |
| New vehicle retail | New vehicle retail | 6,313.0 | | | 6,413.5 | | | 6,217.7 | |
| New vehicle retail | |
| New vehicle retail | |
| Used vehicle retail | Used vehicle retail | 3,552.4 | | | 3,159.6 | | | 2,756.1 | |
| Used vehicle wholesale | Used vehicle wholesale | 296.7 | | | 297.5 | | | 325.8 | |
| Service, body and parts | Service, body and parts | 631.9 | | | 657.5 | | | 621.6 | |
| Fleet and other | Fleet and other | 104.7 | | | 190.8 | | | 123.2 | |
| Total cost of sales | Total cost of sales | 10,898.7 | | | 10,718.9 | | | 10,044.4 | |
| Gross profit | Gross profit | 2,225.6 | | | 1,953.8 | | | 1,777.0 | |
| | Financing operations (loss) income | |
| Financing operations (loss) income | |
| Financing operations (loss) income | |
| | Asset impairments | |
| Asset impairments | |
| Asset impairments | Asset impairments | 7.9 | | | 2.6 | | | 1.3 | |
| Selling, general and administrative | Selling, general and administrative | 1,428.3 | | | 1,373.8 | | | 1,253.3 | |
| Depreciation and amortization | Depreciation and amortization | 92.3 | | | 82.4 | | | 75.4 | |
| Operating income | Operating income | 697.1 | | | 495.0 | | | 447.0 | |
| Floor plan interest expense | Floor plan interest expense | (34.4) | | | (72.8) | | | (62.3) | |
| Other interest expense | Other interest expense | (73.1) | | | (60.6) | | | (56.0) | |
| Other income, net | 58.9 | | | 13.8 | | | 8.8 | |
| Other income (expense), net | |
| Income before income taxes | Income before income taxes | 648.5 | | | 375.4 | | | 337.5 | |
| Income tax provision | Income tax provision | (178.2) | | | (103.9) | | | (71.8) | |
| Net income | |
| Net income attributable to non-controlling interests | |
| Net income attributable to redeemable non-controlling interest | |
| Net income attributable to Lithia Motors, Inc. | |
| | Net income | $ | 470.3 | | | $ | 271.5 | | | $ | 265.7 | |
| | | Basic net income per share | $ | 19.74 | | | $ | 11.70 | | | $ | 10.91 | |
| | Basic earnings per share attributable to Lithia Motors, Inc. | |
| Basic earnings per share attributable to Lithia Motors, Inc. | |
| Basic earnings per share attributable to Lithia Motors, Inc. | |
| Shares used in basic per share calculations | Shares used in basic per share calculations | 23.8 | | | 23.2 | | | 24.4 | |
| | | Diluted net income per share | $ | 19.53 | | | $ | 11.60 | | | $ | 10.86 | |
| | Diluted earnings per share attributable to Lithia Motors, Inc. | |
| Diluted earnings per share attributable to Lithia Motors, Inc. | |
| Diluted earnings per share attributable to Lithia Motors, Inc. | |
| Shares used in diluted per share calculations | Shares used in diluted per share calculations | 24.1 | | | 23.4 | | | 24.5 | |
| | Cash dividends paid per Class A and Class B share | $ | 1.22 | | | $ | 1.19 | | | $ | 1.14 | |
| Cash dividends paid per share | |
| Cash dividends paid per share | |
| Cash dividends paid per share | |
See accompanying notes to consolidated financial statements.
| | CONSOLIDATED STATEMENTS OF COMPREHENSIVE INCOME | CONSOLIDATED STATEMENTS OF COMPREHENSIVE INCOME | CONSOLIDATED STATEMENTS OF COMPREHENSIVE INCOME |
| Year Ended December 31, | | | Year Ended December 31, |
| ($ in millions) | | ($ in millions) | 2023 | | 2022 | | 2021 |
| Net income | |
| Other comprehensive income (loss), net of tax: | |
| Foreign currency translation adjustment | |
| Foreign currency translation adjustment | |
| Foreign currency translation adjustment | |
| Pension plan net loss arising during the period, net of tax provision of $10.8, $0.0 and $0.0 | |
| Gain on cash flow hedges, net of tax provision of $0.0, $0.7 and $1.6 | |
| Total other comprehensive income (loss), net of tax | |
| Comprehensive income | |
| | Year Ended December 31, |
| (In millions) | 2020 | | 2019 | | 2018 |
| Net income | $ | 470.3 | | | $ | 271.5 | | | $ | 265.7 | |
| Other comprehensive loss, net of tax: | |
| Loss on cash flow hedges, net of tax benefit of $2.0, $0.3 and $0.0 | (5.6) | | | (0.7) | | | 0 | |
| Comprehensive income | $ | 464.7 | | | $ | 270.8 | | | $ | 265.7 | |
| Comprehensive income attributable to non-controlling interest | |
| Comprehensive income attributable to non-controlling interest | |
| Comprehensive income attributable to non-controlling interest | |
| Comprehensive income attributable to redeemable non-controlling interest | |
| Comprehensive income attributable to Lithia Motors, Inc. | |
See accompanying notes to consolidated financial statements.
| | | | | | | | | | | | | | | | | |
| CONSOLIDATED STATEMENTS OF CHANGES IN STOCKHOLDERS’ EQUITY |
| Year Ended December 31, |
| (In millions) | 2020 | | 2019 | | 2018 |
| Total stockholders’ equity, beginning balances | $ | 1,467.7 | | | $ | 1,197.2 | | | $ | 1,083.2 | |
| | | | | |
| Class A common stock: | | | | | |
| Beginning balances | 20.5 | | | 0 | | | 149.1 | |
| Compensation for stock and stock option issuances and excess tax benefits from option exercises | 11.6 | | | 12.7 | | | 9.3 | |
| Issuance of stock in connection with employee stock plans | 13.3 | | | 11.0 | | | 10.1 | |
| Class B common stock converted to class A common stock | 0.1 | | | — | | | — | |
| Repurchase of class A common stock | (34.4) | | | (3.2) | | | (168.5) | |
| Equity issuances, net of issuance costs | 777.1 | | | — | | | — | |
| Ending balances | 788.2 | | | 20.5 | | | 0 | |
| | | | | |
| Class B common stock: | | | | | |
| Beginning balances | 0.1 | | | 0.1 | | | 0.1 | |
| Class B common stock converted to class A common stock | (0.1) | | | — | | | — | |
| Ending balances | 0 | | | 0.1 | | | 0.1 | |
| | | | | |
| Additional paid-in capital: | | | | | |
| Beginning balances | 46.0 | | | 35.0 | | | 11.3 | |
| Compensation for stock and stock option issuances and excess tax benefits from option exercises | 11.6 | | | 3.5 | | | 4.1 | |
| Option premiums received | — | | | 7.5 | | | — | |
| Repurchase of class A common stock | (16.2) | | | 0 | | | 19.6 | |
| Ending balances | 41.4 | | | 46.0 | | | 35.0 | |
| | | | | |
| Accumulated other comprehensive loss: | | | | | |
| Beginning balances | (0.7) | | | 0 | | | 0 | |
| Loss on cash flow hedges, net of tax benefit of $2.0 and $0.3 | (5.6) | | | (0.7) | | | — | |
| Ending balances | (6.3) | | | (0.7) | | | 0 | |
| | | | | |
| Retained earnings: | | | | | |
| Beginning balances | 1,401.8 | | | 1,162.1 | | | 922.7 | |
Adjustment to adopt ASC 326 (2020), ASC 842 (2019), ASC 606 (2018) | (4.8) | | | 0.9 | | | 1.4 | |
| Net income | 470.3 | | | 271.5 | | | 265.7 | |
| Dividends paid | (29.1) | | | (27.6) | | | (27.7) | |
| Option premiums paid | — | | | (5.1) | | | — | |
| Ending balances | 1,838.2 | | | 1,401.8 | | | 1,162.1 | |
| | | | | |
| Total stockholders’ equity, ending balances | $ | 2,661.5 | | | $ | 1,467.7 | | | $ | 1,197.2 | |
| | | | | | | | | | | | | | | | | |
| CONSOLIDATED STATEMENTS OF EQUITY AND REDEEMABLE NON-CONTROLLING INTEREST |
| Year Ended December 31, |
| ($ in millions) | 2023 | | 2022 | | 2021 |
| Total equity, beginning balances | $ | 5,210.4 | | | $ | 4,629.2 | | | $ | 2,661.5 | |
| | | | | |
| Common stock, beginning balances | 1,082.1 | | | 1,711.6 | | | 788.2 | |
| Share-based compensation | 37.7 | | | 22.6 | | | 17.8 | |
| Issuance of stock in connection with employee stock purchase plans | 29.7 | | | 36.1 | | | 25.9 | |
| | | | | |
| Repurchase of common stock | (48.9) | | | (688.3) | | | (230.7) | |
| Equity issuances, net of issuance costs | — | | | — | | | 1,110.4 | |
| Common stock, ending balances | 1,100.6 | | | 1,082.1 | | | 1,711.6 | |
| | | | | |
| Additional paid-in capital, beginning balances | 76.8 | | | 58.3 | | | 41.4 | |
| Share-based compensation | 3.1 | | | 18.5 | | | 16.9 | |
| | | | | |
| | | | | |
| Additional paid-in capital, ending balances | 79.9 | | | 76.8 | | | 58.3 | |
| | | | | |
| Accumulated other comprehensive loss, beginning balances | (18.0) | | | (3.0) | | | (6.3) | |
| Foreign currency translation adjustment | 56.5 | | | (16.8) | | | (1.1) | |
| Pension plan net loss arising during the period, net of tax provision of $10.8, $0.0 and $0.0 | (18.4) | | | — | | | — | |
| Gain on cash flow hedges, net of tax provision of $0.0, $0.7 and $1.6 | — | | | 1.8 | | | 4.4 | |
| Accumulated other comprehensive income (loss), ending balances | 20.1 | | | (18.0) | | | (3.0) | |
| | | | | |
| Retained earnings, beginning balances | 4,065.3 | | | 2,859.5 | | | 1,838.2 | |
| | | | | |
| Net income attributable to Lithia Motors, Inc. | 1,000.8 | | | 1,251.0 | | | 1,060.1 | |
| Dividends paid | (52.8) | | | (45.2) | | | (38.8) | |
| | | | | |
| Retained earnings, ending balances | 5,013.3 | | | 4,065.3 | | | 2,859.5 | |
| | | | | |
| Non-controlling interest, beginning balances | 4.2 | | | 2.8 | | | — | |
| Net contributions (distributions) of non-controlling interest | 14.3 | | | (3.4) | | | 1.1 | |
| Net income attributable to non-controlling interest | 6.5 | | | 4.8 | | | 1.7 | |
| Non-controlling interest, ending balances | 25.0 | | | 4.2 | | | 2.8 | |
| | | | | |
| Total equity, ending balances | $ | 6,238.9 | | | $ | 5,210.4 | | | $ | 4,629.2 | |
| | | | | |
| Redeemable non-controlling interest, beginning balances | $ | 40.7 | | | $ | 34.0 | | | $ | — | |
| Net (distributions) contributions of redeemable non-controlling interest | (1.1) | | | 0.8 | | | 33.1 | |
| Net income attributable to redeemable non-controlling interest | 4.4 | | | 5.8 | | | 0.9 | |
| Redeemable non-controlling interest, ending balances | $ | 44.0 | | | $ | 40.7 | | | $ | 34.0 | |
See accompanying notes to consolidated financial statements.
| | CONSOLIDATED STATEMENTS OF CASH FLOWS | CONSOLIDATED STATEMENTS OF CASH FLOWS | CONSOLIDATED STATEMENTS OF CASH FLOWS |
| Year Ended December 31, |
| (In millions) | 2020 | | 2019 | | 2018 |
| Year Ended December 31, | | | Year Ended December 31, |
| ($ in millions) | | ($ in millions) | 2023 | | 2022 | | 2021 |
| Cash flows from operating activities: | Cash flows from operating activities: | | | | | |
| Net income | Net income | $ | 470.3 | | | $ | 271.5 | | | $ | 265.7 | |
| Adjustments to reconcile net income to net cash provided by operating activities: | |
| Net income | |
| Net income | |
| Adjustments to reconcile net income to net cash (used in) provided by operating activities: | |
| Asset impairments | |
| Asset impairments | |
| Asset impairments | Asset impairments | 7.9 | | | 2.6 | | | 1.3 | |
| Depreciation and amortization | Depreciation and amortization | 92.4 | | | 82.4 | | | 75.4 | |
| Stock-based compensation | 23.2 | | | 16.2 | | | 13.3 | |
| | (Gain) loss on disposal of other assets | (1.7) | | | (0.1) | | | 0.2 | |
| Gain from disposal activities | (16.6) | | | (9.7) | | | (15.1) | |
| Unrealized investment gains | (43.4) | | | 0 | | | 0 | |
| Share-based compensation | |
| Loss on redemption of senior notes | |
| Gain on disposal of other assets | |
| Net disposal gain on sale of stores | |
| Investment loss | |
| Deferred income taxes | Deferred income taxes | 17.2 | | | 40.1 | | | 33.0 | |
| | Amortization of operating lease right-of-use assets | Amortization of operating lease right-of-use assets | 28.9 | | | 31.6 | | | 0 | |
| (Increase) decrease (net of acquisitions and dispositions): | (Increase) decrease (net of acquisitions and dispositions): | |
| Trade receivables, net | Trade receivables, net | (113.5) | | | 24.4 | | | 4.7 | |
| Trade receivables, net | |
| Trade receivables, net | |
| Inventories | Inventories | 228.8 | | | (19.7) | | | (108.9) | |
| Finance receivables, net | |
| Other assets | Other assets | (103.6) | | | 5.4 | | | (16.0) | |
| | Increase (decrease) (net of acquisitions and dispositions): | Increase (decrease) (net of acquisitions and dispositions): | |
| Floor plan notes payable | |
| Floor plan notes payable | |
| Floor plan notes payable | Floor plan notes payable | (204.1) | | | 100.7 | | | 196.9 | |
| Trade payables | Trade payables | 28.2 | | | (1.8) | | | 15.1 | |
| Accrued liabilities | Accrued liabilities | 113.1 | | | (7.8) | | | 28.9 | |
| Other long-term liabilities and deferred revenue | Other long-term liabilities and deferred revenue | 15.1 | | | (11.3) | | | 25.2 | |
| Net cash provided by operating activities | 542.2 | | | 524.5 | | | 519.7 | |
| Net cash (used in) provided by operating activities | |
| Cash flows from investing activities: | Cash flows from investing activities: | |
| Notes receivable issued | (12.5) | | | (12.5) | | | 0 | |
| Principal payments received on notes receivable | 25.0 | | | 0 | | | 0 | |
| | Capital expenditures | |
| | Capital expenditures | |
| | Capital expenditures | Capital expenditures | (167.8) | | | (124.9) | | | (158.0) | |
| Proceeds from sales of assets | Proceeds from sales of assets | 6.5 | | | 1.5 | | | 3.1 | |
| Cash paid for other investments | Cash paid for other investments | (11.2) | | | (7.2) | | | (62.7) | |
| Cash paid for acquisitions, net of cash acquired | Cash paid for acquisitions, net of cash acquired | (1,503.3) | | | (366.6) | | | (373.8) | |
| Proceeds from sales of stores | Proceeds from sales of stores | 57.5 | | | 46.7 | | | 34.3 | |
| Net cash used in investing activities | Net cash used in investing activities | (1,605.8) | | | (463.0) | | | (557.1) | |
| Cash flows from financing activities: | Cash flows from financing activities: | |
| Repayments on floor plan notes payable: non-trade, net | (20.6) | | | (54.6) | | | (21.9) | |
| Borrowings (repayments) on floor plan notes payable: non-trade, net | |
| Borrowings (repayments) on floor plan notes payable: non-trade, net | |
| Borrowings (repayments) on floor plan notes payable: non-trade, net | |
| Borrowings on lines of credit | Borrowings on lines of credit | 1,825.4 | | | 3,167.0 | | | 2,691.4 | |
| Repayments on lines of credit | Repayments on lines of credit | (1,935.4) | | | (3,481.6) | | | (2,499.6) | |
| Principal payments on long-term debt, scheduled | (29.4) | | | (26.0) | | | (26.5) | |
| Principal payments on long-term debt and finance lease liabilities, scheduled | |
| Principal payments on long-term debt and finance lease liabilities, other | Principal payments on long-term debt and finance lease liabilities, other | (6.3) | | | (11.0) | | | (26.1) | |
| Proceeds from issuance of long-term debt | Proceeds from issuance of long-term debt | 606.5 | | | 420.3 | | | 62.1 | |
| Principal payments on non-recourse notes payable | |
| Proceeds from issuance of non-recourse notes payable | |
| Payment of debt issuance costs | Payment of debt issuance costs | (10.8) | | | (5.8) | | | (0.4) | |
| Proceeds from issuance of common stock | Proceeds from issuance of common stock | 790.4 | | | 11.0 | | | 10.1 | |
| Repurchase of common stock | Repurchase of common stock | (50.6) | | | (3.2) | | | (148.9) | |
| | Dividends paid | Dividends paid | (29.1) | | | (27.6) | | | (27.7) | |
| Payments of contingent consideration related to acquisitions | Payments of contingent consideration related to acquisitions | (0.3) | | | 0 | | | (0.8) | |
| Other financing activity | 0 | | | 2.4 | | | 0 | |
| | Net cash provided by (used in) financing activities | 1,139.7 | | | (9.1) | | | 11.7 | |
| Increase (decrease) in cash and cash equivalents | 76.2 | | | 52.4 | | | (25.7) | |
| Cash and cash equivalents at beginning of year | 84.0 | | | 31.6 | | | 57.3 | |
| Cash and cash equivalents at end of year | $ | 160.2 | | | $ | 84.0 | | | $ | 31.6 | |
| Supplemental disclosure of cash flow information: | | | | | |
| Cash paid during the period for interest | $ | 107.7 | | | $ | 135.8 | | | $ | 117.1 | |
| Cash paid during the period for income taxes, net | 135.0 | | | 38.4 | | | 32.9 | |
| Floor plan debt paid in connection with store disposals | 38.4 | | | 18.6 | | | 33.1 | |
| Supplemental schedule of non-cash activities: | |
| Debt issued in connection with acquisitions | $ | 0 | | | $ | 26.4 | | | $ | 125.1 | |
| | Contingent consideration in connection with acquisitions | 14.3 | | | 0 | | | 0 | |
| Debt assumed in connection with acquisitions | 0 | | | 0 | | | 10.8 | |
| Acquisition of finance leases in connection with acquisitions | 227.5 | | | 0 | | | 0 | |
| Right-of-use assets obtained in exchange for lease liabilities1 | 55.4 | | | 260.3 | | | — | |
| Other financing activities | |
| Net cash provided by financing activities | |
| Effect of exchange rate changes on cash and restricted cash | |
| Increase in cash and restricted cash | |
| Cash and restricted cash at beginning of year | |
| Cash and restricted cash at end of year | |
| | | | | | | | | | | | | | | | | |
| SUPPLEMENTAL DISCLOSURES OF CASH FLOW INFORMATION |
| Year Ended December 31, |
| ($ in millions) | 2023 | | 2022 | | 2021 |
| Reconciliation of cash and restricted cash to the consolidated balance sheets |
| Cash | $ | 825.0 | | | $ | 168.1 | | | $ | 153.0 | |
| Restricted cash from collections on auto loans receivable | 116.4 | | | 78.6 | | | 21.8 | |
| Cash and restricted cash | 941.4 | | | 246.7 | | | 174.8 | |
| Restricted cash on deposit in reserve accounts, included in other non-current assets | 30.6 | | | 24.8 | | | 3.7 | |
| Total cash and restricted cash reported in the Consolidated Statements of Cash Flows | $ | 972.0 | | | $ | 271.5 | | | $ | 178.5 | |
| | | | | |
| Supplemental cash flow information: | | | | | |
| Cash paid during the period for interest | $ | 514.3 | | | $ | 209.9 | | | $ | 130.1 | |
| Cash paid during the period for income taxes, net | 222.1 | | | 449.3 | | | 369.1 | |
| Floor plan debt paid in connection with store disposals | 27.4 | | | 29.5 | | | 8.7 | |
| | | | | |
| Non-cash activities: | | | | | |
| Debt issued in connection with acquisitions | $ | — | | | $ | — | | | $ | 355.6 | |
| | | | | |
| Contingent consideration in connection with acquisitions | 7.3 | | | 22.4 | | | 0.9 | |
| Debt assumed in connection with acquisitions | 401.6 | | | 0.7 | | | 4.0 | |
| Acquisition of finance leases in connection with acquisitions | 45.0 | | | 78.2 | | | — | |
| | | | | |
| Non-controlling interest recognized in connection with acquisitions | 21.1 | | | — | | | 33.1 | |
| Right-of-use assets obtained in exchange for lease liabilities | 150.0 | | | 44.7 | | | 171.8 | |
| | | | | |
1Amounts for the twelve months ended December 31, 2019 include the transition adjustment for the adoption of Topic 842.
See accompanying notes to consolidated financial statements.
| | | | | | | | | | | | | | |
| | FINANCIAL STATEMENTS | F-9F-10 | |
NOTES TO CONSOLIDATED FINANCIAL STATEMENTS
NoteNOTE 1. Summary of Significant Accounting PoliciesSUMMARY OF SIGNIFICANT ACCOUNTING POLICIES
Organization and Business
We are onea global automotive retailer, offering a wide selection of vehicles across global carmakers and providing a full suite of financing, leasing, repair, and maintenance options. In 2023, we were ranked 145 on the largest automotive retailersFortune 500. As of December 31, 2023, we operated 344 locations representing 47 brands in the United States, Canada, and are among the fastest growing companies in the Fortune 500 (#252-2020) with 210 stores representing 33 brands in 21 states.United Kingdom. We offer vehicles online and through our nationwide retail network.comprehensive network of locations, e-commerce platforms, and captive finance division. Our “Growth Powered by People” strategy drives us to innovate and continuously improve the customer experience.experience, providing consumer optionality to interact wherever, whenever, and however they desire.
Basis of Presentation
The accompanying Consolidated Financial Statements reflect the results of operations, the financial position and the cash flows for Lithia Motors, Inc. and its directly and indirectly wholly-owned subsidiaries. All intercompany balances and transactions have been eliminated in consolidation.
Cash and Restricted Cash Equivalents
Cash and cash equivalents areis defined as cash on hand and cash in bank accounts without restrictions. Restricted cash consisted of collections of principal, interest and fee payments on auto loans receivable that are restricted for repayment on borrowings on our securitization facilities before being unrestricted.
Accounts Receivable
Accounts receivable classifications include the following:
•Contracts in transit are receivables from various lenders for the financing of vehicles that we have arranged on behalf of the customer and are typically received within five to 10 days of selling a vehicle.
•Trade receivables are comprised of amounts due from customers, lenders for the commissions earned on financing and others for commissions earned on service contracts and insurance products.
•Vehicle receivables represent receivables for the portion of the vehicle sales price paid directly by the customer.
•Manufacturer receivables represent amounts due from manufacturers, including holdbacks, rebates, incentives and warranty claims.
•
Auto loan receivables include amounts due from customers
Receivables are recorded at invoice and do not bear interest until they are 60 days past due. The historical losses related to retail salesthese balances are immaterial.The long-term portion of vehicles and certain finance and insurance products.accounts receivable was included as a component of other non-current assets in the Consolidated Balance Sheets. See Note 2 – Accounts Receivable.
Finance Receivables
Finance receivables consist of auto loan and lease contracts originated through our Financing Operations, which are secured by the vehicles we sell. Interest income on auto loanfinance receivables is recognized based on the contractual terms of each loan and is accrued until repayment, reaching non-accrual status, charge-off, or repossession. Direct costs associated with loan originations are capitalized and expensed as an offset to interest income when recognized on the loans. All other receivables are recorded at invoice and do not bear interest until they are 60 days past due.
The balance of auto loan receivables is made up primarily of loans secured by the related vehicle. More than 95%98% of the portfolio is aged less than 60 days past due with less than 5%2% on non-accrual status. As of December 31, 2020,2023, the allowance for credit losses related to auto loan and lease receivables was $12.9$106.4 million and was included in allowance for doubtful accounts and other non-current assets.finance receivables, net. In accordance with Topic 326, the allowance for loan losses is estimated based on our historical write-off experience, current conditions and reasonable and supportable forecasts as well as the value of any underlying assets securing these loans and is reviewed monthly. Consideration is given to recent delinquency trends and recovery rates. Account balances are charged against the allowance upon the earlier of reaching 120 days past due status. The annual activity for charges and subsequent recoveriesstatus, the repossession of the vehicle, or the determination that the account is immaterial. The remainder of our receivables are due primarily from manufacturer partners and various third-party lenders. The historical losses related to these balances are immaterial.uncollectible. See Note 5 – Finance Receivables.
The long-term portion of accounts receivable was included as a component of other non-current assets in the Consolidated Balance Sheets. See Note 2. | | | | | | | | | | | | | | |
| | NOTES TO FINANCIAL STATEMENTS | F-11 | |
Inventories
Inventories are valued at the lower of net realizable value or cost, using the specific identification method for new vehicles, pooled approach forand used vehicles, and the lower of cost (first-in, first-out) or market method for parts. The cost of new and used vehicle inventories includes the cost of any equipment added, reconditioning and transportation. Certain acquired inventories are valued using the last-in first-out (LIFO) method. The LIFO reserve associated with this inventory as of December 31, 2020 and 2019 was immaterial.
| | | | | | | | | | | | | | |
| | NOTES TO FINANCIAL STATEMENTS | F-10 | |
Manufacturers reimburse us for holdbacks, floor plan interest assistance and advertising assistance, which are reflected as a reduction in the carrying value of each vehicle purchased. We recognize advertising assistance, floor plan interest assistance, holdbacks, cash incentives and other rebates received from manufacturers that are tied to specific vehicles as a reduction to cost of sales as the related vehicles are sold.
Parts purchase discounts that we receive from the manufacturer are reflected as a reduction in the carrying value of the parts purchased from the manufacturer and are recognized as a reduction to cost of goods sold as the related inventory is sold. See Note 3.3 – Inventories and Floor Plan Notes Payable.
Property and Equipment
Property and equipment are stated at cost and depreciated over their estimated useful lives on the straight-line basis. Leasehold improvements made at the inception of the lease or during the term of the lease are amortized on a straight-line basis over the shorter of the life of the improvement or the remaining term of the lease.
The range of estimated useful lives is as follows:
| | | | | |
| Buildings and improvements | 5 to 40 years |
| Service equipment | 5 to 15 years |
| Furniture, office equipment, signs and fixtures | 3 to 10 years |
The cost for maintenance, repairs and minor renewals is expensed as incurred, while significant remodels and betterments are capitalized. In addition, interest on borrowings for major capital projects, significant remodels, and betterments is capitalized. Capitalized interest becomes a part of the cost of the depreciable asset and is depreciated according to the estimated useful lives as previously stated. For the years ended December 31, 2020, 20192023, 2022 and 2018,2021, we recorded capitalized interest of $1.6$2.6 million, $2.3$2.6 million and $1.3$2.0 million, respectively.
When an asset is retired, or otherwise disposed of, the related cost and accumulated depreciation are removed from the accounts and any gain or loss is credited or charged to income from operations.
Leased property meeting certain criteria are recorded as finance leases. We have finance leases for certain locations, expiring at various dates through August 31, 2037. Our finance lease right-of-use assets are included in property and equipment on our Consolidated Balance Sheets. Amortization of finance lease right-of-use assets is computed on a straight-line basis over the term of the lease, unless the lease transfers title or it contains a bargain purchase option, in which case, it is amortized over the asset’s useful life and is included in depreciation expense. Finance lease liabilities are recorded as the lesser of the estimated fair market value of the leased property or the net present value of the aggregated future minimum payments and are included in current maturities of long-term debt and long-term debt on our Consolidated Balance Sheets. Interest associated with these obligations is included in other interest expense in the Consolidated Statements of Operations. See Note 78 – Commitments and Note 11.Contingencies.
Long-lived assets held and used by us are reviewed for impairment whenever events or circumstances indicate that the carrying amount of assets may not be recoverable. We consider several factors when evaluating whether there are indications of potential impairment related to our long-lived assets, including store profitability, overall macroeconomic factors and the impact of our strategic management decisions. If recoverability testing is performed, we evaluate assets to be held and used by comparing the carrying amount of an asset to future net undiscounted cash flows associated with the asset, including its disposition. If such assets are considered to be impaired, the amount by which the carrying amount of the assets exceeds the fair value of the assets is recognized as a charge to income from operations. See Note 4.4 – Property and Equipment.
Goodwill
Goodwill represents the excess purchase price over the fair value of net assets acquired which is not allocable to separately identifiable intangible assets. Other identifiable intangible assets, such as franchise rights, are separately
| | | | | | | | | | | | | | |
| | NOTES TO FINANCIAL STATEMENTS | F-12 | |
recognized if the intangible asset is obtained through contractual or other legal right or if the intangible asset can be sold, transferred, licensed or exchanged.
Goodwill is not amortized but tested for impairment at least annually, and more frequently if events or circumstances indicate the carrying amount of the reporting unit more likely than not exceeds fair value. We have the option to qualitatively or quantitatively assess goodwill for impairment, and we evaluated our goodwill using a qualitative
| | | | | | | | | | | | | | |
| | NOTES TO FINANCIAL STATEMENTS | F-11 | |
assessment process. Goodwill is tested for impairment at the reporting unit level. Our reporting units are individual stores as this is the level at which discrete financial information is available and for which operating results are regularly reviewed by our chief operating decision maker to allocate resources and assess performance.
impairment. We test our goodwill for impairment on October 1 of each year. In 2020,2023, we evaluated our goodwill using a qualitative assessment process. If the qualitative factors determine that it is more likely than not that the fair value of the reporting unit exceeds the carrying amount, goodwill is not impaired. If the qualitative assessment determines it is more likely than not the fair value is less than the carrying amount, we would further evaluate for potential impairment. We have determined the appropriate unit of accounting for testing goodwill for impairment is at our reporting unit levels: North America Vehicle Operations, United Kingdom Vehicle Operations, and US and Canada Financing Operations. See Note 56 – Goodwill and Franchise Value and Note 13.14 – Fair Value Measurements.
Franchise Value
We enter into agreements (Franchise Agreements)(franchise agreements) with our manufacturers. Franchise value represents a right received under Franchise Agreementsfranchise agreements with manufacturers and is identified on an individual store basis.
We evaluated the useful lives of our Franchise Agreementsfranchise agreements based on the following factors:
•certain of our Franchise Agreementsfranchise agreements continue indefinitely by their terms;
•certain of our Franchise Agreementsfranchise agreements have limited terms, but are routinely renewed without substantial cost to us;
•other than franchise terminations related to the unprecedented reorganizations of Chrysler and General Motors, and allowed by bankruptcy law, we are not aware of manufacturers terminating Franchise Agreementsfranchise agreements against the wishes of the franchise owners in the ordinary course of business. A manufacturer may pressure a franchise owner to sell a franchise when the owner is in breach of the franchise agreement over an extended period of time;
•state dealership franchise laws typically limit the rights of the manufacturer to terminate or not renew a franchise;
•we are not aware of any legislation or other factors that would materially change the retail automotive franchise system; and
•as evidenced by our acquisition and disposition history, there is an active market for most automotive dealership franchises within the United States. We attribute value to the Franchise Agreementsfranchise agreements acquired with the dealerships we purchase based on the understanding and industry practice that the Franchise Agreementsfranchise agreements will be renewed indefinitely by the manufacturer.
Accordingly, we have determined that our Franchise Agreementsfranchise agreements will continue to contribute to our cash flows indefinitely and, therefore, have indefinite lives.
As an indefinite-lived intangible asset, franchise value is tested for impairment at least annually, and more frequently if events or circumstances indicate the carrying value may exceed fair value. The impairment test for indefinite-lived intangible assets requires the comparison of estimated fair value to carrying value. An impairment charge is recorded to the extent the fair value is less than the carrying value. We have the option to qualitatively or quantitatively assess indefinite-lived intangible assets for impairment. We evaluated our indefinite-lived intangible assets using a qualitative assessment process. We have determined the appropriate unit of accounting for testing franchise value for impairment is each individual store.
We test our franchise value for impairment on October 1 of each year. In 2020,2023, we evaluated our franchise value using a qualitative assessment process. If the qualitative factors discussed above determine that it is more likely than not that the fair value of the individual store’s franchise value exceeds the carrying amount, the franchise value is not impaired and the second step is not necessary. If the qualitative assessment determines it is more likely than not the fair value is less than the carrying value, then a quantitative valuation of our franchise value is performed and an impairment would be recorded. See Note 56 – Goodwill and Franchise Value and Note 13.14 – Fair Value Measurements.
Variable Interest Entities and Securitization Transactions
We maintain a revolving funding program composed of warehouse facilities that we use to fund auto loans receivable originated by our Financing Operations.
| | | | | | | | | | | | | | |
| | NOTES TO FINANCIAL STATEMENTS | F-12F-13 | |
We use term securitizations to provide long-term funding for most of the auto loans receivable initially funded through the warehouse facilities. In these transactions, a pool of auto loans receivable is sold to a bankruptcy-remote, special purpose entity that, in turn, transfers the receivables to a special purpose securitization trust. The securitization trust issues asset-backed securities, secured or otherwise supported by the transferred receivables, and the proceeds from the sale of the asset-backed securities are used to finance the securitized receivables.
The securitization trusts established in connection with asset-backed securitization transactions are variable interest entities (VIEs). We are required to evaluate term securitization trusts for consolidation. In our capacity as servicer, we have the power to direct the activities of the trusts that most significantly impact the economic performance of the trusts. In addition, we have the obligation to absorb losses (subject to limitations) and the rights to receive any returns of the trusts, which could be significant. Accordingly, we are the primary beneficiary of the trusts and are required to consolidate them.
We recognize these term securitizations as secured borrowings, which result in recording the auto loans receivable and the related non-recourse notes payable on our consolidated balance sheets.
These receivables can only be used as collateral to settle obligations of the related non-recourse funding vehicles. The non-recourse funding vehicles and investors have no recourse to our assets beyond the related receivables, the amounts on deposit in reserve accounts and the restricted cash from collections on auto loan receivables. We have not provided financial or other support to the non-recourse funding vehicles that was not previously contractually required, and there are no additional arrangements, guarantees or other commitments that could require us to provide financial support to the non-recourse funding vehicles.
See Note 2 – Accounts Receivable, Note 5 – Finance Receivables, and Note 9 – Credit Facilities and Long-Term Debt for additional information on auto loans receivable and non-recourse notes payable.
Restricted Cash on Deposit in Reserve Accounts
The restricted cash on deposit in reserve accounts is for the benefit of holders of non-recourse notes payable, and these funds are not expected to be available to the company or its creditors. In the event that the cash generated by the related receivables in a given period was insufficient to pay the interest, principal and other required payments, the balances on deposit in the reserve accounts would be used to pay those amounts. Restricted cash on deposit in reserve accounts is invested in money market securities.
Advertising
We expense production and other costs of advertising as incurred as a component of selling, general and administrative expense. Additionally, manufacturer cooperative advertising credits for qualifying, specifically-identified advertising expenditures are recognized as a reduction of advertising expense. Advertising expense and manufacturer cooperative advertising credits were as follows:
| | Year Ended December 31, |
| (Dollars in millions) | | 2020 | | 2019 | | 2018 |
| | Year Ended December 31, | | | | Year Ended December 31, |
| ($ in millions) | | ($ in millions) | | 2023 | | 2022 | | 2021 |
| Advertising expense, gross | Advertising expense, gross | | $ | 121.3 | | | $ | 139.8 | | | $ | 134.2 | |
| Manufacturer cooperative advertising credits | Manufacturer cooperative advertising credits | | (23.9) | | | (27.9) | | | (25.5) | |
| Advertising expense, net | Advertising expense, net | | $ | 97.4 | | | $ | 111.9 | | | $ | 108.7 | |
Contract Origination Costs
Contract origination commissions paid to our employees directly related to the sale of our self-insured lifetime lube, oil and filter service contracts and auto loan receivable originations are deferred and charged to expense in proportion to the associated revenue to be recognized.
Legal Costs
We are a party to numerous legal proceedings arising in the normal course of business. We accrue for certain legal costs, including attorney fees and potential settlement claims related to various legal proceedings that are estimable and probable. See Note 7.8 – Commitments and Contingencies.
| | | | | | | | | | | | | | |
| | NOTES TO FINANCIAL STATEMENTS | F-14 | |
Share-Based Compensation
Compensation costs associated with equity instruments exchanged for employee and director services are measured at the grant date, based on the fair value of the award. If there is a performance-based element to the award, the expense is recognized based on the estimated attainment level, estimated time to achieve the attainment level and/or the vesting period. Estimates of fair value are not intended to predict actual future events or the value ultimately realized by persons who receive equity awards. The fair value of non-vested stockshare-based awards is based on the closing price of our common stock on the date of grant. We account for forfeitures of share-based awards as they occur. See Note 10.13 – Share-based Compensation Plans.
Income and Other Taxes
Income taxes are accounted for under the asset and liability method. Deferred tax assets and liabilities are recognized for the future tax consequences attributable to differences between the financial statement carrying amounts of existing assets and liabilities, their respective tax bases, operating loss and tax credit carryforwards. Deferred tax assets and liabilities are measured using enacted tax rates expected to apply to taxable income in the years in which those temporary differences are expected to be recovered or settled. The effect on deferred tax assets and liabilities of a change in tax rates is recognized in income in the period that includes the enactment date. A valuation allowance, if needed, reduces deferred tax assets when it is more likely than not that some or all of the deferred tax assets will not be realized.
When there are situations with uncertainty as to the timing of the deduction, the amount of the deduction, or the validity of the deduction, we adjust our financial statements to reflect only those tax positions that are more-likely-than-not to be sustained. Positions that meet this criterion are measured using the largest benefit that is more than 50% likely to be realized. Interest and penalties are recorded as income tax provision in the period incurred or accrued when related to an uncertain tax position. See Note 14.15 – Income Taxes.
We account for all taxes assessed by a governmental authority that are directly imposed on a revenue-producing transaction (i.e., sales, use, value-added) on a net (excluded from revenues) basis.
Concentration of Risk and Uncertainties
We purchase substantially all of our new vehicles and inventory from various manufacturers at the prevailing prices charged by auto manufacturers to all franchised dealers. Our overall sales could be impacted by the auto manufacturers’ inability or unwillingness to supply dealerships with an adequate supply of popular models.
We depend on our manufacturers to provide a supply of vehicles which supports expected sales levels. In the event that manufacturers are unable to supply the needed level of vehicles, our financial performance may be adversely impacted.
| | | | | | | | | | | | | | |
| | NOTES TO FINANCIAL STATEMENTS | F-13 | |
We depend on our manufacturers to deliver high-quality, defect-free vehicles. In the event that manufacturers experience future quality issues, our financial performance may be adversely impacted.
We are subject to a concentration of risk in the event of financial distress, including potential reorganization or bankruptcy, of a major vehicle manufacturer. Our sales volume could be materially adversely impacted by the manufacturers’ or distributors’ inability to supply the stores with an adequate supply of vehicles. We also receive incentives and rebates from our manufacturers, including cash allowances, financing programs, discounts, holdbacks and other incentives. These incentives are recorded as accounts receivable in our Consolidated Balance Sheets until payment is received. Our financial condition could be materially adversely impacted by the manufacturers’ or distributors’ inability to continue to offer these incentives and rebates at substantially similar terms, or to pay our outstanding receivables.
We enter into Franchise Agreementsfranchise agreements with the manufacturers. The Franchise Agreementsfranchise agreements generally limit the location of the dealership and provide the auto manufacturer approval rights over changes in dealership management and ownership. The auto manufacturers are also entitled to terminate the Franchise Agreementfranchise agreement if the dealership is in material breach of the terms. Our ability to expand operations depends, in part, on obtaining consents of the manufacturers for the acquisition of additional dealerships. See also “Goodwill” and “Franchise Value” above.
We have a variety of syndicated credit facilityfacilities with a syndicateseveral of 19 financial institutions, including 7 manufacturer-affiliated finance companies. Several of thesethe included financial institutions also provideproviding vehicle financing for certain new vehicles, vehicles that are designated for use as service loaners and mortgage financing. ThisThese credit facility isfacilities are the primary source of floor plan financing for our new vehicle inventory and also
| | | | | | | | | | | | | | |
| | NOTES TO FINANCIAL STATEMENTS | F-15 | |
provides used vehicle financing and a revolving line of credit. The termterms of the facilityfacilities extends through January 2025.various dates through April 2026. At maturity, our financial condition could be materially adversely impacted if lenders are unable to provide credit that has typically been extended to us or with terms unacceptable to us. Our financial condition could be materially adversely impacted if these providers incur losses in the future or undergo funding limitations. See Note 6.9 – Credit Facilities and Long-Term Debt.
We anticipate continued organic growth and growth through acquisitions. This growth will require additional credit which may be unavailable or with terms unacceptable to us. If these events were to occur, we may not be able to borrow sufficient funds to facilitate our growth.
Use of Estimates
The preparation of financial statements in conformity with U.S.United States generally accepted accounting principles requires management to make estimates and assumptions that affect the amounts reported in the Consolidated Financial Statements and related notes to financial statements. Changes in such estimates may affect amounts reported in future periods.
Estimates are used in the calculation of certain reserves maintained for charge-backs on estimated cancellations of service contracts; life, accident and disability insurance policies; finance fees from customer financing contracts and uncollectible accounts receivable.
Estimates are also used in our allowance for loan and lease losses, which represents the net credit losses expected over the remaining contractual life of our finance receivables. Because net loss performance can vary substantially over time, estimating net losses requires assumptions about matters that are uncertain. The allowance for loan and lease losses is determined using a net loss timing curve, primarily based on the composition of the portfolio of managed receivables and historical gross loss and recovery trends. Determining the appropriateness of the allowance for loan and lease losses requires management to exercise judgement about matters that are inherently uncertain, including the timing and distribution of net losses that could materially affect the allowance or loan and lease losses and, therefore, net earnings.
We also use estimates in the calculation of various expenses, accruals and reserves, including anticipated losses related to workers’ compensation insurance; anticipated losses related to self-insurance components of our property and casualty and medical insurance; self-insured lifetime lube, oil and filter service contracts; discretionary employee bonuses, the Transition Agreement with Sidney B. DeBoer, our Chairman of the Board; warranties provided on certain products and services; legal reserves and stock-basedshare-based compensation. We also make certain estimates regarding the assessment of the recoverability of long-lived assets, indefinite-lived intangible assets and deferred tax assets.
We offer a limited warranty on the sale of most retail used vehicles. This warranty is based on mileage and time. We also offer a mileage and time based warranty on parts used in our service repair work and on tire purchases. The cost that may be incurred for these warranties is estimated at the time the related revenue is recorded. A reserve for these warranty liabilities is estimated based on current sales levels, warranty experience rates and estimated costs per claim. The annual activity for reserve increases and claims is immaterial. As of December 31, 2020 and 2019, the accrued warranty balance was $0.5 million and $0.6 million, respectively.
| | | | | | | | | | | | | | |
| | NOTES TO FINANCIAL STATEMENTS | F-14 | |
Fair Value of Assets Acquired and Liabilities Assumed
We estimate the fair value of the assets acquired and liabilities assumed in a business combination using various assumptions. The most significant assumptions used relate to determining the fair value of property and equipment and intangible franchise rights.
We estimate the fair value of property and equipment based on a market valuation approach. We use prices and other relevant information generated primarily by recent market transactions involving similar or comparable assets, as well as our historical experience in divestitures, acquisitions and real estate transactions. Additionally, we may use a cost valuation approach to value long-lived assets when a market valuation approach is unavailable. Under this approach, we determine the cost to replace the service capacity of an asset, adjusted for physical and economic obsolescence. When available, we use valuation inputs from independent valuation experts, such as real estate appraisers and brokers, to corroborate our estimates of fair value.
We estimate the fair value of our franchise rights primarily using the Multi-Period Excess Earnings (MPEE) model. The forecasted cash flows used in the MPEE model contain inherent uncertainties, including significant estimates
| | | | | | | | | | | | | | |
| | NOTES TO FINANCIAL STATEMENTS | F-16 | |
and assumptions related to growth rates, margins, general operating expenses, and cost of capital. We use primarily internally-developed forecasts and business plans to estimate the future cash flows that each franchise will generate. We have determined that only certain cash flows of the store are directly attributable to the franchise rights. We estimate the appropriate interest rate to discount future cash flows to their present value equivalent taking into consideration factors such as a risk-free rate, a peer group average beta, an equity risk premium and a small stock risk premium. Additionally, we also may use a market approach to determine the fair value of our franchise rights. These market data points include our acquisition and divestiture experience and third-party broker estimates.
We use a relief-from-royalty method to determine the fair value of a trade name. Future cost savings associated with owning, rather than licensing, a trade name is estimated based on a royalty rate and management’s forecasted sales projections. The discount rate applied to the future cost savings factors an equity market risk premium, small stock risk premium, an average peer group beta, a risk-free interest rate and a premium for forecast risk.
Revenue Recognition
The following describes our major product lines, which represent the disaggregation of our revenues to transactions that are similar in nature, amount, timing, uncertainties and economic factors.
New Retail Vehicle and Used Retail Vehicle Sales
Revenue from the retail sale of a vehicle is recognized at a point in time, as all performance obligations are satisfied when a contract is signed by the customer, financing has been arranged or collectibility is probable and the control of the vehicle is transferred to the customer. The transaction price for a retail vehicle sale is specified in the contract with the customer and includes all cash and non-cash consideration. In a retail vehicle sale, customers often trade in their current vehicle. The trade-in is measured at its stand-alone selling price in the contract, utilizing various third-party pricing sources. There are no other non-cash forms of consideration related to retail sales. All vehicle rebates are applied to the vehicle purchase price at the time of the sale and are therefore incorporated into the price of the contract at the time of the exchange. We do not allow the return of new or used vehicles, except where mandated by state law.
Service, Body and Parts Sales
Revenue from service, body and parts sales is recognized upon the transfer of control of the parts or service to the customer. We allow for customer returns on sales of our parts inventory up to 30 days after the sale. Most parts returns generally occur within one to two weeks from the time of sale and are not significant.
We are the obligor on our lifetime oil contracts. Revenue is allocated to these performance obligations and is recognized over time as services are provided to the customer. The amount of revenue recognized is calculated, net of cancellations, using an input method, which most closely depicts performance of the contracts. Our contract liability balances were $194.1$317.0 million and $171.5$284.3 million as of December 31, 2020,2023, and December 31, 2019,2022, respectively; and we recognized $31.1$55.2 million and $25.9$44.6 million of revenue in the years ended December 31, 2020,2023, and December 31, 2019,2022, respectively, related to our opening contract liability balances. Our contract liability balance is included in accrued liabilities and deferred revenue.
| | | | | | | | | | | | | | |
| | NOTES TO FINANCIAL STATEMENTS | F-15 | |
Finance and Insurance Sales
Revenue from finance and insurance sales is recognized, net of estimated charge-backs, at the time of the sale of the related vehicle. As a part of the vehicle sale, we seek to arrange financing for customers and sell a variety of add-ons, such as extended warranty service contracts. These products are inherently attached to the governing vehicle and performance of the obligation cannot be performed without the underlying sale of the vehicle. We act as an agent in the sale of these contracts as the pricing is set by the third-party provider, and our commission is preset. A portion of the transaction price related to sales of finance and insurance contracts is considered variable consideration and is estimated and recognized upon the sale of the contract under the new standard. Our contract asset balance was $8.2$11.8 million and $8.9$12.5 million as of December 31, 2020,2023, and December 31, 2019,2022, respectively; and is included in trade receivables and other non-current assets.
Segment ReportingRecent Accounting Pronouncements
While we have determined that each individual store is a reporting unit, we have aggregatedIn November 2023, the Financial Accounting Standards Board (FASB) issued an accounting standards update (ASU) 2023-07 related to improvements to reportable segment disclosures. The amendments in this update require additional disclosure of significant expenses related to our reporting units into 3 reportable segments, basedadditional segment disclosures on their economic similarities: Domestic, Importan interim basis, and Luxury.qualitative disclosures regarding the decision making process for segment resources. The amendments in this update are effective for fiscal years beginning after December 15, 2023, and interim periods within fiscal years beginning after December 15, 2024. We plan to adopt this pronouncement and make the necessary updates to our segment disclosures for the year ended December 31, 2024, and aside from these disclosure changes, we do not expect the amendments to have a material effect on our financial statements.
Our Domestic segment is comprised of retail automotive franchises that sell new vehicles manufactured by Chrysler, General Motors and Ford. Our Import segment is comprised of retail automotive franchises that sell new vehicles manufactured primarily by Honda, Toyota, Subaru, Nissan and Volkswagen. Our Luxury segment is comprised of retail automotive franchises that sell new vehicles manufactured primarily by BMW, Mercedes-Benz and Lexus. The franchises in each segment also sell used vehicles, parts and automotive services, and automotive finance and insurance products.
Corporate and other revenue and income include the results of operations of our stand-alone collision center offset by unallocated corporate overhead expenses, such as corporate personnel costs, and certain unallocated reserve and elimination adjustments. Additionally, certain internal corporate expense allocations increase segment income for Corporate and other while decreasing segment income for the other operating segments. These internal corporate expense allocations are used to increase comparability of our dealerships and reflect the capital burden a stand-alone dealership would experience. Examples of these internal allocations include internal rent expense, internal floor plan financing charges, and internal fees charged to offset employees within our corporate headquarters that perform certain dealership functions.
We define our chief operating decision maker (CODM) to be certain members of our executive management group. Historical and forecasted operational performance is evaluated on a store-by-store basis and on a consolidated basis by the CODM. We derive the operating results of the segments directly from our internal management reporting system. The accounting policies used to derive segment results are substantially the same as those used to determine our consolidated results, except for the internal allocation within Corporate and other discussed above. Our CODM does not regularly review capital expenditures on a reporting unit level. Performance measurement of each reportable segment by the CODM is based on several metrics, including earnings from operations. The CODM uses these results, in part, to evaluate the performance of, and to allocate resources, mainly with expected inventory and working capital requirements, to each of the reportable segments. See Note 17.
Reclassifications
Certain immaterial reclassifications of amounts previously reported have been made to the accompanying Consolidated Financial Statements to maintain consistency and comparability between periods presented. We reclassified certain components within cash provided by operating activities and cash provided by investing activities within the Consolidated Statements of Cash Flows.
| | | | | | | | | | | | | | |
| | NOTES TO FINANCIAL STATEMENTS | F-16F-17 | |
In December 2023, the FASB issued ASU 2023-09 related to improvements to income tax disclosures. The amendments in this update require enhanced jurisdictional and other disaggregated disclosures for the effective tax rate reconciliation and income taxes paid. The amendments in this update are effective for fiscal years beginning after December 15, 2024. We plan to adopt this pronouncement and make the necessary updates to our disclosures for the year ended December 31, 2025, and aside from these disclosure changes, we do not expect the amendments to have a material effect on our financial statements.
NoteNOTE 2. Accounts ReceivableACCOUNTS RECEIVABLE
Accounts receivable consisted of the following:
| | December 31, |
| (Dollars in millions) | | 2020 | | 2019 |
| | December 31, | | | | December 31, |
| ($ in millions) | | ($ in millions) | | 2023 | | 2022 |
| Contracts in transit | Contracts in transit | | $ | 286.8 | | | $ | 269.7 | |
| Trade receivables | Trade receivables | | 67.0 | | | 52.8 | |
| Vehicle receivables | Vehicle receivables | | 61.8 | | | 50.9 | |
| Manufacturer receivables | Manufacturer receivables | | 118.1 | | | 112.4 | |
| Auto loan receivables | | 175.6 | | | 62.2 | |
| Other receivables | | 11.6 | | | 19.4 | |
| 720.9 | | | 567.4 | |
| Other receivables, current | |
| | 1,130.2 | |
| Less: Allowance for doubtful accounts | Less: Allowance for doubtful accounts | | (5.9) | | | (7.3) | |
Less: Long-term portion of accounts receivable, net1 | | (101.0) | | | (55.1) | |
| Total accounts receivable, net | Total accounts receivable, net | | $ | 614.0 | | | $ | 505.0 | |
1
The long-term portionscomponents of accounts receivable and allowance for doubtful accounts were included as a component of other non-current assets in the Consolidated Balance Sheets. See Note 1 for additional information on the allowance for credit losses related to auto loan receivables.
NoteNOTE 3. InventoriesINVENTORIES AND FLOOR PLAN NOTES PAYABLE
The components of inventories consisted of the following:
| | December 31, |
| (Dollars in millions) | | 2020 | | 2019 |
| | December 31, | | | | December 31, |
| ($ in millions) | | ($ in millions) | | 2023 | | 2022 |
| New vehicles | New vehicles | | $ | 1,556.6 | | | $ | 1,704.1 | |
| Used vehicles | Used vehicles | | 835.9 | | | 638.1 | |
| Parts and accessories | Parts and accessories | | 100.4 | | | 91.5 | |
| Total inventories | Total inventories | | $ | 2,492.9 | | | $ | 2,433.7 | |
The new vehicle inventory cost is generally reduced by manufacturer holdbacks and incentives, while the related floor plan notes payable are reflective of the gross cost of the vehicle.
| | | | | | | | | | | | | | |
| | December 31, |
| ($ in millions) | | 2023 | | 2022 |
| Floor plan notes payable: non-trade | | $ | 2,288.5 | | | $ | 1,489.4 | |
| Floor plan notes payable | | 1,347.0 | | | 627.2 | |
| Total floor plan debt | | $ | 3,635.5 | | | $ | 2,116.6 | |
Floor Plan Notes Payable
We have floor plan agreements with manufacturer-affiliated finance companies for certain new vehicles and vehicles that are designated for use as service loaners. The interest rates on these floor plan notes payable commitments vary by manufacturer and are variable rates, ranging from 5.77% to 14.25% as of December 31, 2023. Borrowings from and repayments to manufacturer-affiliated finance companies are classified as operating activities in the Consolidated Statements of Cash Flows.
Floor Plan Notes Payable: Non-Trade
See credit facilities discussion in Note 9 – Credit Facilities and Long-Term Debt for more information on our floor plan commitments.
| | | | | | | | | | | | | | |
| | NOTES TO FINANCIAL STATEMENTS | F-18 | |
NoteNOTE 4. Property and EquipmentPROPERTY AND EQUIPMENT
Property and equipment consisted of the following:
| | December 31, |
| (Dollars in millions) | | 2020 | | 2019 |
| | December 31, | | | | December 31, |
| ($ in millions) | | ($ in millions) | | 2023 | | 2022 |
| Land | Land | | $ | 699.3 | | | $ | 473.0 | |
| Building and improvements | Building and improvements | | 1,149.7 | | | 948.0 | |
| Service equipment | Service equipment | | 123.6 | | | 113.3 | |
| Furniture, office equipment, signs and fixtures | Furniture, office equipment, signs and fixtures | | 512.9 | | | 327.0 | |
| 2,485.5 | | | 1,861.3 | |
| | 4,520.9 | |
| Less accumulated depreciation | Less accumulated depreciation | | (338.0) | | | (284.3) | |
| 2,147.5 | | | 1,577.0 | |
| | 3,874.2 | |
| Construction in progress | Construction in progress | | 50.0 | | | 34.7 | |
| $ | 2,197.5 | | | $ | 1,611.7 | |
| | $ | |
Long-Lived Asset Impairment Charges
We recorded 0no impairment charges in 2020 associated with property2023, 2022, and equipment. In 2019 and 2018 we recorded impairment charges of $0.5 million and $1.3 million, respectively,2021 associated with property and equipment. The long-lived assets were tested for recoverability and were determined to have a carrying value exceeding their fair value.
NOTE 5. FINANCE RECEIVABLES
Our finance receivables are comprised of auto loan and lease receivables. Our auto loan receivables include amounts due from customers related to vehicle sales financed through US and Canada Financing Operations, secured by the related vehicles. Lease receivables include amounts related to vehicles leased through Canadian Financing Operations, also secured by the related vehicles. These amounts are presented net of an allowance for estimated losses.
Interest income on finance receivables is recognized based on the contractual terms of each loan and is accrued until repayment, reaching non-accrual status, charge-off, or repossession. Direct costs associated with loan originations are capitalized and expensed as an offset to interest income when recognized on the loans.
The balances of finance receivables are made up of loans and leases secured by the related vehicles. More than 98% of the portfolio is aged less than 60 days past due with less than 2% on non-accrual status.
Finance Receivables, net
| | | | | | | | | | | |
| December 31, |
| ($ in millions) | 2023 | | 2022 |
| Asset-backed term funding | $ | 2,146.5 | | | $ | 482.1 | |
| Warehouse facilities | 749.3 | | | 1,383.9 | |
| Other managed receivables | 452.9 | | | 390.9 | |
| Total finance receivables | 3,348.7 | | | 2,256.9 | |
| Less: Allowance for finance receivable losses | (106.4) | | | (69.3) | |
| Finance receivables, net | $ | 3,242.3 | | | $ | 2,187.6 | |
Finance Receivables by FICO Score
| | | | | | | | | | | | | | | | | | | | | | | | | | | | | | | | | |
| As of December 31, 2023 |
| Year of Origination |
| ($ in millions) | 2023 | | 2022 | | 2021 | | 2020 | | | | | | Total |
<5991 | $ | 62.2 | | | $ | 39.0 | | | $ | 17.6 | | | $ | 2.4 | | | | | | | $ | 121.2 | |
| 600-699 | 586.6 | | | 463.6 | | | 152.7 | | | 16.1 | | | | | | | 1,219.0 | |
| 700-774 | 568.1 | | | 422.5 | | | 63.9 | | | 5.9 | | | | | | | 1,060.4 | |
| 775+ | 490.3 | | | 263.5 | | | 14.7 | | | 2.7 | | | | | | | 771.2 | |
| Total auto loan receivables | $ | 1,707.2 | | | $ | 1,188.6 | | | $ | 248.9 | | | $ | 27.1 | | | | | | | 3,171.8 | |
Other finance receivables (1) | | | | | | | | | | | | | 176.9 | |
| Total finance receivables | | | | | | | | | | | | | $ | 3,348.7 | |
| | | | | | | | | | | | | | |
| | NOTES TO FINANCIAL STATEMENTS | F-17F-19 | |
| | | | | | | | | | | | | | | | | | | | | | | | | | | | | |
| As of December 31, 2022 |
| Year of Origination |
| ($ in millions) | 2022 | | 2021 | | 2020 | | | | | | | | Total |
<5991 | $ | 63.0 | | | $ | 30.3 | | | $ | 4.8 | | | | | | | | | $ | 98.1 | |
| 600-699 | 652.6 | | | 243.4 | | | 27.2 | | | | | | | | | 923.2 | |
| 700-774 | 575.9 | | | 97.9 | | | 10.0 | | | | | | | | | 683.8 | |
| 775+ | 369.5 | | | 21.5 | | | 4.5 | | | | | | | | | 395.5 | |
| Total auto loan receivables | $ | 1,661.0 | | | $ | 393.1 | | | $ | 46.5 | | | | | | | | | 2,100.6 | |
Other finance receivables (1) | | | | | | | | | | | | | 156.3 | |
| Total finance receivables | | | | | | | | | | | | | $ | 2,256.9 | |
(1)Includes legacy portfolio, loans that are originated with no FICO score available, and lease receivables.
In accordance with Topic 326, the allowance for loan and lease losses is estimated based on our historical write-off experience, current conditions and forecasts, as well as the value of any underlying assets securing these loans. Consideration is given to recent delinquency trends and recovery rates. Account balances are charged against the allowance upon reaching 120 days past due status.
Rollforward of Allowance for Loan and Lease Losses
Our allowance for finance receivable losses represents the net credit losses expected over the remaining contractual life of our managed receivables. During 2023, provision expense and net charge-offs increased primarily due to the higher volume of originations and resulting growth in the finance receivables balance. Also a contributing factor is the 3-4 month lag between charge-off and recovery. Collectively these factors drove an overall increase in the allowance. The allowances for credit losses related to finance receivables consisted of the following changes during the period:
| | | | | | | | | | | |
| Year Ended December 31, |
| ($ in millions) | 2023 | | 2022 |
| Allowance at beginning of period | $ | 69.3 | | | $ | 25.0 | |
| Charge-offs | (110.0) | | | (62.0) | |
| Recoveries | 47.6 | | | 19.1 | |
| Initial allowance for purchased credit-deteriorated loans | 4.6 | | | — | |
| Sold loans | (3.9) | | | — | |
| Provision expense | 98.8 | | | 87.2 | |
| Allowance at end of period | $ | 106.4 | | | $ | 69.3 | |
See Note 1 – Summary of Significant Accounting Policies for additional information on the allowance for credit losses related to finance receivables.
Charge-off Activity by Year of Origination
| | | | | | | | | | | |
| Year Ended December 31, |
| ($ in millions) | 2023 | | 2022 |
| 2023 | $ | 14.2 | | | $ | — | |
| 2022 | 61.9 | | | 17.3 | |
| 2021 | 29.2 | | | 35.5 | |
| 2020 | 2.8 | | | 5.1 | |
| Other finance receivables | 1.9 | | | 4.1 | |
| Total charge-offs | $ | 110.0 | | | $ | 62.0 | |
| | | | | | | | | | | | | | |
| | NOTES TO FINANCIAL STATEMENTS | F-20 | |
Purchased Financial Assets with Credit Deterioration
As part of our acquisition of Priority Auto Group on June 12, 2023, we purchased certain auto loan receivables for which there was evidence of more than insignificant deterioration of credit quality since origination (purchased credit-deteriorated or “PCD” assets). The following is a reconciliation of the difference between the purchase price paid by us for the financial assets and the par value (outstanding principal balance) of the assets on the date we acquired the portfolio:
| | | | | |
| ($ in millions) | |
| Purchase price of PCD loans at acquisition | $ | 8.0 | |
| Initial allowance for credit losses of PCD loans at acquisition | 4.6 | |
| Noncredit premium of PCD loans at acquisition | (3.4) | |
| Par value of acquired PCD loans at acquisition | $ | 9.2 | |
Note 5. Goodwill and Franchise ValueNOTE 6. GOODWILL AND FRANCHISE VALUE
The following is a roll-forward of goodwill:
| | | | | | | | | | | | | | | | | | | | | | | | | | |
| (Dollars in millions) | | Domestic | | Import | | Luxury | | Consolidated |
| Balance as of December 31, 2018 ¹ | | $ | 164.5 | | | $ | 188.9 | | | $ | 81.5 | | | $ | 434.9 | |
Adjustments to purchase price allocations 2 | | 1.6 | | | 1.6 | | | 1.9 | | | 5.1 | |
Additions through acquisitions 2 | | 6.2 | | | 9.0 | | | 2.2 | | | 17.4 | |
| Reductions through divestitures | | (0.2) | | | (0.9) | | | 0 | | | (1.1) | |
| Reductions from impairments | | (0.3) | | | (1.3) | | | (0.1) | | | (1.7) | |
| Balance as of December 31, 2019 ¹ | | 171.8 | | | 197.3 | | | 85.5 | | | 454.6 | |
| | | | | | | | |
Additions through acquisitions 3 | | 33.3 | | | 94.3 | | | 17.3 | | | 144.9 | |
| Reductions through divestitures | | (0.1) | | | (0.7) | | | (2.2) | | | (3.0) | |
| Reductions from impairments | | (0.5) | | | (3.0) | | | 0 | | | (3.5) | |
Balance as of December 31, 2020 1 | | $ | 204.5 | | | $ | 287.9 | | | $ | 100.6 | | | $ | 593.0 | |
| | | | | | | | | | | | | | | | | | | | | | |
| ($ in millions) | | Vehicle Operations | | Financing Operations | | | | Consolidated |
| Balance as of December 31, 2021 | | $ | 977.3 | | | $ | — | | | | | $ | 977.3 | |
| | | | | | | | |
Additions through acquisitions 1 | | 483.4 | | | 17.0 | | | | | 500.4 | |
| Reductions through divestitures | | (17.9) | | | — | | | | | (17.9) | |
| | | | | | | | |
| Currency translation | | 0.7 | | | 0.2 | | | | | 0.9 | |
| Balance as of December 31, 2022 | | 1,443.5 | | | 17.2 | | | | | 1,460.7 | |
| | | | | | | | |
Additions through acquisitions 2 | | 519.1 | | | — | | | | | 519.1 | |
| Reductions through divestitures | | (51.1) | | | — | | | | | (51.1) | |
| | | | | | | | |
| Currency translation | | 1.5 | | | 0.4 | | | | | 1.9 | |
| Balance as of December 31, 2023 | | $ | 1,913.0 | | | $ | 17.6 | | | | | $ | 1,930.6 | |
(1)NetOur purchase price allocations for the 2021 acquisitions were finalized in 2022. As a result, we added $500.4 million of accumulated impairment losses of $299.3 million recorded during the year ended December 31, 2008.goodwill.
(2)Our purchase price allocationallocations for the 20182022 acquisitions were finalized in 2019.2023. As a result, we added $22.5$285.9 million of goodwill.
(3)Our Preliminary purchase price allocation for a portion of the 2019our 2023 acquisitions were finalizedresulted in 2020. As a result, we added $144.9adding $233.2 million of goodwill. Our purchase price allocation for the remaining 2020remainder of the 2023 acquisitions are preliminary and goodwill is not yet allocated to our segments. These amounts are included in other non-current assets until we finalize our purchase accounting. See Note 15.16 – Acquisitions.
The following is a roll-forward of franchise value:
| | | | | | | | |
(Dollars$ in millions) | | Franchise Value |
Balance as of December 31, 20182021 | | $ | 288.7799.1 | |
| Adjustments to purchase price allocations1
| | 3.5 |
Additions through acquisitions1 | | 20.91,088.4 | |
| Reductions through divestitures | | (6.0)(33.6) | |
| | |
Reductions from impairmentsCurrency translation | | (0.4)2.3 | |
Balance as of December 31, 20192022 | | 306.71,856.2 | |
| | |
Additions through acquisitions2 | | 51.9556.5 | |
| Reductions through divestitures | | (4.0)(14.5) | |
| | |
Reductions from impairmentsCurrency translation | | (4.4)4.0 | |
Balance as of December 31, 20202023 | | $ | 350.22,402.2 | |
(1)Our purchase price allocationallocations for the 20182021 acquisitions were finalized in 2019.2022. As a result, we added $24.4 million$1.1 billion of franchise value.
(2)Our purchase price allocationallocations for a portion of the 20192022 acquisitions waswere finalized in 2020.2023. As a result, we added $51.9$363.1 million of franchise value. Preliminary purchase price allocations for a portion of our 2023 acquisitions resulted in adding $193.4 million of franchise value. Our purchase price allocationallocations for the remaining 2020remainder of the 2023 acquisitions are preliminary and is not yet allocated to our segments. See Note 15.16 – Acquisitions.
NOTE 7. NET INVESTMENT IN OPERATING LEASES
Net investment in operating leases consists primarily of lease contracts for vehicles with individuals and business entities. Assets subject to operating leases are depreciated using the straight-line method over the term of the lease
| | | | | | | | | | | | | | |
| | NOTES TO FINANCIAL STATEMENTS | F-21 | |
to reduce the asset to its estimated residual value. Estimated residual values are based on assumptions for used vehicle prices at lease termination and the number of vehicles that are expected to be returned.
Net investment in operating leases was as follows:
| | | | | | | | | | | | | | |
| | December 31, |
| ($ in millions) | | 2023 | | 2022 |
Vehicles, at cost (1) | | $ | 102.7 | | | $ | 92.2 | |
Accumulated depreciation (1) | | (11.2) | | | (7.6) | |
| Net investment in operating leases | | $ | 91.5 | | | $ | 84.6 | |
(1)Vehicles, at cost and accumulated depreciation are recorded in other non-current assets, on the Consolidated Balance Sheets.
NOTE 8. COMMITMENTS AND CONTINGENCIES
Leases
We lease certain dealerships, office space, land and equipment. Leases with an initial term of 12 months or less are not recorded on the balance sheet; we recognize lease expense for these leases on a straight-line basis over the lease term. We have elected not to bifurcate lease and non-lease components related to leases of real property.
Most leases include one or more options to renew, with renewal terms that can extend the lease term from one to 25 or more years. The exercise of lease renewal options is at our sole discretion. Certain leases also include options to purchase the leased property. The depreciable life of assets and leasehold improvements are limited by the expected lease term, unless there is a transfer of title or purchase option reasonably certain of exercise.
Certain of our lease agreements include rental payments based on a percentage of retail sales over contractual levels and others include rental payments adjusted periodically for inflation. Our lease agreements do not contain any material residual value guarantees or material restrictive covenants.
We rent or sublease certain real estate to third parties.
The table below presents the lease-related liabilities and finance lease ROU assets recorded on the Consolidated Balance Sheets:
| | | | | | | | | | | | | | |
| | December 31, |
| ($ in millions) | | 2023 | | 2022 |
| Operating lease liabilities: | | | | |
| Current portion included in accrued liabilities | | $ | 68.2 | | | $ | 51.7 | |
| Noncurrent operating lease liabilities | | 427.9 | | | 346.6 | |
| Total operating lease liabilities | | 496.1 | | | 398.3 | |
| Finance lease liabilities: | | | | |
| Current portion included in current maturities of long-term debt | | 7.8 | | | 2.0 | |
| Long-term portion of lease liabilities in long-term debt | | 91.6 | | | 54.4 | |
| Total finance lease liabilities | | 99.4 | | | 56.4 | |
| Total lease liabilities | | $ | 595.5 | | | $ | 454.7 | |
| Finance lease right-of-use assets: | | | | |
Total finance lease right-of-use assets (1) | | $ | 132.7 | | | $ | 75.9 | |
| Weighted-average remaining lease term: | | | | |
| Operating leases | | 8 years | | 7 years |
| Finance leases | | 10 years | | 10 years |
| Weighted-average discount rate: | | | | |
| Operating leases | | 4.78 | % | | 4.31 | % |
| Finance leases | | 5.53 | % | | 4.85 | % |
(1)Finance lease right-of-use assets included in property and equipment, net of accumulated depreciation.
| | | | | | | | | | | | | | |
| | NOTES TO FINANCIAL STATEMENTS | F-18F-22 | |
Note 6. Credit FacilitiesThe components of lease costs, which were included in our Consolidated Statements of Operations, were as follows:
| | | | | | | | | | | | | | | | | | | | | | | |
| | | Year Ended December 31, |
| ($ in millions) | Classification | | 2023 | | 2022 | | 2021 |
Operating lease cost (1) | Selling, general and administrative | | $ | 96.9 | | | $ | 77.9 | | | $ | 53.1 | |
Variable lease cost (2) | Selling, general and administrative | | 7.1 | | | 5.6 | | | 3.5 | |
| Amortization of finance lease right-of-use assets | Depreciation and amortization | | 3.8 | | | 4.2 | | | 5.9 | |
| Interest on finance lease liabilities | Other interest expense | | 4.1 | | | 3.7 | | | 4.2 | |
| Sublease income | Selling, general and administrative | | (9.0) | | | (7.5) | | | (6.4) | |
| Total lease costs | | | $ | 102.9 | | | $ | 83.9 | | | $ | 60.3 | |
(1)Includes short-term and Long-Term Debtmonth-to-month lease costs, which are immaterial.
(2)Variable lease cost generally includes reimbursement for actual costs incurred by our lessors for common area maintenance, property taxes and insurance on leased real estate.
Below is a summaryAs of December 31, 2023, the maturities of our outstanding balances on credit facilitiesoperating and long-term debt (in millions):finance lease liabilities were as follows:
| | | | | | | | | | | | | | |
| | December 31, |
| (Dollars in millions) | | 2020 | | 2019 |
| Floor plan notes payable: non-trade | | $ | 1,563.0 | | | $ | 1,642.4 | |
| Floor plan notes payable | | 234.2 | | | 425.2 | |
| Total floor plan debt | | $ | 1,797.2 | | | $ | 2,067.6 | |
| | | | |
| Used and service loaner vehicle inventory financing commitments | | $ | 0 | | | $ | 149.0 | |
| Revolving lines of credit | | 39.0 | | | 0 | |
| Real estate mortgages | | 611.5 | | | 597.7 | |
| Finance lease obligations | | 246.4 | | | 30.5 | |
| 5.250% Senior notes due 2025 | | 300.0 | | | 300.0 | |
| 4.625% Senior notes due 2027 | | 400.0 | | | 400.0 | |
| 4.375% Senior notes due 2031 | | 550.0 | | | 0 | |
| Other debt | | 2.4 | | | 3.1 | |
| Total long-term debt outstanding | | 2,149.3 | | | 1,480.3 | |
| Less: unamortized debt issuance costs | | (18.6) | | | (10.4) | |
| Less: current maturities (net of current debt issuance costs) | | (66.0) | | | (39.3) | |
| Long-term debt | | $ | 2,064.7 | | | $ | 1,430.6 | |
| | | | | | | | | | | | | | |
| ($ in millions) | | Operating Lease Liabilities | | Finance Lease Liabilities |
| Year Ending December 31, | | | | |
| 2024 | | $ | 91.9 | | | $ | 13.0 | |
| 2025 | | 85.0 | | | 25.0 | |
| 2026 | | 70.5 | | | 5.8 | |
| 2027 | | 62.8 | | | 5.9 | |
| 2028 | | 53.3 | | | 5.9 | |
| Thereafter | | 262.7 | | | 85.3 | |
| Total minimum lease payments | | 626.2 | | | 140.9 | |
| Less: present value adjustment | | (130.1) | | | (41.5) | |
| Total lease liabilities | | $ | 496.1 | | | $ | 99.4 | |
Credit FacilityCharge-Backs for Various Contracts
Our syndicated credit facility (credit facility) is comprisedWe have recorded a liability of 19 financial institutions, including 7 manufacturer-affiliated finance companies, with a maturity date$175.6 million as of January 2025.December 31, 2023 for our estimated contractual obligations related to potential charge-backs for vehicle service contracts and other various insurance contracts that are terminated early by the customer. We estimate that the charge-backs will be paid out as follows:
| | | | | | | | |
| Year Ending December 31, | | ($ in millions) |
| 2024 | | $ | 101.6 | |
| 2025 | | 45.6 | |
| 2026 | | 20.1 | |
| 2027 | | 6.7 | |
| 2028 | | 1.5 | |
| Thereafter | | 0.1 | |
| Total | | $ | 175.6 | |
Contract Liabilities
We haveretain the option to reallocate the commitments, provided that the used vehicle inventory floor plan financing commitment does not exceed 16.5% of aggregate commitments, the revolving loan commitment does not exceed 18.75% of aggregate commitments, theobligation for lifetime lube, oil and filter service loaner floor plan financing commitment does not exceed $100 million,contracts and the sum of these commitments plus the new vehicle inventory floor plan financing commitment does not exceed the aggregate total financing commitment of $2.8 billion. Additionally, we may request an increase in the aggregate new vehicle floor plan commitment of up to $400 million, provided that the aggregate commitment does not exceed $3.2 billion. All borrowings from, and repaymentsat home valet contracts sold to our lending groupcustomers and assumed the liability of certain existing lifetime lube, oil and filter contracts. These amounts are presented inrecorded as a contract liability. At the Consolidated Statementstime of Cash Flowssale, we defer the full sale price and recognize the revenue based on the rate we expect future costs to be incurred. As of December 31, 2023, we had a contract liability balance of $308.9 million associated with these contracts and estimate the contract liability will be recognized as financing activities.follows:
Our obligations under our credit facility are secured by a substantial amount of our assets, including our inventory (including new and used vehicles, parts and accessories), equipment, accounts receivable (and other rights to payment) and our equity interests in certain subsidiaries. Under our credit facility, our obligations relating to new vehicle floor plan loans are secured only be collateral owned by borrowers of new vehicle floor plan loans under the credit facility. | | | | | | | | |
| Year Ending December 31, | | ($ in millions) |
| 2024 | | $ | 64.0 | |
| 2025 | | 51.4 | |
| 2026 | | 40.7 | |
| 2027 | | 32.2 | |
| 2028 | | 25.9 | |
| Thereafter | | 94.7 | |
| Total | | $ | 308.9 | |
The interest rate on the credit facility,contract liability balance is recorded as amended, varies based on the typecomponents of debt, with the rate of one-month LIBOR plus 1.10% for new vehicle floor plan financing, one-month LIBOR plus 1.40% for used vehicle floor plan financing;deferred revenue and a variable interest rate on the revolving financing ranging from the one-month LIBOR plus 1.00% to 2.00%, depending on our leverage ratio. The annual interest rate associated with our new vehicle floor plan commitment was 1.24% at December 31, 2020. The annual interest rate associated with our used vehicle inventory financing commitment was 1.54% at December 31, 2020. The annual interest rate associated with our service loaner inventory financing commitment was 1.34% at December 31, 2020. The annual interest rate associated with our revolving line of credit was 1.14% at December 31, 2020.
Under the terms of our credit facility, we are subject to financial covenants and restrictive covenants that limit or restrict our incurring additional indebtedness, making investments, selling or acquiring assets and granting security interestsaccrued liabilities in our assets.
| | | | | | | | | | | | | | |
| | NOTES TO FINANCIAL STATEMENTS | F-19F-23 | |
Under our credit facility, we are required to maintain the ratios detailed in the following table:
| | | | | | | | | | | | | | |
Debt Covenant Ratio | | Requirement | | As of December 31, 2020 |
Current ratio | | Not less than 1.10 to 1 | | 1.48 to 1 |
Fixed charge coverage ratio | | Not less than 1.20 to 1 | | 3.91 to 1 |
Leverage ratio | | Not more than 5.75 to 1 | | 2.74 to 1 |
Other LinesSelf-insurance Programs
We self-insure a portion of Credit
Our other linesour property and casualty insurance, vehicle open lot coverage, medical insurance and workers’ compensation insurance. Third parties are engaged to assist in estimating the loss exposure related to the self-retained portion of credit include commitments of upthe risk associated with these insurances. Additionally, we analyze our historical loss and claims experience to $80.0 million, secured by certain assets from select Chrysler locations and all Ford locations. These other lines of credit mature in 2021 and have interest rates up to 5.70%.estimate the loss exposure associated with these programs. As of December 31, 2020, 0 amounts were outstanding on2023 and 2022, we had liabilities associated with these programs of $77.1 million and $67.4 million, respectively, recorded as a component of accrued liabilities and other lines of credit.long-term liabilities in our Consolidated Balance Sheets.
On July 14, 2020,Litigation
We are party to numerous legal proceedings arising in the normal course of our business. Although we entered intodo not anticipate that the resolution of legal proceedings arising in the normal course of business will have a five-year real estate backed facility with 8 financial institutions, including 2 manufacturer affiliated finance companies, maturing in July 2025. The real-estate backed credit facility provides a total financing commitment of up to $251.5 million in working capital financing for general corporate purposes, including acquisitions and working capital, collateralized by real estate and certain other assets owned by us. The interest rate on this credit facility uses one-month LIBOR plus a margin ranging from 2.00%-2.50% basedmaterial adverse effect on our leverage ratio,business, results of operations, financial condition, or a base rate of 0.75% plus a margin. The facility includes financial and restrictive covenants typical of such agreements, lending conditions, and representations and warranties by us. Financial covenants include requirements to maintain minimum current and fixed charge coverage ratios, and a maximum leverage ratio, consistentcash flows, we cannot predict this with those under our existing syndicated credit facility with U.S. Bank National Association as administrative agent.As of December 31, 2020, no amounts were outstanding on the real estate backed facility.
On July 31, 2020, we entered into a securitization facility which provides initial commitments for borrowings of up to $150.0 million and matures in July 2022. As of December 31, 2020, we had $39.0 million drawn on the securitization facility.
Floor Plan Notes Payable
We have floor plan agreements with manufacturer-affiliated finance companies for certain new vehicles and vehicles that are designated for use as service loaners. As discussed above in “Operating Activities” in “Liquidity and Capital Resources”, during 2019 we entered a floor plan agreement with Chrysler Capital. This facility provides floor plan financing for new vehicle inventory at select Chrysler stores. This facility adds to our existing facility with Ford Motor Credit Company. The interest rates on these floor plan notes payable commitments vary by manufacturer and are variable rates. As of December 31, 2020, $234.2 million was outstanding on these agreements at interest rates ranging up to 5.25%. Borrowings from and repayments to manufacturer-affiliated finance companies are classified as operating activities in the Consolidated Statements of Cash Flows.
Real Estate Mortgages, Finance Lease Obligations, and Other Debt
We have mortgages associated with our owned real estate. Interest rates related to this debt ranged from 1.9% to 5.3% at December 31, 2020. The mortgages are payable in various installments through August 1, 2038. As of December 31, 2020, we had fixed interest rates on 76.2% of our outstanding mortgage debt.
We have finance lease obligations with some of our leased real estate. Interest rates related to this debt ranged from 1.9% to 8.5% at December 31, 2020. The leases have terms extending through August 2037.
Our other debt includes sellers’ notes. The interest rates associated with our other debt ranged from 4.4% to 5.3% at December 31, 2020. This debt, which totaled $2.4 million at December 31, 2020, is due in various installments through August 2037.
5.250% Senior Notes Due 2025
On July 24, 2017, we issued $300.0 million in aggregate principal amount of 5.250% senior notes due 2025 to eligible purchasers in a private placement under Rule 144A and Regulation S of the Securities Act of 1933. Interest accrues on the notes from July 24, 2017 and is payable semiannually on February 1 and August 1. The first interest payment was paid on February 1, 2018. We may redeem the notes in whole or in part at any time prior to August 1, 2020 at a price equal to 100% of the principal amount plus a make-whole premium set forth in the indenture and accrued and unpaid interest. After August 1, 2020, we may redeem some or all of the notes subject to the redemption prices set forth in the indenture. If we experience specific kinds of changes of control, as described in
| | | | | | | | | | | | | | |
| | NOTES TO FINANCIAL STATEMENTS | F-20 | |
the indenture, we must offer to repurchase the notes at 101% of their principal amount plus accrued and unpaid interest to the date of purchase.
4.625% Senior Notes Due 2027
On December 9, 2019, we issued $400.0 million in aggregate principal amount of 4.625% senior notes due 2027 to eligible purchasers in a private placement under Rule 144A and Regulation S of the Securities Act of 1933. Interest accrues on the notes from December 9, 2019 and is payable semiannually on June 15 and December 15. We may redeem the notes in whole or in part, on or after December 15, 2022, at the redemption prices set forth in the indenture. Prior to December 15, 2022, we may redeem the notes, in whole or in part, at a price equal to 100% of the principal amount thereof plus a make-whole premium set forth in the indenture. In addition, prior to December 15, 2022, we may redeem up to 40% of the notes from the proceeds of certain equity offerings. Upon certain change of control events (as set forth in the indenture), the holders of the notes may require us to repurchase all or a portion of the notes at a purchase price of 101% of their principal amount plus accrued and unpaid interest, if any, to the date of purchase.
4.375% Senior Notes Due 2031
On October 9, 2020, we issued $550.0 million in aggregate principal amount of 4.375% senior notes due January 15, 2031 to eligible purchasers in a private placement under Rule 144A and Regulation S of the Securities Act of 1933. Interest accrues on the notes from October 9, 2020 and is payable semiannually on January 15 and July 15. We may redeem the notes in whole or in part, on or after October 15, 2025, at the redemption prices set forth in the indenture. Prior to October 15, 2025, we may redeem the notes, in whole or in part, at a price equal to 100% of the principal amount thereof plus a make-whole premium set forth in the indenture. In addition, prior to October 15, 2025, we may redeem up to 40% of the notes from the proceeds of certain equity offerings. Upon certain change of control events (as set forth in the indenture), the holders of the notes may require us to repurchase all or a portion of the notes at a purchase price of 101% of their principal amount plus accrued and unpaid interest, if any, to the date of purchase.
Future Principal Payments
The schedule of future principal payments associated with real estate mortgages, finance lease liabilities, our senior notes and other debt as of December 31, 2020 was as follows:
| | | | | | | | |
| Year Ending December 31, | | (Dollars in millions) |
| 2021 | | $ | 69.4 | |
| 2022 | | 78.9 | |
| 2023 | | 148.0 | |
| 2024 | | 87.5 | |
| 2025 | | 448.3 | |
| Thereafter | | 1,278.2 | |
| Total principal payments | | $ | 2,110.3 | |
Note 7. Commitments and ContingenciesNOTE 9. CREDIT FACILITIES AND LONG-TERM DEBT
LeasesBelow is a summary of our outstanding balances on credit facilities and long-term debt:
As described | | | | | | | | | | | | | | | | | | | | |
| | | | December 31, |
| ($ in millions) | | Maturity Dates | | 2023 | | 2022 |
| Long-term debt: | | | | | | |
| Used and service loaner vehicle inventory financing commitments | | Various dates through Apr 2026 | | $ | 902.8 | | | $ | 877.2 | |
| Revolving lines of credit | | Various dates through Apr 2026 | | 1,620.7 | | | 927.6 | |
| Warehouse facilities | | Various dates through Jul 2026 | | 587.0 | | | 930.0 | |
| Non-recourse notes payable | | Various dates through Apr 2031 | | 1,705.6 | | | 422.2 | |
| 4.625% Senior notes due 2027 | | Dec 2027 | | 400.0 | | | 400.0 | |
| 4.375% Senior notes due 2031 | | Jan 2031 | | 550.0 | | | 550.0 | |
| 3.875% Senior notes due 2029 | | Jun 2029 | | 800.0 | | | 800.0 | |
| Real estate mortgages, finance lease obligations, and other debt | | Various dates through Dec 2050 | | 730.7 | | | 653.1 | |
| Total long-term debt | | | | 7,296.8 | | | 5,560.1 | |
| Less: unamortized debt issuance costs | | | | (31.8) | | | (29.1) | |
| Less: current maturities (net of current debt issuance costs) | | | | (109.6) | | | (20.5) | |
| Long-term debt, net | | | | $ | 7,155.4 | | | $ | 5,510.5 | |
Credit Facilities
US Bank Syndicated Credit Facility
On February 9, 2023, we amended our existing syndicated credit facility (USB credit facility), comprised of 21 financial institutions, including eight manufacturer-affiliated finance companies, maturing April 29, 2026.
This USB credit facility provides for a total financing commitment of $4.6 billion, which may be further expanded, subject to lender approval and the satisfaction of other conditions, up to a total of $5.5 billion. The allocation of the financing commitment is for up to $800 million in Note 20, we adopted Topic 842used vehicle inventory floorplan financing, up to $1.7 billion in revolving financing for general corporate purposes, including acquisitions and working capital, up to $2.1 billion in new vehicle inventory floorplan financing, and up to $50 million in service loaner vehicle floorplan financing. We have the option to reallocate the commitments under this USB credit facility, provided that the aggregate revolving loan commitment may not be more than 40% of the amount of the aggregate commitment, and the aggregate service loaner vehicle floorplan commitment may not be more than the 3% of the amount of the aggregate commitment. All borrowings from, and repayments to, our lending group are presented in the Consolidated Statements of Cash Flows as financing activities.
Our obligations under our USB credit facility are secured by a substantial amount of January 1, 2019, usingour assets, including our inventory (including new and used vehicles, parts and accessories), equipment, accounts receivable (and other rights to payment) and our equity interests in certain of our subsidiaries. Under our USB credit facility, our obligations relating to new vehicle floor plan loans are secured only by collateral owned by borrowers of new vehicle floor plan loans under the modified retrospective approach. This allows adjustment with a cumulative-effect adjustment as of January 1, 2019. Prior period amounts have not been adjusted and continue to be reported in accordance with our historic accounting under Topic 840. See Note 11 for future minimum operating lease payments after December 31, 2020, as presented under Topic 842.USB credit facility.
| | | | | | | | | | | | | | |
| | NOTES TO FINANCIAL STATEMENTS | F-21F-24 | |
Charge-BacksThe interest rate on the USB credit facility varies based on the type of debt, with the rate of one-day SOFR plus a credit spread adjustment of 0.10% plus a margin of 1.10% for Various Contracts
We have recordednew vehicle floor plan financing, 1.40% for used vehicle floor plan financing, 1.20% for service loaner floor plan financing, and a liability of $67.1 million as of December 31, 2020 forvariable interest rate on the revolving financing ranging from 1.00% to 2.00% depending on our estimated contractual obligations related to potential charge-backs for vehicle service contracts, lifetime oil change contracts and other various insurance contracts thatleverage ratio. The annual interest rates associated with our floor plan commitments are terminated early by the customer. We estimate that the charge-backs will be paid out as follows:
| | | | | | | | |
| Year Ending December 31, | | (Dollars in millions) |
| 2021 | | $ | 39.9 | |
| 2022 | | 17.6 | |
| 2023 | | 7.1 | |
| 2024 | | 2.1 | |
| 2025 | | 0.4 | |
| Thereafter | | 0 | |
| Total | | $ | 67.1 | |
| | | | | |
| Commitment | Annual Interest Rate at December 31, 2023 |
| New vehicle floor plan | 6.58% |
| Used vehicle floor plan | 6.88% |
| Service loaner floor plan | 6.68% |
| Revolving line of credit | 6.48% |
Lifetime Lube, OilUnder the terms of our USB credit facility, we are subject to financial covenants and Filter Contractsrestrictive covenants that limit or restrict our incurring additional indebtedness, making investments, selling or acquiring assets and granting security interests in our assets.
We retain
Bank of Nova Scotia Syndicated Credit Facility
On June 3, 2022, we entered into a syndicated credit agreement with The Bank of Nova Scotia as agent (BNS credit facility), comprised of six financing institutions, including two manufacturer-affiliated finance companies.
The BNS credit facility provides for a total financing commitment of approximately $1.1 billion CAD, including a working capital revolving credit facility of up to $100 million CAD, a wholesale flooring facility for new vehicles up to $500 million CAD, used vehicle flooring facility of up to $100 million CAD, wholesale leasing facility of up to $400 million CAD, and daily rental vehicle facility up to $25 million CAD.
| | | | | |
| Commitment | Annual Interest Rate at December 31, 2023 |
| Wholesale flooring facility | 6.46% |
| Used vehicle flooring facility | 6.71% |
| Daily rental facility | 6.66% |
| Wholesale leasing facility | 6.76% |
| Working capital revolving facility | 6.71% |
All Canadian facilities other than the obligationwholesale flooring facility, which is a demand facility, mature on June 3, 2025. The credit agreement includes various financial and other covenants typical of such agreements.
Wells Fargo Syndicated Real Estate Facility
On February 9, 2023, we amended our existing syndicated real estate backed facility with Wells Fargo Bank, National Association, as agent (WFB credit facility), which includes eight financial institutions, including two manufacturer affiliated finance companies, maturing July 14, 2025.
The WFB credit facility currently provides a total financing commitment of up to $196.0 million in working capital financing for lifetime lube, oilgeneral corporate purposes, including acquisitions and filter service contracts sold to our customersworking capital, collateralized by real estate and assumedcertain other assets owned by us. The interest rate on the liabilityWFB credit facility uses Daily Simple SOFR plus a credit spread adjustment of certain existing lifetime lube, oil and filter contracts. These amounts are recorded as0.10% plus a contract liability. At the time of sale, we defer the full sale price and recognize the revenuemargin ranging from 1.10%-2.50% based on the rate we expect future costsour leverage ratio.
The WFB credit facility includes financial and restrictive covenants typical of such agreements, lending conditions, and representations and warranties by us. Financial covenants include requirements to be incurred.maintain minimum fixed charge coverage ratio and a maximum leverage ratio, consistent with those under our existing syndicated credit facility with U.S. Bank National Association as administrative agent. As of December 31, 2020,2023, we had a contract liability balance of $194.3$195.8 million associated with these contracts and estimatedrawn on the contract liability will be recognized as follows:
| | | | | | | | |
| Year Ending December 31, | | (Dollars in millions) |
| 2021 | | $ | 38.8 | |
| 2022 | | 31.1 | |
| 2023 | | 24.9 | |
| 2024 | | 20.7 | |
| 2025 | | 17.4 | |
| Thereafter | | 61.4 | |
| Total | | $ | 194.3 | |
The contract liability balance is recorded as components of deferred revenue and accrued liabilities in our Consolidated Balance Sheets.
We periodically evaluate the estimated future costs of these assumed contracts and record a charge if future expected claim and cancellation costs exceed the contract liability to be recognized. As of December 31, 2020, we had a reserve balance of $2.8 million recorded as a component of accrued liabilities and other long-term liabilities in our Consolidated Balance Sheets. The charges associated with this reserve were recognized in 2011 and earlier.
Self-insurance Programs
We self-insure a portion of our property and casualty insurance, vehicle open lot coverage, medical insurance and workers’ compensation insurance. Third parties are engaged to assist in estimating the loss exposure related to the self-retained portion of the risk associated with these insurances. Additionally, we analyze our historical loss and claims experience to estimate the loss exposure associated with these programs. As of December 31, 2020 and 2019, we had liabilities associated with these programs of $39.1 million and $34.4 million, respectively, recorded as a component of accrued liabilities and other long-term liabilities in our Consolidated Balance Sheets.
Litigation
We are party to numerous legal proceedings arising in the normal course of our business. Although we do not anticipate that the resolution of legal proceedings arising in the normal course of business will have a material adverse effect on our business, results of operations, financial condition, or cash flows, we cannot predict this with certainty.WFB credit facility.
| | | | | | | | | | | | | | |
| | NOTES TO FINANCIAL STATEMENTS | F-22F-25 | |
Note 8. Stockholders’ Equity
Class A and Class B Common Stock
The shares of Class A common stock are not convertible into any other series or class of our securities. Each share of Class B common stock, however, is freely convertible into 1 share of Class A common stock at the option of the holder of the Class B common stock. All shares of Class B common stock automatically convert to shares of Class A common stock (on a share-for-share basis, subject to adjustment) on the earliest record date for an annual meeting of our shareholders on which the number of shares of Class B common stock outstanding is less than 1% of the total number of shares of common stock outstanding. Shares of Class B common stock may not be transferred to third parties, except for transfers to certain family members and in other limited circumstances.
Holders of Class A common stock are entitled to 1 vote for each share held of record and holders of Class B common stock are entitled to 10 votes for each share held of record. The Class A common stock and Class B common stock vote together as a single class on all matters submitted to shareholders.
Repurchases of Class A Common Stock
Repurchases of our Class A Common Stock occurred under repurchase authorizations granted by our Board of Directors and related to shares withheld as part of the vesting of restricted stock units (RSUs).
On October 22, 2018,December 28, 2022, we amended our Boardexisting real estate backed facility with Ally Bank (Ally Capital in Hawaii, Mississippi, Montana and New Jersey), as lender. The credit agreement matures on September 12, 2025 and provides for a revolving line of Directors approved an additional $250credit facility (Ally credit facility) of up to $300 million repurchase authorizationand is secured by real estate owned by us. The Ally credit facility will bear interest at a rate per annum equal to the greater of our Class A common stock, increasing our total share repurchase authorization3.00% or the prime rate designated by Ally Bank, minus 40 basis points. The Ally credit facility includes financial and restrictive covenants typical of such agreements, lending conditions, and representations and warranties. Financial covenants, including the requirements to $500 million. Share repurchasesmaintain minimum fixed charge coverage ratio and a maximum leverage ratio, consistent with those under our authorization wereexisting syndicated credit facility with US Bank National Association as follows:
| | | | | | | | | | | | | | | | | | | | | | | | | | |
| | | Repurchases Occurring in 2020 | | Cumulative Repurchases as of December 31, 2020 |
| | | Shares | | Average Price | | Shares | | Average Price |
| Share repurchase authorization | | 563,953 | | | $ | 81.71 | | | 3,719,048 | | | $ | 84.02 | |
| | | | | | | | |
administrative agent. The covenants restrict us from disposing of assets and granting additional security interests. As of December 31, 2020,2023, we had $187.5$100.0 million availabledrawn on the Ally credit facility.
JPM Warehouse facility
On July 20, 2023, we amended our securitization facility for repurchases pursuantour auto loan portfolio (JPM warehouse facility) with JPMorgan Chase Bank, as administrative agent and account bank, providing initial commitments for borrowings of up to $1.0 billion. The JPM warehouse facility matures on July 18, 2025. The interest rate on the JPM warehouse facility varies based on the Daily Simple SOFR rate plus 1.15% to 1.95%. As of December 31, 2023, we had $395.0 million drawn on the JPM warehouse facility.
Mizuho Warehouse facility
On July 20, 2023, we amended our securitization facility for our auto loan portfolio (Mizuho warehouse facility), with Mizuho Bank Ltd. as administrative agent and account bank, providing initial commitments for borrowings of up to $750 million and matures on July 20, 2026. The interest rate on the Mizuho warehouse facility varies based on the Daily Simple SOFR rate plus 1.20%. As of December 31, 2023, we had $192 million drawn on the Mizuho warehouse facility.
Non-Recourse Notes Payable
DFC auto loans receivable are temporarily funded through our warehouse facilities until they can be funded through non-recourse asset-backed term transactions. These non-recourse funding vehicles are structured to legally isolate the auto loans receivable, and we would not expect to be able to access the assets of our non-recourse funding vehicles, even in insolvency, receivership or conservatorship proceedings. Similarly, the investors in the non-recourse notes payable have no recourse to our share repurchase authorization.assets beyond the related receivables, the amounts on deposit in reserve accounts and the restricted cash from collections on auto loans receivable. We do, however, continue to have the rights associated with the interest we retain in these non-recourse funding vehicles.
In addition, during 2020,2023, we repurchased 30,620 shares at an average price of $149.02 per share, for a total of $4.6 million,issued $1.9 billion in non-recourse notes payable related to tax withholdings associated with the vesting of RSUs. The repurchase of shares related to tax withholdings associated with stock awards does not reduce the number of shares available for repurchase as approved by our Board of Directors.
The followingquarterly asset-backed term funding transactions. Below is a summary of our repurchases in the years ended December 31, 2020, 2019 and 2018:outstanding non-recourse notes payable issued:
| | | | | | | | | | | | | | | | | | | | |
| | Year Ended December 31, |
| | 2020 | | 2019 | | 2018 |
| Shares repurchased pursuant to repurchase authorizations | | 563,953 | | | 0 | | | 2,112,370 | |
| Total purchase price (in millions) | | $ | 46.1 | | | $ | 0 | | | $ | 179.0 | |
| Average purchase price per share | | $ | 81.71 | | | $ | 0 | | | $ | 84.72 | |
| Shares repurchased in association with tax withholdings on the vesting of RSUs | | 30,620 | | | 40,356 | | | 30,119 | |
| | | | | | | | | | | | | | | | | |
| ($ in millions) | Balance as of December 31, 2023 | Initial Principal Amount | Issuance Date | Interest Rate Range | Final Distribution Date |
| LAD Auto Receivables Trust 2021-1 Class A-D | $ | 97.4 | | $ | 344.4 | | 11/24/21 | 1.30% to 3.99% | Various dates through Nov 2029 |
| LAD Auto Receivables Trust 2022-1 Class A-C | 150.6 | | 298.1 | | 08/17/22 | 5.21% to 6.85% | Various dates through Apr 2030 |
| LAD Auto Receivables Trust 2023-1 Class A-D | 315.0 | | 479.7 | | 02/14/23 | 5.48% to 7.30% | Various dates through Jun 2030 |
| LAD Auto Receivables Trust 2023-2 Class A-D | 402.1 | | 556.7 | | 05/24/23 | 5.42% to 6.30% | Various dates through Feb 2031 |
| LAD Auto Receivables Trust 2023-3 Class A-D | 349.4 | | 415.4 | | 08/23/23 | 5.95% to 6.92% | Various dates through Dec 2030 |
| LAD Auto Receivables Trust 2023-4 Class A-D | 391.1 | | 421.2 | | 11/15/23 | 5.71% to 7.37% | Various dates through Apr 2031 |
| | | | | |
| Total non-recourse notes payable | $ | 1,705.6 | | $ | 2,515.5 | | | | |
Senior Notes
Below is a summary of outstanding senior notes issued:
| | | | | | | | | | | | | | | | | | | | |
| ($ in millions) | Principal Amount | Earliest Redemption Date | % Currently Redeemable | Current Redemption Price | Maturity Date | Interest Payment Dates |
| 4.625% Senior notes due 2027 | $400.0 | 12/15/22 | 100% | 102.313% | 12/15/27 | Jun 15, Dec 15 |
| 3.875% Senior notes due 2029 | 800.0 | 06/01/24 | 40% | 103.875% | 06/01/29 | Jun 1, Dec 1 |
| 4.375% Senior notes due 2031 | 550.0 | 10/15/25 | 40% | 104.375% | 01/15/31 | Jan 15, Jul 15 |
| Total senior notes | $1,750.0 | | | | | |
| | | | | | | | | | | | | | |
| | NOTES TO FINANCIAL STATEMENTS | F-23F-26 | |
DividendsReal Estate Mortgages, Finance Lease Obligations, and Other Debt
We declared and paid dividendshave mortgages associated with our owned real estate. Interest rates related to this debt ranged from 3.0% to 8.5% at December 31, 2023. The mortgages are payable in various installments through July 1, 2038. As of December 31, 2023, we had fixed interest rates on our Class A and Class B Common Stock as follows:
| | | | | | | | | | | | | | |
| Quarter declared | | Dividend amount per Class A and Class B share | |
Total amount of dividends paid (in millions) |
| 2018 | | | | |
| First quarter | | $ | 0.27 | | | $ | 6.7 | |
| Second quarter | | 0.29 | | | 7.2 | |
| Third quarter | | 0.29 | | | 7.0 | |
| Fourth quarter | | 0.29 | | | 6.8 | |
| 2019 | | | | |
| First quarter | | $ | 0.29 | | | $ | 6.7 | |
| Second quarter | | 0.30 | | | 7.0 | |
| Third quarter | | 0.30 | | | 7.0 | |
| Fourth quarter | | 0.30 | | | 6.9 | |
| 2020 | | | | |
| First quarter | | $ | 0.30 | | | $ | 7.0 | |
| Second quarter | | 0.30 | | | 6.8 | |
| Third quarter | | 0.31 | | | 7.1 | |
| Fourth quarter | | 0.31 | | | 8.2 | |
Follow-On Public Offering
In October 2020, we completed the public offering of 3,659,091 shares79.6% of our Class A common stock, no par value per share, which included the exercise in full by the underwriters of their option to purchase up to 477,272 additional shares of our Class A common stock, at the public offering price of $220.00 per share. We received $777.6 million from the offering, net of the underwriting discount and before deducting the offering expenses of $0.5 million.outstanding mortgage debt.
ATM Equity Offering Agreement
On July 24, 2020, we entered into an ATM Equity OfferingSM Sales AgreementWe have finance lease obligations with BofA Securities, Inc. and Jefferies LLC acting as sales agents and/or principals and Bank of America, N.A. and Jefferies LLC acting as forward purchasers, pursuant to which we may offer and sell, from time to time through the sales agents, sharessome of our Class A common stock, no par value, having an aggregate gross sales priceleased real estate. Interest rates related to this debt ranged from 2.5% to 8.5% at December 31, 2023. The leases have terms extending through August 2037.
Our other debt includes sellers’ notes and debt associated with our Canadian Financing Operations. The interest rates associated with our other debt ranged from 2.3% to 10.0% at December 31, 2023. This debt, which totaled $7.0 million at December 31, 2023, is due in various installments through February 28, 2029.
Future Principal Payments
The schedule of upfuture principal payments associated with real estate mortgages, finance lease liabilities, our senior notes and other debt as of December 31, 2023 was as follows:
| | | | | | | | |
| Year Ending December 31, | | ($ in millions) |
| 2024 | | $ | 82.3 | |
| 2025 | | 75.4 | |
| 2026 | | 51.0 | |
| 2027 | | 476.2 | |
| 2028 | | 109.6 | |
| Thereafter | | 1,686.3 | |
| Total principal payments | | $ | 2,480.8 | |
This table does not include future payments related to $400.0 million. To date, no sales have been made under the program.revolving lines of credit or non-recourse notes payable.
Note 9. 401(k) Profit Sharing, Deferred Compensation and Long-Term Incentive PlansNOTE 10. RETIREMENT PLANS AND POSTRETIREMENT BENEFITS
Company-Sponsored Defined Contribution 401(k) Plan
We have a defined contribution 401(k) plan and trust covering substantially all full-time employees. The annual contribution to the plan is at the discretion of our Board of Directors. Contributions of $9.0$44.0 million, $9.8$29.9 million, and $5.7$18.8 million were recognized for the years ended December 31, 2020, 20192023, 2022 and 2018,2021, respectively. Employees may contribute to the plan if they meet certain eligibility requirements.
Executive Management Non-Qualified Deferred Compensation and Supplemental Executive Retirement Plan
We offer a non-qualified deferred compensation and supplemental executive retirement plan (the “SERP”) to provide certain employees the ability to accumulate assets for retirement on a tax deferred basis. We may, depending on position, also make discretionary contributions to the SERP. These discretionary contributions could vest immediately or over a period of up to sevenfive years based on the employee’s age. Additionally, a participant may defer a portion of his or her compensation and receive the deferred amount upon certain events, including termination or retirement.
The following is a summary related to our SERP:
| | Year Ended December 31, |
| (Dollars in millions) | | 2020 | | 2019 | | 2018 |
| | Year Ended December 31, | | | | Year Ended December 31, |
| ($ in millions) | | ($ in millions) | | 2023 | | 2022 | | 2021 |
| Compensation expense | Compensation expense | | $ | 1.2 | | | $ | 0.9 | | | $ | 1.3 | |
| Total discretionary contribution | Total discretionary contribution | | $ | 0.9 | | | $ | 0.3 | | | $ | 0.8 | |
| Guaranteed annual return | Guaranteed annual return | | 5.00 | % | | 5.00 | % | | 5.00 | % | Guaranteed annual return | | 5.00 | % | | 5.00 | % | | 5.00 | % |
| | | | | | | | | | | | | | |
| | NOTES TO FINANCIAL STATEMENTS | F-24 | |
As of December 31, 20202023 and 2019,2022, the balance due to participants was $43.3$72.5 million and $37.9$63.0 million, respectively, and was included as a component of other long-term liabilities in the Consolidated Balance Sheets.
Note 10. Stock-Based Compensation
2009 Employee Stock PurchaseCompany-Sponsored Defined Benefit Pension Plan
The 2009 Employee Stock Purchase Plan (the “2009 ESPP”) allows forIn March 2023, we acquired UK-based Jardine Motors Group UK Limited, which included the issuance of 3,000,000 shares of our Class A common stock. The 2009 ESPP is intended to qualify as an “Employee Stock Purchase Plan” under Section 423 of the Internal Revenue Code of 1986, as amended, and is administered by the Compensation Committee of the Board of Directors.
Eligible employees are entitled to defer up to 10% of their base pay for the purchase of stock, up to $25,000 of fair market value of our Class A common stock annually. The purchase price is equal to 85% of the fair market value at the end of the purchase period.
Following is information regarding our 2009 ESPP:
| | | | | | | | |
Year Ended December 31, | | 2020 |
Shares purchased pursuant to 2009 ESPP | | 113,778 | |
Weighted average per share price of shares purchased | | $ | 130.17 | |
Weighted average per share discount from market value for shares purchased | | $ | 22.97 | |
| | |
As of December 31, | | 2020 |
Shares available for purchase pursuant to 2009 ESPP | | 1,412,727 | |
Compensation expense related to our 2009 ESPP is calculated based on the 15% discount from the per share market price on the date of grant.
2013 Stock Incentive Plan
Our 2013 Stock Incentive Plan, as amended, (the “2013 Plan”) allows for the grantassumption of a total of 3.8 million shares in the form of stock appreciation rights, qualified stock options, nonqualified stock options, restricted share awards and restricted stock unit awards (RSUs)company-sponsored defined benefit pension plan applicable to our officers, key employees, directors and consultants. The 2013 Plan is administered by the Compensation Committee of the Board of Directors and permits accelerated vesting of outstanding awards upon the occurrence of certain changes in control. As of December 31, 2020, 1,018,222 shares of Class A common stock were available for future grants. As of December 31, 2020, there were 0 stock appreciation rights, qualified stock options, nonqualified stock options or restricted share awards outstanding.
Restricted Stock Unit Awards
RSU grants vest over a period of time up to four years from the date of grant. RSU activity was as follows:
| | | | | | | | | | | |
| RSUs | | Weighted average per share price, grant date fair value |
| Balance, December 31, 2019 | 496,682 | | | $ | 90.00 | |
| Granted | 148,415 | | | 130.89 | |
| Vested | (90,128) | | | 108.45 | |
| Forfeited | (35,357) | | | 107.91 | |
| Balance, December 31, 2020 | 519,612 | | | 100.78 | |
We granted 43,915 time-vesting RSUs to members of our Board of Directors and employees in 2020. Each grant entitles the holder to receive shares of our Class A common stock upon vesting. A portion of the RSUs vest over four years, beginning on the second anniversary of the grant date, for employeessalaried present and vests quarterly for our Board of Directors, over their service period.
Certain key employees were granted 104,500 performance and time-vesting RSUspast employees. The pension plan was closed to future accrual in 2020. Of these, 98,120 shares were earned based on attaining various target levels of operational performance. Based on the levels of
| | | | | | | | | | | | | | |
| | NOTES TO FINANCIAL STATEMENTS | F-25 | |
performance achieved in 2020, a weighted average attainment level of 93.9% for these RSUs was met. These RSUs will vest over four years from the grant date.
Stock-Based Compensation
As of December 31, 2020, unrecognized stock-based compensation related to outstanding, but unvested RSUs was $13.7 million, which will be recognized over the remaining weighted average vesting period of 2.8 years.
Certain information regarding our stock-based compensation was as follows:
| | | | | | | | | | | | | | | | | | | | |
| Year Ended December 31, | | 2020 | | 2019 | | 2018 |
| Per share intrinsic value of non-vested stock granted | | $ | 130.89 | | | $ | 75.73 | | | $ | 86.84 | |
| Weighted average per share discount for compensation expense recognized under the 2009 ESPP | | 22.97 | | | 17.83 | | | 13.10 | |
| | | | | | |
| Fair value of non-vested stock that vested during the period (in millions) | | 108.5 | | 92.0 | | 92.0 |
| Stock-based compensation recognized in Consolidated Statements of Operations, as a component of selling, general and administrative expense (in millions) | | 23.2 | | 16.2 | | 13.4 |
| Tax benefit recognized in Consolidated Statements of Operations (in millions) | | 3.7 | | 2.7 | | 3.5 |
| Cash received from options exercised and shares purchased under all share-based arrangements (in millions) | | 14.8 | | 11.3 | | 10.6 |
| Tax deduction realized related to stock options exercised (in millions) | | 13.6 | | 9.8 | | 9.0 |
Note 11. Leases
Lease Accounting
We lease certain dealerships, office space, land and equipment. Leases with an initial term of 12 months or less are not recorded on the balance sheet; we recognize lease expense for these leases on a straight-line basis over the lease term. We have elected not to bifurcate lease and non-lease components related to leases of real property.
Most leases include one or more options to renew, with renewal terms that can extend the lease term from one to 25 or more years. The exercise of lease renewal options is at our sole discretion. Certain leases also include options to purchase the leased property. The depreciable life of assets and leasehold improvements are limited by the expected lease term, unless there is a transfer of title or purchase option reasonably certain of exercise.
Certain of our lease agreements include rental payments based on a percentage of retail sales over contractual levels and others include rental payments adjusted periodically for inflation. Our lease agreements do not contain any material residual value guarantees or material restrictive covenants.
We rent or sublease certain real estate to third parties.
We adopted Topic 842 as of January 1, 2019. Prior period amounts have not been adjusted and continue to be reported in accordance with our historic accounting under Topic 840.
| | | | | | | | | | | | | | |
| | NOTES TO FINANCIAL STATEMENTS | F-26 | |
The table below presents the lease-related liabilities and finance lease ROU assets recorded on the Consolidated Balance Sheets:
| | | | | | | | | | | | | | |
| (Dollars in millions) | | December 31, 2020 | | December 31, 2019 |
| Operating lease liabilities: | | | | |
| Current portion included in accrued liabilities | | $ | 30.8 | | | $ | 25.2 | |
| Noncurrent operating lease liabilities | | 246.7 | | | 238.5 | |
| Total operating lease liabilities | | 277.5 | | | 263.7 | |
| Finance lease liabilities: | | | | |
| Current portion included in current maturities of long-term debt | | 6.0 | | | 1.1 | |
| Long-term portion of lease liabilities in long-term debt | | 240.4 | | | 29.4 | |
| Total finance lease liabilities | | 246.4 | | | 30.5 | |
| Total lease liabilities | | $ | 523.9 | | | $ | 294.2 | |
| Finance lease right-of-use assets: | | | | |
Total finance lease right-of-use assets 1 | | $ | 253.9 | | | |
| Weighted-average remaining lease term: | | | | |
| Operating leases | | 5 years | | |
| Finance leases | | 12 years | | |
| Weighted-average discount rate: | | | | |
| Operating leases | | 4.69 | % | | |
| Finance leases | | 4.12 | % | | |
1 Finance lease right-of-use assets included in property and equipment, net of accumulated depreciation.
The components of lease costs, which were included in selling, general and administrative in our Consolidated Statements of Operations, were as follows:
| | | | | | | | |
| | Year Ended December 31, |
(Dollars in millions) | | 2020 |
Operating lease cost 1
| | $ | 41.6 | |
Variable lease cost 2
| | 3.1 | |
Amortization of finance lease right-of-use assets | | 4.5 | |
Interest on finance lease liabilities | | 3.4 | |
Sublease income | | (4.9) | |
Total lease costs | | $ | 47.7 | |
1 Includes short-term and month-to-month lease costs, which are immaterial.
2 Variable lease cost generally includes reimbursement for actual costs incurred by our lessors for common area maintenance, property taxes and insurance on leased real estate.
Rent expense, net of sublease income, for all operating leases was $41.3 million and $43.3 million for the years ended December 31, 2019 and 2018, respectively. These amounts are included as a component of selling, general and administrative expenses in our Consolidated Statements of Operations.
As of December 31, 2020, the maturities of our operating and finance lease liabilities were as follows:
| | | | | | | | | | | | | | |
| (Dollars in millions) | | Operating Lease Liabilities | | Finance Lease Liabilities |
| Year Ending December 31, | | | | |
| 2021 | | $ | 42.7 | | | $ | 11.9 | |
| 2022 | | 40.6 | | 25.7 |
| 2023 | | 34.7 | | 92.3 |
| 2024 | | 29.4 | | 13.3 |
| 2025 | | 26.9 | | 99.5 |
| Thereafter | | 199.7 | | 32.8 |
| Total minimum lease payments | | 374.0 | | 275.5 |
| Less: | | | | |
| Present value adjustment | | (96.5) | | | (29.1) | |
| Total lease liabilities | | $ | 277.5 | | | $ | 246.4 | |
| | | | | | | | | | | | | | |
| | NOTES TO FINANCIAL STATEMENTS | F-27 | |
The following table shows the changes in the benefit obligation, plan assets, and funded status for 2023 for the pension benefit plan.
| | | | | | | | | | |
| ($ in millions) | | 2023 | | |
| Change in projected benefit obligation: | | | | |
| Benefit obligation at beginning of year | | $ | — | | | |
| | | | |
| Interest cost | | 6.2 | | | |
| | | | |
| | | | |
| | | | |
| | | | |
| | | | |
| Benefit payments | | (6.6) | | | |
| | | | |
| | | | |
| | | | |
| | | | |
| Net transfer in (including the effect of any business combinations/divestitures) | | 172.8 | | | |
| | | | |
| Actuarial gain | | (3.3) | | | |
| Exchange rate changes | | 0.9 | | | |
| Benefit obligation at end of year | | $ | 170.0 | | | |
| | | | |
| Change in plan assets: | | | | |
| Fair value of plan assets at beginning of year | | $ | — | | | |
| Actual return on plan assets | | (2.2) | | | |
| Employer contributions | | 35.6 | | | |
| | | | |
| | | | |
| Benefit payments | | (6.6) | | | |
| | | | |
| | | | |
| | | | |
| | | | |
| Net transfer in (including effect of any business combinations/divestitures) | | 157.5 | | | |
| | | | |
| | | | |
| Exchange rate changes | | 1.0 | | | |
| Fair value of plan assets at end of year | | 185.3 | | | |
| Funded status at end of year | | $ | 15.3 | | | |
| | | | |
| Amounts recognized in Consolidated Balance Sheets: | | | | |
| Other non-current assets | | $ | 15.3 | | | |
| | | | |
| | | | |
| Net amount recognized | | $ | 15.3 | | | |
| | | | |
| Amounts recognized in accumulated other comprehensive income (loss) (pre-tax): | | | | |
| Net actuarial loss | | $ | (7.6) | | | |
The benefit obligation for our pension benefit is the projected benefit obligation based upon credited service as of the measurement date.
The December 31, 2023 pension funded status was favorably affected by employer contributions during the period together with an increase in the discount rate, partially offset by lower than expected asset returns.
Net Periodic (Benefit) Cost
Interest cost represents the increase in the projected benefit obligation, which is a discounted amount, due to the passage of time. The expected return on plan assets reflects the computed amount of current-year earnings from the investment of plan assets using an estimated long-term rate of return.
| | | | | | | | | | | | |
| | Year Ended December 31, |
| ($ in millions) | | 2023 | | | | |
| | | | | | |
| Interest cost | | $ | 6.2 | | | | | |
| Expected return on plan assets | | (8.8) | | | | | |
| | | | | | |
| | | | | | |
| | | | | | |
| | | | | | |
| | | | | | |
| Net periodic (benefit) cost | | $ | (2.6) | | | | | |
The components of net periodic pension (benefits) costs are included in other income (expense) in the Consolidated Statements of Operations.
| | | | | | | | | | | | | | |
| | NOTES TO FINANCIAL STATEMENTS | F-28 | |
Actuarial Assumptions
The weighted-average assumptions used to determine the benefit obligation and net periodic pension cost of our pension plan were as follows:
| | | | | | | | | | | | |
| | Year Ended December 31, |
| | 2023 | | | | |
| Actuarial assumption used to determine benefit obligation: | | | | | | |
| Discount rate | | 4.78 | % | | | | |
| Actuarial assumption used to determine net periodic pension cost: | | | | | | |
| Discount rate | | 4.86 | % | | | | |
| Expected return on plan assets | | 6.79 | % | | | | |
The discount rate used in the determination of pension benefit obligation and pension expense was determined based on a review of long-term high-grade bonds of appropriate duration.
The expected return on plan assets assumption is based upon an analysis of historical long-term returns for various investment categories, as measured by appropriate indices and forward looking expectations of returns. These indices are weighted based upon the extent to which plan assets are invested in the particular categories in arriving at our determination of a composite expected return. The expected rate of return on assets has been set in line with the Trustee’s target return.
Plan Assets
There have been no changes in the methodologies used since the assumption of the pension plan in 2023. The following tables set forth by level, within the fair value hierarchy, the investments at fair value for our company-sponsored pension benefit plan:
| | | | | | | | | | | | | | | | | | | | | | | | | | | | | | | | | | |
| | As of December 31 |
| | 2023 | | |
| ($ in millions) | | Level 1 | | Level 2 | | Level 3 | | Total | | | | | | | | |
| Diversified Growth Funds | | $ | — | | | $ | 32.4 | | | $ | — | | | $ | 32.4 | | | | | | | | | |
| Liability Driven Instrument | | — | | | 113.7 | | | — | | | 113.7 | | | | | | | | | |
| Cash | | 39.2 | | | — | | | — | | | 39.2 | | | | | | | | | |
| Total investments at fair value | | $ | 39.2 | | | $ | 146.1 | | | $ | — | | | $ | 185.3 | | | | | | | | | |
We have formal investment policy guidelines for our company-sponsored pension plan. These guidelines were set by our pension plan Trustee. The Trustee has appointed an investment manager (Fiduciary Manager) to manage the pension plan’s assets on a discretionary basis and to provide investment advisory services to the Trustee. The balance within and between these investments will be determined from time-to-time at the discretion of the Fiduciary Manager, with the objective of maximizing the probability of achieving the pension plan’s investment strategy set by the Trustee, subject to maintaining risk within a limit agreed by the Trustee. The Trustee’s duties include periodically reviewing and modifying those investment policy guidelines as necessary and ensuring that the policy is adhered to and the investment objectives are met.
The Trustee’s investment objectives include the acquisition of suitable assets of appropriate liquidity which will generate an overall level of return that is sufficient to meet all liabilities as and when they fall due, and to ensure the security, quality, and profitability of the portfolio as a whole; to limit the risk of the assets failing to meet the liabilities, both over the long-term and on a shorter-term basis; and to minimize the long-term costs of the pension plan by maximizing the return on the assets while having regard to the investment objectives.
The investment strategy makes use of three key types of investments:
•a range of low-risk instruments that provide a broad match to changes in liability values (including high-quality corporate bonds);
•a portfolio of secure income assets; and
•a diversified portfolio of return-seeking assets (including equities, listed real assets, diversifying strategies, hedge funds, private markets, alternative credit and downside protection).
The pension plan will hold assets in cash and other money market instruments from time to time as may be deemed appropriate. The long-term asset allocation targets adopted by the Fiduciary Manager is set out below:
| | | | | | | | | | | | | | |
| | NOTES TO FINANCIAL STATEMENTS | F-29 | |
| | | | | |
| Liability matching | 38 | % |
| Secure income | 8 | % |
| Diversified return seeking | 54 | % |
Periodically, the Trustee reviews the target allocations to determine what adjustments should be made based on changing economic and market conditions and specific liquidity requirements.
We currently do not anticipate making any cash contributions to the plan in 2024.
Estimated future benefit payments are as follows for the years indicated:
| | | | | |
| ($ in millions) | Pension Benefit Plans |
| 2024 | $ | 8.8 | |
| 2025 | 9.2 | |
| 2026 | 9.9 | |
| 2027 | 10.0 | |
| 2028 | 10.1 | |
| 2029 - 2033 | 50.6 | |
Note 12. Derivative Financial InstrumentsNOTE 11. DERIVATIVE FINANCIAL INSTRUMENTS
We account for derivative financial instruments by recording the fair value as either an asset or liability in our Consolidated Balance Sheets and recognize the resulting gains or losses as adjustments to accumulated other comprehensive income (loss). We do not hold or issue derivative financial instruments for trading or speculative purposes. For derivative instruments that hedge the exposure to variability in expected future cash flows that are designated and qualify as cash flow hedges, the gain or loss on the derivative instrument is reported as a component of accumulated other comprehensive loss (AOCI) in stockholders’ equity and reclassified into earnings in the same period or periods during which the hedged transaction affects earnings. To receive hedge accounting treatment, cash flow hedges must be highly effective in offsetting changes to expected future cash flows on hedged transactions.
To hedge the business exposure to rising interest rates on a portion of our variable rate debt, we entered into a 5-year, zero-cost interest rate collar, with an aggregate notional amount of $300 million, effective June 1, 2019. This instrument hedges interest rate risk related to a portion of our $1.6 billion of non-trade floor plan notes payable.
The table below presents the liabilities related to the zero-cost interest rate collar:
| | | | | | | | | | | | | | | | | | | | |
| (Dollars in millions) | | Accrued Liabilities | | Other Long-Term Liabilities | | Total |
| Balance as of December 31, 2018 | | $ | 0 | | | $ | 0 | | | $ | 0 | |
| Amounts reclassified from AOCI to floorplan interest expense | | 0 | | | 0 | | | 0 | |
| Loss recorded from interest rate collar | | (0.1) | | | (0.9) | | | (1.0) | |
| Balance as of December 31, 2019 | | (0.1) | | | (0.9) | | | (1.0) | |
| | | | | | |
| Amounts reclassified from AOCI to floorplan interest expense | | 1.8 | | | 0 | | | 1.8 | |
| Loss recorded from interest rate collar | | (4.3) | | | (5.1) | | | (9.4) | |
| Balance as of December 31, 2020 | | $ | (2.6) | | | $ | (6.0) | | | $ | (8.6) | |
As of December 31, 2020, the amount of net losses we expect to reclassify from AOCI into interest expense in earnings within the next twelve months is $2.8 million. However, the actual amount reclassified could vary due to future changes in the fair value of these derivatives.
We alsohave entered into 2 other, immaterial andfour offsetting derivative arrangements that do not qualify for hedge accounting. These are both related to a securitization facility, effective October 2, 2020.2020 and June 15, 2021. We both purchased and sold offsetting interest rate caps, bothall of which are 5-years long with notional amounts of $60totaling $298 million. As of December 31, 2020,2023, the balance on bothin all four agreements was an offsetting $0.5 million. The amounts for these are$12.3 million and was located in other non-currentcurrent assets and accrued liabilities, respectively.
See Note 1314 – Fair Value Measurements for information on the fair value of the derivative contract. We did not have any activity related to the effect of derivative instruments in 2018.contracts.
NOTE 12. EQUITY
Common Stock
The shares of common stock are not convertible into any other series or class of our securities. Holders of common stock are entitled to one vote for each share held of record.
Repurchases of Common Stock
Repurchases of our common stock occurred under repurchase authorizations granted by our Board of Directors and related to shares withheld as part of the vesting of restricted stock units (RSUs).
Share repurchases under our authorization were as follows:
| | | | | | | | | | | | | | | | | | | | | | | | | | |
| | | Repurchases Occurring in 2023 | | Cumulative Repurchases as of December 31, 2023 |
| | | Shares | | Average Price | | Shares | | Average Price |
| Share repurchase authorization | | 142,729 | | | $ | 240.81 | | | 7,047,510 | | | $ | 174.96 | |
As of December 31, 2023, we had $467.0 million available for repurchases pursuant to our share repurchase authorization.
In addition, during 2023, we repurchased 70,692 shares at an average price of $204.96 per share, for a total of $14.5 million, related to tax withholdings associated with the vesting of RSUs. The repurchase of shares related to
| | | | | | | | | | | | | | |
| | NOTES TO FINANCIAL STATEMENTS | F-30 | |
tax withholdings associated with share-based awards does not reduce the number of shares available for repurchase as approved by our Board of Directors.
The following is a summary of our repurchases in the years ended December 31, 2023, 2022 and 2021:
| | | | | | | | | | | | | | | | | | | | |
| | Year Ended December 31, |
| | 2023 | | 2022 | | 2021 |
| Shares repurchased pursuant to repurchase authorizations | | 142,729 | | | 2,428,850 | | | 756,883 | |
| Total purchase price ($ in millions) | | $ | 34.4 | | | $ | 671.4 | | | $ | 214.8 | |
| Average purchase price per share | | $ | 240.81 | | | $ | 276.42 | | | $ | 283.75 | |
| Shares repurchased in association with tax withholdings on the vesting of RSUs | | 70,692 | | | 56,911 | | | 54,318 | |
Dividends
We declared and paid dividends on our common stock as follows:
| | | | | | | | | | | | | | |
| Quarter declared | | Dividend amount per share | | Total amount of dividends paid ($ in millions) |
| 2021 | | | | |
| First quarter | | $ | 0.31 | | | $ | 8.2 | |
| Second quarter | | 0.35 | | | 9.3 | |
| Third quarter | | 0.35 | | | 10.6 | |
| Fourth quarter | | 0.35 | | | 10.6 | |
| 2022 | | | | |
| First quarter | | $ | 0.35 | | | $ | 10.3 | |
| Second quarter | | 0.42 | | | 11.9 | |
| Third quarter | | 0.42 | | | 11.6 | |
| Fourth quarter | | 0.42 | | | 11.4 | |
| 2023 | | | | |
| First quarter | | $ | 0.42 | | | $ | 11.5 | |
| Second quarter | | 0.50 | | | 13.8 | |
| Third quarter | | 0.50 | | | 13.8 | |
| Fourth quarter | | 0.50 | | | 13.7 | |
NOTE 13. SHARE-BASED COMPENSATION PLANS
2009 Employee Stock Purchase Plan
The 2009 Employee Stock Purchase Plan (2009 ESPP) allows for the issuance of 3.0 million shares of our common stock. The 2009 ESPP is intended to qualify as an “Employee Stock Purchase Plan” under Section 423 of the Internal Revenue Code of 1986, as amended, and is administered by the Compensation Committee of the Board of Directors. As of December 31, 2023, 1.0 million shares were available for purchase pursuant to the 2009 ESPP.
Eligible employees are entitled to defer up to 10% of their base pay for the purchase of stock, up to $25,000 of fair market value of our common stock annually. The purchase price is equal to 85% of the fair market value at the end of the purchase period. Compensation expense related to our 2009 ESPP is calculated based on the 15% discount from the per share market price on the date of grant.
For the year ended December 31, 2023, 124,154 shares were purchased pursuant to the 2009 ESPP at a weighted average price per share of $235.64, with weighted average per share discount from market value of $41.58.
Following is information regarding our 2009 ESPP:
| | | | | | | | | | | | | | | | | | | | |
| | Year Ended December 31, |
| | 2023 | | 2022 | | 2021 |
| Cash received related to ESPP purchases ($ in millions) | | $ | 29.3 | | | $ | 34.4 | | | $ | 29.6 | |
| Tax deductions associated with ESPP disqualifying dispositions ($ in millions) | | $ | 3.9 | | | $ | 3.1 | | | $ | 1.9 | |
| Weighted average per share discount for compensation expense recognized | | $ | 41.58 | | | $ | 38.57 | | | $ | 50.58 | |
| | | | | | | | | | | | | | |
| | NOTES TO FINANCIAL STATEMENTS | F-31 | |
2013 Stock Incentive Plan
Our 2013 Stock Incentive Plan, as amended, (2013 Plan) allows for the grant of a total of 3.8 million shares in the form of stock appreciation rights, qualified stock options, non-qualified stock options, restricted share awards and restricted stock unit awards (RSUs) to our officers, key employees, directors and consultants. The 2013 Plan is administered by the Compensation Committee of the Board of Directors and permits accelerated vesting of outstanding awards upon the occurrence of certain changes in control. As of December 31, 2023, 718,731 shares of common stock were available for future grants. As of December 31, 2023, there were no stock appreciation rights, qualified stock options, non-qualified stock options or restricted share awards outstanding.
Restricted Stock Unit Awards
RSU grants vest over a period of time up to four years from the date of grant. RSU activity was as follows:
| | | | | | | | | | | |
| RSUs | | Weighted average per share grant date fair value |
| Balance, December 31, 2022 | 415,878 | | | $ | 159.85 | |
| Granted | 327,955 | | | 302.35 | |
| Vested | (182,056) | | | 174.61 | |
| Forfeited | (32,101) | | | 214.41 | |
| Balance, December 31, 2023 | 529,676 | | | 287.04 | |
We granted 48,872 time-vesting RSUs to members of our Board of Directors and employees in 2023. Each grant entitles the holder to receive shares of our common stock upon vesting. A portion of the RSUs vest over three years for employees and vest quarterly for our Board of Directors, over their service period.
We granted 279,083 performance and time-vesting RSUs to our employees in 2023. These shares will be earned either over one or three-year performance periods based on attaining various target levels of operational performance, as well as market-based returns. These RSUs will vest over three or four years from the grant date.
Time-vesting RSUs and performance and time-vesting RSUs that are based on our financial performance metrics or non-financial operating goals are valued using the market value of our common stock on the date of grant, discounted for the present value of expected dividends. On the date of grant, we estimated the fair value of the total shareholder return (TSR) component of the performance and time-vesting RSUs using a Monte Carlo simulation model. The performance and time-vesting RSUs granted during the years presented are contingent on the achievement of our financial performance metrics, our comparative market-based returns, or the achievement of financial and non-financial operating goals.
The assumptions for the valuation of time-vesting RSUs and performance and time-vesting RSUs granted are summarized as follows:
| | | | | | | | | | | | | | | | | | | | |
| | Year Ended December 31, |
| | 2023 | | 2022 | | 2021 |
| Time-vesting RSUs | | | | | | |
| Number of shares granted | | 48,872 | | | 18,080 | | | 33,665 | |
| Grant date fair value per share | | $ | 268.60 | | | $ | 283.86 | | | $ | 312.83 | |
| Weighted-average assumptions/inputs: | | | | | | |
| Expected dividend yield | | 0.6 | % | | 0.5 | % | | 0.4 | % |
| Range of risk-free interest rates | | 3.6% - 4.7% | | 1.2% - 4.5% | | 0.3% - 1.0% |
| | | | | | |
| Performance and Time-vesting RSUs | | | | | | |
| Number of shares granted | | 279,083 | | | 120,340 | | | 94,001 | |
| Grant date fair value per share | | $ | 313.84 | | | $ | 296.28 | | | $ | 308.59 | |
| Weighted-average assumptions/inputs: | | | | | | |
| Expected dividend yield | | 0.6 | % | | 0.5 | % | | 0.4 | % |
| Range of risk-free interest rates | | 3.6% - 4.5% | | 0.4% - 3.2% | | 0.3% -0.7% |
| | | | | | | | | | | | | | |
| | NOTES TO FINANCIAL STATEMENTS | F-32 | |
Certain information regarding RSU grant vesting was as follows:
| | | | | | | | | | | | | | | | | | | | |
| | Year Ended December 31, |
| ($ in millions) | | 2023 | | 2022 | | 2021 |
| Number of shares vested | | 182,056 | | 147,441 | | 141,857 |
| Weighted average per share fair value of non-vested shares that vested during the period | | $ | 174.61 | | | $ | 110.77 | | | $ | 107.50 | |
| Tax deduction realized related to shares that vested during the period ($ in millions) | | $ | 25.8 | | | $ | 20.3 | | | $ | 26.3 | |
Share-Based Compensation Expense
Share-based compensation is recognized as a component of SG&A in our Consolidated Statements of Operations. SG&A expense related to all share-based compensation is as follows:
| | | | | | | | | | | | | | | | | | | | |
| | Year Ended December 31, |
| ($ in millions) | | 2023 | | 2022 | | 2021 |
| Restricted stock unit awards | | $ | 35.6 | | | $ | 35.0 | | | $ | 29.5 | |
| Employee stock purchase plan | | 5.2 | | | 6.1 | | | 5.2 | |
| Total share-based compensation | | 40.8 | | 41.1 | | 34.7 |
| Tax expense recognized | | (7.6) | | | (6.4) | | | (8.1) | |
| Net reduction in net income | | $ | 33.2 | | | $ | 34.7 | | | $ | 26.6 | |
As of December 31, 2023, unrecognized share-based compensation related to outstanding, but unvested RSUs was $56.5 million, which will be recognized over the remaining weighted average vesting period of 2.7 years.
Note 13. Fair Value MeasurementsNOTE 14. FAIR VALUE MEASUREMENTS
Factors used in determining the fair value of our financial assets and liabilities are summarized into three broad categories:
•Level 1 - quoted prices in active markets for identical securities;
•Level 2 - other significant observable inputs, including quoted prices for similar securities, interest rates, prepayment spreads, credit risk; and
•Level 3 - significant unobservable inputs, including our own assumptions in determining fair value.
We determined the carrying value of cash equivalents, accounts receivable, trade payables, accrued liabilities, finance receivables, and short-term borrowings approximate their fair values because of the nature of their terms and current market rates of these instruments. We believe the carrying value of our variable rate debt approximates fair value.
We have investments primarily consistingAs of December 31, 2023, we had sold our investment inremaining shares of Shift Technologies, Inc. (Shift), a San Francisco-based digital retail company. Shift has a readily determinable fair value following Shift going public in a reverse-merger deal with Insurance Acquisition, a special purpose acquisition company, in the fourth quarter of 2020. We
| | | | | | | | | | | | | | |
| | NOTES TO FINANCIAL STATEMENTS | F-28 | |
calculated the fair value of this investment using quoted prices for the identical asset (Level 1) and recorded the fair value as part of other non-current assets. An additional component of our investment in Shift consists of shares in escrow subject to release upon certain market conditions being met. The fair value of this component of our investment in Shift is measured using observable Level 2 market expectations at each measurement date and is recorded as part of other non-current assets.. For the year ended December 31, 2020,2023, we recognized a $43.4$1.7 million unrealized investment gainloss related to Shift which was recorded as a component of Other Income, net.other income (expense), net in our Consolidated Statement of Operations, compared to a $39.2 million loss for the year ended December 31, 2022.
We have fixed rate debt primarily consisting of amounts outstanding under our senior notes, non-recourse notes payable, and real estate mortgages. We calculated the estimated fair value of the senior notes using quoted prices for the identical liability (Level 1) and. The fair value of non-recourse notes payable are measured using observable Level 2 market expectations at each measurement date. The calculated the estimated fair valuevalues of the fixed rate real estate mortgages usingand finance lease liabilities use a discounted cash flow methodology with estimated current interest rates based on a similar risk profile and duration (Level 2). The fixed cash flows are discounted and summed to compute the fair value of the debt. As of December 31, 2020, our real estate mortgages and other debt, which includes finance lease liabilities, had maturity dates between January 1, 2020 and August 31, 2038.
We have derivative instruments consisting of an interest rate collar and an offsetting set of interest rate caps. The fair value of derivative assets and liabilities are measured using observable Level 2 market expectations at each measurement date and is recorded as other current assets, current liabilities and other long-term liabilities in the Consolidated Balance Sheets. See Note 1211 – Derivative Financial Instruments for more details regarding our derivative contracts.
Nonfinancial assets such as goodwill, franchise value, or other long-lived assets are measured and recorded at fair value during a business combination or when there is an indicator of impairment. We evaluate our goodwill and franchise value using a qualitative assessment process. If the qualitative factors determine that it is more likely than
| | | | | | | | | | | | | | |
| | NOTES TO FINANCIAL STATEMENTS | F-33 | |
not that the carrying value exceeds the fair value, we would further evaluate for potential impairment using a quantitative assessment. The quantitative assessment estimates fair values using unobservable (Level 3) inputs by discounting expected future cash flows of the store. The forecasted cash flows contain inherent uncertainties, including significant estimates and assumptions related to growth rates, margins, working capital requirements, and cost of capital, for which we utilize certain market participant-based assumptions we believe to be reasonable. We estimate the value of other long-lived assets that are recorded at fair value on a non-recurring basis on a market valuation approach. We use prices and other relevant information generated primarily by recent market transactions involving similar or comparable assets, as well as our historical experience in divestitures, acquisitions and real estate transactions. Additionally, we may use a cost valuation approach to value long-lived assets when a market valuation approach is unavailable. Under this approach, we determine the cost to replace the service capacity of an asset, adjusted for physical and economic obsolescence. When available, we use valuation inputs from independent valuation experts, such as real estate appraisers and brokers, to corroborate our estimates of fair value. Real estate appraisers’ and brokers’ valuations are typically developed using one or more valuation techniques including market, income and replacement cost approaches. Because these valuations contain unobservable inputs, we classified the measurement of fair value of long-lived assets as Level 3.
There were no changes to our valuation techniques during the year ended December 31, 2020.2023.
Below are our investments that are measured at fair value (in millions):
| | | | | | | | | | | | | | | | | | | | |
| Fair Value at December 31, 2020 | | Level 1 | | Level 2 | | Level 3 |
| Measured on a recurring basis: | | | | | | |
| Investments | | $ | 97.9 | | | $ | 9.4 | | | $ | 0 | |
Below are our derivative assets and liabilities that are measured at fair value (in millions):on a recurring basis:
| | | | | | | | | | | | | | | | | | | | |
| Fair Value at December 31, 2020 | | Level 1 | | Level 2 | | Level 3 |
| Measured on a recurring basis: | | | | | | |
| Derivative asset | | $ | 0 | | | $ | 0.5 | | | $ | 0 | |
| Derivative liability | | $ | 0 | | | $ | 9.0 | | | $ | 0 | |
| | | | | | | | | | | | | | | | | | | | | | | | | | | | | | | | | | | | | | | | | | | | | | | | | | |
| | As of December 31 |
| | 2023 | | 2022 |
| ($ in millions) | | Carrying Value | | Level 1 | | Level 2 | | Level 3 | | Carrying Value | | Level 1 | | Level 2 | | Level 3 |
| Investments | | | | | | | | | | | | | | | | |
| Shift Technologies, Inc. | | $ | — | | | $ | — | | | $ | — | | | $ | — | | | $ | 1.8 | | | $ | 1.8 | | | $ | — | | | $ | — | |
| | | | | | | | | | | | | | | | |
| Derivatives | | | | | | | | | | | | | | | | |
| Derivative assets | | 12.3 | | | — | | | 12.3 | | | — | | | 22.1 | | | — | | | 22.1 | | | — | |
| Derivative liabilities | | 12.3 | | | — | | | 12.3 | | | — | | | 22.1 | | | — | | | 22.1 | | | — | |
| | | | | | | | | | | | | | | | |
Fixed rate debt (1) | | | | | | | | | | | | | | | | |
| 4.625% Senior notes due 2027 | | 400.0 | | | 380.0 | | | — | | | — | | | 400.0 | | | 364.0 | | | — | | | — | |
| 4.375% Senior notes due 2031 | | 550.0 | | | 492.3 | | | — | | | — | | | 550.0 | | | 448.3 | | | — | | | — | |
| 3.875% Senior notes due 2029 | | 800.0 | | | 716.0 | | | — | | | — | | | 800.0 | | | 656.0 | | | — | | | — | |
| Non-recourse notes payable | | 1,705.6 | | | — | | | 1,705.1 | | | — | | | 422.2 | | | — | | | 411.8 | | | — | |
| Real estate mortgages and other debt | | 603.5 | | | — | | | 644.5 | | | — | | | 489.0 | | | — | | | 399.0 | | | — | |
(1)Excluding unamortized debt issuance cost
No impairment charges were recorded in 2023 or 2022. During the third quarter of 2021, we recognized asset impairments of $1.9 million related to the franchise value associated with certain dealership locations indicating carrying values less than fair values. These locations were subsequently sold in the fourth quarter of 2021.
| | | | | | | | | | | | | | |
| | NOTES TO FINANCIAL STATEMENTS | F-29F-34 | |
A summary of the aggregate carrying values, excluding unamortized debt issuance cost, and fair values of our long-term fixed interest rate debt is as follows (in millions):
| | | | | | | | | | | | | | |
| December 31, | | 2020 | | 2019 |
| | | | |
| Carrying value | | | | |
| 5.250% Senior notes due 2025 | | $ | 300.0 | | | $ | 300.0 | |
| 4.625% Senior notes due 2027 | | 400.0 | | | 400.0 | |
| 4.375% Senior notes due 2031 | | 550.0 | | | 0 | |
| Real estate mortgages and other debt | | 714.8 | | | 466.6 | |
| | $ | 1,964.8 | | | $ | 1,166.6 | |
| | | | |
| Fair value | | | | |
| 5.250% Senior notes due 2025 | | $ | 311.6 | | | $ | 315.0 | |
| 4.625% Senior notes due 2027 | | 425.0 | | | 412.0 | |
| 4.375% Senior notes due 2031 | | 589.9 | | | 0 | |
| Real estate mortgages and other debt | | 713.2 | | | 468.7 | |
| | $ | 2,039.7 | | | $ | 1,195.7 | |
During the second quarter of 2020, there were indications of a triggering event at certain reporting units. We tested the goodwill and franchise value for these locations. As a result, we identified certain reporting units where it was more likely than not the fair values were less than the carrying amounts, and recorded non-cash impairment charges of $4.4 million and $3.5 million, which was equal to the difference between the fair value and the carrying value for franchise value and goodwill, respectively. The impairment charges for both goodwill and franchise value reduced the carrying value to zero at these locations. One of these locations was subsequently sold in the fourth quarter of 2020.
Note 14. Income TaxesNOTE 15. INCOME TAXES
Income Tax Provision
The income tax provision was as follows:
| | Year Ended December 31, |
| (Dollars in millions) | | 2020 | | 2019 | | 2018 |
| | Year Ended December 31, | | | | Year Ended December 31, |
| ($ in millions) | | ($ in millions) | | 2023 | | 2022 | | 2021 |
| Current: | Current: | | | | | | |
| Federal | Federal | | $ | 108.9 | | | $ | 40.0 | | | $ | 30.3 | |
| Federal | |
| Federal | |
| State | State | | 50.3 | | | 24.0 | | | 11.5 | |
| 159.2 | | | 64.0 | | | 41.8 | |
| Foreign | |
| | 286.6 | |
| Deferred: | Deferred: | |
| Federal | Federal | | 17.6 | | | 34.7 | | | 20.4 | |
| Federal | |
| Federal | |
| State | State | | 1.4 | | | 5.2 | | | 9.6 | |
| 19.0 | | | 39.9 | | | 30.0 | |
| Foreign | |
| | 64.0 | |
| Total | Total | | $ | 178.2 | | | $ | 103.9 | | | $ | 71.8 | |
At December 31, 2020 and 2019,2023, we had income taxes payable of $33.0$28.9 million and $10.1 million, respectively included as a component of accrued liabilities in our Consolidated Balance Sheets. At December 31, 2022, we had prepaid income taxes of $33.6 million included as a component of other current assets in our Consolidated Balance Sheets.
| | | | | | | | | | | | | | |
| | NOTES TO FINANCIAL STATEMENTS | F-30 | |
The reconciliation between amounts computed using the federal income tax rate of 21% and our income tax provision is shown in the following tabulation:
| | Year Ended December 31, |
| (Dollars in millions) | | 2020 | | 2019 | | 2018 |
| | Year Ended December 31, | | | | Year Ended December 31, |
| ($ in millions) | | ($ in millions) | | 2023 | | 2022 | | 2021 |
| Federal tax provision at statutory rate | Federal tax provision at statutory rate | | $ | 136.2 | | | $ | 78.8 | | | $ | 70.9 | |
| State taxes, net of federal income tax benefit | State taxes, net of federal income tax benefit | | 40.4 | | | 23.6 | | | 16.1 | |
| | Non-deductible items | Non-deductible items | | 2.8 | | | 2.6 | | | 1.5 | |
| Permanent differences related to stock compensation | | (0.5) | | | 0.2 | | | (0.1) | |
| Permanent differences related to share-based compensation | |
| Net change in valuation allowance | Net change in valuation allowance | | 0.5 | | | (0.5) | | | 0.5 | |
| General business credits | General business credits | | (1.3) | | | (0.9) | | | (1.1) | |
| Deferred remeasurement for change in statutory tax rate | | 0 | | | 0 | | | (15.8) | |
| Foreign rate differential | |
| Other | Other | | 0.1 | | | 0.1 | | | (0.2) | |
| Income tax provision | Income tax provision | | $ | 178.2 | | | $ | 103.9 | | | $ | 71.8 | |
| | | | | | | | | | | | | | |
| | NOTES TO FINANCIAL STATEMENTS | F-35 | |
Deferred Taxes
Individually significant components of the deferred tax assets and (liabilities) are presented below:
| | December 31, |
| (Dollars in millions) | | 2020 | | 2019 |
| | December 31, | | | | December 31, |
| ($ in millions) | | ($ in millions) | | 2023 | | 2022 |
| Deferred tax assets: | Deferred tax assets: | | | | |
| Deferred revenue and cancellation reserves | Deferred revenue and cancellation reserves | | $ | 64.2 | | | $ | 48.4 | |
| Allowances and accruals, including state tax carryforward amounts | | 55.6 | | | 42.1 | |
| Deferred revenue and cancellation reserves | |
| Deferred revenue and cancellation reserves | |
| Allowances and accruals | |
| Lease liability | Lease liability | | 73.4 | | | 69.7 | |
| Credits and other | Credits and other | | 3.4 | | | 0.3 | |
| Net operating losses | |
| Capital loss | |
| Valuation allowance | Valuation allowance | | (1.1) | | | (0.6) | |
| Total deferred tax assets | Total deferred tax assets | | 195.5 | | | 159.9 | |
| | Deferred tax liabilities: | Deferred tax liabilities: | |
| Deferred tax liabilities: | |
| Deferred tax liabilities: | |
| Inventories | |
| Inventories | |
| Inventories | Inventories | | (44.9) | | | (40.0) | |
| Goodwill | Goodwill | | (76.5) | | | (60.7) | |
| Property and equipment, principally due to differences in depreciation | Property and equipment, principally due to differences in depreciation | | (139.0) | | | (113.6) | |
| Right-of-use assets | | (69.8) | | | (66.6) | |
| Right of use asset | |
| Prepaid expenses and other | Prepaid expenses and other | | (11.6) | | | (10.1) | |
| Total deferred tax liabilities | Total deferred tax liabilities | | (341.8) | | | (291.0) | |
| Total | Total | | $ | (146.3) | | | $ | (131.1) | |
|
We consider whether it is more likely than not that some portion or all of the deferred tax assets will not be realized. The ultimate realization of deferred tax assets is dependent upon future taxable income during the periods in which those temporary differences become deductible. We consider the scheduled reversal of deferred tax liabilities (including the impact of available carryback and carryforward periods), projected future taxable income, and tax-planning strategies in making this assessment.
As of December 31, 2020,2023, we had a $1.1$71.3 million valuation allowance recorded associated with our deferred tax assets. The entireOf the total valuation allowance, is associated with$29.7 million relates to our capital loss resulting from the sale of shares in Shift Technologies Inc. (Shift) and $41.6 million relates to state net operating losses generated in current and previous years. During the year, the capital loss valuation allowance decreased $4.3 million as a result of available capital gain during the carryback period and a reduction in the state deferred tax rate offset by further reduction in the Shift investment valuation in the current year. A valuation allowance remains for the capital loss benefit of which is not currently expected to be realized. The state NOL valuation allowance increased $0.5$24.2 million in the current year as a result of losses incurred, the benefits of which are not expected to be realized.
As of December 31, 2020,2023, we had state net operating loss (NOL) carryforward amounts totaling approximately $2.7$41.6 million, tax effected, with expiration dates through 2040.2043. We believe that it is more likely than not that the benefit from certain state NOL carryforward amounts will not be realized. In recognition of this risk, we have recorded a valuation allowance of $1.1$41.6 million on the deferred tax assets relating to these state NOL carryforwards as discussed above.
As of December 31, 2023, we have a capital loss deferred tax asset of approximately $33.7 million, tax effected. There are $4.0 million, tax effected, of capital gains that can be offset by the capital loss during the carryback period. The remaining $29.7 million capital loss carryforward, if unused, will expire in 2028. We believe that it is more likely than not that remaining benefit from the capital loss carryforward will not be realized. In recognition of this risk, we have recorded a valuation allowance of $29.7 million on the deferred tax assets relating capital loss carryforward.
We have taken the position that we intend to indefinitely reinvest the earnings of our Canadian subsidiaries to ensure there is sufficient working capital to expand operations in Canada. Accordingly, we have not recorded a deferred tax liability related to foreign withholding taxes on approximately $71.1 million of undistributed earnings of these Canadian subsidiaries as of December 31, 2023. Approximately $3.6 million of tax would be payable upon the remittance of these undistributed earnings. We do not intend to indefinitely reinvest the earnings of our U.K. subsidiaries, however, we have not recorded a deferred tax liability related to foreign withholding taxes due to a 0% treaty rate on dividends.
| | | | | | | | | | | | | | |
| | NOTES TO FINANCIAL STATEMENTS | F-31F-36 | |
Unrecognized Tax Benefits
We had 0 unrecognized tax benefits recorded as of December 31, 2019 and 2018. The following is a reconciliation of our unrecognized tax benefits for 2020:December 31, 2023, 2022, and 2021:
| | | | | |
(Dollars$ in millions) | |
Balance, December 31, 20192021 | $ | 00.3 | |
| Increase related to tax positions taken - current year | 0.20.3 | |
Balance, December 31, 20202022 | 0.6 | |
| Increase related to tax positions taken - current year | 0.3 | |
| Balance, December 31, 2023 | $ | 0.20.9 | |
Open tax years at December 31, 20202023 included the following:
| | | | | |
| Federal | 20172020 - 20202023 |
24 statesStates (30) | 20162019 - 2023 |
| Canada | 2021 - 2023 |
| United Kingdom | 2020 - 2023 |
Note 15. AcquisitionsNOTE 16. ACQUISITIONS
In 2020,2023, we completed the following acquisitions:
•In February 2020, Sacramento Lexus and Roseville Lexus2023, Thornhill Acura in California.Canada.
•In March 2023, Jardine Motors Group UK Limited in the United Kingdom.
•In June 2020, Hank’s Body Shop2023, Priority Auto Group in Billings, Montana.Virginia.
•In June 2020, Chrysler Dodge Jeep Ram of Bend and Nissan of Bend2023, Wade Ford in Oregon.Georgia.
•In July 2020, Subaru of Thousand Oaks in California.
•In July 2020, BMW of San Francisco in California.
•In August 2020, John Eagle Auto Group,a 10 store platform2023, Hill Country Honda in Texas.
•In September 2020, Knoxville Chrysler Dodge Jeep RamAugust 2023, Arden Auto Group in Tennessee.
•In October 2020, Latham Ford in New York.
•In November 2020, 9 stores from Keyes Auto Group: 8 in California and 1 in Arizona.
•In November 2020, Ramsey Subaru and Mazda in Iowa.
•In November 2020, Sterling Motorcars in Virginia.the United Kingdom.
Revenue and operating income contributed by the 20202023 acquisitions subsequent to the date of acquisition were as follows:
| | | | | | | | |
| | Year Ended December 31, |
(Dollars$ in millions) | | 20202023 |
| Revenue | | $ | 866.12,621.5 | |
| Operating income | | 28.981.3 | |
In 2019,2022, we completed the following acquisitions:
•In May 2019, Hamilton HondaJanuary 2022, John L. Sullivan Chevrolet, John L. Sullivan Chrysler Dodge Jeep Ram, and Roseville Toyota in Hamilton Township, New Jersey.California.
•In March 2022, Sahara Chrysler Dodge Jeep Ram, Desert 215 Superstore, and Jeep Only in Nevada.
•In May 2019, Ford Lincoln of Morgantown2022, Sisley Honda in Morgantown, West Virginia.Canada.
•In June 2022, Esserman International Volkswagen & Acura in Florida.
•In June 2022, Henderson Hyundai Superstore in Nevada.
•In June 2022, Lehman Auto Group in Florida.
•In July 2019, Jaguar Landrover Mission Viejo2022, Elk Grove Ford in Mission Viejo, California.
•In August 2019, HazletonSeptember 2022, Wilde Honda, Wilde Subaru, Wilde Chrysler Dodge Jeep Ram, Wilde Toyota, and Wilde East Towne Honda in Hazle Township, PA.Wisconsin.
•In October 2019, Chrysler Dodge Jeep Ram Fiat of Morgantown2022, Seattle Airstream Adventures and Subaru of MorgantownSpokane Airstream Adventures in Morgantown, West Virginia.Washington.
•In October 2022, Portland Airstream Adventures and Ultimate Airstream Adventures in Oregon.
•In October 2022, Bay Area Airstream Adventures and South Bay Airstream Adventures in California.
•In October 2022, Boise Airstream Adventures in Idaho.
•In November 2019, Wesley Chapel Toyota, Wesley Chapel Honda, and Tampa Honda2022, Meador Chrysler Dodge Jeep Ram in Florida.Texas.
•In December 2022, Denver Exotics in Colorado.
•In December 2022, Glenn's Freedom Chrysler Jeep Dodge Ram in Kentucky.
All acquisitions were accounted for as business combinations under the acquisition method of accounting. The results of operations of the acquired stores are included in our Consolidated Financial Statements from the date of acquisition.
| | | | | | | | | | | | | | |
| | NOTES TO FINANCIAL STATEMENTS | F-32F-37 | |
The following tables summarize the consideration paid for the acquisitions and the preliminary amount of identified assets acquired and liabilities assumed as of the acquisition date:
| | | | | | | | | | | |
| Year Ended December 31, |
| (Dollars in millions) | 2020 | | 2019 |
| Cash paid, net of cash acquired | $ | 1,503.1 | | | $ | 366.6 | |
| Contingent consideration | 4.6 | | | 0 | |
| | | |
| | | |
| Debt and finance lease obligations | 218.9 | | | 26.4 | |
| Total consideration paid | $ | 1,726.6 | | | $ | 393.0 | |
| | | | | | | | | | | |
| Year Ended December 31, |
| (Dollars in millions) | 2020 | | 2019 |
| Trade receivables, net | $ | 0.2 | | | $ | 0 | |
| Inventories | 358.9 | | | 105.2 | |
| | | |
| Property and equipment | 529.9 | | | 124.0 | |
| Other assets | 858.4 | | | 193.1 | |
| Floor plan notes payable | (13.1) | | | 0 | |
| | | |
| Other liabilities | (8.5) | | | (29.3) | |
| 1,725.8 | | | 393.0 | |
| Goodwill | 0.8 | | | 0 | |
| Total net assets acquired and liabilities assumed | $ | 1,726.6 | | | $ | 393.0 | |
| | | | | | | | | | | |
| Year Ended December 31, |
| ($ in millions) | 2023 | | 2022 |
| Cash paid, net of cash acquired | $ | 1,170.1 | | | $ | 1,240.8 | |
| Contingent consideration | 7.3 | | | 3.9 | |
| Non-controlling interest | 21.1 | | | — | |
| | | |
| | | |
| | | |
| | | |
| Total consideration transferred | $ | 1,198.5 | | | $ | 1,244.7 | |
| | | | | | | | | | | |
| Year Ended December 31, |
| ($ in millions) | 2023 | | 2022 |
| Trade receivables, net | $ | 76.2 | | | $ | 0.2 | |
| Inventories | 572.7 | | | 228.3 | |
| Franchise value | 193.4 | | | 63.7 | |
| Goodwill | 233.2 | | | 30.1 | |
| Property and equipment | 394.8 | | | 379.9 | |
| Operating lease right-of-use assets | 89.6 | | | — | |
| Finance receivables, net | 5.7 | | | — | |
| Other assets | 280.4 | | | 639.1 | |
| Trade payables | (47.9) | | | — | |
| Floor plan notes payable | (353.7) | | | (0.7) | |
| Borrowings on lines of credit | (47.9) | | | — | |
| Finance lease obligations | (45.0) | | | (78.5) | |
| Deferred taxes, net | 5.9 | | | — | |
| Other liabilities and deferred revenue | (158.9) | | | (17.4) | |
| Total net assets acquired and liabilities assumed | $ | 1,198.5 | | | $ | 1,244.7 | |
The purchase price allocations for the 20202023 acquisitions are preliminary as we have not obtained all of the detailed information to finalize the opening balance sheet related to real estate purchased, leases and contract liabilities assumed and the allocation of franchise value and goodwill to each reporting unit. Management has recorded the purchase price allocations based on the information that is currently available.
We expect substantially all of the goodwill related to U.S. acquisitions completed in 20202023 to be deductible for U.S. federal income tax purposes. Due to local country laws, we do not expect goodwill related to U.K. acquisitions completed in 2023 to be deductible for U.K. income tax purposes.
The purchase price allocations for the 20192022 acquisitions were finalized in 2020,2023, including amounts posted to, contingent consideration, real estate, franchise value, and goodwill, reducing the amounts posted to “Other assets” shown in the table above.
We account for franchise value as an indefinite-lived intangible asset. We recognized $3.1$27.2 million and $2.5$15.0 million, respectively, in acquisition related expenses as a component of selling, general and administrative expenses in the Consolidated Statements of Operations in 20202023 and 2019,2022, respectively.
The following unaudited pro forma summary presents consolidated information as if the acquisitions had occurred on January 1 of the previous year:
| | Year Ended December 31, |
| (Dollars in millions, except for per share amounts) | | 2020 | | 2019 |
| | Year Ended December 31, | | | | Year Ended December 31, |
| ($ in millions, except for per share amounts) | | ($ in millions, except for per share amounts) | | 2023 | | 2022 |
| Revenue | Revenue | | $ | 15,500.9 | | | $ | 16,043.4 | |
| Net income | Net income | | 502.6 | | | 321.1 | |
| Basic net income per share | Basic net income per share | | 21.10 | | | 13.83 | |
| Diluted net income per share | Diluted net income per share | | 20.87 | | | 13.73 | |
These amounts have been calculated by applying our accounting policies and estimates. The results of the acquired stores have been adjusted to reflect the following: depreciation on a straight-line basis over the expected lives for property, plant and equipment; accounting for inventory on a specific identification method; and recognition of interest expense for real estate financing related to stores where we purchased the facility. No non-recurring pro forma adjustments directly attributable to the acquisitions are included in the reported pro forma revenues and earnings.
| | | | | | | | | | | | | | |
| | NOTES TO FINANCIAL STATEMENTS | F-33F-38 | |
Note 16. Net Income Per Share of Class A and Class B Common Stock
NOTE 17. EARNINGS PER SHARE
We computecalculate basic earnings per share (EPS) by dividing net income per share of Class A and Class B common stock using the two-class method. Under this method, basic net income per share is computed usingattributable to Lithia Motors, Inc. by the weighted average number of common shares outstanding duringfor the period, excluding unvested common shares subject to repurchase or cancellation.including vested RSU awards. Diluted EPS is calculated by dividing net income per share is computed usingattributable to Lithia Motors, Inc. by the weighted average number of common shares and, if dilutive, potential common shares outstanding, duringadjusted for the period. Potential common shares consist of the incremental common shares issuable upon the exercise of stock options and unvested restricted shares subject to repurchase or cancellation. The dilutive effect of outstandingunvested RSU awards and employee stock options and other grants is reflected in diluted earnings per share by application of the treasury stock method. The computation of the diluted net income per share of Class A common stock assumes the conversion of Class B common stock, while the diluted net income per share of Class B common stock does not assume the conversion of those shares.purchases.
Except with respect to voting and transfer rights, the rights of the holders of our Class A and Class B common stock are identical. Our Restated Articles of Incorporation require that the Class A and Class B common stock must share equally in any dividends, liquidation proceeds or other distribution with respect to our common stock and the Articles of Incorporation can only be amended by a vote of the shareholders. Additionally, Oregon law limits amendments to our Articles of Incorporation that would alter the rights, powers or preferences of a given class of stock without the approval of the class of stock adversely affected by the proposed amendment. As a result, the undistributed earnings for each year are allocated based on the contractual participation rights of the Class A and Class B common shares as if the earnings for the year had been distributed. Because the liquidation and dividend rights are identical, the undistributed earnings are allocated on a proportionate basis.
FollowingThe following is a reconciliation of net income attributable to Lithia Motors, Inc. and weighted average shares used for our basic earnings per share (EPS)EPS and diluted EPS (in millions, except per share amounts):EPS:
| | | | | | | | | | | | | | | | | | | | | | | | | | | | | | | | | | | | | | |
| | Year Ended December 31, |
| | 2020 | | 2019 | | 2018 |
| (Dollars in millions, except for per share amounts) | | Class A | | Class B | | Class A | | Class B | | Class A | | Class B |
| Net income from continuing operations applicable to common stockholders | | $ | 460.9 | | | $ | 9.4 | | | $ | 264.5 | | | $ | 7.0 | | | $ | 254.8 | | | $ | 10.9 | |
| | | | | | | | | | | | |
| Reallocation of distributed net income due to conversion of class B to class A common shares outstanding | | 0.6 | | | 0 | | | 0.7 | | | 0 | | | 1.1 | | | 0 | |
| Conversion of class B common shares into class A common shares | | 8.9 | | | 0 | | | 6.3 | | | 0 | | | 9.8 | | | 0 | |
| | | | | | | | | | | | |
| Net income applicable to common stockholders - diluted | | $ | 470.3 | | | $ | 9.4 | | | $ | 271.5 | | | $ | 7.0 | | | $ | 265.7 | | | $ | 10.9 | |
| | | | | | | | | | | | |
| Weighted average common shares outstanding – basic | | 23.3 | | | 0.5 | | | 22.6 | | | 0.6 | | | 23.4 | | | 1.0 | |
| Conversion of class B common shares into class A common shares | | 0.5 | | | 0 | | | 0.6 | | | 0 | | | 1.0 | | | 0 | |
| Effect of employee stock purchases and restricted stock units on weighted average common shares | | 0.3 | | | 0 | | | 0.2 | | | 0 | | | 0.1 | | | 0 | |
| Weighted average common shares outstanding – diluted | | 24.1 | | | 0.5 | | | 23.4 | | | 0.6 | | | 24.5 | | | 1.0 | |
| | | | | | | | | | | | |
| Net income per common share - basic | | $ | 19.74 | | | $ | 19.74 | | | $ | 11.70 | | | $ | 11.70 | | | $ | 10.91 | | | $ | 10.91 | |
| Net income per common share - diluted | | $ | 19.53 | | | $ | 19.53 | | | $ | 11.60 | | | $ | 11.60 | | | $ | 10.86 | | | $ | 10.86 | |
| | | | | | | | | | | | |
| | | | | | | | | | | | |
| | | | | | | | | | | | |
| | | | | | | | | | | | | | | | | |
| Year Ended December 31, |
| ($ in millions, except for per share amounts) | 2023 | | 2022 | 2021 |
| Net income attributable to Lithia Motors, Inc. and applicable to common stockholders | $ | 1,000.8 | | | $ | 1,251.0 | | | $ | 1,060.1 | |
| | | | | |
| Weighted average common shares outstanding – basic | 27.5 | | | 28.2 | | | 28.8 | |
| Effect of employee stock purchases and restricted stock units on weighted average common shares | 0.1 | | | 0.1 | | | 0.2 | |
| Weighted average common shares outstanding – diluted | 27.6 | | | 28.3 | | | 29.0 | |
| | | | | |
| Basic earnings per share attributable to Lithia Motors, Inc. | $ | 36.36 | | | $ | 44.38 | | | $ | 36.81 | |
| Diluted earnings per share attributable to Lithia Motors, Inc. | $ | 36.29 | | | $ | 44.17 | | | $ | 36.54 | |
The effects of antidilutive securities on Class A and Class B common stock werewas evaluated for the years ended 2020, 2019,2023, 2022, and 20182021 and were determined to be immaterial.
NOTE 18. SEGMENTS
As of December 31, 2023, we had two reportable segments: Vehicle Operations and Financing Operations. Our Vehicle Operations consists of all aspects of our auto merchandising and service operations, including our retail automotive, recreational vehicles, and motorcycle franchises that sell new vehicles, used vehicles, parts, repair and maintenance services, and vehicle finance and insurance products. Vehicle Operations excludes financing provided by our Financing Operations. Our Financing Operations segment provides financing to customers buying and leasing retail vehicles from our Vehicle Operations.
All other remaining activity is reported under “Corporate and Other,” including corporate personnel costs, certain unallocated reserves, internal charges, and other unallocated corporate overhead expenses. Internal charges consist of corporate expense allocations which increase segment income for “Corporate and Other” while decreasing segment income for the other operating segments. These internal corporate expense allocations are used to increase comparability of our dealerships and reflect the capital burden a stand-alone dealership would experience. Examples of these internal allocations include internal rent expense, internal floor plan financing charges, and internal fees charged to offset employees within our corporate headquarters that perform certain dealership functions.
The reportable segments identified above represent our business activities for which discrete financial information is available and for which operating results are regularly reviewed by our chief operating decision maker (CODM) to allocate resources and assess performance. Our CODM is our Chief Executive Officer.
Asset information by segment is not utilized for purposes of assessing performance or allocating resources and, as a result, such information has not been presented.
| | | | | | | | | | | | | | |
| | NOTES TO FINANCIAL STATEMENTS | F-34F-39 | |
Note 17. Segments
Certain financial information on a segment basis is as follows:
| | | | | | | | | | | | | | | | | | | | |
| | Year Ended December 31, |
| (Dollars in millions) | | 2020 | | 2019 | | 2018 |
| Revenues: | | | | | | |
| Domestic | | $ | 4,503.0 | | | $ | 4,382.4 | | | $ | 4,215.0 | |
| Import | | 5,448.8 | | | 5,267.8 | | | 5,038.1 | |
| Luxury | | 3,152.0 | | | 2,991.9 | | | 2,560.3 | |
| | 13,103.8 | | | 12,642.1 | | | 11,813.4 | |
| Corporate and other | | 20.5 | | | 30.6 | | | 8.0 | |
| | $ | 13,124.3 | | | $ | 12,672.7 | | | $ | 11,821.4 | |
| | | | | | |
| Segment income*: | | | | | | |
| Domestic | | $ | 230.0 | | | $ | 123.4 | | | $ | 97.6 | |
| Import | | 249.8 | | | 153.9 | | | 116.2 | |
| Luxury | | 98.5 | | | 57.1 | | | 43.9 | |
| Total segment income for reportable segments | | $ | 578.3 | | | $ | 334.4 | | | $ | 257.7 | |
*Segment income for each of the segments is a Non-GAAP measure defined as Income from operations before income taxes, depreciation and amortization, other interest expense and other income, net.
| | | | | | | | | | | | | | | | | | | | |
| | Year Ended December 31, |
| (Dollars in millions) | | 2020 | | 2019 | | 2018 |
| Total segment income for reportable segments | | $ | 578.3 | | | $ | 334.4 | | | $ | 257.7 | |
| Corporate and other | | 176.7 | | | 170.2 | | | 202.3 | |
| Depreciation and amortization | | (92.3) | | | (82.4) | | | (75.4) | |
| Other interest expense | | (73.1) | | | (60.6) | | | (56.0) | |
| Other income, net | | 58.9 | | | 13.8 | | | 8.9 | |
| Income before income taxes | | $ | 648.5 | | | $ | 375.4 | | | $ | 337.5 | |
| | | | | | | | | | | | | | | | | | | | |
| | Year Ended December 31, |
| (Dollars in millions) | | 2020 | | 2019 | | 2018 |
| Floor plan interest expense: | | | | | | |
| Domestic | | $ | 30.9 | | | $ | 53.6 | | | $ | 52.4 | |
| Import | | 31.6 | | | 44.1 | | | 41.6 | |
| Luxury | | 22.2 | | | 30.2 | | | 25.6 | |
| | 84.7 | | | 127.9 | | | 119.6 | |
| Corporate and other | | (50.3) | | | (55.1) | | | (57.3) | |
| | $ | 34.4 | | | $ | 72.8 | | | $ | 62.3 | |
| | | | | | | | | | | | | | | | |
| | December 31, | | |
| (Dollars in millions) | | 2020 | | 2019 | | |
| Total assets: | | | | | | |
| Domestic | | $ | 1,262.4 | | | $ | 1,467.6 | | | |
| Import | | 1,654.7 | | | 1,306.5 | | | |
| Luxury | | 1,132.4 | | | 945.2 | | | |
| Corporate and other | | 3,852.6 | | | 2,364.6 | | | |
| | $ | 7,902.1 | | | $ | 6,083.9 | | | |
| | | | | | | | | | | | | | | | | |
| Year Ended December 31, |
| ($ in millions) | 2023 | | 2022 | 2021 |
| Vehicle operations revenue | $ | 31,042.3 | | | $ | 28,187.8 | | | $ | 22,831.7 | |
| | | | | |
| Vehicle operations gross profit | 5,228.9 | | | 5,154.3 | | | 4,263.9 | |
| Floor plan interest expense | (150.9) | | | (38.8) | | | (22.3) | |
| Vehicle operations selling, general and administrative | (3,482.6) | | | (3,260.0) | | | (2,568.0) | |
| Vehicle operations income | 1,595.4 | | | 1,855.5 | | | 1,673.6 | |
| | | | | |
| Financing operations interest margin: | | | | | |
| Interest, fee, and lease income | 268.5 | | | 134.1 | | | 45.9 | |
| Interest expense | (170.5) | | | (52.2) | | | (4.8) | |
| Total interest margin | 98.0 | | | 81.9 | | | 41.1 | |
| Selling, general and administrative | (36.7) | | | (32.0) | | | (18.2) | |
| Total pre-provision income | 61.3 | | | 49.9 | | | 22.9 | |
| Provision for loan and lease losses | (98.8) | | | (44.4) | | | (9.4) | |
| Depreciation and amortization | (8.4) | | | (9.5) | | | (2.5) | |
| Financing operations (loss) income | (45.9) | | | (4.0) | | | 11.0 | |
| | | | | |
| Total segment income for reportable segments | 1,549.5 | | | 1,851.6 | | | 1,684.5 | |
| | | | | |
| Corporate and other | 187.8 | | | 213.9 | | | 80.4 | |
| Depreciation and amortization | (195.8) | | | (163.2) | | | (124.8) | |
| Other interest expense | (201.2) | | | (129.1) | | | (103.4) | |
| Other income (expense), net | 22.0 | | | (43.2) | | | (52.0) | |
| Income before income taxes | $ | 1,362.3 | | | $ | 1,730.0 | | | $ | 1,484.8 | |
Note 18. Recent Accounting PronouncementsNOTE 19. SUBSEQUENT EVENTS
In December 2019, the Financial Accounting Standards Board (FASB) issued Accounting Standards Update (ASU) 2019-12, “Income Taxes (Topic 740) - Simplifying the Accounting for Income Taxes”. The pronouncement is effective for fiscal years,Acquisition Activity
On January 31, 2024, we acquired Pendragon’s UK motor division and for interim periods within those fiscal years, beginning after December 15, 2020, with early adoption permitted. We are currentlyvehicle management division, as well as a partial stake in the process of evaluatingremaining London Stock Exchange listed independent software business, Pinewood Technologies. Preliminary purchase price is approximately £430 million for the effects of this pronouncement onassets acquired and liabilities assumed. The initial accounting for the business combination is incomplete and all amounts are considered preliminary. In addition, we also entered into a new joint venture to expand Pinewood’s software into the North American market.
ABS Transaction
In February, we issued $329.4 million in non-recourse notes payable related to our consolidated financial statements.first quarter asset-backed term funding transaction, with interest rates ranging from 5.17% to 6.15%, and final distribution dates through June 2031.
| | | | | | | | | | | | | | |
| | NOTES TO FINANCIAL STATEMENTS | F-35F-40 | |
In October 2020, the FASB issued ASU 2020-10, “Codification Improvements.” The pronouncement is effective for fiscal years, and for interim periods within those fiscal years, beginning after December 15, 2020, with early adoption permitted. We are not early adopting and are in the process of evaluating the effects of this pronouncement on our consolidated financial statements. We do not expect any changes from this pronouncement to be material to our consolidated financial statements.
Note 19. Related Party Transactions
Transition Agreement
In September 2015, we entered into a transition agreement with Sidney B. DeBoer, our Chairman of the Board, which provided him certain benefits until his death. The agreement has an effective date of January 1, 2016 and the initial payment of these benefits began in the third quarter of 2016. On January 22, 2019, we amended the transition agreement to end the annual payments to Mr. DeBoer after 17 years, commencing January 1, 2019, or upon Mr. DeBoer’s death, whichever occurs first.
We recorded a charge of $18.3 million in 2015 as a component of selling, general and administrative expense in our Consolidated Statement of Operations related to the present value of estimated future payments due pursuant to this agreement. We believe that this estimate is reasonable; however, actual cash flows could differ materially. We will periodically evaluate whether significant changes in our assumptions have occurred and record an adjustment if future expected cash flows are significantly different than the reserve recorded. As a result of the amendment to the agreement on January 22, 2019, no change was made to the reserve.
The balance associated with this agreement was $13.9 million and $14.8 million as of December 31, 2020 and 2019, respectively, and was included as a component of accrued liabilities and other long-term liabilities in our Consolidated Balance Sheets.
Note 20. Changes in Accounting Policies
In 2016, the FASB issued ASU No. 2016-13, “Financial Instruments - Credit Losses (Topic 326),” which replaces the existing incurred loss methodology with an expected loss methodology that is referred to as the current expected credit loss (CECL) methodology. The measurement of expected credit losses under the CECL methodology is applicable to financial assets measured at amortized cost, including loan receivables and held-to-maturity debt securities. It also applies to off-balance sheet credit exposures not accounted for as insurance and net investments in leases recognized by a lessor in accordance with Topic 842 on leases. In addition, Topic 326 made changes to the accounting for available-for-sale debt securities. We adopted Topic 326 using a modified retrospective method for all financial assets measured at amortized cost. Results for reporting periods beginning after January 1, 2020 are presented under Topic 326 while prior period amounts continue to be reported in accordance with previously applicable GAAP. We recorded a decrease to retained earnings, net of tax, of $4.8 million as of January 1, 2020 for the cumulative effect of adopting Topic 326. The transition adjustment is related to updating our allowance for loan loss methodology related to our auto loan receivables. Our methodology incorporates a combination of historical loan loss experience, current conditions and forecasts, as well as the value of any underlying assets securing the receivables.
In April 2019, the FASB issued ASU 2019-04, “Codification Improvements,” which provides guidance on accounting for credit losses on accrued interest receivable balances and guidance on including recoveries when estimating the allowance. In May 2019, the FASB issued ASU 2019-05, “Targeted Transition Relief,” which allows entities with an option to elect fair value for certain instruments upon adoption of Topic 326.
| | | | | | | | | | | | | | |
| | NOTES TO FINANCIAL STATEMENTS | F-36 | |
The impact of adopting Topic 326 on the accompanying Consolidated Balance Sheets as of January 1, 2020 was as follows (in millions):
| | | | | | | | | | | | | | | | | | | | |
| Impact on Consolidated Balance Sheets | | December 31, 2019 | | Adjustments | | January 1, 2020 |
| CECL Adoption: | | | | | | |
| Accounts receivable, net of allowance for doubtful accounts of $7.3 | | $ | 505.0 | | | $ | (0.5) | | | $ | 504.5 | |
| Other non-current assets | | 388.5 | | | (6.0) | | | 382.5 | |
| Total assets | | 6,083.9 | | | (6.5) | | | 6,077.4 | |
| Deferred income taxes | | 131.1 | | | (1.7) | | | 129.4 | |
| Total liabilities | | 4,616.2 | | | (1.7) | | | 4,614.5 | |
| Retained earnings | | 1,401.8 | | | (4.8) | | | 1,397.0 | |
| Total liabilities and stockholders’ equity | | 6,083.9 | | | (6.5) | | | 6,077.4 | |
| | | | | | | | | | | | | | |
| | NOTES TO FINANCIAL STATEMENTS | F-37 | |