ITEM 1A: RISK FACTORS
An investment in our common shares is subject to risks inherent to our business. Before making an investment decision, you should carefully consider the risks and uncertainties described below together with all of the other information included or incorporated by reference in this report. The value of our common shares could decline due to any of these risks, and you could lose all or part of your investment.
Risks Relating to Our Businessthe Pandemic
The global coronavirus (COVID-19) pandemic has led, and continues to lead, to periods of significant volatility in financial, commodities and other markets and could harm our business and results of operations.
Given the ongoing and dynamic nature of the coronavirus (COVID-19) pandemic, it is difficult to predict the impact of the pandemic on our business, and there is no guarantee that our efforts to address or mitigate the adverse impacts of the COVID-19 pandemic will be effective in the future. The impact to date has included periods of significant volatility in financial, commodities and other markets. This volatility, if it continues, could have an adverse impact on our customers and on our business, financial condition and results of operations as well as our growth strategy.
Our allowance for loan losses may not be adequatebusiness is dependent upon the willingness and ability of our customers to cover actual loan losses.
Disruptions to our customers could result in increased risk of delinquencies, defaults, foreclosures and losses on our loans as well as declines in wealth management revenues. The escalation of the pandemic may also negatively impact regional economic conditions for a period of time, resulting in declines in local loan demand, liquidity of loan guarantors, loan collateral (particularly in real estate), loan originations and deposit availability. If the global response to contain COVID-19 escalates or is unsuccessful, we could experience a material adverse effect on our business, financial condition, results of operations and cash flows.
The Company has implemented restrictions on employee business travel, conversion of in-person meetings to virtual, and a work-from-home mandate. The Company has also worked with its customers to implement appropriate loan deferral strategies in certain circumstances. These actions in response to the COVID-19 pandemic, and similar actions by our vendors and business partners, have not materially impaired our ability to support our employees, conduct our business and serve our customers, but there is no assurance these actions will be sufficient to successfully mitigate the risks presented by COVID-19 or that our ability to operate will not be materially affected going forward. For instance, our business operations may be disrupted if key personnel or significant portions of our employees are unable to work effectively, including because of illness, quarantines, government actions, or other restrictions in connection with the COVID-19 pandemic. Similarly, if any of our vendors or business partners become unable to continue to provide their products and services, which we rely upon to maintain our day-to-day operations, our ability to serve our customers could be impacted.
Unpredictable future developments related to or resulting from the COVID-19 pandemic could materially and adversely affect our business and results of operations.
Because there have been no comparable recent global pandemics that resulted in similar global impact, we do not yet know the full extent of the COVID-19 pandemic’s effects on our business, operations, or the global economy as a whole. Any future development will be highly uncertain and cannot be predicted, including the scope and duration of the pandemic, the effectiveness of our work from home arrangements, third party providers’ ability to support our operation, increases in inflation or interest rates, labor shortages, supply chain disruptions and any actions taken by
12
governmental authorities and other third parties in response to the pandemic. We are continuing to monitor the COVID-19 pandemic and related risks, although the rapid development and fluidity of the situation precludes any specific prediction as to its ultimate impact on us. However, if the COVID-19 outbreak continues to spread or otherwise results in a continuation or worsening of the current economic and commercial environments, our business, financial condition, results of operations and cash flows as well as our regulatory capital and liquidity ratios could be materially adversely affected and many of the risks described in this Annual Report on Form 10-K may be heightened.
Risks Relating to Economic and Market Conditions
An economic downturn could adversely affect our financial condition, results of operations or cash flows.
Recessionary conditions and/or negative developments in the domestic and international credit markets may significantly affect the markets in which we do business, the value of our loans and investments, and our ongoing operations and profitability. If the communities in which we operate do not grow, or if prevailing economic conditions locally or nationally are unfavorable, our business may not succeed. Unpredictable economic conditions may have an adverse effect on the quality of our loan portfolio and our financial performance. Economic recession or other economic problems in our market areas could have a material adverse impact on the quality of the loan portfolio and the demand for our products and services. Adverse changes in the economies in our market areas may have a material adverse effect on our financial condition, results of operations or cash flows. As a community bank, we bear increased risk of unfavorable local economic conditions. Moreover, we cannot give any assurance that we will benefit from any market growth or favorable economic conditions in our primary market areas even if they do occur.
We face potential risk from changes in governmental monetary policies.
The Bank’sCompany’s earnings are affected by domestic economic conditions and the monetary and fiscal policies of the United States government and its agencies. The Federal Reserve’s monetary policies have had, and are likely to continue to have, an important impact on the operating results of commercial banks through its power to implement national monetary policy in order, among other things, to curb inflation or combat a recession. The monetary policies of the Federal Reserve affect the levels of bank loans, investments, and deposits through its control over the issuance of United States government securities, its regulation of the discount rate applicable to member banks, and its influence over reserve requirements to which member banks are subject. The BankCompany cannot predict the nature or impact of future changes in monetary and fiscal policies.
Our participation in the SBA PPP loan program exposes us to repay their loans may be adversely affected by an increase in market interest rates which could result in increased credit losses. These increased credit losses, whererisks related to noncompliance with the Bank has retained credit exposure, could decrease our assets, net income and cash available.
SBA lending is an important part of our business. Our SBA lending program is dependent upon the U.S. federal government, and we face specific risks associated with originating SBA loans.
Our SBA lending program is dependent upon the U.S. federal government. As an approved participant in the SBA Preferred Lender’s Program (a “Preferred Lender”), we enable our clients to obtain SBA loans without being subject to the potentially lengthy SBA approval process necessary for lenders that are not Preferred Lenders. The SBA periodically reviews the lending operations of participating lenders to assess, among other things, whether the
13
lender exhibits prudent risk management. When weaknesses are identified, the SBA may request corrective actions or impose enforcement actions, including revocation of the fair value gain in the derivative. Market risk existsPreferred Lender status. If we lose our status as a Preferred Lender, we may lose some or all of our customers to lenders who are Preferred Lenders, and as a result we could experience a material adverse effect to our financial results. Any changes to the extent that interest rates change in ways that are significantly different from what we expected when we entered intoSBA program, including but not limited to changes to the derivative transaction. The existencelevel of credit and market risk associated with our derivative instruments could adversely affect our net interest income and, therefore, couldguarantee provided by the federal government on SBA loans, changes to program-specific rules impacting volume eligibility under the guaranty program, as well as changes to the program amounts authorized by Congress, may also have a material adverse effect on our business. In addition, any default by the U.S. government on its obligations or any prolonged government shutdown could, among other things, impede our ability to originate SBA loans or sell such loans in the secondary market, which could materially adversely affect our business, financial condition, results of operations, and future prospects.
financial condition. When we originate SBA loans, we incur credit risk on the non-guaranteed portion of the loans, and if a customer defaults on a loan, we share any loss and recovery related to the loan pro-rata with the SBA. If the Company incurs lossesSBA establishes that erode its capital, ita loss on an SBA guaranteed loan is attributable to significant technical deficiencies in the way the loan was originated, funded, or serviced by us, the SBA may become subject to enhanced regulation or supervisory action.
Changes in government regulation and supervision may increase our costs or impact our ability to operate in certain lines of business.
Our operations are subject to extensive regulation by federal, state and local governmental authorities and are subject to various laws and judicial and administrative decisions imposing requirements and restrictions on part or all of our operations. Banking regulations are primarily intended to protect depositors'depositors’ funds, federal deposit insurance funds and the banking system as a whole, not stockholders.rather than shareholders. Because our business is highly regulated, the laws, rules, regulations and supervisory guidance and policies applicable to us are subject to regular modification and change and could result in an adverse impact on our results of operations.
We are subject to numerous laws designed to protect consumers, including the Community Reinvestment ActCRA and fair lending laws, and failure to comply with these laws could lead to a wide variety of sanctions.
The Community Reinvestment Act,CRA, the Equal Credit Opportunity Act, the Fair Housing Act and other fair lending laws and regulations impose nondiscriminatory lending requirements on financial institutions. The CFPB, the U.S. Department of Justice and other federal agencies are responsible for enforcing these laws and regulations. A successful regulatory challenge to an institution'sinstitution’s performance under the Community Reinvestment ActCRA or fair lending laws and regulations could result in a wide variety of sanctions, including damages and civil money penalties, injunctive relief, restrictions on mergers and acquisitions activity, restrictions on expansion, and restrictions on entering new business lines. Private parties may also have the ability to challenge an institution'sinstitution’s performance under fair lending laws in private class action litigation. Such actions could have a material adverse effect on our business, financial condition, results of operations and future prospects.
We are subject to compliance with the Bank Secrecy Act and other anti-money laundering statutes and regulations, and failure to comply with these laws could lead to a wide variety of sanctions.
The Bank Secrecy Act, the USA PATRIOT Act of 2001, and other laws and regulations require financial institutions, among other duties, to institute and maintain an effective anti-money laundering program and file suspicious activity and currency transaction reports when appropriate. In addition to other bank regulatory agencies, the federal Financial Crimes Enforcement Network of the Department of the Treasury is authorized to impose significant civil money penalties for violations of those requirements and has recently engaged in coordinated enforcement efforts with the state and federal banking regulators, as well as the U.S. Department of Justice, CFPB, Drug Enforcement Administration, and Internal Revenue Service. We are also subject to increased scrutiny of compliance with the rules enforced by the Office of Foreign Assets Control of the Department of the Treasury regarding, among other things, the prohibition of transacting business with, and the need to freeze assets of, certain persons and organizations identified as a threat to the national security, foreign policy or economy of the United States. If our policies, procedures and systems are deemed deficient, we would be subject to liability, including fines and regulatory actions, which may include restrictions on our ability to pay dividends and the necessity to obtain regulatory approvals to proceed with certain aspects of our business plan, including any acquisition plans. Failure to maintain and implement adequate programs to combat money laundering and terrorist financing could also have
14
serious reputational consequences for
us. Any of these results could have a material adverse effect on our business, financial condition, results of operations and future prospects.
If the Company or the Bank incur losses that erode its capital, it may become subject to enhanced regulation or supervisory action.
Under federal and state laws and regulations pertaining to the safety and soundness of insured depository institutions, the Missouri Division of Finance, the Federal Reserve Board, and the FDIC have the authority to compel or restrict certain actions if the Company’s or the Bank’s capital should fall below adequate capital standards as a result of future operating losses, or if its bank regulators determine that it has insufficient capital. Among other matters, the corrective actions include but are not limited to requiring affirmative action to correct any conditions resulting from any violation or practice; directing an increase in capital and the maintenance of specific minimum capital ratios; restricting the Bank’s operations; limiting the rate of interest the bank may pay on brokered deposits; restricting the amount of distributions and dividends and payment of interest on its trust preferred securities; requiring the Bank to enter into informal or formal enforcement orders, including memoranda of understanding, written agreements and consent or cease and desist orders to take corrective action and enjoin unsafe and unsound practices; removing officers and directors and assessing civil monetary penalties; and taking possession of and closing and liquidating the Bank. These actions may limit the ability of the Bank or Company to execute its business plan and thus can lead to an adverse impact on the results of operations or financial position.
Financial Risks
Our allowance for credit losses may not be adequate to cover actual loan losses.
We maintain an allowance for credit losses, which is a reserve established through a provision for credit losses charged to expense, that represents management’s estimate of probable losses within the existing portfolio of loans. The allowance, in the judgment of management, is sufficient to reserve for estimated credit losses and risks inherent in the loan portfolio. We continue to monitor the adequacy of our loan credit allowance and may need to increase it if economic conditions deteriorate. In addition, bank regulatory agencies periodically review our allowance for credit losses and may require an increase in the provision for credit losses or the recognition of further loan charge-offs, based on judgments that can differ somewhat from those of our own management. In addition, if charge-offs in future periods exceed the allowance for loan losses (i.e., if the loan allowance is inadequate), we may need additional credit loss provisions to increase the allowance for loan losses. Additional provisions to increase the allowance for credit losses, should they become necessary, would result in a decrease in net income and a reduction in capital, and may have a material adverse effect on our financial condition and results of operations.
Increased regulatory oversight, changes in the method of determining LIBOR and the phase-out of LIBOR after 2021 may adversely affect the results of our operations.
On December 31, 2021, the United Kingdom’s Financial Conduct Authority (“FCA”), which regulates the LIBOR, ceased issuance of 24 of the 35 LIBOR settings. Five U.S. dollar settings (overnight, 1-month, 3-month, 6-month and 1-year) will continue to be published using panel bank issuances through June 2023. However, new contracts indexed to LIBOR are prohibited after December 31, 2021. In the United States, efforts to identify a set of alternative U.S. dollar reference interest rates are ongoing, and the Alternative Reference Rate Committee (“ARRC”) has recommended the use of SOFR, which is different from LIBOR in that it is a backward looking secured rate rather than a forward looking unsecured rate. These differences could lead to a greater disconnect between our costs to raise funds for SOFR as compared to LIBOR. For cash products and loans, the ARRC has also recommended Term SOFR, which is a forward looking SOFR based on SOFR futures and may in part reduce differences between SOFR and LIBOR.
Successor or replacement interest rates to LIBOR may perform differently and we may incur significant costs to transition both our borrowing arrangements and the loan agreements with our customers from LIBOR, which may have an adverse effect on our results of operations. The Company has not yet selected a replacement index, but has begun issuing loans using SOFR published by the Federal Reserve Bank of New York. The Company has material contracts that are indexed to LIBOR. The full impact of alternatives to LIBOR on the valuations, pricing and operation of our financial instruments is not yet known.
15
Our business is subject to interest rate risk and variations in interest rates may negatively affect our financial performance.
A substantial portion of our income is derived from the differential or “spread” between the interest earned on loans, investment securities, and other interest-earning assets, and the interest paid on deposits, borrowings, and other interest-bearing liabilities. Because of the differences in the maturities and repricing characteristics of our interest-earning assets and interest-bearing liabilities, changes in interest rates may not produce equivalent changes in interest income earned on interest-earning assets and interest paid on interest-bearing liabilities. Our assets and liabilities may react differently to changes in overall interest rates or conditions. Significant fluctuations in market interest rates could materially and adversely affect not only our net interest spread, but also our asset quality and loan origination volume, deposits, funding availability, and/or net income.
We may not be able to maintain our historical rate of growth or profitability, which could have a material adverse effect on our ability to successfully implement our business strategy.
Successful growth requires that we follow adequate loan underwriting standards, balance loan and deposit growth without increasing interest rate risk or compressing our net interest margin, maintain adequate capital at all times, produce investment performance results competitive with our peers and benchmarks, further diversify our revenue sources, meet the expectations of our clients and hire and retain qualified employees. If we do not manage our growth successfully, then our business, results of operations or financial condition may be adversely affected.
We may incur impairments to goodwill.
As of December 31, 2021, we had $365 million recorded as goodwill. We evaluate our goodwill for impairment at least annually. Significant negative industry or economic trends, including the lack of recovery in the market price of our common stock, or reduced future cash flows or disruptions to our business, could result in impairments to goodwill. Our valuation methodology for assessing impairment requires management to make judgments and assumptions based on historical experience and to rely on projections of future operating performance. We operate in competitive environments and projections of future operating results and cash flows may vary significantly from actual results. If our analysis results in impairment to goodwill, we would be required to record an impairment charge to earnings in our financial statements during the period in which such impairment is determined to exist. Any such change could have a material adverse effect on our results of operations and stock price.
Declines in asset values may result in impairment charges and adversely impact the value of our investments and our financial performance and capital.
We hold an investment securities portfolio that includes, but is not limited to, government securities and agency mortgage-backed securities. Factors beyond our control can significantly influence the fair value of securities in our portfolio and can cause potential adverse changes to the fair value of these securities. These factors include, but are not limited to, rating agency actions in respect to the securities, defaults by the issuer or with respect to the underlying securities, changes in market interest rates and/or spread, and instability inand other factors impacting the capital markets. Any of these factors, among others, could cause other-than-temporary impairments and realized or unrealized losses in future periods and declines in other comprehensive income (loss), which could have a material adverse effect on our business, results of operations, financial condition and future prospects. The process for determining whether impairment of a security is other-than-temporary often requires complex, subjective judgments about whether there has been significant deterioration in the financial condition of the issuer, whether management has the intent or ability to hold a security for a period of time sufficient to allow for any anticipated recovery in fair value, the future financial performance and liquidity of the issuer and any collateral underlying the security and other relevant factors.
We primarily invest in mortgage-backed obligations and such obligations have been, and are likely to continue to be, impacted by market dislocations, declining home values and prepayment risk, which may lead to volatility in cash flow and market risk and declines in the value of our investment portfolio.
Our investment portfolio largely consists ofincludes mortgage-backed obligations primarily secured by pools of mortgages on single-family residences. The value of mortgage-backed obligations in our investment portfolio may fluctuate for several reasons, including (i) delinquencies and defaults on the mortgages underlying such obligations, due in part to high unemployment rates, (ii) falling home prices, (iii) lack of a liquid market for such obligations, and (iv) uncertainties
16
in respect of government-sponsored enterprises such as the Federal National Mortgage Association (“Fannie Mae”) or the Federal Home Loan Mortgage Corporation (“Freddie Mac”), which guarantee such obligations, and (v) the expiration of government stimulus initiatives. Although home values had declined over the last several years, prices appear to have now leveled off. However, ifobligations. If the value of homes were to further materially decline, the fair value of the mortgage-backed obligations in which we invest may also decline. Any such decline in the fair value of mortgage-backed obligations, or perceived market uncertainty about their fair value, could adversely affect our financial position and results of operations. In addition, when we acquire a mortgage-backed security, we anticipate that the underlying mortgages will prepay at a projected rate, thereby generating an expected yield. Prepayment rates generally increase as interest rates fall and decrease when rates rise, but changes in prepayment rates are difficult to predict. In light of historically low interest rates, many of our mortgage-backed securities have a higher interest rate than prevailing market rates, resulting in a premium purchase price. In accordance with applicable accounting standards, we amortize the
premium over the expected life of the mortgage-backed security. If the mortgage loans securing the mortgage-backed security prepay more rapidly than anticipated, we would have to amortize the premium on an accelerated basis, which would thereby adversely affect our profitability.
Credit and Liquidity Risks
Our loan and deposit portfolios are in certain markets which could result in increased concentration risk.
A majority of our loans are to businesses and individuals in the St. Louis, Kansas City, Phoenix, Los Alamos, Albuquerque, Santa Fe, Los Angeles, San Diego, and Las Vegas metropolitan areas. These loans are funded by deposits in the same metropolitan areas. The regional economic conditions in areas where we conduct our business have an impact on the demand for our products and services as well as the ability of our clients to repay loans, the value of the collateral securing loans, and the stability of our deposit funding sources. Consequently, a decline in local economic conditions may adversely affect our earnings.
There are material risks involved in commercial lending that could adversely affect our business.
Our business plan calls for continued efforts to increase our assets invested in commercial loans. Our commercial loans include loans that are secured by real estate (commercial property, multi-family residential property, 1-4 family residential property, and construction and land). Commercial loans generally involve a higher degree of credit risk than residential mortgage loans due, in part, to their larger average size and less marketable collateral. In addition, unlike residential mortgage loans, commercial loans generally depend on the cash flow of the borrower’s business to service the debt. Adverse economic conditions or other factors affecting our target markets may have a greater adverse effect on us than on other financial institutions that have a more diversified client base. Increases in non-performing commercial loans could result in operating losses, impaired liquidity and erosion of our capital, and could have a material adverse effect on our financial condition and results of operations. Credit market tightening could adversely affect our commercial borrowers through declines in their business activities and adversely impact their overall liquidity through the diminished availability of other borrowing sources or otherwise.
Our loan portfolio includes loans secured by real estate, which could result in increased credit risk.
A portion of our portfolio is secured by real estate, and thus we face a high degree of risk from a downturn in our real estate markets. If real estate values would decline in our markets, our ability to recover on defaulted loans for which the primary reliance for repayment is on the real estate collateral by foreclosing and selling that real estate would then be diminished, and we would be more likely to suffer losses on defaulted loans.
Additionally, the state-specific foreclosure laws of the jurisdictions in which our real estate collateral is located may hinder our ability to timely or fully recover on defaulted loans secured by property in certain states. For example, some states in which our collateral is located are judicial foreclosure states. In judicial foreclosure states, all foreclosures must be processed through the court system. Due to this process, it may take up to a year or longer to foreclose on real estate collateral located in those states. Our ability to recover on defaulted loans secured by property in those states may be delayed and our recovery efforts are lengthened due to this process. In addition, other states have anti-deficiency statutes with regards to certain types of residential mortgage loans. Our ability to recover on defaulted loans secured by residential mortgages in anti-deficiency statute states may be limited to the fair value of the real estate securing the loan at the time of foreclosure.
17
Our commercial and industrial loans and sponsor finance loans are underwritten based primarily on cash flow, profitability and enterprise value of the client and are not fully covered by the value of tangible assets or collateral of the client. Consequently, if any of these transactions becomes non-performing, we could experience significant losses.
Cash flow lending involves lending money to a client based primarily on the expected cash flow, profitability and enterprise value of a client, with the value of any tangible assets as secondary protection. In some cases, these loans may have more leverage than traditional bank debt. In the case of our senior cash flow loans, we generally take a lien on substantially all of a client’s assets, but the value of those assets is typically substantially less than the amount of money we advance to the client under a cash flow transaction. In addition, some of our cash flow loans may be viewed as stretch loans, meaning they may be at leverage multiples that exceed traditional accepted bank lending standards for senior cash flow loans. Thus, if a cash flow transaction becomes non-performing, our primary recourse to recover some or all of the principal of our loan or other debt product would be to force the sale of all or part of the company as a going concern. Additionally, we may obtain equity ownership in a borrower as a means to recover some or all of the principal of our loan. The risks inherent in cash flow lending include, among other things:
•reduced use of or demand for the client’s products or services and, thus, reduced cash flow of the client to service the loan and other debt product as well as reduced value of the client as a going concern;
•inability of the client to manage working capital, which could result in lower cash flow;
•inaccurate or fraudulent reporting of our client’s positions or financial statements; and
•our client’s poor management of their business.
Additionally, many of our clients use the proceeds of our cash flow transactions to make acquisitions. Poorly executed or poorly conceived acquisitions can burden management, systems and the operations of the existing business, causing a decline in both the client’s cash flow and the value of its business as a going concern. In addition, many acquisitions involve new management teams taking over day-to-day operations of a business. These new management teams may fail to execute at the same level as the former management team, which could reduce the cash flow of the client available to service the loan or other debt product, as well as reduce the value of the client as a going concern.
Widespread financial difficulties or downgrades in the financial strength or credit ratings of life insurance providers could lessen the value of the collateral securing our life insurance premium finance loans and impair our financial condition and liquidity.
One of the specialized products we offer is financing whole life insurance premiums utilized in high net worth estate planning. These loans are primarily secured by the insurance policies financed by the loans, i.e., the obligations of the life insurance providers under those policies. Nationally Recognized Statistical Rating Organizations (“NRSROs”) such as Standard & Poor’s, Moody’s and A.M. Best evaluate the life insurance providers that are the payors on the life insurance policies that we finance. The value of our collateral could be materially impaired in the event there are widespread financial difficulties among life insurance providers or the NRSROs downgrade the financial strength ratings or credit ratings of the life insurance providers, indicating the NRSROs’ opinion that the life insurance provider’s ability to meet policyholder obligations is impaired, or the ability of the life insurance provider to meet the terms of its debt obligations is impaired. The value of our collateral is also subject to the risk that a life insurance provider could become insolvent. In particular, if one or more large nationwide life insurance providers were to fail, the value of our portfolio could be significantly negatively impacted. A significant downgrade in the value of the collateral supporting our premium finance business could impair our ability to create liquidity for this business, which, in turn could negatively impact our ability to expand.
Our construction and land development loans are based upon estimates of costs and value associated with the completed project. These estimates may be inaccurate and we may be exposed to more losses on these projects than on other loans.
Construction, land acquisition and development lending involves additional risks because funds are advanced based upon the projected value of the project, which is inherently uncertain prior to the project’s completion. Because of the uncertainties inherent in estimating construction costs, as well as the fair value of the completed project and the effects of governmental regulation of real property and the general effects of the national and local economies, it is
18
relatively difficult to evaluate accurately the total funds required to complete a project and the related loan-to-value ratio. As a result, construction loans often involve the disbursement of substantial funds with repayment dependent, in part, on the success of the ultimate project and the ability of the borrower to sell or lease the property, rather than the ability of the borrower or guarantor to repay principal and interest. If our appraisal of the value of the completed project proves to be overstated, we may have inadequate security for the repayment of the loan upon completion of construction of the project. If we are forced to foreclose on a project prior to or at completion due to a default, there can be no assurance that we will be able to recover all of the unpaid balance of, and accrued interest on, the loan or the related foreclosure, sale and holding costs. In addition, we may be required to fund additional amounts to complete the project and may have to hold the property for an unspecified period of time. If any of these events occur, our financial condition, results of operations and cash flows could be materially and adversely affected.
The ability of our borrowers to repay their loans may be adversely affected by an increase in market interest rates which could result in increased credit losses. These increased credit losses, where the Bank has retained credit exposure, could decrease our assets, net income and cash available.
The loans we make to our borrowers may bear interest at a variable or floating interest rate. When market interest rates increase, the amount of revenue borrowers need to service their debt also increases. Some borrowers may be unable to make their debt service payments. As a result, an increase in market interest rates will increase the risk of loan default. An increase in non-performing loans could result in a net loss of earnings from these loans, an increase in the provision for loan and covered loan losses, and an increase in loan charge-offs, all of which could have a material adverse effect on our business, financial condition and results of operations.
We are subject to environmental risks associated with owning real estate or collateral.
When a borrower defaults on a loan secured by real property, the Company may purchase the property in foreclosure or accept a deed to the property surrendered by the borrower. We may also take over the management of commercial properties whose owners have defaulted on loans. We may also own and lease premises where branches and other facilities are located. While we have lending, foreclosure and facilities guidelines intended to exclude properties with an unreasonable risk of contamination, hazardous substances could exist on some of the properties that the Company may own, manage or occupy. We face the risk that environmental laws could force us to clean up the properties at the Company’s expense. The cost of cleaning up or paying damages and penalties associated with environmental problems could increase our operating expenses. It may cost more to clean a property than the property is worth. We could also be liable for pollution generated by a borrower’s operations if the Company takes a role in managing those operations after a default. The Company may also find it difficult or impossible to sell these properties.
We may be obligated to indemnify certain counterparties in financing transactions we enter into pursuant to the New Markets Tax Credit Program.
We participate in and have previously been an “Allocatee” of the New Markets Tax Credit Program of the U.S. Department of the Treasury Community Development Financial Institutions Fund. Through this program, we provide our allocation to certain projects, which in turn for an equity investment from an Investor in the project generate federal tax credits to those investors. This equity, coupled with any debt or equity from the project sponsor is in turn invested in a certified community development entity for a period of at least seven years. Community development entities must use this capital to make loans to, or other investments in, qualified businesses in low-income communities in accordance with New Markets Tax Credit Program criteria. Investors receive an overall tax credit equal to 39% of their total equity investment, credited at a rate of five percent in each of the first three years and six percent in each of the final four years. However, after the exhaustion of all cure periods and remedies, the entire credit is subject to recapture if the certified community development entity fails to maintain its certified status, or if substantially all of the equity investment proceeds associated with the tax credits we allocate are no longer continuously invested in a qualified business that meets the New Markets Tax Credit Program criteria, or if the equity investment is redeemed prior to the end of the minimum seven-year term. As part of these financing transactions, we as the parent to Enterprise Financial CDE, LLC (��CDE”), provide customary indemnities to the tax credit investors, which require us to indemnify and hold harmless the investors in the event a credit recapture event occurs, unless the recapture is a result of action or inaction of the investor. No assurance can be given that these counterparties will not call upon us to discharge these obligations in the circumstances under which they are owed.
19
If this were to occur, the amount we may be required to pay a bank investor could be substantial and could have a material adverse effect on our results of operations and financial condition.
If we fail to comply with requirements of the federal New Markets Tax Credit program, the U.S. Department of the Treasury Community Development Financial Institutions Fund could seek any remedies available under its Allocation Agreement with us, and we could suffer significant reputational harm and be subject to greater scrutiny from banking regulators.
Because we have been designated as an “Allocatee” under the New Markets Tax Credit Program, we are required to provide allocation fund qualifying projects under the New Markets Tax Credit Program, and we are responsible for monitoring those projects, ensuring their ongoing compliance with the requirements of the New Markets Tax Credit Program and satisfying the various recordkeeping and reporting requirements under the New Markets Tax Credit Program. If we default in our obligations under the New Markets Tax Credit Program, the U.S. Department of the Treasury may revoke our participation in any other CDFI Fund programs, reallocate the new market tax credits that were originally allocated to us, and take any other remedial actions that it is empowered to take under the Allocation Agreement they have entered into with us with respect to the New Markets Tax Credit Program, with the full range of such remedies being unknown. If we were to default under the New Markets Tax Credit Program, we could suffer negative publicity in the communities in which we operate, and we could face greater scrutiny from federal and state bank regulators, especially with regard to our compliance with the CRA. These developments could have a material adverse impact on our reputation, business, financial condition, results of operations and liquidity.
Liquidity risk could impair our ability to fund operations and meet debt coverage obligations, and jeopardize our financial condition.
Liquidity is essential to our business. We are a holding company and depend on our subsidiaries for liquidity needs, including debt coverage requirements. An inability to raise funds through deposits, borrowings, the sale of investment securities and other sources could have a substantial material adverse effect on our liquidity. Our access to funding sources in amounts that are adequate to finance our activities could be impaired by factors that affect us specifically or the financial services industry in general. Factors that could detrimentally impact our access to liquidity sources include but are not limited to a decrease in the level of our business activity due to a market downturn, our failure to remain well-capitalized, or adverse regulatory action against us. Our ability to acquire deposits or to borrow could also be impaired by factors that are not specific to us, such as a severe disruption of the financial markets or negative views and expectations about the prospects for the financial services industry as a whole.
Our utilization of brokered deposits could adversely affect our liquidity and results of operations.
Since our inception, we have utilized both brokered and non-brokered deposits as a source of funds to support our growing loan demand and other liquidity needs. As a bank regulatory supervisory matter, reliance upon brokered deposits as a significant source of funding is discouraged. Brokered deposits may not be as stable as other types of deposits, and, in the future, those depositors may not renew their deposits when they mature, or we may have to pay a higher rate of interest to keep those deposits or may have to replace them with other deposits or with funds from other sources. Additionally, if the Bank ceases to be categorized as “well-capitalized” for bank regulatory purposes, it would not be able to accept, renew or roll over brokered deposits without a waiver from the FDIC. Our inability to maintain or replace these brokered deposits as they mature could adversely affect our liquidity and results of operations. Further, paying higher interest rates to maintain or replace these deposits could adversely affect our net interest margin and results of operations.
By engaging in derivative transactions, we are exposed to additional credit and market risk in our banking business.
We use interest rate swaps to help manage our interest rate risk in our banking business from recorded financial assets and liabilities when they can be demonstrated to effectively hedge a designated asset or liability and the asset or liability exposes us to interest rate risk or risks inherent in client related derivatives. We may use other derivative financial instruments to help manage other economic risks, such as liquidity and credit risk, including exposures that arise from business activities that result in the receipt or payment of future known or uncertain cash amounts, the value of which are determined by interest rates. We also have derivatives that result from a service we provide to
20
certain qualifying clients approved through our credit process, and therefore, these derivatives are not used to manage interest rate risk in our assets or liabilities. The Company does not enter into derivative financial instruments for trading purposes. Hedging interest rate risk is a complex process, requiring sophisticated models and routine monitoring. As a result of interest rate fluctuations, hedged assets and liabilities will appreciate or depreciate in market value. The effect of this unrealized appreciation or depreciation will generally be offset by income or loss on the derivative instruments that are linked to the hedged assets and liabilities. By engaging in derivative transactions, we are exposed to credit and market risk. If the counterparty fails to perform, credit risk exists to the extent of the fair value gain in the derivative. Market risk exists to the extent that interest rates change in ways that are significantly different from what we expected when we entered into the derivative transaction. The existence of credit and market risk associated with our derivative instruments could adversely affect our net interest income and, therefore, could have a material adverse effect on our business, financial condition, results of operations and future prospects.
Competitive and Reputational Risks
The loss of any of our executive officers or other key employees, or the inability to recruit highly skilled and other key employees, may adversely affect our operations.
The Company believes that its growth and continued success will depend in large part on its executive team and other key employees. The loss of any of our executive officers or other key employees, the failure to successfully transition key roles, or the inability to hire, train, retain, and manage qualified personnel, could have a material adverse effect on our business strategy, financial condition, results of operations and cash flows.
We face significant competition.
The financial services industry, including but not limited to, commercial banking, mortgage banking, consumer lending, and home equity lending, is highly competitive, and we encounter strong competition for deposits, loans, and other financial services in all of our market areas in each of our lines of business. Our principal competitors include other commercial banks, savings banks, savings and loan associations, mutual funds, money market funds, finance companies, trust companies, technology companies, insurers, credit unions, and mortgage companies among others. Many of our non-bank competitors are not subject to the same degree of regulation as us and have advantages over us in providing certain services. Many of our competitors are significantly larger than we are and have greater access to capital and other resources. Also, our ability to compete effectively in our business is dependent on our ability to adapt successfully to regulatory and technological changes within the banking and financial services industry, generally. If we are unable to compete effectively, we will lose market share and our income from loans and other products may diminish.
Our ability to compete successfully depends on a number of factors, including, among other things:
•the ability to develop, maintain, and build upon long-term client relationships based on top quality service and high ethical standards;
•the scope, relevance, and pricing of products and services, including technological innovations to those products and services, offered to meet client needs and demands;
•the rate at which we introduce new products and services relative to our competitors;
•client satisfaction with our level of service; and/or
•industry and general economic trends.
Failure to perform in any of these areas could significantly weaken our competitive position, and could adversely affect our growth and profitability, which, in turn, could have a material adverse effect on our financial condition and results of operations.
Technology is continually changing and we must effectively implement new innovations in providing services to our customers.
The financial services industry is undergoing rapid technological changes with frequent innovations in technology-driven products and services. In addition to better serving customers, the effective use of technology increases our efficiency and enables us to reduce costs. Our future success will depend, in part, upon our ability to address the needs of our customers using innovative methods, processes and technology to provide products and services that will satisfy customer demands for convenience as well as to create additional efficiencies in our operations as we
21
continue to grow and expand our market areas. Many national vendors provide turn-key services to community banks, such as Internet banking and remote deposit capture, that allow smaller banks to compete with institutions that have substantially greater resources to invest in technological improvements. We may not be able, however, to effectively implement new technology-driven products and services or be successful in marketing these products and services to our customers.
Costs and levels of deposits are affected by competition that could increase our funding costs or liquidity risk.
We rely on bank deposits to be a low cost and stable source of funding. We compete with banks and other financial services companies for deposits. If our competitors raise the rates they pay on deposits, our funding costs may increase, either because we raise our rates to avoid losing deposits or because we lose deposits and must rely on more expensive sources of funding. Higher funding costs could reduce our net interest margin and net interest income and could have a material adverse effect on our business, financial condition and results of operations.
Acquisition Risks
We have engaged in and may continue to engage in expansion through acquisitions, and these acquisitions present a number of risks related both to the acquisition transactions and to the integration of the acquired businesses.
The acquisition of other financial services companies or assets present risks to the Company in addition to those presented by the nature of the business acquired. Our earnings, financial condition, and prospects after a merger or acquisition depend in part on our ability to successfully integrate the operations of the acquired company. We may be unable to integrate operations successfully or to achieve expected results or cost savings.
Acquiring other banks or businesses involves various risks commonly associated with acquisitions, including, among other things:
◦potential exposure to unknown or contingent liabilities of the target company;
◦exposure to potential asset quality issues of the target company;
◦difficulty and expense of integrating the operations and personnel of the target company;
◦potential disruption to our business;
◦potential diversion of our management’s time and attention;
◦the possible loss of key employees and clients of the target company;
◦difficulty in estimating the value of the target company;
◦payment of a premium over book and market values that may dilute our tangible book value and earnings per share in the short- and long-term;
◦inability to realize the expected revenue increases, cost savings, increases in geographic or product presence, and/or other projected benefits; and/or
◦potential changes in banking or tax laws or regulations that may affect the target company.
We periodically evaluate merger and acquisition opportunities and conduct due diligence activities related to possible transactions with other financial institutions and financial services companies. As a result, merger or acquisition discussions and, in some cases, negotiations may take place, and future mergers or acquisitions involving cash, debt or equity securities may occur at any time. In addition to the risks noted above, potential acquisitions may incur additional costs for diligence or break-up fees, even if the transaction is not consummated.
We may be unable to successfully integrate new business lines into our existing operations.
From time to time, we may implement other new lines of business or offer new products or services within existing lines of business. There can be substantial risks and uncertainties associated with these efforts, particularly in instances where the markets are not fully developed. Although we continue to expend substantial managerial, operating and financial resources as our business grows, we may be unable to successfully continue the integration of new business lines, and price and profitability targets may not prove feasible. External factors such as compliance with regulations, competitive alternatives and shifting market preferences, may also impact the successful implementation of a new line of business or a new product or service. Furthermore, any new line of business and new product or service could have a significant impact on the effectiveness of our system of internal controls. Failure to successfully manage these risks in the development and implementation of new lines of business
22
or new products or services could have a material adverse effect on our business, financial condition and results of operations.
As we expand outside our current markets, we may encounter additional risks that may adversely affect us.
We are headquartered in Missouri, but have branch locations in the Kansas City, Phoenix, Los Angeles, and San Diego metropolitan areas, as well as Northern New Mexico and Nevada. Over time, we may acquire or open locations in other parts of the United States as well. In the course of these expansion activities, we may encounter significant risks, including unfamiliarity with the characteristics and business dynamics of new markets, increased marketing and administrative expenses and operational difficulties arising from our efforts to attract business in new markets, manage operations in noncontiguous geographic markets, comply with local laws and regulations and effectively and consistently manage personnel and business outside of the State of Missouri. If we are unable to manage these risks, our operations may be materially and adversely affected.
Technology and Cybersecurity Risks
A failure in or breach, or the inability to recognize a potential breach of our operational or security systems, or those of our third party service providers, including as a result of cyber attacks,cyber-attacks, could disrupt our business, result in unintentional disclosure or misuse of confidential or proprietary information, damage our reputation, increase our costs and adversely impact our earnings.
As a financial institution, our operations rely heavily on the secure processing, storage and transmission of confidential and other information on our computer systems and networks. Any failure, interruption or breach in security or operational integrity of these systems could result in failures or disruptions in our internet banking system, treasury management products, check and document imaging, remote deposit capture systems, general ledger, and other systems. The security and integrity of our systems could be threatened by a variety of interruptions or information security breaches, including those caused by computer hacking, cyber attacks,cyber-attacks, electronic fraudulent activity or attempted theft of financial assets. We cannot assure any such failures, interruption or security breaches will not occur, or if they do occur, that they will be adequately addressed. While we have certain protective policies and procedures in place, the nature and sophistication of the threats continue to evolve. We may be required to expend significant additional resources in the future to modify and enhance our protective measures. Additionally, we face the risk of operational disruption, failure, termination or capacity constraints of any of the third parties that facilitate our business activities, including exchanges, clearing agents, clearing houses or other financial intermediaries. Such parties could also be the source of an attack on, or breach of, our operational systems. Any failures, interruptions or security breaches in our information systems could damage our reputation, result in a loss of client business, result in a violation of privacy or other laws, or expose us to civil litigation, regulatory fines or losses not covered by insurance.
We rely on third-party vendors to provide key components of our business infrastructure.
We rely heavily on third-party service providers for much of our communications, information, operating and financial control systems technology, including relationship management, mobile banking, general ledger, investment, deposit, loan servicing and loan origination systems. While we have selected these third-party vendors carefully and perform ongoing monitoring, we do not control their actions. Any problems caused by these third parties, including as a result of inadequate or interrupted service, could adversely affect our ability to deliver products and services to our clients and otherwise conduct our business. Financial or operational difficulties of a third-party vendor could also hurt our operations if those difficulties interfere with the vendor’s ability to serve us, and replacing these third-party vendors could result in significant delay and expense. Accordingly, use of such third parties creates an unavoidable inherent risk to our business operations as well as reputational risk.
Risks Relating to Our Common Stock and Depositary Shares
The price of our common stock and depositary shares may be volatile or may decline.
The trading price of our common stock and depositary shares may fluctuate widely as a result of a number of factors, many of which are outside our control. In addition, the stock market is subject to fluctuations in the share prices and trading volumes that affect the market prices of the shares of many companies. These broad market
23
fluctuations could make it more difficult for you to resell your common stock or depositary shares when you want and at prices you find attractive.
Our stock price and the price of our depositary shares can fluctuate significantly in response to a variety of factors including, among other things:
◦actual or anticipated quarterly fluctuations in our operating results and financial condition;
◦changes in revenue or earnings estimates or publication of research reports and recommendations by financial analysts;
◦failure to meet analysts'analysts’ revenue or earnings estimates;
◦speculation in the press or investment community;
◦strategic actions by us or our competitors, such as acquisitions or restructurings;
◦actions by institutional stockholders;shareholders;
◦fluctuations in the stock prices and operating results of our competitors;
◦general market conditions and, in particular, developments related to market conditions for the financial services industry;
◦proposed or adopted regulatory changes or developments;
◦anticipated or pending investigations, proceedings or litigation that involve or affect us; and/or
◦domestic and international economic factors unrelated to our performance.
The stock market and, in particular, the market for financial institution stocks, has historically experienced significant volatility. As a result, the market price of our common stock and depositary shares may be volatile. In addition, the trading volume in our common stock and depositary shares may fluctuate more than usual and cause significant price variations to occur. The trading price of the shares of our common stock and our depositary shares and the value of our other securities will depend on many factors, which may change from time to time, including, without limitation, our financial condition, performance, creditworthiness and prospects, future sales of our equity or equity related securities, and other factors identified in this annual report and other reports by the Company. In some cases, the markets have produced downward pressure on stock prices and credit availability for certain issuers without regard to those issuers'issuers’ underlying financial strength or operating results. A significant decline in our stock priceor depositary share prices could result in substantial losses for individual stockholdersshareholders and could lead to costly and disruptive securities litigation.
The trading volume in our common stock and depositary shares is less than that of other larger financial institutions.
Although our common stock isand depositary shares are listed for trading on the NASDAQNasdaq Global Select Market, its trading volume may be less than that of other, larger financial services companies. A public trading market having the desired characteristics of depth, liquidity and orderliness depends on the presence in the marketplace of willing buyers and sellers of our common stock or depositary shares at any given time, a factor over which we have no control. During any period of lower trading volume of our common stock or depositary shares, significant sales of shares of our common stock or depositary shares or the expectation of these sales could cause our common stock or depositary shares price to fall.
An investment in our common stock or depositary shares is not insured and you could lose the value of your entire investment.
An investment in our common stock or depositary shares is not a savings account, deposit or other obligation of our bank subsidiary, any non-bank subsidiary or any other bank, and such investment is not insured or guaranteed by the FDIC or any other governmental agency. As a result, if you acquire our common stock or depositary shares, you may lose some or all of your investment.
Our ability to pay dividends is limited by various statutes and regulations and depends primarily on the Bank'sBank’s ability to distribute funds to us and is also limited by various statutes and regulations.
The Company depends on payments from the Bank, including dividends, management fees and payments under tax sharing agreements, for substantially all of the Company's revenue.Company’s liquidity requirements. Federal and state regulations limit the amount of dividends and the amount of payments that the Bank may make to the Company under tax sharing agreements. In
24
certain circumstances, the Missouri Division of Finance, FDIC, or Federal Reserve Board could restrict or prohibit the Bank from distributing dividends or making other payments to us. In the event that the Bank was restricted from paying dividends to the Company or making payments under the tax sharing agreement, the Company may not be able to service its debt, pay its other obligations or pay dividends on its common stock or preferred stock. If we are unable or determine not to pay dividends on our outstanding equity securities, the market price of such securities could be materially adversely affected.
There can be no assurance of any future dividends on our common stock or our outstanding preferred stock.
Holders of our common stock and depositary shares are entitled to receive dividends only when, as and if declared by our boardthe Board of directors.Directors. Although we have historically paid cash dividends, on our common stock, we are not required to do so.
We have outstanding preferred stock and subordinated debentures issued to statutory trust subsidiaries, which have issued and sold preferred securities in the Trusts to investors.
Moreover, any other financing agreements that we enter into in the future may limit our ability to pay cash dividends on our capital stock, including the common stock. In the event that our existing or future financing agreements restrict our ability to pay dividends in cash on the common stock, we may be unable to pay dividends in cash on the common stock unless we can refinance amounts outstanding under those agreements. In addition, if we are unable or determine not to pay interest on our preferred stock or subordinated debentures, the market price of our common stock could be materially or adversely affected.
Anti-takeover provisions could negatively impact our stockholders.shareholders.
Provisions of Delaware law and of our certificate of incorporation, as amended, and bylaws, as well as various provisions of federal and Missouri state law applicable to bank and bank holding companies, could make it more difficult for a third party to acquire control of us or have the effect of discouraging a third party from attempting to acquire control of us. We are subject to Section 203 of the Delaware General Corporation Law, which would make it more difficult for another party to acquire us without the approval of our boardBoard of directors.Directors. Additionally, our certificate of incorporation, as amended, authorizes our boardBoard of directorsDirectors to issue preferred stock which could be issued as a defensive measure in response to a takeover proposal. In the event of a proposed merger, tender offer or other attempt to gain control of the Company, our boardBoard of directorsDirectors would have the ability to readily issue available shares of preferred stock as a method of discouraging, delaying or preventing a change in control of the Company. Such issuance could occur regardless of whether our stockholdersshareholders favorably view the merger, tender offer or other attempt to gain control of the Company. These and other provisions could make it more difficult for a third party to acquire us even if an acquisition might be in the best interests of our stockholders.shareholders. Although we have no present intention to issue any shares of our authorized preferred stock, there can be no assurance that the Company will not do so in the future.
General Risk Factors
Climate-related Risk
Political and social attention to the issue of climate change has increased.Federal and state legislatures and regulatory agencies continue to propose and advance numerous legislative and regulatory initiatives seeking to mitigate the effects of climate change.As a financial institution, it is unclear how future government regulations and shifts in business trends resulting from increased concern about climate change will affect our operations; however, natural or man-made disasters and severe weather events may cause operational disruptions and damage to both our properties and properties securing our loans.Losses resulting from these disasters and severe weather events may make it more difficult for borrowers to timely repay their loans.If these events occur, we may experience a decrease in the value of our loan portfolio and our revenue, and may incur additional operational expenses, each of which could have a material adverse effect on our financial condition and results of operations.
25
With the increased importance and focus on climate change, we are making efforts to enhance our governance of climate change-related risks and integrate climate considerations into our risk governance framework. Nonetheless, the risks associated with climate change are rapidly changing and evolving in an escalating fashion, making them difficult to assess due to limited data and other uncertainties. We could experience increased expenses resulting from strategic planning, litigation, and technology and market changes, and reputational harm as a result of negative public sentiment, regulatory scrutiny, and reduced investor and stakeholder confidence due to our response to climate change and our climate change strategy, which, in turn, could have a material negative impact on our business, results of operations, and financial condition.
26
ITEM 1B: UNRESOLVED STAFF COMMENTS
ITEM 2: PROPERTIES
Our executive offices are located at 150 North Meramec Avenue, Clayton, Missouri, 63105. As of December 31, 2017,2021, we had 19 banking locations and fiveadministrative offices throughout our market areas of Arizona, California, Kansas, Missouri, Nevada, and New Mexico. Additionally, the Company has a limited service facilitiesnetwork of SBA loan production offices and deposit production offices in the St. Louis metropolitan area, seven banking locations in the Kansas City metropolitan area, and two banking locations in the Phoenix metropolitan area.various states. We own 16 of theor lease our facilities and lease the remainder. Most of the leases expire between 2018 and 2024 and include one or more renewal options of up to five years. One lease expires in 2029. All the leases are classified as operating leases. We believe all of our properties are in good condition.condition to meet our business needs.
ITEM 3: LEGAL PROCEEDINGS
The Company and its subsidiaries are, from time to time, parties to various legal proceedings arising out of their businesses. Management believes that there are no such legal proceedings pending or threatened against the Company or its subsidiaries which,in the ordinary course of business, directly, indirectly, or in the aggregate that, if determined adversely, would have a material adverse effect on the business, consolidated financial condition, results of operations or cash flows of the Company or any of its subsidiaries.
For more information on our legal proceedings, see “Item 8. Note 14 – Litigation and Other Contingencies” in this report.
ITEM 4: MINE SAFETY DISCLOSURES
Not applicable.
PART II
ITEM 5: MARKET FOR REGISTRANT'SREGISTRANT’S COMMON EQUITY, RELATED STOCKHOLDER MATTERS AND ISSUER PURCHASES OF EQUITY SECURITIES
Market for Our Common Stock Market Prices
The Company'sCompany’s common stock trades on the NASDAQNasdaq Global Select Market under the symbol “EFSC.” Below are the dividends declared by quarter along with the closing, high, and low sales prices for the common stock for the periods indicated, as reported by the NASDAQ Global Select Market. There may have been other transactions at prices not known to the Company. As of February 21, 2018,24, 2022, the Company had 422 common stock1,776 registered shareholders of record and a market price of $47.90 per share.common stock. The number of holders of record does not represent the actual number of beneficial owners of our common stock because securities dealers and others frequently hold shares in “street name” for the benefit of individual owners who have the right to vote shares.
| 2017 | 2016 | ||||||||||||||||||||||||||||||
| 4th Qtr | 3rd Qtr | 2nd Qtr | 1st Qtr | 4th Qtr | 3rd Qtr | 2nd Qtr | 1st Qtr | ||||||||||||||||||||||||
| Closing Price | $ | 45.15 | $ | 42.35 | $ | 40.80 | $ | 42.40 | $ | 43.00 | $ | 31.25 | $ | 27.89 | $ | 27.04 | |||||||||||||||
| High | 46.25 | 42.70 | 45.35 | 46.25 | 43.65 | 31.96 | 29.06 | 29.36 | |||||||||||||||||||||||
| Low | 41.45 | 36.65 | 39.10 | 38.20 | 30.93 | 26.37 | 25.04 | 25.01 | |||||||||||||||||||||||
| Cash dividends paid on common shares | 0.11 | 0.11 | 0.11 | 0.11 | 0.11 | 0.11 | 0.10 | 0.09 | |||||||||||||||||||||||
Dividends
The holders of shares ofCompany paid quarterly cash dividends in 2021 and 2020 and anticipates continuing to pay comparable dividends. Total dividends paid were $0.75 in 2021 and $0.72 in 2020. However, we have no obligation to pay dividends and we may change our common stock are entitleddividend policy at any time without notice to receive dividends when declared by our Board of Directors out of funds legally available for the purpose of paying dividends. shareholders.
Our ability to pay dividends is substantially dependent upon the ability of our subsidiaries to pay cash dividends to us. Information on regulatory restrictions on our ability to pay dividends is set forth in Part“Part I, Item 1 -1. Business - Supervision and Regulation - Financial Holding Company - Dividend Restrictions.Restrictions and Share Repurchases.” The amount of dividends, if any, that may be declared by the Company also depends on many other factors, including future earnings, bank regulatory capital requirements and business conditions as they affect the Company and its subsidiaries. As a result, no assurance can be given that dividends will be paid in the future with respect to our common stock.
27
Recent Sales of Unregistered Securities and Use of Proceeds
None.
Issuer Purchases of Equity Securities
| Period | Total number of shares purchased (a) | Weighted-average price paid per share | Total number of shares purchased as part of publicly announced plans or programs | Maximum number of shares that may yet be purchased under the plans or programs (b) | |||||||||
| October 1, 2017 through October 31, 2017 | — | $ | — | — | 1,384,327 | ||||||||
| November 1, 2017 through November 30, 2017 | — | — | — | 1,384,327 | |||||||||
| December 1, 2017 through December 31, 2017 | 128 | 44.50 | — | 1,384,327 | |||||||||
| Total | 128 | $ | 44.50 | — | |||||||||
| Period | Total number of shares purchased | Weighted-average price paid per share | Total number of shares purchased as part of publicly announced plans or programs (a) | Maximum number of shares that may yet be purchased under the plans or programs (a) | ||||||||||||||||||||||
| October 1 - 31, 2021 | — | $ | — | — | 1,277,951 | |||||||||||||||||||||
| November 1- 30, 2021 | 192,398 | 47.44 | 192,398 | 1,085,553 | ||||||||||||||||||||||
| December 1- 31, 2021 | 385,080 | 47.76 | 385,080 | 700,473 | ||||||||||||||||||||||
| Total | 577,478 | $ | 47.65 | 577,478 | ||||||||||||||||||||||
(a) Includes shares of the Company’s common stock withheld to satisfy tax withholding obligations upon the vesting of awards of restricted stock. These shares were purchased pursuant to the terms of the applicable plan and not pursuant to a publicly announced repurchase plan or program.
28
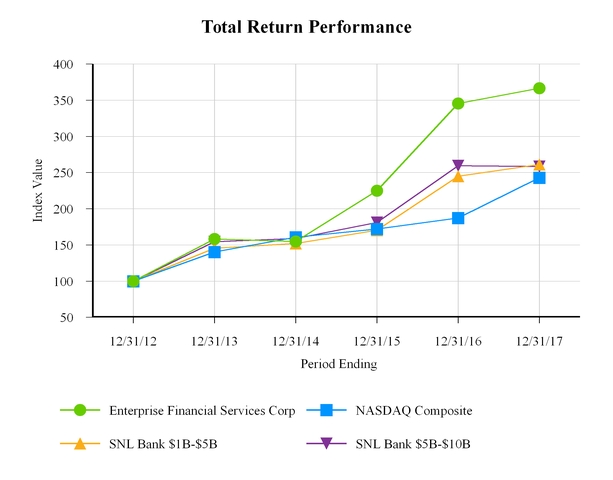
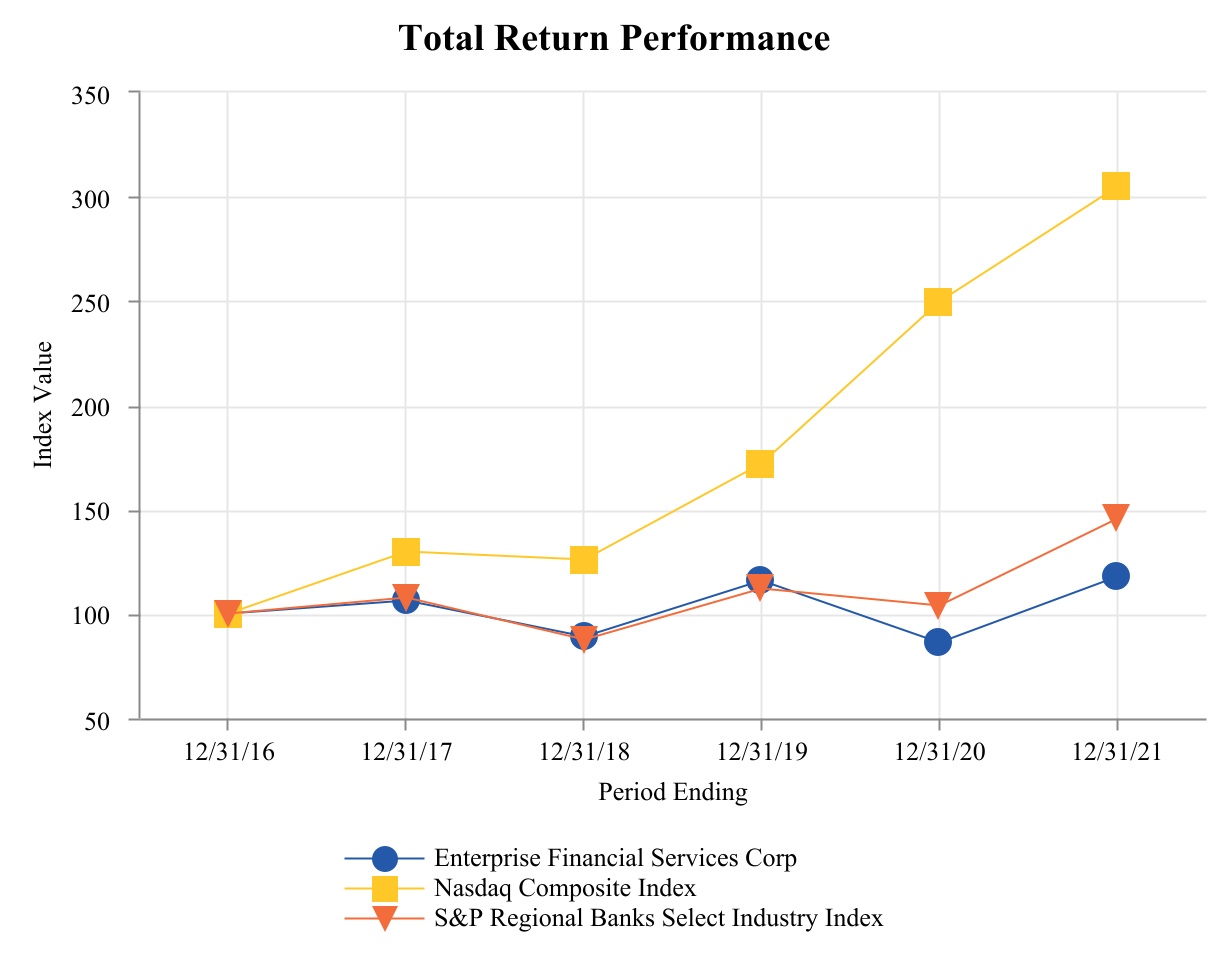
Stock Performance Graph
The following Stock Performance Graph and related information should not be deemed “soliciting material” or to be “filed” with the SEC nor shall such performance be incorporated by reference into any future filings under the Securities Act of 1933 or Securities Exchange Act of 1934, each as amended, except to the extent that the Company specifically incorporates it by reference into such filing.
The graph assumes an investment of $100.00 in the Company'sCompany’s common stock and each index at the respective closing price on December 31, 20122016 and reinvestment of all quarterly dividends. The investment is measured as of each subsequent fiscal year end. There is no assurance that the Company'sCompany’s common stock performance will continue in the future with the same or similar results as shown in the graph.
| Period Ending December 31, | ||||||||||||||||||||
| Index | 2016 | 2017 | 2018 | 2019 | 2020 | 2021 | ||||||||||||||
| Enterprise Financial Services Corp | $ | 100.00 | $ | 106.10 | $ | 89.28 | $ | 116.05 | $ | 86.18 | $ | 117.97 | ||||||||
| Nasdaq Composite Index | $ | 100.00 | $ | 129.64 | $ | 125.96 | $ | 172.18 | $ | 249.51 | $ | 304.85 | ||||||||
| S&P Regional Banks Select Industry Index | $ | 100.00 | $ | 107.95 | $ | 87.69 | $ | 111.92 | $ | 103.98 | $ | 145.47 | ||||||||
| Period Ending December 31, | ||||||||||||
| Index | 2012 | 2013 | 2014 | 2015 | 2016 | 2017 | ||||||
| Enterprise Financial Services Corp | 100.00 | 158.27 | 154.67 | 224.72 | 345.34 | 366.42 | ||||||
| NASDAQ Composite | 100.00 | 140.12 | 160.78 | 171.97 | 187.22 | 242.71 | ||||||
| SNL Bank $1B-$5B | 100.00 | 145.41 | 152.04 | 170.20 | 244.85 | 261.04 | ||||||
| SNL Bank $5B-$10B | 100.00 | 154.28 | 158.92 | 181.04 | 259.37 | 258.40 | ||||||
*Source: S&P Global Market Intelligence. Used with permission. All rights reserved.
ITEM 6: SELECTED FINANCIAL DATA
[RESERVED]
29
| Years ended December 31, | |||||||||||||||||||
| ($ in thousands, except per share data) | 2017 | 2016 | 2015 | 2014 | 2013 | ||||||||||||||
| EARNINGS SUMMARY: | |||||||||||||||||||
| Interest income | $ | 202,539 | $ | 149,224 | $ | 132,779 | $ | 131,754 | $ | 153,289 | |||||||||
| Interest expense | 25,235 | 13,729 | 12,369 | 14,386 | 18,137 | ||||||||||||||
| Net interest income | 177,304 | 135,495 | 120,410 | 117,368 | 135,152 | ||||||||||||||
| Provision (provision reversal) for portfolio loan losses | 10,764 | 5,551 | 4,872 | 4,409 | (642 | ) | |||||||||||||
| Provision (provision reversal) for purchased credit impaired loan losses | (634 | ) | (1,946 | ) | (4,414 | ) | 1,083 | 4,974 | |||||||||||
| Noninterest income | 34,394 | 29,059 | 20,675 | 16,631 | 9,899 | ||||||||||||||
| Noninterest expense | 115,051 | 86,110 | 82,226 | 87,463 | 90,639 | ||||||||||||||
| Income before income tax expense | 86,517 | 74,839 | 58,401 | 41,044 | 50,080 | ||||||||||||||
Income tax expense1 | 38,327 | 26,002 | 19,951 | 13,871 | 16,976 | ||||||||||||||
Net income1 | $ | 48,190 | $ | 48,837 | $ | 38,450 | $ | 27,173 | $ | 33,104 | |||||||||
| PER SHARE DATA: | |||||||||||||||||||
Basic earnings per common share1 | $ | 2.10 | $ | 2.44 | $ | 1.92 | $ | 1.38 | $ | 1.78 | |||||||||
Diluted earnings per common share1 | 2.07 | 2.41 | 1.89 | 1.35 | 1.73 | ||||||||||||||
| Cash dividends paid on common shares | 0.44 | 0.41 | 0.26 | 0.21 | 0.21 | ||||||||||||||
| Book value per common share | 23.76 | 19.31 | 17.53 | 15.94 | 14.47 | ||||||||||||||
| Tangible book value per common share | 18.20 | 17.69 | 15.86 | 14.20 | 12.62 | ||||||||||||||
| BALANCE SHEET DATA: | |||||||||||||||||||
| Ending balances: | |||||||||||||||||||
| Portfolio loans | $ | 4,066,659 | $ | 3,118,392 | $ | 2,750,737 | $ | 2,433,916 | $ | 2,137,313 | |||||||||
| Allowance for portfolio loan losses | 38,166 | 37,565 | 33,441 | 30,185 | 27,289 | ||||||||||||||
| Non-core acquired loans, net of allowance for loan losses | 25,980 | 33,925 | 64,583 | 83,693 | 125,100 | ||||||||||||||
| Goodwill | 117,345 | 30,334 | 30,334 | 30,334 | 30,334 | ||||||||||||||
| Other intangible assets, net | 11,056 | 2,151 | 3,075 | 4,164 | 5,418 | ||||||||||||||
| Total assets | 5,289,225 | 4,081,328 | 3,608,483 | 3,277,003 | 3,170,197 | ||||||||||||||
| Deposits | 4,156,414 | 3,233,361 | 2,784,591 | 2,491,510 | 2,534,953 | ||||||||||||||
| Subordinated debentures and notes | 118,105 | 105,540 | 56,807 | 56,807 | 62,581 | ||||||||||||||
| FHLB advances | 172,743 | — | 110,000 | 144,000 | 50,000 | ||||||||||||||
| Other borrowings | 253,674 | 276,980 | 270,326 | 239,883 | 214,331 | ||||||||||||||
| Shareholders' equity | 548,573 | 387,098 | 350,829 | 316,241 | 279,705 | ||||||||||||||
| Tangible common equity | 420,172 | 354,613 | 317,420 | 281,743 | 243,953 | ||||||||||||||
| Average balances: | |||||||||||||||||||
| Portfolio loans | $ | 3,810,055 | $ | 2,915,744 | $ | 2,520,734 | $ | 2,255,180 | $ | 2,097,920 | |||||||||
| Non-core acquired loans | 35,761 | 55,992 | 87,940 | 119,504 | 168,662 | ||||||||||||||
| Earning assets | 4,611,670 | 3,570,186 | 3,163,339 | 2,921,978 | 2,875,765 | ||||||||||||||
| Total assets | 4,980,229 | 3,796,478 | 3,381,831 | 3,156,994 | 3,126,537 | ||||||||||||||
| Interest-bearing liabilities | 3,396,382 | 2,634,700 | 2,344,861 | 2,209,188 | 2,237,111 | ||||||||||||||
| Shareholders' equity | 532,306 | 371,587 | 335,095 | 301,756 | 259,106 | ||||||||||||||
| Tangible common equity | 414,458 | 338,662 | 301,165 | 266,655 | 222,186 | ||||||||||||||
1Includes $12.1 million ($0.52 per share) deferred tax asset revaluation charge for 2017 due to U.S. corporate income tax reform. | |||||||||||||||||||
| Years ended December 31, | ||||||||||||||
| 2017 | 2016 | 2015 | 2014 | 2013 | ||||||||||
| SELECTED RATIOS: | ||||||||||||||
| Return on average common equity | 9.05 | % | 13.14 | % | 11.47 | % | 9.01 | % | 12.78 | % | ||||
| Return on average tangible common equity | 11.63 | 14.42 | 12.77 | 10.19 | 14.90 | |||||||||
| Return on average assets | 0.97 | 1.29 | 1.14 | 0.86 | 1.06 | |||||||||
| Efficiency ratio | 54.35 | 52.33 | 58.28 | 65.27 | 62.49 | |||||||||
| Total loan yield (1) | 4.84 | 4.66 | 4.72 | 5.14 | 6.36 | |||||||||
| Cost of interest-bearing liabilities | 0.74 | 0.52 | 0.53 | 0.65 | 0.81 | |||||||||
| Net interest spread (1) | 3.69 | 3.71 | 3.72 | 3.91 | 4.60 | |||||||||
| Net interest margin (1) | 3.88 | 3.84 | 3.86 | 4.07 | 4.78 | |||||||||
| Nonperforming loans to total loans (2) | 0.39 | 0.48 | 0.33 | 0.91 | 0.98 | |||||||||
| Nonperforming assets to total assets (2) (3) | 0.31 | 0.39 | 0.48 | 0.74 | 0.90 | |||||||||
| Net charge-offs to average loans (2) | 0.27 | 0.05 | 0.06 | 0.07 | 0.31 | |||||||||
| Allowance for loan losses to total loans (2) | 0.95 | 1.20 | 1.22 | 1.24 | 1.28 | |||||||||
| Dividend payout ratio - basic | 21.27 | 16.81 | 13.68 | 15.37 | 11.92 | |||||||||
| (1) Fully tax equivalent. | ||||||||||||||
| (2) Amounts and ratios exclude purchased credit impaired ("PCI") loans and related assets, except for their inclusion in total assets. | ||||||||||||||
| (3) Other real estate from PCI loans included in nonperforming assets beginning with the year ended December 31, 2015 due to termination of all existing FDIC loss share agreements. | ||||||||||||||
ITEM 7: MANAGEMENT’S DISCUSSION AND ANALYSIS OF FINANCIAL CONDITION AND
RESULTS OF OPERATIONS
Introduction
The objective of this section is to provide an overview of the results of operations and financial condition of the Company for the three years ended December 31, 2017.by focusing on changes in certain key measures from year to year. It should be read in conjunction with the Consolidated Financial Statements and related Notes contained in “Item 8. Financial Statements and Supplementary Data,” and other financial data presented elsewhere in this report, particularly the information regarding the Company'sCompany’s business operations described in Item 1. A detailed discussion comparing 2020 and 2019 results is incorporated herein by reference to Item 7 of the Company’s 2020 Annual Report on Form 10-K filed on February 19, 2021.
Executive Summary
The Company’s financial condition, operating results and liquidity in our consolidated results since this date. See Item 8, Note 2 - Acquisitions for more information.2020 and 2021 were impacted by COVID-19 and the monetary and fiscal policy changes enacted to address the pandemic. Starting in 2020, the Federal Reserve reduced interest rates and reserve requirements, while also increasing quantitative easing through purchases of Treasuries and agency mortgage-backed securities. The federal government’s fiscal support of the economy through the Cares Act, the ARA and other acts have been highly expansionary. Low interest rates, supply chain disruptions and monetary and fiscal policies contributed to higher inflation in 2021, leading the Federal Reserve to begin tapering its quantitative easing in November 2021.
The following table indicates a summarysummarizes the significant components of the acquired assetsFirst Choice and liabilitiesSeacoast transactions at fair value:the date of acquisition. See “Item 8. Note 2 – Acquisitions” for more information.
| First Choice | Seacoast | ||||||||||
| ($ in thousands) | July 21, 2021 | November 12, 2020 | |||||||||
| Loans, net | $ | 1,936,137 | $ | 1,190,441 | |||||||
| Securities | 34,489 | — | |||||||||
| Total assets acquired | 2,248,062 | 1,312,037 | |||||||||
| Deposits | 1,840,429 | 1,081,006 | |||||||||
| Total liabilities assumed | 2,006,857 | 1,193,595 | |||||||||
| Consideration paid: | |||||||||||
| Cash | $ | 2,152 | $ | 1,630 | |||||||
Common stock1 | 343,650 | 167,035 | |||||||||
| Total consideration paid | $ | 345,802 | $ | 168,665 | |||||||
1Common stock consideration for First Choice was $342,280, net of $1,370 for shares withheld on the settlement of share-based awards of First Choice employees.
30
| (in thousands) | |||
| Assets acquired: | |||
| Cash and cash equivalents | $ | 33,739 | |
| Interest-bearing deposits | 1,715 | ||
| Securities | 148,670 | ||
| Portfolio loans, net | 674,811 | ||
| Other real estate owned | 1,680 | ||
| Other investments | 2,695 | ||
| Fixed assets, net | 18,455 | ||
| Accrued interest receivable | 2,794 | ||
| Other intangible assets | 11,514 | ||
| Deferred tax assets | 8,625 | ||
| Other assets | 18,811 | ||
| Total assets acquired | $ | 923,509 | |
| Liabilities assumed: | |||
| Deposits | $ | 765,168 | |
| Other borrowings | 56,111 | ||
| Trust preferred securities | 12,505 | ||
| Accrued interest payable | 653 | ||
| Other liabilities | 5,071 | ||
| Total liabilities assumed | $ | 839,508 | |
| Net assets acquired | $ | 84,001 | |
| Consideration paid: | |||
| Cash | $ | 29,283 | |
| Common stock | 141,729 | ||
| Total consideration paid | $ | 171,012 | |
| Goodwill | $ | 87,011 | |
Financial Performance Highlights
Below are highlights of our financial performance for the year ended December 31, 2017 as compared to the years ended December 31, 20162021, 2020 and 2015.2019.
| ($ in thousands, except per share data) | Year ended December 31, | ||||||||||||||||
| 2021 | 2020 | 2019 | |||||||||||||||
| EARNINGS | |||||||||||||||||
| Total interest income | $ | 383,230 | $ | 304,779 | $ | 305,134 | |||||||||||
| Total interest expense | 23,036 | 34,778 | 66,417 | ||||||||||||||
| Net interest income | 360,194 | 270,001 | 238,717 | ||||||||||||||
| Provision for credit losses | 13,385 | 65,398 | 6,372 | ||||||||||||||
| Net interest income after provision for loan losses | 346,809 | 204,603 | 232,345 | ||||||||||||||
| Total noninterest income | 67,743 | 54,503 | 49,176 | ||||||||||||||
| Total noninterest expense | 245,919 | 167,159 | 165,485 | ||||||||||||||
| Income before income tax expense | 168,633 | 91,947 | 116,036 | ||||||||||||||
| Income tax expense | 35,578 | 17,563 | 23,297 | ||||||||||||||
| Net income | $ | 133,055 | $ | 74,384 | $ | 92,739 | |||||||||||
| Basic earnings per share | $ | 3.86 | $ | 2.76 | $ | 3.56 | |||||||||||
| Diluted earnings per share | $ | 3.86 | $ | 2.76 | $ | 3.55 | |||||||||||
| Return on average assets | 1.16 | % | 0.90 | % | 1.35 | % | |||||||||||
| Return on average common equity | 10.49 | % | 8.24 | % | 11.66 | % | |||||||||||
Return on average tangible common equity1 | 14.18 | % | 11.23 | % | 16.08 | % | |||||||||||
| Net interest margin (fully tax equivalent) | 3.41 | % | 3.56 | % | 3.80 | % | |||||||||||
| Efficiency ratio | 57.47 | % | 51.51 | % | 57.48 | % | |||||||||||
Core efficiency ratio1 | 51.61 | % | 50.96 | % | 52.36 | % | |||||||||||
| Dividend payout ratio | 19.66 | % | 26.61 | % | 17.87 | % | |||||||||||
| Book value per common share | $ | 38.53 | $ | 34.57 | $ | 32.67 | |||||||||||
Tangible book value per common share1 | $ | 28.28 | $ | 25.48 | $ | 23.76 | |||||||||||
| Average common equity to average assets | 11.14 | % | 10.94 | % | 11.54 | % | |||||||||||
Tangible common equity to tangible assets1 | 8.13 | % | 8.40 | % | 8.89 | % | |||||||||||
| At or for the year ended December 31, | |||||||||||||||||
| 2021 | 2020 | 2019 | |||||||||||||||
| ASSET QUALITY | |||||||||||||||||
| Net charge-offs | $ | 11,629 | $ | 1,907 | $ | 6,410 | |||||||||||
| Nonperforming loans | 28,024 | 38,507 | 26,425 | ||||||||||||||
| Classified assets | 100,797 | 123,808 | 85,897 | ||||||||||||||
| Nonperforming loans to total loans | 0.31 | % | 0.53 | % | 0.50 | % | |||||||||||
| Nonperforming assets to total assets | 0.23 | % | 0.45 | % | 0.45 | % | |||||||||||
| Allowance for loan losses to total loans | 1.61 | % | 1.89 | % | 0.81 | % | |||||||||||
| Net charge-offs to average loans | 0.14 | % | 0.03 | % | 0.13 | % | |||||||||||
| ($ in thousands, except per share data) | For the Years ended December 31, | ||||||||||
| 2017 | 2016 | 2015 | |||||||||
| EARNINGS | |||||||||||
| Total interest income | $ | 202,539 | $ | 149,224 | $ | 132,779 | |||||
| Total interest expense | 25,235 | 13,729 | 12,369 | ||||||||
| Net interest income | 177,304 | 135,495 | 120,410 | ||||||||
| Provision for portfolio loans | 10,764 | 5,551 | 4,872 | ||||||||
| Provision reversal for purchased credit impaired loans | (634 | ) | (1,946 | ) | (4,414 | ) | |||||
| Net interest income after provision for loan losses | 167,174 | 131,890 | 119,952 | ||||||||
| Total noninterest income | 34,394 | 29,059 | 20,675 | ||||||||
| Total noninterest expense | 115,051 | 86,110 | 82,226 | ||||||||
| Income before income tax expense | 86,517 | 74,839 | 58,401 | ||||||||
| Income tax expense | 38,327 | 26,002 | 19,951 | ||||||||
| Net income | $ | 48,190 | $ | 48,837 | $ | 38,450 | |||||
| Basic earnings per share | $ | 2.10 | $ | 2.44 | $ | 1.92 | |||||
| Diluted earnings per share | 2.07 | 2.41 | 1.89 | ||||||||
| Return on average assets | 0.97 | % | 1.29 | % | 1.14 | % | |||||
| Return on average common equity | 9.05 | % | 13.14 | % | 11.47 | % | |||||
| Return on average tangible common equity | 11.63 | % | 14.42 | % | 12.77 | % | |||||
| Net interest margin (fully tax equivalent) | 3.88 | % | 3.84 | % | 3.86 | % | |||||
| Efficiency ratio | 54.35 | % | 52.33 | % | 58.28 | % | |||||
ASSET QUALITY (1) | |||||||||||
| Net charge-offs | $ | 10,163 | $ | 1,427 | $ | 1,616 | |||||
| Nonperforming loans | 15,687 | 14,905 | 9,100 | ||||||||
| Classified assets | 73,239 | 93,452 | 67,761 | ||||||||
| Nonperforming loans to total loans | 0.39 | % | 0.48 | % | 0.33 | % | |||||
| Nonperforming assets to total assets (2) | 0.31 | % | 0.39 | % | 0.48 | % | |||||
| Allowance for loan losses to total loans | 0.95 | % | 1.19 | % | 1.18 | % | |||||
| Net charge-offs to average loans | 0.27 | % | 0.05 | % | 0.06 | % | |||||
| (1) Excludes PCI loans and related assets, except for their inclusion in total assets. | |||||||||||
| (2) Other real estate from PCI acquired loans included in nonperforming assets beginning with the year ended December 31, 2015 due to termination of all existing FDIC loss share agreements. | |||||||||||
| For the Years ended December 31, | |||||||||||
| ($ in thousands) | 2017 | 2016 | 2015 | ||||||||
CORE PERFORMANCE MEASURES (NON-GAAP) (1) | |||||||||||
| Net interest income | $ | 169,586 | $ | 123,515 | $ | 107,618 | |||||
| Provision for portfolio loan losses | 10,764 | 5,551 | 4,872 | ||||||||
| Noninterest income | 34,378 | 26,787 | 25,575 | ||||||||
| Noninterest expense | 107,960 | 82,217 | 77,472 | ||||||||
| Income before income tax expense | 85,240 | 62,534 | 50,849 | ||||||||
| Income tax expense | 25,328 | 21,297 | 17,058 | ||||||||
| Net income | $ | 59,912 | $ | 41,237 | $ | 33,791 | |||||
| Diluted earnings per share | $ | 2.58 | $ | 2.03 | $ | 1.66 | |||||
| Return on average assets | 1.20 | % | 1.09 | % | 1.00 | % | |||||
| Return on average common equity | 11.26 | % | 11.10 | % | 10.08 | % | |||||
| Return on average tangible common equity | 14.46 | % | 12.18 | % | 11.22 | % | |||||
| Net interest margin (fully tax equivalent) | 3.72 | % | 3.51 | % | 3.46 | % | |||||
| Efficiency ratio | 52.93 | % | 54.70 | % | 58.17 | % | |||||
| (1) A non-GAAP measure. A reconciliation has been included in this MD&A section under the caption "Use of Non-GAAP Financial Measures." | |||||||||||
•The Company reported net income of $133.1 million, or $3.86 per diluted share for 2021, compared to $74.4 million, or $2.76 per diluted share for 2020. In addition to organic growth, contributing to the
31
increase in net income was a full year of Seacoast operations and a partial year of First Choice operations. Net income also benefited from a reduction in the provision for credit losses of $52.0 million in 2021 compared to 2020, which was partially offset by a $17.9 million increase in merger-related expenses. Acquisition related provision for credit losses of $25.4 million and $8.6 million in 2021 and 2020, respectively, were included in the provision for credit losses. This expense, commonly referred to as the “CECL double-count”, is recognized when a loan portfolio is acquired. Excluding the CECL double-count, the provision for credit losses decreased in 2021 primarily due to strong credit quality, the forward-looking CECL methodology and the improved outlook for forecasted economic factors compared to 2020.
•Net interest income for 2021 totaled$360.2 million, an increase of $90.2 million, or 33%, compared to $270.0 million for 2020. PPP interest and fee income totaled $27.3 million and $19.6 million in 2021 and 2020, respectively. The First Choice acquisition added $37.9 million and the Company benefited from a full year of Seacoast operations in 2021 compared to a partial year in 2020. Organic growth in the loan portfolio also contributed to the current year increase in net interest income.
•Net interest margin decreased 15 basis points to 3.41% during 2021, compared to 3.56% in 2020. The decrease was primarily due to an increase in liquidity from deposit growth. Average interest-bearing cash accounts of $1.1 billion had a yield of 0.14% in 2021, compared to $228.8 million at a yield of 0.27% in 2020.
•Noninterest income increased $13.2 million, or 24%, to $67.7 million in 2021 compared to $54.5 million in 2020. This improvement was primarily due to organic growth and the acquisitions of Seacoast and First Choice.
•Noninterest expenses totaled $245.9 million for 2021, an increase of $78.8 million , or 47%, compared to 2020. Seacoast and First Choice increased noninterest expense $51.2 million in 2021 compared to 2020, in addition to a $17.9 million increase in merger-related expenses year-over-year. The Company’s efficiency ratio was 57.5% in 2021, compared to 51.5% for the prior year. The increase in 2021 was primarily due to merger-related expenses. The Company’s core efficiency ratio1 was relatively stable at 51.6% in 2021, compared to 51.0% for the prior year.
•The Company’s effective tax rate was 21.1% in 2021 compared to 19.1% in 2020. The higher rate in 2021 primarily resulted from higher pre-tax income and the Company’s expanded geographic footprint and the related state apportionment.
1Non-GAAP measures. A reconciliation has been included in this MD&A section under the caption “Use of Non-GAAP Financial Measures.”
2021 Significant Transactions
During 2017,2021, we completedannounced the following significant transactions:
•On February 10, 2017,July 21, 2021, the Company announced the completion of its acquisition of JCB which was mergedFirst Choice, a commercial bank based in Los Angeles, CA, with and into the Company, and Eagle Bank and Trust Company of Missouri, JCB's wholly-owned subsidiary, merged with and into the Bank. As part of the acquisition, 3.3 million shares of the Company’s
•Continued supporting customers through PPP, lending an additional $341 million of PPP loans.
•The Company announced the closing of five branch locations in California and St. Louis. A lease and fixed asset impairment charge of $3.8 million was recognized, including $0.4 million reported in merger-related expenses. The Company expects to realize annual cost savings of approximately $171.0$2.3 million including JCB’s commonrelated to these closures.
•The Company redeemed $50.0 million of 4.75% fixed-to-floating rate subordinated notes.
32
•The Company issued and sold 3,000,000 depositary shares, each representing 1/40th interest in a share of 5% noncumulative, perpetual preferred stock and stock options.totaling $72.0 million, net of issuance costs.
•The Company repurchased 429,9551,299,527 of its common shares at a weighted-average share price of $38.69, pursuant$46.62. At December 31, 2021, there were 700,473 shares remaining to its publicly announced program.be purchased under the existing share repurchase plan.
2020 Significant Transactions
During 2016,2020, we completedannounced the following significant transactions:
•On October 10, 2016,November 12, 2020, the Company entered intoannounced the completion of its acquisition of Seacoast which operated five full-service retail and commercial banking offices in California and Nevada as well as SBA loan production offices and deposit production offices in various states. Aggregate consideration at closing was 5.0 million shares of Company common stock to Seacoast shareholders. The overall transaction had a definitive merger agreement to acquire JCB headquartered in Jefferson County, Missouri. JCB isvalue of $169 million.
•Assisted new and existing customers with navigating and accessing PPP loans through the parent holding companyapproval of Eagle Bank and Trust Company of Missouri. The transaction closed on February 10, 2017.approximately 3,900 loans totaling $859 million.
•The Company repurchased 185,718456,251 of its common shares at a weighted-average share price of $26.32 pursuant to its publicly announced program during the year ended December 31, 2016. The Company's Board authorized the repurchase plan$33.64.
•Dividends paid in May2020 of 2015, which allows the Company to repurchase up to two million common shares, representing approximately 10% of the Company’s then currently outstanding shares. Shares may be bought back in open market$0.72 per share increased $0.10 per share, or privately negotiated transactions over an indeterminate time period based on market and business conditions.
33
RESULTS OF OPERATIONS
Net Interest Income
Average Balance Sheet
| Year ended December 31, | |||||||||||||||||||||||||||||||||||||||||||||||||||||
| 2021 | 2020 | 2019 | |||||||||||||||||||||||||||||||||||||||||||||||||||
| ($ in thousands) | Average Balance | Interest Income/Expense | Average Yield/ Rate | Average Balance | Interest Income/Expense | Average Yield/ Rate | Average Balance | Interest Income/Expense | Average Yield/ Rate | ||||||||||||||||||||||||||||||||||||||||||||
| Assets | |||||||||||||||||||||||||||||||||||||||||||||||||||||
| Interest-earning assets: | |||||||||||||||||||||||||||||||||||||||||||||||||||||
Loans1, 2 | $ | 8,055,873 | $ | 349,112 | 4.33 | % | $ | 6,071,496 | $ | 270,673 | 4.46 | % | $ | 5,018,568 | $ | 269,864 | 5.38 | % | |||||||||||||||||||||||||||||||||||
| Taxable securities | 908,189 | 19,305 | 2.13 | 1,016,100 | 25,524 | 2.51 | 1,064,913 | 30,085 | 2.83 | ||||||||||||||||||||||||||||||||||||||||||||
Non-taxable securities2 | 659,804 | 18,468 | 2.80 | 350,501 | 11,151 | 3.18 | 131,161 | 4,668 | 3.56 | ||||||||||||||||||||||||||||||||||||||||||||
| Total securities | 1,567,993 | 37,773 | 2.41 | 1,366,601 | 36,675 | 2.68 | 1,196,074 | 34,753 | 2.91 | ||||||||||||||||||||||||||||||||||||||||||||
| Interest-earning deposits | 1,084,853 | 1,496 | 0.14 | 228,760 | 620 | 0.27 | 107,433 | 2,128 | 1.98 | ||||||||||||||||||||||||||||||||||||||||||||
| Total interest-earning assets | 10,708,719 | 388,381 | 3.63 | 7,666,857 | 307,968 | 4.02 | 6,322,075 | 306,745 | 4.85 | ||||||||||||||||||||||||||||||||||||||||||||
| Noninterest-earning assets | 758,591 | 587,057 | 572,216 | ||||||||||||||||||||||||||||||||||||||||||||||||||
| Total assets | $ | 11,467,310 | $ | 8,253,914 | $ | 6,894,291 | |||||||||||||||||||||||||||||||||||||||||||||||
| Liabilities and Shareholders' Equity | |||||||||||||||||||||||||||||||||||||||||||||||||||||
| Interest-bearing liabilities: | |||||||||||||||||||||||||||||||||||||||||||||||||||||
| Interest-bearing demand accounts | $ | 2,122,752 | $ | 1,614 | 0.08 | % | $ | 1,494,364 | $ | 2,101 | 0.14 | % | $ | 1,286,641 | $ | 7,592 | 0.59 | % | |||||||||||||||||||||||||||||||||||
| Money market accounts | 2,557,836 | 4,669 | 0.18 | 1,977,826 | 7,754 | 0.39 | 1,608,349 | 26,267 | 1.63 | ||||||||||||||||||||||||||||||||||||||||||||
| Savings accounts | 724,768 | 225 | 0.03 | 589,832 | 279 | 0.05 | 489,310 | 841 | 0.17 | ||||||||||||||||||||||||||||||||||||||||||||
| Certificates of deposit | 570,496 | 4,160 | 0.73 | 676,889 | 10,915 | 1.61 | 799,079 | 15,156 | 1.90 | ||||||||||||||||||||||||||||||||||||||||||||
| Total interest-bearing deposits | 5,975,852 | 10,668 | 0.18 | 4,738,911 | 21,049 | 0.44 | 4,183,379 | 49,856 | 1.19 | ||||||||||||||||||||||||||||||||||||||||||||
| Subordinated debentures and notes | 195,686 | 10,960 | 5.60 | 179,534 | 9,885 | 5.51 | 136,950 | 7,507 | 5.48 | ||||||||||||||||||||||||||||||||||||||||||||
| FHLB advances | 59,945 | 803 | 1.34 | 241,635 | 2,673 | 1.11 | 287,474 | 6,668 | 2.32 | ||||||||||||||||||||||||||||||||||||||||||||
| Securities sold under agreements to repurchase | 225,894 | 235 | 0.10 | 206,338 | 542 | 0.26 | 169,179 | 1,246 | 0.74 | ||||||||||||||||||||||||||||||||||||||||||||
| Other borrowings | 26,428 | 370 | 1.40 | 32,147 | 629 | 1.96 | 32,392 | 1,140 | 3.52 | ||||||||||||||||||||||||||||||||||||||||||||
| Total interest-bearing liabilities | 6,483,805 | 23,036 | 0.36 | 5,398,565 | 34,778 | 0.64 | 4,809,374 | 66,417 | 1.38 | ||||||||||||||||||||||||||||||||||||||||||||
| Noninterest bearing liabilities: | |||||||||||||||||||||||||||||||||||||||||||||||||||||
| Demand deposits | 3,597,204 | 1,854,982 | 1,228,832 | ||||||||||||||||||||||||||||||||||||||||||||||||||
| Other liabilities | 109,148 | 97,492 | 60,608 | ||||||||||||||||||||||||||||||||||||||||||||||||||
| Total liabilities | 10,190,157 | 7,351,039 | 6,098,814 | ||||||||||||||||||||||||||||||||||||||||||||||||||
| Shareholders' equity | 1,277,153 | 902,875 | 795,477 | ||||||||||||||||||||||||||||||||||||||||||||||||||
| Total liabilities & shareholders' equity | $ | 11,467,310 | $ | 8,253,914 | $ | 6,894,291 | |||||||||||||||||||||||||||||||||||||||||||||||
| Net interest income | $ | 365,345 | $ | 273,190 | $ | 240,328 | |||||||||||||||||||||||||||||||||||||||||||||||
| Net interest spread | 3.27 | % | 3.38 | % | 3.47 | % | |||||||||||||||||||||||||||||||||||||||||||||||
| Net interest margin (tax equivalent) | 3.41 | 3.56 | 3.80 | ||||||||||||||||||||||||||||||||||||||||||||||||||
1Average balances include non-accrual loans. Interest income includes net loan fees of $28.4 million, $18.4 million, and $4.5 million for the years ended December 31, 2021, 2020, and 2019 respectively. Loan fees in 2021 and 2020 included PPP fees of $21.7 million and $13.8 million, respectively.
2Non-taxable income is presented on a fully tax-equivalent basis using a 25.2% tax rate in 2021 and a 24.7% tax rate in each of 2020 and 2019. The tax-equivalent adjustments were $5.1 million for the year ended December 31, 2021, $3.2 million for the year ended December 31, 2020, and $1.6 million for the year ended December 31, 2019.
34
| For the Years ended December 31, | ||||||||||||||||||||||||||||||||
| 2017 | 2016 | 2015 | ||||||||||||||||||||||||||||||
| ($ in thousands) | Average Balance | Interest Income/Expense | Average Yield/ Rate | Average Balance | Interest Income/Expense | Average Yield/ Rate | Average Balance | Interest Income/Expense | Average Yield/ Rate | |||||||||||||||||||||||
| Assets | ||||||||||||||||||||||||||||||||
| Interest-earning assets: | ||||||||||||||||||||||||||||||||
| Taxable portfolio loans (1) | $ | 3,774,484 | $ | 173,824 | 4.61 | % | $ | 2,881,071 | $ | 120,803 | 4.19 | % | $ | 2,486,369 | $ | 102,562 | 4.12 | % | ||||||||||||||
| Tax-exempt portfolio loans (2) | 40,634 | 2,652 | 6.53 | 41,471 | 2,512 | 6.06 | 39,347 | 2,570 | 6.53 | |||||||||||||||||||||||
| Non-core acquired loans - contractual | 35,761 | 2,273 | 6.36 | 55,992 | 3,403 | 6.08 | 87,940 | 5,426 | 6.17 | |||||||||||||||||||||||
| Non-core acquired loans - incremental | 7,718 | 21.58 | 11,980 | 21.39 | 12,792 | 14.55 | ||||||||||||||||||||||||||
| Total loans | 3,850,879 | 186,467 | 4.84 | 2,978,534 | 138,698 | 4.66 | 2,613,656 | 123,350 | 4.72 | |||||||||||||||||||||||
| Taxable investments in debt and equity securities | 634,195 | 15,000 | 2.37 | 476,341 | 9,816 | 2.06 | 436,023 | 8,983 | 2.06 | |||||||||||||||||||||||
| Non-taxable investments in debt and equity securities (2) | 47,219 | 2,078 | 4.40 | 48,157 | 2,106 | 4.37 | 44,738 | 1,966 | 4.39 | |||||||||||||||||||||||
| Short-term investments | 79,377 | 804 | 1.01 | 67,154 | 370 | 0.55 | 68,922 | 211 | 0.31 | |||||||||||||||||||||||
| Total securities and short-term investments | 760,791 | 17,882 | 2.35 | 591,652 | 12,292 | 2.08 | 549,683 | 11,160 | 2.03 | |||||||||||||||||||||||
| Total interest-earning assets | 4,611,670 | 204,349 | 4.43 | 3,570,186 | 150,990 | 4.23 | 3,163,339 | 134,510 | 4.25 | |||||||||||||||||||||||
| Noninterest-earning assets: | ||||||||||||||||||||||||||||||||
| Cash and due from banks | 79,189 | 57,237 | 50,017 | |||||||||||||||||||||||||||||
| Other assets | 333,185 | 213,698 | 212,710 | |||||||||||||||||||||||||||||
| Allowance for loan losses | (43,815 | ) | (44,643 | ) | (44,235 | ) | ||||||||||||||||||||||||||
| Total assets | $ | 4,980,229 | $ | 3,796,478 | $ | 3,381,831 | ||||||||||||||||||||||||||
| Liabilities and Shareholders' Equity | ||||||||||||||||||||||||||||||||
| Interest-bearing liabilities: | ||||||||||||||||||||||||||||||||
| Interest-bearing transaction accounts | $ | 802,993 | $ | 2,195 | 0.27 | % | $ | 606,899 | $ | 1,370 | 0.23 | % | $ | 512,272 | $ | 1,149 | 0.22 | % | ||||||||||||||
| Money market accounts | 1,286,796 | 8,708 | 0.68 | 1,075,055 | 4,439 | 0.41 | 949,814 | 2,993 | 0.32 | |||||||||||||||||||||||
| Savings | 189,516 | 459 | 0.24 | 105,115 | 262 | 0.25 | 88,399 | 219 | 0.25 | |||||||||||||||||||||||
| Certificates of deposit | 586,115 | 5,838 | 1.00 | 466,326 | 4,770 | 1.02 | 496,449 | 6,051 | 1.22 | |||||||||||||||||||||||
| Total interest-bearing deposits | 2,865,420 | 17,200 | 0.60 | 2,253,395 | 10,841 | 0.48 | 2,046,934 | 10,412 | 0.51 | |||||||||||||||||||||||
| Subordinated debentures and notes | 116,707 | 5,095 | 4.37 | 64,948 | 1,894 | 2.91 | 56,807 | 1,248 | 2.21 | |||||||||||||||||||||||
| FHLB advances | 192,489 | 2,356 | 1.22 | 109,713 | 555 | 0.51 | 41,283 | 128 | 0.31 | |||||||||||||||||||||||
| Other borrowed funds | 221,766 | 584 | 0.26 | 206,644 | 439 | 0.21 | 199,837 | 581 | 0.29 | |||||||||||||||||||||||
| Total interest-bearing liabilities | 3,396,382 | 25,235 | 0.74 | 2,634,700 | 13,729 | 0.52 | 2,344,861 | 12,369 | 0.53 | |||||||||||||||||||||||
| Noninterest bearing liabilities: | ||||||||||||||||||||||||||||||||
| Demand deposits | 1,017,660 | 761,086 | 673,704 | |||||||||||||||||||||||||||||
| Other liabilities | 33,881 | 29,105 | 28,171 | |||||||||||||||||||||||||||||
| Total liabilities | 4,447,923 | 3,424,891 | 3,046,736 | |||||||||||||||||||||||||||||
| Shareholders' equity | 532,306 | 371,587 | 335,095 | |||||||||||||||||||||||||||||
| Total liabilities & shareholders' equity | $ | 4,980,229 | $ | 3,796,478 | $ | 3,381,831 | ||||||||||||||||||||||||||
| Net interest income | $ | 179,114 | $ | 137,261 | $ | 122,141 | ||||||||||||||||||||||||||
| Net interest spread | 3.69 | % | 3.71 | % | 3.72 | % | ||||||||||||||||||||||||||
| Net interest margin (tax equivalent) | 3.88 | % | 3.84 | % | 3.86 | % | ||||||||||||||||||||||||||
| Core net interest margin (3) | 3.72 | % | 3.51 | % | 3.46 | % | ||||||||||||||||||||||||||
Rate/Volume
The following table sets forth, on a tax-equivalent basis for the periods indicated, a summary of the changes in interest income and interest expense resulting from changes in yield/rates and volume.
| 2021 compared to 2020 | 2020 compared to 2019 | ||||||||||||||||||||||||||||||||||
| Increase (decrease) due to | Increase (decrease) due to | ||||||||||||||||||||||||||||||||||
| ($ in thousands) | Volume1 | Rate2 | Net | Volume1 | Rate2 | Net | |||||||||||||||||||||||||||||
| Interest earned on: | |||||||||||||||||||||||||||||||||||
| Loans | $ | 86,183 | $ | (7,744) | $ | 78,439 | $ | 51,290 | $ | (50,481) | $ | 809 | |||||||||||||||||||||||
| Taxable securities | (2,541) | (3,678) | (6,219) | (1,334) | (3,227) | (4,561) | |||||||||||||||||||||||||||||
Non-taxable securities3 | 8,799 | (1,482) | 7,317 | 7,027 | (544) | 6,483 | |||||||||||||||||||||||||||||
| Interest-earning deposits | 1,313 | (437) | 876 | 1,228 | (2,736) | (1,508) | |||||||||||||||||||||||||||||
| Total interest-earning assets | 93,754 | (13,341) | 80,413 | 58,211 | (56,988) | 1,223 | |||||||||||||||||||||||||||||
| Interest paid on: | |||||||||||||||||||||||||||||||||||
| Interest-bearing demand accounts | $ | 689 | $ | (1,176) | $ | (487) | $ | 1,063 | $ | (6,554) | $ | (5,491) | |||||||||||||||||||||||
| Money market accounts | 1,844 | (4,929) | (3,085) | 4,970 | (23,483) | (18,513) | |||||||||||||||||||||||||||||
| Savings | 55 | (109) | (54) | 145 | (707) | (562) | |||||||||||||||||||||||||||||
| Certificates of deposit | (1,506) | (5,249) | (6,755) | (2,142) | (2,099) | (4,241) | |||||||||||||||||||||||||||||
| Subordinated debentures and notes | 902 | 173 | 1,075 | 2,345 | 33 | 2,378 | |||||||||||||||||||||||||||||
| FHLB advances | (2,341) | 471 | (1,870) | (933) | (3,062) | (3,995) | |||||||||||||||||||||||||||||
| Securities sold under agreements to repurchase | 47 | (354) | (307) | 229 | (933) | (704) | |||||||||||||||||||||||||||||
| Other borrowed funds | (100) | (159) | (259) | (9) | (502) | (511) | |||||||||||||||||||||||||||||
| Total interest-bearing liabilities | (410) | (11,332) | (11,742) | 5,668 | (37,307) | (31,639) | |||||||||||||||||||||||||||||
| Net interest income | $ | 94,164 | $ | (2,009) | $ | 92,155 | $ | 52,543 | $ | (19,681) | $ | 32,862 | |||||||||||||||||||||||
1Change in volume multiplied by yield/rate of prior period. | |||||||||||||||||||||||||||||||||||
2Change in yield/rate multiplied by volume of prior period. | |||||||||||||||||||||||||||||||||||
3Nontaxable income is presented on a fully tax equivalent basis using a tax rate of 25.2% and 24.7% for 2021 and 2020, respectively. | |||||||||||||||||||||||||||||||||||
| NOTE: The change in interest due to both rate and volume has been allocated to rate and volume changes in proportion to the relationship of the absolute dollar amounts of the change in each. | |||||||||||||||||||||||||||||||||||
| 2017 compared to 2016 | 2016 compared to 2015 | ||||||||||||||||||||||
| Increase (decrease) due to | Increase (decrease) due to | ||||||||||||||||||||||
| ($ in thousands) | Volume1 | Rate2 | Net | Volume1 | Rate2 | Net | |||||||||||||||||
| Interest earned on: | |||||||||||||||||||||||
| Taxable portfolio loans | $ | 40,257 | $ | 12,764 | $ | 53,021 | $ | 16,524 | $ | 1,717 | $ | 18,241 | |||||||||||
Tax-exempt portfolio loans3 | (52 | ) | 192 | 140 | 135 | (193 | ) | (58 | ) | ||||||||||||||
| Non-core acquired loans | (5,648 | ) | 256 | (5,392 | ) | (7,756 | ) | 4,921 | (2,835 | ) | |||||||||||||
| Taxable investments in debt and equity securities | 3,586 | 1,598 | 5,184 | 831 | 2 | 833 | |||||||||||||||||
Non-taxable investments in debt and equity securities3 | (41 | ) | 13 | (28 | ) | 150 | (10 | ) | 140 | ||||||||||||||
| Short-term investments | 77 | 357 | 434 | (5 | ) | 164 | 159 | ||||||||||||||||
| Total interest-earning assets | 38,179 | 15,180 | 53,359 | 9,879 | 6,601 | 16,480 | |||||||||||||||||
| Interest paid on: | |||||||||||||||||||||||
| Interest-bearing transaction accounts | $ | 499 | $ | 326 | $ | 825 | $ | 214 | $ | 7 | $ | 221 | |||||||||||
| Money market accounts | 1,006 | 3,263 | 4,269 | 431 | 1,015 | 1,446 | |||||||||||||||||
| Savings | 204 | (7 | ) | 197 | 42 | 1 | 43 | ||||||||||||||||
| Certificates of deposit | 1,196 | (128 | ) | 1,068 | (351 | ) | (930 | ) | (1,281 | ) | |||||||||||||
| Subordinated debentures and notes | 1,976 | 1,225 | 3,201 | 199 | 447 | 646 | |||||||||||||||||
| FHLB advances | 625 | 1,176 | 1,801 | 309 | 118 | 427 | |||||||||||||||||
| Other borrowed funds | 34 | 111 | 145 | 19 | (161 | ) | (142 | ) | |||||||||||||||
| Total interest-bearing liabilities | 5,540 | 5,966 | 11,506 | 863 | 497 | 1,360 | |||||||||||||||||
| Net interest income | $ | 32,639 | $ | 9,214 | $ | 41,853 | $ | 9,016 | $ | 6,104 | $ | 15,120 | |||||||||||
1Change in volume multiplied by yield/rate of prior period. | |||||||||||||||||||||||
2Change in yield/rate multiplied by volume of prior period. | |||||||||||||||||||||||
3Nontaxable income is presented on a fully tax equivalent basis using a 38% tax rate. | |||||||||||||||||||||||
| NOTE: The change in interest due to both rate and volume has been allocated to rate and volume changes in proportion to the relationship of the absolute dollar amounts of the change in each. | |||||||||||||||||||||||
Net interest income (on a tax equivalent basis) was $179.1$365.3 million for 2017,2021, compared to $137.3$273.2 million for 2016,2020, an increase of $41.9$92.2 million, or 30%34%. Total interest income increased $53.4$80.4 million and total interest expense increased $11.5decreased $11.7 million. The increase in net interest income in 2021 was primarily due to higher loan volumes, which benefited from the Seacoast and First Choice acquisitions, PPP loans, and a decline in the interest rate on interest-bearing liabilities.
Loans issued through the PPP bear interest at 1% and have either a two or five year maturity. As a PPP lender, the Company also receives fees for the issuance of PPP loans that vary based on the size of the loan. Interest income and loan fees included in net interest income from the PPP program totaled $27.3 million and $19.6 million in 2021 and 2020, respectively. During 2021, the Company received $14.6 million in PPP loan fees for loans originated in the year. These fees are recognized over the life of the loan, or when the loan is repaid or forgiven. At December 31, 2021, the Company has $272.0 million in PPP loans and $4.2 million in deferred fees, compared to $698.6 million in loans and $11.3 million in fees at the end of 2020.
The tax-equivalent net interest margin was 3.88%3.41% for 2017,2021, compared to 3.84%3.56% for 2020. The primary driver of the prior year period. The increasedecline in net interest incomemargin from 2020 to 2021 was primarily duean increase in liquidity from deposit growth. Average interest-bearing cash balances grew to $1.1 billion, an increase of $856.1 million from 2020. In addition, 2021 was impacted by a full year of low interest rates following the Federal Reserve’s reduction of interest rates in 2020. The federal funds target rate declined 150 basis points in 2020 and one-month LIBOR declined over 160 basis points. The
35
decline in short-term rates reduced the yield on the Company’s variable-rate loan portfolio, as well as the yield earned on new loan production. As of December 31, 2021, variable-rate loans comprised approximately 63% of total loans. In response to the impact of risingdecline in interest rates, which increased yields on variable rate loansthe Company proactively reduced the cost of certain managed money market and to an improved earning asset mix combined with the acquisitioninterest-bearing accounts, while also reducing certificates of JCB, partially offset by a decline in contributions from non-core acquired assetsdeposit balances and higher rates on interest bearing liabilities.wholesale borrowings.
Average interest-earning assets increased $1$3.0 billion, or 29%40%, to $4.6$10.7 billion for the year ended December 31, 2017.2021. The increase was due to growth in average earning assets due to the inclusion of a full year of Seacoast operations, a partial year of First Choice operations and the previously mentioned increase in liquidity from deposit generation. Average total loanssecurities represented 15% of earnings assets in 2021 and 18% in 2020. The acquisitions of Seacoast and First Choice did not include any significant investment security balances. The Company has taken a measured approach to investing excess liquidity into the investment portfolio, increasing the average balance from $1.4 billion in 2020 to $1.6 billion in 2021. Average interest-earning deposits increased $872from 3% to 10% of earning assets, primarily due to higher liquidity from deposit growth. Volume growth of the balance sheet drove an increase in interest income on earning assets of $93.8 million. Interest income on interest-earnings assets decreased $13.3 million primarily due the decline in interest rates in 2021 compared to 2020.
Average interest-bearing liabilities increased $1.1 billion, or 29%, to $3.9 billion20% for the year ended December 31, 2017,2021. The increase resulted from $3.0$1.2 billion of growth in interest-bearing deposits. While average interest-bearing liabilities increased, interest expense declined $11.7 million due to a 26 basis point decline in the cost of deposits, primarily due to the run-off of higher yielding certificates of deposit. The Company issued $63.3 million of subordinated debentures in May 2020 with an interest rate of 5.75% that was included for a full year in 2021. Partially offsetting this additional expense was the redemption of the $50.0 million subordinated debentures at 4.75% in the fourth quarter 2021. The total cost of interest-bearing liabilities declined 28 basis points, from 0.64% in 2021 to 0.36% in 2021. The shift in the mix of interest-bearing liabilities from certificates of deposit and wholesale borrowings to interest-bearing and noninterest-bearing deposits reduced interest expense in 2021 by $0.4 million. Interest expense on interest-bearing liabilities decreased $11.3 million for the year ended December 31, 2016, largely2021 due to the JCB acquisition along with organic loan growth. Average securities and short-term investments increased $169 million, or 29%, to $760.8 million for 2017 compared
| For the Years ended December 31, | |||||||||||
| ($ in thousands) | 2017 | 2016 | 2015 | ||||||||
| Accelerated cash flows and other incremental accretion | $ | 7,718 | $ | 11,980 | $ | 12,792 | |||||
| Provision reversal for loan losses | 634 | 1,946 | 4,414 | ||||||||
| Gain (loss) on sale of other real estate | (6 | ) | 1,565 | 107 | |||||||
| Other income from other real estate | — | 621 | — | ||||||||
FDIC loss share termination1 | — | — | (2,436 | ) | |||||||
| Change in FDIC loss share receivable | — | — | (5,030 | ) | |||||||
| Change in FDIC clawback liability | — | — | (760 | ) | |||||||
| Other expenses | (240 | ) | (1,094 | ) | (1,558 | ) | |||||
| Non-core acquired assets income before income tax expense | $ | 8,106 | $ | 15,018 | $ | 7,529 | |||||
1On December 7, 2015, the Company entered into an agreement with the FDIC to terminate all existing loss share agreements associated with the assets and assumption of liabilities acquired in four FDIC-assisted transactions from 2009 through 2011. | |||||||||||
Noninterest Income
The following table presents a comparative summary of the major components of noninterest income:income for each of the years in the three-year period ended December 31, 2021:
| Year ended December 31, | Change from | ||||||||||||||||||||||||||||
| ($ in thousands) | 2021 | 2020 | 2019 | 2021 vs. 2020 | 2020 vs. 2019 | ||||||||||||||||||||||||
| Service charges on deposit accounts | $ | 15,428 | $ | 11,717 | $ | 12,801 | $ | 3,711 | $ | (1,084) | |||||||||||||||||||
| Wealth management revenue | 10,259 | 9,732 | 9,932 | 527 | (200) | ||||||||||||||||||||||||
| Card services revenue | 11,880 | 9,481 | 9,154 | 2,399 | 327 | ||||||||||||||||||||||||
| Tax credit income | 8,028 | 6,611 | 5,393 | 1,417 | 1,218 | ||||||||||||||||||||||||
| Miscellaneous income | 22,148 | 16,962 | 11,896 | 5,186 | 5,066 | ||||||||||||||||||||||||
| Total noninterest income | $ | 67,743 | $ | 54,503 | $ | 49,176 | $ | 13,240 | $ | 5,327 | |||||||||||||||||||
| Years ended December 31, | Change from | ||||||||||||||||||
| ($ in thousands) | 2017 | 2016 | 2015 | 2017 vs. 2016 | 2016 vs. 2015 | ||||||||||||||
| Service charges on deposit accounts | $ | 11,043 | $ | 8,615 | $ | 7,923 | $ | 2,428 | $ | 692 | |||||||||
| Wealth management revenue | 8,102 | 6,729 | 7,007 | 1,373 | (278 | ) | |||||||||||||
| Card services revenue | 5,433 | 3,130 | 2,496 | 2,303 | 634 | ||||||||||||||
| Gain on state tax credits, net | 2,581 | 2,647 | 2,720 | (66 | ) | (73 | ) | ||||||||||||
| Gain on sale of other real estate - core | 98 | 272 | 35 | (174 | ) | 237 | |||||||||||||
| Miscellaneous income - core | 7,121 | 5,394 | 5,394 | 1,727 | — | ||||||||||||||
Core noninterest income (1) | 34,378 | 26,787 | 25,575 | 7,591 | 1,212 | ||||||||||||||
| Gain (loss) on sale of other real estate from non-core acquired loans | (6 | ) | 1,565 | 107 | (1,571 | ) | 1,458 | ||||||||||||
| Other income from non-core acquired assets | — | 621 | — | (621 | ) | 621 | |||||||||||||
| Gain on sale of investment securities | 22 | 86 | 23 | (64 | ) | 63 | |||||||||||||
| Change in FDIC loss share receivable | — | — | (5,030 | ) | — | 5,030 | |||||||||||||
| Total noninterest income | $ | 34,394 | $ | 29,059 | $ | 20,675 | $ | 5,335 | $ | 8,384 | |||||||||
| (1) A non-GAAP measure. A reconciliation has been included in this MD&A section under the caption "Use of Non-GAAP Financial Measures." | |||||||||||||||||||
Noninterest income increased $5.3$13.2 million, or 18%24%, in 20172021 compared to 2016. Core noninterest income1 increased $7.6 million, or 28%, in 2017.2020. This improvement was primarily due to highera $5.4 million increase from Seacoast and First Choice, a $3.6 million increase in other income, from deposit service charges, wealth management revenue,primarily private equity and community development investments, a $2.4 million increase in card services from the acquisition of JCB, as well as growth in the client base. This income, growth was partially offset by lower gains on the sale of other real estate, which declined $1.7and a $1.4 million from 2016. Noninterest income increased $8.4 million, or 41%, in 2016 compared to 2015. The increase was largely due to an increase in the gain on sale of other real estate from non-core acquired loans of $1.5 million, and a decrease in the loss from the change in FDIC loss share receivable of $5.0 million.tax credit activity.
36
Noninterest Expense
The following table presents a comparative summary of the major components of noninterest expense:
| Year ended December 31, | Change from | ||||||||||||||||||||||||||||
| ($ in thousands) | 2021 | 2020 | 2019 | 2021 vs. 2020 | 2020 vs. 2019 | ||||||||||||||||||||||||
| Employee compensation and benefits | $ | 124,904 | $ | 92,288 | $ | 81,295 | $ | 32,616 | $ | 10,993 | |||||||||||||||||||
| Occupancy | 16,286 | 13,457 | 12,465 | 2,829 | 992 | ||||||||||||||||||||||||
| Data processing | 12,242 | 9,050 | 8,242 | 3,192 | 808 | ||||||||||||||||||||||||
| Professional fees | 4,289 | 3,940 | 3,683 | 349 | 257 | ||||||||||||||||||||||||
| Branch-closure expenses | 3,441 | — | — | 3,441 | — | ||||||||||||||||||||||||
| Merger-related expenses | 22,082 | 4,174 | 17,969 | 17,908 | (13,795) | ||||||||||||||||||||||||
| Other expenses | 62,675 | 44,250 | 41,831 | 18,425 | 2,419 | ||||||||||||||||||||||||
| Total noninterest expense | $ | 245,919 | $ | 167,159 | $ | 165,485 | $ | 78,760 | $ | 1,674 | |||||||||||||||||||
| Efficiency ratio | 57.47 | % | 51.51 | % | 57.48 | % | 5.96 | % | (5.97) | % | |||||||||||||||||||
Core efficiency ratio1 | 51.61 | % | 50.96 | % | 52.36 | % | 0.65 | % | (1.40) | % | |||||||||||||||||||
1 A non-GAAP measure. A reconciliation has been included in this MD&A section under the caption “Use of Non-GAAP Financial Measures.” | |||||||||||||||||||||||||||||
| Years ended December 31, | Change from | ||||||||||||||||||
| ($ in thousands) | 2017 | 2016 | 2015 | 2017 vs. 2016 | 2016 vs. 2015 | ||||||||||||||
| Core expenses (1): | |||||||||||||||||||
| Employee compensation and benefits - core | $ | 61,388 | $ | 48,932 | $ | 45,102 | $ | 12,456 | $ | 3,830 | |||||||||
| Occupancy - core | 9,057 | 6,570 | 6,474 | 2,487 | 96 | ||||||||||||||
| Data processing - core | 6,272 | 4,663 | 4,229 | 1,609 | 434 | ||||||||||||||
| Professional fees - core | 3,779 | 2,614 | 3,401 | 1,165 | (787 | ) | |||||||||||||
| FDIC and other insurance | 3,194 | 3,018 | 2,790 | 176 | 228 | ||||||||||||||
| Loan, legal, and other real estate expense - core | 1,981 | 1,239 | 1,535 | 742 | (296 | ) | |||||||||||||
| Other - core | 22,289 | 15,181 | 13,941 | 7,108 | 1,240 | ||||||||||||||
Core noninterest expense (1) | 107,960 | 82,217 | 77,472 | 25,743 | 4,745 | ||||||||||||||
| Merger related expenses | 6,462 | 1,386 | — | 5,076 | 1,386 | ||||||||||||||
| Facilities disposal charge | 389 | 1,040 | — | (651 | ) | 1,040 | |||||||||||||
| Executive severance | — | 332 | — | (332 | ) | 332 | |||||||||||||
| FDIC loss share termination | — | — | 2,436 | — | (2,436 | ) | |||||||||||||
| FDIC clawback | — | — | 760 | — | (760 | ) | |||||||||||||
| Other expenses related to non-core acquired assets | 240 | 1,094 | 1,558 | (854 | ) | (464 | ) | ||||||||||||
| Other non-core expenses | — | 41 | — | (41 | ) | 41 | |||||||||||||
| Total noninterest expense | $ | 115,051 | $ | 86,110 | $ | 82,226 | $ | 28,941 | $ | 3,884 | |||||||||
| (1) A non-GAAP measure. A reconciliation has been included in this MD&A section under the caption "Use of Non-GAAP Financial Measures." | |||||||||||||||||||
Noninterest expensesexpense increased $28.9$78.8 million, or 34%47%, in 20172021 compared to the prior period. Excluding non-comparable items, core noninterest expenses1 increased $25.7 million, or 31%. This increase primarily represents the additional operating2020. The acquisitions of Seacoast and run-rate expenses associated with JCB, as well as continued investments in underlying business growth. Other core noninterest expense includes $1.4First Choice added $57.2 million of tax credit investment amortization. These investments have a correspondingoperating expenses in 2021, compared to $6.0 million from Seacoast in 2020. Excluding First Choice and higher benefitSeacoast, employee compensation and benefits increased $7.0 million in 2021 compared to 2020, or 8%. The primary components of the increase in compensation and benefits were $2.7 million in salaries from merit increases and net new positions, $1.3 million in employee benefits, and $1.2 million in equity-based compensation.
The Company announced in the Company's income tax expense linethird quarter of 2021 the closure of two branch locations in St. Louis and were consistent with the Company's overall tax planning efforts. Noninterest expenses increased $3.9 million, or 5%,recognized a lease and fixed asset impairment charge of $3.4 million. The branch closures became effective in 2016 compared to 2015, partially due to $1.4 million of mergerJanuary 2022. Merger related expenses forof $22.1 million on the JCB acquisitionFirst Choice and $1.0Seacoast acquisitions, including the cost of closing three California locations, were $17.9 million forhigher than the $4.2 million recorded in 2020 on the Seacoast acquisition. The Company expects to realize annual cost savings of approximately $2.3 million related to these closures.
The Company did not earn a facilities disposal chargefull year of operating income, or incur a full year of expense, from lease buyouts of two unused facilities.First Choice in 2021, but will do so in 2022. The Company does not expect to incur any additional merger expenses on First Choice or Seacoast.
The Company expects to continue to invest in revenue producingits associates and other infrastructure that supports additional growth during 2018. These investmentsgrowth. In addition, low unemployment, inflationary pressures and a shift in employee work arrangements to a virtual/hybrid model are expected to result in expense growth, at a rate of 35% - 45% of projected revenue growth for 2018, resulting in modest improvement to the Company's efficiency ratio.impact future operating expenses.
Income Taxes
37
FINANCIAL CONDITION
Summary Balance Sheet
| ($ in thousands) | December 31, | % Increase (Decrease) | |||||||||||||||||||||||||||
| 2021 | 2020 | 2019 | 2021 vs. 2020 | 2020 vs. 2019 | |||||||||||||||||||||||||
| Total cash and cash equivalents | $ | 2,021,689 | $ | 537,703 | $ | 167,256 | 275.99 | % | 221.49 | % | |||||||||||||||||||
| Securities | 1,795,687 | 1,400,039 | 1,316,483 | 28.26 | % | 6.35 | % | ||||||||||||||||||||||
| Total loans | 9,017,642 | 7,224,935 | 5,314,337 | 24.81 | % | 35.95 | % | ||||||||||||||||||||||
| Total assets | 13,537,358 | 9,751,571 | 7,333,791 | 38.82 | % | 32.97 | % | ||||||||||||||||||||||
| Deposits | 11,343,799 | 7,985,389 | 5,771,023 | 42.06 | % | 38.37 | % | ||||||||||||||||||||||
| Total liabilities | 12,008,242 | 8,672,596 | 6,466,606 | 38.46 | % | 34.11 | % | ||||||||||||||||||||||
| Total shareholders’ equity | 1,529,116 | 1,078,975 | 867,185 | 41.72 | % | 24.42 | % | ||||||||||||||||||||||
| ($ in thousands) | December 31, | % Increase (Decrease) | |||||||||||||||
| 2017 | 2016 | 2015 | 2017 vs. 2016 | 2016 vs. 2015 | |||||||||||||
| Total cash and cash equivalents | $ | 153,323 | $ | 198,802 | $ | 94,157 | (22.88 | )% | 111.14 | % | |||||||
| Securities | 715,131 | 541,260 | 495,484 | 32.12 | % | 9.24 | % | ||||||||||
| Portfolio loans | 4,066,659 | 3,118,392 | 2,750,737 | 30.41 | % | 13.37 | % | ||||||||||
| Non-core acquired loans | 30,391 | 39,769 | 74,758 | (23.58 | )% | (46.80 | )% | ||||||||||
| Total assets | 5,289,225 | 4,081,328 | 3,608,483 | 29.60 | % | 13.10 | % | ||||||||||
| Deposits | 4,156,414 | 3,233,361 | 2,784,591 | 28.55 | % | 16.12 | % | ||||||||||
| Total liabilities | 4,740,652 | 3,694,230 | 3,257,654 | 28.33 | % | 13.40 | % | ||||||||||
| Total shareholders' equity | 548,573 | 387,098 | 350,829 | 41.71 | % | 10.34 | % | ||||||||||
Assets
Loans by Type
The Company has a diversified loan portfolio, with no particular concentration of credit in any one economic sector; however, a substantial portion of the portfolio, including the C&I category, is secured by real estate. The ability of the Company'sCompany’s borrowers to honor their contractual obligations is partially dependent upon the local economy and its effect on the real estate market.
The following table sets forth the composition of the Company'sCompany’s loan portfolio by type of loans at the dates indicated:loans:
| December 31, | |||||||||||||||||||||||||||||
| ($ in thousands) | 2021 | 2020 | |||||||||||||||||||||||||||
| Commercial and industrial | $ | 3,392,375 | $ | 3,088,995 | |||||||||||||||||||||||||
| Commercial real estate - investor owned | 2,141,143 | 1,589,419 | |||||||||||||||||||||||||||
| Commercial real estate - owner occupied | 2,035,785 | 1,498,408 | |||||||||||||||||||||||||||
| Construction and land development | 734,073 | 546,686 | |||||||||||||||||||||||||||
| Residential real estate | 454,052 | 319,179 | |||||||||||||||||||||||||||
| Other | 260,214 | 182,248 | |||||||||||||||||||||||||||
| Total loans | $ | 9,017,642 | $ | 7,224,935 | |||||||||||||||||||||||||
| December 31, | |||||||||||||||||||||||||||||
| 2021 | 2020 | ||||||||||||||||||||||||||||
| Commercial and industrial | 37.6 | % | 42.8 | % | |||||||||||||||||||||||||
| Commercial real estate - investor owned | 23.8 | % | 22.0 | % | |||||||||||||||||||||||||
| Commercial real estate - owner occupied | 22.6 | % | 20.7 | % | |||||||||||||||||||||||||
| Construction and land development | 8.1 | % | 7.6 | % | |||||||||||||||||||||||||
| Residential real estate | 5.0 | % | 4.4 | % | |||||||||||||||||||||||||
| Other | 2.9 | % | 2.5 | % | |||||||||||||||||||||||||
| Total loans | 100.0 | % | 100.0 | % | |||||||||||||||||||||||||
| December 31, | |||||||||||||||||||
| ($ in thousands) | 2017 | 2016 | 2015 | 2014 | 2013 | ||||||||||||||
| Commercial and industrial | $ | 1,919,145 | $ | 1,632,714 | $ | 1,484,327 | $ | 1,264,487 | $ | 1,041,576 | |||||||||
| Commercial real estate - investor owned | 769,275 | 544,808 | 428,064 | 396,751 | 437,688 | ||||||||||||||
| Commercial real estate - owner occupied | 554,589 | 350,148 | 342,959 | 344,003 | 341,631 | ||||||||||||||
| Construction and land development | 345,209 | 194,542 | 161,061 | 143,878 | 117,032 | ||||||||||||||
| Residential real estate | 342,518 | 240,760 | 196,498 | 185,252 | 158,527 | ||||||||||||||
| Consumer and other | 135,923 | 155,420 | 137,828 | 99,545 | 40,859 | ||||||||||||||
| Portfolio loans | $ | 4,066,659 | $ | 3,118,392 | $ | 2,750,737 | $ | 2,433,916 | $ | 2,137,313 | |||||||||
| Non-core acquired loans | 30,391 | 39,769 | 74,758 | 99,103 | 140,538 | ||||||||||||||
| Total loans | $ | 4,097,050 | $ | 3,158,161 | $ | 2,825,495 | $ | 2,533,019 | $ | 2,277,851 | |||||||||
| December 31, | |||||||||||||||||||
| 2017 | 2016 | 2015 | 2014 | 2013 | |||||||||||||||
| Commercial and industrial | 47.2 | % | 52.4 | % | 54.0 | % | 52.0 | % | 48.7 | % | |||||||||
| Commercial real estate - investor owned | 18.9 | % | 17.5 | % | 15.5 | % | 16.3 | % | 20.5 | % | |||||||||
| Commercial real estate - owner occupied | 13.6 | % | 11.2 | % | 12.5 | % | 14.1 | % | 16.0 | % | |||||||||
| Construction and land development | 8.5 | % | 6.2 | % | 5.9 | % | 5.9 | % | 5.5 | % | |||||||||
| Residential real estate | 8.4 | % | 7.7 | % | 7.1 | % | 7.6 | % | 7.4 | % | |||||||||
| Consumer and other | 3.4 | % | 5.0 | % | 5.0 | % | 4.1 | % | 1.9 | % | |||||||||
| Portfolio loans | 100.0 | % | 100.0 | % | 100.0 | % | 100.0 | % | 100.0 | % | |||||||||
C&I loans are made based on the borrower'sborrower’s ability to generate cash flows for repayment from income sources, general credit strength, experience, and character, even though such loans may also be secured by real estate or other assets. The credit risk related to commercial loans is largely influenced by general economic conditions and the resulting impact on a borrower'sborrower’s operations. PPP loans of $272.0 million and $698.6 million were included in C&I loans in the tables above at the end of 2021 and 2020, respectively.
The Company continues to focus on originating high-quality C&I relationships as they typically have variable interest rates and allow for cross selling opportunities involving other banking products. C&I loan growth also
38
supports our efforts to maintain the Company’s asset-sensitive interest rate risk position. Additionally, our specialized products, especially sponsor finance, life insurance premium financing, and tax credit financing/lending, consist of primarily C&I loans, and have contributed significantly to the Company’s C&I loan growth. These loans are sourced through relationships developed with wealth and estate planning firms and private equity funds and are not bound geographically by our markets. As a result, these specialized loan products offer opportunities to expand and diversify our overall geographic concentration by entering into new markets.
Real estate loans are also based on the borrower's character, but moreplace an emphasis is placed on the estimated cash flows from the operation of the property and/or the underlying collateral values, or both.value.
•Residential real estate loans include residential mortgages, which are loans that, due to size or other attributes, do not qualify for conventional home mortgages available for saleavailable-for-sale in the secondary market, second mortgages and home equity lines. Residential mortgage loans are usually limited to a maximum of 80% of collateral value.value at origination.
39
The following table presents a breakdown of loans by NAICS code at December 31, 2021 and 2020:
| December 31, 2021 | December 31, 2020 | ||||||||||||||||||||||
| ($ in thousands) | Outstanding Balance | % | Outstanding Balance | % | |||||||||||||||||||
| Accomodation and Food Services | $ | 785,485 | 9 | % | $ | 577,026 | 8 | % | |||||||||||||||
| Administrative and Support and Waste Management and Remediation Services | 176,601 | 2 | % | 167,023 | 2 | % | |||||||||||||||||
Agriculture, Forestry, Fishing and Hunting1 | 195,342 | 2 | % | 207,335 | 3 | % | |||||||||||||||||
| Arts, Entertainment, and Recreation | 120,805 | 1 | % | 110,422 | 2 | % | |||||||||||||||||
| Construction | 580,731 | 6 | % | 451,050 | 6 | % | |||||||||||||||||
| Educational Services | 52,034 | 1 | % | 53,708 | 1 | % | |||||||||||||||||
| Finance and Insurance | 1,344,389 | 15 | % | 1,057,888 | 15 | % | |||||||||||||||||
| Health Care and Social Assistance | 372,109 | 4 | % | 320,556 | 4 | % | |||||||||||||||||
| Information | 64,686 | 1 | % | 53,696 | 1 | % | |||||||||||||||||
| Management of Companies and Enterprises | 84,110 | 1 | % | 54,563 | 1 | % | |||||||||||||||||
| Manufacturing | 613,725 | 7 | % | 590,652 | 8 | % | |||||||||||||||||
| Mining, Quarrying, and Oil and Gas Extraction | 9,771 | — | % | 3,375 | — | % | |||||||||||||||||
| Other Services (except Public Administration) | 593,149 | 7 | % | 509,006 | 7 | % | |||||||||||||||||
| Professional, Scientific, and Technical Services | 329,009 | 4 | % | 304,701 | 4 | % | |||||||||||||||||
| Public Administration | 11,358 | — | % | 13,811 | — | % | |||||||||||||||||
| Real Estate and Rental and Leasing | 2,462,088 | 27 | % | 1,722,630 | 24 | % | |||||||||||||||||
| Retail Trade | 460,763 | 5 | % | 398,251 | 6 | % | |||||||||||||||||
| Transportation and Warehousing | 214,132 | 2 | % | 151,273 | 2 | % | |||||||||||||||||
| Utilities | 25,393 | — | % | 19,321 | — | % | |||||||||||||||||
| Wholesale Trade | 445,771 | 5 | % | 360,630 | 5 | % | |||||||||||||||||
| Other | 76,191 | 1 | % | 98,018 | 1 | % | |||||||||||||||||
| Total Loans | $ | 9,017,642 | 100 | % | $ | 7,224,935 | 100 | % | |||||||||||||||
1Includes $95.5 million in animal production and $92.1 million in crop production at December 31, 2021. | |||||||||||||||||||||||
The following table presents a breakdown of commercial & industrial loans by size at December 31, 2021.
| ($ in thousands) | Number of Loans | Outstanding Balance | Average Balance | ||||||||||||||
| <$2 million | 3,326 | $ | 921,537 | $ | 277 | ||||||||||||
| $2-5 million | 289 | 915,656 | 3,168 | ||||||||||||||
| $5-10 million | 92 | 627,728 | 6,823 | ||||||||||||||
| >$10 million | 60 | 927,454 | 15,458 | ||||||||||||||
| Total | 3,767 | $ | 3,392,375 | $ | 901 | ||||||||||||
The following table presents a breakdown of commercial real estate loans by size at December 31, 2021.
| ($ in thousands) | Number of Loans | Outstanding Balance | Average Balance | ||||||||||||||
| <$2 million | 3,300 | $ | 1,840,760 | $ | 558 | ||||||||||||
| $2-5 million | 383 | 1,184,292 | 3,092 | ||||||||||||||
| $5-10 million | 90 | 626,733 | 6,964 | ||||||||||||||
| >$10 million | 34 | 525,143 | 15,445 | ||||||||||||||
| Total | 3,807 | $ | 4,176,928 | $ | 1,097 | ||||||||||||
40
The following table presents a breakdown of construction loans by size at December 31, 2021.
| ($ in thousands) | Number of Loans | Outstanding Balance | Average Balance | ||||||||||||||
| <$2 million | 539 | $ | 212,129 | $ | 394 | ||||||||||||
| $2-5 million | 63 | 200,775 | 3,187 | ||||||||||||||
| $5-10 million | 30 | 206,262 | 6,875 | ||||||||||||||
| >$10 million | 8 | 114,907 | 14,363 | ||||||||||||||
| Total | 640 | $ | 734,073 | $ | 1,147 | ||||||||||||
The following table presents a breakdown of residential loans by size at December 31, 2021.
| ($ in thousands) | Number of Loans | Outstanding Balance | Average Balance | ||||||||||||||
| <$2 million | 2,457 | $ | 304,224 | $ | 124 | ||||||||||||
| $2-5 million | 27 | 83,666 | 3,099 | ||||||||||||||
| $5-10 million | 8 | 54,019 | 6,752 | ||||||||||||||
| >$10 million | 1 | 12,143 | 12,143 | ||||||||||||||
| Total | 2,493 | $ | 454,052 | $ | 182 | ||||||||||||
The following table presents a breakdown of other loans by size at December 31, 2021.
| ($ in thousands) | Number of Loans | Outstanding Balance | Average Balance | ||||||||||||||
| <$2 million | 1,415 | $ | 154,663 | $ | 109 | ||||||||||||
| $2-5 million | 16 | 43,306 | 2,707 | ||||||||||||||
| $5-10 million | 7 | 41,262 | 5,895 | ||||||||||||||
| >$10 million | 2 | 20,983 | 10,491 | ||||||||||||||
| Total | 1,440 | $ | 260,214 | $ | 181 | ||||||||||||
The following table presents a breakdown of total loans by geographic region at December 31, 2021:
| ($ in thousands) | December 31, 2021 | ||||||||||
| St. Louis | $ | 2,153,749 | |||||||||
| Kansas City | 785,342 | ||||||||||
| Arizona | 545,362 | ||||||||||
| New Mexico | 538,981 | ||||||||||
| California | 1,715,978 | ||||||||||
| Specialty, PPP and Other loans | 3,278,230 | ||||||||||
| Total | $ | 9,017,642 | |||||||||
41
The following table illustrates loan growth, including selected specializedspecialty lending detail, at December 31, 20172021 and 2016:2020:
| December 31, | First Choice Acquired Loans | ||||||||||||||||||||||||||||
| ($ in thousands) | 2021 | 2020 | Change | % Change | at 12/31/21 | ||||||||||||||||||||||||
| C&I | $ | 1,538,155 | $ | 1,103,060 | $ | 435,095 | 39.4 | % | $ | 298,545 | |||||||||||||||||||
| CRE investor owned | 1,955,087 | 1,420,905 | 534,182 | 37.6 | % | 553,986 | |||||||||||||||||||||||
| CRE owner occupied | 1,112,463 | 825,846 | 286,617 | 34.7 | % | 290,876 | |||||||||||||||||||||||
| SBA loans | 1,241,449 | 895,930 | 345,519 | 38.6 | % | 164,094 | |||||||||||||||||||||||
| Sponsor finance | 508,469 | 396,487 | 111,982 | 28.2 | % | — | |||||||||||||||||||||||
| Life insurance premium financing | 593,562 | 534,092 | 59,470 | 11.1 | % | — | |||||||||||||||||||||||
| Tax credits | 486,881 | 382,602 | 104,279 | 27.3 | % | — | |||||||||||||||||||||||
| SBA PPP loans | 271,958 | 698,645 | (426,687) | (61.1) | % | 149,334 | |||||||||||||||||||||||
| Residential real estate | 430,985 | 318,091 | 112,894 | 35.5 | % | 151,970 | |||||||||||||||||||||||
| Construction and land development | 625,526 | 474,399 | 151,127 | 31.9 | % | 173,969 | |||||||||||||||||||||||
| Other | 253,107 | 174,878 | 78,229 | 44.7 | % | 32,351 | |||||||||||||||||||||||
| Total Loans | $ | 9,017,642 | $ | 7,224,935 | $ | 1,792,707 | 24.8 | % | $ | 1,815,125 | |||||||||||||||||||
| December 31, | ||||||||||||||
| ($ in thousands) | 2017 | 2016 | Change | % Change | ||||||||||
| Enterprise value lending | $ | 407,644 | $ | 388,798 | $ | 18,846 | 4.8 | % | ||||||
| C&I - general | 911,790 | 794,451 | 117,339 | 14.8 | % | |||||||||
| Life insurance premium financing | 364,876 | 305,779 | 59,097 | 19.3 | % | |||||||||
| Tax credits | 234,835 | 143,686 | 91,149 | 63.4 | % | |||||||||
| CRE, construction and land development | 1,669,073 | 1,089,498 | 579,575 | 53.2 | % | |||||||||
| Residential real estate | 342,518 | 240,760 | 101,758 | 42.3 | % | |||||||||
| Consumer and other | 135,923 | 155,420 | (19,497 | ) | (12.5 | )% | ||||||||
| Portfolio loans | $ | 4,066,659 | $ | 3,118,392 | $ | 948,267 | 30.4 | % | ||||||
The Company continues to focus on originating high-quality C&I relationships as they typically have variable interest rates and allow for cross selling opportunities involving other banking products. For the period ending December 31, 2017, C&I loans increased $286 million, or 18% from 2016. C&I loan growth also supports our efforts to maintain the Company's asset sensitive interest rate risk position. Additionally, our specialized products, especially Enterprise value lending, Life insurance premium financing, and Tax credit financing/lending, consist ofsponsor finance portfolio is primarily C&I loans, and have contributed significantly to the Company's loan growth. These loans are sourced through relationships developed with wealth and estate planning firms and private equity funds, and are not bound geographically by our three markets with branch facilities. As a result, these specialized loan products offer opportunities to expand and diversify our overall geographic concentration by entering into new markets.
| % of portfolio | |||||||||||||||||
| 2017 | 2016 | ||||||||||||||||
| Portfolio Loans | Non-core Acquired Loans | Total Loans | Portfolio Loans | Non-core Acquired Loans | Total Loans | ||||||||||||
| Non Real estate | |||||||||||||||||
| Commercial and industrial | 47 | % | 9 | % | 47 | % | 52 | % | 9 | % | 52 | % | |||||
| Consumer and other | 3 | % | — | % | 3 | % | 5 | % | — | % | 5 | % | |||||
| Total Non Real estate | 50 | % | 9 | % | 50 | % | 57 | % | 9 | % | 57 | % | |||||
| Real estate: | |||||||||||||||||
| Commercial - investor owned | |||||||||||||||||
| Retail | 6 | % | 10 | % | 6 | % | 4 | % | 8 | % | 4 | % | |||||
| Commercial office | 6 | % | 7 | % | 6 | % | 6 | % | 11 | % | 6 | % | |||||
| Multi-family housing | 2 | % | — | % | 2 | % | 2 | % | 1 | % | 2 | % | |||||
| Industrial/ Warehouse | 3 | % | — | % | 3 | % | 3 | % | — | % | 3 | % | |||||
| Other | 3 | % | — | % | 3 | % | 3 | % | — | % | 3 | % | |||||
| Total | 20 | % | 17 | % | 20 | % | 18 | % | 20 | % | 18 | % | |||||
| Commercial - owner occupied | |||||||||||||||||
| Commercial and industrial | 8 | % | 30 | % | 8 | % | 9 | % | 29 | % | 9 | % | |||||
| Other | 6 | % | 1 | % | 6 | % | 2 | % | 1 | % | 2 | % | |||||
| Total | 14 | % | 31 | % | 14 | % | 11 | % | 30 | % | 11 | % | |||||
| Construction and land development | 8 | % | 11 | % | 8 | % | 6 | % | 11 | % | 6 | % | |||||
| Residential | |||||||||||||||||
| Investor owned | 6 | % | 27 | % | 6 | % | 1 | % | 5 | % | 1 | % | |||||
| Owner occupied | 2 | % | 5 | % | 2 | % | 7 | % | 25 | % | 7 | % | |||||
| Total | 8 | % | 32 | % | 8 | % | 8 | % | 30 | % | 8 | % | |||||
| Total Real estate | 50 | % | 91 | % | 50 | % | 43 | % | 91 | % | 43 | % | |||||
| Total | 100 | % | 100 | % | 100 | % | 100 | % | 100 | % | 100 | % | |||||
The following descriptions focus on portfolio loans at December 31, 2017, and exclude non-core acquired loans.
The largesttax credit portfolio includes tax credit-related lending on affordable housing projects funded through the use of
federal and state low income housing tax credits. In addition, we provide leveraged and other loans withinon projects funded through the investor ownedCDFI New Markets Tax Credit Program. This portfolio also includes tax credit brokerage through 10-year streams of Missouri state tax credits from affordable housing development funds. The tax credits are sold to clients and other individuals for tax planning purposes.
SBA 7(a) loans are primarily owner-occupied, commercial real estate portfolio are retail and commercial office permanent loans. The Company had $246.9 million of investor owned permanent loans secured by retail properties. There were 121 loan relationshipsa 1st lien. These loans predominantly have a 75% portion guaranteed by the SBA.
SBA PPP loans originated in this category with an average outstanding loan balance of $2.0 million.2020 in response to the COVID-19 pandemic and are guaranteed by the SBA. The largest loans outstanding at year end were a $13.3 million loan securedmay be forgivable by a multi-tenant retail center in Phoenix, an $11.9 million loan secured by commercial land in the St. Louis area, and an $11.0 million loan secured by a hotel in Pennsylvania.SBA if certain requirements are met.
Significant loan concentrations are considered to exist for a financial institution when there are amounts loaned to numerous borrowers engaged in similar activities that would cause them to be similarly impacted by economic or other conditions. At December 31, 2017,2021, no significant concentrations exceeding 10% of total loans existed in the Company'sCompany’s loan portfolio, except as described above.
42
| ($ in thousands) | Due in One Year or Less (1) | After One Through Five Years | After Five Through Fifteen Years | After Fifteen Years | Total | Percent of Total Loans | |||||||||||||||||||||||||||||
| Fixed Rate Loans | |||||||||||||||||||||||||||||||||||
| Commercial and industrial | $ | 135,942 | $ | 549,283 | $ | 278,445 | $ | 15,871 | $ | 979,541 | 11 | % | |||||||||||||||||||||||
| Real estate: | |||||||||||||||||||||||||||||||||||
| Commercial | 159,983 | 1,240,531 | 374,708 | 24,532 | 1,799,754 | 20 | % | ||||||||||||||||||||||||||||
| Construction and land development | 57,205 | 143,742 | 9,336 | 89 | 210,372 | 2 | % | ||||||||||||||||||||||||||||
| Residential | 24,272 | 75,214 | 13,377 | 31,750 | 144,613 | 2 | % | ||||||||||||||||||||||||||||
| Other | 4,018 | 9,019 | 70,578 | 114,154 | 197,769 | 2 | % | ||||||||||||||||||||||||||||
| Total | $ | 381,420 | $ | 2,017,789 | $ | 746,444 | $ | 186,396 | $ | 3,332,049 | 37 | % | |||||||||||||||||||||||
| Variable Rate Loans | |||||||||||||||||||||||||||||||||||
| Commercial and industrial | $ | 976,252 | $ | 1,217,215 | $ | 206,655 | $ | 12,712 | $ | 2,412,834 | 27 | % | |||||||||||||||||||||||
| Real estate: | |||||||||||||||||||||||||||||||||||
| Commercial | 191,202 | 414,017 | 450,615 | 1,321,340 | 2,377,174 | 26 | % | ||||||||||||||||||||||||||||
| Construction and land development | 164,306 | 171,528 | 95,703 | 92,164 | 523,701 | 6 | % | ||||||||||||||||||||||||||||
| Residential | 32,458 | 36,302 | 76,791 | 163,888 | 309,439 | 3 | % | ||||||||||||||||||||||||||||
| Other | 9,913 | 12,726 | 39,676 | 130 | 62,445 | 1 | % | ||||||||||||||||||||||||||||
| Total | $ | 1,374,131 | $ | 1,851,788 | $ | 869,440 | $ | 1,590,234 | $ | 5,685,593 | 63 | % | |||||||||||||||||||||||
| Total Loans | |||||||||||||||||||||||||||||||||||
| Commercial and industrial | $ | 1,112,194 | $ | 1,766,498 | $ | 485,100 | $ | 28,583 | $ | 3,392,375 | 38 | % | |||||||||||||||||||||||
| Real estate: | |||||||||||||||||||||||||||||||||||
| Commercial | 351,185 | 1,654,548 | 825,323 | 1,345,872 | 4,176,928 | 46 | % | ||||||||||||||||||||||||||||
| Construction and land development | 221,511 | 315,270 | 105,039 | 92,253 | 734,073 | 8 | % | ||||||||||||||||||||||||||||
| Residential | 56,730 | 111,516 | 90,168 | 195,638 | 454,052 | 5 | % | ||||||||||||||||||||||||||||
| Other | 13,931 | 21,745 | 110,254 | 114,284 | 260,214 | 3 | % | ||||||||||||||||||||||||||||
| Total | $ | 1,755,551 | $ | 3,869,577 | $ | 1,615,884 | $ | 1,776,630 | $ | 9,017,642 | 100 | % | |||||||||||||||||||||||
(1) Includes loans with no stated maturity and overdraft lines of credit.
| Loans Maturing or Repricing | ||||||||||||||||||
| ($ in thousands) | In One Year or Less | After One Through Five Years | After Five Years | Total | Percent of Total Loans | |||||||||||||
| Fixed rate loans (1) (2) (3) | ||||||||||||||||||
| Commercial and industrial | $ | 138,249 | $ | 269,487 | $ | 28,326 | $ | 436,062 | 11 | % | ||||||||
| Real estate: | ||||||||||||||||||
| Commercial | 164,010 | 719,158 | 86,202 | 969,370 | 24 | % | ||||||||||||
| Construction and land development | 47,594 | 106,431 | 15,598 | 169,623 | 4 | % | ||||||||||||
| Residential | 48,474 | 143,491 | 33,566 | 225,531 | 5 | % | ||||||||||||
| Consumer and other | 12,969 | 30,202 | 22,450 | 65,621 | 2 | % | ||||||||||||
| Non-core acquired loans | 8,859 | 8,013 | 1,027 | 17,899 | — | % | ||||||||||||
| Total | $ | 420,155 | $ | 1,276,782 | $ | 187,169 | $ | 1,884,106 | 46 | % | ||||||||
| Variable rate loans (1) (2) | ||||||||||||||||||
| Commercial and industrial | $ | 1,431,681 | $ | 38,085 | $ | 13,317 | $ | 1,483,083 | 36 | % | ||||||||
| Real estate: | ||||||||||||||||||
| Commercial | 315,668 | 71,488 | 7,079 | 394,235 | 10 | % | ||||||||||||
| Construction and land development | 124,150 | 11,695 | — | 135,845 | 3 | % | ||||||||||||
| Residential | 91,691 | 23,057 | 2,239 | 116,987 | 3 | % | ||||||||||||
| Consumer and other | 48,810 | 21,492 | — | 70,302 | 2 | % | ||||||||||||
| Non-core acquired loans | 11,495 | 997 | — | 12,492 | — | % | ||||||||||||
| Total | $ | 2,023,495 | $ | 166,814 | $ | 22,635 | $ | 2,212,944 | 54 | % | ||||||||
| Loans (1) (2) | ||||||||||||||||||
| Commercial and industrial | $ | 1,569,930 | $ | 307,572 | $ | 41,643 | $ | 1,919,145 | 47 | % | ||||||||
| Real estate: | ||||||||||||||||||
| Commercial | 479,678 | 790,646 | 93,281 | 1,363,605 | 33 | % | ||||||||||||
| Construction and land development | 171,744 | 118,126 | 15,598 | 305,468 | 8 | % | ||||||||||||
| Residential | 140,165 | 166,548 | 35,805 | 342,518 | 8 | % | ||||||||||||
| Consumer and other | 61,779 | 51,694 | 22,450 | 135,923 | 3 | % | ||||||||||||
| Non-core acquired loans | 20,354 | 9,010 | 1,027 | 30,391 | 1 | % | ||||||||||||
| Total | $ | 2,443,650 | $ | 1,443,596 | $ | 209,804 | $ | 4,097,050 | 100 | % | ||||||||
| (1) Loan balances are net of unearned loan fees. | ||||||||||||||||||
| (2) Not adjusted for impact of interest rate swap agreements. | ||||||||||||||||||
| (3) Fixed rate loans include variable rate loans with a rate floor that are currently accruing interest at the floor. | ||||||||||||||||||
43
Provision and Allowance for LoanCredit Losses
The adoption of CECL on January 1, 2020 increased the ACL on loans by $28.4 million, or 65%, and the allowance for unfunded commitments by $2.4 million as compared to 2019. These increases were offset in retained earnings and did not impact the consolidated statement of operations.
The provision for credit losses, which includes a provision for losses on unfunded commitments, is a charge to earnings to maintain the ACL at a level consistent with management’s assessment of expected losses in the loan portfolio at the balance sheet date. The Company also records reversals of interest on nonaccrual loans and interest recoveries directly through the provision of credit losses. CECL requires economic forecasts to be factored into determining estimated losses. As a result, CECL will typically require a higher level of provision at the start of an economic downturn. The decrease in the provision for credit losses in 2021 was primarily due to a change in economic forecasts, which has significantly improved since the start of the COVID-19 pandemic in March 2020. Two of the primary economic loss drivers used in estimating the ACL include the percentage change in GDP and unemployment. At December 31, 2021, the Company’s forecast of the percentage change in GDP included a range of (2.2)% to 6.7% and the percentage change in unemployment included a range of 3.0% to 8.7%. At the beginning of the pandemic at March 2020, the forecast of the percentage change in GDP included a range of (9.6)% to 2.1% and the percentage change in unemployment included a range of 6.0% to 13.0%. The Company utilizes a one-year reasonable and supportable forecast and a one-year reversion period.
In the acquisition of First Choice, we recognized an allowance of $7.6 million on PCD loans and an allowance of $23.9 million on non-PCD loans. Similarly, in the acquisition of Seacoast we recognized an allowance of $3.5 million on PCD loans and $8.6 million on non-PCD loans. Pursuant to the CECL accounting methodology, the allowance on PCD loans is recorded as part of the acquired loan portfolio. The allowance on non-PCD loans is established through a charge to the provision for credit losses in the post-combination financial statements.
To the extent the Company does not recognize charge-offs and economic forecasts improve in future periods, the Company could recognize a reversal of provision for credit losses. Conversely, if economic conditions and the Company’s forecast worsens, the Company could recognize elevated levels of provision for credit losses. The provision is also reflective of charge-offs in the period.
The following table summarizes changes inpresents the allowancecomponents of the provision for loancredit losses arising from loans charged off and recoveries on loans previously charged off, by loan category, and additions tofor the allowance charged to expense.periods indicated:
| December 31, | |||||||||||||||||||||||
| (in thousands) | 2021 | 2020 | |||||||||||||||||||||
| Provision (benefit) for loan losses | $ | (10,911) | $ | 54,822 | |||||||||||||||||||
| Provision on acquired loans | 23,904 | 8,557 | |||||||||||||||||||||
Provision for off-balance sheet commitments1 | 1,911 | 2,877 | |||||||||||||||||||||
| Provision for held-to-maturity securities | 165 | 147 | |||||||||||||||||||||
| Recovery of accrued interest | (1,684) | (1,005) | |||||||||||||||||||||
| Provision for credit losses | $ | 13,385 | $ | 65,398 | |||||||||||||||||||
1 2021 includes $1.5 million as part of the First Choice acquired commitments.
44
| At December 31, | |||||||||||||||||||
| ($ in thousands) | 2017 | 2016 | 2015 | 2014 | 2013 | ||||||||||||||
| Allowance for portfolio loans, at beginning of period | $ | 37,565 | $ | 33,441 | $ | 30,185 | $ | 27,289 | $ | 34,330 | |||||||||
| Loans charged off: | |||||||||||||||||||
| Commercial and industrial | (9,872 | ) | (2,303 | ) | (3,699 | ) | (3,738 | ) | (3,404 | ) | |||||||||
| Real estate: | |||||||||||||||||||
| Commercial | (207 | ) | (95 | ) | (702 | ) | (700 | ) | (4,991 | ) | |||||||||
| Construction and land development | (254 | ) | — | (350 | ) | (905 | ) | (896 | ) | ||||||||||
| Residential | (973 | ) | (25 | ) | (1,313 | ) | (48 | ) | (1,053 | ) | |||||||||
| Consumer and other | (201 | ) | (1,912 | ) | (27 | ) | (165 | ) | (34 | ) | |||||||||
| Total loans charged off | (11,507 | ) | (4,335 | ) | (6,091 | ) | (5,556 | ) | (10,378 | ) | |||||||||
| Recoveries of loans previously charged off: | |||||||||||||||||||
| Commercial and industrial | 545 | 674 | 1,796 | 1,768 | 1,776 | ||||||||||||||
| Real estate: | |||||||||||||||||||
| Commercial | 235 | 1,165 | 1,567 | 1,101 | 776 | ||||||||||||||
| Construction and land development | 101 | 934 | 674 | 806 | 488 | ||||||||||||||
| Residential | 390 | 123 | 337 | 334 | 939 | ||||||||||||||
| Consumer and other | 73 | 12 | 101 | 34 | — | ||||||||||||||
| Total recoveries of loans | 1,344 | 2,908 | 4,475 | 4,043 | 3,979 | ||||||||||||||
| Net loan charge-offs | (10,163 | ) | (1,427 | ) | (1,616 | ) | (1,513 | ) | (6,399 | ) | |||||||||
| Provision (provision reversal) for loan losses | 10,764 | 5,551 | 4,872 | 4,409 | (642 | ) | |||||||||||||
| Allowance for portfolio loans, at end of period | $ | 38,166 | $ | 37,565 | $ | 33,441 | $ | 30,185 | $ | 27,289 | |||||||||
| Allowance for PCI loans, at beginning of period | $ | 5,844 | $ | 10,175 | $ | 15,410 | $ | 15,438 | $ | 11,547 | |||||||||
| Loans charged off | (248 | ) | (1,296 | ) | (25 | ) | (341 | ) | (522 | ) | |||||||||
| Recoveries of loans | — | — | — | — | 114 | ||||||||||||||
| Other | (551 | ) | (1,089 | ) | (796 | ) | (770 | ) | (675 | ) | |||||||||
| Net loan charge-offs | (799 | ) | (2,385 | ) | (821 | ) | (1,111 | ) | (1,083 | ) | |||||||||
| Provision (provision reversal) for loan losses | (634 | ) | (1,946 | ) | (4,414 | ) | 1,083 | 4,974 | |||||||||||
| Allowance for PCI loans, at end of period | $ | 4,411 | $ | 5,844 | $ | 10,175 | $ | 15,410 | $ | 15,438 | |||||||||
| Total allowance, at end of period | $ | 42,577 | $ | 43,409 | $ | 43,616 | $ | 45,595 | $ | 42,727 | |||||||||
| Portfolio loans, average | $ | 3,810,055 | $ | 2,915,744 | $ | 2,520,734 | $ | 2,255,180 | $ | 2,097,920 | |||||||||
| Portfolio loans, ending (1) | 4,022,896 | 3,118,392 | 2,750,737 | 2,433,916 | 2,137,313 | ||||||||||||||
| Net charge-offs to average portfolio loans (1) | 0.27 | % | 0.05 | % | 0.06 | % | 0.07 | % | 0.31 | % | |||||||||
| Allowance for portfolio loan losses to loans (1) | 0.95 | % | 1.20 | % | 1.22 | % | 1.24 | % | 1.28 | % | |||||||||
| (1) Excludes PCI loans | |||||||||||||||||||
The following table is a summary of the allocation of the allowance for loan losses on portfolio loans for the five years ended December 31, 2017:
| December 31, | |||||||||||||||||||||||||||||
| 2017 | 2016 | 2015 | 2014 | 2013 | |||||||||||||||||||||||||
| ($ in thousands) | Allowance | Percent by Category to Portfolio Loans | Allowance | Percent by Category to Portfolio Loans | Allowance | Percent by Category to Portfolio Loans | Allowance | Percent by Category to Portfolio Loans | Allowance | Percent by Category to Portfolio Loans | |||||||||||||||||||
| Commercial and industrial | $ | 26,406 | 47.2 | % | $ | 26,996 | 52.4 | % | $ | 22,056 | 54.0 | % | $ | 16,983 | 52.0 | % | $ | 12,246 | 48.7 | % | |||||||||
| Real estate: | |||||||||||||||||||||||||||||
| Commercial | 7,198 | 33.5 | % | 6,310 | 28.7 | % | 6,453 | 28.0 | % | 7,517 | 30.4 | % | 10,696 | 36.5 | % | ||||||||||||||
| Construction and land development | 1,487 | 7.6 | % | 1,304 | 6.2 | % | 1,704 | 5.9 | % | 1,715 | 5.9 | % | 2,136 | 5.5 | % | ||||||||||||||
| Residential | 2,237 | 8.4 | % | 2,023 | 7.7 | % | 1,796 | 7.1 | % | 2,830 | 7.6 | % | 2,019 | 7.4 | % | ||||||||||||||
| Consumer and other | 838 | 3.3 | % | 932 | 5.0 | % | 1,432 | 5.0 | % | 1,140 | 4.1 | % | 192 | 1.9 | % | ||||||||||||||
| Total allowance | $ | 38,166 | 100.0 | % | $ | 37,565 | 100.0 | % | $ | 33,441 | 100.0 | % | $ | 30,185 | 100.0 | % | $ | 27,289 | 100.0 | % | |||||||||
| December 31, | ||||||||||||||||||||||||||||||||||||||||||||
| ($ in thousands) | 2021 | 2020 | ||||||||||||||||||||||||||||||||||||||||||
| Balance at End of Period Applicable to: | Amount | Percent of loans in each category to total loans | Amount | Percent of loans in each category to total loans | ||||||||||||||||||||||||||||||||||||||||
| Commercial and industrial | $ | 63,825 | 37.6 | % | $ | 58,812 | 42.8 | % | ||||||||||||||||||||||||||||||||||||
| Real estate: | ||||||||||||||||||||||||||||||||||||||||||||
| Commercial | 53,437 | 46.3 | % | 49,074 | 42.7 | % | ||||||||||||||||||||||||||||||||||||||
| Construction and land development | 14,536 | 8.1 | % | 21,413 | 7.6 | % | ||||||||||||||||||||||||||||||||||||||
| Residential | 7,927 | 5.1 | % | 4,585 | 4.4 | % | ||||||||||||||||||||||||||||||||||||||
| Other | 5,316 | 2.9 | % | 2,787 | 2.5 | % | ||||||||||||||||||||||||||||||||||||||
| Total allowance | $ | 145,041 | 100.0 | % | $ | 136,671 | 100.0 | % | ||||||||||||||||||||||||||||||||||||
The allowance for portfolio loancredit losses was 0.95%1.61% of portfoliototal loans at December 31, 2017,2021, compared to 1.20%1.89%, and 1.22%0.81%, at December 31, 20162020 and 2015,2019, respectively. Management believesThe decline in the allowance to total loans ratio in 2021 was primarily due to the comparatively lower ACL on the First Choice loan portfolio, net loan charge-offs of $11.6 million, improved credit metrics, and continued improvement in economic forecasts. The increase in the ratio in 2020 compared to 2019 was due to the adoption of CECL and higher provision expense due to the pandemic, partially offset by the acquisition of Seacoast and PPP loans which included $1.3 billion in government-guaranteed loans with no allowance.
The following table is a summary of net charge-offs (recoveries) to average loans for the periods indicated:
| December 31, | ||||||||||||||||||||||||||||||||||||||||||||||||||
| 2021 | 2020 | |||||||||||||||||||||||||||||||||||||||||||||||||
| ($ in thousands) | Net Charge-offs (Recoveries) | Average Loans(1) | Net Charge-offs (Recoveries)/Average Loans | Net Charge-offs (Recoveries) | Average Loans(1) | Net Charge-offs (Recoveries)/Average Loans | ||||||||||||||||||||||||||||||||||||||||||||
| Commercial and industrial | $ | 10,425 | $ | 3,195,017 | 0.33 | % | $ | 3,533 | $ | 2,917,784 | 0.12 | % | ||||||||||||||||||||||||||||||||||||||
| Real estate: | ||||||||||||||||||||||||||||||||||||||||||||||||||
| Commercial | 810 | 3,586,773 | 0.02 | % | (2,607) | 2,179,246 | (0.12) | % | ||||||||||||||||||||||||||||||||||||||||||
| Construction and land development | (451) | 673,646 | (0.07) | % | (136) | 483,835 | (0.03) | % | ||||||||||||||||||||||||||||||||||||||||||
| Residential | 558 | 396,777 | 0.14 | % | 842 | 337,759 | 0.25 | % | ||||||||||||||||||||||||||||||||||||||||||
| Other | 287 | 197,172 | 0.15 | % | 275 | 142,312 | 0.19 | % | ||||||||||||||||||||||||||||||||||||||||||
| Total | $ | 11,629 | $ | 8,049,385 | 0.14 | % | $ | 1,907 | $ | 6,060,936 | 0.03 | % | ||||||||||||||||||||||||||||||||||||||
(1) Excludes loans held for sale.
See “Critical Accounting Policies and Estimates” of this MD&A section for more information on the allowance for loan losses is adequate to absorb inherent losses in the loan portfolio.
Nonperforming loans are defined asand assets
See “Item 8. Note 1 – Summary of Significant Accounting Policies” for more information on impaired loans on non-accrual status, loans 90 days or more past due but still accruing interest, and restructured loans. Restructured loans involve the granting of a concession to a borrower due to their financial difficulty and include modification of terms of the loan, such as changes in payment schedule or interest rate. Nonperforming assets include nonperforming loans plus other real estate.
45
The following table presents the categories of nonperforming assets, as of the dates indicated:excluding government guaranteed portions:
| December 31, | |||||||||||||||||||||||||||||
| ($ in thousands) | 2021 | 2020 | |||||||||||||||||||||||||||
| Non-accrual loans | $ | 23,449 | $ | 34,818 | |||||||||||||||||||||||||
| Loans past due 90 days or more and still accruing interest | 1,716 | 130 | |||||||||||||||||||||||||||
| Restructured loans | 2,859 | 3,559 | |||||||||||||||||||||||||||
| Total nonperforming loans | 28,024 | 38,507 | |||||||||||||||||||||||||||
| Other real estate | 3,493 | 5,330 | |||||||||||||||||||||||||||
| Total nonperforming assets | $ | 31,517 | $ | 43,837 | |||||||||||||||||||||||||
| Total assets | $ | 13,537,358 | $ | 9,751,571 | |||||||||||||||||||||||||
| Total loans | 9,017,642 | 7,224,935 | |||||||||||||||||||||||||||
| Total allowance for credit losses | 145,041 | 136,671 | |||||||||||||||||||||||||||
| Allowance for credit losses to nonaccrual loans | 619 | % | 393 | % | |||||||||||||||||||||||||
| Allowance for credit losses to nonperforming loans | 518 | % | 355 | % | |||||||||||||||||||||||||
| Allowance for credit losses to total loans | 1.61 | % | 1.89 | % | |||||||||||||||||||||||||
| Nonaccrual loans to total loans | 0.26 | % | 0.48 | % | |||||||||||||||||||||||||
| Nonperforming loans to total loans | 0.31 | % | 0.53 | % | |||||||||||||||||||||||||
| Nonperforming assets to total assets | 0.23 | % | 0.45 | % | |||||||||||||||||||||||||
| December 31, | |||||||||||||||||||
| ($ in thousands) | 2017 | 2016 | 2015 | 2014 | 2013 | ||||||||||||||
| Non-accrual loans | $ | 14,968 | $ | 12,585 | $ | 8,797 | $ | 20,892 | $ | 20,163 | |||||||||
| Restructured loans | 719 | 2,320 | 303 | 1,352 | 677 | ||||||||||||||
| Total nonperforming loans | 15,687 | 14,905 | 9,100 | 22,244 | 20,840 | ||||||||||||||
| Other real estate (1) | 498 | 980 | 8,366 | 1,896 | 7,576 | ||||||||||||||
| Total nonperforming assets (1) (2) | $ | 16,185 | $ | 15,885 | $ | 17,466 | $ | 24,140 | $ | 28,416 | |||||||||
| Total assets | $ | 5,289,225 | $ | 4,081,328 | $ | 3,608,483 | $ | 3,277,003 | $ | 3,170,197 | |||||||||
| Portfolio loans | 4,022,896 | 3,118,392 | 2,750,737 | 2,433,916 | 2,137,313 | ||||||||||||||
| Nonperforming loans to total loans (2) | 0.39 | % | 0.48 | % | 0.34 | % | 0.91 | % | 0.98 | % | |||||||||
| Nonperforming assets to total assets (1) (2) | 0.31 | % | 0.39 | % | 0.48 | % | 0.74 | % | 0.90 | % | |||||||||
| Allowance for portfolio loans to nonperforming loans (2) | 243 | % | 252 | % | 367 | % | 136 | % | 131 | % | |||||||||
| (1)The increase in other real estate included in nonperforming assets from 2014 to 2015 resulted from the reclassification of $5.1 million of other real estate previously covered under FDIC loss share agreements that were terminated in 2015. | |||||||||||||||||||
| (2) Excludes PCI loans, except for their inclusion in total assets. | |||||||||||||||||||
Nonperforming loans based on loan type were as follows:
| ($ in thousands) | December 31, 2021 | Number of loans | December 31, 2020 | Number of loans | |||||||||||||||||||||||||||||||
| Commercial and industrial | $ | 21,538 | 77 | % | 34 | $ | 21,770 | 57 | % | 21 | |||||||||||||||||||||||||
| Commercial real estate | 4,414 | 16 | % | 14 | 12,519 | 32 | % | 27 | |||||||||||||||||||||||||||
| Residential real estate | 2,048 | 7 | % | 12 | 4,189 | 11 | % | 3 | |||||||||||||||||||||||||||
| Other | 24 | — | % | 4 | 29 | — | % | 33 | |||||||||||||||||||||||||||
| Total | $ | 28,024 | 100 | % | 64 | $ | 38,507 | 100 | % | 84 | |||||||||||||||||||||||||
| (in thousands) | December 31, 2017 | Number of loans | December 31, 2016 | Number of loans | |||||||||||||||
| Commercial and industrial | $ | 12,665 | 81 | % | 10 | $ | 12,284 | 82 | % | 6 | |||||||||
| Commercial real estate | 909 | 6 | % | 4 | 655 | 4 | % | 4 | |||||||||||
| Construction and land development | 136 | 1 | % | 1 | 1,904 | 13 | % | 3 | |||||||||||
| Residential real estate | 1,602 | 10 | % | 3 | 62 | 1 | % | 1 | |||||||||||
| Consumer and other | 375 | 2 | % | 1 | — | — | % | — | |||||||||||
| Total | $ | 15,687 | 100 | % | 19 | $ | 14,905 | 100 | % | 14 | |||||||||
The following table summarizes the changes in nonperforming loans:
| Year ended December 31, | |||||||||||
| ($ in thousands) | 2021 | 2020 | |||||||||
| Nonperforming loans, beginning of period | $ | 38,507 | $ | 26,425 | |||||||
| Additions to nonaccrual loans | 43,350 | 30,424 | |||||||||
| Charge-offs | (17,185) | (6,739) | |||||||||
| Principal payments | (36,648) | (18,385) | |||||||||
| Nonperforming loans, end of period | $ | 28,024 | $ | 38,507 | |||||||
| Year ended December 31, | |||||||
| (in thousands) | 2017 | 2016 | |||||
| Nonperforming loans beginning of period | $ | 14,905 | $ | 9,100 | |||
| Additions to nonaccrual loans | 19,092 | 18,853 | |||||
| Additions to restructured loans | 676 | 2,320 | |||||
| Charge-offs | (11,307 | ) | (4,092 | ) | |||
| Other principal reductions | (7,396 | ) | (9,546 | ) | |||
| Moved to other real estate | (283 | ) | (343 | ) | |||
| Moved to performing | — | (1,387 | ) | ||||
| Nonperforming loans end of period | $ | 15,687 | $ | 14,905 | |||
Nonperforming loans at December 31, 2017 increased $0.82021 decreased $10.5 million, or 5%27%, when compared to December 31, 2016. Other principal reductions of $7.4 million includes $1.8 million of proceeds received from sales of collateral, $4.6 million of payments received from borrowers, and $1.0 million of proceeds from other loan settlements.
The Company implemented several loan programs to assist its customers impacted by the COVID-19 pandemic, including providing short-term payment deferrals, primarily for 90 days or 1.5%,less. As of portfolio loans outstanding at December 31, 2017, compared to $77.6 million, or 2.5%,2021, substantially all of portfolio loans outstanding at December 31, 2016. For these loans payment of principal and interest is current and the loans are performing, however some doubts exist ashave returned to the borrower's ability to continue to comply with repayment terms. Potential problem loans include loans to companies that are characterized by significant losses or where downward trends in financial performance have been identified, or are in an industry that is experiencing significant difficulty.a paying status.
46
Other real estate
Other real estate at December 31, 2017 was $0.5 million, compared to $1.0 million, at2021 and December 31, 2016. In 2015, $5.12020 was $3.5 million of other real estate previously covered under FDIC loss share agreements was reclassified into other real estate due to termination of the Company's loss share agreements with the FDIC in the fourth quarter of 2015.and $5.3 million, respectively.
The following table summarizes the changes in other real estate:
| Year ended December 31, | |||||||||||
| ($ in thousands) | 2021 | 2020 | |||||||||
| Other real estate, beginning of period | $ | 5,330 | $ | 6,344 | |||||||
| Additions | 3,175 | 756 | |||||||||
| Writedowns in value | (29) | (1,104) | |||||||||
| Sales | (4,983) | (666) | |||||||||
| Other real estate, end of period | $ | 3,493 | $ | 5,330 | |||||||
| Year ended December 31, | |||||||
| (in thousands) | 2017 | 2016 | |||||
| Other real estate, beginning of period | $ | 980 | $ | 8,366 | |||
| Additions and expenses capitalized to prepare property for sale | 2,338 | 2,263 | |||||
| Writedowns in value | (133 | ) | — | ||||
| Sales | (2,687 | ) | (9,649 | ) | |||
| Other real estate, end of period | $ | 498 | $ | 980 | |||
Investments
At December 31, 2017,2021, our portfolio of investment securities was $715$1.8 billion, or 13%, of total assets, compared to $1.4 million, or 14%, of total assets. The portfolio is primarily comprisedassets as of agency mortgage-backed securities, obligations of U.S. Government-sponsored enterprises, as well as municipal bonds.December 31, 2020. The portfolio is comprised of both available for saleavailable-for-sale and held to maturityheld-to-maturity securities.
The table below sets forth the carrying value of investment securities held by the CompanyCompany:
| December 31, | |||||||||||||||||||||||||||||||||||
| 2021 | 2020 | ||||||||||||||||||||||||||||||||||
| ($ in thousands) | Amount | % | Amount | % | |||||||||||||||||||||||||||||||
| Obligations of U.S. Government sponsored enterprises | $ | 173,511 | 9.6 | % | $ | 15,161 | 1.1 | % | |||||||||||||||||||||||||||
| Obligations of states and political subdivisions | 811,463 | 45.2 | % | 592,556 | 42.3 | % | |||||||||||||||||||||||||||||
| Agency mortgage-backed securities | 581,964 | 32.4 | % | 639,314 | 45.7 | % | |||||||||||||||||||||||||||||
| U.S. Treasury Bills | 91,170 | 5.1 | % | 11,466 | 0.8 | % | |||||||||||||||||||||||||||||
| Corporate debt securities | 138,193 | 7.7 | % | 141,991 | 10.1 | % | |||||||||||||||||||||||||||||
| Total | $ | 1,796,301 | 100.0 | % | $ | 1,400,488 | 100.0 | % | |||||||||||||||||||||||||||
The allowance for credit losses on held-to-maturity debt securities was $0.6 million and $0.4 million at the dates indicated:
| December 31, | ||||||||||||||||||||
| 2017 | 2016 | 2015 | ||||||||||||||||||
| ($ in thousands) | Amount | % | Amount | % | Amount | % | ||||||||||||||
| Obligations of U.S. Government sponsored enterprises | $ | 99,224 | 13.4 | % | $ | 107,660 | 19.4 | % | $ | 99,008 | 19.3 | % | ||||||||
| Obligations of states and political subdivisions | 48,674 | 6.6 | % | 51,390 | 9.2 | % | 56,532 | 11.0 | % | |||||||||||
| Agency mortgage-backed securities | 567,233 | 76.4 | % | 382,210 | 68.7 | % | 339,944 | 66.3 | % | |||||||||||
| FHLB capital stock | 12,924 | 1.7 | % | 4,351 | 0.8 | % | 8,344 | 1.6 | % | |||||||||||
| Other investments | 13,737 | 1.9 | % | 10,489 | 1.9 | % | 9,111 | 1.8 | % | |||||||||||
| Total | $ | 741,792 | 100.0 | % | $ | 556,100 | 100.0 | % | $ | 512,939 | 100.0 | % | ||||||||
December 31, 2021 and 2020, respectively. The Company had no debt securities classified as trading at December 31, 2017, 2016,2021, or 2015.2020.
The following table summarizes expected maturity and tax equivalenttax-equivalent yield information on the investment portfolio at December 31, 2017:2021:
| Within 1 year | 1 to 5 years | 5 to 10 years | Over 10 years | Total | |||||||||||||||||||||||||||||||||||||||||||||||||
| ($ in thousands) | Amount | Yield | Amount | Yield | Amount | Yield | Amount | Yield | Amount | Yield | |||||||||||||||||||||||||||||||||||||||||||
| Obligations of U.S. Government-sponsored enterprises | $ | — | — | % | $ | 142,292 | 1.03 | % | $ | 19,292 | 1.5 | % | $ | 11,927 | 2.36 | % | $ | 173,511 | 1.18 | % | |||||||||||||||||||||||||||||||||
| Obligations of states and political subdivisions | 1,048 | 4.39 | % | 22,870 | 2.35 | % | 39,607 | 2.88 | % | 747,938 | 2.71 | % | 811,463 | 2.71 | % | ||||||||||||||||||||||||||||||||||||||
| Agency mortgage-backed securities | 22,541 | 2.97 | % | 335,215 | 2.83 | % | 205,739 | 1.68 | % | 18,469 | 1.91 | % | 581,964 | 2.40 | % | ||||||||||||||||||||||||||||||||||||||
| U.S. Treasury Bills | 80,961 | 0.07 | % | 10,209 | 2.47 | % | — | — | % | — | — | % | 91,170 | 0.34 | % | ||||||||||||||||||||||||||||||||||||||
| Corporate debt securities | — | — | % | 5,181 | 3.28 | % | 133,012 | 3.37 | % | — | — | % | 138,193 | 3.37 | % | ||||||||||||||||||||||||||||||||||||||
| Total | $ | 104,550 | 0.74 | % | $ | 515,767 | 2.31 | % | $ | 397,650 | 2.36 | % | $ | 778,334 | 2.69 | % | $ | 1,796,301 | 2.39 | % | |||||||||||||||||||||||||||||||||
| Within 1 year | 1 to 5 years | 5 to 10 years | Over 10 years | No Stated Maturity | Total | ||||||||||||||||||||||||||||||
| ($ in thousands) | Amount | Yield | Amount | Yield | Amount | Yield | Amount | Yield | Amount | Yield | Amount | Yield | |||||||||||||||||||||||
| Obligations of U.S. Government-sponsored enterprises | $ | — | — | % | $ | 99,224 | 1.84 | % | $ | — | — | % | $ | — | — | % | $ | — | — | % | $ | 99,224 | 1.84 | % | |||||||||||
| Obligations of states and political subdivisions | 3,076 | 3.84 | % | 11,442 | 4.50 | % | 27,957 | 4.02 | % | 6,198 | 3.14 | % | — | — | % | 48,673 | 4.01 | % | |||||||||||||||||
| Agency mortgage-backed securities | 3,072 | 3.21 | % | 336,943 | 2.63 | % | 219,774 | 2.84 | % | 7,445 | 1.82 | % | — | — | % | 567,234 | 2.70 | % | |||||||||||||||||
| FHLB capital stock | — | — | % | — | — | % | — | — | % | — | — | % | 12,924 | 2.71 | % | 12,924 | 2.71 | % | |||||||||||||||||
| Other investments | — | — | % | — | — | % | — | — | % | — | — | % | 13,737 | 0.63 | % | 13,737 | 0.63 | % | |||||||||||||||||
| Total | $ | 6,148 | 3.53 | % | $ | 447,609 | 2.50 | % | $ | 247,731 | 2.97 | % | $ | 13,643 | 2.42 | % | $ | 26,661 | 1.64 | % | $ | 741,792 | 2.63 | % | |||||||||||
Yields on tax-exempt securities are computed on a taxable equivalent basis using a tax rate of 38%25.2%. Expected maturities will differ from contractual maturities, as borrowers may have the right to call or repay obligations with or without prepayment penalties.
47
Other investments primarily consist of the FHLB capital stock, common stock investments related to our trust preferred securities, community development funds, and other investments in private equity funds, primarily SBICs.
| December 31, | |||||||||||||||||||||||||||||||||||
| 2021 | 2020 | ||||||||||||||||||||||||||||||||||
| ($ in thousands) | Amount | % | Amount | % | |||||||||||||||||||||||||||||||
| FHLB capital stock | $ | 12,075 | 20.2 | % | $ | 10,774 | 22.1 | % | |||||||||||||||||||||||||||
| Other investments | 47,821 | 79.8 | % | 37,991 | 77.9 | % | |||||||||||||||||||||||||||||
| Total | $ | 59,896 | 100.0 | % | $ | 48,765 | 100.0 | % | |||||||||||||||||||||||||||
The following table summarizes expected maturity and tax-equivalent yield information on other investments at December 31, 2021:
| No Stated Maturity | |||||||||||
| ($ in thousands) | Amount | Yield | |||||||||
| FHLB capital stock | $ | 12,075 | 4.13 | % | |||||||
| Other investments | 47,821 | 1.78 | % | ||||||||
| Total | $ | 59,896 | 2.25 | % | |||||||
48
Deposits
The following table shows the breakdown of the Company'sCompany’s deposits by typetype:
| Years ended December 31, | % Increase (decrease) | ||||||||||||||||||||||||||||
| ($ in thousands) | 2021 | 2020 | 2021 vs. 2020 | ||||||||||||||||||||||||||
| Noninterest-bearing demand accounts | $ | 4,578,436 | $ | 2,711,828 | 68.8 | % | |||||||||||||||||||||||
| Interest-bearing demand accounts | 2,465,884 | 1,768,497 | 39.4 | % | |||||||||||||||||||||||||
| Money market accounts | 2,890,976 | 2,327,066 | 24.2 | % | |||||||||||||||||||||||||
| Savings accounts | 800,210 | 627,903 | 27.4 | % | |||||||||||||||||||||||||
| Certificates of deposit: | |||||||||||||||||||||||||||||
| Brokered | 128,970 | 50,209 | 156.9 | % | |||||||||||||||||||||||||
| Other | 479,323 | 499,886 | (4.1) | % | |||||||||||||||||||||||||
| Total deposits | $ | 11,343,799 | $ | 7,985,389 | 42.1 | % | |||||||||||||||||||||||
| Noninterest-bearing deposits / Total deposits | 40 | % | 34 | % | |||||||||||||||||||||||||
The following table shows the average balance and average rate of the Company’s deposits by type:
| Years ended December 31, | |||||||||||||||||||||||||||||||||||
| 2021 | 2020 | 2019 | |||||||||||||||||||||||||||||||||
| ($ in thousands) | Average Balance | Average Rate Paid | Average Balance | Average Rate Paid | Average Balance | Average Rate Paid | |||||||||||||||||||||||||||||
| Noninterest-bearing deposit accounts | $ | 3,597,204 | — | % | $ | 1,854,982 | — | % | $ | 1,228,832 | — | % | |||||||||||||||||||||||
| Interest-bearing demand accounts | 2,122,752 | 0.08 | % | 1,494,364 | 0.14 | % | 1,286,641 | 0.59 | % | ||||||||||||||||||||||||||
| Money market accounts | 2,557,836 | 0.18 | 1,977,826 | 0.39 | 1,608,349 | 1.63 | |||||||||||||||||||||||||||||
| Savings accounts | 724,768 | 0.03 | 589,832 | 0.05 | 489,310 | 0.17 | |||||||||||||||||||||||||||||
| Certificates of deposit | 570,496 | 0.73 | 676,889 | 1.61 | 799,079 | 1.90 | |||||||||||||||||||||||||||||
| Total interest-bearing deposits | $ | 5,975,852 | 0.18 | $ | 4,738,911 | 0.44 | $ | 4,183,379 | 1.19 | ||||||||||||||||||||||||||
| Total average deposits | $ | 9,573,056 | 0.11 | $ | 6,593,893 | 0.32 | $ | 5,412,211 | 0.92 | ||||||||||||||||||||||||||
Average total deposits were $9.6 billion for the periods indicated:
| For the Years ended December 31, | % Increase (decrease) | ||||||||||||||||
| ($ in thousands) | 2017 | 2016 | 2015 | 2017 vs. 2016 | 2016 vs. 2015 | ||||||||||||
| Demand deposits | $ | 1,123,907 | $ | 866,756 | $ | 717,460 | 29.7 | % | 20.8 | % | |||||||
| Interest-bearing transaction accounts | 915,653 | 731,539 | 564,420 | 25.2 | % | 29.6 | % | ||||||||||
| Money market accounts | 1,342,931 | 1,050,472 | 1,053,662 | 27.8 | % | (0.3 | )% | ||||||||||
| Savings | 195,150 | 111,435 | 92,861 | 75.1 | % | 20.0 | % | ||||||||||
| Certificates of deposit: | |||||||||||||||||
| Brokered | 115,306 | 117,145 | 39,573 | (1.6 | )% | 196.0 | % | ||||||||||
| Other | 463,467 | 356,014 | 316,615 | 30.2 | % | 12.4 | % | ||||||||||
| Total deposits | $4,156,414 | $3,233,361 | $2,784,591 | 28.5 | % | 16.1 | % | ||||||||||
| Non-time deposits / Total deposits | 86 | % | 85 | % | 87 | % | |||||||||||
| Demand deposits / Total deposits | 27 | % | 27 | % | 26 | % | |||||||||||
The following table sets forth the maturities of estimated uninsured certificates of deposit which experienced a slight decline. Coreas of December 31, 2021:
| ($ in thousands) | Total | ||||
| Three months or less | $ | 15,074 | |||
| Over three through six months | 9,098 | ||||
| Over six through twelve months | 47,855 | ||||
| Over twelve months | 21,645 | ||||
| Total | $ | 93,672 | |||
As of December 31, 2021, estimated uninsured deposits defined as totaltotaled $5.9 billion, including $93.7 million of certificates of deposit. At December 31, 2020, estimated uninsured deposits excluding time deposits, were $3.6totaled $3.3 billion.
49
Shareholders’ equity
Shareholders’ equity totaled $1.5 billion at December 31, 2017,2021, an increase of $817$450.1 million, or 30%42%, from the prior year period. The increase in deposits reflects the acquisition of JCB, and continued progress across the Company's regions and business lines.
| (in thousands) | Total | ||
| Three months or less | $ | 59,709 | |
| Over three through six months | 52,990 | ||
| Over six through twelve months | 94,658 | ||
| Over twelve months | 94,359 | ||
| Total | $ | 301,716 | |
Significant activity during the year ended December 31, 2017:2021 included the following:
•increase from net income of $133.1 million;
•increase from issuance of preferred stock of $72.0 million, net;
Liquidity and Capital Resources
Liquidity
The objective of liquidity management is to ensure we have the ability to generate sufficient cash or cash equivalents in a timely and cost-effective manner to meet our commitments as they become due. Typical demands on liquidity are changes in deposit levels, maturing time deposits which are not renewed, and fundings under credit commitments to customers. Funds are available from a number of sources, such as the core deposit base and loansloan and securitiessecurity repayments and maturities.
Additionally, liquidity is provided from lines of credit with correspondent banks,the FHLB, the Federal Reserve, and the FHLB,correspondent banks; the ability to acquire large and brokered deposits,deposits; sales of the securities portfolio,portfolio; and the ability to sell loan participations to other banks. These alternatives are an important part of our liquidity plan and provide flexibility and efficient execution of the asset-liability management strategy.
The Bank'sCompany’s Asset-Liability Management Committee oversees our liquidity position, the parameters of which are approved by the Bank'sBank’s Board of Directors.Our liquidity position is monitored monthly by producing a liquidity report, which measures the amount of liquid versus non-liquid assets and liabilities.daily. Ourliquidity management framework includes measurement of several key elements, such as thea loan to deposit ratio, a liquidity ratio, and a dependency ratio. The Company'sCompany’s liquidity framework also incorporates contingency planning to assess the nature and volatility of funding sources and to determine alternatives to these sources. While core deposits and loan and investment repayments are principal sources of liquidity, funding diversification is another key element of liquidity management and is achieved by strategically varying depositor types, terms, funding markets, and instruments.
Liability liquidity funding sources are available to increase financial flexibility. In addition to amounts borrowed at December 31, 2021, the Company could borrow an additional $709 million from the FHLB of Des Moines under blanket loan pledges and has additional real estate loans of approximately $970.0 million that could be pledged. The Company also has $1.1 billion available from the Federal Reserve Bank under a pledged loan agreement. The Company also has unsecured federal funds lines with six correspondent banks totaling $90 million.
50
In the normal course of business, the Company enters into certain forms of off-balance sheet transactions, including unfunded loan commitments and letters of credit. These transactions are managed through the Company’s various risk management processes. Management considers both on-balance sheet and off-balance sheet transactions in 2016.its evaluation of the Company’s liquidity. The investing activitiesCompany has $2.6 billion in 2017 primarily representsunused commitments as of December 31, 2021. While this commitment level would exhaust the majority the Company’s current liquidity resources, the nature of these commitments is such that the likelihood of funding them in the aggregate at any one time is low.
At the holding company level, our normal business activity of making loansprimary funding sources are dividends and investing in securities. Net cash provided by financing activities was $221.2 million in 2017, versus net cash provided of $380.2 million in 2016. The change in cash provided by financing activities was primarily due to larger increases in deposit accountspayments from the Bank and proceeds from the issuance of $50equity (i.e. stock option exercises, stock offerings) and debt instruments. The main use of this liquidity is to provide the funds necessary to pay dividends to shareholders, service debt, invest in subsidiaries as necessary, and satisfy other operating requirements. In 2021, the holding company maintained a revolving line of credit for an aggregate amount up to $25 million, all of subordinated notes bothwhich was available at December 31, 2021. The line of credit has a one-year term that was renewed in 2016, partially offset byFebruary 2022. The proceeds can be used for general corporate purposes.
The Company has an increase in net proceeds from FHLB advances in 2017.effective automatic shelf registration statement on Form S-3 allowing for the issuance of various forms of equity and debt securities. The Company’s ability to offer securities pursuant to the registration statement depends on market conditions and the Company’s continuing eligibility to use the Form S-3 under rules of the SEC.
Strong capital ratios, credit quality and core earnings are essential to retaining cost-effective access to the wholesale funding markets. Deterioration in any of these factors could have a negative impact on the Company'sCompany’s ability to access these funding sources and, as a result, these factors are monitored on an ongoing basis as part of the liquidity management
process. The Bank is subject to regulations and, among other things, may be limited in its ability to pay dividends or transfer funds to the parent company.Accordingly, consolidated cash flows as presented in the consolidated statements of cash flows may not represent cash immediately available for the payment of cash dividends to the Company'sCompany’s shareholders or for other cash needs.
Capital Resources
The Company and the Bank are subject to various regulatory capital requirements administered by the Federalstate and federal banking agencies. Failure to meet minimum capital requirements can initiate certain mandatory and possible additional discretionary actions by regulators that, if undertaken, could have a direct material effect on the financial statements.statements and results of operations of the Company. Under capital adequacy guidelines and the regulatory framework for prompt corrective action, the Company and its bank affiliate must meet specific capital guidelines that involve quantitative measures of assets, liabilities, and certain off-balance-sheet items as calculated under regulatory accounting practices. The banking affiliate’s capital amounts and classification are also subject to qualitative judgments by the regulators about components, risk weightings and other factors.
51
Quantitative measures established by regulation to ensure capital adequacy require the Company and the Bank to maintain minimum amounts and ratios (set forth in the following table) of total and tier 1 capital to risk-weighted assets, and of tier 1 capital to average assets. To be categorized as “well capitalized”“well-capitalized”, banks must maintain minimum total risk-based (10%), tier 1 risk-based (8%), common equity tier 1 risk-based (6.5%), and tier 1 leverage ratios (5%). As of December 31, 2017,2021, and December 31, 2016,2020, the Company and the Bank met all capital adequacy requirements to which they are subject.
The Bank met the definition of “well capitalized”“well-capitalized” at each of December 31, 2017, 2016,2021 and 2015.2020. Refer to Item 8 -“Item 8. Note 1415 – Regulatory MattersCapital” for a summary of our risk-based capital and leverage ratios.
The following table summarizes the Company's variousCompany’s capital ratios at the dates indicated:ratios:
| December 31, 2021 | December 31, 2020 | |||||||||||||||||||||||||
| ($ in thousands) | EFSC | Bank | EFSC | Bank | To Be Well-Capitalized | Minimum Ratio with CCB | ||||||||||||||||||||
| Common Equity Tier 1 Capital to Risk Weighted Assets | 11.3 | % | 12.5 | % | 10.9 | % | 12.5 | % | 6.5 | % | 7.0 | % | ||||||||||||||
| Tier 1 Capital to Risk Weighted Assets | 13.0 | % | 12.5 | % | 12.1 | % | 12.5 | % | 8.0 | % | 8.5 | % | ||||||||||||||
| Total Capital to Risk Weighted Assets | 14.7 | % | 13.5 | % | 14.9 | % | 13.7 | % | 10.0 | % | 10.5 | % | ||||||||||||||
| Leverage Ratio (Tier 1 Capital to Average Assets) | 9.7 | % | 9.3 | % | 10.0 | % | 10.3 | % | 5.0 | % | 4.0 | % | ||||||||||||||
Tangible common equity to tangible assets1 | 8.1 | % | 8.4 | % | ||||||||||||||||||||||
| Common equity tier 1 capital | $ | 1,091,823 | $ | 1,201,340 | $ | 795,873 | $ | 913,116 | ||||||||||||||||||
| Tier 1 capital | 1,257,462 | 1,201,391 | 889,527 | 913,169 | ||||||||||||||||||||||
| Total risk-based capital | 1,423,036 | 1,303,715 | 1,094,601 | 1,004,839 | ||||||||||||||||||||||
1 Not a required regulatory capital ratio | ||||||||||||||||||||||||||
| ($ in thousands) | For the Year ended December 31, | Well Capitalized | |||||||||||
| 2017 | 2016 | 2015 | Minimum % | ||||||||||
| Total capital to risk weighted assets | 12.21 | % | 13.48 | % | 11.85 | % | 10.00% | ||||||
| Tier 1 capital to risk weighted assets | 10.29 | % | 10.99 | % | 10.61 | % | 8.00% | ||||||
| Common equity tier 1 capital to risk weighted assets | 8.88 | % | 9.52 | % | 9.05 | % | 6.50% | ||||||
| Leverage ratio (Tier 1 capital to average assets) | 9.72 | % | 10.42 | % | 10.71 | % | 5.00% | ||||||
Tangible common equity to tangible assets1 | 8.14 | % | 8.76 | % | 8.88 | % | N/A | ||||||
| Total risk-based capital | $ | 589,048 | $ | 506,349 | $ | 418,367 | |||||||
| Tier 1 capital | 496,045 | 412,865 | 374,676 | ||||||||||
| Common equity tier 1 capital | 428,398 | 357,729 | 319,553 | ||||||||||
1 Not a required regulatory capital ratio | |||||||||||||
The Company believes the tangible common equity and regulatory capital ratios are important measures of capital strength even though they are considered to be non-GAAP measures. The tables further withinincluded in this MD&A section under the caption “Use of Non-GAAP Financial Measures” reconcile these ratios to U.S. GAAP.
Risk Management
Market risk arises from exposure to changes in interest rates and other relevant market rate or price risk. The Company faces market risk in the form of interest rate risk through transactions other than trading activities. Market risk from these activities, in the form of interest rate risk, is measured and managed through a number of methods. The Company uses financial modeling techniques to measure interest rate risk. These techniques measure the sensitivity of future earnings due to changing interest rate environments. Guidelines established by the Bank'sBank’s Asset/Liability Management Committee and approved by the Bank'sBank’s Board of Directors are used to monitor exposure of earnings at risk. General interest rate movements are used to develop sensitivity as management believes it has no primary exposure to a specific point on the yield curve. These limits are based on the Company'sCompany’s exposure to immediate and sustained parallel rate movements, up to 400 basis points, either upward or downward. The Company does not have any direct market risk from commodity exposures.
Interest Rate Risk
Our interest rate risk management practices are aimed at optimizing net interest income, while guarding against deterioration that could be caused by certain interest rate scenarios. Interest rate sensitivity varies with different types of interest-earning assets and interest-bearing liabilities. We attempt to maintain interest-earning assets, comprised primarily of both loans and investments, and interest-bearing liabilities, comprised primarily of deposits, maturing or repricing in similar time horizons in order to manage any impact from market interest rate changes according to our risk tolerance. The Company uses an earnings simulation model to measure earnings sensitivity to changing rates.
52
The Company determines the sensitivity of its short-term future earnings to a hypothetical plus or minus 100 to 300 basis point parallel rate shock through the use of simulation modeling. The simulation of earnings includes the modeling of the balance sheet as an ongoing entity. Future business assumptions involving administered rate products, prepayments for future rate-sensitive balances, and the reinvestment of maturing assets and liabilities are included. These items are then modeled to project net interest income based on a hypothetical change in interest rates. The resulting net interest income for the next 12-month period is compared to the net interest income amount calculated using flat rates. This difference represents the Company'sCompany’s earnings sensitivity to a positive or negative 100 basis points parallel rate shock.
The following table summarizes the expectedprojected impact of interest rate shocks on net interest income (due to the current level of interest rates, the 200 and 300 basis point downward shock scenarios are not shown):
at December 31, 2021:
Rate Shock1 | Annual % change in net interest income | ||||
| + 300 bp | 22.9% | ||||
| + 200 bp | 14.1% | ||||
| + 100 bp | 5.6% | ||||
1 Due to the current levels of interest rates, the downward shock scenarios are not shown. | |||||
In addition to the rate shocks shown in the table above, the Company models net interest income under various dynamic interest rate scenarios. In general, changes in interest rates are positively correlated with changes in net interest income. The exception to this is a bear flattener scenario (short term rates move up more than long term rates), which results in a mild decrease in net interest income.
The Company occasionally uses interest rate derivative financial instruments as an asset/liability management tool to hedge mismatches in interest rate exposure indicated by the net interest income simulation described above. They are used to modify the Company'sCompany’s exposures to interest rate fluctuations and provide more stable spreads between loan yields and the rate on their funding sources. At December 31, 2017,2021, the Company had no$62.0 million in derivative contracts used to manage interest rate risk. Derivative financial instruments are also discussed in Item 8,“Item 8. Note 67 – Derivative Financial Instruments.
”
We have exposure to LIBOR in various financial contracts. Instruments that may be impacted include loans, securities, debt instruments and derivatives, among other commitments. Such obligations relatefinancial contracts indexed to fundingLIBOR and that mature after December 31, 2021. We also have loans that are indirectly linked to LIBOR through reference to the ICE swap rate. We have an internal working group composed of members from legal, credit, finance, operations, through deposits or debt issuances, as well as leases for premisesrisk and equipment. As a financial services provider,audit to monitor developments, develop policies and procedures, assess the impact to the Company, routinely enters into commitmentsconsider relevant options and to extend credit. While contractual obligations represent future cash requirementsdetermine an appropriate replacement index for affected contracts that expire after the expected discontinuation of LIBOR on June 30, 2023. We are actively working to amend and address impacted contracts to allow for a replacement index. However, amending certain contracts indexed to LIBOR may require consent from the Company, a significant portion of commitmentscounterparties which could be difficult and costly to extend credit may expire without being drawn upon. Such commitments are subject to the same credit policies and approval process accorded to loans made by the Company.
| Payments due by Period | |||||||||||||||||||
| (in thousands) | Total | Less Than 1 Year | Over 1 Year Less than 3 Years | Over 3 Years Less than 5 Years | Over 5 Years | ||||||||||||||
| Operating leases | $ | 22,498 | $ | 3,503 | $ | 6,895 | $ | 6,138 | $ | 5,962 | |||||||||
| Certificates of deposit | 578,773 | 431,427 | 124,041 | 22,698 | 607 | ||||||||||||||
| Subordinated debentures and notes | 119,241 | — | — | — | 119,241 | ||||||||||||||
| Federal Home Loan Bank advances | 172,743 | 172,743 | — | — | — | ||||||||||||||
| Commitments to extend credit | 1,298,424 | 592,747 | 364,437 | 71,700 | 269,540 | ||||||||||||||
| Commitments - state tax credits | 23,744 | 20,402 | 3,342 | — | — | ||||||||||||||
| Letters of credit | 73,790 | 49,080 | 24,685 | 25 | — | ||||||||||||||
| SBICs (2) | 17,437 | 3,487 | 13,950 | — | — | ||||||||||||||
| (1) Interest charges on related contractual obligations were excluded from reported amounts as the potential cash outflows would have corresponding cash inflows from interest-earning assets. | |||||||||||||||||||
| (2) Represents the estimated timing of various capital raises for SBICs. | |||||||||||||||||||
obtain in certain circumstances. As of December 31, 2017, we had liabilities associated with uncertain2021, the Company’s financial contracts indexed to LIBOR included $2.8 billion in loans (including $618.4 million indirectly linked to LIBOR through reference to an ICE swap rate), $125.3 million in borrowings, and $889.0 million (notional) in derivatives.
In addition, LIBOR is used in the Company’s analysis of the fair value of tax positions of $0.8 million. The table above doescredits and may be referenced in other financial contracts not include these liabilities due toincluded in the high degree of uncertainty regarding the future cash flows associated with these amounts.discussion above.
53
The Company also enters into derivative contracts under which the Company either receives cash from or pays cash to counterparties depending on changeshad $5.7 billion in interest rates. Derivative contracts are carried at fair value on the consolidated balance sheet with the fair value representing the net present value of expected future cash receipts or payments based on market interest ratesvariable rate loans as of December 31, 2021. Of these loans, $3.2 billion have an interest rate floor and 95% of those loans were at the balance sheet date. The fair value of these contracts changes daily as market interest rates change.floor. $2.8 billion in variable rate loans are indexed to LIBOR, $2.4 billion are indexed to the prime rate, and $382.8 million are indexed to other rates.
CRITICAL ACCOUNTING POLICIES AND ESTIMATES
The following accounting policies are considered most critical to the understanding of the Company'sCompany’s financial condition and results of operations. These critical accounting policies require management'smanagement’s most difficult, subjective and complex judgments about matters that are inherently uncertain. Because these estimates and judgments are based on current circumstances, they may change over time or prove to be inaccurate based on actual experiences.experience. In the event that different assumptions or conditions were to prevail, and depending upon the severity of such changes, the possibility of a materially different financial condition and/or results of operations could reasonably be expected. The impact and any associated risks related to our critical accounting policies on our business operations are discussed throughout “Management's“Management’s Discussion and Analysis of Financial Condition and Results of Operations,” where such policies affect our reported and expected financial results. For a detailed discussion on the application of these and other accounting policies, see Item 8,“Item 8. Note 1 – Summary of Significant Accounting Policies.”
The Company has prepared all of the consolidated financial information in this report in accordance with U.S. GAAP. The Company makes estimates and assumptions that affect the reported amount of assets and liabilities, disclosure of contingent assets and liabilities at the date of the consolidated financial statements, and the reported amounts of revenue and expenses during the reporting period. Such estimates include the valuation of loans, goodwill, intangible assets, and other long-lived assets, along with assumptions used in the calculation of income taxes, among others. These estimates and assumptions are based on management'smanagement’s best estimates and judgment. Management evaluates its estimates and assumptions on an ongoing basis using historicalloss experience and other factors, including the current economic environment, which management believes to be reasonable under the circumstances. We adjust such estimates and assumptions when facts and circumstances dictate. Decreased real estate values, volatile credit markets, and persistent high unemployment have combined to increase the uncertainty inherent in such estimates and assumptions. As future events and their effects cannot be determined with precision, actual results could differ significantly from these estimates. Changes in estimates resulting from continuing changes in the economic environment will be reflected in the financial statementstatements in future periods. There can be no assurances that actual results will not differ from those estimates.
Allowance for Credit Losses
On January 1, 2020, the Company adopted Accounting Standard Update 2016-13 “Financial Instruments - Credit Losses (Topic 326): Measurement of Credit Losses on Financial Instruments.” This standard, referred to as CECL, requires an estimate of lifetime expected credit losses on certain financial assets measured at amortized cost.
The Company maintains separate allowances for funded loans, unfunded loans, and held-to-maturity securities, collectively the ACL. The ACL is a valuation account to adjust the cost basis to the amount expected to be collected, based on management’s estimate of experience, current conditions, and reasonable and supportable forecasts. For purposes of determining the allowance for funded and unfunded loans, the portfolios are segregated into pools that share similar risk characteristics that are then further segregated by credit grades. Loans that do not share similar risk characteristics are evaluated on an individual basis and are not included in the collective evaluation. The Company estimates the amount of the allowance based on loan loss experience, adjusted for current and forecasted economic conditions, including unemployment, changes in GDP, and commercial and residential real estate prices. The Company’s forecast of economic conditions uses internal and external information and considers a weighted average of a baseline, upside, and downside scenarios. Because economic conditions can change and are difficult to predict, the anticipated amount of estimated loan defaults and losses, and therefore the adequacy of the allowance, could change significantly and have a direct impact on the Company’s credit costs. The Company’s allowance for credit losses on loans was $145.0 million at December 31, 2021 based on the weighting of the different economic scenarios. As a hypothetical example, if the Company had only used the upside scenario, the allowance would have decreased $20.5 million. Conversely, the allowance would have increased $43.9 million using only the downside scenario.
54
Acquisitions
Acquisitions and Business Combinations are accounted for using the acquisition method of accounting. The assets and liabilities of the acquired entities have been recorded at their estimated fair values at the date of acquisition. Goodwill represents the excess of the purchase price over the fair value of net assets acquired, including the amount assigned to identifiable intangible assets.
The purchase price allocation process requires an estimation of the fair values of the assets acquired and the liabilities assumed. When a business combination agreement provides for an adjustment to the cost of the combination contingent on future events, the Company includes an estimate of the acquisition-date fair value as part of the cost of the combination. To determine the fair values, the Company relies on third party valuations, such as appraisals, or internal valuations based on discounted cash flow analyses or other valuation techniques. The results of operations of the acquired business are included in the Company'sCompany’s consolidated financial statements from the respective date of acquisition. Merger-related costs are costs the Company incurs to effect a business combination. In 2017, the Company changed its presentation of Merger related expenses as a separate component of Noninterest expenses on the Condensed Consolidated Statements of Operations. Merger relatedMerger-related expenses include costs directly related to merger or acquisition activity and include legal and professional fees, system consolidation and conversion costs, and compensation costs such as severance and retention incentives for employees impacted by acquisition activity. The Company accounts for merger-related costs as expenses in the periods in which the costs are incurred and the services are received.
Management uses certain assumptions and estimates in determining income taxes payable or refundable for Loan Losses
Effects of New Accounting Pronouncements
See Item 8,“Item 8. Note 211 – New AuthoritativeSummary of Significant Accounting GuidancePolicies – Recent Accounting Pronouncements” for information on recent accounting pronouncements and their impact, if any, on our consolidated financial statements.
Use of Non-GAAP Financial Measures
The Company'sCompany’s accounting and reporting policies conform to generally accepted accounting principles in the U.S. ("GAAP")GAAP and the prevailing practices in the banking industry. However, the Company provides other financial measures, such as core net income and net interest margin, and other core performance measures, regulatory capital ratios, and theefficiency ratio, tangible common equity ratio, return on average tangible common equity, and tangible book value per common share, in this filingreport that are considered “non-GAAP financial measures.” Generally, a non-GAAP financial measure is a numerical measure of a company'scompany’s financial performance, financial position, or cash flows that exclude (or include) amounts that are included in (or excluded from) the most directly comparable measure calculated and presented in accordance with GAAP.
The Company considers its core efficiency ratio, tangible common equity ratio, return on average tangible common equity, and tangible book value per common share, collectively “core performance measuresmeasures” presented in this report, as importantrelevant measures of financial performance, even though they are non-GAAP measures, as they provide supplemental information by which to evaluate the impact of non-core acquired loans and related income and expenses, the impact of certain non-comparable items, and the Company'sCompany’s operating performance on an ongoing basis. Core performance measures include contractual interest on non-core acquired loans, but exclude incremental accretion on these loans. Core performance measures also excludecertain other income and expense items such as merger-related expenses, facilities charges, and the following:
gain or loss on sale of other real estate from non-core acquired loans,investment securities, which
55
basis. The attached tables contain a reconciliation of these core performance measures to the GAAP measures. The Company believes that the tangible common equity ratio provides useful information to investors about the Company'sCompany’s capital strength even though it is considered to be a non-GAAP financial measure and is not part of the regulatory capital requirements to which the Company is subject.
The Company believes these non-GAAP measures and ratios, when taken together with the corresponding GAAP measures and ratios, provide meaningful supplemental information regarding the Company'sCompany’s performance and capital strength. The Company'sCompany’s management uses, and believes that investors benefit from referring to, these non-GAAP measures and ratios in assessing the Company'sCompany’s operating results and related trends and when forecasting future periods. However, these non-GAAP measures and ratios should be considered in addition to, and not as a substitute for or preferable to, ratios prepared in accordance with GAAP. The Company has provided a reconciliation of, where applicable, the most comparable GAAP financial measures and ratios to the non-GAAP financial measures and ratios, or a reconciliation of the non-GAAP calculation of the financial measure for the periods indicated.
56
Reconciliations of Non-GAAP Financial Measures
Core Performance MeasuresEfficiency Ratio
| For the Years ended December 31, | |||||||||||||||||
| ($ in thousands) | 2021 | 2020 | 2019 | ||||||||||||||
| Net interest income | $ | 360,194 | $ | 270,001 | $ | 238,717 | |||||||||||
| Less incremental accretion income | — | 4,083 | 4,783 | ||||||||||||||
| Core net interest income | 360,194 | 265,918 | 233,934 | ||||||||||||||
| Total noninterest income | 67,743 | 54,503 | 49,176 | ||||||||||||||
| Less gain on sale of other real estate | 884 | — | — | ||||||||||||||
| Less other income from non-core acquired assets | — | — | 1,372 | ||||||||||||||
| Less gain on sale of investment securities | — | 421 | 243 | ||||||||||||||
| Less other non-core income | — | 265 | 266 | ||||||||||||||
| Core noninterest income | 66,859 | 53,817 | 47,295 | ||||||||||||||
| Total core revenue | $ | 427,053 | $ | 319,735 | $ | 281,229 | |||||||||||
| Total noninterest expense | $ | 245,919 | $ | 167,159 | $ | 165,485 | |||||||||||
| Less merger-related expenses | 22,082 | 4,174 | 17,969 | ||||||||||||||
| Less branch-closure expenses | 3,441 | — | — | ||||||||||||||
| Less other non-core expenses | — | 57 | 257 | ||||||||||||||
| Core noninterest expense | $ | 220,396 | $ | 162,928 | $ | 147,259 | |||||||||||
| Core efficiency ratio | 51.61 | % | 50.96 | % | 52.36 | % | |||||||||||
| For the Years ended | |||||||||||
| ($ in thousands, except per share data) | December 31, 2017 | December 31, 2016 | December 31, 2015 | ||||||||
| Net interest income | $ | 177,304 | $ | 135,495 | $ | 120,410 | |||||
| Less: Incremental accretion income | 7,718 | 11,980 | 12,792 | ||||||||
| Core net interest income | 169,586 | 123,515 | 107,618 | ||||||||
| Total noninterest income | 34,394 | 29,059 | 20,675 | ||||||||
| Less: Gain on sale of other real estate from non-core acquired loans | (6 | ) | 1,565 | 107 | |||||||
| Less: Other income from non-core acquired assets | — | 621 | — | ||||||||
| Less: Gain on sale of investment securities | 22 | 86 | 23 | ||||||||
| Less: Change in FDIC loss share receivable | — | — | (5,030 | ) | |||||||
| Core noninterest income | 34,378 | 26,787 | 25,575 | ||||||||
| Total core revenue | 203,964 | 150,302 | 133,193 | ||||||||
| Provision for portfolio loan losses | 10,764 | 5,551 | 4,872 | ||||||||
| Total noninterest expense | 115,051 | 86,110 | 82,226 | ||||||||
| Less: Merger related expenses | 6,462 | 1,386 | — | ||||||||
| Less: Other expenses related to non-core acquired loans | 240 | 1,094 | 1,558 | ||||||||
| Less: Facilities disposal charge | 389 | 1,040 | — | ||||||||
| Less: Executive severance | — | 332 | — | ||||||||
| Less: FDIC loss share termination | — | — | 2,436 | ||||||||
| Less: FDIC clawback | — | — | 760 | ||||||||
| Less: Other non-core expenses | — | 41 | — | ||||||||
| Core noninterest expense | 107,960 | 82,217 | 77,472 | ||||||||
| Core income before income tax expense | 85,240 | 62,534 | 50,849 | ||||||||
| Total income tax expense | 38,327 | 26,002 | 19,951 | ||||||||
| Less: Income tax expense from deferred tax asset revaluation due to the U.S. corporate tax rate change | 12,117 | — | — | ||||||||
Less: Other non-core income tax expense1 | 882 | 4,705 | 2,893 | ||||||||
| Core income tax expense | 25,328 | 21,297 | 17,058 | ||||||||
| Core net income | $ | 59,912 | $ | 41,237 | $ | 33,791 | |||||
| Core diluted earnings per share | $ | 2.58 | $ | 2.03 | $ | 1.66 | |||||
| Core return on average assets | 1.20 | % | 1.09 | % | 1.00 | % | |||||
| Core return on average common equity | 11.26 | % | 11.10 | % | 10.08 | % | |||||
| Core return on average tangible common equity | 14.46 | % | 12.18 | % | 11.22 | % | |||||
| Core efficiency ratio | 52.93 | % | 54.70 | % | 58.17 | % | |||||
1Other non-core income tax expense calculated at 38% of non-core pre-tax income plus an estimate of taxes payable related to non-deductible JCB acquistion costs. | |||||||||||
| ($ in thousands) | For the Years ended December 31, | ||||||||||
| 2017 | 2016 | 2015 | |||||||||
| Net interest income | $ | 179,114 | $ | 137,261 | $ | 122,141 | |||||
| Less: Incremental accretion income | 7,718 | 11,980 | 12,792 | ||||||||
| Core net interest income | $ | 171,396 | $ | 125,281 | $ | 109,349 | |||||
| Average earning assets | $ | 4,611,671 | $ | 3,570,186 | $ | 3,163,339 | |||||
| Reported net interest margin | 3.88 | % | 3.84 | % | 3.86 | % | |||||
| Core net interest margin | 3.72 | % | 3.51 | % | 3.46 | % | |||||
Tangible Common Equity ratioand Tangible Common Equity Ratio
| For the Years ended December 31, | |||||||||||||||||
| ($ in thousands) | 2021 | 2020 | 2019 | ||||||||||||||
| Total shareholders' equity | $ | 1,529,116 | $ | 1,078,975 | $ | 867,185 | |||||||||||
| Less preferred stock | 71,988 | — | — | ||||||||||||||
| Less goodwill | 365,164 | 260,567 | 210,344 | ||||||||||||||
| Less intangible assets | 22,286 | 23,084 | 26,076 | ||||||||||||||
| Tangible common equity | $ | 1,069,678 | $ | 795,324 | $ | 630,765 | |||||||||||
| Total assets | $ | 13,537,358 | $ | 9,751,571 | $ | 7,333,791 | |||||||||||
| Less goodwill | 365,164 | 260,567 | 210,344 | ||||||||||||||
| Less intangible assets | 22,286 | 23,084 | 26,076 | ||||||||||||||
| Tangible assets | $ | 13,149,908 | $ | 9,467,920 | $ | 7,097,371 | |||||||||||
| Tangible common equity to tangible assets | 8.13 | % | 8.40 | % | 8.89 | % | |||||||||||
57
| For the Years ended December 31, | |||||||||||
| ($ in thousands) | 2017 | 2016 | 2015 | ||||||||
| Total shareholders' equity | $ | 548,573 | $ | 387,098 | $ | 350,829 | |||||
| Less: Goodwill | 117,345 | 30,334 | 30,334 | ||||||||
| Less: Intangible assets | 11,056 | 2,151 | 3,075 | ||||||||
| Tangible common equity | $ | 420,172 | $ | 354,613 | $ | 317,420 | |||||
| Total assets | $ | 5,289,225 | $ | 4,081,328 | $ | 3,608,483 | |||||
| Less: Goodwill | 117,345 | 30,334 | 30,334 | ||||||||
| Less: Intangible assets | 11,056 | 2,151 | 3,075 | ||||||||
| Tangible assets | $ | 5,160,824 | $ | 4,048,843 | $ | 3,575,074 | |||||
| Tangible common equity to tangible assets | 8.14 | % | 8.76 | % | 8.88 | % | |||||
| For the Years ended December 31, | |||||||||||||||||
| ($ in thousands) | 2021 | 2020 | 2019 | ||||||||||||||
| Average shareholder’s equity | $ | 1,277,153 | $ | 902,875 | $ | 795,477 | |||||||||||
| Less average preferred stock | 8,903 | — | — | ||||||||||||||
| Less average goodwill | 307,614 | 217,205 | 193,804 | ||||||||||||||
| Less average intangible assets | 22,460 | 23,551 | 24,957 | ||||||||||||||
| Average tangible common equity | $ | 938,176 | $ | 662,119 | $ | 576,716 | |||||||||||
| Net Income | $ | 133,055 | $ | 74,384 | $ | 92,739 | |||||||||||
| Return on average tangible common equity | 14.18 | % | 11.23 | % | 16.08 | % | |||||||||||
| For the Years ended December 31, | |||||||||||||||||
| ($ and shares in thousands) | 2021 | 2020 | 2019 | ||||||||||||||
| Tangible common equity (calculated above) | $ | 1,069,678 | $ | 795,324 | $ | 630,765 | |||||||||||
| Period end shares outstanding | 37,820 | 31,210 | 26,543 | ||||||||||||||
| Tangible book value per common share | $ | 28.28 | $ | 25.48 | $ | 23.76 | |||||||||||
| For the Years ended December 31, | |||||||||||
| ($ in thousands) | 2017 | 2016 | 2015 | ||||||||
| Total shareholders' equity | $ | 548,573 | $ | 387,098 | $ | 350,829 | |||||
| Less: Goodwill | 117,345 | 30,334 | 30,334 | ||||||||
| Less: Intangible assets, net of deferred tax liabilities | 6,661 | 800 | 759 | ||||||||
| Less: Unrealized gains (losses) | (3,818 | ) | (1,741 | ) | 218 | ||||||
| Plus: Other | 12 | 24 | 37 | ||||||||
| Common equity tier 1 capital | 428,397 | 357,729 | 319,555 | ||||||||
| Plus: Qualifying trust preferred securities | 67,600 | 55,100 | 55,100 | ||||||||
| Plus: Other | 48 | 36 | 23 | ||||||||
| Tier 1 capital | 496,045 | 412,865 | 374,678 | ||||||||
| Plus: Tier 2 capital | 93,002 | 93,484 | 43,691 | ||||||||
| Total risk-based capital | $ | 589,047 | $ | 506,349 | $ | 418,369 | |||||
| Total risk weighted assets determined in accordance with prescribed regulatory requirements | $ | 4,822,695 | $ | 3,757,160 | $ | 3,530,521 | |||||
| Common equity tier 1 to risk weighted assets | 8.88 | % | 9.52 | % | 9.05 | % | |||||
| Tier 1 capital to risk-weighted assets | 10.29 | % | 10.99 | % | 10.61 | % | |||||
| Total risk-based capital to risk-weighted assets | 12.21 | % | 13.48 | % | 11.85 | % | |||||
ITEM 7A: QUANTITATIVE AND QUALITATIVE DISCLOSURES ABOUT MARKET RISK
Please refer to “Risk Factors” included in Item 1A and “Risk Management” and "Interest“Interest Rate Risk"Risk” included in Management'sManagement’s Discussion and Analysis under Item 7.
58
ITEM 8: FINANCIAL STATEMENTS AND SUPPLEMENTARY DATA
Enterprise Financial Services Corp and Subsidiaries
| Page Number | |||||
| Report of Independent Registered Public Accounting Firm, PCAOB ID 34 | |||||
| Consolidated Balance Sheets at December 31, | |||||
| Consolidated Statements of Operations for the years ended December 31, | |||||
| Consolidated Statements of Comprehensive Income for the years ended December 31, | |||||
| Consolidated Statements of | |||||
| Consolidated Statements of Cash Flows for the years ended December 31, | |||||
| Notes to Consolidated Financial Statements | |||||
59
REPORT OF INDEPENDENT REGISTERED PUBLIC ACCOUNTING FIRM
To the shareholders and Board of Directors of
Enterprise Financial Services Corp
Opinion on the Consolidated Financial Statements
We have audited the accompanying consolidated balance sheets of Enterprise Financial Services Corp and subsidiaries (the "Company"“Company”) as of December 31, 20172021 and 2016, and2020, the related consolidated statements of operations, comprehensive income, shareholders'shareholders’ equity, and cash flows, for each of the three years in the period ended December 31, 20172021, and the related notes (collectively referred to as the "financial statements"“financial statements”). In our opinion, the consolidated financial statements present fairly, in all material respects, the financial position of the Company as of December 31, 20172021 and 2016,2020, and the results of its operations and its cash flows for each of the three years in the period ended December 31, 20172021, in conformity with accounting principles generally accepted in the United States of America.
We have also audited, in accordance with the standards of the Public Company Accounting Oversight Board (United States) (PCAOB), the Company'sCompany’s internal control over financial reporting as of December 31, 2017,2021, based on criteria established in Internal Control - Control—Integrated Framework (2013) issued by the Committee of Sponsoring Organizations of the Treadway Commission and our report dated February 23, 2018,25, 2022 expressed an unqualified opinion on the Company'sCompany’s internal control over financial reporting.
Change in Accounting Principles
As discussed in Note 1 to the financial statements, on January 1, 2020, the Company adopted ASU 2016-13 “Financial Instruments - Credit Losses (Topic 326): Measurement of Credit Losses on Financial Instruments,” applicable to financial assets measured at amortized cost including loan receivables and held to maturity debt securities.
Basis for Opinion
These consolidated financial statements are the responsibility of the Company'sCompany’s management. Our responsibility is to express an opinion on these consolidatedthe Company’s financial statements based on our audits. We are a public accounting firm registered with the Public Company Accounting Oversight Board (United States) (PCAOB)PCAOB and are required to be independent with respect to the Company in accordance with the U.S.US federal securities laws and the applicable rules and regulations of the Securities and Exchange Commission and the PCAOB.
We conducted our audits in accordance with the standards of the PCAOB. Those standards require that we plan and perform the audit to obtain reasonable assurance about whether the financial statements are free of material misstatement, whether due to error or fraud. Our audits included performing procedures to assess the risks of material misstatement of the financial statements, whether due to error or fraud, and performing procedures that respond to those risks. Such procedures included examining, on a test basis, evidence supportingregarding the amounts and disclosures in the financial statements. Our audits also included assessingevaluating the accounting principles used and significant estimates made by management, as well as evaluating the overall presentation of the financial statements. We believe that our audits provide a reasonable basis for our opinion.
Critical Audit Matters
The critical audit matters communicated below are matters arising from the current-period audit of the financial statements that were communicated or required to be communicated to the audit committee and that (1) relate to accounts or disclosures that are material to the financial statements and (2) involved our especially challenging, subjective, or complex judgments. The communication of critical audit matters does not alter in any way our opinion on the financial statements, taken as a whole, and we are not, by communicating the critical audit matters below, providing separate opinions on the critical audit matters or on the accounts or disclosures to which they relate.
60
Allowance for Credit Losses — Refer to Note 1 to the financial statements
Critical Audit Matter Description
The Company utilizes a discounted cash flow (“DCF”) method to measure the Allowance for Credit Losses (“ACL”) on loans collectively evaluated that are sub-segmented by credit risk levels. The DCF method incorporates assumptions for probability of default, loss given default, prepayments and curtailments over the contractual term of the loans. In determining the probability of default, the Company utilized a regression analysis to determine certain economic factors that are relevant loss drivers in the portfolio segments based on historical or peer evaluations such as unemployment or gross domestic product. Additionally, the Company applies qualitative adjustments to address risks not directly captured in the quantitative reserve; including to address macroeconomic uncertainty by weighting the forecasted baseline, upside, and downside economic factors.
We identified the allowance for credit losses as a critical audit matter because of the complexity of the Company’s model and the significant assumptions used by management. Auditing the allowance for credit losses required a high degree of auditor judgment and an increased extent of effort, including the need to involve credit specialists when performing audit procedures to evaluate the reasonableness of management’s models and assumptions.
How the Critical Audit Matter Was Addressed in the Audit
Our audit procedures related to the Company’s ACL included the following, among others:
a.We tested the design and operating effectiveness of management’s controls covering the key data, assumptions and judgments impacting the allowance for credit losses.
b.We evaluated the appropriateness of the Company’s accounting policies, methodologies, and elections involved in determining the allowance.
c.We involved credit specialists to assist us in evaluating the Company’s development of the CECL model, including the selection of and calibration to economic factors.
d.We assessed the reasonableness of the Company’s qualitative methodology, tested key calculations utilized within the qualitative estimate and agreed underlying data within the calculation to source documents.
Acquisition of First Choice Bancorp (“FCB”) – Valuation of Loans – Refer to Note 2 to the financial statements
Critical Audit Matter Description
On July 21, 2021, the Company closed its acquisition of 100% of First Choice Bancorp and its wholly-owned subsidiary, First Choice Bank. The value of the transaction consideration was approximately $346 million. The acquisition of FCB has been accounted for as a business combination using the acquisition method of accounting which requires assets acquired and liabilities assumed to be recognized at fair value as of the acquisition date. Goodwill arising from the acquisition consists largely of the synergies and economies of scale expected from combining the operations into the Company.
Given that the fair value determination of net assets, specifically the credit assumptions related to the acquired loan balance, required management to make significant estimates and assumptions related to the associated credit risk, performing audit procedures to evaluate the reasonableness of these estimates and assumptions required a high degree of auditor judgment and an increased extent of effort, including the need to involve our fair value specialists.
How the Critical Audit Matter Was Addressed in the Audit
Our audit procedures related to management’s determination of the credit risk associated with these loans included the following, among others:
•We tested the design and operating effectiveness of controls over the valuation of the acquired loans, including management’s controls over the determination of credit risk.
61
•With the assistance of our fair value specialists, we obtained an understanding and evaluated the reasonableness of the Company’s valuation methodology and assumptions.
•We compared the accuracy of the Company’s fair value pricing to the pricing independently developed by our fair value specialists.
/s/ Deloitte & Touche LLP
St. Louis, Missouri
February 23, 201825, 2022
We have served as the Company'sCompany’s auditor since 2010.
62
REPORT OF INDEPENDENT REGISTERED PUBLIC ACCOUNTING FIRM
To the shareholders and Board of Directors of
Enterprise Financial Services Corp
Opinion on Internal Control over Financial Reporting
We have audited the internal control over financial reporting of Enterprise Financial Services Corp and subsidiaries (the "Company"“Company”) as of December 31, 2017,2021, based on criteria established in Internal Control -— Integrated Framework (2013) issued by the Committee of Sponsoring Organizations of the Treadway Commission (COSO). In our opinion, the Company maintained, in all material respects, effective internal control over financial reporting as of December 31, 2017,2021, based on the criteria established in Internal Control -— Integrated Framework (2013)issued by COSO.
We have also audited, in accordance with the standards of the Public Company Accounting Oversight Board (United States) (PCAOB), the consolidated financial statements as of and for the year ended December 31, 20172021, of the Company and our report dated February 23, 201825, 2022, expressed an unqualified opinion on those consolidated financial statements.statements and included an explanatory paragraph regarding the Company’s adoption of accounting standard update (ASU) 2016-13 “Financial Instruments – Credit Losses (Topic 326): Measurement of Credit Losses on Financial Instruments”.
Basis for Opinion
The Company'sCompany’s management is responsible for maintaining effective internal control over financial reporting and for its assessment of the effectiveness of internal control over financial reporting, included in the accompanying Management'sManagement’s Assessment onof Internal Control over Financial Reporting. Our responsibility is to express an opinion on the Company'sCompany’s internal control over financial reporting based on our audit. We are a public accounting firm registered with the PCAOB and are required to be independent with respect to the Company in accordance with the U.S. federal securities laws and the applicable rules and regulations of the Securities and Exchange Commission and the PCAOB.
We conducted our audit in accordance with the standards of the PCAOB. Those standards require that we plan and perform the audit to obtain reasonable assurance about whether effective internal control over financial reporting was maintained in all material respects. Our audit included obtaining an understanding of internal control over financial reporting, assessing the risk that a material weakness exists, testing and evaluating the design and operating effectiveness of internal control based on the assessed risk, and performing such other procedures as we considered necessary in the circumstances. We believe that our audit provides a reasonable basis for our opinion.
Definition and Limitations of Internal Control over Financial Reporting
A company'scompany’s internal control over financial reporting is a process designed by, or under the supervision of, the company's principal executive and principal financial officers, or persons performing similar functions, and effected by the company's board of directors, management, and other personnel to provide reasonable assurance regarding the reliability of financial reporting and the preparation of financial statements for external purposes in accordance with generally accepted accounting principles. A company'scompany’s internal control over financial reporting includes those policies and procedures that (1) pertain to the maintenance of records that, in reasonable detail, accurately and fairly reflect the transactions and dispositions of the assets of the company; (2) provide reasonable assurance that transactions are recorded as necessary to permit preparation of financial statements in accordance with generally accepted accounting principles, and that receipts and expenditures of the company are being made only in accordance with authorizations of management and directors of the company; and (3) provide reasonable assurance regarding prevention or timely detection of unauthorized acquisition, use, or disposition of the company'scompany’s assets that could have a material effect on the financial statements.
Because of theits inherent limitations, internal control over financial reporting may not prevent or detect misstatements. Also, projections of any evaluation of the effectiveness of the internal control over financial reporting to future periods are subject to the risk that the controls may become inadequate because of changes in conditions, or that the degree of compliance with the policies or procedures may deteriorate.
/s/ Deloitte & Touche LLP
St. Louis, Missouri
February 23, 2018
25, 2022
63
ENTERPRISE FINANCIAL SERVICES CORP AND SUBSIDIARIES
Consolidated Balance Sheets
As of December 31, 20172021 and 20162020
| (in thousands, except share and per share data) | December 31, 2017 | December 31, 2016 | ||||||||||||||||
| ($ in thousands, except per share data) | ($ in thousands, except per share data) | December 31, 2021 | December 31, 2020 | |||||||||||||||
| Assets | Assets | |||||||||||||||||
| Cash and due from banks | $ | 91,084 | $ | 54,288 | Cash and due from banks | $ | 209,177 | $ | 99,760 | |||||||||
| Federal funds sold | 1,223 | 446 | Federal funds sold | 1,356 | 1,519 | |||||||||||||
| Interest-bearing deposits (including $1,365 and $675 pledged as collateral, respectively) | 61,016 | 144,068 | ||||||||||||||||
| Interest-earning deposits (including $14,595 and $36,525 pledged as collateral, respectively) | Interest-earning deposits (including $14,595 and $36,525 pledged as collateral, respectively) | 1,811,156 | 436,424 | |||||||||||||||
| Total cash and cash equivalents | 153,323 | 198,802 | Total cash and cash equivalents | 2,021,689 | 537,703 | |||||||||||||
| Interest-bearing deposits greater than 90 days | 2,645 | 980 | ||||||||||||||||
| Securities available for sale | 641,382 | 460,797 | ||||||||||||||||
| Securities held to maturity | 73,749 | 80,463 | ||||||||||||||||
| Loans held for sale | 3,155 | 9,562 | ||||||||||||||||
| Interest-earning deposits greater than 90 days | Interest-earning deposits greater than 90 days | 6,996 | 7,626 | |||||||||||||||
| Securities available-for-sale | Securities available-for-sale | 1,366,006 | 912,429 | |||||||||||||||
| Securities held-to-maturity, net | Securities held-to-maturity, net | 429,681 | 487,610 | |||||||||||||||
| Loans held-for-sale | Loans held-for-sale | 6,389 | 13,564 | |||||||||||||||
| Loans | 4,097,050 | 3,158,161 | Loans | 9,017,642 | 7,224,935 | |||||||||||||
| Less: Allowance for loan losses | 42,577 | 43,409 | ||||||||||||||||
| Allowance for credit losses on loans | Allowance for credit losses on loans | (145,041) | (136,671) | |||||||||||||||
| Total loans, net | 4,054,473 | 3,114,752 | Total loans, net | 8,872,601 | 7,088,264 | |||||||||||||
| Other real estate | 498 | 980 | ||||||||||||||||
| Other investments, at cost | 26,661 | 14,840 | ||||||||||||||||
| Other investments | Other investments | 59,896 | 48,764 | |||||||||||||||
| Fixed assets, net | 32,618 | 14,910 | Fixed assets, net | 47,915 | 53,169 | |||||||||||||
| Accrued interest receivable | 14,069 | 11,117 | ||||||||||||||||
| State tax credits, held for sale, including $400 and $3,585 carried at fair value, respectively | 43,468 | 38,071 | ||||||||||||||||
| Goodwill | 117,345 | 30,334 | Goodwill | 365,164 | 260,567 | |||||||||||||
| Intangible assets, net | 11,056 | 2,151 | Intangible assets, net | 22,286 | 23,084 | |||||||||||||
| Other assets | 114,783 | 103,569 | Other assets | 338,735 | 318,791 | |||||||||||||
| Total assets | $ | 5,289,225 | $ | 4,081,328 | Total assets | $ | 13,537,358 | $ | 9,751,571 | |||||||||
| Liabilities and Shareholders' equity | Liabilities and Shareholders' equity | |||||||||||||||||
| Demand deposits | $ | 1,123,907 | $ | 866,756 | ||||||||||||||
| Interest-bearing transaction accounts | 915,653 | 731,539 | ||||||||||||||||
| Noninterest-bearing demand accounts | Noninterest-bearing demand accounts | $ | 4,578,436 | $ | 2,711,828 | |||||||||||||
| Interest-bearing demand accounts | Interest-bearing demand accounts | 2,465,884 | 1,768,497 | |||||||||||||||
| Money market accounts | 1,342,931 | 1,050,472 | Money market accounts | 2,890,976 | 2,327,066 | |||||||||||||
| Savings | 195,150 | 111,435 | ||||||||||||||||
| Savings accounts | Savings accounts | 800,210 | 627,903 | |||||||||||||||
| Certificates of deposit: | Certificates of deposit: | |||||||||||||||||
| Brokered | 115,306 | 117,145 | Brokered | 128,970 | 50,209 | |||||||||||||
| Other | 463,467 | 356,014 | Other | 479,323 | 499,886 | |||||||||||||
| Total deposits | 4,156,414 | 3,233,361 | Total deposits | 11,343,799 | 7,985,389 | |||||||||||||
| Subordinated debentures and notes (net of debt issuance cost of $1,136 and $1,267, respectively) | 118,105 | 105,540 | ||||||||||||||||
| Federal Home Loan Bank advances | 172,743 | — | ||||||||||||||||
| Subordinated debentures and notes | Subordinated debentures and notes | 154,899 | 203,637 | |||||||||||||||
| FHLB advances | FHLB advances | 50,000 | 50,000 | |||||||||||||||
| Other borrowings | 253,674 | 276,980 | Other borrowings | 353,863 | 301,081 | |||||||||||||
| Accrued interest payable | 1,730 | 1,105 | ||||||||||||||||
| Other liabilities | 37,986 | 77,244 | Other liabilities | 105,681 | 132,489 | |||||||||||||
| Total liabilities | 4,740,652 | 3,694,230 | Total liabilities | 12,008,242 | 8,672,596 | |||||||||||||
| Commitments and contingent liabilities (Note 18) | Commitments and contingent liabilities (Note 18) | |||||||||||||||||
| Shareholders' equity: | Shareholders' equity: | |||||||||||||||||
| Preferred stock, $0.01 par value; 5,000,000 shares authorized; 0 shares issued and outstanding | — | — | ||||||||||||||||
| Common stock, $0.01 par value; 30,000,000 shares authorized; 23,781,112 and 20,306,353 shares issued, respectively | 238 | 203 | ||||||||||||||||
Treasury stock, at cost; 691,673 and 261,718 shares, respectively | (23,268 | ) | (6,632 | ) | ||||||||||||||
| Preferred stock, $0.01 par value; 5,000,000 shares authorized; 75,000 and 0 shares issued and outstanding, respectively ($1,000 per share liquidation preference) | Preferred stock, $0.01 par value; 5,000,000 shares authorized; 75,000 and 0 shares issued and outstanding, respectively ($1,000 per share liquidation preference) | 71,988 | — | |||||||||||||||
| Common stock, $0.01 par value; 75,000,000 and 45,000,000 shares authorized; 39,799,615 and 33,190,306 shares issued, respectively | Common stock, $0.01 par value; 75,000,000 and 45,000,000 shares authorized; 39,799,615 and 33,190,306 shares issued, respectively | 398 | 332 | |||||||||||||||
| Treasury stock, at cost; 1,980,093 shares | Treasury stock, at cost; 1,980,093 shares | (73,528) | (73,528) | |||||||||||||||
| Additional paid in capital | 350,061 | 213,078 | Additional paid in capital | 1,018,799 | 697,839 | |||||||||||||
| Retained earnings | 225,360 | 182,190 | Retained earnings | 492,682 | 417,212 | |||||||||||||
| Accumulated other comprehensive loss | (3,818 | ) | (1,741 | ) | ||||||||||||||
| Accumulated other comprehensive income | Accumulated other comprehensive income | 18,777 | 37,120 | |||||||||||||||
| Total shareholders' equity | 548,573 | 387,098 | Total shareholders' equity | 1,529,116 | 1,078,975 | |||||||||||||
| Total liabilities and shareholders' equity | $ | 5,289,225 | $ | 4,081,328 | Total liabilities and shareholders' equity | $ | 13,537,358 | $ | 9,751,571 | |||||||||
See accompanying notes to consolidated financial statements.
64
ENTERPRISE FINANCIAL SERVICES CORP AND SUBSIDIARIES
Consolidated Statements of Operations
Years ended December 31, 2017, 2016,2021, 2020, and 20152019
| Year ended December 31, | |||||||||||||||||
| ($ in thousands, except per share data) | 2021 | 2020 | 2019 | ||||||||||||||
| Interest income: | |||||||||||||||||
| Loans | $ | 348,615 | $ | 270,238 | $ | 269,406 | |||||||||||
| Debt securities: | |||||||||||||||||
| Taxable | 18,030 | 24,629 | 29,030 | ||||||||||||||
| Nontaxable | 13,814 | 8,397 | 3,515 | ||||||||||||||
| Interest-earning deposits | 1,496 | 620 | 2,128 | ||||||||||||||
| Dividends on equity securities | 1,275 | 895 | 1,055 | ||||||||||||||
| Total interest income | 383,230 | 304,779 | 305,134 | ||||||||||||||
| Interest expense: | |||||||||||||||||
| Deposits | 10,668 | 21,049 | 49,856 | ||||||||||||||
| Subordinated debentures and notes | 10,960 | 9,885 | 7,507 | ||||||||||||||
| FHLB advances | 803 | 2,673 | 6,668 | ||||||||||||||
| Other borrowings | 605 | 1,171 | 2,386 | ||||||||||||||
| Total interest expense | 23,036 | 34,778 | 66,417 | ||||||||||||||
| Net interest income | 360,194 | 270,001 | 238,717 | ||||||||||||||
| Provision for credit losses | 13,385 | 65,398 | 6,372 | ||||||||||||||
| Net interest income after provision for credit losses | 346,809 | 204,603 | 232,345 | ||||||||||||||
| Noninterest income: | |||||||||||||||||
| Service charges on deposit accounts | 15,428 | 11,717 | 12,801 | ||||||||||||||
| Wealth management revenue | 10,259 | 9,732 | 9,932 | ||||||||||||||
| Card services revenue | 11,880 | 9,481 | 9,154 | ||||||||||||||
| Tax credit income | 8,028 | 6,611 | 5,393 | ||||||||||||||
| Miscellaneous income | 22,148 | 16,962 | 11,896 | ||||||||||||||
| Total noninterest income | 67,743 | 54,503 | 49,176 | ||||||||||||||
| Noninterest expense: | |||||||||||||||||
| Employee compensation and benefits | 124,904 | 92,288 | 81,295 | ||||||||||||||
| Occupancy | 16,286 | 13,457 | 12,465 | ||||||||||||||
| Data processing | 12,242 | 9,050 | 8,242 | ||||||||||||||
| Professional fees | 4,289 | 3,940 | 3,683 | ||||||||||||||
| Branch-closure expenses | 3,441 | — | — | ||||||||||||||
| Merger-related expenses | 22,082 | 4,174 | 17,969 | ||||||||||||||
| Other | 62,675 | 44,250 | 41,831 | ||||||||||||||
| Total noninterest expense | 245,919 | 167,159 | 165,485 | ||||||||||||||
| Income before income tax expense | 168,633 | 91,947 | 116,036 | ||||||||||||||
| Income tax expense | 35,578 | 17,563 | 23,297 | ||||||||||||||
| Net income | $ | 133,055 | $ | 74,384 | $ | 92,739 | |||||||||||
| Earnings per common share | |||||||||||||||||
| Basic | $ | 3.86 | $ | 2.76 | $ | 3.56 | |||||||||||
| Diluted | 3.86 | 2.76 | 3.55 | ||||||||||||||
| Years ended December 31, | |||||||||||
| (in thousands, except per share data) | 2017 | 2016 | 2015 | ||||||||
| Interest income: | |||||||||||
| Interest and fees on loans | 185,452 | 137,738 | 122,370 | ||||||||
| Interest on debt securities: | |||||||||||
| Taxable | 14,551 | 9,590 | 8,842 | ||||||||
| Nontaxable | 1,283 | 1,300 | 1,215 | ||||||||
| Interest on interest-bearing deposits | 804 | 370 | 211 | ||||||||
| Dividends on equity securities | 449 | 226 | 141 | ||||||||
| Total interest income | 202,539 | 149,224 | 132,779 | ||||||||
| Interest expense: | |||||||||||
| Interest-bearing transaction accounts | 2,195 | 1,370 | 1,149 | ||||||||
| Money market accounts | 8,708 | 4,439 | 2,993 | ||||||||
| Savings accounts | 459 | 262 | 219 | ||||||||
| Certificates of deposit | 5,838 | 4,770 | 6,051 | ||||||||
| Subordinated debentures and notes | 5,095 | 1,894 | 1,248 | ||||||||
| Federal Home Loan Bank advances | 2,356 | 555 | 127 | ||||||||
| Notes payable and other borrowings | 584 | 439 | 582 | ||||||||
| Total interest expense | 25,235 | 13,729 | 12,369 | ||||||||
| Net interest income | 177,304 | 135,495 | 120,410 | ||||||||
| Provision for portfolio loan losses | 10,764 | 5,551 | 4,872 | ||||||||
| Provision reversal for purchased credit impaired loan losses | (634 | ) | (1,946 | ) | (4,414 | ) | |||||
| Net interest income after provision for loan losses | 167,174 | 131,890 | 119,952 | ||||||||
| Noninterest income: | |||||||||||
| Service charges on deposit accounts | 11,043 | 8,615 | 7,923 | ||||||||
| Wealth management revenue | 8,102 | 6,729 | 7,007 | ||||||||
| Card services revenue | 5,433 | 3,130 | 2,496 | ||||||||
| Gain on state tax credits, net | 2,581 | 2,647 | 2,720 | ||||||||
| Gain on sale of other real estate | 93 | 1,837 | 142 | ||||||||
| Gain on sale of investment securities | 22 | 86 | 23 | ||||||||
| Change in FDIC loss share receivable | — | — | (5,030 | ) | |||||||
| Miscellaneous income | 7,120 | 6,015 | 5,394 | ||||||||
| Total noninterest income | 34,394 | 29,059 | 20,675 | ||||||||
| Noninterest expense: | |||||||||||
| Employee compensation and benefits | 61,388 | 49,846 | 46,095 | ||||||||
| Occupancy | 9,057 | 6,889 | 6,573 | ||||||||
| Data processing | 6,272 | 4,723 | 4,339 | ||||||||
| Professional fees | 3,813 | 3,825 | 3,465 | ||||||||
| FDIC and other insurance | 3,194 | 3,018 | 2,790 | ||||||||
| Loan legal and other real estate expense | 2,220 | 1,635 | 1,812 | ||||||||
| FDIC loss share termination | — | — | 2,436 | ||||||||
| FDIC clawback | — | — | 760 | ||||||||
| Merger related expenses | 6,462 | 1,386 | — | ||||||||
| Other | 22,645 | 14,788 | 13,956 | ||||||||
| Total noninterest expense | 115,051 | 86,110 | 82,226 | ||||||||
| Income before income tax expense | 86,517 | 74,839 | 58,401 | ||||||||
| Income tax expense | 38,327 | 26,002 | 19,951 | ||||||||
| Net income | $ | 48,190 | $ | 48,837 | $ | 38,450 | |||||
| Earnings per common share | |||||||||||
| Basic | $ | 2.10 | $ | 2.44 | $ | 1.92 | |||||
| Diluted | 2.07 | 2.41 | 1.89 | ||||||||
See accompanying notes to consolidated financial statements.
65
ENTERPRISE FINANCIAL SERVICES CORP AND SUBSIDIARIES
Consolidated Statements of Comprehensive Income
Years ended December 31, 2017, 2016,2021, 2020, and 20152019
| Year ended December 31, | |||||||||||||||||
| ($ in thousands) | 2021 | 2020 | 2019 | ||||||||||||||
| Net income | $ | 133,055 | $ | 74,384 | $ | 92,739 | |||||||||||
| Other comprehensive income (loss), net of tax: | |||||||||||||||||
| Change in unrealized gain (loss) on available-for-sale debt securities | (17,049) | 23,944 | 29,189 | ||||||||||||||
| Reclassification adjustment for realized (gain) loss on the sale of available-for-sale debt securities | — | (317) | 37 | ||||||||||||||
| Reclassification of gain on held-to-maturity securities | (3,624) | (1,910) | (33) | ||||||||||||||
| Change in unrealized gain (loss) on cash flow hedges arising during the period | 1,161 | (5,947) | (2,262) | ||||||||||||||
| Reclassification of loss on cash flow hedges | 1,169 | 3,601 | 100 | ||||||||||||||
| Other comprehensive income (loss), net | (18,343) | 19,371 | 27,031 | ||||||||||||||
| Total comprehensive income | $ | 114,712 | $ | 93,755 | $ | 119,770 | |||||||||||
| Years ended December 31, | |||||||||||
| (in thousands) | 2017 | 2016 | 2015 | ||||||||
| Net income | $ | 48,190 | $ | 48,837 | $ | 38,450 | |||||
| Other comprehensive loss, net of tax: | |||||||||||
| Unrealized losses on investment securities arising during the period, net of income tax benefit of $1,265, $1,168, and $899, respectively | (2,064 | ) | (1,906 | ) | (1,449 | ) | |||||
| Less: Reclassification adjustment for realized gains on sale of securities available for sale included in net income, net of income tax expense of $9, $33, and $9, respectively | (13 | ) | (53 | ) | (14 | ) | |||||
| Total other comprehensive loss | (2,077 | ) | (1,959 | ) | (1,463 | ) | |||||
| Total comprehensive income | $ | 46,113 | $ | 46,878 | $ | 36,987 | |||||
See accompanying notes to consolidated financial statements.
66
ENTERPRISE FINANCIAL SERVICES CORP AND SUBSIDIARIES
Consolidated Statements of Shareholders’ Equity
Years ended December 31, 2017, 2016,2021, 2020, and 20152019
| ($ in thousands, except per share data) | Preferred Stock | Common Stock | Treasury Stock | Additional paid in capital | Retained earnings | Accumulated other comprehensive income (loss) | Total shareholders’ equity | ||||||||||||||||||||||||||||||||||||||||
| Balance December 31, 2018 | $ | — | $ | 239 | $ | (42,655) | $ | 350,936 | $ | 304,566 | $ | (9,282) | $ | 603,804 | |||||||||||||||||||||||||||||||||
| Net income | $ | — | $ | — | $ | — | $ | — | $ | 92,739 | $ | — | $ | 92,739 | |||||||||||||||||||||||||||||||||
| Other comprehensive loss, net | — | — | — | — | — | 27,031 | 27,031 | ||||||||||||||||||||||||||||||||||||||||
| Cash dividends paid on common shares, $0.62 per share | — | — | — | — | (16,568) | — | (16,568) | ||||||||||||||||||||||||||||||||||||||||
| Repurchase of common shares, 396,737 shares | — | — | (15,526) | — | — | — | (15,526) | ||||||||||||||||||||||||||||||||||||||||
| Issuance under equity compensation plans, 137,271 shares, net | — | 2 | — | (214) | — | — | (212) | ||||||||||||||||||||||||||||||||||||||||
| Shares issued in connection with acquisition of Trinity Capital Corporation, 3,990,822 shares | 40 | — | 171,845 | — | — | 171,885 | |||||||||||||||||||||||||||||||||||||||||
| Share-based compensation | — | — | — | 4,032 | — | — | 4,032 | ||||||||||||||||||||||||||||||||||||||||
| Balance December 31, 2019 | $ | — | $ | 281 | $ | (58,181) | $ | 526,599 | $ | 380,737 | $ | 17,749 | $ | 867,185 | |||||||||||||||||||||||||||||||||
| Net income | $ | — | $ | — | $ | — | $ | — | $ | 74,384 | $ | — | $ | 74,384 | |||||||||||||||||||||||||||||||||
| Other comprehensive income, net | — | — | — | — | — | 19,371 | 19,371 | ||||||||||||||||||||||||||||||||||||||||
| Cash dividends paid on common shares, $0.72 per share | — | — | — | — | (19,795) | — | (19,795) | ||||||||||||||||||||||||||||||||||||||||
| Repurchase of common shares, 456,251 shares | — | — | (15,347) | — | — | — | (15,347) | ||||||||||||||||||||||||||||||||||||||||
| Issuance under equity compensation plans, 146,005 shares, net | — | 1 | — | 77 | — | — | 78 | ||||||||||||||||||||||||||||||||||||||||
| Shares issued in connection with acquisition of Seacoast Commerce Banc Holdings, 4,977,214 shares | — | 50 | — | 166,985 | — | — | 167,035 | ||||||||||||||||||||||||||||||||||||||||
| Share-based compensation | — | — | — | 4,178 | — | — | 4,178 | ||||||||||||||||||||||||||||||||||||||||
| Reclassification for the adoption of ASU 2016-13 (CECL) | — | — | — | (18,114) | — | (18,114) | |||||||||||||||||||||||||||||||||||||||||
| Balance December 31, 2020 | $ | — | $ | 332 | $ | (73,528) | $ | 697,839 | $ | 417,212 | $ | 37,120 | $ | 1,078,975 | |||||||||||||||||||||||||||||||||
| Net income | $ | — | $ | — | $ | — | $ | — | $ | 133,055 | $ | — | $ | 133,055 | |||||||||||||||||||||||||||||||||
| Other comprehensive loss, net | — | — | — | — | — | (18,343) | (18,343) | ||||||||||||||||||||||||||||||||||||||||
| Cash dividends paid on common shares, $0.75 per share | — | — | — | — | (26,153) | — | (26,153) | ||||||||||||||||||||||||||||||||||||||||
| Repurchase of common shares, 1,299,527 shares | — | (12) | — | (30,518) | (30,059) | — | (60,589) | ||||||||||||||||||||||||||||||||||||||||
| Issuance under equity compensation plans, 131,564 shares, net | — | — | — | 2,549 | (663) | — | 1,886 | ||||||||||||||||||||||||||||||||||||||||
| Shares issued in connection with acquisition of First Choice Bancorp, 7,777,272 shares, net (gross issuance 7,808,459 shares) | — | 78 | — | 342,912 | (710) | — | 342,280 | ||||||||||||||||||||||||||||||||||||||||
| Preferred stock issuance, net of $3,012 issuance cost | 71,988 | — | — | — | — | — | 71,988 | ||||||||||||||||||||||||||||||||||||||||
| Share-based compensation | — | — | — | 6,017 | — | — | 6,017 | ||||||||||||||||||||||||||||||||||||||||
| Balance December 31, 2021 | $ | 71,988 | $ | 398 | $ | (73,528) | $ | 1,018,799 | $ | 492,682 | $ | 18,777 | $ | 1,529,116 | |||||||||||||||||||||||||||||||||
| ($ in thousands, except per share data) | Common Stock | Treasury Stock | Additional paid in capital | Retained earnings | Accumulated other comprehensive income (loss) | Total shareholders' equity | |||||||||||||||||
| Balance December 31, 2014 | $ | 199 | $ | (1,743 | ) | $ | 207,731 | $ | 108,373 | $ | 1,681 | $ | 316,241 | ||||||||||
| Net income | — | — | — | 38,450 | — | 38,450 | |||||||||||||||||
| Other comprehensive loss | — | — | — | — | (1,463 | ) | (1,463 | ) | |||||||||||||||
| Cash dividends paid on common shares, $0.2625 per share | — | — | — | (5,259 | ) | — | (5,259 | ) | |||||||||||||||
| Issuance under equity compensation plans, 179,600 shares, net | 2 | — | (1,192 | ) | — | — | (1,190 | ) | |||||||||||||||
| Share-based compensation | — | — | 3,601 | — | — | 3,601 | |||||||||||||||||
| Excess tax benefit related to equity compensation plans | — | — | 449 | — | — | 449 | |||||||||||||||||
| Balance December 31, 2015 | $ | 201 | $ | (1,743 | ) | $ | 210,589 | $ | 141,564 | $ | 218 | $ | 350,829 | ||||||||||
| Net income | — | — | — | 48,837 | — | 48,837 | |||||||||||||||||
| Other comprehensive loss | — | — | — | — | (1,959 | ) | (1,959 | ) | |||||||||||||||
| Cash dividends paid on common shares, $0.41 per share | — | — | — | (8,211 | ) | — | (8,211 | ) | |||||||||||||||
| Repurchase of common shares | — | (4,889 | ) | — | — | — | (4,889 | ) | |||||||||||||||
| Issuance under equity compensation plans, 213,234 shares, net | 2 | — | (2,205 | ) | — | — | (2,203 | ) | |||||||||||||||
| Share-based compensation | — | — | 3,367 | — | — | 3,367 | |||||||||||||||||
| Excess tax benefit related to equity compensation plans | — | — | 1,327 | — | — | 1,327 | |||||||||||||||||
| Balance December 31, 2016 | $ | 203 | $ | (6,632 | ) | $ | 213,078 | $ | 182,190 | $ | (1,741 | ) | $ | 387,098 | |||||||||
| Net income | — | — | — | 48,190 | — | 48,190 | |||||||||||||||||
| Other comprehensive loss | — | — | — | — | (2,077 | ) | (2,077 | ) | |||||||||||||||
| Cash dividends paid on common shares, $0.44 per share | — | — | — | (10,249 | ) | — | (10,249 | ) | |||||||||||||||
| Repurchase of common shares | — | (16,636 | ) | — | — | — | (16,636 | ) | |||||||||||||||
| Issuance under equity compensation plans, 174,895 shares, net | 2 | — | (2,911 | ) | — | — | (2,909 | ) | |||||||||||||||
| Shares issued in connection with acquisition of Jefferson County Bancshares, Inc., 3,299,865 shares, net | 33 | — | 141,696 | — | — | 141,729 | |||||||||||||||||
| Share-based compensation | — | — | 3,427 | — | — | 3,427 | |||||||||||||||||
| Reclassification for the adoption of share-based payment guidance | — | — | (5,229 | ) | 5,229 | — | — | ||||||||||||||||
| Balance December 31, 2017 | $ | 238 | $ | (23,268 | ) | $ | 350,061 | $ | 225,360 | $ | (3,818 | ) | $ | 548,573 | |||||||||
See accompanying notes to consolidated financial statements.
67
ENTERPRISE FINANCIAL SERVICES CORP AND SUBSIDIARIES
Consolidated Statements of Cash Flows
Years ended December 31, 2017, 2016,2021, 2020, and 20152019
| Year ended December 31, | |||||||||||||||||
| ($ in thousands) | 2021 | 2020 | 2019 | ||||||||||||||
| Cash flows from operating activities: | |||||||||||||||||
| Net income | $ | 133,055 | $ | 74,384 | $ | 92,739 | |||||||||||
| Adjustments to reconcile net income to net cash provided by operating activities: | |||||||||||||||||
| Depreciation | 6,147 | 6,152 | 5,719 | ||||||||||||||
| Provision for credit losses | 13,385 | 65,398 | 6,372 | ||||||||||||||
| Deferred income taxes | 545 | (12,578) | 5,800 | ||||||||||||||
| Net amortization of debt securities | 7,343 | 6,745 | 2,973 | ||||||||||||||
| Net accretion of loan discount | (1,140) | (7,767) | (10,494) | ||||||||||||||
| Amortization of intangible assets | 5,690 | 5,673 | 5,543 | ||||||||||||||
| Amortization of servicing assets | 2,311 | 37 | — | ||||||||||||||
| Mortgage loans originated-for-sale | (159,670) | (223,094) | (81,941) | ||||||||||||||
| Proceeds from mortgage loans sold | 163,864 | 217,934 | 77,302 | ||||||||||||||
| Loss (gain) on: | |||||||||||||||||
| Sale of investment securities | — | (421) | 49 | ||||||||||||||
| Sale of other real estate | (931) | 13 | (113) | ||||||||||||||
| Sale of state tax credits | (2,220) | (2,016) | (2,549) | ||||||||||||||
| Asset impairment | 3,441 | — | — | ||||||||||||||
| Share-based compensation | 6,017 | 4,178 | 4,032 | ||||||||||||||
| Changes in other assets and liabilities, net | (17,262) | 876 | (12,975) | ||||||||||||||
| Net cash provided by operating activities | 160,575 | 135,514 | 92,457 | ||||||||||||||
| Cash flows from investing activities: | |||||||||||||||||
| Acquisition cash purchase price, net of cash and cash equivalents acquired | 212,642 | 62,114 | (23,377) | ||||||||||||||
| Net decrease (increase) in loans | 138,455 | (700,096) | (284,235) | ||||||||||||||
| Proceeds received from: | |||||||||||||||||
| Sale of debt securities, available-for-sale | 27,135 | 20,221 | 357,976 | ||||||||||||||
| Paydown or maturity of debt securities, available-for-sale | 306,360 | 329,350 | 146,132 | ||||||||||||||
| Paydown or maturity of debt securities, held-to-maturity | 49,947 | 41,377 | 7,447 | ||||||||||||||
| Redemption of other investments | 18,159 | 43,555 | 61,917 | ||||||||||||||
| Sale of state tax credits held-for-sale | 18,507 | 14,252 | 14,689 | ||||||||||||||
| Sale of other real estate | 5,915 | 652 | 4,798 | ||||||||||||||
| Settlement of bank-owned life insurance policies | — | 1,993 | — | ||||||||||||||
| Payments for the purchase of: | |||||||||||||||||
| Available-for-sale debt securities | (779,481) | (452,541) | (577,211) | ||||||||||||||
| Other investments | (9,564) | (50,421) | (68,963) | ||||||||||||||
| State tax credits held-for-sale | (8,689) | (11,026) | (11,356) | ||||||||||||||
| Fixed assets | (2,500) | (2,259) | (6,337) | ||||||||||||||
| Net cash used in investing activities | (23,114) | (702,829) | (378,520) | ||||||||||||||
68
| Years ended December 31, | |||||||||||
| (in thousands) | 2017 | 2016 | 2015 | ||||||||
| Cash flows from operating activities: | |||||||||||
| Net income | $ | 48,190 | $ | 48,837 | $ | 38,450 | |||||
| Adjustments to reconcile net income to net cash provided by operating activities: | |||||||||||
| Depreciation | 3,281 | 2,428 | 2,022 | ||||||||
| Provision for loan losses | 10,130 | 3,605 | 458 | ||||||||
| Deferred income taxes | 21,105 | 7,263 | (5,763 | ) | |||||||
| Net amortization of debt securities | 2,415 | 3,225 | 3,256 | ||||||||
| Amortization of intangible assets | 2,609 | 924 | 1,089 | ||||||||
| Gain on sale of investment securities | (22 | ) | (86 | ) | (23 | ) | |||||
| Mortgage loans originated for sale | (138,949 | ) | (157,129 | ) | (135,721 | ) | |||||
| Proceeds from mortgage loans sold | 145,836 | 154,993 | 133,552 | ||||||||
| Gain on sale of other real estate | (93 | ) | (1,837 | ) | (142 | ) | |||||
| Gain on state tax credits, net | (2,581 | ) | (2,647 | ) | (2,720 | ) | |||||
| Excess tax benefit of share-based compensation | — | (1,327 | ) | (449 | ) | ||||||
| Share-based compensation | 3,427 | 3,367 | 3,601 | ||||||||
| Net accretion of loan discount and indemnification asset | (5,609 | ) | (11,057 | ) | (7,805 | ) | |||||
| Changes in: | |||||||||||
| Accrued interest receivable | (158 | ) | (2,718 | ) | (443 | ) | |||||
| Accrued interest payable | (27 | ) | 476 | (214 | ) | ||||||
| Other assets | 506 | (7,739 | ) | 10,457 | |||||||
| Other liabilities | (44,269 | ) | 41,943 | 7,582 | |||||||
| Net cash provided by operating activities | 45,791 | 82,521 | 47,187 | ||||||||
| Cash flows from investing activities: | |||||||||||
| Proceeds from JCB acquisition, net of cash purchase price | 4,456 | — | — | ||||||||
| Net increase in loans | (270,090 | ) | (328,023 | ) | (290,326 | ) | |||||
| Net cash proceeds received from FDIC loss share receivable | — | — | 2,275 | ||||||||
| Proceeds from the termination of FDIC loss share agreements | — | — | 1,253 | ||||||||
| Proceeds from the sale of debt securities, available for sale | 144,076 | 2,493 | 41,069 | ||||||||
| Proceeds from the paydown or maturity of debt securities, available for sale | 143,949 | 63,502 | 53,733 | ||||||||
| Proceeds from the paydown or maturity of debt securities, held to maturity | 6,510 | 3,655 | 2,284 | ||||||||
| Proceeds from the redemption of other investments | 43,207 | 52,279 | 39,929 | ||||||||
| Proceeds from the sale of state tax credits held for sale | 15,314 | 18,757 | 16,337 | ||||||||
| Proceeds from the sale of other real estate | 2,779 | 11,346 | 7,378 | ||||||||
| Payments for the purchase of: | |||||||||||
| Available for sale debt securities | (325,393 | ) | (81,195 | ) | (152,044 | ) | |||||
| Held to maturity debt securities | — | (40,529 | ) | — | |||||||
| Other investments | (56,412 | ) | (49,645 | ) | (36,046 | ) | |||||
| State tax credits held for sale | (18,294 | ) | (8,201 | ) | (20,981 | ) | |||||
| Fixed assets | (2,546 | ) | (2,496 | ) | (2,111 | ) | |||||
| Net cash used in investing activities | (312,444 | ) | (358,057 | ) | (337,250 | ) | |||||
| Year ended December 31, | |||||||||||||||||
| ($ in thousands) | 2021 | 2020 | 2019 | ||||||||||||||
| Cash flows from financing activities: | |||||||||||||||||
| Net increase in noninterest-bearing deposit accounts | $ | 869,203 | $ | 627,756 | $ | 57,551 | |||||||||||
| Net increase in interest-bearing deposit accounts | 648,778 | 505,604 | 44,300 | ||||||||||||||
| Proceeds from the issuance of subordinated notes | — | 61,953 | — | ||||||||||||||
| Payments for the redemption of subordinated notes | (50,000) | — | — | ||||||||||||||
| Proceeds (repayments) from short-term FHLB advances, net | (160,000) | (172,300) | 95,500 | ||||||||||||||
| Proceeds from long-term FHLB advances | — | — | 50,000 | ||||||||||||||
| Repayment of PPPLF advances | — | (86,096) | — | ||||||||||||||
| Proceeds from notes payable | — | — | 41,000 | ||||||||||||||
| Repayments of notes payable | (7,143) | (4,286) | (8,714) | ||||||||||||||
| Net increase in other borrowings | 59,925 | 40,195 | 9,436 | ||||||||||||||
| Cash dividends paid on common stock | (26,153) | (19,795) | (16,568) | ||||||||||||||
| Repurchase of common stock | (60,589) | (15,347) | (15,526) | ||||||||||||||
| Proceeds from issuance of preferred stock, net | 71,988 | — | — | ||||||||||||||
| Other, net | 516 | 78 | (212) | ||||||||||||||
| Net cash provided by financing activities | 1,346,525 | 937,762 | 256,767 | ||||||||||||||
| Net increase (decrease) in cash and cash equivalents | 1,483,986 | 370,447 | (29,296) | ||||||||||||||
| Cash and cash equivalents, beginning of period | 537,703 | 167,256 | 196,552 | ||||||||||||||
| Cash and cash equivalents, end of period | $ | 2,021,689 | $ | 537,703 | $ | 167,256 | |||||||||||
| Supplemental disclosures of cash flow information: | |||||||||||||||||
| Cash paid during the period for: | |||||||||||||||||
| Interest | $ | 23,957 | $ | 35,423 | $ | 65,667 | |||||||||||
| Income taxes | 56,845 | 7,514 | 13,582 | ||||||||||||||
| Noncash investing and financing transactions: | |||||||||||||||||
| Transfer to other real estate owned in settlement of loans | $ | 3,227 | $ | 798 | $ | 8,148 | |||||||||||
| Sales of other real estate financed | 228 | 48 | 621 | ||||||||||||||
| Transfer of securities from available-for-sale to held-to-maturity | — | 352,665 | 116,303 | ||||||||||||||
| Transfer to loans from fixed assets for deconsolidation of partnership | — | 3,336 | — | ||||||||||||||
| Right-of-use assets obtained in exchange for lease obligations | 5,658 | 1,623 | 5,208 | ||||||||||||||
| Common shares issued in connection with acquisitions | 343,650 | 167,035 | 171,885 | ||||||||||||||
| Years ended December 31, | |||||||||||
| (in thousands) | 2017 | 2016 | 2015 | ||||||||
| Cash flows from financing activities: | |||||||||||
| Net increase in noninterest-bearing deposit accounts | 96,681 | 149,296 | 74,530 | ||||||||
| Net increase in interest-bearing deposit accounts | 61,204 | 299,474 | 218,551 | ||||||||
| Proceeds from the issuance of subordinated notes | — | 48,733 | — | ||||||||
| Proceeds from Federal Home Loan Bank advances | 1,716,500 | 1,357,000 | 945,900 | ||||||||
| Repayments of Federal Home Loan Bank advances | (1,544,000 | ) | (1,467,000 | ) | (979,900 | ) | |||||
| Proceeds from notes payable | 10,000 | — | — | ||||||||
| Repayments of notes payable | (10,000 | ) | — | (5,700 | ) | ||||||
| Net increase (decrease) in other borrowings | (79,417 | ) | 6,654 | 36,143 | |||||||
| Cash dividends paid on common stock | (10,249 | ) | (8,211 | ) | (5,259 | ) | |||||
| Excess tax benefit of share-based compensation | — | 1,327 | 449 | ||||||||
| Repurchase of common stock | (16,636 | ) | (4,889 | ) | — | ||||||
| Payments for the issuance of equity instruments, net | (2,909 | ) | (2,203 | ) | (1,190 | ) | |||||
| Net cash provided by financing activities | 221,174 | 380,181 | 283,524 | ||||||||
| Net increase (decrease) in cash and cash equivalents | (45,479 | ) | 104,645 | (6,539 | ) | ||||||
| Cash and cash equivalents, beginning of period | 198,802 | 94,157 | 100,696 | ||||||||
| Cash and cash equivalents, end of period | $ | 153,323 | $ | 198,802 | $ | 94,157 | |||||
| Supplemental disclosures of cash flow information: | |||||||||||
| Cash paid during the period for: | |||||||||||
| Interest | $ | 24,610 | $ | 13,253 | $ | 12,583 | |||||
| Income taxes | 12,449 | 26,039 | 15,763 | ||||||||
| Noncash transactions: | |||||||||||
| Transfer to other real estate owned in settlement of loans | $ | 564 | $ | 2,743 | $ | 8,248 | |||||
| Sales of other real estate financed | — | 140 | — | ||||||||
| Common shares issued in connection with JCB acquisition | 141,729 | — | — | ||||||||
See accompanying notes to consolidated financial statements.
69
ENTERPRISE FINANCIAL SERVICES CORP AND SUBSIDIARIES
Notes to Consolidated Financial Statements
NOTE 1 - SUMMARY OF SIGNIFICANT ACCOUNTING POLICIES
The significant accounting policies used by the Company in the preparation of the consolidated financial statements are summarized below.
Business and Consolidation
Enterprise Financial Services Corp and subsidiaries (the “Company” or “Enterprise”) is a financial holding company that provides a full range of banking and wealth management services to individuals and corporate customers primarily located in the St. Louis,Arizona, California, Kansas, City,Missouri, Nevada, and Phoenix metropolitanNew Mexico markets through its banking subsidiary, Enterprise Bank & Trust (the “Bank”). The consolidated financial statements include the accounts of the Company, and its subsidiaries, all of which are wholly owned.Trust. All intercompany accounts and transactions have been eliminated.
The Company is subject to competition from other financial and nonfinancial institutions providing financial services in the markets served by the Company's subsidiary. Additionally, the Company and its banking subsidiary are subject to the regulations of certain federal and state agencies and undergo periodic examinations by those regulatory agencies. The Company has one1 operating segment.
Use of Estimates
The consolidated financial statements of the Company have been prepared in conformity with U.S. generally accepted accounting principles (“U.S. GAAP”).GAAP. In preparing the consolidated financial statements, management is required to make estimates and assumptions, which significantly affect the reported amounts in the consolidated financial statements. Such estimates include the valuation of loans, goodwill, intangible assets, indemnification assets, and other long-lived assets, along with assumptions used in the calculation of income taxes, among others. These estimates and assumptions are based on management'smanagement’s best estimates and judgment. Management evaluates its estimates and assumptions on an ongoing basis using experience and other factors, including the current economic environment, which management believes to be reasonable under the circumstances. Management adjusts such estimates and assumptions when facts and circumstances dictate. Decreased real estate values, volatile credit markets, and unemployment have combined to increase the uncertainty inherent in such estimates and assumptions. As future events and their effects cannot be determined with precision, actual results could differ significantly from these estimates. Changes in those estimates resulting from continuing changes in the economic environment will be reflected in the financial statements in future periods.
Cash Flow Information
For purposes of reporting cash flows, the Company considers cash and due from banks, interest-bearing deposits and federal funds sold that mature within 90 days of the balance sheet date to be cash and cash equivalents. AtThe balances at December 31, 20172021 and 2016, approximately $17.5 million,2020 were not subject to reserve requirements from the Federal Reserve.
Recent Accounting Pronouncements
ASU 2021-01, Reference Rate Reform (Topic 848): Scope (ASU 2021-01). ASU 2021-01 was issued in January 2021 and $18.2 million, respectively,provided optional expedients and exceptions in ASC 848 to contracts, hedging relationships, and other transactions affected by reference rate reform if certain criteria are met. The amendment only applies to contracts, hedging relationships, and other transactions that reference LIBOR or another reference rate expected to be discontinued because of cashreference rate reform. The expedients and due from banks represented required reserves on deposits maintainedexceptions provided by the Companyamendments will not apply to contract modifications made and hedging relationships entered into or evaluated after December 31, 2022, except for hedging relationships existing as of December 31, 2022, that an entity has elected certain optional expedients for and that are retained through the end of the hedging relationship. The amendments in accordance with Federal Reserve Bank requirements.this update were effective immediately upon issuance and did not have a material effect on the consolidated financial statements.
Investments
The Company has classified all investments in debt securities as available for saleavailable-for-sale or held to maturity.held-to-maturity.
Securities classified as available for saleavailable-for-sale are carried at fair value. Unrealized holding gains and losses for available for saleavailable-for-sale securities are excluded from earnings and reported as a net amount in a separate component of shareholders'
70
shareholders’ equity until realized. All previous fair value adjustments included in the separate component of shareholders'shareholders’ equity are reversed upon sale.
Securities classified as held to maturityheld-to-maturity are carried at historicalamortized cost and adjusted for amortization of premiums and accretion of discounts.
An ACL on held-to-maturity securities is deducted from the amortized cost basis of the securities to reflect the expected amount to be collected. When it is determined that a security will not be collected, the balance is written-off through the allowance. In evaluating the need for an ACL, securities with similar risk characteristics are grouped and an estimate of expected cash flows is determined using loss experience, adjusted for current and reasonable and supportable forecasts of economic conditions.
For available-for-sale securities in a loss position, the Company evaluates whether the decline in fair value below amortized cost resulted from a credit loss or other factors. Losses attributed to credit are recognized through an ACL on available-for-sale securities, limited to the amount that the fair value of securities is less than the amortized cost basis. In assessing credit loss, the Company considers, among other things, (1) the extent to which fair value is less than the amortized cost basis, (2) adverse conditions specific to the security or industry, (3) historical payment patterns, (4) the likelihood of future payments, and (5) changes to the rating of a security by a rating agency.
The Company has elected to exclude accrued interest receivable balances from the estimate of the ACL as these amounts are timely written off as a credit loss expense. Adjustments to the ACL on held-to-maturity and available-for-sale securities are recognized as a component of the provision for credit losses in the Consolidated Statements of Operations.
Premiums and discounts are amortized or accreted over the expected lives of the respective securities as an adjustment to yield using the interest method. Dividend and interest income is recognized when earned. Realized gains and losses are included in earnings and are derived using the specific identification method for determining the cost of securities sold.
Loans Held for SaleHeld-for-Sale and Servicing Assets
The Company provides long-term financing of one-to-four-family residential real estate by originating fixed and variable rate loans. Long-term fixed and variable rate loans are usually sold into the secondary market with limited recourse. Upon receipt of an application for a real estate loan, the Company determines whether the loan will be sold into the secondary market or retained in the Company'sCompany’s loan portfolio. The interest rates on the loans sold are locked with the buyer and the Company bears no interest rate risk related to these loans. Mortgage loans held for saleheld-for-sale are carried at the lower of cost or fair value, which is determined on a specific identification method. The Company does not retain servicing on anythese loans.
The Company also originates SBA7(a) loans that generally provide for a guarantee of 75% up to a maximum amount. The guaranteed portion of the loan can be sold nor didin an active secondary market. For the years ended December 31, 2021 and 2020, all SBA7(a) loans are considered held-for-investment; however, as the Company have any capitalized mortgagemakes the determination to sell the loans, they will be moved into the held-for-sale category. Sales of SBA guaranteed loans are executed on a servicing retained basis, and the Company retains the rights atand obligations to service the loans. At December 31, 2017 or 2016. 2021, the Company was servicing SBA loans that had been sold and has
71
recorded a related servicing asset of $6.7 million. The servicing asset is accounted for under the amortization method and is evaluated for impairment. Amortization of the servicing asset is recorded as a reduction to servicing income.
Gains on the sale of loans held for saleheld-for-sale are reported net of direct origination fees and costs in the Company's consolidated statementsCompany’s Consolidated Statements of operations.Operations.
Loans are reported at the principal balance outstanding, net of unearned fees, costs, and premiums or discounts on acquired loans. Loan origination fees, direct origination costs, and premiums or discounts resulting from acquired loans are deferred and recognized over the lives of the related loans as a yield adjustment using the interest method.
Interest income on loans is accrued to income based on the principal amountbalance outstanding. The recognition of interest income is discontinued when a loan becomes 90 days past due or a significant deterioration in the borrower'sborrower’s credit has occurred which, in management'smanagement’s judgment, negatively impacts the collectibility of the loan. Unpaid interest on such loans is reversed at the time the loan becomes uncollectible and subsequent interest payments received are generally applied to principal if any doubt exists as to the collectibility of such principal; otherwise, such receipts are recorded as interest income.principal. Loans that have not been restructured are returned to accrual status when management believes full collectibility of principal and interest is expected. Non-accrual loans that have been restructured will remain in a non-accrual status until the borrower has made at least six months of consecutive contractual payments.
Accrued interest receivable totaled $31.1 million and $30.6 million at December 31, 2020 and 2021, respectively, and were reported in Other Assets on the consolidated balance sheets.
Acquired Loans
Prior to the adoption of ASU 2016-13 on January 1, 2020, PCI loans were acquired in a business combination or transaction, that havehad evidence of deterioration of credit quality since origination and for which it iswas probable, at acquisition, that the Company willwould be unable to collect all contractually required payments receivable. PCI loans were initially recorded at fair value (as determined by the present value of expected future cash flows) with no valuation allowance. The difference between the undiscounted cash flows expected at acquisition and the investment in the loans, or the “accretable yield,” iswas recognized as interest income on a level-yield method over the life of the loans. Contractually required payments for interest and principal that exceedexceeded the undiscounted cash flows expected at acquisition, or the “nonaccretable difference,” arewere not recognized as a yield adjustment or as a loss accrual or a valuation allowance. The Company aggregatesaggregated individual loans with common risk characteristics into pools of loans. Increases in expected cash flows subsequent to the initial investment arewere recognized prospectively through adjustment of the yield on the loans over their remaining lives. Decreases in expected cash flows due to an inability to collect contractual cash flows arewere recognized as impairment through the provision for loan losses account. Any allowance for loan loss on these pools reflectreflected only losses incurred after the acquisition. Disposals of loans, including sales of loans, paydowns, payments in full or foreclosures resultresulted in the removal or reduction of the loan from the loan pool.
72
to the ACL are recorded through provision expense. For non-PCD loans, an ACL is established immediately after the acquisition through a charge to the provision for credit losses.
The ACL for both PCD and non-PCD is determined by pooling loans with similar risk characteristics and using the approach discussed below under “Allowance for Credit Losses on Loans”.
Impaired Loans
Loans are considered “impaired” when it becomes probable that the Company will be unable to collect all amounts due according to the loan'sloan’s contractual terms. Non-accrual loans, loans past due greater than 90 days and still accruing, unless adequately secured and in the process of collection, and restructured loans qualify as “impaired loans.”Restructured loans involve the granting of a concession on the terms of a loan to a borrower experiencing financial difficulty involving the modification of terms of the loan, such asdifficulty. Concessions may be granted in various forms, including changes in payment schedule or interest rate.
When measuring impairment, the expected future cash flows of an impaired loan are discounted at the loan'sloan’s effective interest rate at origination. Alternatively, impairment can be measured by reference to an observable market price, if one exists, or the fair value of the collateral for a collateral-dependent loan. Interest income on impaired loans is not accrued but is recorded when cash is received and only if principal is considered to be fully collectible. Loans and leases, which are deemed uncollectible, are charged off to the allowance for loancredit losses, while recoveries of amounts previously charged off are credited to the allowance for loancredit losses.
Loans are generally placed on non-accrual status when contractually past due 90 days or more as to interest or principal payments. Additionally, whenever management becomes aware of facts or circumstances that may adversely impact the collectability of principal or interest on loans, it is management'smanagement’s practice to place such loans on non-accrual status immediately, rather than delaying such action until the loans become 90 days past due. Previously accrued and uncollected interest on such loans is reversed. Income is recorded only to the extent that a determination has been made that the principal balance of the loan is collectablecollectible and the interest payments are subsequently received in cash, or for a restructured loan, the borrower has made six consecutive contractual payments.If collectabilitycollectibility of the principal is in doubt, payments received are applied to loan principal.
Loans past due 90 days or more but still accruing interest are also generally included in nonperforming loans. Loans past due 90 days or more but still accruing are classified as such where the underlying loans are both well secured (the collateral value is sufficient to covercovers principal and accrued interest) and are in the process of collection. At December 31, 2017, we did not
Allowance for Credit Losses on Loans
The ACL on loans is a valuation account that is deducted from the amortized cost basis to present the net amount expected to be collected. Loans are charged-off against the allowance when management believes the uncollectibility of a loan balance is confirmed.
Management estimates the allowance using relevant available information, from internal and external sources, relating to past events, current conditions, and reasonable and supportable forecasts. Credit loss experience provides the basis for the estimation of expected credit losses. Adjustments to historical loss information are made for differences in current loan-specific risk characteristics such as differences in underwriting standards, portfolio mix, delinquency level, or term as well as for changes in environmental conditions, such as changes in unemployment rates, property values, or other relevant factors.
The ACL on loans is measured on a collective basis when similar risk characteristics exist. The Company has identified the following portfolio segments:
C&I – C&I loans consist of loans to small and medium-sized businesses in a wide variety of industries. These loans are generally collateralized by inventory, accounts receivable, equipment, real estate and other commercial assets, and may be supported by other credit enhancements such as personal guarantees. Risk arises primarily due to a difference between expected and actual cash flows of the borrower. However, the recoverability of these loans is also dependent on other factors primarily dictated by the type of collateral securing these loans. The fair value of the
73
collateral securing these loans may fluctuate as market conditions change. Included within C&I are revolving loans supported by borrowing bases that fluctuate depending on the amount of underlying collateral. A portion of C&I loans consists of sponsor finance, which are loans with senior debt exposure to private equity backed companies.
CRE – CRE loans include various types of loans for which the Company holds real property as collateral. Commercial real estate lending activity is typically restricted to owner-occupied properties or to investor properties that are owned by customers with a current banking relationship. The primary risks of CRE loans include the borrower’s inability to pay, material decreases in the value of the real estate being held as collateral and significant increases in interest rates, which may make the real estate mortgage loan unprofitable. Real estate loans may be more adversely affected by conditions in the real estate markets or in the general economy.
Construction and Land Development – The Company originates loans to finance construction projects including 1-4 family residences, multifamily residences, commercial office, and industrial projects. Construction loans are generally collateralized by first liens on the real estate and have anyfloating interest rates. Construction loans pastare considered to have higher risks due greater than 90 daysto construction completion and nottiming risk, and the ultimate repayment being sensitive to interest rate changes, governmental regulation of real property and the availability of long-term financing. Additionally, economic conditions may impact the Company’s ability to recover its investment in construction loans. Adverse economic conditions may negatively impact the real estate market which could affect the borrowers’ ability to complete and sell the project. Additionally, the fair value of the underlying collateral may fluctuate as market conditions change.
Residential Real Estate – The Company originates loans to finance one- to four-family residences, secured by both first and second liens. Repayment of these loans is dependent on the borrowers’ ability to pay and the fair value of the underlying collateral. Residential loans with a second lien are inherently riskier due to the junior lien position.
Agricultural – Agricultural loans are generally secured with equipment, livestock, crops or other non-real property and at times the underlying real property. Agricultural loans are primarily included as a component of CRE and C&I loans.
Consumer – The Company provides a broad range of consumer loans to customers, including personal lines of credit, credit cards, recreational vehicles, yachts and automobile loans. Repayment of these loans is dependent on the borrowers’ ability to pay and the fair value of the underlying collateral. Consumer loans are included as a component of Other loans.
The Company utilizes a DCF method to measure the ACL on loans collectively evaluated that are sub-segmented by credit risk levels. The DCF method incorporates assumptions for probability of default, loss given default, prepayments and curtailments over the contractual term of the loans. In determining the probability of default, the Company utilized regression analysis to determine certain economic factors that are relevant loss drivers in the portfolio segments based on historical or peer evaluations. National unemployment is a loss driver used in nearly all portfolios, except Consumer and first lien Residential Real Estate. The annual percentage change in gross domestic product is also used in C&I, Construction, Agricultural first lien Residential Real Estate, and Consumer portfolios. The annual percentage change in a commercial real estate index, national house price index and national retail sales are used in the CRE, second lien Residential Real Estate and Consumer portfolios, respectively. The contractual term excludes expected extensions, renewals, and modifications unless either of the following applies: management has a reasonable expectation at the reporting date that a troubled debt restructuring will be executed with an individual borrower, or the extension or renewal options are included in nonperforming loans.the original or modified contract at the reporting date and are not unconditionally cancellable by the Company.
The Company uses a one-year reasonable and supportable forecast that considers baseline, upside and downside economic scenarios. For periods beyond the forecast period, the Company reverts to historical loss rates on a straight-line basis over a one-year period.
74
Loans that do not share risk characteristics are evaluated on an individual basis. Loans evaluated individually are not also included in the collective evaluation. When management determines foreclosure is probable, expected credit losses are based on the fair value of the collateral at the reporting date, adjusted for selling costs as appropriate.
Loan Charge-Offs
Loans are charged-off when the primary and secondary sources of repayment (cash flow, collateral, guarantors, etc.) are less than their carrying value.
Other Real Estate
Other real estate represents property acquired through foreclosure or deeded to the Company in lieu of foreclosure on loans on which the borrowers have defaulted on the payment of principal or interest. Other real estate is recorded on an individual asset basis at the lower of cost or fair value less estimated costs to sell. The fair value of other real estate is based upon estimates of future cash flows, market value of similar assets, if available, or independent appraisals. These estimates involve significant uncertainties and judgments. As a result, fair value estimates may not be realizable in a current sale or settlement of the other real estate. Subsequent reductions in fair value are expensed within noninterest expense.
Gains and losses resulting from the sale of other real estate are credited or charged to current period earnings. Costs of maintaining and operating other real estate are expensed as incurred, and expenditures to complete or improve other real estate properties are capitalized if the expenditures are expected to be recovered upon ultimate sale of the property.
Fixed Assets
Buildings, leasehold improvements, furniture, fixtures, equipment, and capitalized softwareequipment are stated at cost less accumulated depreciation. All categories are computed using the straight-line method over their respective estimated useful lives. Furniture, fixtures and equipment is depreciated over three to ten years and buildings and leasehold improvements over ten to forty years, and capitalized software over three years, based upon estimated lives or lease obligation periods.
State Tax Credits Held for Sale
The Company has purchased the rights to receive 10-year streams of state tax credits at agreed upon discount rates and sells such tax credits to its clients and others. All stateState tax credits purchased prior to 2009 are accounted for at fair value. All state tax credits purchased since 2009 are accounted for at cost. The Company elected notis also a minority partner in a joint venture, accounted for as an equity method investment, that purchases state income tax credits for resale to account forcustomers. Income from both the sale of state tax credits purchased since 2009 at fair value in order to limitand earnings from the volatility of the fair value changesjoint venture are reported as tax credit income in the Company's consolidated statementsConsolidated Statements of operations.Operations.
Cash Surrender Value of Life Insurance
The Company has purchased bank-owned life insurance policies on certain bank officers. Bank-owned life insurance is recorded at its cash surrender value. Changes in the cash surrender values, including death benefits in excess of the carrying amount, are included in noninterest income.
Federal Home Loan Bank Stock
The Bank, as a member of the Federal Home Loan Bank of Des Moines (“FHLB”),FHLB, is required to maintain an investment in the capital stock of the FHLB. The stock is redeemable at par by the FHLB, and is, therefore, carried at cost and periodically evaluated for impairment. The Company records FHLB dividends in interest income.
Goodwill and Other Intangible Assets
The Company tests goodwill for impairment on an annual basis and whenever events or changes in circumstances indicate that the Company may not be able to recover the respective asset'sasset’s carrying amount. The Company'sCompany’s annual test for impairment was performed in the fourth quarter of December 31, 2017.2021. Such tests involve the use of estimates and assumptions. Core deposit intangibles are amortized using an accelerated method over an estimated useful life of approximately 10 years.
Potential impairments to goodwill must first be identified by performing a qualitative assessment which evaluates relevant events or circumstances to determine whether it is more likely than not that the fair value of a reporting unit
75
is less than its carrying amount. If this test indicates it is more likely than not that goodwill has been impaired, then a quantitative impairment test is completed. The quantitative impairment test calculates the fair value of the reporting unit and compares it with its carrying amount, including goodwill. If the carrying amount of goodwill exceeds its implied fair market value, an impairment loss is recognized. That loss is equal to the carrying amount of goodwill that is in excess of its implied fair market value.
Core deposit intangibles are amortized using an accelerated method over an estimated useful life of approximately 10 years.
Impairment of Long-Lived Assets
Long-lived assets, such as fixed assets and purchased intangibles subject to amortization, are reviewed for impairment whenever events or changes in circumstances indicate that the carrying amount of an asset may not be recoverable. Recoverability of assets to be held and used is measured by a comparison of the carrying amount of an asset to estimated undiscounted future cash flows expected to be generated by the asset. If the carrying amount of an asset exceeds its estimated future cash flows, an impairment charge is recognized in the amount by which the carrying amount of the asset exceeds the fair value of the asset. Assets to be disposed of are separately presented in the balance sheet and reported at the lower of the carrying amount or fair value less costs to sell, and are no longer depreciated. The assets and liabilities of a disposal group classified as held for saleheld-for-sale are presented separately in the appropriate asset and liability sections of the balance sheet.
Derivative Financial Instruments and Hedging Activities
The Company uses derivative financial instruments to assist in the management ofmanaging interest rate sensitivity and to modify the repricing, maturity and option characteristics of certain assets and liabilities. In addition, the Company also offers an interest rate hedge program that includes interest rate swaps to assist its customers in managing their interest rate risk profile. In order to eliminate the interest rate risk associated with offering these products, the Company enters into derivative contracts with third parties to offset the customer contracts.
Derivative instruments are required to be measured at fair value and recognized as either assets or liabilities in the consolidated financial statements. Fair value represents the payment the Company would receive or pay if the item were sold or bought in a current transaction. The accounting for changes in fair value (gains or losses) of a hedged item is dependent on whether the related derivative is designated and qualifies for “hedge accounting.” The Company assigns derivatives to one of these categories at the purchase date: cash flow hedge, fair value hedge, or non-designated derivatives.hedges as part of a customer interest-rate swap product. An assessment of the expected and ongoing hedge effectiveness of any derivative designated a fair value hedge or cash flow hedge is performed as required by the accounting standards. Derivatives are included in other assets and other liabilities in the consolidated balance sheets. The fair value amounts recognized for derivative instruments and the fair value amounts recognized for the right to reclaim or obligation to return cash collateral are not offset when represented under a master netting arrangement. Generally, the only derivative instruments used by the Company have been interest rate swaps, forward currency contracts, and interest rate caps.
Income Taxes
The Company and its subsidiaries file a consolidated federal income tax return. Deferred tax assets and liabilities are recognized for the estimated future tax consequences attributable to differences between the financial statement carrying amounts of existing assets and liabilities and their respective tax bases. Deferred tax assets and liabilities are measured using enacted tax rates in effect for the year in which those temporary differences are expected to be recovered or settled. We evaluated theThe need for deferred tax asset valuation allowances is based on a more-likely-than-not standard. The ability to realize deferred tax assets depends on the ability to generate sufficient positive taxable
76
income within the carryback or carryforward periods provided for in the laws for each applicable taxing jurisdiction. We consider theThe following possible sources of taxable income:income are considered: future reversal patterns of existing taxable temporary differences, future taxable income exclusive of reversing temporary differences, taxable income in prior carryback years and the availability of qualified tax planning strategies. The assessment regarding whether a valuation allowance is required or should be adjusted depends on all available positive and negative factors including, but not limited to, nature, frequency, and severity of recent losses, duration of available carryforward periods, experience with tax attributes expiring unused and near and medium term financial outlook. Because of the complexity of tax laws and regulations, interpretation can be difficult and subject to legal judgment given specific facts and circumstances. It is possible that others, given the same information, may at any point in time reach different reasonable conclusions regarding the estimated amounts of accrued taxes.
Stock-Based Compensation
Stock-based compensation is recognized as an expense for stock options, restricted stock awards, performance stock units, and restricted stock units granted to employees, directors, and advisors in return for employee service. Equity classified awards are measured at the grant date fair value using either an observable market value or a valuation methodology, and are recognized over the requisite service period on a straight-line basis. Forfeitures are recorded as they occur. A description of the Company'sCompany’s stock-based employee compensation plan is describedincluded in Note 15“Note 16 - Shareholders’ Equity and Compensation Plans.”
Acquisitions and Divestitures
Acquisitions and business combinations are accounted for using the acquisition method of accounting. The assets and liabilities of the acquired entities have been recorded at their estimated fair values at the date of acquisition. Goodwill represents the excess of the purchase price over the fair value of net assets acquired, including the amount assigned to identifiable intangible assets.
The purchase price allocation process requires an estimation of the fair values of the assets acquired and the liabilities assumed. When a business combination agreement provides for an adjustment to the cost of the combination contingent on future events, the Company includes an estimate of the acquisition-date fair value as part of the cost of the combination. To determine the fair values, the Company relies on third party valuations, such as appraisals, or internal valuations based on discounted cash flow analyses or other valuation techniques. The results of operations of the acquired business are included in the Company'sCompany’s consolidated financial statements from the date of acquisition. Merger-related costs are costs the Company incurs to effect a business combination. In 2017, the Company changed its presentation of Merger related expenses as a separate component of Noninterest expenses on the Condensed
For divestitures, the Company measures an asset (disposal group) classified as held for saleheld-for-sale at the lower of its carrying value at the date the asset is initially classified as held for saleheld-for-sale or its fair value less costs to sell. The Company reports the results of operations of an entity or group of components that either has been disposed of or held for saleheld-for-sale as discontinued operations only if the disposal of that component represents a strategic shift that has or will have a major effect on an entity'sentity’s operations and financial results.
Any incremental direct costs incurred to transact the sale are allocated against the gain or loss on the sale. These costs would include items likesuch as legal fees, title transfer fees, broker fees, etc. Any goodwill and intangible assets associated with the portion of the reporting unit to be disposed of is included in the carrying amount of the business in determining the gain or loss on the sale.
Basic and Diluted Earnings Per Common Share
Basic earnings per common share data is calculated by dividing net income available to common shareholders by the weighted average number of common shares outstanding during the period. Common shares outstanding include common stock and restricted stock awards where recipients have satisfied the vesting terms. Diluted earnings per common share gives effect to all dilutive potential common shares outstanding during the period using the treasury stock method.
77
Consolidated Statement of Comprehensive Income
The Consolidated Statement of Comprehensive Income includes the amount and the related tax impact that have been reclassified from accumulated other comprehensive income to net income. The classification adjustment for unrealized loss/gain on sale of securities included in net income has been recorded through the gain on sale of investment securities line item, within noninterest income, in the Company'sCompany’s Consolidated Statements of Operations.
Share Repurchases
The Company periodically adopts share repurchase plans that authorize open market repurchases of common stock. Shares acquired through the repurchase plan are classified as treasury stock or the shares are immediately retired upon settlement, depending on plan authorization. When shares are retired, the excess of repurchase price over par is allocated between additional paid in capital and retained earnings. The amount allocated to additional paid in capital is limited to the pro rata portion of additional paid in capital at the time of repurchase.
Reclassifications
NOTE 2 - ACQUISITIONS & DIVESTITURES
The acquisition of JCBnoted below has been accounted for as a business combination using the acquisition method of accounting which requires assets acquired and liabilities assumed to be recognized at fair value as of the acquisition date. Goodwill of $87.0 million arising from the acquisition consistsacquisitions consist largely of the synergies and economies of scale expected from combining the operations of JCB into Enterprise. The goodwill is assigned as part of the Company's Banking reporting unit. None of the goodwill recognized is expected to be deductible for income tax purposes.
Acquisition of First Choice Bancorp
On July 21, 2021, the Company closed its acquisition of 100% of First Choice and its wholly-owned subsidiary, FCB, which operated 8 full-service branches in California.
First Choice shareholders received 0.6603 shares of EFSC common stock for each First Choice common share and cash in lieu of any fractional shares. In connection with the merger, Enterprise issued approximately 7.8 million shares of EFSC Common Stock valued at $44.01 per share, which was the closing price of Enterprise common stock on July 21, 2021. The value of the transaction consideration was approximately $346 million, which includes approximately $2.1 million payable to holders of First Choice stock options. For the year ended December 31, 2021, the Company recognized $18.8 million of merger-related costs recorded in noninterest expense in the statement of operations related to the First Choice acquisition.
78
The following table presentstables present the assets acquired and liabilities assumed. The consideration exchanged, assets acquired and liabilities assumed of JCB as of February 10, 2017, and theirFirst Choice were recorded at estimated fair values:value on the date of acquisition. Fair values are considered preliminary until final fair values are determined, or the measurement period has passed, which is no later than one year from the date of acquisition.
| (in thousands) | As Recorded by JCB | Adjustments | As Recorded by EFSC | (in thousands) | As Recorded by First Choice | Adjustments | As Recorded by EFSC | |||||||||||||||||||||
| Assets acquired: | Assets acquired: | |||||||||||||||||||||||||||
| Cash and cash equivalents | $ | 33,739 | $ | — | $ | 33,739 | Cash and cash equivalents | $ | 214,794 | $ | — | $ | 214,794 | |||||||||||||||
| Interest-bearing deposits | 1,715 | — | 1,715 | |||||||||||||||||||||||||
| Securities | 148,670 | — | 148,670 | Securities | 34,533 | (44) | (a) | 34,489 | ||||||||||||||||||||
| Portfolio loans, net | 685,905 | (11,094 | ) | (a) | 674,811 | |||||||||||||||||||||||
| Other real estate owned | 6,762 | (5,082 | ) | (b) | 1,680 | |||||||||||||||||||||||
| Loans | Loans | 1,937,635 | 5,508 | (b) | 1,943,143 | |||||||||||||||||||||||
| Allowance | Allowance | (19,626) | 12,620 | (b) | (7,006) | |||||||||||||||||||||||
| Other investments | 2,695 | — | 2,695 | Other investments | 19,178 | 138 | (c) | 19,316 | ||||||||||||||||||||
| Fixed assets, net | 21,780 | (3,325 | ) | (c) | 18,455 | |||||||||||||||||||||||
| Fixed assets | Fixed assets | 1,869 | (870) | (c) | 999 | |||||||||||||||||||||||
| Accrued interest receivable | 2,794 | — | 2,794 | Accrued interest receivable | 7,131 | 20 | (c) | 7,151 | ||||||||||||||||||||
| Goodwill | 7,806 | (7,806 | ) | (d) | — | Goodwill | 73,425 | (73,425) | (d) | — | ||||||||||||||||||
| Other intangible assets | 25 | 11,489 | (e) | 11,514 | ||||||||||||||||||||||||
| Intangible assets | Intangible assets | 4,517 | 375 | (e) | 4,892 | |||||||||||||||||||||||
| Deferred tax assets | 4,634 | 3,991 | (f) | 8,625 | Deferred tax assets | 7,558 | (1,943) | (c) | 5,615 | |||||||||||||||||||
| Other assets | 19,107 | (296 | ) | (g) | 18,811 | Other assets | 23,024 | 1,645 | (c) | 24,669 | ||||||||||||||||||
| Total assets acquired | $ | 935,632 | $ | (12,123 | ) | $ | 923,509 | Total assets acquired | $ | 2,304,038 | $ | (55,976) | $ | 2,248,062 | ||||||||||||||
| Liabilities assumed: | Liabilities assumed: | |||||||||||||||||||||||||||
| Deposits | $ | 764,539 | $ | 629 | (h) | $ | 765,168 | Deposits | $ | 1,840,716 | $ | (287) | (c) | $ | 1,840,429 | |||||||||||||
| Other borrowings | 55,430 | 681 | (i) | 56,111 | ||||||||||||||||||||||||
| Trust preferred securities | 12,887 | (382 | ) | (j) | 12,505 | |||||||||||||||||||||||
| FHLB advances | FHLB advances | 160,000 | — | 160,000 | ||||||||||||||||||||||||
| Accrued interest payable | 653 | — | 653 | Accrued interest payable | 124 | — | 124 | |||||||||||||||||||||
| Other liabilities | 5,006 | 65 | 5,071 | Other liabilities | 8,464 | (2,160) | (c) | 6,304 | ||||||||||||||||||||
| Total liabilities assumed | $ | 838,515 | $ | 993 | $ | 839,508 | Total liabilities assumed | $ | 2,009,304 | $ | (2,447) | $ | 2,006,857 | |||||||||||||||
| Net assets acquired | $ | 97,117 | $ | (13,116 | ) | $ | 84,001 | Net assets acquired | $ | 294,734 | $ | (53,529) | $ | 241,205 | ||||||||||||||
| Consideration paid: | Consideration paid: | |||||||||||||||||||||||||||
| Cash | $ | 29,283 | Cash | $ | 2,152 | |||||||||||||||||||||||
| Common stock | 141,729 | |||||||||||||||||||||||||||
Common stock1 | Common stock1 | 343,650 | ||||||||||||||||||||||||||
| Total consideration paid | $ | 171,012 | Total consideration paid | $ | 345,802 | |||||||||||||||||||||||
| Goodwill | $ | 87,011 | Goodwill | $ | 104,597 | |||||||||||||||||||||||
1 Common stock consideration was $342,280, net of $1,370 for shares withheld on the settlement of share-based awards of FCBP employees.
(a)Fair value adjustments based on the Company’s evaluation of the acquired securities portfolio.
(b)Fair value adjustments based on the Company’s evaluation of the acquired loan portfolio, write-off of net deferred loan costs and elimination of the allowance for loan losses recorded by FCBP.
(c)Other miscellaneous fair value adjustments.
(d)Adjustment to eliminate goodwill.
(e)Eliminate acquired intangibles and record the core deposit intangible asset on the acquired core deposit accounts. Amount to be amortized using a sum-of-years digits method over a useful life of 10 years.
The following table provides the unaudited pro forma information for the results of operations for the twelve months ended December 31, 20172021 and 2016,2020, as if the acquisition had occurred on January 1, 2016.2020. The pro forma results combine the historical results of JCBFCBP with the Company’s Consolidated Statements of Income, adjusted for the impact of the application of the acquisition method of accounting including loan discount accretion, intangible assets amortization and deposit and trust preferred securities premium accretion net of taxes.fair value adjustments. The pro forma results have been prepared for comparative purposes only and are not necessarily indicative of the results that would have been obtained had the acquisition actually occurred on January 1, 2016.2020. No
79
assumptions have been applied to the pro forma results of operations regarding possible revenue enhancements, expense efficiencies or asset dispositions. Only the acquisition relatedacquisition-related expenses that have been incurred as of December 31, 20172021 are included in net income in the table below.
| Twelve months ended December 31, | |||||||||||||||||||||||
| (in thousands, except per share data) | 2021 | 2020 | |||||||||||||||||||||
| Total revenues (net interest income plus noninterest income) | $ | 488,280 | $ | 420,487 | |||||||||||||||||||
| Net income | 188,416 | 67,275 | |||||||||||||||||||||
| Diluted earnings per common share | 4.86 | 1.94 | |||||||||||||||||||||
For the year ended December 31, 2021, total revenue and pre-tax net income from FCBP of $40.5 million and $25.9 million (excluding the provision for credit losses of $25.4 million on the acquired loan portfolio and unfunded loan commitments) were included in the Company’s consolidated results.
| Pro Forma | |||||||
| Twelve months ended December 31, | |||||||
| (in thousands, except per share data) | 2017 | 2016 | |||||
| Total revenues (net interest income plus noninterest income) | $ | 213,910 | $ | 199,033 | |||
| Net income | 47,227 | 56,994 | |||||
| Diluted earnings per common share | 2.03 | 2.42 | |||||
NOTE 3 - EARNINGS PER SHARE
The following table presents a summary of earnings per common share data and amounts for the periods indicated.
| Year ended December 31, | |||||||||||||||||
| ($ in thousands, except per share data) | 2021 | 2020 | 2019 | ||||||||||||||
| Net income available to common shareholders | $ | 133,055 | $ | 74,384 | $ | 92,739 | |||||||||||
| Weighted average common shares outstanding | 34,436 | 26,954 | 26,045 | ||||||||||||||
| Additional dilutive common stock equivalents | 60 | 35 | 114 | ||||||||||||||
| Weighted average diluted common shares outstanding | 34,496 | 26,989 | 26,159 | ||||||||||||||
| Basic earnings per common share | $ | 3.86 | $ | 2.76 | $ | 3.56 | |||||||||||
| Diluted earnings per common share | $ | 3.86 | $ | 2.76 | $ | 3.55 | |||||||||||
| Years ended December 31, | |||||||||||
| (in thousands, except per share data) | 2017 | 2016 | 2015 | ||||||||
| Net income as reported | $ | 48,190 | $ | 48,837 | $ | 38,450 | |||||
| Weighted average common shares outstanding | 22,953 | 20,003 | 19,984 | ||||||||
| Additional dilutive common stock equivalents | 296 | 287 | 333 | ||||||||
| Weighted average diluted common shares outstanding | 23,249 | 20,290 | 20,317 | ||||||||
| Basic earnings per common share: | $ | 2.10 | $ | 2.44 | $ | 1.92 | |||||
| Diluted earnings per common share: | $ | 2.07 | $ | 2.41 | $ | 1.89 | |||||
80
NOTE 4 - INVESTMENTS
The following table presents the amortized cost, gross unrealized gains and losses and fair value of securities availableavailable-for-sale and held-to-maturity:
| December 31, 2021 | |||||||||||||||||||||||
| ($ in thousands) | Amortized Cost | Gross Unrealized Gains | Gross Unrealized Losses | Fair Value | |||||||||||||||||||
| Available-for-sale securities: | |||||||||||||||||||||||
| Obligations of U.S. Government-sponsored enterprises | $ | 175,409 | $ | 3 | $ | (1,901) | $ | 173,511 | |||||||||||||||
| Obligations of states and political subdivisions | 571,587 | 5,907 | (2,410) | 575,084 | |||||||||||||||||||
| Agency mortgage-backed securities | 509,243 | 8,485 | (3,869) | 513,859 | |||||||||||||||||||
| Corporate debt securities | 11,750 | 632 | — | 12,382 | |||||||||||||||||||
| U.S. Treasury Bills | 90,971 | 220 | (21) | 91,170 | |||||||||||||||||||
| Total securities available-for-sale | $ | 1,358,960 | $ | 15,247 | $ | (8,201) | $ | 1,366,006 | |||||||||||||||
| Held-to-maturity securities: | |||||||||||||||||||||||
| Obligations of states and political subdivisions | $ | 236,379 | $ | 1,794 | $ | (730) | $ | 237,443 | |||||||||||||||
| Agency mortgage-backed securities | 68,105 | 940 | (666) | 68,379 | |||||||||||||||||||
| Corporate debt securities | 125,811 | 3,039 | — | 128,850 | |||||||||||||||||||
| Total securities held-to-maturity | $ | 430,295 | $ | 5,773 | $ | (1,396) | $ | 434,672 | |||||||||||||||
| Allowance for credit losses | (614) | ||||||||||||||||||||||
| Total securities held-to-maturity, net | $ | 429,681 | |||||||||||||||||||||
| December 31, 2020 | |||||||||||||||||||||||
| ($ in thousands) | Amortized Cost | Gross Unrealized Gains | Gross Unrealized Losses | Fair Value | |||||||||||||||||||
| Available-for-sale securities: | |||||||||||||||||||||||
| Obligations of U.S. Government-sponsored enterprises | $ | 14,978 | $ | 186 | $ | (3) | $ | 15,161 | |||||||||||||||
| Obligations of states and political subdivisions | 335,271 | 8,994 | (33) | 344,232 | |||||||||||||||||||
| Agency mortgage-backed securities | 506,703 | 20,190 | (321) | 526,572 | |||||||||||||||||||
| Corporate debt securities | 14,750 | 248 | — | 14,998 | |||||||||||||||||||
| U.S. Treasury Bills | 10,980 | 486 | — | 11,466 | |||||||||||||||||||
| Total securities available-for-sale | $ | 882,682 | $ | 30,104 | $ | (357) | $ | 912,429 | |||||||||||||||
| Held-to-maturity securities: | |||||||||||||||||||||||
| Obligations of states and political subdivisions | $ | 248,324 | $ | 2,814 | $ | — | $ | 251,138 | |||||||||||||||
| Agency mortgage-backed securities | 112,742 | 2,295 | (496) | 114,541 | |||||||||||||||||||
| Corporate debt securities | 126,993 | 8,851 | — | 135,844 | |||||||||||||||||||
| Total securities held-to-maturity | $ | 488,059 | $ | 13,960 | $ | (496) | $ | 501,523 | |||||||||||||||
| Allowance for credit losses | (449) | ||||||||||||||||||||||
| Total securities held-to-maturity, net | $ | 487,610 | |||||||||||||||||||||
During 2020, the Company transferred securities with a book value of $331.0 million and fair value of $352.6 million from available-for-sale to held-to-maturity. The Company believes the held-to-maturity category is more consistent with the Company’s intent for salethese securities. The transfer of securities was made at fair value at the time of transfer. The unamortized portion of the unrealized holding gain at the time of transfer is retained in accumulated other comprehensive income and heldin the carrying value of held-to-maturity securities. Accordingly, the
81
balance of held-to-maturity securities in the “Amortized cost” column in the table above includes a net unamortized unrealized gain of $21.0 million and $25.6 million at December 31, 2021 and 2020, respectively. Such amounts are amortized over the remaining life of the securities. In January 2022, the Company transferred securities with a book value of $116.7 million from available-for-sale to maturity:held-to-maturity.
| December 31, 2017 | |||||||||||||||
| (in thousands) | Amortized Cost | Gross Unrealized Gains | Gross Unrealized Losses | Fair Value | |||||||||||
| Available for sale securities: | |||||||||||||||
| Obligations of U.S. Government-sponsored enterprises | $ | 99,878 | $ | 6 | $ | (660 | ) | $ | 99,224 | ||||||
| Obligations of states and political subdivisions | 34,181 | 674 | (213 | ) | 34,642 | ||||||||||
| Agency mortgage-backed securities | 513,082 | 727 | (6,293 | ) | 507,516 | ||||||||||
| Total securities available for sale | $ | 647,141 | $ | 1,407 | $ | (7,166 | ) | $ | 641,382 | ||||||
| Held to maturity securities: | |||||||||||||||
| Obligations of states and political subdivisions | $ | 14,031 | $ | 69 | $ | (46 | ) | $ | 14,054 | ||||||
| Agency mortgage-backed securities | 59,718 | 16 | (330 | ) | 59,404 | ||||||||||
| Total securities held to maturity | $ | 73,749 | $ | 85 | $ | (376 | ) | $ | 73,458 | ||||||
| December 31, 2016 | |||||||||||||||
| (in thousands) | Amortized Cost | Gross Unrealized Gains | Gross Unrealized Losses | Fair Value | |||||||||||
| Available for sale securities: | |||||||||||||||
| Obligations of U.S. Government-sponsored enterprises | $ | 107,312 | $ | 348 | $ | — | $ | 107,660 | |||||||
| Obligations of states and political subdivisions | 36,486 | 630 | (485 | ) | 36,631 | ||||||||||
| Agency mortgage-backed securities | 319,345 | 1,101 | (3,940 | ) | 316,506 | ||||||||||
| Total securities available for sale | $ | 463,143 | $ | 2,079 | $ | (4,425 | ) | $ | 460,797 | ||||||
| Held to maturity securities: | |||||||||||||||
| Obligations of states and political subdivisions | $ | 14,759 | $ | 11 | $ | (242 | ) | $ | 14,528 | ||||||
| Agency mortgage-backed securities | 65,704 | 45 | (638 | ) | 65,111 | ||||||||||
| Total securities held to maturity | $ | 80,463 | $ | 56 | $ | (880 | ) | $ | 79,639 | ||||||
At December 31, 2017,2021, and 2016,2020, there were no holdings of securities of any one issuer in an amount greater than 10% of shareholders’ equity, other than the U.S. Government agencies and sponsored enterprises. The agency mortgage-backed securities are all issued by U.S. Government-sponsored enterprises. Securities having a fair value of $500.0$752.7 million and $407.3$525.8 million at December 31, 2017,2021, and December 31, 2016,2020, respectively, were pledged as collateral to secure deposits of public institutions and for other purposes as required by law or contract provisions.
The amortized cost and estimated fair value of debt securities at December 31, 2017,2021, by contractual maturity, are shown below. Expected maturities may differ from contractual maturities because borrowers may have the right to call or prepay obligations with or without call or prepayment penalties. The weighted average life of the agency mortgage-backed
| Available-for-sale | Held-to-maturity | ||||||||||||||||||||||
| ($ in thousands) | Amortized Cost | Estimated Fair Value | Amortized Cost | Estimated Fair Value | |||||||||||||||||||
| Due in one year or less | $ | 81,809 | $ | 81,797 | $ | 211 | $ | 214 | |||||||||||||||
| Due after one year through five years | 166,470 | 165,161 | 13,793 | 13,998 | |||||||||||||||||||
| Due after five years through ten years | 40,130 | 40,568 | 143,900 | 146,933 | |||||||||||||||||||
| Due after ten years | 561,308 | 564,621 | 204,286 | 205,148 | |||||||||||||||||||
| Agency mortgage-backed securities | 509,243 | 513,859 | 68,105 | 68,379 | |||||||||||||||||||
| $ | 1,358,960 | $ | 1,366,006 | $ | 430,295 | $ | 434,672 | ||||||||||||||||
There were approximately 290 available-for-sale securities is approximately 4 years.
| Available for sale | Held to maturity | ||||||||||||||
| (in thousands) | Amortized Cost | Estimated Fair Value | Amortized Cost | Estimated Fair Value | |||||||||||
| Due in one year or less | $ | 3,060 | $ | 3,076 | $ | — | $ | — | |||||||
| Due after one year through five years | 110,910 | 110,480 | 186 | 195 | |||||||||||
| Due after five years through ten years | 14,573 | 14,980 | 12,977 | 12,981 | |||||||||||
| Due after ten years | 5,516 | 5,330 | 868 | 878 | |||||||||||
| Agency mortgage-backed securities | 513,082 | 507,516 | 59,718 | 59,404 | |||||||||||
| $ | 647,141 | $ | 641,382 | $ | 73,749 | $ | 73,458 | ||||||||
| December 31, 2021 | |||||||||||||||||||||||||||||||||||
| Less than 12 months | 12 months or more | Total | |||||||||||||||||||||||||||||||||
| ($ in thousands) | Fair Value | Unrealized Losses | Fair Value | Unrealized Losses | Fair Value | Unrealized Losses | |||||||||||||||||||||||||||||
| Obligations of U.S. Government-sponsored enterprises | $ | 163,634 | $ | 1,775 | $ | 4,874 | $ | 126 | $ | 168,508 | $ | 1,901 | |||||||||||||||||||||||
| Obligations of states and political subdivisions | 242,188 | 2,361 | 1,776 | 49 | 243,964 | 2,410 | |||||||||||||||||||||||||||||
| Agency mortgage-backed securities | 259,047 | 3,685 | 6,467 | 184 | 265,514 | 3,869 | |||||||||||||||||||||||||||||
| U.S. Treasury Bills | 60,961 | 21 | — | — | 60,961 | 21 | |||||||||||||||||||||||||||||
| $ | 725,830 | $ | 7,842 | $ | 13,117 | $ | 359 | $ | 738,947 | $ | 8,201 | ||||||||||||||||||||||||
| December 31, 2020 | |||||||||||||||||||||||||||||||||||
| Less than 12 months | 12 months or more | Total | |||||||||||||||||||||||||||||||||
| ($ in thousands) | Fair Value | Unrealized Losses | Fair Value | Unrealized Losses | Fair Value | Unrealized Losses | |||||||||||||||||||||||||||||
| Obligations of U.S. Government-sponsored enterprises | $ | 4,997 | $ | 3 | $ | — | $ | — | $ | 4,997 | $ | 3 | |||||||||||||||||||||||
| Obligations of states and political subdivisions | 4,079 | 33 | — | — | 4,079 | 33 | |||||||||||||||||||||||||||||
| Agency mortgage-backed securities | 65,986 | 321 | — | — | 65,986 | 321 | |||||||||||||||||||||||||||||
| $ | 75,062 | $ | 357 | $ | — | $ | — | $ | 75,062 | $ | 357 | ||||||||||||||||||||||||
82
| December 31, 2017 | |||||||||||||||||||||||
| Less than 12 months | 12 months or more | Total | |||||||||||||||||||||
| (in thousands) | Fair Value | Unrealized Losses | Fair Value | Unrealized Losses | Fair Value | Unrealized Losses | |||||||||||||||||
| Obligations of U.S. Government-sponsored enterprises | $ | 89,309 | $ | 660 | $ | — | $ | — | $ | 89,309 | $ | 660 | |||||||||||
| Obligations of states and political subdivisions | 13,951 | 259 | — | — | 13,951 | 259 | |||||||||||||||||
| Agency mortgage-backed securities | 469,655 | 6,034 | 12,229 | 589 | 481,884 | 6,623 | |||||||||||||||||
| $ | 572,915 | $ | 6,953 | $ | 12,229 | $ | 589 | $ | 585,144 | $ | 7,542 | ||||||||||||
| December 31, 2016 | |||||||||||||||||||||||
| Less than 12 months | 12 months or more | Total | |||||||||||||||||||||
| (in thousands) | Fair Value | Unrealized Losses | Fair Value | Unrealized Losses | Fair Value | Unrealized Losses | |||||||||||||||||
| Obligations of states and political subdivisions | $ | 21,361 | $ | 408 | $ | 3,553 | $ | 320 | $ | 24,914 | $ | 728 | |||||||||||
| Agency mortgage-backed securities | 267,734 | 4,084 | 12,883 | 493 | 280,617 | 4,577 | |||||||||||||||||
| $ | 289,095 | $ | 4,492 | $ | 16,436 | $ | 813 | $ | 305,531 | $ | 5,305 | ||||||||||||
The unrealized losses at both December 31, 2017,2021, and 2016,2020, were primarily attributable to changes in market interest rates since the securities were purchased. Management systematically evaluates investment securities for other-than-temporary declines in fair value on a quarterly basis. This analysis requires management to consider various factors, which include among other considerations (1) the present value of the cash flows expected to be collected compared to the amortized cost of the security, (2) durationAt both December 31, 2021 and magnitude of the decline in value, (3) the financial condition of the issuer or issuers, (4) structure of the security, and (5) the intent to sell the security or whether it is more likely than not that2020, the Company would be required to sellhad not recorded an ACL on available-for-sale securities.
Accrued interest receivable on held-to-maturity debt securities totaled $3.4 million and $3.6 million at December 31, 2021 and 2020, respectively, and is excluded from the security before its anticipated recovery in market value.estimate of expected credit losses. The estimate of expected credit losses considers historical credit loss information adjusted for current conditions and reasonable and supportable forecasts. At December 31, 20172021 and 2016, management performed its quarterly analysis of all2020, the ACL on held-to-maturity securities with an unrealized losswas $0.6 million and concluded no individual securities were other-than-temporarily impaired.$0.4 million, respectively.
The proceeds, gross gains and losses realized from sales of available for saleavailable-for-sale investment securities were as follows:
| December 31, | |||||||||||||||||
| ($ in thousands) | 2021 | 2020 | 2019 | ||||||||||||||
| Gross gains realized | $ | — | $ | 421 | $ | 400 | |||||||||||
| Gross losses realized | — | — | (449) | ||||||||||||||
| Proceeds from sales | 27,135 | 20,221 | 357,976 | ||||||||||||||
| December 31, | |||||||||||
| (in thousands) | 2017 | 2016 | 2015 | ||||||||
| Gross gains realized | $ | 22 | $ | 86 | $ | 63 | |||||
| Gross losses realized | — | — | (40 | ) | |||||||
| Proceeds from sales | 144,076 | 2,493 | 41,069 | ||||||||
Other Investments At Cost
At December 31, 2017,2021, and 2016,2020, other investments at cost, totaled $26.7$59.9 million and $14.8$48.8 million, respectively. As a member of the FHLB system administered by the Federal Housing Finance Agency, the Bank is required to maintain a minimum investment in capital stock with the FHLB Des Moines consisting of membership stock and activity-based stock. The FHLB capital stock of $12.9$12.1 million, and $4.4$10.8 million at December 31, 2017,2021, and 2016,2020, respectively, is recorded at cost, which represents redemption value, and is included in other investments in the consolidated balance sheets. The remaining amounts in other investments primarily include various investments in SBICs, CDFIs, and the Company'sCompany’s investment in unconsolidated trusts used to issue preferred securities to third parties, (see Note 10see “Note 11 – Subordinated Debentures).Debentures.”
NOTE 5 - LOANS
(in thousands) | December 31, 2017 | December 31, 2016 | |||||
| Loans accounted for at amortized cost | $ | 4,022,896 | $ | 3,118,392 | |||
| Loans accounted for as PCI | 74,154 | 39,769 | |||||
| Total loans | $ | 4,097,050 | $ | 3,158,161 | |||
Below is a summary of loans by category at December 31, 20172021 and 2016:2020:
| (in thousands) | December 31, 2017 | December 31, 2016 | ||||||||||||||||
| ($ in thousands) | ($ in thousands) | December 31, 2021 | December 31, 2020 | |||||||||||||||
| Commercial and industrial | $ | 1,918,720 | $ | 1,632,714 | Commercial and industrial | $ | 3,396,590 | $ | 3,100,299 | |||||||||
| Real estate loans: | Real estate loans: | |||||||||||||||||
| Commercial - investor owned | 769,275 | 544,808 | Commercial - investor owned | 2,141,143 | 1,589,419 | |||||||||||||
| Commercial - owner occupied | 554,589 | 350,148 | Commercial - owner occupied | 2,035,785 | 1,498,408 | |||||||||||||
| Construction and land development | 303,091 | 194,542 | Construction and land development | 734,073 | 546,686 | |||||||||||||
| Residential | 341,312 | 240,760 | Residential | 454,052 | 319,179 | |||||||||||||
| Total real estate loans | 1,968,267 | 1,330,258 | Total real estate loans | 5,365,053 | 3,953,692 | |||||||||||||
| Consumer and other | 137,234 | 156,182 | ||||||||||||||||
| Loans, before unearned loan (fees) costs | 4,024,221 | 3,119,154 | ||||||||||||||||
| Unearned loan (fees) costs, net | (1,325 | ) | (762 | ) | ||||||||||||||
| Other | Other | 265,137 | 187,083 | |||||||||||||||
| Loans, before unearned loan fees | Loans, before unearned loan fees | 9,026,780 | 7,241,074 | |||||||||||||||
| Unearned loan fees, net | Unearned loan fees, net | (9,138) | (16,139) | |||||||||||||||
| Loans, including unearned loan fees | $ | 4,022,896 | $ | 3,118,392 | Loans, including unearned loan fees | $ | 9,017,642 | $ | 7,224,935 | |||||||||
Loans to executive officers and directors, or to entities in which such individuals had beneficial interests as a shareholder, officer, or director.director totaled $5.7 million for each year ended December 31, 2021 and 2020. Such loans were made in the normal course of business on substantially the same terms, including interest rates and collateral, as those prevailing at the time for comparable transactions with other customers and did not involve more than the normal risk of collectibility.
84
| (in thousands) | December 31, 2017 | December 31, 2016 | December 31, 2015 | ||||||||
| Balance at beginning of year | $ | 15,406 | $ | 4,394 | $ | 13,513 | |||||
| New loans and advances | 1,353 | 11,539 | 641 | ||||||||
| Payments and other reductions | (11,410 | ) | (527 | ) | (9,760 | ) | |||||
| Balance at end of year | $ | 5,349 | $ | 15,406 | $ | 4,394 | |||||
A summary of the activity, by loan category, in the allowance for loan losses for 2019, excluding the allowance on PCI loans, and the ACL on loans for 2020 and 2021 is as follows:
| ($ in thousands) | Commercial and industrial | CRE - investor owned | CRE - owner occupied | Construction and land development | Residential real estate | Other | Total | ||||||||||||||||||||||||||||||||||||||||
| Balance at December 31, 2019 | |||||||||||||||||||||||||||||||||||||||||||||||
| Allowance for loan losses: | |||||||||||||||||||||||||||||||||||||||||||||||
| Balance, beginning of year | $ | 29,039 | $ | 4,683 | $ | 4,239 | $ | 1,987 | $ | 1,616 | $ | 731 | $ | 42,295 | |||||||||||||||||||||||||||||||||
| Provision for loan losses | 4,801 | 1,708 | 673 | (237) | (330) | 67 | 6,682 | ||||||||||||||||||||||||||||||||||||||||
| Charge-offs | (6,882) | (551) | (58) | (54) | (667) | (382) | (8,594) | ||||||||||||||||||||||||||||||||||||||||
| Recoveries | 338 | 95 | 19 | 776 | 661 | 295 | 2,184 | ||||||||||||||||||||||||||||||||||||||||
| Balance, end of year | $ | 27,296 | $ | 5,935 | $ | 4,873 | $ | 2,472 | $ | 1,280 | $ | 711 | $ | 42,567 | |||||||||||||||||||||||||||||||||
| Balance at December 31, 2020 | |||||||||||||||||||||||||||||||||||||||||||||||
| Allowance for loan losses: | |||||||||||||||||||||||||||||||||||||||||||||||
| Balance at December 31, 2019 | $ | 27,296 | $ | 5,935 | $ | 4,873 | $ | 2,472 | $ | 1,280 | $ | 711 | $ | 42,567 | |||||||||||||||||||||||||||||||||
| PCI allowance at December 31, 2019 | 159 | — | — | 139 | — | 423 | 721 | ||||||||||||||||||||||||||||||||||||||||
| CECL adoption | 6,494 | 10,726 | 2,598 | 5,183 | 3,470 | (84) | 28,387 | ||||||||||||||||||||||||||||||||||||||||
| PCD loans immediately charged off | — | (5) | (57) | (217) | (1,401) | — | (1,680) | ||||||||||||||||||||||||||||||||||||||||
| Balance, beginning of year | $ | 33,949 | $ | 16,656 | $ | 7,414 | $ | 7,577 | $ | 3,349 | $ | 1,050 | $ | 69,995 | |||||||||||||||||||||||||||||||||
| Provision for loan losses | 28,373 | 11,037 | 7,845 | 13,438 | 674 | 2,012 | 63,379 | ||||||||||||||||||||||||||||||||||||||||
| Initial allowance on acquired PCD loans | 23 | 2,026 | 1,427 | 45 | 3 | — | 3,524 | ||||||||||||||||||||||||||||||||||||||||
| Charge-offs | (5,381) | (498) | (30) | (31) | (408) | (391) | (6,739) | ||||||||||||||||||||||||||||||||||||||||
| Recoveries | 1,848 | 2,841 | 356 | 384 | 967 | 116 | 6,512 | ||||||||||||||||||||||||||||||||||||||||
| Balance, end of year | $ | 58,812 | $ | 32,062 | $ | 17,012 | $ | 21,413 | $ | 4,585 | $ | 2,787 | $ | 136,671 | |||||||||||||||||||||||||||||||||
| Balance at December 31, 2021 | |||||||||||||||||||||||||||||||||||||||||||||||
| Allowance for credit losses: | |||||||||||||||||||||||||||||||||||||||||||||||
| Balance, beginning of year | $ | 58,812 | $ | 32,062 | $ | 17,012 | $ | 21,413 | $ | 4,585 | $ | 2,787 | $ | 136,671 | |||||||||||||||||||||||||||||||||
| Provision (benefit) for loan losses | 14,361 | 568 | (550) | (7,365) | 3,900 | 2,079 | 12,993 | ||||||||||||||||||||||||||||||||||||||||
| Initial allowance on acquired PCD loans | 1,077 | 3,651 | 1,504 | 37 | — | 737 | 7,006 | ||||||||||||||||||||||||||||||||||||||||
| Charge-offs | (12,113) | (2,487) | (602) | (3) | (1,521) | (459) | (17,185) | ||||||||||||||||||||||||||||||||||||||||
| Recoveries | 1,688 | 2,083 | 196 | 454 | 963 | 172 | 5,556 | ||||||||||||||||||||||||||||||||||||||||
| Balance, end of year | $ | 63,825 | $ | 35,877 | $ | 17,560 | $ | 14,536 | $ | 7,927 | $ | 5,316 | $ | 145,041 | |||||||||||||||||||||||||||||||||
The ACL on sponsor finance loans, which is included in the categories above, represented $18.2 million and $19.0 million as of December 31, 2021 and 2020, respectively.
On January 1, 2020, the Company adopted the CECL methodology which added $28.4 million to the ACL on loans. Upon adoption, $1.7 million of nonaccrual PCD loans with individual outstanding balances of less than $100,000 were immediately charged-off. Under the CECL method, the Company recorded investment$13.0 million and $63.4 million in loans by class and category basedprovision for credit losses on impairment methodloans for the years ended indicated below is as follows:
| (in thousands) | Commercial and industrial | CRE - investor owned | CRE - owner occupied | Construction and land development | Residential real estate | Consumer and other | Total | ||||||||||||||||||||
| Balance at December 31, 2017 | |||||||||||||||||||||||||||
| Allowance for loan losses: | |||||||||||||||||||||||||||
| Balance, beginning of year | $ | 26,996 | $ | 3,420 | $ | 2,890 | $ | 1,304 | $ | 2,023 | $ | 932 | $ | 37,565 | |||||||||||||
| Provision (provision reversal) | 8,737 | 456 | 404 | 336 | 797 | 34 | 10,764 | ||||||||||||||||||||
| Losses charged off | (9,872 | ) | (117 | ) | (90 | ) | (254 | ) | (973 | ) | (201 | ) | (11,507 | ) | |||||||||||||
| Recoveries | 545 | 131 | 104 | 101 | 390 | 73 | 1,344 | ||||||||||||||||||||
| Balance, end of year | $ | 26,406 | $ | 3,890 | $ | 3,308 | $ | 1,487 | $ | 2,237 | $ | 838 | $ | 38,166 | |||||||||||||
| Balance at December 31, 2016 | |||||||||||||||||||||||||||
| Allowance for loan losses: | |||||||||||||||||||||||||||
| Balance, beginning of year | $ | 22,056 | $ | 3,484 | $ | 2,969 | $ | 1,704 | $ | 1,796 | $ | 1,432 | $ | 33,441 | |||||||||||||
| Provision (provision reversal) | 6,569 | (11 | ) | (1,202 | ) | (1,334 | ) | 129 | 1,400 | 5,551 | |||||||||||||||||
| Losses charged off | (2,303 | ) | (95 | ) | — | — | (25 | ) | (1,912 | ) | (4,335 | ) | |||||||||||||||
| Recoveries | 674 | 42 | 1,123 | 934 | 123 | 12 | 2,908 | ||||||||||||||||||||
| Balance, end of year | $ | 26,996 | $ | 3,420 | $ | 2,890 | $ | 1,304 | $ | 2,023 | $ | 932 | $ | 37,565 | |||||||||||||
| Balance at December 31, 2015 | |||||||||||||||||||||||||||
| Allowance for loan losses: | |||||||||||||||||||||||||||
| Balance, beginning of year | $ | 16,983 | $ | 4,382 | $ | 3,135 | $ | 1,715 | $ | 2,830 | $ | 1,140 | $ | 30,185 | |||||||||||||
| Provision (provision reversal) | 6,976 | (303 | ) | (1,626 | ) | (335 | ) | (58 | ) | 218 | 4,872 | ||||||||||||||||
| Losses charged off | (3,699 | ) | (664 | ) | (38 | ) | (350 | ) | (1,313 | ) | (27 | ) | (6,091 | ) | |||||||||||||
| Recoveries | 1,796 | 69 | 1,498 | 674 | 337 | 101 | 4,475 | ||||||||||||||||||||
| Balance, end of year | $ | 22,056 | $ | 3,484 | $ | 2,969 | $ | 1,704 | $ | 1,796 | $ | 1,432 | $ | 33,441 | |||||||||||||
| (in thousands) | Commercial and industrial | CRE - investor owned | CRE - owner occupied | Construction and land development | Residential real estate | Consumer and other | Total | ||||||||||||||||||||
| Balance December 31, 2017 | |||||||||||||||||||||||||||
| Allowance for loan losses - Ending balance: | |||||||||||||||||||||||||||
| Individually evaluated for impairment | $ | 2,508 | $ | — | $ | 71 | $ | — | $ | — | $ | — | $ | 2,579 | |||||||||||||
| Collectively evaluated for impairment | 23,898 | 3,890 | 3,237 | 1,487 | 2,237 | 838 | 35,587 | ||||||||||||||||||||
| Total | $ | 26,406 | $ | 3,890 | $ | 3,308 | $ | 1,487 | $ | 2,237 | $ | 838 | $ | 38,166 | |||||||||||||
| Loans - Ending balance: | |||||||||||||||||||||||||||
| Individually evaluated for impairment | $ | 12,665 | $ | 422 | $ | 1,975 | $ | 136 | $ | 1,602 | $ | 375 | $ | 17,175 | |||||||||||||
| Collectively evaluated for impairment | 1,906,055 | 768,853 | 552,614 | 302,955 | 339,710 | 135,534 | 4,005,721 | ||||||||||||||||||||
| Total | $ | 1,918,720 | $ | 769,275 | $ | 554,589 | $ | 303,091 | $ | 341,312 | $ | 135,909 | $ | 4,022,896 | |||||||||||||
| Balance December 31, 2016 | |||||||||||||||||||||||||||
| Allowance for loan losses - Ending balance: | |||||||||||||||||||||||||||
| Individually evaluated for impairment | $ | 2,909 | $ | — | $ | — | $ | 155 | $ | — | $ | — | $ | 3,064 | |||||||||||||
| Collectively evaluated for impairment | 24,087 | 3,420 | 2,890 | 1,149 | 2,023 | 932 | 34,501 | ||||||||||||||||||||
| Total | $ | 26,996 | $ | 3,420 | $ | 2,890 | $ | 1,304 | $ | 2,023 | $ | 932 | $ | 37,565 | |||||||||||||
| Loans - Ending balance: | |||||||||||||||||||||||||||
| Individually evaluated for impairment | $ | 12,523 | $ | 430 | $ | 1,854 | $ | 1,903 | $ | 62 | $ | — | $ | 16,772 | |||||||||||||
| Collectively evaluated for impairment | 1,620,191 | 544,378 | 348,294 | 192,639 | 240,698 | 155,420 | 3,101,620 | ||||||||||||||||||||
| Total | $ | 1,632,714 | $ | 544,808 | $ | 350,148 | $ | 194,542 | $ | 240,760 | $ | 155,420 | $ | 3,118,392 | |||||||||||||
The CECL methodology incorporates various economic scenarios. The Company utilizes three forecasts in the model; Moody’s baseline, a stronger near-term growth upside and a moderate recession downside forecast. The Company weights these scenarios at 40%, 30%, and 30%, respectively, which added approximately $17.5 million to the ACL over the baseline model. These forecasts incorporate an expectation that government stimulus will decline, the Federal Reserve will wind down quantitative easing and begin raising the federal funds rate, and that the
85
| December 31, 2017 | |||||||||||||||||||||||
| (in thousands) | Unpaid Contractual Principal Balance | Recorded Investment With No Allowance | Recorded Investment With Allowance | Total Recorded Investment | Related Allowance | Average Recorded Investment | |||||||||||||||||
| Commercial and industrial | $ | 20,750 | $ | 2,321 | $ | 10,344 | $ | 12,665 | $ | 2,508 | $ | 16,270 | |||||||||||
| Real estate: | |||||||||||||||||||||||
| Commercial - investor owned | 560 | 422 | — | 422 | — | 521 | |||||||||||||||||
| Commercial - owner occupied | 487 | — | 487 | 487 | 71 | 490 | |||||||||||||||||
| Construction and land development | 441 | 136 | — | 136 | — | 331 | |||||||||||||||||
| Residential | 1,730 | 1,602 | — | 1,602 | — | 1,735 | |||||||||||||||||
| Consumer and other | 375 | 375 | — | 375 | — | 375 | |||||||||||||||||
| Total | $ | 24,343 | $ | 4,856 | $ | 10,831 | $ | 15,687 | $ | 2,579 | $ | 19,722 | |||||||||||
| December 31, 2016 | |||||||||||||||||||||||
| (in thousands) | Unpaid Contractual Principal Balance | Recorded Investment With No Allowance | Recorded Investment With Allowance | Total Recorded Investment | Related Allowance | Average Recorded Investment | |||||||||||||||||
| Commercial and industrial | $ | 12,341 | $ | 566 | $ | 11,791 | $ | 12,357 | $ | 2,909 | $ | 4,489 | |||||||||||
| Real estate: | |||||||||||||||||||||||
| Commercial - investor owned | 525 | 435 | — | 435 | — | 668 | |||||||||||||||||
| Commercial - owner occupied | 225 | 231 | — | 231 | — | 227 | |||||||||||||||||
| Construction and land development | 1,904 | 1,947 | 359 | 2,306 | 155 | 1,918 | |||||||||||||||||
| Residential | 62 | 62 | — | 62 | — | 64 | |||||||||||||||||
| Consumer and other | — | — | — | — | — | — | |||||||||||||||||
| Total | $ | 15,057 | $ | 3,241 | $ | 12,150 | $ | 15,391 | $ | 3,064 | $ | 7,366 | |||||||||||
| December 31, | |||||||||||
| (in thousands) | 2017 | 2016 | 2015 | ||||||||
| Total interest income that would have been recognized under original terms on impaired loans | $ | 1,324 | $ | 1,079 | $ | 1,038 | |||||
| Total cash received and recognized as interest income on impaired loans | 643 | 251 | 226 | ||||||||
| Total interest income recognized on impaired loans still accruing | 63 | 155 | 36 | ||||||||
The recorded investment in nonperforming loans by category at December 31, 20172021 and 2016,2020 is as follows:
| December 31, 2021 | |||||||||||||||||||||||||||||
| ($ in thousands) | Non-accrual | Restructured, accruing | Loans over 90 days past due and still accruing interest | Total nonperforming loans | Nonaccrual loans with no allowance | ||||||||||||||||||||||||
| Commercial and industrial | $ | 17,052 | $ | 2,783 | $ | 1,703 | $ | 21,538 | $ | 5,685 | |||||||||||||||||||
| Real estate: | |||||||||||||||||||||||||||||
| Commercial - investor owned | 1,575 | — | — | 1,575 | 168 | ||||||||||||||||||||||||
| Commercial - owner occupied | 2,839 | — | — | 2,839 | 2,550 | ||||||||||||||||||||||||
| Residential | 1,971 | 76 | 1 | 2,048 | 1,348 | ||||||||||||||||||||||||
| Other | 12 | — | 12 | 24 | — | ||||||||||||||||||||||||
| Total | $ | 23,449 | $ | 2,859 | $ | 1,716 | $ | 28,024 | $ | 9,751 | |||||||||||||||||||
| December 31, 2020 | |||||||||||||||||||||||||||||
| ($ in thousands) | Non-accrual | Restructured, accruing | Loans over 90 days past due and still accruing interest | Total nonperforming loans | Nonaccrual loans with no allowance | ||||||||||||||||||||||||
| Commercial and industrial | $ | 18,158 | $ | 3,482 | $ | 130 | $ | 21,770 | $ | 8,316 | |||||||||||||||||||
| Real estate: | |||||||||||||||||||||||||||||
| Commercial - investor owned | 9,579 | — | — | 9,579 | 716 | ||||||||||||||||||||||||
| Commercial - owner occupied | 2,940 | — | — | 2,940 | 6,024 | ||||||||||||||||||||||||
| Residential | 4,112 | 77 | — | 4,189 | — | ||||||||||||||||||||||||
| Other | 29 | — | — | 29 | 3,190 | ||||||||||||||||||||||||
| Total | $ | 34,818 | $ | 3,559 | $ | 130 | $ | 38,507 | $ | 18,246 | |||||||||||||||||||
86
| December 31, 2017 | |||||||||||
| (in thousands) | Non-accrual | Restructured, not on non-accrual | Total | ||||||||
| Commercial and industrial | $ | 11,946 | $ | 719 | $ | 12,665 | |||||
| Real estate: | |||||||||||
| Commercial - investor owned | 422 | — | 422 | ||||||||
| Commercial - owner occupied | 487 | — | 487 | ||||||||
| Construction and land development | 136 | — | 136 | ||||||||
| Residential | 1,602 | — | 1,602 | ||||||||
| Consumer and other | 375 | — | 375 | ||||||||
| Total | $ | 14,968 | $ | 719 | $ | 15,687 | |||||
| December 31, 2021 | |||||||||||||||||||||||
| Type of Collateral | |||||||||||||||||||||||
| (in thousands) | Commercial Real Estate | Residential Real Estate | Blanket Lien | ||||||||||||||||||||
| Commercial and industrial | $ | 4,271 | $ | 209 | $ | 9,312 | |||||||||||||||||
| Real estate: | |||||||||||||||||||||||
| Commercial - investor owned | 169 | 1,200 | — | ||||||||||||||||||||
| Commercial - owner occupied | 2,807 | 32 | — | ||||||||||||||||||||
| Residential | — | 2,048 | — | ||||||||||||||||||||
| Total | $ | 7,247 | $ | 3,489 | $ | 9,312 | |||||||||||||||||
| December 31, 2016 | |||||||||||
| (in thousands) | Non-accrual | Restructured, not on non-accrual | Total | ||||||||
| Commercial and industrial | $ | 10,046 | $ | 2,311 | $ | 12,357 | |||||
| Real estate: | |||||||||||
| Commercial - investor owned | 435 | — | 435 | ||||||||
| Commercial - owner occupied | 231 | — | 231 | ||||||||
| Construction and land development | 2,286 | 20 | 2,306 | ||||||||
| Residential | 62 | — | 62 | ||||||||
| Consumer and other | — | — | — | ||||||||
| Total | $ | 13,060 | $ | 2,331 | $ | 15,391 | |||||
| December 31, 2020 | |||||||||||||||||||||||
| Type of Collateral | |||||||||||||||||||||||
| (in thousands) | Commercial Real Estate | Residential Real Estate | Blanket Lien | Other | |||||||||||||||||||
| Commercial and industrial | $ | 8,316 | $ | — | $ | 394 | $ | — | |||||||||||||||
| Real estate: | |||||||||||||||||||||||
| Commercial - investor owned | 9,579 | — | — | — | |||||||||||||||||||
| Commercial - owner occupied | 2,940 | — | — | — | |||||||||||||||||||
| Residential | — | 4,135 | — | — | |||||||||||||||||||
| Other | — | — | — | 17 | |||||||||||||||||||
| Total | $ | 20,835 | $ | 4,135 | $ | 394 | $ | 17 | |||||||||||||||
The recorded investment by category for the portfolio loans that have been restructured during the years ended December 31, 20172021 and 2016,2020 is as follows:
| Year ended December 31, 2021 | Year ended December 31, 2020 | ||||||||||||||||||||||||||||||||||
| ($ in thousands, except for number of loans) | Number of Loans | Pre-Modification Outstanding Recorded Balance | Post-Modification Outstanding Recorded Balance | Number of Loans | Pre-Modification Outstanding Recorded Balance | Post-Modification Outstanding Recorded Balance | |||||||||||||||||||||||||||||
| Commercial and industrial | — | $ | — | $ | — | 3 | $ | 7,447 | $ | 7,447 | |||||||||||||||||||||||||
| Real estate: | |||||||||||||||||||||||||||||||||||
| Residential | 1 | 221 | 221 | 3 | 372 | 372 | |||||||||||||||||||||||||||||
| Total | 1 | $ | 221 | $ | 221 | 6 | $ | 7,819 | $ | 7,819 | |||||||||||||||||||||||||
| Year ended December 31, 2017 | Year ended December 31, 2016 | ||||||||||||||||||||
| (in thousands, except for number of loans) | Number of Loans | Pre-Modification Outstanding Recorded Balance | Post-Modification Outstanding Recorded Balance | Number of Loans | Pre-Modification Outstanding Recorded Balance | Post-Modification Outstanding Recorded Balance | |||||||||||||||
| Commercial and industrial | 1 | $ | 676 | $ | 676 | 4 | $ | 12,114 | $ | 12,114 | |||||||||||
| Real estate: | |||||||||||||||||||||
| Commercial - investor owned | — | — | — | 1 | 248 | 248 | |||||||||||||||
| Commercial - owner occupied | — | — | — | 1 | 13 | 13 | |||||||||||||||
| Construction and land development | — | — | — | 1 | 20 | 20 | |||||||||||||||
| Residential | — | — | — | — | — | — | |||||||||||||||
| Consumer and other | — | — | — | — | — | — | |||||||||||||||
| Total | 1 | $ | 676 | $ | 676 | 7 | $ | 12,395 | $ | 12,395 | |||||||||||
| Year ended December 31, 2021 | |||||||||||||||||||||||
| ($ in thousands, except for number of loans) | Number of Loans | Recorded Balance | |||||||||||||||||||||
| Real Estate: | |||||||||||||||||||||||
| Residential | 1 | 148 | |||||||||||||||||||||
There were no restructured loans that subsequently defaulted during the year ended December 31, 2020.
87
| Year ended December 31, 2017 | Year ended December 31, 2016 | ||||||||||
| (in thousands, except for number of loans) | Number of Loans | Recorded Balance | Number of Loans | Recorded Balance | |||||||
| Commercial and industrial | 2 | 343 | — | — | |||||||
| Real Estate: | |||||||||||
| Residential | 1 | 5 | — | — | |||||||
| Total | 3 | 348 | — | — | |||||||
In response to the COVID-19 pandemic, the Company implemented short-term deferral programs allowing customers to primarily defer payments for up to 90 days. Deferrals under the CARES Act or interagency guidance are not included above as troubled debt restructurings. As of December 31, 2021, substantially all of these loans have returned to a current payment status.
The aging of the recorded investment in past due portfolio loans by portfolio class and category at December 31, 20172021 and 20162020 is shown below:
| December 31, 2021 | |||||||||||||||||||||||||||||
| ($ in thousands) | 30-89 Days Past Due | 90 or More Days Past Due | Total Past Due | Current | Total | ||||||||||||||||||||||||
| Commercial and industrial | $ | 24,447 | $ | 14,158 | $ | 38,605 | $ | 3,353,770 | $ | 3,392,375 | |||||||||||||||||||
| Real estate: | |||||||||||||||||||||||||||||
| Commercial - investor owned | 3,880 | — | 3,880 | 2,137,263 | 2,141,143 | ||||||||||||||||||||||||
| Commercial - owner occupied | 10,070 | 289 | 10,359 | 2,025,426 | 2,035,785 | ||||||||||||||||||||||||
| Construction and land development | 24 | — | 24 | 734,049 | 734,073 | ||||||||||||||||||||||||
| Residential | 3,181 | 1,305 | 4,486 | 449,566 | 454,052 | ||||||||||||||||||||||||
| Other | 37 | 11 | 48 | 260,166 | 260,214 | ||||||||||||||||||||||||
| Total | $ | 41,639 | $ | 15,763 | $ | 57,402 | $ | 8,960,240 | $ | 9,017,642 | |||||||||||||||||||
| December 31, 2017 | |||||||||||||||||||
| (in thousands) | 30-89 Days Past Due | 90 or More Days Past Due | Total Past Due | Current | Total | ||||||||||||||
| Commercial and industrial | $ | 7,882 | $ | 1,770 | $ | 9,652 | $ | 1,909,068 | $ | 1,918,720 | |||||||||
| Real estate: | |||||||||||||||||||
| Commercial - investor owned | 934 | — | 934 | 768,341 | 769,275 | ||||||||||||||
| Commercial - owner occupied | — | — | — | 554,589 | 554,589 | ||||||||||||||
| Construction and land development | 76 | — | 76 | 303,015 | 303,091 | ||||||||||||||
| Residential | 1,529 | 945 | 2,474 | 338,838 | 341,312 | ||||||||||||||
| Consumer and other | 407 | — | 407 | 135,502 | 135,909 | ||||||||||||||
| Total | $ | 10,828 | $ | 2,715 | $ | 13,543 | $ | 4,009,353 | $ | 4,022,896 | |||||||||
| December 31, 2020 | |||||||||||||||||||||||||||||
| ($ in thousands) | 30-89 Days Past Due | 90 or More Days Past Due | Total Past Due | Current | Total | ||||||||||||||||||||||||
| Commercial and industrial | $ | 8,652 | $ | 12,928 | $ | 21,580 | $ | 3,067,415 | $ | 3,088,995 | |||||||||||||||||||
| Real estate: | |||||||||||||||||||||||||||||
| Commercial - investor owned | 734 | 9,301 | 10,035 | 1,579,384 | 1,589,419 | ||||||||||||||||||||||||
| Commercial - owner occupied | 328 | 4,647 | 4,975 | 1,493,433 | 1,498,408 | ||||||||||||||||||||||||
| Construction and land development | 13 | — | 13 | 546,673 | 546,686 | ||||||||||||||||||||||||
| Residential | 2,071 | 2,118 | 4,189 | 314,990 | 319,179 | ||||||||||||||||||||||||
| Other | 1,731 | 50 | 1,781 | 180,467 | 182,248 | ||||||||||||||||||||||||
| Total | $ | 13,529 | $ | 29,044 | $ | 42,573 | $ | 7,182,362 | $ | 7,224,935 | |||||||||||||||||||
| December 31, 2016 | |||||||||||||||||||
| (in thousands) | 30-89 Days Past Due | 90 or More Days Past Due | Total Past Due | Current | Total | ||||||||||||||
| Commercial and industrial | $ | 334 | $ | 171 | $ | 505 | $ | 1,632,209 | $ | 1,632,714 | |||||||||
| Real estate: | |||||||||||||||||||
| Commercial - investor owned | — | 175 | 175 | 544,633 | 544,808 | ||||||||||||||
| Commercial - owner occupied | 212 | 225 | 437 | 349,711 | 350,148 | ||||||||||||||
| Construction and land development | 355 | 1,528 | 1,883 | 192,659 | 194,542 | ||||||||||||||
| Residential | 91 | — | 91 | 240,669 | 240,760 | ||||||||||||||
| Consumer and other | 7 | — | 7 | 155,413 | 155,420 | ||||||||||||||
| Total | $ | 999 | $ | 2,099 | $ | 3,098 | $ | 3,115,294 | $ | 3,118,392 | |||||||||
The Company categorizes loans into risk categories based on relevant information about the ability of borrowers to service their debt, such as current financial information, historical payment experience, credit documentation, and current economic factors among other factors. This analysis is performed on a quarterly basis. The Company uses the following definitions for risk ratings:
•Grades 1, 2, and 3 – Includes loans to borrowers with a continuous record of strong earnings, sound balance sheet condition and capitalization, ample liquidity with solid cash flow, and whose management team has experience and depth within their industry.
•Grade 4 – Includes loans to borrowers with positive trends in profitability, satisfactory capitalization and balance sheet condition, and sufficient liquidity and cash flow.
•Grade 5 – Includes loans to borrowers that may display fluctuating trends in sales, profitability, capitalization, liquidity, and cash flow.
•Grade 6 – Includes loans to borrowers where an adverse change or perceived weakness has occurred, but may be correctable in the near future. Alternatively, this rating category may also include circumstances where the borrower is starting to reverse a negative trend or condition, or has recently been upgraded from a 7, 8, or 9 rating.
88
•Grade 7 – Watch credits are borrowers that have experienced financial setback of a nature that is not determined to be severe or influence ‘ongoing concern’ expectations. Although possible, no loss is anticipated, due to strong collateral and/or guarantor support.
•Grade 8 – Substandard credits will include those borrowers characterized by significant losses and sustained downward trends in balance sheet condition, liquidity, and cash flow. Repayment reliance may have shifted to secondary sources. Collateral exposure may exist and additional reserves may be warranted.
•Grade 9 – Doubtful credits include borrowers that may show deteriorating trends that are unlikely to be corrected. Collateral values may appear insufficient for full recovery, therefore requiring a partial charge-off, or debt renegotiation with the borrower. The borrower may have declared bankruptcy or bankruptcy is likely in the near term. All doubtful rated credits will be on non-accrual.
89
The recorded investment by risk category of the loans by portfolio class and categoryyear of origination is presented in the following tables as of the dates indicated:
| December 31, 2021 | ||||||||||||||||||||||||||||||||||||||||||||||||||||||||
| Term Loans by Origination Year | ||||||||||||||||||||||||||||||||||||||||||||||||||||||||
| (in thousands) | 2021 | 2020 | 2019 | 2018 | 2017 | Prior | Revolving Loans Converted to Term Loans | Revolving Loans | Total | |||||||||||||||||||||||||||||||||||||||||||||||
| Commercial and industrial | ||||||||||||||||||||||||||||||||||||||||||||||||||||||||
| Pass (1-6) | $ | 1,180,601 | $ | 477,374 | $ | 317,869 | $ | 132,851 | $ | 116,738 | $ | 82,846 | $ | 11,648 | $ | 854,102 | $ | 3,174,029 | ||||||||||||||||||||||||||||||||||||||
| Watch (7) | 35,005 | 17,502 | 9,404 | 9,880 | 12,217 | 10,979 | 4,037 | 53,595 | 152,619 | |||||||||||||||||||||||||||||||||||||||||||||||
| Classified (8-9) | 14,917 | 3,530 | 3,840 | 1,689 | 2,988 | 813 | 787 | 10,996 | 39,560 | |||||||||||||||||||||||||||||||||||||||||||||||
| Total Commercial and industrial | $ | 1,230,523 | $ | 498,406 | $ | 331,113 | $ | 144,420 | $ | 131,943 | $ | 94,638 | $ | 16,472 | $ | 918,693 | $ | 3,366,208 | ||||||||||||||||||||||||||||||||||||||
| Commercial real estate-investor owned | ||||||||||||||||||||||||||||||||||||||||||||||||||||||||
| Pass (1-6) | $ | 651,740 | $ | 476,946 | $ | 346,245 | $ | 146,107 | $ | 112,043 | $ | 217,808 | $ | 3,625 | $ | 68,236 | $ | 2,022,750 | ||||||||||||||||||||||||||||||||||||||
| Watch (7) | 16,871 | 35,908 | 32,755 | 1,003 | 502 | 17,478 | 300 | 2,062 | 106,879 | |||||||||||||||||||||||||||||||||||||||||||||||
| Classified (8-9) | 1,376 | 3,135 | 835 | 817 | 1,159 | 4,141 | — | 50 | 11,513 | |||||||||||||||||||||||||||||||||||||||||||||||
| Total Commercial real estate-investor owned | $ | 669,987 | $ | 515,989 | $ | 379,835 | $ | 147,927 | $ | 113,704 | $ | 239,427 | $ | 3,925 | $ | 70,348 | $ | 2,141,142 | ||||||||||||||||||||||||||||||||||||||
| Commercial real estate-owner occupied | ||||||||||||||||||||||||||||||||||||||||||||||||||||||||
| Pass (1-6) | $ | 604,975 | $ | 423,263 | $ | 278,830 | $ | 164,210 | $ | 140,515 | $ | 235,973 | $ | 250 | $ | 48,349 | $ | 1,896,365 | ||||||||||||||||||||||||||||||||||||||
| Watch (7) | 12,825 | 13,585 | 4,301 | 16,774 | 10,274 | 15,764 | — | 300 | 73,823 | |||||||||||||||||||||||||||||||||||||||||||||||
| Classified (8-9) | 2,048 | 556 | 9,181 | 17,016 | 6,432 | 6,959 | — | — | 42,192 | |||||||||||||||||||||||||||||||||||||||||||||||
| Total Commercial real estate-owner occupied | $ | 619,848 | $ | 437,404 | $ | 292,312 | $ | 198,000 | $ | 157,221 | $ | 258,696 | $ | 250 | $ | 48,649 | $ | 2,012,380 | ||||||||||||||||||||||||||||||||||||||
| Construction real estate | ||||||||||||||||||||||||||||||||||||||||||||||||||||||||
| Pass (1-6) | $ | 310,140 | $ | 229,396 | $ | 70,531 | $ | 35,936 | $ | 14,860 | $ | 7,180 | $ | 568 | $ | 2,992 | $ | 671,603 | ||||||||||||||||||||||||||||||||||||||
| Watch (7) | 28,947 | 15,348 | 60 | 1,199 | 11,068 | 2,330 | — | — | 58,952 | |||||||||||||||||||||||||||||||||||||||||||||||
| Classified (8-9) | — | — | 387 | 419 | — | 22 | — | — | 828 | |||||||||||||||||||||||||||||||||||||||||||||||
| Total Construction real estate | $ | 339,087 | $ | 244,744 | $ | 70,978 | $ | 37,554 | $ | 25,928 | $ | 9,532 | $ | 568 | $ | 2,992 | $ | 731,383 | ||||||||||||||||||||||||||||||||||||||
| Residential real estate | ||||||||||||||||||||||||||||||||||||||||||||||||||||||||
| Pass (1-6) | $ | 116,352 | $ | 66,481 | $ | 21,356 | $ | 14,841 | $ | 24,778 | $ | 103,840 | $ | 9,980 | $ | 87,146 | $ | 444,774 | ||||||||||||||||||||||||||||||||||||||
| Watch (7) | 2,425 | 2 | 622 | 1,157 | 248 | 1,305 | — | 79 | 5,838 | |||||||||||||||||||||||||||||||||||||||||||||||
| Classified (8-9) | 414 | 169 | 554 | — | 12 | 2,024 | — | — | 3,173 | |||||||||||||||||||||||||||||||||||||||||||||||
| Total residential real estate | $ | 119,191 | $ | 66,652 | $ | 22,532 | $ | 15,998 | $ | 25,038 | $ | 107,169 | $ | 9,980 | $ | 87,225 | $ | 453,785 | ||||||||||||||||||||||||||||||||||||||
| Other | ||||||||||||||||||||||||||||||||||||||||||||||||||||||||
| Pass (1-6) | $ | 108,209 | $ | 68,806 | $ | 22,684 | $ | 23,145 | $ | 6,924 | $ | 13,832 | $ | 1,500 | $ | 9,166 | $ | 254,266 | ||||||||||||||||||||||||||||||||||||||
| Watch (7) | — | — | — | 4 | — | 2,440 | — | 1 | 2,445 | |||||||||||||||||||||||||||||||||||||||||||||||
| Classified (8-9) | — | — | 10 | 10 | — | 16 | — | 2 | 38 | |||||||||||||||||||||||||||||||||||||||||||||||
| Total Other | $ | 108,209 | $ | 68,806 | $ | 22,694 | $ | 23,159 | $ | 6,924 | $ | 16,288 | $ | 1,500 | $ | 9,169 | $ | 256,749 | ||||||||||||||||||||||||||||||||||||||
| Total loans classified by risk category | $ | 3,086,845 | $ | 1,832,001 | $ | 1,119,464 | $ | 567,058 | $ | 460,758 | $ | 725,750 | $ | 32,695 | $ | 1,137,076 | $ | 8,961,647 | ||||||||||||||||||||||||||||||||||||||
| Total loans classified by performing status | 55,995 | |||||||||||||||||||||||||||||||||||||||||||||||||||||||
| Total loans | $ | 9,017,642 | ||||||||||||||||||||||||||||||||||||||||||||||||||||||
90
| December 31, 2020 | ||||||||||||||||||||||||||||||||||||||||||||||||||||||||
| Term Loans by Origination Year | ||||||||||||||||||||||||||||||||||||||||||||||||||||||||
| (in thousands) | 2020 | 2019 | 2018 | 2017 | 2016 | Prior | Revolving Loans Converted to Term Loans | Revolving Loans | Total | |||||||||||||||||||||||||||||||||||||||||||||||
| Commercial and industrial | ||||||||||||||||||||||||||||||||||||||||||||||||||||||||
| Pass (1-6) | $ | 1,402,276 | $ | 454,729 | $ | 262,258 | $ | 132,832 | $ | 25,057 | $ | 58,315 | $ | 14,118 | $ | 527,170 | $ | 2,876,755 | ||||||||||||||||||||||||||||||||||||||
| Watch (7) | 44,922 | 15,369 | 9,585 | 7,509 | 19,613 | 110 | — | 60,448 | 157,556 | |||||||||||||||||||||||||||||||||||||||||||||||
| Classified (8-9) | 6,602 | 9,219 | 3,115 | 3,964 | 4,490 | 1,080 | 1,281 | 22,432 | 52,183 | |||||||||||||||||||||||||||||||||||||||||||||||
| Total Commercial and industrial | $ | 1,453,800 | $ | 479,317 | $ | 274,958 | $ | 144,305 | $ | 49,160 | $ | 59,505 | $ | 15,399 | $ | 610,050 | $ | 3,086,494 | ||||||||||||||||||||||||||||||||||||||
| Commercial real estate-investor owned | ||||||||||||||||||||||||||||||||||||||||||||||||||||||||
| Pass (1-6) | $ | 481,867 | $ | 338,843 | $ | 189,305 | $ | 131,718 | $ | 138,288 | $ | 161,439 | $ | 6,509 | $ | 32,058 | $ | 1,480,027 | ||||||||||||||||||||||||||||||||||||||
| Watch (7) | 32,308 | 19,722 | 6,656 | — | 9,647 | 17,370 | — | — | 85,703 | |||||||||||||||||||||||||||||||||||||||||||||||
| Classified (8-9) | — | 5,278 | 8,716 | 5,830 | 1,245 | 2,620 | — | — | 23,689 | |||||||||||||||||||||||||||||||||||||||||||||||
| Total Commercial real estate-investor owned | $ | 514,175 | $ | 363,843 | $ | 204,677 | $ | 137,548 | $ | 149,180 | $ | 181,429 | $ | 6,509 | $ | 32,058 | $ | 1,589,419 | ||||||||||||||||||||||||||||||||||||||
| Commercial real estate-owner occupied | ||||||||||||||||||||||||||||||||||||||||||||||||||||||||
| Pass (1-6) | $ | 419,142 | $ | 287,001 | $ | 215,181 | $ | 179,382 | $ | 104,470 | $ | 167,456 | $ | 2,672 | $ | 45,323 | $ | 1,420,627 | ||||||||||||||||||||||||||||||||||||||
| Watch (7) | 13,657 | 5,257 | 3,113 | 6,198 | 4,338 | 8,460 | 1,776 | 941 | 43,740 | |||||||||||||||||||||||||||||||||||||||||||||||
| Classified (8-9) | 2,420 | 7,427 | 5,822 | 6,140 | 1,309 | 10,860 | — | 63 | 34,041 | |||||||||||||||||||||||||||||||||||||||||||||||
| Total Commercial real estate-owner occupied | $ | 435,219 | $ | 299,685 | $ | 224,116 | $ | 191,720 | $ | 110,117 | $ | 186,776 | $ | 4,448 | $ | 46,327 | $ | 1,498,408 | ||||||||||||||||||||||||||||||||||||||
| Construction real estate | ||||||||||||||||||||||||||||||||||||||||||||||||||||||||
| Pass (1-6) | $ | 223,069 | $ | 156,360 | $ | 45,460 | $ | 18,579 | $ | 11,539 | $ | 9,144 | $ | — | $ | 28,880 | $ | 493,031 | ||||||||||||||||||||||||||||||||||||||
| Watch (7) | 2,544 | 86 | 34,179 | 11,632 | — | 2,499 | — | — | 50,940 | |||||||||||||||||||||||||||||||||||||||||||||||
| Classified (8-9) | 56 | 2,124 | 503 | 1 | — | 31 | — | — | 2,715 | |||||||||||||||||||||||||||||||||||||||||||||||
| Total Construction real estate | $ | 225,669 | $ | 158,570 | $ | 80,142 | $ | 30,212 | $ | 11,539 | $ | 11,674 | $ | — | $ | 28,880 | $ | 546,686 | ||||||||||||||||||||||||||||||||||||||
| Residential real estate | ||||||||||||||||||||||||||||||||||||||||||||||||||||||||
| Pass (1-6) | $ | 57,059 | $ | 27,907 | $ | 17,718 | $ | 17,138 | $ | 27,443 | $ | 92,657 | $ | 1,172 | $ | 66,902 | $ | 307,996 | ||||||||||||||||||||||||||||||||||||||
| Watch (7) | 210 | 840 | 526 | — | 514 | 1,603 | 287 | 511 | 4,491 | |||||||||||||||||||||||||||||||||||||||||||||||
| Classified (8-9) | 571 | 733 | 121 | 14 | 898 | 3,181 | — | 253 | 5,771 | |||||||||||||||||||||||||||||||||||||||||||||||
| Total residential real estate | $ | 57,840 | $ | 29,480 | $ | 18,365 | $ | 17,152 | $ | 28,855 | $ | 97,441 | $ | 1,459 | $ | 67,666 | $ | 318,258 | ||||||||||||||||||||||||||||||||||||||
| Other | ||||||||||||||||||||||||||||||||||||||||||||||||||||||||
| Pass (1-6) | $ | 43,526 | $ | 28,195 | $ | 30,074 | $ | 9,646 | $ | 5,641 | $ | 17,027 | $ | — | $ | 40,779 | $ | 174,888 | ||||||||||||||||||||||||||||||||||||||
| Watch (7) | — | 1 | 8 | — | — | 2,637 | — | 1 | 2,647 | |||||||||||||||||||||||||||||||||||||||||||||||
| Classified (8-9) | — | 18 | 19 | 13 | — | 17 | 8 | 4 | 79 | |||||||||||||||||||||||||||||||||||||||||||||||
| Total Other | $ | 43,526 | $ | 28,214 | $ | 30,101 | $ | 9,659 | $ | 5,641 | $ | 19,681 | $ | 8 | $ | 40,784 | $ | 177,614 | ||||||||||||||||||||||||||||||||||||||
| Total loans classified by risk category | $ | 2,730,229 | $ | 1,359,109 | $ | 832,359 | $ | 530,596 | $ | 354,492 | $ | 556,506 | $ | 27,823 | $ | 825,765 | $ | 7,216,879 | ||||||||||||||||||||||||||||||||||||||
| Total loans classified by performing status | 8,056 | |||||||||||||||||||||||||||||||||||||||||||||||||||||||
| Total loans | $ | 7,224,935 | ||||||||||||||||||||||||||||||||||||||||||||||||||||||
91
In the tables above, loan originations in 2021 and 2020 with a classification of watch or classified primarily represent renewals or modifications initially underwritten and originated in prior years.
For certain loans, primarily credit cards, the Company evaluates credit quality based on the aging status.
The following tables present the recorded investment on loans based on aging status:
| December 31, 2021 | |||||||||||||||||
| (in thousands) | Performing | Non Performing | Total | ||||||||||||||
| Commercial and industrial | $ | 26,166 | $ | 1 | $ | 26,167 | |||||||||||
| Real estate: | |||||||||||||||||
| Commercial - investor owned | 1 | — | 1 | ||||||||||||||
| Commercial - owner occupied | 23,405 | — | 23,405 | ||||||||||||||
| Construction and land development | 2,690 | — | 2,690 | ||||||||||||||
| Residential | 267 | — | 267 | ||||||||||||||
| Other | 3,453 | 12 | 3,465 | ||||||||||||||
| Total | $ | 55,982 | $ | 13 | $ | 55,995 | |||||||||||
| December 31, 2020 | |||||||||||||||||
| (in thousands) | Performing | Non Performing | Total | ||||||||||||||
| Commercial and industrial | $ | 2,502 | $ | — | $ | 2,502 | |||||||||||
| Real estate: | |||||||||||||||||
| Residential | 921 | — | 921 | ||||||||||||||
| Other | 4,612 | 21 | 4,633 | ||||||||||||||
| Total | $ | 8,035 | $ | 21 | $ | 8,056 | |||||||||||
The Company has purchased loans, for which there was, at December 31, 2017 and December 31, 2016acquisition, evidence of more than insignificant deterioration of credit quality since origination. The carrying amount of those loans is as follows:
| ($ in thousands) | At July 21, 2021 | ||||
| Par value of acquired loans | $ | 180,440 | |||
| Allowance for credit losses | (7,006) | ||||
| Non-credit discount | (6,428) | ||||
| Purchase price of acquired loans | $ | 167,006 | |||
92
| December 31, 2017 | |||||||||||||||
| (in thousands) | Pass (1-6) | Watch (7) | Substandard (8) | Total | |||||||||||
| Commercial and industrial | $ | 1,769,102 | $ | 94,002 | $ | 55,616 | $ | 1,918,720 | |||||||
| Real estate: | |||||||||||||||
| Commercial - investor owned | 754,010 | 10,840 | 4,425 | 769,275 | |||||||||||
| Commercial - owner occupied | 514,616 | 34,440 | 5,533 | 554,589 | |||||||||||
| Construction and land development | 292,766 | 9,983 | 342 | 303,091 | |||||||||||
| Residential | 329,742 | 3,648 | 7,922 | 341,312 | |||||||||||
| Consumer and other | 134,704 | 10 | 1,195 | 135,909 | |||||||||||
| Total | $ | 3,794,940 | $ | 152,923 | $ | 75,033 | $ | 4,022,896 | |||||||
| December 31, 2016 | |||||||||||||||
| (in thousands) | Pass (1-6) | Watch (7) | Substandard (8) | Total | |||||||||||
| Commercial and industrial | $ | 1,499,114 | $ | 57,416 | $ | 76,184 | $ | 1,632,714 | |||||||
| Real estate: | |||||||||||||||
| Commercial - investor owned | 530,494 | 10,449 | 3,865 | 544,808 | |||||||||||
| Commercial - owner occupied | 306,658 | 39,249 | 4,241 | 350,148 | |||||||||||
| Construction and land development | 185,505 | 6,575 | 2,462 | 194,542 | |||||||||||
| Residential | 233,479 | 2,997 | 4,284 | 240,760 | |||||||||||
| Consumer and other | 153,984 | — | 1,436 | 155,420 | |||||||||||
| Total | $ | 2,909,234 | $ | 116,686 | $ | 92,472 | $ | 3,118,392 | |||||||
| December 31, 2017 | December 31, 2016 | ||||||||
| ($ in thousands) | Weighted- Average Risk Rating1 | Recorded Investment PCI Loans | Weighted- Average Risk Rating1 | Recorded Investment PCI Loans | |||||
| Commercial and industrial | 6.38 | $ | 3,212 | 5.87 | $ | 3,523 | |||
| Real estate loans: | |||||||||
| Commercial - investor owned | 7.36 | 42,887 | 6.95 | 8,162 | |||||
| Commercial - owner occupied | 6.48 | 11,332 | 6.39 | 11,863 | |||||
| Construction and land development | 5.99 | 5,883 | 5.80 | 4,365 | |||||
| Residential | 5.99 | 10,781 | 5.64 | 11,792 | |||||
| Total real estate loans | 70,883 | 36,182 | |||||||
| Consumer and other | 2.84 | 59 | 1.64 | 64 | |||||
| Purchased credit impaired loans | $ | 74,154 | $ | 39,769 | |||||
| (1) Risk ratings are based on the borrower's contractual obligation, which is not reflective of the purchase discount. | |||||||||
| For the twelve months ended | ||||||||||||||
| ($ in thousands) | December 31, 2021 | December 31, 2020 | ||||||||||||
| Operating lease cost | $ | 4,877 | $ | 3,207 | ||||||||||
| Short-term lease cost | 833 | 201 | ||||||||||||
| Total lease cost | $ | 5,710 | $ | 3,408 | ||||||||||
| December 31, 2017 | |||||||||||||||||||
| (in thousands) | 30-89 Days Past Due | 90 or More Days Past Due | Total Past Due | Current | Total | ||||||||||||||
| Commercial and industrial | $ | — | $ | — | $ | — | $ | 3,212 | $ | 3,212 | |||||||||
| Real estate: | |||||||||||||||||||
| Commercial - investor owned | — | 3,034 | 3,034 | 39,853 | 42,887 | ||||||||||||||
| Commercial - owner occupied | — | 673 | 673 | 10,659 | 11,332 | ||||||||||||||
| Construction and land development | — | — | — | 5,883 | 5,883 | ||||||||||||||
| Residential | 328 | 255 | 583 | 10,198 | 10,781 | ||||||||||||||
| Consumer and other | — | — | — | 59 | 59 | ||||||||||||||
| Total | $ | 328 | $ | 3,962 | $ | 4,290 | $ | 69,864 | $ | 74,154 | |||||||||
| December 31, 2016 | |||||||||||||||||||
| (in thousands) | 30-89 Days Past Due | 90 or More Days Past Due | Total Past Due | Current | Total | ||||||||||||||
| Commercial and industrial | $ | — | $ | — | $ | — | $ | 3,523 | $ | 3,523 | |||||||||
| Real estate: | |||||||||||||||||||
| Commercial - investor owned | — | — | — | 8,162 | 8,162 | ||||||||||||||
| Commercial - owner occupied | — | — | — | 11,863 | 11,863 | ||||||||||||||
| Construction and land development | — | — | — | 4,365 | 4,365 | ||||||||||||||
| Residential | 169 | 51 | 220 | 11,572 | 11,792 | ||||||||||||||
| Consumer and other | — | — | — | 64 | 64 | ||||||||||||||
| Total | $ | 169 | $ | 51 | $ | 220 | $ | 39,549 | $ | 39,769 | |||||||||
| (in thousands) | Contractual Cashflows | Non-accretable Difference | Accretable Yield | Carrying Amount | |||||||||||
| Balance January 1, 2017 | $ | 66,003 | $ | 18,902 | $ | 13,176 | $ | 33,925 | |||||||
| Acquisitions | 68,763 | 14,296 | 5,312 | 49,155 | |||||||||||
| Principal reductions and interest payments | (24,530 | ) | — | — | (24,530 | ) | |||||||||
| Accretion of loan discount | — | — | (7,573 | ) | 7,573 | ||||||||||
| Changes in contractual and expected cash flows due to remeasurement | 13,978 | (1,465 | ) | 5,486 | 9,957 | ||||||||||
| Reductions due to disposals | (11,503 | ) | (2,727 | ) | (2,439 | ) | (6,337 | ) | |||||||
| Balance December 31, 2017 | $ | 112,711 | $ | 29,006 | $ | 13,962 | $ | 69,743 | |||||||
| Balance January 1, 2016 | $ | 116,689 | $ | 26,765 | $ | 25,341 | $ | 64,583 | |||||||
| Principal reductions and interest payments | (25,669 | ) | — | — | (25,669 | ) | |||||||||
| Accretion of loan discount | — | — | (6,155 | ) | 6,155 | ||||||||||
| Changes in contractual and expected cash flows due to remeasurement | 11,718 | 766 | (1,500 | ) | 12,452 | ||||||||||
| Reductions due to disposals | (36,735 | ) | (8,629 | ) | (4,510 | ) | (23,596 | ) | |||||||
| Balance December 31, 2016 | $ | 66,003 | $ | 18,902 | $ | 13,176 | $ | 33,925 | |||||||
Supplemental balance sheet information related to leases is as follows:
| ($ in thousands) | December 31, 2021 | December 31, 2020 | |||||||||
| Operating lease right-of-use assets, included in other assets | $ | 13,483 | $ | 13,636 | |||||||
| Operating lease liabilities, included in other liabilities | 14,865 | 14,152 | |||||||||
| Operating leases | |||||||||||
| Weighted average remaining lease term | 4 years | 5 years | |||||||||
| Weighted average discount rate | 2.0 | % | 2.5 | % | |||||||
Maturities of operating lease liabilities are as follows:
| ($ in thousands) | ||||||||||||||
| Year | Amount | |||||||||||||
| 2022 | $ | 5,191 | ||||||||||||
| 2023 | 3,688 | |||||||||||||
| 2024 | 2,670 | |||||||||||||
| 2025 | 1,326 | |||||||||||||
| 2026 | 1,138 | |||||||||||||
| Thereafter | 1,566 | |||||||||||||
| Total operating lease liabilities, payments | 15,579 | |||||||||||||
| Less: present value adjustment | 714 | |||||||||||||
| Operating lease liabilities | $ | 14,865 | ||||||||||||
Lessor income was $1.9 million and $1.8 million during the twelve months ended December 31, 2016,2021, and 2020, respectively.
NOTE 67 - DERIVATIVE FINANCIAL INSTRUMENTS
Risk Management Objective of Using Derivatives
The Company is exposed to certain risk arising from both its business operations and economic conditions. The Company principally manages its exposures to a party to variouswide variety of business and operational risks through management of its core business activities. The Company manages economic risks, including interest rate, liquidity, and credit risk primarily by managing the amount, sources, and duration of its assets and liabilities and the use of derivative financial instruments. Specifically, the Company enters into derivative financial instruments to manage exposures that arise from business activities that result in the receipt or payment of future known and uncertain cash amounts, the value of which are determined by interest rates. The Company’s derivative financial instruments are used to manage differences in the normal courseamount, timing, and duration of businessthe Company’s known or expected cash receipts and its known or expected cash payments principally related to meet the needs of its clients and as part of its risk management activities. These instruments include interest rate swaps and option contracts and foreign exchange forward contracts.Company’s borrowings. The Company does not enter into derivative financial instruments for trading purposes.
The Company’s objectives in using interest rate derivatives are to varying degrees. Counterparty credit risk relatesadd stability to the lossinterest expense and to manage its exposure to interest rate movements. To accomplish this objective, the Company could incur if a counterparty were to default on a derivative contract. Notional amounts of derivative financial instruments do not represent credit risk, and are not recorded in the consolidated balance sheet. The overall credit risk and exposure to individual counterparties is monitored. The Company does not anticipate nonperformance by any counterparties. The amount of counterparty credit exposure is the unrealized gains in excess of collateral pledged, if any, on such derivative contracts along with the value of foreign exchange forward contracts. At December 31, 2017, the Company had $2.1 million of counterparty credit exposure on derivatives. This counterparty risk is consideredprimarily uses interest rate swaps as part of underwriting and on-going monitoring policies. At December 31, 2017 and 2016,its interest rate risk management strategy. Interest rate swaps designated as cash flow hedges involve the receipt of variable amounts from a counterparty in exchange for the Company had pledgedmaking fixed-rate payments over the life of the agreements without exchange of the underlying notional amount. The Company has executed a series of cash of $1.4 million and $0.7 million, respectively, as collateral in connection withflow hedges to fix the effective interest rate swap agreements.for payments due on $62.0 million of LIBOR-based junior subordinated debentures to a weighted-average-fixed rate of 2.62%. Select terms of the hedges are as follows:
| $ in thousands | ||||||||
| Notional | Fixed Rate | Maturity Date | ||||||
| $15,465 | 2.60% | March 15, 2024 | ||||||
| $14,433 | 2.60% | March 30, 2024 | ||||||
| $18,558 | 2.64% | March 15, 2026 | ||||||
| $13,506 | 2.64% | March 17, 2026 | ||||||
For derivatives designated and qualified as cash flow hedges of interest rate risk, the gain or loss on the derivative is recorded in accumulated other comprehensive income and subsequently reclassified into interest expense in the same period(s) during which the hedged transaction affects earnings. Amounts reported in accumulated other comprehensive income related to derivatives will be reclassified to interest expense as interest payments are paid on the Company’s variable-rate debt. During the next twelve months, the Company had no outstanding hedging instruments usedestimates an additional $1.3 million will be reclassified as an increase to manage risk. Ininterest expense. Concurrently with the past,repayment of $200 million of variable-rate FHLB advances in the fourth quarter of 2020, the Company entered intoterminated two interest rate capsswaps with a notional value of $200.0 million. A loss of $3.2 million was recognized on the termination of the swaps.
Non-designated Hedges
Derivatives not designated as hedges are not considered speculative and result from a service the Company provides to certain customers. The Company executes interest rate swaps with commercial banking customers to facilitate their respective risk management strategies. Those interest rate swaps are simultaneously hedged by offsetting derivatives that the Company executes with a third party, such that the Company minimizes its net risk exposure resulting from such transactions. As the interest rate derivatives associated with this program do not meet the strict hedge accounting requirements, changes in order to economically hedge changes inthe fair value of certain state tax credits held for sale. See Note 18 – Fair Value Measurements for further discussionboth the customer derivatives and the offsetting derivatives are recognized directly in earnings as a component of other noninterest income.
94
The table below presents the fair value of the state tax credits. Company’s derivative financial instruments as well as their classification on the Balance Sheet as of December 31, 2021 and December 31, 2020.
| Notional Amount | Derivative Assets | Derivative Liabilities | |||||||||||||||||||||||||||||||||
| ($ in thousands) | December 31, 2021 | December 31, 2020 | December 31, 2021 | December 31, 2020 | December 31, 2021 | December 31, 2020 | |||||||||||||||||||||||||||||
| Derivatives designated as hedging instruments | |||||||||||||||||||||||||||||||||||
| Interest rate swaps | $ | 61,962 | $ | 61,962 | $ | — | $ | — | $ | 2,911 | $ | 5,987 | |||||||||||||||||||||||
| Derivatives not designated as hedging instruments | |||||||||||||||||||||||||||||||||||
| Interest rate swaps | $ | 918,698 | $ | 1,026,016 | $ | 12,869 | $ | 28,703 | $ | 12,883 | $ | 28,980 | |||||||||||||||||||||||
The notional amounttables below present a gross presentation, the effects of offsetting, and a net presentation of the derivativeCompany’s financial instruments usedsubject to manage risk was $3.5 million atoffsetting as of December 31, 2016.
| As of December 31, 2021 | |||||||||||||||||||||||||||||||||||
| Gross Amounts Not Offset in the Statement of Financial Position | |||||||||||||||||||||||||||||||||||
($ in thousands) | Gross Amounts Recognized | Gross Amounts Offset in the Statement of Financial Position | Net Amounts of Assets presented in the Statement of Financial Position | Financial Instruments | Fair Value Collateral Posted | Net Amount | |||||||||||||||||||||||||||||
| Assets: | |||||||||||||||||||||||||||||||||||
| Interest rate swaps | $ | 12,869 | $ | — | $ | 12,869 | $ | 1,033 | $ | — | $ | 11,836 | |||||||||||||||||||||||
| Liabilities: | |||||||||||||||||||||||||||||||||||
| Interest rate swaps | $ | 15,794 | $ | — | $ | 15,794 | $ | 1,033 | $ | 14,031 | $ | 730 | |||||||||||||||||||||||
| Securities sold under agreements to repurchase | 331,006 | — | 331,006 | — | 331,006 | — | |||||||||||||||||||||||||||||
| As of December 31, 2020 | |||||||||||||||||||||||||||||||||||
| Gross Amounts Not Offset in the Statement of Financial Position | |||||||||||||||||||||||||||||||||||
($ in thousands) | Gross Amounts Recognized | Gross Amounts Offset in the Statement of Financial Position | Net Amounts of Assets presented in the Statement of Financial Position | Financial Instruments | Fair Value Collateral Posted | Net Amount | |||||||||||||||||||||||||||||
| Assets: | |||||||||||||||||||||||||||||||||||
| Interest rate swaps | $ | 28,703 | $ | — | $ | 28,703 | $ | 2 | $ | — | $ | 28,701 | |||||||||||||||||||||||
| Liabilities: | |||||||||||||||||||||||||||||||||||
| Interest rate swaps | $ | 34,967 | $ | — | $ | 34,967 | $ | 2 | $ | 34,903 | $ | 62 | |||||||||||||||||||||||
| Securities sold under agreements to repurchase | 271,081 | — | 271,081 | — | 271,081 | — | |||||||||||||||||||||||||||||
As of certain loans while maintaining a variable rate loan on its balance sheet. The Company also enters into foreign exchange forward contracts with clients, and enters into offsetting foreign exchange forward contracts with established financial institution counterparties. The table below summarizes the notional amounts and fair values of the client-related derivative instruments.
Asset Derivatives (Other Assets) | Liability Derivatives (Other Liabilities) | ||||||||||||||||||||||
| Notional Amount | Fair Value | Fair Value | |||||||||||||||||||||
| (in thousands) | December 31, 2017 | December 31, 2016 | December 31, 2017 | December 31, 2016 | December 31, 2017 | December 31, 2016 | |||||||||||||||||
| Non-designated hedging instruments | |||||||||||||||||||||||
| Interest rate swap contracts | $ | 394,852 | $ | 124,322 | $ | 2,061 | $ | 982 | $ | 2,061 | $ | 982 | |||||||||||
| Foreign exchange forward contracts | 1,528 | 3,034 | 1,528 | 3,034 | 1,528 | 3,034 | |||||||||||||||||
NOTE 78 - FIXED ASSETS
A summary of fixed assets at December 31, 20172021 and 2016,2020, is as follows:
| December 31, | |||||||||||
| ($ in thousands) | 2021 | 2020 | |||||||||
| Land | $ | 12,849 | $ | 13,389 | |||||||
| Buildings and leasehold improvements | 52,012 | 53,007 | |||||||||
| Furniture, fixtures and equipment | 18,821 | 17,933 | |||||||||
| 83,682 | 84,329 | ||||||||||
| Less accumulated depreciation and amortization | 35,767 | 31,160 | |||||||||
| Total fixed assets | $ | 47,915 | $ | 53,169 | |||||||
| December 31, | |||||||
| (in thousands) | 2017 | 2016 | |||||
| Land | $ | 7,263 | $ | 3,103 | |||
| Buildings and leasehold improvements | 32,384 | 18,054 | |||||
| Furniture, fixtures and equipment | 8,272 | 6,136 | |||||
| Capitalized software | 1,305 | 1,305 | |||||
| 49,224 | 28,598 | ||||||
| Less accumulated depreciation and amortization | 16,606 | 13,688 | |||||
| Total fixed assets | $ | 32,618 | $ | 14,910 | |||
Depreciation and amortization of fixed assets included in noninterest expense amounted to $3.3$6.1 million, $2.4$6.2 million, and $2.0$5.7 million in 2017, 2016,2021, 2020, and 2015,2019, respectively.
| Year | Amount | ||
| 2018 | $ | 3,503 | |
| 2019 | 3,477 | ||
| 2020 | 3,418 | ||
| 2021 | 3,337 | ||
| 2022 | 2,801 | ||
| Thereafter | 5,962 | ||
| Total | $ | 22,498 | |
NOTE 89 - GOODWILL AND INTANGIBLE ASSETS
| ($ in thousands) | Years ended December 31, | ||||||||||
| 2021 | 2020 | ||||||||||
| Goodwill, beginning of year | $ | 260,567 | $ | 210,344 | |||||||
| Additions from acquisition | 104,597 | 50,223 | |||||||||
| Goodwill, end of year | $ | 365,164 | $ | 260,567 | |||||||
The table below presents a summary of intangible assets:
| ($ in thousands) | Years ended December 31, | ||||||||||
| 2021 | 2020 | ||||||||||
| Core deposit intangible, net, beginning of year | $ | 23,084 | $ | 26,076 | |||||||
| Additions from acquisition | 4,892 | 2,681 | |||||||||
| Amortization | (5,690) | (5,673) | |||||||||
| Core deposit intangible, net, end of year | $ | 22,286 | $ | 23,084 | |||||||
| (in thousands) | Years ended December 31, | ||||||
| 2017 | 2016 | ||||||
| Gross core deposit intangible balance, beginning of year | $ | 9,060 | $ | 9,060 | |||
| Additions | 11,514 | — | |||||
| Gross core deposit intangible, end of period | 20,574 | 9,060 | |||||
| Accumulated amortization | (9,518 | ) | (6,909 | ) | |||
| Core deposit intangible, net, end of year | $ | 11,056 | $ | 2,151 | |||
Amortization expense on the core deposit intangibles was $2.6$5.7 million $0.9 million, and $1.1 million for the each of the years ended December 31, 2017, 2016,2021 and 2015, respectively.2020, and $5.5 million for the year ended December 31, 2019. The core deposit intangibles are being amortized over a 10year10-year period.
96
The following table reflects the expected amortization schedule for the core deposit intangible (in thousands) at December 31, 2017.2021.
| Year | Core Deposit Intangible ($ in thousands) | ||||
| 2022 | $ | 5,367 | |||
| 2023 | 4,601 | ||||
| 2024 | 3,834 | ||||
| 2025 | 3,068 | ||||
| 2026 | 2,301 | ||||
| After 2026 | 3,115 | ||||
| $ | 22,286 | ||||
| Year | Core Deposit Intangible | ||
| 2018 | $ | 2,504 | |
| 2019 | 2,129 | ||
| 2020 | 1,755 | ||
| 2021 | 1,381 | ||
| 2022 | 1,071 | ||
| After 2022 | 2,216 | ||
| $ | 11,056 | ||
NOTE 910 - MATURITY OF CERTIFICATES OF DEPOSITDEPOSITS
Following is a summary of certificates of deposit maturities at December 31, 2017:2021:
| ($ in thousands) | Brokered | Customer | Total | ||||||||||||||
| Less than 1 year | $ | 10,062 | $ | 365,902 | $ | 375,964 | |||||||||||
| Greater than 1 year and less than 2 years | 61,173 | 67,859 | 129,032 | ||||||||||||||
| Greater than 2 years and less than 3 years | 37,847 | 21,010 | 58,857 | ||||||||||||||
| Greater than 3 years and less than 4 years | 19,888 | 14,238 | 34,126 | ||||||||||||||
| Greater than 4 years and less than 5 years | — | 5,564 | 5,564 | ||||||||||||||
| Greater than 5 years | — | 4,750 | 4,750 | ||||||||||||||
| $ | 128,970 | $ | 479,323 | $ | 608,293 | ||||||||||||
| (in thousands) | Brokered | Customer | Total | ||||||||
| Less than 1 year | $ | 114,054 | $ | 317,373 | $ | 431,427 | |||||
| Greater than 1 year and less than 2 years | 1,252 | 74,236 | 75,488 | ||||||||
| Greater than 2 years and less than 3 years | — | 48,553 | 48,553 | ||||||||
| Greater than 3 years and less than 4 years | — | 21,100 | 21,100 | ||||||||
| Greater than 4 years and less than 5 years | — | 1,598 | 1,598 | ||||||||
| Greater than 5 years | — | 607 | 607 | ||||||||
| $ | 115,306 | $ | 463,467 | $ | 578,773 | ||||||
Certificates of deposit balances over the FDIC insurance limit of $250,000 were $148.0$93.7 million as of December 31, 2017.2021.
At December 31, 2021, deposit accounts of executive officers and directors, or to entities in which such individuals had beneficial interests as a shareholder, officer, or director totaled $5.7 million.
The Company is a participant in the Promontory Interfinancial Network, a network that offers deposit placement services such as CDARS and ICS, which offers products that qualify large deposits for FDIC insurance. At December 31, 2021, the Company had $22.0 million of CDARS deposits and $118.2 million of ICS deposits. At December 31, 2021 and 2020, overdraft deposits of $1.3 million and $1.0 million, respectively, were reclassified to loans.
97
NOTE 1011 - SUBORDINATED DEBENTURES
The amounts and terms of each issuance of the Company'sCompany’s subordinated debentures at December 31, 20172021 and 20162020 were as follows:
| Amount | Maturity Date | Initial Call Date (1) | Interest Rate | ||||||||||||||||||||||||||
| ($ in thousands) | 2021 | 2020 | |||||||||||||||||||||||||||
| EFSC Clayco Statutory Trust I | $ | 3,196 | $ | 3,196 | December 17, 2033 | December 17, 2008 | Floats @ 3MO LIBOR + 2.85% | ||||||||||||||||||||||
| EFSC Capital Trust II | 5,155 | 5,155 | June 17, 2034 | June 17, 2009 | Floats @ 3MO LIBOR + 2.65% | ||||||||||||||||||||||||
| EFSC Statutory Trust III | 11,341 | 11,341 | December 15, 2034 | December 15, 2009 | Floats @ 3MO LIBOR + 1.97% | ||||||||||||||||||||||||
| EFSC Clayco Statutory Trust II | 4,124 | 4,124 | September 15, 2035 | September 15, 2010 | Floats @ 3MO LIBOR + 1.83% | ||||||||||||||||||||||||
| EFSC Statutory Trust IV | 10,310 | 10,310 | December 15, 2035 | December 15, 2010 | Floats @ 3MO LIBOR + 1.44% | ||||||||||||||||||||||||
| EFSC Statutory Trust V | 4,124 | 4,124 | September 15, 2036 | September 15, 2011 | Floats @ 3MO LIBOR + 1.60% | ||||||||||||||||||||||||
| EFSC Capital Trust VI | 14,433 | 14,433 | March 30, 2037 | March 30, 2012 | Floats @ 3MO LIBOR + 1.60% | ||||||||||||||||||||||||
| EFSC Capital Trust VII | 4,124 | 4,124 | December 15, 2037 | December 15, 2012 | Floats @ 3MO LIBOR + 2.25% | ||||||||||||||||||||||||
| JEFFCO Stat Trust I (2) | 7,732 | 7,752 | February 22, 2031 | February 22, 2011 | Fixed @ 10.20% | ||||||||||||||||||||||||
| JEFFCO Stat Trust II (2) | 4,496 | 4,443 | March 17, 2034 | March 17, 2009 | Floats @ 3MO LIBOR + 2.75% | ||||||||||||||||||||||||
| Trinity Capital Trust III (2) | 5,339 | 5,272 | September 8, 2034 | September 8, 2009 | Floats @ 3MO LIBOR + 2.70% | ||||||||||||||||||||||||
| Trinity Capital Trust IV | 10,310 | 10,310 | November 23, 2035 | August 23, 2010 | Fixed @ 6.88% | ||||||||||||||||||||||||
| Trinity Capital Trust V (2) | 7,869 | 7,706 | December 15, 2036 | September 15, 2011 | Floats @ 3MO LIBOR + 1.65% | ||||||||||||||||||||||||
| Total junior subordinated debentures | 92,553 | 92,290 | |||||||||||||||||||||||||||
| 5.75% Fixed-to-floating rate subordinated notes | 63,250 | 63,250 | June 1, 2030 | June 1, 2025 | Fixed @ 5.75% until June 1, 2025, then floats @ Benchmark rate (3 month term SOFR) + 5.66% | ||||||||||||||||||||||||
| 4.75% Fixed-to-floating rate subordinated notes | — | 50,000 | November 1, 2026 | November 1, 2021 | Fixed @ 4.75% until November 1, 2021, then floats @ 3MO LIBOR + 3.387% | ||||||||||||||||||||||||
| Debt issuance costs | (904) | (1,903) | |||||||||||||||||||||||||||
| Total fixed-to-floating rate subordinated notes | 62,346 | 111,347 | |||||||||||||||||||||||||||
| Total subordinated debentures and notes | $ | 154,899 | $ | 203,637 | |||||||||||||||||||||||||
| (1) Callable each quarter after initial call date. | |||||||||||||||||||||||||||||
| (2) Purchase accounting adjustments are reflected in the balance and also impact the effective interest rate. | |||||||||||||||||||||||||||||
| Amount | Maturity Date | Call Date | Interest Rate | ||||||||||
| (in thousands) | 2017 | 2016 | |||||||||||
| EFSC Clayco Statutory Trust I | $ | 3,196 | $ | 3,196 | December 17, 2033 | December 17, 2008 | Floats @ 3MO LIBOR + 2.85% | ||||||
| EFSC Capital Trust II | 5,155 | 5,155 | June 17, 2034 | June 17, 2009 | Floats @ 3MO LIBOR + 2.65% | ||||||||
| EFSC Statutory Trust III | 11,341 | 11,341 | December 15, 2034 | December 15, 2009 | Floats @ 3MO LIBOR + 1.97% | ||||||||
| EFSC Clayco Statutory Trust II | 4,124 | 4,124 | September 15, 2035 | September 15, 2010 | Floats @ 3MO LIBOR + 1.83% | ||||||||
| EFSC Statutory Trust IV | 10,310 | 10,310 | December 15, 2035 | December 15, 2010 | Floats @ 3MO LIBOR + 1.44% | ||||||||
| EFSC Statutory Trust V | 4,124 | 4,124 | September 15, 2036 | September 15, 2011 | Floats @ 3MO LIBOR + 1.60% | ||||||||
| EFSC Capital Trust VI | 14,433 | 14,433 | March 30, 2037 | March 30, 2012 | Floats @ 3MO LIBOR + 1.60% | ||||||||
| EFSC Capital Trust VII | 4,124 | 4,124 | December 15, 2037 | December 15, 2012 | Floats @ 3MO LIBOR + 2.25% | ||||||||
| JEFFCO Stat Trust I (1) | 8,153 | — | February 22, 2031 | February 22, 2011 | Fixed @ 10.2% | ||||||||
| JEFFCO Stat Trust II (1) | 4,281 | — | March 17, 2034 | March 17, 2009 | Floats @ 3MO LIBOR + 2.75% | ||||||||
| Total trust preferred securities | 69,241 | 56,807 | |||||||||||
| Fixed-to-floating rate subordinated notes | 50,000 | 50,000 | November 1, 2026 | November 1, 2021 | Fixed @ 4.75% until November 1, 2021, then floats @ 3MO LIBOR + 3.387% | ||||||||
| Debt issuance costs | (1,136 | ) | (1,267 | ) | |||||||||
| Total fixed-to-floating rate subordinated notes | 48,864 | 48,733 | |||||||||||
| Total subordinated debentures and notes | $ | 118,105 | $ | 105,540 | |||||||||
| (1) Purchase accounting adjustments are reflected in the balance and also impact the effective interest rate. | |||||||||||||
The Company has 1013 unconsolidated statutory business trusts. These trusts issued preferred securities that were sold to third parties. The sole purpose of the trusts was to invest the proceeds in junior subordinated debentures of the Company that have terms identical to the trust preferred securities. The subordinated debentures, which are the sole assets of the trusts, are subordinate and junior in right of payment to all present and future senior and subordinated indebtedness and certain other financial conditions of the Company. The Company fully and unconditionally guarantees each trust'strust’s securities obligations. Under current regulations, the trust preferred securities are included in tier 1 capital for regulatory capital purposes, subject to certain limitations.
The trust preferred securities are redeemable in whole or in part on or after their respective call dates. Mandatory redemption dates may be shortened if certain conditions are met. The securities are classified as subordinated debentures in the Company'sCompany’s consolidated balance sheets. Interest on the subordinated debentures held by the trusts is recorded as interest expense in the Company'sCompany’s consolidated statements of operations. The Company'sCompany’s investment of $2.1$2.9 million at December 31, 2017,2021, in these trusts is included in other investments in the consolidated balance sheets. The Company has fixed the interest rate on a portion of its junior subordinated debentures through a series of interest rate swaps. For further discussion of the interest rate swaps and the corresponding terms, see “Note 7 - Derivative Financial Instruments.”
98
On November 1, 2016, the Company issued $50 million of fixed-to-floating rate subordinated notes. The notes initially bearbore a fixed annual interest rate of 4.75%, with interest payable semiannually in arrears on May 1 and November 1 of each year, commencing May 1, 2017. CommencingOn November 1, 2021, the interest rateCompany redeemed the $50.0 million of subordinated debentures at par. A loss of $0.7 million on the redemption was recognized for the write-off of unamortized debt issuance costs.
On May 21, 2020, EFSC issued $63.3 million of 5.75% fixed-to-floating rate subordinated notes resets quarterlydue in 2030 in a public offering (the “2030 Notes”). From and including the date of issuance to, but excluding, June 1, 2025, the 2030 Notes will bear interest at a rate equal to 5.75% per annum, payable semiannually in arrears on each June 1 and December 1. From and including June 1, 2025 to, but excluding, the maturity date or the date of earlier redemption, the 2030 Notes will bear interest at a floating rate per annum equal to a benchmark rate (which is expected to be three-month LIBOR rateterm SOFR (as defined in the Indenture, dated May 21, 2020, between EFSC and U.S. Bank National Association, as trustee, and subsequent First Supplemental Indenture)), plus a spread of 338.7566.0 basis points, payable quarterly in arrears. On or after Novemberarrears on March 1, 2021,June 1, September 1 and December 1 of each year, commencing on September 1, 2025. Notwithstanding the Company will haveforegoing, in event that the option to redeembenchmark rate is less than zero, then the notes, in whole or in part, at a redemption price equal to 100% of the principal amount of the subordinated notesbenchmark rate shall be deemed to be redeemed plus accrued interest, subject to applicable regulatory approval.zero. The Company’s obligation to make payments of principal and interest on the notes is subordinate and junior in right of payment to all of its senior debt. Current regulatory guidance allows for this subordinated debt to be treated as tier 2 regulatory capital for the first five years of its term, subject to certain limitations, and then phased out of tier 2 capital pro rata over the next five years.
NOTE 1112 - FEDERAL HOME LOAN BANK ADVANCES
FHLB advances are collateralized by 1-4 family residential real estate loans, business loans, and certain commercial real estate loans. At December 31, 20172021 and 2016,2020, the carrying value of the loans pledged to the FHLB of Des Moines was $1.1$1.4 billion and $773.5 million, respectively.at both periods. The secured line of credit had availability of approximately $484.7$708.6 million at December 31, 2017.2021.
The following table summarizes the type, maturity, and rate of the Company'sCompany’s FHLB advances at December 31:
| 2021 | 2020 | |||||||||||||||||||
| ($ in thousands) | Term | Outstanding Balance | Weighted Rate | Outstanding Balance | Weighted Rate | |||||||||||||||
| Non-amortizing fixed advance | Greater than 1 year | $ | 50,000 | 1.56 | % | $ | 50,000 | 1.56 | % | |||||||||||
| 2017 | 2016 | |||||||||||
| ($ in thousands) | Term | Outstanding Balance | Weighted Rate | Outstanding Balance | Weighted Rate | |||||||
| Non-amortizing fixed advance | Less than 1 year | $ | 172,743 | 1.56 | % | $ | — | — | % | |||
| Non-amortizing fixed advance | Greater than 1 year | — | — | % | — | — | % | |||||
| Total Federal Home Loan Bank Advances | $ | 172,743 | 1.56 | % | $ | — | — | % | ||||
In August 2019, the Company entered into agreements totaling $50 million for convertible advances with a weighted average rate of 1.56% that mature in 2024 and are currently puttable by the FHLB.
At December 31, 2017,2021, the Company used $18.1$60.0 million of collateral value to secure confirming letters of credit for public unit deposits and industrial development bonds.
NOTE 1213 - OTHER BORROWINGS AND NOTES PAYABLE
Securities Sold Under Agreement to Repurchase
The Company enters into sales of securities under agreements to repurchase. The agreements are transacted with deposit customers and are utilized as an overnight investment product. The amounts received under these agreements represent short-term borrowings and are reflected as a liability in the consolidated balance sheets. The securities underlying these agreements are included in investment securities in the Consolidated Balance Sheets. The Company has no control over the market value of the securities, which fluctuates due to market conditions. However, the Company is obligated to promptly transfer additional securities if the market value of the securities falls below the repurchase agreement price. The Company manages this risk by maintaining an unpledged securities
99
portfolio that it believes is sufficient to cover a decline in the market value of the securities sold under agreements to repurchase.
A summary of other borrowingssecurities sold under agreements to repurchase is as follows:
| December 31, | |||||||||||
| ($ in thousands) | 2021 | 2020 | |||||||||
| Securities sold under agreement to repurchase | $ | 331,006 | $ | 271,081 | |||||||
| Average balance during the year | 225,895 | 206,338 | |||||||||
| Maximum balance outstanding at any month-end | 331,006 | 271,081 | |||||||||
| Average interest rate during the year | 0.10 | % | 0.23 | % | |||||||
| Average interest rate at December 31 | 0.06 | % | 0.07 | % | |||||||
| December 31, | |||||||
| ($ in thousands) | 2017 | 2016 | |||||
| Securities sold under customer repurchase agreements | $ | 253,674 | $ | 276,980 | |||
| Average balance during the year | $ | 220,807 | $ | 206,643 | |||
| Maximum balance outstanding at any month-end | 253,674 | 276,980 | |||||
| Average interest rate during the year | 0.21 | % | 0.19 | % | |||
| Average interest rate at December 31 | 0.25 | % | 0.18 | % | |||
Federal Reserve Line
The Bank also has a line with the Federal Reserve Bank of St. Louis which provides additional liquidity to the Company. As of December 31, 2017, $898.1 million2021, $1.1 billion was available under this line. This line is secured by a pledge of certain eligible loans aggregating $1.1$1.3 billion. There were no amounts drawn on the Federal Reserve line of credit as of December 31, 2017.2021.
Federal Reserve PPPLF
The Company acquired $86.1 million of Federal Reserve PPPLF funds from the Seacoast acquisition which were paid off in November 2020.
Revolving Credit Line
In February 2016, the Company entered into a senior unsecured revolving credit agreement ("Revolving Agreement"(the “Revolving Agreement”) with another bank allowingbank. The Revolving Agreement has a one-year term, maturing on February 22, 2022. It allows for borrowings up to $20$25 million. The interest rate is the one-month LIBOR plus 125 basis points. The proceeds can be used for general corporate purposes. The Revolving Agreement is subject to ongoing compliance with a number of customary affirmative and negative covenants as well as specified financial covenants. In February 2022, the Revolving Agreement was renewed for a one-year term and the interest rate was amended to one-month Term SOFR plus 136 basis points. The revolving credit line was not accessed in 2021 or 2020.
Term Loan
In February 2019, the Company entered into a five year, $40.0 million unsecured term loan agreement (the “Term Loan”) with another bank with the proceeds primarily used to fund the company’s cash portion of an acquisition in 2019. The interest rate is one-month LIBOR plus 125 basis points. In February 2022, the interest rate on the Term Loan was amended to one-month Term SOFR plus 136 basis points.
A summary of the amounts drawn on the Revolving Agreement as of December 31, 2017, and 2016Term Loan is as follows:
| December 31, | |||||||||||||||||
| ($ in thousands) | 2021 | 2020 | |||||||||||||||
| Term Loan | $ | 22,857 | $ | 30,000 | |||||||||||||
| Average balance during the year | 26,427 | 32,123 | |||||||||||||||
| Maximum balance outstanding at any month-end | 28,571 | 34,286 | |||||||||||||||
| Weighted average interest rate during the year | 1.40 | % | 1.96 | % | |||||||||||||
| Average interest rate at December 31 | 1.38 | % | 1.44 | % | |||||||||||||
100
| December 31, | |||||||
| ($ in thousands) | 2017 | 2016 | |||||
| Outstanding balance | $ | — | $ | — | |||
| Average balance during the year | $ | 822 | $ | — | |||
| Maximum balance outstanding at any month-end | 10,000 | — | |||||
| Weighted average interest rate during the year | 3.50 | % | — | % | |||
| Average interest rate at December 31 | — | % | — | % | |||
NOTE 1314 - LITIGATION AND OTHER CONTINGENCIES
The Company and its subsidiaries are, from time to time, parties to various legal proceedings arising out of their businesses. Management believes that there are no such legal proceedings pending or threatened against the Company or its subsidiaries which,in the ordinary course of business, directly, indirectly, or in the aggregate that, if determined adversely, would have a material adverse effect on the business, consolidated financial condition, results of operations or cash flows of the Company or any of its subsidiaries.
NOTE 1415 - REGULATORY MATTERSCAPITAL
Quantitative measures established by regulation to ensure capital adequacy require the Bank to maintain minimum amounts and ratios (set forth in the following table) of total, tier 1, and common equity tier 1 capital to risk-weighted assets, and of tier 1 capital to average assets. Management believes, as of December 31, 20172021 and 2016,2020, that the Company met all capital adequacy requirements to which it is subject.
As of December 31, 20172021 and 2016,2020, the Bank was categorized as “well capitalized”“well-capitalized” under the regulatory framework for prompt corrective action. To be categorized as “well capitalized”“well-capitalized” the Bank must maintain minimum total risk-based capital, tier 1 risk-based capital, common equity tier 1 risk-based capital, and tier 1 leverage ratios as set forth in the table. In addition, the Company must maintain an additional CCB above the regulatory minimum ratio requirements. The CCB is designed to insulate banks from periods of stress and impose constraints on dividends, share repurchases and discretionary bonus payments when capital levels fall below prescribed levels.
The actual capital amounts and ratios are presented in the table below:following table:
| December 31, 2021 | December 31, 2020 | |||||||||||||||||||||||||
| EFSC | Bank | EFSC | Bank | To Be Well-Capitalized | Minimum Ratio with CCB | |||||||||||||||||||||
| Common Equity Tier 1 Capital to Risk Weighted Assets | 11.3 | % | 12.5 | % | 10.9 | % | 12.5 | % | 6.5 | % | 7.0 | % | ||||||||||||||
| Tier 1 Capital to Risk Weighted Assets | 13.0 | % | 12.5 | % | 12.1 | % | 12.5 | % | 8.0 | % | 8.5 | % | ||||||||||||||
| Total Capital to Risk Weighted Assets | 14.7 | % | 13.5 | % | 14.9 | % | 13.7 | % | 10.0 | % | 10.5 | % | ||||||||||||||
| Leverage Ratio (Tier 1 Capital to Average Assets) | 9.7 | % | 9.3 | % | 10.0 | % | 10.3 | % | 5.0 | % | 4.0 | % | ||||||||||||||
101
| Actual | For Capital Adequacy Purposes | To Be Well Capitalized Under Applicable Action Provisions | ||||||||||||||||||
| ($ in thousands) | Amount | Ratio | Amount | Ratio | Amount | Ratio | ||||||||||||||
| As of December 31, 2017: | ||||||||||||||||||||
| Total Capital (to Risk Weighted Assets) | ||||||||||||||||||||
| Enterprise Financial Services Corp | $ | 589,047 | 12.21 | % | $ | 385,816 | 8.00 | % | $ | — | — | % | ||||||||
| Enterprise Bank & Trust | 546,314 | 11.36 | 384,791 | 8.00 | 480,989 | 10.00 | ||||||||||||||
| Tier 1 Capital (to Risk Weighted Assets) | ||||||||||||||||||||
| Enterprise Financial Services Corp | 496,045 | 10.29 | 289,362 | 6.00 | — | — | ||||||||||||||
| Enterprise Bank & Trust | 503,312 | 10.46 | 288,593 | 6.00 | 384,791 | 8.00 | ||||||||||||||
| Common Equity Tier 1 Capital (to Risk Weighted Assets) | ||||||||||||||||||||
| Enterprise Financial Services Corp | 428,397 | 8.88 | 217,021 | 4.50 | — | — | ||||||||||||||
| Enterprise Bank & Trust | 503,264 | 10.46 | 216,445 | 4.50 | 312,643 | 6.50 | ||||||||||||||
| Leverage Ratio (Tier 1 Capital to Average Assets) | ||||||||||||||||||||
| Enterprise Financial Services Corp | 496,045 | 9.72 | 204,087 | 4.00 | — | — | ||||||||||||||
| Enterprise Bank & Trust | 503,312 | 9.68 | 207,885 | 4.00 | 259,856 | 5.00 | ||||||||||||||
| As of December 31, 2016: | ||||||||||||||||||||
| Total Capital (to Risk Weighted Assets) | ||||||||||||||||||||
| Enterprise Financial Services Corp | $ | 506,349 | 13.48 | % | $ | 300,573 | 8.00 | % | $ | — | — | % | ||||||||
| Enterprise Bank & Trust | 430,981 | 11.53 | 298,982 | 8.00 | 373,728 | 10.00 | ||||||||||||||
| Tier 1 Capital (to Risk Weighted Assets) | ||||||||||||||||||||
| Enterprise Financial Services Corp | 412,865 | 10.99 | 225,430 | 6.00 | — | — | ||||||||||||||
| Enterprise Bank & Trust | 387,497 | 10.37 | 224,237 | 6.00 | 298,982 | 8.00 | ||||||||||||||
| Common Equity Tier 1 Capital (to Risk Weighted Assets) | ||||||||||||||||||||
| Enterprise Financial Services Corp | 357,729 | 9.52 | 169,072 | 4.50 | — | — | ||||||||||||||
| Enterprise Bank & Trust | 387,461 | 10.37 | 168,178 | 4.50 | 242,923 | 6.50 | ||||||||||||||
| Leverage Ratio (Tier 1 Capital to Average Assets) | ||||||||||||||||||||
| Enterprise Financial Services Corp | 412,865 | 10.42 | 158,480 | 4.00 | — | — | ||||||||||||||
| Enterprise Bank & Trust | 387,497 | 9.81 | 157,933 | 4.00 | 197,417 | 5.00 | ||||||||||||||
NOTE 1516 - SHAREHOLDERS’ EQUITY AND COMPENSATION PLANS
Shareholders’ Equity
Common Stock
At December 31, 2021 and 2020, the Company has reserved the following shares of its authorized but unissued common stock for possible future issuance in connection with the following:
| December 31, 2021 | December 31, 2020 | ||||||||||
| Outstanding performance units (maximum issuance) | 169,244 | 125,176 | |||||||||
| Outstanding RSU’s | 181,657 | 157,428 | |||||||||
| Outstanding options and appreciation rights | 112,927 | — | |||||||||
| 2018 Stock Incentive Plan | 670,326 | 339,691 | |||||||||
| Non-Management Director Plan | 73,618 | 86,616 | |||||||||
| 2018 Employee Stock Purchase Plan | 571,064 | 635,890 | |||||||||
| Total | 1,778,836 | 1,344,801 | |||||||||
Common Stock Repurchase Plan
In April 2021, the Company’s board of directors authorized the repurchase of up to 2000000 shares of the Company’s common stock. The repurchases may be made in open market or privately negotiated transactions and the stock repurchase program will remain in effect until fully utilized or until modified, superseded or terminated. At December 31, 2021, there were 700,473 shares available for repurchase under the plan.
Preferred Stock
The Company has 5,000,000 shares of authorized preferred stock with a par value of $0.01 with 75,000 shares issued and outstanding at the end of 2021. The Board of Directors has the right to set for each series of preferred stock, subject to the laws of the State of Delaware, the dividend rate, conversion and redemption terms, voting rights and liquidation preferences, among others. In the fourth quarter 2021, the Company issued and sold 3,000,000 depositary shares, each representing 1/40th interest in a share of the Company’s 5% Noncumulative, Perpetual Preferred Stock, Series A (“Series A Preferred Stock”), totaling $72.0 million, net of issuance costs. The depositary shares trade under the ticker “EFSCP”. The Series A Preferred Stock may be redeemed at the Company’s option, subject to prior regulatory approval, in whole or in part on any dividend payment date on or after December 15, 2026 or within 90 days following a regulatory capital event, as defined in the offering documents. If any Series A Preferred Stock are redeemed, a proportionate number of depositary shares will also be redeemed.
Dividends, when and if declared by the board of directors, are payable, quarterly in arrears, on March 15, June 15, September 15 and December 15 of each year. If dividends on the Series A Preferred stock have not been declared or paid in six quarterly periods, whether or not consecutive, the number of directors on the board will automatically be increased by two and the holders of the Series A preferred stock will be entitled to vote for the additional directors.
Dividends
The Company’s ability to pay dividends to its shareholders is generally dependent upon the payment of dividends by the Bank to the parent company. The Bank cannot pay dividends to the extent it would be deemed undercapitalized by the FDIC after making such dividend.
Dividends on the Company’s capital stock are prohibited under the terms of the junior subordinated debenture agreements, see “Note 11 - Subordinated Debentures,” if the Company is in continuous default on its payment obligations to the capital trusts, has elected to defer interest payments on the debentures or extends the interest payment period. Furthermore, unless dividends on all outstanding shares of the Series A Preferred Stock for the most recently completed dividend period have been paid or declared, dividends on, and repurchases of, common stock is prohibited. At December 31, 2021, the Company was not in default on any of the junior subordinated debenture issuances or preferred stock.
102
Accumulated Other Comprehensive Income (Loss)
The following table presents the changes in accumulated other comprehensive income (loss) after-tax by component:
| ($ in thousands) | Net Unrealized Gain (Loss) on Available-for-Sale Debt Securities | Unamortized Gain (Loss) on Held-to-Maturity Securities | Net Unrealized Loss on Cash Flow Hedges | Total | |||||||||||||||||||
| Balance, December 31, 2018 | $ | (9,047) | $ | (235) | $ | — | $ | (9,282) | |||||||||||||||
| Net change | 29,226 | (33) | (2,162) | 27,031 | |||||||||||||||||||
| Transfer from available-for-sale to held-to-maturity | (5,202) | 5,202 | — | — | |||||||||||||||||||
| Balance, December 31, 2019 | $ | 14,977 | $ | 4,934 | $ | (2,162) | $ | 17,749 | |||||||||||||||
| Net change | 23,627 | (1,910) | (2,346) | 19,371 | |||||||||||||||||||
| Transfer from available-for-sale to held-to-maturity | (16,284) | 16,284 | — | — | |||||||||||||||||||
| Balance, December 31, 2020 | $ | 22,320 | $ | 19,308 | $ | (4,508) | $ | 37,120 | |||||||||||||||
| Net change | (17,049) | (3,624) | 2,330 | (18,343) | |||||||||||||||||||
| Balance, December 31, 2021 | $ | 5,271 | $ | 15,684 | $ | (2,178) | $ | 18,777 | |||||||||||||||
The following table presents the pre-tax and after-tax changes in the components of other comprehensive income:
| 2021 | 2020 | 2019 | |||||||||||||||||||||||||||||||||||||||||||||||||||
| ($ in thousands) | Pre-tax | Tax effect | After-tax | Pre-tax | Tax effect | After-tax | Pre-tax | Tax effect | After-tax | ||||||||||||||||||||||||||||||||||||||||||||
| Change in unrealized gain (loss) on available-for-sale debt securities | $ | (22,701) | $ | (5,652) | $ | (17,049) | $ | 31,798 | $ | 7,854 | $ | 23,944 | $ | 38,764 | $ | 9,575 | $ | 29,189 | |||||||||||||||||||||||||||||||||||
| Reclassification adjustment for realized (gain) loss on sale of available-for-sale debt securities(a) | — | — | — | (421) | (104) | (317) | 49 | 12 | 37 | ||||||||||||||||||||||||||||||||||||||||||||
| Reclassification of gain on held-to-maturity securities(b) | (4,672) | (1,048) | (3,624) | (2,537) | (627) | (1,910) | (44) | (11) | (33) | ||||||||||||||||||||||||||||||||||||||||||||
| Change in unrealized gain (loss) on cash flow hedges arising during the period(b) | 1,533 | 372 | 1,161 | (7,898) | (1,951) | (5,947) | (3,004) | (742) | (2,262) | ||||||||||||||||||||||||||||||||||||||||||||
| Reclassification of loss on cash flow hedges(b) | 1,543 | 374 | 1,169 | 4,782 | 1,181 | 3,601 | 133 | 33 | 100 | ||||||||||||||||||||||||||||||||||||||||||||
| Total other comprehensive income (loss) | $ | (24,297) | $ | (5,954) | $ | (18,343) | $ | 25,724 | $ | 6,353 | $ | 19,371 | $ | 35,898 | $ | 8,867 | $ | 27,031 | |||||||||||||||||||||||||||||||||||
(a)The pre-tax amount is reported in noninterest income/expense in the Consolidated Statements of Operations.
(b)The pre-tax amount is reported in interest income/expense in the Consolidated Statements of Operations, except for a $3.2 million termination fee in 2020 recognized in noninterest expense.
Compensation Plans
The Company has adopted share-based compensation plans to reward and provide long-term incentive for directors and key employees of the Company.Company including its subsidiaries. These plans provide for the granting of stock, stock options, stock-settled stock appreciation rights, ("SSARs"), and restricted stock units (“RSUs”), and may contain performance terms for key employees as designated by the Company'sCompany’s Board of Directors upon the recommendation of the Compensation Committee of the Board. The Company uses authorized and unissued shares to satisfy share award exercises. At December 31, 2017, there were 86,082 shares available
103
The total excess income tax benefit (expense) for grant under the various share-based compensation plans.
| (in thousands) | 2017 | 2016 | 2015 | ||||||||
| Compensation expense | $ | — | $ | — | $ | 50 | |||||
| Intrinsic value of option exercises on date of exercise | 3,156 | 1,156 | 74 | ||||||||
| Cash received from the exercise of stock options | 91 | 87 | 126 | ||||||||
| (in thousands, except share and per share data) | Shares | Weighted Average Exercise Price | Weighted Average Remaining Contractual Term | Aggregate Intrinsic Value | ||||||||
| Outstanding at December 31, 2016 | 270,246 | $ | 18.85 | |||||||||
| Granted | — | — | ||||||||||
| Exercised | (164,116 | ) | 22.40 | |||||||||
| Forfeited | — | — | ||||||||||
| Outstanding at December 31, 2017 | 106,130 | $ | 13.37 | 1.9 years | $ | 3,373 | ||||||
| Exercisable at December 31, 2017 | 106,130 | $ | 13.37 | 1.9 years | $ | 3,373 | ||||||
The Company awards nonvested stock, in the form of RSUs to employees and directors. RSUs generally are subject to continued employment and vest ratably over two to five years. Vesting is accelerated upon a change in control or the employee meeting certain retirement criteria. RSUs do not carry voting or dividend rights until vested. Sales of the units are restricted prior to vesting. Various information related to the RSUs is shown below.following table summarizes share-based compensation expense:
| ($ in thousands) | 2021 | 2020 | 2019 | ||||||||||||||
| Performance stock units | $ | 1,777 | $ | 1,097 | $ | 1,699 | |||||||||||
| Restricted stock units | 3,109 | 2,613 | 1,969 | ||||||||||||||
| Stock options | 396 | — | — | ||||||||||||||
| Employee stock purchase plan | 735 | 468 | 364 | ||||||||||||||
| Total share-based compensation expense | $ | 6,017 | $ | 4,178 | $ | 4,032 | |||||||||||
| ($ in thousands) | 2017 | 2016 | 2015 | ||||||||
| Compensation expense | $ | 898 | $ | 850 | $ | 725 | |||||
| Total fair value at vesting date | 1,471 | 2,275 | 809 | ||||||||
| Total unrecognized compensation cost for nonvested stock units | 837 | 1,084 | 942 | ||||||||
| Expected years to recognize unearned compensation | 1.8 years | 1.6 years | 1.7 years | ||||||||
| Shares | Weighted Average Grant Date Fair Value | |||||
| Outstanding at December 31, 2016 | 58,698 | $ | 23.06 | |||
| Granted | 16,462 | 41.68 | ||||
| Vested | (33,206 | ) | 18.48 | |||
| Forfeited | (732 | ) | 14.48 | |||
| Outstanding at December 31, 2017 | 41,222 | $ | 34.34 | |||
| (in thousands, except share and per share data) | 2017 | 2016 | 2015 | ||||||||
| Shares issued | 10,531 | 12,528 | 16,283 | ||||||||
| Weighted average fair value | $ | 42.46 | $ | 31.25 | $ | 24.43 | |||||
| Compensation expense | 397 | 407 | 373 | ||||||||
The Company has entered into long-term incentive agreements with certain key employees. These awards are conditioned on certain performance criteria and market criteria measured against a group of peer banks over a 3 yearthree-year period for each grant. The awards contain minimum (threshold), target, and maximum (exceptional) performance levels. In the event of a change in control, as defined in the plan, the awards will vest at a minimum of the target level. The amount of the awards areis determined at the end of the 3 yearthree-year vesting and performance period. In January 2018, the Company awarded 134,600 shares to employees upon completionThe fair value of the 2015-2017 performance cycle. In February 2017, the Company awarded 118,519 shares to employees upon completion of the 2014-2016 performance cycle. Inunits vesting in 2021, 2020, and 2019 were $0.9 million, $2.8 million, and $4.6 million, respectively.
| ($ in thousands) | 2019 - 2021 Cycle | 2020 - 2022 Cycle | 2021 - 2023 Cycle | ||||||||||||||
| Shares issuable at target | 19,576 | 24,674 | 40,372 | ||||||||||||||
| Maximum shares issuable | 39,152 | 49,348 | 80,744 | ||||||||||||||
| Unrecognized compensation cost | $ | 27 | $ | 538 | $ | 1,981 | |||||||||||
| Weighted average grant date fair value | $ | 47.46 | $ | 38.09 | $ | 47.16 | |||||||||||
| Maximum Shares Issuable | |||||
| Outstanding at December 31, 2020 | 125,176 | ||||
| Granted | 84,628 | ||||
| Vested (issued 23,251 shares) | (31,452) | ||||
| Forfeited | (9,108) | ||||
| Outstanding at December 31, 2021 | 169,244 | ||||
104
(in thousands, except share and per share data) | 2016 - 2018 Cycle | 2017 - 2019 Cycle | |||||
| Shares issuable at target | 87,758 | 55,203 | |||||
| Maximum shares issuable | 107,955 | 68,263 | |||||
| Unrecognized compensation cost | $ | 949 | $ | 1,792 | |||
| Weighted average grant date fair value | 25.26 | 40.72 | |||||
Restricted Stock Units
The Company recorded $2.5 million, $2.5 millionawards nonvested stock, in the form of RSUs to employees. RSUs generally are subject to continued employment and $2.7 milliongenerally vest ratably over three to five years. Vesting is accelerated upon a change in control or the employee meeting certain retirement criteria. RSUs do not carry voting or dividend rights until vested. Sales of stock-based compensation expense for these awards during 2017, 2016 and 2015, respectively. In 2017 and 2016, this expense included an additional $0.3 million, and $0.2 million, respectively,the units are restricted prior to vesting.
Various information related to modifications madethe RSUs is shown below.
| ($ in thousands) | 2021 | 2020 | 2019 | ||||||||||||||
| Total fair value at vesting date | $ | 2,855 | $ | 1,702 | $ | 1,067 | |||||||||||
| Unrecognized compensation cost | 4,622 | 3,899 | 3,417 | ||||||||||||||
| Expected years to recognize unearned compensation | 1.9 years | 1.9 years | 1.9 years | ||||||||||||||
| Weighted average grant date fair value | $ | 44.01 | $ | 39.63 | $ | 45.00 | |||||||||||
A summary of the status of the Company’s RSU awards as of December 31, 2021 and changes during the year then ended is presented below.
| Shares | Weighted Average Grant Date Fair Value | ||||||||||
| Outstanding at December 31, 2020 | 157,428 | $ | 42.44 | ||||||||
| Granted | 100,220 | 44.01 | |||||||||
| Vested | (65,755) | 43.91 | |||||||||
| Forfeited | (10,236) | 43.51 | |||||||||
| Outstanding at December 31, 2021 | 181,657 | $ | 42.71 | ||||||||
Stock Options
In determining compensation cost for retiring executives.stock options, the Black-Scholes option-pricing model is used to estimate the fair value on date of grant. The modification allowsmodel utilizes several assumptions in its calculations. The risk-free rate for portionsperiods within the contractual life of outstanding performance awards to continue to vest as though employment had not terminated and will be paidthe option is based on actual performance asthe U.S. Treasury yield in effect at the time of the grant. The expected term of options granted is based on the option's vesting schedule and expected exercise patterns and represent the period of time that options granted are expected to be outstanding. The expected volatility is based on the historical volatility of the Company's stock and expected term of the option. The dividend yield is determined by annualizing the compensation committee following completiondividend rate as a percentage of the applicable performance period.Company's stock price.
The following weighted average assumptions were used for grants issued during the year ended December 31, 2021.
| Weighted Average | |||||
| Risk Free Interest Rate | 1.06% | ||||
| Expected Dividend Yield | 1.65% | ||||
| Expected Volatility | 33.92% | ||||
| Expected Term (years) | 6.2 | ||||
Stock options have been granted to key employees with exercise prices equal to the market price of the Company’s common stock at the date of grant and 10-year contractual terms. Stock options have a vesting schedule of three to five years.
105
Following is a summary of stock option activity for 2021.
| ($ in thousands, except per share data) | Shares | Weighted Average Exercise Price | Weighted Average Remaining Contractual Term | ||||||||||||||||||||
| Outstanding at December 31, 2020 | — | $ | — | ||||||||||||||||||||
| Granted | 118,604 | 43.80 | 9.2 years | ||||||||||||||||||||
| Forfeited | (5,677) | 43.81 | |||||||||||||||||||||
| Outstanding at December 31, 2021 | 112,927 | $ | 43.80 | 9.2 years | |||||||||||||||||||
| Exercisable at December 31, 2021 | 460 | $ | 43.81 | 9.2 years | |||||||||||||||||||
Employee Stock Purchase Plan
The Company’s Employee Stock Purchase Plan (“ESPP”) provides its eligible employees with an opportunity to purchase common stock through accumulated payroll contributions. The ESPP provides for shares to be purchased at 85% of the lesser of the stock price at the enrollment date or the exercise date. The maximum number of shares of common stock available for sale under the ESPP is 750,000. In 2021, 2020, and 2019, employees purchased 64,826, 58,195, and 41,116 shares, respectively.
Stock Plan for Non-Management Directors
The Company has adopted a Stock Plan for Non-Management Directors, which provides for issuing up to 200,000 shares of common stock to non-management directors as compensation in lieu of cash. At December 31, 2021, there were 59,760 shares of stock available for grant under the Stock Plan for Non-Management Directors, exclusive of 13,858 shares to be issued upon deferral release.
Various information related to the Director Plan is shown below.
| 2021 | 2020 | 2019 | |||||||||||||||
| Shares granted | 12,998 | 15,901 | 11,382 | ||||||||||||||
| Weighted average grant date fair value | $ | 46.05 | $ | 30.28 | $ | 41.63 | |||||||||||
401(k) plansPlan
The Company has a 401(k) savings plan which covers substantially all full-time employees over the age of 21.21 and matches 100% of the first 6% of employee contributions. The amount charged to expense for the Company'sCompany’s contributions to the plan was $2.0$4.9 million, $1.7$3.8 million and $1.6$3.2 million for 2017, 2016,2021, 2020, and 2015,2019, respectively.
Deferred Compensation Plan
The Company’s Nonqualified Deferred Compensation Plan permits certain executives to participate and defer up to 25% of their base salary and/or up to 100% of their eligible bonus for a plan year. Participants make an irrevocable election when they elect to participate for a plan year to receive the vested account balance following their retirement date, or at a future date not less than five years after the beginning of the plan year. At December 31, 2021, the Company had a liability of $5.0 million related to the Deferred Compensation Plan.
106
NOTE 1617 - INCOME TAXES
The components of income tax expense (benefit) for the years ended December 31, are as follows:
| Year ended December 31, | |||||||||||||||||
| ($ in thousands) | 2021 | 2020 | 2019 | ||||||||||||||
| Current: | |||||||||||||||||
| Federal | $ | 29,835 | $ | 25,132 | $ | 15,470 | |||||||||||
| State and local | 5,198 | 5,009 | 2,027 | ||||||||||||||
| Total current | 35,033 | 30,141 | 17,497 | ||||||||||||||
| Deferred: | |||||||||||||||||
| Federal | 870 | (10,651) | 4,262 | ||||||||||||||
| State and local | (325) | (1,927) | 1,538 | ||||||||||||||
| Total deferred | 545 | (12,578) | 5,800 | ||||||||||||||
| Total income tax expense | $ | 35,578 | $ | 17,563 | $ | 23,297 | |||||||||||
| Years ended December 31, | |||||||||||
| (in thousands) | 2017 | 2016 | 2015 | ||||||||
| Current: | |||||||||||
| Federal | $ | 15,845 | $ | 17,005 | $ | 22,916 | |||||
| State and local | 1,377 | 1,734 | 2,798 | ||||||||
| Total current | 17,222 | 18,739 | 25,714 | ||||||||
| Deferred: | |||||||||||
| Federal | 20,989 | 5,959 | (5,266 | ) | |||||||
| State and local | 116 | 1,304 | (497 | ) | |||||||
| Total deferred | 21,105 | 7,263 | (5,763 | ) | |||||||
| Total income tax expense | $ | 38,327 | $ | 26,002 | $ | 19,951 | |||||
A reconciliation of expected income tax expense, computed by applying the statutory federal income tax rate in 2017, 2016,2021, 2020, and 20152019 to income before income taxes and the amounts reflected in the consolidated statements of operations is as follows:
| Year ended December 31, | |||||||||||||||||
| ($ in thousands) | 2021 | 2020 | 2019 | ||||||||||||||
| Income tax expense at statutory rate | $ | 35,413 | $ | 19,309 | $ | 24,368 | |||||||||||
| Increase (reduction) in income tax resulting from: | |||||||||||||||||
| Tax-exempt interest income, net | (3,198) | (2,010) | (962) | ||||||||||||||
| State and local income taxes, net | 4,936 | 3,254 | 2,816 | ||||||||||||||
| Bank-owned life insurance, net | (713) | (778) | (628) | ||||||||||||||
| Non-deductible expenses | 1,090 | 637 | 749 | ||||||||||||||
| Tax benefit of low-income housing tax credit ("LIHTC") investments, net | (132) | (444) | (278) | ||||||||||||||
| Excess tax benefits | 146 | (175) | (526) | ||||||||||||||
| Federal tax credits | (1,136) | (1,327) | (913) | ||||||||||||||
| Non-taxable donation to charitable foundation | (263) | — | (420) | ||||||||||||||
| Other, net | (565) | (903) | (909) | ||||||||||||||
| Total income tax expense | $ | 35,578 | $ | 17,563 | $ | 23,297 | |||||||||||
| Years ended December 31, | |||||||||||
| (in thousands) | 2017 | 2016 | 2015 | ||||||||
| Income tax expense at statutory rate | $ | 30,281 | $ | 26,194 | $ | 20,440 | |||||
| Increase (reduction) in income tax resulting from: | |||||||||||
| Tax-exempt income, net | (961 | ) | (945 | ) | (931 | ) | |||||
| State and local income taxes, net | 1,676 | 1,673 | 1,414 | ||||||||
| Bank-owned life insurance, net | (715 | ) | (544 | ) | (462 | ) | |||||
| Non-deductible expenses | 407 | 263 | 259 | ||||||||
| Change in estimated rate for deferred taxes | 12,117 | 302 | — | ||||||||
| Tax benefits of LIHTC investments, net | (257 | ) | (181 | ) | (179 | ) | |||||
| Excess tax benefits | (2,141 | ) | — | — | |||||||
| Other federal tax benefits | (1,701 | ) | — | — | |||||||
| Other, net | (379 | ) | (760 | ) | (590 | ) | |||||
| Total income tax expense | $ | 38,327 | $ | 26,002 | $ | 19,951 | |||||
The net amount recognized as a component of tax expense for tax credits, other tax benefits, and amortization from low-income housing tax credit ("LIHTC")LIHTC investments recognized per the table above was $0.3$0.1 million for the year ended December 31, 2017.2021. The net amount recognized as a benefit component of income tax expense per the table above was $0.2$0.4 million for the yearsyear ended December 31, 2016,2020, and 2015.$0.3 million for the year ended December 31, 2019. As of December 31, 20172021 and 2016,2020, the carrying value of the investments related to low-income housing tax credits was $1.3$7.6 million and $1.4$4.2 million, respectively. No impairment losses have been recognized from forfeiture or ineligibility of tax credits or other circumstances during the life of any of the investments. As of December 31, 2017, the Company has future capital commitments of $4.8 million related to low-income housing tax credit investments. The capital commitments are expected to be called between the years 2018 - 2020.
107
A net deferred income tax asset of $22.5$40.9 million and $33.8$29.8 million is included in other assets in the consolidated balance sheets at December 31, 20172021 and 2016,2020, respectively. The tax effect of temporary differences that gave rise to significant portions of the deferred tax assets and deferred tax liabilities is as follows:
| Year ended December 31, | |||||||||||
| ($ in thousands) | 2021 | 2020 | |||||||||
| Deferred tax assets: | |||||||||||
| Allowance for loan losses | $ | 36,550 | $ | 34,031 | |||||||
| Loans held-for-sale | 6,971 | 8,058 | |||||||||
| Other real estate | 305 | 896 | |||||||||
| Deferred compensation | 2,704 | 2,585 | |||||||||
| Accrued compensation | 5,881 | 5,391 | |||||||||
| Net operating losses and tax credits | 6,061 | 6,460 | |||||||||
| Other deferred tax assets | 5,671 | 3,086 | |||||||||
| Total deferred tax assets | 64,143 | 60,507 | |||||||||
| Deferred tax liabilities: | |||||||||||
| Acquired loans | 1,709 | 3,413 | |||||||||
| Unrealized gains on securities | 6,171 | 12,189 | |||||||||
| Intangible assets | 8,789 | 7,800 | |||||||||
| Other deferred tax liabilities | 3,754 | 4,369 | |||||||||
| Total deferred tax liabilities | 20,423 | 27,771 | |||||||||
| Net deferred tax asset before valuation allowance | 43,720 | 32,736 | |||||||||
| Less: valuation allowance | 2,830 | 2,932 | |||||||||
| Net deferred tax asset | $ | 40,890 | $ | 29,804 | |||||||
| Years ended December 31, | |||||||
| (in thousands) | 2017 | 2016 | |||||
| Deferred tax assets: | |||||||
| Allowance for loan losses | $ | 10,516 | $ | 16,496 | |||
| Basis difference on PCI assets, net | 5,748 | 5,551 | |||||
| Basis difference on Other real estate | 694 | 317 | |||||
| Deferred compensation | 2,719 | 4,217 | |||||
| Goodwill and other intangible assets | 2,151 | 5,520 | |||||
| Accrued compensation | 646 | 899 | |||||
| Unrealized losses on securities available for sale | 1,490 | 1,019 | |||||
| Other, net | 2,150 | 925 | |||||
| Total deferred tax assets | 26,114 | 34,944 | |||||
| Deferred tax liabilities: | |||||||
| State tax credits held for sale, net of economic hedge | 26 | 376 | |||||
| Core deposit intangibles | 2,731 | 817 | |||||
| Other, net | 855 | — | |||||
| Total deferred tax liabilities | 3,612 | 1,193 | |||||
| Net deferred tax asset | $ | 22,502 | $ | 33,751 | |||
| Deferred tax rate | 24.7 | % | 38.0 | % | |||
A valuation allowance is provided on deferred tax assets when it is more likely than not that some portion of the assets will not be realized. In 2019, as part of the Trinity Capital Corporation acquisition, the company acquired net operating loss, tax credit, and capital loss deferred tax assets. The Company didcompany determined it was more likely than not have anythat some of the assets would not be realized. As such, the company has a valuation allowances for federal or state income taxesallowance recorded of $2.8 million and $2.9 million as of December 31, 2017 or 2016.2021 and 2020, respectively.
The Company and its subsidiaries file income tax returns in the federal jurisdiction and in nine30 states. The Company is no longer subject to federal, state or local income tax audits by tax authorities for years before 2014,2017, with the exception of 20132016 being an open year by one state taxing authority. The Company is not currently under audit by any taxing jurisdiction.Net operating losses generated prior to 2016 that are utilized going forward would still be subject to examination.
As of December 31, 2017,2021, the gross amount of unrecognized tax benefits was $1.2$2.7 million and the total amount of net unrecognized tax benefits that would impact the effective tax rate, if recognized, was $0.8$2.5 million. As of December 31, 20162020 and 2015,2019, the total amount of the net unrecognized tax benefits that would impact the effective tax rate, if recognized, was $0.8$3.1 million and $0.9$1.1 million, respectively. The Company believes it is reasonably possible that the gross amount of unrecognized benefits will be reduced by approximately $0.3$0.4 million as a result of a lapse of statute of limitations in the next 12 months. The Company is under audit by the state of Missouri, and while the Company has concluded it has adequately provided for uncertain tax positions, the outcome of such audits are always uncertain and could result in additional tax expense, though immaterial.
108
The Company recognizes interest and penalties related to uncertain tax positions in income tax expense and classifies such interest and penalties in the liability for unrecognized tax benefits. The amountsamount accrued for interest and penalties was $0.5 million as of December 31, 2017, 2016,2021, $0.9 million for 2020 and 2015 werewas not significant.significant for 2019.
The activity in the gross liability for unrecognized tax benefits was as follows:
| ($ in thousands) | 2021 | 2020 | 2019 | ||||||||||||||
| Balance at beginning of year | $ | 3,157 | $ | 1,497 | $ | 1,301 | |||||||||||
| Additions based on tax positions related to the current year | 563 | 395 | 401 | ||||||||||||||
| Additions for tax positions of prior years | 436 | 1,556 | 62 | ||||||||||||||
| Settlements for tax positions of prior years | (1,289) | — | — | ||||||||||||||
| Settlements or lapse of statute of limitations | (170) | (291) | (267) | ||||||||||||||
| Balance at end of year | $ | 2,697 | $ | 3,157 | $ | 1,497 | |||||||||||
| (in thousands) | 2017 | 2016 | 2015 | ||||||||
| Balance at beginning of year | $ | 1,180 | $ | 1,359 | $ | 1,884 | |||||
| Additions based on tax positions related to the current year | 331 | 239 | 230 | ||||||||
| Additions for tax positions of prior years | 41 | 39 | 46 | ||||||||
| Reductions for tax positions of prior years | — | — | (437 | ) | |||||||
| Settlements or lapse of statute of limitations | (308 | ) | (457 | ) | (364 | ) | |||||
| Balance at end of year | $ | 1,244 | $ | 1,180 | $ | 1,359 | |||||
NOTE 1718 - COMMITMENTS
Long-term Lease Commitments
See “Note 6 – Leases” in this report for information regarding the Company’s long-term lease commitments.
Off-balance-Sheet Commitments
The Company issues financial instruments in the normal course of the business of meeting the financing needs of its customers. These financial instruments include commitments to extend credit and standby letters of credit. These instruments may involve, to varying degrees, elements of credit and interest rate risk in excess of the amounts recognized in the consolidated balance sheets.
The Company’s extent of involvement and maximum potential exposure to credit loss in the event of nonperformance by the other party to the financial instrument for commitments to extend credit and standby letters of credit is not more than the contractual amount of these instruments.
The Company uses the same credit policies in making commitments and conditional obligations as it does for financial instruments included on its consolidated balance sheets.
The contractual amounts of off-balance-sheet financial instruments as of December 31, 2017,2021, and December 31, 2016,2020, are as follows:
| (in thousands) | December 31, 2021 | December 31, 2020 | |||||||||
| Commitments to extend credit | $ | 2,481,173 | $ | 1,946,068 | |||||||
| Letters of credit | 77,314 | 50,971 | |||||||||
| State tax credits | 18,118 | 24,473 | |||||||||
| Limited partnership commitments | 21,553 | 23,400 | |||||||||
| (in thousands) | December 31, 2017 | December 31, 2016 | |||||
| Commitments to extend credit | $ | 1,298,423 | $ | 1,075,170 | |||
| Letters of credit | 73,790 | 78,954 | |||||
There was an insignificant amount of unadvanced commitments on impaired loans at December 31, 20172021 and December 31, 2016.2020. Other liabilities include approximately $0.4$7.6 million for estimatedan allowance for credit losses attributable to the unadvanced commitments.commitments at December 31, 2021.
Commitments to extend credit are agreements to lend to a customer as long as there is no violation of any condition established in the contract. Commitments usually have fixed expiration dates or other termination clauses, may have significant usage restrictions, and may require payment of a fee. Of the total commitments to extend credit at December 31, 2017,2021, and December 31, 2016, $112.02020, $238.7 million and $89.7$160.6 million, respectively, represent fixed rate loan commitments. Since certain of the commitments may expire without being drawn upon or may be revoked, the total commitment amounts do not necessarily represent future cash obligations. The Company evaluates each
109
customer’s credit worthiness on a case-by-case basis. The amount of collateral obtained, if deemed necessary by the Company upon extension of credit, is based on management’s credit evaluation of the borrower. Collateral held varies, but may include accounts receivable, inventory, premises and equipment, and real estate.
Letters of credit are conditional commitments issued by the Company to guarantee the performance of a customer to a third party. These letters of credit are issued to support contractual obligations of the Company’s customers. The credit risk involved in issuing letters of credit is essentially the same as the risk involved in extending loans to customers. The approximate remaining term of letters of credit range from 1 month to 311 years and 9 months at December 31, 2017.2021.
The Company also has off-balance sheet commitments for purchases of state tax credits and commitments for various capital raises for SBICs.
NOTE 1819 - FAIR VALUE MEASUREMENTS
The fair value of an asset or liability is the exchange price that would be received to sell that asset or paid to transfer that liability in an orderly transaction occurring in the principal market (or most advantageous market in the absence of a principal market) for such asset or liability. In estimating fair value, the Company utilizes valuation techniques that are consistent with the market approach, the income approach and/or the cost approach. Such valuation techniques are consistently applied. Inputs to valuation techniques include the assumptions that market participants would use in pricing an asset or liability. ASC Topic 820, Fair Value Measurements and Disclosures, establishes a fair value hierarchy for valuation inputs that gives the highest priority to quoted prices in active markets for identical assets or liabilities and the lowest priority to unobservable inputs. The fair value hierarchy is as follows:
•Level 1 Inputs - Unadjusted quoted prices in active markets for identical assets or liabilities that the reporting entity has the ability to access at the measurement date.
•Level 2 Inputs - Inputs other than quoted prices included in Level 1 that are observable for the asset or liability, either directly or indirectly. These might include quoted prices for similar assets or liabilities in active markets, quoted prices for identical or similar assets or liabilities in markets that are not active, inputs other than quoted prices that are observable for the asset or liability (such as interest rates, volatilities, prepayment speeds, credit risks, etc.) or inputs that are derived principally from or corroborated by market data by correlation or other means.
•Level 3 Inputs - Unobservable inputs for determining the fair values of assets or liabilities that reflect an entity'sentity’s own assumptions about the assumptions that market participants would use in pricing the assets or liabilities.
110
Fair value on a recurring basis
The following table summarizes financial instruments measured at fair value on a recurring basis as of December 31, 20172021 and 2016,2020, segregated by the level of the valuation inputs within the fair value hierarchy utilized to measure fair value.
| December 31, 2021 | |||||||||||||||||||||||
| ($ in thousands) | Quoted Prices in Active Markets for Identical Assets (Level 1) | Significant Other Observable Inputs (Level 2) | Significant Unobservable Inputs (Level 3) | Total Fair Value | |||||||||||||||||||
| Assets | |||||||||||||||||||||||
| Securities available-for-sale | |||||||||||||||||||||||
| Obligations of U.S. Government-sponsored enterprises | $ | — | $ | 173,511 | $ | — | $ | 173,511 | |||||||||||||||
| Obligations of states and political subdivisions | — | 575,084 | — | 575,084 | |||||||||||||||||||
| Residential mortgage-backed securities | — | 513,859 | — | 513,859 | |||||||||||||||||||
| Corporate debt securities | — | 12,382 | — | 12,382 | |||||||||||||||||||
| U.S. Treasury Bills | — | 91,170 | — | 91,170 | |||||||||||||||||||
| Total securities available-for-sale | — | 1,366,006 | — | 1,366,006 | |||||||||||||||||||
| Other investments | — | 3,012 | — | 3,012 | |||||||||||||||||||
| Derivative financial instruments | — | 12,869 | — | 12,869 | |||||||||||||||||||
| Total assets | $ | — | $ | 1,381,887 | $ | — | $ | 1,381,887 | |||||||||||||||
| Liabilities | |||||||||||||||||||||||
| Derivative financial instruments | $ | — | $ | 15,794 | $ | — | $ | 15,794 | |||||||||||||||
| Total liabilities | $ | — | $ | 15,794 | $ | — | $ | 15,794 | |||||||||||||||
| December 31, 2017 | |||||||||||||||
| (in thousands) | Quoted Prices in Active Markets for Identical Assets (Level 1) | Significant Other Observable Inputs (Level 2) | Significant Unobservable Inputs (Level 3) | Total Fair Value | |||||||||||
| Assets | |||||||||||||||
| Securities available for sale | |||||||||||||||
| Obligations of U.S. Government-sponsored enterprises | $ | — | $ | 99,224 | $ | — | $ | 99,224 | |||||||
| Obligations of states and political subdivisions | — | 34,642 | — | 34,642 | |||||||||||
| Residential mortgage-backed securities | — | 507,516 | — | 507,516 | |||||||||||
| Total securities available for sale | — | 641,382 | — | 641,382 | |||||||||||
| State tax credits held for sale | — | — | 400 | 400 | |||||||||||
| Derivative financial instruments | — | 3,589 | — | 3,589 | |||||||||||
| Total assets | $ | — | $ | 644,971 | $ | 400 | $ | 645,371 | |||||||
| Liabilities | |||||||||||||||
| Derivative financial instruments | $ | — | $ | 3,589 | $ | — | $ | 3,589 | |||||||
| Total liabilities | $ | — | $ | 3,589 | $ | — | $ | 3,589 | |||||||
| December 31, 2020 | |||||||||||||||||||||||
| ($ in thousands) | Quoted Prices in Active Markets for Identical Assets (Level 1) | Significant Other Observable Inputs (Level 2) | Significant Unobservable Inputs (Level 3) | Total Fair Value | |||||||||||||||||||
| Assets | |||||||||||||||||||||||
| Securities available-for-sale | |||||||||||||||||||||||
| Obligations of U.S. Government-sponsored enterprises | $ | — | $ | 15,161 | $ | — | $ | 15,161 | |||||||||||||||
| Obligations of states and political subdivisions | — | 344,232 | — | 344,232 | |||||||||||||||||||
| Residential mortgage-backed securities | — | 526,572 | — | 526,572 | |||||||||||||||||||
| Corporate debt securities | — | 14,998 | — | 14,998 | |||||||||||||||||||
| U.S. Treasury Bills | — | 11,466 | — | 11,466 | |||||||||||||||||||
| Total securities available-for-sale | — | 912,429 | — | 912,429 | |||||||||||||||||||
| Derivative financial instruments | — | 28,703 | — | 28,703 | |||||||||||||||||||
| Total assets | $ | — | $ | 941,132 | $ | — | $ | 941,132 | |||||||||||||||
| Liabilities | |||||||||||||||||||||||
| Derivative financial instruments | $ | — | $ | 34,967 | $ | — | $ | 34,967 | |||||||||||||||
| Total liabilities | $ | — | $ | 34,967 | $ | — | $ | 34,967 | |||||||||||||||
| December 31, 2016 | |||||||||||||||
| (in thousands) | Quoted Prices in Active Markets for Identical Assets (Level 1) | Significant Other Observable Inputs (Level 2) | Significant Unobservable Inputs (Level 3) | Total Fair Value | |||||||||||
| Assets | |||||||||||||||
| Securities available for sale | |||||||||||||||
| Obligations of U.S. Government-sponsored enterprises | $ | — | $ | 107,660 | $ | — | $ | 107,660 | |||||||
| Obligations of states and political subdivisions | — | 33,542 | 3,089 | 36,631 | |||||||||||
| Residential mortgage-backed securities | — | 316,506 | — | 316,506 | |||||||||||
| Total securities available for sale | — | 457,708 | 3,089 | 460,797 | |||||||||||
| State tax credits held for sale | — | — | 3,585 | 3,585 | |||||||||||
| Derivative financial instruments | — | 4,016 | — | 4,016 | |||||||||||
| Total assets | $ | — | $ | 461,724 | $ | 6,674 | $ | 468,398 | |||||||
| Liabilities | |||||||||||||||
| Derivative financial instruments | $ | — | $ | 4,016 | $ | — | $ | 4,016 | |||||||
| Total liabilities | $ | — | $ | 4,016 | $ | — | $ | 4,016 | |||||||
•Securities available for saleavailable-for-sale. Securities classified as available for saleavailable-for-sale are reported at fair value utilizing Level 2 and Level 3 inputs. Fair values for Level 2 securities are based upon dealer quotes, market spreads, the U.S. Treasury yield curve, trade execution data, market consensus prepayment speeds, credit information and the bond'sbond’s terms and conditions at the security level. At December 31, 2017, there were no Level 3 Auction Rate Securities. Auction Rate Securities at December 31, 2017 were valued using a Level 2 pricing source similar to our other securities available for sale.
111
•Derivatives. Derivatives are reported at fair value utilizing Level 2 inputs. The Company obtains counterparty quotations to value its interest rate swaps and caps. In addition, the Company validates the counterparty quotations with third partythird-party valuation sources. Derivatives with negative fair values are included in Other liabilities in the consolidated balance sheets. Derivatives with positive fair value are included in Other assets in the consolidated balance sheets.
| Securities available for sale, at fair value | |||||||
| Years ended December 31, | |||||||
| (in thousands) | 2017 | 2016 | |||||
| Beginning balance | $ | 3,089 | $ | 3,077 | |||
| Total gains: | |||||||
| Included in other comprehensive income | 4 | 12 | |||||
| Transfer in and/or out of Level 3 | (3,093 | ) | — | ||||
| Ending balance | $ | — | $ | 3,089 | |||
| Change in unrealized gains relating to assets still held at the reporting date | $ | — | $ | 12 | |||
| State tax credits held for sale, at fair value | |||||||
| Years ended December 31, | |||||||
| (in thousands) | 2017 | 2016 | |||||
| Beginning balance | $ | 3,585 | $ | 5,941 | |||
| Total gains: | |||||||
| Included in earnings | 101 | 177 | |||||
| Purchases, sales, issuances and settlements: | |||||||
| Sales | (3,286 | ) | (2,533 | ) | |||
| Ending balance | $ | 400 | $ | 3,585 | |||
| Change in unrealized losses relating to assets still held at the reporting date | $ | (885 | ) | $ | (575 | ) | |
Fair value on a non-recurring basis
Certain financial assets and financial liabilities are measured at fair value on a non-recurring basis; that is, the instruments are not measured at fair value on an ongoing basis but are subject to fair value adjustments in certain circumstances (for example, when there is evidence of impairment).
•Impaired loans. Impaired loans are included as Portfolio loans on the Company's consolidated balance sheets with amounts specifically reserved for credit impairment in the Allowance for loan losses. On a quarterly basis, fair value adjustments are recorded as necessary on impaired loans to account for (1) partial write-downs that are based on the current appraised or market-quoted value of the underlying collateral or (2) the full charge-off of the loan carrying value. In some cases, the properties for which market quotes or appraised values have been obtained are located in areas where comparable sales data is limited, outdated, or unavailable. In addition, the Company may adjust the valuations based on other relevant market conditions or information. Accordingly, fair value estimates, including those obtained from real estate brokers or other third-party consultants, for collateral-dependent impaired loans are classified in Level 3 of the valuation hierarchy.
•Other Real Estate.real estate. These assets are reported at the lower of the loan carrying amount at foreclosure or fair value. Fair value is based on third party appraisals of each property and the Company'sCompany’s judgment of other relevant market conditions. These are considered Level 3 inputs.
•Loan servicing asset. The loan servicing asset is included in Other assets on the Company’s consolidated balance sheets and assessed for impairment on a quarterly basis. Market-based cash flow modeling and discounting models specific to the SBA industry are provided by a third-party valuation service and are considered Level 2 inputs.
The following table presents financial instruments and non-financial assets measured at fair value on a non-recurring basis as of December 31, 20172021 and 2016.2020.
| December 31, 2021 | ||||||||||||||||||||||||||
| (1) | (1) | (1) | (1) | |||||||||||||||||||||||
| ($ in thousands) | Total Fair Value | Quoted Prices in Active Markets for Identical Assets (Level 1) | Significant Other Observable Inputs (Level 2) | Significant Unobservable Inputs (Level 3) | Total losses for the year ended December 31, 2021 | |||||||||||||||||||||
| Impaired loans | $ | 6,406 | $ | — | $ | — | $ | 6,406 | $ | 3,500 | ||||||||||||||||
| Other real estate | 632 | — | — | 632 | 29 | |||||||||||||||||||||
| Loan servicing asset | 3,146 | 0 | $ | 3,146 | $ | — | $ | 156 | ||||||||||||||||||
| Total | $ | 10,184 | $ | — | $ | 3,146 | $ | 7,038 | $ | 3,685 | ||||||||||||||||
112
| December 31, 2017 | ||||||||||||||||||
| (1) | (1) | (1) | (1) | |||||||||||||||
| (in thousands) | Total Fair Value | Quoted Prices in Active Markets for Identical Assets (Level 1) | Significant Other Observable Inputs (Level 2) | Significant Unobservable Inputs (Level 3) | Total losses for the year ended December 31, 2017 | |||||||||||||
| Impaired loans | $ | 3,200 | $ | — | $ | — | $ | 3,200 | $ | 6,599 | ||||||||
| Other real estate | — | — | — | — | — | |||||||||||||
| Total | $ | 3,200 | $ | — | $ | — | $ | 3,200 | $ | 6,599 | ||||||||
| December 31, 2020 | ||||||||||||||||||||||||||||||||||||||||||||
| December 31, 2016 | (1) | (1) | (1) | (1) | ||||||||||||||||||||||||||||||||||||||||
| (1) | (1) | (1) | (1) | |||||||||||||||||||||||||||||||||||||||||
| (in thousands) | Total Fair Value | Quoted Prices in Active Markets for Identical Assets (Level 1) | Significant Other Observable Inputs (Level 2) | Significant Unobservable Inputs (Level 3) | Total losses for the year ended December 31, 2016 | |||||||||||||||||||||||||||||||||||||||
| ($ in thousands) | ($ in thousands) | Total Fair Value | Quoted Prices in Active Markets for Identical Assets (Level 1) | Significant Other Observable Inputs (Level 2) | Significant Unobservable Inputs (Level 3) | Total losses for the year ended December 31, 2020 | ||||||||||||||||||||||||||||||||||||||
| Impaired loans | $ | 175 | $ | — | $ | — | $ | 175 | $ | 4,335 | Impaired loans | $ | 1,247 | $ | — | $ | — | $ | 1,247 | $ | 4,486 | |||||||||||||||||||||||
| Other real estate | — | — | — | — | 1 | Other real estate | 3,600 | — | — | 3,600 | 1,000 | |||||||||||||||||||||||||||||||||
| Total | $ | 175 | $ | — | $ | — | $ | 175 | $ | 4,336 | Total | $ | 4,847 | $ | — | $ | — | $ | 4,847 | $ | 5,486 | |||||||||||||||||||||||
(1) The amounts represent only balances measured at fair value during the period and still held as of the reporting date.
Carrying amount and fair value at December 31, 20172021 and 20162020
Following is a summary of the carrying amounts and fair values of the Company’s financial instruments on the consolidated balance sheets at December 31, 20172021 and 2016.
| December 31, 2017 | December 31, 2016 | ||||||||||||||
| (in thousands) | Carrying Amount | Estimated fair value | Carrying Amount | Estimated fair value | |||||||||||
| Balance sheet assets | |||||||||||||||
| Cash and due from banks | $ | 91,084 | $ | 91,084 | $ | 54,288 | $ | 54,288 | |||||||
| Federal funds sold | 1,223 | 1,223 | 446 | 446 | |||||||||||
| Interest-bearing deposits | 63,661 | 63,661 | 145,048 | 145,048 | |||||||||||
| Securities available for sale | 641,382 | 641,382 | 460,797 | 460,797 | |||||||||||
| Securities held to maturity | 73,749 | 73,458 | 80,463 | 79,639 | |||||||||||
| Other investments, at cost | 26,661 | 26,661 | 14,840 | 14,840 | |||||||||||
| Loans held for sale | 3,155 | 3,155 | 9,562 | 9,562 | |||||||||||
| Derivative financial instruments | 3,589 | 3,589 | 4,016 | 4,016 | |||||||||||
| Portfolio loans, net | 4,054,473 | 4,096,741 | 3,114,752 | 3,125,701 | |||||||||||
| State tax credits, held for sale | 43,468 | 44,271 | 38,071 | 41,264 | |||||||||||
| Accrued interest receivable | 14,069 | 14,069 | 11,117 | 11,117 | |||||||||||
| Balance sheet liabilities | |||||||||||||||
| Deposits | 4,156,414 | 4,153,323 | 3,233,361 | 3,232,414 | |||||||||||
| Subordinated debentures and notes | 118,105 | 105,031 | 105,540 | 86,052 | |||||||||||
| Federal Home Loan Bank advances | 172,743 | 172,893 | — | — | |||||||||||
| Other borrowings | 253,674 | 253,530 | 276,980 | 276,905 | |||||||||||
| Derivative financial instruments | 3,589 | 3,589 | 4,016 | 4,016 | |||||||||||
| Accrued interest payable | 1,730 | 1,730 | 1,105 | 1,105 | |||||||||||
| Estimated Fair Value Measurement at Reporting Date Using | Balance at December 31, 2017 | ||||||||||||||
| (in thousands) | Level 1 | Level 2 | Level 3 | ||||||||||||
| Financial Assets: | |||||||||||||||
| Securities held to maturity | $ | — | $ | 73,458 | $ | — | $ | 73,458 | |||||||
| Portfolio loans, net | — | — | 4,096,741 | 4,096,741 | |||||||||||
| State tax credits, held for sale | — | — | 43,871 | 43,871 | |||||||||||
| Financial Liabilities: | |||||||||||||||
| Deposits | 3,577,641 | — | 575,682 | 4,153,323 | |||||||||||
| Subordinated debentures and notes | — | 105,031 | — | 105,031 | |||||||||||
| Federal Home Loan Bank advances | — | 172,893 | — | 172,893 | |||||||||||
| Other borrowings | — | 253,530 | — | 253,530 | |||||||||||
| Estimated Fair Value Measurement at Reporting Date Using | Balance at December 31, 2016 | ||||||||||||||
| (in thousands) | Level 1 | Level 2 | Level 3 | ||||||||||||
| Financial Assets: | |||||||||||||||
| Securities held to maturity | $ | — | $ | 79,639 | $ | — | $ | 79,639 | |||||||
| Portfolio loans, net | — | — | 3,125,701 | 3,125,701 | |||||||||||
| State tax credits, held for sale | — | — | 37,679 | 37,679 | |||||||||||
| Financial Liabilities: | |||||||||||||||
| Deposits | 2,760,202 | — | 472,212 | 3,232,414 | |||||||||||
| Subordinated debentures and notes | — | 86,052 | — | 86,052 | |||||||||||
| Federal Home Loan Bank advances | — | — | — | — | |||||||||||
| Other borrowings | — | 276,905 | — | 276,905 | |||||||||||
| December 31, 2021 | December 31, 2020 | ||||||||||||||||||||||||||||||||||
| ($ in thousands) | Carrying Amount | Estimated fair value | Level | Carrying Amount | Estimated fair value | Level | |||||||||||||||||||||||||||||
| Balance sheet assets | |||||||||||||||||||||||||||||||||||
| Securities held-to-maturity | $ | 429,681 | $ | 434,672 | Level 2 | $ | 487,610 | $ | 501,523 | Level 2 | |||||||||||||||||||||||||
| Other investments | 56,884 | 56,884 | Level 2 | 48,764 | 48,764 | Level 2 | |||||||||||||||||||||||||||||
| Loans held-for-sale | 6,389 | 6,389 | Level 2 | 13,564 | 13,564 | Level 2 | |||||||||||||||||||||||||||||
| Loans, net | 8,872,601 | 8,869,891 | Level 3 | 7,088,264 | 7,067,562 | Level 3 | |||||||||||||||||||||||||||||
| State tax credits, held-for-sale | 27,994 | 30,686 | Level 3 | 36,853 | 39,925 | Level 3 | |||||||||||||||||||||||||||||
| Servicing asset | 6,714 | 6,714 | Level 2 | 5,721 | 5,721 | Level 2 | |||||||||||||||||||||||||||||
| Balance sheet liabilities | |||||||||||||||||||||||||||||||||||
| Certificates of deposit | $ | 608,293 | $ | 606,177 | Level 3 | $ | 550,095 | $ | 553,946 | Level 3 | |||||||||||||||||||||||||
| Subordinated debentures and notes | 154,899 | 155,972 | Level 2 | 203,637 | 192,889 | Level 2 | |||||||||||||||||||||||||||||
| FHLB advances | 50,000 | 51,527 | Level 2 | 50,000 | 51,871 | Level 2 | |||||||||||||||||||||||||||||
| Other borrowings | 353,863 | 353,863 | Level 2 | 301,081 | 301,081 | Level 2 | |||||||||||||||||||||||||||||
Fair value estimates are made at a specific point in time, based on relevant market information and information about the financial instrument. These estimates are subjective in nature and involve uncertainties and matters of significant judgment, and therefore, cannot be determined with precision. Such estimates include the valuation of loans, goodwill, intangible assets, and other long-lived assets, along with assumptions used in the calculation of income taxes, among others. These estimates and assumptions are based on management'smanagement’s best estimates and judgment. Management evaluates its estimates and assumptions on an ongoing basis using experience and other factors, including the current economic environment, which management believes to be reasonable under the circumstances. We adjust suchSuch estimates and assumptions are adjusted when facts and circumstances dictate. DecreasingChanging real estate values, illiquid credit markets, volatile equity markets, and declines in consumer spending have combined to increase the uncertainty inherent in such estimates and assumptions. As future events and their effects cannot be determined with precision, actual results could differ
significantly from these estimates. Changes in estimates resulting from continuing changes in the economic environment will be reflected in the financial statementstatements in future periods. In addition, these estimates do not reflect any premium or discount that could result from offering for sale at one time the Company'sCompany’s entire holdings of a particular financial instrument. Fair value estimates are based on existing on-balance and off-balance-sheet financial instruments without attempting to estimate the value of
113
anticipated future business and the value of assets and liabilities that are not considered financial instruments. In addition, the tax ramifications related to the realization of the unrealized gains and losses can have a significant effect on fair value estimates and have not been considered in many of the estimates.
NOTE 1920 - PARENT COMPANY ONLY CONDENSED FINANCIAL STATEMENTS
Condensed Balance Sheets
| December 31, | |||||||||||
| ($ in thousands) | 2021 | 2020 | |||||||||
| Assets | |||||||||||
| Cash | $ | 94,760 | $ | 75,475 | |||||||
| Investment in Bank | 1,568,796 | 1,200,689 | |||||||||
| Investment in nonbank subsidiaries | 14,302 | 9,778 | |||||||||
| Other assets | 33,847 | 35,108 | |||||||||
| Total assets | $ | 1,711,705 | $ | 1,321,050 | |||||||
| Liabilities and Shareholders’ Equity | |||||||||||
| Subordinated debentures and notes | $ | 154,899 | $ | 203,637 | |||||||
| Notes payable | 22,857 | 30,000 | |||||||||
| Accounts payable and other liabilities | 4,833 | 8,439 | |||||||||
| Shareholders' equity | 1,529,116 | 1,078,974 | |||||||||
| Total liabilities and shareholders' equity | $ | 1,711,705 | $ | 1,321,050 | |||||||
114
| December 31, | |||||||
| (in thousands) | 2017 | 2016 | |||||
| Assets | |||||||
| Cash | $ | 9,977 | $ | 52,245 | |||
| Investment in Enterprise Bank & Trust | 623,439 | 416,831 | |||||
| Investment in nonbank subsidiaries | 6,546 | 2,798 | |||||
| Other assets | 28,741 | 22,111 | |||||
| Total assets | $ | 668,703 | $ | 493,985 | |||
| Liabilities and Shareholders' Equity | |||||||
| Subordinated debentures and notes | $ | 118,105 | $ | 105,540 | |||
| Accounts payable and other liabilities | 2,025 | 1,347 | |||||
| Shareholders' equity | 548,573 | 387,098 | |||||
| Total liabilities and shareholders' equity | $ | 668,703 | $ | 493,985 | |||
Condensed Statements of Operations
| Year ended December 31, | |||||||||||||||||
| ($ in thousands) | 2021 | 2020 | 2019 | ||||||||||||||
| Income: | |||||||||||||||||
| Dividends from Bank | $ | 95,000 | $ | 37,000 | $ | 60,000 | |||||||||||
| Dividends from nonbank subsidiaries | 2,000 | 1,400 | 1,500 | ||||||||||||||
| Other | 3,600 | 483 | 663 | ||||||||||||||
| Total income | 100,600 | 38,883 | 62,163 | ||||||||||||||
| Expenses: | |||||||||||||||||
| Interest expense | 11,406 | 10,590 | 8,689 | ||||||||||||||
| Other expenses | 11,037 | 6,946 | 6,936 | ||||||||||||||
| Total expenses | 22,443 | 17,536 | 15,625 | ||||||||||||||
| Income before taxes and equity in undistributed earnings of subsidiaries | 78,157 | 21,347 | 46,538 | ||||||||||||||
| Income tax benefit | 3,710 | 3,448 | 3,478 | ||||||||||||||
| Net income before equity in undistributed earnings of subsidiaries | 81,867 | 24,795 | 50,016 | ||||||||||||||
| Equity in undistributed earnings of subsidiaries | 51,188 | 49,589 | 42,723 | ||||||||||||||
| Net income | $ | 133,055 | $ | 74,384 | $ | 92,739 | |||||||||||
115
| Years ended December 31, | |||||||||||
| (in thousands) | 2017 | 2016 | 2015 | ||||||||
| Income: | |||||||||||
| Dividends from subsidiaries | $ | 20,000 | $ | 7,500 | $ | 10,000 | |||||
| Other | 708 | 491 | 249 | ||||||||
| Total income | 20,708 | 7,991 | 10,249 | ||||||||
| Expenses: | |||||||||||
| Interest expense-subordinated debentures and notes | 5,094 | 1,893 | 1,248 | ||||||||
| Interest expense-notes payable | 89 | 53 | 144 | ||||||||
| Other expenses | 5,486 | 5,526 | 3,823 | ||||||||
| Total expenses | 10,669 | 7,472 | 5,215 | ||||||||
| Income before taxes and equity in undistributed earnings of subsidiaries | 10,039 | 519 | 5,034 | ||||||||
| Income tax benefit | 3,098 | 2,583 | 2,118 | ||||||||
| Net income before equity in undistributed earnings of subsidiaries | 13,137 | 3,102 | 7,152 | ||||||||
| Equity in undistributed earnings of subsidiaries | 35,053 | 45,735 | 31,298 | ||||||||
| Net income and comprehensive income | $ | 48,190 | $ | 48,837 | $ | 38,450 | |||||
Condensed Statements of Cash Flows
| Year ended December 31, | |||||||||||||||||
| ($ in thousands) | 2021 | 2020 | 2019 | ||||||||||||||
| Cash flows from operating activities: | |||||||||||||||||
| Net income | $ | 133,055 | $ | 74,384 | $ | 92,739 | |||||||||||
| Adjustments to reconcile net income to net cash provided by (used in) operating activities: | |||||||||||||||||
| Share-based compensation | 6,017 | 4,178 | 4,032 | ||||||||||||||
| Net income of subsidiaries | (148,188) | (87,989) | (104,223) | ||||||||||||||
| Dividends from subsidiaries | 97,000 | 38,400 | 61,500 | ||||||||||||||
| Other, net | (16) | 3,588 | (1,063) | ||||||||||||||
| Net cash provided by operating activities | 87,868 | 32,561 | 52,985 | ||||||||||||||
| Cash flows from investing activities: | |||||||||||||||||
| Proceeds (cash paid) for acquisitions, net of cash acquired | 2,346 | (1,243) | (36,015) | ||||||||||||||
| Purchases of other investments | (2,204) | (1,166) | (2,634) | ||||||||||||||
| Proceeds from distributions on other investments | 2,656 | 765 | 1,271 | ||||||||||||||
| Net cash provided by (used in) investing activities | 2,798 | (1,644) | (37,378) | ||||||||||||||
| Cash flows from financing activities: | |||||||||||||||||
| Proceeds from issuance of subordinated notes | — | 61,953 | — | ||||||||||||||
| Payments for the redemption of subordinated notes | (50,000) | — | — | ||||||||||||||
| Proceeds from notes payable | — | — | 1,000 | ||||||||||||||
| Repayments of notes payable | — | — | (3,000) | ||||||||||||||
| Proceeds from issuance of long-term debt | — | — | 40,000 | ||||||||||||||
| Repayment of long-term debt | (7,143) | (4,286) | (5,714) | ||||||||||||||
| Cash dividends paid | (26,153) | (19,795) | (16,569) | ||||||||||||||
| Payments for the repurchase of common stock | (60,589) | (15,347) | (15,526) | ||||||||||||||
| Proceeds from issuance of preferred stock | 71,988 | — | — | ||||||||||||||
| Other | 516 | 78 | (212) | ||||||||||||||
| Net cash provided by (used in) financing activities | (71,381) | 22,603 | (21) | ||||||||||||||
| Net increase in cash and cash equivalents | 19,285 | 53,520 | 15,586 | ||||||||||||||
| Cash and cash equivalents, beginning of year | 75,475 | 21,955 | 6,369 | ||||||||||||||
| Cash and cash equivalents, end of year | $ | 94,760 | $ | 75,475 | $ | 21,955 | |||||||||||
| Supplemental disclosures of cash flow information: | |||||||||||||||||
| Noncash transactions: | |||||||||||||||||
| Common shares issued in connection with acquisitions | $ | 343,650 | $ | 167,035 | $ | 171,885 | |||||||||||
116
| Years Ended December 31, | |||||||||||
| (in thousands) | 2017 | 2016 | 2015 | ||||||||
| Cash flows from operating activities: | |||||||||||
| Net income | $ | 48,190 | $ | 48,837 | $ | 38,450 | |||||
| Adjustments to reconcile net income to net cash provided by (used in) operating activities: | |||||||||||
| Share-based compensation | 3,427 | 3,367 | 3,601 | ||||||||
| Net income of subsidiaries | (55,053 | ) | (53,235 | ) | (41,298 | ) | |||||
| Dividends from subsidiaries | 20,000 | 7,500 | 10,000 | ||||||||
| Excess tax expense of share-based compensation | — | (1,327 | ) | (449 | ) | ||||||
| Other, net | (1,806 | ) | 1,848 | 848 | |||||||
| Net cash provided by operating activities | 14,758 | 6,990 | 11,152 | ||||||||
| Cash flows from investing activities: | |||||||||||
| Cash contributions to subsidiaries | — | (250 | ) | — | |||||||
| Cash paid for acquisitions, net of cash acquired | (25,187 | ) | — | — | |||||||
| Purchases of other investments | (3,679 | ) | (2,435 | ) | (2,832 | ) | |||||
| Proceeds from distributions on other investments | 1,634 | 1,151 | 880 | ||||||||
| Net cash used by investing activities | (27,232 | ) | (1,534 | ) | (1,952 | ) | |||||
| Cash flows from financing activities: | |||||||||||
| Proceeds from issuance of subordinated notes | — | 48,733 | — | ||||||||
| Proceeds from notes payable | 10,000 | — | — | ||||||||
| Repayments of notes payable | (10,000 | ) | — | (5,700 | ) | ||||||
| Cash dividends paid | (10,249 | ) | (8,211 | ) | (5,259 | ) | |||||
| Excess tax benefit of share-based compensation | — | 1,327 | 449 | ||||||||
| Payments for the repurchase of common stock | (16,636 | ) | (4,889 | ) | — | ||||||
| Payments for the issuance of equity instruments, net | (2,909 | ) | (2,203 | ) | (1,190 | ) | |||||
| Net cash provided (used) by financing activities | (29,794 | ) | 34,757 | (11,700 | ) | ||||||
| Net increase (decrease) in cash and cash equivalents | (42,268 | ) | 40,213 | (2,500 | ) | ||||||
| Cash and cash equivalents, beginning of year | 52,245 | 12,032 | 14,532 | ||||||||
| Cash and cash equivalents, end of year | $ | 9,977 | $ | 52,245 | $ | 12,032 | |||||
| Supplemental disclosures of cash flow information: | |||||||||||
| Noncash transactions: | |||||||||||
| Common shares issued in connection with JCB acquisition | $ | 141,729 | $ | — | $ | — | |||||
NOTE 2021 - QUARTERLY CONDENSEDSUPPLEMENTAL FINANCIAL INFORMATION (Unaudited)
The following table presents unaudited quarterly financial information formiscellaneous income and other expense components that exceed one percent of the aggregate of total interest income and other income in one or more of the periods indicated:
| Year ended December 31, | |||||||||||||||||
| ($ in thousands) | 2021 | 2020 | 2019 | ||||||||||||||
| Miscellaneous income: | |||||||||||||||||
| Community development fees | $ | 5,491 | $ | 3,353 | $ | 889 | |||||||||||
| Other miscellaneous income | 16,657 | 13,609 | 11,007 | ||||||||||||||
| Total miscellaneous income | $ | 22,148 | $ | 16,962 | $ | 11,896 | |||||||||||
| Other expense: | |||||||||||||||||
| Amortization expense | $ | 5,691 | $ | 5,673 | $ | 5,543 | |||||||||||
| Banking expenses | 6,123 | 4,921 | 5,258 | ||||||||||||||
| Customer analysis expense | 12,104 | 1,246 | — | ||||||||||||||
| FDIC and other insurance | 5,789 | 3,897 | 2,380 | ||||||||||||||
| Loan, legal expenses | 7,130 | 4,003 | 3,526 | ||||||||||||||
| Meals and entertainment | 1,253 | 742 | 3,670 | ||||||||||||||
| Outside services | 4,992 | 4,961 | 4,335 | ||||||||||||||
| Other expenses | 19,593 | 18,807 | 17,119 | ||||||||||||||
| Total other noninterest expenses | $ | 62,675 | $ | 44,250 | $ | 41,831 | |||||||||||
117
| 2017 | |||||||||||||||
| (in thousands, except per share data) | 4th Quarter | 3rd Quarter | 2nd Quarter | 1st Quarter | |||||||||||
| Interest income | $ | 54,789 | $ | 52,468 | $ | 51,542 | $ | 43,740 | |||||||
| Interest expense | 7,385 | 6,843 | 5,909 | 5,098 | |||||||||||
| Net interest income | 47,404 | 45,625 | 45,633 | 38,642 | |||||||||||
| Provision for portfolio loan losses | 3,186 | 2,422 | 3,623 | 1,533 | |||||||||||
| Provision reversal for purchased credit impaired loan losses | (279 | ) | — | (207 | ) | (148 | ) | ||||||||
| Net interest income after provision for loan losses | 44,497 | 43,203 | 42,217 | 37,257 | |||||||||||
| Noninterest income | 11,112 | 8,372 | 7,934 | 6,976 | |||||||||||
| Noninterest expense | 28,260 | 27,404 | 32,651 | 26,736 | |||||||||||
| Income before income tax expense | 27,349 | 24,171 | 17,500 | 17,497 | |||||||||||
| Income tax expense | 19,820 | 7,856 | 5,545 | 5,106 | |||||||||||
| Net income | $ | 7,529 | $ | 16,315 | $ | 11,955 | $ | 12,391 | |||||||
| Earnings per common share: | |||||||||||||||
| Basic | $ | 0.33 | $ | 0.70 | $ | 0.51 | $ | 0.57 | |||||||
| Diluted | 0.32 | 0.69 | 0.50 | 0.56 | |||||||||||
| 2016 | |||||||||||||||
| (in thousands, except per share data) | 4th Quarter | 3rd Quarter | 2nd Quarter | 1st Quarter | |||||||||||
| Interest income | $ | 39,438 | $ | 37,293 | $ | 37,033 | $ | 35,460 | |||||||
| Interest expense | 3,984 | 3,463 | 3,250 | 3,032 | |||||||||||
| Net interest income | 35,454 | 33,830 | 33,783 | 32,428 | |||||||||||
| Provision for portfolio loan losses | 964 | 3,038 | 716 | 833 | |||||||||||
| Provision reversal for purchased credit impaired loan losses | (343 | ) | (1,194 | ) | (336 | ) | (73 | ) | |||||||
| Net interest income after provision for loan losses | 34,833 | 31,986 | 33,403 | 31,668 | |||||||||||
| Noninterest income | 9,029 | 6,976 | 7,049 | 6,005 | |||||||||||
| Noninterest expense | 23,181 | 20,814 | 21,353 | 20,762 | |||||||||||
| Income before income tax expense | 20,681 | 18,148 | 19,099 | 16,911 | |||||||||||
| Income tax expense | 7,053 | 6,316 | 6,747 | 5,886 | |||||||||||
| Net income | $ | 13,628 | $ | 11,832 | $ | 12,352 | $ | 11,025 | |||||||
| Earnings per common share: | |||||||||||||||
| Basic | $ | 0.68 | $ | 0.59 | $ | 0.62 | $ | 0.55 | |||||||
| Diluted | 0.67 | 0.59 | 0.61 | 0.54 | |||||||||||
ITEM 9: CHANGES IN AND DISAGREEMENTS WITH ACCOUNTANTS ON ACCOUNTING AND FINANCIAL DISCLOSURE
None.
ITEM 9A: CONTROLS AND PROCEDURES
Evaluation of Disclosure Controls and Procedures
Our management, with the participation of our Chief Executive Officer and our Chief Financial Officer, evaluated the Company’s disclosure controls and procedures (as defined in Rule 13a-15(e) and 15d-15(e) under the Securities Exchange Act of 1934, as amended, the “Act”) as of December 31, 2017.2021. Based upon this evaluation, our Chief Executive Officer and our Chief Financial Officer have concluded that as of December 31, 2017,2021, such disclosure controls and procedures were effective to ensure that information required to be disclosed by the Company in the reports it files or submits under the Act is accumulated and communicated to the Company’s management (including the Chief Executive Officer and Chief Financial Officer) to allow timely decisions regarding required disclosure, and is recorded, processed, summarized and reported within the time periods specified in the SEC’s rules and forms.
Management of the Company is responsible for establishing and maintaining adequate internal control over financial reporting (as defined in Rule 13a-15(e)13a-15(f) and 15(d)-15(e)-15(f) under the Securities Exchange Act of 1934, as amended, the “Act”)Act). The Company’s internal control system is a process designed to provide reasonable assurance to the Company’s management and Board of Directors regarding the preparation and fair presentation of published financial statements.
The Company’s internal control over financial reporting includes policies and procedures that pertain to the maintenance of records that, in reasonable detail, accurately and fairly reflect transactions and dispositions of assets; provide reasonable assurances that transactions are recorded as necessary to permit preparation of financial statements in accordance with accounting principles generally accepted in the United States of America, and that receipts and expenditures are being made only in accordance with authorizations of management and the directors of the Company; and provide reasonable assurance regarding prevention or untimely detection of unauthorized acquisition, use or disposition of the Company’s assets that could have a material effect on the Company’s financial statements.
All internal control systems, no matter how well designed, have inherent limitations. Therefore, even those systems determined to be effective can provide only reasonable assurance with respect to financial reporting. Further, because of changes in conditions, the effectiveness of any system of internal control may vary over time. The design of any internal control system also factors in resource constraints and consideration for the benefit of the control relative to the cost of implementing the control. Because of these inherent limitations in any system of internal control, management cannot provide absolute assurance that all control issues and instances of fraud within the Company have been detected.
Management assessed the effectiveness of the Company’s internal control over financial reporting as of December 31, 2017.2021. In making this assessment, management used the criteria set forth by the Internal Control - Integrated Framework (2013) issued by the Committee of Sponsoring Organizations of the Treadway Commission. Management has concluded that the Company maintained an effective system of internal control over financial reporting based on these criteria as of December 31, 2017.2021.
The Company’s independent registered public accounting firm, Deloitte & Touche LLP, who audited the consolidated financial statements, has issued an audit report on the Company’s internal control over financial reporting as of December 31, 2017,2021, and it is included herein.
118
Changes in Internal Control Over Financial Reporting
There have been no changes in the Company’s internal control over financial reporting (as defined in Rule 13a-15(f) and 15d-15(f) under the Act) that occurred during the Company’s quarter ended December 31, 20172021 that have materially affected, or are reasonably likely to materially affect, the Company’s internal control over financial reporting.
ITEM 9B: OTHER INFORMATION
None.
ITEM 9C: DISCLOSURE REGARDING FOREIGN JURISDICTIONS THAT PREVENT INSPECTIONS
Not applicable.
PART III
ITEM 10: DIRECTORS, EXECUTIVE OFFICERS AND CORPORATE GOVERNANCE
The information required by this item is incorporated herein by reference to the Board and Committee Information and Executive Officer sections of the Company'sCompany’s Proxy Statement for its annual meeting2022 Annual Meeting of Shareholders, which will be filed pursuant to be heldRegulation 14A under the Securities Exchange Act of 1934, as amended, not later than 120 days after December 31, 2021.
Governance:
The Company has adopted a Code of Ethics applicable to all of its directors and employees, including the principal executive officer, principal financial officer and principal accounting officer. A copy of the Code of Ethics is available on Wednesday, May 2, 2018.the Company’s website at www.enterprisebank.com.
ITEM 11: EXECUTIVE COMPENSATION
The information required by this item is incorporated herein by reference to the Executive Compensation section of the Company'sCompany’s Proxy Statement for its annual meeting2022 Annual Meeting of Stockholders, which will be filed pursuant to be held on Wednesday, May 2, 2018.Regulation 14A under the Securities Exchange Act of 1934, as amended, not later than 120 days after December 31, 2021.
ITEM 12: SECURITY OWNERSHIP OF CERTAIN BENEFICIAL OWNERS AND MANAGEMENT AND RELATED STOCKHOLDER MATTERS
Securities Authorized for Issuance Under Equity Compensation Plans
The following table provides information regarding the securities authorized for issuance under our equity compensation plans as of December 31, 2021.
EQUITY COMPENSATION PLAN INFORMATION
| Plan Category | Number of securities to be issued upon exercise of outstanding options, warrants and rights (a) | Weighted-average exercise price of outstanding options, warrants and rights (b) | Number of securities remaining available for future issuance under equity compensation plans (c) | |||||||||||||||||
| Equity compensation plans approved by security holders | 477,686 | $ | 43.80 | 1,301,150 | ||||||||||||||||
| Equity compensation plans not approved by security holders | — | — | — | |||||||||||||||||
| Total | 477,686 | $ | 43.80 | 1,301,150 | ||||||||||||||||
(a) Includes the following:
•181,657 shares of common stock to be issued upon vesting of outstanding restricted stock units under the 2018 Stock Incentive Plan;
•169,244 shares of common stock to be issued upon vesting of outstanding performance units under the 2018 Stock Incentive Plan;
•112,927 shares of common stock to be issued upon exercise of outstanding non-qualified stock options; and
•22,300 shares of common stock to be issued upon deferral release of common stock under the 2018 Stock Incentive Plan and the Non-Management Director Stock Plan.
(b) Includes the following:
•price only applicable to the outstanding non-qualified stock options.
(c) Includes the following:
•670,326 shares of common stock available for issuance under the 2018 Stock Incentive Plan;
•73,618 shares of common stock available for issuance under the Non-Management Director Stock Plan; and
•571,064 shares of common stock available for issuance under the 2018 Employee Stock Purchase Plan.
Additional information required by this item is incorporated herein by reference to the Information Regarding Beneficial Ownership section of the Company'sCompany’s Proxy Statement for its annual meeting2022 Annual Meeting of Stockholders, which will be filed pursuant to be held on Wednesday, May 2, 2018.Regulation 14A under the Securities Exchange Act of 1934, as amended, not later than 120 days after December 31, 2021.
ITEM 13: CERTAIN RELATIONSHIPS AND RELATED TRANSACTIONS, AND DIRECTOR INDEPENDENCE
The information required by this item is incorporated herein by reference to the Related Person Transactions section of the Company'sCompany’s Proxy Statement for its annual meeting2022 Annual Meeting of Stockholders, which will be filed pursuant to be held on Wednesday, May 2, 2018.Regulation 14A under the Securities Exchange Act of 1934, as amended, not later than 120 days after December 31, 2021.
ITEM 14: PRINCIPAL ACCOUNTANTACCOUNTING FEES AND SERVICES
The information required by this item is incorporated by reference to the Fees Paid to Independent Registered Public Accounting Firm section of the Company'sCompany’s Proxy Statement for its annual meeting2022 Annual Meeting of Stockholders, which will be filed pursuant to be held on Wednesday, May 2, 2018.Regulation 14A under the Securities Exchange Act of 1934, as amended, not later than 120 days after December 31, 2021.
121
PART IV
ITEM 15: EXHIBITS AND FINANCIAL STATEMENT SCHEDULES
(a) 1. Financial Statements
The following consolidated financial statements of Enterprise Financial Services Corp and its subsidiaries and independent auditors'auditors’ reports are included in Part II, Item 8, of this Form 10-K.10-K and are incorporated by reference from Part II, Item 8 hereof:
Report of Independent Registered Public Accounting Firm
Consolidated Balance Sheets at December 31, 2021 and 2020
Consolidated Statements of Operations for the years ended December 31, 2021, 2020, and 2019
Consolidated Statements of Comprehensive Income for the years ended December 31, 2021, 2020, and 2019
Consolidated Statements of Shareholders’ Equity for the years ended December 31, 2021, 2020, and 2019
Consolidated Statements of Cash Flows for the years ended December 31, 2021, 2020, and 2019
Notes to Consolidated Financial Statements
2. Financial Statement Schedules
All financial statement schedules have been omitted, as they are either inapplicable or included in the Notes to Consolidated Financial Statements.
3. Exhibits
No.Description
122
3.8 Amendment to the Certificate of Incorporation of Registrant (incorporated herein by reference to Appendix C to Registrant’s Registration Statement on Form S-4/A filed on June 2, 2021 (File No. 333-256265)).
3.10 Certificate of Elimination of Registrant’s Certificate of Designation, Preferences, and Rights of the Fixed Rate Cumulative Perpetual Preferred Stock, Series A, dated November 9, 2021 (incorporated herein by reference to Exhibit 3.1 to Registrant’s Current Report on Form 8-K filed on November 9, 2021 (File No. 001-15373)).
3.11 Certificate of Designation of Registrant of Fixed Rate Non-Cumulative Perpetual Preferred Stock, Series A, dated November 16, 2021 (incorporated herein by reference to Exhibit 3.1 to Registrant’s Current Report on Form 8-K filed on November 17, 2021 (File No. 001-15373)).
4.2 Long-term borrowing instruments are omitted pursuant to Item 601(b)(4)(iii) of Regulation S-K. The Company undertakes to furnish copies of such instruments to the Securities and Exchange Commission upon request.
10.1.2* Executive Employment Agreement dated September 13, 2013 by and between Enterprise Financial Services Corp and Keene S. Turner (incorporated by reference herein to Exhibit 10.1 to Registrant’s Quarterly Report on Form 10-Q for the period ending September 30, 2013 (File No. 001-15373)), amended by that First Amendment of Executive Employment Agreement dated as of February 27, 2015 (incorporated herein by reference to Exhibit 10.1.7 to the Registrant’s Annual Report on Form 10-K filed on February 27, 2015 (File No. 001-15373)), and amended by that Second Amendment to Executive Employment Agreement dated as of October 29, 2015 (incorporated by reference to Exhibit 10.1.2 to the Registrant’s Quarterly Report on Form 10-Q for the period ending September 30, 2015 (File No. 001-15373)).
123
10.1.4* Executive Employment Agreement dated effective January 1, 2005 by and between Enterprise Financial Services Corp and Scott R. Goodman, amended by that First Amendment of Executive Employment Agreement dated as of December 31, 2008 (incorporated herein by reference to Exhibit 10.1.5 to Registrant’s Annual Report on Form 10-K filed on March 15, 2013 (File 001-15373)), and amended by that Second Amendment of Executive Employment Agreement dated October 11, 2013 (incorporated herein by reference to Exhibit 10.1.5 to Registrant’s Annual Report on Form 10-K filed on March 17, 2014 (File 001-15373)).
10.1.9* Enterprise Financial Services Corp, Stock Plan for Non-Management Directors (incorporated herein by reference to Registrant’s Proxy Statement on Schedule 14-A filed on March 7, 2006, as amended on Schedule 14A filed on April 23, 2012 (File No. 001-15373), and as amended on Schedule 14A filed on April 17, 2019 (File No. 001-15373)).
10.1.10* Enterprise Financial Services Corp, Annual Incentive Plan (incorporated herein by reference to Appendix C to Registrant's Proxy Statement on Schedule 14A, filed on March 7, 2006 and as amended on Schedule 14A filed on April 23, 2012 (File No. 001-15373)).
10.1.14* Form of Enterprise Financial Services Corp Stock Option Award Agreement, pursuant to Amended and Restated 2018 Stock Incentive Plan (incorporated herein by reference to Exhibit 10.1.14 to Registrant’s Annual Report on Form 10-K filed on February 19, 2021 (File No. 001-15373)).
10.1.15* Enterprise Financial Services Corp. Amendment to the Amended and Restated 2018 Stock Incentive Plan (incorporated herein by reference to Appendix A to Registrant’s Proxy Statement on Schedule 14A, filed on March 17, 2021 (File No. 001-15373)).
124
10.3 Loan Agreement dated February 24, 2016 between US Bank National Association and Registrant (incorporated herein by reference to Exhibit 10.2 to the Registrant’s Report on Form 10-K for the year ended December 31, 2015 (File No. 001-15373)), amended by the First Amendment to Loan Agreement dated as of February 23, 2017 (incorporated herein by reference to Exhibit 10.2 to Registrant’s Report on Form 10-K for the year ended December 31, 2016 (File No. 001-15373)), amended by the Second Amendment to Loan agreement dated as of February 23, 2018 (incorporated herein by reference to Exhibit 10.2 to Registrant’s Report on Form 10-K for the year ended December 31, 2017 (File No. 001-15373)),amended by the Third Amendment to Loan agreement dated as of February 22, 2019 (incorporated herein by reference to Exhibit 10.3 to the Registrant’s Report on Form 10-K for the year ended December 31, 2018 (File No. 001-15373)), amended by the Fourth Amendment to Loan agreement dated as of February 22, 2020, (incorporated herein by reference to Exhibit 10.3 to Registrant's Annual Report on Form 10-K filed on February 22, 2020 (File No. 001-15373)),amended by the Fifth Amendment to Loan Agreement dated as of February 22, 2021, and amended by the Sixth Amendment to Loan Agreement dated as of February 22, 2022, (filed herewith).
24.1+ Power of Attorney.
101+ Pursuant to Rule 405 of Regulation S-T, the following financial information from the Company’s Annual Report on Form 10-K for the period ended December 31, 2021, is formatted in Inline XBRL interactive data files: (i) Consolidated Balance Sheet at December 31, 2021 and December 31, 2020; (ii) Consolidated Statements of Operations for the years ended December 31, 2021, 2020, and 2019; (iii) Consolidated Statements of Comprehensive Income for the years ended December 31, 2021, 2020, and 2019; (iv) Consolidated Statements of Shareholders’ Equity for the years ended December 31, 2021, 2020, and 2019; (v) Consolidated Statements of Cash Flows for the years ended December 31, 2021, 2020, and 2019; and (vi) Notes to Consolidated Financial Statements.
104+ The cover page of Enterprise Financial Services Corp’s Annual Report on Form 10-K for the year ended December 31, 2021, formatted in Inline XBRL (contained in Exhibit 101).
* Management contract or compensatory plan or arrangement.
+ Filed herewith
Note: In accordance with Item 601 (b) 601(b)(4)(iii) of Regulation S-K, Registrant hereby agrees to furnish to the SEC, upon its request, a copy of any instrument that defines the rights of holders of each issue of long-term debt of Registrant and its consolidated subsidiaries for which consolidated and unconsolidated financial statements
are required to be filed and that authorizes a total amount of securities not in excess of ten percent of the total assets of the Registrant on a consolidated basis.
(b) The exhibits not incorporated by reference herein are filed herewith.
125
(c) The financial statement schedules are either included in the Notes to Consolidated Financial Statements or omitted if inapplicable.
ITEM 16: FORM 10-K SUMMARY
None.
126
SIGNATURES
Pursuant to the requirements of Section 13 or 15(d) of the Securities Exchange Act of 1934, as amended, the Registrant has duly caused this report to be signed on its behalf by the undersigned, thereunto duly authorized on February 23, 2018.25, 2022.
ENTERPRISE FINANCIAL SERVICES CORP
| /s/ James B. Lally | ||
| James B. Lally | ||
| Chief Executive Officer and Director | ||
127
Pursuant to the requirements of the Securities Exchange Act of 1934, this Report on Form 10-Kreport has been signed by the following persons on behalf of the registrant and in the capacities indicated on February 23, 2018.
25, 2022.
| Signatures | Title | |||||||
| /s/ James B. Lally | Chief Executive Officer and Director (Principal Executive Officer) | |||||||
| James B. Lally | ||||||||
| /s/ Keene S. Turner | Executive Vice President and Chief Financial Officer (Principal Financial Officer) | |||||||
| Keene S. Turner | ||||||||
| /s/ | Chief Accounting Officer (Principal Accounting Officer) | |||||||
| /s/ John S. Eulich* | ||||||||
| John S. Eulich | Chairman of the Board of Directors | |||||||
| /s/ Michael A. DeCola* | ||||||||
| Michael A. DeCola | Director | |||||||
| /s/ Robert E. Guest, Jr.* | ||||||||
| Robert E. Guest, Jr. | Director | |||||||
| /s/ James M. Havel* | ||||||||
| James M. Havel | Director | |||||||
| /s/ Judith S. Heeter* | ||||||||
| Judith S. Heeter | Director | |||||||
| /s/ Michael R. Holmes* | ||||||||
| Michael R. Holmes | Director | |||||||
| /s/ Peter H. Hui* | ||||||||
| Peter H. Hui | Director | |||||||
| /s/ Nevada A. Kent, IV* | ||||||||
| Nevada A. Kent, IV | Director | |||||||
| /s/ | ||||||||
| Director | ||||||||
| /s/ Anthony R. Scavuzzo* | ||||||||
| Anthony R. Scavuzzo | Director | |||||||
| /s/ Eloise E. Schmitz* | ||||||||
| Eloise E. Schmitz | Director | |||||||
| /s/ Sandra A. Van Trease* | ||||||||
| Sandra A. Van Trease | Director | |||||||
*Signed by Power of Attorney.By: /s/ Keene S. Turner
Keene S. Turner
Attorney-In-Fact
February 25, 2022
128