WASHINGTON, D. C. 20549
FORM 10-K[ X ] ANNUAL REPORT PURSUANT TO SECTION 13 OR 15(d) OF THE SECURITIES EXCHANGE ACT OF 1934
For the fiscal year ended December 31, 2006.
OR[ ] TRANSITION REPORT PURSUANT TO SECTION 13 OR 15(d) OF THE SECURITIES EXCHANGE ACT OF 1934
Commission file number 0-13089
x | ANNUAL REPORT PURSUANT TO SECTION 13 OR 15(d) OF THE SECURITIES EXCHANGE ACT OF 1934 |
For the fiscal year ended December 31, 2008. | |
OR | |
o | TRANSITION REPORT PURSUANT TO SECTION 13 OR 15(d) OF THE SECURITIES EXCHANGE ACT OF 1934 |
Commission file number 0-13089 | |
Hancock Holding Company
(Exact
(Exact name of registrant as specified in its charter)Mississippi 64-0693170
(State or other jurisdiction of incorporation or organization) (I.R.S. Employer Identification Number)
One Hancock Plaza, Gulfport, Mississippi 39501 (228) 868-4727
(Address of principal executive offices) (Zip Code) Registrant's telephone number, including area code
Securities registered pursuant to Section 12(b) of the Act:
COMMON STOCK, $3.33 PAR VALUE The NASDAQ Stock Market, LLC
(Title of Class) (Name of Exchange on Which Registered)
Mississippi | 64-0693170 | ||
(State or other jurisdiction of incorporation or organization) | (I.R.S. Employer Identification Number) | ||
One Hancock Plaza, Gulfport, Mississippi | 39501 | (228) 868-4727 | |
(Address of principal executive offices) | (Zip Code) | Registrant’s telephone number, including area code | |
Securities registered pursuant to Section 12(b) of the Act: | |
COMMON STOCK, $3.33 PAR VALUE | The NASDAQ Stock Market, LLC |
(Title of Class) | (Name of Exchange on Which Registered) |
Securities registered pursuant to Section 12(g) of the Act: NONE
Indicate by check mark if the registrant is a well-known seasoned issuer, as defined in Rule 405 of the Securities Act. Yes Xx No ------- -------
o
Indicate by check mark if the registrant is not required to file reports pursuant to Section 13 or Section 15(d) of the Act. Yes oNo X
-------- -------
x
Indicate by check mark whether the registrant (1) has filed all reports required to be filed by Section 13 or 15(d) of the Securities Exchange Act of 1934 during the preceding 12 months (or for such shorter period that the registrant was required to file such reports) and (2) has been subject to such filing requirements for the past 90 days. Yes Xx No ------- ---------
o
Indicate by check mark if disclosure of delinquent filers pursuant to Item 405 of Regulation S-K is not contained herein, and will not be contained, to the best of registrant'sregistrant’s knowledge, in definitive proxy or information statements incorporated by reference in Part III of this Form 10-K or any amendment to this Form 10-K. Yes Xo No ----- -----
x
Indicate by check mark whether the registrant is a large accelerated filer, an accelerated filer, or a non-accelerated filer. See definition of "accelerated“accelerated filer and large accelerated filer"filer” in Rule 12b-2 of the Exchange Act. (Check One):
Large accelerated filer X Accelerated filer Non-accelerated filer
------ ------- -------
Large accelerated filer x | Accelerated filer o | Non-accelerated filer o |
Indicate by check mark whether the registrant is a shell company (as defined in Rule 12b-2 of the Act).Yes. Yes o No X
----- ------
x
The aggregate market value of the voting stock held by nonaffiliates of the registrant as of June 30, 20062008 was $1,502,420,422$1,016,381,401 based upon the closing market price on NASDAQ as of such date. For purposes of this calculation only, shares held by nonaffiliates are deemed to consist of (a) shares held by all shareholders other than directors and executive officers of the registrant plus (b) shares held by directors and officers as to which beneficial ownership has been disclaimed.
On February 9, 2007,2, 2009, the registrant had outstanding 32,671,19631,802,848 shares of common stock for financial statement purposes.
DOCUMENTS INCORPORATED BY REFERENCE
Portions of the
Registrant'sRegistrant’s Annual Report to Stockholders for the year ended December 31,20062008 are incorporated by reference into Part I and Part II of this report.Portions of the definitive Proxy Statement used in connection with the
Registrant'sRegistrant’s Annual Meeting of Shareholders to be held on March29, 200726, 2009 are incorporated by reference into Part III of this report.
Hancock Holding Company
Form 10-K
IndexPART I
ITEM 1. BUSINESS 1 ITEM 1A. RISK FACTORS 10 ITEM 1B. UNRESOLVED STAFF COMMENTS 14 ITEM 2. PROPERTIES 14 ITEM 3. LEGAL PROCEEDINGS 14 ITEM 4. SUBMISSION OF MATTERS TO A VOTE OF SECURITY HOLDERS 14 PART II ITEM 5. MARKET FOR THE REGISTRANT'S COMMON EQUITY, RELATED STOCKHOLDER MATTERS AND ISSUER PURCHASES OF EQUITY SECURITIES 15 ITEM 6. SELECTED FINANCIAL DATA 18 ITEM 7. MANAGEMENT'S DISCUSSION AND ANALYSIS OF FINANCIAL CONDITION AND RESULTS OF OPERATIONS 21 ITEM 7A. QUANTITATIVE AND QUALITATIVE DISCLOSURES ABOUT MARKET RISK 47 ITEM 8. FINANCIAL STATEMENTS AND SUPPLEMENTARY DATA 48 ITEM 9. CHANGES IN AND DISAGREEMENTS WITH ACCOUNTANTS ON ACCOUNTING AND FINANCIAL DISCLOSURE 101 ITEM 9A. CONTROLS AND PROCEDURES 101 ITEM 9B. OTHER INFORMATION 101 PART III ITEM 10. DIRECTORS, EXECUTIVE OFFICERS AND CORPORATE GOVERNANCE 102 ITEM 11. EXECUTIVE COMPENSATION 102 ITEM 12. SECURITY OWNERSHIP OF CERTAIN BENEFICIAL OWNERS AND MANAGEMENT AND RELATED STOCKHOLDER MATTERS 102 ITEM 13. CERTAIN RELATIONSHIPS AND RELATED TRANSACTIONS, AND DIRECTOR INDEPENDENCE 102 ITEM 14. PRINCIPAL ACCOUNTANT FEES AND SERVICES 102 PART IV ITEM 15. EXHIBITS, FINANCIAL STATEMENT SCHEDULES 103
BUSINESS |
ORGANIZATION AND RECENT DEVELOPMENTS
Hancock Holding Company (the Company), organized in 1984 as a bank holding company registered under the Bank Holding Company Act of 1956, as amended, is headquartered in Gulfport, Mississippi. In 2002, the Company qualified as a financial holding company giving it broader powers. At December 31, 2006,2008, the Company operated more than 140157 banking and financial services offices and more than 130137 automated teller machines (ATMs) in the states of Mississippi, Louisiana, Florida and FloridaAlabama through threefour wholly-owned bank subsidiaries, Hancock Bank, Gulfport, Mississippi (Hancock Bank MS), Hancock Bank of Louisiana, Baton Rouge, Louisiana (Hancock Bank LA) and, Hancock Bank of Florida, Tallahassee, Florida (Hancock Bank FL). and Hancock Bank MS also operates a loan production office in the State of Alabama.Alabama, Mobile, Alabama (Hancock Bank AL). Hancock Bank MS, Hancock Bank LA, Hancock Bank FL and Hancock Bank FLAL are referred to collectively as the “Banks”.
The Banks are community oriented and focus primarily on offering commercial, consumer and mortgage loans and deposit services to individuals and small to middle market businesses in their respective market areas. The Company’s operating strategy is to provide its customers with the financial sophistication and breadth of products of a regional bank, while successfully retaining the local appeal and level of service of a community bank. At December 31, 2006,2008, the Company had total assets of $5.96$7.2 billion and 1,8481,952 employees on a full-time equivalent basis.
Hancock Bank MS was originally chartered as Hancock County Bank in 1899. Since its organization, the strategy of Hancock Bank MS has been to achieve a dominant market share on the Mississippi Gulf Coast. Prior to a series of acquisitions begun in 1985, growth was primarily internal and was accomplished by branch expansions in areas of population growth where no dominant financial institution previously served the market area. Economic expansion on the Mississippi Gulf Coast has resulted primarily from growth of military and government-related facilities, tourism, port facility activities, industrial complexes and the gaming industry. Based on the most current available published data, Hancock Bank MS has the largest deposit market share in each of the following five counties: Harrison, Hancock, Jackson, Lamar and Pearl River. In addition, Hancock Bank MS has a presence in the following counties: Forrest and Jefferson Davis. With assets of $3.5 billion atAt December 31, 2006,2008, Hancock Bank MS was ranked the third largest bank in Mississippi.had total assets of $3.8 billion and 1,279 employees on a full-time equivalent basis.
In August 1990, the Company formed Hancock Bank LA to assume the deposit liabilities and acquire the consumer loan portfolio, corporate credit card portfolio and non-adversely classified securities portfolio of American Bank and Trust, Baton Rouge, Louisiana, (AmBank), from the Federal Deposit Insurance Corporation (FDIC). Economic expansion in East Baton Rouge Parish has resulted from growth in state government and related service industries, educational and medical complexes, petrochemical industries, port facility activities and transportation and related industries. With the purchase of two Dryades Savings Bank, F.S.B. branches in 2003 and the 2007 opening of a new financial center in New Orleans’ Central Business District, Hancock Bank LA established a long-awaited presence in the Greater New Orleans area. At December 31, 2008, Hancock Bank LA had total assets of $2.4$3.0 billion and 573 employees on a full-time equivalent basis.
Hancock Bank FL was formed in March 2004 with the acquisition of Tallahassee’s Guaranty National Bank. In addition to the five branches acquired in the Tallahassee area in 2004, Hancock Bank FL has since opened two more branches in the Pensacola market. Hancock Bank FL had total assets of $367.1 million and 58 employees on a full-time equivalent basis at December 31, 2006,2008.
In February 2007, Hancock Bank LAAL was rankedincorporated in Mobile, AL. During 2007 and 2008, five branches have been opened to serve the fourth largest bank in Louisiana.Mobile area and Alabama’s Eastern Shore. At December 31, 2008, Hancock Bank AL had total assets of $155.9 million and 43 employees on a full-time equivalent basis.
CURRENT OPERATIONS
Loan Production and Credit Review
The Banks’ primary lending focus is to provide commercial, consumer, commercial leasing and real estate loans to consumers and to small and middle market businesses in their respective market areas. The Banks have no significant concentrations of loans to particular borrowers or industries or loans to any foreign entities. Each loan officer has Board approved loan limits on the principal amount of secured and unsecured loans that can be approved for a single borrower without prior approval of a loan committee.one or more Regional Credit Officers. All loans, however, must meet the credit underwriting standards and loan policies of the Banks.
All loans over an individual loan officer’s Board approved lending authority must be approved by one of the Bank’s centralized loan committee, the region’s loan committeeunderwriting units, by a senior lender or by another loan officer with greater lending authority. Both the regional loan committee and the Bank’s senior loan committee must review and approve any loan for a borrower whose total indebtedness exceeds the region’s approved limit.one or more Regional Credit Officers. Each loan file is reviewed by the Bank’s loan operations quality assurance function, a component of its loan review system, to ensure proper documentation and asset quality.
Loan Review and Asset Quality
Each Bank’s portfolio of loan relationships aggregating $500,000 or more is reviewed every 12 to 18 months by the Bank’s Loan Review staff to identify any deficiencies and report them to management to take corrective actions as necessary. Periodically, selected loan relationships aggregating less than $500,000 are also reviewed. As a result of such reviews, each Bank places on its Watch list loans requiring close or frequent review. All loans over $100,000 classified by a regulatory auditor are also placed on the Watch list. All Watch list and past due loans are reviewed monthly by the Banks’ senior lending officers. All Watch list loans are reviewed monthly by the Bank’s Asset Quality Committee and quarterly by the Banks’ Board of Directors’ Loan Oversight Committee.
In addition, in the approval process, all loans to a particular borrower are considered, regardless of classification, each time such borrower requests a renewal or extension of any loan or requests a new loan. All lines of credit are reviewed before renewal. The Banks currently have mechanisms in place that require borrowers to submit annual financial statements, except borrowers with secured installment and residential mortgage loans.
Consumer loans which become 30 days delinquent are reviewed regularly by management. As a matter of policy, loans are placed on a nonaccrualnon-accrual status when the loan is (1) payment in full, of principal or interest is not expected or (2) the principal or interest has been in default for a period of 90 days, unless the loan is well secured and in the process of collection.
The Banks follow the standard FDIC loan classification system. This system provides management with (1) a general view of the quality of the overall loan portfolio (each Bank’s loan portfolio and each commercial loan officer’s loan portfolio) and (2) information on specific loans that may need individual attention.
The Bank’s nonperforming assets, consisting of real property, vehicles and other items held for resale, were acquired generally through the process of foreclosure. At December 31, 2006,2008, the book value of those assets held for resale was approximately $568 thousand.$5.2 million.
Securities Portfolio
The Banks maintain portfolios of securities consisting primarily of U.S. Treasury securities, U.S. government agency issues, agency mortgage-backed securities, agency CMOs and tax-exempt obligations of states and political subdivisions. The portfolios are designed to enhanceprovide liquidity to fund loan growth and deposit outflows while providing acceptable rates of return.maximizing interest income within pre-defined risk parameters. Therefore, the Banks invest only in high quality securities of investment grade quality and with a target effective duration, for the overall portfolio, generally between two to five years.
The Banks’ policies limit investments to securities having a rating of no less than “Baa”, or its equivalent by a Nationally Recognized Statistical Rating Agency, except for certain obligations of Mississippi, Louisiana, Florida or FloridaAlabama counties, parishes and municipalities.
Deposits
The Banks have several programs designed to attract depository accounts offered to consumers and to small and middle market businesses at interest rates generally consistent with market conditions. Additionally, the Banks operate more than 130 ATMs at the Company’s banking offices as well as free-standing ATMs at other locations. As members of regional and international ATM networks such as “STAR”, “PLUS” and “CIRRUS”, the Banks offer customers access to their depository accounts from regional, national and international ATM facilities. Deposit flows are controlled by the Banks primarily through pricing, and to a certain extent, through promotional activities. Management believes that the rates it offers, which are posted weekly on deposit accounts, are generally competitive with other financial institutions in the Banks’ respective market areas.
Trust Services
The Banks, through their respective Trust Departments, offer a full range of trust services on a fee basis. The Banks act as executor, administrator or guardian in administering estates. Also provided are investment custodial services for individuals, businesses and charitable and religious organizations. In their trust capacities, the Banks provide investment management services on an agency basis and act as trustee for pension plans, profit sharing plans, corporate and municipal bond issues, living trusts, life insurance trusts and various other types of trusts created by or for individuals, businesses and charitable and religious organizations. As of December 31, 2006,2008, the Trust Departments of the Banks had approximately $7.1$7.7 billion of assets under administration compared to $5.5$8.3 billion as of December 31, 2005.2007. As of December 31, 2006, $3.82008, $4.2 billion of administered assets were corporate trust accounts and the remaining balances were personal, employee benefit, estate and other trust accounts.
Operating Efficiency Strategy
The primary focus of the Company’s operating strategy is to increase operating income and to reduce operating expense. A Company’s operating efficiency ratio indicates the percentage of each dollar of net revenue that is used to fund operating expenses. Net revenue for a financial institution is the total of net interest income plus non-interest income, excluding securities transactions gains or losses. Operating expenses exclude the amortization of intangibles.
Other Activities
Hancock Bank MS has 6 subsidiaries through which it engages in the following activities: providing consumer financing services; owning, managing and maintaining certain real property; providing general insurance agency services; holding investment securities; marketing credit life insurance; and providing discount investment brokerage services. The income of these subsidiaries generally accounts for less than 10% of the Company’s total net earnings.
During 2001, the Company began servicing mortgage loans for the Federal National Mortgage Association. At that time the loans serviced were originated and closed by the Company’s mortgage subsidiary. The servicing activity was also performed by this same subsidiary. In the middle of 2003, however, the Company modified its strategy and reverted to selling the majority of its conforming loans with servicing released. In December 2004, the Company’s mortgage subsidiary merged with Hancock Bank MS, its parent. Currently all mortgage activity is being reported by Hancock Bank MS, Hancock Bank of Louisiana, Hancock Bank of Florida and Hancock Bank of Florida.
In July 2003, Hancock Bank MS opened a loan production office in Mobile, Alabama. Until September 2005, no deposits were accepted at this location. Subsequent to Hurricane Katrina the State of Alabama allowed Hancock Bank MS to open a temporary branch in Alabama. In January 2007, Hancock Bank of Alabama was granted a charter by the State of Alabama.
Hancock Bank MS also owns approximately 3,700 acres of timberland in Hancock County, Mississippi, most of which was acquired through foreclosure in the 1930's.1930’s. Timber sales and oil and gas leases on this acreage generate less than 1% of the Company’s annual net income.
Competition
The deregulation of the financial services industry, the elimination of many previous distinctions between commercial banks and other financial institutions as well as legislation enacted in Mississippi, Louisiana and other states allowing state-wide branching, multi-bank holding companies and regional interstate banking have all served to foster a highly competitive environment for commercial banking in our market area. The principal competitive factors in the markets for deposits and loans are interest rates and fee structures associated with the various products offered. We also compete through the efficiency, quality, range of services and products it provides, as well as the convenience provided by an extensive network of customer access channels including local branch offices, ATM’s, online banking, and telebanking centers. Access to the bank’s extensive network of customer access points is further enhanced by convenient hours including Saturday banking at selected branch locations and through the bank’s telebanking service center.
In attracting deposits and in our lending activities, we generally compete with other commercial banks, savings associations, credit unions, mortgage banking firms, consumer finance companies, securities brokerage firms, mutual funds and insurance companies and other financial institutions. Many of these institutions have greater available resources than us.
Available Information
We maintain an internet website at www.hancockbank.com. We make available free of charge on the website our annual reports on Form 10-K, quarterly reports on Form 10-Q, current reports on Form 8-K, and amendments to those reports filed with the Securities and Exchange Commission. Our Annual Report to Stockholders is also available on our website. These reports are made available on our website as soon as reasonably practical after the reports are filed with the Commission. Information on our website is not incorporated into this Form 10-K or our other securities filings and is not part of them.
SUPERVISION AND REGULATION
Bank Holding Company Regulation
General
The Company is subject to extensive regulation by the Board of Governors of the Federal Reserve System (the Federal Reserve) pursuant to the Bank Holding Company Act of 1956, as amended (the Bank Holding Company Act). On January 26, 2002 the Company qualified as a financial holding company, giving it broader powers as discussed below. To date, the Company has exercised its powers as a financial holding company to acquire a non-controlling interest in a third party service provider for insurance companies and, in December 2003, acquired Magna Insurance Company. The Company also is required to file certain reports with, and otherwise complies with the rules and regulations of, the Securities and Exchange Commission (the Commission) under federal securities laws.
Federal Regulation
The Bank Holding Company Act generally prohibits a corporation owning a bank from engaging in activities other than banking, managing or controlling banks or other permissible subsidiaries. Acquiring or obtaining control of more than 5% of the voting shares of any company engaged in activities other than those activities determined by the Federal Reserve to be so closely related to banking, managing or controlling banks as to be proper incident thereto is also prohibited. In determining whether a particular activity is permissible, the Federal Reserve considers whether the performance of the activity can reasonably be expected to produce benefits to the public that outweigh possible adverse effects. For example: making, acquiring or servicing loans; leasing personal property; providing certain investment or financial advice; performing certain data processing services; acting as agent or broker in selling credit life insurance, and performing certain insurance underwriting activities have all been determined by regulations of the Federal Reserve to be permissible activities. The Bank Holding Company Act does not place territorial limitations on permissible bank-related activities of bank holding companies. Despite prior approval, however, the Federal Reserve has the power to order a holding company or its subsidiaries to terminate any activity or its control of any subsidiary when it has reasonable cause to believe that continuation of such activity or control of such subsidiary constitutes a serious risk to
the financial safety, soundness or stability of any bank subsidiary of that holding company.
The Bank Holding Company Act requires every bank holding company to obtain the prior approval of the Federal Reserve: (1) before it may acquire ownership or control of any voting shares of any bank if, after such acquisition, such bank holding company will own or control more than 5% of the voting shares of such bank, (2) before it or any of its subsidiaries other than a bank may acquire all of the assets of a bank, (3) before it may merge with any other bank holding company, or (4) before it may engage in permissible non-banking activities. In reviewing a proposed acquisition, the Federal Reserve considers financial, managerial and competitive aspects. The future prospects of the companies and banks concerned and the convenience and needs of the community to be served must also be considered. The Federal Reserve also reviews the indebtedness to be incurred by a bank holding company in connection with the proposed acquisition to ensure that the holding company can service such indebtedness without adversely affecting the capital requirements of the holding company or its subsidiaries. The Bank Holding Company Act further requires that consummation of approved bank holding company or bank acquisitions or mergers must be delayed for a period of not less than 15 or more than 30 days following the date of approval. During such 15 to 30-day period, complaining parties may obtain a review of the Federal Reserve’s order granting its approval by filing a petition in the appropriate United States Court of Appeals petitioning that the order be set aside.
On November 12, 1999, President Clinton signed into law the Gramm-Leach-Bliley Act of 1999 (the “Financial Services Modernization Act”). The Financial Services Modernization Act repeals the two affiliation provisions of the Glass-Steagall Act: Section 20, which restricted the affiliation of Federal Reserve Member Banks with firms “engaged principally” in specified securities activities; and Section 32, which restricts officer, director, or employee interlocks between a member bank and any company or person “primarily engaged” in specified securities activities. In addition, the Financial Services Modernization Act also contains provisions that expressly preempt any state law restricting the establishment of financial affiliations, primarily related to insurance. The general effect of the law is to establish a comprehensive framework to permit affiliations among qualified bank holding companies, commercial banks, insurance companies, securities firms, and other financial service providers by revising and expanding the Bank Holding Company Act framework to permit a holding company system to engage in a full range of financial activities through a new entity known as a Financial Holding Company. “Financial activities” is broadly defined to include not only banking, insurance, and securities activities, but also merchant banking and additional activities that the Federal Reserve, in consultation with the Secretary of the Treasury, determines to be financial in nature, incidental to such financial activities, or complementary activities that do not pose a substantial risk to the safety and soundness of depository institutions or the financial system generally.
Generally, the Financial Services Modernization Act:
o• Repeals historical restrictions on, and eliminates many federal and state law barriers to, affiliations among banks, securities firms, insurance companies, and other financial service providers;
o• Provides a uniform framework for the functional regulation of the activities of banks, savings institutions, and their holding companies;
o• Broadens the activities that may be conducted by national banks, banking subsidiaries of bank holding companies, and their financial subsidiaries;
o• Provides an enhanced framework for protecting the privacy of consumer information;
o• Adopts a number of provisions related to the capitalization, membership, corporate governance, and other measures designed to modernize the Federal Home Loan Bank system;
o• Modifies the laws governing the implementation of the Community Reinvestment Act ("CRA"(“CRA”); and
o• Addresses a variety of other legal and regulatory issues affecting both day-to-day operations and long-term activities of financial institutions.
The Financial Services Modernization Act requires that each bank subsidiary of a financial holding company be well capitalized and well managed as determined by the subsidiary bank’s principal regulator.
To be considered well managed, the bank must have received at least a satisfactory composite rating and a satisfactory management rating at its last examination. To be well capitalized, the bank must have a leverage capital ratio of 5%, a Tier 1 Risk-based capital ratio of 6% and a total risk-based capital ratio of 10%. These ratios are discussed further below. In the event a financial holding company becomes aware that a subsidiary bank ceases to be well capitalized or well managed, it must notify the Federal Reserve and enter into an agreement to cure such condition. The consequences of a failure to cure such condition are that the Federal Reserve Board may order divestiture of the bank. Alternatively, a financial holding company may comply with such order by ceasing to engage in the financial holding company activities that are unrelated to banking or otherwise impermissible for a bank holding company.
The Federal Reserve has adopted capital adequacy guidelines for use in its examination and regulation of bank holding companies and financial holding companies. The regulatory capital of a bank holding company or financial holding company under applicable federal capital adequacy guidelines is particularly important in the Federal Reserve’s evaluation of a holding company and any applications by the bank holding company to the Federal Reserve. If regulatory capital falls below minimum guideline levels, a financial holding company may lose its status as a financial holding company and a bank holding company or bank may be denied approval to acquire or establish additional banks or non-bank businesses or to open additional facilities. In addition, a financial institution’s failure to meet minimum regulatory capital standards can lead to other penalties, including termination of deposit insurance or appointment of a conservator or receiver for the financial institution. There are two measures of regulatory capital presently applicable to bank holding companies,companies: (1) risk-based capital and (2) leverage capital ratios.
The Federal Reserve rates bank holding companies by a component and composite 1-5 rating system. This system is designed to help identify institutions, which require special attention. Financial institutions are assigned ratings based on evaluation and rating of their financial condition and operations. Components reviewed include capital adequacy, asset quality, management capability, the quality and level of earnings, the adequacy of liquidity and sensitivity to interest rate fluctuations.
The leverage ratios adopted by the Federal Reserve require all but the most highly rated bank holding companies to maintain Tier 1 Capital at 4% of total assets. Certain bank holding companies having a composite 1 rating and not experiencing or anticipating significant growth may satisfy the Federal Reserve guidelines by maintaining Tier 1 Capital of at least 3% of total assets. Tier 1 Capital for bank holding companies includes: stockholders’ equity, minority interest in equity accounts of consolidated subsidiaries and qualifying perpetual preferred stock. In addition, Tier 1 Capital excludes goodwill and other disallowed intangibles. The Company’s leverage capital ratio at December 31, 20062008 was 8.63%8.06% and 7.85%8.51% at December 31, 2005.2007.
The risk-based capital guidelines are designed to make regulatory capital requirements more sensitive to differences in risk profiles among banks and bank holding companies, to account for off-balance sheet exposure and to minimize disincentives for holding liquid assets. Under the risk-based capital guidelines, assets are assigned to one of four risk categories: 0%, 20%, 50% and 100%. As an example, U.S. Treasury securities are assigned to the 0% risk category while most categories of loans are assigned to the 100% risk category. A two-step process determines the risk weight of off-balance sheet items such as standby letters of credit. First, the amount of the off-balance sheet item is multiplied by a credit conversion factor of either 0%, 20%, 50% or 100%. The result is then assigned to one of the four risk categories. At December 31, 2006,2008, the Company’s off-balance sheet items aggregated $1.0 billion;$998.4 million; however, after the credit conversion these items represented $226.8$292.3 million of balance sheet equivalents.
The primary component of risk-based capital is Tier 1 Capital, which for the Company is essentially equal to common stockholders’ equity, less goodwill and other intangibles. Tier 2 Capital, which consists primarily of the excess of any perpetual preferred stock, mandatory convertible securities, subordinated debt and general allowances for loan losses, is a secondary component of risk-based capital. The risk-weighted asset base is equal to the sum of the aggregate dollar values of assets and off-balance sheet items in each risk category, multiplied by the weight assigned to that category. A ratio of Tier 1 Capital to risk-weighted assets of at least 4% and a ratio of Total Capital (Tier 1 and Tier 2) to risk-weighted assets of at least 8% must be maintained by bank holding companies. At December 31, 2006,2008, the Company’s Tier 1 and Total Capital ratios were 12.46%10.09% and 13.60%11.22%, respectively. At December 31, 2005,2007, the Company’s Tier 1 and Total Capital ratios were 11.47%11.03% and 12.73%12.07%, respectively.
The prior approval of the Federal Reserve must be obtained before the Company may acquire substantially all the assets of any bank, or ownership or control of any voting shares of any bank, if, after such acquisition, it would own or control, directly or indirectly, more than 5% of the voting shares of such bank. In no case, however, may the Federal Reserve approve an acquisition of any bank located outside Mississippi unless such acquisition is specifically authorized by the laws of the state in which the bank to be acquired is located. The banking laws of Mississippi presently permit out-of-state banking organizations to acquire Mississippi banking organizations, provided the out-of-stateMississippi banking organization’s home state grants similar privileges to banking organizations in Mississippi.organization has been operating for at least five years. In addition, Mississippi banking organizations were granted similar powers to acquire certain out-of-state financial institutions pursuant to the Interstate Bank Branching Act, which was adopted in 1996.1994.
With the passage of The Interstate Banking and Branching Efficiency Act of 1994, adequately capitalized and managed bank holding companies are permitted to acquire control of banks in any state, subject to federal regulatory approval, without regard to whether such a transaction is prohibited by the laws of any state. Beginning June 1, 1997, federal banking regulators may approve merger transactions involving banks located in different states, without regard to laws of any state prohibiting such transactions; except that, mergers may not be approved with respect to banks located in states that, before June 1, 1997, enacted legislation prohibiting mergers by banks located in such state with out-of-state institutions. Federal banking regulators may permit an out-of-state bank to open new branches in another state if such state has enacted legislation permitting interstate branching. The legislation further provides that a bank holding company may not, following an interstate acquisition, control more than 10% of nationwide insured deposits or 30% of deposits in the relevant state. States have the right to adopt legislation to lower the 30% limit. Additional provisions require that interstate activities conform to the Community Reinvestment Act.
The Company is required to give the Federal Reserve prior written notice of any purchase or redemption of its outstanding equity securities if the gross consideration for the purchase or redemption, when combined with the net consideration paid for all such purchases or redemptions during the preceding 12 months, is equal to 10% or more of the Company’s consolidated net worth. The Federal Reserve may disapprove such a transaction if it determines that the proposal constitutes an unsafe or unsound practice, would violate any law, regulation, Federal Reserve order or directive or any condition imposed by, or written agreement with, the Federal Reserve.
In November 1985, the Federal Reserve adopted its Policy Statement on Cash Dividends Not Fully Covered by Earnings (the Policy Statement). The Policy Statement sets forth various guidelines that the Federal Reserve believes that a bank holding company should follow in establishing its dividend policy. In general, the Federal Reserve stated that bank holding companies should pay dividends only out of current earnings. It also stated that dividends should not be paid unless the prospective rate of earnings retention by the holding company appears consistent with its capital needs, asset quality and overall financial condition.
The Company is a legal entity separate and distinct from the Banks. There are various restrictions that limit the ability of the Banks to finance, pay dividends or otherwise supply funds to the Company or other affiliates. In addition, subsidiary banks of holding companies are subject to certain restrictions on any extension of credit to the bank holding company or any of its subsidiaries, on investments in the stock or other securities thereof and on the taking of such stock or securities as collateral for loans to any borrower. Further, a bank holding company and its subsidiaries are prohibited from engaging in certain tie-in arrangements in connection with extensions of credit, or leases or sales of property or furnishing of services.
Bank Regulation
The operations of the Banks are subject to state and federal statutes applicable to state banks and the regulations of the Federal Reserve and the FDIC,FDIC. The operation of the Banks may also be subject to applicable OCC regulation, to the extent states banks are granted parity with national banks. Such statutes and regulations relate to, among other things, required reserves, investments, loans, mergers and consolidations, issuance of securities, payment of dividends, establishment of branches and other aspects of the Banks’ operations.
Hancock Bank MS is subject to regulation and periodic examinations by the FDIC and the State of Mississippi Department of Banking and Consumer Finance. Hancock Bank LA is subject to regulation and periodic examinations by the FDIC and the Office of Financial Institutions, State of Louisiana. Hancock Bank FL is subject to regulation and periodic examinations by the FDIC and the Florida Department of Financial Services.
Hancock Bank AL is subject to regulation and periodic examinations by the FDIC and the Alabama State Banking Department. These regulatory authorities examine such areas as reserves, loan and investment quality, management policies, procedures and practices and other aspects of operations. These examinations are designed for the protection of the Banks’ depositors, rather than their stockholders. In addition to these regular examinations, the Company and the Banks must furnish periodic reports to their respective regulatory authorities containing a full and accurate statement of their affairs.
As a result of the enactment of the Financial Institutions Reform, Recovery, and Enforcement Act of 1989 (FIRREA), a financial institution insured by the FDIC can be held liable for any losses incurred by, or reasonably expected to be incurred by, the FDIC in connection with (1) the default of a commonly controlled FDIC-insured financial institution or (2) any assistance provided by the FDIC to a commonly controlled financial institution in danger of default.
The Banks are members of the FDIC, and their deposits are insured as provided by law by the BankDeposit Insurance Fund (BIF)(DIF). On December 19, 1991, the Federal Deposit Insurance Corporation Improvement Act of 1991 (FDICIA) was enacted. The Federal Deposit Insurance Act, as amended by Section 302 of FDICIA, calls for risk-related deposit insurance assessment rates. The risk classification of an institution will determine its deposit insurance premium. Assignment to oneThe Federal Deposit Insurance Reform act of three capital groups, coupled with assignment to one of three supervisory sub-groups, determines which of2005 created a new risk differentiation system and established a new base assessment rate schedule, effective January 1, 2007. The final rule consolidates the existing nine risk classifications is appropriate for an institution.
Effective incategories into four and names them Risk Categories I, II, III, and IV. Risk Category I replaces the first quarter of 1996, the FDIC lowered banks’ deposit insurance premiums1A risk category. The annual rates (in basis points) are now from 45 cents to 31 cents per hundred dollars in insured deposits to a rate of 0 to 27 cents. The Banks have received a risk classification of 1A for assessment purposes. In 1997 an assessment for the Financing Corporation’s debt service was added to the FDIC quarterly premium payment. That assessment averaged 1.343 cents per hundred dollars of insured deposits, during 2006 and 1.2 (annualized)with category I rates having a range of 5 cents to 7 cents per hundred dollars of insured deposits. In 2007, the Banks received a risk classification of I for the first quarter of 2007.assessment purposes. Total FICO assessments paid to the FDIC amounted to $614.6 thousand$0.6 million in 2006.2008 and $0.6 million in 2007.
Under the provisions of the Federal Deposit Insurance Reform Act of 2005, weHancock Bank MS and Hancock Bank LA received a one-time FDIC assessment credit of $3.2$1.9 million and $1.3 million, respectively, to be used against future deposit insurance assessments. Thisassessments beginning January 1, 2007. $1.8 million of this credit is not reflectedoffset the entire FDIC assessment for 2007 and the remaining $1.4 million offset the 2008 assessment. FDIC insurance expense totaled $1.2 million in 2008.
In October 2008, in an effort to restore capitalization levels and to ensure the DIF will adequately cover projected losses from future bank failures, the FDIC proposed a rule to alter the way in which it differentiates for risk in the accompanying consolidated financial statements. It will be recognized as an offset in future years againstrisk-based assessment system and to revise deposit insurance assessment rates, including base assessment rates. For Risk Category 1 institutions that have long-term debt issuer ratings, the FDIC assessments.proposes (i) to determine the initial base assessment rate using a combination of weighted-average CAMELS component ratings, long-term debt issuer ratings (converted to numbers and averaged) and the financial ratios method assessment rate (as defined), each equally weighted and (ii) to revise the uniform amount and the pricing multipliers. The FDIC also proposes to introduce three adjustments that could be made to an institution’s initial base assessment rate, including (i) a potential decrease of up to 2 basis points for long-term unsecured debt, including senior and subordinated debt, (ii) a potential increase for secured liabilities in excess of 15% of domestic deposits and (iii) for non-Risk Category 1 institutions, a potential increase for brokered deposits in excess of 10% of domestic deposits. In addition, the FDIC proposed raising the current rates uniformly by 7 basis points for the assessment for the first quarter of 2009 resulting in annualized assessment rates for Risk Category 1 institutions ranging from 12 to 14 basis points. The proposal for first quarter 2009 assessment rates was adopted as a final rule in December 2008. The FDIC also proposed, effective April 1, 2009, initial base assessment rates for Risk Category 1 institutions of 10 to 14 basis points. After the effect of potential baserate adjustments, the annualized assessment rate for Risk Category 1 institutions would range from 8 to 21 basis points. A final rule related to this proposal is expected to be issued during the first quarter of 2009. The Company cannot provide any assurance as to the amount of any proposed increase in its deposit insurance premium rate, should such an increase occur, as such changes are dependent upon a variety of factors, some of which are beyond the Company’s control.
In general, FDICIA subjects banks and bank holding companies to significantly increased regulation and supervision. FDICIA increased the borrowing authority of the FDIC in order to recapitalize the BIF,DIF, and the future borrowings are to be repaid by increased assessments on FDIC member banks. Other significant provisions of FDICIA require a new regulatory emphasis linking supervision to bank capital levels.
Also, federal banking regulators are required to take prompt regulatory action with respect to depository institutions that fall below specified capital levels and to draft non-capital regulatory measures to assure bank safety.
FDICIA contains a “prompt corrective action” section intended to resolve problem institutions at the least possible long-term cost to the deposit insurance funds. Pursuant to this section, the federal banking agencies are required to prescribe a leverage limit and a risk-based capital requirement indicating levels at which institutions will be deemed to be “well capitalized,” “adequately capitalized,” “undercapitalized,” “significantly undercapitalized” and “critically undercapitalized.” In the case of a depository institution that is “critically undercapitalized” (a term defined to include institutions which still have positive net worth); the federal banking regulators are generally required to appoint a conservator or receiver.
FDICIA further requires regulators to perform annual on-site bank examinations, places limits on real estate lending and tightens audit requirements. The new legislation eliminated the “too big to fail” doctrine, which protects uninsured deposits of large banks, and restricts the ability of undercapitalized banks to obtain extended loans from the Federal Reserve Board discount window. FDICIA also imposes new disclosure requirements relating to fees charged and interest paid on checking and deposit accounts. Most of the significant changes brought about by FDICIA required new regulations.
In addition to regulating capital, the FDIC has broad authority to prevent the development or continuance of unsafe or unsound banking practices. Pursuant to this authority, the FDIC has adopted regulations that restrict preferential loans and loan amounts to “affiliates” and “insiders” of banks, require banks to keep information on loans to major stockholders and executive officers and bar certain director and officer interlocks between financial institutions. The FDIC is also authorized to approve mergers, consolidations and assumption of deposit liability transactions between insured banks and between insured banks and uninsured banks or institutions to prevent capital or surplus diminution in such transactions where the resulting, continuing or assumed bank is an insured nonmember state bank, like Hancock Bank MS(MS,) Hancock Bank of LA, Hancock Bank of FL and Hancock Bank LA.of AL.
Although Hancock Bank MS,(MS,) Hancock Bank of LA, Hancock Bank of FL and Hancock Bank FLof AL are not members of the Federal Reserve System, they are subject to Federal Reserve regulations that require the Banks to maintain reserves against transaction accounts (primarily checking accounts). Because reserves generally must be maintained in cash or in noninterest-bearing accounts, the effect of the reserve requirements is to increase the cost of funds for the Banks. The Federal Reserve regulations currently require that reserves be maintained against net transaction accounts in the amount of 3% of the aggregate of such accounts up to $40.5$34.1 million, or, if the aggregate of such accounts exceeds $40.5$34.1 million, $1.215$1.023 million plus 10% of the total in excess of $40.5$34.1 million. This regulation is subject to an exemption from reserve requirements on a limited amount of an institution’s transaction accounts.
The Financial Services Modernization Act also permits national banks, and through state parity statutes, state banks, to engage in expanded activities through the formation of financial subsidiaries. A state bank may have a subsidiary engaged in any activity authorized for state banks directly or any financial activity, except for insurance underwriting, insurance investments, real estate investment or development, or merchant banking, which may only be conducted through a subsidiary of a Financial Holding Company. Financial activities include all activities permitted under new sections of the Bank Holding Company Act or permitted by regulation.
A state bank seeking to have a financial subsidiary, and each of its depository institution affiliates, must be “well-capitalized” and “well-managed.” The total assets of all financial subsidiaries may not exceed the lesser of 45% of a bank’s total assets, or $50 billion. A state bank must exclude from its assets and equity all equity investments, including retained earnings, in a financial subsidiary. The assets of the subsidiary may not be consolidated with the bank’s assets. The bank must also have policies and procedures to assess financial subsidiary risk and protect the bank from such risks and potential liabilities.
The Financial Services Modernization Act also includes a new section of the Federal Deposit Insurance Act governing subsidiaries of state banks that engage in “activities as principal that would only be permissible” for a national bank to conduct in a financial subsidiary. It expressly preserves the ability of a state bank to retain all existing subsidiaries. Because Mississippi permits commercial banks chartered by the state to engage in any activity permissible for national banks, the Bank will be permitted to form subsidiaries to engage in the
activities authorized by the Financial Services Modernization Act. In order to form a financial subsidiary, a state bank must be well-capitalized, and the state bank would be subject to the same capital deduction, risk management and affiliate transaction rules as applicable to national banks.
In 2001, the Uniting and Strengthening America by Providing Appropriate Tools Required to Intercept and Obstruct Terrorism Act of 2001 (USA Patriot Act) was signed into law. The USA Patriot Act broadened the application of anti-money laundering regulations to apply to additional types of financial institutions, such as broker-dealers, and strengthened the ability of the U.S. Government to detect and prosecute international money laundering and the financing of terrorism. The principal provisions of Title III of the USA Patriot Act require that regulated financial institutions, including state member banks: (i) establish an anti-money laundering program that includes training and audit components; (ii) comply with regulations regarding the verification of the identity of any person seeking to open an account; (iii) take additional required precautions with non-U.S. owned accounts; and (iv) perform certain verification and certification of money laundering risk for their foreign correspondent banking relationships. The USA Patriot Act also expanded the conditions under which funds in a U.S. interbank account may be subject to forfeiture and increased the penalties for violation of anti-money laundering regulations. Failure of a financial institution to comply with the USA Patriot Act’s requirements could have serious legal and reputational consequences for the institution. The Bank has adopted policies, procedures and controls to address compliance with the requirements of the USA Patriot Act under the existing regulations and will continue to revise and update its policies, procedures and controls to reflect changes required by the USA Patriot Act and implementing regulations.
In July 2002, Congress enacted the Sarbanes-Oxley Act of 2002, which addresses, among other issues, corporate governance, auditing and accounting, executive compensation, and enhanced and timely disclosure of corporate information. Section 404 of the Sarbanes-Oxley Act requires the Company to include in its Annual Report, a report stating management’s responsibility to establish and maintain adequate internal control over financial reporting and management’s conclusion on the effectiveness of the internal controls at year end. Additionally, the Company’s independent registered public accounting firm is required to attest to and report on management’s evaluation of internal control over financial reporting.
In October 2008, the Emergency Economic Stabilization Act of 2008 (“EESA”) was enacted. For more information on EESA, see below under Recent Developments.
Summary
The foregoing is a brief summary of certain statutes, rules and regulations affecting the Company and the Banks. It is not intended to be an exhaustive discussion of all the statutes and regulations having an impact on the operations of such entities.
We do not believe that the Financial Services Modernization Act will have a material adverse effect on our operations in the near-term. However, to the extent that it permits holding companies, banks, securities firms, and insurance companies to affiliate, the financial services industry may experience further consolidation. The Financial Services Modernization Act is intended to grant to community banks certain powers as a matter of right that larger institutions have accumulated on an ad hoc basis. Nevertheless, this act may have the result of increasing the amount of competition that the Company and the Banks face from larger institutions and other types of companies offering financial products, some of which may have substantially more financial resources than us.
It is not known whether EESA will have any effect on the Company’s operations.
Finally, additional bills may be introduced in the future in the United States Congress and state legislatures to alter the structure, regulation and competitive relationships of financial institutions. It cannot be predicted whether and what form any of these proposals will be adopted or the extent to which the business of the Company and the Banks may be affected thereby.
Recent Developments
The Congress, Treasury Department and the federal banking regulators, including the FDIC, have taken broad action since early September, 2008 to address volatility in the U.S. banking system.
In October 2008, the Emergency Economic Stabilization Act of 2008 (“EESA”) was enacted. The EESA authorizes the Treasury Department to purchase from financial institutions and their holding companies up to $700 billion in mortgage loans, mortgage-related securities and certain other financial instruments, including debt and equity securities issued by financial institutions and their holding companies in a troubled asset relief program (“TARP”). The purpose of TARP is to restore confidence and stability to the U.S. banking system and to encourage financial institutions to increase their lending to customers and to each other. The Treasury Department has allocated $250 billion towards the TARP Capital Purchase Program (“CPP”). Under the CPP, Treasury will purchase debt or equity securities from participating institutions. The TARP also will include direct purchases or guarantees of troubled assets of financial institutions. Participants in the CPP are subject to executive compensation limits and are encouraged to expand their lending and mortgage loan modifications. On November 13, 2008, following a thorough evaluation and analysis, the Company announced it would decline the Treasury’s invitation to participate in the CPP.
EESA also increased FDIC deposit insurance on most accounts from $100,000 to $250,000. This increase is in place until the end of 2009 and is not covered by deposit insurance premiums paid by the banking industry.
Following a systemic risk determination, the FDIC established a Temporary Liquidity Guarantee Program (“TLGP”) on October 14, 2008. The TLGP includes the Transaction Account Guarantee Program (“TAGP”), which provides unlimited deposit insurance coverage through December 31, 2009 for noninterest-bearing transaction accounts (typically checking accounts) and certain funds swept into noninterest-bearing savings accounts. Institutions participating in the TAGP pay a 10 basis points fee (annualized) on the balance of each covered account in excess of $250,000, while the extra deposit insurance is in place. The TLGP also includes the Debt Guarantee Program (“DGP”), under which the FDIC guarantees certain senior unsecured debt of FDIC-insured institutions and their holding companies. The unsecured debt must be issued on or after October 14, 2008 and not later than June 30, 2009, and the guarantee is effective through the earlier of the maturity date or June 30, 2012. The DGP coverage limit is generally 125% of the eligible entity’s eligible debt outstanding on September 30, 2008 and scheduled to mature on or before June 30, 2009 or, for certain insured institutions, 2% of their liabilities as of September 30, 2008. Depending on the term of the debt maturity, the nonrefundable DGP fee ranges from 50 to 100 basis points (annualized) for covered debt outstanding until the earlier of maturity or June 30, 2012. The TAGP and DGP are in effect for all eligible entities, unless the entity opted out on or before December 5, 2008. The Company will participate in the TAGP but has opted out of the DGP.
It is not clear at this time what impact the EESA, the TARP Capital Purchase Program, the Temporary Liquidity Guarantee Program, other liquidity and funding initiatives of the Federal Reserve and other agencies that have been previously announced, and any additional programs that may be initiated in the future, will have on the Company or the U.S. and global financial markets.
Effect of Governmental Policies
The difference between the interest rate paid on deposits and other borrowings and the interest rate received on loans and securities comprise most of a bank’s earnings. In order to mitigate the interest rate risk inherent in the industry, the banking business is becoming increasingly dependent on the generation of fee and service charge revenue.
The earnings and growth of a bank will be affected by both general economic conditions and the monetary and fiscal policy of the United States Government and its agencies, particularly the Federal Reserve. The Federal Reserve sets national monetary policy such as seeking to curb inflation and combat recession. This is accomplished by its open-market operations in United States government securities, adjustments in the amount of reserves that financial institutions are required to maintain and adjustments to the discount rates on borrowings and target rates for federal funds transactions. The actions of the Federal Reserve in these areas influence the growth of bank loans, investments and deposits and also affect interest rates on loans and deposits. The nature and timing of any future changes in monetary policies and their potential impact on the Company cannot be predicted.
Impact of Inflation
Our non-interestnoninterest income and expenses can be affected by increasing rates of inflation; however, unlike most industrial companies, the assets and liabilities of financial institutions such as the Banks are primarily monetary in nature. Interest rates, therefore, have a more significant impact on the Banks’ performance than the effect of general levels of inflation on the price of goods and services.
RISK FACTORS |
Making or continuing an investment in securities issued by us, including our common stock, involves certain risks that you should carefully consider. The risks and uncertainties described below are not the only risks that may have a material adverse effect on us. Additional risks and uncertainties also could adversely affect our business and results of operations. If any of the following risks actually occur, our business, financial condition or results of operations could be negatively affected, the market price for your securities could decline, and you could lose all or a part of your investment. Further, to the extent that any of the information contained in this Annual Report on Form 10-K constitutes forward-looking statements, the risk factors set forth below also are cautionary statements identifying important factors that could cause our actual results to differ materially from those expressed in any forward-looking statements made by or on behalf of us.
We may be vulnerable to certain sectors of the economy.economy.
A portion of our loan portfolio is secured by real estate. If the economy deteriorated and depressed real estate values beyond a certain point, that collateral value of the portfolio and the revenue stream from those loans could come under stress and possibly require additional provision to the allowance for loan losses. Our ability to dispose of foreclosed real estate at prices above the respective carrying values could also be impinged, causing additional losses.
General economicDifficult market conditions have adversely affected the industry in which we operate.
The capital and credit markets have been experiencing volatility and disruption for more than twelve months. In recent months, the volatility and disruption has reached unprecedented levels. Dramatic declines in the housing market over the past year, with falling home prices and increasing foreclosures, unemployment and under-employment, have negatively impacted the credit performance of mortgage loans and resulted in significant write-downs of asset values by financial institutions, including government-sponsored entities as well as major commercial and investment banks. These write-downs have caused many financial institutions to seek additional capital, to merge with larger and stronger institutions and, in some cases, to fail. Reflecting concern about the stability of the financial markets generally and the strength of counterparties, many lenders and institutional investors have reduced or ceased providing funding to borrowers, including to other financial institutions. This market turmoil and tightening of credit have led to an increased level of commercial and consumer delinquencies, lack of consumer confidence, increased market volatility and widespread reduction of business activity generally. We do not expect that the difficult conditions in the areas where our operationsfinancial markets are likely to improve in the near future. A worsening of these conditions would likely exacerbate the adverse effects of these difficult market conditions on us and others in the financial institution industry. In particular, we may face the following risks in connection with these events:
• | We may expect to face increased regulation of our industry, including as a result of the Emergency Economic Stabilization Act of 2008 (EESA). Compliance with such regulation may increase our costs and limit our ability to pursue business opportunities. | |
• | Market developments and the resulting economic pressure on consumers may affect consumer confidence levels and may cause increases in delinquencies and default rates, which, among other effects, could affect our charge-offs and provision for loan losses. |
• | Competition in the industry could intensify as a result of the increasing consolidation of financial services companies in connection with current market conditions. | |
• | The current market disruptions make valuation even more difficult and subjective, and our ability to measure the fair value of our assets could be adversely affected. If we determine that a significant portion of our assets have values that are significantly below their recorded carrying value, we could recognize a material charge to earnings in the quarter during which such determination was made, our capital ratios would be adversely affected and a rating agency might downgrade our credit rating or put us on credit watch. |
There can be no assurance that the Emergency Economic Stabilization Act of 2008 will help stabilize the U.S. Financial System.
On Oct. 3, 2008, President Bush signed into law the Emergency Economic Stabilization Act of 2008 (EESA) in response to the current crisis in the financial sector. The U.S. Department of the Treasury and banking regulators are implementing a number of programs under this legislation to address capital and liquidity issues in the banking system. There can be no assurance, however, as to the actual impact that the EESA will have on the financial markets, including the extreme levels of volatility and limited credit availability currently being experienced. The failure of the EESA to help stabilize the financial markets and a continuation or loans are concentrated mayworsening of current financial market conditions could materially and adversely affect our customers' abilitybusiness, financial condition, results of operations, access to meet their obligations.
A suddencredit or severe downturn in the economy in the geographic markets served by us in the states of Mississippi, Louisiana, Alabama, and Florida may affect the abilitytrading price of our customers to meet loan payment obligations on a timely basis. The local economic conditions in these areas have a significant impact on our commercial, real estate, and construction loans, the ability of borrowers to repay these loans and the value of the collateral securing such loans. Changes resulting in adverse economic conditions of our market areas could negatively impact the financial results of our banking operations and our profitability. Additionally, adverse economic changes may cause customers to withdraw deposit balances, thereby causing a strain on our liquidity.common stock.
We are subject to a risk of rapid and significant changes in market interest rates.
Our assets and liabilities are primarily monetary in nature, and as a result, we are subject to significant risks tied to changes in interest rates. Our ability to operate profitably is largely dependent upon net interest income. In 2008, net interest income made up 64% of our revenue. Unexpected movement in interest rates markedly changing the slope of the current yield curve could cause our net interest margins to decrease, subsequently decreasing net interest income. In addition, such changes could adversely affect the valuation of our assets and liabilities.
At present our one-year interest rate sensitivity position is moderately asset sensitive, such that a gradual increase in interest rates during the next twelve months should not have a significant impact on net interest income during that period. However, as with most financial institutions, our results of operations are affected by changes in interest rates and our ability to manage this risk. The difference between interest rates charged on interest-earning assets and interest rates paid on interest-bearing liabilities may be affected by changes in market interest rates, changes in relationships between interest rate indices, and/or changes in the relationships between long-term and short-term market interest rates. A change in this difference might result in an increase in interest expense relative to interest income, or a decrease in our interest rate spread.
Certain changes in interest rates, inflation, deflation, or the financial markets could affect demand for our products and our ability to deliver products efficiently.
Loan originations, and potentially loan revenues, could be adversely impacted by sharply rising interest rates. Conversely, sharply falling rates could increase prepayments within our securities portfolio lowering interest earnings from those investments. An underperforming stock market could reduce brokerage transactions, therefore reducing investment brokerage revenues; in addition, wealth management fees associated with managed securities portfolios could also be adversely affected. An unanticipated increase in inflation could cause our operating costs related to salaries & benefits, technology, and supplies to increase at a faster pace than revenues.
The fair market value of our securities portfolio and the investment income from these securities also fluctuate depending on general economic and market conditions. In addition, actual net investment income and/or cash flows from investments that carry prepayment risk, such as mortgage-backed and other asset-backed securities, may differ from those anticipated at the time of investment as a result of interest rate fluctuations.
Changes in the policies of monetary authorities and other government action could adversely affect our profitability.
The results of operations are affected by credit policies of monetary authorities, particularly the Federal Reserve Board. The instruments of monetary policy employed by the Federal Reserve Board include open market operations in U.S. government securities, changes in the discount rate or the federal funds rate on bank borrowings and changes in reserve requirements against bank deposits. In view of changing conditions in the national economy and in the money markets, particularly in light of the continuing threat of terrorist attacks and the current military operations in the Middle East, we cannot predict possible future changes in interest rates, deposit levels, loan demand or our business and earnings. Furthermore, the actions of the United States government and other governments in responding to such terrorist attacks or the military operations in the Middle East may result in currency fluctuations, exchange controls, market disruption and other adverse effects.
Natural disasters could affect our ability to operate.
Our market areas are susceptible to hurricanes. Natural disasters, such as hurricanes, can disrupt our operations, result in damage to properties and negatively affect the local economies in which we operate.
We cannot predict whether or to what extent damage caused by future hurricanes will affect our operations or the economies in our market areas, but such weather events could cause a decline in loan originations, a decline in the value or destruction of properties securing the loans and an increase in the risk of delinquencies, foreclosures or loan losses.
As a resultInsurance.
With the less severe hurricane seasons in 2007 and 2008, Hancock Bank has been able to place its property insurance at limits sufficient to protect it from its maximum probable loss and secure more favorable terms and conditions. Due to Hancock Bank’s favorable financial performance, the cost of Hurricane Katrinathe Financial Institution Insurance program has continued to be written with favorable terms and other storms, windstorm insurance costs have increased duringconditions. The long term relationship Hancock Bank has with Chubb Insurance Company provides stability and security and should serve the past year regionally, and have also increased for all of our properties. Currently, we have total windstorm coverage on our Mississippi branches with property values of $30.4 million subject to a 2% deductible per location. We also have separate flood coverage onbank well over the branches that flooded during Hurricane Katrina. Our corporate headquarters located in downtown Gulfport, MS has a $15 million deductible and the branches have a $100,000 deductible per occurrence for fire and lightning losses. We also maintain business interruption insurance. We rely on our own liquidity during the hurricane season to cover two to three months of overhead costs, and we maintain additional capital to satisfy any emergency repairs before insurance recoveries are received. The future availability and costs of windstorm and flood insurance are unknown, but this factor may result in additional insurance costs to us.coming years.
Greater loan losses than expected may adversely affect our earnings.
We, as lenderlenders, are exposed to the risk that our customers will be unable to repay their loans in accordance with their terms and that any collateral securing the payment of their loans may not be sufficient to assure repayment. Credit losses are inherent in the business of making loans and could have a material adverse effect on our operating results. Our credit risk with respect to our real estate and construction loan portfolio will relate principally to the creditworthiness of corporations and the value of the real estate serving as security for the repayment of loans. Our credit risk with respect to our commercial and consumer loan portfolio will relate principally to the general creditworthiness of businesses and individuals within our local markets.
We make various assumptions and judgments about the collectibility of our loan portfolio and provide an allowance for estimated loan losses based on a number of factors. We believe that our current allowance for loan losses is adequate. However, if our assumptions or judgments prove to be incorrect, the allowance for loan losses may not be sufficient to cover actual loan losses. We may have to increase our allowance in the future in response to the request of one of our primary banking regulators, to adjust for changing conditions and assumptions, or as a result of any deterioration in the quality of our loan portfolio. The actual amount of future provisions for loan losses cannot be determined at this time and may vary from the amounts of past provisions.
The projected benefit obligations of our pension plan exceed the fair market value of the Plan'sPlan’s assets.
Investments in the portfolio of our pension plan may not provide adequate returns to fully fund benefits as they come due, thus causing higher annual plan expenses and requiring additional contributions by us.
We may need to rely on the financial markets to provide needed capital.
Our stock is listed and traded on the NASDAQ Global Select. Although we anticipate that our capital resources will be adequate for the foreseeable future to meet our capital requirements, at times we may depend on the liquidity of the NASDAQ market to raise equity capital. If the market should fail to operate, or if conditions in the capital markets are adverse, we may be constrained in raising capital. We maintain a consistent analyst following; therefore, downgrades in our prospects by an analyst(s) may cause our stock price to fall and significantly limit our ability to access the markets for additional capital requirements. Should these risks materialize, our ability to further expand our operations through internal growth may be limited.
We are subject to regulation by various Federal and State entities.
We are subject to the regulations of the Securities and Exchange Commission (“SEC”), the Federal Reserve Board, the Federal Deposit Insurance Corporation, the Mississippi Department of Banking and Consumer Finance, the Louisiana Office of Financial Institutions, the Florida Office of Financial Regulation, the Alabama Banking Department and the Mississippi Department of Insurance. New regulations issued by these agencies may adversely affect our ability to carry on our business activities. We are subject to various Federal and State laws and certain changes in these laws and regulations may adversely affect our operations. Non complianceNoncompliance with certain of these regulations may impact our business plans, including ability to branch, offer certain products, or execute existing or planned business strategies.
We are also subject to the accounting rules and regulations of the SEC and the Financial Accounting Standards Board. Changes in accounting rules could adversely affect the reported financial statements or our results of operations and may also require extraordinary efforts or additional costs to implement.
Any of these laws or regulations may be modified or changed from time to time, and we cannot be assured that such modifications or changes will not adversely affect us.
We engage in acquisitions of other businesses from time to time.
On occasion, we will engage in acquisitions of other businesses. Inability to successfully integrate acquired businesses can pose varied risks to us, including customer and employee turnover, thus increasing the cost of operating the new businesses. The acquired companies may also have legal contingencies, beyond those that we are aware of, that could result in unexpected costs. Moreover, there can be no assurance that acquired businesses will achieve prior or planned results of operations.
We are subject to industry competition which may have an impact upon our success.
Our profitability depends on our ability to compete successfully. We operate in a highly competitive financial services environment. Certain competitors are larger and may have more resources than we do. We face competition in our regional market areas from other commercial banks, savings and loan associations, credit unions, internet banks, finance companies, mutual funds, insurance companies, brokerage and investment banking firms, and other financial intermediaries that offer similar services. Some of our nonbank competitors are not subject to the same extensive regulations that govern us or the Bank and may have greater flexibility in competing for business.
Another competitive factor is that the financial services market, including banking services, is undergoing rapid changes with frequent introductions of new technology-driven products and services. Our future success may depend, in part, on itsour ability to use technology competitively to provide products and services that provide convenience to customers and create additional efficiencies in our operations.
Future issuances of additional securities could result in dilution of shareholders'shareholders’ ownership.
We may determine from time to time to issue additional securities to raise additional capital, support growth, or to make acquisitions. Further, we may issue stock options or other stock grants to retain and motivate our employees. Such issuances of our securities will dilute the ownership interests of our shareholders.
Anti-takeover laws and certain agreements and charter provisions may adversely affect share value.
Certain provisions of state and federal law and our articles of incorporation may make it more difficult for someone to acquire control of us. Under federal law, subject to certain exemptions, a person, entity, or group must notify the federal banking agencies before acquiring 10% or more of the outstanding voting stock of a bank holding company, including our shares. Banking agencies review the acquisition to determine if it will result in a change of control. The banking agencies have 60 days to act on the notice, and take into account several factors, including the resources of the acquirer and the antitrust effects of the acquisition. There also are Mississippi statutory provisions and provisions in our articles of incorporation that may be used to delay or block a takeover attempt. As a result, these statutory provisions and provisions in our articles of incorporation could result in our being less attractive to a potential acquirer.
Securities issued by us, including our common stock, are not FDIC insured.
Securities issued by us, including our common stock, are not savings or deposit accounts or other obligations of any bank and are not insured by the FDIC, the Bank Insurance Fund, or any other governmental agency or instrumentality, or any private insurer, and are subject to investment risk, including the possible loss of principal.
UNRESOLVED STAFF COMMENTS |
None None.
PROPERTIES |
Our main office is located at One Hancock Plaza, in Gulfport, Mississippi.
We operate 149157 banking and financial services offices and 131137 automated teller machines across south Mississippi, Louisiana, south Alabama and the Florida Panhandle. We lease 6968 of the 149157 locations with the remainder being owned.
In addition, to the above, Hancock Bank MS owns land and other properties acquired through foreclosures of loan collateral. The major item is approximately 3,700 acres of timberlandtimber land in Hancock County, Mississippi, which Hancock Bank MS acquired by foreclosure in the 1930's.1930’s.
LEGAL PROCEEDINGS |
We are party to various legal proceedings arising in the ordinary course of business. In the opinion of management, after consultation with legal counsel, all such matters areeach matter is adequately covered by insurance or, if not so covered, areis not expected to have a material adverse effect on our financial statements.
SUBMISSION OF MATTERS TO A VOTE OF SECURITY HOLDERS |
There were no matters submitted to a vote of security holders during the quarter ended December 31, 2006.2008.
ITEM 5. MARKET FOR THE REGISTRANT'SREGISTRANT’S COMMON EQUITY, RELATED STOCKHOLDER MATTERS AND ISSUER PURCHASES OF EQUITY SECURITIES
Market Information
Our common stock trades on the NASDAQ Stock Market under the symbol “HBHC” and is quoted in publications under “HancHd.” The following table sets forth the high and low sale prices of our common stock as reported on the NASDAQ Stock Market. These prices do not reflect retail mark-ups, mark-downs or commissions.
Cash High Low Dividends Sale Sale Paid ------------ ------------ --------------20064th quarter $56.00 $50.85 $0.240 3rd quarter 56.79 49.71 0.240 2nd quarter 57.19 44.02 0.220 1st quarter 46.67 37.75 0.19520054th quarter $39.90 $31.08 $0.195 3rd quarter 37.84 29.93 0.195 2nd quarter 34.87 28.25 0.165 1st quarter 34.20 30.25 0.165
|
|
|
|
|
|
|
|
|
|
|
|
|
|
| High |
| Low |
| Cash |
| |||
|
|
|
|
|
| ||||||
2008 |
|
|
|
|
|
|
|
|
|
|
|
| 4th quarter |
| $ | 56.45 |
| $ | 34.20 |
| $ | 0.240 |
|
| 3rd quarter |
|
| 68.42 |
|
| 33.34 |
|
| 0.240 |
|
| 2nd quarter |
|
| 45.68 |
|
| 38.38 |
|
| 0.240 |
|
| 1st quarter |
|
| 44.29 |
|
| 33.45 |
|
| 0.240 |
|
|
|
|
|
|
|
|
|
|
|
|
|
2007 |
|
|
|
|
|
|
|
|
|
|
|
| 4th quarter |
| $ | 43.47 |
| $ | 33.35 |
| $ | 0.240 |
|
| 3rd quarter |
|
| 43.90 |
|
| 32.78 |
|
| 0.240 |
|
| 2nd quarter |
|
| 44.37 |
|
| 37.50 |
|
| 0.240 |
|
| 1st quarter |
|
| 54.09 |
|
| 41.88 |
|
| 0.240 |
|
There were 5,7975,855 registered holders and approximately 5,50010,277 unregistered holders of common stock of the Company at February 9, 20072, 2008 and 32,671,19631,802,848 shares issued. On February 9, 2007,2, 2008, the high and low sale prices of the Company’s common stock as reported on the NASDAQ Stock Market were $47.25$27.88 and $45.94,$27.00, respectively. The principal source of funds to the Company to pay cash dividends is the dividends received from Hancock Bank, Gulfport, Mississippi, and Hancock Bank of Louisiana, Baton Rouge, Louisiana, Hancock Bank of Alabama, Mobile, Alabama, and Hancock Bank of Florida, Tallahassee, Florida. Consequently, dividends are dependent upon earnings, capital needs, regulatory policies and statutory limitations affecting the banks. Federal and state banking laws and regulations restrict the amount of dividends and loans a bank may make to its parent company. Dividends paid to the Company by Hancock Bank are subject to approval by the Commissioner of Banking and Consumer Finance of the State of Mississippi and those paid by Hancock Bank of Louisiana are subject to approval by the Commissioner for Financial Institutions of the State of Louisiana. Dividends paid by Hancock Bank of Florida are subject to approval by the Florida Department of Financial Services. The Company’s management does not expect regulatory restrictions to affect its policy of paying cash dividends. Although no assurance can be given that Hancock Holding Company will continue to declare and pay regular quarterly cash dividends on its common stock, the Company has paid regular cash dividends since 1937.
Stock Performance Graph
The following is a line graph presentation comparing cumulative, five-year shareholder returns on an indexed basis with a performance indicator of the overall stock market and an index of peer companies selected by us. The broad market index used in the graph is the NASDAQ Market Index. The peer group index is a group of financial institutions in the Southeast with approximate market capitalization ranging from $1.0 billion to $2.0 billion;southeast that are similar in asset size and business strategy; a list of the Companies included in the index follows the graph.
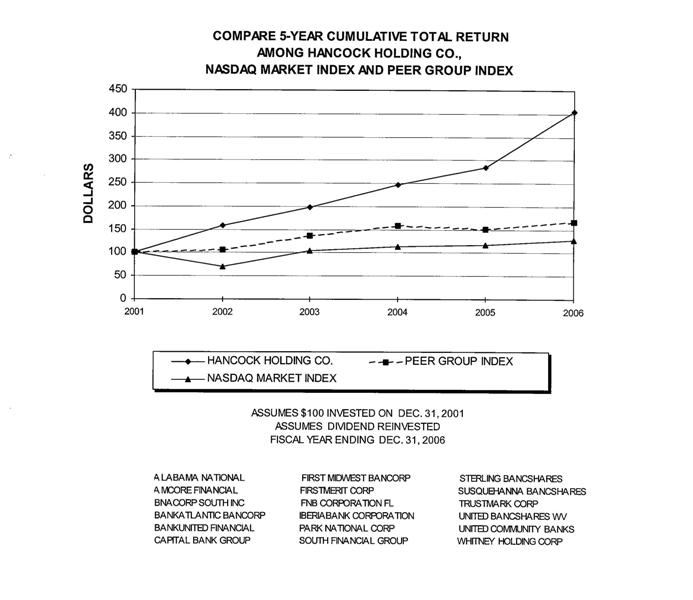
COMPARE 5-YEAR CUMULATIVE TOTAL RETURN
AMONG HANCOCK HOLDING CO.,
NASDAQ MARKET INDEX AND PEER GROUP INDEX
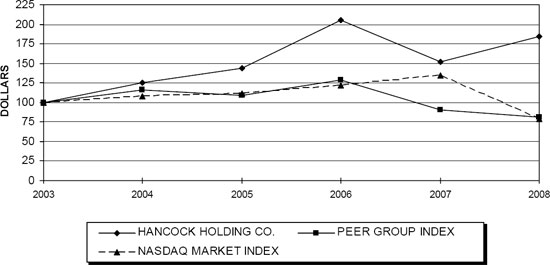
ASSUMES $100 INVESTED ON DEC. 31, 2003
ASSUMES DIVIDEND REINVESTED
FISCAL YEAR ENDING DEC. 31, 2008
BANK OF THE OZARKS INC | IBERIABANK CORP | STERLING BANCSHARES |
BANKATLANTIC BANCORP | PINNACLE FINANCIAL PARTNERS | SUPERIOR BANCORP |
FNB CORPORATION FL | RENASANT CORP | TRUSTMARK CORP |
GREEN BANKSHARES INC | REPUBLIC BANCORP INC CLA | UNITED COMMUNITY BANKS |
Issuer Purchases of Equity Securities
The following table provides information with respect to purchases made by the issuer or any affiliated purchaser of the issuer’s equity securities.
(a) (b) (c) (d) Total number of Maximum number shares purchased of shares Total number as a part of publicly that may yet be of shares or Average Price announced plans purchased under units purchased Paid per Share or programs (1) Plans or Programs ----------------- ----------------- -------------------------- ------------------------- Oct. 1, 2006 - Oct. 31, 2006 - $ - - 1,545,378 Nov. 1, 2006 - Nov. 30, 2006 - - - 1,545,378 Dec. 1, 2006 - Dec. 31, 2006 - - - 1,545,378 ----------------- ----------------- -------------------------- Total - $ - - ================= ================= ========================== (1) The Company publicly announced its stock buy-back program on July 18, 2000.
|
|
|
|
|
|
|
|
|
|
|
|
|
|
|
| (a) |
| (b) |
| (c) |
| (d) |
| ||||
|
|
|
|
|
| ||||||||
Oct. 1, 2008 - Oct. 31, 2008 |
|
| — |
| $ | — |
|
| — |
|
| 2,989,158 |
|
Nov. 1, 2008 - Nov. 30, 2008 |
|
| — |
|
| — |
|
| — |
|
| 2,989,158 |
|
Dec.1, 2008 - Dec. 31, 2008 |
|
| 6,458 |
|
| 40.26 |
|
| 6,458 |
|
| 2,982,700 |
|
|
|
|
|
|
|
|
| ||||||
Total |
|
| 6,458 |
| $ | 40.26 |
|
| 6,458 |
|
|
|
|
|
|
|
|
|
|
|
| ||||||
(1) The Company publicly announced its stock buy-back program on November 13, 2007. |
Equity Compensation Plan Information
|
|
|
|
|
|
|
|
|
|
|
Plan Category |
| Number of securities to |
| Weighted-average |
| Number of securities remaining |
| |||
Equity compensation plans approved by security holders |
| $ | 1,268,150 |
| $ | 26.98 |
| $ | 4,572,802 |
|
Equity compensation plans not approved by security holders |
|
| — |
|
| — |
|
| — |
|
Total |
| $ | 1,268,150 |
| $ | 26.98 |
| $ | 4,572,802 |
|
SELECTED FINANCIAL DATA |
The following table setstables set forth certain selected historical consolidated financial data and should be read in conjunction with “Item 7. Management’s Discussion and Analysis of Financial Condition and resultsResults of Operations” and the consolidated Financial Statements and Notes thereto included elsewhere herein. The following information may not be deemed indicative of our future operating results.
At and For the Years Ended December 31, ------------------------------------------------------------------------ 2006 2005 2004 2003 2002 ------------- ------------- ------------- ------------ -------------(Unaudited, in thousands)Period-End Balance Sheet Data:Securities $ 1,903,658 $ 1,959,261 $ 1,302,369 $ 1,278,049 $ 1,486,810 Short-term investments 222,439 410,226 150,261 11,288 47,257 Loans, net of unearned income 3,266,584 2,989,186 2,748,560 2,448,644 2,104,982 Total earning assets 5,392,680 5,358,673 4,201,191 3,737,981 3,639,049 Allowance for loan losses 46,772 74,558 40,682 36,750 34,740 Total assets 5,964,565 5,950,187 4,664,726 4,150,358 3,973,147 Total deposits 5,030,991 4,989,820 3,797,945 3,447,847 3,301,500 Short-term notes - - - 9,400 - Long-term notes 258 50,266 50,273 50,428 51,020 Total preferred stockholders' equity - - - 37,067 37,069 Total common stockholders' equity 558,410 477,415 464,582 397,814 387,513Average Balance Sheet Data:Securities $ 2,228,822 $ 1,434,415 $ 1,345,350 $ 1,466,156 $ 1,493,574 Short-term investments 211,511 137,821 34,911 57,986 83,427 Loans, net of unearned income 3,062,222 2,883,020 2,599,561 2,238,245 1,961,299 Total earning assets 5,502,555 4,455,256 3,979,822 3,762,387 3,538,300 Allowance for loan losses 64,285 50,107 38,117 35,391 33,135 Total assets 6,031,800 4,931,030 4,424,334 4,111,949 3,857,698 Total deposits 5,069,427 4,001,426 3,602,734 3,407,205 3,174,946 Short-term notes 1,068 3,836 2,311 26 - Long-term notes 13,278 50,275 50,312 50,677 51,299 Total preferred stockholders' equity - - 2,240 37,069 37,069 Total common stockholders' equity 513,656 475,701 447,384 396,034 388,821
|
|
|
|
|
|
|
|
|
|
|
|
|
|
|
|
|
|
| At and For the Years Ended December 31, |
| |||||||||||||
|
|
| ||||||||||||||
|
| 2008 |
| 2007 |
| 2006 |
| 2005 |
| 2004 |
| |||||
|
|
|
|
|
|
| ||||||||||
|
| (Unaudited, in thousands) |
| |||||||||||||
Period-End Balance Sheet Data: |
|
|
|
|
|
|
|
|
|
|
|
|
|
|
|
|
Securities |
| $ | 1,681,957 |
| $ | 1,670,208 |
| $ | 1,895,157 |
| $ | 1,953,245 |
| $ | 1,294,697 |
|
Short-term investments |
|
| 549,416 |
|
| 126,281 |
|
| 222,439 |
|
| 410,226 |
|
| 150,261 |
|
Loans held for sale |
|
| 22,115 |
|
| 18,957 |
|
| 16,946 |
|
| 24,219 |
|
| 30,129 |
|
Loans, net of unearned income |
|
| 4,249,465 |
|
| 3,596,557 |
|
| 3,249,638 |
|
| 2,964,967 |
|
| 2,718,431 |
|
Total earning assets |
|
| 6,502,953 |
|
| 5,412,003 |
|
| 5,384,180 |
|
| 5,352,657 |
|
| 4,193,519 |
|
Allowance for loan losses |
|
| 61,725 |
|
| 47,123 |
|
| 46,772 |
|
| 74,558 |
|
| 40,682 |
|
Total assets |
|
| 7,167,254 |
|
| 6,055,979 |
|
| 5,964,565 |
|
| 5,950,187 |
|
| 4,664,726 |
|
Total deposits |
|
| 5,930,937 |
|
| 5,009,534 |
|
| 5,030,991 |
|
| 4,989,820 |
|
| 3,797,945 |
|
Total common stockholders’ equity |
|
| 609,499 |
|
| 554,187 |
|
| 558,410 |
|
| 477,415 |
|
| 464,582 |
|
|
|
|
|
|
|
|
|
|
|
|
|
|
|
|
|
|
Average Balance Sheet Data: |
|
|
|
|
|
|
|
|
|
|
|
|
|
|
|
|
Securities |
| $ | 1,743,998 |
| $ | 1,726,714 |
| $ | 2,222,114 |
| $ | 1,426,461 |
| $ | 1,337,324 |
|
Short-term investments |
|
| 175,891 |
|
| 117,158 |
|
| 211,511 |
|
| 137,821 |
|
| 34,911 |
|
Loans, net of unearned income |
|
| 3,873,908 |
|
| 3,428,009 |
|
| 3,062,222 |
|
| 2,883,020 |
|
| 2,599,561 |
|
Total earning assets |
|
| 5,793,797 |
|
| 5,271,881 |
|
| 5,495,847 |
|
| 4,447,302 |
|
| 3,971,796 |
|
Allowance for loan losses |
|
| 53,354 |
|
| 46,443 |
|
| 64,285 |
|
| 50,107 |
|
| 38,117 |
|
Total assets |
|
| 6,426,389 |
|
| 5,851,889 |
|
| 6,031,800 |
|
| 4,931,030 |
|
| 4,424,334 |
|
Total deposits |
|
| 5,182,407 |
|
| 4,929,176 |
|
| 5,069,427 |
|
| 4,001,426 |
|
| 3,602,734 |
|
Total common stockholders’ equity |
|
| 584,805 |
|
| 562,383 |
|
| 513,656 |
|
| 475,701 |
|
| 447,384 |
|
At and For the Years Ended December 31, --------------------------------------------------------------------- 2006 2005 2004 2003 2002 ----------- -------------- ------------- ------------ -----------(Unaudited, in thousands)Performance Ratios:Return on average assets 1.69% 1.10% 1.39% 1.34% 1.32% Return on average common equity 19.82% 11.36% 13.79% 13.88% 13.13% Net interest margin (te)
|
|
|
|
|
|
|
|
|
|
|
|
|
|
|
|
|
|
| At and For the Years Ended December 31, |
| |||||||||||||
|
|
| ||||||||||||||
|
| 2008 |
| 2007 |
| 2006 |
| 2005 |
| 2004 |
| |||||
|
|
|
|
|
|
| ||||||||||
|
| (Unaudited, in thousands) |
| |||||||||||||
Key Ratios: |
|
|
|
|
|
|
|
|
|
|
|
|
|
|
|
|
Return on average assets |
|
| 1.02 | % |
| 1.26 | % |
| 1.69 | % |
| 1.10 | % |
| 1.39 | % |
Return on average common equity |
|
| 11.18 | % |
| 13.14 | % |
| 19.82 | % |
| 11.36 | % |
| 13.79 | % |
Net interest margin (te)* |
|
| 3.80 | % |
| 4.08 | % |
| 4.23 | % |
| 4.40 | % |
| 4.44 | % |
Average loans to average deposits |
|
| 74.75 | % |
| 69.55 | % |
| 60.41 | % |
| 72.05 | % |
| 72.16 | % |
Noninterest income excluding storm-related insurance gain, gain on sale of branches and credit card merchant, and securities transactions, as a percent of total revenue (te) |
|
| 35.86 | % |
| 35.89 | % |
| 31.44 | % |
| 32.38 | % |
| 33.78 | % |
Noninterest expense as a percent of total revenue (te) before amortization of purchased intangibles, storm-related insurance gain, gains on sale of branches and credit card merchant, and securities transactions |
|
| 61.84 | % |
| 64.13 | % |
| 59.28 | % |
| 59.08 | % |
| 59.27 | % |
Allowance for loan losses to period-end loans |
|
| 1.45 | % |
| 1.31 | % |
| 1.44 | % |
| 2.51 | % |
| 1.50 | % |
Non-performing assets to loans plus other real estate |
|
| 0.83 | % |
| 0.43 | % |
| 0.13 | % |
| 0.42 | % |
| 0.40 | % |
Allowance for loan losses to non-performing loans and accruing loans 90 days past due |
|
| 133.16 | % |
| 241.43 | % |
| 694.67 | % |
| 195.50 | % |
| 251.85 | % |
Net charge-offs to average loans |
|
| 0.57 | % |
| 0.21 | % |
| 0.23 | % |
| 0.30 | % |
| 0.48 | % |
FTE employees (period-end) |
|
| 1,952 |
|
| 1,888 |
|
| 1,848 |
|
| 1,735 |
|
| 1,767 |
|
Common stockholders’ equity to total assets |
|
| 8.50 | % |
| 9.15 | % |
| 9.36 | % |
| 8.02 | % |
| 9.96 | % |
Tangible common equity to total assets |
|
| 7.62 | % |
| 8.08 | % |
| 8.24 | % |
| 6.89 | % |
| 8.58 | % |
Tier 1 leverage |
|
| 8.06 | % |
| 8.51 | % |
| 8.63 | % |
| 7.85 | % |
| 8.97 | % |
Tier 1 risk-based |
|
| 10.09 | % |
| 11.03 | % |
| 12.46 | % |
| 11.47 | % |
| 12.39 | % |
Total risk-based |
|
| 11.22 | % |
| 12.07 | % |
| 13.60 | % |
| 12.73 | % |
| 13.58 | % |
|
|
|
|
|
|
|
|
|
|
|
|
|
|
|
|
|
Income Data: |
|
|
|
|
|
|
|
|
|
|
|
|
|
|
|
|
Interest income |
| $ | 335,437 |
| $ | 345,697 |
| $ | 344,063 |
| $ | 263,378 |
| $ | 226,622 |
|
Interest expense |
|
| 126,002 |
|
| 140,236 |
|
| 119,863 |
|
| 74,819 |
|
| 57,270 |
|
Net interest income |
|
| 209,435 |
|
| 205,461 |
|
| 224,200 |
|
| 188,559 |
|
| 169,352 |
|
Net interest income (te) |
|
| 219,889 |
|
| 215,000 |
|
| 232,463 |
|
| 195,936 |
|
| 176,626 |
|
Provision for (reversal of) loan losses |
|
| 36,785 |
|
| 7,593 |
|
| (20,762 | ) |
| 42,635 |
|
| 16,537 |
|
Noninterest income excluding storm-related insurance gain, gains on sale of branches and credit card merchant and securities transactions |
|
| 122,953 |
|
| 120,378 |
|
| 106,585 |
|
| 93,840 |
|
| 90,116 |
|
Net storm-related items |
|
| — |
|
| — |
|
| 5,084 |
|
| 6,584 |
|
| — |
|
Gains/(losses) on sales of securities, net |
|
| 4,825 |
|
| 308 |
|
| (5,169 | ) |
| (53 | ) |
| 163 |
|
Gains on sales of branches |
|
| — |
|
| — |
|
| — |
|
| — |
|
| 2,258 |
|
Gain on sale of credit card merchant services business |
|
| — |
|
| — |
|
| — |
|
| — |
|
| 3,000 |
|
Noninterest expense excluding amortization of intangibles |
|
| 212,011 |
|
| 215,092 |
|
| 200,991 |
|
| 171,197 |
|
| 158,109 |
|
Amortization of intangibles |
|
| 1,432 |
|
| 1,651 |
|
| 2,125 |
|
| 2,194 |
|
| 1,945 |
|
Net income before income taxes |
|
| 86,985 |
|
| 101,811 |
|
| 148,346 |
|
| 72,903 |
|
| 88,297 |
|
Net income |
|
| 65,366 |
|
| 73,892 |
|
| 101,802 |
|
| 54,032 |
|
| 61,704 |
|
Net income available to common stockholders |
|
| 65,366 |
|
| 73,892 |
|
| 101,802 |
|
| 54,032 |
|
| 61,704 |
|
* 4.23% 4.40% 4.44% 4.45% 4.70%
Average loans to average deposits 60.41% 72.05% 72.16% 65.69% 61.77%
Noninterest income excluding storm-related insurance
gain, gain on sale of branches and credit card
merchant, and securities transactions,
as a percent of total revenue (te) 30.87% 31.86% 33.77% 30.40% 30.11%
Noninterest expense as a percent of total revenue (te)
before amortization of purchased intangibles,
storm-related insurance gain, gains on sale of
branches and credit card merchant, and
securities transactions 58.99% 58.82% 57.33% 57.83% 57.83%
Allowance for loan losses to period-end loans 1.43% 2.49% 1.48% 1.50% 1.65%
Non-performing assets to loans plus other real estate 0.13% 0.42% 0.40% 0.73% 0.84%
Allowance for loan losses to non-performing loans
and accruing loans 90 days past due 694.67% 195.50% 251.85% 169.73% 143.48%
Net charge-offs to average loans 0.23% 0.30% 0.48% 0.59% 0.91%
FTE employees (period-end) 1,848 1,735 1,767 1,734 1,790
Capital Ratios:
Common stockholders' equity to total assets 9.36% 8.02% 9.96% 9.59% 9.75%
Tier 1 leverage 8.63% 7.85% 8.97% 9.29% 9.19%
Tier 1 risk-based 12.46% 11.47% 12.39% 13.65% 14.88%
Total risk-based 13.60% 12.73% 13.58% 14.88% 16.11%
Income Data:
Interest income $ 344,330 $ 263,631 $ 226,774 $ 218,149 $ 230,781
Interest expense 119,863 74,819 57,270 57,961 72,053
Net interest income 224,467 188,812 169,504 160,188 158,728
Net interest income (te) 232,730 196,189 176,777 167,358 166,190
Provision for (reversal of) loan losses (20,762) 42,635 16,537 15,154 18,495
Noninterest income excluding storm-related insurance
gain, gains on sale of branches and credit card
merchant and securities transactions 103,918 91,738 84,860 73,089 71,589
Net storm-related items 5,084 6,584 - - -
Gains/(losses) on sales of securities, net (5,169) (53) 163 1,667 4
Gains on sales of branches - - 2,258 - -
Gain on sale of credit card merchant
services business - - 3,000 - -
Noninterest expense excluding amortization
of intangibles 198,591 169,349 153,006 139,060 137,508
Amortization of intangibles 2,125 2,194 1,945 1,148 750
Net income before income taxes 148,346 72,903 88,297 79,582 73,569
Net income 101,802 54,032 61,704 54,955 51,043
Net income available to common stockholders 101,802 54,032 61,704 52,302 48,390
*TaxTax Equivalent (te) amounts are calculated using a marginal federal income tax rate of 35%.
At and For the Years Ended December 31, ------------------------------------------------------------------------------------ 2006 2005 2004 2003 2002 ------------- ----------------- ---------------- --------------- --------------Per Common Share Data:(Unaudited, in thousands except per share data) Basic earnings per share $ 3.13 $ 1.67 $ 1.91 $ 1.70 $ 1.54 Diluted earnings per share $ 3.06 $ 1.64 $ 1.87 $ 1.64 $ 1.50 Cash dividends paid $ 0.895 $ 0.72 $ 0.58 $ 0.44 $ 0.40 Book value $ 17.09 $ 14.78 $ 14.32 $ 13.06 $ 12.55 Dividend payout ratio 28.59% 43.11% 30.37% 25.88% 25.97% Weighted average number of shares outstanding Basic 32,534 32,365 32,390 30,714 31,486 Diluted 33,304 32,966 33,052 33,410 34,084 Number of shares outstanding (period end) 32,666 32,301 32,440 30,455 30,887 Market data: High closing price $ 57.19 $ 39.90 $ 34.83 $ 29.25 $ 25.19 Low closing price $ 37.75 $ 28.25 $ 25.00 $ 21.00 $ 13.78 Period-end closing price $ 52.84 $ 37.81 $ 33.46 $ 27.29 $ 22.33 Trading volume 27,275 22,404 11,572 11,410 18,812
|
|
|
|
|
|
|
|
|
|
|
|
|
|
|
|
|
|
| At and For the Years Ended December 31, |
| |||||||||||||
|
|
| ||||||||||||||
|
| 2008 |
| 2007 |
| 2006 |
| 2005 |
| 2004 |
| |||||
|
|
|
|
|
|
| ||||||||||
Per Common Share Data: |
|
|
|
|
|
|
|
|
|
|
|
|
|
|
|
|
Basic earnings per share |
| $ | 2.08 |
| $ | 2.31 |
| $ | 3.13 |
| $ | 1.67 |
| $ | 1.91 |
|
Diluted earnings per share |
| $ | 2.05 |
| $ | 2.27 |
| $ | 3.06 |
| $ | 1.64 |
| $ | 1.87 |
|
Cash dividends paid |
| $ | 0.960 |
| $ | 0.960 |
| $ | 0.895 |
| $ | 0.72 |
| $ | 0.58 |
|
Book value |
| $ | 19.18 |
| $ | 17.71 |
| $ | 17.09 |
| $ | 14.78 |
| $ | 14.32 |
|
Dividend payout ratio |
|
| 46.15 | % |
| 41.56 | % |
| 28.59 | % |
| 43.11 | % |
| 30.37 | % |
Weighted average number of shares outstanding |
|
|
|
|
|
|
|
|
|
|
|
|
|
|
|
|
Basic |
|
| 31,491 |
|
| 32,000 |
|
| 32,534 |
|
| 32,365 |
|
| 32,390 |
|
Diluted |
|
| 31,883 |
|
| 32,545 |
|
| 33,304 |
|
| 32,966 |
|
| 33,052 |
|
Number of shares outstanding (period end) |
|
| 31,770 |
|
| 31,295 |
|
| 32,666 |
|
| 32,301 |
|
| 32,440 |
|
Market data: |
|
|
|
|
|
|
|
|
|
|
|
|
|
|
|
|
High closing price |
| $ | 68.42 |
| $ | 54.09 |
| $ | 57.19 |
| $ | 39.90 |
| $ | 34.83 |
|
Low closing price |
| $ | 33.34 |
| $ | 32.78 |
| $ | 37.75 |
| $ | 28.25 |
| $ | 25.00 |
|
Period-end closing price |
| $ | 45.46 |
| $ | 38.20 |
| $ | 52.84 |
| $ | 37.81 |
| $ | 33.46 |
|
Trading volume |
|
| 73,843 |
|
| 48,169 |
|
| 27,275 |
|
| 22,404 |
|
| 11,572 |
|
MANAGEMENT’S DISCUSSION AND ANALYSIS OF FINANCIAL CONDITION AND RESULTS OF OPERATIONS |
The purpose of this discussion and analysis is to focus on significant changes and events in the financial condition and results of operations of Hancock Holding Company and itsour subsidiaries (Hancock) during 20062008 and selected prior periods. This discussion and analysis is intended to highlight and supplement data and information presented elsewhere in this report, including the preceding consolidated financial statements and related notes. Certain information relating to prior years has been reclassified to conform to the current year’s presentation.
FORWARD-LOOKING STATEMENTS
Congress passed the Private Securities Litigation Act of 1995 in an effort to encourage corporations to provide information about a company’s anticipated future financial performance. This act provides a safe harbor for such disclosure, which protects us from unwarranted litigation, if actual results are different from management expectations. This discussion and analysis contains forward-looking statements and reflects management’s current views and estimates of future economic circumstances, industry conditions, company performance and financial results. The words “may,” “should,” “expect,” “anticipate,” “intend,” “plan,” “continue,” “believe,” “seek,” “estimate” and similar expressions are intended to identify forward-looking statements. These forward-looking statements are subject to a number of factors and uncertainties, which could cause our actual results and experience to differ from the anticipated results and expectations, expressed in such forward-looking statements.
EXECUTIVE OVERVIEW
Diluted earnings per common share Net income for 2006 were $3.06 on earningsthe year ended December 31, 2008 was $65.4 million, a decrease of $101.8$8.5 million, or 11.5%, from 2007’s net income of $73.9 million. Diluted earnings per common share were up 87% and net$2.05, a decrease of $0.22 from 2007’s diluted earnings increased by 88% asper share of $2.27. Our return on average assets for 2008 was 1.02% compared to 2005. Net income1.26% for both 20062007.
Our year-end results were heavily impacted by the continuing financial crisis and 2005 was affected by several items related to the impact of Hurricane Katrina, which made landfallon-going national economic recession. Weaknesses in residential development and rising unemployment levels in our regionmarket areas also impacted earnings which had a significant impact on August 29, 2005. In 2005,our net income was negatively affected by storm-related items totaling $21.1 million on an after tax basis. The largest of 2005‘s items was the establishment ofcharge-off levels and resulted in a $35.2 million (pretax)higher allowance for loan losses in 2008. As a result of these difficult national and regional issues, we recorded a provision for loan losses of $36.8 million, which represents an increase of $29.2 million compared to 2007. Of the $36.8 million provision, $17.1 million was recorded in the fourth quarter of 2008 as a result of the ongoing recession, the continued rise in unemployment levels, and an increase in non-performing loans and higher past dues. Net charge-offs for 2008 were $22.2 million, or 0.57% of average loans and were up $14.9 million compared to 2007. Of the $22.2 million in net charge-offs in 2008, $12.6 million of that was recorded in the fourth quarter of 2008 and was primarily related to the storm. Inconstruction and land development segments as the third quarterhousing market continued to struggle. The construction and land development loan segment represents approximately 13.7% of 2006, we reversed $20.0Hancock’s total loan portfolio, or about $585.4 million from the storm-relatedat year end 2008. These weakening economic conditions also impacted our allowance for loan losses, duewhich increased to better than expected loss experience with storm impacted credits. In addition,1.45% of period-end loans at December 31, 2008 from the 1.31% recorded at December 31, 2007.
Our balance sheet showed strong growth during 2008. At year end, our total asset level reached $7.2 billion, an increase of $1.1 billion, or 18.4%, from December 31, 2007. We experienced strong growth in loans in 2008. Period-end loans were up $652.9 million, or 18.2%, from December 31, 2007. Loan growth increased across our loan categories of commercial/ real estate, direct consumer, indirect consumer, and finance company loans. All of the growth in assets was organic growth as we negotiated a final settlement with our property and casualty insurance provider and booked a $5.1 million gain in 2006‘s fourth quarter.
Our management team continues to evaluate opportunities for growth and expansion as evidenced by our approval for a charterdid not record any acquisitions in the statepast year. We also experienced strong growth in deposits over the past year. Period-end deposits at December 31, 2008 were $5.9 billion, up $921.4 million, or 18.4%, from December 31, 2007. Our growth was related to deposit rate campaigns in growing markets in addition to customers seeking a safe and secure bank for their money as some other banks experienced capital concerns in 2008. We continue to remain well capitalized with total equity of Alabama. Strategic management of earning assets and deposit mix, continued focus on efficiency and credit quality, and improved non-interest income drove the increase in operating earnings in 2006.$609.5 million at December 31, 2008, up $55.3 million, or 10.0%, from December 31, 2007.
RESULTS OF OPERATIONS
Net Interest Income
Net interest income (te) is the primary component of Hancock’sour earnings and represents the difference, or spread, between revenue generated from interest-earning assets and the interest expense related to funding those assets. For internal analytical purposes, management adjusts net interest income to a “taxable equivalent” basis using a 35% federal tax rate on tax exempt items (primarily interest on municipal securities and loans). Fluctuations in interest rates, as well as volume and mix changes in earning assets and interest-bearing liabilities can materially impact net interest income (te).
Another significant statistic in the analysis of net interest income is the effective interest differential (also referred to as the net interest margin), which is the averageratio of net interest earned, net interest income (te) less net interest expense, on Hancock’sto our average earning assets. The difference between the average yield on earning assets and the effective rate paid for all deposits and borrowed funds, non-interest-bearing as well as interest-bearing is the net interest spread. Since a portion of the Bank’s deposits does not bear interest, such as demand accounts, the rate paid for all funds is lower than the rate on interest-bearing liabilities alone. The net interest margin (te) for the years 2008, 2007, and 2006 was 3.80%, 4.08%, and 2005 was 4.23% and 4.40%, respectively.
Net interest income (te) of $232.7$219.9 million was recorded for the year 2006,2008, an increase of $36.5$4.9 million, or 19%2.3%, from 2005.2007. We also experienced a significant increasedecrease of $19.4$17.5 million, or 11%8%, from 20042007 to 2005.2006. The factors contributing to the changes in net interest income (te) for 2006, 20052008, 2007 and 20042006 are presented in Tables 1 and 2. Table 1 is an analysis of the components of Hancock’s average balance sheets, levels of interest income and expense and the resulting earning asset yields and liability rates. Table 2 breaks downdetails the overall changes in the level of net interest income into rate and volume.
The increase of $4.9 million in net interest income (te) in 2008 from 2007 was caused by an increase in average earnings assets of $521.9 million, or 9.9%. In 2008, our average loan growth increased $445.9 million, or 13%, from 2007 along with a slight increase in average securities of $17.3 million. With short-term interest rates down significantly from last year, our loan yield fell 107 basis points, pushing the yield on average earnings assets down 77 basis points. There was also an unfavorable change in 2008 in our average funding mix with most new deposits more heavily weighted to mostly time deposits of $304.2 million and lower levels of non-interest bearing transaction deposits of $51 million.
When comparing 20062007 to 2005,2006, the primary driver of the $36.5$17.5 million, or 19% increase,8% decrease, in net interest income (te) was a $1,047.3$223.9 million, or 24%4%, increasedecrease in average earning assets mainly fromassets. In 2008, our average loan growth increased $366 million offset by a decrease in average securities of $179.2 million, or 7%. Hancock’s loan growth and overall increase$495 million. There was an unfavorable change in earning assets was primarily funded by average deposit growth of $1,068.0 million, or 27%. This overall improvement2007 in the earning asset mix enabled us to maintain our average loan-to-deposit ratio at 60% for the year ended December 31, 2006 compared to 72% in 2005. For the years ended December 31, 2006funding mix with higher levels of more costly time deposits of $233 million and 2005, loans comprise 56%lower levels of Hancock’s earning asset base. It is not uncommon for loan growth to lag deposit growth in the aftermathtransaction deposits of a storm such as Hurricane Katrina in 2005. Loan growth in Hancock’s operating region is expected to continue as inflows$205 million. The impact of insurance and federal aid funds have begun to subside. Thethis change on net interest margin (te) narrowed 17 basis points aswas managed by reducing rates paid on the overall increase in average earning asset yield (33 basis points) did not offset the increase in total funding costs (50 basis points). Hancock’s ability to effect continuing improvements in the earning asset mix remains a significant positive contributor to future earnings growth.interest bearing deposits.
Average earning assets increased $1,047.3 million, or 24%, during 2006 mainly from average loan growth of $179.2 million, or 6%. Average securities increased $794.4 million, or 55%, over 2005. The increase in average earning assets was funded primarily with total average deposit growth of $1,068.0 million, or 27%. Average interest-bearing deposits increased $761.9 million, or 24%, while average non-interest bearing deposits increased $306.1 million, or 37% resulting primarily from the aforementioned inflows of deposits related to Hurricane Katrina.
Recognizing the importance of interest differential to total earnings, management places great emphasis on managing interest rate spreads. Although interest differential is affected by national, regional, and area economic differential through appropriateeconomics our loan and investment policies. These policies are designed to maximize interest differential while maintain sufficient liquidity and availability of funds for purposes of meeting existing commitments and for investment in loans and other investment opportunities that may arise.
The following table is a summary of average balance sheets that reflects average interest earned, average interest paid, average yield and average rate:
TABLE 1. Summary of Average Balance Sheets (w/Net Interest Income (te) & Interest Rates) - ---------------------------------------------------------------------------------------------------------------------------- 2006 2005 2004 --------------------------------------------------------------------------------- Average Average Average Balance Interest Rate Balance Interest Rate Balance Interest Rate ---------------------------------------------------------------------------------(In thousands) ASSETS EARNING ASSETS Loans* (te) $3,062,222 $235,067 7.68% $2,883,020 $201,446 6.99% $2,599,561 $172,868 6.65% --------------------------------------------------------------------------------- U.S. Treasury securities 63,668 3,018 4.74% 16,838 532 3.16% 11,003 200 1.82% U.S. agency securities 1,270,128 60,701 4.78% 514,834 21,499 4.18% 424,875 17,755 4.18% CMOs 154,673 6,142 3.97% 241,473 9,492 3.93% 296,625 11,515 3.88% Mortgage-backed securities 491,130 23,313 4.75% 437,037 19,407 4.44% 389,871 16,706 4.29% Obligations of states and political subdivisions: taxable 20,205 350 1.73% 6,050 428 7.08% 6,777 497 7.33% nontaxable (te) 151,681 10,416 6.87% 155,414 10,823 6.96% 166,540 11,874 7.13% FHLB stock and other corporate securities 77,337 3,826 4.95% 62,769 2,822 4.50% 49,659 2,248 4.53% --------------------------------------------------------------------------------- Total investment in securities 2,228,822 107,766 4.84% 1,434,415 65,003 4.53% 1,345,350 60,795 4.52% --------------------------------------------------------------------------------- Federal funds sold and short-term investments 211,511 9,759 4.61% 137,821 4,559 3.31% 34,911 384 1.10% --------------------------------------------------------------------------------- Total earning assets (te) 5,502,555 352,592 6.41% 4,455,256 271,008 6.08% 3,979,822 234,047 5.88% --------------------------------------------------------------------------------- NON-EARNING ASSETS Other assets 593,530 525,881 482,629 Allowance for loan losses (64,285) (50,107) (38,117) ----------- ----------- ----------- Total assets $6,031,800 $4,931,030 $4,424,334 =========== =========== =========== LIABILITIES, PREFERRED STOCK AND COMMON STOCKHOLDERS' EQUITY INTEREST-BEARING LIABILITIES Interest-bearing transaction deposits $1,623,597 14,931 0.92% $1,384,605 9,203 0.66% $1,360,198 8,191 0.60% Time deposits 1,545,834 62,807 4.06% 1,149,239 40,654 3.54% 1,018,165 35,056 3.44% Public funds 771,146 32,354 4.20% 644,849 17,724 2.75% 574,266 9,323 1.62% ---------------------------------------------------------------------------------- Total interest-bearing deposits 3,940,577 110,092 2.79% 3,178,693 67,581 2.13% 2,952,629 52,570 1.78% ---------------------------------------------------------------------------------- Customer repurchase agreements 250,603 9,060 3.62% 224,842 4,351 1.94% 195,470 1,909 0.98% Other interest-bearing liabilities 30,580 711 2.32% 69,057 2,887 4.18% 69,960 2,791 3.99% ---------------------------------------------------------------------------------- Total interest-bearing liabilities 4,221,760 119,863 2.84% 3,472,592 74,819 2.15% 3,218,059 57,270 1.78% ---------------------------------------------------------------------------------- NON-INTEREST BEARING LIABILITIES, PREFERRED STOCK AND COMMON STOCKHOLDERS' EQUITY Demand deposits 1,128,850 822,733 650,106 Other liabilities 167,534 160,004 106,545 Preferred stockholders' equity - - 2,240 Common stockholders' equity 513,656 475,701 447,384 ---------------------------------------------------------------------------------- Total liabilities, preferred stock & common stockholders' equity $6,031,800 2.18% $4,931,030 1.68% $4,424,334 1.44% =========== =================== ================== ======= Net interest income and margin (te) $232,729 4.23% $196,189 4.40% $176,777 4.44% Net earning assets and spread $1,280,795 3.57% $982,664 3.93% $761,763 4.10% =========== =================== ================== ======= *Loan
|
|
|
|
|
|
|
|
|
|
|
|
|
|
|
|
|
|
|
|
|
|
|
|
|
|
|
|
|
TABLE 1. Summary of Average Balance Sheets (w/Net Interest Income (te) & Interest Rates) |
|
|
| |||||||||||||||||||||||||
|
|
|
|
|
|
|
|
|
|
|
|
|
|
|
|
|
|
|
|
|
|
|
|
|
|
|
| |
|
| Years Ended December 31, |
| |||||||||||||||||||||||||
|
| 2008 |
| 2007 |
| 2006 |
| |||||||||||||||||||||
|
| |||||||||||||||||||||||||||
|
| Average |
| Interest |
| Rate |
| Average |
| Interest |
| Rate |
| Average |
| Interest |
| Rate |
| |||||||||
|
| |||||||||||||||||||||||||||
|
| (In thousands) |
| |||||||||||||||||||||||||
Assets |
|
|
|
|
|
|
|
|
|
|
|
|
|
|
|
|
|
|
|
|
|
|
|
|
|
|
|
|
Interest-Earnings Assets: |
|
|
|
|
|
|
|
|
|
|
|
|
|
|
|
|
|
|
|
|
|
|
|
|
|
|
|
|
Loans* (te) |
| $ | 3,873,908 |
| $ | 254,347 |
|
| 6.57 | % | $ | 3,428,009 |
| $ | 261,944 |
|
| 7.64 | % | $ | 3,062,222 |
| $ | 235,067 |
|
| 7.68 | % |
U.S. Treasury securities |
|
| 11,366 |
|
| 296 |
|
| 2.60 | % |
| 29,095 |
|
| 1,379 |
|
| 4.74 | % |
| 63,668 |
|
| 3,018 |
|
| 4.74 | % |
U.S. agency securities |
|
| 349,931 |
|
| 16,000 |
|
| 4.57 | % |
| 810,299 |
|
| 41,111 |
|
| 5.07 | % |
| 1,270,128 |
|
| 60,701 |
|
| 4.78 | % |
CMOs |
|
| 150,692 |
|
| 7,465 |
|
| 4.95 | % |
| 94,731 |
|
| 3,997 |
|
| 4.22 | % |
| 154,673 |
|
| 6,142 |
|
| 3.97 | % |
Mortgage-backed securities |
|
| 1,012,274 |
|
| 52,564 |
|
| 5.19 | % |
| 534,893 |
|
| 27,190 |
|
| 5.08 | % |
| 491,130 |
|
| 23,313 |
|
| 4.75 | % |
Obligations of states and political subdivisions: |
|
|
|
|
|
|
|
|
|
|
|
|
|
|
|
|
|
|
|
|
|
|
|
|
|
|
|
|
taxable |
|
| 52,070 |
|
| 1,661 |
|
| 3.19 | % |
| 50,944 |
|
| 1,189 |
|
| 2.33 | % |
| 20,205 |
|
| 350 |
|
| 1.73 | % |
nontaxable (te) |
|
| 120,237 |
|
| 7,659 |
|
| 6.37 | % |
| 146,060 |
|
| 9,590 |
|
| 6.57 | % |
| 151,681 |
|
| 10,416 |
|
| 6.87 | % |
Other corporate securities |
|
| 47,428 |
|
| 2,061 |
|
| 4.34 | % |
| 60,692 |
|
| 3,223 |
|
| 5.31 | % |
| 70,629 |
|
| 3,559 |
|
| 5.04 | % |
Total investment in securities |
|
| 1,743,998 |
|
| 87,706 |
|
| 5.03 | % |
| 1,726,714 |
|
| 87,679 |
|
| 5.08 | % |
| 2,222,114 |
|
| 107,499 |
|
| 4.84 | % |
Federal funds sold and short-term investments |
|
| 175,891 |
|
| 3,838 |
|
| 2.18 | % |
| 117,158 |
|
| 5,613 |
|
| 4.79 | % |
| 211,511 |
|
| 9,760 |
|
| 4.61 | % |
|
| |||||||||||||||||||||||||||
Total interest-earning assets (te) |
|
| 5,793,797 |
|
| 345,891 |
|
| 5.97 | % |
| 5,271,881 |
|
| 355,236 |
|
| 6.74 | % |
| 5,495,847 |
|
| 352,326 |
|
| 6.41 | % |
|
| |||||||||||||||||||||||||||
Non-earning assets: |
|
|
|
|
|
|
|
|
|
|
|
|
|
|
|
|
|
|
|
|
|
|
|
|
|
|
|
|
Other assets |
|
| 685,946 |
|
|
|
|
|
|
|
| 626,451 |
|
|
|
|
|
|
|
| 600,238 |
|
|
|
|
|
|
|
Allowance for loan losses |
|
| (53,354 | ) |
|
|
|
|
|
|
| (46,443 | ) |
|
|
|
|
|
|
| (64,285 | ) |
|
|
|
|
|
|
|
|
|
|
|
|
|
|
|
|
|
|
|
|
|
|
|
|
|
|
|
|
| ||||||
Total assets |
| $ | 6,426,389 |
|
|
|
|
|
|
| $ | 5,851,889 |
|
|
|
|
|
|
| $ | 6,031,800 |
|
|
|
|
|
|
|
|
|
|
|
|
|
|
|
|
|
|
|
|
|
|
|
|
|
|
|
|
|
| ||||||
|
|
|
|
|
|
|
|
|
|
|
|
|
|
|
|
|
|
|
|
|
|
|
|
|
|
|
|
|
Liabilities and Stockholder’s Equity |
|
|
|
|
|
|
|
|
|
|
|
|
|
|
|
|
|
|
|
|
|
|
|
|
|
|
|
|
Interest-bearing Liabilities: |
|
|
|
|
|
|
|
|
|
|
|
|
|
|
|
|
|
|
|
|
|
|
|
|
|
|
|
|
Interest-bearing transaction deposits |
| $ | 1,415,288 |
|
| 13,751 |
|
| 0.97 | % | $ | 1,419,077 |
|
| 18,135 |
|
| 1.28 | % | $ | 1,623,597 |
|
| 14,931 |
|
| 0.92 | % |
Time deposits |
|
| 1,843,966 |
|
| 70,659 |
|
| 3.83 | % |
| 1,778,854 |
|
| 81,223 |
|
| 4.57 | % |
| 1,545,834 |
|
| 62,807 |
|
| 4.06 | % |
Public funds |
|
| 1,046,484 |
|
| 26,642 |
|
| 2.55 | % |
| 803,589 |
|
| 33,561 |
|
| 4.18 | % |
| 771,146 |
|
| 32,354 |
|
| 4.20 | % |
|
| |||||||||||||||||||||||||||
Total interest-bearing deposits |
|
| 4,305,738 |
|
| 111,052 |
|
| 2.58 | % |
| 4,001,520 |
|
| 132,919 |
|
| 3.32 | % |
| 3,940,577 |
|
| 110,092 |
|
| 2.79 | % |
|
| |||||||||||||||||||||||||||
Customer repurchase agreements |
|
| 524,712 |
|
| 14,491 |
|
| 2.76 | % |
| 216,730 |
|
| 8,023 |
|
| 3.70 | % |
| 250,603 |
|
| 9,060 |
|
| 3.62 | % |
Other interest-bearing liabilities |
|
| 30,186 |
|
| 536 |
|
| 1.78 | % |
| 11,280 |
|
| 289 |
|
| 2.56 | % |
| 30,580 |
|
| 1,517 |
|
| 4.96 | % |
Capitalized Interest |
|
| — |
|
| (77 | ) |
| 0.00 | % |
| — |
|
| (995 | ) |
| 0.00 | % |
| — |
|
| (806 | ) |
| 0.00 | % |
|
| |||||||||||||||||||||||||||
Total interest-bearing liabilities |
|
| 4,860,636 |
|
| 126,002 |
|
| 2.59 | % |
| 4,229,530 |
|
| 140,236 |
|
| 3.32 | % |
| 4,221,760 |
|
| 119,863 |
|
| 2.84 | % |
|
| |||||||||||||||||||||||||||
Non-interest bearing: |
|
|
|
|
|
|
|
|
|
|
|
|
|
|
|
|
|
|
|
|
|
|
|
|
|
|
|
|
Demand deposits |
|
| 876,669 |
|
|
|
|
|
|
|
| 927,656 |
|
|
|
|
|
|
|
| 1,128,850 |
|
|
|
|
|
|
|
Other liabilities |
|
| 104,279 |
|
|
|
|
|
|
|
| 132,320 |
|
|
|
|
|
|
|
| 167,534 |
|
|
|
|
|
|
|
Stockholders’ equity |
|
| 584,805 |
|
|
|
|
|
|
|
| 562,383 |
|
|
|
|
|
|
|
| 513,656 |
|
|
|
|
|
|
|
|
| |||||||||||||||||||||||||||
Total liabilities & stockholders’ equity |
| $ | 6,426,389 |
|
|
|
|
| 2.17 | % | $ | 5,851,889 |
|
|
|
|
| 2.66 | % | $ | 6,031,800 |
|
|
|
|
| 2.18 | % |
|
|
|
|
|
|
|
|
|
|
|
|
|
|
| ||||||||||||||
Net interest income and margin (te) |
|
|
|
| $ | 219,889 |
|
| 3.80 | % |
|
|
| $ | 215,000 |
|
| 4.08 | % |
|
|
| $ | 232,463 |
|
| 4.23 | % |
|
|
|
|
|
|
|
|
|
|
|
|
|
|
|
|
|
|
|
|
|
|
| ||||||
Net earning assets and spread |
| $ | 933,161 |
|
|
|
|
| 3.38 | % | $ | 1,042,349 |
|
|
|
|
| 3.42 | % | $ | 1,280,795 |
|
|
|
|
| 3.57 | % |
|
|
|
|
|
|
|
|
|
|
|
|
|
|
| ||||||||||||||
*Loan interest income includes loan fees of $8.6 million, $9.2$483,000, $1.3 million and $11.1$9.0 million for each of the three years ended December 31, 2008, 2007 and 2006. Non-accrual loans in average balances and income on such loans, if recognized, is recorded on a cash basis. Tax equivalent (te) amounts are calculated using a marginal federal income tax rate of 35%.
The following table presents the change in interest income and the change in interest expense:TABLE 2. Summary of Changes in Net Interest Income (te)
- --------------------------------------------------------------------------------------------------------------------------
2006 Compared to 2005 2005 Compared to 2004
-----------------------------------------------------------------------------------
Due to Due to
Change in Total Change in Total
-------------------------- Increase ------------------------- Increase
Volume Rate (Decrease) Volume Rate (Decrease)
-----------------------------------------------------------------------------------
(In thousands)
INTEREST INCOME (te)
Loans* $14,008 $19,612 $33,620 $16,913 $11,665 $28,578
-----------------------------------------------------------------------------------
U.S. Treasury securities 2,107 379 2,486 139 193 332
U.S. agency securities 35,684 3,517 39,201 3,735 9 3,744
CMOs (3,273) (76) (3,349) (1,918) (105) (2,023)
Mortgage-backed securities 2,504 1,402 3,906 2,072 629 2,701
Obligations of states and
political subdivisions:
taxable 271 (349) (78) (29) (40) (69)
nontaxable (te) (252) (155) (407) (143) (908) (1,051)
FHLB stock and
other corporate securities 701 304 1,005 589 (15) 574
-----------------------------------------------------------------------------------
Total investment in securities 37,742 5,022 42,764 4,445 (237) 4,208
-----------------------------------------------------------------------------------
Federal funds and short-term investments 2,991 2,209 5,200 2,483 1,692 4,175
-----------------------------------------------------------------------------------
Total interest income (te) $54,741 $26,843 $81,584 $23,841 $13,120 $36,961
-----------------------------------------------------------------------------------
Interest-bearing transaction deposits $1,777 $3,951 $5,728 $149 $863 $1,012
Time deposits 15,486 6,668 22,154 4,615 983 5,598
Public funds 3,967 10,663 14,630 1,266 7,135 8,401
-----------------------------------------------------------------------------------
Total interest-bearing deposits 21,230 21,282 42,512 6,030 8,981 15,011
-----------------------------------------------------------------------------------
Customer repurchase agreements 550 4,159 4,709 324 2,118 2,442
Other interest-bearing liabilities (2,175) (2) (2,177) 65 31 96
-----------------------------------------------------------------------------------
Total interest expense $19,605 $25,439 $45,044 6,419 $11,130 $17,549
-----------------------------------------------------------------------------------
Change in net interest income (te) $35,136 $1,404 $36,540 $17,422 $1,990 $19,412
===================================================================================
|
|
|
|
|
|
|
|
|
|
|
|
|
|
|
|
|
|
|
|
TABLE 2. Summary of Changes in Net Interest Income (te) |
|
|
|
|
|
|
|
|
|
| |||||||||
| |||||||||||||||||||
|
|
|
|
|
|
|
|
|
|
|
|
|
|
|
|
|
|
|
|
|
| 2008 Compared to 2007 |
| 2007 Compared to 2006 |
| ||||||||||||||
|
| ||||||||||||||||||
|
| Due to |
| Total |
| Due to |
| Total |
| ||||||||||
|
|
|
|
|
| ||||||||||||||
|
| Volume |
| Rate |
|
| Volume |
| Rate |
|
| ||||||||
|
| ||||||||||||||||||
|
| (In thousands) |
| ||||||||||||||||
Interest Income (te) |
|
|
|
|
|
|
|
|
|
|
|
|
|
|
|
|
|
|
|
Loans |
| $ | 31,558 |
| ($ | 39,155 | ) | ($ | 7,597 | ) | $ | 30,204 |
| ($ | 3,327 | ) | $ | 26,877 |
|
|
|
|
|
|
|
|
|
|
|
|
|
|
|
|
|
|
|
|
|
U.S. Treasury securities |
|
| (622 | ) |
| (461 | ) |
| (1,083 | ) |
| (1,639 | ) |
| — |
|
| (1,639 | ) |
U.S. agency securities |
|
| (21,386 | ) |
| (3,725 | ) |
| (25,111 | ) |
| (17,270 | ) |
| (2,320 | ) |
| (19,590 | ) |
CMOs |
|
| 2,678 |
|
| 790 |
|
| 3,468 |
|
| (1,902 | ) |
| (243 | ) |
| (2,145 | ) |
Mortgage-backed securities |
|
| 24,777 |
|
| 597 |
|
| 25,374 |
|
| 2,157 |
|
| 1,720 |
|
| 3,877 |
|
Obligations of states and political subdivisions: |
|
|
|
|
|
|
|
|
|
|
|
|
|
|
|
|
|
|
|
Taxable |
|
| 25 |
|
| 447 |
|
| 472 |
|
| 684 |
|
| 155 |
|
| 839 |
|
Nontaxable (te) |
|
| (1,365 | ) |
| (566 | ) |
| (1,931 | ) |
| (528 | ) |
| (298 | ) |
| (826 | ) |
FHLB stock and other corporate securities |
|
| (634 | ) |
| (528 | ) |
| (1,162 | ) |
| (336 | ) |
| — |
|
| (336 | ) |
Total investment in securities |
|
| 3,473 |
|
| (3,446 | ) |
| 27 |
|
| (18,834 | ) |
| (986 | ) |
| (19,820 | ) |
|
|
|
|
|
|
|
|
|
|
|
|
|
|
|
|
|
|
|
|
Federal funds and short-term investments |
|
| 2,080 |
|
| (3,855 | ) |
| (1,775 | ) |
| (4,507 | ) |
| 360 |
|
| (4,147 | ) |
|
| ||||||||||||||||||
Total interest income (te) |
| $ | 37,111 |
| ($ | 46,456 | ) | ($ | 9,345 | ) | $ | 6,863 |
| ($ | 3,953 | ) | $ | 2,910 |
|
|
| ||||||||||||||||||
|
|
|
|
|
|
|
|
|
|
|
|
|
|
|
|
|
|
|
|
Interest-bearing transaction deposits |
| $ | 48 |
| $ | 4,336 |
| $ | 4,384 |
| $ | 2,060 |
| ($ | 5,264 | ) | ($ | 3,204 | ) |
Time deposits |
|
| (2,884 | ) |
| 13,448 |
|
| 10,564 |
|
| (10,112 | ) |
| (8,304 | ) |
| (18,416 | ) |
Public funds |
|
| (8,416 | ) |
| 15,335 |
|
| 6,919 |
|
| (1,356 | ) |
| 149 |
|
| (1,207 | ) |
|
| ||||||||||||||||||
Total interest-bearing deposits |
|
| (11,252 | ) |
| 33,119 |
|
| 21,867 |
|
| (9,408 | ) |
| (13,419 | ) |
| (22,827 | ) |
|
| ||||||||||||||||||
|
|
|
|
|
|
|
|
|
|
|
|
|
|
|
|
|
|
|
|
Securities sold under repurchase agreements |
|
| (8,945 | ) |
| 2,477 |
|
| (6,468 | ) |
| 1,250 |
|
| (213 | ) |
| 1,037 |
|
Other interest-bearing liabilities |
|
| (22 | ) |
| (1,143 | ) |
| (1,165 | ) |
| 1,095 |
|
| 322 |
|
| 1,417 |
|
|
| ||||||||||||||||||
Total interest expense |
|
| (20,219 | ) |
| 34,453 |
|
| 14,234 |
|
| (7,063 | ) |
| (13,310 | ) |
| (20,373 | ) |
|
| ||||||||||||||||||
|
|
|
|
|
|
|
|
|
|
|
|
|
|
|
|
|
|
|
|
Change in net interest income (te) |
| $ | 16,892 |
| ($ | 12,003 | ) | $ | 4,889 |
| ($ | 200 | ) | ($ | 17,263 | ) | ($ | 17,463 | ) |
|
| ||||||||||||||||||
Provision for Loan Losses
In 2005 Hancock established Weaknesses in residential development and rising unemployment levels in our market areas had a $35.2 millionsignificant impact on our net charge-off levels and resulted in a higher allowance for loan losses relatedin 2008 than 2007. Net charge-offs were $22.2 million, an increase of $14.9 million, or 206.3%, from 2007 to Hurricane Katrina. In 2006, Hancock reversed $20.02008. The increase was primarily reflected in our construction and land development loan segment. The construction and land development loan segment represents approximately 13.7% of Hancock’s total loan portfolio, or about $585.4 million of this related allowanceat year end 2008. The provision for loan losses due to better than expected loss experience with storm impacted credits. Net charge-offs decreased $1.7was $36.8 million in 2008, an increase of $29.2 million, or 20%384.5% from 2007. Major drivers of the overall higher level of the provision for loan losses were an increase in period-end loans of $652.9 million, or 18.2%, from 2005 to 2006December 31, 2007, continued weakness in the local and were $7.0 million for 2006.national economies, and increases in nonperforming loans and higher past dues. The provision for loan losses reflects management’s assessment of the adequacy of the allowance for loan losses to absorb probableinherent losses in the loan portfolio. The amount of provision for each period is dependent on many factors, including loan growth, net charge-offs, changes in the composition of the loan portfolio, delinquencies, identified loan impairment, management’s assessment of the loan portfolio quality, the value of collateral, as well as, overall economic factors. Hancock’sOur allowance for loan losses as a percent of period-end loans was 1.43%1.45% at December 31, 2008, an increase of 14 basis points from 1.31% at December 31, 2007.
Net charge-offs were $7.2 million for 2007, an increase of $0.2 million, or 3.1%, from 2006 to 2007. The provision for loan losses in 2007 was $7.6 million. In 2006, we reversed $20.8 million of the allowance for loan losses through the provision primarily due to better than expected loss experience with Hurricane Katrina storm impacted credits. The allowance for loan losses as a percent of period-end loans was 1.31% in 2007, a decrease of 10612 basis points from the 2.49% at December 31, 2005.1.44% in 2006.
Noninterest Income
Table 3 presents a three-year analysis of the components of noninterest income. Overall, noninterest income of $103.8$127.8 million was reported in 2006,2008, as compared to $98.3$120.7 million for 20052007 and $90.3$106.5 million for 2004.2006. This represents an increase of $5.5$7.1 million, or 6%, from 20052007 to 20062008 and an increase of $8.0$14.2 million, or 9%13%, from 20042006 to 2005. Included2007.
|
|
|
|
|
|
|
|
|
|
|
|
|
|
|
|
|
TABLE 3. Noninterest Income |
|
|
|
|
|
|
|
|
|
|
|
|
|
|
|
|
|
|
|
|
|
|
|
|
|
|
|
|
|
|
|
|
|
|
| 2008 |
| % Change |
| 2007 |
| % Change |
| 2006 |
| |||||
|
| |||||||||||||||
|
| (In thousands) |
| |||||||||||||
Service charges on deposit accounts |
| $ | 44,243 |
|
| 6 | % | $ | 41,929 |
|
| 16 | % | $ | 36,228 |
|
Trust fees |
|
| 16,858 |
|
| 6 | % |
| 15,902 |
|
| 20 | % |
| 13,286 |
|
Insurance commissions and fees |
|
| 16,554 |
|
| -14 | % |
| 19,229 |
|
| 0 | % |
| 19,248 |
|
Investment and annuity fees |
|
| 10,807 |
|
| 24 | % |
| 8,746 |
|
| 46 | % |
| 5,970 |
|
Debit card and merchant fees |
|
| 11,082 |
|
| 9 | % |
| 10,126 |
|
| 8 | % |
| 9,365 |
|
ATM fees |
|
| 6,856 |
|
| 15 | % |
| 5,983 |
|
| 12 | % |
| 5,338 |
|
Secondary mortgage market operations |
|
| 2,977 |
|
| -20 | % |
| 3,723 |
|
| 6 | % |
| 3,528 |
|
Other fees and income |
|
| 13,576 |
|
| -8 | % |
| 14,740 |
|
| 8 | % |
| 13,622 |
|
Net storm-related gains |
|
| — |
|
| N/M | * |
| — |
|
| N/M | * |
| 5,084 |
|
Securities gains/(losses) |
|
| 4,825 |
|
| N/M | * |
| 308 |
|
| N/M | * |
| (5,169 | ) |
|
| |||||||||||||||
Total non-interest income |
| $ | 127,778 |
|
| 6 | % | $ | 120,686 |
|
| 13 | % | $ | 106,500 |
|
|
| |||||||||||||||
*Not meaningful
Noninterest income increased $7.1 million, or 6%, when comparing 2008 to 2007. Increases were experienced in noninterest income in 2006service charges on deposit accounts, trust fees, investment and 2005 are net storm-related gains of $5.1annuity fees, debit card and $6.6 million, respectively. These represent gains on involuntary conversions of assets lost in Hurricane Katrina for which insurance proceeds had been received net of certain direct costs. Excluding the impact of net storm-related gainsmerchant fees, ATM fees, and securities transactions, noninterest income for 2006 was $103.9 million compared to noninterest income in 2005 of $91.7 million. This represents an increase of $12.2 million, or 13% as compared to 2005. During 2004, Hancock sold four Louisiana branches at a $2.3 million pre-tax gain and also sold its credit card merchant services business at a pre-tax gain of $3.0 million.
secondary mortgage market operations decreased $0.7 million, or 20%.TABLE 3. Noninterest Income - --------------------------------------------------------------------------------------------------------------------------- 2006 % Change 2005 % Change 2004 ------------------------------------------------------------------------(In thousands)gains/(losses). Service charges on deposit accounts$36,228 4% $34,773 -20% $43,631increased $2.3 million, or 6%, when compared to 2007, due to a $1.3 million increase in overdraft fees as a result of an increase in rate per item, effective January 1, 2008, in addition to the increase in period-end deposits of $921 million in 2008. Trustfees 13,286 20% 11,107 23% 9,030fee income increased $1.0 million, or 6%, when compared to the previous year. Investment and annuity fees5,970 18% 5,076 121% 2,295 Insurance commissions and fees 19,246 13% 17,099 86% 9,193increased $2.1 million, or 24%, from 2007 to 2008 due to an increase in annuity sales to customers from our subsidiary, Hancock Investment Services. Debit card and merchant fees7,298 50% 4,878 14% 4,271increased $1.0 million or 9% and ATM fees5,005 19% 4,202 -7% 4,512 Secondary mortgage market operations 3,528 59% 2,221 -24% 2,934increased $0.9 million or 15% due to an increase in customers. Securities gains increased $4.5 million in 2008. For additional information on securities activity, see Note 2 of Notes to the Consolidated Financial Statements. Insurance commissions and fees decreased $2.7 million or 14%, mainly due to our subsidiary Magna Insurance Company’s reduction of the annuity business which was accelerated with the 1035 exchange program promoted in the fourth quarter of 2007. Other fees and income13,357decreased $1.2 million, or 8%12,382 38% 8,994 ------------------------------------------------------------------------ Total recurring non-interest income 103,918 13% 91,738 8% 84,860 Net storm-related gains 5,084 -23% 6,584 N/M* - Gains on sales of branches, andcredit card merchant service business - - - - 5,258 Securities gains/(losses) (5,169) N/M* (53) -133% 163 ------------------------------------------------------------------------ Total noninterest income $103,833 6% $98,269 9% $90,281 ======================================================================== *Not meaningful
Increases in noninterest income, when comparing 20062007 to 2005,2006, were experienced in service charges on deposit accounts, trust fees, investment and annuity fees, insurance commissions and fees, debit card and merchant fees, insurance commissionATM fees, secondary mortgage market operations, and other fees and serviceincome. Service charges on deposit accounts.accounts increased $5.7 million, or 16%, when compared to 2006. This was caused by service charge fee increases in 2007 on consumer and business accounts and an increase in accounts from the expanding Alabama market. Trust fee income increased $2.2$2.6 million, or 20%, when compared to the previous year as a result of increases in the value of assets under care (either managed or in custody). Debit card and merchant fees increased $2.4 million, or 50%, from 2005 to 2006 and there were higher levels of insurance commissions and fees (up $2.1 million or 13%). Securities losses increased $5.1 million from losses of $53,000 in 2005 to losses of $5.2 million in 2006.
Considerable increases in noninterest income, when comparing 2005 to 2004, were experienced in trust fees, investment and annuity fees, insurance commission fees, and other fees and income. Smaller increases were also experienced in debit card and merchant fees. Significantly offsetting the increased noninterest income when compared to 2004 were decreases in service charges on deposit accounts principally due to waived return item fees and other service charges as a result of accommodations to customers impacted by Hurricane Katrina along with changes in customer behavior since many had significant cash available from insurance proceeds.
Trust fee income for 2005 increased $2.1 million, or 23%, when compared to 2004 as a result of increases in the value of asset under care (either managed or in custody). Investment and annuity fees increased $2.8 million, or 121%46%, from 20042006 to 2005. Higher2007 and there were higher levels of insurance commissions and fees (up $7.9 million or 86%) were mostly related to higher revenues associated with Magna Insurance Company, our wholly owned insurance company. In addition, on July 1, 2005 the Company acquired J. Everett Eaves, Inc. a property and casualty insurance agency, as a division of Hancock Insurance Agency. Otherother fees and income increased $3.4(up $1.1 million or 38%, from 2004 to 2005, primarily due to $1.1 million of non refundable purchase option income on real estate.8%).
Service charges on deposit accounts decreased $8.9 million, or 20%, when comparing 2005 to 2004, primarily due to aforementioned waived return items and other service charges resulting from the impact of Hurricane Katrina. The level of ATM fees decreased from 2004 to 2005 by $310,000, or 7%, due to decreased volume. Secondary mortgage market operations income decreased $713,000, or 24%, compared to 2004 primarily due to the reversal during 2004 of an $850,000 mortgage servicing rights valuation allowance that had been previously established. Securities transactions gains/losses declined by $216,000, or 133%, from gains of $163,000 in 2004 to losses of $53,000 in 2005.
Table 4 presents an analysis of the components of noninterest expense for the years 2006, 20052008, 2007 and 2004. Hancock’s2006. The level of operating expenses increased $29.2decreased $3.3 million, or 17%2%, from 20052007 to 20062008 and $16.6increased $13.6 million, or 11%7%, from 20042006 to 2005.2007.
TABLE 4. Noninterest Expense - ---------------------------------------------------------------------------------------------------------------------------- 2006 % Change 2005 % Change 2004 ------------------------------------------------------------------------------(In thousands) Employee compensation $84,569 10% $76,602 11% $68,910 Employee benefits 19,184 9% 17,556 0% 17,494 ------------------------------------------------------------------------------ Total personnel expense 103,753 10% 94,158 9% 86,404 Equipment and data processing expense 21,301 23% 17,358 0% 17,287 Net occupancy expense 13,350 22% 10,926 10% 9,915 Postage and communications 9,649 23% 7,820 -4% 8,152 Ad valorem and franchise taxes 3,346 -7% 3,607 112% 1,699 Legal and professional services 14,994 44% 10,429 25% 8,322 Printing and supplies 1,997 12% 1,787 5% 1,702 Amortization of intangible assets 2,125 -3% 2,194 13% 1,945 Advertising 6,642 27% 5,232 22% 4,292 Deposit insurance and regulatory fees 946 16% 814 -4% 844 Training
TABLE 4. Noninterest Expense
2008
% Change
2007
% Change
2006
(In thousands)
Employee compensation
$
88,670
5
%
$
84,654
0
%
$
84,569
Employee benefits
21,103
-5
%
22,305
16
%
19,184
Total personnel expense
109,773
3
%
106,959
3
%
103,753
Equipment and data processing expense
29,424
5
%
28,050
13
%
24,729
Net occupancy expense
19,538
1
%
19,435
46
%
13,350
Postage and communications
9,454
-10
%
10,453
8
%
9,649
Ad valorem and franchise taxes
3,532
1
%
3,514
5
%
3,346
Legal and professional services
12,718
-17
%
15,234
9
%
13,968
Printing and supplies
1,833
-19
%
2,252
13
%
1,997
Amortization of intangible assets
1,432
-13
%
1,651
-22
%
2,125
Advertising
6,917
-2
%
7,032
6
%
6,642
Deposit insurance and regulatory fees
2,851
174
%
1,039
10
%
946
Training expenses
655
0
%
656
16
%
564
Other real estate owned expense/(income)
917
285
%
(497
)
27
%
(390
)
Other expense
14,399
-31
%
20,965
-7
%
22,437
Total noninterest expense
$
213,443
-2
%
$
216,743
7
%
$
203,116
In 2008, operating expenses
564 57% 359 -13% 412 Other real estate owned expense/(income) (390) 178% (140) -127% 514 Other expense 22,439 32% 16,999 26% 13,463 ------------------------------------------------------------------------------ Total noninterest expense $200,716 17% $171,543 11% $154,951 ==============================================================================
decreased $3.3 million, or 2%, over 2007. The significant factors driving the increasedecrease in operating expenses from 20052007 to 2006 included an increase2008 include a decrease in personnel expenselegal and professional services ($9.62.5 million, or 17%) caused primarily by the decrease in commissions for Magna with the reduction of the annuity business, postage and communications ($1.0 million, or 10%), net occupancyprinting and supplies expense ($2.40.4 million, or 22%19%), legal and professional servicesamortization of intangible assets ($4.50.2 million, or 44%13%),. Other expense also decreased $6.6 million, or 31% over 2007, mainly due to our VISA litigation entries, accruing $2.5 million in 2007 and reversing $1.5 million in 2008, and our subsidiary Magna Insurance Company’s reduction of the annuity business which was accelerated with the 1035 exchange program. These decreases were offset primarily by increases in equipment and data processing expense ($3.91.4 million, or 23%5%), postage due to increases in personnel support to grow deposits and communicationloans; total personnel expense ($2.8 million, or 3%) increased to grow deposits and loans; deposit and regulatory fees ($1.8 million, or 23%174%) due to changes in FDIC insurance assessment rates that became effective in 2007, where the 2007 assessment was offset by a one-time credit from the FDIC; and advertisingother real estate owned expense ($1.4 million, or 27%285%). due to an increase in maintenance for the growth in foreclosed assets in 2008 caused by the ongoing recession.
In 2005,2007, operating expenses increased $16.6$13.6 million, or 11%7%, over 2004.2006. Increases were reflected in personnelnet occupancy expense ($7.86.1 million, or 46%) due to reoccupying One Hancock Plaza, our corporate headquarters, in 2007, the opening of our data center and the opening of new branches, legal and professional services ($1.3 million, or 9%), net occupancypersonnel expense ($1.03.2 million, or 10%3%), legal and professional servicesequipment and data processing expense ($2.13.3 million, or 25%), ad valorem and franchise taxes ($1.9 million, or 112%), amortization of intangible assets ($249,000, or 13%), and other expenses ($3.5 million, or 26%).
Income Taxes
Income tax expense was $21.6 million in 2008, $27.9 million in 2007 and $46.5 million in 2006, $18.9 million in 2005 and $26.6 million in 2004.2006. Income tax expense increased because of the higherdecreased due to a lower level of pretax income in 2006.2008. Our effective income tax rate continues to be less than the statutory rate of 35%, due primarily to tax-exempt interest income and tax credits. The effective tax rates for 2008, 2007 and 2006 2005were 25%, 27% and 2004 were 31%, 26% and 30%, respectively. The 5% increase2% decrease in Hancock’sour effective tax rate was due primarily to the decreaseincrease in the percentage of tax-exempt income as it relates to pre-tax book income. We expect
SEGMENT REPORTING
See Note 16 to our effective tax rate to be approximately 31% for 2007.
Hancock’s primary segments are geographically divided into the Mississippi (MS), Louisiana (LA) and Florida (FL) markets. Each segment offers the same products and services but is managed separately due to different pricing, product demand, and consumer markets. Each segment offers commercial, consumer and mortgage loans and deposit services. In the following table, the column “Other” includes our additional consolidated subsidiaries: Hancock Investment Services, Inc., Hancock Insurance Agency, Inc., Harrison Finance Company, Magna Insurance Company, and three real estate corporations owning land and buildings that house bank branches and other facilities. Following is selected information for Hancock’s segments:
TABLE 5. Segment Reporting - ---------------------------------------------------------------------------------------------------------------------------------- Year Ended December 31, 2006 ------------------------------------------------------------------------------------------MS LA FL Other EliminationsConsolidated-------------- ----------- ------------ ----------- ------------ ------------ (In thousands) Interest income $ 193,698 $ 136,844 $ 8,108 $ 20,270 $ (14,590) $ 344,330 Interest expense 72,154 52,833 2,934 6,103 (14,161) 119,863 -------------- ----------- ------------ ----------- ------------ ------------ Net interest income 121,544 84,011 5,174 14,167 (429) 224,467 Provision (recovery) for loan losses (19,811) (4,446) 834 2,661 - (20,762) Noninterest income 47,844 29,782 346 25,966 (105) 103,833 Depreciation and amortization 6,986 2,611 319 527 - 10,443 Other noninterest expense 89,978 61,688 5,172 33,479 (44) 190,273 -------------- ----------- ------------ ----------- ------------ ------------ Income before income taxes 92,235 53,940 (805) 3,466 (490) 148,346 Income tax expense (benefit) 23,074 24,035 (603) (796) 834 46,544 -------------- ----------- ------------ ----------- ------------ ------------ Net income (loss) $ 69,161 $ 29,905 $ (202) $ 4,262 $ (1,324) $ 101,802 ============== =========== ============ =========== ============ ============ Total assets $ 3,454,274 $2,365,422 $158,836 $ 807,912 $(821,879) $5,964,565 Total interest income from affiliates $ 13,895 $ 6 $ 260 $ - $ (14,161) $ - Total interest income from external customers $ 179,803 $ 136,838 $ 7,848 $ 20,270 $ (429) $ 344,330 (Amortization) & accretion of securities $ 10,287 $ 1,123 $ (51) $ (59) $ - $ 11,300
TABLE 5. Segment Reporting (continued) - ------------------------------------------------------------------------------------------------------------------------ Year Ended December 31, 2005 -------------------------------------------------------------------------MS LA FL Other Eliminations Consolidated ----------- ----------- --------- --------- ------------ ------------(In thousands) Interest income $ 140,583 $ 109,248 $ 6,563 $ 17,037 $ (9,800) $ 263,631 Interest expense 45,392 33,184 1,796 3,902 (9,455) 74,819 ----------- ----------- --------- --------- ------------ ------------ Net interest income 95,191 76,064 4,767 13,135 (345) 188,812 Provision for loan losses 24,744 14,836 494 2,561 - 42,635 Noninterest income 46,197 28,061 476 23,671 (135) 98,270 Depreciation and amortization 5,299 2,467 453 498 - 8,717 Other noninterest expense 73,725 56,065 4,349 28,819 (131) 162,827 ----------- ----------- --------- --------- ------------ ------------ Income before income taxes 37,620 30,757 (53) 4,928 (349) 72,903 Income tax expense (benefit) 16,673 (191) 170 2,260 (41) 18,871 ----------- ----------- --------- --------- ------------ ------------ Net income (loss) $ 20,947 $ 30,948 $ (223) $ 2,668 $ (308) $ 54,032 =========== =========== ========= ========= ============ ============ Total assets $3,546,748 $2,138,894 $ 122,845 $ 697,548 $ (555,848) $5,950,187 Total interest income from affiliates $ 9,334 $ - $ 121 $ - $ (9,455) $ - Total interest income from external customers $ 131,249 $ 109,248 $ 6,442 $ 17,037 $ (345) $ 263,631 (Amortization) & accretion of securities $ (477) $ (1,228) $ (81) $ (61) $ - $ (1,847)Year Ended December 31, 2004 ------------------------------------------------------------------------- MS LA FL Other Eliminations Consolidated ----------- ----------- --------- --------- ------------ ------------(In thousands) Interest income $ 120,197 $ 91,148 $ 3,089 $ 17,189 $ (4,849) $ 226,774 Interest expense 37,953 20,385 922 2,581 (4,571) 57,270 ----------- ----------- --------- --------- ------------ ------------ Net interest income 82,244 70,763 2,167 14,608 (278) 169,504 Provision for loan losses 5,564 6,429 928 3,616 - 16,537 Noninterest income 39,894 33,255 445 19,084 (2,397) 90,281 Depreciation and amortization 5,879 2,648 67 563 - 9,157 Other noninterest expense 67,370 51,348 3,047 24,157 (128) 145,794 ----------- ----------- --------- --------- ------------ ------------ Income before income taxes 43,325 43,593 (1,430) 5,356 (2,547) 88,297 Income tax expense (benefit) 12,808 13,213 (547) 1,913 (794) 26,593 ----------- ----------- --------- --------- ------------ ------------ Net income (loss) $ 30,517 $ 30,380 $ (883) $ 3,443 $ (1,753) $ 61,704 =========== =========== ========= ========= ============ ============ Total assets $2,628,221 $1,895,832 $ 88,070 $703,844 $(651,241) $4,664,726 Total interest income from affiliates $ 4,496 $ - $ 75 $ - $ (4,571) $ - Total interest income from external customers $ 115,701 $ 91,148 $ 3,014 $ 17,189 $ (278) $ 226,774 (Amortization) & accretion of securities $ (2,579) $ (2,795) $ (46) $ (44) $ - $ (5,464)
Financial Statements included elsewhere in this report.
BALANCE SHEET ANALYSIS
Securities Available for Sale
Hancock’s Our investment in securities was $1.90$1.68 billion at December 31, 2006,2008, compared to $1.96$1.67 billion at December 31, 2005.2007. At December 31, 2006 and 2005, the composition2008, 99.87% of the securities portfolio was 100%comprised of securities classified as available for sale, and0.13% of the securities were classified as trading while none were classified as held to maturity. At December 31, 2007, 88.18% of the portfolio was comprised of securities classified as available for sale, 11.82% of the securities were classified as trading while none were classified as held to maturity. Average investment securities were $2.23$1.74 billion for 20062008 as compared to $1.43$1.73 billion for 2005.2007.
During 2005, securities classified as held to maturity in the portfolio of one of Hancock’s subsidiaries were sold. A determination was made that this action tainted the investment portfolio of the entire company. As a result of this action and determination, all securities held by us have been reclassified to available for sale and the carrying value of those securities are adjusted to market as prescribed in Statement of Financial Accounting Standard (SFAS) No. 115,Accounting for Certain Investments in Debt and Equity Securities.
The vast majority of securities in the Banks’ portfoliosour portfolio are fixed rate and there were no investments in securities of a single issuer, other than U.S. Treasury and U.S. Governmentgovernment agency securities and mortgage-backed securities issued or guaranteed by U.S. government agencies that exceeded 10% of stockholders’ equity. At December 31, 2006,2008, the average lifematurity of the portfolio was 3.571.56 years with an effective duration of 2.045.03 and an average yield of 4.56%2.74%.
Hancock’s Our securities portfolio is an important source of liquidity and earnings for us. A stated objective in managing the securities portfolio is to provide consistent liquidity to support balance sheet growth but also to provide a safe and consistent stream of earnings. To that end, management is open to opportunities that present themselves which enables us to improve the structure and earnings potential of the securities portfolio. During the fourth quarter, the current economic environment, the slope of the yield curve and the expectations of future interest rate movements presented Hancock with an opportunity to sell $162.9 million in certain U.S. Agency securities. The bonds were sold at a pretax book loss of $5.5 million and had a book yield of 3.81 percent. The proceeds were immediately reinvested in a combination of federal funds and other short-term instruments. We have no intention and do not expect to incur any other significant security sales in the immediate future. The net securities losses in 2006 of $5.2 million were composed primarily of the aforementioned $5.5 million bond loss. We recorded net securities losses during 2005 of $53,000 and net securities gains in 2004 of $163,000.
The amortized costs of securities classified as available for sale and trading at December 31, 2006, 20052008, 2007 and 2004,2006, were as follows (in thousands):
TABLE 6. Securities by Type - -------------------------------------------------------------------------------------------- Years Ended December 31, --------------------------------------------------- 2006 2005 2004 ------------- --------------- ---------------U.S. Treasury $ 60,231 $ 50,883 $ 9,985 U.S. government agencies 1,016,811 1,029,656 413,419 Municipal obligations 200,891 165,180 60,956 Mortgage-backed securities 443,410 484,131 352,510 CMOs 116,161 194,899 263,471 Other debt securities 44,664 48,476 7,056 Equity securities 34,677 7,520 11,225 ------------- --------------- --------------- $ 1,916,845 $ 1,980,745 $ 1,118,622 ============= =============== ===============
|
|
|
|
|
|
|
|
|
|
|
TABLE 5. Securities by Type |
|
|
|
|
|
|
|
|
|
|
|
|
|
|
|
|
|
|
|
|
|
|
| Years Ended December 31, |
| |||||||
|
|
| ||||||||
|
| 2008 |
| 2007 |
| 2006 |
| |||
|
|
|
|
| ||||||
Available for sale securities |
|
|
|
|
|
|
|
|
|
|
U.S. Treasury |
| $ | 11,250 |
| $ | 11,353 |
| $ | 60,231 |
|
U.S. government agencies |
|
| 224,803 |
|
| 431,772 |
|
| 1,016,811 |
|
Municipal obligations |
|
| 151,706 |
|
| 197,596 |
|
| 200,891 |
|
Mortgage-backed securities |
|
| 1,041,805 |
|
| 637,578 |
|
| 443,410 |
|
CMOs |
|
| 195,771 |
|
| 143,639 |
|
| 116,161 |
|
Other debt securities |
|
| 25,117 |
|
| 49,653 |
|
| 44,664 |
|
Equity securities |
|
| 1,047 |
|
| 959 |
|
| 26,176 |
|
|
|
|
|
| ||||||
|
| $ | 1,651,499 |
| $ | 1,472,550 |
| $ | 1,908,344 |
|
|
|
|
|
| ||||||
|
|
|
|
|
|
|
|
|
|
|
|
| Years Ended December 31, |
| |||||||
|
|
| ||||||||
|
| 2008 |
| 2007 |
| 2006 |
| |||
|
|
|
|
| ||||||
Trading securities |
|
|
|
|
|
|
|
|
|
|
U.S. government agencies |
|
| — |
|
| 69,793 |
|
| — |
|
Mortgage-backed securities |
|
| — |
|
| 125,387 |
|
| — |
|
Equity securities |
|
| 2,201 |
|
| 2,245 |
|
| — |
|
|
|
|
|
| ||||||
|
| $ | 2,201 |
| $ | 197,425 |
| $ | — |
|
|
|
|
|
| ||||||
The amortized cost, yield and fair value of debt securities classified as available for sale at December 31, 2006,2008, by contractual maturity, were as follows (amounts in thousands):
TABLE 7. Securities Maturities by Type - --------------------------------------------------------------------------------------------------------------------------- Over One Over Five One Year Year Years Over Weighted or Through Through Ten Fair Average Less Five Years Ten Years Years Total Value Yield ----------- ------------ ----------- ---------- ------------- ------------- -----------U.S. Treasury $ 59,032 $ 799 $ 400 $ - $ 60,231 $ 60,191 4.98% U.S. government agencies 567,771 276,537 171,371 1,132 1,016,811 1,010,929 4.89% Municipal obligations 28,211 122,757 42,065 7,858 200,891 204,017 4.61% Other debt securities 930 7,717 25,608 10,409 44,664 44,020 5.73% ----------- ----------- ----------- ---------- ------------- ------------- $ 655,944 $ 407,810 $ 239,444 $ 19,399 $ 1,322,597 $ 1,319,157 4.88% =========== =========== =========== ========== ============= ============= Fair Value $ 654,732 $ 406,557 $ 238,429 $ 19,439 $ 1,319,157 =========== =========== =========== ========== ============= Weighted Average Yield 4.92% 4.80% 4.85% 5.19% 4.88% Mortgage-backed securities & CMOs $ 559,571 $ 548,597 4.95% ============= =============
|
|
|
|
|
|
|
|
|
|
|
|
|
|
|
|
|
|
|
|
|
|
|
TABLE 6. Securities Maturities by Type |
|
|
|
|
|
|
|
|
|
|
|
|
|
|
|
| ||||||
|
|
|
|
|
|
|
|
|
|
|
|
|
|
|
|
|
|
|
|
|
|
|
|
| One Year |
| Over One |
| Over Five |
| Over |
| Total |
| Fair |
| Weighted |
| |||||||
|
|
|
|
|
|
|
|
| ||||||||||||||
Available for sale |
|
|
|
|
|
|
|
|
|
|
|
|
|
|
|
|
|
|
|
|
|
|
U.S. Treasury |
| $ | 10,328 |
| $ | 613 |
| $ | 309 |
| $ | — |
| $ | 11,250 |
| $ | 11,442 |
|
| 1.82 | % |
U.S. government agencies |
|
| 20,192 |
|
| 54,300 |
|
| 150,260 |
|
| 51 |
|
| 224,803 |
|
| 226,610 |
|
| 4.45 | % |
Municipal obligations |
|
| 16,805 |
|
| 62,265 |
|
| 46,059 |
|
| 26,577 |
|
| 151,706 |
|
| 152,470 |
|
| 4.67 | % |
Other debt securities |
|
| 1,410 |
|
| 12,480 |
|
| 8,810 |
|
| 2,417 |
|
| 25,117 |
|
| 22,272 |
|
| 4.97 | % |
|
|
|
|
|
|
|
|
|
|
| ||||||||||||
|
| $ | 48,735 |
| $ | 129,658 |
| $ | 205,438 |
| $ | 29,045 |
| $ | 412,876 |
| $ | 412,794 |
|
| 4.50 | % |
|
|
|
|
|
|
|
|
|
|
| ||||||||||||
|
|
|
|
|
|
|
|
|
|
|
|
|
|
|
|
|
|
|
|
|
|
|
Fair Value |
| $ | 49,190 |
| $ | 132,290 |
| $ | 204,412 |
| $ | 26,902 |
| $ | 412,794 |
|
|
|
|
|
|
|
|
|
|
|
|
|
|
|
|
|
|
|
| ||||||||||
|
|
|
|
|
|
|
|
|
|
|
|
|
|
|
|
|
|
|
|
|
|
|
Weighted Average Yield |
|
| 2.94 | % |
| 4.15 | % |
| 5.04 | % |
| 4.82 | % |
| 4.50 | % |
|
|
|
|
|
|
|
|
|
|
|
|
|
|
|
|
|
|
|
|
|
|
|
|
|
|
|
|
|
Other Equity Securities |
|
|
|
|
|
|
|
|
|
|
|
|
| $ | 1,047 |
| $ | 1,379 |
|
| N/A |
|
Mortgage-backed securities & CMOs |
|
|
|
|
|
|
|
|
|
|
|
|
|
| 1,237,576 |
|
| 1,265,583 |
|
| 5.21 | % |
|
|
|
|
|
|
|
|
|
|
|
|
|
|
|
|
|
|
| ||||
Total available for sale securities |
|
|
|
|
|
|
|
|
|
|
|
|
| $ | 1,651,499 |
| $ | 1,679,756 |
|
| 5.03 | % |
|
|
|
|
|
|
|
|
|
|
|
|
|
|
|
|
|
|
| ||||
Trading securities |
|
|
|
|
|
|
|
|
|
|
|
|
| $ | 2,201 |
| $ | 2,201 |
|
| N/A |
|
|
|
|
|
|
|
|
|
|
|
|
|
|
|
|
|
|
|
| ||||
Federal Funds Sold and Short-term Investments
The Company held $175.2 million in federal funds sold in 2008, an increase of $57.4 million from 2007. In the fourth quarter of 2008, the Company purchased a total of $365 million in agency discount notes that all mature in 2009. The Company did this primarily for liquidity and to use these investments as collateral for public fund deposit and customer repos.
Loan Portfolio
We experienced an increase in loan growth during 20062008 as our efforts to generate loan volume continue. Average loans were $3.9 billion in 2008, an increase of $445.9 million, or 13.0%, over 2007. As indicated by Table 8,7, commercial and real estate loans increased $182.4$317.4 million, or 12%15.3%, from 2005.2007. Included in this category are commercial real estate loans, which are secured by properties, used in commercial or industrial operations. We originate commercial and real estate loans to a wide variety of customers in many different industries and, as such, no single industry concentrations existed at December 31, 2006.2008.
Mortgage loans of $418.3$418.1 million were $6.4$32.6 million, or 2%8.5%, lower than in 2005.2007. We originate both fixed-rate and adjustable-rate mortgage loans. Certain types of mortgage loans are sold in the secondary mortgage market, while Hancock retains other types. HancockWe also originatesoriginate home equity loans. This product offers customers the opportunity to leverage rising home values and equity, when the market allows, to obtain tax-advantaged consumer financing.
Direct consumer loans, which include loans and revolving lines of credit made directly to consumers, were down $30.7up $48.6 million, or 6%9.9%, from 2005.2007. We also originate indirect consumer loans, which consist primarily of consumer loans originated through third parties such as automobile dealers or other point-of-sale channels.
Indirect consumer loans of $349.5$406.0 million for 20062008 were up $20.8$36.8 million, or 6%10.0%, from 2005. Hancock owns2007. We own a finance company subsidiary, which originates both direct and indirect consumer loans. Finance company loans increased approximately $13$10.5 million, or 21%10.0%, at December 31, 2006,2008, compared to the subsidiary’s outstanding loans on December 31, 2005.2007. The loan growth in the finance company was mainly due to continued growth in direct consumer loans.
The following table shows average loan growth for the three-year period ended December 31, 2006:
TABLE 8. Average Loans
- -----------------------------------------------------------------------------------------------------------------------------------
2006 2005 2004
---------------------------------------------------------------------------------------------------------
Balance TE Yield Mix Balance TE Yield Mix Balance TE Yield Mix
(In thousands)
Commercial & R.E. Loans $1,747,816 7.21% 57.0% $1,565,369 6.40% 54.3% $1,372,014 5.65% 52.8%
Mortgage loans 418,273 5.93% 13.7% 424,654 5.56% 14.7% 392,028 5.68% 15.1%
Direct consumer loans 470,942 8.17% 15.4% 501,677 7.51% 17.4% 489,040 7.25% 18.8%
Indirect consumer loans 349,518 6.21% 11.4% 328,679 5.91% 11.4% 288,005 6.03% 11.1%
Finance company loans 75,673 19.98% 2.5% 62,640 19.03% 2.2% 58,474 18.88% 2.2%
----------------------------------- ---------------------------------- --------------------------------
Total average loans
(net of unearned) $3,062,222 7.68% 100.0% $2,883,020 6.99% 100.0% $2,599,561 6.65% 100.0%
=================================== ================================== ================================2008:
|
|
|
|
|
|
|
|
|
|
|
|
|
|
|
|
|
|
|
|
|
|
|
|
|
|
|
|
|
TABLE 7. Average Loans |
|
|
|
|
|
|
|
|
|
|
|
|
|
|
|
|
|
|
|
|
|
|
| |||||
|
|
|
|
|
|
|
|
|
|
|
|
|
|
|
|
|
|
|
|
|
|
|
|
|
|
|
|
|
|
| 2008 |
| 2007 |
| 2006 |
| |||||||||||||||||||||
|
| |||||||||||||||||||||||||||
|
| Balance |
| TE Yield |
| Mix |
| Balance |
| TE Yield |
| Mix |
| Balance |
| TE Yield |
| Mix |
| |||||||||
|
| (In thousands) |
| |||||||||||||||||||||||||
Commercial & R.E. Loans |
| $ | 2,393,856 |
|
| 6.00 | % |
| 61.8 | % | $ | 2,076,429 |
|
| 7.37 | % |
| 60.6 | % | $ | 1,747,816 |
|
| 7.21 | % |
| 57.0 | % |
Mortgage loans |
|
| 418,133 |
|
| 5.93 | % |
| 10.8 | % |
| 385,568 |
|
| 5.90 | % |
| 11.2 | % |
| 418,273 |
|
| 5.93 | % |
| 13.7 | % |
Direct consumer loans |
|
| 540,885 |
|
| 6.73 | % |
| 13.9 | % |
| 492,298 |
|
| 8.03 | % |
| 14.4 | % |
| 470,942 |
|
| 8.17 | % |
| 15.4 | % |
Indirect consumer loans |
|
| 405,964 |
|
| 6.81 | % |
| 10.5 | % |
| 369,147 |
|
| 6.68 | % |
| 10.8 | % |
| 349,518 |
|
| 6.21 | % |
| 11.4 | % |
Finance company loans |
|
| 115,070 |
|
| 18.53 | % |
| 3.0 | % |
| 104,567 |
|
| 19.89 | % |
| 3.0 | % |
| 75,673 |
|
| 19.98 | % |
| 2.5 | % |
|
| |||||||||||||||||||||||||||
Total average loans (net of unearned) |
| $ | 3,873,908 |
|
| 6.57 | % |
| 100.0 | % | $ | 3,428,009 |
|
| 7.64 | % |
| 100.0 | % | $ | 3,062,222 |
|
| 7.68 | % |
| 100.0 | % |
|
| |||||||||||||||||||||||||||
The following table sets forth, for the periods indicated, the composition of our loan portfolio:TABLE 9. Loans Outstanding by Type
- ---------------------------------------------------------------------------------------------------------------------------
Loan Portfolio
Years Ended December 31,
--------------------------------------------------------------------------------
2006 2005 2004 2003 2002
------------- ------------- --------------- ------------- -------------
(In thousands)
Real estate:
Residential mortgages 1-4 family $ 714,126 $ 703,769 $ 713,266 $ 645,123 $ 539,808
Residential mortgages multifamily 69,296 40,678 25,544 22,803 20,305
Home equity lines/loans 133,540 133,823 134,405 110,634 86,609
Construction and development 534,460 391,194 296,114 235,049 197,166
Nonresidential 666,593 609,647 595,013 536,389 445,733
Commercial, industrial and other 551,483 546,635 437,670 395,678 346,808
Consumer 530,756 512,549 496,926 463,642 434,407
Lease financing and depository institutions 69,487 48,007 44,357 34,388 29,565
Credit cards and other revolving credit 14,262 14,316 16,970 15,437 14,085
------------- ------------- --------------- ------------- -------------
3,284,003 3,000,618 2,760,265 2,459,143 2,114,486
Less, unearned income 17,420 11,432 11,705 10,499 9,504
------------- ------------- --------------- ------------- -------------
Net loans $ 3,266,583 $2,989,186 $ 2,748,560 $ 2,448,644 $ 2,104,982
============= ============= =============== ============= =============
TABLE 8. Loans Outstanding by Type
Loan Portfolio
Years Ended December 31,
2008
2007
2006
2005
2004
(In thousands)
Real estate:
Residential mortgages 1-4 family
$
772,170
$
705,566
$
702,772
$
685,681
$
701,913
Residential mortgages multifamily
65,979
53,442
69,296
40,678
25,544
Home equity lines/loans
312,598
214,528
133,540
133,823
134,405
Construction and development
586,830
628,037
534,460
391,194
296,114
Nonresidential
943,105
731,318
666,593
609,647
595,013
Commercial, industrial and other
884,102
627,015
551,484
546,635
437,670
Consumer
611,036
564,869
525,164
506,418
478,150
Lease financing and depository institutions
72,571
72,717
69,487
48,007
44,357
Credit cards and other revolving credit
15,933
15,391
14,262
14,316
16,970
4,264,324
3,612,883
3,267,058
2,976,399
2,730,136
Less, unearned income
14,859
16,326
17,420
11,432
11,705
Net loans
$
4,249,465
$
3,596,557
$
3,249,638
$
2,964,967
$
2,718,431
The following table sets forth, for the periods indicated, the approximate contractual maturity by type of the loan portfolio:
TABLE 10. Loans Maturities by Type - ------------------------------------------------------------------------------------------------------ December 31, 2006 Maturity Range After One Within Through After Five One Year Five Years Years Total -----------------------------------------------------------------------(In thousands) Commercial, industrial and other $ 246,010 $ 217,470 $ 88,003 $ 551,483 Real estate - construction 336,599 158,466 39,395 534,460 All other loans 289,354 1,054,496 854,210 2,198,060 ---------------- --------------- --------------- ---------------- Total loans $ 871,963 $ 1,430,432 $ 981,608 $ 3,284,003 ================ =============== =============== ================
TABLE 9. Loans Maturities by Type
December 31, 2008
Maturity Range
Within
One Year
After One
Through
Five Years
After Five
Years
Total
(In thousands)
Commercial, industrial and other
$
352,770
$
271,343
$
257,037
$
881,150
Real estate - construction
324,705
222,952
44,077
591,734
All other loans
333,536
1,290,795
1,167,109
2,791,440
Total loans
$
1,011,011
$
1,785,090
$
1,468,223
$
4,264,324
The sensitivity to interest rate changes of that portion of
Hancock'sour loan portfolio that matures after one year is shown below:TABLE 11. Loans Sensitivity to Changes in Interest Rates - ----------------------------------------------------------------------------------------------------------------- December 31, 2006 --------------------(In thousands) Commercial, industrial, and real estate construction maturing after one year: Fixed rate $ 379,896 Floating rate 123,438 Other loans maturing after one year: Fixed rate 1,402,914 Floating rate 505,792 -------------------- Total $ 2,412,040 ====================
|
|
|
|
|
TABLE 10. Loans Sensitivity to Changes in Interest Rates | ||||
|
|
|
|
|
|
| December 31, |
| |
|
|
| ||
|
| (In thousands) |
| |
Commercial, industrial, and real estate construction maturing after one year: |
|
|
|
|
Fixed rate |
| $ | 669,196 |
|
Floating rate |
|
| 126,213 |
|
Other loans maturing after one year: |
|
|
|
|
Fixed rate |
|
| 1,837,284 |
|
Floating rate |
|
| 620,620 |
|
|
|
| ||
|
|
|
|
|
Total |
| $ | 3,253,313 |
|
|
|
| ||
Non-performing Assets
The following table sets forth nonperformingnon-performing assets by type for the periods indicated, consisting of nonaccrualnon-accrual loans, restructured loans and real estate owned. Loans past due 90 days or more and still accruing are also disclosed:
TABLE 12. Non-Performing Assets - ---------------------------------------------------------------------------------------------------------------------------- December 31, -------------------------------------------------------------------- 2006 2005 2004 2003 2002 --------------------------------------------------------------------(In thousands) Loans accounted for on a non-accrual basis $3,500 $10,617 $7,480 $12,161 $11,870 Restructured loans - - - - - -------------------------------------------------------------------- Total non-performing loans 3,500 10,617 7,480 12,161 11,870 Foreclosed assets 681 1,898 3,513 5,809 5,936 -------------------------------------------------------------------- Total non-performing assets $4,181 $12,515 $10,993 $17,970 $17,806 -------------------------------------------------------------------- Loans 90 days past due still accruing $2,552 $25,622 $5,160 $3,682 $6,407 -------------------------------------------------------------------- Ratios Non-performing assets to loans plus other real estate 0.13% 0.42% 0.40% 0.73% 0.84% Allowance for loan losses to non-performing loans and accruing loans 90 days past due 695% 196% 252% 170% 143% Loans 90 days past due still accruing to loans 0.08% 0.86% 0.19% 0.15% 0.30%
|
|
|
|
|
|
|
|
|
|
|
|
|
|
|
|
|
TABLE 11. Non-performing Assets |
|
|
|
|
|
|
|
|
|
|
|
|
|
|
|
|
|
|
|
|
|
|
|
|
|
|
|
|
|
|
|
|
|
|
| December 31, |
| |||||||||||||
|
| |||||||||||||||
|
| 2008 |
| 2007 |
| 2006 |
| 2005 |
| 2004 |
| |||||
|
| |||||||||||||||
|
| (In thousands) |
| |||||||||||||
Loans accounted for on a non-accrual basis |
| $ | 29,976 |
| $ | 13,067 |
| $ | 3,500 |
| $ | 10,617 |
| $ | 7,480 |
|
Restructured loans |
|
| — |
|
| — |
|
| — |
|
| — |
|
| — |
|
|
| |||||||||||||||
Total non-performing loans |
|
| 29,976 |
|
| 13,067 |
|
| 3,500 |
|
| 10,617 |
|
| 7,480 |
|
Foreclosed assets |
|
| 5,360 |
|
| 2,297 |
|
| 681 |
|
| 1,898 |
|
| 3,513 |
|
|
| |||||||||||||||
Total non-performing assets |
| $ | 35,336 |
| $ | 15,364 |
| $ | 4,181 |
| $ | 12,515 |
| $ | 10,993 |
|
|
| |||||||||||||||
Loans 90 days past due still accruing |
| $ | 11,005 |
| $ | 4,154 |
| $ | 2,552 |
| $ | 25,622 |
| $ | 5,160 |
|
|
| |||||||||||||||
Ratios |
|
|
|
|
|
|
|
|
|
|
|
|
|
|
|
|
Non-performing assets to loans plus other real estate |
|
| 0.83 | % |
| 0.43 | % |
| 0.13 | % |
| 0.42 | % |
| 0.40 | % |
Allowance for loan losses to non-performing loans and accruing loans 90 days past due |
|
| 133.16 | % |
| 241.43 | % |
| 694.67 | % |
| 195.50 | % |
| 251.85 | % |
Loans 90 days past due still accruing to loans |
|
| 0.26 | % |
| 0.11 | % |
| 0.08 | % |
| 0.86 | % |
| 0.19 | % |
The amount of interest that would have been recorded on nonaccrualnon-accrual loans had the loans not been classified as “nonaccrual”“non-accrual” was $759,000, $747,000, $574,000, $762,000$1.1 million, $.05 million, $0.8 million, $0.7 million and $662,000$0.6 million for the years ended December 31, 2008, 2007, 2006, 2005 and 2004, 2003 and 2002, respectively.
Interest actually received on nonaccrualnon-accrual loans was not material. The amount of interest recorded on restructured loans did not differ significantly from the interest that would have been recorded under the original terms of those loans.
Nonperforming Non-performing assets consist of loans accounted for on a nonaccrualnon-accrual basis, restructured loans and foreclosed assets. Table 1211 presents information related to nonperformingnon-performing assets for the five years ended December 31, 2006.2008. Total nonperformingnon-performing assets at December 31, 20062008 were $4.2$35.3 million, a decreasean increase of $8.3$20.0 million, or 67%130%, from December 31, 2005.2007. Loans that are over 90 days past due but still accruing were $2.6$11.0 million at December 31, 2006.2008. This compares to $25.6$4.2 million at December 31, 2005. This2007. The increase wasin non-performing loans, foreclosed assets, and loans past due primarilyare due to accommodations granted to certain loan customers related to Hurricane Katrina. In the aftermatheffects of Hurricane Katrina, we recognized that manythe on-going national recession, weakness in residential development, and higher unemployment levels across all of our credit customers (mostly residential mortgage holders) were in a position where time would be neededmarkets. The loans contributing to recover sufficiently from the storm before they could resume paymentsincrease have been identified, and appropriate write-downs or allowances have been made based on their loans. Accommodationsunderlying collateral values and those relationships have been placed in the formhands of loan payment extensions (mostspecial asset personnel for 90 days) were granted on a customer by customer basis. Efforts onhandling. Management believes that the part of management to reduceloans included in the levels of non-performing assets as well as past due loans, will continue in 2007.total are being handled appropriately.
Allowance for Loan and Lease Losses
Management and the Audit Committee are responsible for maintaining an effective loan review system, and internal controls, which include an effective risk rating system that identifies, monitors, and addresses asset quality problems in an accurate and timely manner. The allowance is evaluated for adequacy on at least a quarterly basis.
The Company’s loan loss reserve methodology is established and maintained at an amount sufficient to cover the estimated credit loss associated with the loan and lease portfolios of the Bank as of the date of determination. Credit losses arise not only from credit risk, but also from other risks inherent in the lending process including, but not limited to, collateral risk, operational risk, concentration risk, and economic risk. As such, all related risks of lending are considered when assessing the adequacy of the Allowance for Loan and Lease Losses (ALLL).
The methodology for determining the allowance for loan and lease losses involves significant judgment. Therefore, the Company has established a methodology for measuring the adequacy of the ALLL, which is systematic and consistently applied each quarter. The analysis and methodology include three primary segments: (1) a specific reserve analysis for those loans considered impaired under Statement of Financial Accounting Standards (SFAS) No. 114; (2) a pool analysis of groups of loans within the portfolio that have similar characteristics; and (3) qualitative risk factors and general economic conditions.
A SFAS No. 114 reserve analysis is completed on all loans that have been determined to be impaired by Management. When a loan is determined to be impaired, the amount of that impairment must be measured by either the loan’s observable market price, the fair value of the collateral of the loan, less liquidation costs, if it is collateral dependent, or by calculating the present value of expected future cash flows discounted at the loan’s effective interest rate. If the value of the impaired loan is less than the current balance of the loan, the Company must recognize the impairment by creating a specific reserve allowance for the shortfall.
The second reserve segment, the pool analysis methodology is governed by SFAS No. 5, Accounting for Contingencies. A historical loss rate is calculated for each loan type over the 12 prior quarters to determine the 3 year average loss rate. As circumstances dictate, Management will make adjustments to the loss history to reflect significant changes in the Company’s loss history.
The third segment relates to risks not captured elsewhere. Adjustments are made to historical loss rates to cover risks associated with trends in delinquencies, non-accruals, current economic conditions, credit administration/ underwriting practices, and borrower concentrations.
At December 31, 2006,2008, the allowance for loan losses was $46.8$61.7 million, or 1.43%1.45%, of year-end loans, compared to $74.6$47.1 million, or 2.49%1.31%, of year-end loans for 2005. In 2005, Hancock established a $35.2 million specific allowance for estimated credit losses related to the impact of Hurricane Katrina on our loan portfolio. In 2005, we reduced the allowance by $2.4 million for storm-related net charge-offs. As a result, the storm-related allowance was $32.9 million as of December 31, 2005. During 2006 we reversed $20.0 million from the storm-related allowance for loan losses due to better than expected loss experience with storm impacted credits.
2007. Net charge-offs amountedincreased significantly to $7.0$22.2 million in 2006,2008, as compared to $8.8$7.2 million in 2005. The $1.8 million decrease in net charge-offs from 2005 was related primarily to decreases in the commercial and commercial real estate category.2007. Overall, the allowance for loan losses was 695%133.2% of non-performing loans and accruing loans 90 days past due at year-end 2006,2008 compared to 196%241.4% at year-end 2005. Management utilizes2007. We utilize quantitative methodologies and modeling to determine the adequacy of the allowance for loan and lease losses and isare of the opinion that the allowance at December 31, 20062008 is adequate.
The following table sets forth, for the periods indicated, average net loans outstanding, allowance for loan losses, amounts charged-off and recoveries of loans previously charged-off:
TABLE 13. Summary of Activity in the Allowance for Loan Losses - --------------------------------------------------------------------------------------------------------------------------- At and For The Years Ended December 31, --------------------------------------------------------------------------- 2006 2005 2004 2003 2002 ------------- -------------- ------------- -------------- -------------(In thousands) Net loans outstanding at end of period $ 3,266,583 $ 2,989,186 $ 2,748,560 $ 2,448,644 $ 2,104,982 ============= ============== ============= ============== ============= Average net loans outstanding $ 3,062,222 $ 2,883,020 $ 2,599,561 $ 2,238,245 $ 1,961,299 ============= ============== ============= ============== ============= Balance of allowance for loan losses at beginning of period $ 74,558 $ 40,682 $ 36,750 $ 34,740 $ 34,417 ------------- -------------- ------------- -------------- ------------- Loans charged-off: Real estate 758 226 403 291 109 Commercial 3,676 4,001 5,381 4,868 9,143 Consumer, credit cards and other revolving credit 14,712 11,537 14,383 14,311 14,291 Lease financing 369 47 261 73 10 ------------- -------------- ------------- -------------- ------------- Total charge-offs 19,515 15,811 20,428 19,543 23,553 ------------- -------------- ------------- -------------- ------------- Recoveries of loans previously charged-off: Real estate 263 33 179 180 7 Commercial 4,729 2,757 1,957 1,112 639 Consumer, credit cards and other revolving credit 7,489 4,258 5,687 5,103 5,135 Lease financing 10 4 - 4 - ------------- -------------- ------------- -------------- ------------- Total recoveries 12,491 7,052 7,823 6,399 5,781 ------------- -------------- ------------- -------------- ------------- Net charge-offs 7,024 8,759 12,605 13,144 17,772 Provision for (recovery of) loan losses (20,762) 42,635 16,537 15,154 18,495 Balance acquired through acquisition & other - - - - (400) ------------- -------------- ------------- -------------- ------------- Balance of allowance for loan losses at end of period $ 46,772 $ 74,558 $ 40,682 $ 36,750 $ 34,740 ============= ============== ============= ============== ============= Ratios Gross charge-offs to average loans 0.64% 0.55% 0.79% 0.87% 1.20% Recoveries to average loans 0.41% 0.24% 0.30% 0.29% 0.29% Net charge-offs to average loans 0.23% 0.30% 0.48% 0.59% 0.91% Allowance for loan losses to year end loans 1.43% 2.49% 1.48% 1.50% 1.65% Net charge-offs to period-end net loans 0.22% 0.29% 0.46% 0.54% 0.84% Allowance for loan losses to average net loans 1.53% 2.59% 1.56% 1.64% 1.77% Net charge-offs to loan loss allowance 15.02% 11.75% 30.98% 35.77% 51.16%
|
|
|
|
|
|
|
|
|
|
|
|
|
|
|
|
|
TABLE 12. Summary of Activity in the Allowance for Loan Losses |
|
|
|
|
|
|
|
|
| |||||||
|
|
|
|
|
|
|
|
|
|
|
|
|
|
|
|
|
|
| At and For The Years Ended December 31, |
| |||||||||||||
|
|
| ||||||||||||||
|
| 2008 |
| 2007 |
| 2006 |
| 2005 |
| 2004 |
| |||||
|
|
|
|
|
|
| ||||||||||
|
| (In thousands) |
| |||||||||||||
|
|
|
|
|
|
|
|
|
|
|
|
|
|
|
|
|
Net loans outstanding at end of period |
| $ | 4,249,465 |
| $ | 3,596,557 |
| $ | 3,249,638 |
| $ | 2,964,967 |
| $ | 2,718,431 |
|
|
|
|
|
|
|
| ||||||||||
|
|
|
|
|
|
|
|
|
|
|
|
|
|
|
|
|
Average net loans outstanding |
| $ | 3,873,908 |
| $ | 3,428,009 |
| $ | 3,062,222 |
| $ | 2,883,020 |
| $ | 2,599,561 |
|
|
|
|
|
|
|
| ||||||||||
|
|
|
|
|
|
|
|
|
|
|
|
|
|
|
|
|
Balance of allowance for loan losses at beginning of period |
| $ | 47,123 |
| $ | 46,772 |
| $ | 74,558 |
| $ | 40,682 |
| $ | 36,750 |
|
|
|
|
|
|
|
| ||||||||||
Loans charged-off: |
|
|
|
|
|
|
|
|
|
|
|
|
|
|
|
|
Real estate |
|
| 1,360 |
|
| 530 |
|
| 758 |
|
| 226 |
|
| 403 |
|
Commercial |
|
| 12,974 |
|
| 2,597 |
|
| 3,676 |
|
| 4,001 |
|
| 5,381 |
|
Consumer, credit cards and other revolving credit |
|
| 13,051 |
|
| 11,159 |
|
| 14,712 |
|
| 11,537 |
|
| 14,383 |
|
Lease financing |
|
| 22 |
|
| 166 |
|
| 369 |
|
| 47 |
|
| 261 |
|
|
|
|
|
|
|
| ||||||||||
Total charge-offs |
|
| 27,407 |
|
| 14,452 |
|
| 19,515 |
|
| 15,811 |
|
| 20,428 |
|
|
|
|
|
|
|
| ||||||||||
Recoveries of loans previously |
|
|
|
|
|
|
|
|
|
|
|
|
|
|
|
|
Real estate |
|
| 162 |
|
| 188 |
|
| 263 |
|
| 33 |
|
| 179 |
|
Commercial |
|
| 1,036 |
|
| 2,774 |
|
| 4,729 |
|
| 2,757 |
|
| 1,957 |
|
Consumer, credit cards and other revolving credit |
|
| 4,026 |
|
| 4,205 |
|
| 7,489 |
|
| 4,258 |
|
| 5,687 |
|
Lease financing |
|
| — |
|
| 43 |
|
| 10 |
|
| 4 |
|
| — |
|
|
|
|
|
|
|
| ||||||||||
Total recoveries |
|
| 5,224 |
|
| 7,210 |
|
| 12,491 |
|
| 7,052 |
|
| 7,823 |
|
|
|
|
|
|
|
| ||||||||||
Net charge-offs |
|
| 22,183 |
|
| 7,242 |
|
| 7,024 |
|
| 8,759 |
|
| 12,605 |
|
Provision for (reversal of) loan losses |
|
| 36,785 |
|
| 7,593 |
|
| (20,762 | ) |
| 42,635 |
|
| 16,537 |
|
|
|
|
|
|
|
| ||||||||||
Balance of allowance for loan losses at end of period |
| $ | 61,725 |
| $ | 47,123 |
| $ | 46,772 |
| $ | 74,558 |
| $ | 40,682 |
|
|
|
|
|
|
|
| ||||||||||
Ratios |
|
|
|
|
|
|
|
|
|
|
|
|
|
|
|
|
Gross charge-offs to average loans |
|
| 0.71 | % |
| 0.42 | % |
| 0.64 | % |
| 0.55 | % |
| 0.79 | % |
Recoveries to average loans |
|
| 0.13 | % |
| 0.21 | % |
| 0.41 | % |
| 0.24 | % |
| 0.30 | % |
Net charge-offs to average loans |
|
| 0.57 | % |
| 0.21 | % |
| 0.23 | % |
| 0.30 | % |
| 0.48 | % |
Allowance for loan losses to year end loans |
|
| 1.45 | % |
| 1.31 | % |
| 1.44 | % |
| 2.51 | % |
| 1.50 | % |
Net charge-offs to period-end net loans |
|
| 0.52 | % |
| 0.20 | % |
| 0.22 | % |
| 0.30 | % |
| 0.46 | % |
Allowance for loan losses to average net loans |
|
| 1.59 | % |
| 1.37 | % |
| 1.53 | % |
| 2.59 | % |
| 1.56 | % |
Net charge-offs to loan loss allowance |
|
| 35.94 | % |
| 15.37 | % |
| 15.02 | % |
| 11.75 | % |
| 30.98 | % |
An allocation of the loan loss allowance by major loan category is set forth in the following table. There were no relevant variations in loan concentrations, quality or terms, except for an increase in the outstanding loan portfolio balance and in the unallocated amount.balance. The unallocated portion of the allowance represents supportable estimates of probable losses inherent in the loan portfolio but not specifically related to one category of the portfolio. The allocation is not necessarily indicative of the category of futureincurred losses, and the full allowance at December 31, 20062008 is available to absorb losses occurring in any category of loans.
TABLE 14. Allocation of Loan Loss by Category - -------------------------------------------------------------------------------------------------------------------------------- For Years Ended December 31, 2006 2005 2004 2003 2002 -------------------- -------------------- -------------------- ------------------- -------------------- Allowance % of Allowance % of Allowance % of Allowance % of Allowance % of for Loans for Loans for Loans for Loans for Loans Loan to Total Loan to Total Loan to Total Loan to Total Loan to Total Losses(1) Loans(2) Losses(1) Loans(2) Losses(1) Loans(2) Losses(1) Loans(2) Losses(1) Loans(2) --------- -------- ---------- -------- ---------- -------- ---------- -------- ---------- ---------(In thousands) Real estate $1,697 64.84 $23,042 62.86 $11,253 64.19 $9,711 63.30 $7,664 61.26 Commercial, industrial and other 27,838 18.77 34,128 19.74 14,974 17.37 15,311 17.41 11,610 17.72 Consumer and other revolving credit 15,363 16.39 15,812 17.40 11,453 18.44 10,718 19.29 10,174 21.02 Unallocated 1,874 - 1,576 - 3,002 - 1,010 - 5,292 - --------- -------- ---------- -------- ---------- -------- ---------- -------- ---------- --------- $46,772 100.00 $74,558 100.00 $40,682 100.00 $36,750 100.00 $34,740 100.00 ========= ======== ========== ======== ========== ======== ========== ======== ========== ========= (1) Loans used in the calculation of "allowance for loan losses" are grouped according to loan purpose. (2) Loans used in the calculation of "% of loans to total loans" are grouped by collateral type.
|
|
|
|
|
|
|
|
|
|
|
|
|
|
|
|
|
|
|
|
|
|
|
|
|
|
|
|
|
|
|
|
TABLE 13. Allocation of Loan Loss by Category |
|
|
|
|
|
|
|
|
|
|
|
|
|
|
|
| |||||||||||||||
| |||||||||||||||||||||||||||||||
|
| For Years Ended December 31, |
| ||||||||||||||||||||||||||||
|
| 2008 |
| 2007 |
| 2006 |
| 2005 |
| 2004 |
| ||||||||||||||||||||
|
|
|
|
|
|
| |||||||||||||||||||||||||
|
| Allowance |
| % of |
| Allowance |
| % of |
| Allowance |
| % of |
| Allowance |
| % of |
| Allowance |
| % of |
| ||||||||||
|
|
|
|
|
|
|
|
|
|
|
| ||||||||||||||||||||
|
| (In thousands) |
| ||||||||||||||||||||||||||||
|
|
|
|
|
|
|
|
|
|
|
|
|
|
|
|
|
|
|
|
|
|
|
|
|
|
|
|
|
|
|
|
Real estate |
| $ | 5,315 |
|
| 63.08 |
| $ | 1,998 |
|
| 64.85 |
| $ | 1,697 |
|
| 64.84 |
| $ | 23,042 |
|
| 62.86 |
| $ | 11,253 |
|
| 64.19 |
|
Commercial, industrial and other |
|
| 36,448 |
|
| 22.35 |
|
| 27,546 |
|
| 19.15 |
|
| 27,838 |
|
| 18.77 |
|
| 34,128 |
|
| 19.74 |
|
| 14,974 |
|
| 17.37 |
|
Consumer and other revolving credit |
|
| 19,063 |
|
| 14.57 |
|
| 16,111 |
|
| 16.00 |
|
| 15,363 |
|
| 16.39 |
|
| 15,812 |
|
| 17.40 |
|
| 11,453 |
|
| 18.44 |
|
Unallocated |
|
| 899 |
|
| — |
|
| 1,468 |
|
| — |
|
| 1,874 |
|
| — |
|
| 1,576 |
|
| — |
|
| 3,002 |
|
| — |
|
|
|
|
|
|
|
|
|
|
|
|
| ||||||||||||||||||||
|
|
|
|
|
|
|
|
|
|
|
|
|
|
|
|
|
|
|
|
|
|
|
|
|
|
|
|
|
|
|
|
|
| $ | 61,725 |
|
| 100.00 |
| $ | 47,123 |
|
| 100.00 |
| $ | 46,772 |
|
| 100.00 |
| $ | 74,558 |
|
| 100.00 |
| $ | 40,682 |
|
| 100.00 |
|
|
|
|
|
|
|
|
|
|
|
|
| ||||||||||||||||||||
(1) | Loans used in the calculation of “allowance for loan losses” are grouped according to loan purpose. |
(2) | Loans used in the calculation of “% of loans to total loans” are grouped by collateral type. |
Deposits
Hancock’s deposit base experienced significant growth since Hurricane Katrina impacted its market area. Deposits increased to $5.03 billion at December 31, 2006 from $4.99 billion at December 31, 2005, an increase of $41.2 million, or approximately 0.83%. The year-end deposit increase from 2004 to 2005 was primarily driven by non-interest bearing deposit growth of $627.6 million and time deposit growth of $564.3 million. Total average deposits increased by $399.0$253.2 million, or 11%5.1%, from $3.60$4.9 billion during 2004at December 31, 2007 to $4.00$5.2 billion during 2005.at December 31, 2008. The increase occurred primarily in time deposits which grew $151.5 million, or 7.7%, to $2.1 billion in 2008. We experienced a slight decrease in non-interest bearing demand deposits of $51.0 million.
Over the course of 2006,2008, we increasedcontinued our focus on multiple accounts, core deposit relationships and strategic placement of time deposit campaigns to stimulate overall deposit growth. We continue toIn addition, we keep as our highest priority, continued customer demand for safety and liquidity of deposit products. Interest-bearing accounts, which include NOW accounts, money market investment accounts, savings accountsThe composition of our deposit mix continued to change during 2008, and ended with a slightly less favorable funding mix than in 2007. As a percent of our average deposit mix, time deposits increased more than $761.9 million on an average basis during 2006. Additionally, non-interest-bearing deposits were up almost $306.1 million for the period January through December 2006. The vast majority of the aforementioned net growth occurred as a result of deposit inflowsto 41% from the impact of Hurricane Katrina, but the inflows were not limited to the immediate aftermath of the storm. The composition of deposit inflows since August 31, 2005 has been favorable to Hancock’s funding mix and consisted of 22% non-interest bearing demand accounts, 44%40% while low cost interest-bearinginterest bearing transaction accounts and 34% time deposits.
Borrowings consist primarily of purchases of federal funds, sales of securities under repurchase agreements and borrowingsdemand deposits decreased from the FHLB. In total, borrowings were down over $79.9 million from December 31, 200519% to December 31, 2006, driven primarily by a decrease in FHLB borrowings. Sales of securities under repurchase agreements decreased $32.2 million from year-end 2005, while a $50 million long-term note from the FHLB was paid off in 2006. At December 31, 2006, federal funds purchased totaled $3.8 million while purchases of federal funds outstanding at year-end 2005 totaled $1.5 million.
17%. The Banks traditionally price their deposits to position themselves competitively with the local market.The Banks' policy is not to accept brokered deposits.Table
1514 shows average deposits for a three-year period.TABLE 15. Average Deposits - ----------------------------------------------------------------------------------------------------------------------------------- 2006 2005 2004 ---------------------------------------------------------------------------------------------------------Balance Rate Mix Balance Rate Mix Balance Rate Mix (In thousands) Non-interest bearing demand deposits $1,128,850 0.00% 22% $822,733 0.00% 21% $650,106 0.00% 18% NOW account deposits 1,167,047 2.45% 23% 893,521 1.55% 22% 798,286 1.01% 22% Money market deposits 517,542 1.74% 10% 445,134 0.96% 11% 444,390 0.69% 12% Savings deposits 564,177 0.63% 11% 521,502 0.70% 13% 562,976 0.79% 16% Time deposits 1,691,811 4.08% 34% 1,318,536 3.47% 33% 1,146,976 3.23% 32% ---------------------------------- --------------------------------- --------------------------------- Total average deposits $5,069,427 100% $4,001,426 100% $3,602,734 100% ============== ========= =============== ======== =============== =========
TABLE 14. Average Deposits
2008
2007
2006
Balance
Rate
Mix
Balance
Rate
Mix
Balance
Rate
Mix
(In thousands)
Non-interest bearing demand deposits
$
876,669
0.00
%
17
%
$
927,655
0.00
%
19
%
$
1,128,850
0.00
%
22
%
NOW account deposits
1,195,900
1.65
%
23
%
1,067,775
2.52
%
22
%
1,167,047
2.45
%
23
%
Money market deposits
612,510
1.91
%
12
%
529,976
2.50
%
11
%
517,542
1.74
%
10
%
Savings deposits
370,705
0.26
%
7
%
428,599
0.61
%
8
%
564,177
0.63
%
11
%
Time deposits (including Public Funds CDs)
2,126,623
3.70
%
41
%
1,975,171
4.56
%
40
%
1,691,811
4.08
%
34
%
Total average deposits
$
5,182,407
100
%
$
4,929,176
100
%
$
5,069,427
100
%
Time certificates of deposit of $100,000 and greater at December 31,
20062008 had maturities as follows:TABLE 16. Maturity of Time Deposits greater than or equal to $100,000 - ----------------------------------------------------------------------------------------------------------------------------- December 31, 2006 -------------------------(In thousands) $ 278,543 Over three through six months 211,708 Over six months through one year 157,109 Over one year 88,277 ------------------------- Total $ 735,637 =========================
TABLE 15. Maturity of Time Deposits greater than or equal to $100,000
December 31, 2008
(In thousands)
Three months
$
382,551
Over three through six months
166,597
Over six months through one year
94,554
Over one year
413,648
Total
$
1,057,350
Short-Term Borrowings
The following table sets forth certain information concerning
Hancock'sour short-term borrowings, which consist of federal funds purchased and securities sold under agreements to repurchase.TABLE 17. Short-Term Borrowings - --------------------------------------------------------------------------------------------------------------------------- Years Ended December 31, -------------------------------------------------------- 2006 2005 2004 ---------------- ----------------- ----------------(In thousands) Federal funds purchased: Amount outstanding at period-end $ 3,800 $ 1,475 $ 800 Weighted average interest at period-end 4.95% 3.95% 2.15% Maximum amount at any month-end during period $ 49,160 $ 55,120 $ 41,852 Average amount outstanding during period $ 11,557 $ 10,262 $ 14,181 Weighted average interest rate during period 5.38% 3.27% 1.64% Securities sold under agreements to repurchase: Amount outstanding at period-end $ 218,591 $ 250,807 $ 195,478 Weighted average interest at period-end 3.72% 4.29% 1.13% Maximum amount at any month-end during period $ 425,753 $ 258,508 $ 243,101 Average amount outstanding during period $ 250,603 $ 224,842 $ 195,470 Weighted average interest rate during period 3.62% 1.94% 0.98%
|
|
|
|
|
|
|
|
|
|
|
TABLE 16. Short-Term Borrowings |
|
|
|
|
|
|
|
|
|
|
| ||||||||||
|
| Years Ended December 31, |
| |||||||
|
|
| ||||||||
|
| 2008 |
| 2007 |
| 2006 |
| |||
|
|
|
|
| ||||||
|
| (In thousands) |
| |||||||
|
|
|
|
|
|
|
|
|
|
|
Federal funds purchased: |
|
|
|
|
|
|
|
|
|
|
Amount outstanding at period-end |
| $ | — |
| $ | 4,100 |
| $ | 3,800 |
|
Weighted average interest at period-end |
|
| — |
|
| 4.02 | % |
| 4.95 | % |
Maximum amount at any month-end during period |
| $ | 33,775 |
| $ | 4,100 |
| $ | 49,160 |
|
Average amount outstanding during period |
| $ | 16,003 |
| $ | 4,174 |
| $ | 11,557 |
|
Weighted average interest rate during period |
|
| 2.20 | % |
| 4.99 | % |
| 5.38 | % |
|
|
|
|
|
|
|
|
|
|
|
Securities sold under agreements to repurchase: |
|
|
|
|
|
|
|
|
|
|
Amount outstanding at period-end |
| $ | 505,932 |
| $ | 371,604 |
| $ | 218,591 |
|
Weighted average interest at period-end |
|
| 2.10 | % |
| 3.63 | % |
| 3.72 | % |
Maximum amount at any month end during-period |
| $ | 621,424 |
| $ | 371,604 |
| $ | 425,753 |
|
Average amount outstanding during period |
| $ | 524,712 |
| $ | 216,730 |
| $ | 250,603 |
|
Weighted average interest rate during period |
|
| 2.76 | % |
| 3.70 | % |
| 3.62 | % |
Return on Equity and Assets
Information regarding performance and equity ratios is as follows:
TABLE 18. Return on Equity and Assets - -------------------------------------------------------------------------------------------------- Years Ended December 31, --------------------------------------------- 2006 2005 2004 --------------- -------------- ------------Return on average assets 1.69% 1.10% 1.39% Return on average common equity 19.82% 11.36% 13.79% Dividend payout ratio 28.59% 43.11% 30.37% Average common equity to average assets ratio 8.52% 9.65% 10.11%
|
|
|
|
|
|
|
|
|
|
|
TABLE 17. Return on Equity and Assets |
|
|
|
|
|
|
|
|
|
|
| ||||||||||
|
| Years Ended December 31, |
| |||||||
|
|
|
|
| ||||||
|
| 2008 |
| 2007 |
| 2006 |
| |||
|
|
|
|
| ||||||
Return on average assets |
|
| 1.02 | % |
| 1.26 | % |
| 1.69 | % |
Return on average common equity |
|
| 11.18 | % |
| 13.14 | % |
| 19.82 | % |
Dividend payout ratio |
|
| 46.15 | % |
| 41.56 | % |
| 28.59 | % |
|
|
|
|
|
|
|
|
|
|
|
Average common equity to average assets ratio |
|
| 9.10 | % |
| 9.61 | % |
| 8.52 | % |
COMMITMENTS AND CONTINGENCIES
Loan Commitments and Letters of Credit
In the normal course of business, Hancock enterswe enter into financial instruments, such as commitments to extend credit and letters of credit, to meet the financing needs of our customers. Such instruments are not reflected in the accompanying consolidated financial statements until they are funded and involve, to varying degrees, elements of credit risk not reflected in the consolidated balance sheets. The contract amounts of these instruments reflect our exposure to credit loss in the event of non-performance by the other party on whose behalf the instrument has been issued. We undertake the same credit evaluation in making commitments and conditional obligations as we do for on-balance-sheet instruments and may require collateral or other credit support for off-balance-sheet financial instruments.
At December 31, 2006, Hancock2008, we had $963.1$885.2 million in unused loan commitments outstanding, of which approximately $455.6$610.4 million were at variable rates and the remainder was at fixed rates. A commitment to extend credit is an agreement to lend to a customer as long as the conditions established in the agreement have been satisfied. A commitment to extend credit generally has a fixed expiration date or other termination clauses and may require payment of a fee by the borrower. Since commitments often expire without being fully drawn, the total commitment amounts do not necessarily represent our future cash requirements. We continually evaluate each customer’s credit worthiness on a case-by-case basis. Occasionally, a credit evaluation of a customer requesting a commitment to extend credit results in our obtaining collateral to support the obligation.
Letters of credit are conditional commitments issued by Hancockus to guarantee the performance of a customer to a third party. The credit risk involved in issuing a letter of credit is essentially the same as that involved in extending a loan. At December 31, 2006,2008, we had $69.5$113.3 million in letters of credit issued and outstanding.
The following table shows the commitments to extend credit and letters of credit at December 31, 20062008 and 2007 according to expiration date.
TABLE 19. Commitments
TABLE 18. Commitments and Letters of Credit
Expiration Date
Total
Less than
1 year
1-3
years
3-5
years
More than
5 years
(In thousands)
December 31, 2008
Commitments to extend credit
$
885,156
$
527,118
$
43,454
$
66,348
$
248,236
Letters of credit
113,274
51,366
11,003
50,905
—
Total
$
998,430
$
578,484
$
54,457
$
117,253
$
248,236
Expiration Date
Total
Less than
1 year
1-3
years
3-5
years
More than
5 years
(In thousands)
December 31, 2007
Commitments to extend credit
$
1,110,935
$
744,412
$
46,759
$
69,008
$
250,756
Letters of credit
86,969
25,225
48,983
12,761
—
Total
$
1,197,904
$
769,637
$
95,742
$
81,769
$
250,756
Visa IPO and
LettersLitigationIn the fourth quarter of
Credit - ----------------------------------------------------------------------------------------------------------------------------------- Expiration Date ------------------------------------------------------------ Less than 1-3 3-5 More than Total 1 year2007, we recorded a $2.5 million pretax charge pursuant to FASB Interpretation No. 45 “Guarantors Accounting and Disclosure Requirements, Including Indirect Guarantees of Indebtedness of Others” (“FIN No. 45”) for liabilities related to VISA USA’s antitrust settlement with American Express and other pending VISA litigation (reflecting our share as a VISA member.) In the first quarter of 2008 as part of VISA’s initial public offering, VISA redeemed 37.5% of shares held by us resulting in proceeds of $2.8 million in a realized security gain. The remaining 62.5% of the Class B shares are restricted and must be held for the longer period of 3 yearsyears 5 years ---------------- ----------------- ----------------- ---------------- -----------------or until all settlements are complete. At that time, we can keep the Class B shares or convert them to Class A publicly tradeable shares at a conversion rate to be determined.These shares are recorded at historical cost. The realized securities gain is included in the securities gain line of the noninterest income section of the Consolidated Statements of Income and the cash received is recorded in cash and due from banks in the assets section of the Consolidated Balance Sheets. In addition, VISA lowered its estimate of pending litigation settlements. Consequently, $1.3 million of the $2.5 million FIN No. 45 liability that was recorded in the fourth quarter was reversed in the first quarter of 2008. The reduction in the litigation liability is recorded in the other liabilities section of the Consolidated Balance Sheets and the reduction in litigation expense is recorded in the other expense line of the noninterest expense section of the Consolidated Statements of Income.
In the fourth quarter of 2008, VISA, Discover Financial Services Inc., and MasterCard Inc. announced that they have settled the antitrust lawsuit and that they are working on the specific terms on the settlement. On December 22, 2008, VISA, Inc. announced that it had deposited $1.1 billion into the litigation escrow account as settlement for the Discover case. Under terms of the plan, Hancock Bank as a member bank bore its portion of the expense via a reduction in share count of Class B shares. There was no cash outlay required of us. Based on the funding and settlement with Discover, we reversed as of December 31,
2006(In thousands) Commitments2008, the portion of the VISA contingency reserve related toextend credit $ 963,098 $ 648,802 $ 38,204 $ 38,164 $ 237,928 LettersDiscover ofcredit 69,468 20,235 40,174 9,059 - ---------------- ----------------- ----------------- ---------------- ----------------- Total $ 1,032,566 $ 669,037 $ 78,378 $ 47,223 $ 237,928 ================ ================= ================= ================ =================Expiration Date ------------------------------------------------------------ Less than 1-3 3-5 More than Total 1 year years years 5 years ---------------- ----------------- ----------------- ---------------- -----------------$0.3 million. The reduction in the litigation liability is recorded in the other liabilities section of the Consolidated Balance Sheets and the reduction in litigation expense is recorded in the other expense line of the noninterest expense section of the Consolidated Statements of Income. The settlement did not have a material impact on the Company’s results of operations or financial position. As of December 31,2005(In thousands) Commitments to extend credit $ 550,948 $ 284,249 $ 34,999 $ 25,815 $ 205,885 Letters of credit 57,427 34,261 1,287 21,397 483 ---------------- ----------------- ----------------- ---------------- ----------------- Total $ 608,375 $ 318,510 $ 36,286 $ 47,212 $ 206,368 ================ ================= ================= ================ =================
Under the provisions2008, $0.9 million of the Federal Deposit Insurance Reform Act of 2005, we received, in October 2006, a one-time FDIC assessment credit of $3.2initial $2.5 million to be used against future deposit insurance assessments. This credit is not reflectedFIN No. 45 liability remained in the accompanying consolidated financial statements. It will be recognized as an offset in future years againstother liabilities section of the FDIC assessments.Consolidated Balance Sheets.
RISK MANAGEMENT
Credit Risk
The Banks’ primary lending focus is to provide commercial, consumer and real estate loans to consumers and to small and middle market businesses in their respective market areas. Diversification in the loan portfolio is a means of reducing the risks associated with economic fluctuations. The Banks have no significant concentrations of loans to particular borrowers or loans to any foreign entities. There have been increases in some categories of loans – home equity, real estate construction/term and C&I loans are examples. These are principally within and in support of the markets that are continuing to rebuild and repair since Hurricane Katrina. Loan demand continues to be strong within those markets. Loan underwriting standards reducesreduce the impact of credit risk to us. Loans are underwritten on the basis of cash flow capacityrepayment ability and collateral fair value. Generally, real estate mortgage loans are made when the borrower produces sufficient cash flow capacity andevidence of repayment ability along with equity in the property to offset historical market devaluations.
Allowance for Loan and Lease Losses
The allowance for loan and lease losses (ALLL)“ALLL” is a valuation account available to absorb losses on loans. The ALLL is established and maintained at an amount sufficient to cover the estimated credit loss associated with the loan and lease portfolios of the Banks as of the date of the determination. Credit losses arise not only from credit risk, but also from other risks inherent in the lending process including, but not limited to, collateral risk, operational risk, concentration risk, and economic risk. As such, all related risks of lending are considered when assessing the adequacy of the allowance for loan and lease losses. Quarterly, management estimateswe estimate the probable level of losses to determine whether the allowance is adequate to absorb reasonably foreseeable, anticipated losses in the existing portfolio based on Hancock’sour past loan loss and delinquency experience, known and inherent risks in the portfolio, adverse situations that may affect the borrowers’ ability to repay, and the estimated value of any underlying collateral and current economic conditions. The analysis and methodology include three primary segments. These segments include a pool analysis of various retail loans based upon loss history, a pool analysis of commercial and commercial real estate loans based upon loss history by loan type, and a specific reserve analysis for those loans considered impaired under SFAS No. 114. All commercial and commercial real estate loans with an outstanding balance of $100,000 or greater are individually reviewed for impairment; substandard mortgage loans with balances of $100,000 or greater are also included in the analysis. All losses are charged to the allowance for loan and lease losses when the loss actually occurs or when a determination is made that a loss is likely to occur; recoveries are credited to the allowance for loan losses at the time of receipt.
Commercial loans are considered impaired when it is probable (the future event or events are likely to occur) that the bank will be unable to collect all amounts due (including principal and interest) according to the contractual terms of the loan agreement. In order to ensure consideration of all possible impairments, for purposes of the model the Banks consider all loans that are risk rated substandard as impaired. When a loan is determined to be impaired, the amount of that impairment must be measured by either the loan’s observable market price, the fair value of the collateral of the loan (less liquidation costs) if it is collateral dependent, or by calculating the present value of expected future cash flows discounted at the loan’s effective interest rate. If the value of the impaired loan is less than the current balance of the loan, the impairment is recognized by creating a specific reserve allowance for the shortfall. If the value is greater or equal to the loan balance, then no reserve allocation may be made for the loan. In addition, any loans included in the impairment review shouldare not be incorporated into the pool analysis to avoid double counting.
Pool analysis is applied for all retail loans. The retail loans are subdivided into three groups, which currently include: mortgage real estate, indirect loans and direct consumer loans. A historical loss rate is calculated for each group over the twelve prior quarters to determine the three year average loss rate. As circumstances dictate, management will make adjustments to the loss history to reflect significant changes in the Bank’sour loss history. Adjustments will also be made to historical loss rates to cover risks associated with trends in delinquencies, non-accruals, current economic conditions and credit administration/ underwriting practices and policies.
A historical loss ratio is applied to all commercial loans, commercial real estate loans and leases grouped by product type for which SFAS No. 5 exposure can best be evaluated collectively due to similar attributes. A historical loss rate is calculated for each group over the twelve prior quarters to determine the three year average loss rate. As circumstances dictate, managementwe will make adjustments to the loss history to reflect significant changes in the Bank’sour loss history. Adjustments will also be made to historical loss rates to cover risks associated with trends in delinquencies, non-accruals, current economic conditions and credit administration/ underwriting practices and policies and borrower concentrations.
Asset/Liability Management
Our asset liability management (ALM) process consists of quantifying, analyzing and controlling interest rate risk (IRR) to maintain stability in net interest income (NII) under varying interest rate environments. The principal objective of ALM is to maximize net interest income while operating within acceptable limits established for interest rate risk and maintaining adequate levels of liquidity.
Hancock’s Our net earnings are dependent on our net interest income. Net interest income is susceptible to IRR to the degree that interest-bearing liabilities mature or reprice on a different basis and timing than interest-earning assets. This timing difference represents a potential risk to Hancock’sour future earnings. When interest-bearing liabilities mature or reprice more quickly than interest-earning assets in a given period, a significant increase in market rates of interest and the subsequent impact on customer behavior could adversely affect NII. Similarly, when interest-earning assets mature or reprice more quickly than interest-bearing liabilities, falling interest rates and changes in customer behavior could result in a decrease in NII.
Management and the Asset/Liability Committee (ALCO) direct Hancock’sour IRR management through a Risk Management policy that is designed to produce a stable net interest margin (NIM) in periods of interest rate fluctuation. In adjusting Hancock’sour asset/liability position, the board of directors and management attempt to direct Hancock’sour IRR while enhancing the NIM. At times, depending on the general level of interest rates, the relationship between long-term and short-term interest rates, market conditions and competitive factors, managementwe may determine strategies that could add to the level of IRR in order to increase its NIM. Not withstanding Hancock’sour IRR management activities, the potential for changing interest rates is an uncertainty that can have an adverse effect on net earnings.
To control interest rate risk, managementwe regularly monitorsmonitor the volume of interest sensitive assets compared with interest sensitive liabilities over specific time intervals. Interest-sensitive assets and liabilities are those that are subject to maturity or repricing within a given time period. ManagementWe also administersadminister this sensitivity through the development and implementation of investment, lending, funding and pricing strategies designed to achieve NII performance goals while minimizing the potential negative variations in NII under different interest rate scenarios. Investment strategies, including portfolio durations and cash flows, are formulated and continually adjusted during the implementation to assure attainment of objectives in the most effective manner. Loan and deposit pricing are adjusted weekly to reflect current interest rate and competitive market environments, with duration targets on both reviewed monthly.
The static gap report shown in Table 2019 measures the net amounts of assets and liabilities that reprice within a given time period over the remaining lives of those instruments. At December 31, 2006, Hancock’s2008, our cumulative repricing gap in the one year interval was 4%9.0%. The asset sensitive position represents a significant security portfolio cash flow within one year. The earning asset position is strategically managed with a balance in our loan growth (fixed versus floating and duration targets) and the strategic management of securities portfolio cash flows and deposit mix. Management believes it isflows. We believe we are well positioned for the current rate environment.
To further control IRR, we structure our loan portfolio to provide appropriate investment opportunities while minimizing potential volatility in earnings from extension risk. Deposit strategies continue to emphasize a mix of non-certificate of deposit core accounts and consumer time deposits. Management believes that core deposit accounts carry a lower interest cost, and that a material portion of such accounts may beHowever, the 2008 yield curve environment has created more resistant to changes in interest rates. Management further believes that mixing these accountsdemand on consumer time deposits with targeted maturities for certificates of deposit provides the customer with a wider array of deposit opportunities while being beneficial to our duration and rate sensitivity profile.less than one year.
The following table sets forth the scheduled re-pricing or maturity of our assets and liabilities at December 31, 20062008 and December 31, 2005.2007. The assumed prepayment of investments and loans werewas based on Hancock’sour assessment of current market conditions on such dates. Estimates have been made for the re-pricing of savings, NOW and money market accounts. Actual prepayments and deposit withdrawals will differ from the following analysis due to variable economic circumstances and consumer behavior. Although assets and liabilities may have similar maturities or re-pricingrepricing periods, reactions will vary as to timing and degree of interest rate change.
TABLE 20. Analysis of Interest Sensitivity - ---------------------------------------------------------------------------------------------------------------------------- December 31, 2006 Non- Within 6 months 1 to 3 > 3 Sensitive Overnight 6 months to 1 year years years Balance Total ---------------------------------------------- ---------- ------------ -----------(In thousands) Assets Securities $ - $ 531,640 $ 325,198 $ 424,694 $ 586,372 $ 35,754 $1,903,658 Federal funds sold & short-term investments 222,122 - 317 - - - 222,439 Loans 60,762 1,563,794 297,791 671,158 626,307 - 3,219,812 Other assets - - - - - 618,656 618,656 ---------- ----------- ---------- ----------- ----------- ------------ ---------- Total Assets $ 282,884 $ 2,095,434 $ 623,306 $ 1,095,852 $1,212,679 $ 654,410 $5,964,565 ========== =========== ========== =========== =========== ============ ========== Liabilities Interest bearing transaction deposits $ - $ 694,677 $ 315,933 $ 926,668 $ 155,172 $ - $2,092,450 Time deposits - 1,071,192 464,663 281,425 63,903 - 1,881,183 Non-interest bearing deposits - - - 52,868 1,004,490 - 1,057,358 Federal funds purchased 3,800 - - - - - 3,800 Borrowings 222,976 - - 24 227 - 223,227 Other liabilities - - - - - 148,137 148,137 Stockholders' Equity - - - - - 558,410 558,410 ---------- ----------- ---------- ----------- ----------- ------------ ---------- Total Liabilities & Equity $ 226,776 $ 1,765,869 $ 780,596 $ 1,260,985 $ 1,223,792 $ 706,547 $5,964,565 ========== =========== ========== =========== =========== ============ ========== Interest sensitivity gap $ 56,108 $ 329,565 $(157,290) $ (165,133) $ (11,113) $ (52,137) Cumulative interest rate sensitivity gap $ 56,108 $ 385,673 $ 228,383 $ 63,250 $ 52,137 $ - Cumulative interest rate sensitivity gap as a percentage of total earning assets 1.0 % 7.2 % 4.2 % 1.2 % 1.0 %
|
|
|
|
|
|
|
|
|
|
|
|
|
|
|
|
|
|
|
|
|
|
|
TABLE 19. Analysis of Interest Sensitivity | ||||||||||||||||||||||
| ||||||||||||||||||||||
|
| December 31, 2008 | ||||||||||||||||||||
| ||||||||||||||||||||||
|
| Overnight |
| Within |
| 6 months |
| 1 to 3 |
| > 3 |
| Non-Sensitive |
| Total |
| |||||||
|
|
|
|
|
|
|
|
| ||||||||||||||
|
| (In thousands) | ||||||||||||||||||||
Assets |
|
|
|
|
|
|
|
|
|
|
|
|
|
|
|
|
|
|
|
|
|
|
Securities |
| $ | 1,666 |
| $ | 743,616 |
| $ | 283,566 |
| $ | 300,332 |
| $ | 349,755 |
| $ | 3,022 |
| $ | 1,681,957 |
|
Federal funds sold & short-term investments |
|
| — |
|
| 376,499 |
|
| 172,917 |
|
| — |
|
| — |
|
| — |
|
| 549,416 |
|
Loans |
|
| — |
|
| 1,912,989 |
|
| 324,287 |
|
| 947,141 |
|
| 1,025,438 |
|
| — |
|
| 4,209,855 |
|
Other assets |
|
| — |
|
| — |
|
| — |
|
| — |
|
| — |
|
| 726,026 |
|
| 726,026 |
|
|
|
|
|
|
|
|
|
| ||||||||||||||
Total Assets |
| $ | 1,666 |
| $ | 3,033,104 |
| $ | 780,770 |
| $ | 1,247,473 |
| $ | 1,375,193 |
| $ | 729,048 |
| $ | 7,167,254 |
|
|
|
|
|
|
|
|
|
| ||||||||||||||
Liabilities |
|
|
|
|
|
|
|
|
|
|
|
|
|
|
|
|
|
|
|
|
|
|
Interest bearing transaction deposits |
| $ | — |
| $ | 1,289,545 |
| $ | 353,995 |
| $ | 856,040 |
| $ | 196,735 |
| $ | — |
| $ | 2,696,315 |
|
Time deposits |
|
| — |
|
| 1,064,269 |
|
| 256,781 |
|
| 737,807 |
|
| 212,879 |
|
| — |
|
| 2,271,736 |
|
Non-interest bearing deposits |
|
| — |
|
| — |
|
| — |
|
| 48,144 |
|
| 914,742 |
|
| — |
|
| 962,886 |
|
Federal funds purchased |
|
| — |
|
| — |
|
| — |
|
| — |
|
| — |
|
| — |
|
| — |
|
Borrowings |
|
| 255,932 |
|
| 9,427 |
|
| — |
|
| 131,978 |
|
| 119,920 |
|
| — |
|
| 517,257 |
|
Other liabilities |
|
| — |
|
| — |
|
| — |
|
| — |
|
| — |
|
| 109,561 |
|
| 109,561 |
|
Stockholders’ equity |
|
| — |
|
| — |
|
| — |
|
| — |
|
| — |
|
| 609,499 |
|
| 609,499 |
|
|
|
|
|
|
|
|
|
| ||||||||||||||
Total Liabilities & Equity |
| $ | 255,932 |
| $ | 2,363,241 |
| $ | 610,776 |
| $ | 1,773,969 |
| $ | 1,444,276 |
| $ | 719,060 |
| $ | 7,167,254 |
|
|
|
|
|
|
|
|
|
| ||||||||||||||
Interest sensitivity gap |
| $ | (254,266 | ) | $ | 669,863 |
| $ | 169,994 |
| $ | (526,496 | ) | $ | (69,083 | ) | $ | 9,988 |
|
|
|
|
Cumulative interest rate sensitivity gap |
| $ | (254,266 | ) | $ | 415,597 |
| $ | 585,591 |
| $ | 59,095 |
| $ | (9,988 | ) |
| — |
|
|
|
|
Cumulative interest rate sensitivity gap as a percentage of total earning assets |
|
| (3.9 | )% |
| 6.4 | % |
| 9.0 | % |
| 0.9 | % |
| (0.2 | )% |
|
|
|
|
|
|
TABLE 20. Analysis of Interest Sensitivity (continued) - ----------------------------------------------------------------------------------------------------------------------------- December 31, 2005 Within 6 months 1 to 3 > 3 Non-Sensitive Overnight 6 months to 1 year years years Balance Total ---------- ----------- ---------- ----------- ----------- -------------- ----------(In thousands) Assets Securities $ - $ 321,224 $ 396,374 $ 544,557 $ 685,504 $ 11,602 $1,959,261 Federal funds sold & short-term investments 402,968 - 7,258 - - - 410,226 Loans 43,145 1,413,210 240,200 634,416 583,657 - 2,914,628 Other assets - - - - - 666,072 666,072 ---------- ----------- ---------- ----------- ----------- ------------ ----------- Total Assets $ 446,113 $1,734,434 $ 643,832 $ 1,178,973 $1,269,161 $ 677,674 $5,950,187 ========== =========== ========== =========== =========== ============ =========== Liabilities Interest bearing transaction deposits $ - $ 776,515 $ 309,737 $ 923,166 $ 155,417 $ - $2,164,835 Time deposits - 410,815 495,558 452,356 141,318 - 1,500,047 Non-interest bearing deposits - 425,444 159,876 533,352 206,266 - 1,324,938 Federal funds purchased 1,475 - - - - - 1,475 Borrowings 250,807 9 3 21 50,233 - 301,073 Other liabilities - - - - - 180,404 180,404 Stockholders' Equity - - - - - 477,415 477,415 ---------- ----------- ---------- ----------- ---------- ------------ ---------- Total Liabilities & Equity $ 252,282 $1,612,783 $ 965,174 $ 1,908,895 $ 553,234 $ 657,819 $5,950,187 ========== =========== ========== =========== ========== ============ ========== Interest sensitivity gap $ 193,831 $ 121,651 $(321,342) $ (729,922) $ 715,927 $ 19,855 Cumulative interest rate sensitivity gap $ 193,831 $ 315,482 $ (5,860) $ (735,782) $ (19,855) $ - Cumulative interest rate sensitivity gap as a percentage of total earning assets 4.0 % 6.0 % (0.1)% (14.0)% (0.4)%
|
|
|
|
|
|
|
|
|
|
|
|
|
|
|
|
|
|
|
|
|
|
|
TABLE 19. Analysis of Interest Sensitivity (continued) | ||||||||||||||||||||||
|
|
|
|
|
|
|
|
|
|
|
|
|
|
|
|
|
|
|
|
|
|
|
|
| December 31, 2007 | ||||||||||||||||||||
| ||||||||||||||||||||||
|
| Overnight |
| Within |
| 6 months |
| 1 to 3 |
| > 3 |
| Non-Sensitive |
| Total |
| |||||||
|
|
|
|
|
|
|
|
| ||||||||||||||
|
| (In thousands) | ||||||||||||||||||||
Assets |
|
|
|
|
|
|
|
|
|
|
|
|
|
|
|
|
|
|
|
|
|
|
Securities |
| $ | 2,003 |
| $ | 513,981 |
| $ | 188,854 |
| $ | 412,428 |
| $ | 530,680 |
| $ | 29,675 |
| $ | 1,677,621 |
|
Federal funds sold & short-term investments |
|
| 126,281 |
|
| — |
|
| — |
|
| — |
|
| — |
|
| — |
|
| 126,281 |
|
Loans |
|
| — |
|
| 1,811,351 |
|
| 289,337 |
|
| 745,239 |
|
| 722,464 |
|
| — |
|
| 3,568,391 |
|
Other assets |
|
| — |
|
| — |
|
| — |
|
| — |
|
| — |
|
| 683,686 |
|
| 683,686 |
|
|
|
|
|
|
|
|
|
| ||||||||||||||
Total Assets |
| $ | 128,284 |
| $ | 2,325,332 |
| $ | 478,191 |
| $ | 1,157,667 |
| $ | 1,253,144 |
| $ | 713,361 |
| $ | 6,055,979 |
|
|
|
|
|
|
|
|
|
| ||||||||||||||
Liabilities |
|
|
|
|
|
|
|
|
|
|
|
|
|
|
|
|
|
|
|
|
|
|
Interest bearing transaction deposits |
| $ | — |
| $ | 652,915 |
| $ | 299,590 |
| $ | 875,616 |
| $ | 139,795 |
| $ | — |
| $ | 1,967,916 |
|
Time deposits |
|
| — |
|
| 1,414,005 |
|
| 511,260 |
|
| 144,284 |
|
| 64,195 |
|
| — |
|
| 2,133,744 |
|
Non-interest bearing deposits |
|
| — |
|
| — |
|
| — |
|
| 45,402 |
|
| 862,472 |
|
| — |
|
| 907,874 |
|
Federal funds purchased |
|
| 4,100 |
|
| — |
|
| — |
|
| — |
|
| — |
|
| — |
|
| 4,100 |
|
Borrowings |
|
| 371,604 |
|
| 11 |
|
| — |
|
| 30 |
|
| 10,518 |
|
| — |
|
| 382,163 |
|
Other liabilities |
|
| — |
|
| — |
|
| — |
|
| — |
|
| — |
|
| 105,995 |
|
| 105,995 |
|
Stockholders’ equity |
|
| — |
|
| — |
|
| — |
|
| — |
|
| — |
|
| 554,187 |
|
| 554,187 |
|
|
|
|
|
|
|
|
|
| ||||||||||||||
Total Liabilities & Equity |
| $ | 375,704 |
| $ | 2,066,931 |
| $ | 810,850 |
| $ | 1,065,332 |
| $ | 1,076,980 |
| $ | 660,182 |
| $ | 6,055,979 |
|
|
|
|
|
|
|
|
|
| ||||||||||||||
Interest sensitivity gap |
| $ | (247,420 | ) | $ | 258,401 |
| $ | (332,659 | ) | $ | 92,335 |
| $ | 176,164 |
| $ | 53,179 |
|
|
|
|
Cumulative interest rate sensitivity gap |
| $ | (247,420 | ) | $ | 10,981 |
| $ | (321,678 | ) | $ | (229,343 | ) | $ | (53,179 | ) |
| — |
|
|
|
|
Cumulative interest rate sensitivity gap as a percentage of total earning assets |
|
| (4.6 | )% |
| 0.2 | % |
| (5.9 | )% |
| (4.2 | )% |
| (1.0 | )% |
|
|
|
|
|
|
Net Interest Income at Risk
NII at risk measures the risk of a decline in earnings due to changes in interest rates. Table 2120 presents an analysis of Hancock’sour IRR as measured by the estimated changes in NII resulting from an instantaneous and sustained parallel shift in the yield curve at December 31, 2006.2008. Shifts are measured in 100 basis point increments (+ 300 through — 300- 100 basis points) from base case. Base case encompasses key assumptions for asset/liability mix, loan and deposit growth, pricing, prepayment speeds, deposit decay rates, securities portfolio cash flows and reinvestment strategy, and the market value of certain assets under the various interest rate scenarios. The base case scenario assumes that the current interest rate environment is held constant throughout the forecast period; the instantaneous shocks are performed against that yield curve.
TABLE 21. Net Interest Income (te) at Risk - ------------------------------------------------------------------------------------------------------ Change in Estimated Increase Interest (Decrease) in NII Rates December 31, 2006 ------------------------- --------------------------------------- (basis points)-300 -13.7% -200 -7.7% -100 -2.9% Stable 0.0% + 100 1.4% + 200 2.5% + 300 3.3% Most Likely -0.7% - ------------------------------------------------------------------------------------------------------
|
|
|
|
|
TABLE 20. Net Interest Income (te) at Risk | ||||
| ||||
Change in |
| Estimated Increase | ||
| ||||
(basis points) |
|
| ||
|
|
|
|
|
-100 |
|
| -8.5 | % |
Stable |
|
| 0.0 | % |
+ 100 |
|
| 7.2 | % |
+ 200 |
|
| 11.4 | % |
+ 300 |
|
| 12.3 | % |
| ||||
Most Likely |
|
| 2.0 | % |
Additionally, we have forecastforecasted a Most Likely NII scenario based on its conservative projection of yield curve changes for the coming 12 month period. This scenario utilizes all base case assumptions, applying those assumptions against a yield curve forecast that incorporates the current interest rate environment and projects certain strategic pricing changes over the forecast period. Table 2120 indicates that Hancock’sour level of NII significantly increases under rising rates and declines under falling rates. It should be noted that -100 is only presented as interest rates are at historic lows with Fed Funds target at 0.25% at December 31, 2008. The most likely scenario for interest rates projects a modest 2.0% increase in net interest income to be relatively flat with base case falling by 0.7% indicating that the
balance sheet is appropriately structured for the current rate environment.
The increasing rate scenarios show increasedsignificant increase to levels of net interest income while the decreasing scenarios show higher levels of volatility and subsequentlydown 100 scenario shows lower levels of NII. These scenarios are instantaneous shocks that assume balance sheet management will mirror base case. Should the yield curve begin to rise or fall, management has several strategies available to maximize earnings opportunities or offset the negative impact to earnings. For example, in a fallingrising rate environment, deposit pricing strategies could be adjusted to further incent customer behavior to non-contractual or short term (less than 12 months) contractual deposit products which would reset downward with the changes in the yield curveoffer more competitive rates on long and prevailing market rates.medium-term CDs and less competitive rates on short-term CDs. Another opportunity at the start of such a cycle would be reinvesting the securities portfolio cash flows into longer term, non-callable bondsshort-term or floating-rate securities. On the loan side the company can make more floating-rate loans that would lock in higher yields.tie to index that re-price more frequently, such as LIBOR (London interbank offered rate) and make fewer fixed-rate loans. Finally, there are a number of hedge strategies by which management could use derivatives, including swaps and purchased floors,ceilings, to lock in net interest margin protection; to date, management haswe have not entered into any hedge transactions for the purpose of earnings protection.
Even if interest rates change in the designated amounts, there can be no assurance that Hancock’sour assets and liabilities would perform as anticipated. Additionally, a change in the U.S. Treasury rates in the designated amounts accompanied by a change in the shape of the U.S. Treasury yield curve would cause significantly different changes to NII than indicated above. Strategic management of Hancock’sour balance sheet and earnings is fluid and would be adjusted to accommodate these movements. As with any method of measuring IRR, certain shortcomings are inherent in the methods of analysis presented above. For example, although certain assets and liabilities may have similar maturities or periods to repricing, they may react in different degrees to changes in market interest rates. Also, the interest rates on certain types of assets and liabilities may fluctuate in advance of changes in market interest rates, while interest rates on other types may lag behind changes in market rates. Certain assets such as adjustable-rate loans have features which restrict changes in interest rates on a short-term basis and over the life of the asset. Also, the ability of many borrowers to service their debt may decrease in the event of an interest rate increase. We consider all of these factors in monitoring its exposure to interest rate risk.
LIQUIDITY
Liquidity Management
Liquidity management encompasses the Company’sour ability to ensure that funds are available to meet the cash flow requirements of depositors and borrowers, while also ensuring that the Company haswe have adequate cash flow to meet itsour various needs, including operating, strategic and capital. Without proper liquidity management, the Companywe would not be able to perform the primary function of a financial intermediary and would not be able to meet the needs of the communities in which it haswe have a presence and serves.serve. In addition, the parent holding company’s principal source of liquidity is dividends from its subsidiary banks. Liquidity is required at the parent holding company level for the purpose of paying dividends to stockholders, servicing of any debt the Companywe may have, business combinations as well as general corporate expenses.
The asset portion of the balance sheet provides liquidity primarily through loan principal repayments, maturities of investment securities and occasional sales of various assets. Short-term investments such as federal funds sold, securities purchased under agreements to resell and maturing interest-bearing deposits with other banks are additional sources of liquidity funding. As shown in Table 2221 below, our liquidity ratios as of December 31, 20062008 and 20052007 for free securities stood at 35%22.5% or $661.3$378.4 million and 42%17.1% or $819.0$286.9 million, respectively.
TABLE 22. Liquidity Ratios - ----------------------------------------------------------------------------------------------------------------------------- 2006 2005 ------------------------------------------------(In thousands) Free securities 34.50% 41.80% Free securities-net wholesale funds/core deposits 5.40% 11.10% ------------------------------------------------ Wholesale funding diversification Certificate of deposits > $100,000 (excluding public funds) 9.80% 6.90% Brokered certificate of deposits 4.00% 0.40% Public fund certificate of deposits $126,493 $149,612 ------------------------------------------------ Net wholesale funding maturity concentrations Overnight 0.10% 0.00% Up to 3 months 3.50% 1.40% Up to 6 months 3.70% 1.70% Over 6 months 6.60% 5.20% ------------------------------------------------ Net wholesale funds $826,082 $514,003 Core deposits $4,242,726 $4,303,561 ------------------------------------------------
|
|
|
|
|
|
|
|
TABLE 21. Liquidity Ratios |
|
|
|
|
|
|
|
|
|
|
|
|
|
|
|
|
| 2008 |
| 2007 |
| ||
|
| ||||||
|
| (In thousands) |
| ||||
Free securities |
|
| 22.50 | % |
| 17.10 | % |
Free securities-net wholesale funds/core deposits |
|
| -5.25 | % |
| -7.40 | % |
|
| ||||||
Wholesale funding diversification |
|
|
|
|
|
|
|
Certificate of deposits > $100,000 (excluding public funds) |
|
| 11.57 | % |
| 11.10 | % |
Brokered certificate of deposits |
|
| 0.00 | % |
| 0.00 | % |
Public fund certificate of deposits |
| $ | 168,388 |
| $ | 220,942 |
|
|
| ||||||
Net wholesale funding maturity concentrations |
|
|
|
|
|
|
|
Overnight |
|
| 0.00 | % |
| 0.10 | % |
Up to 3 months |
|
| 6.92 | % |
| 6.00 | % |
Up to 6 months |
|
| 1.64 | % |
| 3.80 | % |
Over 6 months |
|
| 9.94 | % |
| 7.30 | % |
|
| ||||||
Net wholesale funds |
| $ | 1,325,274 |
| $ | 1,037,475 |
|
Core deposits |
| $ | 4,474,625 |
| $ | 4,158,189 |
|
|
| ||||||
The liability portion of the balance sheet provides liquidity through various customers’ interest-bearing and non-interest-bearing deposit accounts. Purchases of federal funds, securities sold under agreements to repurchase and other short-term borrowings are additional sources of liquidity and represent the Company’sour incremental borrowing capacity. These sources of liquidity are short-term in nature and are used as necessary to fund asset growth and meet short-term liquidity needs. The Company’sOur short-term borrowing capacity includes an approved line of credit with the Federal Home Loan Bank of $346.8$359.8 million and borrowing capacity at the Federal Reserve’s Discount Window in excess of $100 million. As of December 31, 20062008 and 2005, the Company’s2007, our core deposits were $4.242$4.5 billion and $4.304$4.2 billion, respectively, and Net Wholesale Funding stood at $826.1 million$1.3 billion and $514.0 million,$1.0 billion, respectively.
The Consolidated Statements of Cash Flows provide an analysis of cash from operating, investing, and financing activities for each of the three years in the period ended December 31, 2006.2008. Cash flows from operations are a significant part of liquidity management, contributing significant levels of funds in 2006, 20052008, 2007 and 2004.2006.
Cash flows from operations increased to $74.9$94.4 million in 20062008 from $71.1$56.1 million in 2005.2007. Net cash used by investing activities decreasedincreased to $97.6$1.11 billion in 2008 from $107.3 million in 2006 from $1.172 billion in 2005 due to securities transactions in the amount of $97.1 million. In 2006, securities transaction activity resulted in a net use of funds, while in 2005 proceeds from the sales and maturities of securities resulted in a net use of funds in the amount of $1.355 billion.2007. Federal funds sold decreased to $190.7increased $57.4 million during 20062008 and increased $260.8decreased $94.5 million during 2005. We paid approximately $3.9 million in connection with the acquisition of a business combination in 2005.2007. Cash flows used forprovided by financing activities were $58.3$1.03 billion in 2008, primarily from the increase in deposits compared to cash flows provided by financing activities of $43.7 million in 2006 as compared to $1,216 billion provided in 2005 primarily by deposit growth.2007.
Contractual Obligations
Hancock has We have contractual obligations to make future payments on certain debt and lease agreements. Table 2322 summarizes all significant contractual obligations at December 31, 2006,2008, according to payments due by period.
|
|
|
|
|
|
|
|
|
|
|
|
|
|
|
|
|
TABLE 22. Contractual Obligations | ||||||||||||||||
| ||||||||||||||||
|
| Payment due by period |
| |||||||||||||
|
| |||||||||||||||
|
| Total |
| Less than |
| 1-3 |
| 3-5 |
| More than |
| |||||
|
| |||||||||||||||
|
| (In thousands) |
| |||||||||||||
Certificates of deposit |
| $ | 2,271,736 |
| $ | 1,321,050 |
| $ | 737,807 |
| $ | 212,879 |
| $ | — |
|
Short-term debt obligations |
|
| 516,619 |
|
| 265,359 |
|
| 131,978 |
|
| 119,282 |
|
| — |
|
Long-term debt obligations |
|
| 236 |
|
| 14 |
|
| 35 |
|
| 49 |
|
| 138 |
|
Capital lease obligations |
|
| 402 |
|
| 152 |
|
| 107 |
|
| 60 |
|
| 83 |
|
Operating lease obligations |
|
| 32,583 |
|
| 4,563 |
|
| 6,677 |
|
| 4,152 |
|
| 17,191 |
|
|
| |||||||||||||||
Total |
| $ | 2,821,576 |
| $ | 1,591,138 |
| $ | 876,604 |
| $ | 336,422 |
| $ | 17,412 |
|
|
| |||||||||||||||
TABLE 23. Contractual Obligations - ---------------------------------------------------------------------------------------------------------------------------- Payment due by period --------------------------------------------------------------------------- Less than 1-3 3-5 More than Total 1 year years years 5 years ---------------------------------------------------------------------------(In thousands) Certificates of deposit $ 1,881,183 $ 1,535,855 $ 281,425 $ 63,895 $ 8 Short-term debt obligations 222,391 222,391 - - - Long-term debt obligations 258 10 25 35 188 Operating lease obligations* 16,942 4,137 5,507 3,299 3,999 --------------------------------------------------------------------------- Total $ 2,120,774 $ 1,762,393 $ 286,957 $ 67,229 $ 4,195 =========================================================================== *We have no material capital lease obligations.
CAPITAL RESOURCES
A strong capital position, which is vital to the continued profitability, of the Company, also promotes depositor and investor confidence and provides a solid foundation for the future growth of the Company.growth. Composite ratings by the respective regulatory authorities of the Company and the Banks establish minimum capital levels. Currently, the Company and the Bankswe are required to maintain minimum Tier 1 leverage ratios of at least 3%, subject to an increase up to 5%, depending on the composite rating. At December 31, 2006, the Company’s and the Banks’2008, our capital balances were in excess of current regulatory minimum requirements. As indicated in Table 2423 below, theour regulatory capital ratios of the Company and the Banks far exceed the minimum required ratios, and the Bankswe have been categorized as “well capitalized” in the most recent notice received from their regulators.
The Company remains We remain very well capitalized. As of December 31, 2006, Hancock’s2008, our Leverage (tier one) Ratio stands at 8.63%8.06%, while the Tangible Equity Ratio is 8.24%7.62% (see below in Table 24)23). While Hancock remainswe remain very well capitalized, so that we maintain flexibility for future capital needs, including acquisitions, the Companywe may consider raising additional capital at some point in the future.
TABLE 24. Risk-Based Capital and Capital Ratios - --------------------------------------------------------------------------------------------------------------------------- 2006 2005 2004 2003 2002 ----------------------------------------------------------------(In thousands) Tier 1 regulatory capital $510,639 $420,283 $399,320 $378,262 $354,535 Tier 2 regulatory capital 46,583 46,218 38,161 34,175 29,544 ---------------------------------------------------------------- Total regulatory capital $557,222 $466,501 $437,481 $412,437 $384,079 ---------------------------------------------------------------- Risk-weighted assets $4,097,400 $3,665,722 $3,222,554 $2,770,904 $2,383,423 ---------------------------------------------------------------- Ratios Leverage (Tier 1 capital to average assets) 8.63% 7.85% 8.97% 9.29% 9.19% Tier 1 capital to risk-weighted assets 12.46% 11.47% 12.39% 13.65% 14.88% Total capital to risk-weighted assets 13.60% 12.73% 13.58% 14.88% 16.11% Common stockholders' equity to
TABLE 23. Risk-Based Capital and Capital Ratios
2008
2007
2006
2005
2004
(In thousands)
Tier 1 regulatory capital
$
550,216
$
498,731
$
510,639
$
420,283
$
399,320
Tier 2 regulatory capital
61,874
47,447
46,583
46,218
38,161
Total regulatory capital
$
612,090
$
546,178
$
557,222
$
466,501
$
437,481
Risk-weighted assets
$
5,452,992
$
4,523,479
$
4,097,400
$
3,665,722
$
3,222,554
Ratios
Leverage (Tier 1 capital to average assets)
8.06
%
8.51
%
8.63
%
7.85
%
8.97
%
Tier 1 capital to risk-weighted assets
10.09
%
11.03
%
12.46
%
11.47
%
12.39
%
Total capital to risk-weighted assets
11.22
%
12.07
%
13.60
%
12.73
%
13.58
%
Common stockholders’ equity to total assets
8.50
%
9.15
%
9.36
%
8.02
%
9.96
%
Tangible common equity to total assets
7.62
%
8.08
%
8.24
%
6.89
%
8.58
%
During 2008, we purchased a total
assets 9.36% 8.02% 9.96% 9.59% 9.75% Tangible common equity to total assets 8.24% 6.89% 8.58% 8.32% 8.45% ----------------------------------------------------------------
The Company continued the execution of the common stock buyback program, which provides for the repurchase of up to 10% of the Company’s outstanding common stock. This program was announced in July 2000 and authorized the repurchase of approximately 3,320,000 shares of the Company’s outstanding stock. Over the course of 2006, the Company purchased 33,4096,458 shares of common stock at an aggregate price of $1.7 million,$260,000, or approximately $50.30$40.26 per share. In 2005, the CompanyDuring 2007, we purchased 147,909a total of 1,556,220 shares of common stock at an aggregate price of $4.5$60.4 million, or approximately $30.45$38.84 per share. As
In November 2007, the board of December 31, 2006,directors approved the total number2007 Stock Repurchase Plan, authorizing the repurchase of 3,000,000 shares, or approximately 10% of our outstanding common stock. Subject to market conditions, repurchases will be conducted solely through a Rule 10b-1 repurchase plan. Shares repurchased under this plan will be held in treasury and used for general corporate purposes as determined by our board of directors. In 2007, we purchased 10,842 shares of common shares purchasedstock under this plan at an aggregate price of $421,000, or approximately $38.84 per share.
During 2007, we completed the currentJuly 2000 common stock buyback program, since inception was approximately 2,641,393,which provided for the repurchase of 3,320,000 shares or 8.0%,10% of the outstanding common stock at that time. In 2007, we purchased the remaining 1,545,378 shares of common stock available to be repurchased under this plan at June 30, 2000.an aggregate price of $60.0 million, or approximately $38.84 per share.
Table 24 summarizes our unaudited quarterly financial results for 2008 and 2007.
|
|
|
|
|
|
|
|
|
|
|
|
|
|
TABLE 24. Summary of Quarterly Results | |||||||||||||
| |||||||||||||
|
| 2008 |
| ||||||||||
|
|
| |||||||||||
|
| First |
| Second |
| Third |
| Fourth |
| ||||
|
|
|
|
|
| ||||||||
|
| (In thousands, except per share data) |
| ||||||||||
Interest income (te) |
| $ | 87,227 |
| $ | 84,164 |
| $ | 86,774 |
| $ | 87,726 |
|
Interest expense |
|
| (34,345 | ) |
| (29,573 | ) |
| (29,357 | ) |
| (32,727 | ) |
|
|
|
|
|
| ||||||||
Net interest income (te) |
|
| 52,882 |
|
| 54,591 |
|
| 57,417 |
|
| 54,999 |
|
Provision for loan losses |
|
| (8,818 | ) |
| (2,787 | ) |
| (8,064 | ) |
| (17,116 | ) |
Noninterest income |
|
| 36,421 |
|
| 31,838 |
|
| 30,115 |
|
| 29,404 |
|
Noninterest expense |
|
| (50,134 | ) |
| (52,189 | ) |
| (55,483 | ) |
| (55,637 | ) |
Taxable equivalent adjustment |
|
| (2,455 | ) |
| (2,432 | ) |
| (2,642 | ) |
| (2,925 | ) |
|
|
|
|
|
| ||||||||
Income before income taxes |
|
| 27,896 |
|
| 29,021 |
|
| 21,343 |
|
| 8,725 |
|
Income tax expense |
|
| (7,839 | ) |
| (8,037 | ) |
| (5,338 | ) |
| (405 | ) |
|
|
|
|
|
| ||||||||
Net income |
| $ | 20,057 |
| $ | 20,984 |
| $ | 16,005 |
| $ | 8,320 |
|
|
|
|
|
|
| ||||||||
|
|
|
|
|
|
|
|
|
|
|
|
|
|
Earnings per share |
|
|
|
|
|
|
|
|
|
|
|
|
|
Basic |
| $ | 0.64 |
| $ | 0.67 |
| $ | 0.51 |
| $ | 0.26 |
|
Diluted |
| $ | 0.63 |
| $ | 0.66 |
| $ | 0.50 |
| $ | 0.26 |
|
|
|
|
|
|
|
|
|
|
|
|
|
|
|
|
| 2007 |
| ||||||||||
|
|
| |||||||||||
|
| First |
| Second |
| Third |
| Fourth |
| ||||
|
|
|
|
|
| ||||||||
|
| (In thousands, except per share data) |
| ||||||||||
Interest income (te) |
| $ | 88,077 |
| $ | 87,162 |
| $ | 89,982 |
| $ | 90,015 |
|
Interest expense |
|
| (34,308 | ) |
| (33,394 | ) |
| (36,467 | ) |
| (36,067 | ) |
|
|
|
|
|
| ||||||||
Net interest income (te) |
|
| 53,769 |
|
| 53,768 |
|
| 53,515 |
|
| 53,948 |
|
Provision for loan losses |
|
| (1,211 | ) |
| (1,238 | ) |
| (1,554 | ) |
| (3,590 | ) |
Noninterest income |
|
| 26,510 |
|
| 30,786 |
|
| 31,232 |
|
| 32,158 |
|
Noninterest expense |
|
| (49,708 | ) |
| (52,374 | ) |
| (55,857 | ) |
| (58,804 | ) |
Taxable equivalent adjustment |
|
| (2,416 | ) |
| (2,267 | ) |
| (2,373 | ) |
| (2,483 | ) |
|
|
|
|
|
| ||||||||
Income before income taxes |
|
| 26,944 |
|
| 28,675 |
|
| 24,963 |
|
| 21,229 |
|
Income tax expense |
|
| (7,715 | ) |
| (8,352 | ) |
| (7,224 | ) |
| (4,628 | ) |
|
|
|
|
|
| ||||||||
Net income |
| $ | 19,229 |
| $ | 20,323 |
| $ | 17,739 |
| $ | 16,601 |
|
|
|
|
|
|
| ||||||||
|
|
|
|
|
|
|
|
|
|
|
|
|
|
Earnings per share |
|
|
|
|
|
|
|
|
|
|
|
|
|
Basic |
| $ | 0.59 |
| $ | 0.63 |
| $ | 0.55 |
| $ | 0.53 |
|
Diluted |
| $ | 0.58 |
| $ | 0.62 |
| $ | 0.55 |
| $ | 0.53 |
|
Net interest income (te) is the primary component of earnings and represents the difference, or spread, between revenue generated from interest-earning assets and the interest expense related to funding those assets.
CRITICAL ACCOUNTING POLICIES AND ESTIMATES
The accounting principles we follow and the methods for applying these principles conform with accounting principles generally accepted in the United States of America and with general practices followed by the banking industry.industry which requires management to make estimates and assumptions about future events. These estimates and assumptions are based on our best estimates and judgments. We evaluate estimates and assumptions on an ongoing basis using historical experience and other factors, including the current economic environment. We adjust such estimates and assumptions when facts and circumstances dictate. Illiquid credit markets, volatile equity markets, rising unemployment levels and declines in consumer spending have combined to increase the uncertainty inherent in such estimates and assumptions. Certain critical accounting policies affect the more significant judgments and estimates used in the preparation of the consolidated financial statements.
Allowance for Loan Losses
Our most critical accounting policy relates to our allowance for loan losses, which reflects the estimated losses resulting from the inability of our borrowers to make loan payments. If the financial condition of its borrowers were to deteriorate, resulting in an impairment of their ability to make payments, the estimates of the allowance would be updated, and additional provisions for loan losses may be required.
The allowance for loan and lease losses (ALLL) is a valuation account available to absorb losses on loans. The ALLL is established and maintained at an amount sufficient to cover the estimated credit loss associated with the loan and lease portfolios of the Banks as of the date of the determination. Credit losses arise not only from credit risk, but also from other risks inherent in the lending process including, but not limited to, collateral risk, operational risk, concentration risk, and economic risk. As such, all related risks of lending are considered when assessing the adequacy of the allowance for loan and lease losses. Quarterly, management estimates the probable level of losses to determine whether the allowance is adequate to absorb reasonably foreseeable, anticipated losses in the existing portfolio based on Hancock’sour past loan loss and delinquency experience, known and inherent risks in the portfolio, adverse situations that may affect the borrowers’ ability to repay, and the estimated value of any underlying collateral and current economic conditions. The analysis and methodology include three primary segments. These segments include a pool analysis of various retail loans based upon loss history, a pool analysis of commercial and commercial real estate loans based upon loss history by loan type, and a specific reserve analysis for those loans considered impaired under SFAS No. 114. All commercial and commercial real estate loans with an outstanding balance of $100,000 or greater are individually reviewed for impairment; substandard mortgage loans with balances of $100,000 or greater are also included in the analysis. All losses are charged to the allowance for loan and lease losses when the loss actually occurs or when a determination is made that a loss is likely to occur; recoveries are credited to the allowance for loan losses at the time of receipt.
Retirement Employee Benefit Plans
Retirement and employee benefit plan assets, liabilities and pension costs are determined utilizing actuarially determined present value calculations. The valuation of the benefit obligation and net periodic expense is considered critical, as it requires management and its actuaries to make estimates regarding the amount and timing of expected cash outflows including assumptions about mortality, expected service periods, rate of compensation increases and the long-term return on plan assets. Note 13 —9 – Retirement and Employee Benefit Plans, included in the accompanying Notes to the Consolidated Financial Statements, provides further discussion on the accounting for Hancock’s retirement and employee benefit plans and the estimates used in determining the actuarial present value of the benefit obligations and the net periodic benefit expense.
Fair Value Accounting Estimates
Generally accepted accounting principles require the use of fair values in determining the carrying values of certain assets and liabilities, as well as for specific disclosures. The most significant include securities, loans held for sale, mortgage servicing rights and net assets acquired in business combinations. Certain of these assets do not have a readily available market to determine fair value and require an estimate based on specific parameters. When market prices are unavailable, Hancock determineswe determine fair values utilizing parameters, which are constantly changing, including interest rates, duration, prepayment speeds and other specific conditions.
In most cases, these specific parameters require a significant amount of judgment by management.
In May 2005, the FASB issued SFAS No. 154,Accounting Changes and Error Corrections (“SFAS No. 154”). SFAS No. 154 is a replacement of APB Opinion No. 20,Accounting Changes, and SFAS No. 3,Reporting Accounting Changes in Interim Financial Statements, and changes the requirements for the accounting for and reporting of a change in accounting principle. SFAS No. 154 applies to all voluntary changes in accounting principle and to changes required by an accounting pronouncement in the unusual instance that the pronouncement does not include specific transition provisions. This statement requires retrospective application to prior periods’ financial statements of changes in accounting principle, unless it is impracticable to determine period-specific effects of an accounting change on one or more individual prior periods presented. Then the new accounting principle is applied to the balances of assets and liabilities as of the beginning of the earliest period for which retrospective application is practicable and that a corresponding adjustment be made to the opening balance of retained earnings for that period rather that being reported in an income statement. Further, the accounting principle is to be applied prospectively from the earliest date when it is impracticable to determine the effect to all prior periods. We The Company adopted SFAS No. 154 as of January 1, 2006 as required and its effect on the consolidated financial statements, to date, has not been material. Adoption of this statement could have an impact if there are future voluntary accounting changes and correction of errors.
In September 2005, the American Institute of Certified Public Accountants (“AICPA”) issued Statement of Position (SOP) 05-1,Financial Accounting by Insurance Enterprises for Deferred Acquisition Costs in Connection with Modifications or Exchanges of Insurance Contracts (“SOP 05-1”). SOP 05-1 provides guidance on accounting by insurance enterprises for deferred acquisition costs on internal replacements of insurance and investment contracts other than those specifically described in FASB Statement No. 97,Accounting and Reporting by Insurance Enterprises for Certain Long-Duration Contracts and for Realized Gains and Losses from the Sale of Investments. The provisions in SOP 05-1 are effective for us beginning in fiscal year 2007. We are currently evaluating the requirements of SOP 05-1 and have not yet determined the impact on our consolidated financial statements.
In March 2006, the FASB issued SFAS No. 156,Accounting for Servicing of Financial Assets (“SFAS No. 156”). SFAS No. 156 requires all separately recognized servicing assets and servicing liabilities to be initially measured at fair value, if practicable, and permits an entity to subsequently measure those servicing assets and servicing liabilities at fair value. This pronouncement is effective for us beginning in fiscal year 2007. We intend on using the amortization method and do not believe the adoption of SFAS No. 156 will have a material impact on its results of operations and financial position.
In June 2006, the FASB issued Interpretation No. 48,Accounting for Uncertainty in Income Taxes, An Interpretation of FASB Statement No. 109 (“FIN 48”). FIN 48 clarifies that the benefit of a position taken or expected to be taken in a tax return should be recognized in a company’s financial statements in accordance with SFAS No.109,Accounting for Income Taxes, when it is more likely than not that the position will be sustained based on its technical merits. FIN 48 also prescribes how to measure the tax benefit recognized and provides guidance on when a tax benefit should be derecognized as well as various other accounting, presentation and disclosure matters. This interpretation is effective for us beginning in fiscal year 2007. We do not believe the adoption of FIN 48 will have a material impact on our results of operations and financial position.
In September 2006, the FASB issued SFASStandards (SFAS) No. 157,Fair Value Measurements (“SFAS No. 157”). This standard defines fair value, establishes, on January 1, 2008.SFAS No. 157establishes a framework for measuring fair value inunder generally accepted accounting principles generally accepted in(GAAP), clarifies the United Statesdefinition of America,fair value within that framework, and expands disclosuredisclosures about the use of fair value measurements. This pronouncement applies to other accounting standards that require or permit fair value measurements. Accordingly, this statement does not require any new fair value measurement. This statement is effective for fiscal years beginning after November 15, 2007, and interim periods within those fiscal years. We will be required to adopt SFAS No. 157 defines a fair value hierarchy that prioritizes the inputs to these valuation techniques used to measure fair value giving preference to quoted prices in active markets (level 1) and the first quarterlowest priority to unobservable inputs such as a reporting entity’s own data (level 3). Level 2 inputs include quoted prices for similar assets or liabilities in active markets, quoted prices for identical assets or liabilities in markets that are not active, observable inputs other than quoted prices, such as interest rates and yield curves, and inputs that are derived principally from or corroborated by observable market data by correlation or other means. Available for sale securities classified as Level 1 within the valuation hierarchy include U.S. Treasury securities, obligations of fiscal year 2008. We are currently evaluating the requirements of SFAS No. 157U.S. Government-sponsored agencies, and have not yet determined the impact on our consolidated financial statements.other debt and equity securities. Level 2 classified available for sale securities include mortgage-backed debt securities, collateralized mortgage obligations, and state and municipal bonds.
In September 2006,October 2008, the FASB issued SFASFSP No. 158,157-3, Employers’ Accounting for Defined Benefit Pension and Other Postretirement Plans — An Amendment of FASB Statements No. 87, 88, 106, and 132(R) (“SFAS No. 158”). This pronouncement requires an employer to recognizeDetermining the over funded or under funded statusFair Value of a defined benefit postretirement plan (other thanFinancial Asset in a multiemployer plan) asMarket That is Not Active, which clarifies the application of Statement of Financial Accounting Standard (SFAS) No. 157, Fair Value Measurements, in an asset or liability on its statementinactive market. Application issues clarified include: how management’s internal assumptions should be considered when measuring fair value when relevant observable data do not exist; how observable market information in a market that is not active should be considered when measuring fair value; and how the use of financial position. SFAS No. 158 also requires an employer to recognize changes in that funded status inmarket quotes should be considered when assessing the year in which the changes occur through comprehensive income effective for fiscal years ending after December 15, 2006. In addition, this statement requires an employerrelevance of observable and unobservable data available to measure the funded status of a plan as of the date of its year-end statement of financial positionfair value. FSP 157-3 was effective for fiscal years ending after December 15, 2008. We adopted the requirement to recognize the funded status of the benefit plansimmediately and related disclosure requirements as of December 31, 2006. We are currently evaluating the requirements of SFAS No. 158 related to the measurement date and havedid not yet determined the impact of adoption on our consolidated financial statements.
In September 2006, the FASB ratified the consensus the EITF reached regarding EITF No.06-5,Accounting for Purchases of Life Insurance — Determining the Amount that Could Be Realized in Accordance with FASB Technical Bulletin 85-4 (“EITF 06-5”). The EITF concluded that a policyholder should consider any additional amounts included in the contractual terms of the life insurance policy in determining the “amount that could be realized under the insurance contract.” For group policies with multiple certificates or multiple policies with a group rider, the Task Force also tentatively concluded that the amount that could be realized should be determined at the individual policy or certificate level, i.e., amounts that would be realized only upon surrendering all of the policies or certificates would not be included when measuring the assets. This interpretation is effective for us beginning in fiscal year 2007. We do not believe the adoption of EITF 06-5 will have a material impact on ourthe Company’s financial condition or results of operationsoperations.
The Company adopted SFAS No. 159, The Fair Value Option for Financial Assets and financial position.Financial Liabilities - Including an Amendment SFAS No. 115 (“SFAS No. 159”), on January 1, 2008. The Company did not elect to fair value any additional items under SFAS No. 159. The Company, in accordance with Financial Accounting Standards Board Staff Position No. 157-2 “The Effective Date of FASB Statement No. 157”, will defer application of SFAS No. 157 for nonfinancial assets and nonfinancial liabilities until January 1, 2009.
In fiscal 2006, we adopted SEC Staff Accounting Bulletin No. 108 (“SAB No. 108”). SAB No. 108Income Taxes
We use the asset and liability method of accounting for income taxes. Determination of the deferred and current provision requires that registrants assess the impact on both balance sheetanalysis by management of certain transactions and the statement of income when quantifyingrelated tax laws and regulations. Management exercises significant judgment in evaluating the materialityamount and timing of recognition of the resulting tax liabilities and assets. Those judgments and estimates are re-evaluated on a misstatement. Under SAB No. 108, adjustment of financial statements is required when either approach resultscontinual basis as regulatory and business factors change.
RECENT ACCOUNTING PRONOUNCEMENTS
See Note 1 to our Consolidated Financial Statements included elsewhere in quantifying a misstatement that is material to a reporting period presented within the financial statements, after considering all relevant quantitative and qualitative factors. The impact of adopting SAB No. 108 was a $2.9 million adjustment to retained earnings as of December 31, 2005, as disclosed in Note 12.this report.
QUANTITATIVE AND QUALITATIVE DISCLOSURES ABOUT MARKET RISK |
The information required for this item is included in the section entitled “Asset/Liability Management” in “Management’s Discussion and Analysis of Financial Condition and Results of Operations” that appears in Item 7 of this Form 10-K and is incorporated here by reference.
ITEM 8. FINANCIAL STATEMENTS AND SUPPLEMENTARY DATA
Index to Financial Statements and Financial Statement SchedulePage
------------
Management's Report on Internal Control Over Financial Reporting 49
Report of Independent Registered Public Accounting Firm 50
Report of Independent Registered Public Accounting Firm 52
Consolidated Balance Sheets as of December 31, 206 and 2005 53
Consolidated Statements of Income for each of the years in the three-year period ended December 31, 2006 54
Consolidated Statements of Stockholders' Equity for each of the years in the three-year period ended December 31, 2006 55
Consolidated Statements of Cash Flows for each of the years in the three-year period ended December 31, 2006 56
Notes to Consolidated Financial Statements 58
Page | |
Management’s Report on Internal Control Over Financial Reporting | 49 |
50 | |
51 | |
Consolidated Balance Sheets as of December 31, 2008 and 2007 | 52 |
53 | |
54 | |
55 | |
57 |
MANAGEMENT’S REPORT ON INTERNAL CONTROL OVER FINANCIAL REPORTING |
The management of Hancock Holding Company has prepared the consolidated financial statements and other information in our Annual Report in accordance with accounting principles generally accepted in the United States of America and is responsible for its accuracy. The financial statements necessarily include amounts that are based on management’s best estimates and judgments.
In meeting its responsibility, management relies on internal accounting and related control systems. The internal control systems are designed to ensure that transactions are properly authorized and recorded in the Company’s financial records and to safeguard the Company’s assets from material loss or misuse. Such assurance cannot be absolute because of inherent limitations in any internal control system.
The Company’s management is responsible for establishing and maintaining the adequate internal control over financial reporting, as such term is defined in the Exchange Act Rules 13(a) —– 15(f). Under the supervision and with the participation of management, including the Company’s principal executive officers and principal financial officer, the Company conducted an evaluation of the effectiveness of internal control over financial reporting based on the framework inInternal Control —– Integrated Framework issued by the Committee of Sponsoring Organizations of the Treadway Commission. Management also conducted an assessment of requirements pertaining to Section 112 of the Federal Deposit Insurance Corporation Improvement Act (FDICIA). This section relates to management’s evaluation of internal control over financial reporting, including controls over the preparation of the schedules equivalent to the basic financial statements and compliance with laws and regulations. Our evaluation included a review of the documentation of controls, evaluations of the design of the internal control system and tests of the effectiveness of internal controls.
Based on the Company’s evaluation under the framework inInternal Control —– Integrated Framework, management concluded that internal control over financial reporting was effective as of December 31, 2006. Management’s assessment2008.
Carl J. Chaney | John M. Hairston | Michael M. Achary |
President & | Chief Executive Officer & | Chief Financial Officer |
Chief Executive Officer | Chief Operating Officer | |
February 27, 2009 | February 27, 2009 | February 27, 2009 |
Report of the effectiveness of internal control over financial reporting as of December 31, 2006 has been audited by KPMG, LLP, an independent registered public accounting firm, as stated in their report which is contained herein.Independent Registered Public Accounting Firm
Carl J. Chaney John M. Hairston Chief Executive Officer & Chief Executive Officer & Chief Financial Officer Chief Operating Officer February 23, 2007 February 23, 2007
The Board of Directors and Stockholders
Hancock Holding Company:
We have audited management’s assessment, included in the accompanying Management’s Report on Internal Control over Financial Reporting, that Hancock Holding Company maintained effectiveCompany’s internal control over financial reporting as of December 31, 2006,2008, based on criteria established inInternal Control—Control - Integrated Framework issued by the Committee of Sponsoring Organizations of the Treadway Commission. Hancock Holding Company’s management is responsible for maintaining effective internal control over financial reporting and for its assessment of the effectiveness of internal control over financial reporting.reporting, included in the accompanying Management’s Report on Internal Control over Financial Reporting. Our responsibility is to express an opinion on management’s assessment and an opinion on the effectiveness of theHancock Holding Company’s internal control over financial reporting based on our audit.
We conducted our audit in accordance with the standards of the Public Company Accounting Oversight Board (United States). Those standards require that we plan and perform the audit to obtain reasonable assurance about whether effective internal control over financial reporting was maintained in all material respects. Our audit included obtaining an understanding of internal control over financial reporting, evaluating management’s assessment,assessing the risk that a material weakness exists, and testing and evaluating the design and operating effectiveness of internal control andbased on the assessed risk. Our audit also included performing such other procedures as we considered necessary in the circumstances. We believe that our audit provides a reasonable basis for our opinion.
A company’s internal control over financial reporting is a process designed to provide reasonable assurance regarding the reliability of financial reporting and the preparation of financial statements for external purposes in accordance with generally accepted accounting principles. Because management’s assessment and our audit were conducted to also meet the reporting requirements of Section 112 of the Federal Deposit Insurance Corporation Improvement Act (FDICIA), management’s assessment and our audit of Hancock Holding Company’s internal control over financial reporting included controls over the preparation of the schedules equivalent to the basic financial statements in accordance with the instructions to the Consolidated Financial Statements for Bank Holding Companies (Form FR Y-9 C). A company’s internal control over financial reporting includes those policies and procedures that (1) pertain to the maintenance of records that, in reasonable detail, accurately and fairly reflect the transactions and dispositions of the assets of the company; (2) provide reasonable assurance that transactions are recorded as necessary to permit preparation of financial statements in accordance with generally accepted accounting principles, and that receipts and expenditures of the company are being made only in accordance with authorizations of management and directors of the company; and (3) provide reasonable assurance regarding prevention or timely detection of unauthorized acquisition, use, or disposition of the company’s assets that could have a material effect on the financial statements.
Because of its inherent limitations, internal control over financial reporting may not prevent or detect misstatements. Also, projections of any evaluation of effectiveness to future periods are subject to the risk that controls may become inadequate because of changes in conditions, or that the degree of compliance with the policies or procedures may deteriorate.
In our opinion, management’s assessment that Hancock Holding Company maintained effective internal control over financial reporting as of December 31, 2006, is fairly stated, in all material respects, based on criteria established inInternal Control—Integrated Framework issued by the Committee of Sponsoring Organizations of the Treadway Commission. Also, in our opinion, Hancock Holding Company maintained, in all material respects, effective internal control over financial reporting as of December 31, 2006,2008, based on criteria established inInternal Control—Control - Integrated Framework issued by the Committee of Sponsoring Organizations of the Treadway Commission.
We do not express an opinion or any other form of assurance on management’s statement referring to compliance with laws and regulations.
We also have audited, in accordance with the standards of the Public Company Accounting Oversight Board (United States), the consolidated balance sheets of Hancock Holding Company and subsidiaries as of December 31, 20062008 and 2005,2007, and the related consolidated statements of income, stockholders’ equity, and cash flows for each of the years in the three-year period ended December 31, 20062008, and our report dated February 23, 200727, 2009 expressed an unqualified opinion on those consolidated financial statements.
/s/ KPMG LLP
/s/ KPMG LLP
Birmingham, Alabama
February23, 2007
Report of Independent Registered Public Accounting Firm
The Board of Directors and Stockholders
Hancock Holding CompanyCompany:
We have audited the accompanying consolidated balance sheets of Hancock Holding Company and subsidiaries as of December 31, 20062008 and 2005,2007, and the related consolidated statements of income, stockholders’ equity and cash flows for each of the years in the three-year period ended December 31, 2006.2008. These consolidated financial statements are the responsibility of the Company’s management. Our responsibility is to express an opinion on these consolidated financial statements based on our audits.
We conducted our audits in accordance with the standards of the Public Company Accounting Oversight Board (United States). Those standards require that we plan and perform the audit to obtain reasonable assurance about whether the financial statements are free of material misstatement. An audit includes examining, on a test basis, evidence supporting the amounts and disclosures in the financial statements. An audit also includes assessing the accounting principles used and significant estimates made by management, as well as evaluating the overall financial statement presentation. We believe that our audits provide a reasonable basis for our opinion.
In our opinion, the consolidated financial statements referred to above present fairly, in all material respects, the financial position of Hancock Holding Company and subsidiaries as of December 31, 20062008 and 2005,2007, and the results of their operations and their cash flows for each of the years in the three yearthree-year period ended December 31, 2006,2008 in conformity with U. S.U.S. generally accepted accounting principles.
We also have also audited, in accordance with the standards of the Public Company Accounting Oversight Board (United States), the effectiveness of Hancock Holding Company’s internal control over financial reporting as of December 31, 2006,2008, based on criteria established inInternal Control —- Integrated Framework issued by the Committee of Sponsoring Organizations of the Treadway Commission (COSO), and our report dated February 23, 200727, 2009 expressed an unqualified opinion on management’s assessmentthe effectiveness of and the effective operation of,Company’s internal control over financial reporting.
As discussed in Note 1 to the consolidated financial statements, the Company changed its method of accounting for share based payments and evaluating prior year misstatements effective January 1, 2006 and,defined benefit pension postretirement benefit plans effective December 31, 2006, its method of accounting for defined benefit pension and postretirement benefit plans.2006.
/s/ KPMG LLP
/s/ KPMG LLP
Birmingham, Alabama
February23, 2007
Hancock Holding Company and Subsidiaries
Consolidated Balance SheetsDecember 31,
----------------------------------------------
2006 2005
--------------------- ---------------------
(In thousands except share data)
Assets:
Cash and due from banks (non-interest bearing) $ 190,114 $ 271,104
Interest-bearing time deposits with other banks 10,197 7,258
Federal funds sold 212,242 402,968
Securities available for sale, at fair value
(amortized cost of $1,916,845 and $1,980,745) 1,903,658 1,959,261
Loans held for sale 16,946 24,219
Loans 3,267,058 2,976,399
Less: Allowance for loan losses (46,772) (74,558)
Unearned income (17,420) (11,432)
--------------------- ---------------------
Loans, net 3,219,812 2,914,628
Property and equipment, net of accumulated
depreciation of $66,043 and $57,922 140,554 79,386
Other real estate, net 568 1,833
Accrued interest receivable 32,984 35,046
Goodwill, net 62,277 61,418
Other intangible assets, net 10,355 10,781
Life insurance contracts 107,170 83,080
Reinsurance receivables 38,042 49,452
Deferred tax asset, net 16,544 40,380
Other assets 20,048 33,592
--------------------- ---------------------
Total assets $ 5,964,565 $ 5,950,187
===================== =====================
Liabilities and Stockholders' Equity:
Deposits:
Non-interest bearing demand $ 1,057,358 $ 1,324,938
Interest-bearing savings, NOW, money market
and time 3,973,633 3,664,882
--------------------- ---------------------
Total deposits 5,030,991 4,989,820
Federal funds purchased 3,800 1,475
Securities sold under agreements to repurchase 218,591 250,807
Long-term notes 258 50,266
Policy reserves and liabilities 93,669 105,368
Other liabilities 58,846 75,036
--------------------- ---------------------
Total liabilities 5,406,155 5,472,772
Common Stockholders' Equity
Common stock-$3.33 par value per share; 75,000,000
shares authorized, 32,666,052 and 32,301,123 issued,
respectively 108,778 107,563
Capital surplus 139,099 129,222
Retained earnings 334,546 265,039
Accumulated other comprehensive loss, net (24,013) (22,066)
Unearned compensation - (2,343)
--------------------- ---------------------
Total common stockholders' equity 558,410 477,415
--------------------- ---------------------
Total liabilities and commonstockholders' equity $ 5,964,565 $ 5,950,187
===================== =====================
|
|
|
|
|
|
|
|
|
| December 31, |
| ||||
|
|
| |||||
|
| 2008 |
| 2007 |
| ||
|
|
|
| ||||
|
| (In thousands, except share data) |
| ||||
Assets: |
|
|
|
|
|
|
|
Cash and due from banks (non-interest bearing) |
| $ | 199,775 |
| $ | 182,615 |
|
Interest-bearing time deposits with other banks |
|
| 11,355 |
|
| 8,560 |
|
Federal funds sold |
|
| 175,166 |
|
| 117,721 |
|
Other short-term investments |
|
| 362,895 |
|
| — |
|
Trading securities |
|
| 2,201 |
|
| 197,425 |
|
Securities available for sale, at fair value |
|
| 1,679,756 |
|
| 1,472,783 |
|
Loans held for sale |
|
| 22,115 |
|
| 18,957 |
|
Loans |
|
| 4,264,324 |
|
| 3,612,883 |
|
Less: Allowance for loan losses |
|
| (61,725 | ) |
| (47,123 | ) |
Unearned income |
|
| (14,859 | ) |
| (16,326 | ) |
|
|
|
| ||||
Loans, net |
|
| 4,187,740 |
|
| 3,549,434 |
|
Property and equipment, net of accumulated depreciation of $101,050 and $87,160 |
|
| 205,912 |
|
| 200,566 |
|
Other real estate, net |
|
| 5,195 |
|
| 2,172 |
|
Accrued interest receivable |
|
| 33,067 |
|
| 35,117 |
|
Goodwill |
|
| 62,277 |
|
| 62,277 |
|
Other intangible assets, net |
|
| 6,363 |
|
| 8,298 |
|
Life insurance contracts |
|
| 144,959 |
|
| 139,421 |
|
Deferred tax asset, net |
|
| 5,819 |
|
| 3,976 |
|
Other assets |
|
| 62,659 |
|
| 56,657 |
|
|
|
|
| ||||
Total assets |
| $ | 7,167,254 |
| $ | 6,055,979 |
|
|
|
|
| ||||
|
|
|
|
|
|
|
|
Liabilities and Stockholders’ Equity: |
|
|
|
|
|
|
|
Deposits: |
|
|
|
|
|
|
|
Non-interest bearing demand |
| $ | 962,886 |
| $ | 907,874 |
|
Interest-bearing savings, NOW, money market and time |
|
| 4,968,051 |
|
| 4,101,660 |
|
|
|
|
| ||||
Total deposits |
|
| 5,930,937 |
|
| 5,009,534 |
|
Federal funds purchased |
|
| — |
|
| 4,100 |
|
Securities sold under agreements to repurchase |
|
| 505,932 |
|
| 371,604 |
|
Long-term notes |
|
| 638 |
|
| 793 |
|
Other liabilities |
|
| 120,248 |
|
| 115,761 |
|
|
|
|
| ||||
Total liabilities |
|
| 6,557,755 |
|
| 5,501,792 |
|
|
|
|
|
|
|
|
|
Stockholders’ Equity |
|
|
|
|
|
|
|
Common stock-$3.33 par value per share; 350,000,000 shares authorized, 31,769,679 and 31,294,607 issued and outstanding, respectively |
|
| 105,793 |
|
| 104,211 |
|
Capital surplus |
|
| 101,210 |
|
| 87,122 |
|
Retained earnings |
|
| 411,579 |
|
| 377,481 |
|
Accumulated other comprehensive loss, net |
|
| (9,083 | ) |
| (14,627 | ) |
|
|
|
| ||||
Total stockholders’ equity |
|
| 609,499 |
|
| 554,187 |
|
|
|
|
| ||||
|
|
|
|
|
|
|
|
Total liabilities and stockholders’ equity |
| $ | 7,167,254 |
| $ | 6,055,979 |
|
|
|
|
| ||||
See accompanying notes to consolidated financial statements.
Hancock Holding Company and Subsidiaries
Consolidated Statements of IncomeYears Ended December 31,
---------------------------------------------------
2006 2005 2004
--------------- --------------- ---------------
(In thousands, except per share data)
Interest income:
Loans, including fees $ 230,450 $ 197,857 $ 169,750
Securities-taxable 93,525 51,360 46,672
Securities-tax exempt 6,770 7,034 7,719
Federal funds sold 9,657 4,447 297
Other investments 3,928 2,933 2,336
--------------- --------------- ---------------
Total interest income 344,330 263,631 226,774
--------------- --------------- ---------------
Interest expense:
Deposits 110,092 67,581 52,570
Federal funds purchased and securities sold
under agreements to repurchase 9,682 4,687 2,141
Long-term notes and other interest expense 89 2,551 2,559
--------------- --------------- ---------------
Total interest expense 119,863 74,819 57,270
--------------- --------------- ---------------
Net interest income 224,467 188,812 169,504
Provision for (reversal of) loan losses (20,762) 42,635 16,537
--------------- --------------- ---------------
Net interest income after provision for (reversal of) loan losses 245,229 146,177 152,967
--------------- --------------- ---------------
Noninterest income:
Service charges on deposit accounts 36,228 34,773 43,631
Trust fees 13,286 11,107 9,030
Insurance commissions and fees 19,246 17,099 9,193
Investment and annuity fees 5,970 5,076 2,295
Debit card and merchant fees 7,298 4,878 4,271
ATM fees 5,005 4,202 4,512
Secondary mortgage market operations 3,528 2,221 2,934
Securities gains (losses), net (5,169) (53) 163
Gains on sales of branches and credit card merchant
services business - - 5,258
Net storm-related gain 5,084 6,584 -
Other income 13,357 12,382 8,994
--------------- --------------- ---------------
Total noninterest income 103,833 98,269 90,281
--------------- --------------- ---------------
Noninterest expense:
Salaries and employee benefits 103,753 94,158 86,404
Net occupancy expense of premises 13,350 10,926 9,915
Equipment rentals, depreciation and maintenance 10,796 9,553 9,669
Amortization of intangibles 2,125 2,194 1,945
Other expense 70,692 54,712 47,018
--------------- --------------- ---------------
Total noninterest expense 200,716 171,543 154,951
--------------- --------------- ---------------
Income before income taxes 148,346 72,903 88,297
Income taxes 46,544 18,871 26,593
--------------- --------------- ---------------
Net income $ 101,802 $ 54,032 $ 61,704
=============== =============== ===============
Basic earnings per common share $ 3.13 $ 1.67 $ 1.91
=============== =============== ===============
Diluted earnings per common share $ 3.06 $ 1.64 $ 1.87
=============== =============== ===============
|
|
|
|
|
|
|
|
|
|
|
|
| Years Ended December 31, |
| |||||||
|
|
| ||||||||
|
| 2008 |
| 2007 |
| 2006 |
| |||
|
|
|
|
| ||||||
|
| (In thousands, except per share data) |
| |||||||
Interest income: |
|
|
|
|
|
|
|
|
|
|
Loans, including fees |
| $ | 246,573 |
| $ | 255,761 |
| $ | 230,450 |
|
Securities-taxable |
|
| 80,048 |
|
| 78,089 |
|
| 97,084 |
|
Securities-tax exempt |
|
| 4,978 |
|
| 6,234 |
|
| 6,770 |
|
Federal funds sold |
|
| 1,858 |
|
| 5,458 |
|
| 9,657 |
|
Other investments |
|
| 1,980 |
|
| 155 |
|
| 102 |
|
|
|
|
|
| ||||||
Total interest income |
|
| 335,437 |
|
| 345,697 |
|
| 344,063 |
|
|
|
|
|
| ||||||
Interest expense: |
|
|
|
|
|
|
|
|
|
|
Deposits |
|
| 111,052 |
|
| 132,920 |
|
| 110,092 |
|
Federal funds purchased and securities sold under agreements |
|
| 14,843 |
|
| 8,231 |
|
| 9,682 |
|
Long-term notes and other interest expense |
|
| 184 |
|
| 80 |
|
| 895 |
|
Capitalized interest |
|
| (77 | ) |
| (995 | ) |
| (806 | ) |
|
|
|
|
| ||||||
Total interest expense |
|
| 126,002 |
|
| 140,236 |
|
| 119,863 |
|
|
|
|
|
| ||||||
Net interest income |
|
| 209,435 |
|
| 205,461 |
|
| 224,200 |
|
Provision for (reversal of) loan losses |
|
| 36,785 |
|
| 7,593 |
|
| (20,762 | ) |
|
|
|
|
| ||||||
Net interest income after provision for (reversal of) loan losses |
|
| 172,650 |
|
| 197,868 |
|
| 244,962 |
|
|
|
|
|
| ||||||
Noninterest income: |
|
|
|
|
|
|
|
|
|
|
Service charges on deposit accounts |
|
| 44,243 |
|
| 41,929 |
|
| 36,228 |
|
Trust fees |
|
| 16,858 |
|
| 15,902 |
|
| 13,286 |
|
Insurance commissions and fees |
|
| 16,554 |
|
| 19,229 |
|
| 19,248 |
|
Investment and annuity fees |
|
| 10,807 |
|
| 8,746 |
|
| 5,970 |
|
Debit card and merchant fees |
|
| 11,082 |
|
| 10,126 |
|
| 9,365 |
|
ATM fees |
|
| 6,856 |
|
| 5,983 |
|
| 5,338 |
|
Secondary mortgage market operations |
|
| 2,977 |
|
| 3,723 |
|
| 3,528 |
|
Securities gains (losses), net |
|
| 4,825 |
|
| 308 |
|
| (5,169 | ) |
Net storm-related gain |
|
| — |
|
| — |
|
| 5,084 |
|
Other income |
|
| 13,576 |
|
| 14,740 |
|
| 13,622 |
|
|
|
|
|
| ||||||
Total noninterest income |
|
| 127,778 |
|
| 120,686 |
|
| 106,500 |
|
|
|
|
|
| ||||||
Noninterest expense: |
|
|
|
|
|
|
|
|
|
|
Salaries and employee benefits |
|
| 109,773 |
|
| 106,959 |
|
| 103,753 |
|
Net occupancy expense |
|
| 19,538 |
|
| 19,435 |
|
| 13,350 |
|
Equipment rentals, depreciation and maintenance |
|
| 10,992 |
|
| 10,465 |
|
| 10,796 |
|
Amortization of intangibles |
|
| 1,432 |
|
| 1,651 |
|
| 2,125 |
|
Other expense |
|
| 71,708 |
|
| 78,233 |
|
| 73,092 |
|
|
|
|
|
| ||||||
Total noninterest expense |
|
| 213,443 |
|
| 216,743 |
|
| 203,116 |
|
|
|
|
|
| ||||||
Income before income taxes |
|
| 86,985 |
|
| 101,811 |
|
| 148,346 |
|
Income taxes |
|
| 21,619 |
|
| 27,919 |
|
| 46,544 |
|
|
|
|
|
| ||||||
Net income |
| $ | 65,366 |
| $ | 73,892 |
| $ | 101,802 |
|
|
|
|
|
| ||||||
Basic earnings per common share |
| $ | 2.08 |
| $ | 2.31 |
| $ | 3.13 |
|
|
|
|
|
| ||||||
Diluted earnings per common share |
| $ | 2.05 |
| $ | 2.27 |
| $ | 3.06 |
|
|
|
|
|
| ||||||
See accompanying notes to consolidated financial statements.
Hancock Holding Company and Subsidiaries
Consolidated Statements of Stockholders'Stockholders’ Equity
Accumulated
Other Unearned
Common Stock Capital Retained Comprehensive Compen-
Shares Amount Surplus Earnings Loss, net sation Total
----------- --------- ---------- ---------- ------------- -------- ----------
(In thousands, except share and per share data)
Balance January 1, 2004 30,455,358 $ 101,416 $ 111,963 $ 191,696 $ (6,304) $ (957) $397,814
Comprehensive income:
Net income per consolidated
statements of income - - - 61,704 - - 61,704
Net change in fair value of
securities available for sale,
net of tax - - - - (4,375) - (4,375)
Net change in unfunded accumulated
benefit obligation, net of tax - - - - (442) - (442)
-----------
Comprehensive income 56,887
Cash dividends paid ($0.58 per share) - - - (18,977) - - (18,977)
Common stock issued, long - term incentive
plan - - 1,387 - - (1,387) -
Compensation expense, long - term
incentive plan 142,075 473 1,357 - - 695 2,525
Repurchase and retirement of common
stock (370,793) (1,235) (9,733) - - - (10,968)
Preferred stock conversion 2,200,976 7,329 29,886 - - - 37,215
Other stock transactions 12,086 41 45 - - - 86
------------ ------------ ------------ ------------ ----------- ---------- -----------
Balance, December 31, 2004 32,439,702 108,024 134,905 234,423 (11,121) (1,649) 464,582
Comprehensive income:
Net income per consolidated
statements of income - - - 54,032 - - 54,032
Net change in fair value of
securities available for sale,
net of tax - - - - (10,983) - (10,983)
Net change in unfunded accumulated
benefit obligation, net of tax - - - - 38 - 38
-----------
Comprehensive income 43,087
Cash dividends paid ($0.72 per share) - - - (23,416) - - (23,416)
Common stock issued, long - term incentive
plan 142,684 475 2,288 - - (1,425) 1,338
Compensation expense, long - term
incentive plan - - - - - 731 731
Repurchase and retirement of common
stock (295,849) (985) (8,564) - - - (9,549)
Other stock transactions 14,586 49 593 - - - 642
------------ ------------ ------------ ------------ ----------- ---------- -----------
Balance, December 31, 2005 32,301,123 107,563 129,222 265,039 (22,066) (2,343) 477,415
SAB No.108 adjustments, net of tax - - - (2,984) - - (2,984)
------------ ------------ ------------ ------------ ----------- ---------- -----------
Balance, December 31, 2005, as adjusted 32,301,123 107,563 129,222 262,055 (22,066) (2,343) 474,431
Comprehensive income:
Net income per consolidated
statements of income - - - 101,802 - - 101,802
Net change in fair value of
securities available for sale,
net of tax - - - - 4,940 - 4,940
Net change in unfunded accumulated
benefit obligation, net of tax - - - - 1,057 - 1,057
-----------
Comprehensive income 107,799
Adoption of SFAS No. 158, net of tax - - - - (7,944) - (7,944)
Cash dividends paid ($0.895 per share) - - - (29,311) - - (29,311)
Common stock issued, long - term
incentive plan, including income
tax benefit of $3,493 398,338 1,326 10,169 - - - 11,495
Compensation expense, long - term
incentive plan - - 3,690 - - - 3,690
SFAS No. 123(R) reclass of unearned
compensation - - (2,343) - - 2,343 -
Repurchase and retirement of
common stock (33,409) (111) (1,639) - - - (1,750)
------------ ------------ ------------ ------------ ----------- ---------- -----------
Balance, December 31, 2006 32,666,052 $ 108,778 $ 139,099 $ 334,546 $(24,013) $ - $558,410
============ ============ ============ ============ =========== ========== ===========
|
|
|
|
|
|
|
|
|
|
|
|
|
|
|
|
|
|
|
|
|
|
|
| Common Stock |
| Capital |
| Retained |
| Accumulated |
| Unearned |
|
|
| ||||||||
|
| Shares |
| Amount |
| Surplus |
| Earnings |
| Loss, net |
| Compensation |
| Total |
| ||||||
|
|
|
|
|
|
|
|
| |||||||||||||
|
| (In thousands, except share and per share data) |
| ||||||||||||||||||
| |||||||||||||||||||||
Balance, January 1, 2006 |
| 32,301,123 |
| $ | 107,563 |
| $ | 129,222 |
| $ | 262,055 |
| $ | (22,066 | ) | $ | (2,343 | ) | $ | 474,431 |
|
Comprehensive income: |
|
|
|
|
|
|
|
|
|
|
|
|
|
|
|
|
|
|
|
|
|
Net income per consolidated statements of income |
| — |
|
| — |
|
| — |
|
| 101,802 |
|
| — |
|
| — |
|
| 101,802 |
|
Net change in fair value of securities available for sale, net of tax |
| — |
|
| — |
|
| — |
|
| — |
|
| 4,940 |
|
| — |
|
| 4,940 |
|
Net change in unfunded accumulated benefit obligation, net of tax |
| — |
|
| — |
|
| — |
|
| — |
|
| 1,057 |
|
| — |
|
| 1,057 |
|
|
|
|
|
|
|
|
|
|
|
|
|
|
|
|
|
|
|
|
| ||
Comprehensive income |
|
|
|
|
|
|
|
|
|
|
|
|
|
|
|
|
|
|
| 107,799 |
|
Adoption of SFAS No. 158, net of tax |
| — |
|
| — |
|
| — |
|
| — |
|
| (7,944 | ) |
| — |
|
| (7,944 | ) |
Cash dividends paid ($0.895 per share) |
| — |
|
| — |
|
| — |
|
| (29,311 | ) |
| — |
|
| — |
|
| (29,311 | ) |
Common stock issued, long - term incentive plan, including excess income tax benefit of $3,493 |
| 398,338 |
|
| 1,326 |
|
| 10,169 |
|
| — |
|
| — |
|
| — |
|
| 11,495 |
|
Compensation expense, long - term incentive plan |
| — |
|
| — |
|
| 3,690 |
|
| — |
|
| — |
|
| — |
|
| 3,690 |
|
SFAS No. 123(R) reclass of unearned compensation |
| — |
|
| — |
|
| (2,343 | ) |
| — |
|
| — |
|
| 2,343 |
|
| — |
|
Purchase of common stock |
| (33,409 | ) |
| (111 | ) |
| (1,639 | ) |
| — |
|
| — |
|
| — |
|
| (1,750 | ) |
|
|
|
|
|
|
|
|
| |||||||||||||
Balance, December 31, 2006 |
| 32,666,052 |
|
| 108,778 |
|
| 139,099 |
|
| 334,546 |
|
| (24,013 | ) |
| — |
|
| 558,410 |
|
Comprehensive income: |
|
|
|
|
|
|
|
|
|
|
|
|
|
|
|
|
|
|
|
|
|
Net income per consolidated statements of income |
| — |
|
| — |
|
| — |
|
| 73,892 |
|
| — |
|
| — |
|
| 73,892 |
|
Net change in fair value of securities available for sale, net of tax |
| — |
|
| — |
|
| — |
|
| — |
|
| 8,846 |
|
| — |
|
| 8,846 |
|
Net change in unfunded accumulated benefit obligation, net of tax |
| — |
|
| — |
|
| — |
|
| — |
|
| 540 |
|
| — |
|
| 540 |
|
|
|
|
|
|
|
|
|
|
|
|
|
|
|
|
|
|
|
|
| ||
Comprehensive income |
|
|
|
|
|
|
|
|
|
|
|
|
|
|
|
|
|
|
| 83,278 |
|
Cash dividends paid ($0.96 per share) |
| — |
|
| — |
|
| — |
|
| (30,957 | ) |
| — |
|
| — |
|
| (30,957 | ) |
Common stock issued, long - term incentive plan, including excess income tax benefit of $345 |
| 184,775 |
|
| 615 |
|
| 2,134 |
|
| — |
|
| — |
|
|
|
|
| 2,749 |
|
Compensation expense, long - term incentive plan |
| — |
|
| — |
|
| 1,155 |
|
| — |
|
| — |
|
| — |
|
| 1,155 |
|
Purchase of common stock |
| (1,556,220 | ) |
| (5,182 | ) |
| (55,266 | ) |
| — |
|
| — |
|
| — |
|
| (60,448 | ) |
|
|
|
|
|
|
|
|
| |||||||||||||
Balance, December 31, 2007 |
| 31,294,607 |
| $ | 104,211 |
| $ | 87,122 |
| $ | 377,481 |
| $ | (14,627 | ) | $ | — |
| $ | 554,187 |
|
Comprehensive income |
|
|
|
|
|
|
|
|
|
|
|
|
|
|
|
|
|
|
|
|
|
Net income per consolidated statements of income |
| — |
|
| — |
|
| — |
|
| 65,366 |
|
| — |
|
| — |
|
| 65,366 |
|
Net change in unfunded accumulated benefit obligation, net of tax |
| — |
|
| — |
|
| — |
|
| — |
|
| (12,095 | ) |
| — |
|
| (12,095 | ) |
Net change in fair value of securities available for sale, net of tax |
| — |
|
| — |
|
| — |
|
| — |
|
| 17,639 |
|
| — |
|
| 17,639 |
|
|
|
|
|
|
|
|
|
|
|
|
|
|
|
|
|
|
|
|
| ||
Comprehensive income |
|
|
|
|
|
|
|
|
|
|
|
|
|
|
|
|
|
|
| 70,910 |
|
SFAS No. 158, change in measurement date |
| — |
|
| — |
|
| — |
|
| (815 | ) |
| — |
|
| — |
|
| (815 | ) |
Cash dividends declared ($0.96 per common share) |
| — |
|
| — |
|
| — |
|
| (30,453 | ) |
| — |
|
| — |
|
| (30,453 | ) |
Common stock issued, long-term incentive plan, including excess income tax benefit of $4,512 |
| 481,530 |
|
| 1,604 |
|
| 11,520 |
|
| — |
|
| — |
|
| — |
|
| 13,124 |
|
Compensation expense, long-term incentive plan |
| — |
|
| — |
|
| 2,806 |
|
| — |
|
| — |
|
| — |
|
| 2,806 |
|
Purchase of common stock |
| (6,458 | ) |
| (22 | ) |
| (238 | ) |
| — |
|
| — |
|
| — |
|
| (260 | ) |
|
|
|
|
|
|
|
|
| |||||||||||||
Balance, December 31, 2008 |
| 31,769,679 |
| $ | 105,793 |
| $ | 101,210 |
| $ | 411,579 |
| $ | (9,083 | ) | $ | — |
| $ | 609,499 |
|
|
|
|
|
|
|
|
|
| |||||||||||||
See accompanying notes to consolidated financial statements.
Hancock Holding Company and Subsidiaries
Consolidated Statements of Cash Flows
Years Ended December 31,
-----------------------------------------
2006 2005 2004
-------------- ------------ ------------
(In thousands)
Cash Flows from Operating Activities:
Net income $ 101,802 $ 54,032 $ 61,704
Adjustments to reconcile net income to net cash provided by operating activities:
Depreciation and amortization 10,443 8,717 9,157
Provision for (recovery of) loan losses (20,762) 42,635 16,537
Deferred tax (benefit) provision 24,599 (18,401) (3,529)
Provision for losses on other real estate owned 86 - 142
Increase in cash surrender value of life insurance contracts (4,090) (3,450) (3,465)
Securities (gains) losses, net 5,169 53 (163)
Gain on sale of other real estate owned, net (7) (444) -
Gains on sales of branches and credit card merchant service business - - (5,258)
Gain on involuntary conversion of assets, net (5,084) (14,135) -
(Accretion) amortization of securities premium/discount (11,300) (1,847) 5,464
Amortization of intangible assets 2,125 2,194 1,945
Amortization of mortgage servicing rights 549 818 1,048
Stock-based compensation expense 3,690 1,289 679
Excess tax benefit from exercise of stock options (3,493) - -
(Increase) decrease in accrued interest receivable 2,062 (11,263) (445)
(Decrease) increase in accrued expenses (30,133) 28,349 1,025
Increase (decrease) in other liabilities (2,636) 1,625 6,089
Increase (decrease) in interest payable 2,341 521 513
Increase (decrease) in unearned premiums (11,699) (5,739) 90,315
Decrease (increase) in reinsurance receivables 11,410 9,738 (42,893)
(Increase) decrease in other assets, net (2,633) (26,154) 15,214
Other, net (2,790) 2,516 (896)
-------------- ------------ ------------
Net cash provided by operating activities 74,921 71,054 153,183
-------------- ------------ ------------
|
|
|
|
|
|
|
|
|
|
|
|
| Years Ended December 31, |
| |||||||
|
|
| ||||||||
|
| 2008 |
| 2007 |
| 2006 |
| |||
|
|
|
|
| ||||||
|
| (In thousands) |
| |||||||
Operating Activities: |
|
|
|
|
|
|
|
|
|
|
Net income |
| $ | 65,366 |
| $ | 73,892 |
| $ | 101,802 |
|
Adjustments to reconcile net income to net cash provided by operating activities: |
|
|
|
|
|
|
|
|
|
|
Depreciation and amortization |
|
| 15,761 |
|
| 14,041 |
|
| 10,443 |
|
Provision for (reversal of) loan losses, net |
|
| 36,785 |
|
| 7,593 |
|
| (20,762 | ) |
(Gains) losses on other real estate owned |
|
| 230 |
|
| (732 | ) |
| 79 |
|
Deferred tax expense (benefit) |
|
| (5,012 | ) |
| 7,560 |
|
| 24,599 |
|
Increase in cash surrender value of life insurance contracts |
|
| (5,538 | ) |
| (5,397 | ) |
| (4,090 | ) |
(Gain) loss on sales/paydowns of securities available for sale, net |
|
| (1,950 | ) |
| (273 | ) |
| 5,169 |
|
(Gain) loss on disposal of other assets |
|
| (602 | ) |
| 193 |
|
| — |
|
Gain on involuntary conversion of assets, net |
|
| — |
|
| — |
|
| (5,084 | ) |
Gain on sale of loans held for sale |
|
| (427 | ) |
| (583 | ) |
| (564 | ) |
(Gain) loss on trading securities |
|
| (2,875 | ) |
| 114 |
|
| — |
|
Purchase of trading securities, net |
|
| — |
|
| (10 | ) |
| — |
|
Proceeds from paydowns of securities held for trading |
|
| 7,635 |
|
| — |
|
| — |
|
Amortization (accretion) of securities premium/discount, net |
|
| 2,012 |
|
| (1,773 | ) |
| (11,300 | ) |
Amortization of mortgage servicing rights |
|
| 210 |
|
| 345 |
|
| 549 |
|
Amortization of intangible assets |
|
| 1,432 |
|
| 1,651 |
|
| 2,125 |
|
Stock-based compensation expense |
|
| 2,806 |
|
| 1,155 |
|
| 3,690 |
|
(Increase) decrease in accrued interest receivable |
|
| 2,050 |
|
| (1,417 | ) |
| 1,346 |
|
Increase (decrease) in accrued expenses |
|
| 2,624 |
|
| (12,197 | ) |
| (30,133 | ) |
Increase in other liabilities |
|
| 2,309 |
|
| 4,430 |
|
| 2,636 |
|
Increase (decrease) in interest payable |
|
| (2,785 | ) |
| 883 |
|
| 2,341 |
|
Decrease in policy reserves and liabilities |
|
| (12,051 | ) |
| (35,180 | ) |
| (11,699 | ) |
Decrease in reinsurance receivables |
|
| 8,060 |
|
| 3,215 |
|
| 11,410 |
|
(Increase) decrease in other assets |
|
| (14,062 | ) |
| 274 |
|
| 308 |
|
Proceeds from sale of loans held for sale |
|
| 192,838 |
|
| 251,684 |
|
| 238,045 |
|
Originations of loans held for sale |
|
| (195,569 | ) |
| (253,112 | ) |
| (230,208 | ) |
Excess tax benefit from share based payments |
|
| (4,512 | ) |
| (345 | ) |
| (3,493 | ) |
Other, net |
|
| (367 | ) |
| 60 |
|
| (2,790 | ) |
|
|
|
|
| ||||||
Net cash provided by operating activities |
|
| 94,368 |
|
| 56,071 |
|
| 84,419 |
|
|
|
|
|
| ||||||
See accompanying notes to consolidated financial statements.
Hancock Holding Company and Subsidiaries
Consolidated Statements of Cash Flows (continued)
Years Ended December 31,
--------------------------------------
2006 2005 2004
----------- ----------- ----------
(In thousands)
Cash Flows from Investing Activities:
Net (increase) decrease in interest-bearing time deposits (2,939) 868 (2,572)
Proceeds from maturities, calls or prepayments of securities
held to maturity - 195,599 27,890
Purchases of securities held to maturity - (7,736) (54,216)
Proceeds from sales of securities available for sale 157,300 133,800 20,000
Proceeds from maturities of securities available for sale 1,086,070 378,105 686,237
Purchases of securities available for sale (1,169,592) (1,354,864) (714,750)
Net (increase) decrease in federal funds sold 190,726 (260,833) (122,903)
Net increase in loans (293,117) (248,056) (295,410)
Net (increase) decrease in loans held for sale 7,273 (6,735) (2,469)
Purchase of property, equipment and software (76,943) (15,486) (10,422)
Proceeds from sales of property, equipment and software 4,097 591 1,172
Proceeds from sales of other real estate 1,749 4,338 6,981
Proceeds from insurance settlements 22,469 12,562 -
Proceeds from sale of credit card merchant services business - - 3,000
Premiums paid on life insurance contracts (20,000) - (25,000)
Purchase of interest in unconsolidated joint venture (4,710) - -
Net cash paid in connection with sale of branches - - (22,999)
Net cash paid in business combinations - (3,922) (6,378)
----------- ----------- ----------
Net cash used by investing activities (97,617) (1,171,769) (511,839)
----------- ----------- ----------
Cash Flows from Financing Activities:
Net increase in deposits 41,171 1,191,875 327,788
Net increase (decrease) in federal funds purchased and
securities sold under agreements to repurchase (29,891) 56,004 46,182
Repayments of short-term notes - - (9,400)
Repayments of long-term notes (50,008) (7) (155)
Dividends paid (29,311) (23,416) (18,977)
Conversion of preferred stock to cash - - (148)
Proceeds from exercise of stock options 8,002 1,213 1,830
Repurchase/retirement of common stock (1,750) (9,549) (10,968)
Excess tax benefit from the exercise of stock options 3,493 - -
Other stock transactions, net - (98) 219
----------- ----------- ----------
Net cash (used by) provided by financing activities (58,294) 1,216,022 336,371
----------- ----------- ----------
Net (decrease) increase in cash and due from banks (80,990) 115,307 (22,285)
Cash and due from banks, beginning of year 271,104 155,797 178,082
----------- ----------- ----------
Cash and due from banks, end of year $ 190,114 $ 271,104 $ 155,797
=========== =========== ==========
SUPPLEMENTAL INFORMATION:
Income taxes paid $ 55,503 $ 12,500 $26,700
Interest paid, including capitalized interest
of $806 in 2006 $ 112,447 $ 74,300 $56,800
Restricted stock issued to employees of Hancock $ 2,518 $ 1,490 $ 1,391
SUPPLEMENTAL INFORMATION FOR NON-CASH
INVESTING AND FINANCING ACTIVITIES
Transfers from loans to other real estate $ 1,304 $ 2,703 $ 4,700
Financed sales of foreclosed property $ 741 $ 1,300 $ 1,200
|
|
|
|
|
|
|
|
|
|
|
|
| Years Ended December 31, |
| |||||||
|
|
| ||||||||
|
| 2008 |
| 2007 |
| 2006 |
| |||
|
|
|
|
| ||||||
|
| (In thousands) |
| |||||||
Investing Activities: |
|
|
|
|
|
|
|
|
|
|
Net (increase) decrease in interest-bearing time deposits |
| $ | (2,795 | ) | $ | 1,637 |
| $ | (2,939 | ) |
Proceeds from sales of securities available for sale |
|
| 213,814 |
|
| 9,222 |
|
| 157,300 |
|
Proceeds from maturities of securities available for sale |
|
| 938,939 |
|
| 1,270,294 |
|
| 1,083,845 |
|
Purchases of securities available for sale |
|
| (1,140,901 | ) |
| (1,038,175 | ) |
| (1,169,592 | ) |
Purchase of short-term investments |
|
| (362,895 | ) |
| — |
|
| — |
|
Net (increase) decrease in federal funds sold |
|
| (57,445 | ) |
| 94,521 |
|
| 190,726 |
|
Net increase in loans |
|
| (684,528 | ) |
| (356,787 | ) |
| (293,117 | ) |
Purchases of property and equipment |
|
| (23,618 | ) |
| (70,267 | ) |
| (76,943 | ) |
Proceeds from sales of property and equipment |
|
| 2,150 |
|
| 497 |
|
| 4,097 |
|
Premiums paid on life insurance contracts |
|
| — |
|
| (20,000 | ) |
| (20,000 | ) |
Proceeds from sales of other real estate |
|
| 6,184 |
|
| 1,753 |
|
| 1,749 |
|
Proceeds from insurance settlements |
|
| — |
|
| — |
|
| 22,469 |
|
Purchase of interest in unconsolidated joint venture |
|
| — |
|
| — |
|
| (4,710 | ) |
|
|
|
|
| ||||||
Net cash used in investing activities |
|
| (1,111,095 | ) |
| (107,305 | ) |
| (107,115 | ) |
|
|
|
|
| ||||||
|
|
|
|
|
|
|
|
|
|
|
Financing Activities: |
|
|
|
|
|
|
|
|
|
|
Net increase (decrease) in deposits |
|
| 921,403 |
|
| (21,457 | ) |
| 41,171 |
|
Net increase (decrease) in federal funds purchased and securities sold under agreements to repurchase |
|
| 130,228 |
|
| 153,313 |
|
| (29,891 | ) |
(Proceeds) repayments of long-term notes |
|
| (155 | ) |
| 535 |
|
| (50,008 | ) |
Dividends paid |
|
| (30,453 | ) |
| (30,957 | ) |
| (29,311 | ) |
Proceeds from exercise of stock options |
|
| 8,612 |
|
| 2,404 |
|
| 8,002 |
|
Repurchase/retirement of common stock |
|
| (260 | ) |
| (60,448 | ) |
| (1,750 | ) |
Excess tax benefit from stock option exercises |
|
| 4,512 |
|
| 345 |
|
| 3,493 |
|
|
|
|
|
| ||||||
Net cash provided by (used in) financing activities |
|
| 1,033,887 |
|
| 43,735 |
|
| (58,294 | ) |
|
|
|
|
| ||||||
Increase (decrease) in cash and due from banks |
|
| 17,160 |
|
| (7,499 | ) |
| (80,990 | ) |
Cash and due from banks at beginning of year |
|
| 182,615 |
|
| 190,114 |
|
| 271,104 |
|
|
|
|
|
| ||||||
Cash and due from banks at end of year |
| $ | 199,775 |
| $ | 182,615 |
| $ | 190,114 |
|
|
|
|
|
| ||||||
|
|
|
|
|
|
|
|
|
|
|
Supplemental Information |
|
|
|
|
|
|
|
|
|
|
|
|
|
|
|
|
|
|
|
|
|
Income taxes paid |
| $ | 19,413 |
| $ | 29,209 |
| $ | 55,503 |
|
Interest paid, including capitalized interest of $77, $995,and $806, respectively |
|
| 128,787 |
|
| 139,353 |
|
| 112,447 |
|
Restricted stock issued to employees of Hancock |
|
| 3,045 |
|
| 2,495 |
|
| 2,518 |
|
|
|
|
|
|
|
|
|
|
|
|
Supplemental Information for Non-Cash |
|
|
|
|
|
|
|
|
|
|
Investing and Financing Activities |
|
|
|
|
|
|
|
|
|
|
Transfers from loans to other real estate |
| $ | 10,671 |
| $ | 2,694 |
| $ | 1,304 |
|
Financed sales of foreclosed property |
|
| 1,234 |
|
| 339 |
|
| 741 |
|
Transfers from trading securities to available for sale securities |
|
| 190,802 |
|
| — |
|
| — |
|
See accompanying notes to consolidated financial statements.
HANCOCK HOLDING COMPANY AND SUBSIDIARIES
NOTES TO CONSOLIDATED FINANCIAL STATEMENTS
Note 1. Summary of Significant Accounting Policies
Description of Business
Hancock Holding Company (the Company“the Company” or Hancock)“Hancock” is a financial holding company headquartered in Gulfport, Mississippi operating in the states of Mississippi, Louisiana, Alabama and Florida. Hancock Holding Company, the Parent Company operates through threefour wholly-owned bank subsidiaries, Hancock Bank, Gulfport, Mississippi, Hancock Bank of Louisiana, Baton Rouge, Louisiana, and Hancock Bank of Florida, Tallahassee, Florida (the Banks).and Hancock Bank of Alabama, Mobile, Alabama (“the Banks.”) The Banks are community oriented and focus primarily on offering commercial, consumer and mortgage loans and deposit services to individuals and small to middle market businesses in their respective market areas. The Company’s operating strategy is to provide its customers with the financial sophistication and breadth of products of a regional bank, while successfully retaining the local appeal and level of service of a community bank.
Consolidation
The accounting and reporting policiesconsolidated financial statements include the accounts of the Company and all other entities in which the Company has a controlling interest. Significant inter-company transactions and balances have been eliminated in consolidation.
Use of Estimates
The consolidated financial statements have been prepared in conformity with U.S. generally accepted accounting principles. The accounting principles we follow and the methods for applying these principles conform towith accounting principles generally accepted in the United States of America and with general practices withinfollowed by the banking industry. The following is a summary of the more significant of those policies.
The consolidated financial statements of the Company include the accounts of the Company, the Banks, Hancock Investment Services, Inc., Hancock Insurance Agency, Inc., Harrison Finance Company, Magna Insurance Company and subsidiary, as well as three real estate corporations owning land and buildings that house bank branches and other facilities. Significant intercompany transactions and balances have been eliminated in consolidation.
Comprehensive income includes net earnings and other comprehensive incomeindustry which in the case of the Company, includes unrealized gains and losses on securities available for sale and unfunded pension and post retirement plan liabilities.
The preparation of financial statements in conformity with accounting principles generally accepted in the United States of America requires management to make estimates and assumptions that affect the reported amounts of assets and liabilities and disclosure of contingent assets and liabilities at the date of the financial statements and the reported amounts of revenues and expenses during the reporting period.about future events. On an ongoing basis, the Company evaluates its estimates, including those related to the allowance for loan losses, intangible assets and goodwill, income taxes, pension and postretirement benefit plans and contingent liabilities. These estimates and assumptions are based on our best estimates and judgments. We evaluate estimates and assumptions on an ongoing basis using historical experience and other factors, including the current economic environment. We adjust such estimates and assumptions when facts and circumstances dictate. Illiquid credit markets, volatile equity markets, rising unemployment levels and declines in consumer spending have combined to increase the uncertainty inherent in such estimates and assumptions. The Company bases its estimates on historical experience and on various other assumptions that are believed to be reasonable under the circumstances, the results of which form the basis for making judgments about the carrying values of assets and liabilities not readily apparent from other sources. Allowance for loan losses, deferred income taxes, and goodwill are potentially subject to material changes in the near term. Actual results could differ significantly from those estimates.
Reclassifications
Certain reclassifications have been made to prior periods to conform to the current year presentation.
Cashthe Federal Home Loan Bank (FHLB), that has been reclassified from investment securities to other assets since these equity securities are restricted and cash equivalents are defineddo not have a readily determinable fair value. The balance of FHLB stock as only cashof December 31, 2007, was $2.3 million. The Company also reclassified its investment in an equity method investment from investment securities into other assets. The balance of the equity method investment as of December 31, 2007, was $5.0 million. The dividend income on handthe FHLB stock has also been reclassified from other investments to other income. The dividend on FHLB stock for the years ended 2007 and balances due2006 was $16,621 and $7,958, respectively. In addition, the Company reclassified debit card, merchant, and ATM charges from financial institutions.non-interest income to non-interest expense. Debit card, merchant, and ATM charges were $2.4 million in 2007 and $2.4 million in 2006.
HANCOCK HOLDING COMPANY AND SUBSIDIARIES
NOTES TO CONSOLIDATED FINANCIAL STATEMENTS
Note 1. Summary of Significant Accounting Policies (continued)
Securities
Securities have been classified into one of two categories: available for sale or held to maturity.trading. Management determines the appropriate classification of debt securities at the time of purchase and re-evaluates this classification periodically. Debt securities are classified as held to maturity when the Company has the positive intent and ability to hold the securities to maturity. Securities not classified as held to maturity are classified as available for sale.
Held to maturity securities are stated at amortized cost. Available for sale securities are stated at fair value with unrealized gains and losses, net of income taxes, reported as a separate component of stockholders’ equity until realized. Trading securities are stated at fair value with unrealized gains and losses reported in results of operations.
The amortized cost of debt securities classified as held to maturity or available for sale is adjusted for amortization of premiums and accretion of discounts to maturity or, in the case of mortgage-backed securities, over the estimated life of the security using the constant-yield method. The prepayment speed chosen to determine the estimated life of a mortgage-backed security is the security’s historical 3-month prepayment speed. When prepayment speeds are faster than expected, the average life of the mortgage-backed security is shorter than the original estimate. Amortization, accretion and accrued interest are included in interest income on securities. Realized gains and losses, and declines in value judged to be other than temporary, are included in net securities gains and losses. Gains and losses on the sales of securities available for sale are determined using the specific-identification method. Using this basis results in the most accurate reporting of gains and losses realized on these sales, as well as the appropriate adjustment to Accumulated Other Comprehensive Income.accumulated other comprehensive income. A decline in the fair value of securities below cost that is deemed to be other than temporary results in a charge to earnings and the establishment of a new cost basis for the security.
During 2005, securities classified as held to maturity in the portfolio of one of the Company’s subsidiaries were sold. A determination was made that this action tainted the investment portfolio of the entire Company. As a result of this action Gains and determination, all securities held by the Company have been reclassified to available for sale and the carrying value of those securities are adjusted to fair value as prescribed in Statement of Financial Accounting Standards (SFAS) No. 115,Accounting for Certain Investments in Debt and Equity Securities.
The Company does not have any accounting hedges under the guidelines of SFAS No. 133. The Company does have certain Interest Rate Lock Commitments (IRLC’s) that are carried off balance sheet. These represent forward commitments to fund customer mortgage loans that will be sold, servicing released upon funding. The Company values its position for the outstanding IRLC’slosses on a quarterly basis versus current market rates and tests its position for exposure to future earnings from the sales of those commitments.
HANCOCK HOLDING COMPANY AND SUBSIDIARIESNOTES TO CONSOLIDATED FINANCIAL STATEMENTS
operations.
Short-term Investments
Short-term investments represent U.S. government agency discount notes that all mature in less than one year, but with maturities greater than 90 days. These investments were purchased for liquidity purposes..
Loans
Loans are reported at the principal balance outstanding. Non-refundable loan origination fees and certain direct origination costs are recognized as an adjustment to the yield on the related loan. Interest on loans is recorded to income as earned. Where doubt exists
The accrual of interest on loans is discontinued when, in management’s opinion, the borrower may be unable to meet payment obligations as to collectibility of a loan, thethey become due, as well as when required by regulatory provisions. When accrual of interest is discontinued, all unpaid accrued interest is reversed and payments subsequently received are applied first to principal. Interest income is recorded after principal has been satisfied and as payments are received. Loans are returned to accrual status when all the principal and interest contractually due are brought current and future amounts are reasonably assured.
The Company considers a loan to be impaired when, based upon current information and events, it believes it is probable that the Company will be unable to collect all amounts due according to the contractual terms of the loan agreement. The Company’s impaired loans include troubled debt restructurings, and performing and non-performing major loans for which full payment of principal or interest is not expected. Categories of non-major homogeneous loans, which are evaluated on an overall basis, generally include all loans under $500,000. The Company calculates an allowance required for impaired loans based on the present value of expected future cash flows discounted at the loan’s effective interest rate, the loan’s observable market price or the fair value of its collateral. If the recorded investment in the impaired loan exceeds the measure of fair value, a valuation allowance is required as a component of the allowance for loan losses. Changes to the valuation allowance are recorded as a component of the provision for loan losses.
Generally, loans of all types which become 90 days delinquent are reviewed relative to collectibility.collectability. Unless such loans are in the process of terms revision to bring to a current status, collection through repossession or foreclosure, those loans deemed uncollectible are charged off against the allowance account. As a matter
Loans held for sale are stated at lower of policy,cost or market on the consolidated balance sheets. These loans are placedoriginated on a non-accrual status when doubt exists asbest-efforts basis, whereby a commitment by a third party to collectibility.purchase the loan has been received concurrent with the Banks’ commitment to the borrower to originate the loan.
HANCOCK HOLDING COMPANY AND SUBSIDIARIES
NOTES TO CONSOLIDATED FINANCIAL STATEMENTS
Note 1. Summary of Significant Accounting Policies (continued)
Allowance for Loan Losses
The allowance for loan and lease losses (ALLL)“ALLL” is a valuation account available to absorb losses on loans. The ALLL is established and maintained at an amount sufficient to cover the estimated credit loss associated with the loan and lease portfolios of the Company as of the date of the determination. Credit losses arise not only from credit risk, , but also from other risks inherent in the lending process including, but not limited to, collateral risk, operational risk, concentration risk, and economic risk. As such, all related risks of lending are considered when assessing the adequacy of the allowance for loan and lease losses. Quarterly, management estimates the probable level of losses to determine whether the allowance is adequate to absorb reasonably foreseeable, anticipated losses in the existing portfolio based on the Company’s past loan loss and delinquency experience, known and inherent risks in the portfolio, adverse situations that may affect the borrowers’ ability to repay, and the estimated value of any underlying collateral and current economic conditions. The analysis and methodology include three primary segments. These segments include a pool analysis of various retail loans based upon loss history, a pool analysis of commercial and commercial real estate loans based upon loss history by loan type, and a specific reserve analysis for those loans considered impaired under SFASStatement of Financial Accounting Standards (SFAS) No. 114.114, Accounting by Creditors for Impairment of a Loan. All commercial and commercial real estate loans with an outstanding balance of $100,000 or greater are individually reviewed for impairment; substandard mortgage loans with balances of $100,000 or greater are also included in the analysis. All losses are charged to the allowance for loan and lease losses when the loss actually occurs or when a determination is made that a loss is likely to occur; recoveries are credited to the allowance for loan losses at the time of receipt.
The Company considers a loan to be impaired when, based upon current information and events, it believes it is probable that the Company will be unable to collect all amounts due according to the contractual terms of the loan agreement. The Company’s impaired loans include troubled debt restructurings, and performing and non-performing major loans for which full payment of principal or interest is not expected. Categories of non-major homogeneous loans, which are evaluated on an overall basis, generally include all loans under $500,000. The Company determines an allowance required for impaired loans based on the present value of expected future cash flows discounted at the loan’s effective interest rate, the loan’s observable market price or the fair value of its collateral. If the recorded investment in the impaired loan exceeds the measure of fair value, a valuation allowance is required as a component of the allowance for loan losses.
Property and Equipment
Property and equipment are recorded at cost, less accumulated depreciation and amortization. Depreciation is charged to expense over the estimated useful lives of the assets, which are up to 39 years for buildings and three to seven years for furniture and equipment. Amortization expense for software is charged over 3 years. Leasehold improvements are amortized over the terms of the respective leases or the estimated useful lives of the improvements, whichever is shorter. In cases where Hancock has the right to renew the lease for additional periods, the lease term for the purpose of calculating amortization of the capitalized cost of the leasehold improvements is extended when Hancock is “reasonably assured” that it will renew the lease. Depreciation and amortization expenses are computed using a straight-line basis for assets acquired after January 1, 2006 and the double declining balance basis for assets acquired prior to January 1, 2006. Hancock continually evaluates whether events and circumstances have occurred that indicate that such long-lived assets have been impaired. Measurement of any impairment of such long-lived assets is based on those assets’ fair values. There were no impairment losses on property and equipment recorded during 2008, 2007, or 2006.
Other Real Estate
Other real estate owned includes assets that have been acquired in satisfaction of debt through foreclosure. Other real estate owned is reported in other assets and is recorded at the lower of cost or estimated fair value less the estimated cost of disposition. Valuation adjustments required at foreclosure are charged to the allowance for loan losses. Subsequent to foreclosure, losses on the periodic revaluation of the property are
HANCOCK HOLDING COMPANY AND SUBSIDIARIES
NOTES TO CONSOLIDATED FINANCIAL STATEMENTS
Note 1. Summary of Significant Accounting Policies (continued)
charged to net income as other expense. Costs of operating and maintaining the properties are included in other noninterest expenses, while gains (losses) on their disposition are charged to other income as incurred. Improvements made to properties are capitalized if the expenditures are expected to be recovered upon the sale of the properties.
Goodwill and Other Intangible Assets
Goodwill, which represents the excess of cost over the fair value of the net assets of an acquired business, is not amortized but tested for impairment on an annual basis, or more often if events or circumstances indicate there may be impairment.
Identifiable intangible assets are acquired assets that lack physical substance but can be distinguished from goodwill because of contractual or legal rights or because the assets are capable of being sold or exchanged either on their own on in combination with a related contract, asset, or liability. Hancock’s identifiable intangible assets primarily relate to core deposits, insurance customer relationships, non-compete agreements and trade name. These intangibles, which have definite useful lives, are amortized based on the sum-of-the-years-digits method over their estimated useful lives for assets acquired prior to January 1, 2006 and on a straight-line basis for assets acquired subsequent to January 1, 2006. In addition, these intangibles are evaluated annually for impairment or whenever events and changes in circumstances indicate that the carrying amount should be reevaluated.
Mortgage Servicing Rights
The Company adopted SFAS No. 156, Accounting for Servicing of Financial Assets on January 1, 2007 without material impact. SFAS No. 156 requires all separately recognized servicing assets and servicing liabilities to be initially measured at fair value, if practicable, and permits an entity to subsequently measure those servicing assets and servicing liabilities at fair value. Under SFAS. No. 156, the Company decided to continue to use the amortization method instead of adopting the fair value method. Management has determined that it has one class of servicing rights which is based on the type of loan. The risk characteristics of the underlying financial assets used to stratify servicing assets for purposes of measuring impairment are interest rate, type of product (fixed versus variable), duration and asset quality. The book value of mortgage servicing rights at December 31, 2008 and December 31, 2007 was $0.3 million and $0.5 million, respectively. The fair value of mortgage servicing rights at December 31, 2008 and December 31, 2007 was $1.0 million and $1.8 million, respectively.
Reinsurance Receivables
Certain premiums and losses are assumed from and ceded to other insurance companies under various reinsurance agreements. Reinsurance premiums, loss reimbursement, and reserves related to reinsurance business are accounted for on a basis consistent with that used in accounting for the original policies issued and the terms of the reinsurance contract. The Company may receive a ceding commission in connection with ceded reinsurance. If so, the ceding commission is earned on a monthly pro rata basis in the same manner as the premium and is recorded as a reduction of other operating expenses.
Derivative Instruments
The Company has certain Interest Rate Lock Commitments “IRLC’s” that are reported on the consolidated balance sheets at fair value with changes in fair value reported in statements of income. The Company also has interest rate swaps which are recognized on the consolidated balance sheets as other assets at fair value as required by SFAS No. 133. These interest rate swaps do not qualify for hedge accounting under the guidelines of SFAS No. 133, Accounting for Derivative Instruments and Hedging. Gains and losses related to the change in fair value are recognized in earnings during the period of change in fair value as other non-interest income.
HANCOCK HOLDING COMPANY AND SUBSIDIARIES
NOTES TO CONSOLIDATED FINANCIAL STATEMENTS
Note 1. Summary of Significant Accounting Policies (continued)
Income Taxes
Hancock accounts for deferred income taxes using the liability method. Deferred tax assets and liabilities are based on temporary differences between the financial statement carrying amounts and the tax basis of Hancock’s assets and liabilities. Deferred tax assets and liabilities are measured using the enacted tax rates expected to apply to taxable income in the years in which those temporary differences are expected to be realized or settled.
Pension Accounting
The Company has accounted for its defined benefit pension plan using the actuarial model required by SFAS No. 87, Employers’ Accounting for Pensions. The compensation cost of an employee’s pension benefit is recognized on the projected unit credit method over the employee’s approximate service period. The aggregate cost method is utilized for funding purposes. The Company also sponsors two defined benefit postretirement plans, which provide medical benefits and life insurance benefits. The Company has accounted for these plans using the actuarial computations required by SFAS No. 106, Employers Accounting for Postretirement Benefits Other Than Pensions as amended by SFAS No. 132. The cost of the defined benefit postretirement plan has been recognized on the projected unit credit method over the employee’s approximate service period. Effective December 31, 2006, the Company adopted SFAS No. 158, Employers’ Accounting for Defined Benefit Pension and Other Postretirement Plans – an amendment of FASB Statements No. 87, 88, 106 and 132(R); which required the recognition of the over funded or under funded status of a defined benefit postretirement plan as an asset or liability on the balance sheet. In 2008, the Company changed the measurement date of the funded status of the plan from September 30 to December 31.
Policy Reserves and Liabilities
Unearned premium reserves are based on the assumption that the portion of the original premium applicable to the remaining term and amount of insurance will be adequate to pay future benefits. The reserve is calculated by multiplying the original gross premium times an unearned premium factor. Factors are developed which represent the proportion of the remaining coverage compared to the total coverage provided over the entire term of insurance.
Policy reserves for future life and health claims not yet incurred are based on assumed mortality and interest rates. For disability, the reserves are based upon unearned premium, which is the portion of the original premium applicable to the remaining term and amount of insurance that will be adequate to pay future benefits. Present value of amounts not yet due is an amount for disability claims already reported and incurred and represents the present value of all the future benefits using actuarial disability tables. IBNR “Incurred But Not Reported” is an estimate of claims incurred but not yet reported, and is based upon historical analysis of claims payments.
Stock-Based Compensation
In recognizing stock-based compensation, Hancock follows the provisions of SFAS No. 123(R), Share-Based Payment. This statement establishes fair value as the measurement objective in accounting for stock awards and requires the application of a fair value based measurement method in accounting for compensation cost, which is recognized over the requisite service period.
Revenue Recognition
The largest source of revenue for Hancock is interest revenue. Interest revenue is recognized on an accrual basis driven by written contracts, such as loan agreements or securities contracts. Credit-related fees, including letter of credit fees, are recognized in non-interest income when earned. Hancock recognizes commission revenue and brokerage, exchange and clearance fess on a trade-date basis. Other types of non-interest revenue such as service charges on deposits and trust revenues, are accrued and recognized into income as services are provided and the amount of fees earned are reasonably determinable.
HANCOCK HOLDING COMPANY AND SUBSIDIARIES
NOTES TO CONSOLIDATED FINANCIAL STATEMENTS
Note 1. Summary of Significant Accounting Policies (continued)
Earnings Per Share
Basic earnings per share “EPS” excludes dilution and is computed by dividing net income by the weighted-average shares outstanding. Diluted EPS is computed by dividing net income, adjusted for the effect of potentially dilutive stock options outstanding during the period by the weighted-average stock outstanding.
Recent Accounting Pronouncements
New Accounting Standards
In December 2008, the Financial Accounting Standards Board (“FASB”) issued FASB Staff Position (FSP) No. 132(R)-1, Employers’ Disclosures about Postretirement Benefit Plan Assets, which provides guidance on an employer’s disclosures about plan assets of a defined benefit pension or other postretirement plan. The objectives of the disclosures are to provide users of financial statements with an understanding of how investment allocation decisions are made; the major categories of plan assets; the inputs and valuation techniques used to measure fair value of plan assets; the effect of fair value measurements using significant unobservable inputs (Level 3) on changes in plan assets for the period; and significant concentrations on risk within plan assets. FSP No. 132(R)-1 is effective for fiscal years ending after December 15, 2009. The Company is assessing the impact of adopting FSP No. 132(R)-1, but does not expect the impact to be material to the Company’s financial condition or results of operations.
In October 2008, the FASB issued FSP No. 157-3, Determining the Fair Value of a Financial Asset in a Market That is Not Active, which clarifies the application of SFAS No. 157, Fair Value Measurements, in an inactive market. Application issues clarified include: how management’s internal assumptions should be considered when measuring fair value when relevant observable data do not exist; how observable market information in a market that is not active should be considered when measuring fair value; and how the use of market quotes should be considered when assessing the relevance of observable and unobservable data available to measure fair value. FSP No. 157-3 was effective immediately and did not have a material impact on the Company’s financial condition or results of operations.
In November 2008, the FASB issued Emerging Issues Task Force (“EITF”) No 08-10, Selected Statement 160 Implementation Questions, which clarifies how an entity should account for the transfer of an interest in a subsidiary that is in-substance real estate; how an entity should account for the transfer of an interest in a subsidiary to an equity method investee that results in deconsolidation of the subsidiary; and how an entity should account for the transfer of an interest in a subsidiary in exchange for a joint venture interest that results in deconsolidation of the subsidiary. The Company will adopt the provisions of EITF No. 08-10 in the first quarter of 2009, as required, and the impact on the Company’s financial condition or results of operations is dependent on the extent of future business combinations.
In September 2008, the FASB issued EITF No 08-6, Equity Method Investment Accounting Considerations, which clarifies how the initial carrying value of an equity method investment should be determined; how the difference between the investor’s carrying value and the investor’s share of the underlying equity of the investee should be allocated to the underlying assets and liabilities of the investee; how an impairment assessment of an underlying indefinite-lived intangible asset of an equity method investment should be performed; how an equity method investee’s issuance of shares should be accounted for; and how to account for a change in an investment from the equity method to the cost method. The Company will adopt the provisions of EITF No. 08-6 in the first quarter of 2009, as required, and the impact on the Company’s financial condition or results of operations is dependent on the extent of future business combinations.
In June 2008, the FASB issued EITF No. 03-6-1, which provides that unvested share-based payment awards that contain nonforfeitable rights to dividends or dividend equivalents (whether paid or unpaid) are participating securities and should be included in the computation of earnings per share pursuant to the two-class method. EITF No. 03-6-1 is effective for financial statements issued for fiscal years beginning after December 15, 2008 and interim periods within those years. Upon adoption, a company is required to
HANCOCK HOLDING COMPANY AND SUBSIDIARIES
NOTES TO CONSOLIDATED FINANCIAL STATEMENTS
Note 1. Summary of Significant Accounting Policies (continued)
retrospectively adjust its earnings per share data including any amounts related to interim periods, summaries of earnings and selected financial data. The Company is assessing the impact of adopting EITF No. 03-6-1, but does not expect the impact to be material to the Company’s financial condition or results of operations.
In May 2008, the FASB issued SFAS No. 162, The Hierarchy of Generally Accepted Principles which is intended to improve financial reporting by identifying a consistent framework, or hierarchy, for selecting accounting principles to be used in preparing financial statements that are presented in conformity with U.S. generally accepted accounting principles for nongovernmental entities. SFAS No. 162 will be effective 60 days following the SEC’s approval of the Public Company Accounting Oversight Board (PCAOB) amendments to AU Section 411, The Meaning of Present Fairly in Conformity with Generally Accepted Accounting Principles. The Company will adopt the provisions of SFAS No. 162, when required, but does not expect the impact to be material to the Company’s financial condition or results of operations.
In April 2008, the FASB issued FSP No. 142-3, Determination of the Useful Life of Intangible Asset, which amends the factors that should be considered in developing renewal or extension assumptions used to determine the useful life of a recognized intangible asset under SFAS No. 142, Goodwill and Other Intangible Assets. The intent of the FSP is to improve the consistency between the useful life of a recognized intangible asset under SFAS No. 142 and the period of expected cash flows used to measure the fair value of the asset under SFAS No. 141R and other U.S. generally accepted accounting principles. This FSP is effective for financial statements issued for fiscal years beginning after December 15, 2008. The Company is assessing the impact of FSP No. 142-3, but does not expect the impact to be material to the Company’s financial condition or results of operations.
In March 2008, the FASB issued SFAS No. 161, Disclosures about Derivative Instruments and Hedging Activities – an Amendment of FASB 133, which enhances required disclosures regarding derivatives and hedging activities, including enhanced disclosures regarding how: (a) an entity uses derivative instruments; (b) derivative instruments and related hedged items are accounting for under SFAS No. 133, Accounting forDerivative Instruments and Hedging Activities; and (c) derivative instruments and related hedged items affect an entity’s financial position, financial performance, and cash flows. SFAS No. 161 is effective for fiscal years and interim periods beginning after November 15, 2008. The Company is assessing the impact of SFAS No. 161, but does not expect the impact to be material to the Company’s financial condition or results of operations.
SFAS No. 160, Noncontrolling Interests in Consolidated Financial Statements, an amendment of ARB No. 51, was issued in December 2007. This standard that is effective for 2009 governs the accounting for and reporting of noncontrolling interests in partially owned consolidated subsidiaries and the loss of control of subsidiaries. The Company currently has no such partially owned consolidated subsidiaries.
In December 2007, the FASB issued SFAS No. 141R, Business Combinations which applies to all business combinations. The statement requires most identifiable assets, liabilities, noncontrolling interests, and goodwill acquired in a business combination to be recorded at “full fair value.” All business combinations will be accounted for by applying the acquisition method (previously referred to as the purchase method.) Companies will have to identify the acquirer; determine the acquisition date and purchase price; recognize at their acquisition-date fair values the identifiable assets acquired, liabilities assumed, and any noncontrolling interests in the acquiree, and recognize goodwill or, in the case of a bargain purchase, a gain. SFAS No. 141R is effective for periods beginning on or after December 15, 2008, and early adoption is prohibited. It will be applied to business combinations occurring after the effective date. The Company will adopt the provisions of SFAS No. 141R in the first quarter of 2009, as required, and the impact on the Company’s financial condition or results of operations is dependent on the extent of future business combinations.
HANCOCK HOLDING COMPANY AND SUBSIDIARIES
NOTES TO CONSOLIDATED FINANCIAL STATEMENTS
Note 1. Summary of Significant Accounting Policies (continued)
Accounting Standards Adopted in 2008
In November 2007, the SEC issued Staff Accounting Bulletin No. 109, Written Loan Commitments Recorded at Fair Value Through Earnings, SAB No. 109 rescinds SAB No. 105’s prohibition on inclusion of expected net future cash flows related to loan servicing activities in the fair value measurement of a written loan commitment. SAB No. 109 applies to any loan commitments for which fair value accounting is elected under SFAS No. 159. SAB No. 109 is effective prospectively for derivative loan commitments issued or modified in fiscal quarters beginning after December 15, 2007. The adoption of SAB No. 109 during the first quarter of 2008 did not have a material impact on the Company’s results of operations or financial position.
In June 2007, the FASB ratified Emerging Issues Task Force (“EITF”) Issue No. 06-11, Accounting for Income Tax Benefits of Dividends on Share-Based Payment Award. The objective of this issue is to determine the accounting for the income tax benefits of dividend or dividend equivalents when the dividends or dividend equivalents are: (a) linked to equity-classified nonvested shares or share units or equity-classified outstanding share options and (b) charged to retained earnings under SFAS Statement No. 123 (Revised 2004), Share-Based Payment. The Task Force reached a consensus that EITF No. 06-11 should be applied prospectively to the income tax benefits of dividends on equity-classified employee share-based payment awards that are declared in fiscal years beginning after September 15, 2007. The adoption of EITF No. 06-11 during the first quarter of 2008 did not have a material impact on the Company’s results of operations or financial position.
In March 2007, the FASB ratified EITF No. 06-10, Accounting for Collateral Assignment Split-Dollar Life Insurance Arrangements. One objective of EITF No. 06-10 is to determine whether a liability for future benefits under a collateral assignment split-dollar life insurance arrangement that provides a benefit to an employee that extends into postretirement periods should be recognized in accordance with SFAS No. 106 or APB Opinion 12, as appropriate, based on the substantive agreement with the employee. Another objective of EITF No. 06-10 is to determine how the asset arising from a collateral assignment split-dollar life insurance arrangement should be recognized and measured. EITF No. 06-10 is effective for fiscal years beginning after December 15, 2007. The adoption of EITF No. 06-10 during the first quarter of 2008 did not have a material impact on the Company’s results of operations or financial position.
In February 2007, the FASB issued SFAS No. 159, The Fair Value Option for Financial Assets and Financial Liabilities - Including an Amendment SFAS No. 115 which permits an entity to choose to measure many financial instruments and certain other items at fair value. Most of the provisions in SFAS No. 159 are elective; however, the amendment to FASB Statement No. 115, Accounting for Certain Investments in Debt and Equity Securities, applies to all entities with available-for-sale and trading securities. The fair value option established by SFAS No. 159 permits all entities to choose to measure eligible items at fair value at specified election dates. A business entity will report unrealized gains and losses on items for which the fair value option has been elected in earnings (or another performance indicator if the business entity does not report earnings) at each subsequent reporting date. The fair value option: (a) may be applied instrument by instrument, with a few exceptions, such as investments otherwise accounted for by the equity method; (b) is irrevocable (unless a new election date occurs); and (c) is applied only to entire instruments and not to portions of instruments. The adoption of SFAS No. 159 during the first quarter of 2008 did not have a material impact on the Company’s results of operations or financial position.
Effective December 31, 2006, the Company adopted SFAS No. 158, Employers’ Accounting for Defined Benefit Pension and Other Postretirement Plans – an amendment of FASB Statements No. 87, 88, 106 and 132(R); which required the recognition of the over funded or under funded status of a defined benefit postretirement plan as an asset or liability on the balance sheet. In 2008, the Company changed the measurement date of the funded status of the plan from September 30 to December 31.
HANCOCK HOLDING COMPANY AND SUBSIDIARIES
NOTES TO CONSOLIDATED FINANCIAL STATEMENTS
Note 1. Summary of Significant Accounting Policies (continued)
In September 2006, the FASB issued SFAS No. 157, Fair Value Measurements. This standard defines fair value, establishes a framework for measuring fair value in accounting principles generally accepted in the United States of America, and expands disclosure about fair value measurements. This pronouncement applies to other accounting standards that require or permit fair value measurements. Accordingly, this statement does not require any new fair value measurement. This statement is effective for fiscal years beginning after November 15, 2007, and interim periods within those fiscal years. At the November 14, 2007 Board meeting, the Board decided to defer the effective date for all nonfinancial assets and nonfinancial liabilities, except those that are recognized or disclosed at fair value in the financial statements on a recurring basis (at least annually). The adoption of SFAS No. 157 during the first quarter of 2008 did not have a material impact on the Company’s results of operations or financial position.
Note 2. Securities
The amortized cost and fair value of securities classified as available for sale follow (in thousands):
|
|
|
|
|
|
|
|
|
|
|
|
|
|
|
|
|
|
|
|
|
|
|
|
|
|
|
| December 31, 2008 |
| December 31, 2007 |
| ||||||||||||||||||||
|
|
|
| ||||||||||||||||||||||
|
| Amortized |
| Gross |
| Gross |
| Fair |
| Amortized |
| Gross |
| Gross |
| Fair |
| ||||||||
|
|
|
|
|
|
|
|
|
| ||||||||||||||||
U.S. Treasury |
| $ | 11,250 |
| $ | 192 |
| $ | — |
| $ | 11,442 |
| $ | 11,353 |
| $ | 41 |
| $ | — |
| $ | 11,394 |
|
U.S. government agencies |
|
| 224,803 |
|
| 1,836 |
|
| 29 |
|
| 226,610 |
|
| 431,772 |
|
| 1,999 |
|
| 107 |
|
| 433,664 |
|
Municipal obligations |
|
| 151,706 |
|
| 3,182 |
|
| 2,418 |
|
| 152,470 |
|
| 197,596 |
|
| 2,347 |
|
| 1,361 |
|
| 198,582 |
|
Mortgage-backed securities |
|
| 1,041,805 |
|
| 25,703 |
|
| 387 |
|
| 1,067,121 |
|
| 637,578 |
|
| 3,519 |
|
| 4,717 |
|
| 636,380 |
|
CMOs |
|
| 195,771 |
|
| 2,692 |
|
| 1 |
|
| 198,462 |
|
| 143,639 |
|
| 392 |
|
| 1,219 |
|
| 142,812 |
|
Other debt securities |
|
| 25,117 |
|
| 5 |
|
| 2,850 |
|
| 22,272 |
|
| 49,653 |
|
| 342 |
|
| 1,597 |
|
| 48,398 |
|
Other equity securities |
|
| 1,047 |
|
| 462 |
|
| 130 |
|
| 1,379 |
|
| 959 |
|
| 613 |
|
| 19 |
|
| 1,553 |
|
|
|
|
|
|
|
|
|
|
| ||||||||||||||||
|
| $ | 1,651,499 |
| $ | 34,072 |
| $ | 5,815 |
| $ | 1,679,756 |
| $ | 1,472,550 |
| $ | 9,253 |
| $ | 9,020 |
| $ | 1,472,783 |
|
|
|
|
|
|
|
|
|
|
| ||||||||||||||||
The amortized cost and fair value of securities classified as available for sale at December 31, 2008, by contractual maturity, (expected maturities will differ from contractual maturities because of rights to call or repay obligations with or without penalties), and the amortized cost and fair value of trading securities were as follows (in thousands):
|
|
|
|
|
|
|
|
|
| Amortized |
| Fair |
| ||
|
|
|
| ||||
Due in one year or less |
| $ | 48,735 |
| $ | 49,190 |
|
Due after one year through five years |
|
| 129,658 |
|
| 132,290 |
|
Due after five years through ten years |
|
| 205,438 |
|
| 204,412 |
|
Due after ten years |
|
| 29,045 |
|
| 26,902 |
|
|
|
|
| ||||
|
|
| 412,876 |
|
| 412,794 |
|
|
|
|
|
|
|
|
|
Mortgage-backed securities & CMOs |
|
| 1,237,576 |
|
| 1,265,583 |
|
Equity securities |
|
| 1,047 |
|
| 1,379 |
|
|
|
|
| ||||
Total available for sale securities |
| $ | 1,651,499 |
| $ | 1,679,756 |
|
|
|
|
| ||||
The Company held no securities classified as held to maturity at December 31, 2008 or 2007.
HANCOCK HOLDING COMPANY AND SUBSIDIARIES
NOTES TO CONSOLIDATED FINANCIAL STATEMENTS
Note 2. Securities (continued)
The details concerning securities classified as available for sale with unrealized losses as of December 31, 2008 follow (in thousands):
|
|
|
|
|
|
|
|
|
|
|
|
|
|
|
|
|
|
|
|
|
| Losses < 12 months |
| Losses 12 months or > |
| Total |
| ||||||||||||
|
|
|
|
|
|
| |||||||||||||
|
| Fair |
| Gross |
| Fair |
| Gross |
| Fair |
| Gross |
| ||||||
|
|
|
|
|
|
|
| ||||||||||||
U.S. government agencies |
| $ | — |
| $ | — |
| $ | 20,077 |
| $ | 29 |
| $ | 20,077 |
| $ | 29 |
|
Municipal obligations |
|
| — |
|
| — |
|
| 38,610 |
|
| 2,418 |
|
| 38,610 |
|
| 2,418 |
|
Mortgage-backed securities |
|
| — |
|
| — |
|
| 20,385 |
|
| 387 |
|
| 20,385 |
|
| 387 |
|
CMOs |
|
| — |
|
| — |
|
| 4,442 |
|
| 1 |
|
| 4,442 |
|
| 1 |
|
Other debt securities |
|
| 1,029 |
|
| 25 |
|
| 22,077 |
|
| 2,825 |
|
| 23,106 |
|
| 2,850 |
|
Equity securities |
|
| — |
|
| — |
|
| 135 |
|
| 130 |
|
| 135 |
|
| 130 |
|
|
|
|
|
|
|
|
| ||||||||||||
|
| $ | 1,029 |
| $ | 25 |
| $ | 105,726 |
| $ | 5,790 |
| $ | 106,755 |
| $ | 5,815 |
|
|
|
|
|
|
|
|
| ||||||||||||
The details concerning securities classified as available for sale with unrealized losses as of December 31, 2007 were as follows (in thousands):
|
|
|
|
|
|
|
|
|
|
|
|
|
|
|
|
|
|
|
|
|
| Losses < 12 months |
| Losses 12 months or > |
| Total |
| ||||||||||||
|
|
|
|
|
|
| |||||||||||||
|
| Fair |
| Gross |
| Fair |
| Gross |
| Fair |
| Gross |
| ||||||
|
|
|
|
|
|
|
| ||||||||||||
U.S. government agencies |
| $ | 29,893 |
| $ | 107 |
| $ | — |
| $ | — |
| $ | 29,893 |
| $ | 107 |
|
Municipal obligations |
|
| 4,946 |
|
| 17 |
|
| 37,327 |
|
| 1,344 |
|
| 42,273 |
|
| 1,361 |
|
Mortgage-backed securities |
|
| — |
|
| — |
|
| 206,894 |
|
| 4,717 |
|
| 206,894 |
|
| 4,717 |
|
CMOs |
|
| — |
|
| — |
|
| 117,489 |
|
| 1,219 |
|
| 117,489 |
|
| 1,219 |
|
Other debt securities |
|
| 4,177 |
|
| 147 |
|
| 23,230 |
|
| 1,450 |
|
| 27,407 |
|
| 1,597 |
|
Equity securities |
|
| — |
|
| — |
|
| 17 |
|
| 19 |
|
| 17 |
|
| 19 |
|
|
|
|
|
|
|
|
| ||||||||||||
|
| $ | 39,016 |
| $ | 271 |
| $ | 384,957 |
| $ | 8,749 |
| $ | 423,973 |
| $ | 9,020 |
|
|
|
|
|
|
|
|
| ||||||||||||
The unrealized losses relate to fixed-rate debt securities that have incurred fair value reductions due to higher market interest rates since the respective purchase date. The unrealized losses are not likely to reverse unless and until market interest rates decline to the levels that existed when the securities were purchased. Since none of the unrealized losses relate to the marketability of the securities or the issuer’s ability to honor redemption obligations, none of the securities are deemed to be other than temporarily impaired.
As of December 31, 2008, the securities portfolio totaled $1.68 billion. Of the total portfolio, $106.8 million of securities were in an unrealized loss position of $5.8 million. Management and the Asset/Liability Committee continually monitor the securities portfolio and management is able to effectively measure and monitor the unrealized loss position on these securities. The Company has adequate liquidity and therefore has the ability and additionally the intent to hold these securities to recovery. Accordingly, the unrealized loss of these securities has been determined to be temporary.
The Company’s securities portfolio is an important source of liquidity and earnings for the Company. A stated objective in managing the securities portfolio is to provide consistent liquidity to support balance sheet growth but also to provide a safe and consistent stream of earnings. To that end, management is open to opportunities that present themselves which enables the Company to improve the structure and earnings potential of the securities portfolio.
HANCOCK HOLDING COMPANY AND SUBSIDIARIES
NOTES TO CONSOLIDATED FINANCIAL STATEMENTS
Note 2. Securities (continued)
Available for Sale Securities
Proceeds from sales and pay downs of available for sale securities were approximately $213.8 million in 2008, $9.2 million in 2007 and $157.3 million in 2006. Gross gains of $6.0 million in 2008, $0.4 million in 2007 and $0.3 million in 2006 and gross losses of $4.1 million in 2008, $0.1 million in 2007 and $5.5 million in 2006 were realized on such sales and pay downs.
Securities with an amortized cost of approximately $1.49 billion at December 31, 2008 and $1.15 billion at December 31, 2007, were pledged primarily to secure public deposits and securities sold under agreements to repurchase. The Company has approximately $4.8 million and $6.4 million of securities pledged with various state regulatory authorities to secure reinsurance receivables as of December 31, 2008 and 2007, respectively.
Trading Securities
The Company recognized $2.9 million in net gains, including a net gain of $3.2 million on a portfolio of trading securities which were subsequently transferred to available for sale. There were no trading gains or losses in 2007.
Note 3. Loans
Loans, net of unearned income, consisted of the following (in thousands):
|
|
|
|
|
|
|
|
|
| December 31, |
| ||||
|
|
| |||||
|
| 2008 |
| 2007 |
| ||
|
|
|
| ||||
Real estate loans |
| $ | 2,680,682 |
| $ | 2,332,891 |
|
Commercial and industrial loans |
|
| 420,981 |
|
| 359,519 |
|
Loans to individuals for household, family and other consumer expenditures |
|
| 619,115 |
|
| 571,349 |
|
Leases and other loans |
|
| 528,687 |
|
| 332,798 |
|
|
|
|
| ||||
|
| $ | 4,249,465 |
| $ | 3,596,557 |
|
|
|
|
| ||||
The Company generally makes loans in its market areas of South Mississippi, South Alabama, South and Central Louisiana and Northwest Florida. Loans are made in the normal course of business to its directors, executive officers and their associates on substantially the same terms, including interest rates and collateral, as those prevailing at the time for comparable transactions with other persons. Such loans did not involve more than normal risk of collectibility. Balances of loans to the Company’s directors, executive officers and their affiliates at December 31, 2008 and 2007 were approximately $31.6 million and $13.1 million, respectively. New loans, repayments and changes of directors and executive officers and their affiliates on these loans for 2008 were $20.7 million, $4.3 million and $2.1 million, respectively. New loans, repayments and changes of directors and executive officers and their affiliates on these loans for 2007 were $3.7 million, $1.6 million and $3.5 million, respectively.
HANCOCK HOLDING COMPANY AND SUBSIDIARIES
NOTES TO CONSOLIDATED FINANCIAL STATEMENTS
Note 3. Loans (continued)
Changes in the allowance for loan losses follow (in thousands):
|
|
|
|
|
|
|
|
|
|
|
|
| 2008 |
| 2007 |
| 2006 |
| |||
|
|
|
|
| ||||||
Balance at January 1 |
| $ | 47,123 |
| $ | 46,772 |
| $ | 74,558 |
|
Recoveries |
|
| 5,224 |
|
| 7,210 |
|
| 12,491 |
|
Loans charged off |
|
| (27,407 | ) |
| (14,452 | ) |
| (19,515 | ) |
Provision for (reversal of) loan losses |
|
| 36,785 |
|
| 7,593 |
|
| (20,762 | ) |
|
|
|
|
| ||||||
Balance at December 31 |
| $ | 61,725 |
| $ | 47,123 |
| $ | 46,772 |
|
|
|
|
|
| ||||||
In 2005, the Company established a $35.2 million specific allowance for estimated credit losses related to the impact of Hurricane Katrina on its loan portfolio. In 2005, the Company reduced the allowance by $2.4 million for storm-related net charge-offs. Of this remaining amount, the Company reversed $20.0 million of the allowance to income in 2006 based on its review of the asset quality of significant credits included in the original $35.2 million storm-related allowance.
In some instances, loans are placed on non-accrual status. All accrued but uncollected interest related to the loan is deducted from income in the period the loan is assigned a non-accrual status. For such period as a loan is in non-accrual status, any cash receipts are applied first to principal, second to expenses incurred to cause payment to be made and lastly to the recovery of any reversed interest income and interest that would be due and owing subsequent to the loan being placed on non-accrual status.
The Company’s investments in impaired loans at December 31, 2008 and December 31, 2007 were $22.1 million and $10.4 million, respectively. Non-accrual and renegotiated loans amounted to approximately 0.71% and 0.36% of total loans at December 31, 2008 and 2007, respectively. Accruing loans 90 days past due as a percent of loans was 0.26% and 0.12% at December 31, 2008 and 2007, respectively. The average amounts of impaired loans carried on the Company’s books for 2008, 2007 and 2006 were $19.3 million, $7.7 million and $7.4 million, respectively. The amount of interest that would have been recorded on non-accrual loans had the loans not been classified as non-accrual in 2008, 2007 or 2006, was $1.1 million, $0.5 million and $0.8 million, respectively. The amount of interest actually collected was immaterial in 2008, 2007, and 2006.
The following table presents the makeup of allowance for loan losses by:
|
|
|
|
|
|
|
|
|
| December 31, |
| ||||
|
|
| |||||
|
| 2008 |
| 2007 |
| ||
|
|
|
| ||||
|
| (In thousands) |
| ||||
Balance of allowance for loan losses |
|
|
|
|
|
|
|
Non-impaired |
| $ | 54,408 |
| $ | 43,070 |
|
Impaired |
|
| 7,317 |
|
| 4,053 |
|
|
|
|
| ||||
Total allowance for loan losses |
| $ | 61,725 |
| $ | 47,123 |
|
|
|
|
| ||||
As of December 31, 2008 and 2007, the Company had $24.1 million and $18.8 million, respectively, in loans carried at fair value. The Company held $22.1 million and $19.0 million in loans held for sale at December 31, 2008 and 2007 carried at lower of cost or market. These loans are originated on a best-efforts basis, whereby a commitment by a third party to purchase the loan has been received concurrent with the Banks’ commitment to the borrower to originate the loan.
HANCOCK HOLDING COMPANY AND SUBSIDIARIES
NOTES TO CONSOLIDATED FINANCIAL STATEMENTS
Note 4. Property and Equipment
Property and equipment are recordedstated at cost. Costs of normal repairscost, less accumulated depreciation and maintenance are charged to expense as incurred. Gains or losses on dispositions of property and equipment are included in the determination of income. Depreciation is computed using multiple methods based on the estimated useful livesamortization, consisted of the related assets, which generally range from 7 to 39following (in thousands):
|
|
|
|
|
|
|
|
|
| December 31, |
| ||||
|
|
| |||||
|
| 2008 |
| 2007 |
| ||
|
|
|
| ||||
Land and land improvements |
| $ | 38,090 |
| $ | 32,679 |
|
Buildings and leasehold improvements |
|
| 178,374 |
|
| 156,666 |
|
Furniture, fixtures and equipment |
|
| 61,525 |
|
| 59,837 |
|
Construction in progress |
|
| 4,111 |
|
| 14,836 |
|
Software |
|
| 24,862 |
|
| 23,708 |
|
|
|
|
| ||||
|
|
| 306,962 |
|
| 287,726 |
|
Accumulated depreciation and amortization |
|
| (101,050 | ) |
| (87,160 | ) |
|
|
|
| ||||
Property and equipment, net |
| $ | 205,912 |
| $ | 200,566 |
|
|
|
|
| ||||
Depreciation and amortization expense was $15.8 million, $14.0 million and $10.4 million for the years ended December 31, 2008, 2007 and 2006, respectively. Capitalized interest was $77,000, $1.0 million, and $0.8 million for buildingsthe years ended December 31, 2008, 2007, and improvements2006, respectively.
Note 5. Goodwill and from 3 to 7 years for furniture, fixtures and equipment. Leasehold improvements are amortized over the shorter of the term of the lease or the asset’s useful life.Other Intangible Assets
Goodwill represents costs in excess of the fair value of net assets acquired in connection with purchase business combinations. In accordance with the provisions of SFAS No. 142,Goodwill and Other Intangibles, the Company tests its goodwill for impairment annually or more frequently if impairment indicators are present. If indicators of impairment were present and undiscounted future cash flows were not expected to be sufficient to recover the assets’ carrying amount, an impairment loss would be charged to expense in the period identified.
Other real estate acquired through foreclosure is stated at fair value at the date of acquisition, net of the costs of disposal. When a reduction to fair value at the time of foreclosure is required, it is charged to the allowance for loan losses. Valuation allowances associated with other real estate amounted to $131,000 and $450,000 at December 31, 2006 and 2005, respectively.
The Company determines the fair value of other real estate utilizing observations of current market conditions, adjusted for contracts existing at the date of valuation. The carrying value of other real estate is adjusted on a quarterly basis.
Any subsequent adjustments, as well as the costs associated with holding the real estate, are charged to expense.
Other intangible assets consist of core deposit intangibles, value of business acquired, value of insurance expirations, non-compete agreements, trade name and mortgage servicing rights (MSRs). Other intangible assets are being amortized using multiple methods based on the assets estimated useful life and pattern in which the expected benefits are consumed. If indicators of impairment were present in amortizable intangible assets and undiscounted future cash flows were not expected to be sufficient to recover the assets’ carrying amount, an impairment loss would be charged to expense in the period identified.
MSRs are rights to service mortgage loans for others, on loans not retained by the Company. For loans originated and sold, where the servicing rights have been retained, the Company allocates the cost of the loan and servicing right based on their relative fair values. The Company amortizes MSRs over the estimated lives of the underlying loans in proportion to the resultant servicing income stream. For the valuation of MSRs, management obtains external information, evaluates overall portfolio characteristics and monitors economic conditions to arrive at appropriate prepayment speeds and other assumptions. The company used the loan type and term of the mortgage to stratify the servicing portfolio on which MSRs have been recognized to determine valuation and impairment. Impairment is recognized for the amount by which MSRs for a stratum exceed their fair value.
HANCOCK HOLDING COMPANY AND SUBSIDIARIESNOTES TO CONSOLIDATED FINANCIAL STATEMENTS
Life insurance contracts represent single premium life insurance contracts on the lives of certain officers of the Company. The Company is the beneficiary of these policies. These contracts are reported at their cash surrender values of $107.2 million and $83.1 million at December 31, 2006 and 2005, respectively. Changes in the cash surrender value are included in other income and amounted to $4.1 million, $3.5 million and $3.5 million for the years ended December 31, 2006, 2005 and 2004, respectively.
Certain premiums and losses are assumed from and ceded to other insurance companies under various reinsurance agreements. Reinsurance premiums, loss reimbursement, and reserves related to reinsurance business are accounted for on a basis consistent with that used in accounting for the original policies issued and the terms of the reinsurance contract. The Company may receive a ceding commission in connection with ceded reinsurance. If so, the ceding commission is earned on a monthly pro rata basis in the same manner as the premium and is recorded as a reduction of other operating expenses.
The Company is self insured for certain risks including employee health insurance and records estimated liabilities for these risks.
The Company recognizes the financial and servicing assets it controls and the liabilities it incurs, derecognizes financial assets when control has been surrendered, and derecognizes liabilities when extinguished. All measurements and allocations are based on fair value.
Trust income is recorded as earned.
Provisions for income taxes are based on taxes payable or refundable for the current year (after exclusion of non-taxable income such as interest on state and municipal securities and loans and earnings on the Company’s bank-owned life insurance policies). Deferred taxes on temporary differences are calculated at the currently enacted tax rates applicable to the period in which the deferred tax assets and liabilities are expected to be realized or settled. As changes in tax laws or rates are enacted, deferred tax assets and liabilities are adjusted through the provision for income taxes.
The Company has accounted for its defined benefit pension plan using the actuarial model required by SFAS No. 87,Employers’ Accounting for Pensions. The compensation cost of an employee’s pension benefit is recognized on the projected unit credit method over the employee’s approximate service period. The aggregate cost method is utilized for funding purposes. The Company also sponsors two defined benefit postretirement plans, which provide medical benefits and life insurance benefits. The Company has accounted for these plans using the actuarial computations required by SFAS No. 106,Employers Accounting for Postretirement Benefits Other Than Pensions as amended by SFAS No. 132. The cost of the defined benefit postretirement plan has been recognized on the projected unit credit method over the employee’s approximate service period. Effective December 31, 2006, the Company adopted SFAS No. 158,Employers’ Accounting for Defined Benefit Pension and Other Postretirement Plans — an amendment of FASB Statements No. 87, 88, 106 and 132(R); which requires the recognition of the over funded or under funded status of a defined benefit postretirement plan as an asset or liability on the balance sheet. As a result of adopting SFAS No. 158, unrecognized transition assets and obligations, unrecognized actuarial gains and losses and prior service costs and credits are recognized as a component of accumulated other comprehensive income resulting in a reduction to stockholders’ equity of $7.9 million.
HANCOCK HOLDING COMPANY AND SUBSIDIARIESNOTES TO CONSOLIDATED FINANCIAL STATEMENTS
Unearned premium reserves are based on the assumption that the portion of the original premium applicable to the remaining term and amount of insurance will be adequate to pay future benefits. The reserve is calculated by multiplying the original gross premium times an unearned premium factor. Factors are developed which represent the proportion of the remaining coverage compared to the total coverage provided over the entire term of insurance.
Policy reserves for future life and health claims not yet incurred are based on assumed mortality and interest rates. For disability, the reserves are based upon unearned premium, which is the portion of the original premium applicable to the remaining term and amount of insurance that will be adequate to pay future benefits. Present value of amounts not yet due is an amount for disability claims already reported and incurred and represents the present value of all the future benefits using actuarial disability tables. IBNR (Incurred But Not Reported) is an estimate of claims incurred but not yet reported, and is based upon historical analysis of claims payments.
The Company adopted SFAS No. 123(R),Accounting for Stock-Based Compensation, effective January 1, 2006. Under the provisions of this statement, compensation expense is recognized for options granted, modified or settled after January 1, 2006, utilizing the fair value of the grants over the vesting period. The impact of the adoption of SFAS No. 123(R) on the Company’s net income was $2.5 million. (See Note 14).The Company estimates the fair value of each pool of options granted using the Black-Scholes-Merton options pricing model.
Basic earnings per common share (EPS) excludes dilution and is computed by dividing net earnings available to common shareholders by the weighted-average number of common shares outstanding for the period. Diluted EPS reflects the potential dilution that could occur if securities or other contracts to issue common stock were exercised or converted into common stock or resulted in the issuance of common stock that then shared in the earnings of the entity. Diluted EPS is computed by dividing net earnings available to common shareholders by the total of the weighted-average number of shares outstanding plus the “if-converted” effect of outstanding options and other equity based incentives using the treasury stock method.
In the ordinary course of business, the Company has entered into commitments to extend credit and standby letters of credit. Such financial instruments are recorded when they are funded.
In May 2005, the FASB issued SFAS No. 154,Accounting Changes and Error Corrections (“SFAS No. 154”). SFAS No. 154 is a replacement of APB Opinion No. 20, Accounting Changes, and SFAS No. 3,Reporting Accounting Changes in Interim Financial Statements, and changes the requirements for the accounting for and reporting of a change in accounting principle. SFAS No. 154 applies to all voluntary changes in accounting principle and to changes required by an accounting pronouncement in the unusual instance that the pronouncement does not include specific transition provisions. This statement requires retrospective application to prior periods’ financial statements of changes in accounting principle, unless it is impracticable to determine period-specific effects of an accounting change on one or more individual prior periods presented. Then the new accounting principle is applied to the balances of assets and liabilities as of the beginning of the earliest period for which retrospective application is practicable and that a corresponding adjustment is made to the opening balance of retained earnings for that period rather that being reported in an income statement. Further, the accounting principle is to be applied prospectively from the earliest date when it is impracticable to determine the effect to all prior periods. The Company adopted SFAS No. 154 as of January 1, 2006 as required and its effect on the consolidated financial statements, to date, has not been material. Adoption of this statement could have an impact if there are future voluntary accounting changes and correction of errors.
HANCOCK HOLDING COMPANY AND SUBSIDIARIESNOTES TO CONSOLIDATED FINANCIAL STATEMENTS
In September 2005, the American Institute of Certified Public Accountants (“AICPA”) issued Statement of Position 05-1,Accounting by Insurance Enterprises for Deferred Acquisition Costs in Connection with Modifications or Exchanges of Insurance Contracts (“SOP 05-1”). SOP 05-1 provides guidance on accounting by insurance enterprises for deferred acquisition costs on internal replacements of insurance and investment contracts other than those specifically described in FASB Statement No. 97,Accounting and Reporting by Insurance Enterprises for Certain Long-Duration Contracts and for Realized Gains and Losses from the Sale of Investments. The provisions in SOP 05-1 are effective for the Company beginning in fiscal year 2007. The Company is currently evaluating the requirements of SOP 05-1 and has not yet determined the impact on the Company’s consolidated financial statements.
In March 2006, the Financial Accounting Standards Board (FASB) issued SFAS No. 156,Accounting for Servicing of Financial Assets (“SFAS No. 156”). SFAS No. 156 requires all separately recognized servicing assets and servicing liabilities to be initially measured at fair value, if practicable, and permits an entity to subsequently measure those servicing assets and servicing liabilities at fair value. This pronouncement is effective for the Company beginning in fiscal year 2007. The Company intends on using the amortization method and does not believe the adoption of SFAS No. 156 will have a material impact on its results of operations and financial position.
In June 2006, the FASB issued Interpretation No. 48,Accounting for Uncertainty in Income Taxes, An Interpretation of FASB Statement No. 109 (“FIN 48”). FIN 48 clarifies that the benefit of a position taken or expected to be taken in a tax return should be recognized in a company’s financial statements in accordance with SFAS No.109,Accounting for Income Taxes, when it is more likely than not that the position will be sustained based on its technical merits. FIN 48 also prescribes how to measure the tax benefit recognized and provides guidance on when a tax benefit should be derecognized as well as various other accounting, presentation and disclosure matters. This interpretation is effective for the Company beginning in fiscal year 2007. The Company does not believe the adoption of FIN 48 will have a material impact on its results of operations and financial position.
In September 2006, the FASB issued SFAS No. 157,Fair Value Measurements (“SFAS No. 157”). This standard defines fair value, establishes a framework for measuring fair value in accounting principles generally accepted in the United States of America, and expands disclosure about fair value measurements. This pronouncement applies to other accounting standards that require or permit fair value measurements. Accordingly, this statement does not require any new fair value measurement. This statement is effective for fiscal years beginning after November 15, 2007, and interim periods within those fiscal years. The Company will be required to adopt SFAS No. 157 in the first quarter of fiscal year 2008. Management is currently evaluating the requirements of SFAS No. 157 and has not yet determined the impact on the Company’s consolidated financial statements.
In September 2006, the FASB issued SFAS No. 158,Employers’ Accounting for Defined Benefit Pension and Other Postretirement Plans — An Amendment of FASB Statements No. 87, 88, 106, and 132(R) (“SFAS No. 158”). This pronouncement requires an employer to recognize the over funded or under funded status of a defined benefit postretirement plan (other than a multiemployer plan) as an asset or liability on its balance sheet. SFAS No. 158 also requires an employer to recognize changes in that funded status in the year in which the changes occur through comprehensive income effective for fiscal years ending after December 15, 2006. In addition, this statement requires an employer to measure the funded status of a plan as of its year-end balance sheet date effective for fiscal years ending after December 15, 2008. The Company adopted the requirement to recognize the funded status of the benefit plans and related disclosure requirements as of December 31, 2006. The Company is currently evaluating the requirements of SFAS No. 158 related to the measurement date and has not yet determined the impact of adoption on the Company’s consolidated financial statements.
HANCOCK HOLDING COMPANY AND SUBSIDIARIESNOTES TO CONSOLIDATED FINANCIAL STATEMENTS
In September 2006, the FASB ratified the consensus the EITF reached regarding EITF No.06-5,Accounting for Purchases of Life Insurance — Determining the Amount that Could Be Realized in Accordance with FASB Technical Bulletin 85-4 (“EITF 06-5”). The EITF concluded that a policyholder should consider any additional amounts included in the contractual terms of the life insurance policy in determining the “amount that could be realized under the insurance contract.” For group policies with multiple certificates or multiple policies with a group rider, the Task Force also tentatively concluded that the amount that could be realized should be determined at the individual policy or certificate level, i.e., amounts that would be realized only upon surrendering all of the policies or certificates would not be included when measuring the assets. This interpretation is effective for the Company beginning in fiscal year 2007. The Company does not believe the adoption of EITF 06-5 will have a material impact on its results of operations and financial position.
In fiscal 2006, the Company adopted SEC Staff Accounting Bulletin No. 108 (“SAB No. 108”). SAB No. 108 requires that registrants assess the impact on both balance sheet and the statement of income when quantifying and evaluating the materiality of a misstatement. Under SAB No. 108, adjustment of financial statements is required when either approach results in quantifying a misstatement that is material to a reporting period presented within the financial statements, after considering all relevant quantitative and qualitative factors. The impact of adopting SAB No. 108 was a $2.9 million adjustment to retained earnings as of December 31, 2005, as disclosed in Note 12.
Net income for both 2006 and 2005 was affected by several items related to the impact of Hurricane Katrina, which made landfall in the Company’s operating region on August 29, 2005. In 2005, net income was negatively affected by storm-related items totaling $21.1 million on an after tax basis. The largest of 2005‘s items was the establishment of a $35.2 million (pretax) allowance for loan losses related to the storm. In 2006, the Company reversed $20.0 million from the storm-related allowance for loan losses due to better than expected loss experience with storm impacted credits. In addition, the Company negotiated a final settlement with our primary property and casualty insurance provider and recognized a $5.1 million gain in 2006.
In July 2006, the Company purchased a 50% interest in a joint venture partnership for $4.7 million in which no party has a controlling interest. The Company’s vision is to help develop the Mississippi Coast as a center for economic development in the 21st century by creating the Gulf South Technology Center, LLC. Management expects that the center will include a commercial hub offering state of the art technology infrastructure, strategic multimodal transportation access and a network of business support services as well as corporate office complexes, technology and data centers, logistics and distribution facilities, service and convenience retail, residential housing and education campuses.
HANCOCK HOLDING COMPANY AND SUBSIDIARIESNOTES TO CONSOLIDATED FINANCIAL STATEMENTS
On July 1, 2005, Hancock Insurance Agency acquired 100% of the stock of J. Everett Eaves, Inc., a well-known commercial insurance agency operating in the New Orleans, Louisiana market for approximately $5.0 million. During 2006, to record the final purchase price of J. Everett Eaves, Inc. and reflect the results of a third-party study which valued the intangible assets, the Company recorded a reallocation of intangibles and final purchase accounting adjustments which resulted in the recording of four separate categories of intangible assets: value of insurance expirations, $1.9 million; non-compete agreements, $0.1 million; trade name, $0.1 million and goodwill of $3.8 million. The value of insurance expirations, non-compete agreements and trade name assets are being amortized over their estimated lives, which are 10, 5 and 5 year lives, respectively, on a straight line basis.
An intangibles valuation relating to the intangibles recorded in the acquisition of Ross King Walker, Inc. in late 2004 was completed during 2005. The reallocation of intangibles resulted in the recording of three separate categories of intangible assets: value of insurance expirations, $1.1 million; non-compete agreements, $0.2 million and goodwill of $1.3 million. The value of insurance expirations and non-compete agreement assets are being amortized over their estimated lives, which are 10 years and 5 years, respectively, on an accelerated basis.
The amortized cost and fair value of securities classified as available for sale follow (in thousands):
December 31, 2006 December 31, 2005 --------------------------------------------------- -------------------------------------------------- Gross Gross Gross Gross Amortized Unrealized Unrealized Fair Amortized Unrealized Unrealized Fair Cost Gains Losses Value Cost Gains Losses Value -------------- --------- ------------ ------------- ------------ ---------- ---------- ---------------U.S. Treasury $ 60,231 $ 17 $ 57 $ 60,191 $ 50,883 $ 22 $ 35 $ 50,870 U.S. government agencies 1,016,811 172 6,054 1,010,929 1,029,656 299 10,695 1,019,260 Municipal obligations 200,891 3,556 430 204,017 165,180 3,548 521 168,207 Mortgage-backed securities 443,410 995 9,978 434,427 484,131 1,064 11,657 473,538 CMOs 116,161 - 1,991 114,170 194,899 6 2,827 192,078 Other debt securities 44,664 282 926 44,020 48,476 288 1,553 47,211 Federal home loan bank stock 3,198 - - 3,198 5,422 - - 5,422 Other equity securities 31,479 1,247 20 32,706 2,098 631 54 2,675 -------------- --------- ------------ ------------- ------------ ---------- ---------- --------------- $ 1,916,845 $ 6,269 $ 19,456 $ 1,903,658 $ 1,980,745 $ 5,858 $ 27,342 $ 1,959,261 ============== ========= ============ ============= ============ ========== ========== ===============
HANCOCK HOLDING COMPANY AND SUBSIDIARIESNOTES TO CONSOLIDATED FINANCIAL STATEMENTS
The amortized cost and fair value of securities classified as available for sale at December 31, 2006, by contractual maturity, (expected maturities will differ from contractual maturities because of rights to call or repay obligations with or without penalties) were as follows (in thousands):
Amortized Fair Cost Value ---------------- ----------------Due in one year or less $ 655,944 $ 654,732 Due after one year through five years 407,810 406,557 Due after five years through ten years 239,444 238,429 Due after ten years 19,399 19,439 ---------------- ---------------- 1,322,597 1,319,157 Mortgage-backed securities & CMOs 559,571 548,597 Equity securities 34,677 35,904 ---------------- ---------------- $ 1,916,845 $ 1,903,658 ================ ================
The Company held no securities classified as held to maturity at December 31, 2006 and 2005. During 2005, securities classified as held to maturity in the portfolio of one of the Company’s subsidiaries were sold. A determination was made that this action tainted the investment portfolio of the entire Company. As a result of this action and determination, all securities held by the Company have been classified to available for sale and the carrying value of those securities are adjusted to market as prescribed in SFAS No. 115,Accounting for Certain Investments in Debt and Equity Securities. Investments with a carrying value of approximately $167.0 million were reclassified and resulted in the recording of net unrealized gains of approximately $480,000. There were no associated gains or losses in accumulated other comprehensive income related to any derivative which hedged these securities.
The details concerning securities classified as available for sale with unrealized losses as of December 31, 2006 follow (in thousands):
Losses < 12 months Losses 12 months or > Total ---------------------------- ------------------------------ ----------------------------- Gross Gross Gross Unrealized Unrealized Unrealized Fair Value Losses Fair Value Losses Fair Value Losses ------------- ------------- -------------- -------------- ------------- -------------U.S. Treasury $ 59,194 $ 49 $ 500 $ 8 $ 59,694 $ 57 U.S. government agencies 465,684 1,344 440,711 4,710 906,395 6,054 Municipal obligations 2,070 14 36,568 416 38,638 430 Mortgage-backed securities 1,729 1 343,494 9,977 345,223 9,978 CMOs 8 - 114,018 1,991 114,026 1,991 Other debt securities 914 4 32,033 922 32,947 926 Equity securities 3 1 19 19 22 20 ------------- ------------- -------------- -------------- ------------- ------------- $ 529,602 $ 1,413 $ 967,343 $ 18,043 $ 1,496,945 $ 19,456 ============= ============= ============== ============== ============= =============
HANCOCK HOLDING COMPANY AND SUBSIDIARIESNOTES TO CONSOLIDATED FINANCIAL STATEMENTS
The details concerning securities classified as available for sale with unrealized losses as of December 31, 2005 were as follows (in thousands):
Losses < 12 months Losses 12 months or > Total ---------------------------- ------------------------------ ----------------------------- Gross Gross Gross Unrealized Unrealized Unrealized Fair Value Losses Fair Value Losses Fair Value Losses ------------- ------------- -------------- -------------- ------------- -------------U.S. Treasury $ 49,992 $ 30 $ 193 $ 5 $ 50,185 $ 35 U.S. government agencies 269,754 569 537,172 10,126 806,926 10,695 Municipal obligations 889 3 21,625 518 22,514 521 Mortgage-backed securities 8,767 188 379,133 11,469 387,900 11,657 CMOs - - 191,371 2,827 191,371 2,827 Other debt securities 12,972 583 21,121 970 34,093 1,553 Equity securities 67 54 - - 67 54 ------------- ------------- -------------- -------------- ------------- ------------- $ 342,441 $ 1,427 $ 1,150,615 $ 25,915 $ 1,493,056 $ 27,342 ============= ============= ============== ============== ============= =============
As of December 31, 2006, the Company had 1,291 investments. Of the total portfolio, 449 securities were in an unrealized loss position. Management and the Asset/Liability Committee continually monitor the securities portfolio and management is able to effectively measure and monitor the unrealized loss position on these securities. The Company has adequate liquidity and therefore has the ability and additionally the intent to hold these securities to recovery. Accordingly, the unrealized loss of these securities has been determined to be temporary.
The Company’s securities portfolio is an important source of liquidity and earnings for the Company. A stated objective in managing the securities portfolio is to provide consistent liquidity to support balance sheet growth but also to provide a safe and consistent stream of earnings. To that end, management is open to opportunities that present themselves which enables the Company to improve the structure and earnings potential of the securities portfolio. During the fourth quarter of 2006, the current economic environment, the slope of the yield curve and the expectations of future interest rate movements presented the Company with an opportunity to sell $162.9 million in certain U.S. Agency securities. The bonds were sold at a pretax book loss of $5.5 million and had a book yield of 3.81 percent. The proceeds were immediately reinvested in a combination of federal funds and other short-term instruments. The Company has no intention and does not expect to incur any other significant security sales in the immediate future.
Proceeds from sales of available for sale securities were approximately $157.3 million in 2006, $133.8 million in 2005 and $20.0 million in 2004. Gross gains of $309,000 in 2006, $781,000 in 2005 and $165,000 in 2004 and gross losses of $5.5 million in 2006, $834,000 in 2005 and $2,000 in 2004 were realized on such sales.
Securities with an amortized cost of approximately $1,212.5 million at December 31, 2006 and $1,030.9 million at December 31, 2005, were pledged primarily to secure public deposits and securities sold under agreements to repurchase. The Company has approximately $10.0 million and $6.7 million of securities pledged with various state regulatory authorities to secure reinsurance receivables as of December 31, 2006 and 2005, respectively.
HANCOCK HOLDING COMPANY AND SUBSIDIARIESNOTES TO CONSOLIDATED FINANCIAL STATEMENTS
Loans, net of unearned income, consisted of the following (in thousands):
December 31, --------------------------------- 2006 2005 --------------- ---------------Real estate loans $ 2,118,014 $ 1,879,107 Commercial and industrial loans 317,630 364,163 Loans to individuals for household, family and other consumer expenditures 535,354 520,218 Leases and other loans 295,586 225,698 --------------- --------------- $ 3,266,584 $ 2,989,186 =============== ===============
The Company generally makes loans in its market areas of South Mississippi, South Alabama, South and Central Louisiana and Northwest Florida. Loans are made in the normal course of business to its directors, executive officers and their associates on substantially the same terms, including interest rates and collateral, as those prevailing at the time for comparable transactions with other persons. Such loans did not involve more than normal risk of collectibility. Balances of loans to the Company’s directors, executive officers and their affiliates at December 31, 2006 and 2005 were approximately $14.4 million and $15.2 million, respectively, all of which are completely reserved. New loans, repayments and changes of directors and executive officers and their affiliates on these loans for 2006 were $7.0 million, $1.8 million and $6.0 million, respectively. New loans and repayments of directors and executive officers and their affiliates on these loans for 2005 were $4.4 million and $4.0 million, respectively.
Changes in the allowance for loan losses follow (in thousands):
2006 2005 2004 -------------- ------------- -------------Balance at January 1 $ 74,558 $ 40,682 $ 36,750 Recoveries 12,491 7,052 7,823 Loans charged off (19,515) (15,811) (20,428) Provision for (reversal of) loan losses (20,762) 42,635 16,537 -------------- ------------- ------------- Balance at December 31 $ 46,772 $ 74,558 $ 40,682 ============== ============= =============
In 2005, the Company established a $35.2 million specific allowance for estimated credit losses related to the impact of Hurricane Katrina on its loan portfolio. In 2005, the Company reduced the allowance by $2.4 million for storm-related net charge-offs. As a result, the storm-related allowance was $32.9 million as of December 31, 2005. Of this remaining amount, the Company reversed $20.0 million of the allowance to income in 2006. While management determined that the potential for further storm-related charge-offs is present, the levels are projected to be lower than originally anticipated. The Company reviewed the asset quality of significant credits included in the original $35.2 million storm-related allowance and determined that this reversal was appropriate.
In some instances, loans are placed on nonaccrual status. All accrued but uncollected interest related to the loan is deducted from income in the period the loan is assigned a nonaccrual status. For such period as a loan is in nonaccrual status, any cash receipts are applied first to principal, second to expenses incurred to cause payment to be made and lastly to the recovery of any reversed interest income and interest that would be due and owing subsequent to the loan being placed on nonaccrual status.
HANCOCK HOLDING COMPANY AND SUBSIDIARIESNOTES TO CONSOLIDATED FINANCIAL STATEMENTS
Nonaccrual and renegotiated loans amounted to approximately 0.11% and 0.36% of total loans at December 31, 2006 and 2005, respectively. In addition, the Company’s other individually evaluated impaired loans amounted to approximately 0.08% and 0.86% of total loans at December 31, 2006 and 2005, respectively. The average amounts of impaired loans carried on the Company’s books for 2006, 2005 and 2004 were $7.4 million, $9.3 million and $9.8 million, respectively. Interest recognized on nonaccrual loans is immaterial to the Company’s operating results. Related allowance amounts were not significant during the years ended December 31, 2006, 2005 or 2004. The amount of interest that would have been recorded on nonaccrual loans had the loans not been classified as nonaccrual in 2006, 2005 or 2004, was $759,000, $747,000 and $574,000, respectively.
As of December 31, 2006, the Company had $17.2 million in loans carried at fair value. There were no loans carried at fair value as of December 31, 2005.
The Company held $16.9 million and $24.2 million in loans held for sale at December 31, 2006 and 2005 carried at fair value. These loans are originated on a best-efforts basis, whereby a commitment by a third party to purchase the loan has been received concurrent with the Banks’ commitment to the borrower to originate the loan.
Property and equipment stated at cost, less accumulated depreciation and amortization, consisted of the following (in thousands):
2006 2005 ------------------- --------------------Land $ 25,203 $ 20,343 Land improvements 1,535 1,296 Buildings and leasehold improvements 72,410 64,392 Construction in progress 47,038 5,894 Furniture, fixtures and equipment 60,411 45,383 ------------------- -------------------- 206,597 137,308 Accumulated depreciation and amortization (66,043) (57,922) ------------------- -------------------- Property and equipment, net $ 140,554 $ 79,386 =================== ====================
Depreciation and amortization expense was $10.4 million, $8.7 million and $9.2 million for the years ended December 31, 2006, 2005 and 2004, respectively. Capitalized interest was $0.8 million for the year ended December 31, 2006. There was no capitalized interest for the years ended December 31, 2005 and 2004.
Construction in progress is primarily for reconstruction of the corporate headquarters in Gulfport, Mississippi. The remaining construction commitment amount is expected to be approximately $8.3 million. The Company expects completion during the second quarter of 2007.
Goodwill represents costs in excess of the fair value of net assets acquired in connection with purchase business combinations. In accordance with the provisions of SFAS No. 142 Goodwill and Other Intangibles, the Company tests its goodwill for impairment annually. No impairment charges were recognized asduring 2008, 2007, or 2006. The carrying amount of goodwill was $62.3 million at both December 31, 2006 or 2005. The carrying amounts of goodwill were $62.3 million2008 and $61.4 million as of December 31, 2006 and 2005, respectively.2007.
During 2006, the Company recorded reallocations of goodwill to other intangible assets and to record the final purchase price for the acquisition of J. Everett Eaves, Inc.
HANCOCK HOLDING COMPANY AND SUBSIDIARIES
NOTES TO CONSOLIDATED FINANCIAL STATEMENTS
Note 7.5. Goodwill and Other Intangible Assets (continued)
The changes in the carrying amount of goodwill for 2006 and 2005 follow (in thousands):
December 31, ---------------------------- 2006 2005 ------------ ------------Balance at January 1 $ 61,418 $ 55,409 Goodwill on business acquisition - 4,715 Reallocation based on subsequent valuation 859 1,304 Goodwill adjustment related to consolidation of branches - (10) ------------ ------------ Balance at December 31 $ 62,277 $ 61,418 ============ ============
The following tables present information regarding the components of the Company’s other intangible assets, and related amortization for the dates indicated (in thousands):
December 31, 2006 ----------------------------------------------------------------------- Gross Carrying Accumulated Net Carrying Amount Amortization Amount --------------------- --------------------- ----------------------Core deposit intangibles $ 14,137 $ 7,290 $ 6,847 Value of insurance business acquired 3,767 1,459 2,308 Non-compete agreements 368 179 189 Trade name 100 30 70 --------------------- --------------------- ---------------------- $ 18,372 $ 8,958 $ 9,414 ===================== ===================== ======================December 31, 2005 ----------------------------------------------------------------------- Gross Carrying Accumulated Net Carrying Amount Amortization Amount --------------------- --------------------- ----------------------Core deposit intangibles $ 14,137 $ 5,924 $ 8,213 Value of insurance business acquired 1,673 833 840 Non-compete agreements 228 76 152 --------------------- --------------------- ---------------------- $ 16,038 $ 6,833 $ 9,205 ===================== ===================== ======================Years Ended December 31, ----------------------------------------------------------------------- 2006 2005 2004 --------------------- --------------------- ----------------------Aggregate amortization expense for: Core deposit intangibles $ 1,366 $ 1,654 $ 1,766 Value of insurance business acquired 626 471 179 Non-compete agreements 103 69 - Trade name 30 - - --------------------- --------------------- ---------------------- $ 2,125 $ 2,194 $ 1,945 ===================== ===================== ======================
|
|
|
|
|
|
|
|
|
|
|
|
| December 31, 2008 |
| |||||||
|
|
| ||||||||
|
|
| Gross Carrying |
|
| Accumulated |
|
| Net Carrying |
|
|
|
|
|
| ||||||
Core deposit intangibles |
| $ | 14,137 |
| $ | 9,613 |
| $ | 4,524 |
|
Value of insurance business acquired |
|
| 2,752 |
|
| 1,289 |
|
| 1,463 |
|
Non-compete agreements |
|
| 322 |
|
| 280 |
|
| 42 |
|
Trade name |
|
| 100 |
|
| 70 |
|
| 30 |
|
|
|
|
|
| ||||||
|
| $ | 17,311 |
| $ | 11,252 |
| $ | 6,059 |
|
|
|
|
|
| ||||||
|
|
|
|
|
|
|
|
|
|
|
|
| December 31, 2007 |
| |||||||
|
|
| ||||||||
|
|
| Gross Carrying |
|
| Accumulated |
|
| Net Carrying |
|
|
|
|
|
| ||||||
Core deposit intangibles |
| $ | 14,137 |
| $ | 8,500 |
| $ | 5,637 |
|
Value of insurance business acquired |
|
| 3,757 |
|
| 1,807 |
|
| 1,950 |
|
Non-compete agreements |
|
| 368 |
|
| 252 |
|
| 116 |
|
Trade name |
|
| 100 |
|
| 50 |
|
| 50 |
|
|
|
|
|
| ||||||
|
| $ | 18,362 |
| $ | 10,609 |
| $ | 7,753 |
|
|
|
|
|
| ||||||
|
|
|
|
|
|
|
|
|
|
|
|
| Years Ended December 31, |
| |||||||
|
|
| ||||||||
|
| 2008 |
| 2007 |
| 2006 |
| |||
|
|
|
|
| ||||||
Aggregate amortization expense for: |
|
|
|
|
|
|
|
|
|
|
Core deposit intangibles |
| $ | 1,113 |
| $ | 1,210 |
| $ | 1,366 |
|
Value of insurance business acquired |
|
| 271 |
|
| 348 |
|
| 626 |
|
Non-compete agreements |
|
| 28 |
|
| 73 |
|
| 103 |
|
Trade name |
|
| 20 |
|
| 20 |
|
| 30 |
|
|
|
|
|
| ||||||
|
| $ | 1,432 |
| $ | 1,651 |
| $ | 2,125 |
|
|
|
|
|
| ||||||
HANCOCK HOLDING COMPANY AND SUBSIDIARIESNOTES TO CONSOLIDATED FINANCIAL STATEMENTS
The amortization period used for core deposit intangibles and value of insurance business acquired is 10 years. The amortization period used for non-compete agreements and trade name intangibles is 5 years. The following table shows estimated amortization expense of other intangible assets for the five succeeding years and thereafter, calculated based on current amortization schedules (in thousands):
2007 $ 1,701 2008 1,518 2009 1,484 2010 1,425 2011 1,177 Thereafter 2,109 ------------- $ 9,414 =============
|
|
|
|
|
2009 |
| $ | 1,417 |
|
2010 |
|
| 1,382 |
|
2011 |
|
| 1,143 |
|
2012 |
|
| 928 |
|
2013 |
|
| 757 |
|
Thereafter |
|
| 432 |
|
|
|
| ||
|
| $ | 6,059 |
|
|
|
|
The changes in the carrying amounts of mortgage servicing rights for the years ended December 31, 2006, 2005, and 2004 are as follows (in thousands):
Gross Carrying Valuation Net Carrying Amount Allowance Amount ----------------- ----------------- -----------------Balance as of January 1, 2004 $ 5,165 $ (2,409) $ 2,756 Additions 305 - 305 Disposals (635) 292 (343) Amortization - (1,048) (1,048) Impairment reversal - 850 850 ----------------- ----------------- ----------------- Balance as of December 31, 2004 4,835 (2,315) 2,520 Additions 167 - 167 Disposals (710) 417 (293) Amortization - (818) (818) ----------------- ----------------- ----------------- Balance as of December 31, 2005 4,292 (2,716) 1,576 Additions 21 - 21 Disposals (475) 368 (107) Amortization - (549) (549) ----------------- ----------------- ----------------- Balance as of December 31, 2006 $ 3,838 $ (2,897) $ 941 ================= ================= =================
The following table shows estimated amortization expense of mortgage servicing rights for the five succeeding years and thereafter, calculated based on current amortization schedules (in thousands):
2007 $ 359 2008 235 2009 163 2010 106 2011 56 Thereafter 22 ------------- $ 941 =============
HANCOCK HOLDING COMPANY AND SUBSIDIARIES
NOTES TO CONSOLIDATED FINANCIAL STATEMENTS
Note 8. Mortgage Banking (including Mortgage Servicing Rights) - (continued)The assumptions underlying these estimates are subject to modification based on changes in market conditions and portfolio behavior (such as prepayment speeds). Variable prepayment speeds were used in this projection and are based on coupon stratification, age and type of loans in this portfolio under the current interest rate environment. As a result, these estimates are subject to change in a manner and amount that is not presently determinable by management.6. Deposits
Impairment for mortgage servicing rights occurs when the estimated fair value falls below amortized cost. Fair value is determined utilizing specific risk characteristics of the mortgage loan, current interest rates and current prepayments speeds. Although there were some temporary deferrals related to Hurricane Katrina in 2005, the value of the mortgage servicing rights was not subject to impairment as a result of the long term effects of the storm. During 2004, the Company reversed $850,000 of mortgage servicing right temporary impairment taken during 2003 due to changes in the interest rate environment and market conditions for prepayment activity. Mortgage servicing rights valuations during 2004 proved this impairment to be temporary, and management determined it appropriate to reverse the non-cash pre-tax expense.
At December 31, 2006, the fair value of mortgage servicing rights was $2.2 million, with a weighted average coupon of 5.73% as compared to a worse case scenario value (assuming 30% prepayments) of $2.5 million and a fair value (using Bloomberg prepayment speeds) of $3.0 million as of December 31, 2005.
The Company experienced significant deposit growth since Hurricane Katrina impacted our market area. The majority of the deposit inflows consisted of transaction accounts and, to a lesser extent, short duration (12 months or less) time deposits. This rapid inflow of deposit dollars creates the potential for additional future liquidity needs; accordingly, the deposit inflows since the storm were primarily invested in Fed Funds, short-term U. S. Treasury Bills and U. S. Agency Discount notes, and short duration U. S. Agency bonds.
The maturities of time deposits at December 31, 20062008 follow (in thousands):
2007 $1,535,854 2008 188,864 2009 92,561 2010 35,200 2011 28,695 thereafter 8 ---------------- $1,881,182 ================
|
|
|
|
|
2009 |
| $ | 1,321,052 |
|
2010 |
|
| 632,621 |
|
2011 |
|
| 105,184 |
|
2012 |
|
| 126,621 |
|
2013 |
|
| 24,716 |
|
thereafter |
|
| 61,542 |
|
|
|
| ||
|
| $ | 2,271,736 |
|
|
|
|
Time deposits of $100,000 or more totaled approximately $735.6 million$1.1 billion and $633.6$935.3 million at December 31, 20062008 and 2005,2007, respectively.
HANCOCK HOLDING COMPANY AND SUBSIDIARIESNOTES TO CONSOLIDATED FINANCIAL STATEMENTS
Note
Short-Term Borrowings
The following table presents information concerning federal funds purchased and sold and securities sold under agreements to repurchase (in thousands):
December 31, ------------------------------------------------- 2006 2005 --------------------- ---------------------Federal funds sold Amount outstanding at period-end $ 212,242 $ 402,968 Weighted average interest rate at period-end 5.09% 4.00% Federal funds purchased Amount outstanding at period-end $ 3,800 $ 1,475 Weighted average interest rate at period-end 4.95% 3.95% Weighted average interest rate during the year 5.38% 3.27% Average daily balance during the year $ 11,557 $ 10,262 Maximum month end balance during the year $ 49,160 $ 55,120 Securities sold under agreements to repurchase Amount outstanding at period-end $ 218,591 $ 250,807 Weighted average interest rate at period-end 3.72% 4.29% Weighted average interest rate during the year 3.62% 1.94% Average daily balance during the year $ 250,603 $ 224,842 Maximum month end balance during the year $ 425,753 $ 258,508
|
|
|
|
|
|
|
|
|
| December 31, |
| ||||
|
|
| |||||
|
| 2008 |
| 2007 |
| ||
|
|
|
| ||||
Federal funds sold |
|
|
|
|
|
|
|
Amount outstanding at period-end |
| $ | 175,166 |
| $ | 117,721 |
|
Weighted average interest rate at period-end |
|
| 0.11 | % |
| 4.32 | % |
|
|
|
|
|
|
|
|
Federal funds purchased |
|
|
|
|
|
|
|
Amount outstanding at period-end |
| $ | — |
| $ | 4,100 |
|
Weighted average interest rate at period-end |
|
| — |
|
| 4.02 | % |
Weighted average interest rate during the year |
|
| 2.20 | % |
| 4.99 | % |
Average daily balance during the year |
| $ | 16,003 |
| $ | 4,174 |
|
Maximum month end balance during the year |
| $ | 33,775 |
| $ | 4,100 |
|
|
|
|
|
|
|
|
|
Securities sold under agreements to repurchase |
|
|
|
|
|
|
|
Amount outstanding at period-end |
| $ | 505,932 |
| $ | 371,604 |
|
Weighted average interest rate at period-end |
|
| 2.10 | % |
| 3.63 | % |
Weighted average interest rate during the year |
|
| 2.76 | % |
| 3.70 | % |
Average daily balance during the year |
| $ | 524,712 |
| $ | 216,730 |
|
Maximum month end balance during the year |
| $ | 621,424 |
| $ | 371,604 |
|
The contractual maturity of federal funds purchased and securities sold under agreements to repurchase is demand or due overnight.
Specific U. S. Treasury and U. S. Government agencies with carrying values of $218.6$504.8 million at December 31, 20062008 and $250.8$371.6 million at December 31, 20052007 collateralized the retail and wholesale repurchase agreements. The fair value of this collateral approximated $216.6$513.3 million at December 31, 20062008 and $259.2$375.6 million at December 31, 2005.
On April 6, 2006, the Company completed an early retirement of its $50.0 million debt obligation to the Federal Home Loan Bank (FHLB). This obligation2007. In addition, there was recorded as a long-term liabilitycash collateral in the accompanying Consolidated Balance Sheets asamount of $12.1 million for the wholesale repurchase agreements at December 31, 2008 and $750,000 in cash collateral at December 31, 2007.
HANCOCK HOLDING COMPANY AND SUBSIDIARIES
NOTES TO CONSOLIDATED FINANCIAL STATEMENTS
Note 7. Borrowings (continued)
Long-Term Borrowings
As of December 31, 2005. As a result2008, the Company had $250.0 million in long-term borrowings classified as securities sold under agreements to repurchase. Combined with short-term borrowings of this transaction, a $41,000 loss on early extinguishment of debt$255.9 million, the Company’s total position in securities sold under agreements to repurchase was recognized in 2006.$505.9 million. The Company has an approved line of credit with the FHLB of approximately $346.8$308.5 million, which is secured by a blanket pledge of certain residential mortgage loans. This line of credit had no outstanding balances at December 31, 20062008 and 2005.2007, however, four letters of credit totaling $200 million have been issued to use as collateral for public deposits.
HANCOCK HOLDING COMPANY AND SUBSIDIARIESNOTES TO CONSOLIDATED FINANCIAL STATEMENTS
Note
The components of other assets and other liabilities follow (in thousands):
December 31, --------------------------------- 2006 2005 --------------- ---------------Other assets Prepaid assets $ 13,203 $ 11,115 Other receivables 4,845 20,709 Miscellaneous 2,000 1,768 --------------- --------------- Total other assets $ 20,048 $ 33,592 =============== =============== Other liabilities Other interest bearing liabilities $ 4,378 $ 4,881 Accrued expenses 48,391 63,724 Miscellaneous 6,077 6,431 --------------- --------------- Total other liabilities $ 58,846 $ 75,036 =============== ===============
Regulatory Capital
Common stockholders’ equity of the Company includes the undistributed earnings of the bank subsidiaries. Dividends are payable only out of undivided profits or current earnings. Moreover, dividends to the Company’s shareholdersstockholders can generally be paid only from dividends paid to the Company by the Banks. Consequently, dividends are dependent upon earnings, capital needs, regulatory policies and statutory limitations affecting the Banks. Federal and state banking laws and regulations restrict the amount of dividends and loans a bank may make to its parent company. Dividends paid by Hancock Bank are subject to approval by the Commissioner of Banking and Consumer Finance of the State of Mississippi and those paid by Hancock Bank of Louisiana are subject to approval by the Commissioner of Financial Institutions of the State of Louisiana. Dividends paid by Hancock Bank of Florida are subject to approval by the Florida Department of Financial Services.Services and those paid by Hancock Bank of Alabama are subject to approval by Alabama State Banking Department. The amount of capital of the subsidiary banks available for dividends at December 31, 20062008 was approximately $128.8$43.6 million.
Risk-based capital requirements are intended to make regulatory capital more sensitive to risk elements of the Company. Currently, the Company and its bank subsidiaries are required to maintain minimum risk-based capital ratios of 8.0%, with not less than 4.0% in Tier 1 capital. In addition, the Company and its bank subsidiaries must maintain minimum Tier 1 leverage ratios (Tier 1 capital to total average assets) of at least 3.0% based upon the regulators latest composite rating of the institution.
The Federal Deposit Insurance Corporation Improvement Act of 1991 (FDICIA) required each federal banking agency to implement prompt corrective actions for institutions that it regulates. The rules provide that an institution is “well capitalized” if its total risk-based capital ratio is 10.0% or greater, its Tier 1 risked-based capital ratio is 6.0% or greater, its leverage ratio is 5.0% or greater and the institution is not subject to a capital directive. Under this regulation, all of the subsidiary banks were deemed to be “well capitalized” as of December 31, 20062008 and 20052007 based upon the most recent notifications from their regulators. There are no conditions or events since those notifications that management believes would change these classifications.
HANCOCK HOLDING COMPANY AND SUBSIDIARIESNOTES TO CONSOLIDATED FINANCIAL STATEMENTS
The Company and its bank subsidiaries are required to maintain certain minimum capital levels. At December 31, 20062008 and 2005,2007, the Company and the Banks were in compliance with their respective statutory minimum capital requirements.
HANCOCK HOLDING COMPANY AND SUBSIDIARIES
NOTES TO CONSOLIDATED FINANCIAL STATEMENTS
Note 8. Stockholders’ Equity (continued)
Following is a summary of the actual capital levels at December 31, 20062008 and 20052007 (amounts in thousands):
To be Well Required for Capitalized Under Minimum Capital Prompt Corrective Actual Adequacy Action Provisions ------------------------- ------------------------- --------------------------- Amount Ratio % Amount Ratio % Amount Ratio % ------------ ---------- -------------- -------- ----------- ------------At December 31, 2006Total capital (to risk weighted assets) Company $558,410 13.60 $327,792 8.00 $ N/A N/A Hancock Bank 307,655 14.33 171,729 8.00 214,661 10.00 Hancock Bank of Louisiana 200,829 11.23 143,037 8.00 178,797 10.00 Hancock Bank of Florida 27,414 20.08 10,920 8.00 13,651 10.00 Tier 1 capital (to risk weighted assets) Company $510,639 12.46 $163,896 4.00 $ N/A N/A Hancock Bank 280,773 13.08 85,864 4.00 128,796 6.00 Hancock Bank of Louisiana 182,835 10.23 71,519 4.00 107,278 6.00 Hancock Bank of Florida 25,707 18.83 5,460 4.00 8,190 6.00 Tier 1 leverage capital Company $510,639 8.63 $177,575 3.00 $ N/A N/A Hancock Bank 280,773 7.98 105,513 3.00 175,855 5.00 Hancock Bank of Louisiana 182,835 7.69 71,348 3.00 118,913 5.00 Hancock Bank of Florida 25,707 17.77 4,340 3.00 7,233 5.00At December 31, 2005Total capital (to risk weighted assets) Company $466,501 12.73 $293,166 8.00 $ N/A N/A Hancock Bank 241,626 12.21 158,314 8.00 197,892 10.00 Hancock Bank of Louisiana 181,077 11.40 127,072 8.00 158,839 10.00 Hancock Bank of Florida 27,067 26.08 8,303 8.00 10,378 10.00 Tier 1 capital (to risk weighted assets) Company $420,283 11.47 $146,568 4.00 $ N/A N/A Hancock Bank 216,594 10.95 79,121 4.00 118,682 6.00 Hancock Bank of Louisiana 161,147 10.15 63,506 4.00 95,259 6.00 Hancock Bank of Florida 25,768 24.83 4,151 4.00 6,227 6.00 Tier 1 leverage capital Company $420,283 7.85 $160,618 3.00 $ N/A N/A Hancock Bank 216,594 6.84 94,997 3.00 158,329 5.00 Hancock Bank of Louisiana 161,147 7.67 63,030 3.00 105,050 5.00 Hancock Bank of Florida 25,768 24.01 3,220 3.00 5,366 5.00
|
|
|
|
|
|
|
|
|
|
|
|
|
|
|
|
|
|
|
|
|
| Actual |
| Required for |
| To Be Well |
| ||||||||||||
|
|
|
|
| |||||||||||||||
|
| Amount |
| Ratio % |
| Amount |
| Ratio % |
| Amount |
| Ratio % |
| ||||||
|
|
|
|
|
|
|
| ||||||||||||
At December 31, 2008 |
|
|
|
|
|
|
|
|
|
|
|
|
|
|
|
|
|
|
|
Total capital (to risk weighted assets) |
|
|
|
|
|
|
|
|
|
|
|
|
|
|
|
|
|
|
|
Company |
| $ | 612,090 |
|
| 11.22 |
| $ | 436,239 |
|
| 8.00 |
| $ | N/A |
|
| N/A |
|
Hancock Bank |
|
| 293,110 |
|
| 10.91 |
|
| 214,846 |
|
| 8.00 |
|
| 268,558 |
|
| 10.00 |
|
Hancock Bank of Louisiana |
|
| 243,117 |
|
| 10.48 |
|
| 185,635 |
|
| 8.00 |
|
| 232,043 |
|
| 10.00 |
|
Hancock Bank of Florida |
|
| 40,173 |
|
| 12.23 |
|
| 26,278 |
|
| 8.00 |
|
| 32,848 |
|
| 10.00 |
|
Hancock Bank of Alabama |
|
| 15,673 |
|
| 10.45 |
|
| 12,000 |
|
| 8.00 |
|
| 15,000 |
|
| 10.00 |
|
|
|
|
|
|
|
|
|
|
|
|
|
|
|
|
|
|
|
|
|
Tier 1 capital (to risk weighted assets) |
|
|
|
|
|
|
|
|
|
|
|
|
|
|
|
|
|
|
|
Company |
| $ | 550,216 |
|
| 10.09 |
| $ | 218,120 |
|
| 4.00 |
| $ | N/A |
|
| N/A |
|
Hancock Bank |
|
| 261,726 |
|
| 9.75 |
|
| 107,423 |
|
| 4.00 |
|
| 161,135 |
|
| 6.00 |
|
Hancock Bank of Louisiana |
|
| 217,186 |
|
| 9.36 |
|
| 92,817 |
|
| 4.00 |
|
| 139,226 |
|
| 6.00 |
|
Hancock Bank of Florida |
|
| 37,144 |
|
| 11.31 |
|
| 13,139 |
|
| 4.00 |
|
| 19,709 |
|
| 6.00 |
|
Hancock Bank of Alabama |
|
| 14,250 |
|
| 9.50 |
|
| 6,000 |
|
| 4.00 |
|
| 9,000 |
|
| 6.00 |
|
|
|
|
|
|
|
|
|
|
|
|
|
|
|
|
|
|
|
|
|
Tier 1 leverage capital |
|
|
|
|
|
|
|
|
|
|
|
|
|
|
|
|
|
|
|
Company |
| $ | 550,216 |
|
| 8.06 |
| $ | 204,680 |
|
| 3.00 |
| $ | N/A |
|
| N/A |
|
Hancock Bank |
|
| 261,726 |
|
| 7.08 |
|
| 110,878 |
|
| 3.00 |
|
| 184,797 |
|
| 5.00 |
|
Hancock Bank of Louisiana |
|
| 217,186 |
|
| 7.48 |
|
| 87,099 |
|
| 3.00 |
|
| 145,165 |
|
| 5.00 |
|
Hancock Bank of Florida |
|
| 37,144 |
|
| 12.78 |
|
| 8,717 |
|
| 3.00 |
|
| 14,528 |
|
| 5.00 |
|
Hancock Bank of Alabama |
|
| 14,250 |
|
| 10.11 |
|
| 4,230 |
|
| 3.00 |
|
| 7,050 |
|
| 5.00 |
|
|
|
|
|
|
|
|
|
|
|
|
|
|
|
|
|
|
|
|
|
At December 31, 2007 |
|
|
|
|
|
|
|
|
|
|
|
|
|
|
|
|
|
|
|
Total capital (to risk weighted assets) |
|
|
|
|
|
|
|
|
|
|
|
|
|
|
|
|
|
|
|
Company |
| $ | 546,178 |
|
| 12.07 |
| $ | 361,878 |
|
| 8.00 |
| $ | N/A |
|
| N/A |
|
Hancock Bank |
|
| 286,646 |
|
| 12.26 |
|
| 187,098 |
|
| 8.00 |
|
| 233,873 |
|
| 10.00 |
|
Hancock Bank of Louisiana |
|
| 208,285 |
|
| 10.46 |
|
| 159,317 |
|
| 8.00 |
|
| 199,147 |
|
| 10.00 |
|
Hancock Bank of Florida |
|
| 26,928 |
|
| 18.08 |
|
| 11,912 |
|
| 8.00 |
|
| 14,890 |
|
| 10.00 |
|
Hancock Bank of Alabama |
|
| 9,571 |
|
| 19.90 |
|
| 3,848 |
|
| 8.00 |
|
| 4,810 |
|
| 10.00 |
|
|
|
|
|
|
|
|
|
|
|
|
|
|
|
|
|
|
|
|
|
Tier 1 capital (to risk weighted assets) |
|
|
|
|
|
|
|
|
|
|
|
|
|
|
|
|
|
|
|
Company |
| $ | 498,731 |
|
| 11.03 |
| $ | 180,939 |
|
| 4.00 |
| $ | N/A |
|
| N/A |
|
Hancock Bank |
|
| 260,240 |
|
| 11.13 |
|
| 93,549 |
|
| 4.00 |
|
| 140,324 |
|
| 6.00 |
|
Hancock Bank of Louisiana |
|
| 189,324 |
|
| 9.51 |
|
| 79,659 |
|
| 4.00 |
|
| 119,488 |
|
| 6.00 |
|
Hancock Bank of Florida |
|
| 25,384 |
|
| 17.05 |
|
| 5,956 |
|
| 4.00 |
|
| 8,934 |
|
| 6.00 |
|
Hancock Bank of Alabama |
|
| 9,209 |
|
| 19.15 |
|
| 1,924 |
|
| 4.00 |
|
| 2,886 |
|
| 6.00 |
|
|
|
|
|
|
|
|
|
|
|
|
|
|
|
|
|
|
|
|
|
Tier 1 leverage capital |
|
|
|
|
|
|
|
|
|
|
|
|
|
|
|
|
|
|
|
Company |
| $ | 498,731 |
|
| 8.51 |
| $ | 175,801 |
|
| 3.00 |
| $ | N/A |
|
| N/A |
|
Hancock Bank |
|
| 260,240 |
|
| 7.97 |
|
| 97,968 |
|
| 3.00 |
|
| 163,281 |
|
| 5.00 |
|
Hancock Bank of Louisiana |
|
| 189,324 |
|
| 7.55 |
|
| 75,225 |
|
| 3.00 |
|
| 125,374 |
|
| 5.00 |
|
Hancock Bank of Florida |
|
| 25,384 |
|
| 16.79 |
|
| 4,536 |
|
| 3.00 |
|
| 7,560 |
|
| 5.00 |
|
Hancock Bank of Alabama |
|
| 9,209 |
|
| 25.33 |
|
| 1,091 |
|
| 3.00 |
|
| 1,818 |
|
| 5.00 |
|
HANCOCK HOLDING COMPANY AND SUBSIDIARIES
NOTES TO CONSOLIDATED FINANCIAL STATEMENTS
Comprehensive income is the change in equity during a period from transactions and other events and circumstances from nonowner sources. It includes all changes in equity during a period except those resulting from investments by owners and distributions to owners.
In addition to net income, the Company has identified changes related to other nonowner transactions in the Consolidated Statements of Stockholders’ Equity. Changes in other nonowner transactions consist of changes in the fair value of securities available for sale and liability adjustments for pension and post-retirement benefit plans.
In the calculation of comprehensive income, certain reclassification adjustments are made to avoid duplicating items that are displayed as part of net income and other comprehensive income in that period or earlier periods. The following table reflects the reclassification amounts and the related tax effects of changes in fair value of securities available for sale and the liability adjustment for pension and post-retirement benefit plans for the years ended December 31, 2006, 2005 and 2004 (in thousands):
Accumulated Other Before-Tax Tax Comprehensive Amount Effect Loss ------------------ ------------------ --------------------Accumulated other comprehensive (loss) income: Balance, January 1, 2004 $ (8,510) $ 2,206 $ (6,304) Minimum pension liability (584) 142 (442) Net change in fair value of securities available for sale (6,795) 2,526 (4,269) Less adjustment for net gains included in income (163) 57 (106) ------------------ ------------------ -------------------- Balance, December 31, 2004 (16,052) 4,931 (11,121) Minimum pension liability 62 (24) 38 Net change in fair value of securities available for sale (17,334) 6,347 (10,987) Less adjustment for net losses included in income 53 (49) 4 ------------------ ------------------ -------------------- Balance, December 31, 2005 (33,271) 11,205 (22,066) Minimum pension liability 1,685 (628) 1,057 Adoption of SFAS No. 158 (12,663) 4,719 (7,944) Net change in fair value of securities available for sale 3,100 (1,352) 1,748 Less adjustment for net losses included in income 5,169 (1,977) 3,192 ------------------ ------------------ -------------------- Balance, December 31, 2006 $ (35,980) $ 11,967 $ (24,013) ================== ================== ====================
HANCOCK HOLDING COMPANY AND SUBSIDIARIESNOTES TO CONSOLIDATED FINANCIAL STATEMENTS
Note 9. Retirement and Employee Benefit Plans | |
In September 2006, the SEC issued Staff Accounting Bulletin (SAB) No. 108,Considering the Effects of Prior Year Misstatements when quantifying Misstatements in Current Year Financial Statements. SAB No. 108 requires companies to evaluate the materiality of identified unadjusted errors on each financial statement and related financial statement disclosure using both the rollover approach and the iron curtain approach, as those terms are defined in SAB No. 108. The rollover approach quantifies misstatements based on the amount of the error in the current year consolidated statement of income, whereas the iron curtain approach quantifies misstatements based on the effects of correcting the misstatement existing in the balance sheet at the end of the current year, irrespective of the misstatement’s year(s) of origin. Financial statements would require adjustment when either approach results in quantifying a misstatement that is material. Correcting prior year financial statements for immaterial errors would not require previously filed reports to be amended. If a company determines that an adjustment to prior year financial statements is required upon adoption of SAB No. 108 and does not elect to restate its previous financial statements, then it must recognize the cumulative effect of applying SAB No. 108 in fiscal 2006 beginning balances of the affected assets and liabilities with a corresponding adjustment to the fiscal 2006 opening balance in retained earnings. The Company elected to record the effects of applying SAB No. 108 using the cumulative effect transition method as an adjustment to fiscal 2006 beginning retained earnings. The following table summarizes the effects at January 1, 2006 of applying the guidance in SAB No. 108:
Period in which the Misstatement Originated (1) ---------------------------------------------------- Cumulative Adjustment Prior to Years Ended December 31, Recorded as of Janaury 1, ---------------------------------- January 1, 2004 2004 2005 2006 ---------------- ---------------- ---------------- ---------------------Net deferred loan fees (costs) (2) $ 2,546,831 $ (20,043) $(1,668,327) $ 858,461 Accrued interest receivable (3) 589,770 227,876 530,664 1,348,310 Equity investment in subsidiary (4) - - 644,204 644,204 Franchise tax payable (5) 950,000 (47,636) (142,364) 760,000 Income tax expense (benefit) (6) (1,304,468) 20,423 657,367 (626,678) ---------------- ---------------- ---------------- --------------------- Impact on net income (7) $ 2,782,133 $ 180,620 $ 21,544 ================ ================ ================ Retained earnings (8) $ 2,984,297 ===================== (1) The Company has concluded that these errors were immaterial, individually and in the aggregate, to all periods prior to January 1, 2006. (2) The Company was not properly accounting for net deferred loan fees (costs) in accordance with SFAS No. 91,Accounting for Nonrefundable Fees and Costs Associated with Originating or Acquiring Loans and Initial Direct Costs of Leases. The Company had previously calculated the impact of SFAS No. 91 each year, but determined the adjustment to be immaterial. The Company recorded a $0.9 million reduction in our loans as of January 1, 2006 for net deferred loan fees previously recognized as income with a corresponding reduction in retained earnings to correct these misstatements.
HANCOCK HOLDING COMPANY AND SUBSIDIARIESNOTES TO CONSOLIDATED FINANCIAL STATEMENTS
(3) The Company was not properly accounting for income tax credits on loans and securities. The Company recorded a $1.3 million reduction in accrued interest receivable as of January 1, 2006 with a corresponding reduction in retained earnings to correct this misstatement. (4) The Company was not properly accounting for its equity investment in Magna Insurance Company, related to certain post-closing adjustments due to the one-month lag in recording its investment. The Company recorded a $0.6 million reduction in equity investment in subsidiary as included in other assets as of January 1, 2006 with a corresponding reduction in retained earnings to correct this misstatement. (5) The Company was accounting for franchise taxes in prior years on a cash basis by expensing franchise taxes in arrears. Accordingly, the $760,000 adjustment is a true-up at January 1, 2006 to establish an accrual. The Company recorded a $0.8 million increase in its franchise tax liability as of January 1, 2006 with a corresponding reduction in retained earnings to correct this misstatement. (6) As a result of the misstatements previously described, the Company's provision for income taxes was misstated. The Company recorded an increase in its deferred income tax assets in the amount of $0.6 million as of January 1, 2006 with a corresponding increase in retained earnings to correct these misstatements. (7) Represents the net overstatement of net income for the indicated periods resulting from these misstatements. (8) Represents the net reduction to retained earnings as of January 1, 2006 to reflect the initial adoption of SAB No. 108.
At December 31, 2006,2008, the Company had a pension plan and two postretirement plans for employees, which are described more fully below. The Company has accounted for its defined benefit pension plan using the actuarial model required by SFAS No. 87,Employers'Employers’ Accounting for Pensions. The compensation cost of an employee'semployee’s pension benefit has been recognized on the projected unit credit method over the employee'semployee’s approximate service period. The aggregate cost method has been utilized for funding purposes. The Company also sponsors two defined benefit postretirement plans, which provide medical benefits and life insurance benefits. The Company has accounted for these plans using the actuarial computations required by SFAS No. 106,Employers Accounting for Postretirement Benefits Other Than Pensions as amended by SFAS No. 132. The cost of the defined benefit postretirement plan has been recognized on the projected unit credit method over the employee'semployee’s approximate service period.
Effective December 31, 2006, the Company adopted certain requirements of SFAS No. 158,Employers'Employers’ Accounting for Defined Benefit Pension and Other Postretirement Plans -– An Amendment of FASB Statements No. 87, 88, 106, and 132(R). Under SFAS No. 158, the Company is required to recognize the over funded or under funded status of a defined benefit postretirement plan as an asset or liability on its balance sheet. This pronouncement also requires the Company to recognize changes in that funded status in the year in which the changes occur through comprehensive income effective for years ending after December 15, 2006. The Company is evaluating the requirementIn addition, this statement requires an employer to measure the funded status of a plan as of the date of its year-end balance sheet datestatement of financial position effective for fiscal years ending after December 15, 2008. With the adoption of the change in measurement date of SFAS No. 158, the Company recorded an $815,107 adjustment to beginning 2008 retained earnings. Results for prior periods have not been restated.
HANCOCK HOLDING COMPANY AND SUBSIDIARIESNOTES TO CONSOLIDATED FINANCIAL STATEMENTS
Defined Benefit Plan - PensionThe incremental effect of applying SFAS No. 158 on individual line items in the accompanying Consolidated Balance Sheets as of December 31, 2006 is as follows (in thousands):Before After Application of Application of SFAS No. 158 Adjustments SFAS No. 158 -------------------- ------------------- --------------------Liability for pension and postretirement benefits $ 11,133 $ 12,663 $ 23,796 Deferred taxes assets 21,263 (4,719) 16,544 Total liabilities 5,398,211 7,944 5,406,155 Accumulated other comprehensive loss (16,069) (7,944) (24,013) Total stockholders' equity 566,354 (7,944) 558,410
The Company has a noncontributory defined benefit pension plan covering substantially all salaried full time employees who have been employed by the Company one year and who have worked a minimum of 1,000 hours during the required length of time.calendar year. The Company’s current policy is to contribute annually the minimum amount that can be deducted for federal income tax purposes. The benefits are based upon years of service and the employee’s compensation during the last five years of employment.
HANCOCK HOLDING COMPANY AND SUBSIDIARIES
NOTES TO CONSOLIDATED FINANCIAL STATEMENTS
Note 9. Retirement and Employee Benefit Plans (continued) | |
The measurement date for the pension plan is September 30, 2006.December 31, 2008. Data relative to the pension plan is as follows (in thousands):
Years Ended September 30, ----------------------------------- 2006 2005 ---------------- ---------------Reconciliation of Benefit Obligation:- ---------------------------------------------------------- Benefit obligation at beginning of year $ 65,191 $ 57,925 Service cost 2,304 2,153 Interest cost 3,499 3,395 Actuarial loss 53 4,400 Benefits paid (2,754) (2,682) ---------------- --------------- Benefit obligation at end of year $ 68,293 $ 65,191 ================ ===============Reconciliation of Plan Assets:- ---------------------------------------------------------- Fair value of plan assets at beginning of year $ 48,509 $ 42,565 Actual return on plan assets 2,584 5,600 Employer contributions 3,854 3,119 Benefits paid (2,754) (2,683) Expenses (258) (92) ---------------- --------------- Fair value of plan assets at end of year $ 51,935 $ 48,509 ================ ===============Rate assumptions used for benefit obligations at September 30:Discount rate 5.75% 5.50% Expected return on plan assets 8.00% 8.00% Rate of compensation increase 4.00% 3.00%
|
|
|
|
|
|
|
|
|
| December 31, |
| ||||
|
|
| |||||
|
| 2008* |
| 2007 |
| ||
|
|
|
| ||||
Change in benefit obligation |
|
|
|
|
|
|
|
Benefit obligation, beginning of year |
| $ | 73,203 |
| $ | 68,293 |
|
Service cost |
|
| 3,283 |
|
| 2,656 |
|
Interest cost |
|
| 5,646 |
|
| 3,834 |
|
Actuarial loss |
|
| 4,999 |
|
| 1,331 |
|
Benefits paid |
|
| (4,269 | ) |
| (2,911 | ) |
|
|
|
| ||||
Benefit obligation, end of year |
|
| 82,862 |
|
| 73,203 |
|
|
|
|
| ||||
Change in plan assets |
|
|
|
|
|
|
|
Fair value of plan assets, beginning of year |
|
| 59,741 |
|
| 51,935 |
|
Actual return on plan assets |
|
| (11,757 | ) |
| 6,275 |
|
Employer contributions |
|
| 7,467 |
|
| 4,695 |
|
Benefit payments |
|
| (4,269 | ) |
| (2,911 | ) |
Expenses |
|
| (181 | ) |
| (253 | ) |
|
|
|
| ||||
Fair value of plan assets, end of year |
|
| 51,001 |
|
| 59,741 |
|
|
|
|
| ||||
|
|
|
|
|
|
|
|
Funded status at end of year - net liability |
| $ | (31,861 | ) | $ | (13,462 | ) |
|
|
|
| ||||
|
|
|
|
|
|
|
|
Amounts recognized in accumulated other comprehensive loss |
|
|
|
|
|
|
|
Unrecognized loss at beginning of year |
| $ | 18,699 |
| $ | 20,307 |
|
Amount of (loss)/gain recognized during the year |
|
| (1,184 | ) |
| (1,122 | ) |
Net actuarial loss/(gain) |
|
| 22,975 |
|
| (486 | ) |
|
|
|
| ||||
Unrecognized loss at end of year |
| $ | 40,490 |
| $ | 18,699 |
|
|
|
|
| ||||
|
|
|
|
|
|
|
|
* 2008 amounts are for the 15 month period October 1, 2007 - December 31, 2008. |
| ||||||
HANCOCK HOLDING COMPANY AND SUBSIDIARIESNOTES TO CONSOLIDATED FINANCIAL STATEMENTS
The following table reconciles the amounts the Company recorded related to the pension plan (in thousands):
Year Ended December 31, 2006 --------------------Reconciliation of Balance Sheet Due to Adoption of SFAS No. 158:- -------------------------------------------------------------------------- Accrued pension cost at January 1, 2006 $ (8,490) Net periodic cost for the year (2,998) Contributions credited for the year 4,683 Adjustment to eliminate minimum pension liability prior to SFAS No. 158 1,686 Adjustment to apply SFAS No. 158, pretax (11,239) -------------------- Funded status for balance sheet (liability) $ (16,358) ====================Amounts Recognized in Accumulated Other Comprehensive Loss:- -------------------------------------------------------------------------- Unrecognized loss at beginning of year $ 19,868 Amount of loss recognized during the year 1,062 Gain due to changes in actuarial assumptions (623) -------------------- Unrecognized loss at end of year $ 20,307 ====================
There is $1.1 million of net losses in accumulated other comprehensive loss as of December 31, 2006 that the Company expects to recognize as net periodic expense during the year ending December 31, 2007. Net periodic expense is as follows (in thousands):
Years Ended December 31, ---------------------------------------- 2006 2005 2004 ------------- ------------ -----------Net pension expense included the following (income) expense components: Service cost benefits earned during the period $ 2,304 $ 2,153 $ 2,057 Interest cost on projected benefit obligation 3,499 3,395 3,151 Return on plan assets (3,867) (3,410) (3,043) Amortization of prior service cost - 26 83 Net amortization and deferral 1,062 999 938 ------------- ------------ ----------- Net pension expense $ 2,998 $ 3,163 $ 3,186 ============= ============ ===========Rate assumptions used for net periodic pension expense for the years ended December 31:Discount rate 5.75% 5.50% 6.00% Expected return on plan assets 8.00% 8.00% 8.00% Rate of compensation increase 4.00% 3.00% 3.00%
|
|
|
|
|
|
|
|
|
|
|
|
| Years Ended December 31, |
| |||||||
|
|
| ||||||||
|
| 2008 |
| 2007 |
| 2006 |
| |||
|
|
|
|
| ||||||
Net periodic benefit cost |
|
|
|
|
|
|
|
|
|
|
Service cost |
| $ | 2,626 |
| $ | 2,656 |
| $ | 2,304 |
|
Interest cost |
|
| 4,517 |
|
| 3,834 |
|
| 3,499 |
|
Expected return on plan assets |
|
| (4,830 | ) |
| (4,206 | ) |
| (3,867 | ) |
Recognized net amortization and deferral |
|
| 947 |
|
| 1,122 |
|
| 1,062 |
|
|
|
|
|
| ||||||
Net pension benefit cost |
|
| 3,260 |
|
| 3,406 |
|
| 2,998 |
|
|
|
|
|
| ||||||
|
|
|
|
|
|
|
|
|
|
|
Other changes in plan assets and benefit obligations recognized in other comprehensive income, before taxes |
|
|
|
|
|
|
|
|
|
|
Net (loss)/gain recognized during the year |
|
| (1,184 | ) |
| (1,122 | ) |
| 1,062 |
|
Net actuarial loss/(gain) |
|
| 22,975 |
|
| (486 | ) |
| (623 | ) |
|
|
|
|
| ||||||
Total recognized in other comprehensive income |
|
| 21,791 |
|
| (1,608 | ) |
| 439 |
|
|
|
|
|
| ||||||
|
|
|
|
|
|
|
|
|
|
|
Total recognized in net periodic benefit cost and other comprehensive income |
| $ | 25,051 |
| $ | 1,798 |
| $ | 3,437 |
|
|
|
|
|
| ||||||
Weighted average assumptions as of measurement date |
|
|
|
|
|
|
|
|
|
|
Discount rate for benefit obligations |
|
| 5.96 | % |
| 6.31 | % |
| 5.75 | % |
Discount rate for net periodic benefit cost |
|
| 6.31 | % |
| 5.75 | % |
| 5.50 | % |
Expected long-term return on plan assets |
|
| 7.50 | % |
| 8.00 | % |
| 8.00 | % |
Rate of compensation increase |
|
| 4.00 | % |
| 4.00 | % |
| 4.00 | % |
HANCOCK HOLDING COMPANY AND SUBSIDIARIES
NOTES TO CONSOLIDATED FINANCIAL STATEMENTS
Note 9. Retirement and Employee Benefit Plans (continued) | |
The long term rate of return is determined by using the weighted-average of historical real returns for major asset classes based on target asset allocations. The result is then adjusted for inflation. The discount rate is based on publishedCompany changed to the Citigroup Discount Pension Curve in 2007 from the Aa Seasoned Moody Twenty Year Bond Rate as ofwhich was used in 2006. The Company used the measurement date, adjusted within a band of 25 basis points. The adjustment reflects the general longer duration of liabilities under the Hancock BankCitigroup Discount Pension Plan since the Plan does not pay lump sums in excess of $6,000.
In accordance with SFAS No. 158, the Company has recorded a funded pension obligation of $16.4 millionCurve discount rate at December 31, 2006.2008. This amount represents the excesscurve had a duration of projected benefit obligation over the Plan’s assets. At December 31, 2005, in accordance with SFAS No. 87, the Company had recorded an additional minimum pension liability for under funded plans of $13.5 million. This amount represents the excess of accumulated benefit obligations over the Plan’s assets as adjusted for prepaid pension costs.15.53 years.
The Company has been making the contributions required by the Internal Revenue Service. The Company’s contributions to this plan were $4.8 million in 2008, $4.6 million in 2007 and $4.7 million in 2006, $2.7 million in 2005 and $3.1 million in 2004.2006. The Company expects to contribute $3.0approximately $6.6 million to the pension plan in 2007.2009. The following pension plan benefit payments, which reflect expected future service, are expected to be made (in thousands):
2007 $ 2,988 2008 3,061 2009 3,127 2010 3,288 2011 3,478 2012 - 2016 21,844 ------------ $ 37,786 ============
|
|
|
|
|
2009 |
| $ | 3,265 |
|
2010 |
|
| 3,386 |
|
2011 |
|
| 3,534 |
|
2012 |
|
| 4,039 |
|
2013 |
|
| 4,175 |
|
2014 - 2018 |
|
| 23,720 |
|
|
|
| ||
|
| $ | 42,119 |
|
|
|
| ||
|
|
|
|
|
The expected benefits to be paid are based on the same assumptions used to measure the Company’s benefit obligation at December 31, 2006.2008.
The Company’s pension plan weighted-average asset allocations and target allocations at December 31, 20062008 and 2005,2007, by asset category, are as follows:
Plan Assets Target Allocation at December 31, at December 31, -------------------------------- -------------------------------Asset category2006 2005 2006 2005 -------------- -------------- -------------- --------------Equity securities 54% 54% 30-60% 30-60% Fixed income securities 45% 45% 40-70% 40-70% Cash equivalents 1% 1% 0-10% 0-10% -------------- -------------- 100% 100% ============== ==============
|
|
|
|
|
|
|
|
|
|
|
|
|
|
|
| Plan Assets |
| Target Allocation |
| ||||||||
|
|
|
| ||||||||||
|
| 2008 |
| 2007 |
| 2008 |
| 2007 |
| ||||
|
|
|
|
|
| ||||||||
Asset category |
|
|
|
|
|
|
|
|
|
|
|
|
|
Equity securities |
|
| 49% |
|
| 51% |
|
| 40-70% |
|
| 30-60% |
|
Fixed income securities |
|
| 47% |
|
| 44% |
|
| 30-60% |
|
| 40-70% |
|
Cash equivalents |
|
| 4% |
|
| 5% |
|
| 0-10% |
|
| 0-10% |
|
|
|
|
|
|
|
|
|
|
| ||||
|
|
| 100% |
|
| 100% |
|
|
|
|
|
|
|
|
|
|
|
|
|
|
|
|
| ||||
The investment strategy of the pension plan is to emphasize a balanced return of current income and growth of principal while accepting a moderate level of risk. The investment goal of the plan is to meet or exceed the return of balanced market index comprised of 50% of the S&P 500 Index and 50% Lehman BrothersBarclays Intermediate Aggregate Index. The pension plan investment committee meets periodically to review the policy, strategy and performance of the plan.
The pension plan’s assets do not include any of the Company’s common stock at December 31, 2006 and 2005, respectively.2008 or 2007.
HANCOCK HOLDING COMPANY AND SUBSIDIARIESNOTES TO CONSOLIDATED FINANCIAL STATEMENTS
Defined Benefit Plan - Postretirement
The Company sponsors two defined benefit postretirement plans, other than the pension plan, that cover full-time employees who have reached 55 years of age with fifteen years of service, age 62 with twelve years of service or age 65 with ten years of service. One plan provides medical benefits and the other provides life insurance benefits. The postretirement health care plan is contributory, with retiree contributions adjusted annually and subject to certain employer contribution maximums; the life insurance plan is noncontributory.
HANCOCK HOLDING COMPANY AND SUBSIDIARIES
NOTES TO CONSOLIDATED FINANCIAL STATEMENTS
Note 9. Retirement and Employee Benefit Plans (continued) | |
The measurement date for the plans is December 31, 2006.2008. The Company used a 5.75%6.00% and 5.5%6.40% discount rate for the determination of the projected postretirement benefit obligation as of December 31, 20062008 and 2005,2007, respectively. The discount rate is based on the published Aa Seasoned Moody Twenty Year Bond Rate as of the measurement date, adjusted within a band of 25 basis points. The adjustment reflects the general longer duration of liabilities under the Hancock BankCitigroup Discount Pension Plan since the Plan does not pay lump sums in excess of $6,000.Curve.
Data relative to these postretirement benefits is as follows (in thousands):
Years Ended December 31, ------------------------------------- 2006 2005 ----------------- -----------------Reconciliation of Postretirement Benefit Obligation:- ------------------------------------------------------------------------ Projected postretirement benefit obligation at beginning of year $ 7,517 $ 6,818 Service cost 315 269 Interest cost 393 380 Plan participants' contributions 156 144 Actuarial (gain)/loss (425) 384 Benefits paid (518) (479) ----------------- ----------------- Projected postretirement benefit obligation at end of year $ 7,438 $ 7,517 ================= =================Years Ended December 31, ------------------------------------- 2006 2005 ----------------- -----------------Reconciliation of Plan Assets:- ------------------------------------------------------------------------ Plan assets at beginning of year $ - $ - Employer contributions 362 335 Plan participants' contributions 156 144 Benefits paid (518) (479) ----------------- ----------------- Plan assets at end of year $ - $ - ================= =================
|
|
|
|
|
|
|
|
|
| Years Ended December 31, |
| ||||
|
|
| |||||
|
| 2008 |
| 2007 |
| ||
|
|
|
| ||||
Change in postretirement benefit obligation |
|
|
|
|
|
|
|
Projected postretirement benefit obligation, beginning of year |
| $ | 8,481 |
| $ | 7,438 |
|
Service cost |
|
| 174 |
|
| 168 |
|
Interest cost |
|
| 505 |
|
| 485 |
|
Plan participants’ contributions |
|
| 304 |
|
| 286 |
|
Actuarial loss |
|
| 269 |
|
| 1,012 |
|
Benefit payments |
|
| (1,006 | ) |
| (908 | ) |
|
|
|
| ||||
Projected postretirement benefit obligation, end of year |
|
| 8,727 |
|
| 8,481 |
|
|
|
|
| ||||
|
|
|
|
|
|
|
|
Change in plan assets |
|
|
|
|
|
|
|
Plan assets, beginning of year |
|
| — |
|
| — |
|
Employer contributions |
|
| 702 |
|
| 622 |
|
Plan participants’ contributions |
|
| 304 |
|
| 286 |
|
Benefit payments |
|
| (1,006 | ) |
| (908 | ) |
|
|
|
| ||||
Plan assets, end of year |
|
| — |
|
| — |
|
|
|
|
| ||||
|
|
|
|
|
|
|
|
Funded status at end of year - net liability |
| $ | (8,727 | ) | $ | (8,481 | ) |
|
|
|
| ||||
|
|
|
|
|
|
|
|
Amounts recognized in accumulated other comprehensive loss |
|
|
|
|
|
|
|
Net loss |
| $ | 2,568 |
| $ | 2,476 |
|
Prior service cost |
|
| (208 | ) |
| (261 | ) |
Net obligation |
|
| 15 |
|
| 21 |
|
|
|
|
| ||||
|
| $ | 2,375 |
| $ | 2,236 |
|
|
|
|
| ||||
HANCOCK HOLDING COMPANY AND SUBSIDIARIES
NOTES TO CONSOLIDATED FINANCIAL STATEMENTS
Note 9. Retirement and Employee Benefit Plans (continued) | |
The following table reconciles the amounts the Company recorded related to the postretirement benefit plans (in thousands):
Year Ended December 31, 2006 --------------------Reconciliation of Balance Sheet Due to Adoption of SFAS No. 158:- ------------------------------------------------------------------------ Accrued benefit cost at January 1, 2006 $ (5,600) Net periodic cost for the year (776) Contributions credited for the year 362 Adjustment to apply SFAS No. 158, pretax (1,424) -------------------- Funded status for balance sheet (liability) $ (7,438) ====================Items Not Recognized in Income:- ------------------------------------------------------------------------ Prior service cost $ (314) Net transition obligation 26 Net loss 1,712 -------------------- Total $ 1,424 ====================Amounts Recognized in Accumulated Other Comprehensive Loss:- ------------------------------------------------------------------------ Unrecognized loss at beginning of year $ 2,253 Amount of gain recognized during the year (115) Gain due to changes in actuarial assumptions (426) -------------------- Unrecognized loss at end of year $ 1,712 ====================
The following table shows the amounts in accumulated other comprehensive loss that the Company expects to be recognized as net periodic benefit cost during the year ending December 31, 2007 (in thousands):
Prior service cost $ (53) Net transition obligation 5 Net loss 78 -------------------- Total $ 30 ====================
HANCOCK HOLDING COMPANY AND SUBSIDIARIESNOTES TO CONSOLIDATED FINANCIAL STATEMENTS
The net periodic postretirement benefit cost for the year is determined as the sum of service cost for the year, interest on both the postretirement benefit obligation and market related plan asset value, and amortization of the transition obligation less previously accrued expenses over the average remaining service period of employees expected to receive plan benefits. The following table shows the composition of net period postretirement benefit cost (in thousands):
Years Ended December 31, ------------------------------------------------ 2006 2005 2004 --------------- --------------- --------------Net periodic postretirement benefit cost: Service cost for the year $ 315 $ 269 $ 278 Interest costs on postretirement benefit obligation 393 380 371 Amortization of net loss 116 86 82 Amortization of transition obligation 5 5 5 Amortization of prior service cost (53) (53) (53) --------------- --------------- -------------- Net periodic postretirement benefit cost $ 776 $ 688 $ 683 =============== =============== ==============
|
|
|
|
|
|
|
|
|
|
|
|
| Years Ended December 31, |
| |||||||
|
|
| ||||||||
|
| 2008 |
| 2007 |
| 2006 |
| |||
|
|
|
|
| ||||||
Net periodic postretirement benefit cost |
|
|
|
|
|
|
|
|
|
|
Service cost |
| $ | 174 |
| $ | 168 |
| $ | 315 |
|
Interest costs |
|
| 505 |
|
| 485 |
|
| 393 |
|
Amortization of net loss |
|
| 177 |
|
| 249 |
|
| 116 |
|
Amortization of transition obligation |
|
| (5 | ) |
| (5 | ) |
| (5 | ) |
Amortization of prior service cost |
|
| 53 |
|
| 53 |
|
| 53 |
|
|
|
|
|
| ||||||
Net periodic postretirement benefit cost |
|
| 904 |
|
| 950 |
|
| 872 |
|
|
|
|
|
| ||||||
|
|
|
|
|
|
|
|
|
|
|
Other changes in plan assets and benefit obligations recognized in other comprehensive income, before taxes |
|
|
|
|
|
|
|
|
|
|
Amount of loss recognized during the year |
|
| (177 | ) |
| (249 | ) |
| (115 | ) |
Net actuarial (gain)/loss |
|
| 269 |
|
| 1,012 |
|
| (426 | ) |
Amortization of transition obligation |
|
| 5 |
|
| 5 |
|
| 5 |
|
Amortization of prior service cost |
|
| (53 | ) |
| (53 | ) |
| (53 | ) |
|
|
|
|
| ||||||
Total recognized in other comprehensive loss |
|
| 44 |
|
| 715 |
|
| (589 | ) |
|
|
|
|
| ||||||
|
|
|
|
|
|
|
|
|
|
|
|
|
|
|
| ||||||
Total recognized in net periodic benefit cost and other comprehensive income |
| $ | 948 |
| $ | 1,665 |
| $ | 283 |
|
|
|
|
|
| ||||||
For measurement purposes in 2006,2008, a 9.0%7.0% annual rate of increase in the over age 65 per capita costs of covered health care benefits was assumed for 2007.2009. The rate was assumed to decrease gradually to 5.00%5.0% over 42 years and remain at that level thereafter. In 2005,2007, an 8.5%8.0% annual rate of increase in the over age 65 per capita costs of covered health care benefits was assumed. The rate was assumed to decrease gradually to 5.00%5.0% over 43 years and remain at that level thereafter. The health care cost trend rate assumption has an effect on the amounts reported. The following table illustrates the effect on the postretirement benefit obligation of a 1% increase or 1% decrease in the assumed health care cost trend rates:
1% Decrease Assumed 1% Increase in Rates Rates in Rates ------------------- ------------------- ------------------Aggregated service and interest cost $ 530 $ 709 $ 779 Postretirement benefit obligation 6,506 7,439 8,611
|
|
|
|
|
|
|
|
|
|
|
|
| 1% Decrease |
| Assumed |
| 1% Increase |
| |||
|
|
|
|
| ||||||
Aggregated service and interest cost |
| $ | 609 |
| $ | 679 |
| $ | 764 |
|
Postretirement benefit obligation |
|
| 7,935 |
|
| 8,727 |
|
| 9,684 |
|
The Company expects to contribute $316,000$0.7 million to the plans in 2007.2009. Expected benefits to be paid over the next ten years and are reflected in the following table (in thousands):
(in thousands):2007 $ 316 2008 314
2009
$
728
2010
754
2011
764
2012
645
2013
603
2014 - 2018
2,424
$
5,918
HANCOCK HOLDING COMPANY AND SUBSIDIARIES
NOTES TO CONSOLIDATED FINANCIAL STATEMENTS
Note 9. Retirement and Employee Benefit Plans (continued)
The following table shows the amounts in accumulated other comprehensive loss that the Company expects to be recognized as net periodic benefit cost during the year ending December 31, 2009
321 2010 363 2011 404 2012 - 2016 1,992 ------------ $ 3,710 ============
|
|
|
|
|
Prior service cost |
| $ | (53 | ) |
Net transition obligation |
|
| 5 |
|
Net loss |
|
| 170 |
|
|
|
| ||
Total |
| $ | 122 |
|
|
|
|
Defined Contribution Plan -– 401(k)
The Company has a 401(k) retirement plan covering substantially all employees who have been employed the required length of time90 days excluding on call, temporary, and seasonal employees and meet certain other requirements. Under this plan, employees can contribute a portion of their salary within limits provided by the Internal Revenue Code into the plan. The Company’s contributions to this plan were $1.7 million in 2008, $1.5 million in 2007 and $1.4 million in 2006, $1.2 million in 2005 and2006.
Nonqualified Deferred Compensation Plans
The Company has one nonqualified deferred compensation plan covering key employees who have met certain requirements. The Company’s contributions to this plan were $1.0 million in 2004.
HANCOCK HOLDING COMPANY AND SUBSIDIARIESNOTES TO CONSOLIDATED FINANCIAL STATEMENTS
$0.4 million in 2006.
Employee Stock Purchase Plan
The Company has an employee stock purchase plan that is designed to provide the employees of the Company a convenient means of purchasing common stock of the Company. Substantially all salaried, full time employees, with the exception of Leo W. Seal, Jr., President, who have been employed by the Company the required length of time,90 days excluding on call, temporary, and seasonal employees, are eligible to participate. The Company makes no contribution to each participant’s contribution. The numbers of shares purchased under this plan were 9,864 in 2008, 11,623 in 2007 and 7,213 in 2006, 10,461 in 2005 and 11,418 in 2004.2006.
The postretirement plans relating to health care payments and life insurance and the stock purchase plan are not guaranteed and are subject to immediate cancellation and/or amendment. These plans are predicated on future Company profit levels that will justify their continuance. Overall health care costs are also a factor in the level of benefits provided and continuance of these post-retirement plans. There are no vested rights under the postretirement health or life insurance plans.
Note 10. Stock-Based Payment Arrangements | |
At December 31, 2006,2008, the Company had two share-based payment plans for employees, which are described below. Prior to January 1, 2006, theThe Company accounted for those plans under the recognition and measurement provisions of Accounting Principles Board (APB) Opinion No. 25,Accounting for Stock Issued to Employees, and related Interpretations, as permitted by SFAS No. 123,Accounting for Stock-Based Compensation. Compensation cost for stock options was not recognized in our Condensed Consolidated Statements of Income until December 2005, when the Board approved accelerated vesting for all outstanding unvested options granted to employees. No compensation cost was recognized prior to 2006 as all options granted under those plans had an exercise price equal to the market value of the underlying common stock on the date of the grant. Prior to January 1, 2006, compensation cost was recognized for restricted share awards. Effective January 1, 2006, the Company adoptedfollows the fair value recognition provisions of SFAS No. 123(R),Share-Based PaymentPayment., using the modified-prospective method. Under this method, compensation cost recognized in 2006 includes: (1) compensation cost for all the Company’s share-based payments granted prior to, but not yet vested as of December 31, 2005, based on the grant date fair value estimated in accordance with the original provisions of SFAS No. 123, and (2) compensation cost for all the Company’s share-based payments granted subsequent to December 31, 2005, based on the grant date fair value estimated in accordance with the provisions of SFAS No. 123(R). Results for prior periods have not been restated.
For the years ended December 31, 2006, December 31, 2005,2008, 2007, and December 31, 20042006 total compensation cost for share-based compensation recognized in income was $3,690,000, $1,289,000,$2.8 million, $1.2 million, and $704,000,$3.7 million, respectively. The total recognized tax benefit related to the share-based compensation was $1,158,000, $334,000,$0.7 million, $0.3 million, and $212,000,$1.2 million, respectively, for years 2006, 2005,2008, 2007 and 2004.2006.
As a result of the adoption SFAS No. 123(R) on January 1, 2006, the Company’s income before income taxes and net income for December 31, 2006, are $3,690,000 and $2,532,000 lower, respectively, than if it had continued to account for share-based compensation under APB No. 25. Basic earnings per share for 2006 would have been $3.21 if the Company had not adopted SFAS No. 123(R), compared to reported basic earnings per share of $3.13. Diluted earnings per share for 2006 would have been $3.13 if the Company had not adopted SFAS No. 123(R), compared to reported diluted earnings per share of $3.06.
Prior to the adoption of SFAS No. 123(R), the Company presented all tax benefits of deductions resulting from the exercise of stock options as operating cash flows in the Consolidated Statement of Cash Flows. SFAS 123(R) requires the cash flows resulting from the tax benefits resulting from tax deductions in excess of the compensation cost recognized for those options (excess tax benefits) to be classified as financing cash flows. For the year ended December 31, 2006, there was a $3.5 millionThe excess tax benefit classified as a financing cash inflow and classified as an operating cash outflow.outflow for the years ended December 31, 2008, 2007, and 2006 was $4.5 million, $0.3 million, and $3.5 million, respectively.
HANCOCK HOLDING COMPANY AND SUBSIDIARIES
NOTES TO CONSOLIDATED FINANCIAL STATEMENTS
Note 10. Stock-Based Payment Arrangements (continued) | |
The following table illustrates the effect on net income if the Company had applied the fair value recognition provisions of SFAS No. 123 to options granted in 2005. For purposes of this pro forma disclosure, the value of the options was estimated using a Black-Scholes-Merton option pricing formula and amortized to expense over the options’ vesting periods (in thousands, except per share amounts).
Stock Option PlansYears Ended December 31, ---------------------------------- 2005 2004 ---------------- ----------------Net income, as reported $ 54,032 $ 61,704 Add: stock-based employee compensation expense included in reported net income, net of related tax effects 558 - Deduct: total stock-based employee compensation expense determined under fair value based method for all awards, net of related tax effects (8,954) (1,858) ---------------- ---------------- Pro forma net income $ 45,636 $ 59,846 ================ ================ Earnings per share Basic - as reported $ 1.67 $ 1.91 ================ ================ Basic - pro forma $ 1.41 $ 1.85 ================ ================ Diluted - as reported $ 1.64 $ 1.87 ================ ================ Diluted - pro forma $ 1.38 $ 1.81 ================ ================
The 1996 Hancock Holding Company Long-Term Incentive Plan (the “1996 Plan”) that was approved by the Company’s shareholders in 1996 was designed to provide annual incentive stock awards. Awards as defined in the 1996 Plan include, with limitations, stock options (including restricted stock options), restricted and performance shares, and performance stock awards, all on a stand-alone, combination or tandem basis. A total of fifteen million (15,000,000) common shares can be granted under the 1996 Plan with an annual grant maximum of two percent (2%) of the Company’s outstanding common stock as reported for the fiscal year ending immediately prior to such plan year. Grants of restricted stock awards are limited to one-third of the grant totals.
The exercise price is equal to the closing market price on the date immediately preceding the date of grant, except for certain of those granted to major stockholders where the option price is 110 percent of the market price. Option awards generally vest based on five years of continuous service and have ten-year contractual terms. The Company’s policy is to issue new shares upon share option exercise and issue treasury shares upon restricted stock award vesting. The 1996 Long-Term Incentive Plan expired in 2006.
In March of 2005, the stockholders of the Company approved Hancock Holding Company’s 2005 Long-Term Incentive Plan (the “2005 Plan”) as the successor plan to the 1996 LTIP. The 2005 Plan is designed to enable employees and directors to obtain a proprietary interest in the Company and to attract and retain outstanding personnel.
The 2005 Plan provides that awards for up to an aggregate of five million (5,000,000) shares of the Company’s common stock may be granted during the term of the 2005 Plan. The 2005 Plan limits the number of shares for which awards may be granted during any calendar year to two percent (2%) of the outstanding Company’s common stock as reported for the fiscal year ending immediately prior to such plan year.
HANCOCK HOLDING COMPANY AND SUBSIDIARIESNOTES TO CONSOLIDATED FINANCIAL STATEMENTS
The fair value of each option award is estimated on the date of grant using Black-Scholes-Merton option valuation model that uses the assumptions noted in the following table. Expected volatilities are based on implied volatilities from traded options on the Company’s stock, historical volatility of the Company’s stock and other factors. The expected term of options granted is derived from the output of the option valuation model and represents the period of time that options granted are expected to be outstanding. The risk-free rate for periods within the contractual life of the option is based on the U.S. Treasury yield curve in effect at the time of grant.
Years Ended December 31, ------------------------------------------------------- 2006 2005 2004 ------------------- ---------------- ----------------Expected volatility 29.87% 31.33% 31.33% Expected dividends 1.61% - 1.96% 2.12% 2.07% Expected term (in years) 5 - 8 5 - 8 8 Risk-free rates 4.30% - 4.54% 4.00% 3.98%
|
|
|
|
|
|
|
|
|
| Years Ended December 31, |
| ||||
|
|
| |||||
|
| 2008 |
| 2007 |
| 2006 |
|
|
|
|
|
| |||
Expected volatility |
| 29.02% - 35.33% |
| 29.02% - 30.89% |
| 29.87% |
|
Expected dividends |
| 2.31% - 2.60% |
| 2.47% - 2.52% |
| 1.61% - 1.96% |
|
Expected term (in years) |
| 5.6 - 8.7 |
| 5.6 - 9 |
| 5 - 8 |
|
Risk-free rates |
| 2.07% - 3.71% |
| 3.87% - 5.10% |
| 4.30% - 4.54% |
|
HANCOCK HOLDING COMPANY AND SUBSIDIARIES
NOTES TO CONSOLIDATED FINANCIAL STATEMENTS
Note 10. Stock-Based Payment Arrangements (continued) | |
A summary of option activity and changes under the plans for 20062008 is presented below:
Weighted- Average Weighted- Remaining Average Contractual Aggregate Number of Exercise Term Intrinsic Options Shares Price ($) (Years) Value ($000) - -------------------------------------------- ----------------- ------------------ ----------------- ---------------Outstanding at January 1, 2006 1,616,779 $ 22.32 6.5 Granted 347,043 $ 41.63 9.1 Exercised (423,571) $ 20.98 4.6 $ 8,256 Forfeited or expired (28,990) $ 26.74 5.3 ----------------- Outstanding at December 31, 2006 1,511,261 $ 27.04 6.6 $ 38,987 ================= ================== ================= =============== Exercisable at December 31, 2006 1,176,378 $ 22.90 5.9 $ 35,226 ================= ================== ================= =============== Share options expected to vest 301,989 $ 41.61 9.1 $ 3,392 ================= ================== ================= ===============
|
|
|
|
|
|
|
|
|
|
|
|
|
|
Options |
| Number of |
| Average |
| Contractual |
| Aggregate |
| ||||
|
|
|
|
| |||||||||
|
|
|
|
|
|
|
|
|
|
|
|
|
|
Outstanding at January 1, 2008 |
|
| 1,345,333 |
| $ | 29.04 |
|
|
|
|
|
|
|
Granted |
|
| 154,261 |
| $ | 41.43 |
|
|
|
|
|
|
|
Exercised |
|
| (469,985 | ) | $ | 22.67 |
|
|
|
| $ | 12,591 |
|
Forfeited or expired |
|
| (15,932 | ) | $ | 37.08 |
|
|
|
|
|
|
|
|
|
|
|
|
|
|
|
|
|
|
| ||
Outstanding at December 31, 2008 |
|
| 1,013,677 |
| $ | 33.75 |
|
| 6.4 |
| $ | 11,865 |
|
|
|
|
|
|
| ||||||||
Exercisable at December 31, 2008 |
|
| 622,244 |
| $ | 29.18 |
|
| 5.0 |
| $ | 10,131 |
|
|
|
|
|
|
| ||||||||
Share options expected to vest |
|
| 391,433 |
| $ | 41.03 |
|
| 8.6 |
| $ | 1,734 |
|
|
|
|
|
|
| ||||||||
The weighted-average grant-date fair valuevalues of options granted during 2008, 2007, and 2006 2005,were $13.19, $12.14, and 2004 was $17.96, $13.43, and $11.87,$14.21, respectively, per optioned share. The total intrinsic value of options exercised during 2008, 2007 and 2006 2005,was $12.6 million, $5.2 million, and 2004 was $8.2 million, $2.3 million, and $2.2 million, respectively.
HANCOCK HOLDING COMPANY AND SUBSIDIARIESNOTES TO CONSOLIDATED FINANCIAL STATEMENTS
A summary of the status of the Company’s nonvested shares as of December 31, 2006,2008, and changes during 2006,2008, is presented below:
Weighted- Average Number of Grant-Date Shares Fair Value ($) ----------------- -----------------Nonvested at January 1, 2006 132,635 $ 26.77 Granted 409,880 $ 21.70 Vested (4,424) $ 34.56 Forfeited (15,521) $ 23.23 ------------------- Nonvested at December 31, 2006 522,570 $ 22.79 ===================
|
|
|
|
|
|
|
|
| Number of |
| Weighted- |
| |
|
|
|
| |||
| ||||||
Nonvested at January 1, 2008 |
| 589,290 |
| $ | 21.82 |
|
Granted |
| 230,184 |
| $ | 22.24 |
|
Vested |
| (161,022 | ) | $ | 18.41 |
|
Forfeited |
| (12,189 | ) | $ | 23.33 |
|
|
|
|
|
|
| |
Nonvested at December 31, 2008 |
| 646,263 |
| $ | 22.79 |
|
|
|
|
|
|
| |
As of December 31, 2006,2008, there was $7.5$10.0 million of total unrecognized compensation cost related to nonvested share-based compensation arrangements granted under the plans. That cost is expected to be recognized over a weighted-average period of 3.73.9 years. The total fair value of shares which vested during 20062008 and 20052007 was $153 thousand$3.0 million and $13.5$1.2 million, respectively.
During 2005, the Board of Directors of the Company approved the accelerated vesting of all outstanding unvested options granted to employees. The Company used guidance provided in FASB Interpretation No. 44 (FIN 44),Accounting for Certain Transactions Involving Stock Compensation, in the determination of the expense associated with the accelerated vesting of the unvested options outstanding. Compensation expense was calculated as the difference between the grant price and the current market price on the date of the vesting. Forfeiture rates were calculated based on observation of historical trends. The impact of this action was a reduction in 2005 pretax income of approximately $558,000. The acceleration of the vesting of these options allowed the Company to avoid future compensation expense estimated to be approximately $6.4 million.
In the normal course of business, the Company enters into financial instruments, such as commitments to extend credit and letters of credit, to meet the financing needs of its customers. Such instruments are not reflected in the accompanying consolidated financial statements until they are funded and involve, to varying degrees, elements of credit risk not reflected in the consolidated balance sheets. The contract amounts of these instruments reflect the Company’s exposure to credit loss in the event of non-performance by the other party on whose behalf the instrument has been issued. The Company undertakes the same credit evaluation in making commitments and conditional obligations as it does for on-balance sheet instruments and may require collateral or other credit support for off-balance sheet financial instruments. These obligations are summarized below (in thousands):
December 31, ---------------------------------- 2006 2005 ---------------- ----------------Commitments to extend credit $ 963,098 $ 550,948 Letters of credit 69,468 57,427
HANCOCK HOLDING COMPANY AND SUBSIDIARIES
NOTES TO CONSOLIDATED FINANCIAL STATEMENTS
Note 11. Fair Value of Financial Instruments | |
Approximately $455.6 million The Company adopted Statement of SFAS No. 157, Fair Value Measurements, on January 1, 2008. SFAS No. 157 establishes a framework for measuring fair value under generally accepted accounting principles (GAAP), clarifies the definition of fair value within that framework, and $348.9 millionexpands disclosures about the use of commitmentsfair value measurements. SFAS No. 157 defines a fair value hierarchy that prioritizes the inputs to extend creditthese valuation techniques used to measure fair value giving preference to quoted prices in active markets (level 1) and the lowest priority to unobservable inputs such as a reporting entity’s own data (level 3). Level 2 inputs include quoted prices for similar assets or liabilities in active markets, quoted prices for identical assets or liabilities in markets that are not active, observable inputs other than quoted prices, such as interest rates and yield curves, and inputs that are derived principally from or corroborated by observable market data by correlation or other means. Available for sale securities classified as Level 1 within the valuation hierarchy include U.S. Treasury securities, obligations of U.S. Government-sponsored agencies, and other debt and equity securities. Level 2 classified available for sale securities include mortgage-backed debt securities, collateralized mortgage obligations, and state and municipal bonds.
The Company adopted SFAS No. 159, The Fair Value Option for Financial Assets and Financial Liabilities - Including an Amendment SFAS No. 115 (“SFAS No. 159”), on January 1, 2008. The Company did not elect to fair value any additional items under SFAS No. 159. The Company, in accordance with Financial Accounting Standards Board Staff Position No. 157-2 “The Effective Date of FASB Statement No. 157”, will defer application of SFAS No. 157 for nonfinancial assets and nonfinancial liabilities until January 1, 2009.
Fair Value of Assets Measured on a Recurring Basis
The following table presents for each of the fair-value hierarchy levels the Company’s financial assets and liabilities that are measured at fair value (in thousands) on a recurring basis at December 31, 2006 and 2005, respectively, were at variable rates and the remainder was at fixed rates. A commitment to extend credit is an agreement to lend to a customer as long as the conditions established in the agreement have been satisfied. A commitment to extend credit generally has a fixed expiration date or other termination clauses and may require payment of a fee by the borrower. Since commitments often expire without being fully drawn, the total commitment amounts do not necessarily represent future cash requirements of the Company. The Company continually evaluates each customer’s credit worthiness on a case-by-case basis. Occasionally, a credit evaluation of a customer requesting a commitment to extend credit results in the Company obtaining collateral to support the obligation.2008.
|
|
|
|
|
|
|
|
|
|
|
|
| Level 1 |
| Level 2 |
| Net Balance |
| |||
Assets |
|
|
|
|
|
|
|
|
|
|
Available for sale securities |
| $ | 290,374 |
| $ | 1,389,382 |
| $ | 1,679,756 |
|
Trading securities |
|
| 2,201 |
|
| — |
|
| 2,201 |
|
Short-term investments |
|
| 362,895 |
|
| — |
|
| 362,895 |
|
Interest rate lock commitments |
|
| — |
|
| 10 |
|
| 10 |
|
Swaps |
|
| — |
|
| (4,123 | ) |
| (4,123 | ) |
Loans carried at fair value |
|
| — |
|
| 24,125 |
|
| 24,125 |
|
Total assets |
| $ | 655,470 |
| $ | 1,409,394 |
| $ | 2,064,864 |
|
Letters of credit are conditional commitments issued by the Company to guarantee the performance of a customer to a third party. The credit risk involved in issuing a letter of credit is essentially the same as that involved in extending a loan. The Company accounts for these commitments under the provisions of the FASB Interpretation No. 45 (FIN 45),Guarantees of Indebtedness of Others. The liability associated with letters of credit is not material to the Company’s consolidated financial statements. Letters of credit are supported by collateral or borrower guarantee sufficient to cover any draw on the letter that would result in an outstanding loan.
Certain assets and liabilities are measured at fair value on a non-recurring basis and therefore are not included in the table above. Impaired loans are level 2 assets measured using appraisals from external parties of the collateral less any prior liens. As of December 31, 2008, the fair value of impaired loans was $14.8 million.
The following methods and assumptions were used to estimate the fair value in accordance with SFAS No. 107, Disclosures about Fair Value of Financial Instruments, of each class of financial instruments for which it is practicable to estimate:
Cash, Short-Term Investments and Federal Funds Sold —- For those short-term instruments, the carrying amount is a reasonable estimate of fair value.
HANCOCK HOLDING COMPANY AND SUBSIDIARIES
NOTES TO CONSOLIDATED FINANCIAL STATEMENTS
Note 11. Fair Value of Financial Instruments (continued) | |
Securities - — Estimated fair values for securities are based on quoted market prices where available. If quoted market prices are not available, estimated fair values are based on market prices of comparable instruments.
Loans, Net of Unearned Income - — The fair value of loans is estimated by discounting the future cash flows using the current rates for similar loans with the same remaining maturities.
Accrued Interest Receivable and Accrued Interest PayablePayable–- The carrying amounts are a reasonable estimate of their fair values.
Deposits — The– SFAS No. 107 requires that the fair value of deposits with no stated maturity, such as noninterest-bearing demand deposits, interest-bearing checking and savings accounts, and certain money market deposits is the amountbe assigned fair values equal to amounts payable onupon demand at the reporting date.(carrying amounts). The fair value of fixed-maturity certificates of deposit is estimated using the rates currently offered for deposits of similar remaining maturities.
Federal Funds Purchased - — For these short-term liabilities, the carrying amount is a reasonable estimate of fair value.
Securities Sold under Agreements to Repurchase and Federal Funds Purchased —– For these short-term liabilities, the carrying amount is a reasonable estimate of fair value.
Short-Term Notes — For short-term notes, the carrying amount is a reasonable estimate of fair value.
Long-Term Notes —- Rates currently available to the Company for debt with similar terms and remaining maturities are used to estimate fair value of existing debt. The fair value is estimated by discounting the future contractual cash flows using current market rates at which similar Notes over the same remaining term could be obtained.
HANCOCK HOLDING COMPANY AND SUBSIDIARIESNOTES TO CONSOLIDATED FINANCIAL STATEMENTS
Commitments - — The fair value of loan commitments and letters of credit approximate the fees currently charged for similar agreements or the estimated cost to terminate or otherwise settle similar obligations. The fees associated with these financial instruments, or the estimated cost to terminate, as applicable are immaterial.
The estimated fair values of the Company’s financial instruments were as follows (in thousands):
December 31,
2008
2007
Carrying
Amount
Fair
Value
Carrying
Amount
Fair
Value
Financial assets:
Cash, interest-bearing deposits, federal funds sold, and short-term investments
$
749,191
$
749,191
$
308,896
$
308,896
Securities
1,681,957
1,681,957
1,670,208
1,670,208
Loans, net of unearned income
4,271,580
4,625,130
3,615,514
3,828,989
Accrued interest receivable
33,067
33,067
35,117
35,117
Financial liabilities:
Deposits
$
5,930,937
$
5,990,883
$
5,009,534
$
5,026,639
Federal funds purchased
—
—
4,100
4,100
Securities sold under agreements to repurchase
505,932
505,932
371,604
371,604
Long-term notes
638
638
793
793
Accrued interest payable
6,322
6,322
9,105
9,105
2008 and 2007, respectively, were at variable rates and the remainder was at fixed rates. A commitment to extend credit is an agreement to lend to a customer as long as the conditions established in the agreement have been satisfied. A commitment to extend credit generally has a fixed expiration date or other termination clauses and may require payment of a fee by the borrower. Since commitments often expire without being fully drawn, the total commitment amounts do not necessarily represent future cash requirements of the Company. The Company continually evaluates each customer’s credit worthiness on a case-by-case basis. Occasionally, a credit evaluation of a customer requesting a commitment to extend credit results in the Company obtaining collateral to support the obligation. HANCOCK HOLDING COMPANY AND SUBSIDIARIES
NOTES TO CONSOLIDATED FINANCIAL STATEMENTS
Note 12. Commitments and Contingencies
Lending Related
In the normal course of business, the Company enters into financial instruments, such as commitments to extend credit and letters of credit, to meet the financing needs of its customers. Such instruments are not reflected in the accompanying consolidated financial statements until they are funded and involve, to varying degrees, elements of credit risk not reflected in the consolidated balance sheets. The contract amounts of these instruments reflect the Company’s exposure to credit loss in the event of non-performance by the other party on whose behalf the instrument has been issued. The Company undertakes the same credit evaluation in making commitments and conditional obligations as it does for on-balance sheet instruments and may require collateral or other credit support for off-balance sheet financial instruments. These obligations are summarized below (in thousands):
December 31,
2008
2007
Commitments to extend credit
$
885,156
$
1,110,935
Letters of credit
113,274
86,969
Approximately $610.4 million and $524.7 million of commitments to extend credit at December 31,
-------------------------------------------------------------- 2006 2005 ------------------------------ ------------------------------ Carrying Fair Carrying Fair Amount Value Amount Value -------------- -------------- -------------- ---------------Letters of credit are conditional commitments issued by the Company to guarantee the performance of a customer to a third party. The credit risk involved in issuing a letter of credit is essentially the same as that involved in extending a loan. The Company accounts for these commitments under the provisions of the FASB Interpretation No. 45, Guarantors Accounting and Disclosure Requirements, Including Indirect Guarantees of Indebtedness of Others. The liability associated with letters of credit is not material to the Company’s consolidated financial statements. Letters of credit are supported by collateral or borrower guarantee sufficient to cover any draw on the letter that would result in an outstanding loan.
Visa Litigation
In the fourth quarter of 2007, we recorded a $2.5 million pretax charge pursuant to FASB Interpretation No. 45 “Guarantors Accounting and Disclosure Requirements, Including Indirect Guarantees of Indebtedness of Others” (“FIN No. 45”) for liabilities related to VISA USA’s antitrust settlement with American Express and other pending VISA litigation (reflecting our share as a VISA member.) In the first quarter of 2008 as part of VISA’s initial public offering, VISA redeemed 37.5% of shares held by us resulting in proceeds of $2.8 million in a realized security gain. The remaining 62.5% of the Class B shares are restricted and must be held for the longer period of 3 years or until all settlements are complete. At that time, we can keep the Class B shares or convert them to Class A publicly tradeable shares at a conversion rate to be determined. These shares are recorded at historical cost. The realized securities gain is included in the securities gain line of the noninterest income section of the Consolidated Statements of Income and the cash received is recorded in cash and due from banks in the assets section of the Consolidated Balance Sheets. In addition, VISA lowered its estimate of pending litigation settlements. Consequently, $1.3 million of the $2.5 million FIN No. 45 liability that was recorded in the fourth quarter was reversed in the first quarter of 2008. The reduction in the litigation liability is recorded in the other liabilities section of the Consolidated Balance Sheets and the reduction in litigation expense is recorded in the other expense line of the noninterest expense section of the Consolidated Statements of Income.
HANCOCK HOLDING COMPANY AND SUBSIDIARIES
NOTES TO CONSOLIDATED FINANCIAL STATEMENTS
Note 12. Commitments and Contingencies (continued)
In the fourth quarter of 2008, VISA, Discover Financial
assets: Cash, interest-bearing depositsServices Inc., andfederal funds sold $ 412,553 $ 412,553 $ 681,330 $ 681,330 Securities availableMasterCard Inc. announced that they have settled the antitrust lawsuit and that they are working on the specific terms on the settlement. On December 22, 2008, VISA, Inc. announced that it had deposited $1.1 billion into the litigation escrow account as settlement forsale 1,903,658 1,903,658 1,959,261 1,959,261 Loans, netthe Discover case. Under terms ofunearned income 3,266,584 3,360,368 2,989,186 3,079,084 Accrued interest receivable 32,984 32,984 35,046 35,046 Financial liabilities: Deposits $ 5,030,991 $ 4,934,128 $ 4,989,820 $ 4,890,632 Federal funds purchased 3,800 3,800 1,475 1,475 Securities sold under agreementsthe plan, Hancock Bank as a member bank bore its portion of the expense via a reduction in share count of Class B shares. There was no cash outlay required of Hancock Bank. Based on the funding and settlement with Discover, Hancock Bank reversed as of December 31, 2008, the portion of the VISA contingency reserve related torepurchase 218,591 218,591 250,807 250,807 Long-term notes 258 258 50,266 50,566 Accrued interest payable 8,222 8,222 5,881 5,881
Legal Proceedings
The Company is party to various legal proceedings arising in the ordinary course of business. In the opinion of management, after consultation with legal counsel, all such matters areeach matter is not expected to have a material adverse effect on the financial statements of the Company.
Lease Commitments
Hancock currently has capital and operating leases for buildings and equipment that expire from 2009 to 2048. It is expected that certain leases will be renewed or equipment replaced as leases expire. Certain of these leases have escalation clauses that are being amortized on a straight-line basis over the term of the lease as required by SFAS No. 13, Accounting for Leases. Future minimum lease payments for all non-cancelable capital and operating leases with initial or remaining terms of one year or more consisted of the following at December 31, 20062008 (in thousands):
2007 $ 4,137 2008 3,056 2009 2,451 2010 2,030 2011 1,269 thereafter 3,999 ----------------- $ 16,942 =================
|
|
|
|
|
|
|
|
|
| Captial Leases |
| Operating Leases |
| ||
|
|
|
| ||||
2009 |
| $ | 152 |
| $ | 4,563 |
|
2010 |
|
| 81 |
|
| 3,890 |
|
2011 |
|
| 26 |
|
| 2,787 |
|
2012 |
|
| 28 |
|
| 2,324 |
|
2013 |
|
| 31 |
|
| 1,828 |
|
Thereafter |
|
| 83 |
|
| 17,191 |
|
|
|
|
| ||||
Total minimum lease payments |
| $ | 401 |
| $ | 32,583 |
|
|
|
|
|
|
| ||
Amounts representing interest |
|
| 110 |
|
|
|
|
|
|
|
|
|
| ||
Present value of net minimum lease payments |
| $ | 291 |
|
|
|
|
|
|
|
|
|
| ||
Rental expense approximated $3.6$5.7 million, $2.8$6.4 million, and $2.6$5.0 million for the years ended December 31, 2008, 2007, and 2006, 2005, and 2004, respectively. Rental expense is included in net occupancy expense on the Consolidated Statement of Income.
HANCOCK HOLDING COMPANY AND SUBSIDIARIES
NOTES TO CONSOLIDATED FINANCIAL STATEMENTS
Note 18.13. Other Noninterest Income and Other Noninterest Expense
The components of other noninterest income and other noninterest expense are as follows (in thousands):
Years Ended December 31, ----------------------------------------- 2006 2005 2004 ------------- ------------- ------------Other noninterest income:
Years Ended December 31,
2008
2007
2006
Other noninterest income:
Income from bank owned life insurance
$
5,906
$
4,912
$
4,091
Outsourced check income
284
2,288
2,801
Income on real estate option
—
—
859
Safety deposit box income
821
794
842
Appraisal fee income
1,001
926
852
Other
5,564
5,820
4,177
Total other noninterest income
$
13,576
$
14,740
$
13,622
Other noninterest expense:
Postage
$
3,902
$
3,851
$
3,731
Communication
5,552
6,602
5,918
Data processing
18,432
17,585
13,933
Legal and professional services
12,718
15,234
13,968
Ad valorem and franchise taxes
3,532
3,514
3,346
Printing and supplies
1,833
2,252
1,997
Advertising
6,917
7,032
6,642
Regulatory and other fees
6,935
4,433
5,513
Miscellaneous expense
3,705
10,522
9,927
Other expense
8,182
7,208
8,117
Total other noninterest expense
$
71,708
$
78,233
$
73,092
Note 14. Income
from bank owned life insurance $ 4,091 $ 3,449 $ 3,466 Outsourced check income 2,801 1,345 632 Income on real estate option 859 1,145 - Safety deposit box income 842 807 836 Appraisal fee income 852 694 686 Other 3,912 4,942 3,374 ------------- ------------- ------------ Total other noninterest income $ 13,357 $ 12,382 $ 8,994 ============= ============= ============ Other noninterest expense: Postage $ 3,731 $ 3,780 $ 4,199 Communication 5,918 4,040 3,953 Data processing 10,505 7,805 7,618 Professional fees 14,994 10,429 8,322Taxesand licenses 3,346 3,607 1,699 Printing and supplies 1,997 1,787 1,702 Marketing 6,642 5,232 4,292 Regulatory and other fees 5,513 3,663 3,670 Miscellaneous expense 9,927 8,578 5,186 Other expense 8,119 5,791 6,377 ------------- ------------- ------------ Total other noninterest expense $ 70,692 $ 54,712 $ 47,018 ============= ============= ============
Income taxes consisted of the following components (in thousands):
Years Ended December 31, -------------------------------------------- 2006 2005 2004 ------------- ------------- ------------Current federal $ 19,879 $ 34,183 $ 28,001 Current state 2,066 3,089 2,121 ------------- ------------- ------------ Total current provision 21,945 37,272 30,122 ------------- ------------- ------------ Deferred federal 22,641 (14,864) (2,960) Deferred state 1,958 (3,537) (569) ------------- ------------- ------------ Total deferred provision 24,599 (18,401) (3,529) ------------- ------------- ------------ Total tax expense $ 46,544 $ 18,871 $ 26,593 ============= ============= ============
|
|
|
|
|
|
|
|
|
|
|
|
| Years Ended December 31, |
| |||||||
|
|
| ||||||||
|
| 2008 |
| 2007 |
| 2006 |
| |||
|
|
|
|
| ||||||
Current federal |
| $ | 24,603 |
| $ | 19,150 |
| $ | 19,879 |
|
Current state |
|
| 2,028 |
|
| 1,209 |
|
| 2,066 |
|
|
|
|
|
| ||||||
Total current provision |
|
| 26,631 |
|
| 20,359 |
|
| 21,945 |
|
|
|
|
|
| ||||||
|
|
|
|
|
|
|
|
|
|
|
Deferred federal |
|
| (4,675 | ) |
| 6,264 |
|
| 22,641 |
|
Deferred state |
|
| (337 | ) |
| 1,296 |
|
| 1,958 |
|
|
|
|
|
| ||||||
Total deferred provision |
|
| (5,012 | ) |
| 7,560 |
|
| 24,599 |
|
|
|
|
|
| ||||||
Total tax expense |
| $ | 21,619 |
| $ | 27,919 |
| $ | 46,544 |
|
|
|
|
|
| ||||||
HANCOCK HOLDING COMPANY AND SUBSIDIARIESNOTES TO CONSOLIDATED FINANCIAL STATEMENTS
Deferred income taxes reflect the net tax effects of temporary differences between the carrying amounts of assets and liabilities for financial reporting purposes and the amounts used for income tax reporting purposes.
HANCOCK HOLDING COMPANY AND SUBSIDIARIES
NOTES TO CONSOLIDATED FINANCIAL STATEMENTS
Note 14. Income Taxes (continued)
Significant components of the Company’s deferred tax assets and liabilities were as follows (in thousands):
December 31,
2008
2007
Deferred tax assets:
Minimum pension liability
$
16,004
$
8,787
Allowance for loan losses
22,792
17,420
Compensation
8,740
7,960
Capital loss
1,405
—
Net operating loss
182
182
Other
1,496
1,405
Gross deferred tax assets
50,619
35,754
Valuation allowance
(85
)
(85
)
Net deferred tax assets
50,534
35,669
Deferred tax liabilities:
Fixed assets & intangibles
(26,432
)
(25,842
)
Unrealized gain on securities available for sale
(10,479
)
(94
)
Other
(7,804
)
(5,757
)
Gross deferred tax liabilities
(44,715
)
(31,693
)
Net deferred tax asset
$
5,819
$
3,976
At December 31,
----------------------------------- 2006 2005 ---------------- ----------------Deferred tax assets: Pension liability $ 9,123 $ 5,031 Post-retirement benefit obligation 2,187 2,039 Allowance for loan losses 17,321 27,711 Deferred compensation 1,658 1,851 Unrealized loss on securities available for sale 4,579 7,908 Premium amortization on securities, net - 5,186 ---------------- ---------------- Gross2008, Magna Insurance Company had a deferred taxassets 34,868 49,726 ---------------- ---------------- Deferred tax liabilities: Pension contribution (2,486) (1,856) Loan servicing assets (360) (603) Propertyasset net of a valuation allowance, $1.5 million, related to a federal net operating loss carryforward andequipment depreciation (7,552) (5,034) Other intangible assets (2,984) (339) Discount accretion on securities,capital loss carryforward. This net(3,412) - Prepaid expenses (1,525) (1,353) Other (5) (161) ---------------- ---------------- Gross deferred tax liabilities (18,324) (9,346) ---------------- ---------------- Net deferred tax assets $ 16,544 $ 40,380 ================ ================
Based uponoperating loss carryforward will expire in 2011 and the level of historical taxable income and projections for future taxable income over the periods, whichcapital loss carryforward will expire in 2013. Also, the deferred tax assets above are deductible,net of an immaterial valuation allowance due to miscellaneous state net operating losses. Other than these items, no valuation allowance related to deferred tax assets has been recorded on December 31, 2008 and 2007, as management believes that it is more likely than not that the Companyremaining deferred tax assets will realize the benefits of these deductible differences existing at December 31, 2006. Therefore, no valuation allowance is necessary at this time.be fully utilized.
HANCOCK HOLDING COMPANY AND SUBSIDIARIESNOTES TO CONSOLIDATED FINANCIAL STATEMENTS
The reason for differences in income taxes reported compared to amounts computed by applying the statutory income tax rate of 35% to earnings before income taxes were as follows (in thousands):
(continued)Years Ended December 31, ---------------------------------------------------------------------------- 2006 2005 2004 ------------------------ ------------------------ ------------------------ Amount % Amount % Amount % ------------ ---------- ------------ ---------- ------------ ----------
Years Ended December 31,
2008
2007
2006
Amount
%
Amount
%
Amount
%
Taxes computed at statutory rate
$
30,445
35%
$
35,634
35%
$
51,921
35%
Increases (decreases) in taxes resulting from:
State income taxes, net of federal income tax benefit
1,099
1%
1,628
2%
2,616
2%
Tax-exempt interest
(5,827
)
-7%
(5,072
)
-5%
(4,311
)
-3%
Bank owned life insurance
(2,159
)
-2%
(1,807
)
-2%
(1,417
)
-1%
Tax credits
(3,514
)
-4%
(3,510
)
-3%
(2,357
)
-2%
Other, net
1,575
2%
1,046
1%
92
—
Income tax expense
$
21,619
25%
$
27,919
28%
$
46,544
31%
HANCOCK HOLDING COMPANY AND SUBSIDIARIES
NOTES TO CONSOLIDATED FINANCIAL STATEMENTSNote 14. Income Taxes
computed at statutory rate $ 51,921 35% $ 25,526 35% $ 30,904 35% Increases (decreases) in taxes resulting from: State income taxes, net of federal income tax benefit 2,616 2% 1,059 1% 1,099 1% Tax-exempt interest (4,311) -3% (4,105) -5% (4,015) -5% Bank owned life insurance (1,417) -1% (1,279) -2% (1,248) - Contingency release, net (627) - (1,163) -1% - - Tax credits (2,357) -2% (674) -1% - - Other, net 719 - (493) -1% (147) - ------------ ---------- ------------ ---------- ------------ ---------- Income tax expense $ 46,544 31% $ 18,871 26% $ 26,593 31% ============ ========== ============ ========== ============ ==========
�� Due to recent tax legislation following Hurricane Katrina, tax credits available to the Company for the 20062008 and 2007 tax yearyears include the Worker’s Opportunity Tax Credit and the Gulf Tax Credit.
FIN 48
The Company adopted FASB Interpretation No. 48, Accounting for Uncertainty in Income Taxes, An Interpretation of FASB Statement No. 109 (“FIN 48”), on January 1, 2007 and determined that no adjustment was required to retained earnings due to the adoption of this Interpretation. There were no material uncertain tax positions at December 31, 2008. The Company does not expect that unrecognized tax benefits will significantly increase or decrease within the next 12 months.
It is the Company’s policy to recognize interest and penalties accrued relative to unrecognized tax benefits in income tax provisions related to items included in other comprehensive income were as follows (in thousands):
Years Endedexpense. As of December 31,---------------------------------------------------- 2006 2005 2004 --------------- ---------------- ----------------Pension liability $ (4,091) $ 24 $ (142) Unrealized holdings gains (losses) 1,352 (6,347) (2,526) Reclassification adjustments 1,977 49 (72) --------------- ---------------- ---------------- Total2008, the interest accrued is considered immaterial to the Company’s consolidated balance sheet.The Company and its subsidiaries file a consolidated U.S. federal income tax
benefit $ (762) $ (6,274) $ (2,740) =============== ================ ================
return, as well as filing various returns in the states where its banking offices are located. Its filed income tax returns are no longer subject to examination by taxing authorities for years before 2005.
HANCOCK HOLDING COMPANY AND SUBSIDIARIESNOTES TO CONSOLIDATED FINANCIAL STATEMENTS
Note
Following is a summary of the information used in the computation of earnings per common share (in thousands):
Years Ended December 31, ---------------------------------------------------- 2006 2005 2004 ---------------- ---------------- ----------------Net income available to common stockholders - used in computation of basic and diluted earnings per common share $ 101,802 $ 54,032 $ 61,704 ================ ================ ================ Weighted average number of common shares outstanding - used in computation of basic earnings per common share 32,534 32,365 32,390 Effect of dilutive securities Stock options and restricted stock awards 770 601 556 Convertible preferred stock - - 106 ---------------- ---------------- ---------------- Weighted average number of common shares outstanding plus effect of dilutive securities - used in computation of diluted earnings per common share 33,304 32,966 33,052 ================ ================ ================
|
|
|
|
|
|
|
|
|
|
|
|
| Years Ended December 31, |
| |||||||
|
|
| ||||||||
|
| 2008 |
| 2007 |
| 2006 |
| |||
|
|
|
|
| ||||||
Net income available to common stockholders - used in computation of basic and diluted earnings per common share |
| $ | 65,366 |
| $ | 73,892 |
| $ | 101,802 |
|
|
|
|
|
| ||||||
|
|
|
|
|
|
|
|
|
|
|
Weighted average number of common shares outstanding - used in computation of basic earnings per common share |
|
| 31,491 |
|
| 32,000 |
|
| 32,534 |
|
Effect of dilutive securities |
|
|
|
|
|
|
|
|
|
|
Stock options and restricted stock awards |
|
| 392 |
|
| 545 |
|
| 770 |
|
|
|
|
|
| ||||||
|
|
|
|
|
|
|
|
|
|
|
Weighted average number of common shares outstanding plus effect of dilutive securities - used in computation of diluted earnings per common share |
|
| 31,883 |
|
| 32,545 |
|
| 33,304 |
|
|
|
|
|
| ||||||
The Company had 55,398no shares of anti-dilutive options in 2006. There were2008 and no shares of anti-dilutive options in 2005.2007. There were 55,398 anti-dilutive options in 2006.
HANCOCK HOLDING COMPANY AND SUBSIDIARIES
NOTES TO CONSOLIDATED FINANCIAL STATEMENTS
Note 21.16. Segment Reporting
The Company’s primary segments are geographically divided into the Mississippi (MS), Louisiana (LA), Florida (FL) and Florida (FL)Alabama (AL) markets. Each segment offers the same products and services but is managed separately due to different pricing, product demand and consumer markets. The threefour segments offer commercial, consumer and mortgage loans and deposit services. In the second table,all tables, the column “Other” includes additional consolidated subsidiaries of the Company: Hancock Investment Services, Inc., Hancock Insurance Agency, Inc., Harrison Finance Company, Magna Insurance Company and three real estate corporations owning land and buildings that house bank branches and other facilities. Following is selected information for the Company’s segments (in thousands):
Year Ended December 31, 2006 ------------------------------------------------------------------------------------- MS LA FL Other Eliminations Consolidated --------------- ------------- ---------- ----------- ------------- ---------------(In thousands) Interest income $ 193,698 $ 136,844 $ 8,108 $ 20,270 $ (14,590) $ 344,330 Interest expense 72,154 52,833 2,934 6,103 (14,161) 119,863 -------------- ------------- ---------- ----------- ------------- --------------- Net interest income 121,544 84,011 5,174 14,167 (429) 224,467 Provision for (reversal of) loan losses (19,811) (4,446) 834 2,661 - (20,762) Noninterest income 47,844 29,782 346 25,966 (105) 103,833 Depreciation and amortization 6,986 2,611 319 527 - 10,443 Other noninterest expense 89,978 61,688 5,172 33,479 (44) 190,273 -------------- ------------- ---------- ----------- ------------- --------------- Income before income taxes 92,235 53,940 (805) 3,466 (490) 148,346 Income tax expense (benefit) 23,074 24,035 (603) (796) 834 46,544 -------------- ------------- ---------- ----------- ------------- --------------- Net income (loss) $ 69,161 $ 29,905 $ (202) $ 4,262 $ (1,324) $ 101,802 ============== ============= ========== =========== ============= =============== Total assets $ 3,454,274 $ 2,365,422 $ 158,836 $ 807,912 $ (821,879) $ 5,964,565 Total interest income from affiliates $ 13,895 $ 6 $ 260 $ - $ (14,161) $ - Total interest income from external customers $ 179,803 $ 136,838 $ 7,848 $ 20,270 $ (429) $ 344,330 (Amortization) & accretion of securities $ 10,287 $ 1,123 $ (51) $ (59) $ - $ 11,300
|
|
|
|
|
|
|
|
|
|
|
|
|
|
|
|
|
|
|
|
|
|
|
|
| Year Ended |
| |||||||||||||||||||
|
|
| ||||||||||||||||||||
|
| MS |
| LA |
| FL |
| AL |
| Other |
| Eliminations |
| Consolidated |
| |||||||
|
|
|
|
|
|
|
|
| ||||||||||||||
|
| (In thousands) |
| |||||||||||||||||||
Interest income |
| $ | 158,288 |
| $ | 145,546 |
| $ | 9,717 |
| $ | 5,088 |
| $ | 26,574 |
| $ | (9,776 | ) | $ | 335,437 |
|
Interest expense |
|
| 73,477 |
|
| 48,813 |
|
| 5,355 |
|
| 2,508 |
|
| 5,164 |
|
| (9,315 | ) |
| 126,002 |
|
|
|
|
|
|
|
|
|
| ||||||||||||||
Net interest income |
|
| 84,811 |
|
| 96,733 |
|
| 4,362 |
|
| 2,580 |
|
| 21,410 |
|
| (461 | ) |
| 209,435 |
|
Provision for loan losses |
|
| 11,922 |
|
| 15,715 |
|
| 2,419 |
|
| 1,393 |
|
| 5,336 |
|
| — |
|
| 36,785 |
|
Noninterest income |
|
| 55,640 |
|
| 46,231 |
|
| 1,633 |
|
| 702 |
|
| 23,606 |
|
| (34 | ) |
| 127,778 |
|
Depreciation and amortization |
|
| 10,778 |
|
| 3,555 |
|
| 484 |
|
| 377 |
|
| 567 |
|
| — |
|
| 15,761 |
|
Other noninterest expense |
|
| 87,318 |
|
| 68,340 |
|
| 6,894 |
|
| 4,634 |
|
| 30,613 |
|
| (117 | ) |
| 197,682 |
|
|
|
|
|
|
|
|
|
| ||||||||||||||
Income before income taxes |
|
| 30,433 |
|
| 55,354 |
|
| (3,802 | ) |
| (3,122 | ) |
| 8,500 |
|
| (378 | ) |
| 86,985 |
|
Income tax expense (benefit) |
|
| 6,627 |
|
| 14,854 |
|
| (1,953 | ) |
| (1,163 | ) |
| 3,254 |
|
| — |
|
| 21,619 |
|
|
|
|
|
|
|
|
|
| ||||||||||||||
Net income (loss) |
| $ | 23,806 |
| $ | 40,500 |
| $ | (1,849 | ) | $ | (1,959 | ) | $ | 5,246 |
| $ | (378 | ) | $ | 65,366 |
|
|
|
|
|
|
|
|
|
| ||||||||||||||
|
|
|
|
|
|
|
|
|
|
|
|
|
|
|
|
|
|
|
|
|
|
|
Total assets |
| $ | 3,795,890 |
| $ | 3,008,320 |
| $ | 367,134 |
| $ | 155,862 |
| $ | 871,758 |
| $ | (1,031,710 | ) | $ | 7,167,254 |
|
|
|
|
|
|
|
|
|
|
|
|
|
|
|
|
|
|
|
|
|
|
|
|
Total interest income from affiliates |
| $ | 9,754 |
| $ | 8 |
| $ | 14 |
| $ | — |
| $ | — |
| $ | (9,776 | ) | $ | — |
|
|
|
|
|
|
|
|
|
|
|
|
|
|
|
|
|
|
|
|
|
|
|
|
Total interest income from external customers |
| $ | 148,534 |
| $ | 145,538 |
| $ | 9,703 |
| $ | 5,088 |
| $ | 26,574 |
| $ | — |
| $ | 335,437 |
|
|
|
|
|
|
|
|
|
|
|
|
|
|
|
|
|
|
|
|
|
|
|
|
|
| Year Ended |
| |||||||||||||||||||
|
|
| ||||||||||||||||||||
|
| MS |
| LA |
| FL |
| AL |
| Other |
| Eliminations |
| Consolidated |
| |||||||
|
|
|
|
|
|
|
|
| ||||||||||||||
|
| (In thousands) |
| |||||||||||||||||||
Interest income |
| $ | 179,775 |
| $ | 148,708 |
| $ | 9,583 |
| $ | 1,238 |
| $ | 25,769 |
| $ | (19,376 | ) | $ | 345,697 |
|
Interest expense |
|
| 79,189 |
|
| 66,699 |
|
| 5,023 |
|
| 462 |
|
| 7,779 |
|
| (18,916 | ) |
| 140,236 |
|
|
|
|
|
|
|
|
|
| ||||||||||||||
Net interest income |
|
| 100,586 |
|
| 82,009 |
|
| 4,560 |
|
| 776 |
|
| 17,990 |
|
| (460 | ) |
| 205,461 |
|
Provision for (reversal of) loan losses |
|
| (22 | ) |
| 3,744 |
|
| 427 |
|
| 400 |
|
| 3,044 |
|
| — |
|
| 7,593 |
|
Noninterest income |
|
| 53,787 |
|
| 37,035 |
|
| 883 |
|
| 56 |
|
| 28,967 |
|
| (42 | ) |
| 120,686 |
|
Depreciation and amortization |
|
| 9,665 |
|
| 3,323 |
|
| 452 |
|
| 54 |
|
| 545 |
|
| — |
|
| 14,039 |
|
Other noninterest expense |
|
| 89,626 |
|
| 70,984 |
|
| 5,610 |
|
| 1,567 |
|
| 36,511 |
|
| (1,594 | ) |
| 202,704 |
|
|
|
|
|
|
|
|
|
| ||||||||||||||
Income before income taxes |
|
| 55,104 |
|
| 40,993 |
|
| (1,046 | ) |
| (1,189 | ) |
| 6,857 |
|
| 1,092 |
|
| 101,811 |
|
Income tax expense (benefit) |
|
| 15,788 |
|
| 10,458 |
|
| (603 | ) |
| (399 | ) |
| 2,675 |
|
| — |
|
| 27,919 |
|
|
|
|
|
|
|
|
|
| ||||||||||||||
Net income (loss) |
| $ | 39,316 |
| $ | 30,535 |
| $ | (443 | ) | $ | (790 | ) | $ | 4,182 |
| $ | 1,092 |
| $ | 73,892 |
|
|
|
|
|
|
|
|
|
| ||||||||||||||
|
|
|
|
|
|
|
|
|
|
|
|
|
|
|
|
|
|
|
|
|
|
|
Total assets |
| $ | 3,351,986 |
| $ | 2,512,200 |
| $ | 168,790 |
| $ | 48,619 |
| $ | 815,011 |
| $ | (840,627 | ) | $ | 6,055,979 |
|
|
|
|
|
|
|
|
|
|
|
|
|
|
|
|
|
|
|
|
|
|
|
|
Total interest income from affiliates |
| $ | 19,327 |
| $ | — |
| $ | — |
| $ | 49 |
| $ | — |
| $ | (19,376 | ) | $ | — |
|
|
|
|
|
|
|
|
|
|
|
|
|
|
|
|
|
|
|
|
|
|
|
|
Total interest income from external customers |
| $ | 160,448 |
| $ | 148,708 |
| $ | 9,583 |
| $ | 1,189 |
| $ | 25,769 |
| $ | — |
| $ | 345,697 |
|
HANCOCK HOLDING COMPANY AND SUBSIDIARIES
NOTES TO CONSOLIDATED FINANCIAL STATEMENTS
Note 21.16. Segment Reporting (continued)Year Ended
December 31, 2005
-------------------------------------------------------------------------------------
MS LA FL Other Eliminations Consolidated
--------------- ------------- ----------- ----------- ------------- ---------------
(In thousands)
Interest income $ 140,583 $ 109,248 $ 6,563 $ 17,037 $ (9,800) $ 263,631
Interest expense 45,392 33,184 1,796 3,902 (9,455) 74,819
--------------- ------------- ----------- ----------- ------------- ---------------
Net interest income 95,191 76,064 4,767 13,135 (345) 188,812
Provision for loan losses 24,744 14,836 494 2,561 - 42,635
Noninterest income 46,197 28,061 476 23,671 (135) 98,270
Depreciation and amortization 5,299 2,467 453 498 - 8,717
Other noninterest expense 73,725 56,065 4,349 28,819 (131) 162,827
--------------- ------------- ----------- ----------- ------------- ---------------
Income before income taxes
37,620 30,757 (53) 4,928 (349) 72,903
Income tax expense (benefit) 16,673 (191) 170 2,260 (41) 18,871
--------------- ------------- ----------- ----------- ------------- ---------------
Net income (loss) $ 20,947 $ 30,948 $ (223) $ 2,668 $ (308) $ 54,032
=============== ============= =========== =========== ============= ===============
Total assets $ 3,546,748 $ 2,138,894 $ 122,845 $ 697,548 $ (555,848) $ 5,950,187
Total interest income from affiliates $ 9,334 $ - $ 121 $ - $ (9,455) $ -
Total interest income from
external customers $ 131,249 $ 109,248 $ 6,442 $ 17,037 $ (345) $ 263,631
(Amortization) & accretion of securities $ (477) $ (1,228) $ (81) $ (61) $ - $ (1,847)
Year Ended
December 31, 2004
-------------------------------------------------------------------------------------
MS LA FL Other Eliminations Consolidated
------------ ------------ ----------- ----------- ------------ -------------
(In thousands)
Interest income $ 120,197 $ 91,148 $ 3,089 $ 17,189 $ (4,849) $ 226,774
Interest expense 37,953 20,385 922 2,581 (4,571) 57,270
------------ ------------ ----------- ----------- ------------ -------------
Net interest income 82,244 70,763 2,167 14,608 (278) 169,504
Provision for loan losses 5,564 6,429 928 3,616 - 16,537
Noninterest income 39,894 33,255 445 19,084 (2,397) 90,281
Depreciation and amortization 5,879 2,648 67 563 - 9,157
Other noninterest expense 67,370 51,348 3,047 24,157 (128) 145,794
------------ ------------ ----------- ----------- ------------ -------------
Income before income taxes 43,325 43,593 (1,430) 5,356 (2,547) 88,297
Income tax expense (benefit) 12,808 13,213 (547) 1,913 (794) 26,593
------------ ------------ ----------- ----------- ------------ -------------
Net income (loss) $ 30,517 $ 30,380 $ (883) $ 3,443 $ (1,753) $ 61,704
============ ============ =========== =========== ============ =============
Total assets $ 2,628,221 $ 1,895,832 $ 88,070 $ 703,844 $ (651,241) $ 4,664,726
Total interest income from affiliates $ 4,496 $ - $ 75 $ - $ (4,571) $ -
Total interest income from
external customers $ 115,701 $ 91,148 $ 3,014 $ 17,189 $ (278) $ 226,774
(Amortization) & accretion of securities $ (2,579) $ (2,795) $ (46) $ (44) $ - $ (5,464)
|
|
|
|
|
|
|
|
|
|
|
|
|
|
|
|
|
|
|
|
|
| Year Ended |
| ||||||||||||||||
|
|
| |||||||||||||||||
|
| MS |
| LA |
| FL |
| Other |
| Eliminations |
| Consolidated |
| ||||||
|
|
|
|
|
|
|
| ||||||||||||
|
| (In thousands) |
| ||||||||||||||||
Interest income |
| $ | 193,461 |
| $ | 136,814 |
| $ | 8,108 |
| $ | 20,270 |
| $ | (14,590 | ) | $ | 344,063 |
|
Interest expense |
|
| 72,154 |
|
| 52,833 |
|
| 2,934 |
|
| 6,103 |
|
| (14,161 | ) |
| 119,863 |
|
|
|
|
|
|
|
|
| ||||||||||||
Net interest income |
|
| 121,307 |
|
| 83,981 |
|
| 5,174 |
|
| 14,167 |
|
| (429 | ) |
| 224,200 |
|
Provision for (reversal of) loan losses |
|
| (19,811 | ) |
| (4,446 | ) |
| 834 |
|
| 2,661 |
|
| — |
|
| (20,762 | ) |
Noninterest income |
|
| 50,260 |
|
| 29,995 |
|
| 384 |
|
| 25,966 |
|
| (105 | ) |
| 106,500 |
|
Depreciation and amortization |
|
| 6,986 |
|
| 2,611 |
|
| 319 |
|
| 527 |
|
| — |
|
| 10,443 |
|
Other noninterest expense |
|
| 92,156 |
|
| 61,872 |
|
| 5,210 |
|
| 33,479 |
|
| (44 | ) |
| 192,673 |
|
|
|
|
|
|
|
|
| ||||||||||||
Income before income taxes |
|
| 92,236 |
|
| 53,939 |
|
| (805 | ) |
| 3,466 |
|
| (490 | ) |
| 148,346 |
|
Income tax expense (benefit) |
|
| 23,074 |
|
| 24,035 |
|
| (603 | ) |
| (796 | ) |
| 834 |
|
| 46,544 |
|
|
|
|
|
|
|
|
| ||||||||||||
Net income (loss) |
| $ | 69,162 |
| $ | 29,904 |
| $ | (202 | ) | $ | 4,262 |
| $ | (1,324 | ) | $ | 101,802 |
|
|
|
|
|
|
|
|
| ||||||||||||
|
|
|
|
|
|
|
|
|
|
|
|
|
|
|
|
|
|
|
|
Total assets |
| $ | 3,454,274 |
| $ | 2,365,422 |
| $ | 158,836 |
| $ | 807,912 |
| $ | (821,879 | ) | $ | 5,964,565 |
|
|
|
|
|
|
|
|
|
|
|
|
|
|
|
|
|
|
|
|
|
Total interest income from affiliates |
| $ | 13,895 |
| $ | 6 |
| $ | 260 |
| $ | — |
| $ | (14,161 | ) | $ | — |
|
|
|
|
|
|
|
|
|
|
|
|
|
|
|
|
|
|
|
|
|
Total interest income from external customers |
| $ | 179,566 |
| $ | 136,808 |
| $ | 7,848 |
| $ | 20,270 |
| $ | (429 | ) | $ | 344,063 |
|
HANCOCK HOLDING COMPANY AND SUBSIDIARIESNOTES TO CONSOLIDATED FINANCIAL STATEMENTS
The Company allocated administrative charges betweenamong its Louisiana, Florida, Alabama and Other segments and its Mississippi segment and the Parent Company. This allocation was based on an analysis of costs for 2006.2008. The administrative charges allocated to the Louisiana segment were $18.9 million in 2008, $18.0 million in 2007, and $11.8 million in 2006, $11.6 million in 2005, and $10.9 million in 2004.2006. The Florida segment received $210,000$0.3 million in allocated administrative charges in 20062008, $0.2 million in 2007, and $200,000$0.2 million in 2005.2006. The administrative charges allocated to the Alabama segment were $0.05 million in 2008 and $0 in 2007. The Other segmentssegment’s allocated charges were $708,760$1.2 million in 20062008, $1.0 million in 2007 and $150,000$0.7 million in 2005. No charges were allocated to the Florida or Other segments in 2004.2006. The aforementioned administrative charges were allocated from the Mississippi segment ($12.720.3 million in 2006, $11.62008, $19.2 million in 2005,2007, and $10.8$12.7 million in 2004)2006). Subsidiaries of the Mississippi segment were included in the cost allocation process beginning in 2004. Administrative charges allocated from the Parent Company were $315,000$0.1 million in 20062008, $0.1 million in 2007 and $300,000$0.3 million in 2005, $124,000 in 2004.2006.
Goodwill and other intangible assets assigned to the Mississippi segment totaled approximately $13.9$13.1 million, of which $12.1 million represented goodwill and $1.8 million represented core deposit intangibles at December 31, 2006. At December 31, 2005, goodwill and other intangible assets assigned to the Mississippi segment totaled approximately $15.9 million, of which $12.1 million represented goodwill and $2.2 million represented core deposit intangibles. The related core deposit amortization was approximately $409,000 in 2006, $518,000 in 2005, and $666,000 in 2004.
Goodwill and other intangible assets assigned to the Louisiana segment totaled approximately $38.0 million, of which $33.8 million represented goodwill and $4.2 million represented core deposit intangibles at December 31, 2006. Goodwill and other intangible assets assigned to the Louisiana segment totaled approximately $37.0 million, of which $32.0 million represented goodwill and $5.0 million represented core deposit intangibles, at December 31, 2005. The related core deposit amortization was approximately $815,000 in 2006, $977,000 in 2005, and $951,000 in 2004.
Goodwill and other intangible assets assigned to the Florida segment totaled approximately $12.1 million, of which $11.3 million represented goodwill and $0.8 million represented core deposit intangibles, at December 31, 2006. Goodwill and other intangible assets assigned to the Florida segment totaled approximately $12.3 million, of which $11.3 million represented goodwill and $1.0 million represented core deposit intangibles at December 31, 2005.2008. At December 31, 2007, goodwill and other intangible assets assigned to the Mississippi segment totaled approximately $13.5 million, of which $12.1 million represented goodwill and $1.4 million represented core deposit intangibles. The related core deposit amortization was approximately $142,000$0.4 million in 2006, $160,0002008, $0.4 million in 20052007, and $149,000$0.4 million in 2004.2006.
Goodwill and other intangible assets assigned to the Louisiana segment totaled approximately $36.7 million, of which $33.8 million represented goodwill and $2.9 million represented core deposit intangibles at December 31, 2008. Goodwill and other intangible assets assigned to the Louisiana segment totaled approximately $37.3 million, of which $33.8 million represented goodwill and $3.5 million represented core deposit intangibles at December 31, 2007. The related core deposit amortization was approximately $0.6 million in 2008, $0.7 million in 2007, and $0.8 million in 2006.
Goodwill and other intangible assets assigned to the Florida segment totaled approximately $11.9 million, of which $11.3 million represented goodwill and $0.6 million represented core deposit intangibles, at December 31, 2008. At December 31, 2007, goodwill and other intangible assets assigned to the Florida segment totaled approximately $12.0 million, of which $11.3 million represented goodwill and $0.7 million represented core deposit intangibles. The related core deposit amortization was approximately $0.1 million in 2008, $0.1 million in 2007 and $0.1 million in 2006.
HANCOCK HOLDING COMPANY AND SUBSIDIARIES
NOTES TO CONSOLIDATED FINANCIAL STATEMENTS
Note 16. Segment Reporting (continued)
Other intangible assets are also assigned to subsidiaries that are included in the “Other” category in the table above and totaled $7.7$6.7 million at December 31, 20062008 and $7.0$7.2 million at December 31, 2005. Those2007. At December 31, 2008, those intangibles consist of goodwill, $5.1 million; non-compete agreements, $189,000; value of insurance expirations, approximately $2.3$1.5 million; non-compete agreements, approximately $0.04 million and trade name of $70,000.$0.03 million.
On July 1, 2005, Hancock Insurance Agency acquired 100% of the stock of J. Everett Eaves, Inc., a well-known commercial insurance agency operating in the New Orleans, Louisiana market. During 2006, the The Company recorded reallocations of goodwill to other intangible assets to record the final purchase price of J. Everett Eaves, Inc. and the results of third-party studies which valued the intangible assets. The reallocation of intangibles and final purchase adjustments resulted in the recording of four separate categories of intangible assets: value of insurance expirations, $1.9 million; non-compete agreements, $0.1 million; trade name, $0.1 million and goodwill of $3.8 million. The value of insurance expirations, non-compete agreements and trade name assets are being amortized over 10, 5 and 5 year lives, respectively, on a straight line basis.
An intangibles valuation relating to the intangibles recorded in the acquisition of Ross King Walker, Inc. in late 2004 was completed during 2005. The reallocation of intangibles resulted in the recording of three separate categories of intangible assets: value of insurance expirations, $1.1 million; non-compete agreements, $0.2 million and goodwill of $1.3 million. The value of insurance expirations and non-compete agreement assets are being amortized over 10 year and 5 year lives, respectively, on an accelerated basis.
HANCOCK HOLDING COMPANY AND SUBSIDIARIESNOTES TO CONSOLIDATED FINANCIAL STATEMENTS
None of the segments recorded amortization of goodwill during 2006, 2005 and 2004 in accordance with SFAS No. 142 as discussed in Note 1. The segments performed a fair value based impairment test of goodwill and determined that the fair values of these reporting units exceeded their carrying values at December 2006, 20052008, 2007 and 2004.2006. No impairment loss, therefore, was recorded.
Note 22.17. Condensed Parent Company Information
The following condensed financial information reflects the accounts and transactions of Hancock Holding Company (parent company only) for the dates indicated (in thousands):
Condensed Balance SheetsDecember 31, --------------------------------- 2006 2005 --------------- ---------------Assets:Cash $ 6,669 $ 3,161 Investment in bank subsidiaries 537,890 461,375 Investment in non-bank subsidiaries 11,101 12,757 Due from subsidiaries and other assets 3,299 2,342 --------------- --------------- $ 558,959 $ 479,635 =============== ===============Liabilities and Stockholders' Equity:Due to subsidiaries $ 2 $ 2,194 Other liabilities 547 26 Stockholders' equity 558,410 477,415 --------------- --------------- $ 558,959 $ 479,635 =============== ===============Condensed Statements of IncomeYears Ended December 31, -------------------------------------------- 2006 2005 2004 ------------- ----------- -------------Operating IncomeFrom subsidiaries Dividends received from bank subsidiaries $ 19,416 $ 34,900 $ 45,506 Dividends received from non-bank subsidiaries 537 - 10,000 Equity in earnings of subsidiaries greater than dividends received 80,523 20,702 6,484 ------------- ----------- ------------- Total operating income 100,476 55,602 61,990 Other (expense) income (407) 512 (187) Income tax provision (benefit) (1,733) 2,082 99 ------------- ----------- -------------Net income$ 101,802 $ 54,032 $ 61,704 ============= =========== =============
|
|
|
|
|
|
|
|
|
| December 31, |
| ||||
|
|
| |||||
|
| 2008 |
| 2007 |
| ||
|
|
|
| ||||
Assets: |
|
|
|
|
|
|
|
Cash |
| $ | 4,053 |
| $ | 3,843 |
|
Investment in bank subsidiaries |
|
| 592,275 |
|
| 540,071 |
|
Investment in non-bank subsidiaries |
|
| 12,807 |
|
| 10,552 |
|
Due from subsidiaries and other assets |
|
| 1,115 |
|
| 1,616 |
|
|
|
|
| ||||
|
| $ | 610,250 |
| $ | 556,082 |
|
|
|
|
| ||||
|
|
|
|
|
|
|
|
Liabilities and Stockholders’ Equity: |
|
|
|
|
|
|
|
Due to subsidiaries |
| $ | 198 |
| $ | 1,281 |
|
Other liabilities |
|
| 553 |
|
| 614 |
|
Stockholders’ equity |
|
| 609,499 |
|
| 554,187 |
|
|
|
|
| ||||
|
| $ | 610,250 |
| $ | 556,082 |
|
|
|
|
| ||||
HANCOCK HOLDING COMPANY AND SUBSIDIARIES
NOTES TO CONSOLIDATED FINANCIAL STATEMENTS
Note 22.17. Condensed Parent Company Information (continued)
Condensed Statements of Income
|
|
|
|
|
|
|
|
|
|
|
|
| Years Ended December 31, |
| |||||||
|
|
| ||||||||
|
| 2008 |
| 2007 |
| 2006 |
| |||
|
|
|
|
| ||||||
Operating Income |
|
|
|
|
|
|
|
|
|
|
From subsidiaries |
|
|
|
|
|
|
|
|
|
|
Dividends received from bank subsidiaries |
| $ | 43,700 |
| $ | 90,400 |
| $ | 19,416 |
|
Dividends received from non-bank subsidiaries |
|
| — |
|
| — |
|
| 537 |
|
Equity in earnings of subsidiaries greater than (less than) dividends received |
|
| 21,646 |
|
| (18,214 | ) |
| 80,523 |
|
|
|
|
|
| ||||||
Total operating income |
|
| 65,346 |
|
| 72,186 |
|
| 100,476 |
|
Other (expense) income |
|
| (19 | ) |
| 1,473 |
|
| (407 | ) |
Income tax provision (benefit) |
|
| (39 | ) |
| (233 | ) |
| (1,733 | ) |
|
|
|
|
| ||||||
Net income |
| $ | 65,366 |
| $ | 73,892 |
| $ | 101,802 |
|
|
|
|
|
| ||||||
Condensed Statements of Cash FlowsYears Ended December 31,
------------------------------------------
2006 2005 2004
------------ ------------ ------------
Cash flows from operating activities - principally
dividends received from subsidiaries $ 26,567 $ 50,670 $ 60,411
------------ ------------ ------------
Cash flows from investing activities:
Business acquisitions - - (4,533)
Infusion of capital to subsidiary - (20,000) (15,949)
------------ ------------ ------------
Net cash used by investing activities - (20,000) (20,482)
------------ ------------ ------------
Cash flows from financing activities:
Repayments of short-term notes - - (9,400)
Dividends paid to stockholders (29,311) (23,416) (18,977)
Stock transactions, net 6,252 (7,876) (8,919)
------------ ------------ ------------
Net cash used by financing activities (23,059) (31,292) (37,296)
------------ ------------ ------------
Net increase (decrease) in cash 3,508 (622) 2,633
Cash, beginning of year 3,161 3,783 1,150
------------ ------------ ------------
Cash, end of year $ 6,669 $ 3,161 $ 3,783
============ ============ ============
Note 23. Summary of Quarterly Operating Results (Unaudited)2006 2005
---------------------------------------------- ----------------------------------------------
First Second Third Fourth First Second Third Fourth
---------- ---------- ---------- ---------- ----------- ---------- ----------- -----------
(In thousands, except per share data)
Interest income (te) $ 83,563 $ 88,375 $ 91,275 $ 89,366 $ 62,302 $ 65,767 $ 67,506 $ 75,433
Interest expense (25,273) (28,636) (31,988) (33,966) (16,289) (17,961) (19,659) (20,910)
---------- ---------- ---------- ---------- ----------- ---------- ----------- -----------
Net interest income (te) 58,290 59,739 59,287 55,400 46,013 47,806 47,847 54,523
(Provision for) reversal of loan
losses 705 - 20,000 57 (2,760) (1,891) (36,905) (1,079)
Noninterest income 25,008 25,942 25,737 27,148 22,433 24,680 33,858 17,298
Noninterest expense (49,165) (51,172) (50,336) (50,042) (41,642) (42,505) (42,770) (44,626)
Taxable equivalent adjustment (1,973) (1,972) (2,043) (2,263) (1,771) (1,740) (1,862) (2,004)
---------- ---------- ---------- ---------- ----------- ---------- ----------- -----------
Income before income taxes 32,865 32,537 52,645 30,300 22,273 26,350 168 24,112
Income tax (expense) benefit (10,854) (10,539) (16,614) (8,538) (6,835) (8,256) 1,267 (5,047)
---------- ---------- ---------- ---------- ----------- ---------- ----------- -----------
Net income $ 22,011 $ 21,998 $ 36,031 $ 21,762 $ 15,438 $ 18,094 $ 1,435 $ 19,065
========== ========== ========== ========== =========== ========== =========== ===========
Basic earnings per share $0.68 $0.68 $1.11 $0.67 $0.48 $0.56 $0.04 $0.59
Diluted earnings per share 0.67 0.66 1.08 0.65 0.47 0.55 0.04 0.58
Unaudited - see accompanying accountants' report.
|
|
|
|
|
|
|
|
|
|
|
|
| Years Ended December 31, |
| |||||||
|
|
| ||||||||
|
| 2008 |
| 2007 |
| 2006 |
| |||
|
|
|
|
| ||||||
Cash flows from operating activities - principally dividends received from subsidiaries |
| $ | 35,493 |
| $ | 93,886 |
| $ | 26,567 |
|
|
|
|
|
| ||||||
Cash flows from investing activities - principally contribution of capital to subsidiary |
|
| (20,500 | ) |
| (10,000 | ) |
| — |
|
|
|
|
|
| ||||||
Net cash used by investing activities |
|
| (20,500 | ) |
| (10,000 | ) |
| — |
|
|
|
|
|
| ||||||
Cash flows from financing activities: |
|
|
|
|
|
|
|
|
|
|
Dividends paid to stockholders |
|
| (30,453 | ) |
| (30,957 | ) |
| (29,311 | ) |
Stock transactions, net |
|
| 15,670 |
|
| (55,755 | ) |
| 6,252 |
|
|
|
|
|
| ||||||
Net cash used by financing activities |
|
| (14,783 | ) |
| (86,712 | ) |
| (23,059 | ) |
|
|
|
|
| ||||||
Net increase (decrease) in cash |
|
| 210 |
|
| (2,826 | ) |
| 3,508 |
|
Cash, beginning of year |
|
| 3,843 |
|
| 6,669 |
|
| 3,161 |
|
|
|
|
|
| ||||||
Cash, end of year |
| $ | 4,053 |
| $ | 3,843 |
| $ | 6,669 |
|
|
|
|
|
| ||||||
ITEM 9. CHANGES IN AND DISAGREEMENTS WITH ACCOUNTANTS ON ACCOUNTING AND FINANCIAL DISCLOSURENone
Effective as of January 1, 2009, the Board of Directors of Hancock Holding Company (“the Company”) has appointed PricewaterhouseCoopers, a firm of independent certified public accountants, as auditors for the fiscal year ending December 31, 2009, and until their successors are selected. The decision to change auditors was approved by the Audit Committee of the Company’s Board of Directors during its December, 2008 meeting.
The Company has been advised that neither the firm nor any of its partners has any direct or any material indirect financial interest in the securities of the Company or any of its subsidiaries, except as auditors and consultants on accounting procedures and tax matters.
Additionally, during the two fiscal years ended December 31, 2008 and 2007, there were no consultations between the Company and PricewaterhouseCoopers regarding: (i) the application of accounting principles to a specified transaction, either completed or proposed; or the type of audit opinion that might be rendered on the Company’s financial statements and either a written report was provided to the Company or oral advice was provided that the new accountant concluded was an important factor considered by the Company in reaching a decision as to the accounting, auditing, or financial reporting issue (ii) any matter that was the subject of a disagreement under Item 304(a)(1)(iv) of Regulation S-K, or a reportable event under Item 304(a)(1)(v) of Regulation S-K; or (iii) any other matter.
Although not required to do so, the Company’s Board of Directors has chosen to submit its appointment of PricewaterhouseCoopers for ratification by the Company’s shareholders. This matter is being submitted to the Company’s shareholders for ratification during the Company’s annual meeting to be held on March 26, 2009 as more fully described in the Company’s proxy statement to be filed with the Commission.
No Adverse Opinion or Disagreement
The audit reports of KPMG LLP on the consolidated financial statements of the Company as of and for the years ended December 31, 2008 and 2007 did not contain an adverse opinion or disclaimer of opinion, and were not qualified or modified as to uncertainity, audit scope or accounting principles, except as follows: KPMG LLP’s report on the consolidated financial statements of Hancock Holding Company as of and for the years ended December 31, 2008 and 2007, contained a separate paragraph stating that “As discussed in Note 1 to the consolidated financial statements, the Company changed its method of accounting for defined benefit pension postretirement benefit plans effective December 31, 2006”, and additionally as of and for the year ended December 31, 2007, contained a separate paragrph stating that “As discussed in Note 1 to the consolidated financial statements, the Company changed its method of accounting for share based payments and evaluating prior year misstatements effective January 1, 2006”. The audit reports of KPMG LLP on the effectiveness of internal control over financial reporting as of December 31, 2008 and 2007 did not contain an adverse opinion or disclaimer of opinion, and was not qualified or modified as to uncertainty, audit scope or accounting principles.
In connection with the audits of the two fiscal years ended December 31, 2008 and 2007 and the subsequent period and through the current period, there were no: (1) disagreements with KPMG LLP on any matter of accounting principles or practices, financial statement disclosure, or auditing scope or procedures, which disagreements, if not resolved to their satisfaction, would have caused them to make reference in connection with their opinion to the subject matter of the disagreement, or (2) reportable events.
ITEM 9A. CONTROLS AND PROCEDURES
Evaluation of Disclosure Controls and Procedures
As defined by the Securities and Exchange Commission in Exchange Act Rules 13a-14(c) and 15d-14(c), a company’s “disclosure controls and procedures” means controls and other procedures of an issuer that are designed to ensure that information required to be disclosed by the issuer in the reports that it files or submits under the Exchange Act is recorded, processed, summarized and reported, within the time periods specified in the Commission’s rules and forms.
As of December 31, 2006,2008, (the “Evaluation Date”), our Chief Executive Officers and Chief Financial Officer have evaluated the effectiveness of our disclosure controls and procedures as defined in the Exchange Act Rules. Based on their evaluation, our Chief Executive Officers and Chief Financial Officer have concluded Hancock’s disclosure controls and procedures are sufficiently effective to ensure that material information relating to us and required to be disclosed by us in the reports that we file or submit under the Exchange Act is recorded, processed, summarized and reported within the time periods specified in the Commission’s rules and forms.
Internal Control over Financial Reporting
The management of Hancock Holding Company has prepared the consolidated financial statements and other information in our Annual Report in accordance with accounting principles generally accepted in the United States of America and is responsible for its accuracy. The financial statements necessarily include amounts that are based on management’s best estimates and judgments.
In meeting its responsibility, management relies on internal accounting and related control systems. The internal control systems are designed to ensure that transactions are properly authorized and recorded in our financial records and to safeguard our assets from material loss or misuse. Such assurance cannot be absolute because of inherent limitations in any internal control system.
Management is responsible for establishing and maintaining the adequate internal control over financial reporting, as such term is defined in the Exchange Act Rules 13 —– 15(f). Under the supervision and with the participation of management, including our principal executive officers and principal financial officer, we conducted an evaluation of the effectiveness of internal control over financial reporting based on the framework inInternal Control —– Integrated Framework issued by the Committee of Sponsoring Organizations of the Treadway Commission. Management also conducted an assessment of requirements pertaining to Section 112 of the Federal Deposit Insurance Corporation Improvement Act (FDICIA). This section relates to management’s evaluation of internal control over financial reporting including controls over the preparation of the schedules equivalent to the basic financial statements and compliance with laws and regulations. Our evaluation included a review of the documentation of controls, evaluations of the design of the internal control system and tests of the effectiveness of internal controls.
Based on our evaluation under the framework inInternal Control —– Integrated Framework, management concluded that internal control over financial reporting was effective as of December 31, 2006. Management’s2008. KPMG, under Auditing Standard No. 5, does not express an opinion on management’s assessment as occurred under Auditing Standard No. 2. Under Auditing Standard No. 5 management is responsible for maintaining effective internal control over financial reporting and for its assessment of the effectiveness of internal control over financial reporting. KPMG’s responsibility is to express an opinion on the effectiveness of the Company’s internal control over financial reporting as of December 31, 2006 has been audited by KPMG, LLP, an independent registered public accounting firm, as stated inbased on their report which is incorporated herein by reference.audit.
None
ITEM 10. DIRECTORS, EXECUTIVE OFFICERS AND CORPORATE GOVERNANCE
Pursuant to General Instruction G (3), information on directors and executive officers of the Registrant will be incorporated by reference from the Company’s Definitive Proxy Statement for the annual meeting to be held on March 29, 2007.26, 2009.
ITEM 11. EXECUTIVE COMPENSATION
Pursuant to General Instructions G (3), information on executive compensation will be incorporated by reference from the Company’s Definitive Proxy Statement for the annual meeting to be held on March 29, 2007.26, 2009.
ITEM 12. SECURITY OWNERSHIP OF CERTAIN BENEFICIAL OWNERS AND MANAGEMENT AND RELATED STOCKHOLDER MATTERS
Pursuant to General Instructions G (3), information on security ownership of certain beneficial owners and management will be incorporated by reference from the Company’s Definitive Proxy Statement for the annual meeting to be held on March 29, 2007.26, 2009.
Number of securities to be Weighted-average exercise Number of securities remaining available issued upon exercise of price of outstanding for future issuance under equity outstanding options, options, warrants and compensation plans (excluding securities Plan Category warrants and rights rights reflected in column (a)) (a) (b) (c)- --------------------------------------------------------------------------------------------------------------------------------- Equity Compensation plans approved by security holders 1,698,948 $ 24.06 4,996,975 - --------------------------------------------------------------------------------------------------------------------------------- Equity Compensation plans not approved by security holders - - - - --------------------------------------------------------------------------------------------------------------------------------- Total 1,698,948 $ 24.06 4,996,975
ITEM 13. CERTAIN RELATIONSHIPS AND RELATED TRANSACTIONS, AND DIRECTOR INDEPENDENCE
Pursuant to General Instructions G (3), information on certain relationships and related transactions will be incorporated by reference from the Company’s Definitive Proxy Statement for the annual meeting to be held on March 29, 2007.26, 2009.
ITEM 14. PRINCIPAL ACCOUNTANT FEES AND SERVICES
Pursuant to General Instructions G (3), information on principal accountant fees and services will be incorporated by reference from the Company’s Definitive Proxy Statement for the annual meeting to be held on March 29, 2007.26, 2009.
ITEM 15. EXHIBITS, FINANCIAL STATEMENT SCHEDULES
(a) The following documents are filed as part of this report:
1. The following consolidated financial statements of Hancock Holding Company and subsidiaries are filed as part of
this report under Item 8 - Financial Statements and Supplementary Data:
Consolidated balance sheets - December 31, 2006 and 2005
Consolidated statements of income - Years ended December 31, 2006, 2005, and 2004
Consolidated statements of stockholders' equity - Years ended December 31, 2006, 2005, and 2004
Consolidated statements of cash flows -Years ended December 31, 2006, 2005, and 2004
Notes to consolidated financial statements - December 31, 2006 (pages 58 to 100)
2. Financial schedules required to be filed by Item 8 of this form, and by Item 15(d) below:
The schedules to the consolidated financial statements set forth by Article 9 of Regulation S-X are not required
under the related instructions or are inapplicable and therefore have been omitted.
3. Exhibits required to be filed by Item 601 of Regulation S-K, and by Item 15(b) below.
(b) Exhibits:
All other financial statements and schedules are omitted as the required information is inapplicable or the required
information is presented in the consolidated financial statements or related notes.
(a) 3. Exhibits:Exhibit
Number Description
2.1 Agreement and Plan of Merger between Hancock Holding Company and Lamar Capital Corporation dated February 21,
2001 (Appendix C to the Prospectus contained in the S-4 Registration Statement 333-60280 filed on May 4, 2001
and incorporated by reference herein).
3.1 Amended and Restated Articles of Incorporation dated November 8, 1990 (filed as Exhibit 3.1 to the Registrant's
Form 10-K for the year ended December 31, 1990 and incorporated herein by reference).
3.2 Amended and Restated Bylaws dated November 8, 1990 (filed as Exhibit 3.2 to the Registrant's Form 10-K for the
year ended December 31, 1990 and incorporated herein by reference).
3.3 Articles of Amendment to the Articles of Incorporation of Hancock Holding Company, dated October 16, 1991 (filed
as Exhibit 4.1 to the Registrant's Form 10-Q for the quarter ended September 30, 1991).
3.4 Articles of Correction, filed with Mississippi Secretary of State on November 15, 1991 (filed as Exhibit 4.2 to
the Registrant's Form 10-Q for the quarter ended September 30, 1991).
3.5 Articles of Amendment to the Articles of Incorporation of Hancock Holding Company, adopted February 13, 1992
(filed as Exhibit 3.5 to the Registrant's Form 10-K for the year ended December 31, 1992 and incorporated herein
by reference).
3.6 Articles of Correction, filed with Mississippi Secretary of State on March 2, 1992 (filed as Exhibit 3.6 to the
Registrant's Form 10-K for the year ended December 31, 1992 and incorporated herein by reference).
3.7 Articles of Amendment to the Articles of Incorporation adopted February 20, 1997 (filed as Exhibit 3.7 to the
Registrant's Form 10-K for the year ended December 31, 1996 and incorporated herein by reference).
(a) | The following documents are filed as part of this report: | ||
1. | The following consolidated financial statements of Hancock Holding Company and subsidiaries are filed as part of this report under Item 8 – Financial Statements and Supplementary Data: | ||
Consolidated balance sheets – December 31, 2008 and 2007 | |||
Consolidated statements of income – Years ended December 31, 2008, 2007, and 2006 | |||
Consolidated statements of stockholders’ equity – Years ended December 31, 2008, 2007, and 2006 | |||
Consolidated statements of cash flows –Years ended December 31, 2008, 2007, and 2006 | |||
Notes to consolidated financial statements – December 31, 2008 (pages 57 to 92) | |||
2. | Financial schedules required to be filed by Item 8 of this form, and by Item 15(d) below: | ||
The schedules to the consolidated financial statements set forth by Article 9 of Regulation S-X are not required under the related instructions or are inapplicable and therefore have been omitted. | |||
3. | Exhibits required to be filed by Item 601 of Regulation S-K, and by Item 15(b) below. | ||
(b) | Exhibits: | ||
All other financial statements and schedules are omitted as the required information is inapplicable or the required information is presented in the consolidated financial statements or related notes. | |||
(a) 3. Exhibits: | |||
4.1 Specimen stock certificate (reflecting change in par value from $10.00 to $3.33, effective March 6, 1989) (filed as Exhibit 4.1 to the Registrant's Form 10-Q for the quarter ended March 31, 1989 and incorporated herein by reference). 4.2 By executing this Form 10-K, the Registrant hereby agrees to deliver to the Commission upon request copies of instruments defining the rights of holders of long-term debt of the Registrant or its consolidated subsidiaries or its unconsolidated subsidiaries for which financial statements are required to be filed, where the total amount of such securities authorized there under does not exceed 10 percent of the total assets of the Registrant and its subsidiaries on a consolidated basis. *10.1 1996 Long Term Incentive Plan (filed as Exhibit 10.1 to the Registrant's Form 10-K for the year ended December 31, 1995, and incorporated herein by reference). *10.2 Description of Hancock Bank Executive Supplemental Reimbursement Plan, as amended (filed as Exhibit 10.2 to the Registrant's Form 10-K for the year ended December 31, 1996, and incorporated herein by reference). *10.3 Description of Hancock Bank Automobile Plan (filed as Exhibit 10.3 to the Registrant's Form 10-K for the year ended December 31, 1996, and incorporated herein by reference). *10.4 Description of Deferred Compensation Arrangement for Directors (filed as Exhibit 10.4 to the Registrant's Form 10-K for the year ended December 31, 1996, and incorporated herein by reference). *10.5 Hancock Holding Company 2005 Long-Term Incentive Plan, filed as Appendix "A" to the Company's Definitive Proxy Statement filed with the Commission on February 28, 2005 and incorporated herein by reference. *10.6 Hancock Holding Company Nonqualified Deferred Compensation Plan, filed as Exhibit 99.1 to the Company's Current Report on Form 8-K filed with the Commission on December 21, 2005 and incorporated herein by reference. 10.7 Shareholder Rights Agreement dated as of February 21, 1997, between Hancock Holding Company and Hancock Bank, as Rights Agent as extended by the Company. 21 Subsidiaries of Hancock Holding Company. 22 Proxy Statement for the Registrant's Annual Meeting of Shareholders on March 29, 2007 (deemed "filed" for the purposes of this Form 10-K only for those portions which are specifically incorporated herein by reference). 23 Consent of KPMG, LLP. 31.1 Certification of Chief Executive Officers pursuant to Rule 13a-14(a) and Rule 15d-14(a) of the Securities Exchange Act, as amended. 31.2 Certification of Chief Financial Officer pursuant to Rule 13a-14(a) and Rule 15d-14(a) of the Securities Exchange Act, as amended. 32 Certification of Chief Executive Officers and Chief Financial Officer Pursuant to 18 U.S.C. 1350, as adopted pursuant to Section 906 of the Sarbanes-Oxley Act of 2002. - --------------------------------------------------------------------------------------------------------------------------------- * Compensatory plan or arrangement.
Exhibit | Description | ||
2.1 | Agreement and Plan of Merger between Hancock Holding Company and Lamar Capital Corporation dated February 21, 2001 (Appendix C to the Prospectus contained in the S-4 Registration Statement 333-60280 filed on May 4, 2001 and incorporated by reference herein). | ||
3.1 | Amended and Restated Articles of Incorporation dated November 8, 1990 (filed as Exhibit 3.1 to the Registrant’s Form 10-K for the year ended December 31, 1990 and incorporated herein by reference). | ||
3.2 | Amended and Restated Bylaws dated November 8, 1990 (filed as Exhibit 3.2 to the Registrant’s Form 10-K for the year ended December 31, 1990 and incorporated herein by reference). | ||
3.3 | Articles of Amendment to the Articles of Incorporation of Hancock Holding Company, dated October 16, 1991 (filed as Exhibit 4.1 to the Registrant’s Form 10-Q for the quarter ended September 30, 1991). | ||
3.4 | Articles of Correction, filed with Mississippi Secretary of State on November 15, 1991 (filed as Exhibit 4.2 to the Registrant’s Form 10-Q for the quarter ended September 30, 1991). | ||
3.5 | Articles of Amendment to the Articles of Incorporation of Hancock Holding Company, adopted February 13, 1992 (filed as Exhibit 3.5 to the Registrant’s Form 10-K for the year ended December 31, 1992 and incorporated herein by reference). | ||
3.6 | Articles of Correction, filed with Mississippi Secretary of State on March 2, 1992 (filed as Exhibit 3.6 to the Registrant’s Form 10-K for the year ended December 31, 1992 and incorporated herein by reference). | ||
3.7 | Articles of Amendment to the Articles of Incorporation adopted February 20, 1997 (filed as Exhibit 3.7 to the Registrant’s Form 10-K for the year ended December 31, 1996 and incorporated herein by reference). | ||
3.8 | Articles of Amendment to the Articles of Incorporation adopted March 29, 2007. | ||
4.1 | Specimen stock certificate (reflecting change in par value from $10.00 to $3.33, effective March 6, 1989) (filed as Exhibit 4.1 to the Registrant’s Form 10-Q for the quarter ended March 31, 1989 and incorporated herein by reference). | ||
4.2 | By executing this Form 10-K, the Registrant hereby agrees to deliver to the Commission upon request copies of instruments defining the rights of holders of long-term debt of the Registrant or its consolidated subsidiaries or its unconsolidated subsidiaries for which financial statements are required to be filed, where the total amount of such securities authorized there under does not exceed 10 percent of the total assets of the Registrant and its subsidiaries on a consolidated basis. | ||
*10.1 | 1996 Long Term Incentive Plan (filed as Exhibit 10.1 to the Registrant’s Form 10-K for the year ended December 31, 1995, and incorporated herein by reference). | ||
*10.2 | Description of Hancock Bank Executive Supplemental Reimbursement Plan, as amended (filed as Exhibit 10.2 to the Registrant’s Form 10-K for the year ended December 31, 1996, and incorporated herein by reference). | ||
*10.3 | Description of Hancock Bank Automobile Plan (filed as Exhibit 10.3 to the Registrant’s Form 10-K for the year ended December 31, 1996, and incorporated herein by reference). | ||
*10.4 | Description of Deferred Compensation Arrangement for Directors (filed as Exhibit 10.4 to the Registrant’s Form 10-K for the year ended December 31, 1996, and incorporated herein by reference). | ||
*10.5 | Hancock Holding Company 2005 Long-Term Incentive Plan, filed as Appendix “A” to the Company’s Definitive Proxy Statement filed with the Commission on February 28, 2005 and incorporated herein by reference. | ||
*10.6 | Hancock Holding Company Nonqualified Deferred Compensation Plan, filed as Exhibit 99.1 to the Company’s Current Report on Form 8-K filed with the Commission on December 21, 2005 and incorporated herein by reference. | ||
10.7 | Shareholder Rights Agreement dated as of February 21, 1997, between Hancock Holding Company and Hancock Bank, as Rights Agent as extended by the Company. |
21 | Subsidiaries of Hancock Holding Company. | ||
22 | Proxy Statement for the Registrant’s Annual Meeting of Shareholders on March 26, 2009 (deemed “filed” for the purposes of this Form 10-K only for those portions which are specifically incorporated herein by reference). | ||
23 | Consent of KPMG LLP. | ||
31.1 | Certification of Chief Executive Officers pursuant to Rule 13a-14(a) and Rule 15d-14(a) of the Securities Exchange Act, as amended. | ||
31.2 | Certification of Chief Financial Officer pursuant to Rule 13a-14(a) and Rule 15d-14(a) of the Securities Exchange Act, as amended. | ||
32.1 | Certification of Chief Executive Officers Pursuant to 18 U.S.C. 1350, as adopted pursuant to Section 906 of the Sarbanes-Oxley Act of 2002. | ||
32.2 | Certification of Chief Financial Officer Pursuant to 18 U.S.C. 1350, as adopted pursuant to Section 906 of the Sarbanes-Oxley Act of 2002. | ||
* Compensatory plan or arrangement. | |||
SIGNATURES
Pursuant to the requirements of Section 13 or 15(d) of the Securities Exchange Act of 1934, the Registrant has duly caused this report to be signed on its behalf by the undersigned, thereunto duly authorized.HANCOCK HOLDING COMPANY
----------------------------------------------------
Registrant
February 23, 2007 By: /s/ Carl J. Chaney
- ------------------- ----------------------------------
Date Carl J. Chaney
Chief Executive Officer &
Chief Financial Officer
Director
February 23, 2007 By: /s/ John M. Hairston
- ------------------- ----------------------------------
Date John M. Hairston
Chief Executive Officer &
Chief Operating Officer
HANCOCK HOLDING COMPANY | ||
Registrant |
February 27, 2009 | By: | /s/ Carl J. Chaney | ||
Date | Carl J. Chaney | |||
President & Chief Executive Officer | ||||
Director | ||||
February 27, 2009 | By: | /s/ John M. Hairston | ||
Date | John M. Hairston | |||
Chief Executive Officer & Chief Operating Officer | ||||
Director | ||||
February 27, 2009 | By: | /s/ Michael M. Achary | ||
Date | Michael M. Achary | |||
Chief Financial Officer | ||||
Pursuant to the requirements of the Securities Exchange Act of 1934, this report has been signed below by the following persons on behalf of the Registrant and in the capacities and on the dates indicated.
President, February 23, 2007
- ------------------------------ Director
Leo W. Seal, Jr.
Chairman of the Board, February 23, 2007
- ------------------------------ Director
George A Schloegel
Director February 23, 2007
- ------------------------------
Alton G. Bankston
/s/ Frank E. Bertucci Director February 23, 2007
- ------------------------------
Frank E. Bertucci
/s/ Joseph F. Boardman, Jr. Director February 23, 2007
- ------------------------------
Joseph F. Boardman, Jr.
/s/ Don P. Descant Director February 23, 2007
- ------------------------------
Don P. Descant
/s/ James B. Estabrook, Jr. Director February 23, 2007
- ------------------------------
James B. Estabrook, Jr.
Director February 23, 2007
- ------------------------------
James H. Horne
/s/ George A. Schloegel | Chairman of the Board, | February 27, 2009 | |
Director | |||
George A Schloegel | |||
/s/ Alton G. Bankston | Director | February 27, 2009 | |
Alton G. Bankston | |||
/s/ Frank E. Bertucci | Director | February 27, 2009 | |
Frank E. Bertucci | |||
/s/ Don P. Descant | Director | February 27, 2009 | |
Don P. Descant | |||
/s/ James B. Estabrook, Jr. | Director | February 27, 2009 | |
James B. Estabrook, Jr. | |||
/s/ James H. Horne | Director | February 27, 2009 | |
James H. Horne | |||
/s/ John H. Pace | Director | February 27, 2009 | |
John H. Pace |
(signatures(signatures continued)
/s/ Charles H. Johnson Director February 23, 2007 - ------------------------------- Charles H. Johnson Director February 23, 2007 - ------------------------------- John H. Pace /s/ Christine L. Pickering Director February 23, 2007 - ------------------------------- Christine L. Pickering Director February 23, 2007 - ------------------------------- Robert W. Roseberry Director February 23, 2007 - ------------------------------- Anthony J. Topazi
/s/ Christine L. Pickering | Director | February 27, 2009 | |
Christine L. Pickering | |||
/s/ Robert W. Roseberry | Director | February 27, 2009 | |
Robert W. Roseberry | |||
/s/ Anthony J. Topazi | Director | February 27, 2009 | |
Anthony J. Topazi |
EXHIBIT INDEX
Exhibit Number Description2.1 Agreement and Plan of Merger between Hancock Holding Company and Lamar Capital Corporation dated February 21, 2001 (Appendix C to the Prospectus contained in the S-4 Registration Statement 333-60280 filed on May 4, 2001 and incorporated by reference herein). 3.1 Amended and Restated Articles of Incorporation dated November 8, 1990 (filed as Exhibit 3.1 to the Registrant's Form 10-K for the year ended December 31, 1990 and incorporated herein by reference). 3.2 Amended and Restated Bylaws dated November 8, 1990 (filed as Exhibit 3.2 to the Registrant's Form 10-K for the year ended December 31, 1990 and incorporated herein by reference). 3.3 Articles of Amendment to the Articles of Incorporation of Hancock Holding Company, dated October 16, 1991 (filed as Exhibit 4.1 to the Registrant's Form 10-Q for the quarter ended September 30, 1991). 3.4 Articles of Correction, filed with Mississippi Secretary of State on November 15, 1991 (filed as Exhibit 4.2 to the Registrant's Form 10-Q for the quarter ended September 30, 1991). 3.5 Articles of Amendment to the Articles of Incorporation of Hancock Holding Company, adopted February 13, 1992 (filed as Exhibit 3.5 to the Registrant's Form 10-K for the year ended December 31, 1992 and incorporated herein by reference). 3.6 Articles of Correction, filed with Mississippi Secretary of State on March 2, 1992 (filed as Exhibit 3.6 to the Registrant's Form 10-K for the year ended December 31, 1992 and incorporated herein by reference). 3.7 Articles of Amendment to the Articles of Incorporation adopted February 20, 1997 (filed as Exhibit 3.7 to the Registrant's Form 10-K for the year ended December 31, 1996 and incorporated herein by reference). 4.1 Specimen stock certificate (reflecting change in par value from $10.00 to $3.33, effective March 6, 1989) (filed as Exhibit 4.1 to the Registrant's Form 10-Q for the quarter ended March 31, 1989 and incorporated herein by reference). 4.2 By executing this Form 10-K, the Registrant hereby agrees to deliver to the Commission upon request copies of instruments defining the rights of holders of long-term debt of the Registrant or its consolidated subsidiaries or its unconsolidated subsidiaries for which financial statements are required to be filed, where the total amount of such securities authorized there under does not exceed 10 percent of the total assets of the Registrant and its subsidiaries on a consolidated basis. *10.1 1996 Long Term Incentive Plan (filed as Exhibit 10.1 to the Registrant's Form 10-K for the year ended December 31, 1995, and incorporated herein by reference). *10.2 Description of Hancock Bank Executive Supplemental Reimbursement Plan, as amended (filed as Exhibit 10.2 to the Registrant's Form 10-K for the year ended December 31, 1996, and incorporated herein by reference). *10.3 Description of Hancock Bank Automobile Plan (filed as Exhibit 10.3 to the Registrant's Form 10-K for the year ended December 31, 1996, and incorporated herein by reference). *10.4 Description of Deferred Compensation Arrangement for Directors (filed as Exhibit 10.4 to the Registrant's Form 10-K for the year ended December 31, 1996, and incorporated herein by reference). *10.5 Hancock Holding Company 2005 Long-Term Incentive Plan, filed as Appendix "A" to the Company's Definitive Proxy Statement filed with the Commission on February 28, 2005 and incorporated herein by reference.
Exhibit | Description | ||
2.1 | Agreement and Plan of Merger between Hancock Holding Company and Lamar Capital Corporation dated February 21, 2001 (Appendix C to the Prospectus contained in the S-4 Registration Statement 333-60280 filed on May 4, 2001 and incorporated by reference herein). | ||
3.1 | Amended and Restated Articles of Incorporation dated November 8, 1990 (filed as Exhibit 3.1 to the Registrant’s Form 10-K for the year ended December 31, 1990 and incorporated herein by reference). | ||
3.2 | Amended and Restated Bylaws dated November 8, 1990 (filed as Exhibit 3.2 to the Registrant’s Form 10-K for the year ended December 31, 1990 and incorporated herein by reference). | ||
3.3 | Articles of Amendment to the Articles of Incorporation of Hancock Holding Company, dated October 16, 1991 (filed as Exhibit 4.1 to the Registrant’s Form 10-Q for the quarter ended September 30, 1991). | ||
3.4 | Articles of Correction, filed with Mississippi Secretary of State on November 15, 1991 (filed as Exhibit 4.2 to the Registrant’s Form 10-Q for the quarter ended September 30, 1991). | ||
3.5 | Articles of Amendment to the Articles of Incorporation of Hancock Holding Company, adopted February 13, 1992 (filed as Exhibit 3.5 to the Registrant’s Form 10-K for the year ended December 31, 1992 and incorporated herein by reference). | ||
3.6 | Articles of Correction, filed with Mississippi Secretary of State on March 2, 1992 (filed as Exhibit 3.6 to the Registrant’s Form 10-K for the year ended December 31, 1992 and incorporated herein by reference). | ||
3.7 | Articles of Amendment to the Articles of Incorporation adopted February 20, 1997 (filed as Exhibit 3.7 to the Registrant’s Form 10-K for the year ended December 31, 1996 and incorporated herein by reference). | ||
Articles of Amendment to the Articles of Incorporation adopted March 29, 2007. | |||
4.1 | Specimen stock certificate (reflecting change in par value from $10.00 to $3.33, effective March 6, 1989) (filed as Exhibit 4.1 to the Registrant’s Form 10-Q for the quarter ended March 31, 1989 and incorporated herein by reference). | ||
4.2 | By executing this Form 10-K, the Registrant hereby agrees to deliver to the Commission upon request copies of instruments defining the rights of holders of long-term debt of the Registrant or its consolidated subsidiaries or its unconsolidated subsidiaries for which financial statements are required to be filed, where the total amount of such securities authorized there under does not exceed 10 percent of the total assets of the Registrant and its subsidiaries on a consolidated basis. | ||
*10.1 | 1996 Long Term Incentive Plan (filed as Exhibit 10.1 to the Registrant’s Form 10-K for the year ended December 31, 1995, and incorporated herein by reference). | ||
*10.2 | Description of Hancock Bank Executive Supplemental Reimbursement Plan, as amended (filed as Exhibit 10.2 to the Registrant’s Form 10-K for the year ended December 31, 1996, and incorporated herein by reference). | ||
*10.3 | Description of Hancock Bank Automobile Plan (filed as Exhibit 10.3 to the Registrant’s Form 10-K for the year ended December 31, 1996, and incorporated herein by reference). | ||
*10.4 | Description of Deferred Compensation Arrangement for Directors (filed as Exhibit 10.4 to the Registrant’s Form 10-K for the year ended December 31, 1996, and incorporated herein by reference). | ||
*10.6 Hancock Holding Company Nonqualified Deferred Compensation Plan, filed as Exhibit 99.1 to the Company's Current Report on Form 8-K filed with the Commission on December 21, 2005 and incorporated herein by reference. 10.7 Shareholder Rights Agreement dated as of February 21, 1997, between Hancock Holding Company and Hancock Bank, as Rights Agent as extended by the Company. 21 Subsidiaries of Hancock Holding Company. 22 Proxy Statement for the Registrant's Annual Meeting of Shareholders on March 29, 2007 (deemed "filed" for the purposes of this Form 10-K only for those portions which are specifically incorporated herein by reference). 23 Consent of KPMG, LLP. 31.1 Certification of Chief Executive Officers pursuant to Rule 13a-14(a) and Rule 15d-14(a) of the Securities Exchange Act, as amended. 31.2 Certification of Chief Financial Officer pursuant to Rule 13a-14(a) and Rule 15d-14(a) of the Securities Exchange Act, as amended. 32 Certification of Chief Executive Officers and Chief Financial Officer Pursuant to 18 U.S.C. 1350, as adopted pursuant to Section 906 of the Sarbanes-Oxley Act of 2002. - --------------------------------------------------------------------------------------------------------------------------------- * Compensatory plan or arrangement.
*10.5 | Hancock Holding Company 2005 Long-Term Incentive Plan, filed as Appendix “A” to the Company’s Definitive Proxy Statement filed with the Commission on February 28, 2005 and incorporated herein by reference. | ||
*10.6 | Hancock Holding Company Nonqualified Deferred Compensation Plan, filed as Exhibit 99.1 to the Company’s Current Report on Form 8-K filed with the Commission on December 21, 2005 and incorporated herein by reference. | ||
10.7 | Shareholder Rights Agreement dated as of February 21, 1997, between Hancock Holding Company and Hancock Bank, as Rights Agent as extended by the Company. | ||
22 | Proxy Statement for the Registrant’s Annual Meeting of Shareholders on March 26, 2009 (deemed “filed” for the purposes of this Form 10-K only for those portions which are specifically incorporated herein by reference). | ||
* Compensatory plan or arrangement. | |||