FORM 10-K
UNITED STATES SECURITIES AND EXCHANGE COMMISSION
Washington, D.C. 20549
(Mark One)
|
| |
| R | ANNUAL REPORT PURSUANT TO SECTION 13 OR 15(d) OF THE SECURITIES EXCHANGE ACT OF 1934 |
For the fiscal year ended December 31, 20102011
OR
|
| |
| o | TRANSITION REPORT PURSUANT TO SECTION 13 OR 15(d) OF THE SECURITIES EXCHANGE ACT OF 1934 |
| | For the transition period from _______________ to _______________ |
Commission file number 1-13175
VALERO ENERGY CORPORATION
(Exact name of registrant as specified in its charter)
|
| |
| Delaware | 74-1828067 |
| (State or other jurisdiction of | (I.R.S. Employer |
| incorporation or organization) | Identification No.) |
|
| | | |
| One Valero Way | 78249 |
| San Antonio, Texas | (Zip Code) |
| (Address of principal executive offices) | | |
| | Registrant’s telephone number, including area code: (210) 345-2000 | |
Securities registered pursuant to Section 12(b) of the Act: Common stock, $0.01 par value per share listed on the New York Stock Exchange.
Securities registered pursuant to Section 12(g) of the Act: None.
Indicate by check mark if the registrant is a well-known seasoned issuer, as defined in Rule 405 of the Securities Act.
Yes R No o
Indicate by check mark if the registrant is not required to file reports pursuant to Section 13 or Section 15(d) of the Act.
Yes R No o
Indicate by check mark whether the registrant (1) has filed all reports required to be filed by Section 13 or 15(d) of the Securities Exchange Act of 1934 during the preceding 12 months (or for such shorter period that the registrant was required to file such reports), and (2) has been subject to such filing requirements for the past 90 days. Yes RNo o
Indicate by check mark whether the registrant has submitted electronically and posted on its corporate Web site, if any, every Interactive Data File required to be submitted and posted pursuant to Rule 405 of Regulation S-T (§232.405 of this chapter) during the preceding 12 months (or for such shorter period that the registrant was required to submit and post such files). Yes R No o
Indicate by check mark if disclosure of d elinquentdelinquent filers pursuant to Item 405 of Regulation S-K (§229.405 of this chapter) is not contained herein, and will not be contained, to the best of registrant’s knowledge, in definitive proxy or information statements incorporated by reference in Part III of this Form 10-K or any amendment to this Form 10-K. [X]
Indicate by check mark whether the registrant is a large accelerated filer, an accelerated filer, a non-accelerated filer, or a smaller reporting company. See the definitions of “large accelerated filer,” “accelerated filer,” and “smaller reporting company” in Rule12b-2 of the Exchange Act.
|
| | | |
Large accelerated filer R | Accelerated filer o | Non-accelerated filer o | Smaller reporting company o |
Indicate by check mark whether the registrant is a shell company (as defined in Rule 12b-2 of the Exchange Act). Yes o No R
The aggregate market value of the voting and non-voting common stock held by non-affiliates was approximately $10.2$14.6 billion based on the last sales price quoted as of June 30, 20102011 on the N ewNew York Stock Exchange, the last business day of the registrant’s most recently completed second fiscal quarter.
As of January 31, 20112012, 568,971,156555,069,442 shares of the registrant’s common stock were outstanding.
DOCUMENTS INCORPORATED BY REFERENCE
We intend to file with the Securities and Ex changeExchange Commission a definitive Proxy Statement for our Annual Meeting of Stockholders scheduled for April 28, 2011,May 3, 2012, at which directors will be elected. Portions of the 20112012 Proxy Statement are incorporated by reference in Part III of this Form 10-K and are deemed to be a part of this report.
CROSS-REFERENCE SHEET
The following table indicates the headings in the 20112012 Proxy Statement where certain information required in Part III of this Form 10-K may be found.
|
| | | |
| Form 10-K Item No. and Caption | | Heading in 20112012 Proxy Statement |
| | | |
| 10. | Directors, Executive Officers and Corporate Governance | | Information Regarding the Board of Directors, Independent D irectors,Directors, Audit Committee, Proposal No. 1 Election of Directors, Information Concerning Nominees and Other Directors, Identification of Executive Officers, Section 16(a) Beneficial Ownership Reporting Compliance, and Governance Documents and Codes of Ethics |
| | | | |
| 11. | Executive Compensation | | Compensation Committee, Compensation Discussion and Analysis, Director Compensation, Executive Compensation, and Certain Relationships and Related Transactions |
| | | | |
| 12. | Security Ownership of Certain Beneficial Owners and Management and Related Stockholder Matters | | Beneficial Ownership of Valero Securities and Equity Compensation Plan Information |
| | | | |
| 13. | Certain Relationships and Related Transactions, and Director Independence | | Certain Relationships and Related Transactions and Independent Directors |
| | | | |
| 14. | Principal Accountant Fees and Services | | KPMG Fees for Fiscal Year 2010,2011, KPMG Fees for Fiscal Year 2009,2010, and Audit Committee Pre-Approval Policy |
Copies of all documents incorpo ratedincorporated by reference, other than exhibits to such documents, will be provided without charge to each person who receives a copy of this Form 10-K upon written request to Jay D. Browning, Senior Vice President – Corporate Law and Secretary, Valero Energy Corporation, P.O. Box 696000, San Antonio, Texas 78269-6000.
CONTENTS
|
| | |
| | | PAGE |
| | |
| | |
| | |
| | | |
| | | |
| | | |
| | | |
| | |
| | |
| | |
| | | |
| | |
| | |
| | |
| | |
| | |
| | |
| | |
| | |
| | |
| | | |
| | |
| | |
| Item 11. | Executive Compensation | |
| Item 12. | Security Ownership of Certain Beneficial Owners and Management and Related Stockholder Matters | |
| Item 13. | Certain Relationships and Related Transactions, and Director Independence | |
| Item 14. | Principal Accountant Fees and Services | |
| | | |
| | |
| | |
| | | |
| | |
| | | |
PART I
The terms “Valero,” “we,” “our,” and “us,” as used in this report, may refer to Valero Energy Corporation, to one or more of our consolidated subsidiaries, or to all of them taken as a whole. In this Form 10-K, we make certain forward-looking statements, including statements regarding our plans, strategies, objectives, expectations, intentions, and resources, under the safe harbor provisions of the Private Securities Litigation Reform Act of 1995. You should read our forward-looking statements together with our disclosures beginning on page 2324 of this report under the heading: “CAUTIONARY STATEMENT FOR THE PURPOSE OF SAF ESAFE HARBOR PROVISIONS OF THE PRIVATE SECURITIES LITIGATION REFORM ACT OF 1995.”
ITEMS 1., 1A., and 2. BUSINESS, RISK FACTORS, AND PROPERTIES
Overview. We are a Fortune 500 company based in San Antonio, Texas. Our corporate offices are at One Valero Way, San Antonio, Texas, 78249, and our telephone number is (210) 345-2000. Our common stock trades on the New York Stock Exchange under the symbol “VLO.” We were incorporated in Delaware in 1981 under the name Valero Refining and Marketing Company. We changed our name to Valero Energy Corporation on August 1, 1997. On January 31, 2011,2012, we had 20,31321,942 employees.
Our 1416 petroleum refineries are located in the United States (U.S.), Canada, the United Kingdom (U.K.), and Aruba. Our refineries can produce conventional gasolines, distillates, jet fuel, asphalt, petrochemicals, lubricants, and other refined products as well as a slate of premium products including CBOB and RBOB1, gasoline meeting the speci ficationsspecifications of the California Air Resources Board (CARB), CARB diesel fuel, and low-sulfur and ultra-low-sulfur diesel fuel, and oxygenates (liquid hydrocarbon compounds containing oxygen).fuel.
We market branded and unbranded refined products on a wholesale basis in the U.S., Canada, and Canadathe U.K. through an extensive bulk and rack marketing network. We alsonetwork, and we sell refined products through a network of about 5,8006,800 retail and branded wholesale branded outlets in the U.S., Canada, the U.K., Aruba, and Aruba.Ireland.
We also own 10 ethanol plants in the Midwestcentral plains region of the U.S. with a combined ethan olethanol nameplate production capacity of about 1.1 billion gallons per year.
Available Information. Our internet website address is www.valero.com. Information contained on our website is not part of this annual report on Form 10-K. Our annual reports on Form 10-K, quarterly reports on Form 10-Q, and current reports on Form 8-K filed with (or furnished to) the Securities and Exchange Commission (SEC) are available on our internet website (in the(under “Investor Relations” section),) free of charge, soon after we file or furnish such material. In this same location, we also post our corporate governance guidelines, codecodes of business conduct and ethics, code of ethics for senior financial officers, and the charters of the committees of our board of directors. These documents are available in print to any stockholder that makes a written request to Jay D. Browning, Senior Vice President – Corporate Law and Secretary, Valero Energy Corporation, P.O. Box 696000, San Antonio, Texas 78269-6000.
_____________________________
1 CBOB, or “conventional blendstock for oxygenate blending,” is conventiona lconventional gasoline blendstock intended for blending with oxygenates downstream of the refinery where it was produced. CBOB becomes conventional gasoline after blending with oxygenates. RBOB is a base unfinished reformulated gasoline mixture known as “reformulated gasoline blendstock for oxygenate blending.” It is a specially produced reformulated gasoline blendstock intended for blending with oxygenates downstream of the refinery where it was produced to produce finished gasoline that meets or exceeds U.S. emissions performance requirements for federal reformulated gasoline. Ethanol is the primary oxygenate currently used in gasoline blending in the U.S.
SEGMENTS
&n bsp;
Our business is organized intoWe have three reportable business segments: refining, ethanol, and retail. The financial information about our segments is discussed in Note 18 of Notes to Consolidated Financial Statements and is incorporated herein by reference.
| |
• | Our refining segment includes refining operations, wholesale marketing, product supply and distribution, and transportation operations. The refining segment is segregated geographically into the Gulf Coast, Mid-Continent, West Coast, and Northeast regions. |
Our refining segment includes refining operations, wholesale marketing, product supply and distribution, and transportation operations. The refining segment is segregated geographically into the U.S. Gulf Coast, U.S. Mid-Continent, North Atlantic, and U.S. West Coast regions.
| |
• | Our ethanol segment includes sales of internally produced ethanol and distillers grains. Our ethanol operation s are geographically located in the central plains region of the U.S.. |
| |
• | Our retail segment includes company-operated convenience stores, Canadian dealers/jobbers, truckstop facilities, cardlock facilities, and home heating oil operations. The retail segment is segregated into two geographic regions. Our retail operations in the U.S. are referred to as Retail-U.S. Our retail operations in eastern Canada are referred to as Retai l-Canada. |
Our ethanol segment includes sales of internally produced ethanol and distillers grains. Our ethanol operations are geographically located in the central plains region of the U.S.
Our retail segment includes company-operated convenience stores, Canadian dealers/jobbers, truckstop facilities, cardlock facilities, and home heating oil operations. The retail segment is segregated into two geographic regions. Our retail operations in the U.S. are referred to as Retail-U.S. Our retail operations in Canada are referred to as Retail-Canada.
VALERO’S OPERATIONS
REFINING
On December 31, 20102011, our refining operations included 1416 refineries in the U.S., Canada, the U.K., and Aruba, with a combined total throughput capacity of approximately 2.63.0 million barrels per day (BPD). The following table presents the locations of these refineries and their approximate feedstock throughput capacities as of December 31, 20102011.
|
| | | | | |
| Refinery | | Location | | Throughput Capacity (a) (BPD) |
U.S. Gulf Coast: | | | | |
C orpusCorpus Christi (b)
| | Texas | | 325,000 |
|
| Port Arthur | | Texas | | 310,000 |
|
| St. Charles | | Louisiana | | 270,000 |
|
| Texas City | | Texas | | 245,000 |
|
Aruba(c) | | Aruba | | 235,000 |
|
| Houston | | Texas | | 160,000 |
|
Meraux | | Louisiana | | 135,000 |
|
| Three Rivers | | Texas | | 100,000 |
|
| | | | | 1,645,0001,780,000 |
|
West Coast:
| | | | |
Benicia | | California | | 170,000 | |
Wilmington | | California | | 135,000 | |
| | | | 305,000 | |
U.S. Mid-Continent: | | | | |
| Memphis | | Tennessee | | 195,000 |
|
| McKee | | Texas | | 170,000 |
|
Ardmore | | Oklahoma | | 90,000 |
|
| | | | | 455,000 |
|
| | | | |
Northeast (d)North Atlantic:
| | | | |
| Pembroke | | Wales, U.K. | | 270,000 |
|
| Quebec City | | Quebec, Canada | | 235,000 |
|
| | | | 505,000 |
|
| | | | |
| U.S. West Coast: | | | | |
| Benicia | | California | | 170,000 |
|
| Wilmington | | California | | 135,000 |
|
| | | | 305,000 |
|
| Total | | & nbsp; | | 2,640,0003,045,000 |
|
&n bsp;
| |
(a) | “Throughput capacity” represents estimated capacity for processing crude oil, intermediates, and other feedstocks. Total estimated crude oil capacity is approximately 2.22.6 million BPD. |
| |
(b) | Represents the combined capacities of two refineries – the Corpus Christi East and Corpus Christi West Refineries. |
| |
(c)
| The Aruba Refinery was idled in July 2009, but resumed operations in January 2011. |
| |
(d)
| We sold our Paulsboro, New Jersey Refinery in the fourth quarter of 2010, as described in Note 3 of Notes to Consolidated Financial Statements. Throughput capacity of this refinery was approximately 185,000 BPD.
|
Total Refining System
The following table presents the percentages of principal charges and yields (on a combined basis) for all of our refineries for the year ended December 31, 20102011 (includes the results of operations of our Meraux and Pembroke Refineries from the dates of their acquisition through the end of the year). Our total combined throughput volumes averaged 2.1292.4 million BPD for the year ended December 31, 20102011. (The information presented excludes the charges and yields of the Paulsboro Refinery, which we sold in the fourth quart er of 2010, as more fully described in Note 3 of Notes to Consolidated Financial Statements.)
|
| | | |
| Combined Total Refining System Charges and Yields |
| | | |
| Charges: | | |
| | sour crude oil | 4037 | % |
| | acidic sweet crude oil | 3
5 | % |
| | sweet crude oil | 31 | % |
| | residual fuel oil | 1011 | % |
| | other feedstocks | 5 | % |
| | blendstocks | 11 | % |
| Yields: | | |
| | gasolines and blendstocks | 4946 | % |
| | distillates | 3334 | % |
| | petrochemicals | 3 | % |
| | other products (includes gas oil, No. 6 fuel oil, petroleum coke, and asphalt) | 1517 | % |
U.S. Gulf Coast
The following table presents the percentages of principal charges and yields (on a combined basis) for the eightnine refineries in this region for the year endedDecember 31, 20102011 (includes the results of operations of our Meraux Refinery from October 1, 2011, the date of its acquisition, through the end of the year). Total throughput volumes for the U.S. Gulf Coast refining region averaged 1.281.45 million BPD for the year ended December 31, 20102011.
|
| | | |
| Combined U.S. Gulf Coast Region Charges and Yields |
| | | |
| Charges: | | |
| | sour crude oil | 5250 | % |
| | acidic sweet crude oil | 2 | % |
| | sweet crude oil | 1110 | % |
| | residual fuel oil | 1619 | % |
| | other feedstocks | 6 | % |
| | blendstocks | 13 | % |
| Yields: | | |
| | gasolines and blendstocks | 4541 | % |
| | distillates | 33 | % |
| | petrochemicals | 4 | % |
| | other products (includes ga sgas oil, No. 6 fuel oil, petroleum coke, and asphalt) | 1822 | % |
Corpus Christi East and West Refineries. Our Corpus Christi East and West Refineries are located on the Texas Gulf Coast along the Corpus Christi Ship Channel. The East Refinery processes sour crude oil into conventional gasoline, diesel, jet fuel, asphalt, aromatics, and other light products. The West Refinery specializes in processing primarily sour crude oil and residual fuel oil into premium products such as RBOB. The East Refinery processes sour crude oil into conventional gasoline, diesel, jet fuel, asphalt, aromatics, and other light products. The East and West Refineries are substantially integrated allowingallow for the trans fertransfer of various feedstocks and blending components between the two refineries and the sharing of resources. The refineries typically receive and deliver feedstocks and products by tanker and barge via deepwater docking facilities along the Corpus Christi Ship Channel. Three truck racks with a total of 16 bays service local markets for gasoline, diesel, jet fuels, liquefied petroleum gases, and asphalt. Finished products are distributed across the refineryrefineries’ docks into ships or barges, and are transported via third-party pipelines to the Colonial, Explorer, Valley, and other major pipelines.
Port Arthur Refinery. Our Port Arthur Refinery is located on the Texas Gulf Coast app roximatelyapproximately 90 miles east of Houston. The refinery processes primarily heavy sour crude oils and other feedstocks into gasoline, blendstocks, as well as diesel, jet fuel, petrochemicals, intermediates, petroleum coke, and sulfur. The refinery receives crude oil over marine docks and through crude oil pipelines, and has access to the Sunoco and Oiltanking terminals at Nederland, Texas. Finished products are distributed into the Colonial, Explorer, and TEPPCO pipelines and across the refinery docks into ships or barges.
St. Charles Refinery. Our St. Charles Refinery is located approximately 15 miles from New Orleans along the Mississippi River. The refinery processes sour crude oils and oth erother feedstocks into gasoline, distillates, and other light products. The refinery receives crude oil over five marine docks and has access to the Louisiana Offshore Oil Port where it can receive crude oil through a 24-inch pipeline. Finished products can be shipped over these docks or through the Colonial pipeline network for distribution to the eastern U.S.
Texas City Refinery. Our Texas City Refinery is located southeast of Houston on the Texas City Ship Channel. The refinery processes sour crude oils into a wide slate of products. The refinery receives and delivers its feedstocks and products by ship and barge via deepwater docking facilities along the Texas City Ship Channe lChannel and uses the Colonial, Explorer, and TEPPCO pipelines for distribution of its products.
Aruba Refinery. Our Aruba Refinery is located on the island of Aruba in the Caribbean Sea. It processes primarily heavy sour crude oil and produces intermediate feedstocks and finished distillate products. Significant amounts of the refinery'srefinery’s intermediate feedstock production are transported and further processed in our other refineries in the U.S. Gulf Coast and U.S. West Coast regions. The refinery receives crude oil by ship at its two deepwater marine docks, which can berth ultra-large crude carriers. The refinery'srefinery’s products are delivered by ship primarily into markets in the U.S., the Caribbea n,Caribbean, Europe, and South America.
Houston Refinery. Our Houston Refinery is located on the Houston Ship Channel. It processes a mix of crude oils and low-sulfur residual fuel oil into reformulated gasoline and distillates. The refinery receives its feedstocks via tanker at deepwater docking facilities along the Houston Ship Channel and interconnecting pipelines with the Texas City Refinery. It delivers its products through major refined-product pipelines, including the Colonial, Explorer, Orion, and TEPPCO pipelines.
Meraux Refinery. Our Meraux Refinery is located in St. Bernard Parish southeast of New Orleans. We acquired the refinery on October 1, 2011. The refinery processes primarily medium sour crude oils into gasoline, distillates, and other light products. The refinery receives crude oil at its marine dock and has access to the Louisiana Offshore Oil Port where it can receive crude oil via the Clovelly-Alliance-Meraux pipeline system. Finished products can be shipped from the refinery’s dock or through the Colonial pipeline network for distribution to the eastern U.S. The Meraux Refinery is located about 40 miles from our St. Charles Refinery, allowing for integration of feedstocks and refined product blending.
Three Rivers Refinery. Our Three Rivers Refinery is located in South Texas between Corpus Christi and San Antonio. It processes sweet and medium sour crude oils into gasoline, distillates, and aromatics. The refinery has access to crude oil from foreign sources outside the U.S. delivered to the Texas Gulf Coast at Corpus Christi as well as crude oil from domesticU.S. sources through third-party pipelines and trucks. A 70-mile pipeline transports crude oil via connections to the Three Rivers Refinery from Corpus Christi. The refinery distributes its refined products primarily through pipelines owned by NuStar Energy L.P.
U.S. Mid-Continent
The following table presents the percentages of principal charges and yields (on a combined basis) for the three refineries in this region for the year ended December 31, 2011. Total throughput volumes for the U.S. Mid-Continent refining region averaged approximately 411,000 BPD for the year ended December 31, 2011.
|
| | | |
| Combined U.S. Mid-Continent Region Charges and Yields |
| | |
| Charges: | | |
| sour crude oil | 9 | % |
| sweet crude oil | 82 | % |
| other feedstocks | 1 | % |
| blendstocks | 8 | % |
| Yields: | | |
| gasolines and blendstocks | 54 | % |
| distillates | 35 | % |
| petrochemicals | 5 | % |
| other products (includes gas oil, No. 6 fuel oil, and asphalt) | 6 | % |
Memphis Refinery. Our Memphis Refinery is located in Tennessee along the Mississippi River’s Lake McKellar. It processes primarily sweet crude oils. Most of its production is light products, including regular and premium gasoline, diesel, jet fuels, and petrochemicals. Crude oil is supplied to the refinery via the Capline pipeline and can also be received, along with other feedstocks, via barge. The refinery’s products are distributed via truck racks at our three product terminals, barges, and a pipeline network, including one pipeline directly to the Memphis airport.
McKee Refinery. Our McKee Refinery is located in the Texas Panhandle. It processes primarily sweet crude oils into conventional gasoline, RBOB, low-sulfur diesel, jet fuels, and asphalt. The refinery has access to crude oil from Texas, Oklahoma, Kansas, and Colorado through third-party pipelines. The refinery also has access at Wichita Falls, Texas to third-party pipelines that transport crude oil from West Texas to the U.S. Mid-Continent region. The refinery distributes its products primarily via NuStar Energy L.P.’s pipelines to markets in Texas, New Mexico, Arizona, Colorado, and Oklahoma.
Ardmore Refinery. Our Ardmore Refinery is located in Ardmore, Oklahoma, approximately 100 miles south of Oklahoma City. It processes medium sour and sweet crude oils into conventional gasoline, ultra-low-sulfur diesel, liquefied petroleum gas products, and asphalt. Local crude oil is gathered by TEPPCO’s crude oil gathering/trunkline systems and trucking operations, and is then transported to the refinery through third-party crude oil pipelines. The refinery also receives crude oil from other locations via third-party pipelines. Refined products are transported to market via railcars, trucks, and the Magellan pipeline system.
West CoastNorth Atlantic
The following table presents the percentages of principal charges and yields (on a combined basis) for the two refineries in this region for the year ended December 31, 20102011 (includes the results of operations of our Pembroke Refinery from August 1, 2011, the date of its acquisition, through the end of the year). Total throughput volumes for the North Atlantic refining region averaged approximately 317,000 BPD for the year ended December 31, 2011.
|
| | | |
| North Atlantic Region Charges and Yields |
| | |
| Charges: | | |
| sour crude oil | 2 | % |
| acidic sweet crude oil | 11 | % |
| sweet crude oil | 78 | % |
| residual fuel oil | 3 | % |
| other feedstocks | 1 | % |
| blendstocks | 5 | % |
| Yields: | | |
| gasolines and blendstocks | 43 | % |
| distillates | 44 | % |
| petrochemicals | 1 | % |
| other products (includes gas oil, No. 6 fuel oil, and other products) | 12 | % |
Pembroke Refinery. Our Pembroke Refinery is located in the County of Pembrokeshire in southwest Wales, U.K. We acquired the refinery on August 1, 2011. The refinery processes primarily sweet crude oils into ultra-low sulfur gasoline and diesel, jet fuel, heating oil, and low sulfur fuel oil. The refinery receives all of its feedstocks and delivers the majority of its products by ship and barge via deepwater docking facilities along the Milford Haven Waterway with its remaining products being delivered by the Mainline pipeline system.
Quebec City Refinery. Our Quebec City Refinery is located in Lévis, Canada (near Quebec City). It processes sweet, high mercaptan crude oils and lower-quality, sweet acidic crude oils into conventional gasoline, low-sulfur diesel, jet fuel, heating oil, and propane. The refinery receives crude oil by ship at its deepwater dock on the St. Lawrence River. We charter large ice-strengthened, double-hulled crude oil tankers that can navigate the St. Lawrence River year-round. The refinery transports its products to its terminals in Quebec and Ontario primarily by train, and also uses ships and trucks extensively throughout eastern Canada.
U.S. West Coast
The following table presents the percentages of principal charges and yields (on a combined basis) for the two refineries in this region for the year ended December 31, 2011. Total throughput volumes for the U.S. West Coast refining region averaged approximately 256,000 BPD for the year ended December 31, 20102011.
|
| | | |
| Combined U.S. West Coast Region Charges and Yields |
| | | |
| Charges: | | |
| | sour crude oil | 5148 | % |
| | acidic sweet crude oil | 817 | % |
| | sweet crude oil | 147 | % |
| | other feedstocks | 1213 | % |
| | blendstocks | 15 | % |
| Yields: | | |
| | gasolines and blendstocks | 6362 | % |
| | distillates | 2225 | % |
| | other products (includes gas oil, No. 6 fuel oil, petroleum coke, and asphalt) | 1513 | % |
Benicia Refinery. Our Benicia Refinery is located northeast of San Francisco on the Carquinez Straits of San Francisco Bay. It processes sour crude oils into premium products, primarily CARBOB gasoline. (CARBOB is a reformulated gasoline mixture that meets the specifications of the CARB when blended with ethanol.) The refinery receives crude oil feedstocks via a marine dock that can berth large crude oil carriers and a 20-inch crude oil pipeline connected to a southern California crude oil delivery system. Most of the refinery'srefinery’s products are distributed via the Kinder Morgan pipeline system in California.
Wilmington Refinery. Our Wilmington Refi neryRefinery is located near Los Angeles, California. The refinery processes a blend of lower-cost heavy and high-sulfur crude oils. The refinery can produce all of its gasoline as CARBOB gasoline and produces both ultra-low-sulfur diesel, CARB diesel, and CARB diesel.jet fuel. The refinery is connected by pipeline to marine terminals and associated dock facilities that can move and store crude oil and other feedstocks. Refined products are distributed via the Kinder Morgan pipeline system and various third-party terminals in southern California, Nevada, and Arizona.
Mid-Continent
The following table presents the percentages of principal charges and yields (on a combined basis) for the three refineries in this region for the year ended December 31, 2010. Total throughput volumes for the Mid-Continent refining region averaged approximately 398,000 BPD for the year ended December 31, 2010.
| | | |
Combined Mid-Continent Region Charges and Yields |
| | |
Charges: | | |
| sour crude oil | 12 | % |
| sweet crude oil | 79 | % |
| other feedstocks | 1 | % |
| blendstocks | 8 | % |
Yields: | | |
| gasolines and blendstocks | 55 | % |
| distillates | 35 | % |
| petrochemicals | 3 | % |
| other products (includes gas oil, No. 6 fuel oil, and asphalt) | 7
% |
Memphis Refinery. Our Memphis Refinery is located in Tennessee along the Mississippi River's Lake McKellar. It processes primarily sweet crude oils. Most of its production is light products, including regular and premium gasoline, diesel, jet fuels, and petrochemicals. Crude oil is supplied to the refinery via the Capline pipeline and can also be received, along with other feedstocks, via barge. The refinery's products are distributed via truck racks at our three product terminals, barges, and a pipeline network, including one pipeline directly to the Memphis airport.
McKee Refinery. Our McKee Refinery is located in the Texas Panhandle. It processes primarily sweet crude oils into conventional gasoline, RBOB, low-sulfur diesel, jet fuels, and asphalt. The refinery has access to crude oil from Texas, Oklahoma, Kansas, and Colorado through third-party pipelines. The refinery also has access at Wichita Falls, Texas to third-party pipelines that transport crude oil from the Texas Gulf Coast and West Texas to the Mid-Continent region. The refinery distributes its products primarily via NuStar Energy L.P.'s pipelines to markets in Texas, New Mexico, Arizona, Colorado, and Oklahoma.
Ardmore Refinery. Our Ardmore Refinery is located in Ardmore, Oklahoma, approximately 100 miles south of Oklahoma City. It processes medium sour and sweet crude oils into conventional gasoline, ultra-low-sulfur diesel, liquefied petroleum gas products, and asphalt. Local crude oil is gathered by TEPPCO's crude oil gathering/trunkline systems and trucking operations, and then transported to the refinery through third-party crude oil pipelines. Foreign, mid-continent, and other domestic crude oils are received via third-party pipelines. Refined products are transported to market via railcars, trucks, and the Magellan pipeline system.
Northeast
The following table presents the percentages of principal charges and yields for the Quebec City Refinery for the year ended December 31, 2010. Total throughput volumes for the Northeast refining region averaged approximately 195,000 BPD for the year ended December 31, 2010.
| | | |
Northeast Region Charges and Yields |
| | |
Charges: | | |
| acidic sweet crude oil | 10 | % |
| sweet crude oil | 86 | % |
| other feedstocks | 2 | % |
| blendstocks | 2 | % |
Yields: | | |
| gasolines and blendstocks | 41 | % |
| distillates | 44 | % |
| petrochemicals | 1 | % |
| other products (includes gas oil, No. 6 fuel oil, petroleum coke, and asphalt) | 14 | % |
Quebec City Refinery. Our Quebec City Refinery is located in Lévis, Canada (near Quebec City). It processes sweet, high mercaptan crude oils and lower-quality, sweet acidic crude oils into conventional gasoline, low-sulfur diesel, jet fuels, heating oil, and propane. The refinery receives crude oil by ship at its deepwater dock on the St. Lawrence River. We charter large ice-strengthened, double-hulled crude oil tankers that can nav igate the St. Lawrence River year-round. The refinery transports its products to its terminals in Quebec and Ontario primarily by train, and also uses ships and trucks extensively throughout eastern Canada.
Feedstock Supply
Approximately 5863 percent of our current crude oil feedstock requirements are purchased through term contracts while the remaining requirements are generally purchased on the spot market. Our term supply agreements include arrangements to purchase feedstoc ksfeedstocks at market-related prices directly or indirectly from various foreign national oil companies (including feedstocks originating in the Middle East, Africa, Asia, Mexico, and South America) as well as international and domesticU.S. oil companies. The contracts generally permit the parties to amend the contracts (or terminate them), effective as of the next scheduled renewal date, by giving the other party proper notice within a prescribed period of time (e.g., 60 days, 6 months) before expiration of the current term. The majority of the crude oil purchased under our term contracts is purchased at the producer’s official stated price (i.e., the “market” price established by the seller for all purchasers) and not at a nego tiatednegotiated price specific to us. About 78 percent of our crude oil feedstocks under term supply agreements are imported from foreign sources and about 22 percent are domestic. If we become unable to purchase crude oil from any one of these sources, we believe that adequate alternative supplies of crude oil would be available.
The U.S. network of crude oil pipelines and terminals allows us to acquire crude oil from producing leases, domestic crude oil trading centers, and ships delivering cargoes of foreign and domestic crude oil. Our Pembroke, Quebec City, and Aruba Refineries rely on foreign crude oil that is delivered to the refineries’ dock facilities by ship. We use the futures market to manage a portion of the price risk inherent in purchasing crude oil in adva nce of the delivery date and holding inventories of crude oils and refined products.
Refining Segment Sales
Our refining segment includes sales of refined products in both the wholesale rack and bulk markets. These sales include refined products that are manufactured in our refining operations as well as refined products purchased or received on exchange from third parties. Most of our refineries have access to marine transportation facilities and interconnect with common-carrier pipeline systems, allowing us to sell products in most major geographic regions of the U.S., Canada, the U.K., and eastern Canada.other countries. No customer accounted for more than 10 percent of our total operating revenues in 2010.2011.
Wholesale Marketing
We market branded and unbranded transportation fuels on a wholesale basis in 44 states through an extensive rack marketing network. The principal purchasers of our transportation fuels from terminal truck racks are wholesalers, distributors, retailers, and truck-delivered end users throughout the U.S..U.S., the U.K., and Ireland.
The majority of our rack volume is sold through unbranded channels. The remainder is sold to distributors and dealers that are members of the Valero-brand family that operate approximately 4,000 branded sites.sites in the U.S. and approximately 1,000 branded sites in the U.K. and Ireland. These sites are indepen dentlyindependently owned and are supplied by us under multi-year contracts. For wholesale branded sites, we promote our Valero® brand throughout, Beacon®, and Shamrock® brands in the U.S. In addition, we offer, and the BeaconTexaco® brand in Californiathe U.K. and the Shamrock® brand elsewhere in the U.S.Ireland.
Bulk Sales and Trading
We sell a significant portion of our gasoline and distillate production through bulk sales channels in domesticU.S. and international markets. Our bulk sales are made to various oil companies and traders as well as certain bulk end-users such as railroads, airlines, and utilities. Our bulk sales are transported primarily by pipeline, barges, and tankers to major tank farms and trading hubs.
We also enter into refined product exchange and purchase agreements. These agreements help to minimize transportation costs, optimize refinery utilization, balance refined product availability, , broaden geographic distribution, and provide access to markets not connected to our refined product pipeline systems. Exchange agreements provide for the delivery of refined products by us to unaffiliated companies at our and third parties’ terminals in exchange for delivery of a similar amount of refined products to us by these unaffiliated companies at specified locations. Purchase agreements involve our purchase of refined products from third
parties with delivery occurring at specified locations.
Specialty Products
We sell a variety of other pr oductsproducts produced at our refineries, which we refer to collectively as “Specialty Products.” Our Specialty Products include asphalt, lube oils, natural gas liquids (NGLs), petroleum coke, petrochemicals, and sulfur.
| |
• | We produce asphalt at five of our refineries. Our asphalt products are sold for use in road construction, road repair, and roofing applications through a network of refinery and terminal loading racks. |
| |
• | We produce napthenic oils at one of our refineries suitable for a wide variety of lubricant and process applications. |
| |
• | NGLs produced at our refineries include butane, isobutane, and propane. These products can b e used for gasoline blending, home heating, and petrochemical plant feedstocks. |
| |
• | We are a significant producer of petroleum coke, supplying primarily power generation customers and cement manufacturers. Petroleum coke is used largely as a substitute for coal. |
We produce asphalt at five of our refineries. Our asphalt products are sold for use in road construction, road repair, and roofing applications through a network of refinery and terminal loading racks.
We produce napthenic oils at one of our refineries suitable for a wide variety of lubricant and process applications.
NGLs produced at our refineries include butane, isobutane, and propane. These products can be used for gasoline blending, home heating, and petrochemical plant feedstocks.
We are a significant producer of petroleum coke, supplying primarily power generation customers and cement manufacturers. Petroleum coke is used largely as a substitute for coal.
We produce and market a number of commodity petrochemicals including aromatic solvents (benzene, toluene, and xylene) and two grades of propylene. Aromatic solvents and propylenes are sold to customers in the chemical industry for further processing into such products as paints, plastics, and adhesives.
We are a large producer of sulfur with sales primarily to customers in the agricultural sector. Sulfur is used in manufacturing fertilizer.
| |
• | We produce and market a number of commodity petrochemicals including aromatic solvents (benzene, toluene, and xylene) and two grades of propylene. Aromatic solvents and propylenes are sold to customers in the chemical industry for further processing into such products as paints, plastics, and adhesives. |
| |
• | We are a large producer of sulfur with sales primarily to customers in the agricultural sector. Sulfur is used in manufacturing fertilizer. |
ETHANOL
We own 10 ethanol plants with a combined ethanol nameplate production capacity of about 1.1 billion gallons per year. Our ethanol plants are dry mill facilities1 that process corn to produce ethanol and distillers grains.2 We source our corn supply from local farmers and commercial elevators. Our facilities receive corn by rail and truck. OnWe publish on our website we publish a corn bid for local farmers and cooperative dealers to use to facilitate corn supply transactions.
After processing, our ethanol is held in storage tanks on-site pending loading to trucks and railcars. We sell our ethanol (i) to large customers – primarily refiners and gasoline blenders – under term and spot contracts, and (ii) in bulk markets such as New York, Chicago, Dallas, Florida, and the U.S. West Coast. We also use our ethanol for our own needs in blending gasoline. We ship our dry distillers grains (DDG) by truck or rail primarily to animal feed customers in the U.S. and Mexico, with some sales into the Far East. We also sell modified distillers grains locally at our plant sites.
The following table presents the locations of our ethanol plants, their approximate ethanol and DDG production capacit ies,capacities, and their approximate corn processing capacities.
|
| | | | | | | | |
| State | | City | | Ethanol Nameplate Production (in gallons per year) | | Production of DDG (in tons per year) | | Corn Processed (in bushels per year) |
| Indiana | | Linden | | 110 million | | 350,000 | | 40 million |
| Iowa | | Albert City | | 110 million | | 350,000 | | 40 million |
| | | Charles City | | 110 million | | 350,000 | | 40 million |
| | | Fort Dodge | | 110 million | | 350,000 | | 40 million |
| | | Hartley | | 110 million | | 350,000 | | 40 million |
| Minnesota | | Welcome | | 110 million | | 350,000 | | 40 million |
| Nebraska | | Albion | | 110 million | | 350,000 | | 40 million |
| Ohio | | Bloomingburg | | 110 million | | 350,000 | | 40 million |
| South Dakota | | Aurora | | 120 million | | 390,000 | | 43 million |
| Wisconsin | | Jefferson | | 110 million | | 350,000 | | 40 million |
| | | Total | | 1,110 million | | 3,540,000 | | 403 million |
EthanolThe combined ethanol production from our 10 plants in the fourth quarter of 20102011 averaged 3.253.4 million gallons per day. We acquired our Iowa, Minnesota, Nebraska, and South Dakota plants in the second quarter of 2009. We acquired our Indiana, Ohio, and Wisconsin plants in the first quarter of 2010. For additional information regarding these acquisitions, see Note 2 of Notes to Consolidated Financial Statements.
________________________
| |
1 | Ethanol is commercially produced using either the wet mill or dry mill process. Wet milling involves separating the grain kernel into its component parts (germ, fiber, protein, and starch) prior to fermentation. In the dry mill process, the entire grain kernel is ground into flour. The starch in the flour is converted to ethanol during the fermentation process, creating carbon dioxide and distillers grains. |
1 Ethanol is commercially produced using either the wet mill or dry mill process. Wet milling involves separating the grain kernel into its component parts (germ, fiber, protein, and starch) prior to fermentation. In the dry mill process, the entire grain kernel is ground into flour. The starch in the flour is converted to ethanol during the fermentation process, creating carbon dioxide and distillers grains.
| |
2 | During fermentation, nearly all of the starch in the grain is converted into ethanol and carbon dioxide, while the remaining nutrients (proteins, fats, minerals, and vitamins) are concentrated to yield modified distillers grains, or, after further drying, dried distillers grains. Distillers grains generally are an economical partial replacement for corn, soybean, and dicalcium phosphate in feeds for livestock, swine, and poultry. |
;
2 During fermentation, nearly all of the starch in the grain is converted into ethanol and carbon dioxide, while the remaining nutrients (proteins, fats, minerals, and vitamins) are concentrated to yield modified distillers grains, or, after further drying, dried distillers grains. Distillers grains generally are an economical partial replacement for corn, soybean, and dicalcium phosphate in feeds for livestock, swine, and poultry.
RETAIL
Our retail segment operations include the following:include:
| |
• | sales of transportation fuels at retail stores and unattended self-service cardlocks, |
| |
• | sales of convenience store merchandise and services in retail stores, and |
| |
• | sales of home heating oil to residential customers. |
sales of transportation fuels at retail stores and unattended self-service cardlocks,
sales of convenience store merchandise and services in retail stores, and
sales of home heating oil to residential customers.
We are one of the largest independent retailers of refined productstransportation fuels in the central and southwest U.S. and eastern Canada. Our retail operations are segregated geographically into two groups: Retail-U.S .Retail-U.S. and Retail-Canada.
Retail-U.S.
Sales in Retail-U.S. represent sales of transportation fuels and convenience store merchandise and services through our company-operated retail sites. For the year ended December 31, 20102011, total sales of refined productstransportation fuels through Retail-U.S.’s retail sites averaged approximately 119,900119,780 BPD. In addition to transportation fuels, our company-operated convenience stores sell convenience-type items, such as tobacco products, beer, snacks and beverages, and fast food s and sandwiches, snacks, fountain drinks, bagged ice, and candy.foods. Our stores also offer services such as ATM access, money orders, lottery tickets, car wash facilities, air and water, and video rentals. On December 31, 20102011, we had 994998 company-operated sites in Retail-U.S. (of which 80 percent were owned and 20 percent were leased). Our company-operated stores are operated primarily under the Corner Store® brand name. Transportation fuels sold in our Retail-U.S. stores are sold primarily under the Valero® brand.
Retail-Canada
Sales in Retail-Canada include the following:include:
| |
• | sales of refined products and convenience store merchandise th rough our company-operated retail sites and cardlocks, |
| |
• | sales of refined products through sites owned by independent dealers and jobbers, and |
| |
• | sales of home heating oil to residential customers. |
sales of transportation fuels and convenience store merchandise through our company-operated retail sites and cardlocks,
sales of transportation fuels through sites owned by independent dealers and jobbers, and
sales of home heating oil to residential customers.
Retail-Canada includes retail operations in eastern Canada where we are a major supplier of refined productstransportation fuels serving Quebec, Ontario, and the Atlantic Provinces of Newfoundland, Nova Scotia, New Brunswick, and Prince Edward Island. For the year ended December 31, 20102011, total retail sales of refined productstransportation fuels through Retail-Canada averaged approximately 75,40076,100 BPD. Transportation fuels are sold under the Ultramar® brand through a network of 812791 outlets throughout eastern Canada. On December 31, 20102011, we owned or leased 392381 retail stores in Retail-Canada and distributed gasoline to 420410 dealers and independent jobbers. In addition, Retail-Canada operates 8382 cardlocks, which are card- or key-activated, self-service, unattended stations that allow commercial, trucking, and governmental fleets to buy transportation fuel 24 hours a day. Retail-Canada operations also include a large home heating oil business that provides home heating oil to approximately 138,000133,000 households in eastern Canada. Our home heating oil business tends to beis seasonal to the extent of increased demand for home heating oil during the winter.
RISK FACTORS
Our financial results are affected by volatile refining margins, and global economic activity.which are dependent upon factors beyond our control.
Our financial results are primarily affected by the relationship, or margin, between refined product prices and the prices for crude oil and other feedstocks. Our cost to acquire feedstocks and the price at which we can ultimately sell refined products depend upon several factors beyond our control, including regional and global supply of and demand for crude oil, gasoline, diesel, and other feedstocks and refined products. These in turn depend on, among other things, the availability and quantity of imports, the production levels of domesticU.S. and foreign sup pliers,international suppliers, levels of refined product inventories, productivity and growth (or the lack thereof) of U.S. and global economies, U.S. relationships with foreign governments, political affairs, and the extent of governmental regulation. Historically, refining margins have been volatile, and we believe they will continue to be volatile in the future.
Continued economicEconomic turmoil and political unrest or hostilities, including the threat of future terrorist attacks, could affect the economies of the U.S. and other countries. Lower levels of economic activity during periods of recession could result in declines in energy consumption, including declines in the demand for and consumption of our refined products, which could cause our revenues and margins to decline and limit our future growth prospect s.prospects.
Refining margins are also significantly impacted by additional refinery conversion capacity through the expansion of existing refineries or the construction of new refineries. Worldwide refining capacity expansions may result in refining production capability far exceeding refined product demand, which would have a significantan adverse effect on refining margins.
A significant portion of our profitability is derived from the ability to purchase and process crude oil feedstocks that historically have been cheaper than benchm arkbenchmark crude oils, such as West Texas Intermediate and Louisiana Light Sweet (LLS) and Brent crude oils. These crude oil feedstock differentials vary significantly depending on overall economic conditions and trends and conditions within the markets for crude oil and refined products, and they could decline in the future, which would have a negative impact on our earnings.results of operations.
Uncertainty and illiquidity in credit and capital markets can impair our ability to obtain credit and financing on acceptable terms, and can adversely affect the financial strength of our business partners.
Our ability to obtain credit and capital depends in large measure on capital markets and liquidity factors that we do not control. Our ability to access credit and capital markets may be restricted at a time when we would like, or need, to access those markets, which could have an impact on our flexibility to react to changing economic and business conditions. In addition, the cost and availability of debt and equity financing may be adversely impacted by unstable or illiquid market conditions. Protracted uncertainty and illiquidity in these markets also could have an adverse impact on our lenders, commodity hedging counterparties, or our customers, causing them to fail to meet their obligations to us. In addition, decreased returns on pension fund assets may also materially increase our pension funding requirements.
Our access to credit and capital markets also depends on the credit ratings assigned to our debt by independent credit rating agencies. We currently maintain investment-grade ratings by Standard & Poor’s Ratings Services (S&P), Moody’s Investors Service (Moody’s), and Fitch Ratings (Fitch) on our senior unsecured debt. (Ratings from credit agencies are not recommendations to buy, sell, or hold our securities. Each rating should be evaluated independently of any other rating.) We cannot provide assurance that any of our current ratings will remain in effect for any given period of time or that a rating will not be lowered or withdrawn entirely
by a rating agency if, in its judgment, circumstances so warrant. Specifically, if S&P, Moody’s, or Fitch were to downgrade our long-term rating, particularly below investment grade, our borrowing costs would increase,
which could adversely affect our ability to attract potential investors and our funding sources could decrease. In addition, we may not be able to obtain favorable credit terms from our suppliers or they may require us to provide collateral, letters of credit, or other forms of security which would increase our operating costs. As a result, a downgrade below investment g radegrade in our credit ratings could have a material adverse impact on our future operations and financial position.
From time to time, our cash needs may exceed our internally generated cash flow, and our business could be materially and adversely affected if we were unable to obtain necessary funds from financing activities. From time to time, we may need to supplement our cash generated from operations with proceeds from financing activities. We have existing revolving credit facilities, committed letter of credit facilities, and an accounts receivable sales facility to provide us with available financing to meet our ongoing cash needs. In addition, we rely on the counterparties to our derivative instruments to fund their obligations under such arrangements. Uncertainty and illiquidity in financial markets may materially impact the ability of the participating financial institutions and other counterparties to fun dfund their commitments to us under our various financing facilities. Accordingly, we may not be able to obtain the full amount of the funds available underfacilities or our financing facilities to satisfy our cash requirements, and our failure to do soderivative instruments, which could have a material adverse effect on our operations and financial position.
Compliance with and changes in environmental laws, including proposed climate change laws and regulations, could adversely affect our performance.
The principal environmental risks associated with our operations are emissions into the air and releases into the soil, surface water, or groundwater.&nb sp; Our operations are subject to extensive federal, state, and local environmental laws and regulations, including those relating to the discharge of materials into the environment, waste management, pollution prevention measures, greenhouse gas emissions, and characteristics and composition of gasoline and diesel fuels. Certain of these laws and regulations could impose obligations to conduct assessment or remediation efforts at our facilities as well as at formerly owned properties or third-party sites where we have taken wastes for disposal or where our wastes have migrated. Environmental laws and regulations also may impose liability on us for the conduct of third parties, or for actions that complied with applicable requirements when taken, regardless of negligence or fault. If we violate or fail to comply with these laws and regulations, we could be fined or otherwise sanctioned.
Because environmental laws and regulations are becoming more stringent and new environmental laws and regulations are continuously being enacted or proposed, such as those relating to greenhouse gas emissions and climate change, the level of expenditures required for environmental matters could increase in the future. In particular, currentCurrent and future legislative action and regulatory initiatives could result in changes to operating permits, additional remedial actions, material changes in operations, increased capital expenditures and operating costs, increased cost scosts of the goods we sell, and decreased demand for our products that cannot be assessed with certainty at this time. Our refining processes produce significant amountsWe may be required to make expenditures to modify operations or install pollution control equipment that could materially and adversely affect our business, financial condition, results of carbonoperations, and liquidity. For example, the U.S. Environmental Protection Agency (EPA) has announced its intent to promulgate in 2012 more stringent requirements for refinery air emissions through revisions to existing New Source Performance Standards and National Emission Standards for Hazardous Air Pollutants. In addition, the EPA has, in recent years, adopted final rules making more stringent the National Ambient Air Quality Standards (NAAQS) for ozone, sulfur dioxide and nitrogen dioxide, and the fuels we manufacture areEPA is considering further revisions to the primary sourceNAAQS. Emerging rules and permitting requirements implementing these revised standards may require us to install more stringent controls at our facilities, which may result in increased capital expenditures.
Governmental restrictions on greenhouse gas emissions -– including so-called “cap-and-trade” programs targeted at reducing carbon dioxide emissions -– could result in material increased compliance costs, additional operating restrictions for our business, and an increase in the cost of, and reduction in demand for, the products we produce, which could have a material adverse effect on our financial position, results of operations, and liquidity.
Disruption of our ability to obtain crude oil could adversely affect our operations.
A significant portion of our feedstock requirements is satisfied through supplies originating in the Middle East, Africa, Asia, North America, and South America. We are, therefore, subject to the political, geographic, and economic risks attendant to doing business with suppliers located in, and supplies originating from, thosethese areas. If one or more of our supply contracts were terminated, or if political events disrupt our traditional crude oil supply, we believe that adequate alternative supplies of crude oil would be available, but it is possible that we would be unable to find alternative sources of supply. If we are unable to obtain adequate crude oil volumes or are able to obtain such volumes only at unfavorable prices, our results of operations could be materially adversely affected, including reduced sales volumes of refined products or reduced margins as a result of higher crude oil costs.
In addition, the U.S. government can prevent or restrict us from doing business in or with foreignother countries. These restrictions, and those of foreignother governments, could limit our ability to gain access to business opportunities in various countries. Actions by both the U.S. and foreignother countries have affected our operations in the past and will continue to do so in the future.
We are subject to interruptions of supply and increased costs as a result of our reliance on third-party transportation of crude oil and refined products.
We often use the services of third parties to transport feedstocks and refined products to and from our facilities. If we experience prolonged interruptions of supply or increases in costs to deliver refined products to market, or if the ability of the pipelines or vessels to transport feedstocks or refined products is disrupted because of weather events, accidents, governmental regulations, or third-party actions, it could have a material adverse effect on our business, financial condition, results of operations, and liquidity.
Competitors that produce their own supply of feedstocks, have more extensive retail outlets, or have greater financial resources, or provide alternative energy sources may have a competitive advantage.
The refining and marketing industry is highly co mpetitivecompetitive with respect to both feedstock supply and refined product markets. We compete with many companies for available supplies of crude oil and other feedstocks and for outlets for our refined products. We do not produce any of our crude oil feedstocks. Many of our competitors, however, obtain a significant portion of their feedstocks from company-owned production and some have more extensive retail outlets than we have. Competitors that have their own production or extensive retail outlets (and greater brand-name recognition) are at times able to offset losses from refining operations with profits from producing or retailing operations, and may be better positioned to withstand periods of depressed refining margins or feedstock shortages.
Some of our competitor scompetitors also have materially greater financial and other resources than we have. Such competitors have a greater ability to bear the economic risks inherent in all phases of our industry. In addition, we compete with other industries that provide alternative means to satisfy the energy and fuel requirements of our industrial, commercial, and individual consumers.
A significant interruption in one or more of our refineries could adversely affect our business.
Our refineries are our principal operating assets. As a result, our operations could be subject to significant interruption if one or more of our refineries w erewere to experience a major accident or mechanical failure, encounter work stoppages relating to organized labor issues, be damaged by severe weather or other natural or man-made disaster, such as an act of terrorism, or otherwise be forced to shut down. If any refinery were to experience an interruption in operations, earnings from the refinery could be materially adversely affected (to the extent not recoverable through insurance) because of lost production and repair costs. A significant interruptionSignificant interruptions in one or more of our refineriesrefining system could also lead to increased volatility in prices for crude oil feedstocks and refined products, and could increase instability in the financial and insurance markets, making it more difficult for us to access capital and to obtain insurance coverage that we consider adequate.
We maintainare subject to operational risks and our insurance against many, butmay not be sufficient to cover all potential losses arising from operating hazards. Failure by one or more insurers to honor its coverage commitments for an insured event could materially and adversely affect our future cash flows,liquidity, operating results, and financial condition.
Our refining and marketing operations are subject to various hazards common to the industry, including explosions, fires, toxic emissions, maritime hazards, and natural catastrophes. As protection against these hazards, we maintain insurance coverage against some, but not all, such potential losses and liabilities. We may not be able to maintain or obtain insurance of the type and amount we desire at reasonable rates. As a result of market conditions, premiums and ded uctiblesdeductibles for certain of our insurance policies have increased substantially, and could escalate further.increase substantially. In some instances, certain insurance could become unavailable or available only for reduced amounts of coverage. For example, coverage for hurricane damage is very limited, and coverage for terrorism risks includes very broad exclusions. If we were to incur a significant liability for which we were not fully insured, it could have a material adverse effect on our financial position.
Our insurance program includes a number of insurance carriers. Significant disruptions in financial markets could lead to a deterioration in the financial condition of many financial institutions, including insurance companies. We are not currently aware of any information that would indicate that any of our insurers is
unlikely to perform in the event of a covered incident. However, in light of this uncertainty and the risk of a volatile financial market, we c ancan make no assurances that we will be able to obtain the full amount of our insurance coverage for insured events.
Compliance with and changes in tax laws could adversely affect our performance.
We are subject to extensive tax liabilities imposed by multiple jurisdictions, including U.S., state, and foreign income taxes, and transactional taxes such as excise,(excise/duty, sales/use, and value-added taxes), payroll taxes, franchise taxes, withholding taxes, and ad valorem taxes. New tax laws and regulations and changes in existing tax laws and regulations are continuously being enacted or proposed that could result in increased expenditures for tax liabilities in the future. Many of these liabiliti esliabilities are subject to periodic audits by the respective taxing authority. Subsequent changes to our tax liabilities as a result of these audits may subject us to interest and penalties.
We may incur losses as a result of our forward-contract activities and derivative transactions.
We currently use commodity derivative instruments, and we expect to continue their use in the future. If the instruments we use to hedge our exposure to various types of risk are not effective, we may incur losses.
ENVIRONMENTAL MATTERS
We incorporate by reference into this Item the environmental disclosures contained in the following sections of this report:
| |
• | Item 1 under the caption “Risk Factors – Compliance with and changes in environmental laws, including proposed climate change laws and regulations, could adversely affect our performance,” |
| |
• | I tem 3 “Legal Proceedings” under the caption “Environmental Enforcement Matters,” and |
| |
• | Item 8 “Financial Statements and Supplementary Data” in Note 10 of Notes to Consolidated Financial Statements under the caption “E nvironmental Liabilities.”
|
Item 1 under the caption “Risk Factors – Compliance with and changes in environmental laws, including proposed climate change laws and regulations, could adversely affect our performance,”
Item 3 “Legal Proceedings” under the caption “Environmental Enforcement Matters,” and
Item 8 “Financial Statements and Supplementary Data” in Note 10 of Notes to Consolidated Financial Statements under the caption “Environmental Liabilities” and Note 12 of Notes to Consolidated Financial Statements under the caption “Environmental Matters.”
Capital Expenditures Attributable to Compliance with Environmental Regulations. In 20102011, our capital expenditures attributable to compliance with environmental regulations were approximately $730$241 million, and are currently estimated to be $260$140 million for 20112012 and $80$155 million for 20122013. The estimates for 20112012 and 20122013 do not include amounts related to capital investments at our facilities that management has deemed to be strategic investments. These amounts could materially change as a result of federal and state legislativegovernmental and regulatory actions.
PROPERTIES
Our principal properties are described above under the caption “Valero’s Operations,” and that information is incorporated herein by reference. We also own feedstock and refined product storage and transportation facilities in various locations. We believe that our properties and facilities are generally adequate for our operations and that our facilities are maintained in a good state of repair. As of December 31, 20102011, we were the lessee under a number of cancelable and noncancelable leases for certain properties. Our leases are discussed more fully in Notes 11 and 12 of Notes to Consolidated Financial Statements.
Our patents relating to our refining operations are not material to us as a whole. The trademarks and tradenames under which we conduct our retail and branded wholesale business – including Valero®, Diamond Shamrock®, Shamrock��®, Ultramar®, Beacon®, Texaco®, Corner Store®, and Stop N Go® – and other trademarks employed in the marketing of petroleum products are integral to our wholesale and retail marketing operations.
ITEM 1B. UNRESOLVED STAFF COMMENTS
None.
ITEM 3. LEGAL PROCEEDINGS
Litigation
For the legal proceedings listed below, weWe incorporate by reference into this Item our disclosures made in Part II, Item 8 of this report included in Note 12 of Notes to Consolidated Financial Statements under the caption “Litigation Matters.”
| |
• | Retail Fuel Temperature Litigation |
Environmental Enforcement Matters
While it is not possible to predict the outcome of the following environmental proceedings, if any one or more of them were decided against us, we believe that there would be no material effect on our financial position or results of operations. We are reporting these proceedings to comply with SEC regulations, which require us to disclose certain information about proceedings arising under federal, state, or local provisions regulating the discharge of materials into the environment or protecting the environment if we reasonably believe that such proceedings will result in monetary sanctions of $100,000 or more.
United States Environmental Protection Agency (EPA)EPA (mobile source enforcement). In November 201 0,2010, the EPA issued a letter to us formalizing a proposed penalty of $585,000 in connection with eight alleged violations of U.S. federal fuels regulations (most of which were self-reported) purportedly occurring from March 2004 to 2006 at various refineries and terminals. We are negotiating with the EPA to resolve this matter.
EPA (Port Arthur Refinery). We expect the EPA to assess a penalty in an amount greater than $100,000 for a flaring event that occurred at our Port Arthur Refinery in 2011. The penalty would be a stipulated amount prescribed under our consent decree with the EPA. We have not yet received a formal penalty assessment from the EPA.
EPA (Three Rivers Refinery). We expect the EPA to assess a penalty in an amount greater than $100,000 for a flaring event that occurred at our Three Rivers Refinery in 2011. The penalty would be a stipulated amount prescribed under our consent decree with the EPA. We have not yet received a formal penalty assessment from the EPA.
Bay Area Air Quality Management District (BAAQMD) (Benicia Refinery). In the fourth quarter of 2010,2011, we settled 2223 violation notices (VN’s) with the BAAQMD that were issued in 20062009. In the first quarter of 2012, we settled five VN’s from 2009 and 2007.nine VN’s from 2010. We presently have outstanding 7875 VN’s issued by the BAAQMD from 20082010 to 2010the present. These VN’s are for various alleged air regulation and air permit violations at our Benicia Refinery and asphalt plant. No penalties have been specified in these VN’s. We are pursuing settlement of all VN’s.
New Jersey Department of Environmental Protection (NJDEP) (Paulsboro Refinery). We previously disclosed certain outstanding proceedings between the NJDEP and the Paulsboro Refinery in our Annual Report on Form 10-K for the year ended December 31, 2009; our Quarterly Report on Form 10-Q for the quarter ended March 31, 2010; and our Quarterly Report on Form 10-Q for the quarter ended June 30, 2010. Most of these proceedings were resolved in the first quarter of 2011 through a negotiated settlement with the NJDEP. The other proceedings were resolved with entry of Administrative Compliance Orders in the second quarter and fourth quarter of 2010.
People of the State of Illinois, ex rel. v. The Premcor Refining Group Inc., et al., Third Judicial Circuit Court, Madison County (Case No. 03-CH-00459, filed May 29, 2003) (Hartford Refinery and terminal). The Illinois Environmental Protection Agency has issued several notices of violation alleging violations of air and waste regulations at Premcor’s Hartford, Illinois terminal and closed refinery. We are negotiating the terms of a consent order for corrective action.
South Coast Air Quality Management District (SCAQMD) (Wilmington Refinery). Due to excess flare related emissions in 2011 at our Wilmington Refinery, we will pay a mitigation fee of about $2.3 million under SCAQMD Rule 1118 for emissions from refinery flares. We will pay the fee in the first quarter of 2012.
Texas Commission on Environmental Quality(TCEQ) (Corpus Christi East Refinery). In October 2010, we received a proposed agreed order from the TCEQ relating to unauthorized air emissions during a flaring event and excess air emissions from three plant boilers at our Corpus Christi East Refinery. The gross penalty demand was stated to be more than $100,000, but following our discussions with the TCEQ to clarify certain issues under question, we reasonably believe that the ultimate penalty amount for this matter will fall below $100,000.
TCEQ (Corpus Christi West Refinery and Texas City Refinery). In our annual report on Form 10-K for the year ended December 31, 2010, we disclosed that in the second quarter of 2009, the TCEQ issued a notice of enforcement (NOE) to our Corpus Christi West Refinery. The NOE alleged excess air emissions relating to two cooling tower leaks that occurred in 2008. The penalty demanded in t he TCEQ’s Preliminary Report and Petition was $1,100,424. In the fourth quarter of 2010, the TCEQ issued a proposed agreed order with a combined penalty of $591,858 pertaining to alleged cooling tower emissions at our Corpus Christi West Refinery and alleged flaring emissions at our Texas City Refinery. We are negotiatingsettled this matter with the TCEQ to resolve this matter.
TCEQ (Three Rivers Refinery). In January 2011, we received a proposed agreed order from the TCEQ relating to our Three Rivers Refinery. In the order, the TCEQ alleges unauthorized discharge of wastewater and oily storm water and the unauthorized storage of industrial solid waste. The gross penalty demand is stated to be $105,9 25, but is subject to reduction to $84,740 under certain circumstances. We are in discussions with the TCEQ to resolve this matter.
ITEM 4. RESERVED
in the fourth quarter of 2011.
TCEQ (Three Rivers Refinery). In our quarterly report on Form 10-Q for the quarter ended September 30, 2011, we disclosed that the TCEQ had issued a proposed agreed order to our Three Rivers Refinery for various alleged air violations. We settled this matter with the TCEQ in the first quarter of 2012.
ITEM 4. RESERVED
PART II
ITEM 5. MARKET FOR REGISTRANT’S COMMON EQUITY, RELATED STOCKHOLDER MATTERS, AND ISSUER PURCHASES OF EQUITY SECURITIES
Our common stock trades on the New York Stock Exchange under the symbol “VLO.”
As of January 31, 20112012 there were 7,6607,659 holders of record of our common stock.
The following table shows the high and low sales prices of and dividends declared on our common stock for each quarter of 20102011 and 20092010.
| | | | | Sales Prices of the Common Stock | | Dividends Per Common Share | | Sales Prices of the Common Stock | | Dividends Per Common Share |
| Quarter Ended | | High | | Low | | | High | | Low | |
| 2011: | | | | | | | |
| December 31 | | | $ | 26.70 |
| | $ | 17.17 |
| | $ | 0.15 |
|
| September 30 | | | 26.89 |
| | 17.78 |
| | 0.05 |
|
| June 30 | | | 30.50 |
| | 23.18 |
| | 0.05 |
|
| March 31 | | | 30.73 |
| | 23.19 |
| | 0.05 |
|
| 2010: | | | | | | | | | | | | |
| December 31 | | $ | 23.35 | | | $ | 17.25 | | | $ | 0.05 | | | $ | 23.35 |
| | $ | 17.25 |
| | $ | 0.05 |
|
| September 30 | | 18.31 | | | 15.65 | | | 0.05 | | | 18.31 |
| | 15.65 |
| | 0.05 |
|
| June 30 | | 21.37 | | | 16.36 | | | 0.05 | | | 21.37 |
| | 16.36 |
| | 0.05 |
|
| March 31 | | 20.69 | | | 17.45 | | | 0.05 | | | 20.69 |
| | 17.45 |
| | 0.05 |
|
| 2009: | | | | | | | |
| December 31 | | $ | 20.67 | | | $ | 15.89 | | | $ | 0.15 | | |
| September 30 | | 20.50 | | | 15.57 | | | 0.15 | | |
| June 30 | | 23.30 | | | 16.03 | | | 0.15 | | |
| March 31 | | 25.85 | | | 16.24 | &nb sp; | | 0.15 | | |
On January 25, 2011,24, 2012, our board of directors declared a quarterly cash dividend of $0.05$0.15 per common share payable March 16, 201114, 2012 to holders of record at the close o fof business on February 16, 2011.15, 2012.
Dividends are considered quarterly by the board of directors and may be paid only when approved by the board.
The following table discloses purchases of shares of Valero’s common stock made by us or on our behalf during the fourth quarter of 20102011.
| | | | | | | | | |
| Period | Total Number of Shares Purchased | Average Price Paid per Share | Total Number of Shares Not Purchased as Part of Publicly Announced Plans or Programs (a) | Total Number of Shares Purchased as Part of Publicly Announced Plans or Programs | Approximate Dollar Value of Shares that May Yet Be Purchased Under the Plans or Programs (b) |
| October 2010 | 160,072 | | $ | 18.11 | | 160,072 | | — | | $ 3.46 billion |
| November 2010 | 183,109 | | $ | 18.64 | | 183,109 | | — | | $ 3.46 billion |
| December 2010 | 249,985 | | $ | 21.11 | | 249,985 | | — | &n bsp; | $ 3.46 billion |
| Total | 593,166 | | $ | 19.54 | | 593,166 | | — | | $ 3.46 billion |
|
| | | | | | | | | | |
| Period | Total Number of Shares Purchased | Average Price Paid per Share | Total Number of Shares Not Purchased as Part of Publicly Announced Plans or Programs (a) | Total Number of Shares Purchased as Part of Publicly Announced Plans or Programs | Approximate Dollar Value of Shares that May Yet Be Purchased Under the Plans or Programs (b) |
| October 2011 | 195,078 |
| $ | 25.08 |
| 195,078 |
| — |
| $ 3.46 billion |
| November 2011 | 1,986,045 |
| $ | 23.43 |
| 1,986,045 |
| — |
| $ 3.46 billion |
| December 2011 | 1,338,789 |
| $ | 20.76 |
| 1,338,789 |
| — |
| $ 3.46 billion |
| Total | 3,519,912 |
| $ | 22.51 |
| 3,519,912 |
| — |
| $ 3.46 billion |
(a) The shares reported in this column represent purchases settled in the fourth quarter of 2010 relating to (a) our purchases of shares in open-market transactions to meet our obligations under employee stock | |
| (a) | The shares reported in this column represent purchases settled in the fourth quarter of 2011 relating to (a) our purchases of shares in open-market transactions to meet our obligations under incentive compensation plans, and (b) our purchases of shares from our employees and non-employee directors in connection with the exercise of stock options, the vesting of restricted stock, and other stock compensation transactions in accordance with the terms of our incentive compensation plans. (b) On April 26, 2007, we publicly announced an increase in our common stock purchase program from $2 billion to $6 billion, as authorized by our board of directors on April 25, 2007. The $6 billion common stock purchase program has no expiration date. On February 28, 2008, we announced that our board of directors approved a $3&nbs p;billion common stock purchase program, which is in addition to the $6 billion program. This $3 billion program has no expiration date.
|
| |
| (b) | On April 26, 2007, we publicly announced an increase in our common stock purchase program from $2 billion to $6 billion, as authorized by our board of directors on April 25, 2007. The $6 billion common stock purchase program has no expiration date. On February 28, 2008, we announced that our board of directors approved a $3 billion common stock purchase program, which is in addition to the $6 billion program. This $3 billion program has no expiration date. |
The following p erformanceperformance graph is not “soliciting material,” is not deemed filed with the SEC, and is not to be incorporated by reference into any of Valero’s filings under the Securities Act of 1933 or the Securities Exchange Act of 1934, as amended, respectively.
This performance graph and the related textual information are based on historical data and are not indicative of future performance.
The following line graph compares the cumulative total return1 on an investment in our common stock against the cumulative total return of the S&P 500 Composite Index and an index of peer companies (selected by us)(that we selected) for the five-year period commencing December 31, 20052006 and ending December 31, 20102011. Our peer group consists of the following 13nine companies that are engaged in domestic refining operations:operations in the U.S.: Alon USA Energy, Inc.,; Chevron Corporation, ConocoPhillips,Corporation; CVR Energy, Inc., Ex xon; Exxon Mobil Corporation, Frontier Oil Corporation,Corporation; Hess Corporation, Holly Corporation,Corporation; HollyFrontier Corporation; Marathon Oil Corporation, Murphy Oil Corporation, Sunoco, Inc.,Petroleum Corporation; Tesoro Corporation,Corporation; and Western Refining, Inc. Our peer group previously included ConocoPhillips; Marathon Oil Corporation; Murphy Oil Corporation; and Sunoco, Inc., but they are not included in our current peer group because they have exited or are exiting refining operations in the U.S. Frontier Oil Corporation and Holly Corporation are now represented in our peer group as HollyFrontier Corporation.
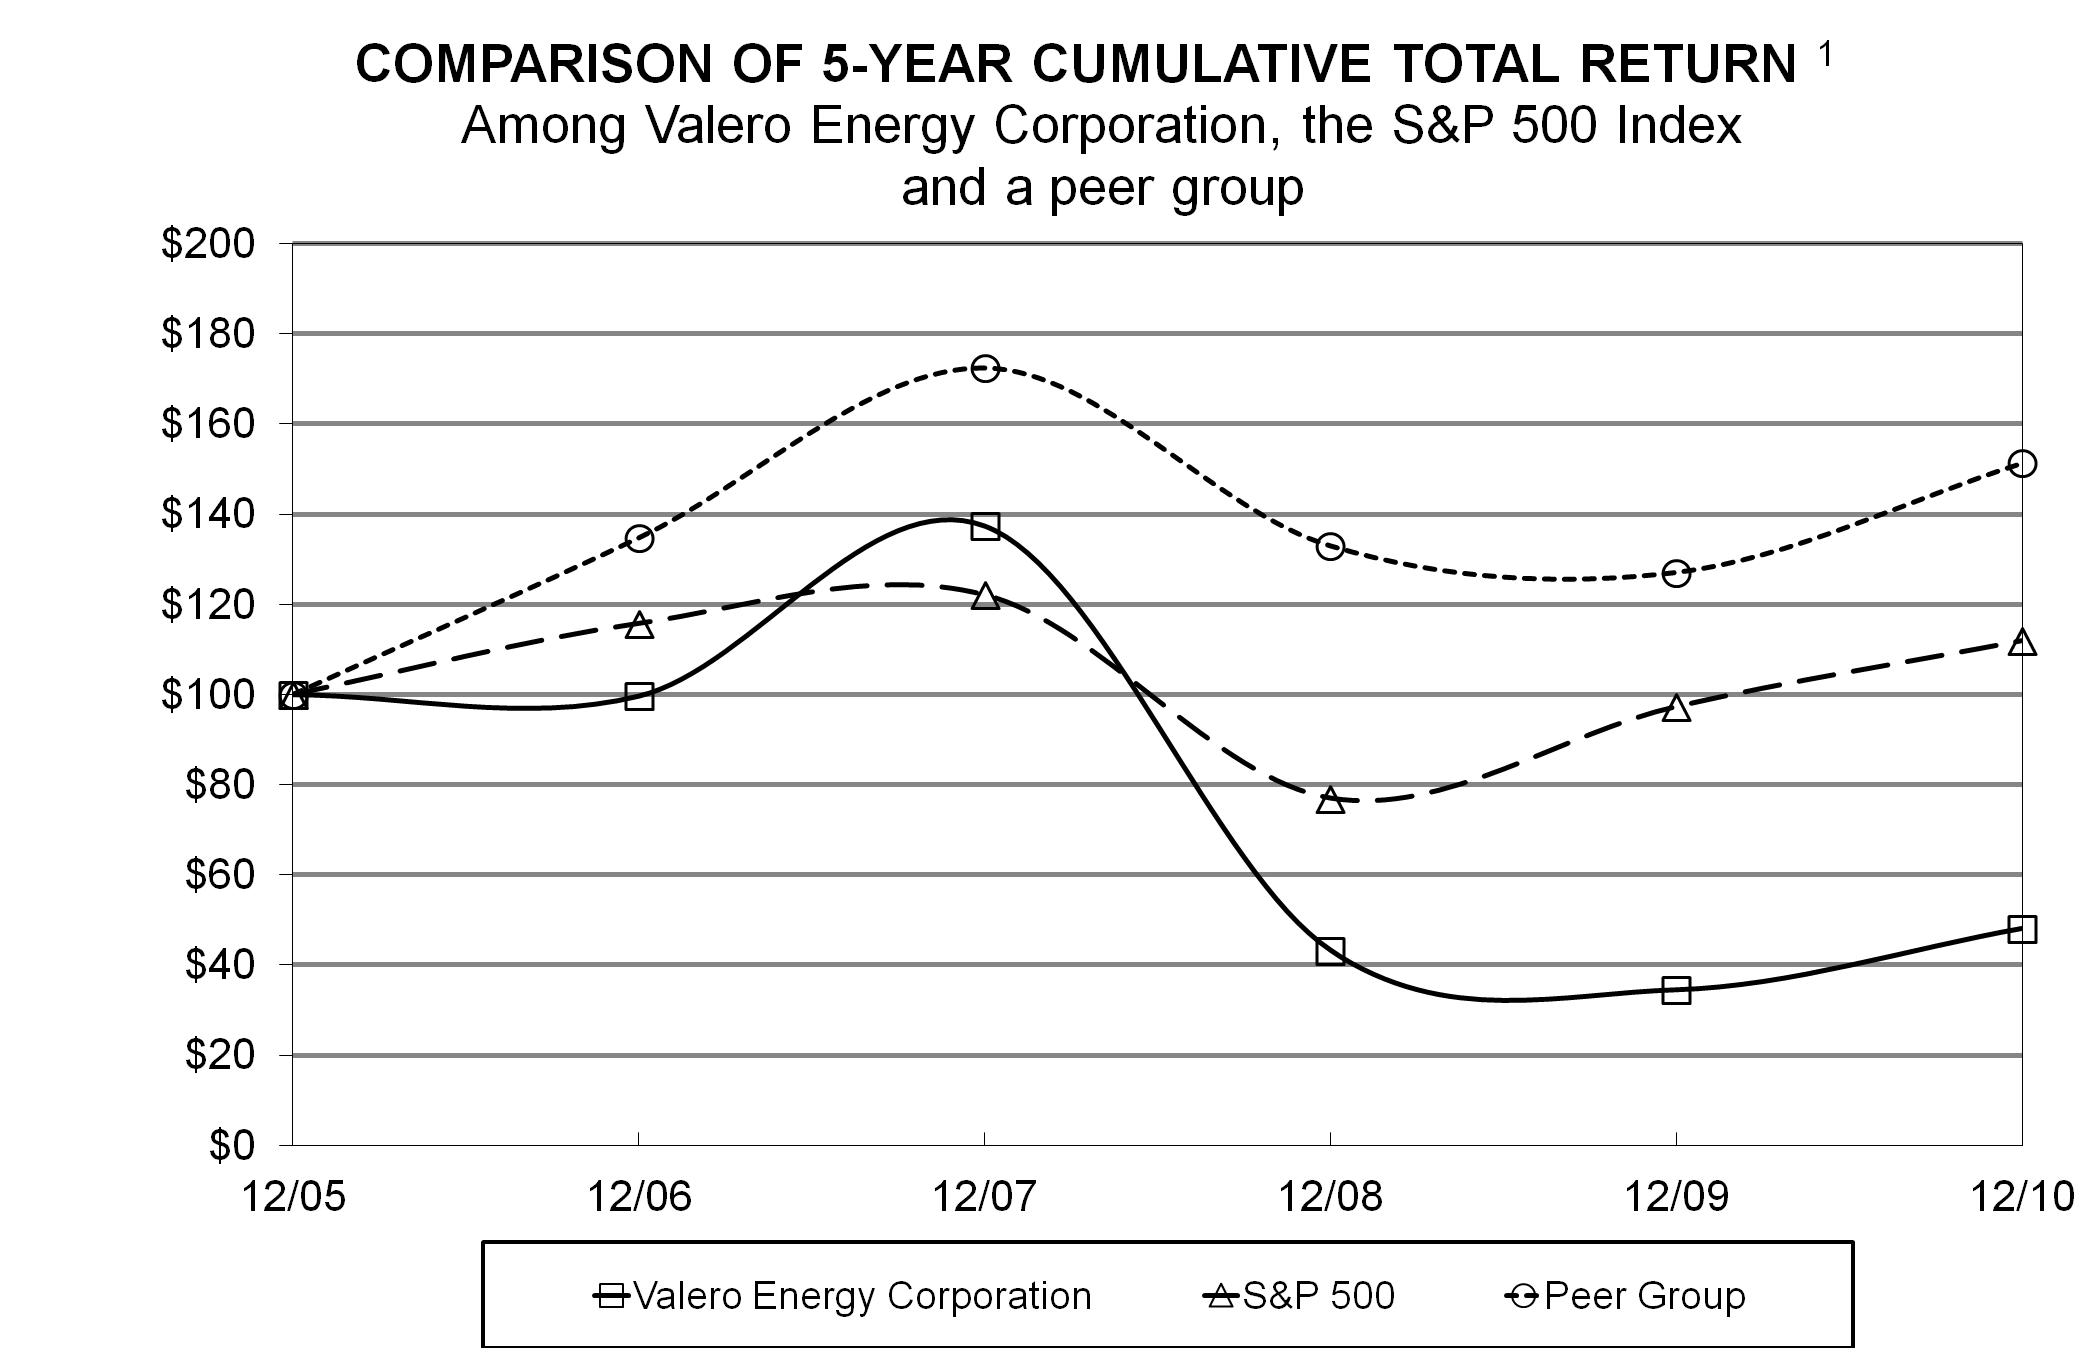
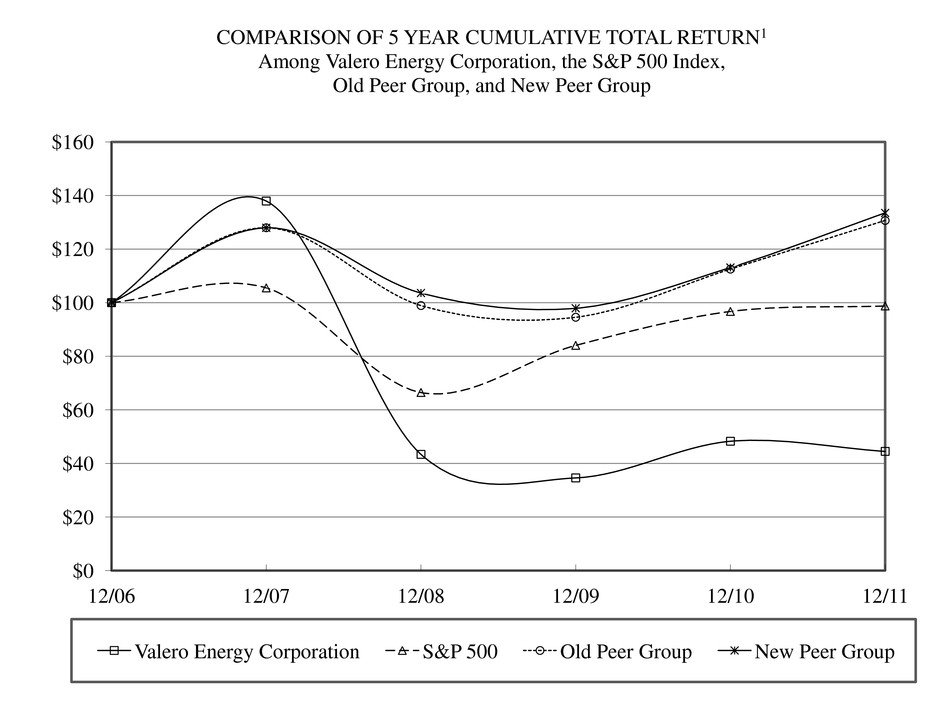
| | | | 12/2005 | | 12/2006 | | 12/2007 | | 12/2008 | | 12/2009 | | 12/2010 | 12/2006 | | 12/2007 | | 12/2008 | | 12/2009 | | 12/2010 | | 12/2011 |
| Valero Common Stock | $ | 100.00 | | | $ | 99.67 | | | $ | 137.46 | | | $ | 43.23 | | | $ | 34.29 | | | $ | 48.12 | | $ | 100.00 |
| | $ | 137.91 |
| | $ | 43.38 |
| | $ | 34.60 |
| | $ | 48.28 |
| | $ | 44.49 |
|
| S&P 500 | 100.00 | | | 115.80 | | | 122.16 | | | 76.96 | | | 97.33 | | | 111.99 | | 100.00 |
| | 105.49 |
| | 66.46 |
| | 84.05 |
| | 96.71 |
| | 98.75 |
|
| Peer Group | 100.00 | | | 134.75 | | | 172.48 | | | 132.99 | | | 127.12 | | | 151.36 | | |
| Old Peer Group | | 100.00 |
| | 127.94 |
| | 98.91 |
| | 94.54 |
| | 112.51 |
| | 130.65 |
|
| New Peer Group | | 100.00 |
| | 127.92 |
| | 103.60 |
| | 97.91 |
| | 113.09 |
| | 133.47 |
|
| |
1Assumes that an investment in Valero common stock and each index was $100 on December 31, 2005. “Cumulative total return” is based on share price appreciation plus reinvestment of dividends from December 31, 2005 through December 31, 2010. | Assumes that an investment in Valero common stock and each index was $100 on December 31, 2006. “Cumulative total return” is based on share price appreciation plus reinvestment of dividends from December 31, 2006 through December 31, 2011. |
ITEM 6. SELECTED FINANCIAL DATA
The selected financial data for the five-year period ended December 31, 20102011 was derived from our audited consolidated financial statements. The following table should be read together with the historical consolidated financial statements and accompanying notes included in Item 8, “Financial Statements and Supplementary Data,” and with Item 7, “Management’s Discussion and Analysis of Financial Condition and Results of Operations.”
The following summaries are in millions of dollars, except for per share amounts:
| | | | Year Ended December 31, | Year Ended December 31, |
| | 2010 (a) (b) | | 2009 (a) (b) | | 2008 (a) | | 2007 (a) | | 2006 (a) | 2011 (a) | | 2010 (b) | | 2009 (b) | | 2008 | | 2007 |
| Operating revenues | $ | 82,233 | | | $ | 64,599 | | | $ | 106,676 | | | $ | 85,079 | | | $ | 78,187 | | $ | 125,987 |
| | $ | 82,233 |
| | $ | 64,599 |
| | $ | 106,676 |
| | $ | 85,079 |
|
| | | | | | | | | | | |
| Operating income | 1,876 | | | 83 | | | 531 | | | 6,375 | | | 7,076 | | |
| | | | | &nbs p; | | | | | | |
Income (loss) from continuing operations | 923 | | | (273 | ) | | (1,154 | ) | | 4,230 | | | 4,866 | | 2,096 |
| | 923 |
| | (273 | ) | | (1,154 | ) | | 4,230 |
|
| | | | | | | | | | | |
Earnings (loss) per common share from continuing operations - assuming dilution | 1.62 | | | (0.50 | ) | | (2.20 | ) | | 7.31 | | | 7.69 | | |
| | | | | | | | | | | |
Earnings per common share from continuing operations - assuming dilution | | 3.69 |
| | 1.62 |
| | (0.50 | ) | | (2.20 | ) | | 7.31 |
|
| Dividends per common share | 0.20 | | | 0.60 | | | 0.57 | | | 0.48 | | | 0.30 | | 0.30 |
| | 0.20 |
| | 0.60 |
| | 0.57 |
| | 0.48 |
|
| | | | | | | | | | | |
| Property, plant and equipment, net | 22,669 | | | 21,615 | | | 20,205 | | | 18,873 | | | 17,419 | | |
| | | | | | | | | | | |
| Goodwill | — | | | — | | | — | | | 3,943 | | | 4,019 | | |
| | | | | | | | | | | |
| Total assets | 37,621 | | | 35,572 | | | 34,417 | | | 42,722 | | | 37,753 | | 42,783 |
| | 37,621 |
| | 35,572 |
| | 34,417 |
| | 42,722 |
|
| | | | | | | | | | | |
Debt and capital lease obligations, less current portion | 7,515 | | | 7,163 | | | 6,264 | | | 6,470 | | | 4,619 | | 6,732 |
| | 7,515 |
| | 7,163 |
| | 6,264 |
| | 6,470 |
|
| | | | | | | | | | | |
| Stockholders’ equity | 15,025 | | | 14,725 | | | 15,620 | | | 18,507 | | | 18,605 | | |
___________________________
| |
| (a) | We acquired the Meraux Refinery on October 1, 2011 and the Pembroke Refinery on August 1, 2011. The information presented in this table excludesfor 2011 includes the results of operations related to the Paulsboro Refinery, which have been presented as discontinued operations due to the sale of the refinery in December 2010. In addition, the assets related to the Paulsboro Refinery have been presented as asse ts held for sale for all years presented. As a result, the property, plant and equipment and goodwill amounts reflected herein have changed from the amounts presented in our annual reportthese acquisitions commencing on Form 10-K for the year ended December 31, 2009.their respective acquisition dates. |
| |
| (b) | We acquired three ethanol plants in the first quarter of 2010 and seven ethanol plants in the second quarter of 2009. The information presented for 2010 and 2009 includes the results of operations of thosethese plants commencing on their respective acquisition closing dates. |
ITEM 7. MANAGEMENT’S DISCUSSION AND ANALYSIS OF FINANCIAL CONDITION AND RESULTS OF OPERATIONS
The following review of our results of operations and financial condition should be read in conjunction with Items 1, 1A, and 2, “Business, Risk Factors, and Properties,” and Item 8, “Financial Statements and Supplementary Data,” included in this report. In the discussions that follow, per-share amounts include the effect of common equivalent shares for periods reflecting income from continuing operations and exclude the effect of common equivalent shares for periods reflecting a loss from continuing operations.
CAUTIONARY STATEMENT FOR THE PURPOSE OF SAFE HARBOR PROVISIONS OF THE PRIVATE SECURITIES LITIGATION REFORM ACT OF 1995
This report, including without limitation our disclosures below under the heading “OVERVIEW AND OUTLOOK,” includes forward-looking statements within the meaning of Section 27A of the Securities Act of 1933 and Section 21E of the Securities Exchange Act of 1934. You can identify our forward-looking statements by the words “anticipate,” “believe,” “expect,” “plan,” “intend,” “estimate,” “project,” “projection,” “predict,” “budget,” “forecast,” “goal,” “guidance,” “target,” “could,” “should,” “may,” and similar expressions.
These forward-looking statements include, among other things, statements regarding:
| |
• | future refining margins, including gasoline and distillate margins; |
| |
• | future retail margins, includ ing gasoline, diesel, home heating oil, and convenience store merchandise margins; |
| |
• | future ethanol margins; |
| |
• | expectations regarding feedstock costs, including crude oil differentials, and operating expenses; |
| |
• | anticipated levels of crude oil and refined product inventories; |
| |
• &nb sp; | our anticipated level of capital investments, including deferred refinery turnaround and catalyst costs and capital expenditures for environmental and other purposes, and the effect of those capital investments on our results of operations; |
| |
• | anticipated trends in the supply of and demand for crude oil and other feedstocks and refined products in the U.S., Canada, and elsewhere; |
| |
• | expectations regarding environmental, tax, and other regulatory initiatives; and |
| |
• | the effect of general economic and other conditions on refining industry fundamentals. |
future refining margins, including gasoline and distillate margins;
future retail margins, including gasoline, diesel, home heating oil, and convenience store merchandise margins;
future ethanol margins;
expectations regarding feedstock costs, including crude oil differentials, and operating expenses;
anticipated levels of crude oil and refined product inventories;
our anticipated level of capital investments, including deferred refinery turnaround and catalyst costs and capital expenditures for environmental and other purposes, and the effect of these capital investments on our results of operations;
anticipated trends in the supply of and demand for crude oil and other feedstocks and refined products globally and in the regions where we operate;
expectations regarding environmental, tax, and other regulatory initiatives; and
the effect of general economic and other conditions on refining, retail, and ethanol industry fundamentals.
We based our forward-looking statements on our current expectations, estimates, and projections about ourselves and our industry. We caution that these statements are not guarantees of future performance and involve risks, uncertainties, and assumptions that we cannot predict. In addition, we based many of these forward-looking statements on assumptions about future events that may prove to be inaccurate. Accordingly, our actual results may differ materially from the future performance that we have expressed or forecast in the forward-looking statements. Differences between actual results and any future performance suggested in these forward-looking statements could result from a variety of factors, including the following:
| |
• | acts of terrorism aimed at either our facilities or other facilities that could impair our ability to produce or transport refined products or receive feedstocks; |
| |
• | political and economic conditions in nations that consume refined products, including the United States, and in crude oil producing regions, including the Middle East and South America; |
| |
• | domestic and foreign demand for, and supplies of, refined products such as gasoline, diesel fuel, jet fuel, home heating oil, and petrochemicals; |
| |
• | domestic and foreign demand for, and supplies of, crude oil and other feedstocks; |
acts of terrorism aimed at either our facilities or other facilities that could impair our ability to produce or transport refined products or receive feedstocks;
political and economic conditions in nations that produce crude oil or consume refined products;
demand for, and supplies of, refined products such as gasoline, diesel fuel, jet fuel, home heating oil, petrochemicals, and ethanol;
demand for, and supplies of, crude oil and other feedstocks;
| |
• | the ability of the members of the Organization of Petroleum Exporting Countries (OPEC) to agree on and to maintain crude oil price and production controls; |
| |
• | the level of consumer demand, including seasonal fluctuations; |
| |
• | refinery overcapacity or undercapacity; |
| |
• | our ability to successfully integrate any acquired businesses into our operations; |
| |
• | the actions taken by competitors, including both pricing and adjustments to refining capacity in response to market conditions; |
| |
• | the level of foreign imports of refined products; |
| |
• | accidents or other unscheduled shutdowns affecting our refineries, machinery, pipelines, or equi pment, or those of our suppliers or customers; |
| |
• | changes in the cost or availability of transportation for feedstocks and refined products; |
| |
• | the price, availability, and acceptance of alternative fuels and alternative-fuel vehicles; |
| |
• | the levels of government subsidies for ethanol and other alternative fuels; |
| |
• | delay of, cancellation of, or failure to implement planned capital projects and realize the various assumptions and benefits projected for such projects or cost overruns in constructing such planned capital projects; |
| |
• | lower than expected ethanol margins; |
| |
• | earthquakes, hurricanes, tornadoes, and irregular weather, which can unforeseeably affect the price or availability of natural gas, crude oil, grain and other feedstocks, and refined products and ethanol; |
| |
• | ru lings, judgments, or settlements in litigation or other legal or regulatory matters, including unexpected environmental remediation costs, in excess of any reserves or insurance coverage; |
| |
• | legislative or regulatory action, including the introduction or enactment of federal, state, municipal, or foreign legislation or rulemakings, including tax and environmental regulations, such as those to be implemented under the California Global Warming Solutions Act (also known as AB32) and the EPA’s regulation of greenhouse gases, which may adverse ly affect our business or operations; |
| |
• | changes in the credit ratings assigned to our debt securities and trade credit; |
| |
• | changes in currency exchange rates, including the value of the Canadian dollar relative to the U.S. dollar; |
| |
• | overall economic conditions, including the stability and liquidity of financial markets; and |
| |
• | other factors generally described in the “Risk Factors” section included in Items 1, 1A and 2, “Business, Risk Factors and Properties” in this report. |
the ability of the members of the Organization of Petroleum Exporting Countries (OPEC) to agree on and to maintain crude oil price and production controls;
the level of consumer demand, including seasonal fluctuations;
refinery overcapacity or undercapacity;
our ability to successfully integrate any acquired businesses into our operations;
the actions taken by competitors, including both pricing and adjustments to refining capacity in response to market conditions;
the levels of competitors’ imports into markets that we supply;
accidents, unscheduled shutdowns, or other catastrophes affecting our refineries, machinery, pipelines, equipment, and information systems, or those of our suppliers or customers;
changes in the cost or availability of transportation for feedstocks and refined products;
the price, availability, and acceptance of alternative fuels and alternative-fuel vehicles;
the levels of government subsidies for ethanol and other alternative fuels;
delay of, cancellation of, or failure to implement planned capital projects and realize the various assumptions and benefits projected for such projects or cost overruns in constructing such planned capital projects;
earthquakes, hurricanes, tornadoes, and irregular weather, which can unforeseeably affect the price or availability of natural gas, crude oil, grain and other feedstocks, and refined products and ethanol;
rulings, judgments, or settlements in litigation or other legal or regulatory matters, including unexpected environmental remediation costs, in excess of any reserves or insurance coverage;
legislative or regulatory action, including the introduction or enactment of legislation or rulemakings by governmental authorities, including tax and environmental regulations, such as those to be implemented under the California Global Warming Solutions Act (also known as AB 32) and the EPA’s regulation of greenhouse gases, which may adversely affect our business or operations;
changes in the credit ratings assigned to our debt securities and trade credit;
changes in currency exchange rates, including the value of the Canadian dollar, the pound sterling, and the euro relative to the U.S. dollar;
overall economic conditions, including the stability and liquidity of financial markets; and
other factors generally described in the “Risk Factors” section included in Items 1, 1A, and 2, “Business, Risk Factors, and Properties” in this report.
Any one of these factors, or a combination of these factors, could materially affect our future results of operations and whether any forward-looking statements ultimately prove to be accurate. Our forward-looking statements are not guarantees of future performance, and actual results and future performance may differ materially from those suggested in any forward-lookin gforward-looking statements. We do not intend to update these statements unless we are required by the securities laws to do so.
All subsequent written and oral forward-looking statements attributable to us or persons acting on our behalf are expressly qualified in their entirety by the foregoing. We undertake no obligation to publicly release any revisions to any such forward-looking statements that may be made to reflect events or circumstances after the date of this report or to reflect the occurrence of unanticipated events.
OVERVIEW AND OUTLOOK
We reported net income attributable to Valero stockholders from continuing operations of$2.1 billion, or $3.69 per share, for the year ended December 31, 2011 compared to $923 million, or $1.62 per share, for the year ended December 31, 2010, compared. The improvement in net income attributable to a lossValero stockholders from continuing operations of $273 million, or $0.50 per share, for the year ended December 31, 2009. These results werein 2011 versus 2010 was primarily due to our refining segment operations, which generatedan increase in operating income of $1.91.8 billion forattributable to the year ended business segments outlined in the following table (in millions):
|
| | | | | | | | | | | | |
| | | Year Ended December 31, |
| | | 2011 | | 2010 | | Change |
| Operating income (loss) by business segment: | | | | | | |
| Refining | | $ | 3,516 |
| | $ | 1,903 |
| | $ | 1,613 |
|
| Retail | | 381 |
| | 346 |
| | 35 |
|
| Ethanol | | 396 |
| | 209 |
| | 187 |
|
| Corporate | | (613 | ) | | (582 | ) | | (31 | ) |
| Total | | $ | 3,680 |
| | $ | 1,876 |
| | $ | 1,804 |
|
December 31, 2010, compared to operating incomeThe increase of $247 million1.6 billion for the year ended December 31, 2009. The increase in refining operating income was primarily due to improved margins for the distillate products we produce and wider sour crude oil differentials. The sour crude oil differential is thefavorable difference between the price of sweet crude oil andoils sourced from the inland U.S., such as West Texas Intermediate (WTI), versus the price of sourbenchmark sweet crude oil. We believe thatoils, such as LLS and Brent. Historically, the improved distillate margins areprice of WTI-type crude oil has closely approximated LLS and Brent crude oils. Due to the significant development of crude oil reserves within the U.S. Mid-Continent region and increased deliveries of crude oil from Canada into the U.S. Mid-Continent region, the increased supply of WTI-type crude oil resulted in WTI-type crude oil being priced at a significant discount to LLS and Brent crude oils for most of 2011 as compared to 2010. Our McKee and Ardmore Refineries in the U.S. Mid-Continent region process WTI-type crude oils and significantly benefited from this favorable price difference.
The increase of $35 million in retail operating income was primarily due to higher fuel margins and volumes in our Canadian operations, including a favorable impact from the strengthening of the Canadian dollar relative to the U.S. dollar.
The increase of $187 million in ethanol operating income was primarily due to improved operating margins combined with an increase in the demand for refined products resulting from the improving U.S. and worldwide economies. Although improving, refined product demand has not returnedproduction volumes to levels experienced prior to the economic slowdown that began in 2008. Excess worldwide refinery capacity and high levelsan average of refined product inventories continue to constrain refined product margins.
In response to the worldwide economic slowdown, and as a result of our assessment of the operating performance and profitability of our refineries, we temporarily shut down our Aruba Refinery in July 2009 and p ermanently shut down our Delaware City Refinery in November 2009. In June 2010, we sold our shutdown Delaware City Refinery assets and associated terminal and pipeline assets for $2203.4 million of cash proceeds, and in December 2010, we sold our Paulsboro Refinery and associated inventory for $547 million of cash proceeds and a $160 million one-year note. Our Aruba Refinery remained idle throughout 2010, but in the third quarter of 2010, we began refinery-wide maintenance to prepare the refinery’s production units for restart due to improved sour crude oil differentials and a general improvement in refining economics. The Aruba Refinery resumed operations in January 2011.
Our retail segment generated operating income of $346 million for the year ended December 31, 2010 compared to operating income of $293 million for the year ended December 31, 2009. The 2010 results benefited from the blending of ethanol into gasoline sold by our retail segment. For most of 2010, ethanol was a lower cost product than gasoline and this lower cost results in an increase in retail fuel margins. During the latter part of 2010, the difference between the cost of gasoline and the cost of et hanol began to narrow and the benefit that our retail segment experienced through most of 2010 from the blending of ethanol into gasoline narrowed. Should this trend continue in 2011, our retail fuel margins may be negatively impacted as compared to 2010.
In the second quarter of 2009, we entered the ethanol business through the acquisition of seven ethanol facilities, and we acquired three additional facilities in the first quarter of 2010. We believe that ethanol is a natural fit for us because we manufacture transportation fuels. During the year ended December 31, 2010, our ethanol segment generated operating in come of $209 million, compared to $165 million for the year ended December 31, 2009.gallons per day. The ethanol business is dependent on margins between ethanol and corn feedstocks and can beis impacted by U.S. government subsidies and biofuels (including ethanol) mandates.
To support our financial strength and liquidity,On August 1, 2011, we issued $1.25 b illion in debt during the first quarter of 2010 at interest rates favorable to those on our existing debt. We used a portionacquired 100 percent of the proceedsoutstanding shares of Chevron Limited from a subsidiary of Chevron Corporation and we subsequently changed the name of Chevron Limited to redeem $484 millionValero Energy Ltd. Valero Energy Ltd owns and operates the Pembroke Refinery. Valero Energy Ltd also owns, directly and through various subsidiaries, an extensive network of debt with a higher interest rate,marketing and logistics assets throughout the remainderU.K. and Ireland. On the acquisition date, we initially paid $1.8 billion from available cash, of which $1.1 billion was used for general corporate purposes. In December 2010,working capital. Subsequent to the acquisition date, we received proceedsrecorded an adjustment to working capital (primarily inventory), resulting in an adjusted purchase price of $300 million under a financing agreement associated with$1.7 billion. This acquisition is referred to as the issuance of $300 million of Gulf Opportunity Zone Revenue Bonds (GO Zone Bonds). In February 2011, we paid $300 million to acquire the GO Zone Bonds, which we expect to hold and reissue in future years to help fund the construction costs of a capital project at our St. Charles Refinery.Pembroke Acquisition.
WeOn October 1, 2011, we acquired the Meraux Refinery and related logistics assets from Murphy Oil Corporation for an initial payment of $586 million, which was funded from available cash. In the fourth quarter of 2011, we recorded an adjustment related to inventories acquired that reduced the purchase price to $547 million.
The benefit we experienced in our refining business for most of 2011 from processing discounted WTI-type crude oils declined significantly during the fourth quarter of 2011 as the premium of LLS and Brent crude oils versus WTI-type crude oil narrowed considerably. In addition, our fourth quarter 2011 results reflected a significant decline in margins for most of the products we produce. Product margins have since improved in early 2012, but we expect the energy markets and margins to be volatile. The U.S. and worldwide economiesrefining business continues to continueexperience capacity rationalization, particularly in Europe, the U.S. East Coast, and the Caribbean, where declining product margins have negatively impacted refineries in those regions. In particular, our Aruba Refinery has been negatively impacted. We restarted the Aruba Refinery in January 2011 after shutting it down temporarily in July 2009, but the refinery has not yet generated positive cash flows on a sustained basis. We are exploring strategic alternatives for the refinery, including alternative feedstocks, configuration changes, and a temporary or permanent shutdown of the refinery facilities. We expect to recover slowly, and we expect refined product demandconclude our evaluation of these strategic alternatives in the first quarter of 2012. A decision to increase. The increasetemporarily or permanently shut down the refinery or a revision to the future operating plans for the refinery that results in anticipated refined product demand isa decrease in future expected to result in an increase in crude oil production, which we believe willcash flows could result in the productionrefinery being impaired. The Aruba Refinery had a net book value of more sour crude oils and continued improvement in sour crude oil differentials. The expected increases in refined product demand and sour crude oil production should favorably impact$958 million as of December 31, 2011; therefore, an impairment loss would be material to our refined product margins. However, we expect thatresults of operations.
As of the current excess global refining capacity will put pressure on refining margins and could result in ongoing production constraints or refinery shutdowns indate of the refining industry. We willfiling of this report, the financial markets continue to optimizeexperience significant volatility and the overall impact on our refining assets based on market conditions.business is uncertain at this time.
RESULTS OF OPERATIONS
The following tables highlight our results of operations, our operating performance, and market prices that directly impact our operations. The narrative following these tables provides an analysis of our results of operations.
20102011 Compared to 20092010
Financial Highlights (a) (b) (c) (d)
(millions of dollars, except per share amounts)
| | | | | | | | | | | |
| | Year Ended December 31, |
| | 2010 | | 2009 | | Change |
| Operating revenues | $ | 82,233 |
| $ | 64,599 | | | $ | 17,634 | |
| Costs and expenses: | | | | | |
| Cost of sales (d) | 74,458 | | | 58,686 | | | 15,772 | |
| Operating expenses: | | | | | |
| Refining | 2,944 | | | 2,880 | | | 64 | |
| Retail (d) | 654 | | | 626 | | | 28 | |
| Ethanol | 363 | | | 169 | | | 194 | |
| General and administrative expenses | 531 | | | 572 | | | (41 | ) |
| Depreciation and amortization expense: | | | | | |
| Refining | 1,210 | | | 1,194 | | | 16 | |
| Retail | 108 | | | 101 | | | 7 | |
| Ethanol | 36 | | | 18 | | | 18 | |
Corporate | 51 | | | 48 | | | 3 | |
Asset impairment loss (e) | 2 | | | 222 | | | (220 | ) |
Total costs and expenses | 80,357 | | | 64,516 | | | 15,841 | |
Operating income | 1,876 | | | 83 | | | 1,793 | |
Other income, net | 106 | | | 17 | | | 89 | |
Interest and debt expense: | | | | | |
Incurred | (574 | ) | | (521 | ) | | (53 | ) |
Capitalized | 90 | | | 105 | | | (15 | ) |
| | | | | |
Income (loss) from continuing operations
before income tax expense (benefit)
| 1,498 | | | (316 | ) | | 1,814 | |
Income tax expense (benefit) | 575 | | | (43 | ) | | 618 | |
Income (loss) from continuing operations | 923 | | | (273 | ) | | 1,196 | |
Loss from discontinued operations, net of income taxes | (599 | ) | | (1,709 | ) | | 1,110 | |
Net income (loss) | $ | 324 | | | $ | (1,982 | ) | | $ | 2,306 | |
Earnings (loss) per common share – assuming dilution: | | | | | |
Continuing operations | $ | 1.62 | | | $ | (0.50 | ) | | $ | 2.12 | |
Discontinued operations | (1.05 | ) | | (3.17 | ) | | 2.12 | |
Total | $ | 0.57 | | | $ | (3.67 | ) | | $ | 4.24 | |
|
| | | | | | | | | | | |
| | Year Ended December 31, |
| | 2011 | | 2010 | | Change |
| Operating revenues | $ | 125,987 |
| | $ | 82,233 |
| | $ | 43,754 |
|
| Costs and expenses: | | | | | |
| Cost of sales | 115,719 |
| | 74,458 |
| | 41,261 |
|
| Operating expenses: | | | | | |
| Refining | 3,406 |
| | 2,944 |
| | 462 |
|
| Retail | 678 |
| | 654 |
| | 24 |
|
| Ethanol | 399 |
| | 363 |
| | 36 |
|
| General and administrative expenses | 571 |
| | 531 |
| | 40 |
|
| Depreciation and amortization expense: | | | | | |
| Refining | 1,338 |
| | 1,210 |
| | 128 |
|
| Retail | 115 |
| | 108 |
| | 7 |
|
| Ethanol | 39 |
| | 36 |
| | 3 |
|
| Corporate | 42 |
| | 51 |
| | (9 | ) |
| Asset impairment loss | — |
| | 2 |
| | (2 | ) |
| Total costs and expenses | 122,307 |
| | 80,357 |
| | 41,950 |
|
| Operating income | 3,680 |
| | 1,876 |
| | 1,804 |
|
| Other income, net | 43 |
| | 106 |
| | (63 | ) |
| Interest and debt expense, net of capitalized interest | (401 | ) | | (484 | ) | | 83 |
|
Income from continuing operations before income tax expense | 3,322 |
| | 1,498 |
| | 1,824 |
|
| Income tax expense | 1,226 |
| | 575 |
| | 651 |
|
| Income from continuing operations | 2,096 |
| | 923 |
| | 1,173 |
|
| Loss from discontinued operations, net of income taxes | (7 | ) | | (599 | ) | | 592 |
|
| Net income | 2,089 |
| | 324 |
| | 1,765 |
|
| Less: Net loss attributable to noncontrolling interests | (1 | ) | | — |
| | (1 | ) |
| Net income attributable to Valero stockholders | $ | 2,090 |
| | $ | 324 |
| | $ | 1,766 |
|
| | | | | | |
| Net income attributable to Valero stockholders: | | | | | |
| Continuing operations | $ | 2,097 |
| | $ | 923 |
| | $ | 1,174 |
|
| Discontinued operations | (7 | ) | | (599 | ) | | 592 |
|
| Total | $ | 2,090 |
| | $ | 324 |
| | $ | 1,766 |
|
| | | | | | |
| Earnings per common share – assuming dilution: | | | | | |
| Continuing operations | $ | 3.69 |
| | $ | 1.62 |
| | $ | 2.07 |
|
| Discontinued operations | (0.01 | ) | | (1.05 | ) | | 1.04 |
|
| Total | $ | 3.68 |
| | $ | 0.57 |
| | $ | 3.11 |
|
________________
See note references on pages 31 and 32.page 33.
Operating Highlights
(millions of dollars, except per barrel andamounts)
|
| | | | | | | | | | | |
| | Year Ended December 31, |
| | 2011 | | 2010 | | Change |
| Refining (a) (b) (c): | | | | | |
| Operating income | $ | 3,516 |
| | $ | 1,903 |
| | $ | 1,613 |
|
| Throughput margin per barrel (e) | $ | 9.30 |
| | $ | 7.80 |
| | $ | 1.50 |
|
| Operating costs per barrel: | | | | | |
| Operating expenses | 3.83 |
| | 3.79 |
| | 0.04 |
|
| Depreciation and amortization expense | 1.51 |
| | 1.56 |
| | (0.05 | ) |
| Total operating costs per barrel | 5.34 |
| | 5.35 |
| | (0.01 | ) |
| Operating income per barrel | $ | 3.96 |
| | $ | 2.45 |
| | $ | 1.51 |
|
| | | | | | |
| Throughput volumes (thousand BPD): | | | | | |
| Feedstocks: | | | | | |
| Heavy sour crude | 454 |
| | 458 |
| | (4 | ) |
| Medium/light sour crude | 442 |
| | 386 |
| | 56 |
|
| Acidic sweet crude | 116 |
| | 60 |
| | 56 |
|
| Sweet crude | 745 |
| | 668 |
| | 77 |
|
| Residuals | 282 |
| | 204 |
| | 78 |
|
| Other feedstocks | 122 |
| | 110 |
| | 12 |
|
| Total feedstocks | 2,161 |
| | 1,886 |
| | 275 |
|
| Blendstocks and other | 273 |
| | 243 |
| | 30 |
|
| Total throughput volumes | 2,434 |
| | 2,129 |
| | 305 |
|
| | | | | | |
| Yields (thousand BPD): | | | | | |
| Gasolines and blendstocks | 1,120 |
| | 1,048 |
| | 72 |
|
| Distillates | 834 |
| | 712 |
| | 122 |
|
| Other products (f) | 494 |
| | 395 |
| | 99 |
|
| Total yields | 2,448 |
| | 2,155 |
| | 293 |
|
See note references on page 33.
Refining Operating Highlights by Region (g)
(millions of dollars, except per gallonbarrel amounts)
| | | | | | | | | | | |
| | Year Ended December 31, |
| | 2010 | | 2009 | | Change |
| Refining (a) (b): | | | | | |
| Operating income (e) | $ | 1,903 | | | $ | 247 | | | $ | 1,656 | |
| Throughput margin per barrel (f) | $ | 7.80 | | | $ | 6.00 | | | $ | 1.80 | |
| Operating costs per barrel (e): | | | | | |
| Operating expenses | $ | 3.79 | | | $ | 3.71 | | | $ | 0.08 | |
| Depreciation and amortization expense | 1.56 | | | 1.55 | | | 0.01 | |
| Total operating costs per barrel | $ | 5.35 | | | $ | 5.26 | | | $ | 0.09 | |
| | | | | | |
| Throughput volumes (thousand barrels per day): | | | | | |
| Feedstocks: | | | | | |
| Heavy sour crude | 458 | | | 457 | | | 1 | |
| Medium/light sour crude | 386 | | | 417 | | | (31 | ) |
| Acidic sweet crude | 60 | | | 64 | | | (4 | ) |
| Sweet crude | 668 | | | 616 | | | 52 | |
| Residuals | 204 | | | 170 | | | 34 | |
| Other feedstocks | 110 | | | 136 | | | (26 | ) |
| Total feedstocks | 1,886 | | & nbsp; | 1,860 | | | 26 | |
| Blendstocks and other | 243 | | | 264 | | | (21 | ) |
| Total throughput volumes | 2,129 | | |
|
| | | | | | | | | | | |
| | Year Ended December 31, |
| | 2011 | | 2010 | | Change |
| U.S. Gulf Coast: (a) | | | | | |
| Operating income | $ | 1,833 |
| | $ | 1,349 |
| | $ | 484 |
|
| Throughput volumes (thousand BPD) | 1,450 |
| | 1,280 |
| | 170 |
|
| Throughput margin per barrel (e) | $ | 8.63 |
| | $ | 8.20 |
| | $ | 0.43 |
|
| Operating costs per barrel: | | | | | |
| Operating expenses | 3.66 |
| | 3.71 |
| | (0.05 | ) |
| Depreciation and amortization expense | 1.50 |
| | 1.60 |
| | (0.10 | ) |
| Total operating costs per barrel | 5.16 |
| | 5.31 |
| | (0.15 | ) |
| Operating income per barrel | $ | 3.47 |
| | $ | 2.89 |
| | $ | 0.58 |
|
| | | | | | |
| U.S. Mid-Continent: | | | | | |
| Operating income | $ | 1,413 |
| | $ | 339 |
| | $ | 1,074 |
|
| Throughput volumes (thousand BPD) | 411 |
| | 398 |
| | 13 |
|
| Throughput margin per barrel (e) | $ | 15.10 |
| | $ | 7.33 |
| | $ | 7.77 |
|
| Operating costs per barrel: | | | | | |
| Operating expenses | 4.15 |
| | 3.60 |
| | 0.55 |
|
| Depreciation and amortization expense | 1.52 |
| | 1.40 |
| | 0.12 |
|
| Total operating costs per barrel | 5.67 |
| | 5.00 |
| | 0.67 |
|
| Operating income per barrel | $ | 9.43 |
| | $ | 2.33 |
| | $ | 7.10 |
|
| | | | | | |
| North Atlantic (b): | | | | | |
| Operating income | $ | 171 |
| | $ | 129 |
| | $ | 42 |
|
| Throughput volumes (thousand BPD) | 317 |
| | 195 |
| | 122 |
|
| Throughput margin per barrel (e) | $ | 5.43 |
| | $ | 6.18 |
| | $ | (0.75 | ) |
| Operating costs per barrel: | | | | | |
| Operating expenses | 3.08 |
| | 2.99 |
| | 0.09 |
|
| Depreciation and amortization expense | 0.87 |
| | 1.39 |
| | (0.52 | ) |
| Total operating costs per barrel | 3.95 |
| | 4.38 |
| | (0.43 | ) |
| Operating income per barrel | $ | 1.48 |
| | $ | 1.80 |
| | $ | (0.32 | ) |
| | | | | | |
| U.S. West Coast: | | | | | |
| Operating income | $ | 99 |
| | $ | 88 |
| | $ | 11 |
|
| Throughput volumes (thousand BPD) | 256 |
| | 256 |
| | — |
|
| Throughput margin per barrel (e) | $ | 8.60 |
| | $ | 7.73 |
| | $ | 0.87 |
|
| Operating costs per barrel: | | | | | |
| Operating expenses | 5.25 |
| | 5.09 |
| | 0.16 |
|
| Depreciation and amortization expense | 2.29 |
| | 1.69 |
| | 0.60 |
|
| Total operating costs per barrel | 7.54 |
| | 6.78 |
| | 0.76 |
|
| Operating income per barrel | $ | 1.06 |
| | $ | 0.95 |
| | $ | 0.11 |
|
| | | | | | |
| Operating income for regions above | $ | 3,516 |
| | $ | 1,905 |
| | $ | 1,611 |
|
| Asset impairment loss applicable to refining | — |
| | (2 | ) | | 2 |
|
| Total refining operating income | $ | 3,516 |
| | $ | 1,903 |
| | $ | 1,613 |
|
2,124 | | | 5 | | | | | | | |
Yields (thousand barrels per day): | | | | | |
Gasolines and blendstocks | 1,048 | | | 1,040 | | | 8 | |
Distillates | 712 | | | 692 | | | 20 | |
Other products (g) | 395 | | | 402 | | | (7 | ) |
Total yields | 2,155 | | | 2,134 | | | 21 | |
| | | | | |
Retail–U.S. (d): | | | | | |
Operating income | $ | 200 | | | $ | 170 | | | $ | 30 | __________ |
Company-operated fuel sites (average) | 990 | | | 999 | | | (9 | ) |
Fuel volumes (gallons per day per site) | 5,086 | | | 4,983 | | | 103 | |
Fuel margin per gallon | $ | 0.140 | | | $ | 0.126 | | | $ | 0.014 | |
Merchandise sales | $ | 1,205 | | | $ | 1,171 | | | $ | 34 | |
Merchandise margin (percentage of sales) | 28.3 | % | | 28.1 | % | | 0.2 | % |
Margin on miscellaneous sales | $ | 86 | | | $ | 87 | | | $ | (1 | ) |
Operating expenses | $ | 412 | | | $ | 405 | | | $ | 7 | |
Depreciation and amortization expense | $ | 73 | | | $ | 70 | | | $ | 3 | |
| | | | | |
Retail–Canada (d): | | | | | |
Operating income | $ | 146 | | | $ | 123 | | | $ | 23 | |
Fuel volumes (thousand gallons per day) | 3,168 | | | 3,159 | | | 9 | |
Fuel margin per gallon | $ | 0.271 | | | $ | 0.247 | | | $ | 0.024 | |
Merchandise sales | $ | 240 | | | $ | 201 | | | $ | 39 | |
Merchandise margin (percentage of sales) | 30.1 | % | | 28.3 | %
| | 1.8 | % |
Margin on miscellaneous sales | $ | 38 | | | $ | 33 | | | $ | 5 | |
Operating expenses | $ | 242 | | | $ | 221 | | | $ | 21 | |
Depreciation and amortization expense | $ | 35 | | | $ | 31 | | | $ | 4 | |
__________See note references on pages 3 1 and 32.page 33.
Average Market Reference Prices and Differentials (h)
(dollars per barrel, except as noted)
|
| | | | | | | | | | | |
| | Year Ended December 31, |
| | 2011 | | 2010 | | Change |
| Feedstocks: | | | | | |
| LLS crude oil | $ | 111.47 |
| | $ | 81.62 |
| | $ | 29.85 |
|
| LLS less WTI crude oil | 16.42 |
| | 2.21 |
| | 14.21 |
|
| LLS less Alaska North Slope (ANS) crude oil | 1.93 |
| | 2.55 |
| | (0.62 | ) |
| LLS less Brent crude oil | 0.54 |
| | 2.09 |
| | (1.55 | ) |
| LLS less Mars crude oil | 4.00 |
| | 3.62 |
| | 0.38 |
|
| LLS less Maya crude oil | 12.72 |
| | 11.34 |
| | 1.38 |
|
| WTI crude oil | 95.05 |
| | 79.41 |
| | 15.64 |
|
| WTI less Mars crude oil | (12.42 | ) | | 1.41 |
| | (13.83 | ) |
| WTI less Maya crude oil | (3.70 | ) | | 9.13 |
| | (12.83 | ) |
| | | | | | |
| Products: | | | | | |
| U.S. Gulf Coast: | | | | | |
| Conventional 87 gasoline less LLS | $ | 5.04 |
| | $ | 5.30 |
| | $ | (0.26 | ) |
| Ultra-low-sulfur diesel less LLS | 13.24 |
| | 8.93 |
| | 4.31 |
|
| Propylene less LLS | 7.69 |
| | 5.71 |
| | 1.98 |
|
| Conventional 87 gasoline less WTI | 21.46 |
| | 7.51 |
| | 13.95 |
|
| Ultra-low-sulfur diesel less WTI | 29.66 |
| | 11.14 |
| | 18.52 |
|
| Propylene less WTI | 24.11 |
| | 7.92 |
| | 16.19 |
|
| U.S. Mid-Continent: | | | | | |
| Conventional 87 gasoline less WTI | 22.37 |
| | 8.20 |
| | 14.17 |
|
| Ultra-low-sulfur diesel less WTI | 31.06 |
| | 11.91 |
| | 19.15 |
|
| North Atlantic: | | | | | |
| Conventional 87 gasoline less Brent | 6.24 |
| | 8.38 |
| | (2.14 | ) |
| Ultra-low-sulfur diesel less Brent | 15.64 |
| | 12.63 |
| | 3.01 |
|
| Conventional 87 gasoline less WTI | 22.12 |
| | 8.50 |
| | 13.62 |
|
| Ultra-low-sulfur diesel less WTI | 31.52 |
| | 12.76 |
| | 18.76 |
|
| U.S. West Coast: | | | | | |
| CARBOB 87 gasoline less ANS | 11.48 |
| | 14.21 |
| | (2.73 | ) |
| CARB diesel less ANS | 18.47 |
| | 13.79 |
| | 4.68 |
|
| CARBOB 87 gasoline less WTI | 25.97 |
| | 13.88 |
| | 12.09 |
|
| CARB diesel less WTI | 32.96 |
| | 13.45 |
| | 19.51 |
|
| New York Harbor corn crush (dollars per gallon) | 0.25 |
| | 0.39 |
| | (0.14 | ) |
__________
See note references on page 33.
Operating Highlights (continued)
(millions of dollars, except per gallon amounts)
| | | | | | | | | | | |
| | Year Ended December 31, |
| | 2010 | | 2009 | | Change |
| Ethanol (c): | | | | | |
| Operating income | $ | 209 | | | $ | 165 | | | $ | 44 | |
| Ethanol production (thousand gallons per day) | 3,021 | | | 1,479 | | | 1,542 | |
| Gross margin per gallon of ethanol production | $ | 0.55 | | | $ | 0.65 | | | $ | (0.10 | ) |
| Operating costs per gallon of ethanol production: | | | | | |
| Operating expenses | $ | 0.33 | | | $ | 0.31 | | | $ | 0.02 | |
| Depreciation and amortization expense | 0.03 | | | 0.03 | | |
— | | Total operating costs per gallon of ethanol production | $ | 0.36 | | | $ | 0.34 | | | $ | 0.02 | |
|
| | | | | | | | | | | |
| | Year Ended December 31, |
| | 2011 | | 2010 | | Change |
| Retail–U.S.: | | | | | |
| Operating income | $ | 213 |
| | $ | 200 |
| | $ | 13 |
|
| Company-operated fuel sites (average) | 994 |
| | 990 |
| | 4 |
|
| Fuel volumes (gallons per day per site) | 5,060 |
| | 5,086 |
| | (26 | ) |
| Fuel margin per gallon | $ | 0.144 |
| | $ | 0.140 |
| | $ | 0.004 |
|
| Merchandise sales | $ | 1,223 |
| | $ | 1,205 |
| | $ | 18 |
|
| Merchandise margin (percentage of sales) | 28.7 | % | | 28.3 | % | | 0.4 | % |
| Margin on miscellaneous sales | $ | 88 |
| | $ | 86 |
| | $ | 2 |
|
| Operating expenses | $ | 416 |
| | $ | 412 |
| | $ | 4 |
|
| Depreciation and amortization expense | $ | 77 |
| | $ | 73 |
| | $ | 4 |
|
| | | | | | |
| Retail–Canada: | | | | | |
| Operating income | $ | 168 |
| | $ | 146 |
| | $ | 22 |
|
| Fuel volumes (thousand gallons per day) | 3,195 |
| | 3,168 |
| | 27 |
|
| Fuel margin per gallon | $ | 0.299 |
| | $ | 0.271 |
| | $ | 0.028 |
|
| Merchandise sales | $ | 261 |
| | $ | 240 |
| | $ | 21 |
|
| Merchandise margin (percentage of sales) | 29.4 | % | | 30.1 | % | | (0.7 | )% |
| Margin on miscellaneous sales | $ | 43 |
| | $ | 38 |
| | $ | 5 |
|
| Operating expenses | $ | 262 |
| | $ | 242 |
| | $ | 20 |
|
| Depreciation and amortization expense | $ | 38 |
| | $ | 35 |
| | $ | 3 |
|
| | | | | | |
| Ethanol (d): | | | | | |
| Operating income | $ | 396 |
| | $ | 209 |
| | $ | 187 |
|
| Ethanol production (thousand gallons per day) | 3,352 |
| | 3,021 |
| | 331 |
|
| Gross margin per gallon of ethanol production (e) | $ | 0.68 |
| | $ | 0.55 |
| | $ | 0.13 |
|
| Operating costs per gallon of production: | | | | | |
| Operating expenses | 0.33 |
| | 0.33 |
| | — |
|
| Depreciation and amortization expense | 0.03 |
| | 0.03 |
| | — |
|
| Total operating costs per gallon of production | 0.36 |
| | 0.36 |
| | — |
|
| Operating income per gallon of production | $ | 0.32 |
| | $ | 0.19 |
| | $ | 0.13 |
|
__________
See note references on pages 31 and 32.page 33.
The following notes relate to references on pages 28 through 32.
| |
| (a) | The financial highlights and operating highlights for the refining segment and U.S. Gulf Coast region include the results of operations of our Meraux Refinery, including related logistics assets, from the date of its acquisition on October 1, 2011 through December 31, 2011. |
| |
| (b) | The financial highlights and operating highlights for the refining segment and North Atlantic region include the results of operations of our Pembroke Refinery, including the related market and logistics business from the date of its acquisition on August 1, 2011 through December 31, 2011. |
| |
| (c) | In 2010, we sold our Paulsboro Refinery and our shutdown Delaware City refinery assets and associated terminal and pipeline assets. The results of operations of these refineries have been presented as discontinued operations for the year ended December 31, 2010. In addition, the operating highlights for the refining segment and North Atlantic region exclude these refineries for the year ended December 31, 2010. |
| |
| (d) | We acquired three ethanol plants in the first quarter of 2010. The information presented includes the results of operations of these plants commencing on their respective acquisition dates. Ethanol production volumes are based on total production during each year divided by actual calendar days per year. |
| |
| (e) | Throughput margin per barrel represents operating revenues less cost of sales of our refining segment divided by throughput volumes. Gross margin per gallon of production represents operating revenues less cost of sales of our ethanol segment divided by production volumes. |
| |
| (f) | Other products primarily include petrochemicals, gas oils, No. 6 fuel oil, petroleum coke, and asphalt. |
| |
| (g) | The regions reflected herein contain the following refineries: the U.S. Gulf Coast region includes the Corpus Christi East, Corpus Christi West, Texas City, Houston, Three Rivers, St. Charles, Aruba, Port Arthur, and Meraux Refineries; the U.S. Mid-Continent region includes the McKee, Ardmore, and Memphis Refineries; the North Atlantic (formerly known as Northeast) region includes the Pembroke and Quebec City Refineries; and the U.S. West Coast region includes the Benicia and Wilmington Refineries. |
| |
| (h) | Average market reference prices for LLS crude oil, along with price differentials between the price of LLS crude oil and other types of crude oil, have been included in the table of Average Market Reference Prices and Differentials. The table also includes price differentials by region between the prices of certain products and the benchmark crude oil that provides the best indicator of product margins for each region. Prior to the first quarter of 2011, feedstock and product differentials were based on the price of WTI crude oil. However, the price of WTI crude oil no longer provides a reasonable benchmark price of crude oil for all regions. Beginning in late 2010, WTI crude oil began to price at a discount to benchmark sweet crude oils, such as LLS and Brent, because of increased WTI supplies resulting from greater U.S. production and increased deliveries of crude oil from Canada into the U.S. Mid-Continent region. Therefore, the use of the price of WTI crude oil as a benchmark price for regions that do not process WTI crude oil is no longer reasonable. |
General
Operating revenues increased 53 percent (or $43.8 billion) for the year ended December 31, 2011 compared to the year ended December 31, 2010 primarily as a result of higher average refined product prices and higher throughput volumes between the two years related to our refining segment operations. The higher throughput volumes resulted primarily from the incremental throughput of 33,000 BPD1 ($1.3 billion of revenue) from the Meraux Refinery, which was acquired on October 1, 2011, incremental throughput of 109,000 BPD1 ($7.5 billion of revenue) from the Pembroke Refinery, which was acquired on August 1, 2011, and incremental throughput of 145,000 BPD ($4.9 billion of revenue) from the Aruba Refinery, which restarted operations in January 2011. Operating income increased $1.8 billion and income from continuing operations before taxes also increased $1.8 billion for the year ended December 31, 2011 compared to the amounts reported for the year ended December 31, 2010 primarily due to a $1.6 billion increase in refining segment operating income discussed below.
_______________
1Calculated based on throughput volumes of the Meraux Refinery and the Pembroke Refinery from the date of their respective acquisitions (October 1, 2011 and August 1, 2011), divided by the number of days during the year ended December 31, 2011.
Refining
Refining segment operating income nearly doubled from $1.9 billion for the year ended December 31, 2010 to $3.5 billion for the year ended December 31, 2011. The $1.6 billion improvement in operating income was due to a $2.2 billion increase in refining margin, partially offset by a $462 million increase in operating expenses.
The $2.2 billion increase in refining margin was primarily due to a 19 percent increase in throughput margin per barrel (a $1.50 per barrel increase between the years). This increase in refining margin was largely driven by an improvement in the U.S. Mid-Continent region, which experienced an increase in its throughput margin per barrel of $7.77. The U.S. Mid-Continent throughput margin per barrel of $15.10 for the year ended December 31, 2011 was more than double the throughput margin per barrel of $7.33 for the year ended December 31, 2010. This increase was due to the substantial discount in the price of WTI-type crude oil, the primary type of crude oil processed by our U.S. Mid-Continent refineries, versus the price of LLS and Brent crude oils. Historically, the price of WTI-type crude oil has closely approximated LLS and Brent crude oils, but due to the significant development of crude oil reserves within the U.S. Mid-Continent region and increased deliveries of crude oil from Canada into the U.S. Mid-Continent region, the increased supply of WTI-type crude oil resulted in WTI-type crude oil being priced at a significant discount to LLS and Brent crude oils during 2011. For example, the WTI-based benchmark reference margin for U.S. Mid-Continent conventional 87 gasoline was $22.37 per barrel for the year ended December 31, 2011 compared to $8.20 per barrel for the year ended December 31, 2010, representing a favorable increase of $14.17 per barrel. In addition, the WTI-based benchmark reference margin for U.S. Mid-Continent ultra-low sulfur diesel (a type of distillate) was $31.06 per barrel for the year ended December 31, 2011 compared to $11.91 per barrel for the year ended December 31, 2010, representing a favorable increase of $19.15 per barrel. We estimate that these increases in gasoline and distillate margins per barrel had a positive impact to our refining margin of approximately $1.1 billion and $1.0 billion, respectively, year over year.
The increase of $462 million in operating expenses discussed above was partially due to $42 million in operating expenses of the Meraux Refinery, which was acquired on October 1, 2011, and $141 million in operating expenses of the Pembroke Refinery, which was acquired on August 1, 2011. The remaining increase of $279 million was due to a $107 million increase in chemicals and catalyst costs, an $86 million increase in employee-related expenses, and a $75 million increase in reliability expenses.
Retail
Retail operating income was $381 million for the year ended December 31, 2011 compared to $346 million for the year ended December 31, 2010. This 10 percent (or $35 million) increase was primarily due to increases in fuel margins of $43 million primarily from our Canadian operations, including a favorable impact from the strengthening of the Canadian dollar relative to the U.S. dollar, and an increase in merchandise margins of $15 million, offset by increased operating expenses of $24 million.
Ethanol
Ethanol segment operating income was $396 million for the year ended December 31, 2011 compared to $209 million for the year ended December 31, 2010. This increase of $187 million was primarily due to a $226 million increase in gross margin, partially offset by a $36 million increase in operating expenses.
Gross margin increased from the year ended December 31, 2010 to the year ended December 31, 2011 due to an increase in ethanol production (a 331,000 gallon per day increase between the years) primarily resulting from the full operation of three additional plants acquired in the first quarter of 2010 and higher utilization rates and increased yields during 2011 combined with a $0.13 per gallon increase in the ethanol gross margin.
The increase in operating expenses was primarily due to $27 million of additional expenses related to the three ethanol plants acquired in the first quarter of 2010. We operated these plants for all of 2011 compared to part of 2010.
Corporate Expenses and Other
General and administrative expenses increased $40 million for the year ended December 31, 2011 compared to the year ended December 31, 2010 due to a $25 million increase in variable compensation expense, $27 million in costs incurred in connection with the Pembroke Acquisition, and a favorable settlement with an insurance company for $40 million recorded in 2010, which reduced general and administrative expenses in 2010. These increases in general and administrative expenses were partially offset by favorable legal settlements of $47 million in 2011.
“Other income, net” for the year ended December 31, 2011 decreased $63 million from the year ended December 31, 2010 due to a pre-tax gain of $55 million related to the sale of our 50 percent interest in Cameron Highway Oil Pipeline Company (CHOPS) recognized in November 2010 and the $16 million effect of earnings on our interest in CHOPS recognized in 2010.
“Interest and debt expense, net of capitalized interest” for the year ended December 31, 2011 decreased $83 million from the year ended December 31, 2010. This decrease is primarily due to an increase of $62 million in capitalized interest related to an increase in capital expenditures between the years and the resumption of construction activity on previously suspended projects combined with a $19 million favorable impact from the decrease in average borrowings.
Income tax expense for the year ended December 31, 2011 increased $651 million from the year ended December 31, 2010 mainly as a result of higher operating income in 2011 and a one-time $20 million income tax benefit recognized in 2010 related to a tax settlement with the Government of Aruba (GOA).
The loss from discontinued operations of $7 million for the year ended December 31, 2011 is primarily due to adjustments to the working capital settlement related to the sale of our Paulsboro Refinery in December 2010. The loss from discontinued operations of $599 million for the year ended December 31, 2010 represents a $47 million after-tax loss from the discontinued operations of the Delaware City and Paulsboro Refineries and a $610 million after-tax loss on the sale of the Paulsboro Refinery, partially offset by a $58 million after-tax gain on the sale of the shutdown refinery assets at Delaware City.
2010 Compared to 2009
Financial Highlights (a) (b) (c)
(millions of dollars, except per share amounts)
|
| | | | | | | | | | | |
| | Year Ended December 31, |
| | 2010 | | 2009 | | Change |
| Operating revenues | $ | 82,233 |
| | $ | 64,599 |
| | $ | 17,634 |
|
| Costs and expenses: | | | | | |
| Cost of sales | 74,458 |
| | 58,686 |
| | 15,772 |
|
| Operating expenses: | | | | | |
| Refining | 2,944 |
| | 2,880 |
| | 64 |
|
| Retail | 654 |
| | 626 |
| | 28 |
|
| Ethanol | 363 |
| | 169 |
| | 194 |
|
| General and administrative expenses | 531 |
| | 572 |
| | (41 | ) |
| Depreciation and amortization expense: | | | | | |
| Refining | 1,210 |
| | 1,194 |
| | 16 |
|
| Retail | 108 |
| | 101 |
| | 7 |
|
| Ethanol | 36 |
| | 18 |
| | 18 |
|
| Corporate | 51 |
| | 48 |
| | 3 |
|
| Asset impairment loss (d) | 2 |
| | 222 |
| | (220 | ) |
| Total costs and expenses | 80,357 |
| | 64,516 |
| | 15,841 |
|
| Operating income | 1,876 |
| | 83 |
| | 1,793 |
|
| Other income, net | 106 |
| | 17 |
| | 89 |
|
| Interest and debt expense, net of capitalized interest | (484 | ) | | (416 | ) | | (68 | ) |
Income (loss) from continuing operations before income tax expense (benefit) | 1,498 |
| | (316 | ) | | 1,814 |
|
| Income tax expense (benefit) | 575 |
| | (43 | ) | | 618 |
|
| Income (loss) from continuing operations | 923 |
| | (273 | ) | | 1,196 |
|
| Loss from discontinued operations, net of income taxes | (599 | ) | | (1,709 | ) | | 1,110 |
|
| Net income (loss) | 324 |
| | (1,982 | ) | | 2,306 |
|
| Less: Net loss attributable to noncontrolling interests | — |
| | — |
| | — |
|
| Net income (loss) attributable to Valero stockholders | $ | 324 |
| | $ | (1,982 | ) | | $ | 2,306 |
|
| | | | | | |
| Net income (loss) attributable to Valero stockholders: | | | | | |
| Continuing operations | $ | 923 |
| | $ | (273 | ) | | $ | 1,196 |
|
| Discontinued operations | (599 | ) | | (1,709 | ) | | 1,110 |
|
| Total | $ | 324 |
| | $ | (1,982 | ) | | $ | 2,306 |
|
| | | | | | |
| Earnings per common share – assuming dilution: | | | | | |
| Continuing operations | $ | 1.62 |
| | $ | (0.50 | ) | | $ | 2.12 |
|
| Discontinued operations | (1.05 | ) | | (3.17 | ) | | 2.12 |
|
| Total | $ | 0.57 |
| | $ | (3.67 | ) | | $ | 4.24 |
|
__________
See note references on page 41.
Operating Highlights
(millions of dollars, except per barrel amounts) |
| | | | | | | | | | | |
| | Year Ended December 31, |
| | 2010 | | 2009 | | Change |
| Refining (a) (b): | | | | | |
| Operating income (d) | $ | 1,903 |
| | $ | 247 |
| | $ | 1,656 |
|
| Throughput margin per barrel (e) | $ | 7.80 |
| | $ | 6.00 |
| | $ | 1.80 |
|
| Operating costs per barrel (d): | | | | | |
| Operating expenses | 3.79 |
| | 3.71 |
| | 0.08 |
|
| Depreciation and amortization expense | 1.56 |
| | 1.55 |
| | 0.01 |
|
| Total operating costs per barrel | 5.35 |
| | 5.26 |
| | 0.09 |
|
| Operating income per barrel | $ | 2.45 |
| | $ | 0.74 |
| | $ | 1.71 |
|
| | | | | | |
| Throughput volumes (thousand BPD): | | | | | |
| Feedstocks: | | | | | |
| Heavy sour crude | 458 |
| | 457 |
| | 1 |
|
| Medium/light sour crude | 386 |
| | 417 |
| | (31 | ) |
| Acidic sweet crude | 60 |
| | 64 |
| | (4 | ) |
| Sweet crude | 668 |
| | 616 |
| | 52 |
|
| Residuals | 204 |
| | 170 |
| | 34 |
|
| Other feedstocks | 110 |
| | 136 |
| | (26 | ) |
| Total feedstocks | 1,886 |
| | 1,860 |
| | 26 |
|
| Blendstocks and other | 243 |
| | 264 |
| | (21 | ) |
| Total throughput volumes | 2,129 |
| | 2,124 |
| | 5 |
|
| | | | | | |
| Yields (thousand BPD): | | | | | |
| Gasolines and blendstocks | 1,048 |
| | 1,040 |
| | 8 |
|
| Distillates | 712 |
| | 692 |
| | 20 |
|
| Other products (f) | 395 |
| | 402 |
| | (7 | ) |
| Total yields | 2,155 |
| | 2,134 |
| | 21 |
|
| | | | | | |
__________
See note references on page 41.
Refining Operating Highlights by Region (e) (h)(d) (g)
(millions of dollars, except per barrel amounts)
| | | Year Ended December 31, | | | | | | | |
| | 2010 | | 2009 | | Change | Year Ended December 31, |
| Gulf Coast: | | | | | | |
| | | 2010 | | 2009 | | Change |
| U.S. Gulf Coast: | | | | | | |
| Operating income (loss) | $ | 1,349 | | | $ | (56 | ) | | $ | 1,405 | | $ | 1,349 |
| | $ | (56 | ) | | $ | 1,405 |
|
| Throughput volumes (thousand barrels per day) | 1,280 | | | 1,274 | | | 6 | | |
| Throughput margin per barrel (f) | $ | 8.20 | | | $ | 5.13 | | | $ | 3.07 | | |
| Throughput volumes (thousand BPD) | | 1,280 |
| | 1,274 |
| | 6 |
|
| Throughput margin per barrel (e) | | $ | 8.20 |
| | $ | 5.13 |
| | $ | 3.07 |
|
| Operating costs per barrel: | | | | | | | | | | |
| Operating expenses | $ | 3.71 | | | $ | 3.71 | | | $ | — | | 3.71 |
| | 3.71 |
| | — |
|
| Depreciation and amortization expense | 1.60 | | | 1.54 | | | 0.06 | | 1.60 |
| | 1.54 |
| | 0.06 |
|
| Total operating costs per barrel | $ | 5.31 | | | $ | 5.25 | | | $ | 0.06 | | 5.31 |
| | 5.25 |
| | 0.06 |
|
| Mid-Continent: | | | | | | |
| Operating income (loss) per barrel | | $ | 2.89 |
| | $ | (0.12 | ) | | $ | 3.01 |
|
| | | | | | | |
| U.S. Mid-Continent: | | | | | | |
| Operating income | $ | 339 | | | $ | 189 | | | $ | 150 | | $ | 339 |
| | $ | 189 |
| | $ | 150 |
|
| Throughput volumes (thousand barrels per day) | 398 | | | 387 | | | 11 | | |
| Throughput margin per barrel (f) | $ | 7.33 | | | $ | 6.52 | | | $ | 0.81 | | |
| Throughput volumes (thousand BPD) | | 398 |
| | 387 |
| | 11 |
|
| Throughput margin per barrel (e) | | $ | 7.33 |
| | $ | 6.52 |
| | $ | 0.81 |
|
| Operating costs per barrel: | | | | | | | | | | |
| Operating expenses | $ | 3.60 | | | $ | 3.66 | | | $ | (0.06 | ) | 3.60 |
| | 3.66 |
| | (0.06 | ) |
| Depreciation and amortization expense | 1.40 | | | 1.53 | | | (0.13 | ) | 1.40 |
| | 1.53 |
| | (0.13 | ) |
| Total operating costs per barrel | $ | 5.00 | | | $ | 5.19 | | | $ | (0.19 | ) | 5.00 |
| | 5.19 |
| | (0.19 | ) |
| Northeast (a) (b): | | | | | | |
| Operating income per barrel | | $ | 2.33 |
| | $ | 1.33 |
| | $ | 1.00 |
|
| | | | | | | |
| North Atlantic (a) (b): | | | | | | |
| Operating income | $ | 129 | | | $ | 196 | | | $ | (67 | ) | $ | 129 |
| | $ | 196 |
| | $ | (67 | ) |
| Throughput volumes (thousand barrels per day) | 195 | | | 196 | | | (1 | ) | |
| Throughput margin per barrel (f) | $ | 6.18 | | | $ | 6.36 | | | $ | (0.18 | ) | |
| Throughput volumes (thousand BPD) | | 195 |
| | 196 |
| | (1 | ) |
| Throughput margin per barrel (e) | | $ | 6.18 |
| | $ | 6.36 |
| | $ | (0.18 | ) |
| Operating costs per barrel: | | | | | | | | | | |
| Operating expenses | $ | 2.99 | | | $ | 2.31 | | | $ | 0.68 | | 2.99 |
| | 2.31 |
| | 0.68 |
|
| Depreciation and amortization expense | 1.39 | | | 1.33 | | | 0.06 | | 1.39 |
| | 1.33 |
| | 0.06 |
|
| Total operating costs per barrel | $ | 4.38 | | | $ | 3.64 | | | $ | 0.74 | | 4.38 |
| | 3.64 |
| | 0.74 |
|
| West Coast: | | | | | | |
| Operating income per barrel | | $ | 1.80 |
| | $ | 2.72 |
| | $ | (0.92 | ) |
| | | | | | | |
| U.S. West Coast: | | | | | | |
| Operating income | $ | 88 | | | $ | 252 | | | $ | (164 | ) | $ | 88 |
| | $ | 252 |
| | $ | (164 | ) |
| Throughput volumes (thousand barrels per day) | 256 | | | 267 | | | (11 | ) | |
| Throughput margin per barrel (f) | $ | 7.73 | | | $ | 9.16 | | | $ | (1.43 | ) | |
| Throughput volumes (thousand BPD) | | 256 |
| | 267 |
| | (11 | ) |
| Throughput margin per barrel (e) | | $ | 7.73 |
| | $ | 9.16 |
| | $ | (1.43 | ) |
Operating costs per barrel: | | | | | | | | | | |
| Operating expenses | $ | 5.09 | | | $ | 4.83 | | | $ | 0.26 | | 5.09 |
| | 4.83 |
| | 0.26 |
|
| Depreciation and amortization expense | 1.69 | | | 1.74 | | | (0.05 | ) | 1.69 |
| | 1.74 |
| | (0.05 | ) |
| Total operating cos ts per barrel | $ | 6.78 | | | $ | 6.57 | | | $ | 0.21 | | |
| Total operating costs per barrel | | 6.78 |
| | 6.57 |
| | 0.21 |
|
| Operating income per barrel | | $ | 0.95 |
| | $ | 2.59 |
| | $ | (1.64 | ) |
| | | | | | | |
| Operating income for regions above | $ | 1 ,905 | | | $ | 581 | | | $ | 1,324 | | $ | 1,905 |
| | $ | 581 |
| | $ | 1,324 |
|
| Asset impairment loss applicable to refining | (2 | ) | | (220 | ) | | 218 | | (2 | ) | | (220 | ) | | 218 |
|
| Loss contingency accrual related to Aruba tax matter (i) | — | | | (114 | ) | | 114 | | |
| Loss contingency accrual related to Aruba tax matter (h) | | — |
| | (114 | ) | | 114 |
|
| Total refining operating income | $ | 1,903 | | | $ | 247 | | | $ | 1,656 | | $ | 1,903 |
| | $ | 247 |
| | $ | 1,656 |
|
__________
See note references on pages 31 and 32.page 41.
Average Market Reference Prices and Differentials
(dollars per barrel, except as noted)
| | | | Year Ended December 31, | Year Ended December 31, |
| | 2010 | | 2009 | | Change | 2010 | | 2009 | | Change |
| Feedstocks: | | | | | | | | | | |
| West Texas Intermediate (WTI) crude oil | $ | 79.41 | | | $ | 61.69 | | | $ | 17.72 | | |
| Louisiana Light Sweet crude oil | 81.62 | | | 62.25 | | | 19.37 | | |
| LLS crude oil | | $ | 81.62 |
| | $ | 62.25 |
| | $ | 19.37 |
|
| LLS less WTI crude oil | | 2.21 |
| | 0.56 |
| | 1.65 |
|
| WTI crude oil | | 79.41 |
| | 61.69 |
| | 17.72 |
|
| WTI less Mars crude oil | 1.41 | | | 1.36 | | | 0.05 | | 1.41 |
| | 1.36 |
| | 0.05 |
|
| WTI less Maya crude oil | 9.13 | | | 5.19 | | | 3.94 | | 9.13 |
| | 5.19 |
| | 3.94 |
|
| | | | | | | | | | | |
| Products: | | | | | | | | | | |
| U.S. Gulf Coast: | | | | | | | | | | |
| Conventional 87 gasoline less WTI | 7.51 | | | 7.61 | | | (0.10 | ) | $ | 7.51 |
| | $ | 7.61 |
| | $ | (0.10 | ) |
| Ultra-low-sulfur diesel less WTI | 11.14 | | | 8.02 | | | 3.12 | | 11.14 |
| | 8.02 |
| | 3.12 |
|
| Propylene less WTI | 7.92 | | | (1.31 | ) | | 9.23 | | 7.92 |
| | (1.31 | ) | | 9.23 |
|
| U.S. Mid-Continent: | | | | | | | | | | |
| Conventional 87 gasoline less WTI | 8.20 | | | 8.01 | | | 0.19 | | 8.20 |
| | 8.01 |
| | 0.19 |
|
| Ultra-low-sulfur diesel less WTI | 11.91 | | | 8.26 | | | 3.65 | | 11.91 |
| | 8.26 |
| | 3.65 |
|
| U.S. Northeast: | | | | | | |
| North Atlantic: | | | | | | |
| Conventional 87 gasoline less WTI | 8.50 | | | 7.99 | | | 0.51 | | 8.50 |
| | 7.99 |
| | 0.51 |
|
| Ultra-low-sulfur diesel less WTI | 12.76 | | | 9.55 | | | 3.21 | | 12.76 |
| | 9.55 |
| | 3.21 |
|
| U.S. West Coast: | | | | | | | | | | |
| CARBOB 87 gasoline less WTI | 13.88 | | | 15.75 | | | (1.87 | ) | 13.88 |
| | 15.75 |
| | (1.87 | ) |
| CARB diesel less WTI | 13.45 | | | 9.86 | | | 3.59 | | 13.45 |
| | 9.86 |
| | 3.59 |
|
| New York Harbor corn crush (dollars per gallon) | 0.39 | | | 0.47 | | | (0.08 | ) | 0.39 |
| | 0.47 |
| | (0.08 | ) |
__________
See note references on page 41.
Operating Highlights
(millions of dollars, except per gallon amounts)
|
| | | | | | | | | | | |
| | Year Ended December 31, |
| | 2010 | | 2009 | | Change |
| Retail–U.S.: | | | | | |
| Operating income | $ | 200 |
| | $ | 170 |
| | $ | 30 |
|
| Company-operated fuel sites (average) | 990 |
| | 999 |
| | (9 | ) |
| Fuel volumes (gallons per day per site) | 5,086 |
| | 4,983 |
| | 103 |
|
| Fuel margin per gallon | $ | 0.140 |
| | $ | 0.126 |
| | $ | 0.014 |
|
| Merchandise sales | $ | 1,205 |
| | $ | 1,171 |
| | $ | 34 |
|
| Merchandise margin (percentage of sales) | 28.3 | % | | 28.1 | % | | 0.2 | % |
| Margin on miscellaneous sales | $ | 86 |
| | $ | 87 |
| | $ | (1 | ) |
| Operating expenses | $ | 412 |
| | $ | 405 |
| | $ | 7 |
|
| Depreciation and amortization expense | $ | 73 |
| | $ | 70 |
| | $ | 3 |
|
| | | | | | |
| Retail–Canada: | | | | | |
| Operating income | $ | 146 |
| | $ | 123 |
| | $ | 23 |
|
| Fuel volumes (thousand gallons per day) | 3,168 |
| | 3,159 |
| | 9 |
|
| Fuel margin per gallon | $ | 0.271 |
| | $ | 0.247 |
| | $ | 0.024 |
|
| Merchandise sales | $ | 240 |
| | $ | 201 |
| | $ | 39 |
|
| Merchandise margin (percentage of sales) | 30.1 | % | | 28.3 | % | | 1.8 | % |
| Margin on miscellaneous sales | $ | 38 |
| | $ | 33 |
| | $ | 5 |
|
| Operating expenses | $ | 242 |
| | $ | 221 |
| | $ | 21 |
|
| Depreciation and amortization expense | $ | 35 |
| | $ | 31 |
| | $ | 4 |
|
| | | | | | |
| Ethanol (c): | | | | | |
| Operating income | $ | 209 |
| | $ | 165 |
| | $ | 44 |
|
| Ethanol production (thousand gallons per day) | 3,021 |
| | 1,479 |
| | 1,542 |
|
| Gross margin per gallon of ethanol production (e) | $ | 0.55 |
| | $ | 0.65 |
| | $ | (0.10 | ) |
| Operating costs per gallon of ethanol production: | | | | | |
| Operating expenses | 0.33 |
| | 0.31 |
| | 0.02 |
|
| Depreciation and amortization expense | 0.03 |
| | 0.03 |
| | — |
|
| Total operating costs per gallon of production | 0.36 |
| | 0.34 |
| | 0.02 |
|
| Operating income per gallon of production | $ | 0.19 |
| | $ | 0.31 |
| | $ | (0.12 | ) |
__________
See note references on page 41.
The following notes relate to references on pages 2736 through 31.40.
| |
| (a) | OnIn December 17, 2010, we sold our Paulsboro Refinery and associated inventory to PBF Holding Company LLC (PBF Holding) for $547 million of cash proceeds and a $160 million one-year note, resulting in a pre-tax loss on the sale of $980 million ($610 million after taxes). The results of operations of the refinery, including the loss on the sale, have been presented as discontinued operations for both years presented. The refining segment and NortheastNorth Atlantic Region operating highlights exclude the Paulsboro Refinery for both years presented.
|
| |
| (b) | During the fourth quarter of 2009, we permanently shut down our Delaware City Refinery and wrote down the book value of the refinery assets to net realizable value, resulting in a pre-tax loss on the shutdown of $1.9$1.9 billion ($ ($1.2 billion after taxes). OnIn June 1, 2010, we sold the shutdown refinery assets and associated terminal and pipeline assets to wholly owned subsidiaries of PBF Energy Partners LP (PBF) for $220 million of cash proceeds, resulting in a pre-tax gain on the sale of the refinery assets of $92 million ($58 million after taxes) and an insignificant gain on the sale of the terminal and pipeline assets. The results of operations of the shutdown refinery, including the gain on the sale in 2010 and the loss on the shutdown in 2009, have been presented as discontinued operations for both years presented. The ref iningrefining segment and NortheastNorth Atlantic Region operating highlights exclude the Delaware City Refinery for both years presented. The terminal and pipeline assets associated with the refinery were not shut down in 2009 and continued to be operated until they were sold; the results of these operations are reflected in continuing operations for both years presented. |
| |
| (c) | We acquired three ethanol plants in the first quarter of 2010 and seven ethanol plants in the second quarter of 2009. The information presented includes the results of operations of thosethese plants comme ncingcommencing on their respective acquisition or closing dates. Ethanol production volumes are based on total production during each year divided by actual calendar days per year. |
| |
| (d) | Credit card transactions processing fees incurred by our retail segment of $76 million for the year ended December 31, 2009 have been reclassified from retail operating expenses to cost of sales. The Retail–U.S. and Retail–Canada operating highlights
|
have been restated to reflect this reclassification.
| |
(e) | The asset impairment loss relates primarily to the permanent cancellation of certain capital projects classified as “construction in progress” as a result of the unfavorable impact of the economic slowdown on refining industry fundamentals. The asset impairment loss amounts are included in the refining segment operating income but are excluded from the regional operating income amounts and the consolidated and regional operating costs per barrel. |
| |
(f) (e) | Throughput margin per barrel represents operating revenues less cost of sales of our refining segment divided by throughput volumes. Gross margin per gallon of production represents operating revenues less cost of sales of our ethanol segment divided by production volumes. |
| |
(g) (f) | Other produc tsproducts primarily include petrochemicals, gas oils, No. 6 fuel oil, petroleum coke, and asphalt. |
| |
(h) (g) | The refining regions reflected herein contain the following refineries: the U.S. Gulf Coast refining region includes the Corpus Christi East, Corpus Christi West, Texas City, Houston, Three Rivers, St. Charles, Aruba, and Port Arthur Refineries; the U.S. Mid-Continent refining region includes the McKee, Ardmore, and Memphis Refineries; the Northeast refiningNorth Atlantic region includes the Quebec City Refinery; and the U.S. West Coast refining region includes the Benicia and Wilm ingtonWilmington Refineries. |
| |
(i) (h) | A loss contingency accrual of $140 million was recorded in the third quarter of 2009 related to our dispute with the Government of Aruba (GOA)GOA regarding a turnover tax on export sales as well as other tax matters. The portion of the loss contingency accrual that relates to the turnover tax was recorded in cost of sales duringfor the year ended December 31, 2009,, and therefore is included in refining operating income (loss) but has been excluded in determining throughput margin per barrel. |
General
Operating revenues increased 27 percent (or (or $17.6 billion)$17.6 billion) for the year ended December 31, 2010 compared to the year ended December 31, 2009 primarily as a result of higher average refined product prices between the two years. Operating income increased $1.8 billion and income from continuing operations before taxes also increased $1.8$1.8 billion for the year ended December 31, 2010, compared to the amounts reported for the year ended December 31, 2009, primarily due to a $1.7 billion increase in refining segment operating income discussed below.
Refining
Operating income for our refining segment increased from $247 million for the year ended December 31, 2009 to $1.9 billion for the year ended December 31, 2010, primarily due to an overall improvement in operating results of $1.3 billion (discussed below), reduced asset impairment lossesloss of $218 million, and the nonrecurrence of a $114 million loss contingency accrual in 2009. The asset impairment loss recorded in 2009 related to our decision to p ermanentlypermanently cancel certain construction projects in response to the economic slowdown that began in 2008. We continuecontinued to evaluate our ongoing construction projects during 2009 and 2010, but the number and significance of projects cancelled has substantially declined in 2010. The loss contingency accrual recorded in the third quarter of 2009 related to our dispute of a turnover tax on export sales in Aruba.
The $1.3 billion improvement in operating results was primarily due to a 30 percent increa se increase in throughput margin per barrel (an overall $1.80 per barrel increase between the comparable years). The increase in throughput margin per barrel was caused by a significant improvement in distillate margins and petrochemical (primarily propylene) margins, but thosethese improvements were somewhat offset by a decline in gasoline margins in two of our refining regions. Throughput margin per barrel also benefited from wider sour crude oil differentials. The impact of these factors on our throughput margin per barrel is described below.
Changes in the margin that we receive for our products have a material impact on our resul tsresults of operations. For example, the WTI-based benchmark reference margin for U.S. Gulf Coast ultra-low-sulfur diesel which is a type of distillate, was $11.14 per barrel for the year ended December 31, 2010, compared to $8.02 per barrel for the year ended December 31, 2009, representing a favorable increase of $3.12 per barrel. Similar increases in distillate margins were experienced in other regions. We estimate that the increase in margin for distillates had an $820 million positive impact toon our overall refining margin, year over year, as we produced 712,000 barrels per dayBPD of distillates during the year ended December 31, 2010. Similarly, the WTI-based benchmark reference margin for U.S. Gulf Coast propylene was $7.92$7.92 per barrel for the year ended December 31, 2010, compared to a negative margin of $1.31$1.31 for the year ended December 31, 2009, representing a favorable increase of $9.23$9.23 per barrel. We estimate that the increase in margin for petrochemicals (primarily propylene) had a $199 million positive impact on our refining margin, year over year. Distillate and propylene margins
were higher in 2010 as compared to 2009 due to an increase in the industrial demand for these products resulting from the ongoing recovery of the U.S. and worldwide economies and exports.
The WTI-based benchmark reference margin for U.S. Gulf Coast Conventionalconventional 87 gasoline (Gulf Coast 87 gasoline) was $7.51 per barrel for the year ended December 31, 2010, compared to $7.61 per barrel for the year ended December 31, 2009, representing an unfavorable decrease of $0.10 per barrel. The WTI-based CARBOB 87 gasoline benchmark reference margins decreased year over year to an even greater extent in the U.S. West Coast region (a $1.87 per barrel unfavorable decrease). We estimate that the decrease in gasoline margins had a $119 million negative impact to our overall refining margin, year over year, as we produced 1.05 million barrels per dayBPD of gasoline during the year ended December 31, 2010.2010. Gasoline margins were lower in 2010 as compared to 2009 despite an increase in gasoline prices during 2010. We believe that the margins for gasoline were constrained due to continued weak consumer demand and high levels of inventory. In addition, our downstream customers increased the use of ethanol as a component in transportation fuels because its price was lower than the price of gasoline.
For the year ended December 31, 2010, the differential applicable to the price of sour crude oil as compared to the price of sweet crude oil was wider than the differential for the year ended December 31, 2009. For example, Maya crude oil, which is a type of sour crude oil, sold at a discount of $9.13 per barrel to WTI crude oil, a type of sweet crude oil, during the year ended December 31, 2010. This comparescompared to a discount of $5.19 per barrel during the year ended December 31, 2009, representing a favorable increase of $3.94 per barrel. The benefit of this wider differential, however, was offset by a reduction of 30,000 barrels per dayBPD of sour crude oil that we processed during 2010 as compared to 2009. We estimate that the wider differentials for all types of sour crude oil that we process, offset by reduced throughput volumes, had a $196 million positive impact to our overall refining margin for 2010 as we processed 844,000 barrels per dayBPD of sour crude oils.
Retail
Retail operating income wa swas $346 million for the year ended December 31, 2010 compared to $293 million for the year ended December 31, 2009. This 18 percent (or $53 million)$53 million) increase was primarily due to increases in retail fuel margins of $57 million and merchandise marginsmargin of $27 million, partially offset by a $28$28 million increase in operating expenses.
Retail fuel margins are affected by the blending of ethanol with the gasoline sold by our retail segment. For most of 2010, ethanol was a lower cost product than gasoline and this lower cost resulted in an increase in retail fuel margins. For example, the Chicago Board of Trade (CBOT) price for a gallon of ethanol was $0.23 less than a gallon of U.S. Gulf Coast conventional 87 gasoline for the year ended December 31, 2010, but there was little difference between the prices of these products for the year ended December 31, 2009. We estimate that the lower cost of ethanol had a $32 million positive impact to our U.S. retail fuel margins for 2010 as approximately 80 percent of the gasoline we sold during the year ended December 31, 2010 contained 10 percent ethanol. Retail fuel margins in our Canadian retail op erationsoperations increased by $27 million due to the favorable impact from the strengthening of the Canadian dollar relative to the U.S. dollar in 2010 compared to 2009. On average, Cdn$1 was equal to $0.96 during 2010 compared to $0.88 in 2009, representing an increase in value of nine percent.
Retail merchandise margins increased due to increased product pricing combined with improved product mix, and a favorable impact from the stronger Canadian dollar relative to the U.S. dollar in 2010 compared to 2009, as described above.
The increase in operating expenses was also due to the stronger Canadian dollar relative to the U.S. dollar in 2010 compared to 2009. The stronger Canadian dollar had a $21 million unfavorable impact on the 2010 operating expenses of our Canadian retail operations compared to 2009.
Ethanol
Ethanol operating income was $209 million for the year ended December 31, 2010, compared to $165 million for the year ended December 31, 2009. This increase of $44 million was primarily due to a full year of operations of the seven ethanol plants acquired in the second quarter of 2009 and the addition of three ethanol plants acquired in the first quarter of 2010, as described in Note 2 of Notes to Consolidated Financial Statements.
Corporate Expenses and Other
General and administrative expenses decreased $41 million for the year ended December 31, 2010 compared to the year ended December 31, 2009 primarily due to a favorable settlement with an insurance company for $40 million recorded in 2010, which offset an increase in litigation costs of $40 million recorded in 2009. After adjusting for these items, the $40 million increase in general and administrative expenses year over year resulted from an increase of $21 million for incentive compensation expenses and an increase of $18 million for environmental remed iationremediation expenses.
“Other income, net” for the year ended December 31, 2010 increased $89 million from the year ended December 31, 2009 due to a pre-tax gain of $55 million related to the sale of our 50 percent interest in Cameron Highway Oil Pipeline Company (CHOPS)CHOPS in November 2010 and the effect of a $42 million loss in 2009 on changes in the fair values of an earn-out agreement and associated derivative instruments that were entered into in connection with the sale of our Krotz Springs Refinery in 2008.
“Interest and debt expense, net of capitalized interest” increased $68$68 million from the year ended December 31, 2009 to the year ended December 31, 2010. This increase is composed of a $53 million increase
in interest incurred on $1.25 billion of debt issued in February 2010 and $1.0 billion of debt issued in March 2009 (see Note 11 of Notes to Consolidated Financial Statements) and a $15$15 million decrease in capitalized interest due to a reduction in capital expenditures between the years and the temporary suspension of activity on certain construction projects. We do not capitalize interest with respect to suspended construction projects until significant construction activities resume. We anticipate that significant construction activities will resume on certain construction projects in 2011.
Income tax expense increased $618 million from a $43 million benefit in 2009 to $575 million of expense in 2010 mainly as a result of higher operating income in 2010.2010.
“Loss from discontinued operations, net of income taxes” decreased $1.1 billion from the year ended December 31, 2009 to the year ended December 31, 2010 due to the after-tax loss of $1.2$1.2 billion related to the permanent shutdownshut down of theour Delaware City Refinery in the fourth quarter of 2009. The results of operations for the Pauls boroPaulsboro and Delaware City Refineries, including the loss and gain, respectively, on their sales, are reflected in “Loss from discontinued operations, net of income taxes” as discussed in Note 3 of Notes to Consolidated Financial Statements.
2009 Compared to 2008
Financial Highlights (a) (b) (c)
(millions of dollars, except per share amounts)
| | | | | | | | | | | |
| | Year Ended December 31, |
| | 2009 | | 2008 | | Change |
| Operating revenues | $ | 64,599 | | | $ | 106,676 | | | $ | (42,077 | ) |
| Costs and expenses: | | | | | |
| Cost of sales (d) | 58,686 | | | 96,087 | | | (37,401 | ) |
| Operating expenses: | | | | | |
| Refining | 2,880 | | | 3,731 | | | (851 | ) |
| Retail (d) | 626 | | | 676 | | | (50 | ) |
| Ethanol | 169 | | | — | | | 169 | |
| General and administrative expenses | 572 | | | 559 | | | 13 | |
| Depreciation and amortization expense: | | | | | |
| Refining | 1,194 | | | 1,155 | | | 39 | |
| Retail | 101 | | | 105 | | | (4 | ) |
| Ethanol | 18 | | | — | | | 18 | |
| Corporate | 48 | | | 44 | | | 4 | |
| Asset impairment loss (e) | 222 | | | 86 | | | 136 | |
| Gain on sale of Krotz Springs Refinery (f) | — | | | (305 | ) | | 305 | |
| Goodwill impairment loss (g) | — | | | 4,007 | | | (4,007 | ) |
| Total costs and expenses | 64,516 | | | 106,145 | | | (41,629 | ) |
| Operating income | 83 | | | 531 | | | (448 | ) |
| Other income, net | 17 | | | 113 | | | (96 | ) |
| Interest and debt expense: | | | | | |
| Incurred | (521 | ) | | (452 | ) | | (69 | ) |
| Capitalized | 105 | | | 92 | | | 13 | |
Income (loss) from continuing operations before income tax expense (benefit) | (316 | ) | | 284 | | | (600 | ) |
| Income tax expense (benefit) | (43
) | | 1,438 | |
| (1,481 | ) | Loss from continuing operations | (273 | ) | | (1,154 | ) | | 881 | |
Income (loss) from discontinued operations,
net of income taxes
| (1,709 | ) | | 23 | | | (1,732 | ) |
Net loss | $ | (1,982 | ) | | $ | (1,131 | ) | | $ | (851 | ) |
Loss per common share – assuming dilution: | | | &n bsp; | | |
Continuing operations | $ | (0.50 | ) | | $ | (2.20
| ) | | $ | 1.70 | |
Discontinued operations | (3.17 | ) | | 0.04 | | | (3.21 | ) |
Total | $ | (3.67 | ) | | $ | (2.16 | ) | | $ | (1.51 | ) |
__________
See note references on pages 39 and 40.
Operating Highlights
(millions of dollars, except per barrel and per gallon amounts) | | | | | | | | | | | |
| | Year Ended December 31, |
| | 2009 | | 2008 | | Change |
| Refining (a) (b) (f): | | | | | |
| Operating income (e) (g) (k) | $ | 247 | | | $ | 765 | | | $ | (518 | ) |
| Throughput margin per barrel (g) (h) (k) | $ | 6.00 | | | $ | 11.16 | | | $ | (5.16 | ) |
| Operating costs per barrel (e): | | | | | |
| Operating expenses | $ | 3.71 | | | $ | 4.41 | | | $ | (0.70 | ) |
| Depreciation and amortization expense | 1.55 | | | 1.37 | | | 0.18 | |
| Total operating costs per barrel | $ | 5.26 | | | $ | 5.78 | | | $ | (0.52 | ) |
| Throughput volumes (thousand barrels per day): | | | | | |
| Feedstocks: | | | | | |
| Heavy sour crude | 457 | | | 588 | | | (131 | ) |
| Medium/light sour crude | 417 | | | 460 | | | (43 | ) |
| Acidic sweet crude | 64 | | | 79 | | | (15 | ) |
Sweet crude | 616 | | | 592 | | | 24 | |
| Residuals | 170 | | | 189 | | | (19 | ) |
| Other feedstocks | 136 | | | 130 | | | 6 | |
| Total feedstocks | 1,860 | | | 2,038 | | | (178 | ) |
| Blendstocks and other | 264 | | | 272 | | | (8 | ) |
| Total throughput volumes | 2,124 | | | 2,310 | | | (186 | ) |
| | | | | | |
| Yields (thousand barrels per day): | | | | | |
| Gasolines and blendstocks | 1,040 | | | 1,040 | | | — | |
| Distillates | 692 | | | 805 | | | (113 | ) |
| Other products (i) | 402 | | | 468 | | | (66 | ) |
| Total yields | 2,134 | | | 2,313 | | | (179 | ) |
| | | | | | |
| Retail–U.S. (d): | | | | | |
| Operating income | $ | 170 | | | $ | 260 | | | $ | (90 | ) |
| Company-operated fuel sites (average) | 999 | | | 973 | | | 26 | |
| Fuel volumes (gallons per day per site) | 4,983 | | | 5,000 | | | (17 | ) |
| Fuel margin per gallon | $ | 0.126 | | | $ | 0.194 | | | $ | (0.068 | ) |
| Merchandise sales | $ | 1,171 | | | $ | 1,097 | | | $ | 74 | |
| Merchandise margin (percentage of sales) | 28.1 | % | | 29.2 | % | | (1.1 | )% |
| Margin on miscellaneous sales | $ | 87 | | | $ | 99 | | | $ | (12 | ) |
| Operating expenses | $ | 405 | | | $ | 434 | | | $ | (29 | ) |
| Depreciation and amortization expense | $ | 70 | | | $ | 70 | | | $ | — | |
| | | | | | |
| Retail–Canada (d): | | | | | |
| Operating income | $ | 123 | | | $ | 109 | | | $ | 14 | |
| Fuel volumes (thousand gallons per day) | 3,159 | | | 3,193 | | | (34 | ) |
| Fuel margin per gallon | $ | 0.247 | | ; | $ | 0.252 | | | $ | (0.005 | ) |
| Merchandise sales | $ | 201 | | | $ | 200 | | | $ | 1 | |
| Merchandise margin (percentage of sales) | 28.3 | % | | 27.7 | % | | 0.6 | % |
| Margin on miscellaneous sales | $ | 33 | | | $ | 36 | | | $ | (3 | ) |
| Operating expenses | $ | 221 | & nbsp; | | $ | 242 | | | $ | (21 | ) |
| Depreciation and amortization expense | $ | 31 | | | $ | 35 | | | $ | (4 | ) |
__________
See note references on pages 39 and 40.
Operating Highlights (continued)
(millions of dollars, except per gallon amounts)
| | | | | | | | | |
| | Year Ended December 31, |
| | 2009 | | 2008 | | Change |
| Ethanol (c): | | | | | |
| Operating income | $ | 165 | | | N/A | | $ | 165 | |
| Ethanol production (thousand gallons per day) | 1,479 | | | N/A | | 1,479 | |
| Gross margin per gallon of ethanol production | $ | 0.65 | | | N/A | | $ | 0.65 | |
| Operating costs per gallon of ethanol production: | | | | | |
| Operating expenses | $ | 0.31 | | | N/A | | $ | 0.31 | |
| Depreciation an d amortization expense | 0.03 | | | N/A | | 0.03 | |
| Total operating costs per gallon of ethanol production | $ | 0.34 | | | N/A | | $ | 0.34 | |
__________
See note references on pages 39 and 40.
Refining Operating Highlights by Region (e) (h) (j)
(millions of dollars, except per barrel amounts)
| | | | | | | | | | | |
| | Year Ended December 31, |
| | 2009 | | 2008 | | Change |
Gulf Coast (f):
| | &nb sp; | | |
| Operating income (loss) | $ | (56 | ) | | $ | 3,267 | | | $ | (3,323 | ) |
| Throughput volumes (thousand barrels per day) | 1,274 | | | 1,404 | | | (130 | ) |
| Throughput margin per barrel (k) | $ | 5.13 | | | $ | 11.57 | | | $ | (6.44 | ) |
| Operating costs per barrel: | | | | | |
| Operating expenses | $ | 3.71 | | | $ | 4.50 | | | $ | (0.79 | ) |
| Depreciation and amortization expense | 1.54 | | | 1.30 | | | 0.24 | |
| Total operating costs per barrel | $ | 5.25 | | | $ | 5.80 | | | $ | (0.55 | ) |
| Mid-Continent: | | | | | |
| Operating income | $ | 189 | | | $ | 580 | | | $ | (391 | ) |
| Throughput volumes (thousand barrels per day) | 387 | | | 423 | | | (36 | ) |
| Throughput margin per barrel | $ | 6.52 | | | $ | 9.27 | | | $ | (2.75 | ) |
| Operating costs per barrel: | | | | | |
| Operating expenses | $ | 3.66 | | | $ | 4.24 | | | $ | (0.58 | ) |
| Depreciation and amortization expense | 1.53 | | | 1.29 | | | 0.24 | |
| Total operating costs per barrel | $ | 5.19 | | | $ | 5.53 | | | $ | (0.34 | ) |
| Northeast (a) (b): | | | | | |
| Operating income | $ | 196 | | | $ | 636 | | | $ | (440 | ) |
| Throughput volumes (thousand barrels per day) | 196 | | | 207 | | | (11 | ) |
| Throughput margin per barrel | $ | 6.36 | | | $ | 12.73 | | &n bsp; | $ | (6.37 | ) |
| Operating costs per barrel: | | | | | |
| Operating expenses | $ | 2.31 | | | $ | 2.90 | | | $ | (0.59 | ) |
| Depreciation and amortization expense | 1.33 | | | 1.41 | | | (0.08 | ) |
| Total operating costs per barrel | $ |
3.64 | | | $ | 4.31 | | | $ | (0.67 | ) | West Coast: | | | | | |
Operating income | $ | 252 | | | $ | 375 | | | $ | (123 | ) |
Throughput volumes (thousand barrels per day) | 267 | | | 276 | | | (9 | ) |
Throughput margin per barrel | $ | 9.16 | | | $ | 10.84 | | | $ | (1.68 | ) |
Operating costs per barrel: | | | | | |
Operating expenses | $ | 4.83 | | | $ | 5.36 | | | $ | (0.53 | ) |
Depreciation and amortization expense | 1.74 | | | 1.77 | | | (0.03 | ) |
Total operating costs per barrel | $ | 6.57 | | | $ | 7.13 | | | $ | (0.56 | ) |
Operating income for regions above | $ | 581 | | | $ | 4,858 | | | $ | (4,277 | ) |
Asset impairment loss applicable to refining | (220 | ) | | (86 | ) | | (134 | ) |
Loss contingency accrual related to Aruba tax matter (k) | (114 | ) | | — | | | (114 | ) |
Goodwill impairment loss (g) | — | | | (4,007 | ) | | 4,007 | |
Total refining operating income | $ | 247 | | | $ | 765 | | | $ | (518 | ) |
__________
See note references on pages 39 and 40.
Average Market Reference Prices and Differentials
(dollars per barrel , except as noted)
| | | | | | | | | | | |
| | Year Ended December 31, |
| | 2009 | | 2008 | | Change |
| Feedstocks: | | | | | |
| WTI crude oil | $ | 61.69 | &nb sp; | | $ | 99.56 | | | $ | (37.87 | ) |
| Louisiana Light Sweet crude oil | 62.25 | | | 101.99 | | | (39.74 | ) |
| WTI less Mars crude oil | 1.36 | | | 6.13 | | | (4.77 | ) |
| WTI less Maya crude oil | 5.19 | | | 15.71 | | | (10.52 | ) |
| Products: | | | | | |
| U.S. Gulf Coast : | | | | | |
| Conventional 87 gasoline less WTI | 7.61 | | | 4.85 | | | 2.76 | |
| Ultra-low-sulfur diesel less WTI | 8.02 | | | 22.96 | | | (14.94 | ) |
| Propylene less WTI | (1.31 | ) | | (3.69 | ) | | 2.38 | |
| U.S. Mid-Continent: | | | | | |
| Conventional 87 gasoline less WTI | 8.01 | | | 4.46 | | | 3.55 | |
| Ultra-low-sulfur diesel less WTI | 8.26 | | | 24.12 | | | (15.86 | ) |
| U.S. Northeast: | | | | | |
| Conventional 87 gasoline less WTI | 7.99 | | | 3.22 | | | 4.77 | |
| Ultra-low-sulfur diesel less WTI | 9.55 | | | 24.53 | | | (14.98 | ) |
| U.S. West Coast: | | | | | |
| CAR BOB 87 gasoline less WTI | 15.75 | | | 9.93 | | | 5.82 | |
| CARB diesel less WTI | 9.86 | | | 22.59 | | | (12.73 | ) |
| New York Harbor corn crush (dollars per gallon) | 0.47 | | | 0.42 | | | 0.05 | |
__________
The following notes relate to references on pages 35 through 39.
| |
(a) | On December 17, 2010, we sold our Paulsboro Refinery and associated inventory to PBF Holding. The results of operations of the refinery have been presented as discontinued operations for both years presented. The refining segment and Northeast Region operating highlights exclude the Paulsboro Refinery for both years presented. |
| |
(b) | During the fourth quarter of 2009, we permanently shut down our Delaware City Refinery and wrote down the book value of the refinery assets to net realizable value, resulting in a pre-tax loss on the shutdown of $1.9 billion ($1.2 billion after taxes). The results of operations of the shutdown refinery, including the loss on the shutdown in 2009, have been presented as discontinued operations for both years presented. The refining segment and Northeast Region operating highlights exclude the Delaware City Refinery for both years presented. |
| |
(c) | We acquired seven ethanol plants in the second quarter of 2009. The information presented for 2009 includes the results of operations of these plants commencing on their respective closing dates . Ethanol production volumes are based on total production during 2009 divided by actual calender days in 2009. |
| |
(d) | Credit card transactions processing fees incurred by our retail segment of $76 million and $92 million for the years ended December 31, 2009 and 2008, respectively, have been reclassified from retail operating expenses to cost of sales. The Retail–U.S. and Retail–Canada operating highlights have been restated to reflect this reclassification.
|
| |
(e) | The asset impairment loss relates primarily to the permanent cancellation of certain capital projects classified as “construction in progress” as a result of the unfavorable impact of the economic slowdown on refining industry fundamentals. The asset impairment loss amounts are included in the refining segment operating income but are excluded from the regional operating income amounts and the consolidated and regional operating costs per barrel. |
| |
(f) | On July 1, 2008, we sold our Krotz Springs Refinery to Alon Refining Krotz Springs, Inc. (Alon). The nature and significance of our post-closing participation in an offtake agreement with Alon represents a continuation of activities with the Krotz Springs Refinery for accounting purposes, and as such the results of operations related to the Krotz Springs Refinery have not been presented as discontinued operations. In addition, all refining operating highlights, both consolidated and for the Gulf Coast |
region, include the Krotz Springs Refinery for the year ended December 31, 2008. The pre-tax gain of $305 million on the sale of the Krotz Springs Refinery is included in the Gulf Coast operating income for the year ended December 31, 2008 but is excluded from the per-barrel operating highlights.
| |
(g) | During the fourth quarter of 2008, we determ ined that the goodwill in all four of our refining segment reporting units was impaired, which resulted in a pre-tax and after-tax goodwill impairment loss of $4.0 billion related to continuing operations. This goodwill impairment loss is included in the refining segment operating income but is excluded from the consolidated and regional throughput margins per barrel and the regional operating income amounts for the year ended December 31, 2008. |
| |
(h) | Throughput margin per barrel represents operating revenues less cost of sales divided by throu ghput volumes. |
| |
(i) | Other products primarily include petrochemicals, gas oils, No. 6 fuel oil, petroleum coke, and asphalt. |
| |
(j) | The regions reflected herein contain the following refineries: the Gulf Coast refining region includes the Corpus Christi East, Corpus Christi West, Texas City, Houston, Three Rivers, Krotz Springs (for periods prior to its sale on July 1, 2008), St. Charles, Aruba, and Port Arthur Refineries; the Mid-Continent refining region includes the McKee, Ardmore, and Memphis Refineries; the Northeast refining region includes the Quebec City Refinery and the West Coast refining region includes the Benicia and Wilmington Refineries. |
| |
(k) | A loss contingency accrual of $140 million was recorded in the third quarter of 2009 related to our dispute with the GOA regarding a turnover tax on export sales as well as other tax matters. The portion of the loss contingency accrual that relates to the turnover tax was recorded in cost of sales for the year ended December 31, 2009, and therefore is included in refining operating income (loss) but has been excluded in determining throughput margin per barrel. |
General
Operating revenues decreased 39 percent (or $42.1 billion) for the year ended December 31, 2009 compared to the year ended December 31, 2008. Operating income decreased by $448 million and income from continuing operations before taxes decreased by $600 million over the same period. These decreases were primarily the result of the negative impact of the U.S. and worldwide economic slowdown on the demand and prices for our refined products. The economic slowdown began in late 2008 and persisted throughout 2009. The decreases in operating income and income from continuing operations before taxes, however, were significantly affected by the $4.0 billion goodwill impairment loss and the $305 million gain on the sale of our Krotz Springs Refinery that we recorded in 2008. Excluding these two items, operating income and income from continuing operations before taxes for the year ended December 31, 2009 decreased by $4.2 billion and $4.3 billion, respectively, from the prior year. These decreases were primarily related to our refining segment, which experienced a $518 million decrea se in operating income in 2009 compared to 2008 (a $4.3 billion decrease after excluding the effect of the goodwill write-off and other items) as discussed below.
Refining
Operating income for our refining segment decreased from $765 million for the year ended December 31, 2008 to $247 million for the year ended December 31, 2009, due to a decrease in operating results of $4.3 billion (discussed below), a reduced goodwill impairment loss of $4.0 billion, an increased asset impairment loss of $134 million, and an increased loss contingency accrual of $114 million. The goodwill impairment loss related to our determination in 2008 that our goodwill was impaired, which was based on the significant decline in our equity market capitalization. That decline was caused by severe disruptions in the U.S. and worldwide capital and commodities markets in 2008 and the resulting economic slowdown. The asset impairment loss of $220 million and $86 million reported in 2009 and 2008, respectively, related to our decision to permanently cancel certain construction projects in response to the economic slowdown that began in 2008. The loss contingency accrual recorded in 2009 related to our dispute of a turnover tax on export sales in Aruba.
The $4.3 billion decrease in operating results was primarily due to a 46 perc ent decrease in throughput margin per barrel (a $5.16 per barrel decrease between the comparable years) and an 8 percent decrease in throughput volumes (an 186,000 barrel per day decrease between the comparable years). The decreases were primarily the result of the negative impact of the economic slowdown on the demand for and prices of refined products. The decrease in throughput margin per barrel was caused by a significant decrease in distillate margins, but
the decrease in distillate margins was somewhat offset by an increase in gasoline margins in all of our refining regions. Throughput margin per barrel was also negatively impacted by narrow sour crude oil differentials. The impact of these factors on our throughput margin per barrel is described below.
Changes in the margin we receive for our products have a material impact on our results of operations. For example, the benchmark reference margin for U.S. Gulf Coast ultra-low-sulfur diesel was $8.02 per barrel for the year ended December 31, 2009, compared to $22.96 per barrel for the year ended December 31, 2008, representing an unfavorable decrease of $14.94 per barrel. We experienced similar decreases in distillate margins in other regions. We estimate that the decrease in distillate margins negatively impacted our overall refining margin by $4.4 billion, as we produced 692,000 barrels per day of distillates during the year ended December 31, 2009.
The benchmark reference margin for Gulf Coast 87 gasoline was $7.61 per barrel for the year ended December 31, 2009, compared to $4.85 per barrel for the year ended December 31, 2008, representing a favorable increase of $2.76 per barrel. CARBOB 87 gasoline benchmark reference margins increased year over year to an even greater extent in the West Coast region (a $5.82 per barrel favorable increase). We estimate that the increase in gasoline margins had a $1.0 billion favorable impact t o our overall refining margin, year over year, as we produced 1.04 billion barrels per day of gasoline during the year ended December 31, 2009. Gasoline margins were higher in 2009 as compared to 2008 despite a decrease in gasoline prices during 2009. We believe that the margins for gasoline improved due to a greater percentage decrease in the cost of crude oil as compared to the percentage decrease in the price of gasoline.
In addition, the margins we received for other products, such as petroleum coke and sulfur, for the year ended December 31, 2009 improved by $2.1 billion as compared to 2008. We believe that the margins were higher in 2009 due to the decrease in the cost of crude oil in 2009 as compared to 2008. For example, the benchmark reference price of WTI crude oil was $61.69 per barrel for the year ended December 31, 2009, compared to $99.56 per barrel for the year ended December 31, 2008, representing a decrease of $37.87 per barrel. Because the prices for these other products are not significantly influenced by the cost of crude oil, changes in the cost of crude oil have a significant effect of the margins we receive for these products.
For the year ended December 31, 2009, the differential applicable to the price of sour crude oil as compared to the price of sweet crude oil was lower than the differential for the year ended December 31, 2008. For example, Maya crude oil, which is a type of sour crude oil, sold at a discount of $5.19 per barrel to WTI crude oil, a type of sweet crude oil, during the year ended December 31, 2009. This compared to a discount of $15.71per barrel during the year ended December 31, 2008, representing an unfavorable decrease of $10.52 per barrel. However, this narrower differential in 2009 was offset by a reduction of 174,000 barrels per day of sour crude oil that we processed during 2009 as compared to 2008, which resulted primarily from the temporary shutdown of our Aruba Refinery commencing in July 2009. We estimate that the narrower differentials for all types of sour crude oil that we process, offset by reduced throughput volumes, negatively impacted our overall refining margin for 2009 by $2.6 billion as we processed 874,000 barrels per day of sour crude oils.
Refining operating expenses were 23 percent lower (or $851 million) for the year ended December 31, 2009 compared to the year ended December 31, 2008 primarily due to a decrease of $490 million in energy costs, a decrease of $171 million in maintenance expenses, a decrease of $48 million in sales and use taxes, and a decrease of $43 million resulting from no longer operating the Krotz Springs Refinery, which was sold in 2008.
Retail
Retail operating income was $293 million for the year ended December 31, 2009 compared to $369 million for the year ended December 31, 2008. This 21 percent decrease (or $76 million) was primarily due to decreased retail fuel margins of $124 million, offset by a $50 million decrease in operating expenses.
The decrease in retail fuel margins was due to the effect of significantly higher margins in 2008. The hi gher margins in 2008 were caused by a decrease in the supply of fuel in connection with the temporary shutdown of refineries along the U.S. Gulf Coast in the wake of Hurricane Ike during the third quarter of 2008. Many of those refineries became operational by the fourth quarter of December 2008, and fuel supply and margins returned to normal levels. There were no similar events that occurred in 2009.
The decrease in operating expenses was primarily due to a $24 million decrease in bad debt expense and a decrease in operating expenses due to the weakening of the Canadian dollar relative to the U.S. dollar in 2009 compared to 2008. On average, Cdn.$1 was equal to $0.88 during 2009 compared to $0.95 during 2008, representing a decrease in value of seven percent. The weaker Canadian dollar had an $18 million favorable impact on the 2009 operating expenses of our Canadian retail operatio ns compared to 2008.
Ethanol
Ethanol operating income was $165 million for the year ended December 31, 2009, which represents the operations of the seven ethanol plants acquired in the second quarter of 2009, as described in Note 2 of Notes to Consolidated Financial Statements. We did not own or operate any ethanol plants prior to this acquisition.
Corporate Expenses and Other
General and administrative expenses increased $13 million for the year ended December 31, 2009 compared to the year ended December 31, 2008 mainly due to an increase of $39 million in litigation costs, an increase of $10 million in severance expenses, and acquisition costs of $10 million related to the acquisition of seven ethanol plants. These increases were partially offset by reductions of $29 million in environmental remediation expenses and $16 million in professional fees.
“Other income, net” for the year ended December 31, 2009 decreased $96 million from the year ended December 31, 2008 primarily due to a $128 million unfavorable change in fair value adjustments related to the Alon earn-out agreement and associated derivative instruments as discussed in Notes 20 and 21 of Notes to Consolidated Financial Statements, reduced interest income of $37 million resulting from lower cash balances and interest rates, and a $14 million gain recognized in 2008 on the redemption of our 9.5% senior notes as discussed in Note 11 of Notes to Consolidated Financial Statements. These decreases were partially offset by a $55 milli on increase in the fair value of certain nonqualified benefit plan assets and $27 million of income resulting from the reversal of an accrual for potential payments related to a prior acquisition in connection with the expiration of the statute of limitations.
Interest and debt expense increased $56 million mainly due to interest incurred on $1.0 billion of notes issued in March 2009.
Income tax expense decreased $1.5 billion from $1.4 billion of expense in 2008 to a $43 million benefit in 2009 mainly as a result of lower operating income in 2009 and the nondeductibility of a significant portion of the $4.0 billion goodwill impairment loss in 2008.
“Income (loss) from discontinued operat ions, net of income taxes” for the year ended December 31, 2009 increased $1.7 billion from the year ended December 31, 2008 primarily due to the $1.2 billion after tax loss on the permanent shut down of our Delaware City Refinery in the fourth quarter of 2009.
LIQUIDITY AND CAPITAL RESOURCES
Cash Flows for the Year Ended December 31, 2011
Net cash provided by operating activities for the year ended December 31, 2011 was $4.0 billion compared to $3.0 billion for the year ended December 31, 2010. The increase in cash generated from operating activities was primarily due to the $1.8 billion increase in operating income discussed above under “RESULTS OF OPERATIONS.” Changes in cash provided by or used for working capital during the years ended December 31, 2011 and 2010 are shown in Note 19 of Notes to Consolidated Financial Statements. Both receivables and accounts payable increased in 2011 due to significant increases in prices for gasoline, distillate, and crude oil at the end of 2011 compared to such prices at the end of 2010.
The net cash generated from operating activities during the year ended December 31, 2011 combined with $150 million of proceeds from the sale of receivables and $2.3 billion from available cash on hand was used mainly to:
fund $3.0 billion of capital expenditures and deferred turnaround and catalyst costs;
purchase the Pembroke Refinery and the related marketing and logistics business for $1.7 billion;
purchase the Meraux Refinery for $547 million;
redeem our Series 1997B 5.4% and Series 1997C 5.4% industrial revenue bonds for $56 million;
make scheduled long-term note repayments of $418 million;
acquire the Gulf Opportunity Zone Revenue Bonds Series 2010 (GO Zone Bonds) for $300 million;
purchase our common stock for $349 million; and
pay common stock dividends of $169 million.
Cash Flows for the Year Ended December 31, 2010
Net cash provided by operating activities for the year ended December 31, 2010 was $3.0 billion compared to $1.8 billion for the year ended December 31, 2009. The increase in cash generated from operating activities was due primarily to the receipt of a $923 million tax refund in 2010. Changes in cash provided by or used for working capital during the years ended December 31, 2010 and 2009 are shown in Note 19 of Notes to Consolidated Financial Statements. Both receivables and accounts payable increased in 2010 due to significant increases in prices for gasoline, distillate, and crude oil at the end of 2010 compared to such prices at the end of 2009.
The net cash generated from operating activities during the year ended December 31, 2010, combined with $1.5$1.5 billion of proceeds from the issuance of $400 million of 4.50%4.5% notes due in February 2015, $850 million of 6.125% notes due in February 2020, and $300 million of GO Zone Bonds as discussed in Note 11 of Notes to Consolidated Financial Statements, $547$547 million of proceeds from the sale of the Paulsboro Refinery, sale, $220$220 million of proceeds from the sale of the shutdown Delaware City Refinery assets and associated terminal and pipeline assets, and $330$330 million of proceeds from the sale of our 50 percent interest in CHOPS as discussed in Note 3 of Notes to Consolidated Financial Statements, were used mainly to:
| |
• | fund $2.3fund $2.3 billion of capital expenditures and deferred turnaround and catalyst costs; |
| |
• | redeem our 7.5% senior notes for $294 million and our 6.75% senior notes for $190 million;
|
| |
• | make scheduled long-term note repayments of $33 million; |
| |
• | make net repayments under our accounts receivable sales facility of $100 million;
|
| |
• | pay common stock dividends of $114 million;
|
| |
• | purchase additional ethanol facilities for $260 million; and
| |
• | increase available cash on hand by $2.5 billion.
|
Cash Flowsredeem our 7.5% senior notes for the Year Ended December 31, 2009$294 million and our 6.75% senior notes for $190 million;
Net cash provided by operating activities for the year ended December 31, 2009 was $1.8 billion compared to $3.1 billion for the year ende d December 31, 2008. The decrease in cash generated from operating activities was due primarily to the $4.2 billion decrease in operating income discussed abovemake scheduled long-term note repayments of $33 million;
make net repayments under “RESULTS OF OPERATIONS,” after excluding the effectour accounts receivable sales facility of the goodwill impairment loss and gain on the sale of the Krotz Springs Refinery, both of which had no effect on cash flows from operating activities. This decrease was partially offset by a $1.6 billion favorable change in the amount of income tax payments and refunds in 2008 and 2009 and a net $1.4 billion favorable eff ect from changes in receivables, inventories, and accounts payable between the two years. Changes in cash provided by or used for working capital during the years ended December 31, 2009 and 2008 are shown in Note 19 of Notes to Consolidated Financial Statements. Both receivables and accounts payable increased in 2009 due to significant increases in prices for gasoline, distillate, and crude oil at the end of 2009 compared to such prices at the end of 2008.$100 million;
The net cash generated from operating activities during the year ended December 31, 2009, combined with $998 million of proceeds from the issuance of $1.0 billion of notes in March 2009 as discussed in Note 11 of Notes to Consolidated Financial Statements, $799 million of net proceeds from the issuance of 46 million shares ofpay common stock in June 2009 as discussed in Note 13dividends of Notes to Consolidated Financial Statements, $100 million of$114 million;
purchase additional proceeds from the sale of receivables,ethanol facilities for $260 million; and$115 million of
increase available cash on hand were used mainly to:
| |
• | fund $2.7 billion of capital expenditures and deferred turnaround and catalyst costs;
|
| |
• | fund the acquisition of seven ethanol plants for $556 million;
|
| |
• | make scheduled long-term note repayment s of $285 million; and
|
| |
• | pay common stock dividends of $324 million.
|
Cash flows related to the discontinued operations of the Paulsboro and Delaware City Refineries have been combined with the cash flows from continuing operations within each category in the consolidated statements of cash flows for allthe years presentedended December 31, 2010 and 2009 and are summarized as follows (in millions):
| | | | Year Ended December 31, | Year Ended December 31, |
| | 2010 | | 2009 | | 2008 | 2011 | | 2010 | | 2009 |
Cash provided by (used in) operating activities: | | | | | | | | | | |
| Paulsboro Refinery | $ | 88 | | | $ | 10 | | | $ | 246 | | $ | — |
| | $ | 88 |
| | $ | 10 |
|
| Delaware City Refinery | (26 | ) | | (126 | ) | | 81 | | — |
| | (26 | ) | | (126 | ) |
| Cash used in investing activities: | | | | | |
| | | | |
| Paulsboro Refinery | (41 | ) | | (121 | ) | | (212 | ) | — |
| | (41 | ) | | (121 | ) |
| Delaware City Refinery | — | | | (153 | ) | | (268 | ) | — |
| | — |
| | (153 | ) |
Capital Investments
Our operations, especially those of our refining segment, are highly capital intensive. Each of our refineries comprises a large base of property assets, consisting of a series of interconnected, highly integrated and interdependent crude oil processing facilities and supporting logistical infrastructure (Units), and these Units are continuously improved. Improvements consist of the addition of new Units and betterments of existing Units, and the cost of these improvements is significant. We have historically acquired our refineries at amounts significantly below their replacement costs, whereas our improvements are made at full replacement value. As such, the costs for improving our refinery assets increase over time and are significant in relation to the amounts we paid to acquire our refineries. We plan for these improvements by developing a multi-year capital program that is updated and revised based on changing internal and external factors.
We make improvements to our refineries in order to maintain and enhance their operating reliability, to meet environmental obligations with respect to reducing emissions and removing prohibited elements from the products we produce, or to enhance their profitability. Reliability and environmental improvements generally do not increase the throughput capacities of our refineries. Improvements that enhance refinery profitability may increase throughput capacity, but many of these improvements allow our refineries to process higher volumes of sour crude oil, which lowers our feedstock costs, and enables us to refine crude oil into products with higher market values. Therefore, many of our improvements do not increase throughput capacity
significantly.
During the year ended December 31, 20102011, we expended $1.72.4 billion for capital expendi turesexpenditures and $535629 million for deferred turnaround and catalyst costs. Capital expenditures for the year ended December 31, 20102011 included $740$241 million of costs related to environmental projects.
For 2011,2012, we expect to incur approximately $2.9$3.4 billion for capital investments, including approximately $2.4$2.8 billion for capital expenditures (approximately $260$140 million of which is for environmental projects) and approximately $510$560 million for deferred turnaround an dand catalyst costs. The capital expenditure estimate excludes expenditures related to future strategic acquisitions. We continuously evaluate our capital budget and make changes as conditions warrant.
In January 2010, we acquired two ethanol plants and inventories for a total purchase price of $202 million. The plants are located in Linden, Indiana and Bloomingburg, Ohio. In February 2010, we acquired an additional ethanol plant located near Jefferson, Wisconsin plus certain receivables and inventories for a total consideration of $ 79 million. Of the $281 million of total consideration paid for these acquisitions, $21 million was paid in the fourth quarter of 2009.
On June 1, 2010, we sold the shutdown Delaware City Refinery assets and associated terminal and pipeline assets to PBF for$220 million of cash proceeds, and on December 17, 2010, we sold our Paulsboro Refinery to PBF Holding for $547 million of cash proceeds and a $160 million one-year note secured by the Paulsboro Refinery.
Contractual Obligations
Our contractual obligations as of December 31, 20102011 are summarized below (in millions).
| | | | | | | | | | | | | | | | | | | | | | | | | | | |
| | Payments Due by Period | | |
| | 2011 | | 2012 | | 2013 | | 2014 | | 2015 | | Thereafter | | Total |
Debt and capital lease obligations (including interest on capital lease obligations) | $ | 825 | | | $ | 765 | | | $ | 495 | | | $ | 214 | | | $ | 489 | | | $ | 5,623 | | | $ | 8,411 | |
| Operating lease obligations | 353 | | | 237 | | | 160 | | | 104 | | |
85 | | | 324 | | | 1,263 | | Purchase obligations | 28,599 | | | 4,602 | | | 1,413 | | | 249 | | | 203 | | | 1,105 | | | 36,171 | |
Other long-term liabilities | — | | | 206 | | | 168 | | | 149 | | | 139 | | | 1,105 | | | 1,767 | |
Total | $ | 29,777 | | | $ | 5,810 | | | $ | 2,236 | | | $ | 716 | | | $ | 916 | | | $ | 8,157 | | | $ | 47,612 | |
|
| | | | | | | | | | | | | | | | | | | | | | | | | | | |
| | Payments Due by Period | | |
| | 2012 | | 2013 | | 2014 | | 2015 | | 2016 | | Thereafter | | Total |
Debt and capital lease obligations (including interest on capital lease obligations) | $ | 1,015 |
| | $ | 494 |
| | $ | 209 |
| | $ | 483 |
| | $ | 8 |
| | $ | 5,615 |
| | $ | 7,824 |
|
| Operating lease obligations | 291 |
| | 198 |
| | 131 |
| | 106 |
| | 86 |
| | 294 |
| | 1,106 |
|
| Purchase obligations | 36,303 |
| | 3,088 |
| | 962 |
| | 407 |
| | 360 |
| | 899 |
| | 42,019 |
|
| Other long-term liabilities | — |
| | 176 |
| | 152 |
| | 145 |
| | 137 |
| | 1,271 |
| | 1,881 |
|
| Total | $ | 37,609 |
| | $ | 3,956 |
| | $ | 1,454 |
| | $ | 1,141 |
| | $ | 591 |
| | $ | 8,079 |
| | $ | 52,830 |
|
Debt and Capital Lease Obligations
During 2010,2011, the following activity occurred related to our non-bank debt:
| |
• | in December 2011, we redeemed our Series 1997B 5.4% and Series 1997C 5.4% industrial revenue bonds for $56 million, or 100% of their stated values; in May 2011, we made a scheduled debt repayment of $200 million related to our 6.125% senior notes; in April 2011, we made scheduled debt repayments of $8 million related to our Series 1997A 5.45%, Series 1997B 5.4%, and Series 1997C 5.4% industrial revenue bonds; in February 2010, we issued $400 million of 4.50% notes due in February 2015 and $850 million of 6.125% notes due in February 2020 for total net proceeds of $1.244 billion; |
| |
• | in March 2010, we redeemed our 7.50% senior notes with a maturity date of June 15, 2015 for $294 million, or 102.5% of stated value, resulting in a $2 million gain; |
| |
• | in April 2010, we made scheduled debt repayments of $8 million related to our Series A 5.45%, Series B 5.40%, and Series C 5.40% industrial revenue bonds; |
| |
• | in May 2010, we redeemed our 6.75% senior notes with a maturity date of May 1, 2014 for $190 million, or 102.25% of stated value, resulting in a $3 million loss; |
| |
• | in June 2010, we made scheduled debt repayments of $25 million related to our 7.25% debentures; and |
| |
•&nb sp; | in December 2010, we received proceeds of $300 million under a financing agreement associated with the issuance of $300 million of GO Zone Bonds. |
On February 1, 2011, we made a scheduled debt repayment of $210 million related to our 6.75% senior notes. Onnotes; and
in February 2, 2011, we paid $300$300 million to acquire the GO Zone Bonds, which were subject to mandatory tender on that date. We expect to hold the GO Zone Bonds for our own account until conditions permit the rema rketing of these bonds at an interest rate acceptable to us.tender.
We have an accounts receivable sales facility with a group of third-party entities and financial institutions to sell on a revolving basis up to $1.01 billion of eligible trade receivables, which maturesreceivables. We amended our agreement in June 2011.2011 to extend the maturity date to June 2012. As of December 31, 20102011, the amount of eligible receivables sold was $100250 million. During the year ended December 31, 20102011, we reduced the netsold $150 million of eligible receivables sold under this program by $100 million. Proceeds from the sale of receivablesand made no repayments. All amounts outstanding under this facility are reflected as debt.
Our agreements do not have rating agency triggers that would automatically require us to post additional collateral. However, in the event of certain downgrades of our senior unsecured debt to below investment grade ratings by S&P, Moody’s Investors Service and Standard & Poor’s Ratings Services,Fitch, the cost of borrowings under some of our bank credit facilities and other arrangements would increase. As of December 31, 2010,2011, all of our ratings on our senior unsecured debt are at or above investment grade level as follows:
|
| | |
| Rating Agency | | Rating |
| Standard & Poor’s Ratings Services | | BBB (negative(stable outlook) |
| Moody’s Investors Service | | Baa2 (negative outlook )(stable outlook) |
| Fitch Ratings | | BBB (negative(stable outlook) |
We cannot provide assurance that these ratings will remain in effect for any given period of time or that one or more of these ratings will not be lowered or withdrawn entirely by a rating agency. We note that these credit ratings are not recommendations to buy, sell, or hold our securities and may be revised or withdrawn at any time by the rating agency. Each rating should be evaluated independently of any other rating. Any future reduction below investment grade or withdrawal of one or more of our credit ratings could have a material adverse impact on our ability to obtain short- and long-term financing and the cost of such financings.
Operating Lease Obligations
Our operating lease obligations include leases for land, office facilities and equipment, retail facilities and equipment, transportation equipment, time charters for ocean - -goingocean-going tankers and coastal vessels, dock facilities, and various facilities and equipment used in the storage, transportation, production, and sale of refinery feedstocks, and refined productproducts, and corn inventories. Operating lease obligations include all operating leases that have initial or remaining noncancelable terms in excess of one year, and are not reduced by minimum rentals to be received by us under subleases.
Purchase Obligations
A purchase obligation is an enforceable and legally binding agreement to purchase goods or services that specifies significant terms, including (i) fixed or minimum quantities to be purchase d,purchased, (ii) fixed, minimum, or variable price provisions, and (iii) the approximate timing of the transaction. We have various purchase obligations including industrial gas and chemical supply arrangements (such as hydrogen supply arrangements), crude oil and other feedstock supply arrangements, and various throughput and terminalling agreements. We enter into these contracts to ensure an adequate supply of utilities and feedstock and adequate storage capacity to operate our refineries. Substantially all of our purchase obligations are based on market prices or adjustments based on market indices. Certain of these purchase obligations include fixed or minimum volume requirements, while others are based on our usage requirements. The purchase obligation amounts includedshown in the table above include both short-termshort- and long-term obligations and are based on (a) fixed or minimum quantities to be purchased and (b) fixed or estimated prices to be paid based on current market conditions. As of December 31, 20102011, our short-termshort- and long-term purchase obligations increased by $6.4approximately $6 billion from the amount reported as of December 31, 20092010. The increase is primarily attributable to higher crude oil and other feedstock prices at December 31, 20102011 compared to December 31, 20092010.
Other Long-term Liabilities
Our other long-term liabilities are described in Note 10 of Notes to Consolidated Financial Statements. For purposes of reflecting amounts for other long-term liabilities in the table above, we have made our best estimate of expected payments for each type of liability based on information available as of December 31, 20102011.
Other Commercial Commitments
As of December 31, 20102011, our committed lines of credit were as follows:follows (in millions):
| | | |
| Borrowing
Capacity
| Expiration | Outstanding
Letters of Credit
|
Letter of credit facility | $200 million | June 2011 | $ - |
Letter of credit facility | $300 million | June 2011 | $100 million |
Revolving credit facility | $2.4 billion | November 2012 | $399 million
|
Canadian revolving credit facility | Cdn. $115 million | December 2012 | Cdn. $20 milli on |
|
| | | | | | | | | | |
| | | Borrowing Capacity | | Expiration | | Outstanding Letters of Credit |
| Letter of credit facilities | | $ | 500 |
| | June 2012 | | $ | 300 |
|
| U.S. revolving credit facility | | $ | 3,000 |
| | December 2016 | | $ | 119 |
|
| Canadian revolving credit facility | | C$ | 115 |
| | December 2012 | | C$ | 20 |
|
As of December 31, 20102011, we had no amounts borrowed under our revolving credit facilities. The letters of credit outstanding as of December 31, 20102011 expire during 20112012 and 2012.2013.
Other Matters Impacting Liquidity and Capital Resources
Stock Purchase Programs
As of December 31, 20102011, we have approvals under common stock purchase programs previously approved by our board of directors to purchase approximately $3.5 billion of our common stock.
Pension Plan Funded Status
During 20102011, we contributed $50$204 million to our qualified pension plans. Based on a 5.40 percent discount rate and fair valuesplans that have minimum funding requirements. As of plan assets as of December 31, 2010,2011, the fair value of the assets in our qualified pensionof these plans was equal to approximately 9588 percent of the projected benefit obligationobligations under those plans as of the end of these plans.2010.
We have no minimum required contributions of $2 millionto ourthese pension plans during 2011 under the Employee Retirement Income Security Act;2012; however, we plan to contribute approximately $100 million to our pension plans during 2011.2012.
Environmental Matters
WeOur operations are subject to extensive federal, state, and local environmental laws and regulations including thoseby governmental authorities relating to the discharge of materials into the environment, waste management, pollution prevention measures, greenhouse gas emissions, and characteristics and composition of gasolines and distillates. Because environmental laws and regulations are becoming more complex and stringent and new environmental laws and regulations are continuously being enacted or proposed, the level of future expenditures required for environmental matters could increase in the future. In addition, any major upgrades in any of our refineriesoperating facilities could require material additional expenditures to comply with environmental laws and regulations.
While debate continues in the U.S. Congress regarding greenhouse gas legislation, the regulation See Note 12 of greenhouse gases at the federal level has now shiftedNotes to the U.S. Environmental Protection Agency (EPA), which began regulating greenhouse gases on January 2, 2011 under the Clean Air Act Amendments of 1990 (Clean Air Act). According to statements by the EPA, any new construction or material expansions will require that, among other things,Consolidated Financial Statements for a greenhouse gas permit be issued at the state or federal level in accordance with the Clean Air Act and regulations, and we will be required to undertake a technology review to determine appropriate controls to be implemented with the project in order to reduce greenhouse gas emissions. The determination will be on a case by case basis, and the EPA has provided only general guidance on which controls will be required. Any such controls, however, could result in material increased compliance costs, additional operating restrictions for our business, and an increase in the cost of the products we produce, wh ich could have a material adverse effect on our financial position, results of operations, and liquidity.
In addition, certain states have pursued independent regulation of greenhouse gases at the state level. For example, the California Global Warming Solutions Act, also known as AB 32, directs the CARB to develop and issue regulations to reduce greenhouse gas emissions in California to 1990 levels by 2020. CARB has issued a variety of regulations aimed at reaching this goal, including a Low Carbon Fuel Standard (LCFS) as well as a state-wide cap-and-trade program. The LCFS is effective in 2011, with small reductions in the carbon intensity of transportation fuels sold in California. The mandated reductions in carbon intensity are scheduled to increase through 2020, after which another step-change in reductions is anticipated. The LCFS is designed to encourage substitution of traditional petroleum fuels, and, over time, it is anticipated that the LCFS will lead to a greater use of electric cars and alternative fuels, such as E85, as companies seek to generate more cre dits to offset petroleum fuels. The state-wide cap-and-trade program will begin in 2012. Initially, the program will apply only to stationary sources of greenhouse gases (e.g., refinery and power plant greenhouse gas emissions). Greenhouse gas emissions from fuels that we sell in California will be covered by the program beginning in 2015. We anticipate that free allocations of credits will be available in the early years of the program, but we expect that compliance costs will be significant, particularly beginning in 2015, when fuels are included in the program. Complying with AB 32, including the LCFS and the cap-and-trade program, could result in material increased compliance costs for us, increased capital expenditures, increased operating costs, and additional operating restrictions for our business, resulting in an increase in the cost of, and decreases in the demand for, the products we produce. To the degree we are unable to recover these increased costs, these matters could have a material adverse effect on our financial position, results of operations, and liquidity.
On June 30, 2010, the EPA formally disapproved the flexible permits program submitted by the TCEQ in 1994 for inclusion in its clean-air implementation plan. The EPA determined that Texas’ flexible permit program did not meet several requirements under the federal Clean Air Act. Our Port Arthur, Texas City, Three Rivers, McKee and Corpus Christi East and West Refineries formerly operated under flexible permits administered by the TCEQ. In the fourth quarter of 2010, we completed the conversionfurther discussion of our flexible permits into federally enforc eable conventional state NSR permits (“de-flexed permits”). We are now in the process of incorporating these de-flexed permits into our Title V permits. Continued discussions with EPA regarding this matter are likely.environmental matters.
Meanwhile, EPA has formally disapproved other TCEQ permitting programs that historically have streamlined the environmental permitting process in Texas. For example, EPA has disapproved the TCEQ pollution control standard permit, thus requiring conventional permitting for future pollution control equipment. Litigation is pending from industry groups and others against EPA for each of these actions. EPA has also objected to numerous Title V permits in Texas and other states, including permits at our Port Arthur, Corpus Christi East, and McKee Refineries. Environmental activist groups have filed a notice of intent to sue EPA, seeking to require EPA to assume control of these permits from the TCEQ. All of these developments have created substantial uncertainty regarding existing and future permitting. Because of this uncertainty, we are unable to determine the costs or effects of EPA’s actions on our permitting activity. But EPA’s disruption of the Texas permitting system could result in material increased compliance costs for us, increased capital expenditures, increased operating costs, and additional operating restrictions for our business, resulting in an increase in the cost of, and decreases in the demand for, the products we produce, which could have a material adverse effect on our financial position, results of operations, and liquidity.
Tax Matters
As discussed in Note 12 of Notes to Consolidated Financial Statements, weWe are subject to extensive tax liabilities.liabilities imposed by multiple jurisdictions, including income taxes, transactional taxes (excise/duty, sales/use, and value-added taxes), payroll taxes, franchise taxes, withholding taxes, and ad valorem taxes. New tax laws and regulations and changes in existing tax laws and regulations are continuously being enacted or proposed that could result in increased expenditures for tax liabilities in the future. Many of these liabilities are subject to periodic audits by the respective taxing authority. Subsequent changes to
our tax liabilities as a result of these audits may subject us to interest and penalties. See Notes 12 and 16 of Notes to Consolidated Financial Statements for a further discussion of our tax matters.
Effective June 1, 2010,
48
As of December 31, 2011, the GOA enacted a newInternal Revenue Service (IRS) has ongoing tax re gime applicableaudits related to refineryour U.S. federal tax returns from 2002 through 2009, as discussed in Note 16 of Notes to Consolidated Financial Statements. We have received Revenue Agent Reports on our tax years for 2002 through 2007 and terminal operations in Aruba. Under the new tax regime, we are subjectvigorously contesting many of the tax positions and assertions from the IRS. Although we believe our tax liabilities are fairly stated and properly reflected in our financial statements, should the IRS eventually prevail, it could result in a material amount of our deferred tax liabilities being reclassified to current liabilities which could have a profit tax ratematerial adverse effect on our liquidity.
Cash Held by Our International Subsidiaries
We operate in countries outside the U.S. through subsidiaries incorporated in these countries, and the earnings of 7 percentthese subsidiaries are taxed by the countries in which they are incorporated. We intend to reinvest these earnings indefinitely in our international operations even though we are not restricted from repatriating such earnings to the U.S. in the form of cash dividends. Should we decide to repatriate such earnings, we would incur and a dividend withholding tax rate of 0 percent.pay taxes on the amounts repatriated. In addition, all imports and exports are exempt from turnoversuch repatriation could cause us to record deferred tax and throughput fees. Beginning June 1, 2012, we will also makeexpense that could significantly impact our results of operations, as further discussed in Note 16 of Notes to Consolidated Financial Statements. We believe, however, that a minimum annual tax paymentsubstantial portion of $10 million (payable in equal quarterly installments) with the ability to carry forward any excess tax prepayments to future tax years.
The new tax regime was the result of a settlement agreement that we entered into on February 24, 2010 with the GOA that established the terms for settlement of a lengthy and complicated tax dispute between the parties. On May 30, 2010, the Aruban Parliament adopted several laws that implement ed the provisions of the settlement agreement, which became effective June 1, 2010. Pursuantour international cash can be returned to the termsU.S. without significant tax consequences through means other than a repatriation of the settlement agreement, we relinquished the provisionsearnings. As of the previous tax holiday regime. On June 4, 2010, we made a payment to the GOADecember 31, 2011, $822 million of $118 million (primarily from restrictedour cash and temporary cash investments was held in escrow) in consideration of a full release of all tax claims prior to June 1, 2010.by our international subsidiaries.
Financial Regulatory Reform
OnIn July 21, 2010, President Obama signed into law the Dodd-Frank Wall Street Reform and Consumer Protection Act (Wall Street Reform Act). The Wall Street Reform Act, among many things, creates new re gulationsregulations for companies that extend credit to consumers and requires most derivative instruments to be traded on exchanges and routed through clearinghouses. Rules to implement the Wall Street Reform Act are being finalized and therefore, the impact to our operations is not yet known. However, implementation could result in higher margin requirements, higher clearing costs, and more reporting requirements with respect to our derivative activities.
OtherConcentration of Customers
Our refining and marketing operations have a concentration of customers in the refining industry and customers who are refined product wholesalers and retailers .retailers. These concentrations of customers may impact our overall exposure to credit risk, either positively or negatively, in that these customers may be similarly affected by changes in economic or other conditions. However, we believe that our portfolio of accounts receivable is sufficiently diversified to the extent necessary to minimize potential credit risk. Historically, we have not had any significant problems collecting our accounts receivable.
Sources of Liquidity
We believe that we have sufficient funds from operations and, to the extent necessary, from borrowings under our credit facilities, to fund our ongoing operating requirements. We expect that, to the extent necessary, we can raise additional funds from time to time through equity or debt financings in the public and private c apitalcapital markets or the arrangement of additional credit facilities. However, there can be no assurances regarding the availability of any future financings or additional credit facilities or whether such financings or additional credit facilities can be made available on terms that are acceptable to us.
NEW ACCOUNTING PRONOUNCEMENTS
As discussed in Note 1 of Notes to Consolidated Financial Statements, certain new financial accounting pronouncements have been issued that either have already been reflected in the accompanying consolidated financial statements, or will become effective for our financial statements at various dates in the future. The adoption of these pronouncements has not had, and is not expected to have, a material effect on our consolidated financial statements.
CRITICAL ACCOUNTING POLICIES INVOLVING CRITICAL ACCOUNTING ESTIMATES
The preparation of financial statements in accordance with U.S. generally accepted accounting principles requires us to make estimates and assumptions that affect the amounts reported in the consolidated financial statements and accompanying notes. Actual results could differ from those estimates. The following summary provides further information about our critical accounting policies that involve critical accounting estimates, and should be read in conjunction with Note 1 of Notes to Consolidated Financial Statements, which summarizes our significant accounting policies. The following accounting policies involve estimates that are considered critical due to the level of sensitivity and judgment involved, as well as the impact on our consolidated financial position and results of operations. We believe that all of our estimates are reasonable.
Property, Plant and Equipment
The cost of property, plant and equipment (property assets) purchased or constructed, including betterments of property assets, are capitalized. The cost of repairs to and normal maintenance of property assets, however, is expensed as incurred. Betterments of property assets are those which either extend the useful life, increase the capacity or improve the operating efficiency of the asset, or improve the safety of our operations. The cost of property assets constructed includes interest and certain overhead costs allocable to the construction activities.
Our operations, especially those of our refining segment, are highly capital intensive. Each of our refineries comprises a large base of property assets, consisting of a series of interconnected, highly integrated and interdependent crude oil processing facilities and supporting logistical infrastructure (Units), and these Units are continuously improved. Improvements consist of the addition of new Units and betterments of existing Units. We plan for these improvements by developing a multi-year capital program that is updated and revised based on changing internal and external factors.
Depreciation of property assets used in our refining segment is recorded on a straight-line basis over the estimated useful lives of these assets primarily using the composite method of depreciation. We maintain a separate composite group of property assets for each of our refineries. We estimate the useful life of each group based on an evaluation of the property assets comprising the group, and such evaluations consist of, but are not limited to, the physical inspection of the assets to determine their condition, consideration of the manner in which the assets are maintained, assessment of the need to replace assets, and evaluation of the manner in which improvements impact the useful life of the group. The estimated useful lives of our composite groups range primarily from 25 to 30 years.
Under the composite method of depreciation, the cost of an improvement is added to the composite group to which it relates and is depreciated over that group’s estimated useful life. We design improvements to our refineries in accordance with engineering specifications, design standards and practices accepted in our industry, and these improvements have design lives consistent with our estimated useful lives. Therefore, we believe the use of the group life to depreciate the cost of improvements made to the group is reasonable because the estimated useful life of each improvement is consistent with that of the group. It should be noted, however, that factors such as competition, regulation, or environmental matters could cause us to change our estimates, thus impacting depreciation expense in the future.
Also under the composite method of depreciation, the historical cost of a minor property asset (net of salvage value) that is retired or replaced is charged to accumulated depreciation and no gain or loss is recognized in income. However, a gain or loss is recognized in income for a major property asset that is retired, replaced or sold and for an abnormal disposition of a property asset (primarily involuntary conversions). Gains and losses are reflected in depreciation and amortization expense, unless such amounts are reported separately due to materiality.
Impairment of Assets
Long-lived assets, which include property, plant and equipment, intangible assets, and refinery turnaround and catalyst costs, are tested for recoverability whenever events or changes in circumstances indicate that the carrying amount of the asset may not be recoverable. An impairment loss should be recognized if the carrying amount of the asset exceeds its fair value.
In order to test for recoverability, we must make estimates of projected cash flows related to the asset being evaluated, which include, but are not limited to, assumptions about the use or disposition of the asset, its estimated remaining life, and future expenditures necessary to maintain its existing service potential. In order to determine fair value, management must make certain estimates and assumptions including, among other things, an assessment of market conditions, projected cash flows, investment rates, interest/equity rates, and growth rates, that could significantly impact the fair value of the asset being tested for impairment. Our impairment evaluations are based on assumptions that we deem to be reasonable. Providing sensitivity analyses if other assumptions were used in performing the impairment evaluations is not practicable due to the significant number of assumptions involved in the estimates. See Note 4 of Notes to Consolidated Financial Statements for a further discussion of our asset impairment evaluationsanalysis and certain losses resulting from those evaluations.analyses.
We evaluate our equity method investments for impairment when there is evidence that we may not be able to recover the carrying amount of our investments or the investee is unable to sustain an earnings capacity that justifies the carrying amount. A loss in the value of an investment that is other than a temporary decline is recognized currently in earnings, and is based on the difference between the estimated current fair value of the investment and its carrying amount.
Environmental Matters
Our operations are subject to extensive environmental regulationregulations by federal, state, and localgovernmental authorities relating primarily to the discharge of materials into the environment, waste management, and pollution prevention measures. Future legislative action and regulatory initiatives, as discussed in “LIQUIDITY AND CAPITAL RESOURCES – Environmental MattersNote 12,” of Notes to Consolidated Financial Statements could result in changes to required operating permits, additional remedial actions, or increased capital expenditures and operating costs that cannot be assessed with certainty at this time.
Accruals for environmental liabilities are based on best estimates of probable undiscounted future costs assumingover a 20-year time period using currently available remediation technology and applying current regulations, as well as our own internal environmental policies. However, environmental liabilities are difficult to assess and estimate due to uncertainties related to the magnitude of possible remediation, the timing of such remediation, and the determination of our obligation in proportion to other parties. Such estimates are subject to change due to many factors, including the identification of new sites requiring remediation, changes in environmental laws
and regulations and their interpretation, additional information related to the extent and nature of remediation efforts, and potential improvements in remediation technologies. An estimate of the sensitivity to earnings for changes in those factors is not practicable due to the number of contingencies that must be assessed, the number of underlying assumptions, and the wide range of possible outcomes.
The amount of and changes in our accruals for environmental matters as of and for the years ended December 31, 20102011, 20092010, and 20082009 is included in Note 10 of Notes to Consolidated Financial Statements.
Pension and Other Postretirement Benefit Obligations
We have significant pension and other postretirement benefit liabilities and costs that are developed from actuarial valuations. Inherent in these valuations are key assumptions including discount rates, expected return on plan assets, future compensation increases, and health care cost trend rates. Changes in these assumptions are primarily influenced by factors outside our control. For example, the discount rate assumption represents a yield curve comprised of various long-term bonds that each receive onehave an average rating of the two highestdouble-A when averaging all available ratings given by the recognized rating agencies, as of the end of each year, while the expected return on pl anplan assets is based on a compounded return calculated assuming an asset allocation that is representative of the asset mix in our qualified pension plans. These assumptions can have a significant effect on the amounts reported in our consolidated financial statements. For example, a 0.25 percent decrease in the assumptions related to the discount rate or expected return on plan assets or a 0.25 percent increase in the assumptions related to the health care cost trend rate or rate of compensation increase would have the following effects on the projected benefit obligation as of December 31, 20102011 and net periodic benefit cost for the year ending December 31, 20112012 (in millions):
| | | | | | | |
| | Pension Benefits | | Other Postretirement Benefits |
| Increase in projected benefit obligation resulting from: | | | |
| Discount rate decrease | $ | 70 | | | $ | 12 | |
| Compensation rate increase | 29 | | | — | |
| Health care cost trend rate increase | — | | | 5 | |
| | | | |
| Increase in expense resulting from: | | | |
Discount rate decrease | 9 | | | 1 | |
Expected return on plan assets decrease | 4 | | | — | |
Compensation rate increase | 6 | | | — | |
Health care cost t rend rate increase | — | | | 1 | |
|
| | | | | | | |
| |
Pension Benefits | | Other Postretirement Benefits |
| Increase in projected benefit obligation resulting from: | | | |
| Discount rate decrease | $ | 85 |
| | $ | 13 |
|
| Compensation rate increase | 33 |
| | — |
|
| Health care cost trend rate increase | — |
| | 5 |
|
| | | | |
| Increase in expense resulting from: | | | |
| Discount rate decrease | 14 |
| | 1 |
|
| Expected return on plan assets decrease | 4 |
| | — |
|
| Compensation rate increase | 8 |
| | — |
|
| Health care cost trend rate increase | — |
| | 1 |
|
See Note 14 of Notes to Consolidated Financial Statements for a further discussion of our pension and other postretirement benefit obligations.
Tax Matters
Our operationsWe are subject to extensive tax liabilities imposed by multiple jurisdictions, including federal, state, and foreign income taxes. We are also subject to varioustaxes, transactional taxes such as excise,(excise/duty, sales/use, and value-added taxes), payroll taxes, franchise taxes, withholding taxes, and ad valorem taxes. New tax laws and regulations and changes in existing tax laws and regulations are continuously being enacted or proposed and the implementation of future legislative and regulatory tax initiativesthat could result in increased expenditures for tax liabilities that cannot be predicted at this time. In addition, we have received claims from various jurisdictions related to certain tax matters. Tax liabilities include potential assessments of penalty and interest amounts.
We record tax liabilities based on our assessment of existing tax laws and regulations. A contingent loss related to a transactional tax claim is recorded if the loss is both probable and estimable. The recording of our tax liabilities requires significant judgments and estimates. Actual tax liabilities can vary from our
estimates for a variety of reasons, including different interpretations of tax laws and regulations and different assessments of the amount of tax due. In addition, in determining our income tax provision, we must assess the likelihood that our deferred tax assets, primarily consisting of net operating loss and tax credit carryforwards, will be recovered through future taxable income. Significant judgment is required in estimating the amount of valuation allowance, if any, that should be recorded against those deferred income tax assets. If our actual results of operations differ from such estimates or our estimates of future taxable income change, the valuation allowance may need to be revised. However, an estimate of the sensitivity to earnings that would result from changes in the assumptions and estimates used in determining our tax liabilities is not practicable due to the number of assumptions and tax laws involved, the various potential interpretations of the tax laws, and the wide range of possible outcomes. See NoteNotes 12 and 16 of Notes to Consolidated Financial Statements for a further discussion of our tax liabilities.
Legal Matters
A variety of claims have been made against us in various lawsuits. We record a liability related to a loss contingency attributable to such legal matters if we determine the loss to be both probable and estimable. The recording of such liabilities requires judgments and estimates, the results of which can vary significantly from actual litigation results due to differing interpretations of rele vantrelevant law and differing opinions regarding the degree of potential liability and the assessment of reasonable damages. However, an estimate of the sensitivity to earnings if other assumptions were used in recording our legal liabilities is not practicable due to the number of contingencies that must be assessed and the wide range of reasonably possible outcomes, both in terms of the probability of loss and the estimates of such loss. See Note 12 of Notes to Consolidated Financial Statements for a further discussion of our litigation matters.
ITEM 7A. QUANTITATIVE AND QUALITATIVE DISCLOSURES ABOUT MARKET RISK
COMMODITY PRICE RI SKRISK
We are exposed to market risks related to the volatility in the price of crude oil, refined products (primarily gasoline and distillate), grain (primarily corn), and natural gas used in our refining operations. To reduce the impact of price volatility on our results of operations and cash flows, we enter intouse commodity derivative instruments, including swaps, futures, and options to hedge:
| |
• | inventories and firm commitments to purchase inventories generally for amounts by which our current year LIFO inventory levels differ from our previous year-end LIFO inventory levels and |
| |
• | forecasted feedstock and refined product purchases, refined product sales, natural gas purchases, and corn purchases to lock in the price of those forecasted transactions at existing market prices that we deem favorable. |
inventories and firm commitments to purchase inventories generally for amounts by which our current year inventory levels (determined on a last-in, first-out (LIFO) basis) differ from our previous year-end LIFO inventory levels and
forecasted feedstock and refined product purchases, refined product sales, natural gas purchases, and corn purchases to lock in the price of these forecasted transactions at existing market prices that we deem favorable.
We use the futures markets for the available liquidity, which provides greater flexibility in transacting our hedging and trading operations. We use swaps primarily to manage our price exposure. We also enter into certain commodity derivative instruments for trading purposes to take advantage of existing market conditions related to commodities that we perceive as opportunities to benefit ourfuture results of operations and cash flows, but for which there are no related physical transactions.flows.
Our positions in commodity derivative instruments are monito redmonitored and managed on a daily basis by a risk control group to ensure compliance with our stated risk management policy that has been approved by our board of directors.
The following sensitivity analysis includes all positions at the end of the reporting period with which we have market risk (in millions):
| | | Derivative Instruments Held For | | | | | |
| | Non-Trading Purposes | | Trading Purposes | Derivative Instruments Held For |
| December 31, 2010 | | | | |
| Gain (loss) in fair value due to: | | | | |
| | | Non-Trading Purposes | | Trading Purposes |
| December 31, 2011 | | | | |
| Gain (loss) in fair value resulting from: | | | | |
| 10% increase in underlying commodity prices | $ | (199 | ) | | $ | — | | $ | (156 | ) | | $ | 1 |
|
| 10% decrease in underlying commodity prices | 189 | | | (1 | ) | 156 |
| | 2 |
|
| | | | | | | |
| December 31, 2009 | | | | |
| Gain (loss) in fair value due to: | | | | |
| December 31, 2010 | | | | |
| Gain (loss) in fair value resulting from: | | | | |
| 10% increase in underlying commodity prices | (6 | ) | | (8 | ) | (199 | ) | | — |
|
| 10% decrease in underlying commodity prices | 6 | | | — | | 189 |
| | (1 | ) |
See Note 21 of Notes to Consolidated Financial Statements for notional volumes associated with these derivative contracts as of December 31, 20102011.
I NTERESTCOMPLIANCE PROGRAM PRICE RISK
We are exposed to market risks related to the volatility in the price of financial instruments associated with
various governmental and regulatory compliance programs that we must purchase in the open market to comply with these programs. To reduce the impact of this risk on our results of operations and cash flows, we may enter into derivative instruments, such as futures. As of December 31, 2011, there was no significant gain or loss in the fair value of derivative instruments that would result from a 10 percent increase or decrease in the underlying price of the futures contracts. See Note 21 of Notes to Consolidated Financial Statements for a discussion about these compliance programs and notional volumes associated with these derivative contracts as of December 31, 2011.
INTEREST RATE RISK
The following table provides information about our debt instruments, excluding capital lease obligations (dollars in millions), the fair values of which are sensitive to changes in interest rates. Principal cash flows and related weighted-average interest rates by expected maturity dates are presented. We had no interest rate derivative instruments outstanding as of December 31, 20102011 and 20092010.
| | | December 31, 2010 | | | | | | | | | | | | | | | | | |
| | Expected Maturity Dates | | | | | December 31, 2011 |
| | 2011 | | 2012 | | 2013 | | 2014 | | 2015 | | There- after | | Total | | Fair Value | Expected Maturity Dates | | | | |
Debt (excluding capital lease obligations): | |
| | | 2012 | | 2013 | | 2014 | | 2015 | | 2016 | | There- after | | Total | | Fair Value |
| Debt: | | | | | | | | | | | | | | | | |
| Fixed rate | $ | 418 | | | $ | 759 | | | $ | 489 | | | $ | 209 | | | $ | 484 | | | $ | 5,605 | | | $ | 7,964 | | | $ | 9,092 | | $ | 754 |
| | $ | 484 |
| | $ | 200 |
| | $ | 475 |
| | $ | — |
| | $ | 5,578 |
| | $ | 7,491 |
| | $ | 9,048 |
|
| Average interest rate | 6.4 | % | | 6.9 | % | | 5.5 | % | | 4.8 | % | | 5.2 | % | | 7.2 | % | | 6.9 | % | | | 6.9 | % | | 5.5 | % | | 4.8 | % | | 5.2 | % | | — | % | | 7.3 | % | | 6.9 | % | | |
| Floating rate | $ | 400 | | | — | | | — | | | — | | | — | | | — | | | $ | 400 | | | $ | 400 | | $ | 250 |
| | $ | — |
| | $ | — |
| | $ | — |
| | $ | — |
| | $ | — |
| | $ | 250 |
| | $ | 250 |
|
| Average interest rate | 0.5 | % | | — | % | | — | % | | — | % | | — | % | | — | % | | 0.5 | % | | | 0.6 | % | | — | % | | — | % | | — | % | | — | % | | — | % | | 0.6 | % | | |
| | | | | | | | | | | | | | | | | | | | | | | | | | | | | | | |
| December 31, 2009 |
| Expected Maturity Dates | | | | |
| 2010 | |
2011 | | 2012 | | 2013 | | 2014 | | There- | | | | | | | | | | | | | | | | | | | | | | | | | | | | | | | | | | | December 31, 2010 | | | Expected Maturity Dates | | | | | | | 2011 | | 2012 | | 2013 | | 2014 | | 2015 | | There- after | | Total | | Fair Value | | Debt: | | | | | | | | | | | | | | | | | Fixed rate | $ | 418 |
| | $ | 759 |
| | $ | 489 |
| | $ | 209 |
| | $ | 484 |
| | $ | 5,605 |
| | $ | 7,964 |
| | $ | 9,092 |
| | Average interest rate | 6.4 | % | | 6.9 | % | | 5.5 | % | | 4.8 | % | | 5.2 | % | | 7.2 | % | | 6.9 | % | | | | Floating rate | $ | 400 |
| | $ | — |
| | $ | — |
| | $ | — |
| | $ | — |
| | $ | — |
| | $ | 400 |
| | $ | 400 |
| | Average interest rate | 0.5 | % | | — | % | | — | % | | — | % | | — | % | | — | % | | 0.5 | % | | |
after
| | Total | | Fair
Value
| Debt (excluding
capital lease obligations):
| | | | | | | | | | | | | | | |
Fixed rate | $ | 33 | | | $ | 418 | | | $ | 759 | | | $ | 489 | | | $ | 395 | | | $ | 5,126 | | | $ | 7,220 | | | $ | 8,028 | |
Average interest rate | 6.8 | % | | 6.4 | % | | 6.9 | % | | 5.5 | % | | 5.7 | % | | 7.5 | % | | 7.1 | % | | |
Floating rate | $ | 200 | | | — | | | — | | | — | | | — | | | — | | | $ | 200 | | | $ | 200 | |
Average interest rate | 0.9 | % | | — | % | | — | % | | — | % | | — | % | | — | % | | 0.9 | % | | |
FOREIGN CURRENCY RISK
As of December 31, 20102011, we had commitments to purchase $487751 million of U.S. dollars. Our market risk was minimal on the contracts, as they matured on or before January 31, 201126, 2012, resulting in a $2$3 million loss in the first quarter of 2011.2012.
ITEM 8. FINANCIAL STATEMENTS AND SUPPLEME NTARYSUPPLEMENTARY DATA
MANAGEMENT’S REPORT ON INTERNAL CONTROL OVER FINANCIAL REPORTING
Our management is responsible for establishing and maintaining adequate “internal control over financial reporting” (as defined in Rule 13a-15(f) under the Securities Exchange Act of 1934) for Valero. Our management evaluated the effectivenes seffectiveness of Valero’s internal control over financial reporting as of December 31, 20102011. In its evaluation, management used the criteria established in Internal Control – Integrated Framework issued by the Committee of Sponsoring Organizations of the Treadway Commission (COSO). Management believes that as of December 31, 20102011, our internal control over financial reporting was effective based on those criteria.
Management’s evaluation of and conclusion regarding the effectiveness of our internal control over financial reporting excludes the internal control over financial reporting of Valero Energy Ltd and its subsidiaries (VEL), which we acquired on August 1, 2011 and of Valero Refining-Meraux LLC (Meraux), the operations of which we acquired on October 1, 2011, (as described in Note 2 of Notes to Consolidated Financial Statements). The VEL and Meraux acquisitions contributed approximately 7 percent of our total operating revenues for the year ended December 31, 2011 and accounted for approximately 10 percent of our total assets as of December 31, 2011. We plan to fully integrate VEL and Meraux into our internal control over financial reporting in 2012.
Our independent registered public accounting fir mfirm has issued an attestation report on the effectiveness of our internal control over financial reporting, which begins on page 5758 of this report.
REPORT OF INDEPENDENT REGISTERED PUBLIC ACCOUNTING FIRM
The Board of Directors and Stockholders
of Valero Energy Corporation and subsidiaries:
We have audited the accompanying consolidated balance sheets of Valero Energy Corporation and subsidiaries (the Company) as of December 31, 20102011 and 20092010, and the related consolidated statements of income, stockholders’ equity, cash flows, and comprehensive income for each of the years in the three-year period ended December 31, 20102011. These consolidated financial statements are the responsibility of the Company’s management. Our responsibility i sis to express an opinion on these consolidated financial statements based on our audits.
We conducted our audits in accordance with the standards of the Public Company Accounting Oversight Board (United States) (the PCAOB). Those standards require that we plan and perform the audit to obtain reasonable assurance about whether the financial statements are free of material misstatement. An audit includes examining, on a test basis, evidence supporting the amounts and disclosures in the financial statements. An audit also includes assessing the accounting principles used and significant estimates made by management, as well as evaluating the overall financial statement presentation. We believe that our audits provide a reasonable basis for our opinion.
In our opinion, the consolidated financial statements referred to above present fairly, in all material respects, the financial position of Valero Energy Corporation and subsidiaries as of December 31, 20102011 and 20092010, and the results of their operations and their cash flows for each of the years in the three-year period ended December 31, 20102011, in conformity with U.S. generally accepted accounting principles.
We also have audited, in accordance with the standards of the PCAOB, the Company’s internal control over financial reporting as of December 31, 20102011, based on criteria established in Internal Control – Integrated Framework issued by the Committee of Sponsoring Organizations of the Treadway Commission, (COSO), and our report dated February 25, 201124, 2012, expressed an unqualified opinion on the effectiveness of the Company’s internal control over financial reporting.
/s/ KPMG LLP
San Antonio, Texas
February 25, 201124, 2012
REPORT OF INDEPENDENT REGISTERED PUBLIC ACCOUNTING FIRM
The Board of Directors and Stockholders
of Valero Energy Corporation and subsidiaries:
We have audited Valero Energy Corporation and subsidiaries’ (the Company’s) internal control over financial repor tingreporting as of December 31, 2010,2011, based on criteria established in Internal Control – Integrated Framework issued by the Committee of Sponsoring Organizations of the Treadway Commission (COSO). The Company’s management is responsible for maintaining effective internal control over financial reporting and for its assessment of the effectiveness of internal control over financial reporting, included in the accompanying Management’s Report on Internal Control over Financial Reporting. Our responsibility is to express an opinion on the Company’s internal control over financial reporting based on our audit.
We conducted ou rour audit in accordance with the standards of the Public Company Accounting Oversight Board (United States) (the PCAOB). Those standards require that we plan and perform the audit to obtain reasonable assurance about whether effective internal control over financial reporting was maintained in all material respects. Our audit included obtaining an understanding of internal control over financial reporting, assessing the risk that a material weakness exists, and testing and evaluating the design and operating effectiveness of internal control based on the assessed risk. Our audit also included performing such other procedures as we considered necessary in the circumstances. We believe that our audit provides a reasonable basis for our opinion.
A company’s internal control over financial reporting is a process designed to provide reasonable assurance regarding the reliability of financial reporting and the preparation of financial statements for external purposes in accordance with generally accepted accounting principles. A company’s internal control over financial reporting includes those policies and procedures that (1) pertain to the maintenance of records that, in reasonable detail, accurately and fairly reflect the transactions and dispositions of the assets of the company; (2) provide reasonable assurance that transactions are recorded as necessary to permit preparation of financial statements in accordance with generally accepted accounting principles, and that receipts and expenditures of the company are being made only in accordance with authorizations of management and directors of the company; and (3) provide reasonable assurance regarding prevention or timely detection of unauthorized acquisition, use, or disposition of the company’s assets th atthat could have a material effect on the financial statements.
Because of its inherent limitations, internal control over financial reporting may not prevent or detect misstatements. Also, projections of any evaluation of effectiveness to future periods are subject to the risk that controls may become inadequate because of changes in conditions, or that the degree of compliance with the policies or procedures may deteriorate.
In our opinion, Valero Energy Corporation and subsidiaries maintained, in all material respects, effect iveeffective internal control over financial reporting as of December 31, 2010,2011, based on criteria established in Internal Control – Integrated Framework issued by COSO.
The Company acquired Valero Energy Ltd and its subsidiaries (VEL) on August 1, 2011 and the operations of Valero Refining-Meraux LLC (Meraux) on October 1, 2011, and management excluded VEL’s and Meraux’s internal control over financial reporting from its assessment of the effectiveness of the Company’s internal control over financial reporting as of December 31, 2011. The VEL and Meraux acquisitions
contributed approximately 7 percent of the Company’s total operating revenues for the year ended December 31, 2011 and accounted for approximately 10 percent of its total assets as of December 31, 2011. Our audit of internal control over financial reporting of the Company also excluded an evaluation of the internal control over financial reporting of VEL and Meraux.
We also have audited, in accordance with the standards of the PCAOB, the consolidated balance sheets of Valero Energy Corporation and subsidiaries as of December 31, 20102011 and 2009,2010, and the related consolidated statements of income, stockholders’ equity, cash flows, and comprehensive income for each of the years in the three-year period ended December 31, 2010,2011, and our report dated February 25, 201124, 2012 expressed an unqualified opinion on those consolidated financial statements.
/s/ KPMG LLP
San Antonio, Texas
February 25, 2011
24, 2012
VALERO ENERGY CORPORATION AND SUBSIDIARIES
CONSOLIDATED BALANCE SHEETS
(Millions of Dollars, Except Par Value)
| | | December 31, | | | | | |
| | 2010 | | 2009 | December 31, |
| | | | | 2011 | | 2010 |
| ASSETS | | | | | | |
| Current assets: | | | | | | |
| Cash and temporary cash investments | $ | 3,334 | | | $ | 825 | | $ | 1,024 |
| | $ | 3,334 |
|
| Receivables, net | 4,583 | | | 3,779 | | 8,706 |
| | 4,583 |
|
| Inventories | 4,947 | | | 4,578 | | 5,623 |
| | 4,947 |
|
| Income taxes receivable | 343 | | | 887 | | 212 |
| | 343 |
|
| Deferred income taxes | 190 | | | 180 | | 283 |
| | 190 |
|
| Prepaid expenses and other | 121 | | | 384 | | 124 |
| | 121 |
|
| Assets held for sale | — | | | 289 | | |
| Total current assets | 13,518 | | | 10,922 | | 15,972 |
| | 13,518 |
|
| Property, plant and equipment, at cost | 28,921 | | | 26,885 | | 32,253 |
| | 28,921 |
|
| Accumulated depreciation | (6,252 | ) | | (5,270 | ) | (7,076 | ) | | (6,252 | ) |
| Property, plant and equipment, net | 22,669 | | | 21,615 | | 25,177 |
| | 22,669 |
|
| Intangible assets, net | 224 | | | 227 | | 227 |
| | 224 |
|
| Deferred charges and other assets, net | 1,210 | | | 1,347 | | 1,407 |
| | 1,210 |
|
| Long-term assets held for sale | — | | | 1,461 | | |
| Total assets | $ | 37,621 | | | $ | 35,572 | | $ | 42,783 |
| | $ | 37,621 |
|
LIABILITIES AND STOCKHOLDERS’ EQUITY | | | | |
| LIABILITIES AND EQUITY | | | | |
| Current liabilities: | | | | | | |
| Current portion of debt and capital lease obligations | $ | 822 | | | $ | 237 | | $ | 1,009 |
| | $ | 822 |
|
| Accounts pay able | 6,441 | | | 5,825 | | |
| Accounts payable | | 9,472 |
| | 6,441 |
|
| Accrued expenses | 590 | | | 641 | | 595 |
| | 590 |
|
| Taxes other than income taxes | 671 | | | 725 | | 1,264 |
| | 671 |
|
| Income taxes payable | 3 | | | 95 | | 119 |
| | 3 |
|
| Deferred income taxes | 257 | | | 253 | | 249 |
| | 257 |
|
| Liabilities related to assets held for sale | — | | | 33 | | |
| Total current liabilities | 8,784 | | | 7,809 | | 12,708 |
| | 8,784 |
|
| Debt and capital lease obligations, less current portion | 7,515 | | | 7,163 | | 6,732 |
| | 7,515 |
|
| Deferred income taxes | 4,530 | | | 4,006 | | 5,017 |
| | 4,530 |
|
| Other long-term liabilities | 1,767 | | | 1,869 | | 1,881 |
| | 1,767 |
|
| Commitments and contingencies | | | |
| |
|
| Stockholders’ equity: | | | | |
| Equity: | | | | |
| Valero Energy Corporation stockholders’ equity: | | | | |
Common stock, $0.01 par value; 1,200,000,000 shares authorized;
673,501,593 and 673,501,593 shares issued | 7 | | | 7 | | 7 |
| | 7 |
|
| Additional paid-in capital | 7,704 | | | 7,896 | | 7,486 |
| | 7,704 |
|
| Treasury stock, at cost; 105,113,545 and 108,798,847 common shares | (6,462 | ) | | (6,721 | ) | |
| Treasury stock, at cost; 116,689,450 and 105,113,545 common shares | | (6,475 | ) | | (6,462 | ) |
| Retained earnings | 13,388 | | | 13,178 | | 15,309 |
| | 13,388 |
|
| Accumulated other comprehensive income | 388 | | | 365 | | 96 |
| | 388 |
|
| Total stockholders’ equity | 15,025 | | | 14,725 | | |
| Total liabilities and stockholders’ equity | $ | 37,621 | | | $ | 35,572 | | |
| Total Valero Energy Corporation stockholders’ equity | | 16,423 |
| | 15,025 |
|
| Noncontrolling interest | | 22 |
| | — |
|
| Total equity | | 16,445 |
| | 15,025 |
|
| Total liabilities and equity | | $ | 42,783 |
| | $ | 37,621 |
|
See Notes to Consolidated Financial Statements.
VALERO ENERGY CORPORATION AND SUBSIDIARIES
CONSOLIDATED STA TEMENTS OF INCOME
(Millions of Dollars, Except per Share Amounts)
| | | | | | | | | | | |
| | Year Ended December 31,
| | 2010 | | 2009 | | 2008 |
| Operating revenues (a) | $ | 82,233 | | | $ | 64,599 | | | $ | 106,676 | |
| Costs and expe nses: | | | | | |
| Cost of sales | 74,458 | | | 58,686 | | | 96,087 | |
| Operating expenses: | | | | | |
| Refining | 2,944 | | | 2,880 | | | 3,731 | |
| Retail | 654 | | | 626 | | | 676 | |
| Ethanol | 363 | | | 169 | | | — | |
| General and administrative expenses | 531 | | | 572 | | | 559 | |
| Depreciation and amortization expense | 1,405 | | | 1,361 | | | 1,304 | |
| Asset impairment loss | 2 | | | 222 | | | 86 | |
| Gain on sale of Krotz Springs Refinery | — | | | — | | | (305 | ) |
| Goodwill impairment loss | — | | | — | | | 4,007 | |
| Total costs and expenses | 80,357 | | | 64,516 | | | 106,145 | |
| Operating income | 1,876 |
| | 83 | | | 531 | | Other income, net | 106 | | | 17 | | | 113 | |
Interest and debt expense: | | | | | |
Incurred | (574 | ) | | (521 | ) | | (452 | ) |
Capitalized | 90 | | | 105 | | | 92 | |
Income (loss) from continuing operations
before income tax e xpense (benefit)
| 1,498 | | | (316 | ) | | 284 | |
Income tax expense (bene fit) | 575 | | | (43 | ) | | 1,438 | |
Income (loss) f rom continuing operations | 923 | | | (273 | ) | | (1,154 | ) |
Income (loss) from discontinued operations, net of income taxes | (599 | ) | | (1,709
| ) | | 23 | |
Net income (loss) | $ | 324 | | | $ | (1,982 | ) | | $ | (1,131 | ) |
Earnings (loss) per common share:
| | | | | |
Continuing operations | $ | 1.63 | | | $ | (0.50 | ) | | $ | (2.20 | ) |
Discontinued operations | (1.06 | ) | | (3.17 | ) | | 0.04 | |
Total | $ | 0.57 | | | $ | (3.67 | ) |
| $ | (2.16 | ) |
Weighted-average common shares outstanding (in millions) | 563 | | | 541 | | | 524 | |
Earnings (loss) per common share – assuming dilution: | | | | | |
Continuing operations | $ | 1.62 | | | $ | (0.50 | ) | | $
(2.20 | ) |
Discontinued operations | (1.05 | ) | | (3.17 | ) | | 0.04 | |
Total | $ | 0.57 | | | $ | (3.67 | ) | | $ | (2.16 | ) |
Weighted-average common shares outstanding –
assuming dilution (in millions)
| 568 | | | 541 | | | 524 | |
Dividends per common share | $ | 0.20 | | | $ | 0.60 | | | $ | 0.57 | |
| | | | | | | | | | | |
| Supplemental information: | | | | | |
| (a) Includes excise taxes on sales by our U.S. retail system | $ | 891 | | | $ | 873 | | | $ | 816 | |
See Notes to Consolidated Financial Statements.
VALERO ENERGY CORPORATION AND SUBSIDIARIES
CONSOLIDATED STATEMENTS OF STOCKHOLDERS’ EQUITYINCOME
(Millions of Dollars)Dollars, Except per Share Amounts)
| | | | | | | | | | | | | | | | | | | |
| | Common Stock | | Additional Paid-in Capital | | Treasury Stock | | Retained Earnings | | Accumulated Other Comprehensive Income (Loss) |
| Balance as of December 31, 2007 | $ | 6 | | | $ | 7,111 | | | $ | (6,097 | ) | | $ | 16,914 | | | $ | 573 | |
| Net loss | — | | | — | | | — | | | (1,131 | ) | | — | |
| Dividends on common stock | — | | | — | | | — | | | (299 | ) | | — | |
Stock-based compensation expense | — | | | 62 | | | — | | | — | | | — | |
Shares repurchased under $6 billion common stock purchase program | — | | | — | | | (667 | ) | | — | | | — | |
Shares repurchased, net of shares issued, in connection with employee stock plans and other | — | | | 17 | | | (120 | ) | | — | | | — | |
| Other comprehensive loss | — | | | — | | | — | | | — | | | (749 | ) |
| Balance as of December 31, 2008 | 6 | | | 7,190 | | | (6,884 | ) | | 15,484 | | & nbsp; | (176 | ) |
| Net loss | — | | | — | | | — | | | (1,982 | ) | | — | |
| Dividends on common stock |
— | | | — | | | — | | | (324 | ) | | — | | Sale of common stock | 1 | | | 798 | | | — | | | — | | | — | |
Stock-based compensation
expense
| — | | | 68 | | | — | | | — | | | — | |
Shares issued, net of shares
repurchased, in connection with
employee stock plans and other
| — | | | (160 | ) | | 163 | | | — | | | — | |
Other comprehensive income | — | | | — | | | — | | | — | | | 541 | |
Balance as of December 31, 2009 | 7 | | | 7,896 | | ; | (6,721 | ) | | 1 3,178 | | | 365 | |
Net income | — | | | — | | | — | | | 324 | | | — | |
Dividends on common stock | — | | | — | | | — | | | (114 | ) | | — | |
Stock-based compensation
expense
| — | | | 54 | | | &mdas h; | | | — | | | — | |
Shares issued, net of shares
repurchased, in connection with
employee stock plans and other
| — | | | (246 | ) | | 259 | | | — | | | — |
|
Other comprehensive income | — | | | — | | | — | | | — | | | 23 | |
Balance as of December 31, 2010 | $ | 7 | | | $ | 7,704 | | | $ | (6,462 | ) | | $ | 13,388 | | | $ | 388 | |
|
| | | | | | | | | | | |
| | Year Ended December 31, |
| | 2011 | | 2010 | | 2009 |
| Operating revenues (a) | $ | 125,987 |
| | $ | 82,233 |
| | $ | 64,599 |
|
| Costs and expenses: | | | | | |
| Cost of sales | 115,719 |
| | 74,458 |
| | 58,686 |
|
| Operating expenses: | | | | | |
| Refining | 3,406 |
| | 2,944 |
| | 2,880 |
|
| Retail | 678 |
| | 654 |
| | 626 |
|
| Ethanol | 399 |
| | 363 |
| | 169 |
|
| General and administrative expenses | 571 |
| | 531 |
| | 572 |
|
| Depreciation and amortization expense | 1,534 |
| | 1,405 |
| | 1,361 |
|
| Asset impairment loss | — |
| | 2 |
| | 222 |
|
| Total costs and expenses | 122,307 |
| | 80,357 |
| | 64,516 |
|
| Operating income | 3,680 |
| | 1,876 |
| | 83 |
|
| Other income, net | 43 |
| | 106 |
| | 17 |
|
| Interest and debt expense, net of capitalized interest | (401 | ) | | (484 | ) | | (416 | ) |
| Income (loss) from continuing operations before income tax expense (benefit) | 3,322 |
| | 1,498 |
| | (316 | ) |
| Income tax expense (benefit) | 1,226 |
| | 575 |
| | (43 | ) |
| Income (loss) from continuing operations | 2,096 |
| | 923 |
| | (273 | ) |
| Loss from discontinued operations, net of income taxes | (7 | ) | | (599 | ) | | (1,709 | ) |
| Net income (loss) | 2,089 |
| | 324 |
| | (1,982 | ) |
| Less: Net loss attributable to noncontrolling interests | (1 | ) | | — |
| | — |
|
| Net income (loss) attributable to Valero Energy Corporation stockholders | $ | 2,090 |
| | $ | 324 |
| | $ | (1,982 | ) |
| | | | | | |
| Net income (loss) attributable to Valero Energy Corporation stockholders: | | | | | |
| Continuing operations | $ | 2,097 |
| | $ | 923 |
| | $ | (273 | ) |
| Discontinued operations | (7 | ) | | (599 | ) | | (1,709 | ) |
| Total | $ | 2,090 |
| | $ | 324 |
| | $ | (1,982 | ) |
| Earnings per common share: | | | | | |
| Continuing operations | $ | 3.70 |
| | $ | 1.63 |
| | $ | (0.50 | ) |
| Discontinued operations | (0.01 | ) | | (1.06 | ) | | (3.17 | ) |
| Total | $ | 3.69 |
| | $ | 0.57 |
| | $ | (3.67 | ) |
| Weighted-average common shares outstanding (in millions) | 563 |
| | 563 |
| | 541 |
|
| Earnings per common share – assuming dilution: | | | | | |
| Continuing operations | $ | 3.69 |
| | $ | 1.62 |
| | $ | (0.50 | ) |
| Discontinued operations | (0.01 | ) | | (1.05 | ) | | (3.17 | ) |
| Total | $ | 3.68 |
| | $ | 0.57 |
| | $ | (3.67 | ) |
| Weighted-average common shares outstanding – assuming dilution (in millions) | 569 |
| | 568 |
| | 541 |
|
| Dividends per common share | $ | 0.30 |
| | $ | 0.20 |
| | $ | 0.60 |
|
| _____________________________ | | | | | |
| Supplemental information: | | | | | |
| (a) Includes excise taxes on sales by our U.S. retail system | $ | 892 |
| | $ | 891 |
| | $ | 873 |
|
See Notes to Consolidated Financial Statements.
VALERO ENERGY CORPORATION AND SUBSIDIARIES
CONSOLIDATED STATEMENTS OF EQUITY
(Millions of Dollars)
|
| | | | | | | | | | | | | | | | | | | | | | | | | | | | | | | |
| | Valero Energy Corporation Stockholders’ Equity | | | | |
| | Common Stock | | Additional Paid-in Capital | | Treasury Stock | | Retained Earnings | | Accumulated Other Comprehensive Income (Loss) | | Total | | Non-controlling Interest | | Total Equity |
| Balance as of December 31, 2008 | $ | 6 |
| | $ | 7,190 |
| | $ | (6,884 | ) | | $ | 15,484 |
| | $ | (176 | ) | | $ | 15,620 |
| | $ | — |
| | $ | 15,620 |
|
| Net loss | — |
| | — |
| | — |
| | (1,982 | ) | | — |
| | (1,982 | ) | | — |
| | (1,982 | ) |
| Dividends on common stock | — |
| | — |
| | — |
| | (324 | ) | | — |
| | (324 | ) | | — |
| | (324 | ) |
| Sale of common stock | 1 |
| | 798 |
| | — |
| | — |
| | — |
| | 799 |
| | — |
| | 799 |
|
| Stock-based compensation expense | — |
| | 68 |
| | — |
| | — |
| | — |
| | 68 |
| | — |
| | 68 |
|
| Tax deduction less than stock-based compensation expense | — |
| | (4 | ) | | — |
| | — |
| | — |
| | (4 | ) | | — |
| | (4 | ) |
| Transactions in connection with stock-based compensation plans: | | | | | | | | | | | | | | | |
| Stock issuances | — |
| | (156 | ) | | 167 |
| | — |
| | — |
| | 11 |
| | — |
| | 11 |
|
| Stock repurchases | — |
| | — |
| | (4 | ) | | — |
| | — |
| | (4 | ) | | — |
| | (4 | ) |
| Other comprehensive income | — |
| | — |
| | — |
| | — |
| | 541 |
| | 541 |
| | — |
| | 541 |
|
| Balance as of December 31, 2009 | 7 |
| | 7,896 |
| | (6,721 | ) | | 13,178 |
| | 365 |
| | 14,725 |
| | — |
| | 14,725 |
|
| Net income | — |
| | — |
| | — |
| | 324 |
| | — |
| | 324 |
| | — |
| | 324 |
|
| Dividends on common stock | — |
| | — |
| | — |
| | (114 | ) | | — |
| | (114 | ) | | — |
| | (114 | ) |
| Stock-based compensation expense | — |
| | 54 |
| | — |
| | — |
| | — |
| | 54 |
| | — |
| | 54 |
|
| Tax deduction in excess of stock-based compensation expense | — |
| | 6 |
| | — |
| | — |
| | — |
| | 6 |
| | — |
| | 6 |
|
| Transactions in connection with stock-based compensation plans: | | | | | | | | | | | | | | | |
| Stock issuances | — |
| | (252 | ) | | 272 |
| | — |
| | — |
| | 20 |
| | — |
| | 20 |
|
| Stock repurchases | — |
| | — |
| | (13 | ) | | — |
| | — |
| | (13 | ) | | — |
| | (13 | ) |
| Other comprehensive income | — |
| | — |
| | — |
| | — |
| | 23 |
| | 23 |
| | — |
| | 23 |
|
| Balance as of December 31, 2010 | 7 |
| | 7,704 |
| | (6,462 | ) | | 13,388 |
| | 388 |
| | 15,025 |
| | — |
| | 15,025 |
|
| Net income | — |
| | — |
| | — |
| | 2,090 |
| | — |
| | 2,090 |
| | (1 | ) | | 2,089 |
|
| Dividends on common stock | — |
| | — |
| | — |
| | (169 | ) | | — |
| | (169 | ) | | — |
| | (169 | ) |
| Stock-based compensation expense | — |
| | 57 |
| | — |
| | — |
| | — |
| | 57 |
| | — |
| | 57 |
|
| Tax deduction in excess of stock-based compensation expense | — |
| | 22 |
| | — |
| | — |
| | — |
| | 22 |
| | — |
| | 22 |
|
| Transactions in connection with stock-based compensation plans: | | | | | | | | | | | | | | | |
| Stock issuances | — |
| | (287 | ) | | 336 |
| | — |
| | — |
| | 49 |
| | — |
| | 49 |
|
| Stock repurchases | — |
| | (10 | ) | | (349 | ) | | — |
| | — |
| | (359 | ) | | — |
| | (359 | ) |
| Contributions from noncontrolling interest in DGD | — |
| | — |
| | — |
| | — |
| | — |
| | — |
| | 23 |
| | 23 |
|
| Recognition of noncontrolling interests in MLP in connection with Pembroke Acquisition | — |
| | — |
| | — |
| | — |
| | — |
| | — |
| | 5 |
| | 5 |
|
| Acquisition of noncontrolling interests in MLP | — |
| | — |
| | — |
| | — |
| | — |
| | — |
| | (5 | ) | | (5 | ) |
| Other comprehensive loss | — |
| | — |
| | — |
| | — |
| | (292 | ) | | (292 | ) | | — |
| | (292 | ) |
| Balance as of December 31, 2011 | $ | 7 |
| | $ | 7,486 |
| | $ | (6,475 | ) | | $ | 15,309 |
| | $ | 96 |
| | $ | 16,423 |
| | $ | 22 |
| | $ | 16,445 |
|
See Notes to Consolidated Financial Statements.
VALERO ENERGY CORPORATION AND SUBSIDIARIES
CONSOLIDATED STATEMENTS OF CASH FLOWS
(Millions of Dollars)
| | | | | | | | | | | |
| | Year Ended December 31, |
| | 2010 | | 2009 | | 2008 |
| Cash flows from operating activities: | | | | | |
| Net income (loss) | $ | 324 | | | $ | (1,982 | ) | | $ | (1,131 | ) |
| Adjustments to reconcile net income (loss) to net cash provided by operating activities: | | | | | |
| Depreciation and amortization expense | 1,473 | | | 1,527 | | | 1,476 | |
| Asset impairment loss | 2 | | | 607 | | | 103 | |
| Goodwill impairment loss | — | | | — | | | 4,069 | |
| Loss (gain) on sale of refinery assets, net | 888 | | | — | | | (305 | ) |
| Loss on shutdown of Delaware City Refinery | — | | | 1,868 | | | — | |
| Gain on sale of investment in Cameron Highway Oil Pipeline Company | (55 | ) | | — | | | — | |
| Noncash interest expense and other income, net | 3 | | | (2 | ) | | (76 | ) |
| Stock-based compensation expense | 54 | | | 66 | | | 59 | |
| Deferred income tax expense (benefit) | 347 | | | (343 | ) | | 675 | |
| Changes in current assets and current liabilities | 68 | | | 255 | | | (1,630 | ) |
| Changes in deferred charges an d credits and other operating activities, net | (59 | ) | | (173 | ) | | (145 | ) |
| Net cash provided by operating activities | 3,045 | | | 1,823 | | | 3,095 | |
| Cash flows from investing activities: | | | | | |
| Capital expenditures | (1,730 | ) | | (2,306 | ) | | (2,893 | ) |
| Deferred turnaround and catalyst costs | (535 | ) | | (415 | ) | | (408 | ) |
| Acquisitions of ethanol plants | (260 | ) | | (556 | ) | | — | |
| Advance payments related to acquisition of ethanol plants | — | | | (21 | ) | | — | |
| Proceeds from the sale of the Paulsboro Refinery | 547 | | | — | | | — | |
Proceeds from the sale of the Delaware City Refinery assets and associated terminal and pipeline assets | 220 | | | — | | | — | |
| Proceeds from the sale of the Krotz Springs Refinery | — | | | — | | | 463 | |
| Proceeds from the sale of investment in Cameron Highway Oil Pipeline Company | 330 | | | — | | | — | |
Minor acquisitions | — | | | (29 | ) | | (144 | ) |
| Other investing activities, net | 23 | | | 35 | | | 17 | |
| Net cash used in investing activities | (1,405 | ) | | (3,292 | ) | | (2,965 | ) |
| Cash flows from financing activities: | | | | | |
| Non-bank debt: | | | | | |
| Borrowings | 1,544 | | | 998 | | | — | |
| Repayments | (517 | ) | | (285 | ) | | (374 | ) |
| Bank credit agreements: | | | | | |
| Borrowings | — | | | 39 | | | 296 | |
| Repayments | — | | | (39 | ) | | (296 | ) |
| Accounts receivable sales program: | |
| | | | | | | | | | | | | | | | | | Year Ended December 31, | | | 2011 | | 2010 | | 2009 | | Cash flows from operating activities: | | | | | | | Net income (loss) | $ | 2,089 |
| | $ | 324 |
| | $ | (1,982 | ) | | Adjustments to reconcile net income (loss) to net cash provided by operating activities: | | | | | | | Depreciation and amortization expense | 1,534 |
| | 1,473 |
| | 1,527 |
| | Asset impairment loss | — |
| | 2 |
| | 607 |
| | Loss on shutdown and sales of refinery assets, net | 12 |
| | 888 |
| | 1,868 |
| | Gain on sale of investment in Cameron Highway Oil Pipeline Company | — |
| | (55 | ) | | — |
| | Stock-based compensation expense | 58 |
| | 54 |
| | 66 |
| | Deferred income tax expense (benefit) | 461 |
| | 347 |
| | (343 | ) | | Changes in current assets and current liabilities | 81 |
| | 68 |
| | 255 |
| | Changes in deferred charges and credits and other operating activities, net | (197 | ) | | (56 | ) | | (175 | ) | | Net cash provided by operating activities | 4,038 |
| | 3,045 |
| | 1,823 |
| | Cash flows from investing activities: | | | | | | | Capital expenditures | (2,355 | ) | | (1,730 | ) | | (2,306 | ) | | Deferred turnaround and catalyst costs | (629 | ) | | (535 | ) | | (415 | ) | | Acquisition of Pembroke Refinery, net of cash acquired | (1,691 | ) | | — |
| | — |
| | Acquisition of Meraux Refinery | (547 | ) | | — |
| | — |
| | Acquisitions of ethanol plants | — |
| | (260 | ) | | (577 | ) | | Minor acquisitions | (37 | ) | | — |
| | (29 | ) | | Proceeds from the sale of the Paulsboro Refinery | — |
| | 547 |
| | — |
| Proceeds from the sale of the Delaware City Refinery assets and associated terminal and pipeline assets | — |
| | 220 |
| | — |
| | Proceeds from the sale of investment in Cameron Highway Oil Pipeline Company | — |
| | 330 |
| | — |
| | Other investing activities, net | (39 | ) | | 23 |
| | 35 |
| | Net cash used in investing activities | (5,298 | ) | | (1,405 | ) | | (3,292 | ) | | Cash flows from financing activities: | | | | | | | Non-bank debt: | | | | | | | Borrowings | — |
| | 1,544 |
| | 998 |
| | Repayments | (774 | ) | | (517 | ) | | (285 | ) | | Bank credit agreements: | | | | | | | Borrowings | — |
| | — |
| | 39 |
| | Repayments | (4 | ) | | — |
| | (39 | ) | | Accounts receivable sales facility: | | | | | | | Proceeds from the sale of receivables | 150 |
| | 1,225 |
| | 950 |
| | Repayments | — |
| | (1,325 | ) | | (850 | ) | | Proceeds from the sale of common stock, net of issuance costs | — |
| | — |
| | 799 |
| | Proceeds from the exercise of stock options | 49 |
| | 20 |
| | 11 |
| | Purchase of common stock for treasury | (349 | ) | | (13 | ) | | (4 | ) | | Common stock dividends | (169 | ) | | (114 | ) | | (324 | ) | | Contributions from noncontrolling interests | 22 |
| | — |
| | — |
| | Other financing activities, net | 9 |
| | (4 | ) | | (6 | ) | | Net cash provided by (used in) financing activities | (1,066 | ) | | 816 |
| | 1,289 |
| | Effect of foreign exchange rate changes on cash | 16 |
| | 53 |
| | 65 |
| | Net increase (decrease) in cash and temporary cash investments | (2,310 | ) | | 2,509 |
| | (115 | ) | | Cash and temporary cash investments at beginning of year | 3,334 |
| | 825 |
| | 940 |
| | Cash and temporary cash investments at end of year | $ | 1,024 |
| | $ | 3,334 |
| | $ | 825 |
|
| Proceeds from sale of receivables | 1,225 | | | 950 | | | — | |
Repayments | (1,325 | ) | | (850 | ) | | — | |
Proceeds from the sale of common stock, net of issuance costs | — | | | 799 | | | — | |
Purchase of common stock for treasury | (13 | ) | | (4 | ) | | (955 | ) |
Issuance of common stock in connection with stock-based compensation plans | 20 | | | 11 | | | 16 | |
Common stock dividends | (114 | ) | | (324 | ) | | (299 | ) |
Other financing activities, net | (4 | ) | | (6 | ) | | 5 | |
Net cash provided by (used in) financing activities | 816 | | | 1,289 | | | (1,607 | ) |
Effect of foreign exchange rate changes on cash | 53 | | | 65 | | | (47 | ) |
Net increase (decrease) in cash and temporary cash investments | 2,509 | | | (115 | ) | | (1,524 | ) |
Cash and temporary cash investments at beginning of year | 825 | | | 940 | | | 2,464 | |
Cash and temporary cash investments at end of year | $ | 3,334 | | | $ | 825 | | | $ | 940 | |
See Notes to Consolidated Financial Statements.
VALERO ENERGY CORPORATION AND SUBSIDIARIES
CONSOLIDATED STATEMENTS OF COMPREHENSIVE INCOME
(Millions of Dollars)
| | | | | | | | | | | |
| Year Ended December 31, |
| 2010 | | 2009 | | 2008 |
Net income (loss) | $ | 324 | | | $ | (1,982 | ) | | $ | (1,131 | ) |
Other comprehensive income (loss): | | | | | |
Foreign currency translation adjustment,
net of income tax expense of $ - , $ - , and $ - | 158 | | | 375 | | | (490 | ) |
Pension and other postretirement benefits: | | | | | |
Net gain (loss) arising during the period,
net of income tax (expense) benefit of $5, $(132), and $227 | (14 | ) | | 219 | | | (410 | ) |
Net (gain) loss reclassified into income,
net of income tax expense (benefit) of $3, $(2), and $ - | (4 | ) | | (1 | ) | | (1 | ) |
Net gain (loss) on pension
and other postretirement benefits
| (18 | ) | | 218 | | | (411 | ) |
Derivative instruments designated
and qualifying as cash flow hedges:
| | | | | |
Net gain (loss) arising during the period,
net of income tax (expense) benefit of $1, $(44), and $(46) | (1 | ) | | 81 | | | 85 | |
Net (gain) loss reclassified into income,
net of income tax expense (benefit) of $62, $72, and $(36) | (116 | ) | | (133 | ) | | 67 | |
Net gain (loss) on cash flow hedges | (117 | ) | | (52 | ) | | 152 | |
Other comprehensive income (loss) | 23 | | | 541 | | | (749 | ) |
Comprehensive income (loss) | $ | 347 | | | $ | (1,441 | ) | | $ | (1,880 | ) |
|
| | | | | | | | | | | |
| | Year Ended December 31, |
| | 2011 | | 2010 | | 2009 |
| Net income (loss) | $ | 2,089 |
| | $ | 324 |
| | $ | (1,982 | ) |
| Other comprehensive income (loss): | | | | | |
|
Foreign currency translation adjustment,
net of income tax expense of $ - , $ - , and $ - | (122 | ) | | 158 |
| | 375 |
|
| Pension and other postretirement benefits: | | | | | |
Net gain (loss) arising during the year,
net of income tax (expense) benefit of $101, $5, and $(132) | (188 | ) | | (14 | ) | | 219 |
|
Net (gain) loss reclassified into income,
net of income tax expense (benefit) of $2, $3, and $(2) | (1 | ) | | (4 | ) | | (1 | ) |
Net gain (loss) on pension and other postretirement benefits | (189 | ) | | (18 | ) | | 218 |
|
Derivative instruments designated and qualifying as cash flow hedges: | | | | | |
Net gain (loss) arising during the year,
net of income tax (expense) benefit of $(11), $1, and $(44) | 21 |
| | (1 | ) | | 81 |
|
Net (gain) loss reclassified into income,
net of income tax expense (benefit) of $1, $62, and $72 | (2 | ) | | (116 | ) | | (133 | ) |
| Net gain (loss) on cash flow hedges | 19 |
| | (117 | ) | | (52 | ) |
| Other comprehensive income (loss) | (292 | ) | | 23 |
| | 541 |
|
| Comprehensive income (loss) | 1,797 |
| | 347 |
| | (1,441 | ) |
| Less: Comprehensive loss attributable to noncontrolling interests | (1 | ) | | — |
| | — |
|
Comprehensive income (loss) attributable to Valero Energy Corporation stockholders | $ | 1,798 |
| | $ | 347 |
| | $ | (1,441 | ) |
See Notes to Consolidated Financial Statements.
VALERO ENERGY CORPORATION AND SUBSIDIARIES
NOTES TO CONSOLIDATED FINANCIAL STATEMENTS
| |
| 1. | BASIS OF PRESENTATION AND SUMMARY OF SIGNIFICANT ACCOUNTING POLICIES |
Basis of Presentation
General
As used in this report, the terms “Valero,” “we,” “us,” or “our” may refer to Valero Energy Corporation, one or more of its consolidated subsidiaries, or all of them taken as a whole. We are an independent petroleum refining and marketing company and own 1416 refineries with a combined total throughput capacity of approximately 2.63.0 million barrels per day as of December 31, 20102011. We market our refined products through an extensive bulk and rack marketing network and we sell refined products through a network of approximately 5,8006,800 retail and wholesale branded outlets in the United States (U.S.), Canada, the United Kingdom (U.K.), Aruba, and eastern CanadaIreland under various brand names including Valero®, Diamond Shamrock®, Shamrock®, Ultramar®, Beacon®,and BeaconTexaco®. We also produce ethanol and as ofoperate December 31, 2010ten, we operated ten ethanol plants in the MidwestU.S. with a combined nameplate production capacity of approximately 1.1 billion gallons per year.year as of December 31, 2011. Our operations are affected by:
| |
• | company-specific factors, primarily refinery utilization rates and refinery maintenance turnarounds; |
| |
• | seasonal factors, such as the demand for refined products during the summer driving season and heating oil during the winter season; and |
| |
• | company-specific factors, primarily refinery utilization rates and refinery maintenance turnarounds; seasonal factors, such as the demand for refined products during the summer driving season and heating oil during the winter season; and industry factors, such as movements in and the level of crude oil prices including the effect of quality differentials between grades of crude oil, the demand for and prices of refined products, industry supply capacity, and competitor refinery maintenanc e turnarounds. |
The terms UDS Acquisition and Premcor Acquisition used elsewhere in these notes refer to the merger of Ultramar Diamond Shamrock Corporation (UDS) into Valero effective December 31, 2001 and the mergerlevel of Premcor Inc. (Premcor) into Valero effective September 1, 2005, respectively.crude oil prices including the effect of quality differentials between grades of crude oil, the demand for and prices of refined products, industry supply capacity, and competitor refinery maintenance turnarounds.
We have evaluated subsequent events that occurred after December 31, 20102011 through the filing of this Form 10-K. Any material subsequent events that occurred during this time have been properly recognized or disclosed in ourthese financial statements.
Noncontrolling Interest
On January 21, 2011, we entered into a joint venture agreement with Darling Green Energy LLC, a subsidiary of Darling International, Inc., to form Diamond Green Diesel Holdings LLC (DGD Holdings). DGD Holdings, through its wholly owned subsidiary, Diamond Green Diesel LLC (DGD), is constructing and will operate a biomass-based diesel plant having a design feed capacity of 10,000 barrels per day that will process animal fats, used cooking oils, and other vegetable oils into renewable green diesel. The plant will be located next to our St. Charles Refinery. The aggregate cost of this facility is estimated to be approximately $368 million and the construction is expected to be completed in late 2012. The joint venture agreement requires that contributions be made to DGD Holdings based on the percentage of units held by each member, which is currently on a 50/50 basis. From the inception of DGD Holdings (January 21, 2011) through December 31, 2011, each member had contributed $22 million of cash and $1 million of noncash assets, consisting primarily of property, plant, and equipment, to DGD Holdings. In addition, on May 31, 2011, we agreed to lend DGD up to $221 million in order to finance 60 percent of the construction costs of the plant.
Because of our controlling financial interest in DGD Holdings, we have included the financial statements of DGD Holdings in these consolidated financial statements and have separately disclosed the related noncontrolling interest.
VALERO ENERGY CORPORATION AND SUBSIDIARIES
NOTES TO CONSOLIDATED FINANCIAL STATEMENTS (Continued)
Significant Accounting PoliciesEnvironmental Matters
ReclassificationsOur operations are subject to extensive environmental regulations by governmental authorities relating to the discharge of materials into the environment, waste management, pollution prevention measures, greenhouse gas emissions, and characteristics and composition of gasolines and distillates. Because environmental laws and regulations are becoming more complex and stringent and new environmental laws and regulations are continuously being enacted or proposed, the level of future expenditures required for environmental matters could increase in the future. In addition, any major upgrades in any of our operating facilities could require material additional expenditures to comply with environmental laws and regulations. See Note 12 of Notes to Consolidated Financial Statements for a further discussion of our environmental matters.
Tax Matters
We are subject to extensive tax liabilities imposed by multiple jurisdictions, including income taxes, transactional taxes (excise/duty, sales/use, and value-added taxes), payroll taxes, franchise taxes, withholding taxes, and ad valorem taxes. New tax laws and regulations and changes in existing tax laws and regulations are continuously being enacted or proposed that could result in increased expenditures for tax liabilities in the future. Many of these liabilities are subject to periodic audits by the respective taxing authority. Subsequent changes to our tax liabilities as a result of these audits may subject us to interest and penalties. See Notes 12 and 16 of Notes to Consolidated Financial Statements for a further discussion of our tax matters.
As of December 31, 2011, the Internal Revenue Service (IRS) has ongoing tax audits related to our U.S. federal tax returns from 2002 through 2009, as discussed in Note 16 of Notes to Consolidated Financial Statements. We have received Revenue Agent Reports on our tax years for 2002 through 2007 and we are vigorously contesting many of the tax positions and assertions from the IRS. Although we believe our tax liabilities are fairly stated and properly reflected in our financial statements, should the IRS eventually prevail, it could result in a material amount of our deferred tax liabilities being reclassified to current liabilities which could have a material adverse effect on our liquidity.
Cash Held by Our International Subsidiaries
We operate in countries outside the U.S. through subsidiaries incorporated in these countries, and the earnings of these subsidiaries are taxed by the countries in which they are incorporated. We intend to reinvest these earnings indefinitely in our international operations even though we are not restricted from repatriating such earnings to the U.S. in the form of cash dividends. Should we decide to repatriate such earnings, we would incur and pay taxes on the amounts repatriated. In addition, such repatriation could cause us to record deferred tax expense that could significantly impact our results of operations, as further discussed in Note 16 of Notes to Consolidated Financial Statements. We believe, however, that a substantial portion of our international cash can be returned to the U.S. without significant tax consequences through means other than a repatriation of earnings. As of December 31, 2011, $822 million of our cash and temporary cash investments was held by our international subsidiaries.
Financial Regulatory Reform
In July 2010, President Obama signed into law the Dodd-Frank Wall Street Reform and Consumer Protection Act (Wall Street Reform Act). The Wall Street Reform Act, among many things, creates new regulations for companies that extend credit to consumers and requires most derivative instruments to be traded on exchanges and routed through clearinghouses. Rules to implement the Wall Street Reform Act are being finalized and therefore, the impact to our operations is not yet known. However, implementation could result in higher margin requirements, higher clearing costs, and more reporting requirements with respect to our derivative activities.
Concentration of Customers
Our refining and marketing operations have a concentration of customers in the refining industry and customers who are refined product wholesalers and retailers. These concentrations of customers may impact our overall exposure to credit risk, either positively or negatively, in that these customers may be similarly affected by changes in economic or other conditions. However, we believe that our portfolio of accounts receivable is sufficiently diversified to the extent necessary to minimize potential credit risk. Historically, we have not had any significant problems collecting our accounts receivable.
Sources of Liquidity
We believe that we have sufficient funds from operations and, to the extent necessary, from borrowings under our credit facilities, to fund our ongoing operating requirements. We expect that, to the extent necessary, we can raise additional funds from time to time through equity or debt financings in the public and private capital markets or the arrangement of additional credit facilities. However, there can be no assurances regarding the availability of any future financings or additional credit facilities or whether such financings or additional credit facilities can be made available on terms that are acceptable to us.
NEW ACCOUNTING PRONOUNCEMENTS
As discussed in Note 31, we sold our Paulsboro Refinery in December 2010. As a result, the assets and liabilities sold of Notes to Consolidated Financial Statements, certain new financial accounting pronouncements have been presentedissued that either have already been reflected in the consolidated balance sheet as assets heldaccompanying financial statements, or will become effective for sale and liabilities related to assets held for sale as of December 31, 2009, and the results of operations of the Paulsboro Refinery have been presented as discontinued operationsour financial statements at various dates in the consolidated statements of income for all years presented.
Also as discussed in Note 3, we sold our shutdown Delaware City Refinery assets and associated terminal and pipeline assets in June 2010. As a result, these assets have been presented in the consolidated balance sheet as assets held for sale as of December ;31, 2009. The results of operations of the Delaware City Refinery have been presented as discontinued operations in the consolidated statements of income for all years presented.
In addition, certain amounts previously reported in our annual report on Form 10-K for the year ended December 31, 2009 have been reclassified to conform to the 2010 presentation. Credit card fees previously recognized in 2009 and 2008 in retail operating expenses have been reclassified to cost of sales as such fees are directly and jointly related to the sale transaction. This reclassification resulted in an increase in cost of
VALERO ENERGY CORPORATION AND SUBSIDIARIES
NOTES TO CONSOLIDATED FINANCIAL STATEMENTS (Continued)
sales and a decrease in retail operating expenses of $76 million and $92 million for the years ended December 31, 2009 and 2008, respectively.
Principles of Consolidation
These consolidated financial statements include the accounts of Valero and subsidiaries in which Valero has a controlling interest. Intercompany balances and transactions have been eliminated in consolidation. Investments in significant noncontrolled entities are accounted for using the equity method.
In June 2009, the Financial Accounting Standards Board amend ed Accounting Standards Codification (ASC) Topic 810, “Consolidation,” to modify provisions related to variable interest entities to include entities previously considered qualifying special-purpose entities, as the concept of these entities was eliminated. This modification also clarified consolidation requirements and expanded disclosure requirements related to variable interest entities. These provisions of ASC Topic 810 were effective for fiscal years, and interim periods within those fiscal years, beginning after November 15, 2009, and earlier application was prohibited.future. The adoption of these provisions of ASC Topic 810 effective January 1, 2010 didpronouncements has not affecthad, and is not expected to have, a material effect on our financial position or results of operations.statements.
CRITICAL ACCOUNTING POLICIES INVOLVING CRITICAL ACCOUNTING ESTIMATES
Use o f Estimates
The preparation of financial statements in conformityaccordance with U.S. generally accepted accounting principles requires us to make estimates and assumptions that affect the amounts reported in the consolidated financial statements and accompanying notes. Actual results could differ from those estimates. On an ongoing basis, we reviewThe following summary provides further information about our critical accounting policies that involve critical accounting estimates, and should be read in conjunction with Note 1 of Notes to Consolidated Financial Statements, which summarizes our significant accounting policies. The following accounting policies involve estimates that are considered critical due to the level of sensitivity and judgment involved, as well as the impact on our financial position and results of operations. We believe that all of our estimates based on currently available information. Changes in facts and circumstances may result in revised estimates.are reasonable.
Cash and Temporary Cash Investments
Our tempo rary cash investments are highly liquid, low-risk debt instruments that have a maturity of three months or less when acquired.
Receivables
Trade receivables are carried at original invoice amount. We maintain an allowance for doubtful accounts which is adjusted based on management’s assessment of our customers’ historical collection experience, known credit risks and industry and economic conditions.
Inventories
Inventories are carried at the lower of cost or market. The cost of refinery feedstocks purchased for processing, refined products, and grain and ethanol inventories are determined under the last-in, first-out (LIFO) method using the dollar-value LIFO method, with any increments valued based on average purchase prices during the year. The cost of feedstocks and products purchased for resale and the cost of materials, supplies, and convenience store merchandise are determined principally under the weighted-average cost method.
Property, Plant and Equipment
Additions toThe cost of property, plant and equipment (property assets) purchased or constructed, including capitalizedbetterments of property assets, are capitalized. The cost of repairs to and normal maintenance of property assets, however, is expensed as incurred. Betterments of property assets are those which either extend the useful life, increase the capacity or improve the operating efficiency of the asset, or improve the safety of our operations. The cost of property assets constructed includes interest and certain overhead costs allocable to the construction activities.
Our operations, especially those of our refining segment, are highly capital intensive. Each of our refineries comprises a large base of property assets, consisting of a series of interconnected, highly integrated and interdependent crude oil processing facilities and supporting logistical infrastructure (Units), and these Units are continuously improved. Improvements consist of the addition of new Units and betterments of existing Units. We plan for these improvements by developing a multi-year capital program that is updated and revised based on changing internal and external factors.
Depreciation of property purchases,assets used in our refining segment is recorded on a straight-line basis over the estimated useful lives of these assets primarily using the composite method of depreciation. We maintain a separate composite group of property assets for each of our refineries. We estimate the useful life of each group based on an evaluation of the property assets comprising the group, and such evaluations consist of, but are recorded at cost.not limited to, the physical inspection of the assets to determine their condition, consideration of the manner in which the assets are maintained, assessment of the need to replace assets, and evaluation of the manner in which improvements impact the useful life of the group. The estimated useful lives of our composite groups range primarily from 25 to 30 years.
Under the composite method of depreciation, the cost of an improvement is added to the composite group to which it relates and is depreciated over that group’s estimated useful life. We design improvements to our refineries in accordance with engineering specifications, design standards and practices accepted in our industry, and these improvements have design lives consistent with our estimated useful lives. Therefore, we believe the use of the group life to depreciate the cost of improvements made to the group is reasonable because the estimated useful life of each improvement is consistent with that of the group. It should be noted, however, that factors such as competition, regulation, or environmental matters could cause us to change our estimates, thus impacting depreciation expense in the future.
VALERO ENERGY CORPORATION AND SUBSIDIARIES
NOTES TO CONSOLIDATED FINANCIAL STATEMENTS (Continued)
The costsAlso under the composite method of depreciation, the historical cost of a minor property units (or components of property units), netasset (net of salvage value,value) that areis retired or abandoned arereplaced is charged or credited to accumulated depreciation under the com posite method of depreciation. Gainsand no gain or losses on salesloss is recognized in income. However, a gain or other dispositions of major units of property are recordedloss is recognized in income for a major property asset that is retired, replaced or sold and for an abnormal disposition of a property asset (primarily involuntary conversions). Gains and losses are reportedreflected in depreciation and amortization expense, unless such amounts are reported separately due to materiality.
Depreciation of property, plant and equipment used in the refining and retail segments is recorded on a straight-line basis over the estimated useful lives of the related facilities primarily using the composite method of depreciation. Depreciation of property, plant and equipment used in the ethanol segment is recorded on a straight-line basis over the estimated useful lives of each individual asset. Leasehold improvements and assets acquired under capital leases are amortized using the straight-line method over the sho rter of the lease term or the estimated useful life of the related asset.
Deferred Charges and Other Assets
“Deferred charges and other assets, net” include the following:
| |
• | refinery turnaround costs, which are incurred in connection with planned major maintenance activities at our refineries and which are deferred when incurred and amortized on a straight-line basis over the period of time estimated to lapse until the next turnaround occurs; |
| |
• | fixed-bed catalyst costs, representing the cost of catalyst that is changed out at periodic intervals when the quality of the catalyst has deteriorated beyond its prescribed function, which are deferred when incurred and amortized on a straight-line basis over the es timated useful life of the specific catalyst; |
| |
• | investments in entities that we do not control; and |
| |
• | other noncurrent assets such as convenience store dealer incentive programs, nonqualified pension plan assets, debt issuance costs, and various other costs. |
Impairment of Assets
Long-lived assets, which include property, plant and equipment, intangible assets, and refinery turnaround and catalystscatalyst costs, are tested for recoverability whenever events or changes in circumstances indicate that the carrying amount of the asset may not be recoverable. A long-lived asset is not recoverableAn impairment loss should be recognized if itsthe carrying amount exceeds the sum of the undiscounted cash flows expected to result from its use and eventual disposition. If a long-lived asset is not recoverable, an impairment loss is recognized in an amount by which its carrying amount exceeds its fair value, withvalue.
In order to test for recoverability, we must make estimates of projected cash flows related to the asset being evaluated, which include, but are not limited to, assumptions about the use or disposition of the asset, its estimated remaining life, and future expenditures necessary to maintain its existing service potential. In order to determine fair value, determinedmanagement must make certain estimates and assumptions including, among other things, an assessment of market conditions, projected cash flows, investment rates, interest/equity rates, and growth rates, that could significantly impact the fair value of the asset being tested for impairment. Our impairment evaluations are based on discounted estimated net cash flows orassumptions that we deem to be reasonable. Providing sensitivity analyses if other appropriate methods.assumptions were used in performing the impairment evaluations is not practicable due to the significant number of assumptions involved in the estimates. See Note 4 of Notes to Consolidated Financial Statements for our impairment evaluationa further discussion of our long-lived assets.asset impairment analysis and certain losses resulting from those analyses.
Goodwill was tested for impairment annually or more frequently if events or changes in circumstances indicated that the asset was impaired. We used October 1 of each year as our valuation date for annual impairment testing purposes. See Note 4 for our impairment evaluation of goodwill in 2008, which resulted in the write-off of all of our goodwill.
We evaluate our equity method investments for impairment when there is evidence that we may not be able to recover the carrying amount of our investments or the investee is unable to sustain an earnings capacity that justifies the carrying amount. A loss in the value of an investment that is other than a temporary decline is recognized currently in earnings, and is based on the difference between the estimated current fair value of the investment and its carrying amount.
Environmental Matters
Our operations are subject to extensive environmental regulations by governmental authorities relating primarily to the discharge of materials into the environment, waste management, and pollution prevention measures. Future legislative action and regulatory initiatives, as discussed in Note 12 of Notes to Consolidated Financial Statements could result in changes to required operating permits, additional remedial actions, or increased capital expenditures and operating costs that cannot be assessed with certainty at this time.
Accruals for environmental liabilities are based on best estimates of probable undiscounted future costs over a 20-year time period using currently available technology and applying current regulations, as well as our own internal environmental policies. However, environmental liabilities are difficult to assess and estimate due to uncertainties related to the magnitude of possible remediation, the timing of such remediation, and the determination of our obligation in proportion to other parties. Such estimates are subject to change due to many factors, including the identification of new sites requiring remediation, changes in environmental laws and regulations and their interpretation, additional information related to the extent and nature of remediation efforts, and potential improvements in remediation technologies. An estimate of the sensitivity to earnings for changes in those factors is not practicable due to the number of contingencies that must be assessed, the number of underlying assumptions, and the wide range of possible outcomes.
The amount of and changes in our accruals for environmental matters as of and for the years ended December 31, 2011, 2010, and 2009 is included in Note 10 of Notes to Consolidated Financial Statements.
Pension and Other Postretirement Benefit Obligations
We have significant pension and other postretirement benefit liabilities and costs that are developed from actuarial valuations. Inherent in these valuations are key assumptions including discount rates, expected return on plan assets, future compensation increases, and health care cost trend rates. Changes in these assumptions are primarily influenced by factors outside our control. For example, the discount rate assumption represents a yield curve comprised of various long-term bonds that have an average rating of double-A when averaging all available ratings by the recognized rating agencies, while the expected return on plan assets is based on a compounded return calculated assuming an asset allocation that is representative of the asset mix in our pension plans. These assumptions can have a significant effect on the amounts reported in our financial statements. For example, a 0.25 percent decrease in the assumptions related to the discount rate or expected return on plan assets or a 0.25 percent increase in the assumptions related to the health care cost trend rate or rate of compensation increase would have the following effects on the projected benefit obligation as of December 31, 2011 and net periodic benefit cost for the year ending December 31, 2012 (in millions):
|
| | | | | | | |
| |
Pension Benefits | | Other Postretirement Benefits |
| Increase in projected benefit obligation resulting from: | | | |
| Discount rate decrease | $ | 85 |
| | $ | 13 |
|
| Compensation rate increase | 33 |
| | — |
|
| Health care cost trend rate increase | — |
| | 5 |
|
| | | | |
| Increase in expense resulting from: | | | |
| Discount rate decrease | 14 |
| | 1 |
|
| Expected return on plan assets decrease | 4 |
| | — |
|
| Compensation rate increase | 8 |
| | — |
|
| Health care cost trend rate increase | — |
| | 1 |
|
See Note 14 of Notes to Consolidated Financial Statements for a further discussion of our pension and other postretirement benefit obligations.
Tax Matters
We are subject to extensive tax liabilities imposed by multiple jurisdictions, including income taxes, transactional taxes (excise/duty, sales/use, and value-added taxes), payroll taxes, franchise taxes, withholding taxes, and ad valorem taxes. New tax laws and regulations and changes in existing tax laws and regulations are continuously being enacted or proposed that could result in increased expenditures for tax liabilities that cannot be predicted at this time. In addition, we have received claims from various jurisdictions related to certain tax matters. Tax liabilities include potential assessments of penalty and interest amounts.
We record tax liabilities based on our assessment of existing tax laws and regulations. A contingent loss related to a transactional tax claim is recorded if the loss is both probable and estimable. The recording of our tax liabilities requires significant judgments and estimates. Actual tax liabilities can vary from our
estimates for a variety of reasons, including different interpretations of tax laws and regulations and different assessments of the amount of tax due. In addition, in determining our income tax provision, we must assess the likelihood that our deferred tax assets, primarily consisting of net operating loss and tax credit carryforwards, will be recovered through future taxable income. Significant judgment is required in estimating the amount of valuation allowance, if any, that should be recorded against those deferred income tax assets. If our actual results of operations differ from such estimates or our estimates of future taxable income change, the valuation allowance may need to be revised. However, an estimate of the sensitivity to earnings that would result from changes in the assumptions and estimates used in determining our tax liabilities is not practicable due to the number of assumptions and tax laws involved, the various potential interpretations of the tax laws, and the wide range of possible outcomes. See Notes 12 and 16 of Notes to Consolidated Financial Statements for a further discussion of our tax liabilities.
Legal Matters
A variety of claims have been made against us in various lawsuits. We record a liability related to a loss contingency attributable to such legal matters if we determine the loss to be both probable and estimable. The recording of such liabilities requires judgments and estimates, the results of which can vary significantly from actual litigation results due to differing interpretations of relevant law and differing opinions regarding the degree of potential liability and the assessment of reasonable damages. However, an estimate of the sensitivity to earnings if other assumptions were used in recording our legal liabilities is not practicable due to the number of contingencies that must be assessed and the wide range of reasonably possible outcomes, both in terms of the probability of loss and the estimates of such loss.
ITEM 7A. QUANTITATIVE AND QUALITATIVE DISCLOSURES ABOUT MARKET RISK
COMMODITY PRICE RISK
We are exposed to market risks related to the volatility in the price of crude oil, refined products (primarily gasoline and distillate), grain (primarily corn), and natural gas used in our operations. To reduce the impact of price volatility on our results of operations and cash flows, we use commodity derivative instruments, including swaps, futures, and options to hedge:
inventories and firm commitments to purchase inventories generally for amounts by which our current year inventory levels (determined on a last-in, first-out (LIFO) basis) differ from our previous year-end LIFO inventory levels and
forecasted feedstock and refined product purchases, refined product sales, natural gas purchases, and corn purchases to lock in the price of these forecasted transactions at existing market prices that we deem favorable.
We use the futures markets for the available liquidity, which provides greater flexibility in transacting our hedging and trading operations. We use swaps primarily to manage our price exposure. We also enter into certain commodity derivative instruments for trading purposes to take advantage of existing market conditions related to future results of operations and cash flows.
Our positions in commodity derivative instruments are monitored and managed on a daily basis by a risk control group to ensure compliance with our stated risk management policy that has been approved by our board of directors.
The following sensitivity analysis includes all positions at the end of the reporting period with which we have market risk (in millions):
|
| | | | | | | |
| | Derivative Instruments Held For |
| | Non-Trading Purposes | | Trading Purposes |
| December 31, 2011 | | | |
| Gain (loss) in fair value resulting from: | | | |
| 10% increase in underlying commodity prices | $ | (156 | ) | | $ | 1 |
|
| 10% decrease in underlying commodity prices | 156 |
| | 2 |
|
| | | | |
| December 31, 2010 | | | |
| Gain (loss) in fair value resulting from: | | | |
| 10% increase in underlying commodity prices | (199 | ) | | — |
|
| 10% decrease in underlying commodity prices | 189 |
| | (1 | ) |
See Note 21 of Notes to Consolidated Financial Statements for notional volumes associated with these derivative contracts as of December 31, 2011.
COMPLIANCE PROGRAM PRICE RISK
We are exposed to market risks related to the volatility in the price of financial instruments associated with
various governmental and regulatory compliance programs that we must purchase in the open market to comply with these programs. To reduce the impact of this risk on our results of operations and cash flows, we may enter into derivative instruments, such as futures. As of December 31, 2011, there was no significant gain or loss in the fair value of derivative instruments that would result from a 10 percent increase or decrease in the underlying price of the futures contracts. See Note 21 of Notes to Consolidated Financial Statements for a discussion about these compliance programs and notional volumes associated with these derivative contracts as of December 31, 2011.
66INTEREST RATE RISK
The following table provides information about our debt instruments, excluding capital lease obligations (dollars in millions), the fair values of which are sensitive to changes in interest rates. Principal cash flows and related weighted-average interest rates by expected maturity dates are presented. We had no interest rate derivative instruments outstanding as of December 31, 2011 and 2010.
|
| | | | | | | | | | | | | | | | | | | | | | | | | | | | | | | |
| | December 31, 2011 |
| | Expected Maturity Dates | | | | |
| | 2012 | | 2013 | | 2014 | | 2015 | | 2016 | | There- after | | Total | | Fair Value |
| Debt: | | | | | | | | | | | | | | | |
| Fixed rate | $ | 754 |
| | $ | 484 |
| | $ | 200 |
| | $ | 475 |
| | $ | — |
| | $ | 5,578 |
| | $ | 7,491 |
| | $ | 9,048 |
|
| Average interest rate | 6.9 | % | | 5.5 | % | | 4.8 | % | | 5.2 | % | | — | % | | 7.3 | % | | 6.9 | % | | |
| Floating rate | $ | 250 |
| | $ | — |
| | $ | — |
| | $ | — |
| | $ | — |
| | $ | — |
| | $ | 250 |
| | $ | 250 |
|
| Average interest rate | 0.6 | % | | — | % | | — | % | | — | % | | — | % | | — | % | | 0.6 | % | | |
|
| | | | | | | | | | | | | | | | | | | | | | | | | | | | | | | |
| | December 31, 2010 |
| | Expected Maturity Dates | | | | |
| | 2011 | | 2012 | | 2013 | | 2014 | | 2015 | | There- after | | Total | | Fair Value |
| Debt: | | | | | | | | | | | | | | | |
| Fixed rate | $ | 418 |
| | $ | 759 |
| | $ | 489 |
| | $ | 209 |
| | $ | 484 |
| | $ | 5,605 |
| | $ | 7,964 |
| | $ | 9,092 |
|
| Average interest rate | 6.4 | % | | 6.9 | % | | 5.5 | % | | 4.8 | % | | 5.2 | % | | 7.2 | % | | 6.9 | % | | |
| Floating rate | $ | 400 |
| | $ | — |
| | $ | — |
| | $ | — |
| | $ | — |
| | $ | — |
| | $ | 400 |
| | $ | 400 |
|
| Average interest rate | 0.5 | % | | — | % | | — | % | | — | % | | — | % | | — | % | | 0.5 | % | | |
FOREIGN CURRENCY RISK
As of December 31, 2011, we had commitments to purchase $751 million of U.S. dollars. Our market risk was minimal on the contracts, as they matured on or before January 26, 2012, resulting in a $3 million loss in the first quarter of 2012.
ITEM 8. FINANCIAL STATEMENTS AND SUPPLEMENTARY DATA
MANAGEMENT’S REPORT ON INTERNAL CONTROL OVER FINANCIAL REPORTING
Our management is responsible for establishing and maintaining adequate “internal control over financial reporting” (as defined in Rule 13a-15(f) under the Securities Exchange Act of 1934) for Valero. Our management evaluated the effectiveness of Valero’s internal control over financial reporting as of December 31, 2011. In its evaluation, management used the criteria established in Internal Control – Integrated Framework issued by the Committee of Sponsoring Organizations of the Treadway Commission (COSO). Management believes that as of December 31, 2011, our internal control over financial reporting was effective based on those criteria.
Management’s evaluation of and conclusion regarding the effectiveness of our internal control over financial reporting excludes the internal control over financial reporting of Valero Energy Ltd and its subsidiaries (VEL), which we acquired on August 1, 2011 and of Valero Refining-Meraux LLC (Meraux), the operations of which we acquired on October 1, 2011, (as described in Note 2 of Notes to Consolidated Financial Statements). The VEL and Meraux acquisitions contributed approximately 7 percent of our total operating revenues for the year ended December 31, 2011 and accounted for approximately 10 percent of our total assets as of December 31, 2011. We plan to fully integrate VEL and Meraux into our internal control over financial reporting in 2012.
Our independent registered public accounting firm has issued an attestation report on the effectiveness of our internal control over financial reporting, which begins on page 58 of this report.
REPORT OF INDEPENDENT REGISTERED PUBLIC ACCOUNTING FIRM
The Board of Directors and Stockholders
of Valero Energy Corporation and subsidiaries:
We have audited the accompanying consolidated balance sheets of Valero Energy Corporation and subsidiaries (the Company) as of December 31, 2011 and 2010, and the related consolidated statements of income, equity, cash flows, and comprehensive income for each of the years in the three-year period ended December 31, 2011. These consolidated financial statements are the responsibility of the Company’s management. Our responsibility is to express an opinion on these consolidated financial statements based on our audits.
We conducted our audits in accordance with the standards of the Public Company Accounting Oversight Board (United States) (the PCAOB). Those standards require that we plan and perform the audit to obtain reasonable assurance about whether the financial statements are free of material misstatement. An audit includes examining, on a test basis, evidence supporting the amounts and disclosures in the financial statements. An audit also includes assessing the accounting principles used and significant estimates made by management, as well as evaluating the overall financial statement presentation. We believe that our audits provide a reasonable basis for our opinion.
In our opinion, the consolidated financial statements referred to above present fairly, in all material respects, the financial position of Valero Energy Corporation and subsidiaries as of December 31, 2011 and 2010, and the results of their operations and their cash flows for each of the years in the three-year period ended December 31, 2011, in conformity with U.S. generally accepted accounting principles.
We also have audited, in accordance with the standards of the PCAOB, the Company’s internal control over financial reporting as of December 31, 2011, based on criteria established in Internal Control – Integrated Framework issued by the Committee of Sponsoring Organizations of the Treadway Commission, and our report dated February 24, 2012 expressed an unqualified opinion on the effectiveness of the Company’s internal control over financial reporting.
/s/ KPMG LLP
San Antonio, Texas
February 24, 2012
REPORT OF INDEPENDENT REGISTERED PUBLIC ACCOUNTING FIRM
The Board of Directors and Stockholders
of Valero Energy Corporation and subsidiaries:
We have audited Valero Energy Corporation and subsidiaries’ (the Company’s) internal control over financial reporting as of December 31, 2011, based on criteria established in Internal Control – Integrated Framework issued by the Committee of Sponsoring Organizations of the Treadway Commission (COSO).The Company’s management is responsible for maintaining effective internal control over financial reporting and for its assessment of the effectiveness of internal control over financial reporting, included in the accompanying Management’s Report on Internal Control over Financial Reporting. Our responsibility is to express an opinion on the Company’s internal control over financial reporting based on our audit.
We conducted our audit in accordance with the standards of the Public Company Accounting Oversight Board (United States) (the PCAOB). Those standards require that we plan and perform the audit to obtain reasonable assurance about whether effective internal control over financial reporting was maintained in all material respects. Our audit included obtaining an understanding of internal control over financial reporting, assessing the risk that a material weakness exists, and testing and evaluating the design and operating effectiveness of internal control based on the assessed risk. Our audit also included performing such other procedures as we considered necessary in the circumstances. We believe that our audit provides a reasonable basis for our opinion.
A company’s internal control over financial reporting is a process designed to provide reasonable assurance regarding the reliability of financial reporting and the preparation of financial statements for external purposes in accordance with generally accepted accounting principles. A company’s internal control over financial reporting includes those policies and procedures that (1) pertain to the maintenance of records that, in reasonable detail, accurately and fairly reflect the transactions and dispositions of the assets of the company; (2) provide reasonable assurance that transactions are recorded as necessary to permit preparation of financial statements in accordance with generally accepted accounting principles, and that receipts and expenditures of the company are being made only in accordance with authorizations of management and directors of the company; and (3) provide reasonable assurance regarding prevention or timely detection of unauthorized acquisition, use, or disposition of the company’s assets that could have a material effect on the financial statements.
Because of its inherent limitations, internal control over financial reporting may not prevent or detect misstatements. Also, projections of any evaluation of effectiveness to future periods are subject to the risk that controls may become inadequate because of changes in conditions, or that the degree of compliance with the policies or procedures may deteriorate.
In our opinion, Valero Energy Corporation and subsidiaries maintained, in all material respects, effective internal control over financial reporting as of December 31, 2011, based on criteria established in Internal Control – Integrated Framework issued by COSO.
The Company acquired Valero Energy Ltd and its subsidiaries (VEL) on August 1, 2011 and the operations of Valero Refining-Meraux LLC (Meraux) on October 1, 2011, and management excluded VEL’s and Meraux’s internal control over financial reporting from its assessment of the effectiveness of the Company’s internal control over financial reporting as of December 31, 2011. The VEL and Meraux acquisitions
contributed approximately 7 percent of the Company’s total operating revenues for the year ended December 31, 2011 and accounted for approximately 10 percent of its total assets as of December 31, 2011. Our audit of internal control over financial reporting of the Company also excluded an evaluation of the internal control over financial reporting of VEL and Meraux.
We also have audited, in accordance with the standards of the PCAOB, the consolidated balance sheets of Valero Energy Corporation and subsidiaries as of December 31, 2011 and 2010, and the related consolidated statements of income, equity, cash flows, and comprehensive income for each of the years in the three-year period ended December 31, 2011, and our report dated February 24, 2012 expressed an unqualified opinion on those consolidated financial statements.
/s/ KPMG LLP
San Antonio, Texas
February 24, 2012
VALERO ENERGY CORPORATION AND SUBSIDIARIES
CONSOLIDATED BALANCE SHEETS
(Millions of Dollars, Except Par Value)
|
| | | | | | | |
| | December 31, |
| | 2011 | | 2010 |
| ASSETS | | | |
| Current assets: | | | |
| Cash and temporary cash investments | $ | 1,024 |
| | $ | 3,334 |
|
| Receivables, net | 8,706 |
| | 4,583 |
|
| Inventories | 5,623 |
| | 4,947 |
|
| Income taxes receivable | 212 |
| | 343 |
|
| Deferred income taxes | 283 |
| | 190 |
|
| Prepaid expenses and other | 124 |
| | 121 |
|
| Total current assets | 15,972 |
| | 13,518 |
|
| Property, plant and equipment, at cost | 32,253 |
| | 28,921 |
|
| Accumulated depreciation | (7,076 | ) | | (6,252 | ) |
| Property, plant and equipment, net | 25,177 |
| | 22,669 |
|
| Intangible assets, net | 227 |
| | 224 |
|
| Deferred charges and other assets, net | 1,407 |
| | 1,210 |
|
| Total assets | $ | 42,783 |
| | $ | 37,621 |
|
| LIABILITIES AND EQUITY | | | |
| Current liabilities: | | | |
| Current portion of debt and capital lease obligations | $ | 1,009 |
| | $ | 822 |
|
| Accounts payable | 9,472 |
| | 6,441 |
|
| Accrued expenses | 595 |
| | 590 |
|
| Taxes other than income taxes | 1,264 |
| | 671 |
|
| Income taxes payable | 119 |
| | 3 |
|
| Deferred income taxes | 249 |
| | 257 |
|
| Total current liabilities | 12,708 |
| | 8,784 |
|
| Debt and capital lease obligations, less current portion | 6,732 |
| | 7,515 |
|
| Deferred income taxes | 5,017 |
| | 4,530 |
|
| Other long-term liabilities | 1,881 |
| | 1,767 |
|
| Commitments and contingencies |
| |
|
| Equity: | | | |
| Valero Energy Corporation stockholders’ equity: | | | |
Common stock, $0.01 par value; 1,200,000,000 shares authorized;
673,501,593 and 673,501,593 shares issued | 7 |
| | 7 |
|
| Additional paid-in capital | 7,486 |
| | 7,704 |
|
| Treasury stock, at cost; 116,689,450 and 105,113,545 common shares | (6,475 | ) | | (6,462 | ) |
| Retained earnings | 15,309 |
| | 13,388 |
|
| Accumulated other comprehensive income | 96 |
| | 388 |
|
| Total Valero Energy Corporation stockholders’ equity | 16,423 |
| | 15,025 |
|
| Noncontrolling interest | 22 |
| | — |
|
| Total equity | 16,445 |
| | 15,025 |
|
| Total liabilities and equity | $ | 42,783 |
| | $ | 37,621 |
|
See Notes to Consolidated Financial Statements.
VALERO ENERGY CORPORATION AND SUBSIDIARIES
CONSOLIDATED STATEMENTS OF INCOME
(Millions of Dollars, Except per Share Amounts)
|
| | | | | | | | | | | |
| | Year Ended December 31, |
| | 2011 | | 2010 | | 2009 |
| Operating revenues (a) | $ | 125,987 |
| | $ | 82,233 |
| | $ | 64,599 |
|
| Costs and expenses: | | | | | |
| Cost of sales | 115,719 |
| | 74,458 |
| | 58,686 |
|
| Operating expenses: | | | | | |
| Refining | 3,406 |
| | 2,944 |
| | 2,880 |
|
| Retail | 678 |
| | 654 |
| | 626 |
|
| Ethanol | 399 |
| | 363 |
| | 169 |
|
| General and administrative expenses | 571 |
| | 531 |
| | 572 |
|
| Depreciation and amortization expense | 1,534 |
| | 1,405 |
| | 1,361 |
|
| Asset impairment loss | — |
| | 2 |
| | 222 |
|
| Total costs and expenses | 122,307 |
| | 80,357 |
| | 64,516 |
|
| Operating income | 3,680 |
| | 1,876 |
| | 83 |
|
| Other income, net | 43 |
| | 106 |
| | 17 |
|
| Interest and debt expense, net of capitalized interest | (401 | ) | | (484 | ) | | (416 | ) |
| Income (loss) from continuing operations before income tax expense (benefit) | 3,322 |
| | 1,498 |
| | (316 | ) |
| Income tax expense (benefit) | 1,226 |
| | 575 |
| | (43 | ) |
| Income (loss) from continuing operations | 2,096 |
| | 923 |
| | (273 | ) |
| Loss from discontinued operations, net of income taxes | (7 | ) | | (599 | ) | | (1,709 | ) |
| Net income (loss) | 2,089 |
| | 324 |
| | (1,982 | ) |
| Less: Net loss attributable to noncontrolling interests | (1 | ) | | — |
| | — |
|
| Net income (loss) attributable to Valero Energy Corporation stockholders | $ | 2,090 |
| | $ | 324 |
| | $ | (1,982 | ) |
| | | | | | |
| Net income (loss) attributable to Valero Energy Corporation stockholders: | | | | | |
| Continuing operations | $ | 2,097 |
| | $ | 923 |
| | $ | (273 | ) |
| Discontinued operations | (7 | ) | | (599 | ) | | (1,709 | ) |
| Total | $ | 2,090 |
| | $ | 324 |
| | $ | (1,982 | ) |
| Earnings per common share: | | | | | |
| Continuing operations | $ | 3.70 |
| | $ | 1.63 |
| | $ | (0.50 | ) |
| Discontinued operations | (0.01 | ) | | (1.06 | ) | | (3.17 | ) |
| Total | $ | 3.69 |
| | $ | 0.57 |
| | $ | (3.67 | ) |
| Weighted-average common shares outstanding (in millions) | 563 |
| | 563 |
| | 541 |
|
| Earnings per common share – assuming dilution: | | | | | |
| Continuing operations | $ | 3.69 |
| | $ | 1.62 |
| | $ | (0.50 | ) |
| Discontinued operations | (0.01 | ) | | (1.05 | ) | | (3.17 | ) |
| Total | $ | 3.68 |
| | $ | 0.57 |
| | $ | (3.67 | ) |
| Weighted-average common shares outstanding – assuming dilution (in millions) | 569 |
| | 568 |
| | 541 |
|
| Dividends per common share | $ | 0.30 |
| | $ | 0.20 |
| | $ | 0.60 |
|
| _____________________________ | | | | | |
| Supplemental information: | | | | | |
| (a) Includes excise taxes on sales by our U.S. retail system | $ | 892 |
| | $ | 891 |
| | $ | 873 |
|
See Notes to Consolidated Financial Statements.
VALERO ENERGY CORPORATION AND SUBSIDIARIES
CONSOLIDATED STATEMENTS OF EQUITY
(Millions of Dollars)
|
| | | | | | | | | | | | | | | | | | | | | | | | | | | | | | | |
| | Valero Energy Corporation Stockholders’ Equity | | | | |
| | Common Stock | | Additional Paid-in Capital | | Treasury Stock | | Retained Earnings | | Accumulated Other Comprehensive Income (Loss) | | Total | | Non-controlling Interest | | Total Equity |
| Balance as of December 31, 2008 | $ | 6 |
| | $ | 7,190 |
| | $ | (6,884 | ) | | $ | 15,484 |
| | $ | (176 | ) | | $ | 15,620 |
| | $ | — |
| | $ | 15,620 |
|
| Net loss | — |
| | — |
| | — |
| | (1,982 | ) | | — |
| | (1,982 | ) | | — |
| | (1,982 | ) |
| Dividends on common stock | — |
| | — |
| | — |
| | (324 | ) | | — |
| | (324 | ) | | — |
| | (324 | ) |
| Sale of common stock | 1 |
| | 798 |
| | — |
| | — |
| | — |
| | 799 |
| | — |
| | 799 |
|
| Stock-based compensation expense | — |
| | 68 |
| | — |
| | — |
| | — |
| | 68 |
| | — |
| | 68 |
|
| Tax deduction less than stock-based compensation expense | — |
| | (4 | ) | | — |
| | — |
| | — |
| | (4 | ) | | — |
| | (4 | ) |
| Transactions in connection with stock-based compensation plans: | | | | | | | | | | | | | | | |
| Stock issuances | — |
| | (156 | ) | | 167 |
| | — |
| | — |
| | 11 |
| | — |
| | 11 |
|
| Stock repurchases | — |
| | — |
| | (4 | ) | | — |
| | — |
| | (4 | ) | | — |
| | (4 | ) |
| Other comprehensive income | — |
| | — |
| | — |
| | — |
| | 541 |
| | 541 |
| | — |
| | 541 |
|
| Balance as of December 31, 2009 | 7 |
| | 7,896 |
| | (6,721 | ) | | 13,178 |
| | 365 |
| | 14,725 |
| | — |
| | 14,725 |
|
| Net income | — |
| | — |
| | — |
| | 324 |
| | — |
| | 324 |
| | — |
| | 324 |
|
| Dividends on common stock | — |
| | — |
| | — |
| | (114 | ) | | — |
| | (114 | ) | | — |
| | (114 | ) |
| Stock-based compensation expense | — |
| | 54 |
| | — |
| | — |
| | — |
| | 54 |
| | — |
| | 54 |
|
| Tax deduction in excess of stock-based compensation expense | — |
| | 6 |
| | — |
| | — |
| | — |
| | 6 |
| | — |
| | 6 |
|
| Transactions in connection with stock-based compensation plans: | | | | | | | | | | | | | | | |
| Stock issuances | — |
| | (252 | ) | | 272 |
| | — |
| | — |
| | 20 |
| | — |
| | 20 |
|
| Stock repurchases | — |
| | — |
| | (13 | ) | | — |
| | — |
| | (13 | ) | | — |
| | (13 | ) |
| Other comprehensive income | — |
| | — |
| | — |
| | — |
| | 23 |
| | 23 |
| | — |
| | 23 |
|
| Balance as of December 31, 2010 | 7 |
| | 7,704 |
| | (6,462 | ) | | 13,388 |
| | 388 |
| | 15,025 |
| | — |
| | 15,025 |
|
| Net income | — |
| | — |
| | — |
| | 2,090 |
| | — |
| | 2,090 |
| | (1 | ) | | 2,089 |
|
| Dividends on common stock | — |
| | — |
| | — |
| | (169 | ) | | — |
| | (169 | ) | | — |
| | (169 | ) |
| Stock-based compensation expense | — |
| | 57 |
| | — |
| | — |
| | — |
| | 57 |
| | — |
| | 57 |
|
| Tax deduction in excess of stock-based compensation expense | — |
| | 22 |
| | — |
| | — |
| | — |
| | 22 |
| | — |
| | 22 |
|
| Transactions in connection with stock-based compensation plans: | | | | | | | | | | | | | | | |
| Stock issuances | — |
| | (287 | ) | | 336 |
| | — |
| | — |
| | 49 |
| | — |
| | 49 |
|
| Stock repurchases | — |
| | (10 | ) | | (349 | ) | | — |
| | — |
| | (359 | ) | | — |
| | (359 | ) |
| Contributions from noncontrolling interest in DGD | — |
| | — |
| | — |
| | — |
| | — |
| | — |
| | 23 |
| | 23 |
|
| Recognition of noncontrolling interests in MLP in connection with Pembroke Acquisition | — |
| | — |
| | — |
| | — |
| | — |
| | — |
| | 5 |
| | 5 |
|
| Acquisition of noncontrolling interests in MLP | — |
| | — |
| | — |
| | — |
| | — |
| | — |
| | (5 | ) | | (5 | ) |
| Other comprehensive loss | — |
| | — |
| | — |
| | — |
| | (292 | ) | | (292 | ) | | — |
| | (292 | ) |
| Balance as of December 31, 2011 | $ | 7 |
| | $ | 7,486 |
| | $ | (6,475 | ) | | $ | 15,309 |
| | $ | 96 |
| | $ | 16,423 |
| | $ | 22 |
| | $ | 16,445 |
|
See Notes to Consolidated Financial Statements.
VALERO ENERGY CORPORATION AND SUBSIDIARIES
CONSOLIDATED STATEMENTS OF CASH FLOWS
(Millions of Dollars)
|
| | | | | | | | | | | |
| | Year Ended December 31, |
| | 2011 | | 2010 | | 2009 |
| Cash flows from operating activities: | | | | | |
| Net income (loss) | $ | 2,089 |
| | $ | 324 |
| | $ | (1,982 | ) |
| Adjustments to reconcile net income (loss) to net cash provided by operating activities: | | | | | |
| Depreciation and amortization expense | 1,534 |
| | 1,473 |
| | 1,527 |
|
| Asset impairment loss | — |
| | 2 |
| | 607 |
|
| Loss on shutdown and sales of refinery assets, net | 12 |
| | 888 |
| | 1,868 |
|
| Gain on sale of investment in Cameron Highway Oil Pipeline Company | — |
| | (55 | ) | | — |
|
| Stock-based compensation expense | 58 |
| | 54 |
| | 66 |
|
| Deferred income tax expense (benefit) | 461 |
| | 347 |
| | (343 | ) |
| Changes in current assets and current liabilities | 81 |
| | 68 |
| | 255 |
|
| Changes in deferred charges and credits and other operating activities, net | (197 | ) | | (56 | ) | | (175 | ) |
| Net cash provided by operating activities | 4,038 |
| | 3,045 |
| | 1,823 |
|
| Cash flows from investing activities: | | | | | |
| Capital expenditures | (2,355 | ) | | (1,730 | ) | | (2,306 | ) |
| Deferred turnaround and catalyst costs | (629 | ) | | (535 | ) | | (415 | ) |
| Acquisition of Pembroke Refinery, net of cash acquired | (1,691 | ) | | — |
| | — |
|
| Acquisition of Meraux Refinery | (547 | ) | | — |
| | — |
|
| Acquisitions of ethanol plants | — |
| | (260 | ) | | (577 | ) |
| Minor acquisitions | (37 | ) | | — |
| | (29 | ) |
| Proceeds from the sale of the Paulsboro Refinery | — |
| | 547 |
| | — |
|
Proceeds from the sale of the Delaware City Refinery assets and associated terminal and pipeline assets | — |
| | 220 |
| | — |
|
| Proceeds from the sale of investment in Cameron Highway Oil Pipeline Company | — |
| | 330 |
| | — |
|
| Other investing activities, net | (39 | ) | | 23 |
| | 35 |
|
| Net cash used in investing activities | (5,298 | ) | | (1,405 | ) | | (3,292 | ) |
| Cash flows from financing activities: | | | | | |
| Non-bank debt: | | | | | |
| Borrowings | — |
| | 1,544 |
| | 998 |
|
| Repayments | (774 | ) | | (517 | ) | | (285 | ) |
| Bank credit agreements: | | | | | |
| Borrowings | — |
| | — |
| | 39 |
|
| Repayments | (4 | ) | | — |
| | (39 | ) |
| Accounts receivable sales facility: | | | | | |
| Proceeds from the sale of receivables | 150 |
| | 1,225 |
| | 950 |
|
| Repayments | — |
| | (1,325 | ) | | (850 | ) |
| Proceeds from the sale of common stock, net of issuance costs | — |
| | — |
| | 799 |
|
| Proceeds from the exercise of stock options | 49 |
| | 20 |
| | 11 |
|
| Purchase of common stock for treasury | (349 | ) | | (13 | ) | | (4 | ) |
| Common stock dividends | (169 | ) | | (114 | ) | | (324 | ) |
| Contributions from noncontrolling interests | 22 |
| | — |
| | — |
|
| Other financing activities, net | 9 |
| | (4 | ) | | (6 | ) |
| Net cash provided by (used in) financing activities | (1,066 | ) | | 816 |
| | 1,289 |
|
| Effect of foreign exchange rate changes on cash | 16 |
| | 53 |
| | 65 |
|
| Net increase (decrease) in cash and temporary cash investments | (2,310 | ) | | 2,509 |
| | (115 | ) |
| Cash and temporary cash investments at beginning of year | 3,334 |
| | 825 |
| | 940 |
|
| Cash and temporary cash investments at end of year | $ | 1,024 |
| | $ | 3,334 |
| | $ | 825 |
|
See Notes to Consolidated Financial Statements.
VALERO ENERGY CORPORATION AND SUBSIDIARIES
CONSOLIDATED STATEMENTS OF COMPREHENSIVE INCOME
(Millions of Dollars)
|
| | | | | | | | | | | |
| | Year Ended December 31, |
| | 2011 | | 2010 | | 2009 |
| Net income (loss) | $ | 2,089 |
| | $ | 324 |
| | $ | (1,982 | ) |
| Other comprehensive income (loss): | | | | | |
|
Foreign currency translation adjustment,
net of income tax expense of $ - , $ - , and $ - | (122 | ) | | 158 |
| | 375 |
|
| Pension and other postretirement benefits: | | | | | |
Net gain (loss) arising during the year,
net of income tax (expense) benefit of $101, $5, and $(132) | (188 | ) | | (14 | ) | | 219 |
|
Net (gain) loss reclassified into income,
net of income tax expense (benefit) of $2, $3, and $(2) | (1 | ) | | (4 | ) | | (1 | ) |
Net gain (loss) on pension and other postretirement benefits | (189 | ) | | (18 | ) | | 218 |
|
Derivative instruments designated and qualifying as cash flow hedges: | | | | | |
Net gain (loss) arising during the year,
net of income tax (expense) benefit of $(11), $1, and $(44) | 21 |
| | (1 | ) | | 81 |
|
Net (gain) loss reclassified into income,
net of income tax expense (benefit) of $1, $62, and $72 | (2 | ) | | (116 | ) | | (133 | ) |
| Net gain (loss) on cash flow hedges | 19 |
| | (117 | ) | | (52 | ) |
| Other comprehensive income (loss) | (292 | ) | | 23 |
| | 541 |
|
| Comprehensive income (loss) | 1,797 |
| | 347 |
| | (1,441 | ) |
| Less: Comprehensive loss attributable to noncontrolling interests | (1 | ) | | — |
| | — |
|
Comprehensive income (loss) attributable to Valero Energy Corporation stockholders | $ | 1,798 |
| | $ | 347 |
| | $ | (1,441 | ) |
See Notes to Consolidated Financial Statements.
VALERO ENERGY CORPORATION AND SUBSIDIARIES
NOTES TO CONSOLIDATED FINANCIAL STATEMENTS
| |
| 1. | BASIS OF PRESENTATION AND SUMMARY OF SIGNIFICANT ACCOUNTING POLICIES |
Basis of Presentation
General
As used in this report, the terms “Valero,” “we,” “us,” or “our” may refer to Valero Energy Corporation, one or more of its consolidated subsidiaries, or all of them taken as a whole. We are an independent petroleum refining and marketing company and own 16 refineries with a combined total throughput capacity of approximately 3.0 million barrels per day as of December 31, 2011. We market our refined products through an extensive bulk and rack marketing network and we sell refined products through a network of approximately 6,800 retail and wholesale branded outlets in the United States (U.S.), Canada, the United Kingdom (U.K.), Aruba, and Ireland under various brand names including Valero®, Diamond Shamrock®, Shamrock®,Ultramar®, Beacon®,andTexaco®. We also produce ethanol and operate ten ethanol plants in the U.S. with a combined nameplate production capacity of approximately 1.1 billion gallons per year as of December 31, 2011. Our operations are affected by:
company-specific factors, primarily refinery utilization rates and refinery maintenance turnarounds;
seasonal factors, such as the demand for refined products during the summer driving season and heating oil during the winter season; and
industry factors, such as movements in and the level of crude oil prices including the effect of quality differentials between grades of crude oil, the demand for and prices of refined products, industry supply capacity, and competitor refinery maintenance turnarounds.
We have evaluated subsequent events that occurred after December 31, 2011 through the filing of this Form 10-K. Any material subsequent events that occurred during this time have been properly recognized or disclosed in these financial statements.
Noncontrolling Interest
On January 21, 2011, we entered into a joint venture agreement with Darling Green Energy LLC, a subsidiary of Darling International, Inc., to form Diamond Green Diesel Holdings LLC (DGD Holdings). DGD Holdings, through its wholly owned subsidiary, Diamond Green Diesel LLC (DGD), is constructing and will operate a biomass-based diesel plant having a design feed capacity of 10,000 barrels per day that will process animal fats, used cooking oils, and other vegetable oils into renewable green diesel. The plant will be located next to our St. Charles Refinery. The aggregate cost of this facility is estimated to be approximately $368 million and the construction is expected to be completed in late 2012. The joint venture agreement requires that contributions be made to DGD Holdings based on the percentage of units held by each member, which is currently on a 50/50 basis. From the inception of DGD Holdings (January 21, 2011) through December 31, 2011, each member had contributed $22 million of cash and $1 million of noncash assets, consisting primarily of property, plant, and equipment, to DGD Holdings. In addition, on May 31, 2011, we agreed to lend DGD up to $221 million in order to finance 60 percent of the construction costs of the plant.
Because of our controlling financial interest in DGD Holdings, we have included the financial statements of DGD Holdings in these consolidated financial statements and have separately disclosed the related noncontrolling interest.
VALERO ENERGY CORPORATION AND SUBSIDIARIES
NOTES TO CONSOLIDATED FINANCIAL STATEMENTS (Continued)
of the investment and its carrying amount. See Notes 3 and 9 regarding the sale of our equity method investment in Cameron Highway Oil Pipeline Company (CHOPS).
Environmental Matters
Our operations are subject to extensive environmental regulations by governmental authorities relating to the discharge of materials into the environment, waste management, pollution prevention measures, greenhouse gas emissions, and characteristics and composition of gasolines and distillates. Because environmental laws and regulations are becoming more complex and stringent and new environmental laws and regulations are continuously being enacted or proposed, the level of future expenditures required for environmental matters could increase in the future. In addition, any major upgrades in any of our operating facilities could require material additional expenditures to comply with environmental laws and regulations. See Note 12 of Notes to Consolidated Financial Statements for a further discussion of our environmental matters.
Tax Matters
We are subject to extensive tax liabilities imposed by multiple jurisdictions, including income taxes, transactional taxes (excise/duty, sales/use, and value-added taxes), payroll taxes, franchise taxes, withholding taxes, and ad valorem taxes. New tax laws and regulations and changes in existing tax laws and regulations are continuously being enacted or proposed that could result in increased expenditures for tax liabilities in the future. Many of these liabilities are subject to periodic audits by the respective taxing authority. Subsequent changes to our tax liabilities as a result of these audits may subject us to interest and penalties. See Notes 12 and 16 of Notes to Consolidated Financial Statements for a further discussion of our tax matters.
As of December 31, 2011, the Internal Revenue Service (IRS) has ongoing tax audits related to our U.S. federal tax returns from 2002 through 2009, as discussed in Note 16 of Notes to Consolidated Financial Statements. We have received Revenue Agent Reports on our tax years for 2002 through 2007 and we are vigorously contesting many of the tax positions and assertions from the IRS. Although we believe our tax liabilities are fairly stated and properly reflected in our financial statements, should the IRS eventually prevail, it could result in a material amount of our deferred tax liabilities being reclassified to current liabilities which could have a material adverse effect on our liquidity.
Cash Held by Our International Subsidiaries
We operate in countries outside the U.S. through subsidiaries incorporated in these countries, and the earnings of these subsidiaries are taxed by the countries in which they are incorporated. We intend to reinvest these earnings indefinitely in our international operations even though we are not restricted from repatriating such earnings to the U.S. in the form of cash dividends. Should we decide to repatriate such earnings, we would incur and pay taxes on the amounts repatriated. In addition, such repatriation could cause us to record deferred tax expense that could significantly impact our results of operations, as further discussed in Note 16 of Notes to Consolidated Financial Statements. We believe, however, that a substantial portion of our international cash can be returned to the U.S. without significant tax consequences through means other than a repatriation of earnings. As of December 31, 2011, $822 million of our cash and temporary cash investments was held by our international subsidiaries.
Financial Regulatory Reform
In July 2010, President Obama signed into law the Dodd-Frank Wall Street Reform and Consumer Protection Act (Wall Street Reform Act). The Wall Street Reform Act, among many things, creates new regulations for companies that extend credit to consumers and requires most derivative instruments to be traded on exchanges and routed through clearinghouses. Rules to implement the Wall Street Reform Act are being finalized and therefore, the impact to our operations is not yet known. However, implementation could result in higher margin requirements, higher clearing costs, and more reporting requirements with respect to our derivative activities.
Concentration of Customers
Our refining and marketing operations have a concentration of customers in the refining industry and customers who are refined product wholesalers and retailers. These concentrations of customers may impact our overall exposure to credit risk, either positively or negatively, in that these customers may be similarly affected by changes in economic or other conditions. However, we believe that our portfolio of accounts receivable is sufficiently diversified to the extent necessary to minimize potential credit risk. Historically, we have not had any significant problems collecting our accounts receivable.
Sources of Liquidity
We believe that we have sufficient funds from operations and, to the extent necessary, from borrowings under our credit facilities, to fund our ongoing operating requirements. We expect that, to the extent necessary, we can raise additional funds from time to time through equity or debt financings in the public and private capital markets or the arrangement of additional credit facilities. However, there can be no assurances regarding the availability of any future financings or additional credit facilities or whether such financings or additional credit facilities can be made available on terms that are acceptable to us.
NEW ACCOUNTING PRONOUNCEMENTS
As discussed in Note 1 of Notes to Consolidated Financial Statements, certain new financial accounting pronouncements have been issued that either have already been reflected in the accompanying financial statements, or will become effective for our financial statements at various dates in the future. The adoption of these pronouncements has not had, and is not expected to have, a material effect on our financial statements.
CRITICAL ACCOUNTING POLICIES INVOLVING CRITICAL ACCOUNTING ESTIMATES
The preparation of financial statements in accordance with U.S. generally accepted accounting principles requires us to make estimates and assumptions that affect the amounts reported in the financial statements and accompanying notes. Actual results could differ from those estimates. The following summary provides further information about our critical accounting policies that involve critical accounting estimates, and should be read in conjunction with Note 1 of Notes to Consolidated Financial Statements, which summarizes our significant accounting policies. The following accounting policies involve estimates that are considered critical due to the level of sensitivity and judgment involved, as well as the impact on our financial position and results of operations. We believe that all of our estimates are reasonable.
Property, Plant and Equipment
The cost of property, plant and equipment (property assets) purchased or constructed, including betterments of property assets, are capitalized. The cost of repairs to and normal maintenance of property assets, however, is expensed as incurred. Betterments of property assets are those which either extend the useful life, increase the capacity or improve the operating efficiency of the asset, or improve the safety of our operations. The cost of property assets constructed includes interest and certain overhead costs allocable to the construction activities.
Our operations, especially those of our refining segment, are highly capital intensive. Each of our refineries comprises a large base of property assets, consisting of a series of interconnected, highly integrated and interdependent crude oil processing facilities and supporting logistical infrastructure (Units), and these Units are continuously improved. Improvements consist of the addition of new Units and betterments of existing Units. We plan for these improvements by developing a multi-year capital program that is updated and revised based on changing internal and external factors.
Depreciation of property assets used in our refining segment is recorded on a straight-line basis over the estimated useful lives of these assets primarily using the composite method of depreciation. We maintain a separate composite group of property assets for each of our refineries. We estimate the useful life of each group based on an evaluation of the property assets comprising the group, and such evaluations consist of, but are not limited to, the physical inspection of the assets to determine their condition, consideration of the manner in which the assets are maintained, assessment of the need to replace assets, and evaluation of the manner in which improvements impact the useful life of the group. The estimated useful lives of our composite groups range primarily from 25 to 30 years.
Under the composite method of depreciation, the cost of an improvement is added to the composite group to which it relates and is depreciated over that group’s estimated useful life. We design improvements to our refineries in accordance with engineering specifications, design standards and practices accepted in our industry, and these improvements have design lives consistent with our estimated useful lives. Therefore, we believe the use of the group life to depreciate the cost of improvements made to the group is reasonable because the estimated useful life of each improvement is consistent with that of the group. It should be noted, however, that factors such as competition, regulation, or environmental matters could cause us to change our estimates, thus impacting depreciation expense in the future.
Also under the composite method of depreciation, the historical cost of a minor property asset (net of salvage value) that is retired or replaced is charged to accumulated depreciation and no gain or loss is recognized in income. However, a gain or loss is recognized in income for a major property asset that is retired, replaced or sold and for an abnormal disposition of a property asset (primarily involuntary conversions). Gains and losses are reflected in depreciation and amortization expense, unless such amounts are reported separately due to materiality.
Impairment of Assets
Long-lived assets, which include property, plant and equipment, intangible assets, and refinery turnaround and catalyst costs, are tested for recoverability whenever events or changes in circumstances indicate that the carrying amount of the asset may not be recoverable. An impairment loss should be recognized if the carrying amount of the asset exceeds its fair value.
In order to test for recoverability, we must make estimates of projected cash flows related to the asset being evaluated, which include, but are not limited to, assumptions about the use or disposition of the asset, its estimated remaining life, and future expenditures necessary to maintain its existing service potential. In order to determine fair value, management must make certain estimates and assumptions including, among other things, an assessment of market conditions, projected cash flows, investment rates, interest/equity rates, and growth rates, that could significantly impact the fair value of the asset being tested for impairment. Our impairment evaluations are based on assumptions that we deem to be reasonable. Providing sensitivity analyses if other assumptions were used in performing the impairment evaluations is not practicable due to the significant number of assumptions involved in the estimates. See Note 4 of Notes to Consolidated Financial Statements for a further discussion of our asset impairment analysis and certain losses resulting from those analyses.
We evaluate our equity method investments for impairment when there is evidence that we may not be able to recover the carrying amount of our investments or the investee is unable to sustain an earnings capacity that justifies the carrying amount. A loss in the value of an investment that is other than a temporary decline is recognized currently in earnings, and is based on the difference between the estimated current fair value of the investment and its carrying amount.
Environmental Matters
Our operations are subject to extensive environmental regulations by governmental authorities relating primarily to the discharge of materials into the environment, waste management, and pollution prevention measures. Future legislative action and regulatory initiatives, as discussed in Note 12 of Notes to Consolidated Financial Statements could result in changes to required operating permits, additional remedial actions, or increased capital expenditures and operating costs that cannot be assessed with certainty at this time.
Accruals for environmental liabilities are based on best estimates of probable undiscounted future costs over a 20-year time period using currently available technology and applying current regulations, as well as our own internal environmental policies. However, environmental liabilities are difficult to assess and estimate due to uncertainties related to the magnitude of possible remediation, the timing of such remediation, and the determination of our obligation in proportion to other parties. Such estimates are subject to change due to many factors, including the identification of new sites requiring remediation, changes in environmental laws and regulations and their interpretation, additional information related to the extent and nature of remediation efforts, and potential improvements in remediation technologies. An estimate of the sensitivity to earnings for changes in those factors is not practicable due to the number of contingencies that must be assessed, the number of underlying assumptions, and the wide range of possible outcomes.
The amount of and changes in our accruals for environmental matters as of and for the years ended December 31, 2011, 2010, and 2009 is included in Note 10 of Notes to Consolidated Financial Statements.
Pension and Other Postretirement Benefit Obligations
We have significant pension and other postretirement benefit liabilities and costs that are developed from actuarial valuations. Inherent in these valuations are key assumptions including discount rates, expected return on plan assets, future compensation increases, and health care cost trend rates. Changes in these assumptions are primarily influenced by factors outside our control. For example, the discount rate assumption represents a yield curve comprised of various long-term bonds that have an average rating of double-A when averaging all available ratings by the recognized rating agencies, while the expected return on plan assets is based on a compounded return calculated assuming an asset allocation that is representative of the asset mix in our pension plans. These assumptions can have a significant effect on the amounts reported in our financial statements. For example, a 0.25 percent decrease in the assumptions related to the discount rate or expected return on plan assets or a 0.25 percent increase in the assumptions related to the health care cost trend rate or rate of compensation increase would have the following effects on the projected benefit obligation as of December 31, 2011 and net periodic benefit cost for the year ending December 31, 2012 (in millions):
|
| | | | | | | |
| |
Pension Benefits | | Other Postretirement Benefits |
| Increase in projected benefit obligation resulting from: | | | |
| Discount rate decrease | $ | 85 |
| | $ | 13 |
|
| Compensation rate increase | 33 |
| | — |
|
| Health care cost trend rate increase | — |
| | 5 |
|
| | | | |
| Increase in expense resulting from: | | | |
| Discount rate decrease | 14 |
| | 1 |
|
| Expected return on plan assets decrease | 4 |
| | — |
|
| Compensation rate increase | 8 |
| | — |
|
| Health care cost trend rate increase | — |
| | 1 |
|
See Note 14 of Notes to Consolidated Financial Statements for a further discussion of our pension and other postretirement benefit obligations.
Tax Matters
We are subject to extensive tax liabilities imposed by multiple jurisdictions, including income taxes, transactional taxes (excise/duty, sales/use, and value-added taxes), payroll taxes, franchise taxes, withholding taxes, and ad valorem taxes. New tax laws and regulations and changes in existing tax laws and regulations are continuously being enacted or proposed that could result in increased expenditures for tax liabilities that cannot be predicted at this time. In addition, we have received claims from various jurisdictions related to certain tax matters. Tax liabilities include potential assessments of penalty and interest amounts.
We record tax liabilities based on our assessment of existing tax laws and regulations. A contingent loss related to a transactional tax claim is recorded if the loss is both probable and estimable. The recording of our tax liabilities requires significant judgments and estimates. Actual tax liabilities can vary from our
estimates for a variety of reasons, including different interpretations of tax laws and regulations and different assessments of the amount of tax due. In addition, in determining our income tax provision, we must assess the likelihood that our deferred tax assets, primarily consisting of net operating loss and tax credit carryforwards, will be recovered through future taxable income. Significant judgment is required in estimating the amount of valuation allowance, if any, that should be recorded against those deferred income tax assets. If our actual results of operations differ from such estimates or our estimates of future taxable income change, the valuation allowance may need to be revised. However, an estimate of the sensitivity to earnings that would result from changes in the assumptions and estimates used in determining our tax liabilities is not practicable due to the number of assumptions and tax laws involved, the various potential interpretations of the tax laws, and the wide range of possible outcomes. See Notes 12 and 16 of Notes to Consolidated Financial Statements for a further discussion of our tax liabilities.
Legal Matters
A variety of claims have been made against us in various lawsuits. We record a liability related to a loss contingency attributable to such legal matters if we determine the loss to be both probable and estimable. The recording of such liabilities requires judgments and estimates, the results of which can vary significantly from actual litigation results due to differing interpretations of relevant law and differing opinions regarding the degree of potential liability and the assessment of reasonable damages. However, an estimate of the sensitivity to earnings if other assumptions were used in recording our legal liabilities is not practicable due to the number of contingencies that must be assessed and the wide range of reasonably possible outcomes, both in terms of the probability of loss and the estimates of such loss.
ITEM 7A. QUANTITATIVE AND QUALITATIVE DISCLOSURES ABOUT MARKET RISK
COMMODITY PRICE RISK
We are exposed to market risks related to the volatility in the price of crude oil, refined products (primarily gasoline and distillate), grain (primarily corn), and natural gas used in our operations. To reduce the impact of price volatility on our results of operations and cash flows, we use commodity derivative instruments, including swaps, futures, and options to hedge:
inventories and firm commitments to purchase inventories generally for amounts by which our current year inventory levels (determined on a last-in, first-out (LIFO) basis) differ from our previous year-end LIFO inventory levels and
forecasted feedstock and refined product purchases, refined product sales, natural gas purchases, and corn purchases to lock in the price of these forecasted transactions at existing market prices that we deem favorable.
We use the futures markets for the available liquidity, which provides greater flexibility in transacting our hedging and trading operations. We use swaps primarily to manage our price exposure. We also enter into certain commodity derivative instruments for trading purposes to take advantage of existing market conditions related to future results of operations and cash flows.
Our positions in commodity derivative instruments are monitored and managed on a daily basis by a risk control group to ensure compliance with our stated risk management policy that has been approved by our board of directors.
The following sensitivity analysis includes all positions at the end of the reporting period with which we have market risk (in millions):
|
| | | | | | | |
| | Derivative Instruments Held For |
| | Non-Trading Purposes | | Trading Purposes |
| December 31, 2011 | | | |
| Gain (loss) in fair value resulting from: | | | |
| 10% increase in underlying commodity prices | $ | (156 | ) | | $ | 1 |
|
| 10% decrease in underlying commodity prices | 156 |
| | 2 |
|
| | | | |
| December 31, 2010 | | | |
| Gain (loss) in fair value resulting from: | | | |
| 10% increase in underlying commodity prices | (199 | ) | | — |
|
| 10% decrease in underlying commodity prices | 189 |
| | (1 | ) |
See Note 21 of Notes to Consolidated Financial Statements for notional volumes associated with these derivative contracts as of December 31, 2011.
COMPLIANCE PROGRAM PRICE RISK
We are exposed to market risks related to the volatility in the price of financial instruments associated with
various governmental and regulatory compliance programs that we must purchase in the open market to comply with these programs. To reduce the impact of this risk on our results of operations and cash flows, we may enter into derivative instruments, such as futures. As of December 31, 2011, there was no significant gain or loss in the fair value of derivative instruments that would result from a 10 percent increase or decrease in the underlying price of the futures contracts. See Note 21 of Notes to Consolidated Financial Statements for a discussion about these compliance programs and notional volumes associated with these derivative contracts as of December 31, 2011.
INTEREST RATE RISK
The following table provides information about our debt instruments, excluding capital lease obligations (dollars in millions), the fair values of which are sensitive to changes in interest rates. Principal cash flows and related weighted-average interest rates by expected maturity dates are presented. We had no interest rate derivative instruments outstanding as of December 31, 2011 and 2010.
|
| | | | | | | | | | | | | | | | | | | | | | | | | | | | | | | |
| | December 31, 2011 |
| | Expected Maturity Dates | | | | |
| | 2012 | | 2013 | | 2014 | | 2015 | | 2016 | | There- after | | Total | | Fair Value |
| Debt: | | | | | | | | | | | | | | | |
| Fixed rate | $ | 754 |
| | $ | 484 |
| | $ | 200 |
| | $ | 475 |
| | $ | — |
| | $ | 5,578 |
| | $ | 7,491 |
| | $ | 9,048 |
|
| Average interest rate | 6.9 | % | | 5.5 | % | | 4.8 | % | | 5.2 | % | | — | % | | 7.3 | % | | 6.9 | % | | |
| Floating rate | $ | 250 |
| | $ | — |
| | $ | — |
| | $ | — |
| | $ | — |
| | $ | — |
| | $ | 250 |
| | $ | 250 |
|
| Average interest rate | 0.6 | % | | — | % | | — | % | | — | % | | — | % | | — | % | | 0.6 | % | | |
|
| | | | | | | | | | | | | | | | | | | | | | | | | | | | | | | |
| | December 31, 2010 |
| | Expected Maturity Dates | | | | |
| | 2011 | | 2012 | | 2013 | | 2014 | | 2015 | | There- after | | Total | | Fair Value |
| Debt: | | | | | | | | | | | | | | | |
| Fixed rate | $ | 418 |
| | $ | 759 |
| | $ | 489 |
| | $ | 209 |
| | $ | 484 |
| | $ | 5,605 |
| | $ | 7,964 |
| | $ | 9,092 |
|
| Average interest rate | 6.4 | % | | 6.9 | % | | 5.5 | % | | 4.8 | % | | 5.2 | % | | 7.2 | % | | 6.9 | % | | |
| Floating rate | $ | 400 |
| | $ | — |
| | $ | — |
| | $ | — |
| | $ | — |
| | $ | — |
| | $ | 400 |
| | $ | 400 |
|
| Average interest rate | 0.5 | % | | — | % | | — | % | | — | % | | — | % | | — | % | | 0.5 | % | | |
FOREIGN CURRENCY RISK
As of December 31, 2011, we had commitments to purchase $751 million of U.S. dollars. Our market risk was minimal on the contracts, as they matured on or before January 26, 2012, resulting in a $3 million loss in the first quarter of 2012.
ITEM 8. FINANCIAL STATEMENTS AND SUPPLEMENTARY DATA
MANAGEMENT’S REPORT ON INTERNAL CONTROL OVER FINANCIAL REPORTING
Our management is responsible for establishing and maintaining adequate “internal control over financial reporting” (as defined in Rule 13a-15(f) under the Securities Exchange Act of 1934) for Valero. Our management evaluated the effectiveness of Valero’s internal control over financial reporting as of December 31, 2011. In its evaluation, management used the criteria established in Internal Control – Integrated Framework issued by the Committee of Sponsoring Organizations of the Treadway Commission (COSO). Management believes that as of December 31, 2011, our internal control over financial reporting was effective based on those criteria.
Management’s evaluation of and conclusion regarding the effectiveness of our internal control over financial reporting excludes the internal control over financial reporting of Valero Energy Ltd and its subsidiaries (VEL), which we acquired on August 1, 2011 and of Valero Refining-Meraux LLC (Meraux), the operations of which we acquired on October 1, 2011, (as described in Note 2 of Notes to Consolidated Financial Statements). The VEL and Meraux acquisitions contributed approximately 7 percent of our total operating revenues for the year ended December 31, 2011 and accounted for approximately 10 percent of our total assets as of December 31, 2011. We plan to fully integrate VEL and Meraux into our internal control over financial reporting in 2012.
Our independent registered public accounting firm has issued an attestation report on the effectiveness of our internal control over financial reporting, which begins on page 58 of this report.
REPORT OF INDEPENDENT REGISTERED PUBLIC ACCOUNTING FIRM
The Board of Directors and Stockholders
of Valero Energy Corporation and subsidiaries:
We have audited the accompanying consolidated balance sheets of Valero Energy Corporation and subsidiaries (the Company) as of December 31, 2011 and 2010, and the related consolidated statements of income, equity, cash flows, and comprehensive income for each of the years in the three-year period ended December 31, 2011. These consolidated financial statements are the responsibility of the Company’s management. Our responsibility is to express an opinion on these consolidated financial statements based on our audits.
We conducted our audits in accordance with the standards of the Public Company Accounting Oversight Board (United States) (the PCAOB). Those standards require that we plan and perform the audit to obtain reasonable assurance about whether the financial statements are free of material misstatement. An audit includes examining, on a test basis, evidence supporting the amounts and disclosures in the financial statements. An audit also includes assessing the accounting principles used and significant estimates made by management, as well as evaluating the overall financial statement presentation. We believe that our audits provide a reasonable basis for our opinion.
In our opinion, the consolidated financial statements referred to above present fairly, in all material respects, the financial position of Valero Energy Corporation and subsidiaries as of December 31, 2011 and 2010, and the results of their operations and their cash flows for each of the years in the three-year period ended December 31, 2011, in conformity with U.S. generally accepted accounting principles.
We also have audited, in accordance with the standards of the PCAOB, the Company’s internal control over financial reporting as of December 31, 2011, based on criteria established in Internal Control – Integrated Framework issued by the Committee of Sponsoring Organizations of the Treadway Commission, and our report dated February 24, 2012 expressed an unqualified opinion on the effectiveness of the Company’s internal control over financial reporting.
/s/ KPMG LLP
San Antonio, Texas
February 24, 2012
REPORT OF INDEPENDENT REGISTERED PUBLIC ACCOUNTING FIRM
The Board of Directors and Stockholders
of Valero Energy Corporation and subsidiaries:
We have audited Valero Energy Corporation and subsidiaries’ (the Company’s) internal control over financial reporting as of December 31, 2011, based on criteria established in Internal Control – Integrated Framework issued by the Committee of Sponsoring Organizations of the Treadway Commission (COSO).The Company’s management is responsible for maintaining effective internal control over financial reporting and for its assessment of the effectiveness of internal control over financial reporting, included in the accompanying Management’s Report on Internal Control over Financial Reporting. Our responsibility is to express an opinion on the Company’s internal control over financial reporting based on our audit.
We conducted our audit in accordance with the standards of the Public Company Accounting Oversight Board (United States) (the PCAOB). Those standards require that we plan and perform the audit to obtain reasonable assurance about whether effective internal control over financial reporting was maintained in all material respects. Our audit included obtaining an understanding of internal control over financial reporting, assessing the risk that a material weakness exists, and testing and evaluating the design and operating effectiveness of internal control based on the assessed risk. Our audit also included performing such other procedures as we considered necessary in the circumstances. We believe that our audit provides a reasonable basis for our opinion.
A company’s internal control over financial reporting is a process designed to provide reasonable assurance regarding the reliability of financial reporting and the preparation of financial statements for external purposes in accordance with generally accepted accounting principles. A company’s internal control over financial reporting includes those policies and procedures that (1) pertain to the maintenance of records that, in reasonable detail, accurately and fairly reflect the transactions and dispositions of the assets of the company; (2) provide reasonable assurance that transactions are recorded as necessary to permit preparation of financial statements in accordance with generally accepted accounting principles, and that receipts and expenditures of the company are being made only in accordance with authorizations of management and directors of the company; and (3) provide reasonable assurance regarding prevention or timely detection of unauthorized acquisition, use, or disposition of the company’s assets that could have a material effect on the financial statements.
Because of its inherent limitations, internal control over financial reporting may not prevent or detect misstatements. Also, projections of any evaluation of effectiveness to future periods are subject to the risk that controls may become inadequate because of changes in conditions, or that the degree of compliance with the policies or procedures may deteriorate.
In our opinion, Valero Energy Corporation and subsidiaries maintained, in all material respects, effective internal control over financial reporting as of December 31, 2011, based on criteria established in Internal Control – Integrated Framework issued by COSO.
The Company acquired Valero Energy Ltd and its subsidiaries (VEL) on August 1, 2011 and the operations of Valero Refining-Meraux LLC (Meraux) on October 1, 2011, and management excluded VEL’s and Meraux’s internal control over financial reporting from its assessment of the effectiveness of the Company’s internal control over financial reporting as of December 31, 2011. The VEL and Meraux acquisitions
contributed approximately 7 percent of the Company’s total operating revenues for the year ended December 31, 2011 and accounted for approximately 10 percent of its total assets as of December 31, 2011. Our audit of internal control over financial reporting of the Company also excluded an evaluation of the internal control over financial reporting of VEL and Meraux.
We also have audited, in accordance with the standards of the PCAOB, the consolidated balance sheets of Valero Energy Corporation and subsidiaries as of December 31, 2011 and 2010, and the related consolidated statements of income, equity, cash flows, and comprehensive income for each of the years in the three-year period ended December 31, 2011, and our report dated February 24, 2012 expressed an unqualified opinion on those consolidated financial statements.
/s/ KPMG LLP
San Antonio, Texas
February 24, 2012
VALERO ENERGY CORPORATION AND SUBSIDIARIES
CONSOLIDATED BALANCE SHEETS
(Millions of Dollars, Except Par Value)
|
| | | | | | | |
| | December 31, |
| | 2011 | | 2010 |
| ASSETS | | | |
| Current assets: | | | |
| Cash and temporary cash investments | $ | 1,024 |
| | $ | 3,334 |
|
| Receivables, net | 8,706 |
| | 4,583 |
|
| Inventories | 5,623 |
| | 4,947 |
|
| Income taxes receivable | 212 |
| | 343 |
|
| Deferred income taxes | 283 |
| | 190 |
|
| Prepaid expenses and other | 124 |
| | 121 |
|
| Total current assets | 15,972 |
| | 13,518 |
|
| Property, plant and equipment, at cost | 32,253 |
| | 28,921 |
|
| Accumulated depreciation | (7,076 | ) | | (6,252 | ) |
| Property, plant and equipment, net | 25,177 |
| | 22,669 |
|
| Intangible assets, net | 227 |
| | 224 |
|
| Deferred charges and other assets, net | 1,407 |
| | 1,210 |
|
| Total assets | $ | 42,783 |
| | $ | 37,621 |
|
| LIABILITIES AND EQUITY | | | |
| Current liabilities: | | | |
| Current portion of debt and capital lease obligations | $ | 1,009 |
| | $ | 822 |
|
| Accounts payable | 9,472 |
| | 6,441 |
|
| Accrued expenses | 595 |
| | 590 |
|
| Taxes other than income taxes | 1,264 |
| | 671 |
|
| Income taxes payable | 119 |
| | 3 |
|
| Deferred income taxes | 249 |
| | 257 |
|
| Total current liabilities | 12,708 |
| | 8,784 |
|
| Debt and capital lease obligations, less current portion | 6,732 |
| | 7,515 |
|
| Deferred income taxes | 5,017 |
| | 4,530 |
|
| Other long-term liabilities | 1,881 |
| | 1,767 |
|
| Commitments and contingencies |
| |
|
| Equity: | | | |
| Valero Energy Corporation stockholders’ equity: | | | |
Common stock, $0.01 par value; 1,200,000,000 shares authorized;
673,501,593 and 673,501,593 shares issued | 7 |
| | 7 |
|
| Additional paid-in capital | 7,486 |
| | 7,704 |
|
| Treasury stock, at cost; 116,689,450 and 105,113,545 common shares | (6,475 | ) | | (6,462 | ) |
| Retained earnings | 15,309 |
| | 13,388 |
|
| Accumulated other comprehensive income | 96 |
| | 388 |
|
| Total Valero Energy Corporation stockholders’ equity | 16,423 |
| | 15,025 |
|
| Noncontrolling interest | 22 |
| | — |
|
| Total equity | 16,445 |
| | 15,025 |
|
| Total liabilities and equity | $ | 42,783 |
| | $ | 37,621 |
|
See Notes to Consolidated Financial Statements.
VALERO ENERGY CORPORATION AND SUBSIDIARIES
CONSOLIDATED STATEMENTS OF INCOME
(Millions of Dollars, Except per Share Amounts)
|
| | | | | | | | | | | |
| | Year Ended December 31, |
| | 2011 | | 2010 | | 2009 |
| Operating revenues (a) | $ | 125,987 |
| | $ | 82,233 |
| | $ | 64,599 |
|
| Costs and expenses: | | | | | |
| Cost of sales | 115,719 |
| | 74,458 |
| | 58,686 |
|
| Operating expenses: | | | | | |
| Refining | 3,406 |
| | 2,944 |
| | 2,880 |
|
| Retail | 678 |
| | 654 |
| | 626 |
|
| Ethanol | 399 |
| | 363 |
| | 169 |
|
| General and administrative expenses | 571 |
| | 531 |
| | 572 |
|
| Depreciation and amortization expense | 1,534 |
| | 1,405 |
| | 1,361 |
|
| Asset impairment loss | — |
| | 2 |
| | 222 |
|
| Total costs and expenses | 122,307 |
| | 80,357 |
| | 64,516 |
|
| Operating income | 3,680 |
| | 1,876 |
| | 83 |
|
| Other income, net | 43 |
| | 106 |
| | 17 |
|
| Interest and debt expense, net of capitalized interest | (401 | ) | | (484 | ) | | (416 | ) |
| Income (loss) from continuing operations before income tax expense (benefit) | 3,322 |
| | 1,498 |
| | (316 | ) |
| Income tax expense (benefit) | 1,226 |
| | 575 |
| | (43 | ) |
| Income (loss) from continuing operations | 2,096 |
| | 923 |
| | (273 | ) |
| Loss from discontinued operations, net of income taxes | (7 | ) | | (599 | ) | | (1,709 | ) |
| Net income (loss) | 2,089 |
| | 324 |
| | (1,982 | ) |
| Less: Net loss attributable to noncontrolling interests | (1 | ) | | — |
| | — |
|
| Net income (loss) attributable to Valero Energy Corporation stockholders | $ | 2,090 |
| | $ | 324 |
| | $ | (1,982 | ) |
| | | | | | |
| Net income (loss) attributable to Valero Energy Corporation stockholders: | | | | | |
| Continuing operations | $ | 2,097 |
| | $ | 923 |
| | $ | (273 | ) |
| Discontinued operations | (7 | ) | | (599 | ) | | (1,709 | ) |
| Total | $ | 2,090 |
| | $ | 324 |
| | $ | (1,982 | ) |
| Earnings per common share: | | | | | |
| Continuing operations | $ | 3.70 |
| | $ | 1.63 |
| | $ | (0.50 | ) |
| Discontinued operations | (0.01 | ) | | (1.06 | ) | | (3.17 | ) |
| Total | $ | 3.69 |
| | $ | 0.57 |
| | $ | (3.67 | ) |
| Weighted-average common shares outstanding (in millions) | 563 |
| | 563 |
| | 541 |
|
| Earnings per common share – assuming dilution: | | | | | |
| Continuing operations | $ | 3.69 |
| | $ | 1.62 |
| | $ | (0.50 | ) |
| Discontinued operations | (0.01 | ) | | (1.05 | ) | | (3.17 | ) |
| Total | $ | 3.68 |
| | $ | 0.57 |
| | $ | (3.67 | ) |
| Weighted-average common shares outstanding – assuming dilution (in millions) | 569 |
| | 568 |
| | 541 |
|
| Dividends per common share | $ | 0.30 |
| | $ | 0.20 |
| | $ | 0.60 |
|
| _____________________________ | | | | | |
| Supplemental information: | | | | | |
| (a) Includes excise taxes on sales by our U.S. retail system | $ | 892 |
| | $ | 891 |
| | $ | 873 |
|
See Notes to Consolidated Financial Statements.
VALERO ENERGY CORPORATION AND SUBSIDIARIES
CONSOLIDATED STATEMENTS OF EQUITY
(Millions of Dollars)
|
| | | | | | | | | | | | | | | | | | | | | | | | | | | | | | | |
| | Valero Energy Corporation Stockholders’ Equity | | | | |
| | Common Stock | | Additional Paid-in Capital | | Treasury Stock | | Retained Earnings | | Accumulated Other Comprehensive Income (Loss) | | Total | | Non-controlling Interest | | Total Equity |
| Balance as of December 31, 2008 | $ | 6 |
| | $ | 7,190 |
| | $ | (6,884 | ) | | $ | 15,484 |
| | $ | (176 | ) | | $ | 15,620 |
| | $ | — |
| | $ | 15,620 |
|
| Net loss | — |
| | — |
| | — |
| | (1,982 | ) | | — |
| | (1,982 | ) | | — |
| | (1,982 | ) |
| Dividends on common stock | — |
| | — |
| | — |
| | (324 | ) | | — |
| | (324 | ) | | — |
| | (324 | ) |
| Sale of common stock | 1 |
| | 798 |
| | — |
| | — |
| | — |
| | 799 |
| | — |
| | 799 |
|
| Stock-based compensation expense | — |
| | 68 |
| | — |
| | — |
| | — |
| | 68 |
| | — |
| | 68 |
|
| Tax deduction less than stock-based compensation expense | — |
| | (4 | ) | | — |
| | — |
| | — |
| | (4 | ) | | — |
| | (4 | ) |
| Transactions in connection with stock-based compensation plans: | | | | | | | | | | | | | | | |
| Stock issuances | — |
| | (156 | ) | | 167 |
| | — |
| | — |
| | 11 |
| | — |
| | 11 |
|
| Stock repurchases | — |
| | — |
| | (4 | ) | | — |
| | — |
| | (4 | ) | | — |
| | (4 | ) |
| Other comprehensive income | — |
| | — |
| | — |
| | — |
| | 541 |
| | 541 |
| | — |
| | 541 |
|
| Balance as of December 31, 2009 | 7 |
| | 7,896 |
| | (6,721 | ) | | 13,178 |
| | 365 |
| | 14,725 |
| | — |
| | 14,725 |
|
| Net income | — |
| | — |
| | — |
| | 324 |
| | — |
| | 324 |
| | — |
| | 324 |
|
| Dividends on common stock | — |
| | — |
| | — |
| | (114 | ) | | — |
| | (114 | ) | | — |
| | (114 | ) |
| Stock-based compensation expense | — |
| | 54 |
| | — |
| | — |
| | — |
| | 54 |
| | — |
| | 54 |
|
| Tax deduction in excess of stock-based compensation expense | — |
| | 6 |
| | — |
| | — |
| | — |
| | 6 |
| | — |
| | 6 |
|
| Transactions in connection with stock-based compensation plans: | | | | | | | | | | | | | | | |
| Stock issuances | — |
| | (252 | ) | | 272 |
| | — |
| | — |
| | 20 |
| | — |
| | 20 |
|
| Stock repurchases | — |
| | — |
| | (13 | ) | | — |
| | — |
| | (13 | ) | | — |
| | (13 | ) |
| Other comprehensive income | — |
| | — |
| | — |
| | — |
| | 23 |
| | 23 |
| | — |
| | 23 |
|
| Balance as of December 31, 2010 | 7 |
| | 7,704 |
| | (6,462 | ) | | 13,388 |
| | 388 |
| | 15,025 |
| | — |
| | 15,025 |
|
| Net income | — |
| | — |
| | — |
| | 2,090 |
| | — |
| | 2,090 |
| | (1 | ) | | 2,089 |
|
| Dividends on common stock | — |
| | — |
| | — |
| | (169 | ) | | — |
| | (169 | ) | | — |
| | (169 | ) |
| Stock-based compensation expense | — |
| | 57 |
| | — |
| | — |
| | — |
| | 57 |
| | — |
| | 57 |
|
| Tax deduction in excess of stock-based compensation expense | — |
| | 22 |
| | — |
| | — |
| | — |
| | 22 |
| | — |
| | 22 |
|
| Transactions in connection with stock-based compensation plans: | | | | | | | | | | | | | | | |
| Stock issuances | — |
| | (287 | ) | | 336 |
| | — |
| | — |
| | 49 |
| | — |
| | 49 |
|
| Stock repurchases | — |
| | (10 | ) | | (349 | ) | | — |
| | — |
| | (359 | ) | | — |
| | (359 | ) |
| Contributions from noncontrolling interest in DGD | — |
| | — |
| | — |
| | — |
| | — |
| | — |
| | 23 |
| | 23 |
|
| Recognition of noncontrolling interests in MLP in connection with Pembroke Acquisition | — |
| | — |
| | — |
| | — |
| | — |
| | — |
| | 5 |
| | 5 |
|
| Acquisition of noncontrolling interests in MLP | — |
| | — |
| | — |
| | — |
| | — |
| | — |
| | (5 | ) | | (5 | ) |
| Other comprehensive loss | — |
| | — |
| | — |
| | — |
| | (292 | ) | | (292 | ) | | — |
| | (292 | ) |
| Balance as of December 31, 2011 | $ | 7 |
| | $ | 7,486 |
| | $ | (6,475 | ) | | $ | 15,309 |
| | $ | 96 |
| | $ | 16,423 |
| | $ | 22 |
| | $ | 16,445 |
|
See Notes to Consolidated Financial Statements.
VALERO ENERGY CORPORATION AND SUBSIDIARIES
CONSOLIDATED STATEMENTS OF CASH FLOWS
(Millions of Dollars)
|
| | | | | | | | | | | |
| | Year Ended December 31, |
| | 2011 | | 2010 | | 2009 |
| Cash flows from operating activities: | | | | | |
| Net income (loss) | $ | 2,089 |
| | $ | 324 |
| | $ | (1,982 | ) |
| Adjustments to reconcile net income (loss) to net cash provided by operating activities: | | | | | |
| Depreciation and amortization expense | 1,534 |
| | 1,473 |
| | 1,527 |
|
| Asset impairment loss | — |
| | 2 |
| | 607 |
|
| Loss on shutdown and sales of refinery assets, net | 12 |
| | 888 |
| | 1,868 |
|
| Gain on sale of investment in Cameron Highway Oil Pipeline Company | — |
| | (55 | ) | | — |
|
| Stock-based compensation expense | 58 |
| | 54 |
| | 66 |
|
| Deferred income tax expense (benefit) | 461 |
| | 347 |
| | (343 | ) |
| Changes in current assets and current liabilities | 81 |
| | 68 |
| | 255 |
|
| Changes in deferred charges and credits and other operating activities, net | (197 | ) | | (56 | ) | | (175 | ) |
| Net cash provided by operating activities | 4,038 |
| | 3,045 |
| | 1,823 |
|
| Cash flows from investing activities: | | | | | |
| Capital expenditures | (2,355 | ) | | (1,730 | ) | | (2,306 | ) |
| Deferred turnaround and catalyst costs | (629 | ) | | (535 | ) | | (415 | ) |
| Acquisition of Pembroke Refinery, net of cash acquired | (1,691 | ) | | — |
| | — |
|
| Acquisition of Meraux Refinery | (547 | ) | | — |
| | — |
|
| Acquisitions of ethanol plants | — |
| | (260 | ) | | (577 | ) |
| Minor acquisitions | (37 | ) | | — |
| | (29 | ) |
| Proceeds from the sale of the Paulsboro Refinery | — |
| | 547 |
| | — |
|
Proceeds from the sale of the Delaware City Refinery assets and associated terminal and pipeline assets | — |
| | 220 |
| | — |
|
| Proceeds from the sale of investment in Cameron Highway Oil Pipeline Company | — |
| | 330 |
| | — |
|
| Other investing activities, net | (39 | ) | | 23 |
| | 35 |
|
| Net cash used in investing activities | (5,298 | ) | | (1,405 | ) | | (3,292 | ) |
| Cash flows from financing activities: | | | | | |
| Non-bank debt: | | | | | |
| Borrowings | — |
| | 1,544 |
| | 998 |
|
| Repayments | (774 | ) | | (517 | ) | | (285 | ) |
| Bank credit agreements: | | | | | |
| Borrowings | — |
| | — |
| | 39 |
|
| Repayments | (4 | ) | | — |
| | (39 | ) |
| Accounts receivable sales facility: | | | | | |
| Proceeds from the sale of receivables | 150 |
| | 1,225 |
| | 950 |
|
| Repayments | — |
| | (1,325 | ) | | (850 | ) |
| Proceeds from the sale of common stock, net of issuance costs | — |
| | — |
| | 799 |
|
| Proceeds from the exercise of stock options | 49 |
| | 20 |
| | 11 |
|
| Purchase of common stock for treasury | (349 | ) | | (13 | ) | | (4 | ) |
| Common stock dividends | (169 | ) | | (114 | ) | | (324 | ) |
| Contributions from noncontrolling interests | 22 |
| | — |
| | — |
|
| Other financing activities, net | 9 |
| | (4 | ) | | (6 | ) |
| Net cash provided by (used in) financing activities | (1,066 | ) | | 816 |
| | 1,289 |
|
| Effect of foreign exchange rate changes on cash | 16 |
| | 53 |
| | 65 |
|
| Net increase (decrease) in cash and temporary cash investments | (2,310 | ) | | 2,509 |
| | (115 | ) |
| Cash and temporary cash investments at beginning of year | 3,334 |
| | 825 |
| | 940 |
|
| Cash and temporary cash investments at end of year | $ | 1,024 |
| | $ | 3,334 |
| | $ | 825 |
|
See Notes to Consolidated Financial Statements.
VALERO ENERGY CORPORATION AND SUBSIDIARIES
CONSOLIDATED STATEMENTS OF COMPREHENSIVE INCOME
(Millions of Dollars)
|
| | | | | | | | | | | |
| | Year Ended December 31, |
| | 2011 | | 2010 | | 2009 |
| Net income (loss) | $ | 2,089 |
| | $ | 324 |
| | $ | (1,982 | ) |
| Other comprehensive income (loss): | | | | | |
|
Foreign currency translation adjustment,
net of income tax expense of $ - , $ - , and $ - | (122 | ) | | 158 |
| | 375 |
|
| Pension and other postretirement benefits: | | | | | |
Net gain (loss) arising during the year,
net of income tax (expense) benefit of $101, $5, and $(132) | (188 | ) | | (14 | ) | | 219 |
|
Net (gain) loss reclassified into income,
net of income tax expense (benefit) of $2, $3, and $(2) | (1 | ) | | (4 | ) | | (1 | ) |
Net gain (loss) on pension and other postretirement benefits | (189 | ) | | (18 | ) | | 218 |
|
Derivative instruments designated and qualifying as cash flow hedges: | | | | | |
Net gain (loss) arising during the year,
net of income tax (expense) benefit of $(11), $1, and $(44) | 21 |
| | (1 | ) | | 81 |
|
Net (gain) loss reclassified into income,
net of income tax expense (benefit) of $1, $62, and $72 | (2 | ) | | (116 | ) | | (133 | ) |
| Net gain (loss) on cash flow hedges | 19 |
| | (117 | ) | | (52 | ) |
| Other comprehensive income (loss) | (292 | ) | | 23 |
| | 541 |
|
| Comprehensive income (loss) | 1,797 |
| | 347 |
| | (1,441 | ) |
| Less: Comprehensive loss attributable to noncontrolling interests | (1 | ) | | — |
| | — |
|
Comprehensive income (loss) attributable to Valero Energy Corporation stockholders | $ | 1,798 |
| | $ | 347 |
| | $ | (1,441 | ) |
See Notes to Consolidated Financial Statements.
VALERO ENERGY CORPORATION AND SUBSIDIARIES
NOTES TO CONSOLIDATED FINANCIAL STATEMENTS
| |
| 1. | BASIS OF PRESENTATION AND SUMMARY OF SIGNIFICANT ACCOUNTING POLICIES |
Basis of Presentation
General
As used in this report, the terms “Valero,” “we,” “us,” or “our” may refer to Valero Energy Corporation, one or more of its consolidated subsidiaries, or all of them taken as a whole. We are an independent petroleum refining and marketing company and own 16 refineries with a combined total throughput capacity of approximately 3.0 million barrels per day as of December 31, 2011. We market our refined products through an extensive bulk and rack marketing network and we sell refined products through a network of approximately 6,800 retail and wholesale branded outlets in the United States (U.S.), Canada, the United Kingdom (U.K.), Aruba, and Ireland under various brand names including Valero®, Diamond Shamrock®, Shamrock®,Ultramar®, Beacon®,andTexaco®. We also produce ethanol and operate ten ethanol plants in the U.S. with a combined nameplate production capacity of approximately 1.1 billion gallons per year as of December 31, 2011. Our operations are affected by:
company-specific factors, primarily refinery utilization rates and refinery maintenance turnarounds;
seasonal factors, such as the demand for refined products during the summer driving season and heating oil during the winter season; and
industry factors, such as movements in and the level of crude oil prices including the effect of quality differentials between grades of crude oil, the demand for and prices of refined products, industry supply capacity, and competitor refinery maintenance turnarounds.
We have evaluated subsequent events that occurred after December 31, 2011 through the filing of this Form 10-K. Any material subsequent events that occurred during this time have been properly recognized or disclosed in these financial statements.
Noncontrolling Interest
On January 21, 2011, we entered into a joint venture agreement with Darling Green Energy LLC, a subsidiary of Darling International, Inc., to form Diamond Green Diesel Holdings LLC (DGD Holdings). DGD Holdings, through its wholly owned subsidiary, Diamond Green Diesel LLC (DGD), is constructing and will operate a biomass-based diesel plant having a design feed capacity of 10,000 barrels per day that will process animal fats, used cooking oils, and other vegetable oils into renewable green diesel. The plant will be located next to our St. Charles Refinery. The aggregate cost of this facility is estimated to be approximately $368 million and the construction is expected to be completed in late 2012. The joint venture agreement requires that contributions be made to DGD Holdings based on the percentage of units held by each member, which is currently on a 50/50 basis. From the inception of DGD Holdings (January 21, 2011) through December 31, 2011, each member had contributed $22 million of cash and $1 million of noncash assets, consisting primarily of property, plant, and equipment, to DGD Holdings. In addition, on May 31, 2011, we agreed to lend DGD up to $221 million in order to finance 60 percent of the construction costs of the plant.
Because of our controlling financial interest in DGD Holdings, we have included the financial statements of DGD Holdings in these consolidated financial statements and have separately disclosed the related noncontrolling interest.
VALERO ENERGY CORPORATION AND SUBSIDIARIES
NOTES TO CONSOLIDATED FINANCIAL STATEMENTS (Continued)
Significant Accounting Policies
Reclassifications
Certain amounts previously reported in our annual report on Form 10-K for the year ended December 31, 2010 have been reclassified to conform to the 2011 presentation.
Principles of Consolidation
These consolidated financial statements include the accounts of Valero and subsidiaries in which Valero has a controlling interest. Intercompany balances and transactions have been eliminated in consolidation. Investments in significant noncontrolled entities are accounted for using the equity method.
Use of Estimates
The preparation of financial statements in conformity with generally accepted accounting principles (GAAP)requires us to make estimates and assumptions that affect the amounts reported in the consolidated financial statements and accompanying notes. Actual results could differ from those estimates. On an ongoing basis, we review our estimates based on currently available information. Changes in facts and circumstances may result in revised estimates.
Cash and Temporary Cash Investments
Our temporary cash investments are highly liquid, low-risk debt instruments that have a maturity of three months or less when acquired.
Receivables
Trade receivables are carried at original invoice amount. We maintain an allowance for doubtful accounts which is adjusted based on management’s assessment of our customers’ historical collection experience, known credit risks, and industry and economic conditions.
Inventories
Inventories are carried at the lower of cost or market. The cost of refinery feedstocks purchased for processing, refined products, and grain and ethanol inventories are determined under the last-in, first-out (LIFO) method using the dollar-value LIFO method, with any increments valued based on average purchase prices during the year. The cost of feedstocks and products purchased for resale and the cost of materials, supplies, and convenience store merchandise are determined principally under the weighted-average cost method.
Property, Plant and Equipment
The cost of property, plant and equipment (property assets) purchased or constructed, including betterments of property assets, is capitalized. The cost of repairs to and normal maintenance of property assets, however, is expensed as incurred. Betterments of property assets are those which either extend the useful life, increase the capacity or improve the operating efficiency of the asset, or improve the safety of our operations. The cost of property assets constructed includes interest and certain overhead costs allocable to the construction activities.
Our operations, especially those of our refining segment, are highly capital intensive. Each of our refineries comprises a large base of property assets, consisting of a series of interconnected, highly integrated and interdependent crude oil processing facilities and supporting logistical infrastructure (Units), and these Units are continuously improved. Improvements consist of the addition of new Units and betterments of existing Units. We plan for these improvements by developing a multi-year capital program that is updated and revised
VALERO ENERGY CORPORATION AND SUBSIDIARIES
NOTES TO CONSOLIDATED FINANCIAL STATEMENTS (Continued)
based on changing internal and external factors.
Depreciation of property assets used in our refining segment is recorded on a straight-line basis over the estimated useful lives of these assets primarily using the composite method of depreciation. We maintain a separate composite group of property assets for each of our refineries. We estimate the useful life of each group based on an evaluation of the property assets comprising the group, and such evaluations consist of, but are not limited to, the physical inspection of the assets to determine their condition, consideration of the manner in which the assets are maintained, assessment of the need to replace assets, and evaluation of the manner in which improvements impact the useful life of the group. The estimated useful lives of our composite groups range primarily from 25 to 30 years.
Under the composite method of depreciation, the cost of an improvement is added to the composite group to which it relates and is depreciated over that group’s estimated useful life. We design improvements to our refineries in accordance with engineering specifications, design standards and practices accepted in our industry, and these improvements have design lives consistent with our estimated useful lives. Therefore, we believe the use of the group life to depreciate the cost of improvements made to the group is reasonable because the estimated useful life of each improvement is consistent with that of the group. It should be noted, however, that factors such as competition, regulation, or environmental matters could cause us to change our estimates, thus impacting depreciation expense in the future.
Also under the composite method of depreciation, the historical cost of a minor property asset (net of salvage value) that is retired or replaced is charged to accumulated depreciation and no gain or loss is recognized in income. However, a gain or loss is recognized in income for a major property asset that is retired, replaced or sold and for an abnormal disposition of a property asset (primarily involuntary conversions). Gains and losses are reflected in depreciation and amortization expense, unless such amounts are reported separately due to materiality.
Depreciation of property assets used in our retail segment is also recorded on a straight-line basis over the estimated useful lives of the related facilities primarily using the composite method of depreciation. However, depreciation of property assets used in our ethanol segment is recorded on a straight-line basis over the estimated useful lives of each individual asset. Leasehold improvements and assets acquired under capital leases are amortized using the straight-line method over the shorter of the lease term or the estimated useful life of the related asset.
Deferred Charges and Other Assets
“Deferred charges and other assets, net” include the following:
turnaround costs, which are incurred in connection with planned major maintenance activities at our refineries and ethanol plants and which are deferred when incurred and amortized on a straight-line basis over the period of time estimated to lapse until the next turnaround occurs;
fixed-bed catalyst costs, representing the cost of catalyst that is changed out at periodic intervals when the quality of the catalyst has deteriorated beyond its prescribed function, which are deferred when incurred and amortized on a straight-line basis over the estimated useful life of the specific catalyst;
investments in entities that we do not control; and
other noncurrent assets such as convenience store dealer incentive programs, investments of certain benefit plans, debt issuance costs, and various other costs.
VALERO ENERGY CORPORATION AND SUBSIDIARIES
NOTES TO CONSOLIDATED FINANCIAL STATEMENTS (Continued)
Impairment of Assets
Long-lived assets, which include property, plant and equipment, intangible assets, and refinery turnaround and catalysts costs, are tested for recoverability whenever events or changes in circumstances indicate that the carrying amount of the asset may not be recoverable. A long-lived asset is not recoverable if its carrying amount exceeds the sum of the undiscounted cash flows expected to result from its use and eventual disposition. If a long-lived asset is not recoverable, an impairment loss is recognized for the amount by which the carrying amount of the long-lived asset exceeds its fair value, with fair value determined based on discounted estimated net cash flows or other appropriate methods. See Note 4 for our impairment analysis of our long-lived assets.
We evaluate our equity method investments for impairment when there is evidence that we may not be able to recover the carrying amount of our investments or the investee is unable to sustain an earnings capacity that justifies the carrying amount. A loss in the value of an investment that is other than a temporary decline is recognized currently in income, and is based on the difference between the estimated current fair value of the investment and its carrying amount.
Environmental Matters
Liabilities for future reme diationremediation costs are recorded when environmental assessments from governmental regulatory agencies and/or remedial efforts are probable and the costs can be reasonably estimated. Other than for assessments, the timing and magnitude of these accruals generally are based on the completion of investigations or other studies or a commitment to a formal plan of action. Environmental liabilities are based on best estimates of probable undiscounted future costs over a 20-year time period using currently available technology and applying current regulations, as well as our own internal environmental policies, without establishing a range of loss for these liabilities. Environmental liabilities are difficult to assess and estimate due to uncertainties related to the magnitude of possible remediation, the timing of such remediation, and the determination of our obligation in proportion to other parties. Such estimates are subject to change due to many factors, including the identification of new sites requiring remediation, changes in environmental laws and regulations and their interpretation, additional information related to the extent and nature of remediation efforts, and potential improvements in remediation technologies. Amounts recorded for environmental liabilities have not been reduced by possible recoveries from third parties.
Asset Retirement Obligations
We record a liability, which is referred to as an asset retirement obligation, at fair value for the estimated cost to retire a tan gibletangible long-lived asset at the time we incur that liability, which is generally when the asset is purchased, constructed, or leased. We record the liability when we have a legal obligation to incur costs to retire the asset and when a reasonable estimate of the fair value of the liability can be made. If a reasonable estimate cannot be made at the time the liability is incurred, we record the liability when sufficient information is available to estimate the liability’s fair value.
Transfers of Financial Assets
In June 2009, ASC Topic 860, “Transfers and Servicing,” was modified to clarify the requirements fo r derecognizing transferred financial assets, remove the concept of a qualifying special-purpose entity and related exceptions, and require additional disclosures related to transfers of financial assets. This guidance was effective for fiscal years, and interim periods within those fiscal years, beginning after November 15, 2009, and earlier application was prohibited. The adoption of these provisions of ASC Topic 860 effective January 1, 2010 did not affect the manner in which we account for our accounts receivable sales facility as discussed in Note 11, our financial position, or our results of operations.
Foreign Currency Translation
The functional currencies of our Canadian and Aruban operations are the Canadian dollar and the Aruban florin, respectively. The translation of the Canadian operations into U.S. dollars is computed for balance sheet accounts using exchange rates in effect as of the balance sheet date and for revenue and expense accounts using the weighted-average exchange rates during the year. Adjustments resulting from this translation are reported in other comprehensive income. The value of the Aruban florin is fixed to the U.S. dollar at 1.79 Aruban florins to one U.S. dollar. The translation of the Aruban operations into U.S. dollars is computed based on this fixed exchange rate for both balance sheet and income statement accounts. As a result, there are no adjustments resulting from this translation reported in other comprehensive income.
VALERO ENERGY CORPORATION AND SUBSIDIARIES
NOTES TO CONSOLIDATED FINANCIAL STATEMENTS (Continued)
Foreign Currency Translation
The functional currency of each of our international operations is generally the respective local currency, which includes the Canadian dollar, the Aruban florin, the pound sterling, and the euro. Balance sheet accounts are translated into U.S. dollars using exchange rates in effect as of the balance sheet date. Revenue and expense accounts are translated using the weighted-average exchange rates during the year presented. Foreign currency translation adjustments are recorded as a component of accumulated other comprehensive income.
Revenue Recognition
Revenues for products sold by the refining, retail, and ethanol segments are recorded upon delivery of the products to our customers, which is the point at which tit letitle to the products is transferred, and when payment has either been received or collection is reasonably assured.
We present excise taxes on sales by our U.S. retail system on a gross basis with supplemental information regarding the amount of such taxes included in revenues provided in a footnote on the face of the income statement.statements of income. All other excise taxes are presented on a net basis.
We enter into certain purchase and sale arrangements with the same counterparty that are deemed to be made in contemplation of one another. We combine these transactions and, as a result, revenues and cost of sales are not recognized in connection with these arrangements. We also enter into refined product exchange transactions to fulfill sales contracts with our customers by accessing refined products in markets where we do not operate our own refineries. These refined product exchanges are accounted for as exchanges of non-monetary assets, and no revenues are recorded on these transactions.
Product Shipping and Handling Costs
Costs incurred for shipping and handling of products are included in cost of sales.
Stock-Based Compensation
Compensation expense for our share-based compensation plans is based on the fair value of the awards granted and is recognized in income on a straight-line basis over the requisite service period of each award. For new grants that have retirement-eligibility provisions, we use the non-substantive vesting period approach, under which compensation cost is recognized immediately for awards granted to retirement-eligible employees or over the period from the grant date to the date retirement eligibility is achieved if that date is expected to occur during the nominal vesting period.
Income Taxes
Income taxes are accounted for under the asset and liability method. Under this method, deferred tax assets and liabilities are recognized for the future tax consequences attributable to differences between the financial statement carrying amounts of existing assets and liabilities and their respective tax bases. Deferred amounts are measured using enacted tax rates expected to apply to taxable income in the year those temporary differences are expected to be recovered or settled.
We have elected to classify any interest expense and penalties related to the underpayment of income taxes in income tax expense.
VALERO ENERGY CORPORATION AND SUBSIDIARIES
NOTES TO CONSOLIDATED FINANCIAL STATEMENTS (Continued)
Earnings per Common Share
Earnings per common share is computed by dividing net income by the weighted-average number of common shares outstanding for the year. Participating share-based payment awards, including shares of restricted stock granted under certain of our stock-based compensation plans, are included in the computation of basic earnings per share using the two-class method. Earnings per common share – assuming dilution reflects the potential dilution arising from our outstanding stock options and nonvested shares granted to employees in connection wi thwith our stockstock-based compensation plans. Potentially dilutive securities are excluded from the computation of earnings per common share – assuming dilution when the effect of including such shares would be antidilutive when applied to income (loss) from continuing operations.
VALERO ENERGY CORPORATION AND SUBSIDIARIES
NOTES TO CONSOLIDATED FINANCIAL STATEMENTS (Continued)
Effective January 1, 2009, we adopted amendments to ASC Topic 260, “Earnings Per Share,” which require participating share-based payment awards to be included in the computation of basic earnings per share using the two-class method and require the restatement of prior period earnings per share. S hares of restricted stock granted under certain of our stock-based compensation plans represent participating share-based payment awards covered by these provisions. The adoption of these provisions did not have any effect on the calculation of the basic loss per common share from continuing operations for the year ended 2008.
Fair Value Measurements and Disclosures
In January 2010, the provisions of ASC Topic 820, “Fair Value Measurements and Disclosures,” were modi fied to require additional disclosures, including transfers in and out of Level 1 and 2 fair value measurements and the gross basis presentation of the reconciliation of Level 3 fair value measurements. This guidance was effective for interim and annual reporting periods beginning after December 15, 2009, except for disclosures related to Level 3 fair value measurements, which are effective for fiscal years beginning after December 15, 2010 (including interim periods). Early adoption was permitted. The adoption of this guidance effective December 31, 2009 did not affect our financial position or results of operations because these requirements only affected our disclosures.
Financial Instruments
Our financial instruments include cash and temporary cash investments, receivables, payables, debt, capital lease obligations, commodity derivative contracts, and foreign currency derivative contracts. The estimated fair values of these financial instruments approximate their carrying amounts, except for certain debt as discussed in Note 1120. The fair values of our debt, commodity derivative contracts, and foreign currency derivative contracts were estimated primarily based on year-end quoted market prices for identical and similar assets and liabilities in active markets.
Derivatives and Hedging
All derivative instruments are recorded in the balance sheet as either assets or liabilities measured at their fair values. When we enter into a derivative instrument, it is designated as a fair value hedge, a cash flow hedge, an economic hedge, or a trading activity.derivative. The gain or loss on a derivative instrument designated and qualifying as a fair value hedge, as well as the offsetting loss or gain on the hedged item attributable to the hedged risk, are recognized currently in income in the same period. The effective portion of the gain or loss on a derivative instrument designated and qualifying as a cash flow hedge is initially reported as a component of other comprehensive income and is then recorded in income in the period or periods during which the hedged forecasted transaction affects income. The ineffective portion of the gain or loss on the cash flow derivative instrument, if any, is recognized in income as incurred. For our economic hedging relationships (hedges(derivative instruments not designated as fair value or cash flow hedges) and for derivative instruments entered into for trading purposes, the derivative instrument is recorded at fair value and changes in the fair value of the derivative instrument are recognized currently in income. Income effects of commodity derivative instruments, other than certain contracts related to an earn-out agreement discussed in Notes 3 and 20, are recorded in cost of sales while income effects of interest rate swaps (if applicable) are recorded in interest and debt expense. The cash flow effects of all of our derivative contractsinstruments are reflected in operating activities in the statements of cash flows from operating activities.flows.
VALERO ENERGY CORPORATION AND SUBSIDIARIES
NOTES TO CONSOLIDATED FINANCIAL STATEMENTS (Continued)
In March 2008, ASC Topic 815, “Derivatives and Hedging,” was modified to establish disclosure requirements for derivative instruments and for hedging activities. The required disclosures include qualitative disclosures about objectives and strategies for using derivatives, quantitative disclosures about fair value amounts of and gains and losses on derivative instruments, and disclosures about contingent features related to credit risk in derivative agreements. These disclosures were effective for fiscal years, and interim periods within those fiscal years, beginning after November 15, 2008. The adoption of these provisi ons of ASC Topic 815 effective January 1, 2009 did not affect our financial position or results of operations but did result in additional disclosures, which are provided in Note 21.
New Accounting Pronouncements
Business Combinations
In December 2010, the provisions of ASC Topic 805, “Business Combinations,” were modified to specify that if a public entity presents comparative financial statements, then the entity should disclose pro forma revenues and earnings of the combined entity as though the business combination that occurred during the current year had occurred as of the beginning of the comparable prior annual reporting period only. In addition, the supplemental pro forma disclosures were expanded to include a description of the nature and amount of material, nonrecurring pro forma adjustments directly attributable to the business combination included in the reported pro forma revenue and earnings. This guidance is effective prospectively for business combinations for which the acquisition date is on or after the beginning of the first annual reporting period beginning on or after December 15, 2010 with early adoption permitted. The adoption of this guidance effective January 1, 2011 will not affect our fin ancial position or results of operations because these requirements only affect disclosures.
Receivables
In July 2010, the provisions of ASC Topic 310, “Receivables,” were amended to enhance the disclosures about the credit quality of an entity’s financing receivables and the related allowance for credit losses. For public entities, the disclosures as of the end of a reporting period are effective for interim and annual reporting periods ending on or after December 15, 2010; disclosures about activity that occurs during a reporting period are effective for interim and annual reporting periods beginning on or after December 15, 2010. The adoption of this guidance effective December 31, 2010 did not affect our financial position or results of operations nor will it affect our future financial position or results of operations because these requirements only affect disclosures.
VALERO ENERGY CORPORATION AND SUBSIDIARIES
NOTES TO CONSOLIDATED FINANCIAL STATEMENTS (Continued)
New Accounting Pronouncements
In December 2011, the provisions of ASC Topic 210, “Balance Sheet,” were amended to require an entity to disclose information about offsetting and related arrangements to enable users of its financial statements to understand the effect of these arrangements on its financial position. The guidance requires entities to disclose both gross information and net information about both instruments and transactions eligible for offset in the balance sheet and instruments and transactions subject to an agreement similar to a master netting arrangement. These provisions are effective for interim and annual reporting periods beginning on January 1, 2013. The adoption of this guidance effective January 1, 2013 will not affect our financial position or results of operations, but may result in additional disclosures.
In December 2011, the provisions of ASC Topic 220, “Comprehensive Income,” were amended to allow an entity the option to present the total of comprehensive income, the components of net income, and the components of other comprehensive income either in a single continuous statement or in two separate but consecutive financial statements. These provisions to ASC Topic 220 are effective for the first interim or annual period beginning after December 15, 2011 and are to be applied retrospectively, with early adoption permitted. The adoption of this guidance effective January 1, 2012 will not affect our financial position or results of operations because these requirements only affect presentation.
In May 2011, the provisions of ASC Topic 820, “Fair Value Measurement,” were amended to clarify the application of existing fair value measurement requirements and to change certain fair value measurement and disclosure requirements. Amendments that change measurement and disclosure requirements relate to (i) fair value measurement of financial instruments that are managed within a portfolio, (ii) application of premiums and discounts in a fair value measurement, and (iii) additional disclosures about fair value measurements categorized within Level 3 of the fair value hierarchy. These provisions are effective for the first interim or annual period beginning after December 15, 2011. The adoption of this guidance effective January 1, 2012 will not affect our financial position or results of operations, but may result in additional disclosures.
VALERO ENERGY CORPORATION AND SUBSIDIARIES
NOTES TO CONSOLIDATED FINANCIAL STATEMENTS (Continued)
Acquisitions of Refineries
The acquired refining and marketing businesses as discussed below involve the production and marketing of refined petroleum products. These acquisitions are consistent with our general business strategy and complement our existing refining and marketing network.
Meraux Acquisition
On October 1, 2011, we acquired the Meraux Refinery and related logistics assets from Murphy Oil Corporation for an initial payment of $586 million, which was funded from available cash. This acquisition is referred to as the Meraux Acquisition. The Meraux Refinery has a total throughput capacity of 135,000 barrels per day and is located in Meraux, Louisiana.
In the fourth quarter of 2011, we recorded an adjustment related to inventories acquired that reduced the purchase price to $547 million. The assets acquired and liabilities assumed in the Meraux Acquisition were recognized at their acquisition-date estimated fair values, pending the completion of an independent appraisal and other evaluations, and are as follows (in millions):
|
| | | |
| Inventories | $ | 219 |
|
| Property, plant and equipment | 320 |
|
| Deferred charges and other assets, net | 9 |
|
| Other long-term liabilities | (1 | ) |
| Purchase price | $ | 547 |
|
Pembroke Acquisition
On August 1, 2011, we acquired 100 percent of the outstanding shares of Chevron Limited from a subsidiary of Chevron Corporation (Chevron), and we subsequently changed the name of Chevron Limited to Valero Energy Ltd. Valero Energy Ltd owns and operates the Pembroke Refinery, which has a total throughput capacity of 270,000 barrels per day and is located in Wales, U.K. Valero Energy Ltd also owns, directly and through various subsidiaries, an extensive network of marketing and logistics assets throughout the U.K. and Ireland. On the acquisition date, we initially paid $1.8 billion from available cash, of which $1.1 billion was for working capital. Subsequent to the acquisition date, we recorded an adjustment to working capital (primarily inventory), resulting in an adjusted purchase price of $1.7 billion, as outlined below. This acquisition is referred to as the Pembroke Acquisition.
VALERO ENERGY CORPORATION AND SUBSIDIARIES
NOTES TO CONSOLIDATED FINANCIAL STATEMENTS (Continued)
The assets acquired and liabilities assumed in the Pembroke Acquisition were recognized at their acquisition-date estimated fair values, pending the completion of an independent appraisal and other evaluations, and are as follows (in millions):
|
| | | |
| Current assets, net of cash acquired | $ | 2,214 |
|
| Property, plant and equipment | 804 |
|
| Deferred charges and other assets, net | 32 |
|
| Intangible assets | 23 |
|
Current liabilities, less current portion of debt and capital lease obligations | (1,287 | ) |
| Debt and capital leases assumed, including current portion | (12 | ) |
| Other long-term liabilities | (78 | ) |
| Noncontrolling interests | (5 | ) |
| Purchase price, net of cash acquired | $ | 1,691 |
|
The acquired intangible assets are subject to amortization and have weighted-average useful lives of 10 years. These acquired intangible assets have been assigned to the intangible asset classes of trade names and supply agreements. These acquired intangible assets have no residual value.
In connection with the Pembroke Acquisition, we acquired an 85 percent interest in Mainline Pipelines Limited (MLP). MLP owns a pipeline that distributes refined products from the Pembroke Refinery to terminals in the U.K. In the fourth quarter of 2011, we acquired the remaining 15 percent interest in MLP.
Other Disclosures
In conjunction with the Meraux and Pembroke Acquisitions, neither goodwill nor a gain from a bargain purchase was recognized, and no significant contingent assets or liabilities were acquired or assumed.
The statement of income includes the results of operations of each of the acquisitions from the dates of their acquisition. Actual operating revenues, income from continuing operations, and acquisition-related costs associated with the Meraux and Pembroke Acquisitions included in our statement of income for the year ended December 31, 2011 were as follows (in millions):
|
| | | | | | | |
| | Meraux Acquisition | | Pembroke Acquisition |
| Operating revenues | $ | 1,343 |
| | $ | 7,522 |
|
| Loss from continuing operations | (74 | ) | | (10 | ) |
| Acquisition-related costs (included in general and administrative expenses) | 2 |
| | 27 |
|
The acquisition-related costs shown above are not included in the loss from continuing operations of the respective acquisitions.
VALERO ENERGY CORPORATION AND SUBSIDIARIES
NOTES TO CONSOLIDATED FINANCIAL STATEMENTS (Continued)
The following unaudited pro forma financial information (in millions, except per share amounts) presents our results assuming the Meraux and Pembroke Acquisitions occurred on January 1, 2010. The pro forma financial information is not necessarily indicative of the results of future operations.
|
| | | | | | | |
| | Year Ended December 31, |
| | 2011 | | 2010 |
| Operating revenues | $ | 142,109 |
| | $ | 99,824 |
|
Income from continuing operations attributable to Valero stockholders | 2,071 |
| | 953 |
|
Earnings per common share from continuing operations – basic | 3.66 |
| | 1.68 |
|
Earnings per common share from continuing operations – assuming dilution | 3.64 |
| | 1.68 |
|
Acquisitions of Ethanol Plants
The acquired ethanol businesses as discussed below involve the production and marketing of ethanol and its co-products, including distillers grains. The operations of our ethanol business complement our existing clean motor fuels business.
ASA and Renew Assets
In December 2009, we signed an agreement with ASA Ethanol Holdings, LLC (ASA) to buy two ethanol plants located in Linden, Indiana and Bloomingburg, Ohio and made a $20 million advance payment towards the acquisition of these plants. OnIn January 13, 2010, we completed the acquisition of these plants, including certain inventories, for total consideration of $202 million.
VALERO ENERGY CORPORATION AND SUBSIDIARIES
NOTES TO CONSOLIDATED FINANCIAL STATEMENTS (Continued)
Also in December 2009, we received approval from a bankruptcy court to acquire anone ethanol plant located near Jefferson, Wisconsin from Renew Energy LLC (Renew) and made a $1 million advance payment towards the acquisition of this plant. We completed the acquisition of this plant, including certain receivables and inventories, onin February 4, 2010 for total consideration of $79 million.
The assets acquired from ASA and Renew were recognized at acquisition-date fair values as determined by independent appraisals and other evaluations as follows (in millions):
| | | |
| Current assets, primarily inventory | $ | 11 | |
| Property, plant and equipment | 269 | |
| Identifiable intangible assets | 1 | |
| Total consideration | $ | 281 | |
Neither goodwill nor a gain from a bargain purchase was recognized in conjunction with the ASA and Renew acquisitions, and no contingent assets or liabilities were acquired or assumed. Because these acquisitions were not material to our results of operations, we have not presented pro forma results of operations for the years ended December 31, 2010 and 2009, or actual results of operations from the acquisition dates through December 31, 2010. The consolidated statement of income for the year ended December 31, 2010 includes the results of the ASA and Re new acquisitions from their acquisition dates in 2010.
VeraSun Assets
In the second quarter of 2009, we acquired seven ethanol plants and aone site under development from VeraSun Energy Corpor ation (VeraSun)Corporation for $556 million. The acquisition of these ethanol plants (referred to as the VeraSun Acquisition) was completed under three separate closing transactions. The ethanol plants are located in Charles City, Fort Dodge, Hartley, and Albert City, Iowa; Aurora, South Dakota; Welcome, Minnesota; Albion, Nebraska; and the site under development is located in Reynolds, Indiana.
Consideration for the VeraSun Acquisition was $477 million plus $79 million primarily for inventory and cer tain other working capital. We incurred approximately $10 million of acquisition-related costs that were recognized in general and administrative expenses in 2009. The acquisition was funded with part of the proceeds from a $1.0 billion issuance of notes in March 2009, which is discussed in Note 11.
The assets acquired and the liabilities assumed were recognized at their acquisition-date fair values as determined by an independent appraisal and other evaluations as follows (in millions):
| | | |
| Current assets, primarily inventory | $ | 77 | |
| Property, plant and equipment | 491 | |
| Identifiable intangible assets | 1 | |
| Current liabilities | (10 | ) |
| Other long-term liabilities | (3 | ) |
| Total consideration | $ | 556 | |
VALERO ENERGY CORPORATION AND SUBSIDIARIES
NOTES TO CONSOLIDATED FINANCIAL STATEMENTS (Continued)
Neither goodwill nor a gain from a bargain purchase was recognized in conjunction with the VeraSun Acquisition, and no contingent assets or liabilities were acquired or assumed.
The consolidated statements of income include the results of operations of the ethanol plants commencing on their closing dates in the second quarter of 2009. Actual and pro forma information related to the VeraSun Acquisition is presented below (in millions, except per share amounts). The pro forma information assumes the acquisition date had occurred as of January 1 of each respective year and that the purchase price was funded with proceeds from the issuance of $556 million of debt. The consolidated pro forma financ ial information is not necessarily indicative of the results of future operations.
| | | | | | | |
| | Year Ended |
| | December 31, |
| | 2009 | | 2008 |
Actual results of operations from acquired business from the closing dates through year end: | | | |
| Operating revenues | $ | 1,198 | | | N/A |
| Net income | 92 | | | N/A |
| | | | |
| Consolidated pro forma results of operations: | | | |
| Operating revenues | 64,822 | | | $ | 108,165 | |
| Loss from continuing operations | (279 | ) | | (1,252 | ) |
Loss per common share from continuing operations –
assuming dilution | (0.52 | ) | | (2.39 | ) |
Minor Acquisitions
In June 2009, we acquired the Trans-Texas Pipeline, the Wynnewood Pipeline, and their related tank and storage facilities from NuStar Logistics, L.P. for $29 million. These assets provide transportation and storage services for moving r efined products from our McKee Refinery to Mont Belvieu, Texas, and from our Ardmore Refinery to the Magellan pipeline system in the Midwest.
In August 2008, we acquired 70 convenience stores and fueling kiosks from Albertson’s LLC for $87 million, including $4 million for inventory. These retail sites, which are located i n Texas, Colorado, Arizona, and Louisiana, enhance our existing retail network and supply chain.
In February 2008, we acquired ConocoPhillips’ one-third undivided joint interest in a refined product pipeline and terminal for $57 million. These assets provide transportation and storage services for moving refined products from our McKee Refinery to markets in El Paso, Texas and Phoenix and Tucson, Arizona.
VALERO ENERGY CORPORATION AND SUBSIDIARIES
NOTES TO CONSOLIDATED FINANCIAL STATEMENTS (Continued)
Paulsboro Refinery
On In December 17, 2010,, we sold our Paulsboro Refinery to PBF Holding Company LLC (PBF Holding). Working capital, consisting primarily of inventory, was included as part of this transaction. The results of operations of the Paulsboro Refinery, including the loss on the sale discussed below, have been presented as discontinued operations for all years presented.
We received total proceeds of $707 million, including $361 million from the sale of working capital, resulting in a pre-tax loss of $980 million ($610 million after taxes). The loss includes a $50 million charge related to a LIFO inventory liquidation that resulted from the sale of inventory to PBF Holding and the effect of a $40 million accrual to settle differences between estimated and actual inventory volumes sold. The sale proceeds consisted of $547 million of cash and a $160 million note secured by the Paulsboro Refinery. The note matures in December 2011 and bears interest at LIBOR plus 700 basis points. PBF Holding has the option to extend the note for six months, however, the interest rate for the additional six months will be LIBOR plus 900 basis points.In February 2012, we received full payment on this note.
The following financial information summarizes the Paulsboro Refinery assets and liabilities sold on December 17, 2010 and the comparative amounts as of December 31, 2009 (in millions), which have been reclassified to assets held for sale and liabilities related to assets held for sale.
| | | | | | | |
| | December 17, 2010 | | December 31, 2009 |
| Current assets, primarily inventory | $ | 329 | | | $ | 289 | |
| Property, plant and equipment, net | 1,227 | | | 1,256 | |
| Deferred charges and other assets, net | 50 | | | 48 | |
| Assets held for sale | $ | 1,606 | | | $ | 1,593 | |
| | | | |
| Current liabilities | $ | 9 | | | $ | 33 | |
| Liabilities related to assets held for sale | $ | 9 | | | $ | 33 | |
ResultsSelected results of operations of the Paulsboro Refinery prior to its sale, excluding the loss on the sale in 2010, are shown below (in millions).
| | | | Year Ended December 31, | Year Ended December 31, |
| | 2010 | | 2009 | | 2008 | 2011 | | 2010 | | 2009 |
| Operating revenues | $ | 4,692 | | | $ | 3,545 | | | $ | 6,460 | | $ | — |
| | $ | 4,692 |
| | $ | 3,545 |
|
| Income (loss) before income taxes | (53 | ) | | (133 | ) | | (243 | ) | |
| Loss before income taxes | | (9 | ) | | (53 | ) | | (133 | ) |
Delaware City Refinery Assets and Associated Terminal and Pipeline Assets
OnIn November 20, 2009, we announced the permanent shutdown of our Delaware City Refinery, and we recorded a pre-tax loss of $1.9 billion, of which $1.4 billion represented the write-down of the book value of the refinery assets to net realizable value. The results of operations of the Delaware City Refinery have been presented as discontinued operations for all years presented because of the permanent shutdown of thepresented.
VALERO ENERGY CORPORATION AND SUBSIDIARIES
NOTE S TO CONSOLIDATED FINANCIAL STATEMENTS (Continued)
refinery. Certain terminal and pipeline assets previously associated with the refinery were not shut down and continued to be operated until the date of their sale. The results of their operations are reflected in continuing operations for all years presented due to our post-closing participation in the terminalling agreement described below.
On In June 1, 2010,, we sold the shutdown refinery assets and the terminal and pipeline assets to wholly owned subsidiaries of PBF Energy Partners LP (PBF) for $220 million of cash proceeds. The sale resulted in a gain of $92 million ($58 million after taxes) related to the shutdown refinery assets and a gain of $3 million related to the terminal and pipeline assets. The gain on the sale of the shutdown refinery assets primarily resulted from receiving proceeds related to the scrap value of the assets and the reversal of certain liabilities recorded in the fourth quarter of 2009 in connection associated with the shutdown of the refinery, which we will not incur because of the sale. This gain is presented in discontinued operations for the year ended December 31, 2010.2010.
The following financial information summarizes the Delaware City Refinery assets sold on June 1, 2010 and the comparative amounts as
| | | | | | | |
| | June 1,
2010 | | December 31, 2009 |
| Inventories | $ | 4 | | | $ | — | |
| Property, plant and equipment, net | | | |
| Refinery | 16 | | | 16 | |
| Terminal and pipeline | 140 | | | 141 | |
| Assets held for sale | $ | 160 | | | $ | 157 | |
VALERO ENERGY CORPORATION AND SUBSIDIARIES
NOTES TO CONSOLIDATED FINANCIAL STATEMENTS (Continued)
ResultsSelected results of operations of the Delaware City Refinery prior to its sale, excluding the gain on the sale in 2010 and the loss on the shut down of the refinery in 2009, are shown below (in millions).
| | | | | | | | | | | |
| | Year Ended December 31, |
| | 2010 | | 2009 | | 2008 |
| Operating revenues | $ | — | | | $ | 2,764 | | | $ | 5,978 | |
| Loss before income taxes | (29 | ) | | (769 | ) | | (190 | ) |
Krotz Springs Refinery
On July 1, 2008, we sold our Krotz Spring Refinery to Alon Refining Krotz Springs, Inc. (Alon), a subsidiary of Alon USA Energy, Inc. In addition, we sold working capital, consisting primarily of inventory, to Alon as part of this transaction. The nature and significance of our post-closing participation in an offtake agreement with Alon represented a continuation of activities with the Krotz Springs Refinery for accounting purposes, and as such the results of operations related to the Krotz Springs Refinery have not been presented as discontinued operations for the year ended December 31, 2008. Under the off take agreement, we agreed to (i) purchase all refined products from the Krotz Springs Refinery for three months after the effective date of the sale, (ii) purchase certain products for an additional one to five years after the expiration of the initial three-month period of the agreement, and (iii) provide certain refined products to Alon that are not produced at the Krotz Springs Refinery for an initial term of 15 months and thereafter until terminated by either party.
VALERO ENERGY CORPORATION AND SUBSIDIARIES
NOTES TO C ONSOLIDATED FINANCIAL STATEMENTS (Continued)
We received total cash proceeds, net of certain costs related to the sale, of $463 million, including approximately $135 million from the sale of working capital, resulting in a pre-tax gain of $305 million ($170 million afte r taxes).
In addition to the cash consideration received, we also received contingent consideration in the form of a three-year earn-out agreement based on certain product margins. This earn-out agreement qualified as a derivative contract and had a fair value of $171 million as of July 1, 2008. We hedged the risk of a decline in the referenced product margins by entering into certain commodity derivative contracts. On August 27, 2009, we settled the earn-out agreement with Alon for $35 million, of which $18 million was received on the settlement date and the remaining amount will be received in eight payments of $2.2 million each quarter beginning in the fourth quarter of 2009. In connection with the settlement of the earn-out agreement, we effectively closed our positions in the related commodity derivative contracts during the third quarter of 2009, and we locked in $175 millionof cash proceeds on those contracts, approximately $105 million of which was received as of December 31, 2009 with the remaining proceeds to be received in varying monthly amounts through July 2011. As such, the total amount earned on the Alon earn-out agreement, including the related commodity derivative contracts, was $210 million.
Financial information as of July 1, 200 8 related to the Krotz Springs Refinery assets and liabilities sold is summarized as follows (in millions):
| | | |
| Current assets, primarily inventory | $ | 138 | |
| Property, plant and equipment, net | 153 | |
| Goodwill | 42 | |
| Deferred charges and other assets, net | 4 | |
| Assets held for sale | $ | 337 | |
| | |
| Current liabilities | $ | 10 | |
| Liabilities related to assets held for sale | $ | 10 | |
|
| | | | | | | | | | | |
| | Year Ended December 31, |
| | 2011 | | 2010 | | 2009 |
| Operating revenues | $ | — |
| | $ | — |
| | $ | 2,764 |
|
| Loss before income taxes | (3 | ) | | (29 | ) | | (769 | ) |
Investment in CHOPSCameron Highway Oil Pipeline Company (CHOPS)
In November 2010, we sold our 50 percent interest in CHOPS to Genesis Energy, L.P. for total cash proceeds of $330 million. The sale resulted in a pre-tax gain of $55 million ($36 million after taxes), which is included in “other income, net” for the year ended December 31, 2010. CHOPS is a general partnership that operates a 390-mile crude oil pipeline, which delivers up to 500,000 barrels per day of crude oil from the Gulf of Mexico to major refining areas of Port Arthur and Texas City, Texas. Our investment in CHOPS was accounted for using the equity method and was included in “deferred charges and other assets, net” as of December 31, 2009.
VALERO ENERGY CORPORATION AND SUBSIDIARIES
NOTES TO CONSOLIDATED FINANCIAL STATEMENTS (Continued)
| |
| 4. | IMPAIRMENTSIMPAIRMENT ANALYSIS |
General
In late 2008, the U.S. and worldwide economies experienced severe disruptions in their capital and commodities markets that resultedresulting in a significant economic slowdown that persisted th roughout 2009. This slowdown negatively impacted refining industry fundamentals and the demand and pricesprice for our refined products. We responded toBecause of this negative economic environment and its impact, on our business by assessing the operating performance and profitability of our refining segment assets. This assessment led to our decisionwe decided to shut down our Aruba Refinery temporarily in July 2009,2009. We also decided to shut down our Delaware City Refinery permanently in late 2009 and ultimately sellsold that refinery in June 2010, and to sellwe sold our Paulsboro Refinery in December 2010, as discussed in Note 3. We alsoIn addition, we temporarily suspended construction activity on various capital projects and permanently cancelled other projects, as discussed below under “projects. These permanent cancellations resulted in asset impairment losses of C apital Projects.$2 million” The negative economic conditions also contributed to a significant decline in our common stock price in late 2008 and caused our equity market capitalization to fall significantly below our net book value. We determined that our goodwill was impaired,$222 million for the years ended December 31, 2010 and it was written off in 2008, as discussed below under “Goodwill.”2009, respectively.
Long-Lived Assets, Excluding Capital Projects
The U.S. and worldwide economies and refining industry fundamentals improved throughout 2010, and most of 2011, resulting in a significant improvement in the operating results of all of our refining segment assets. These improvements led to our decision to commence refinery-wide maintenance atrestart our temporarily shutdown Aruba Refinery duringand resume construction activities on the third quartermajority of 2010 to prepare the refinery’s production units for restart in January 2011; however,previously suspended capital projects. However, we evaluatedanalyzed our Aruba Refinery for potential impairment as of December 31, 20102011 because of its recent temporary shutdown, since July 2009its inability to generate positive cash flows on a sustained basis subsequent to its restart, and the sensitivity of its profitability to sour crude oil d ifferentials. Sour crude oil differentials, improvedwhich narrowed significantly in 2010 along with other refining industry fundamentals, but their improvement was less significant. the fourth quarter of 2011. In addition, we are exploring strategic alternatives for the refinery, including alternative feedstocks, configuration changes, and a temporary or permanent shutdown of the refinery facilities.
We considered all of these positive developmentsmatters in our impairment evaluationanalysis and concluded that our Aruba Refinery was not impaired as of December 31, 20102011. Our future cash flow estimates for the refinery are based on our expectation that sour crude oil differentialsrefining industry fundamentals will continue to improve in connection with an increase in the demand for refined products and the increased production of sour crude oils. Should differentialsproducts. However, should refining industry fundamentals fail to widen or failcontinue to widen to amounts experienced in prior years,improve, our future cash flow estimates will be negatively impacted andimpacted. In addition, as discussed above, we could ultimately determine thatare exploring strategic alternatives for the refinery is impaired. The Aruba Refinery had a net book valueand expect to conclude our evaluation of $980 million as of December 31, 2010; therefore, an impairment loss could be material to our results of operations.
Capital Projects
We have continually evaluated all of our capital projects classified as “construction in progress” since late 2008. These evaluations have led to the permanent cancellation of certain projects, resulting in write-offs of project costs and the recognition of asset impairment losses as shownthese strategic alternatives in the table below (in millions).
| | | | | | | | | | | |
| | Year Ended December 31, |
| | 2010 | | 2009 | | 2008 |
| Continuing operations | $ | 2 | | | $ |
222 | | | $ | 86
| Discontinued operations: | | | | | |
Delaware City Refinery | — | | | 377 | | | 17 | |
Paulsboro Refinery | — | | | 8 | | | — | |
Asset impairment loss | $ |
2 | | | $ | 607 | | | $ | 103 | | first quarter of 2012. A decision to temporarily or permanently shut down the refinery or a revision to
VALERO ENERGY CORPORATION AND SUBSIDIARIES
NOTES TO CONSOLIDATED FINANCIAL STATEMENTS (Continued)
In conjunction with our e valuation of capital projects, we suspended construction activity on various other projectsthe future operating plans for the refinery that results in 2009, including hydrocracker projects located at our St. Charles Refinery and our Port Arthur Refinery. Due to the improvementa decrease in refining industry fundamentals in 2010, we have decided to complete the hydrocrackers and other projects, and construction activity has commenced or is planned to commence in 2011.
Goodwill
As of December 31, 2007, we had $4.0 billion of goodwill, which was allocated among our Gulf Coast, Mid-Continent, Northeast, and West Coast reportin g units. As noted above, there were severe disruptionsfuture expected cash flows could result in the capital and commodities markets in late 2008 that contributed torefinery being impaired. The Aruba Refinery had a significant decline in our common stock price and caused our equity market capitalization to fall significantly below our net book value. As a result, we evaluated the potential impairmentvalue of our goodwill$958 million as of December 31, 20082011. For purposes of this evaluation, the fair value of each reporting unit was estimated based on the present value of expected future cash flows, with the present value determined using discount rates that reflected the risk inherent in the assets and risk premiums that reflected the volatility in the industry and the financial markets. Based on this analysis, we determined that all of the goodwill in our four reporting units was impaired, which resulted in the recognition of a goodwill; therefore, an impairment loss for t he year ended December 31, 2008 as follows (in millions):would be material to our results of operations.
| | | |
| Continuing operations | $ | 4,007 | |
| Discontinued operations: | |
| Delaware City Refinery | 41 | |
| Paulsboro Refinery | 21 | |
| Goodwill impairment loss | $ | 4,069 | |
VALERO ENERGY CORPORATION AND SUBSIDIARIES
NOTES TO CONSOLIDATED FINANCIAL STATEMENTS (Continued)
Receivables consisted of the following (in millions):
| | | | December 31, | December 31, |
| | 2010 | | 2009 | 2011 | | 2010 |
| Accounts receivable | $ | 4,299 | | | $ | 3,616 | | $ | 8,366 |
| | $ | 4,299 |
|
| Commodity derivative receivables | 144 | | | 183 | | 174 |
| | 144 |
|
| Notes receivable and other | 182 | | | 25 | | 214 |
| | 182 |
|
| | 4,625 | | | 3,824 | | 8,754 |
| | 4,625 |
|
| Allowance for doubtful accounts | (42 | ) | | (45 | ) | (48 | ) | | (42 | ) |
| Receivables, ne t | $ | 4,583 | | | $ | 3,779 | | |
| Receivables, net | | $ | 8,706 |
| | $ | 4,583 |
|
The changesNotes receivable primarily represent amounts due from PBF Holding related to the sale of the Paulsboro Refinery, the full payment of which was received in February 2012.
Changes in the allowance for doubtful accounts consisted of the following (in millions):
| | | | Year Ended December 31, | Year Ended December 31, |
| | 2010 | | 2009 | | 2008 | 2011 | | 2010 | | 2009 |
| Balance as of beginning of year | $ | 45 | | | $ | 58 | | | $ | 43 | | $ | 42 |
| | $ | 45 |
| | $ | 58 |
|
| Increase in allowance charged to expense | 14 | | | 28 | | | 43 | | 21 |
| | 14 |
| | 28 |
|
| Accounts charged against the allowance, net of recoveries | (17 | ) | | (42 | ) | | (27 | ) | (14 | ) | | (17 | ) | | (42 | ) |
| Foreign currency translation | — | | | 1 | | | (1 | ) | (1 | ) | | — |
| | 1 |
|
| Balance as of end of year | $ | 42 | | | $ | 45 | | | $ | 58 | | $ | 48 |
| | $ | 42 |
| | $ | 45 |
|
VALERO ENERGY CORPORATION AND SUBSIDIARIES
NOTES TO CONSOLIDATED FINANCIAL STATEMENTS (Continued)
Inventories consisted of the following (in millions):
| | | | December 31, | December 31, |
| | 2010 | | 2009 | 2011 | | 2010 |
| Refinery feedstocks | $ | 2,225 | | | $ | 2,004 | | $ | 2,474 |
| | $ | 2,225 |
|
| Refined products and blendstocks | 2,233 | | | 2,161 | | 2,633 |
| | 2,233 |
|
| Ethanol feedstocks and products | | 195 |
| | 201 |
|
| Convenience store merchandise | 101 | | | 96 | | 103 |
| | 101 |
|
| Materials and supplies | 187 | 218 |
| | 187 |
|
| Inventories | $ | 4,947 | | | $ | 4,578 | | $ | 5,623 |
| | $ | 4,947 |
|
During the years ended December 31, 2011, 2010, and 2009, we had net liquidations of LIFO inventory layers that were established in prior years, which decreased cost of sales in 2011 and 2010 by $247 million and $16 million, respectively, and increased cost of sales in 2009 by $66 million. There was no substantial liquida tion of LIFO inventory layers in 2008. The effect of the liquidation in 2010
VALERO ENERGY CORPORATION AND SUBSIDIARIES
NOTES TO CONSOLIDATED FINANCIAL STATEMENTS (Continued)
excludes the impact from the sale of inventory to PBF Holding in connection with the sale of our Paulsboro Refinery to PBF Holding. The effect of the 2010 liquidation attributable to the sale of that inventory increased the loss on the sale of the Paulsboro Refinery by $50 million ($31 million after taxes) as discussed in Note 3. and is reflected in discontinued operations.
As of December 31, 20102011and 20092010, the replacement cost (market value) of LIFO inventories exceeded their LIFO carrying amounts by approximately $6.16.8 billion and $4.56.1 billion, respectively.
VALERO ENERGY CORPORATION AND SUBSIDIARIES
NOTES TO CONSOLIDATED FINANCIAL STATEMENTS (Continued)
| |
| 7. | PROPERTY, PLANT AND EQUIPMENT |
Major classes of property, plant and equipment, which include capital lease assets, consisted of the following (in millions):
| | | | | | | | | |
| Estimated Useful Lives | | December 31, |
| | 2010 | |
2009 | Land | | | $ | 624 | | | $ | 604 | |
Crude oil processing facilities | 10 - 33 years | | 21,200 | | | 19,274 | |
Butane processing facilities | 30 years | | 246 | | | 246
| |
Pipeline and terminal facilities | 10 - 44 years | | 686 | | | 652 | |
Grain processing equipment | 22 years | | 656 | | | 399 | |
Retail facilities | 3 - 25 years | | 915 | | | 851 | |
Buildings | 13 - 44 years | | 1,067 | | | 1,010 | |
Other | 3 - 44 years | | 1,224 | | | 1,155 | |
Construction in progress | | | 2,303 | | | 2,694 | |
Property, plant and equipment, at cost | | | 28,921 | | | 26,885 | |
Accumulated depreciation | | | (6,252 | ) | | (5,270 | ) |
Property, plant and equipment, net | | | $ | 22,669 | | | $ | 21,615 | |
|
| | | | | | | | |
| | | December 31, |
| | | 2011 | | 2010 |
| Land | | $ | 722 |
| | $ | 624 |
|
| Crude oil processing facilities | | 23,322 |
| | 21,421 |
|
| Pipeline and terminal facilities | | 856 |
| | 709 |
|
| Grain processing equipment | | 673 |
| | 656 |
|
| Retail facilities | | 1,346 |
| | 1,277 |
|
| Administrative buildings | | 712 |
| | 705 |
|
| Other | | 1,290 |
| | 1,226 |
|
| Construction in progress | | 3,332 |
| | 2,303 |
|
| Property, plant and equipment, at cost | | 32,253 |
| | 28,921 |
|
| Accumulated depreciation | | (7,076 | ) | | (6,252 | ) |
| Property, plant and equipment, net | | $ | 25,177 |
| | $ | 22,669 |
|
We had crude oil processing facilities, pi pelinepipeline and terminal facilities, and certain buildings and other equipment under capital leases totaling $5977 million and $5559 million as of December 31, 20102011 and 20092010, respectively. Accumulated amortization on assets under capital leases was $2226 million and $1722 million, respectively, as of December 31, 20102011 and 20092010.
Depreciation expense for the years ended December 31, 20102011, 20092010, and 20082009 was$1.1 billion, $985 million, and $919 million, and $875 million, respectively.
VALERO ENERGY CORPORATION AND SUBSIDIARIES
NOTES TO CONSOLIDATED FINANCIAL STATEMENTS (Continued)
Intangible assets consisted of the following (in millions):
| | | | | | | | | | | | | | | |
| | December 31, 2010 | | December 31, 2009 |
| | Gross Cost | | Accumulated Amortization | | Gross Cost | | Accumulated Amortization |
| Intangible assets subject to amortization: | | | | | | | |
| Customer lists | $ | 121 | | | $ | (68 | ) | | $ | 114 | | | $ | (57 | ) |
| Canadian retail operations | 155 | | | (35 | ) | | 147 | | | (30 | ) |
| U.S. retail store operations | 65 | | | (54 | ) | | 78 | | | (64 | ) |
| Air emission credits | 68 | | | (38 | ) | | 62 | | | (34 | ) |
| Royalties and licenses | 25 | | | (15 | ) | | 25 | | | (14 | ) |
| Intangible assets subject to amortization | $ | 434 | | | $ | (210 | ) | | $ | 426 | | | $ | (199 | ) |
include trade names, customer lists, air emission credits, and various other agreements. All of our intangi bleintangible assets are subject to amortization. Intangible assets with finite useful lives are amortized on a straight-line basis over 2 to 40 years.basis. Amortization expense for intangible assets was $2218 million, $2522 million, and $3325 million for the years ended December 31, 20102011, 20092010, and 20082009, respectively. The estimated aggregate amortization expense for the years ending December 31,is expected to be 2011$20 million through December 31, 2015 is as follows (in millions):for each of the next five years.
| | | |
| | Amortization Expense |
| 2011 | $ | 17 | |
| 2012 | 17 | |
| 2013 | 17 | |
| 2014 | 17 | |
| 2015 | 17 | |
| |
| 9. | DEFERRED CHARGES AND OTHER ASSETS |
“Deferred charges and other assets, net” primarily includes refinery turnaround and catalyst costs, , which are deferred and amortized as discussed in Note 1. Amortization expense related to continuing operations for deferred refinery turnaround and catalyst costs was $383444 million, $404383 million, and $384404 million for the years ended December 31, 2011, 2010, and 2009, and 2008, respectively.
“Deferred charges and other assets, net” also included our equity investment in CHOPS, which was sold in November 2010 as discussed in Note 3.
VALERO ENERGY CORPORATION AND SUBSIDIARIES
NOTES TO CONSOLIDATED FINANCIAL STATEMENTS (Continued)
| |
| 10. | ACCRUED EXPENSES AND OTHER LONG-TERM LIABILITIES |
Accrued expenses and other long-term liabilities consisted of the following as of December 31 (in millions):
| | | | Accrued Expenses | | Other Long-Term Liabilities | Accrued Expenses | | Other Long-Term Liabilities |
| | 2010 | | 2009 | | 2010 | | 2009 | 2011 | | 2010 | | 2011 | | 2010 |
| Defined benefit plan liabilities (see Note 14) | $ | 54 | | | $ | 44 | | | $ | 636 | | | $ | 625 | | $ | 37 |
| | $ | 54 |
| | $ | 796 |
| | $ | 636 |
|
| Wage and other employee-related liabilities | 172 | | | 105 | | | 85 | | | 78 | | 259 |
| | 172 |
| | 79 |
| | 85 |
|
| Uncertain income tax position liabilities (see Note 16) | — | | | — | | | 343 | | | 481 | | — |
| | — |
| | 337 |
| | 343 |
|
| Other tax liabilities | — | | | — | | | 106 | | | 103 | | — |
| | — |
| | 103 |
| | 106 |
|
| Environmental liabilities | 40 | | | 41 | | | 228 | | | 238 | | 39 |
| | 40 |
| | 235 |
| | 228 |
|
| Accrued interest expense | 116 | | | 100 | | | — | | | — | | 108 |
| | 116 |
| | — |
| | — |
|
| Derivative liabil ities | 39 | | | 109 | | | — | | | — | | |
| Derivative liabilities | | 25 |
| | 39 |
| | — |
| | — |
|
| Insurance liabilities | — | | | — | | | 80 | | | 84 | | 13 |
| | 13 |
| | 79 |
| | 80 |
|
| Asset retirement obligations | 20 | | | 103 | | | 81 | | | 76 | | 6 |
| | 20 |
| | 81 |
| | 81 |
|
| Other | 149 | | | 139 | | | 208 | | | 184 | | 108 |
| | 136 |
| | 171 |
| | 208 |
|
| Accrued expenses and other long-term liabilities | $ | 590 | | | $ | 641 | | | $ | 1,767 | | | $ | 1,869 | | $ | 595 |
| | $ | 590 |
| | $ | 1,881 |
| | $ | 1,767 |
|
Environmental Liabilities
The table below reflects the changesChanges in our environmental liabilities were as follows (in millions):
| | | | Year Ended December 31, | Year Ended December 31, |
| | 2010 | | 2009 | | 2008 | 2011 | | 2010 | | 2009 |
| Balance as of beginning of year | $ | 279 | | | $ | 297 | | | $ | 285 | | $ | 268 |
| | $ | 279 |
| | $ | 297 |
|
| Pembroke Acquisition | | 30 |
| | — |
| | — |
|
| Additions to liability | 50 | | | 21 | | | 75 | | 18 |
| | 50 |
| | 21 |
|
| Reductions to liability | (21 | ) | | (5 | ) | | (3 | ) | (5 | ) | | (21 | ) | | (5 | ) |
| Payments, net of third-party recoveries | (42 | ) | | (40 | ) | | (51 | ) | (35 | ) | | (42 | ) | | (40 | ) |
| Foreign currency translation | 2 | | | 6 | | | (9 | ) | (2 | ) | | 2 |
| | 6 |
|
| Balance as of end of year | $ | 268 | | | $ | 279 | | | $ | 297 | | $ | 274 |
| | $ | 268 |
| | $ | 279 |
|
In connection with our various acquisitions, we assumed certain environmental liabilities including, but not limited to, certain remediation obligations, site restoration costs, and certain liabilities relating to soil and groundwater remediation. In addition, we have indemnified NuStar Energy L.P. for certainThere were no significant environmental liabilities related to assets we previously sold to NuStar Energy L.P. that were known onassumed in connection with the date the assets were sold or are discovered wit hin a specified number of years after the assets were sold and result from events occurring or conditions existing prior to the date of sale.
Meraux Acquisition.
VALERO ENERGY CORPORATION AND SUBSIDIARIES
NOTES TO CONSOLIDATED FINANCIAL STATEMENTS (Continued)
Asset Retire mentRetirement Obligations
We have asset retirement obligations with respect to certain of our refinery assets due to various legal obligations to clean and/or dispose of various component parts of each refinery at the time they are retired. However, these component parts can be used for extended and indeterminate periods of time as long as they are properly maintained and/or upgraded. It is our practice and current intent to maintain our refinery assets and continue making improvements to those assets based on technological advances. As a result, we believe that our refineries have indeterminate lives for purposes of estimating asset retirement obligations because dates or ranges of dates upon which we would retire refinery assets cannot reasonably be estimated at this time. When a date or range of dates can reasonably be estimated for the retirement of any component part of a refinery, we es timateestimate the cost of performing the retirement activities and record a liability for the fair value of that cost using established present value techniques.
We also have asset retirement obligations for the removal of underground storage tanks (USTs) for refined products at owned and leased retail locations. There is no legal obligation to remove USTs while they remain in service. However, environmental laws require that unused USTs be removed within certain periods of time after the USTs no longer remain in service, usually one to two years depending on the jurisdiction in which the USTs are located. We have estimated that USTs at our owned retail locations will not remain in service after 25 years of use and that we will have an obligation to remove those USTs at that time. For our leased retail locations, our lease agreements generally require that we remove certain improvements, primarily USTs and signage, upon termination of the lease. While our lease agreements typically contain options for multiple renewal periods, we have not assumed that such leases will be renewed for purposes of estimating our obligation to remove USTs and signage.
The table below reflects the changesChanges in our asset retirement obligations were as follows (in millions).
| | | | | | | | | | | |
| | Year Ended December 31, |
| | 2010 | | 2009 | | 2008 |
| Balance as of beginning of year | $ | 179 | | | $ | 72 | | | $ | 70 | |
| Additions to accrual | 3 | | | 98 | | | 4 | |
| Reductions to accrual | (34 | ) | | — | | | — | |
Accretion expense | 7 | | | 14 | | | 3 | |
Settlements | (54 | ) | | (5 | ) | | (4 | ) |
Foreign currency translation | — | | | — | | | (1 | ) |
Balance as | | | | | | | | | | | | | | | Year Ended December 31, | | | 2011 | | 2010 | | 2009 | | Balance as of beginning of year | $ | 101 |
| | $ | 179 |
| | $ | 72 |
| | Additions to accrual | 4 |
| | 3 |
| | 98 |
| | Reductions to accrual | — |
| | (34 | ) | | — |
| | Accretion expense | 4 |
| | 7 |
| | 14 |
| | Settlements | (22 | ) | | (54 | ) | | (5 | ) | | Balance as of end of year | $ | 87 |
| | $ | 101 |
| | $ | 179 |
|
There are no assets that are legally restricted for purposes of end of year | $ | 101 | | | $ | 179 | | | $ | 72 | |
settling our asset retirement obligations.
Other
Other tax liabilities relate primarily to contingent liabilities for transactional tax claims that are both probable and reasonably estimable.
VALERO ENERGY CORPORATION AND SUBSIDIARIES
NOTES TO CONS OLIDATEDCONSOLIDATED FINANCIAL STATEMENTS (Continued)
| |
| 11. | DEBT AND CAPITAL LEASE OBLIGATIONS |
Debt, at stated values, and capital lease obligations consisted of the following (in millions):
| | | | | | | | | |
| | Final Maturity | | December 31, |
| | | 2010 | | 2009 |
| Bank credit facilities | Various | | $ | — | | | $ | — | |
| Industrial revenue bonds: | | | | | |
| Tax-exempt Revenue Refunding Bonds: | | | | | |
| Series 1997A, 5.45% | 2027 | | 21 | | | 24 | |
| Series 1997B, 5.40% | 2018 | | 30 | | | 33 | |
| Series 1997C, 5.40% | 2018 | | 30 | | | 33 | |
| Tax-exempt Waste Disposal Revenue Bonds: | | | | | |
| Series 1997, 5.6% | 2031 | | 25 | | | 25 | |
| Series 1998, 5.6% | 2032 | | 25 | | | 25 | |
| Series 1999, 5.7% | 2032 | | 25 | | | 25 | |
| Series 2001, 6.65% | 2032 | | 19 | | | 19 | |
| 4.50% notes | 2015 | | 400 | | | — | |
| 4.75% notes | 2013 | | 300 | | | 300 | |
| 4.75% notes | 2014 | | 200 | | | 200 | |
| 6.125% notes | 2017 | | 750 | | | 750 | |
| 6.125% notes | 2020 | | 850 | | | — | |
| 6.625% notes | 2037 | | 1,500 | | | 1,500 | |
| 6.875% notes |
2012 | | 750 | | | 750 | | 7.50% notes | 2032 | | 750 | | | 750 | |
8.75% notes | 2030 | | 200 | | | 200 | |
Debentures: | | | | | |
7.25% | 2010 | | — | | | 25 | |
7.65% | 2026 | | 100 | | | 100 | |
8.75% | 2015 | | 75 | | | 75 | |
Senior Notes: | | | | | |
6.125% | 2011 | | 200 | | | 200 | |
6.70% | 2013 | | 180 | | | 180 | |
6.75% | 2011
| | 210 | | | 210 | |
6.75% | 2014 | | — | | | 185 | |
6.75% | 2037 | | 24 | | | 24 | |
7.20% | 2017 | | 200 | | | 200 | |
7.45% | 2097 | | 100 | | | 100 | |
7.50% | 2015 | | — | | | 287 | |
9.375% | 2019 | | 750 | | | 750 | |
10.50% | 2039 | | 250 | | | 250 | |
Gulf Opportunity Zone Revenue Bonds, Series 2010, variable rate | 2040 | | 300 | | | — | |
Accounts receivable sales facility | 2011 | | 100 | | | 200 | |
Net unamortized discount, including fair value adjustments | | | (64 | ) | | (56 | ) |
Total debt | | | 8,300 | | | 7,364 | |
Capital lease obligations, including unamortized fair value adjustments | | 37 | | | 36 | |
Total debt and capital lease obligations | & nbsp; | | 8,337 | | | 7,400 | |
Less current portion | | | (822 | ) | | (237 | ) |
Debt and capital lease obligations, less current portion | | | $ | 7,515 | | | $ | 7,163 | |
|
| | | | | | | | | |
| | Final Maturity | | December 31, |
| | | 2011 | | 2010 |
| Bank credit facilities | Various | | $ | — |
| | $ | — |
|
| Industrial revenue bonds: | | | | | |
| Tax-exempt Revenue Refunding Bonds: | | | | | |
| Series 1997A, 5.45% | 2027 | | 18 |
| | 21 |
|
| Series 1997B, 5.4% | 2018 | | — |
| | 30 |
|
| Series 1997C, 5.4% | 2018 | | — |
| | 30 |
|
| Tax-exempt Waste Disposal Revenue Bonds: | | | | | |
| Series 1997, 5.6% | 2031 | | 25 |
| | 25 |
|
| Series 1998, 5.6% | 2032 | | 25 |
| | 25 |
|
| Series 1999, 5.7% | 2032 | | 25 |
| | 25 |
|
| Series 2001, 6.65% | 2032 | | 19 |
| | 19 |
|
| 4.5% notes | 2015 | | 400 |
| | 400 |
|
| 4.75% notes | 2013 | | 300 |
| | 300 |
|
| 4.75% notes | 2014 | | 200 |
| | 200 |
|
| 6.125% notes | 2017 | | 750 |
| | 750 |
|
| 6.125% notes | 2020 | | 850 |
| | 850 |
|
| 6.625% notes | 2037 | | 1,500 |
| | 1,500 |
|
| 6.875% notes | 2012 | | 750 |
| | 750 |
|
| 7.5% notes | 2032 | | 750 |
| | 750 |
|
| 8.75% notes | 2030 | | 200 |
| | 200 |
|
| Debentures: | | | | | |
| 7.65% | 2026 | | 100 |
| | 100 |
|
| 8.75% | 2015 | | 75 |
| | 75 |
|
| Senior Notes: | | | | | |
| 6.125% | 2011 | | — |
| | 200 |
|
| 6.7% | 2013 | | 180 |
| | 180 |
|
| 6.75% | 2011 | | — |
| | 210 |
|
| 6.75% | 2037 | | 24 |
| | 24 |
|
| 7.2% | 2017 | | 200 |
| | 200 |
|
| 7.45% | 2097 | | 100 |
| | 100 |
|
| 9.375% | 2019 | | 750 |
| | 750 |
|
| 10.5% | 2039 | | 250 |
| | 250 |
|
| Gulf Opportunity Zone Revenue Bonds, Series 2010, variable rate | 2040 | | — |
| | 300 |
|
| Accounts receivable sales facility | 2012 | | 250 |
| | 100 |
|
| Net unamortized discount, including fair value adjustments | | | (51 | ) | | (64 | ) |
| Total debt | | | 7,690 |
| | 8,300 |
|
| Capital lease obligations, including unamortized fair value adjustments | | 51 |
| | 37 |
|
| Total debt and capital lease obligations | | | 7,741 |
| | 8,337 |
|
| Less current portion | | | (1,009 | ) | | (822 | ) |
| Debt and capital lease obligations, less current portion | | | $ | 6,732 |
| | $ | 7,515 |
|
VALERO ENERGY CORPORATION AND SUBSIDIARIES
NOTES TO CONSOLIDATED FINANCIAL ST ATEMENTSSTATEMENTS (Continued)
Bank Debt and Credit Facilities
We haveIn December 2011, we entered into a $2.43 billion revolving credit facility (the Revolver) that has aan initial maturity date of November 2012December 2016., which replaced our maturing $2.4 billion revolving credit facility. Borrowings under the Revolver bear interest at LIBOR plus a margin, or an alternate base rate as defined under the agreement.agreement, plus a margin. We are also charged various fees and expenses in connection with the Revolver, including facility fees and letter of credit fees. The interest rate and fees under the Revolver are subject to adjustment based upon the credit ratings assigned to our non-bank debt. The Revolver has certain restrictive covenants, including a maximum debt-to-capitalization ratio of 60 percent. As of December 31, 20102011 and 20092010, our debt-to-capitalization ratios, calculated in accordance with the terms of the Revolver, were 25.029 percent and 30.925 percent, respectively. We believe that we will remain in compliance with this covenant.
During the year ended December 31, 2010, we had no borrowings or repayments under our Revolver or other revolving bank credit facilities. During the years ended December 31, 2009 and 2008, we borrowed and repaid $39 million and $296 million, respectively, under the Revolver. As of December 31, 2010 and 2009, there were no borrowings outstanding under the Revolver and letters of credit outstanding under this committed facility totaled $399 million and $104 million, respectively.
In addition to the Revolver, one of our Canadian subsidiaries has a committed revolving credit facility under which it may borrow and obtain letters of credit up to Cdn. $C$115 million. As of
During the years ended December 31, 20102011 and 20092010, we had no borrowings outstandingor repayments under our Cana dianthe Revolver or the Canadian revolving credit facility and letters of credit issued under this credit facility totaled Cdn. $20 million and Cdn. $22 million, respectively. The Canadian credit facility has a maturity date offacility. During the year ended December 2012.
In June 201031, 2009, we entered into aborrowed and repaid one-year committed revolving letter of credit facility under which we may obtain letters of credit of up to $30039 million to support certain of our crude oil purchases. This agreement matures in June 2011. We are charged letter of credit issuance fees in connection with this letter ofunder the Revolver and had no borrowings or repayments under the Canadian revolving credit facility. As of December 31, 2010, we
We had$100 million of outstanding letters of credit issued under this revolving credit facility.
In December 2010, we entered into a short-termour committed revolving letterlines of credit facility under which we may obtain letters of credit of up to $350 million composed of a committed maximum amount of $200 million and an uncommitted maximum amount of $150 million to support certain of our crude oil purchases. The committed portion of this facility matures in June 2011, and the uncommitted portion of this facility may be terminated with a 60-day prior written notice. We are charged letter of credit issuance fees in connection with the committed portion of this letter of credit facility. As of December 31, 2010, we had no outstanding letters of credit issued under the committed and uncommitted portions of this revolving credit fa cility.as follows (in millions):
|
| | | | | | | | | | | | | | |
| | | | | | | Amounts Outstanding |
| | | Borrowing Capacity | | Expiration | | December 31, 2011 | | December 31, 2010 |
| Letter of credit facilities | | $ | 500 |
| | June 2012 | | $ | 300 |
| | $ | 100 |
|
| Revolver | | $ | 3,000 |
| | December 2016 | | $ | 119 |
| | $ | 399 |
|
| Canadian revolving credit facility | | C$ | 115 |
| | December 2012 | | C$ | 20 |
| | C$ | 20 |
|
We also have various other uncommitted short-term bank credit facilities. As of December 31, 20102011 and 20092010, we had no borrowings outstanding under our uncommitted short-term bank credit facilities; however, there were $176 million and $259 million, respectively, of letters of credit outstanding under such facilities of $391 million and $176 million, respectively, for which we are charged letter of credit issuance fees. The uncommitted credit facilities have no commitment fees or compensating balance requirements.
In connection with the Pembroke Acquisition, we assumed a €2.8 million short-term demand loan, which bore interest at EURIBOR plus a margin. We repaid this loan in full in November 2011.
84
;
VALERO ENERGY CORPORATION AND SUBSIDIARIES
NOTES TO CONSOLIDATED FINANCIAL STATEMENTS (Continued)
Non-Bank DebtOther Disclosures
In February 2008, we redeemed our 9.50% senior notes for $367 million, or 104.75% of stated value. These notes had a carrying amount of $381 million onconjunction with the date of redemption, resulting inMeraux and Pembroke Acquisitions, neither goodwill nor a gain from a bargain purchase was recognized, and no significant contingent assets or liabilities were acquired or assumed.
The statement of $14 million that wasincome includes the results of operations of each of the acquisitions from the dates of their acquisition. Actual operating revenues, income from continuing operations, and acquisition-related costs associated with the Meraux and Pembroke Acquisitions included in “otherour statement of income net.” In addition,for the year ended December 31, 2011 were as follows (in millions):
|
| | | | | | | |
| | Meraux Acquisition | | Pembroke Acquisition |
| Operating revenues | $ | 1,343 |
| | $ | 7,522 |
|
| Loss from continuing operations | (74 | ) | | (10 | ) |
| Acquisition-related costs (included in general and administrative expenses) | 2 |
| | 27 |
|
The acquisition-related costs shown above are not included in March 2008, we made a scheduled debt repayment of $7 million related to certain of our other debt.
In March 2009, we issued $750 million of 9.375% notes due March&n bsp;15, 2019 and $250 million of 10.5% notes due March 15, 2039. Proceedsthe loss from the issuance of these notes totaled $998 million, before deducting underwriting discounts and other issuance costs of $8 million.
In April 2009, we made scheduled debt repayments of $200 million related to our 3.5% notes and $9 million related to our 5.125% Series 1997D industrial revenue bonds.
In October 2009, we redeemed $76 million of our 6.75% senior notes with a maturity date of October 15, 2037 at 100% of stated value. As a result, a $6 million charge to write off a pro rata portioncontinuing operations of the related unamortized fair value adjustment was recognized in “other income, net.”
In February 2010, we issued $400 million of 4.50% notes due in February 2015 and $850 million of 6.125% notes due in February 2020. Proceeds from the issuance of these notes totaled $1.244 billion, before deducting underwriting discounts and other issuance costs of $10 million.
In March 2010, we redeemed our 7.50%senior notes with a maturity date of June 15, 2015 for $294 million, or 102.5% of stated value. These notes had a carrying amount of $296 million as of the redemption date, resulting in a $2 million gain that was included in “other income, net.”
In April 2010, we made scheduled debt repayments of $8 million related to our Series A 5.45%, Series B 5.40%, and Series C 5.40%industrial revenue bonds.
In May 2010, we redeemed our 6.75% senior notes with a maturity date of May 1, 2014 for $190 million, or 102.2 5% of stated value. These notes had a carrying amount of $187 million as of the redemption date, resulting in a $3 million loss that was included in “other income, net.”
In June 2010, we made scheduled debt repayments of $25 million related to our 7.25% debentures.
In December 2010, the Parish of St. Charles, State of Louisiana (Issuer) issued Gulf Opportunity Zone Revenue Bonds Series 2010 (GO Zone Bonds) totaling $300 million. The GO Zone Bonds initially bear interest at a weekly rate with interest payable monthly, commencing January 5, 2011. The GO Zone Bonds mature on December 1, 2040. Pursuant to a financing agreement, the Issuer lent the proceeds of the sale of the GO Zone Bonds to us to finance a portion of the construction costs of a hydrocracker project at our St. Charles Refinery. We received proceeds of $300 million, before deducting underwriting and issuance costs of $2 million. Under the financing agreement, we are obligated to pay the Issuer amounts sufficient for the Issuer to pay principal and interest on the GO Zone Bonds.
On February 1, 2011, we made a scheduled debt repayment of $210 million related to our 6.75% senior notes. On February 2, 2011, we paid $300 million to acquire the GO Zone Bonds, which were subject to mandatory tender on that date. We expect to hold the GO Zone Bonds for our own account until conditions permit the remarketing of these bonds at an interest rate acceptable to us.
respective acquisitions.
VALERO ENERGY CORPORATION AND SUBSIDIARIES
NOTES TO CONSOLIDATED FINANCIAL STATEMENTS (Continued)
Accounts Receivable Sales FacilityThe following unaudited pro forma financial information (in millions, except per share amounts) presents our results assuming the Meraux and Pembroke Acquisitions occurred on January 1, 2010. The pro forma financial information is not necessarily indicative of the results of future operations.
|
| | | | | | | |
| | Year Ended December 31, |
| | 2011 | | 2010 |
| Operating revenues | $ | 142,109 |
| | $ | 99,824 |
|
Income from continuing operations attributable to Valero stockholders | 2,071 |
| | 953 |
|
Earnings per common share from continuing operations – basic | 3.66 |
| | 1.68 |
|
Earnings per common share from continuing operations – assuming dilution | 3.64 |
| | 1.68 |
|
Acquisitions of Ethanol Plants
The acquired ethanol businesses as discussed below involve the production and marketing of ethanol and its co-products, including distillers grains. The operations of our ethanol business complement our existing clean motor fuels business.
ASA and Renew Assets
We haveIn December 2009, we signed an accounts receivable sales facilityagreement with ASA Ethanol Holdings, LLC to buy two ethanol plants located in Linden, Indiana and Bloomingburg, Ohio and made a group$20 million advance payment towards the acquisition of third-party entitiesthese plants. In January 2010, we completed the acquisition of these plants, including certain inventories, for total consideration of $202 million.
Also in December 2009, we received approval from a bankruptcy court to acquire one ethanol plant located near Jefferson, Wisconsin from Renew Energy LLC and financial institutions to sell onmade a revolving basis up to $1 billion of eligible trade receivables. In June 2010, we amended the agreement to extend the maturity date to June 2011. We use this program as a source of working capital funding. Under this program, one of our marketing subsidiaries (Valero Marketing) sells eligible receivables, without recourse, to another of our subsidiaries (Valero Capital), whereupon the receivables are no longer owned by Valero Marketing. Valero Capital, in turn, sells an undivided percentage ownership interest in the eligible receivables, without recourse, to the third-party entities and financial institutions. To the extent that Valero Capital retains an ownership interest in the receivables it has purchased from Valero Marketing, such interest is included in our consolidated financial statements solely as a result of the consolidation of the financial statements of Valero Capital with those of Valero Energy Corporation; the receivables are not available to satisfy the claims of the creditors of Valero Marketing or Valero Energy Corporation.
As of December 31, 2010 and 2009, $2.2 billion and $1.8 billion, respectively, of our accounts receivable composed the designated pool of accounts receivable included in the program. The amount of eligible receivables sold to the third-party entities and financial institutions was $100 million advance payment towards the acquisition of this plant. We completed the acquisition of this plant, including certain receivables and $200 million as of December 31,inventories, in February 2010 and 2009, respectively. Proceeds from the sale of receivables under this facility are reflected as debt. During the years ended December 31, 2010 and 2009, we sold additional eligible receivables under this program for total consideration of $1.2 billion79 million.
VeraSun Assets
In the second quarter of 2009, we acquired seven ethanol plants and one site under development from VeraSun Energy Corporation for $950556 million, respectively,. The ethanol plants are located in Charles City, Fort Dodge, Hartley, and repaid $1.3 billionAlbert City, Iowa; Aurora, South Dakota; Welcome, Minnesota; Albion, Nebraska; and $850 million, respectively.the site under development is located in Reynolds, Indiana.
We remain responsible for servicing the receivables sold to the third-party entities and financial institutions and pay certain fees related to our sale of receivables under the program. The costs we incurred related to this facility were $8 million, $8 million, and $6 million for the years ended December 31, 2010, 2009, and 2008, respectively. Proceeds from collections under this facility of $4.3 billion, $5.5 billion, and $3.3 billion for the years ended December 31, 2010, 2009, and 2008, respectively, were reinvested in the program by the third-party entities and financial institutions. However, the third-party entities’ and financial institutions’ interests in our accounts receivable were never in excess of the sales facility limits at any time under this program. No accounts receivable included in this program were written off during 2010, 2009, or 2008.
VALERO ENERGY CORPORATION AND SUBSIDIARIES
NOTES TO CONSOLIDATED FINANCIAL STATEMENTS (Continued)
Paulsboro Refinery
In December 2010, we sold our Paulsboro Refinery to PBF Holding Company LLC (PBF Holding). Working capital, consisting primarily of inventory, was included as part of this transaction. The results of operations of the Paulsboro Refinery, including the loss on the sale discussed below, have been presented as discontinued operations for all years presented.
We received total proceeds of $707 million, including $361 million from the sale of working capital, resulting in a pre-tax loss of $980 million ($610 million after taxes). The loss includes a $50 million charge related to a LIFO inventory liquidation that resulted from the sale of inventory to PBF Holding and the effect of a $40 million accrual to settle differences between estimated and actual inventory volumes sold. The sale proceeds consisted of $547 million of cash and a $160 million note secured by the Paulsboro Refinery. In February 2012, we received full payment on this note.
Selected results of operations of the Paulsboro Refinery prior to its sale, excluding the loss on the sale in 2010, are shown below (in millions).
|
| | | | | | | | | | | |
| | Year Ended December 31, |
| | 2011 | | 2010 | | 2009 |
| Operating revenues | $ | — |
| | $ | 4,692 |
| | $ | 3,545 |
|
| Loss before income taxes | (9 | ) | | (53 | ) | | (133 | ) |
Delaware City Refinery Assets and Associated Terminal and Pipeline Assets
In November 2009, we announced the permanent shutdown of our Delaware City Refinery, and we recorded a pre-tax loss of $1.9 billion, of which $1.4 billion represented the write-down of the book value of the refinery assets to net realizable value. The results of operations of the Delaware City Refinery have been presented as discontinued operations for all years presented.
In June 2010, we sold the shutdown refinery assets and the terminal and pipeline assets to wholly owned subsidiaries of PBF Energy Partners LP for $220 million of cash proceeds. The sale resulted in a gain of $92 million ($58 million after taxes) related to the shutdown refinery assets and a gain of $3 million related to the terminal and pipeline assets. The gain on the sale of the shutdown refinery assets primarily resulted from receiving proceeds related to the scrap value of the assets and the reversal of certain liabilities recorded in the fourth quarter of 2009 associated with the shutdown of the refinery, which we will not incur because of the sale. This gain is presented in discontinued operations for the year ended December 31, 2010.
VALERO ENERGY CORPORATION AND SUBSIDIARIES
NOTES TO CONSOLIDATED FINANCIAL STATEMENTS (Continued)
Selected results of operations of the Delaware City Refinery prior to its sale, excluding the gain on the sale in 2010 and the loss on the shut down of the refinery in 2009, are shown below (in millions).
|
| | | | | | | | | | | |
| | Year Ended December 31, |
| | 2011 | | 2010 | | 2009 |
| Operating revenues | $ | — |
| | $ | — |
| | $ | 2,764 |
|
| Loss before income taxes | (3 | ) | | (29 | ) | | (769 | ) |
Investment in Cameron Highway Oil Pipeline Company (CHOPS)
In November 2010, we sold our 50 percent interest in CHOPS to Genesis Energy, L.P. for total cash proceeds of $330 million. The sale resulted in a pre-tax gain of $55 million ($36 million after taxes), which is included in “other income, net” for the year ended December 31, 2010. CHOPS is a general partnership that operates a 390-mile pipeline, which delivers up to 500,000 barrels per day of crude oil from the Gulf of Mexico to major refining areas of Port Arthur and Texas City, Texas.
In late 2008, the U.S. and worldwide economies experienced severe disruptions in their capital and commodities markets resulting in a significant economic slowdown that negatively impacted refining industry fundamentals and the demand and price for our refined products. Because of this negative impact, we decided to shut down our Aruba Refinery temporarily in July 2009. We also decided to shut down our Delaware City Refinery permanently in late 2009 and ultimately sold that refinery in June 2010, and we sold our Paulsboro Refinery in December 2010, as discussed in Note 3. In addition, we temporarily suspended construction activity on various capital projects and permanently cancelled other projects. These permanent cancellations resulted in asset impairment losses of $2 million and $222 million for the years ended December 31, 2010 and 2009, respectively.
The U.S. and worldwide economies and refining industry fundamentals improved throughout 2010 and most of 2011, resulting in a significant improvement in the operating results of all of our refining segment assets. These improvements led to our decision to restart our Aruba Refinery and resume construction activities on the majority of the previously suspended capital projects. However, we analyzed our Aruba Refinery for potential impairment as of December 31, 2011 because of its recent temporary shutdown, its inability to generate positive cash flows on a sustained basis subsequent to its restart, and the sensitivity of its profitability to sour crude oil differentials, which narrowed significantly in the fourth quarter of 2011. In addition, we are exploring strategic alternatives for the refinery, including alternative feedstocks, configuration changes, and a temporary or permanent shutdown of the refinery facilities.
We considered all of these matters in our impairment analysis and concluded that our Aruba Refinery was not impaired as of December 31, 2011. Our future cash flow estimates for the refinery are based on our expectation that refining industry fundamentals will continue to improve in connection with an increase in the demand for refined products. However, should refining industry fundamentals fail to continue to improve, our future cash flow estimates will be negatively impacted. In addition, as discussed above, we are exploring strategic alternatives for the refinery and expect to conclude our evaluation of these strategic alternatives in the first quarter of 2012. A decision to temporarily or permanently shut down the refinery or a revision to
VALERO ENERGY CORPORATION AND SUBSIDIARIES
NOTES TO CONSOLIDATED FINANCIAL STATEMENTS (Continued)
the future operating plans for the refinery that results in a decrease in future expected cash flows could result in the refinery being impaired. The Aruba Refinery had a net book value of $958 million as of December 31, 2011; therefore, an impairment loss would be material to our results of operations.
Receivables consisted of the following (in millions):
|
| | | | | | | |
| | December 31, |
| | 2011 | | 2010 |
| Accounts receivable | $ | 8,366 |
| | $ | 4,299 |
|
| Commodity derivative receivables | 174 |
| | 144 |
|
| Notes receivable and other | 214 |
| | 182 |
|
| | 8,754 |
| | 4,625 |
|
| Allowance for doubtful accounts | (48 | ) | | (42 | ) |
| Receivables, net | $ | 8,706 |
| | $ | 4,583 |
|
Notes receivable primarily represent amounts due from PBF Holding related to the sale of the Paulsboro Refinery, the full payment of which was received in February 2012.
Changes in the allowance for doubtful accounts consisted of the following (in millions):
|
| | | | | | | | | | | |
| | Year Ended December 31, |
| | 2011 | | 2010 | | 2009 |
| Balance as of beginning of year | $ | 42 |
| | $ | 45 |
| | $ | 58 |
|
| Increase in allowance charged to expense | 21 |
| | 14 |
| | 28 |
|
Accounts charged against the allowance, net of recoveries | (14 | ) | | (17 | ) | | (42 | ) |
| Foreign currency translation | (1 | ) | | — |
| | 1 |
|
| Balance as of end of year | $ | 48 |
| | $ | 42 |
| | $ | 45 |
|
VALERO ENERGY CORPORATION AND SUBSIDIARIES
NOTES TO CONSOLIDATED FINANCIAL STATEMENTS (Continued)
Inventories consisted of the following (in millions):
|
| | | | | | | |
| | December 31, |
| | 2011 | | 2010 |
| Refinery feedstocks | $ | 2,474 |
| | $ | 2,225 |
|
| Refined products and blendstocks | 2,633 |
| | 2,233 |
|
| Ethanol feedstocks and products | 195 |
| | 201 |
|
| Convenience store merchandise | 103 |
| | 101 |
|
| Materials and supplies | 218 |
| | 187 |
|
| Inventories | $ | 5,623 |
| | $ | 4,947 |
|
During the years ended December 31, 2011, 2010, and 2009, we had net liquidations of LIFO inventory layers that were established in prior years, which decreased cost of sales in 2011 and 2010 by $247 million and $16 million, respectively, and increased cost of sales in 2009 by $66 million. The effect of the liquidation in 2010 excludes the impact from the sale of inventory in connection with the sale of our Paulsboro Refinery to PBF Holding. The effect of the 2010 liquidation attributable to the sale of that inventory increased the loss on the sale of the Paulsboro Refinery by $50 million ($31 million after taxes) as discussed in Note 3 and is reflected in discontinued operations.
As of December 31, 2011 and 2010, the replacement cost (market value) of LIFO inventories exceeded their LIFO carrying amounts by approximately $6.8 billion and $6.1 billion, respectively.
VALERO ENERGY CORPORATION AND SUBSIDIARIES
NOTES TO CONSOLIDATED FINANCIAL STATEMENTS (Continued)
| |
| 7. | PROPERTY, PLANT AND EQUIPMENT |
Major classes of property, plant and equipment, which include capital lease assets, consisted of the following (in millions):
|
| | | | | | | | |
| | | December 31, |
| | | 2011 | | 2010 |
| Land | | $ | 722 |
| | $ | 624 |
|
| Crude oil processing facilities | | 23,322 |
| | 21,421 |
|
| Pipeline and terminal facilities | | 856 |
| | 709 |
|
| Grain processing equipment | | 673 |
| | 656 |
|
| Retail facilities | | 1,346 |
| | 1,277 |
|
| Administrative buildings | | 712 |
| | 705 |
|
| Other | | 1,290 |
| | 1,226 |
|
| Construction in progress | | 3,332 |
| | 2,303 |
|
| Property, plant and equipment, at cost | | 32,253 |
| | 28,921 |
|
| Accumulated depreciation | | (7,076 | ) | | (6,252 | ) |
| Property, plant and equipment, net | | $ | 25,177 |
| | $ | 22,669 |
|
We had crude oil processing facilities, pipeline and terminal facilities, and certain buildings and other equipment under capital leases totaling $77 million and $59 million as of December 31, 2011 and 2010, respectively. Accumulated amortization on assets under capital leases was $26 million and $22 million, respectively, as of December 31, 2011 and 2010.
Depreciation expense for the years ended December 31, 2011, 2010, and 2009 was $1.1 billion, $985 million, and $919 million, respectively.
Intangible assets include trade names, customer lists, air emission credits, and various other agreements. All of our intangible assets are subject to amortization. Intangible assets with finite useful lives are amortized on a straight-line basis. Amortization expense for intangible assets was $18 million, $22 million, and $25 million for the years ended December 31, 2011, 2010, and 2009, respectively. The estimated aggregate amortization expense is expected to be $20 million for each of the next five years.
| |
| 9. | DEFERRED CHARGES AND OTHER ASSETS |
“Deferred charges and other assets, net” primarily includes turnaround and catalyst costs, which are deferred and amortized as discussed in Note 1. Amortization expense for deferred refinery turnaround and catalyst costs was $444 million, $383 million, and $404 million for the years ended December 31, 2011, 2010, and 2009, respectively.
VALERO ENERGY CORPORATION AND SUBSIDIARIES
NOTES TO CONSOLIDATED FINANCIAL STATEMENTS (Continued)
| |
| 10. | ACCRUED EXPENSES AND OTHER LONG-TERM LIABILITIES |
Accrued expenses and other long-term liabilities consisted of the following as of December 31 (in millions):
|
| | | | | | | | | | | | | | | |
| | Accrued Expenses | | Other Long-Term Liabilities |
| | 2011 | | 2010 | | 2011 | | 2010 |
| Defined benefit plan liabilities (see Note 14) | $ | 37 |
| | $ | 54 |
| | $ | 796 |
| | $ | 636 |
|
| Wage and other employee-related liabilities | 259 |
| | 172 |
| | 79 |
| | 85 |
|
| Uncertain income tax position liabilities (see Note 16) | — |
| | — |
| | 337 |
| | 343 |
|
| Other tax liabilities | — |
| | — |
| | 103 |
| | 106 |
|
| Environmental liabilities | 39 |
| | 40 |
| | 235 |
| | 228 |
|
| Accrued interest expense | 108 |
| | 116 |
| | — |
| | — |
|
| Derivative liabilities | 25 |
| | 39 |
| | — |
| | — |
|
| Insurance liabilities | 13 |
| | 13 |
| | 79 |
| | 80 |
|
| Asset retirement obligations | 6 |
| | 20 |
| | 81 |
| | 81 |
|
| Other | 108 |
| | 136 |
| | 171 |
| | 208 |
|
| Accrued expenses and other long-term liabilities | $ | 595 |
| | $ | 590 |
| | $ | 1,881 |
| | $ | 1,767 |
|
Environmental Liabilities
Changes in our environmental liabilities were as follows (in millions):
|
| | | | | | | | | | | |
| | Year Ended December 31, |
| | 2011 | | 2010 | | 2009 |
| Balance as of beginning of year | $ | 268 |
| | $ | 279 |
| | $ | 297 |
|
| Pembroke Acquisition | 30 |
| | — |
| | — |
|
| Additions to liability | 18 |
| | 50 |
| | 21 |
|
| Reductions to liability | (5 | ) | | (21 | ) | | (5 | ) |
| Payments, net of third-party recoveries | (35 | ) | | (42 | ) | | (40 | ) |
| Foreign currency translation | (2 | ) | | 2 |
| | 6 |
|
| Balance as of end of year | $ | 274 |
| | $ | 268 |
| | $ | 279 |
|
In connection with our various acquisitions, we assumed certain environmental liabilities including, but not limited to, certain remediation obligations, site restoration costs, and certain liabilities relating to soil and groundwater remediation. There were no significant environmental liabilities assumed in connection with the Meraux Acquisition.
VALERO ENERGY CORPORATION AND SUBSIDIARIES
NOTES TO CONSOLIDATED FINANCIAL STATEMENTS (Continued)
Asset Retirement Obligations
We have asset retirement obligations with respect to certain of our refinery assets due to various legal obligations to clean and/or dispose of various component parts of each refinery at the time they are retired. However, these component parts can be used for extended and indeterminate periods of time as long as they are properly maintained and/or upgraded. It is our practice and current intent to maintain our refinery assets and continue making improvements to those assets based on technological advances. As a result, we believe that our refineries have indeterminate lives for purposes of estimating asset retirement obligations because dates or ranges of dates upon which we would retire refinery assets cannot reasonably be estimated at this time. When a date or range of dates can reasonably be estimated for the retirement of any component part of a refinery, we estimate the cost of performing the retirement activities and record a liability for the fair value of that cost using established present value techniques.
We also have asset retirement obligations for the removal of underground storage tanks (USTs) for refined products at owned and leased retail locations. There is no legal obligation to remove USTs while they remain in service. However, environmental laws require that unused USTs be removed within certain periods of time after the USTs no longer remain in service, usually one to two years depending on the jurisdiction in which the USTs are located. We have estimated that USTs at our owned retail locations will not remain in service after 25 years of use and that we will have an obligation to remove those USTs at that time. For our leased retail locations, our lease agreements generally require that we remove certain improvements, primarily USTs and signage, upon termination of the lease. While our lease agreements typically contain options for multiple renewal periods, we have not assumed that such leases will be renewed for purposes of estimating our obligation to remove USTs and signage.
Changes in our asset retirement obligations were as follows (in millions).
|
| | | | | | | | | | | |
| | Year Ended December 31, |
| | 2011 | | 2010 | | 2009 |
| Balance as of beginning of year | $ | 101 |
| | $ | 179 |
| | $ | 72 |
|
| Additions to accrual | 4 |
| | 3 |
| | 98 |
|
| Reductions to accrual | — |
| | (34 | ) | | — |
|
| Accretion expense | 4 |
| | 7 |
| | 14 |
|
| Settlements | (22 | ) | | (54 | ) | | (5 | ) |
| Balance as of end of year | $ | 87 |
| | $ | 101 |
| | $ | 179 |
|
There are no assets that are legally restricted for purposes of settling our asset retirement obligations.
Other
Other tax liabilities relate primarily to contingent liabilities for transactional tax claims that are both probable and reasonably estimable.
VALERO ENERGY CORPORATION AND SUBSIDIARIES
NOTES TO CONSOLIDATED FINANCIAL STATEMENTS (Continued)
| |
| 11. | DEBT AND CAPITAL LEASE OBLIGATIONS |
Debt, at stated values, and capital lease obligations consisted of the following (in millions):
|
| | | | | | | | | |
| | Final Maturity | | December 31, |
| | | 2011 | | 2010 |
| Bank credit facilities | Various | | $ | — |
| | $ | — |
|
| Industrial revenue bonds: | | | | | |
| Tax-exempt Revenue Refunding Bonds: | | | | | |
| Series 1997A, 5.45% | 2027 | | 18 |
| | 21 |
|
| Series 1997B, 5.4% | 2018 | | — |
| | 30 |
|
| Series 1997C, 5.4% | 2018 | | — |
| | 30 |
|
| Tax-exempt Waste Disposal Revenue Bonds: | | | | | |
| Series 1997, 5.6% | 2031 | | 25 |
| | 25 |
|
| Series 1998, 5.6% | 2032 | | 25 |
| | 25 |
|
| Series 1999, 5.7% | 2032 | | 25 |
| | 25 |
|
| Series 2001, 6.65% | 2032 | | 19 |
| | 19 |
|
| 4.5% notes | 2015 | | 400 |
| | 400 |
|
| 4.75% notes | 2013 | | 300 |
| | 300 |
|
| 4.75% notes | 2014 | | 200 |
| | 200 |
|
| 6.125% notes | 2017 | | 750 |
| | 750 |
|
| 6.125% notes | 2020 | | 850 |
| | 850 |
|
| 6.625% notes | 2037 | | 1,500 |
| | 1,500 |
|
| 6.875% notes | 2012 | | 750 |
| | 750 |
|
| 7.5% notes | 2032 | | 750 |
| | 750 |
|
| 8.75% notes | 2030 | | 200 |
| | 200 |
|
| Debentures: | | | | | |
| 7.65% | 2026 | | 100 |
| | 100 |
|
| 8.75% | 2015 | | 75 |
| | 75 |
|
| Senior Notes: | | | | | |
| 6.125% | 2011 | | — |
| | 200 |
|
| 6.7% | 2013 | | 180 |
| | 180 |
|
| 6.75% | 2011 | | — |
| | 210 |
|
| 6.75% | 2037 | | 24 |
| | 24 |
|
| 7.2% | 2017 | | 200 |
| | 200 |
|
| 7.45% | 2097 | | 100 |
| | 100 |
|
| 9.375% | 2019 | | 750 |
| | 750 |
|
| 10.5% | 2039 | | 250 |
| | 250 |
|
| Gulf Opportunity Zone Revenue Bonds, Series 2010, variable rate | 2040 | | — |
| | 300 |
|
| Accounts receivable sales facility | 2012 | | 250 |
| | 100 |
|
| Net unamortized discount, including fair value adjustments | | | (51 | ) | | (64 | ) |
| Total debt | | | 7,690 |
| | 8,300 |
|
| Capital lease obligations, including unamortized fair value adjustments | | 51 |
| | 37 |
|
| Total debt and capital lease obligations | | | 7,741 |
| | 8,337 |
|
| Less current portion | | | (1,009 | ) | | (822 | ) |
| Debt and capital lease obligations, less current portion | | | $ | 6,732 |
| | $ | 7,515 |
|
VALERO ENERGY CORPORATION AND SUBSIDIARIES
NOTES TO CONSOLIDATED FINANCIAL STATEMENTS (Continued)
Bank Debt and Credit Facilities
In December 2011, we entered into a $3 billion revolving credit facility (the Revolver) that has an initial maturity date of December 2016, which replaced our maturing $2.4 billion revolving credit facility. Borrowings under the Revolver bear interest at LIBOR plus a margin, or an alternate base rate as defined under the agreement, plus a margin. We are also charged various fees and expenses in connection with the Revolver, including facility fees and letter of credit fees. The interest rate and fees under the Revolver are subject to adjustment based upon the credit ratings assigned to our non-bank debt. The Revolver has certain restrictive covenants, including a maximum debt-to-capitalization ratio of 60 percent. As of December 31, 2011 and 2010, our debt-to-capitalization ratios, calculated in accordance with the terms of the Revolver, were 29 percent and 25 percent, respectively. We believe that we will remain in compliance with this covenant.
In addition to the Revolver, one of our Canadian subsidiaries has a committed revolving credit facility under which it may borrow and obtain letters of credit up to C$115 million.
During the years ended December 31, 2011 and 2010, we had no borrowings or repayments under the Revolver or the Canadian revolving credit facility. During the year ended December 31, 2009, we borrowed and repaid $39 million under the Revolver and had no borrowings or repayments under the Canadian revolving credit facility.
We had outstanding letters of credit under our committed lines of credit as follows (in millions):
|
| | | | | | | | | | | | | | |
| | | | | | | Amounts Outstanding |
| | | Borrowing Capacity | | Expiration | | December 31, 2011 | | December 31, 2010 |
| Letter of credit facilities | | $ | 500 |
| | June 2012 | | $ | 300 |
| | $ | 100 |
|
| Revolver | | $ | 3,000 |
| | December 2016 | | $ | 119 |
| | $ | 399 |
|
| Canadian revolving credit facility | | C$ | 115 |
| | December 2012 | | C$ | 20 |
| | C$ | 20 |
|
We also have various other uncommitted short-term bank credit facilities. As of December 31, 2011 and 2010, we had no borrowings outstanding under our uncommitted short-term bank credit facilities; however, there were letters of credit outstanding under such facilities of $391 million and $176 million, respectively, for which we are charged letter of credit issuance fees. The uncommitted credit facilities have no commitment fees or compensating balance requirements.
In connection with the Pembroke Acquisition, we assumed a €2.8 million short-term demand loan, which bore interest at EURIBOR plus a margin. We repaid this loan in full in November 2011.
Other Disclosures
In conjunction with the Meraux and Pembroke Acquisitions, neither goodwill nor a gain from a bargain purchase was recognized, and no significant contingent assets or liabilities were acquired or assumed.
The statement of income includes the results of operations of each of the acquisitions from the dates of their acquisition. Actual operating revenues, income from continuing operations, and acquisition-related costs associated with the Meraux and Pembroke Acquisitions included in our statement of income for the year ended December 31, 2011 were as follows (in millions):
|
| | | | | | | |
| | Meraux Acquisition | | Pembroke Acquisition |
| Operating revenues | $ | 1,343 |
| | $ | 7,522 |
|
| Loss from continuing operations | (74 | ) | | (10 | ) |
| Acquisition-related costs (included in general and administrative expenses) | 2 |
| | 27 |
|
The acquisition-related costs shown above are not included in the loss from continuing operations of the respective acquisitions.
VALERO ENERGY CORPORATION AND SUBSIDIARIES
NOTES TO CONSOLIDATED FINANCIAL STATEMENTS (Continued)
The following unaudited pro forma financial information (in millions, except per share amounts) presents our results assuming the Meraux and Pembroke Acquisitions occurred on January 1, 2010. The pro forma financial information is not necessarily indicative of the results of future operations.
|
| | | | | | | |
| | Year Ended December 31, |
| | 2011 | | 2010 |
| Operating revenues | $ | 142,109 |
| | $ | 99,824 |
|
Income from continuing operations attributable to Valero stockholders | 2,071 |
| | 953 |
|
Earnings per common share from continuing operations – basic | 3.66 |
| | 1.68 |
|
Earnings per common share from continuing operations – assuming dilution | 3.64 |
| | 1.68 |
|
Acquisitions of Ethanol Plants
The acquired ethanol businesses as discussed below involve the production and marketing of ethanol and its co-products, including distillers grains. The operations of our ethanol business complement our existing clean motor fuels business.
ASA and Renew Assets
In December 2009, we signed an agreement with ASA Ethanol Holdings, LLC to buy two ethanol plants located in Linden, Indiana and Bloomingburg, Ohio and made a $20 million advance payment towards the acquisition of these plants. In January 2010, we completed the acquisition of these plants, including certain inventories, for total consideration of $202 million.
Also in December 2009, we received approval from a bankruptcy court to acquire one ethanol plant located near Jefferson, Wisconsin from Renew Energy LLC and made a $1 million advance payment towards the acquisition of this plant. We completed the acquisition of this plant, including certain receivables and inventories, in February 2010 for total consideration of $79 million.
VeraSun Assets
In the second quarter of 2009, we acquired seven ethanol plants and one site under development from VeraSun Energy Corporation for $556 million. The ethanol plants are located in Charles City, Fort Dodge, Hartley, and Albert City, Iowa; Aurora, South Dakota; Welcome, Minnesota; Albion, Nebraska; and the site under development is located in Reynolds, Indiana.
VALERO ENERGY CORPORATION AND SUBSIDIARIES
NOTES TO CONSOLIDATED FINANCIAL STATEMENTS (Continued)
Paulsboro Refinery
In December 2010, we sold our Paulsboro Refinery to PBF Holding Company LLC (PBF Holding). Working capital, consisting primarily of inventory, was included as part of this transaction. The results of operations of the Paulsboro Refinery, including the loss on the sale discussed below, have been presented as discontinued operations for all years presented.
We received total proceeds of $707 million, including $361 million from the sale of working capital, resulting in a pre-tax loss of $980 million ($610 million after taxes). The loss includes a $50 million charge related to a LIFO inventory liquidation that resulted from the sale of inventory to PBF Holding and the effect of a $40 million accrual to settle differences between estimated and actual inventory volumes sold. The sale proceeds consisted of $547 million of cash and a $160 million note secured by the Paulsboro Refinery. In February 2012, we received full payment on this note.
Selected results of operations of the Paulsboro Refinery prior to its sale, excluding the loss on the sale in 2010, are shown below (in millions).
|
| | | | | | | | | | | |
| | Year Ended December 31, |
| | 2011 | | 2010 | | 2009 |
| Operating revenues | $ | — |
| | $ | 4,692 |
| | $ | 3,545 |
|
| Loss before income taxes | (9 | ) | | (53 | ) | | (133 | ) |
Delaware City Refinery Assets and Associated Terminal and Pipeline Assets
In November 2009, we announced the permanent shutdown of our Delaware City Refinery, and we recorded a pre-tax loss of $1.9 billion, of which $1.4 billion represented the write-down of the book value of the refinery assets to net realizable value. The results of operations of the Delaware City Refinery have been presented as discontinued operations for all years presented.
In June 2010, we sold the shutdown refinery assets and the terminal and pipeline assets to wholly owned subsidiaries of PBF Energy Partners LP for $220 million of cash proceeds. The sale resulted in a gain of $92 million ($58 million after taxes) related to the shutdown refinery assets and a gain of $3 million related to the terminal and pipeline assets. The gain on the sale of the shutdown refinery assets primarily resulted from receiving proceeds related to the scrap value of the assets and the reversal of certain liabilities recorded in the fourth quarter of 2009 associated with the shutdown of the refinery, which we will not incur because of the sale. This gain is presented in discontinued operations for the year ended December 31, 2010.
VALERO ENERGY CORPORATION AND SUBSIDIARIES
NOTES TO CONSOLIDATED FINANCIAL STATEMENTS (Continued)
Selected results of operations of the Delaware City Refinery prior to its sale, excluding the gain on the sale in 2010 and the loss on the shut down of the refinery in 2009, are shown below (in millions).
|
| | | | | | | | | | | |
| | Year Ended December 31, |
| | 2011 | | 2010 | | 2009 |
| Operating revenues | $ | — |
| | $ | — |
| | $ | 2,764 |
|
| Loss before income taxes | (3 | ) | | (29 | ) | | (769 | ) |
Investment in Cameron Highway Oil Pipeline Company (CHOPS)
In November 2010, we sold our 50 percent interest in CHOPS to Genesis Energy, L.P. for total cash proceeds of $330 million. The sale resulted in a pre-tax gain of $55 million ($36 million after taxes), which is included in “other income, net” for the year ended December 31, 2010. CHOPS is a general partnership that operates a 390-mile pipeline, which delivers up to 500,000 barrels per day of crude oil from the Gulf of Mexico to major refining areas of Port Arthur and Texas City, Texas.
In late 2008, the U.S. and worldwide economies experienced severe disruptions in their capital and commodities markets resulting in a significant economic slowdown that negatively impacted refining industry fundamentals and the demand and price for our refined products. Because of this negative impact, we decided to shut down our Aruba Refinery temporarily in July 2009. We also decided to shut down our Delaware City Refinery permanently in late 2009 and ultimately sold that refinery in June 2010, and we sold our Paulsboro Refinery in December 2010, as discussed in Note 3. In addition, we temporarily suspended construction activity on various capital projects and permanently cancelled other projects. These permanent cancellations resulted in asset impairment losses of $2 million and $222 million for the years ended December 31, 2010 and 2009, respectively.
The U.S. and worldwide economies and refining industry fundamentals improved throughout 2010 and most of 2011, resulting in a significant improvement in the operating results of all of our refining segment assets. These improvements led to our decision to restart our Aruba Refinery and resume construction activities on the majority of the previously suspended capital projects. However, we analyzed our Aruba Refinery for potential impairment as of December 31, 2011 because of its recent temporary shutdown, its inability to generate positive cash flows on a sustained basis subsequent to its restart, and the sensitivity of its profitability to sour crude oil differentials, which narrowed significantly in the fourth quarter of 2011. In addition, we are exploring strategic alternatives for the refinery, including alternative feedstocks, configuration changes, and a temporary or permanent shutdown of the refinery facilities.
We considered all of these matters in our impairment analysis and concluded that our Aruba Refinery was not impaired as of December 31, 2011. Our future cash flow estimates for the refinery are based on our expectation that refining industry fundamentals will continue to improve in connection with an increase in the demand for refined products. However, should refining industry fundamentals fail to continue to improve, our future cash flow estimates will be negatively impacted. In addition, as discussed above, we are exploring strategic alternatives for the refinery and expect to conclude our evaluation of these strategic alternatives in the first quarter of 2012. A decision to temporarily or permanently shut down the refinery or a revision to
VALERO ENERGY CORPORATION AND SUBSIDIARIES
NOTES TO CONSOLIDATED FINANCIAL STATEMENTS (Continued)
the future operating plans for the refinery that results in a decrease in future expected cash flows could result in the refinery being impaired. The Aruba Refinery had a net book value of $958 million as of December 31, 2011; therefore, an impairment loss would be material to our results of operations.
Receivables consisted of the following (in millions):
|
| | | | | | | |
| | December 31, |
| | 2011 | | 2010 |
| Accounts receivable | $ | 8,366 |
| | $ | 4,299 |
|
| Commodity derivative receivables | 174 |
| | 144 |
|
| Notes receivable and other | 214 |
| | 182 |
|
| | 8,754 |
| | 4,625 |
|
| Allowance for doubtful accounts | (48 | ) | | (42 | ) |
| Receivables, net | $ | 8,706 |
| | $ | 4,583 |
|
Notes receivable primarily represent amounts due from PBF Holding related to the sale of the Paulsboro Refinery, the full payment of which was received in February 2012.
Changes in the allowance for doubtful accounts consisted of the following (in millions):
|
| | | | | | | | | | | |
| | Year Ended December 31, |
| | 2011 | | 2010 | | 2009 |
| Balance as of beginning of year | $ | 42 |
| | $ | 45 |
| | $ | 58 |
|
| Increase in allowance charged to expense | 21 |
| | 14 |
| | 28 |
|
Accounts charged against the allowance, net of recoveries | (14 | ) | | (17 | ) | | (42 | ) |
| Foreign currency translation | (1 | ) | | — |
| | 1 |
|
| Balance as of end of year | $ | 48 |
| | $ | 42 |
| | $ | 45 |
|
VALERO ENERGY CORPORATION AND SUBSIDIARIES
NOTES TO CONSOLIDATED FINANCIAL STATEMENTS (Continued)
Inventories consisted of the following (in millions):
|
| | | | | | | |
| | December 31, |
| | 2011 | | 2010 |
| Refinery feedstocks | $ | 2,474 |
| | $ | 2,225 |
|
| Refined products and blendstocks | 2,633 |
| | 2,233 |
|
| Ethanol feedstocks and products | 195 |
| | 201 |
|
| Convenience store merchandise | 103 |
| | 101 |
|
| Materials and supplies | 218 |
| | 187 |
|
| Inventories | $ | 5,623 |
| | $ | 4,947 |
|
During the years ended December 31, 2011, 2010, and 2009, we had net liquidations of LIFO inventory layers that were established in prior years, which decreased cost of sales in 2011 and 2010 by $247 million and $16 million, respectively, and increased cost of sales in 2009 by $66 million. The effect of the liquidation in 2010 excludes the impact from the sale of inventory in connection with the sale of our Paulsboro Refinery to PBF Holding. The effect of the 2010 liquidation attributable to the sale of that inventory increased the loss on the sale of the Paulsboro Refinery by $50 million ($31 million after taxes) as discussed in Note 3 and is reflected in discontinued operations.
As of December 31, 2011 and 2010, the replacement cost (market value) of LIFO inventories exceeded their LIFO carrying amounts by approximately $6.8 billion and $6.1 billion, respectively.
VALERO ENERGY CORPORATION AND SUBSIDIARIES
NOTES TO CONSOLIDATED FINANCIAL STATEMENTS (Continued)
| |
| 7. | PROPERTY, PLANT AND EQUIPMENT |
Major classes of property, plant and equipment, which include capital lease assets, consisted of the following (in millions):
|
| | | | | | | | |
| | | December 31, |
| | | 2011 | | 2010 |
| Land | | $ | 722 |
| | $ | 624 |
|
| Crude oil processing facilities | | 23,322 |
| | 21,421 |
|
| Pipeline and terminal facilities | | 856 |
| | 709 |
|
| Grain processing equipment | | 673 |
| | 656 |
|
| Retail facilities | | 1,346 |
| | 1,277 |
|
| Administrative buildings | | 712 |
| | 705 |
|
| Other | | 1,290 |
| | 1,226 |
|
| Construction in progress | | 3,332 |
| | 2,303 |
|
| Property, plant and equipment, at cost | | 32,253 |
| | 28,921 |
|
| Accumulated depreciation | | (7,076 | ) | | (6,252 | ) |
| Property, plant and equipment, net | | $ | 25,177 |
| | $ | 22,669 |
|
We had crude oil processing facilities, pipeline and terminal facilities, and certain buildings and other equipment under capital leases totaling $77 million and $59 million as of December 31, 2011 and 2010, respectively. Accumulated amortization on assets under capital leases was $26 million and $22 million, respectively, as of December 31, 2011 and 2010.
Depreciation expense for the years ended December 31, 2011, 2010, and 2009 was $1.1 billion, $985 million, and $919 million, respectively.
Intangible assets include trade names, customer lists, air emission credits, and various other agreements. All of our intangible assets are subject to amortization. Intangible assets with finite useful lives are amortized on a straight-line basis. Amortization expense for intangible assets was $18 million, $22 million, and $25 million for the years ended December 31, 2011, 2010, and 2009, respectively. The estimated aggregate amortization expense is expected to be $20 million for each of the next five years.
| |
| 9. | DEFERRED CHARGES AND OTHER ASSETS |
“Deferred charges and other assets, net” primarily includes turnaround and catalyst costs, which are deferred and amortized as discussed in Note 1. Amortization expense for deferred refinery turnaround and catalyst costs was $444 million, $383 million, and $404 million for the years ended December 31, 2011, 2010, and 2009, respectively.
VALERO ENERGY CORPORATION AND SUBSIDIARIES
NOTES TO CONSOLIDATED FINANCIAL STATEMENTS (Continued)
| |
| 10. | ACCRUED EXPENSES AND OTHER LONG-TERM LIABILITIES |
Accrued expenses and other long-term liabilities consisted of the following as of December 31 (in millions):
|
| | | | | | | | | | | | | | | |
| | Accrued Expenses | | Other Long-Term Liabilities |
| | 2011 | | 2010 | | 2011 | | 2010 |
| Defined benefit plan liabilities (see Note 14) | $ | 37 |
| | $ | 54 |
| | $ | 796 |
| | $ | 636 |
|
| Wage and other employee-related liabilities | 259 |
| | 172 |
| | 79 |
| | 85 |
|
| Uncertain income tax position liabilities (see Note 16) | — |
| | — |
| | 337 |
| | 343 |
|
| Other tax liabilities | — |
| | — |
| | 103 |
| | 106 |
|
| Environmental liabilities | 39 |
| | 40 |
| | 235 |
| | 228 |
|
| Accrued interest expense | 108 |
| | 116 |
| | — |
| | — |
|
| Derivative liabilities | 25 |
| | 39 |
| | — |
| | — |
|
| Insurance liabilities | 13 |
| | 13 |
| | 79 |
| | 80 |
|
| Asset retirement obligations | 6 |
| | 20 |
| | 81 |
| | 81 |
|
| Other | 108 |
| | 136 |
| | 171 |
| | 208 |
|
| Accrued expenses and other long-term liabilities | $ | 595 |
| | $ | 590 |
| | $ | 1,881 |
| | $ | 1,767 |
|
Environmental Liabilities
Changes in our environmental liabilities were as follows (in millions):
|
| | | | | | | | | | | |
| | Year Ended December 31, |
| | 2011 | | 2010 | | 2009 |
| Balance as of beginning of year | $ | 268 |
| | $ | 279 |
| | $ | 297 |
|
| Pembroke Acquisition | 30 |
| | — |
| | — |
|
| Additions to liability | 18 |
| | 50 |
| | 21 |
|
| Reductions to liability | (5 | ) | | (21 | ) | | (5 | ) |
| Payments, net of third-party recoveries | (35 | ) | | (42 | ) | | (40 | ) |
| Foreign currency translation | (2 | ) | | 2 |
| | 6 |
|
| Balance as of end of year | $ | 274 |
| | $ | 268 |
| | $ | 279 |
|
In connection with our various acquisitions, we assumed certain environmental liabilities including, but not limited to, certain remediation obligations, site restoration costs, and certain liabilities relating to soil and groundwater remediation. There were no significant environmental liabilities assumed in connection with the Meraux Acquisition.
VALERO ENERGY CORPORATION AND SUBSIDIARIES
NOTES TO CONSOLIDATED FINANCIAL STATEMENTS (Continued)
Asset Retirement Obligations
We have asset retirement obligations with respect to certain of our refinery assets due to various legal obligations to clean and/or dispose of various component parts of each refinery at the time they are retired. However, these component parts can be used for extended and indeterminate periods of time as long as they are properly maintained and/or upgraded. It is our practice and current intent to maintain our refinery assets and continue making improvements to those assets based on technological advances. As a result, we believe that our refineries have indeterminate lives for purposes of estimating asset retirement obligations because dates or ranges of dates upon which we would retire refinery assets cannot reasonably be estimated at this time. When a date or range of dates can reasonably be estimated for the retirement of any component part of a refinery, we estimate the cost of performing the retirement activities and record a liability for the fair value of that cost using established present value techniques.
We also have asset retirement obligations for the removal of underground storage tanks (USTs) for refined products at owned and leased retail locations. There is no legal obligation to remove USTs while they remain in service. However, environmental laws require that unused USTs be removed within certain periods of time after the USTs no longer remain in service, usually one to two years depending on the jurisdiction in which the USTs are located. We have estimated that USTs at our owned retail locations will not remain in service after 25 years of use and that we will have an obligation to remove those USTs at that time. For our leased retail locations, our lease agreements generally require that we remove certain improvements, primarily USTs and signage, upon termination of the lease. While our lease agreements typically contain options for multiple renewal periods, we have not assumed that such leases will be renewed for purposes of estimating our obligation to remove USTs and signage.
Changes in our asset retirement obligations were as follows (in millions).
|
| | | | | | | | | | | |
| | Year Ended December 31, |
| | 2011 | | 2010 | | 2009 |
| Balance as of beginning of year | $ | 101 |
| | $ | 179 |
| | $ | 72 |
|
| Additions to accrual | 4 |
| | 3 |
| | 98 |
|
| Reductions to accrual | — |
| | (34 | ) | | — |
|
| Accretion expense | 4 |
| | 7 |
| | 14 |
|
| Settlements | (22 | ) | | (54 | ) | | (5 | ) |
| Balance as of end of year | $ | 87 |
| | $ | 101 |
| | $ | 179 |
|
There are no assets that are legally restricted for purposes of settling our asset retirement obligations.
Other
Other tax liabilities relate primarily to contingent liabilities for transactional tax claims that are both probable and reasonably estimable.
VALERO ENERGY CORPORATION AND SUBSIDIARIES
NOTES TO CONSOLIDATED FINANCIAL STATEMENTS (Continued)
| |
| 11. | DEBT AND CAPITAL LEASE OBLIGATIONS |
Debt, at stated values, and capital lease obligations consisted of the following (in millions):
|
| | | | | | | | | |
| | Final Maturity | | December 31, |
| | | 2011 | | 2010 |
| Bank credit facilities | Various | | $ | — |
| | $ | — |
|
| Industrial revenue bonds: | | | | | |
| Tax-exempt Revenue Refunding Bonds: | | | | | |
| Series 1997A, 5.45% | 2027 | | 18 |
| | 21 |
|
| Series 1997B, 5.4% | 2018 | | — |
| | 30 |
|
| Series 1997C, 5.4% | 2018 | | — |
| | 30 |
|
| Tax-exempt Waste Disposal Revenue Bonds: | | | | | |
| Series 1997, 5.6% | 2031 | | 25 |
| | 25 |
|
| Series 1998, 5.6% | 2032 | | 25 |
| | 25 |
|
| Series 1999, 5.7% | 2032 | | 25 |
| | 25 |
|
| Series 2001, 6.65% | 2032 | | 19 |
| | 19 |
|
| 4.5% notes | 2015 | | 400 |
| | 400 |
|
| 4.75% notes | 2013 | | 300 |
| | 300 |
|
| 4.75% notes | 2014 | | 200 |
| | 200 |
|
| 6.125% notes | 2017 | | 750 |
| | 750 |
|
| 6.125% notes | 2020 | | 850 |
| | 850 |
|
| 6.625% notes | 2037 | | 1,500 |
| | 1,500 |
|
| 6.875% notes | 2012 | | 750 |
| | 750 |
|
| 7.5% notes | 2032 | | 750 |
| | 750 |
|
| 8.75% notes | 2030 | | 200 |
| | 200 |
|
| Debentures: | | | | | |
| 7.65% | 2026 | | 100 |
| | 100 |
|
| 8.75% | 2015 | | 75 |
| | 75 |
|
| Senior Notes: | | | | | |
| 6.125% | 2011 | | — |
| | 200 |
|
| 6.7% | 2013 | | 180 |
| | 180 |
|
| 6.75% | 2011 | | — |
| | 210 |
|
| 6.75% | 2037 | | 24 |
| | 24 |
|
| 7.2% | 2017 | | 200 |
| | 200 |
|
| 7.45% | 2097 | | 100 |
| | 100 |
|
| 9.375% | 2019 | | 750 |
| | 750 |
|
| 10.5% | 2039 | | 250 |
| | 250 |
|
| Gulf Opportunity Zone Revenue Bonds, Series 2010, variable rate | 2040 | | — |
| | 300 |
|
| Accounts receivable sales facility | 2012 | | 250 |
| | 100 |
|
| Net unamortized discount, including fair value adjustments | | | (51 | ) | | (64 | ) |
| Total debt | | | 7,690 |
| | 8,300 |
|
| Capital lease obligations, including unamortized fair value adjustments | | 51 |
| | 37 |
|
| Total debt and capital lease obligations | | | 7,741 |
| | 8,337 |
|
| Less current portion | | | (1,009 | ) | | (822 | ) |
| Debt and capital lease obligations, less current portion | | | $ | 6,732 |
| | $ | 7,515 |
|
VALERO ENERGY CORPORATION AND SUBSIDIARIES
NOTES TO CONSOLIDATED FINANCIAL STATEMENTS (Continued)
Bank Debt and Credit Facilities
In December 2011, we entered into a $3 billion revolving credit facility (the Revolver) that has an initial maturity date of December 2016, which replaced our maturing $2.4 billion revolving credit facility. Borrowings under the Revolver bear interest at LIBOR plus a margin, or an alternate base rate as defined under the agreement, plus a margin. We are also charged various fees and expenses in connection with the Revolver, including facility fees and letter of credit fees. The interest rate and fees under the Revolver are subject to adjustment based upon the credit ratings assigned to our non-bank debt. The Revolver has certain restrictive covenants, including a maximum debt-to-capitalization ratio of 60 percent. As of December 31, 2011 and 2010, our debt-to-capitalization ratios, calculated in accordance with the terms of the Revolver, were 29 percent and 25 percent, respectively. We believe that we will remain in compliance with this covenant.
In addition to the Revolver, one of our Canadian subsidiaries has a committed revolving credit facility under which it may borrow and obtain letters of credit up to C$115 million.
During the years ended December 31, 2011 and 2010, we had no borrowings or repayments under the Revolver or the Canadian revolving credit facility. During the year ended December 31, 2009, we borrowed and repaid $39 million under the Revolver and had no borrowings or repayments under the Canadian revolving credit facility.
We had outstanding letters of credit under our committed lines of credit as follows (in millions):
|
| | | | | | | | | | | | | | |
| | | | | | | Amounts Outstanding |
| | | Borrowing Capacity | | Expiration | | December 31, 2011 | | December 31, 2010 |
| Letter of credit facilities | | $ | 500 |
| | June 2012 | | $ | 300 |
| | $ | 100 |
|
| Revolver | | $ | 3,000 |
| | December 2016 | | $ | 119 |
| | $ | 399 |
|
| Canadian revolving credit facility | | C$ | 115 |
| | December 2012 | | C$ | 20 |
| | C$ | 20 |
|
We also have various other uncommitted short-term bank credit facilities. As of December 31, 2011 and 2010, we had no borrowings outstanding under our uncommitted short-term bank credit facilities; however, there were letters of credit outstanding under such facilities of $391 million and $176 million, respectively, for which we are charged letter of credit issuance fees. The uncommitted credit facilities have no commitment fees or compensating balance requirements.
In connection with the Pembroke Acquisition, we assumed a €2.8 million short-term demand loan, which bore interest at EURIBOR plus a margin. We repaid this loan in full in November 2011.
Non-Bank Debt
During the year ended December 31, 2011, the following activity occurred:
in December 2011, we redeemed our Series 1997B 5.4% and Series 1997C 5.4% industrial revenue bonds for $56 million, or 100% of their stated values;
in May 2011, we made a scheduled debt repayment of $200 million related to our 6.125% senior notes;
in April 2011, we made scheduled debt repayments of $8 million related to our Series 1997A 5.45%, Series 1997B 5.4%, and Series 1997C 5.4% industrial revenue bonds;
in February 2011, we made a scheduled debt repayment of $210 million related to our 6.75% senior
VALERO ENERGY CORPORATION AND SUBSIDIARIES
NOTES TO CONSOLIDATED FINANCIAL STATEMENTS (Continued)
notes; and
in February 2011, we paid $300 million to acquire the Gulf Opportunity Zone Revenue Bonds Series 2010 (GO Zone Bonds), which were subject to mandatory tender. We expect to hold the GO Zone Bonds for our own account until conditions permit the remarketing of these bonds at an interest rate acceptable to us.
During the year ended December 31, 2010, the following activity occurred:
in December 2010, the Parish of St. Charles, State of Louisiana (Issuer) issued GO Zone Bonds totaling $300 million, with a maturity date of December 1, 2040. The GO Zone Bonds initially bore interest at a weekly rate with interest payable monthly, commencing January 5, 2011. Pursuant to a financing agreement, the Issuer lent the proceeds of the sale of the GO Zone Bonds to us to finance a portion of the construction costs of a hydrocracker project at our St. Charles Refinery. We received proceeds of $300 million. Under the financing agreement, we were obligated to pay the Issuer amounts sufficient for the Issuer to pay principal and interest on the GO Zone Bonds;
in June 2010, we made a scheduled debt repayment of $25 million related to our 7.25% debentures;
in May 2010, we redeemed our 6.75% senior notes with a maturity date of May 1, 2014 for $190 million, or 102.25% of stated value;
in April 2010, we made scheduled debt repayments of $8 million related to our Series 1997A 5.45%, Series 1997B 5.4%, and Series 1997C 5.4% industrial revenue bonds;
in March 2010, we redeemed our 7.5% senior notes with a maturity date of June 15, 2015 for $294 million, or 102.5% of stated value, and
in February 2010, we issued $400 million of 4.5% notes due February 1, 2015 and $850 million of 6.125% notes due in February 1, 2020 for total net proceeds of $1.2 billion.
During the year ended December 31, 2009, the following activity occurred:
in October 2009, we redeemed $76 million of our 6.75% senior notes with a maturity date of October 15, 2037 at 100% of stated value;
in April 2009, we made scheduled debt repayments of $200 million related to our 3.5% notes and $9 million related to our 5.125% Series 1997D industrial revenue bonds; and
in March 2009, we issued $750 million of 9.375% notes due March 15, 2019 and $250 million of 10.5% notes due March 15, 2039. Proceeds from the issuance of these notes totaled $998 million.
Accounts Receivable Sales Facility
We have an accounts receivable sales facility with a group of third-party entities and financial institutions to sell on a revolving basis up to $1 billion of eligible trade receivables. We amended our agreement in June 2011 to extend the maturity date to June 2012. Under this program, one of our marketing subsidiaries (Valero Marketing) sells eligible receivables, without recourse, to another of our subsidiaries (Valero Capital), whereupon the receivables are no longer owned by Valero Marketing. Valero Capital, in turn, sells an undivided percentage ownership interest in the eligible receivables, without recourse, to the third-party entities and financial institutions. To the extent that Valero Capital retains an ownership interest in the receivables it has purchased from Valero Marketing, such interest is included in our financial statements solely as a result of the consolidation of the financial statements of Valero Capital with those of Valero Energy Corporation; the receivables are not available to satisfy the claims of the creditors of Valero Marketing or Valero Energy Corporation.
VALERO ENERGY CORPORATION AND SUBSIDIARIES
NOTES TO CONSOLIDATED FINANCIAL STATEMENTS (Continued)
As of December 31, 2011 and 2010, $3.3 billion and $2.2 billion, respectively, of our accounts receivable composed the designated pool of accounts receivable included in the program. All amounts outstanding under the accounts receivable sales facility are reflected as debt on our balance sheets and proceeds and repayments are reflected as cash flows from financing activities on the statements of cash flows. Changes in the amounts outstanding under our accounts receivable sales facility were as follows (in millions):
|
| | | | | | | | | | | |
| | Year Ended December 31, |
| | 2011 | | 2010 | | 2009 |
| Balance as of beginning of year | $ | 100 |
| | $ | 200 |
| | $ | 100 |
|
| Proceeds from the sale of receivables | 150 |
| | 1,225 |
| | 950 |
|
| Repayments | — |
| | (1,325 | ) | | (850 | ) |
| Balance as of end of year | $ | 250 |
| | $ | 100 |
| | $ | 200 |
|
Capitalized Interest
For the years ended December 31, 2011, 2010, and 2009, capitalized interest was $152 million, $90 million, and $105 million, respectively.
Other Disclosures
In addition to the maximum debt-to-capitalization ratio applicable to the Revolver discussed above under ““Bank Credit Facilities,”” our bank credit facilities and other debt arrangements contain various customary restrictive covenants, including cross-default and cro ss-accelerationcross-acceleration clauses.
Principal payments on our debt obligations and future minimum rentals on capital lease obligations as of December 31, 20102011 were as follows (in millions):
| | | | | | | |
| | Debt | | Capital Lease Obligations |
| 2011 | $ | 818 | | | $ | 7 | |
| 2012 | 759 | | | 6 | |
| 2013 | 489 | | | 6 | |
| 2014 | 209 | | | 5 | |
| 2015 | 484 | | | 5 | |
| Thereafter | 5,605 | | | 18 | |
Net unamortized discount and fair value adjustments | (64 | ) | | — | |
| Less interest expense | — | | | (10 | ) |
Total | $ | 8,300 | | | $ | 37 | |
As of December 31, 2010 and 2009, the estimated fair value of our debt, including current portion, was as follows (in millions):
| | | | | | | |
| | December 31, |
| | 2010 | | 2009 |
| Carrying amount | $ | 8,300 | | | $ | 7,364 | |
| Fair value | 9,492 | | | 8,228 | |
The carrying amount of our debt is the amount of debt that is reflected on our consolidated balance sheets. The fair value of that debt is based on quoted prices in active markets or quoted prices for debt of other companies with similar credit ratings, interest rates, and terms.
&nb sp; |
| | | | | | | |
| |
Debt | | Capital Lease Obligations |
| 2012 | $ | 1,004 |
| | $ | 11 |
|
| 2013 | 484 |
| | 10 |
|
| 2014 | 200 |
| | 9 |
|
| 2015 | 475 |
| | 8 |
|
| 2016 | — |
| | 8 |
|
| Thereafter | 5,578 |
| | 37 |
|
Net unamortized discount and fair value adjustments | (51 | ) | | — |
|
| Less interest expense | — |
| | (32 | ) |
| Total | $ | 7,690 |
| | $ | 51 |
|
VALERO ENERGY CORPORATION AND SUBSIDIARIES
NOTES TO CONSOLIDATED FINANCIAL STATEMENTS (Continued)
| |
| 12. | COMMITMENTS AND CONTINGENCIES |
Operating Leases
We have long-term operating lease commitments for land, office facilities, retail facilities and related equipment, transportation equipment, time charters for ocean-going tankers and coastal vessels, dock facilities, and various facilities and equipment used in the storage, transportation, production, and sale of refinery feedstocks, refined product and corn inventories.
Certain leases for processing equipment and feedstock and refined product storage facilities provide for various contingent payments based on, among other things, throughput volumes in excess of a base amount. Certain leases for vessels contain renewal options and escalation claus es,clauses, which vary by charter, and provisions for the payment of chartering fees, which either vary based on usage or provide for payments, in addition to established minimums, that are contingent on usage. Leases for convenience stores may also include provisions for contingent rental payments based on sales volumes. In most cases, we expect that in the normal course of business, our leases will be renewed or replaced by other leases.
As of December 31, 20102011, our future minimum rentals and minimum rentals to be received under subleases for leases having initial or remaining noncancelable lease terms in excess of one year were as reflected in the following tablefollows (in millions):
| | 2011 | $ | 353 | | |
| | 2012 | 237 | | $ | 291 |
|
| 2013 | 160 | | 198 |
|
| 2014 | 104 | | 131 |
|
| 2015 | 85 | | 106 |
|
| 2016 | | 86 |
|
| Thereafter | 324 | | 294 |
|
| Total minimum rental payments | 1,263 | | 1,106 |
|
Less minimum rentals to be received under subleases | (15 | ) | (41 | ) |
| Net minimum rental payments | $ | 1,248 | | $ | 1,065 |
|
Rental expense was as follows (in millions):
| | | | Year Ended December 31, | Year Ended December 31, |
| | 2010 | | 2009 | | 2008 | 2011 | | 2010 | | 2009 |
| Minimum rental expense | $ | 485 | | | $ | 519 | | | $ | 500 | | $ | 523 |
| | $ | 485 |
| | $ | 519 |
|
| Contingent rental expense | 23 | | | 21 | | | 23 | | 23 |
| | 23 |
| | 21 |
|
| Total rental expense | 508 | | | 540 | | | 523 | | 546 |
| | 508 |
| | 540 |
|
| Less sublease rental income | (3 | ) | | (4 | ) | | (4 | ) | (2 | ) | | (3 | ) | | (4 | ) |
| Net rental expense | $ | 505 | | | $ | 536 | | | $ | 519 | | $ | 544 |
| | $ | 505 |
| | $ | 536 |
|
VALERO ENERGY CORPORATION AND SUBSIDIARIES
NOTES TO CONSOLIDATED FINANCIAL STATEMENTS (Continued)
Other Commitments
We have various purchase obligations under certain industrial gas and chemical supply arrangements (such as hydrogen supply arrangements), crude oil and other feedstock supply arrangements, and various throughput and terminalling agreements. We enter into these contracts to ensure an adequate supply of utilities and feedstock and adequate storage capacity to operate our refineries. Substantially all of our purchase obligations are based on market prices or adjustments based on market indices. Certain of these purchase obligations include fixed or minimum volume requirements, while others are based on our usage requirements. None of these obligations are associated with suppliers’ financing arrangements. These purchase obligations are not reflected as liabilities.
Environmental Matters
While debate continues in the U.S. Congress regarding greenhouse gas legislation, the regulation of greenhouse gases at the federal level has now shifted to theThe U.S. Environmental Protection Agency (EPA), which began regulating greenhouse gases on January 2, 2011, under the Clean Air Act Amendments of 1990 (Clean Air Act). According to statements by the EPA, anyAny new construction or material expansions will require that, among other things, a greenhouse gas permit be issued at either or both the state or federal level in accordance with the Clean Air Act and regulations, and we will be required to undertake a technology review to determine appropriate controls to be implemented with the project in order to reduce greenhouse gas emissions. The determination willwould be on a case by case basis, and the EPA has provided only genera lgeneral guidance on which controls will be required.
Furthermore, the EPA is currently developing refinery-specific greenhouse gas regulations and performance standards that are expected to impose, on new and existing operations, greenhouse gas emission limits and/or technology requirements. These control requirements may affect a wide range of refinery operations but have not yet been delineated. Any such controls, however, could result in material increased compliance costs, additional operating restrictions for our business, and an increase in the cost of the products we produce, which could have a material adverse effect on our financial position, results of operations, and liquidity.
In addition, certainCertain states and foreign governments have pursued independent regulation of greenhouse gases atindependent of the state level.EPA. For example, the California Global Warming Solutions Act, also known as AB 32, directs the California Air Resources Board (CARB) to develop and issue regulations to reduce greenhouse gas emissions in California to 1990 levels by 2020. The CARB has issued a variety of regulations aimed at reaching this goal, including a Low Carbon F uelFuel Standard (LCFS) as well as a state-widestatewide cap-and-trade program.
The LCFS iswas scheduled to become effective in 2011, with small reductions inbut recent rulings by the carbon intensityU.S. District Court have stayed enforcement of transportation fuels sold in California. The mandated reductions in carbon intensity are scheduledthe LCFS until certain legal challenges to increase through 2020, after which another step-change in reductions is anticipated. Thethe LCFS is designed to encourage substitution of traditional petroleum fuels, and, over time, it is anticipatedhave been resolved. Most notably, the court determined that the LCFS will leadviolates the Commerce Clause of the U.S. Constitution to a greater usethe extent that the standard discriminates against out-of-state crude oils and corn ethanol. CARB has appealed the lower court’s ruling to the U.S. Court of electric cars and alternative fuels, such as E85, as companies seek to generate more credits to offset petroleum fuels. The state-wideAppeals for the Ninth Circuit.
| |
| ▪ | As initially designed, the LCFS called for initially small reductions in the carbon intensity of transportation fuels sold in California. The mandated reductions in carbon intensity were thereafter scheduled to increase through 2020, after which another step-change in reductions is anticipated. |
| |
| ▪ | CARB designed the LCFS to encourage substitution of traditional petroleum fuels, and, over time, lead to greater use of electric cars and alternative fuels, such as E85, as companies seek to generate more credits to offset petroleum fuels. |
A California statewide cap-and-trade program will begin in 2012.2013. Initially, the program will apply only to stationary sources of greenhouse gases (e.g.(e.g., refinery and power plant greenhouse gas
VALERO ENERGY CORPORATION AND SUBSIDIARIES
NOTES TO CONSOLIDATED FINANCIAL STATEMENTS (Continued)
emissions). Greenhouse gas emissions from fuels that we sell in California will be covered by t hethe program beginning in 2015. We anticipate that free allocations of credits will be available in the early years of the program, but we expect that compliance costs will be significant, particularlyincrease significantly beginning in 2015, when transportation fuels are included in the program.
Complying with AB 32, including the LCFS and the cap-and-trade program, could result in material increased compliance costs for us, increased capital expenditures, increased operating costs, and additional operating restrictions for our business, resulting in an increase in the cost of, and decreases in the demand for, the products we produce. To the degree we are unable to recover these increased costs, these matters could have a material adverse effect on our financial position, results of operations, and liquidity.
In January 2012, CARB adopted amendments to its Clean Fuels Outlet (CFO) Regulation. CARB states that the CFO Regulation is intended to provide outlets of clean fuel to meet the needs of alternative fuel vehicles. The regulation would require major refiners and importers of gasoline, including Valero, to install clean fuel outlets at five percent of California’s retail stations for hydrogen fueling and electric vehicle charging. We expect this regulation to be challenged, but we could be required to make significant capital expenditures if the regulation is implemented as presently adopted.
89
TableThe EPA has disapproved certain permitting programs of Contentsthe Texas Commission on Environmental Quality (TCEQ) that historically have streamlined the environmental permitting process in Texas. For example, the EPA has disapproved the TCEQ pollution control standard permit, thus requiring conventional permitting for future pollution control equipment. Litigation is pending from industry groups and others against the EPA for each of these actions. The EPA has also objected to numerous Title V permits in Texas and other states, including permits at our Port Arthur, Corpus Christi East, and McKee Refineries. Environmental activist groups have filed a notice of intent to sue the EPA, seeking to require the EPA to assume control of these permits from the TCEQ. All of these developments have created substantial uncertainty regarding existing and future permitting. Because of this uncertainty, we are unable to determine the costs or effects of the EPA’s actions on our permitting activity. But the EPA’s disruption of the Texas permitting system could result in material increased compliance costs for us, increased capital expenditures, increased operating costs, and additional operating restrictions for our business, resulting in an increase in the cost of, and decreases in the demand for, the products we produce, which could have a material adverse effect on our financial position, results of operations, and liquidity.
VALERO ENERGY CORPORATION AND SUBSIDIARIES
NOTES TO CONSOLIDATED FINANCIAL STATEMENTS (Continued)
Tax Matters
We are subject to extensive tax liabilities imposed by multiple jurisdictions, including federal, state, and foreign income taxes, and transactional taxes such as excise,(excise/duty, sales/use, and value-added taxes), payroll taxes, franchise taxes, withholding taxes, and ad valorem taxes. New tax laws and regulations and changes in existing tax laws and regulations are continuously being enacted or proposed that could result in increased expenditures for tax liabilities in the future. Many of these liabilities are subject to periodic audits by the respective taxing authority. Subsequent change schanges to our tax liabilities as a result of these audits may subject us to interest and penalties.
As of December 31, 2011, the Internal Revenue Service (IRS) has ongoing tax audits related to our U.S. federal tax returns from 2002 through 2009, as discussed in Note 16. We have received Revenue Agent Reports on our tax years for 2002 through 2007 and we are vigorously contesting many of the tax positions and assertions from the IRS. Although we believe our tax liabilities are fairly stated and properly reflected
VALERO ENERGY CORPORATION AND SUBSIDIARIES
NOTES TO CONSOLIDATED FINANCIAL STATEMENTS (Continued)
in our financial statements, should the IRS eventually prevail, it could result in a material amount of our deferred tax liabilities being reclassified to current liabilities which could have a material adverse effect on our liquidity.
Effective June 1, 2010, the Government of Aruba (GOA) enacted a new tax regime applicable to refinery and terminal operations in Aruba. Under the new tax regime, we are subject to a profit tax rate of 7 percent and a dividend withholding tax rate of 0zero percent. In addition, all imports and exports are exempt from turnover tax and throughput fees. Beginning June 1, 2012, we will also make a minimum annual tax payment of $10 million (payable in equal quarterly installments), with the ability to carry forward any excess tax prepayments to future tax years.
The new tax regime was the result of a settlement agreement entered into on February 24, 2010 between the GOA and us that set the parties’ proposed terms for settlement of a lengthy and complicated tax dispute between the parties. On May 30, 2010, the Aruban Parliament adopted several laws that implemented the provisions of the settlement agreement, which became effective June 1, 2010. Pursuant to the terms of the settlement agreement, we relinquished thecertain provisions of a previous tax holiday regime. On June 4, 2010, we made a payment to the GOA of $118 million (primarily from restricted cash held in escrow) in consideration of a full release of all tax claims prior to June 1, 2010. This settlement resulted in an after-tax gain of $30 million recognized primarily as a reduction to interest expense of $8 million and an income tax benefit of $20 million for the quarteryear ended June 30, 2010.December 31, 2010.
Health Care Reform
In March 2010, a comprehensive health care reform package composed of the Patient Protection and Affordable Care Act and the Health Care and Education Reconciliation Act of 2010 (Health Care Reform) was enacted into law. Provisions of the Health Care Reform are expected to affect the future costs of our U.S. health care plans. An estimate of the impactsWe sponsor U.S. health care plans that are grandfathered under Health Care Reform and have made only those changes required by Health Care Reform to our plans. Legislative challenges have been made to several of the Health Care Reform is not yet practicable due to the numberprovisions and complexity of the provisions; however, we are currently evaluatingunder review by the U.S. Supreme Court. We expect to receive more guidance on the Health Care Reform provisions which are required in 2014 and will then be able to evaluate the potential impact of the Health Care Reform on our financial position and results of operations.
Litigation Matters
Retail Fuel Temperature Litigation
In 2006, a class action complaint was filed against usWe are party to claims and several other defendants engagedlegal proceedings arising in the retail and wholesale petroleum marketingordinary course of business. The complaint allegesWe have not recorded a loss contingency liability with respect to some of these matters because we have determined that because fuel volume increases with fuel temperature, the defendants violated state consumer protection laws by failing to adjust the volume or price of fuel when the fuel temperature exceeded 60 degrees Fahrenheit. The complaints seek to certify classes of retail consumers who purchased fuel in various locations. The complaints seek an order compelling the installation of temperature correction devices as well as monetary relief. Following the 2006 complaint, numerousit is remote that a loss has been incurred. For other federal complaints were filed, and there are nowmatters, we have recorded a total of 46 lawsuits of which 21 involve us. (We are named in classes involving several statesloss contingency liability where we have no retail presence.) The lawsuitsdetermined that it is probable that a loss has been incurred and that the loss is reasonably estimable. These loss contingency liabilities are consolidated into a multi-district litigation case in the U.S. District Court for the District of Kansas (Kansas City) (Multi-District Litigation Docket No. 1840, In re: Motor Fuel Temperature Sales Practices Litigation). In May 2010, the court issued an order in responsenot material to our financial position. We re-evaluate and update our loss contingency liabilities as matters progress over time, and we believe that any changes to the plaintiffs’ motion for class certificationrecorded liabilities will not be material to our financial position or results of the Kansas cases. The court certified an “injunction class” covering nonmonetary relief but deferred ruling onoperations.
VALERO ENERGY CORPORATION AND SUBSIDIARIES
NOTES TO CONSOLIDATED FINANCIAL STATEMENTS (Continued)
a “damages class.” The court has scheduled trial in the Kansas cases for May 2012. We anticipate that the non-Kansas cases will be remanded in late 2011 or early 2012 with no additional rulings on the merits or class certification. We are a party to the Kansas cases, but we have no company-owned retail locations in Kansas. We believe that we have several strong defenses to these lawsuits and intend to contest them. We have not recorded a loss contingency liability with respect to this matter, but due to the inherent uncertainty of litigation, we believe that it is reasonably possible that we may suffer a loss wi th respect to one or more of the lawsuits. An estimate of the possible loss or range of loss from an adverse result in all or substantially all of these cases cannot reasonably be made.
Other Litigation
We are also a party to additional claims and legal proceedings arising in the ordinary course of business. We believe that there is only a remote likelihood that future costs related to known contingent liabilities related to these legal proceedings would have a material adverse impact on our consolidated results of operations or financial position.
Share Activity
For the years ended December 31, 20102011, 20092010, and 20082009, activity in the number of shares of common stock and treasury stock was as follows (in millions):
| | | | | |
| | Common Stock | | Treasury Stock |
| Balance as of December 31, 2007 | 627 | | | (91 | ) |
Shares repurchased under $6 billion common stock purchase program | — | | | (18 | ) |
Shares repurchased, net of shares issued, in connection with employee stock plans and other | — | | | (2 | ) |
| Balance as of December 31, 2008 | 627 | | | (111 | ) |
| Sale of common stock | 46 | | | — | |
Shares issued, net of shares repurchased, in connection with employee stock plans and other | — | | | 2 | |
| Balance as of December 31, 2009 | 673 | | | (109 | ) |
Shares issued, net of shares repurchased, in connection with employee stock plans and other | — | | | 4 | |
| Balance as of December 31, 2010 | 673 | | | (105 | ) |
|
| | | | | |
| | Common Stock | | Treasury Stock |
| Balance as of December 31, 2008 | 627 |
| | (111 | ) |
| Sale of common stock | 46 |
| | — |
|
Transactions in connection with stock-based compensation plans: | | | |
| Stock issuances | — |
| | 2 |
|
| Balance as of December 31, 2009 | 673 |
| | (109 | ) |
Transactions in connection with stock-based compensation plans: | | | |
| Stock issuances | — |
| | 5 |
|
| Stock repurchases | — |
| | (1 | ) |
| Balance as of December 31, 2010 | 673 |
| | (105 | ) |
Transactions in connection with stock-based compensation plans: | | | |
| Stock issuances | — |
| | 5 |
|
| Stock repurchases | — |
| | (17 | ) |
| Balance as of December 31, 2011 | 673 |
| | (117 | ) |
VALERO ENERGY CORP ORATIONCORPORATION AND SUBSIDIARIES
NOTES TO CONSOLIDATED FINANCIAL STATEMENTS (Continued)
Common Stock Offering
OnIn June 3, 2009, we sold in a public offering 46 million shares of our common stock, which included 6 million shares related to an overallotment option exerci sedexercised by the underwriters, at a price of $18.00 per share and received proceeds of $799 million, net of underwriting discounts and commissions and other issuance costs, of $799 million.costs.
Preferred Stock
We have 20 million shares of preferred stock authorized with a par value of $0.01 per share. No shares of preferred stock were outstanding during the years endedas of December 31, 20102011, 2009, and 20082010.
Treasury Stock
We purchase shares of our common stock in open market transactions to meet our obligations under employee stock-based compensation plans. We also purchase shares of our common stock from our employees and non-employee directors in connection with the exercise of stock options, the vesting of restricted stock, and other stock compensation transactions.
On February 28, 2008, our board of directors approved a $3 billion common stock purchase program, which is in addition to the remaining amount under a $6 billion program previously authorized. This additional $3 billion program has no expiration date. As of December 31, 20102011, we had made no purchases of our common stock under this $3 billion program. As of December 31, 20102011, we have approvals under these stock purchase programs to purchase approximately $3.5 billion of our common stock.
During the years ended December 31, 2010, 2009, and 2008, we purchased 0.7 million, 0.2 million, and 23.0 million shares of our common stock, respectively, at a cost of $13 million, $4 million, and $955 million, respectively. These pu rchases were made in connection with the administration of our stock-based compensation plans and the $6 billion common stock purchase program. During the years ended December 31, 2010, 2009, and 2008, we issued 4.4 million, 2.7 million, and 2.5 million shares from treasury, respectively, for our employee stock-based compensation plans.
Common Stock Dividends
On January 25, 201124, 2012, our board of directors declared a quarterly cash dividend of $0.050.15 per common share payable March 16, 201114, 2012 to holders of record at the close of business on February 16, 201115, 2012.
VALERO ENERGY CORPORATION AND SUBSIDIARIES
NOTES TO CONSOLIDATED FINANCIAL STATEMENTS (Continued)
Accumulated Other Comprehensive Income
AccumulatedChanges in the balances forof each component of accumulated other comprehensive income (loss) were as follows (in millions):
| | | Foreign Currency Translation Adjustment | | Pension/OPEB Liability Adjustment | | Net Gain (Loss) On Cash Flow Hedges | | Accumulated Other Comprehensive Income (Loss) | | | | | | | | | |
| Balance as of December 31, 2007 | $ | 580 | | | $ | (24 | ) | | $ | 17 | | | $ | 573 | | |
| Other comprehensive income (loss) | (490 | ) | | (411 | ) | | 152 | | | (749 | ) | |
| | | Foreign Currency Translation Adjustment | | Pension/ OPEB Liability Adjustment | | Net Gain (Loss) On Cash Flow Hedges | | Accumulated Other Comprehensive Income (Loss) |
| Balance as of December 31, 2008 | 90 | | | (435 | ) | | 169 | | | (176 | ) | $ | 90 |
| | $ | (435 | ) | | $ | 169 |
| | $ | (176 | ) |
| Other comprehensive income (loss) | 375 | | | 218 | | | (52 | ) | | 541 | | 375 |
| | 218 |
| | (52 | ) | | 541 |
|
| Balance as of December 31, 2009 | 465 |
| | (217 | ) | | 117 |
| | 365 |
|
| Other comprehensive income (loss) | 158 | | | (18 | ) | | (117 | ) | | 23 | | 158 |
| | (18 | ) | | (117 | ) | | 23 |
|
| Balance as of December 31, 2010 | $ | 623 | | | $ | (235 | ) | | $ | — | | | $ | 388 | | 623 |
| | (235 | ) | | — |
| | 388 |
|
| Other comprehensive income (loss) | | (122 | ) | | (189 | ) | | 19 |
| | (292 | ) |
| Balance as of December 31, 2011 | | $ | 501 |
| | $ | (424 | ) | | $ | 19 |
| | $ | 96 |
|
VALERO ENERGY CORPORATION AND SUBSIDIARIES
NOTES TO CONSOLIDATED FINANCIAL STATEMENTS (Continued)
| |
| 14. | EMPLOYEE BENEFIT PLANS |
Defined Benefit Plans
We have several qualified non-contributory defined benefit pension plans, (collectively, the Qualified Plans), some of which are subject to collective bargaining agreements. The Qualified Plansagreements, that cover substantially allmost e mployees in the U.S. and generallyof our employees. These plans provide eligible employees with retirement income based on years of service and compensation during specific periods. In addition, we have several nonqualified defined benefitWe fund our pension plans (collectively,as required by local regulations. In the Nonqualified Plans) that provideU.S., all qualified pension benefitsplans are subject to employees in Aruba and provide additional pension benefits to executive officersthe Employee Retirement Income Security Act (ERISA) minimum funding standard. We typically do not fund or fully fund U.S. nonqualified and certain international pension plans that are not subject to funding requirements because contributions to these pension plans may be less economic and investment returns may be less attractive than our other employees. The Qualified Plans and the Nonqualified Plans are collectively referred to as the Pension Plans.investment alternatives.
We also provide certain health care and life insurance benefits for certain retired employees referred to as otherthrough our postretirement benefits. Substantially allbenefit plans. Most of our employees may become eligible for these benefits if, while still working for us, they either reach normal retirement age or take early retirement. We offer retiree health care benefits through a self-insured planThese plans are unfunded, and for certain locations, a health maintenance organization. Life insurance benefits are provided through an insurance company. We fund our postretirement benefits other than pensions on a pay-as-you-go basis.retired employees share the cost with us. Individuals who became our employees as a result of an acquisition became eligible for other postretirement benefits under our planplans as determined by the terms of the relevant acquisition agreement. In March 2010, the Health Care Reform was enacted into law. As a result, income tax expense for the year ended December 31, 2010 includes a charge of $16 million related to the non-deductibility of certain retiree prescription health care costs, to the extent of federal subsidies received. Although the tax ch ange provisions of the Health Care Reform are not effective until 2013, the effect of changes in tax laws or rates on deferred tax assets and liabilities are recognized in the period that includes the enactment date, even though the changes may not be effective until future periods.
VALERO ENERGY CORPORATION AND SUBSIDIARIES
NOTES TO CONSOLIDATED FINANCIAL STATEMENTS (Continued)
The changes in benefit obligation, the changes in fair value of plan assets, and the funded status of our Pension Planspension plans and other postretireme ntpostretirement benefit plans as of and for the years ended December 31, 20102011 and 20092010 were as follows (in millions):
| | | | Pension Plans | | Other Postretirement Benefit Plans | Pension Plans | | Other Postretirement Benefit Plans |
| | 2010 | | 2009 | | 2010 | | 2009 | 2011 | | 2010 | | 2011 | | 2010 |
| Change in benefit obligation: | | | | | | | | | | | | | | |
| Benefit obligation at beginning of year | $ | 1,454 | | | $ | 1,492 | | | $ | 466 | | | $ | 520 | | $ | 1,626 |
| | $ | 1,454 |
| | $ | 426 |
| | $ | 466 |
|
| Service cost | 88 | | | 104 | | | 10 | | | 12 | | 104 |
| | 88 |
| | 11 |
| | 10 |
|
| Interest cost | 83 | | | 79 | | | 26 | | | 25 | | 85 |
| | 83 |
| | 22 |
| | 26 |
|
| Acquisitions | | — |
| | — |
| | 4 |
| | — |
|
| Participant contributions | — | | | — | | | 12 | | | 9 | | — |
| | — |
| | 12 |
| | 12 |
|
| Plan amendments | — | | | — | | | (31 | ) | | (51 | ) | 4 |
| | — |
| | — |
| | (31 | ) |
| Special termination benefits | 4 | | | 6 | | | — | | | 1 | | — |
| | 4 |
| | — |
| | — |
|
| Medicare subsidy for prescription drugs | — | | | — | | | 1 | | | 1 | | — |
| | — |
| | 3 |
| | 1 |
|
| Benefits paid | (109 | ) | | (74 | ) | | (31 | ) | | (28 | ) | (117 | ) | | (109 | ) | | (30 | ) | | (31 | ) |
| Actuarial (gain) loss | 106 | | | (153 | ) | | (28 | ) | | (27 | ) | 179 |
| | 106 |
| | (9 | ) | | (28 | ) |
| Foreign currency exchange rate changes | — | | | — | | | 1 | | | 4 | | — |
| | — |
| | (1 | ) | | 1 |
|
| Benefit obligation at end of year | $ | 1,626 | | | $ | 1,454 | | | $ | 426 | | | $ | 466 | | $ | 1,881 |
| | $ | 1,626 |
| | $ | 438 |
| | $ | 426 |
|
| | | | | | | | | | | | | | | |
| Change in plan assets: | | | | | | | | | | | | | | |
| Fair value of plan assets at beginning of year | $ | 1,251 | | | $ | 1,005 | | | $ | — | | | $ | — | | $ | 1,362 |
| | $ | 1,251 |
| | $ | — |
| | $ | — |
|
| Actual return on plan assets | 149 | | | 228 | | | — | | | — | | (2 | ) | | 149 |
| | — |
| | — |
|
| Valero contributions | 71 | | | 92 | | | 18 | | | 18 | | 244 |
| | 71 |
| | 15 |
| | 18 |
|
| Participant contributions | — | | | — | | | 12 | | | 9 | | — |
| | — |
| | 12 |
| | 12 |
|
| Medicare subsidy for prescription drugs | — | | | — | | | 1 | | | 1 | | — |
| | — |
| | 3 |
| | 1 |
|
| Benefits paid | (109 | ) | | (74 | ) | | (31 | ) | | (28 | ) | (117 | ) | | (109 | ) | | (30 | ) | | (31 | ) |
| Fair value of plan assets at end of year | $ | 1,362 | | | $ | 1,251 | | | $ | — | | | $ | — | | $ | 1,487 |
| | $ | 1,362 |
| | $ | — |
| | $ | — |
|
| | | | | | | | | | | | | | | |
| Reconciliation of funded status: | | | | | | | | | | | | | | |
| Fair value of plan assets at end of year | $ | 1,362 | | | $ | 1,251 | | | $ | — | | | $ | — | | $ | 1,487 |
| | $ | 1,362 |
| | $ | — |
| | $ | — |
|
| Less benefit obligation at end of year | 1,626 | | | 1,454 | | | 426 | | | 466 | | 1,881 |
| | 1,626 |
| | 438 |
| | 426 |
|
| Funded status at end of year | $ | (264 | ) | | $ | (203 | ) | | $ | (426 | ) | | $ | (466 | ) | $ | (394 | ) | | $ | (264 | ) | | $ | (438 | ) | | $ | (426 | ) |
VALERO ENERGY CORPORAT IONCORPORATION AND SUBSIDIARIES
NOTES TO CONSOLIDATED FINANCIAL STATEMENTS (Continued)
The accumulated benefit obligations for certain of our Pension Planspension plans exceed the fair values of the assets of those plans. For those plans, the table below presents the total projected benefit obligation, accumulated benefit obligation, and fair value of the plan assets (in millions).
| | | | December 31, | December 31, |
| | 2010 | | 2009 | 2011 | | 2010 |
| Projected benefit obligation | $ | 231 | | | $ | 249 | | $ | 244 |
| | $ | 231 |
|
| Accumulated benefit obligation | 192 | | | 221 | | 189 |
| | 192 |
|
| Fair value of plan assets | 44 | | | 81 | | 40 |
| | 44 |
|
Benefit payments which reflect expected future services that we expect to pay, including amounts related to expected future services, and the anticipated Medicare subsidies that we expect to receive are as follows for the years ending December 31 (in millions):
| | &n bsp; | Pension Benefits | | Other Postretirement Benefits | | Medicare Subsidy | |
| 2011 | $ | 89 | | | $ | 25 | | | $ | (2 | ) | |
| | | | Pension Benefits | | Other Postretirement Benefits | | Medicare Subsidy |
| 2012 | 87 | | | 27 | | | (2 | ) | $ | 84 |
| | $ | 23 |
| | $ | (2 | ) |
| 2013 | 89 | | | 28 | | | n/a | | 99 |
| | 24 |
| | n/a |
|
| 2014 | 98 | | | 29 | | | n/a | | 101 |
| | 26 |
| | n/a |
|
| 2015 | 105 | | | 30 | | | n/a | | 107 |
| | 28 |
| | n/a |
|
| Years 2016-2020 | 707 | | | 162 | | | n/a | | |
| 2016 | | 117 |
| | 29 |
| | n/a |
|
| 2017-2021 | | 766 |
| | 159 |
| | n/a |
|
We have nominimum required contributions of $2 millionto our Pension Planspension plans during 20112012 under the Employee Retirement Income Security Act;ERISA and other local regulations; however, we plan to contribute approximately $100 million to our Pension Planspension plans during 2011.2012.
VALERO ENERGY CORPORATION AND SUBSIDIARIES
NOTES TO CONSOLIDATED FINANCIAL STATEMENTS (Continued)
The components of net periodic benefit cost were as follows for the years ended December 31, 20102011, 20092010, and 20082009 (in millions):
| | | | | | | | | | | | | | | | | | | | | | | |
| | Pension Plans | | Other Postretirement Benefit Plans |
| | 2010 | | 2009 | | 2008 | | 2010 | | 2009 | | 2008 |
| Components of net periodic benefit cost: | | | | | | | | | | | |
| Service cost | $ | 88 | | | $ | 104 | | | $ | 92 | | | $ | 10 | | | $ | 12 | | | $ | 13 | |
| Interest cost | 83 | | | 79 | | | 76 | | | 26 | | | 25 | | | 28 | |
| Expected return on plan assets | (112 | ) | | (108 | ) | | (105 | ) | | — | | | — | | | — | |
| Amortization of: | | | | | | | | | | | |
| Prior service cost (credit) | 3 | | | 3 | | | 3 | | | (20 | ) | | (19 | ) | | (9 | ) |
| Net loss | 2 | | | 10 |
| | 2 | | | 4 | | | 6 | | | 3 | | Net periodic benefit cost before
special charges
| 64 | | | 88 | | | 68 | | | 20 | | | 24 | | | 35 | |
Charge for special termination benefits | 8 | | | 7 | | | — | | | — | | | 1 | | | — | |
Net periodic benefit cost | $ | 72 | | | $ | 95 | | | $ | 68 | | | $ | 20 | | | $ | 25 | | | $ | 35 | |
|
| | | | | | | | | | | | | | | | | | | | | | | |
| | Pension Plans | | Other Postretirement Benefit Plans |
| | 2011 | | 2010 |
| 2009 | | 2011 | | 2010 | | 2009 |
Components of net periodic benefit cost: | | | | | | | | | | | |
| Service cost | $ | 104 |
| | $ | 88 |
| | $ | 104 |
| | $ | 11 |
| | $ | 10 |
| | $ | 12 |
|
| Interest cost | 85 |
| | 83 |
| | 79 |
| | 22 |
| | 26 |
| | 25 |
|
| Expected return on plan assets | (112 | ) | | (112 | ) | | (108 | ) | | — |
| | — |
| | — |
|
| Amortization of: | | | | | | | | | | | |
| Prior service cost (credit) | 2 |
| | 3 |
| | 3 |
| | (23 | ) | | (20 | ) | | (19 | ) |
| Net loss | 12 |
| | 2 |
| | 10 |
| | 2 |
| | 4 |
| | 6 |
|
| Net periodic benefit cost before special charges | 91 |
| | 64 |
| | 88 |
| | 12 |
| | 20 |
| | 24 |
|
| Special charges | 4 |
| | 8 |
| | 7 |
| | 4 |
| | — |
| | 1 |
|
| Net periodic benefit cost | $ | 95 |
| | $ | 72 |
| | $ | 95 |
| | $ | 16 |
| | $ | 20 |
| | $ | 25 |
|
Amortization of prior service cost (credit) shown in the above table was based on the average remaining service period of employees expected to receive benefits under each respective plan. The chargeSpecial charges in 2011 relate to purchase accounting for special termination benefitsthe Meraux Acquisition and settlements related to lump sum payments in excess of thresholds. Special charges in 2010 and 2009 relatesrelated to early retirement programs for corporate employees and employees at our Delaware City and Paulsboro Refineries.
Pre-tax amounts recognized in other comprehensive income for the years ended December 31, 2011, 2010, and 2009 were as follows (in millions):
| | | Pension Plans | | Other Postretirement Benefit Plans | | | | | | | | | | | | | |
| | 2010 | | 2009 | | 2010 | | 2009 | Pension Plans | | Other Postretirement Benefit Plans |
| Net (gain) loss arising during the year: | | | | | | | | |
| | | 2011 | | 2010 | | 2009 | | 2011 | | 2010 | | 2009 |
Net loss (gain) arising during the year: | | | | | | | | | | | | |
| Net actuarial loss (gain) | $ | 68 | | | $ | (273 | ) | | $ | (28 | ) | | $ | (27 | ) | $ | 294 |
| | $ | 68 |
| | $ | (273 | ) | | $ | (9 | ) | | $ | (28 | ) | | $ | (27 | ) |
| Prior service credit | — | | | — | | | (31 | ) | | (51 | ) | 4 |
| | — |
| | — |
| | — |
| | (31 | ) | | (51 | ) |
| | | | | | | | | | | | | | | | | | | |
| Net gain (loss) reclassified into income: | | | | | | | | | | | | | | | | | | |
| Net actuarial loss | (2 | ) | | (10 | ) | | (4 | ) | | (6 | ) | (12 | ) | | (2 | ) | | (10 | ) | | (2 | ) | | (4 | ) | | (6 | ) |
| Prior service (cost) credit | (3 | ) | | (3 | ) | | 20 | | | 19 | | (2 | ) | | (3 | ) | | (3 | ) | | 23 |
| | 20 |
| | 19 |
|
| Curtailment and settlement | (4 | ) | | (1 | ) | | &md ash; | | | — | | (4 | ) | | (4 | ) | | (1 | ) | | — |
| | — |
| | — |
|
Total ch anges in other comprehensive (income) loss | $ | 59 | | | $ | (287 | ) | | $ | (43 | ) | | $ | (65 | ) | |
Total changes in other comprehensive (income) loss | | $ | 280 |
| | $ | 59 |
| | $ | (287 | ) | | $ | 12 |
| | $ | (43 | ) | | $ | (65 | ) |
VALERO ENERGY CORPORATION AND SUBSIDIARIES
NOTES TO CONSOLIDATED FINANCIAL STATEMENTS (Continued)
The pre-tax amounts in accumulated other comprehensive income as of D ecemberDecember 31, 20102011 and 20092010 that have not yet been recognized as components of net periodic benefit cost were as follows (in millions):
| | | | Pension Plans | | Other Postretirement Benefit Plans | Pension Plans | | Other Postretirement Benefit Plans |
| | 2010 | | 2009 | | 2010 | | 2009 | 2011 |
| 2010 | | 2011 | | 2010 |
| Prior service cost (credit) | $ | 14 | | | $ | 16 | | | $ | (126 | ) | & nbsp; | $ | (115 | ) | $ | 16 |
| | $ | 14 |
| | $ | (103 | ) | | $ | (126 | ) |
| Net actuarial loss | 403 | | | 342 | | | 61 | | | 94 | | 681 |
| | 403 |
| | 50 |
| | 61 |
|
| Total | $ | 417 | | | $ | 358 | | | $ | (65 | ) | | $ | (21 | ) | $ | 697 |
| | $ | 417 |
| | $ | (53 | ) | | $ | (65 | ) |
The following pre-tax amounts included in accumulated other comprehensive income as of December 31, 20102011 are expected to be recognized as components of net periodic benefit cost during the year ending December 31, 20112012 (in millions):
| | | | Pension Plans | | Other Postretirement Benefit Plans | Pension Plans | | Other Postretirement Benefit Plans |
| Amortization of prior service cost (credit) | $ | 2 | | | $ | (23 | ) | $ | 3 |
| | $ | (23 | ) |
| Amortization of net actuarial loss | 12 | | | 2 | | 33 |
| | 1 |
|
| Total | $ | 14 | | | $ | (21 | ) | $ | 36 |
| | $ | (22 | ) |
The weighted-average assumptions used to determine the benefit obligations as of December 31, 20102011 and 20092010 were as follows:
| | | Pension Plans | | Other Postretirement Benefit Plans |
| | 2010 | | 2009 | | 2010 | | 2009 | 2011 | | 2010 | | 2011 | | 2010 |
| Discount rate | 5.40 | % | | 5.80 | % | | 5.22 | % | | 5.68 | % | 5.08 | % | | 5.40 | % | | 4.97 | % | | 5.22 | % |
| Rate of compensation increase | 3.56 | % | | 3.47 | % | | — | % | | — | % | 3.68 | % | | 3.56 | % | | — | % | | — | % |
The discount rate assumptionsassumption used to determine the benefit obligations as of December 31, 2011 for the pension planplans and other postretirement benefit plans was based on the Aon Hewitt AA Only Above Median yield curve and considered the timing of the projected cash outflows under our plans. This curve was designed by Aon Hewitt to provide a means for plan sponsors to value the liabilities of their pension plans or postretirement benefit plans. It is a hypothetical double-A yield curve represented by a series of annualized individual discount rates with maturities from one-half year to 99 years. Each bond issue underlying the curve is required to have an average rating of double-A when averaging all available ratings by Moody’s Investor Services (Moody’s), Standard and Poor’s Ratings Service (S&P), and Fitch Ratings. Only the bonds representing the 50 percent highest yielding issuance among these with average ratings of double-A are included in this yield curve.
VALERO ENERGY CORPORATION AND SUBSIDIARIES
NOTES TO CONSOLIDATED FINANCIAL STATEMENTS (Continued)
The discount rate assumption used to determine the benefit obligations as of December&n bsp;31, 2010 for the pension plans and 2009 wereother postretirement benefit plans was based on the Hewitt Above Median yield curve (HAM). The HAMand considered the timing of the projected cash outflows under our plans. This curve was also designed by Aon Hewitt to provide a means for plan sponsors to value the liabilities of their pension plans or other postretirement benefit plans. The HAM isThis curve was a hypothetical double yield curve represented by a series of annualized individual discount rates with maturities from one-half year to more than 30 years. Each bond issue underlying the HAM iscurve was required to have a rating of Aa or better by Moody’s Investors Service or a rating of AA or better by Standard & Poor’s Ratings Services.S&P.
We based our December 31, 2011 discount rate assumption on the Aon Hewitt AA Only Above Median yield curve because we believe it is representative of the types of bonds we would use to settle our pension and other postretirement benefit plan liabilities as of that date. We believe that the market volatility of the last two to three years has largely subsided and that the yields associated with the bonds used to develop this yield curve reflect the current level of interest rates. In 2010 and 2009, we based our discount rate assumption on the Hewitt Above Median yield curve because it included a larger number of bonds which lessened the effect of outlier bonds whose yields were influenced by the volatility in the market at that time.
97
VALERO ENERGY CORPORATION AND SUBSIDIARIES
NOTES TO CONSOLIDATED FINANCIAL STATEMENTS (Continued)
The weighted-average assumptions used to determine the net periodic benefit cost for the years ended December 31, 20102011, 20092010, and 20082009 were as follows:
| | | | Pension Plans | | Other Postretirement Benefit Plans | Pension Plans | | Other Postretirement Benefit Plans |
| | 2010 | | 2009 | | 2008 | | 2010 | | 2009 | | 2008 | 2011 | | 2010 | | 2009 | | 2011 | | 2010 | | 2009 |
| Discount rate | 5.80 | % | | 5.40 | % | | 6.00 | % | | 5.68 | % | | 5.39 | % | | 6.00 | % | 5.40 | % | | 5.80 | % | | 5.40 | % | | 5.22 | % | | 5.68 | % | | 5.39 | % |
Expected long-term rate of return on plan assets | 7.71 | % | | 7.72 | % | | 8.23 | % | | — | % | | — | % | | — | % | 7.69 | % | | 7.71 | % | | 7.72 | % | | — | % | | — | % | | — | % |
| Rate of compensation increase | 4.18 | % | | 4.18 | % | | 4.40 | % | | — | % | | — | % | | — | % | 3.56 | % | | 4.18 | % | | 4.18 | % | | — | % | | — | % | | — | % |
The assumed health care cost trend rates as of December 31, 20102011 and 20092010 were as follows:
| | | 2010 | | 2009 | | | | |
| Health care cost trend rate assumed for next year | 7.46 | % | | 7.50 | % | |
| | | 2011 | | 2010 |
| Health care cost trend rate assumed for the next year | | 7.43 | % | | 7.46 | % |
Rate to which the cost trend rate was assumed to decline (the ultimate trend rate) | 5.00 | % | | 5.00 | % | 5.00 | % | | 5.00 | % |
| Year that the rate reaches the ultimate trend rate | 2018 | | | 201 8 | | 2018 |
| | 2018 |
|
Assumed health care cost trend rates have a significant effectan impact on the amounts reported for retiree health care plans. A one percentage-point change in assumed health care cost trend rates would have the following effects on other postretirement benefits (in millions):
|
| | | | | | | |
| | 1% Increase | | 1% Decrease |
| Effect on total of service and interest cost components | $ | 1 |
| | $ | (1 | ) |
| Effect on accumulated postretirement benefit obligation | 18 |
| | (16 | ) |
VALERO ENERGY CORPORATION AND SUBSIDIARIES
NOTES TO CONSOLIDATED FINANCIAL STATEMENTS (Continued)
The tables below present the fair values of the assets of our Qualified Planspension plans (in millions) as of December 31, 20102011 and 20092010 by level of the fair value hierarchy. Assets categorized in Level 1 of the hierarchy are measured at fair value using a market approach based on quotations from national securities exchanges. Assets categorized in Level 2 of the hierarchy are measured at net asset value as a practical expedient for fair value. As previously noted, above,we do not fund or fully fund U.S. nonqualified and certain international pension plans that are not subject to funding requirements, and we do not fund our other postretirement benefit plans. Plan assets for certain U.S. nonqualified pension plans are funded on a pay-as-you-go basis and have no assets. Our Nonqualified Plans have assets, but the fair values of the assets of these plans are presenteddisclosed in Note 20. and are not included in the plan assets reflected below because they are not protected from our creditors and therefore cannot be reflected as a reduction from our obligations under the pension plans.
| | | | Fair Value Measurements Using | | | Fair Value Measurements Using | | |
| | Quoted Prices in Active Markets (Level 1) | | Significant Other Observable Inputs (Level 2) | | Significant Unobservable Inputs (Level 3) | | Total as of
December 31,
2010 | Quoted Prices in Active Markets (Level 1) | | Significant Other Observable Inputs (Level 2) | | Significant Unobservable Inputs (Level 3) | | Total as of
December 31,
2011 |
| Equity securities: | | | | | | | | | | | | | | |
Valero Energy Corporation common stock | $ | 5 | | | $ | — | | | $ | — | | | $ | 5 | | $ | 5 |
| | $ | — |
| | $ | — |
| | $ | 5 |
|
| Other U.S. companies (a) | 369 | | | — | | | — | | | 369 | | 375 |
| | — |
| | — |
| | 375 |
|
| International companies | 107 | | | — | | | — | | | 107 | | 120 |
| | — |
| | — |
| | 120 |
|
| Preferred stock | 1 | | | — | | | — | | | 1 | | 2 |
| | — |
| | — |
| | 2 |
|
| Mutual funds: | | | | | | | | | | | | | | |
| International growth | 117 | | | — | | | — | | | 117 | | 102 |
| | — |
| | — |
| | 102 |
|
| Index funds (b) | 64 | | | — | | | — | | | 64 | | 63 |
| | — |
| | — |
| | 63 |
|
| Corporate debt instruments | 274 | | | — | | | — | | | 274 | | 246 |
| | — |
| | — |
| | 246 |
|
| Government securities: | | | | | | | | | | | | | | |
| U.S. Treasury securities | 30 | | | — | | | — | | | 30 | | 67 |
| | — |
| | — |
| | 67 |
|
| Mortgage-backed securities | 3 | | | — | | | — | | | 3 | | 3 |
| | — |
| | — |
| | 3 |
|
Other government securities | 93 | | | — | | | — | | | 93 | | 81 |
| | — |
| | — |
| | 81 |
|
| Common collective trusts | — | | | 231 | | | — | | | 231 | | — |
| | 247 |
| | — |
| | 247 |
|
| Insurance contracts | — | | | 18 | | | — | | | 18 | | — |
| | 17 |
| | — |
| | 17 |
|
Interest and dividends receivable | 5 | | | — | | | — | | | 5 | | 5 |
| | — |
| | — |
| | 5 |
|
| Cash and cash equivalents | 45 | | | — | | | — | | | 45 | | 154 |
| | — |
| | — |
| | 154 |
|
| Total | $ | 1,113 | | | $ | 249 | | | $ | — | | | $ | 1,362 | | $ | 1,223 |
| | $ | 264 |
| | $ | — |
| | $ | 1,487 |
|
______________________
See notes on page 100.99.
VALERO ENERGY CORPORATION AND SUBSIDIARIES
NOTES TO CONSOLIDATED FINANCIAL STATEMENTS (Continued)
| | | | | | | | | | | | | | | |
| | Fair Value Measurements Using | | |
| | Quoted Prices in Active Markets (Level 1) | | Significant Other Observable Inputs (Level 2) | | Significant Unobservable Inputs (Level 3) | | Total as of
December 31,
2009 |
Equity securities:
| | | | | | |
Valero Energy Corporation common stock | $ | 15 | | | $ | — | | | $ | — | | | $ | 15 | |
| Other U.S. companies (a) | 518 | | | — | | | — | | | 518 | |
| International companies | 98 | | | — | | | — | | | 98 | |
| Preferred stock | 3 | | | — | | | — | | | 3 | |
| Mutual funds: | | | | | | | |
| International growth | 107 | | | — | | | — | | | 107 | |
| Index funds (b) | 60 | | | — | | | — | | | 60 | |
| Corporate debt instruments | 257 | | | — | | | — | | | 257 | |
| Government securities: | | | | | | | |
| U.S. Treasury securities | 38 | | |
— | | | — | | | 38 | | Mortgage-backed securities
| 2 | | | — | | | — | | | 2
| |
Other government
securities
| 93 | | | — | | | — | | | 93 | |
Insurance contracts | — | | | 18 | | | — | | | 18 | |
Interest and dividends
receivable
| 4 | | | — | | | — | | | 4 | |
Cash and cash equivalents | 38 | | | — | | | — | |
| 38 | |
Total | $ | 1,233 | | | $ | 18 | | | $ | — | | | $ | 1,251 | |
|
| | | | | | | | | | | | | | | |
| | Fair Value Measurements Using | | |
| | Quoted Prices in Active Markets (Level 1) | | Significant Other Observable Inputs (Level 2) | | Significant Unobservable Inputs (Level 3) | | Total as of
December 31,
2010 |
| Equity securities: | | | | | | | |
Valero Energy Corporation common stock | $ | 5 |
| | $ | — |
| | $ | — |
| | $ | 5 |
|
| Other U.S. companies (a) | 369 |
| | — |
| | — |
| | 369 |
|
| International companies | 107 |
| | — |
| | — |
| | 107 |
|
| Preferred stock | 1 |
| | — |
| | — |
| | 1 |
|
| Mutual funds: | | | | | | | |
| International growth | 117 |
| | — |
| | — |
| | 117 |
|
| Index funds (b) | 64 |
| | — |
| | — |
| | 64 |
|
| Corporate debt instruments | 274 |
| | — |
| | — |
| | 274 |
|
| Government securities: | | | | | | | |
| U.S. Treasury securities | 30 |
| | — |
| | — |
| | 30 |
|
| Mortgage-backed securities | 3 |
| | — |
| | — |
| | 3 |
|
Other government securities | 93 |
| | — |
| | — |
| | 93 |
|
| Common collective trusts | — |
| | 231 |
| | — |
| | 231 |
|
| Insurance contracts | — |
| | 18 |
| | — |
| | 18 |
|
Interest and dividends receivable | 5 |
| | — |
| | — |
| | 5 |
|
| Cash and cash equivalents | 45 |
| | — |
| | — |
| | 45 |
|
| Total | $ | 1,113 |
| | $ | 249 |
| | $ | — |
| | $ | 1,362 |
|
| |
| (a) | Equity securities are held in a wide range of industrial sectors, including consumer goods, information technology, healthcare, industrials, and financial services. |
| |
| (b) | This class include primarily investments in approximately 60 percent equities and 40 percent bonds. |
The investment policies and strategies for the assets of our Qualified Planspension plans incorporate a diversified approach that is expected to earn long-term returns from capital appreciation and a growing stream of current income. This approach recognizes that assets are exposed to risk and the market value of the Qualified Plans’pension plans’ assets may fluctuate from year to year. Risk tolerance is determined based on our financial ability to withstand risk within the investment program and the willingness to accept return volatility. In line with the investment return objective and risk parameters, the Qualified Plans’pension plans’ mix of assets includes a diversified portfolio of equity and fixed-income investments. As of December 31, 20102011, the target allocations for plan assets are 70 percent equity securities and 30 percent fixed income investments. Equity securities include international stocks and a blend of domesticU.S. growth and value stocks of various sizes of capitalization. Fixed income securities include bonds and notes issued by the U.S. government and its agencies, corporate bonds, and mortgage-backed securities. The aggregate asset allocation is reviewed on an annual basis.
VALERO ENERGY CORPORATION AND SUBSIDIARIES
NOTES TO CONSOLIDATED FINANCIAL STATEMENTS (Continued)
The overall expected long-term rate of return on plan assets for the Qualified Planspension plans is estimated using models of asset returns. Model assumptions are derived using historical data given the assumption that capital markets are informationally efficient. Three methods are used to derive the long-term expected returns for each asset class. Because each method has distinct advantages and disadvantages and differing results, an equal weighted average of the methods’ results is used.
Defined Contribution Plans
Valero Energy Corporation Thrift Plan
The Valero Energy Corporation Thrift Plan covers substantially all U.S. employees except for those employees covered by the plans discussed below. Employees are immediately eligible to participate in the plan and receive employer matching contributions.
Through December 31, 2009, participants could make basic contributions up to 8 percent of their total annual salary, which included overtime and cash bonuses. In addition, participants who made a basic contribution of 8 percent could also make a supplemental contribution of up to 22 percent of their total eligible annual salary. We matched 75 percent of each participant’s total basic contributions up to 8 percent based on the participant’s total annual salary, excluding cash bonuses. Commencing January 1, 2010, we match 100 percent of basic contributions up to 6 percent of each participant’s total annual salary, excluding cash bonuses.
Valero Savings Plan
The Valero Savings Plan covers our U.S. retail store employees, certain other employees supporting the retail organization, and employees at our ethanol plants. Under this plan, participants can contribute from 1 percent to 30 percent of their eligible compensation. We contribute $0.60 for every $1.00 of the participant’s contribution up to6 percent of eligible compensation. At our discretion, we may also make profit-sharing contributions, which can range from 3.5 to 5 percent of eligible compensation, to the Plan to be allocated to the participants.
Premcor Retirement Savings Plan
The Premcor Retirement Savings Plan covers certain union employees. Under this plan, particip antsparticipants can contribute from 1 percent to 50 percent of their eligible compensation. We contribute 200 percent of the first 3 percent of a participant’s eligible compensation. In addition, we contribute 100 percent of the next 3 percent of a participant’s eligible compensation for certain union participants who contribute to the plan.
Ultramar Ltd. Savings Plan
The Ultramar Ltd. Savings Plan covers all Canadian employees. Permanent employees are eligible after three months of service, temporary employees are eligible after one year of service, and seasonal employees are eligible after 220 days of service during 36 consecutive months. We contribute 9 percent of the employee’s base salary plus 50 percent of the employee’s voluntary contribution, which is limited to 6 pe rcentpercent of the base salary. Our contribution does not exceed 12 percent of the base salary.
Valero Refining Company – Aruba N.V. Thrift Plan
The Valero Refining Company – Aruba N.V. Thrift Plan covers all Aruban employees. Employees are eligible to participate after completing one year of service and can contribute a maximum of 8 percent of salary. We match 100 percent of employee contributions up to a maximum of 8 percent based on years of service.
VALERO ENERGY CORPORATI ONCORPORATION AND SUBSIDIARIES
NOTES TO CONSOLIDATED FINANCIAL STATEMENTS (Continued)
Our contributions to these qualified defined contribution plans were as follows (in millions):
| | | | | | | | | | | |
| | Year Ended December 31, |
| | 2010 | | 2009 | | 2008 |
| Valero Energy Corporation Thrift Plan | $ | 36 | | | $ | 37 | | | $ | 38 | |
| Valero Savings Plan | 6 | | | 5 | | | 5 | |
| Premcor Retirement Savings Plan | 5 | | | 6 | | | 6 | |
| Ultramar Ltd. Savings Plan | 9 | | | 8 | | | 9 | |
Valero Refining Company – Aruba N.V.
| 1 | | | 1 | | | 1 | |
|
| | | | | | | | | | | |
| | Year Ended December 31, |
| | 2011 | | 2010 | | 2009 |
| Valero Energy Corporation Thrift Plan | $ | 35 |
| | $ | 36 |
| | $ | 37 |
|
| Valero Savings Plan | 8 |
| | 6 |
| | 5 |
|
| Premcor Retirement Savings Plan | 5 |
| | 5 |
| | 6 |
|
| Ultramar Ltd. Savings Plan | 10 |
| | 9 |
| | 8 |
|
Valero Refining Company – Aruba N.V. Thrift Plan | 1 |
| | 1 |
| | 1 |
|
Other Plans
We have several defined contribution plans in the U.K. and Ireland that cover employees of those countries. Employer contributions to these plans were immaterial for the year ended December 31, 2011.
We also have two nonqualified defined contribution plans in the U.S., the assets and liabilities of which are measured and recorded at fair value on a recurring basis as disclosed in Note 20. No employer contributions were made to these nonqualified defined contribution plans for the years ended December 31, 20102011, 20092010, and 20082009.
VALERO ENERGY CORPORATION AND SUBSIDIARIES
NOTES TO CONSOLIDATED FINANCIAL STATEMENTS (Continued)
| |
| 15. | STOCK-BASED COMPENSATION |
We have various fixed and performance-based stock compensation plans under which awards have been granted, which are summarized as follows:
| |
• | The 2005 Omnibus Stock Incentive Plan (the OSIP) authorizes the grant of various stock and stock-based awards to our employees and our non-employee directors. Awards available under the OSIP include options to purchase shares of common stock, performance awards that vest upon the achievement of an objective performance goal, and restricted stock that vests over a period determined by our compensation committee. As of December 31, 2010, a total of 9,711,596The 2011 Omnibus Stock Incentive Plan (the OSIP) authorizes the grant of various stock and stock-based awards to our employees and our non-employee directors. Awards available under the OSIP include options to purchase shares of common stock, performance awards that vest upon the achievement of an objective performance goal, stock appreciation rights, and restricted stock that vests over a period determined by our compensation committee. The OSIP was approved by our stockholders on April 28, 2011. As of December 31, 2011, 18,498,630 shares of our common stock remained available to be awarded under the OSIP. Prior to the approval of the OSIP by our stockholders, most of the equity awards granted to our employees and non-employee directors were made under our 2005 Omnibus Stock Incentive Plan. Prior awards granted under this plan included options to purchase shares of common stock, performance awards that vest upon the achievement of an objective performance goal, and restricted stock that vests over a period determined by our compensation committee. No additional grants may be awarded under this plan. The Restricted Stock Plan for Non-Employee Directors authorizes an annual grant of our common stock valued at $160,000 to each non-employee director. Vesting generally will occur based on the number of grants received as follows: (i) initial grants will vest in three equal annual installments, (ii) second grants will vest one-third on the first anniversary of the grant date and the remaining two-thirds on the second anniversary of the grant date, and (iii) all grants thereafter will vest 100 percent on the first anniversary of the grant date. As of December 31, 2011, 8,289 shares of our common stock remained available to be awarded under this plan.
VALERO ENERGY CORPORATION AND SUBSIDIARIES NOTES TO CONSOLIDATED FINANCIAL STATEMENTS (Continued)
The 2003 Employee Stock Incentive Plan authorizes the grant of various stock and stock-related awards to employees and prospective employees. Awards include options to purchase shares of common stock, performance awards that vest upon the achievement of an objective performance goal, stock appreciation rights, and restricted stock that vests over a period determined by our compensation committee. As of December 31, 2011, 536,141 shares of our common stock remained available to be awarded under this plan. In addition, we maintained other stock option and incentive plans under which previously granted equity awards remain outstanding. No additional grants may be awarded under these plans. |
| |
• | The Restricted Stock Plan for Non-Employee Directors authorizes an annual grant of our common stock valued at $160,000 to each non-employee director. Vesting will occur based on the number of grants received as follows: (i) initial grants will vest in three equal annual installments, (ii) second grants will vest one third on the first anniversary of the grant date and the remainingtwo thirds on the second anniversary of the grant date, and (iii) all grants thereafter will vest 100 percent on the first anniversary of the grant date. As of December 31, 2010, a total of 77,839 shares of our common stock remained available to be awarded under this plan.
|
| |
• | The 2003 Employee Stock Incentive Plan authorizes the grant of various stock and stock-related awards to employees and prospective employees. Awards include options to purchase shares of common stock, performance awards that vest upon the achievement of an objective performance goal, stock appreciation rights, and restricted stock that vests over a period determined by our compensation committee. As of December 31, 2010, a total of 46,5 93 shares of our common stock remained available to be awarded under this plan.
|
| |
• | In addition, we maintained other stock option and incentive plans under which previously granted equity awards remain outstanding. No additional grants may be awarded under these plans. |
Each of our stock-based compensati oncompensation arrangements is discussed below.
The following table reflects activity related to our stock-based compensation arrangements (in millions):
| | | | | | | | | | | |
| | Year Ended December 31, |
| | 2010 | | 2009 | | 2008 |
| Stock-based compensation expense | $ | 54 | | | $ | 68 | | | $ | 59 | |
Tax benefit recognized on stock-based compensation expense | 19 | | | 24 | | | 21 | |
Tax benefit realized for tax deductions resulting from exercises and vestings | 23 | | | 9 | | | 22 | |
Effect of tax deductions in excess of recognized stock-based compensation expense reported as a financing cash flow | 11 | | | 5 | | &n bsp; | 9 | |
|
| | | | | | | | | | | |
| | Year Ended December 31, |
| | 2011 | | 2010 | | 2009 |
| Stock-based compensation expense | $ | 58 |
| | $ | 54 |
| | $ | 68 |
|
| Tax benefit recognized on stock-based compensation expense | 20 |
| | 19 |
| | 24 |
|
| Tax benefit realized for tax deductions resulting from exercises and vestings | 35 |
| | 23 |
| | 9 |
|
| Effect of tax deductions in excess of recognized stock-based compensation expense reported as a financing cash flow | 23 |
| | 11 |
| | 5 |
|
VALERO ENERGY CORPORATION AND SUBSIDIARIES
NOTES TO CONSOLIDATED FINANCIAL STATEMENTS (Continued)
Stock Options
U nderUnder the terms of our various stock-based compensation option plans, the exercise price of options granted is not less than the fair market value of our common stock on the date of grant. Stock options become exercisable pursuant to the individual written agreements between the participants and us, usually in three or five equal annual installments beginning one year after the date of grant, with unexercised options generally expiring seven or ten years from the date of grant.
The fair value of each stock option grant was estimated on the grant date using the Black-Schole sBlack-Scholes option-pricing model. The expected life of options granted is the period of time from the grant date to the date of expected exercise or other expected settlement. The expected life for each of the years in the table below was calculated using the safe harbor provisions of SEC Staff Accounting Bulletin No. 107 and No. 110 related to share-based payments. Because the vesting period for almost all of the stock options granted during the years ended December 31, 20102011, 20092010, and 20082009 was three years rather than five years as in prior years, historical exercise patterns did not provide a reasonable basis for estimating the expected life. Expected volatility is based on closing prices of our common stock for periods corresponding to the expected life of options granted. Expected dividend yield is based on annualized dividends at the date of grant. The risk-free interest rate used is the implied yield currently available from the U.S. Treasury zero-coupon issues with a remaining term equal to the expected life of the options at the grant date.
VALERO ENERGY CORPORATION AND SUBSIDIARIES
NOTES TO CONSOLIDATED FINANCIAL STATEMENTS (Continued)
A summary of the weighted-average assumptions used in our fair value measurements i sis presented in the table below.
| | | | | | | | |
| | Y ear Ended December 31, |
| | 2010 | | 2009 | | 2008 |
| Expected life in years | 6.0 | | | 6.0 | | | 4.5 | |
| Expected volatility | 48.21 | % | | 47.8 | % | | 43.2 | % |
| Expected dividend yield | 1.05 | % | | 3.1 | % | ; | 3.5 | % |
| Risk-free interest rate | 1.83 | % |
| 2.8 | % | | 2.8 | % | |
| | | | | | | | |
| | Year Ended December 31, |
| | 2011 | | 2010 | | 2009 |
| Expected life in years | 6.0 |
| | 6.0 |
| | 6.0 |
|
| Expected volatility | 49.30 | % | | 48.21 | % | | 47.8 | % |
| Expected dividend yield | 2.28 | % | | 1.05 | % | | 3.1 | % |
| Risk-free interest rate | 1.44 | % | | 1.83 | % | | 2.8 | % |
A summary of the status of our stock option awards is presented in the table below.
| | | | | | | | | | | | | |
| Number of Stock Options | | Weighted-Average Exercise Price Per Share | | Weighted-Average Remaining Contractual Term | | Aggregate Intrinsic Value |
| | | | | | (in years) | | (in millions) |
| Outstanding at January 1, 2010 | 26,625,876 | | | $ | 23.75 | | | | | |
| Granted | 333,375 | | | 18.99 | | | | | |
| Exercised | (2,242,056 | ) | | 9.18 | | | | | |
| Forfeited | (337,637 | ) | | 38.21 | | | | | |
| Outstanding at December 31, 2010 | 24,379,558 | | | 24.83 | | | 3.8 | | | $ | 145 |
| | | | | | | | |
Exercisable at December 31, 2010 | 19,619,887 | | | 24.21 | | | 3.1 | | | 128 | |
|
| | | | | | | | | | | | | |
| Number of Stock Options | | Weighted- Average Exercise Price Per Share | | Weighted- Average Remaining Contractual Term | | Aggregate Intrinsic Value |
| | | | | | (in years) | | (in millions) |
| Outstanding as of January 1, 2011 | 24,379,558 |
| | $ | 24.83 |
| |
| |
|
| Granted | 370,025 |
| | 26.30 |
| |
| |
|
| Exercised | (4,345,678 | ) | | 11.56 |
| |
| |
|
| Forfeited | (497,319 | ) | | 50.29 |
| |
| |
|
| Outstanding as of December 31, 2011 | 19,906,586 |
| | 27.11 |
| | 3.5 |
| | $ | 67 |
|
| | | | | | | | |
| Exercisable as of December 31, 2011 | 17,864,926 |
| | 27.05 |
| | 3.0 |
| | 64 |
|
104
VALERO ENERGY CORPORATION AND SUBSIDIARIES
NOTES TO CONSOLIDATED FINANCIAL STATEMENTS (Continued)
The weighted-average grant-date fair value of stock options granted during the years ended December 31, 20102011, 20092010, and 20082009 was $8 .1710.10, $6.918.17, and $5.036.91 per stock option, respectively. The total intrinsic value of stock options exercised during the years ended December 31, 20102011, 20092010, and 20082009 was$63 million, $25 million, $12 million, and $4712 million, respectively. Cash received from stock option exercises for the years ended December 31, 20102011, 20092010, and 20082009 was$49 million, $20 million, $11 million, and $1611 million, respectively.
As of December 31, 20102011, there was $239 million of unrecognized compensation cos tcost related to outstanding unvested stock option awards, which is expected to be recognized over a weighted-average period of approximately twoone years.year.
VALERO ENERGY CORPORATION AND SUBSIDIARIES
NOTES TO CONSOLIDATED FINANCIAL STATEMENTS (Continued)
Restricted Stock
Restricted stock is granted to employees and non-employee directors. Restricted stock granted to employees vests in accordance with individual written agreements between the participants and us, usually in equal annual installments over a period of three to five years beginning one year after the date of grant. Restricted stock granted to our non-employee directors vests from one to three years following the date of grant. A summary of the status of our restricted stock awards is presented in the table below.
| | Number of Shares | | Weighted-Average Grant-Date Fair Value Per Share | | | | |
| Nonvested shares at January 1, 2010 | 2,598,297 | | | $ | 26.12 | | |
| |
Number of Shares | | Weighted- Average Grant-Date Fair Value Per Share |
| Nonvested shares as of January 1, 2011 | | 3,360,213 |
| | $ | 21.05 |
|
| Granted | 2,138,414 | | | 18.78 | | 1,297,464 |
| | 26.32 |
|
| Vested | (1,327,040 | ) | | 27.13 | | (1,350,658 | ) | | 23.17 |
|
| Forfeited | (49,458 | ) | | 26.20 | | (57,929 | ) | | 20.66 |
|
| Nonvested shares at December 31, 2010 | 3,360,213 | | | 21.05 | | |
| Nonvested shares as of December 31, 2011 | | 3,249,090 |
| | 22.28 |
|
As of December 31, 20102011, there was $4744 million of unrecognized compensation cost related to outstanding unvested restricted stock awards, which is expected to be recognized over a weighted-average period of approximately two years. The total fair value of restricted stock that vested during the years ended December 31, 20102011, 20092010, and 20082009 was $2532 million, $1225 million, and $12 million, respectively.
Performance Awards
Performance awards are issued to certain of our key employees and represent rights to receive shares of our common stock upon the achievement by us of an objective performance measure. The objective performance measure is our total shareholder return, which is ranked among the total shareholder returns of a defined peer group of companies. Our ranking determines the rate at which the performance awards convert into our common shares. Conversion rates can range from zero to a maximum of 200 percent.
Performance awards vest in equal one-third increments (tranches) on an annual basis. Our compensation committee establishes the peer group of companies for each tranche of awards at the beginning of the one-year vesting period for that tranche. Therefore, performance awards are not considered to be granted for accounting purposes until our compensation committee establishes the peer group of companies for each tranche of awards. The fair value of each tranche of awards is determine ddetermined at the time the awards are considered to be granted and is based on the expected conversion rate for those awards and the fair value per share. Fair
VALERO ENERGY CORPORATION AND SUBSIDIARIES
NOTES TO CONSOLIDATED FINANCIAL STATEMENTS (Continued)
value per share is equal to the market price of our common stock on the grant date reduced by expected dividends over that tranche’s vesting period.
IfFor performance awards awarded in 2010, if a tranche of these awards fails to meet the minimum performance measure at the end of its vesting period as established by our compensation committee, that tranche of awards remains outstanding for an additional year and may convert into our common shares that following year. If such tranche of awards does not convert to our common shares the following year, those awards are forfeited. Performance awards awarded in 2011 do not have carry-forward features.
VALERO ENERGY CORPORATION AND SUBSIDIARIES
NOTES TO CONSOLIDATED FINANCIAL STATEMENTS (Continued)
A summary of the status of our performance awards considered granted is presented below.
| | | Nonvested Awards | | Vested Awards | | | | |
| Awards as of January 1, 2010 | 48,455 | | | 67,882 | | |
| | | Nonvested Awards | | Vested Awards |
| Awards outstanding as of January 1, 2011 | | 253,611 |
| | 24,219 |
|
| Granted | 253,611 | | | — | | 468,941 |
| | — |
|
| Vested | (48,455 | ) | | 48,455 | | (31,361 | ) | | 31,361 |
|
| Converted | — | | | (58 ,186 | ) | — |
| | — |
|
| Forfeited | — | | | (33,932 | ) | — |
| | (30,945 | ) |
| Awards as of December 31, 2010 | 253,611 | | | 24,219 | | |
| Awards outstanding as of December 31, 2011 | | 691,191 |
| | 24,635 |
|
There were two grants of performance awards during the year ended December 31, 20102011 as follows (dollars in millions). The fair valuefirst grant shown below represents the second tranche of vesting awards from the performance awards authorized by our compensation committee in 2010. The second grant shown represents the first granttranche of 31,361vesting awards was based on an expected conversion rate of 50 percent and a fair value per share of $18.15. The fair value offrom the second grant of 222,250performance awards which are subject to vesting during the year ending December 31, 2011 was based on an expected conversion rate of 83 percent and a fair value per share of $18.79.authorized by our compensation committee in 2011.
|
| | | | | | | | |
| | Awards Granted | | Expected Conversion Rate | | Fair Value Per Share |
| First grant | 222,250 |
| | 50% | | $ | 25.70 |
|
| Second grant | 246,691 |
| | —% | | 25.70 |
| Total | 468,941 |
| | | | |
VALERO ENERGY CORPORATION AND SUBSIDIARIES
NOTES TO CONSOLIDATED FINANCIAL STATEMENTS (Continued)
Inc ome
Income (loss) from continuing operations before income tax expense (benefit) from domesticU.S. and foreigninternational operations was as follows (in millions):
| | | | | | | | | | | |
| | Year Ended December 31, |
| | 2010 | | 2009 | | 2008 |
| U.S. operations | $ | 1,436 | | | $ | (371 | ) | | $ | (307 | ) |
| Canada operations | 223 | | | 222 | | | 605 | |
| Aruba operations | (161 | ) | | (167 | ) | | (14 | ) |
Income (loss) from continuing operations before income tax expense (benefit) | $ | 1,498 | | | $ | (316 | ) | | $ | 284 | |
|
| | | | | | | | | | | |
| | Year Ended December 31, |
| | 2011 | | 2010 | | 2009 |
| U.S. operations | $ | 3,190 |
| | $ | 1,436 |
| | $ | (371 | ) |
| International operations | 132 |
| | 62 |
| | 55 |
|
| Income (loss) from continuing operations before income tax expense (benefit) | $ | 3,322 |
| | $ | 1,498 |
| | $ | (316 | ) |
The following is a reconciliation of income tax expense (benefit) related to continuing operations to income taxes computed by applying the U.S. statutory federal income tax rate (35 percent for all years presented) to income (loss) from continuing operations before income tax expense (benefit) (in millions):
| | | | | | | | | | | |
| | Year Ended December 31, |
| | 2010 | | 2009 | | 2008 |
Federal income t ax expense (benefit) at the U.S. statutory rate | $ | 524 | | | $ | (111 | ) | | $ | 99 | |
U.S. state income tax expense (benefit), net of U.S. federal income tax effect | (21 | ) | | (2 | ) | | 18 | |
| U.S . manufacturing deduction | 5 | | | 7 | | | (55 | ) |
| Canada operations | (12 | ) | | (6 | ) | | (27 | ) |
| Aruba operations | 39 | | | 81 | | | 7 | |
| Goodwill impairment | — | | | — | | | 1,346 | |
| Permanent differences | 8 | | | (7 | ) | | 25 | |
| Change in tax law | 16 | | | — | | | — | |
| Other, net | 16 | | | (5 | ) | | 25 | |
| Income tax expense (benefit) | $ | 575 | | | $ | (43 | ) | | $ | 1,438 | |
|
| | | | | | | | | | | |
| | Year Ended December 31, |
| | 2011 | | 2010 | | 2009 |
Federal income tax expense (benefit) at the U.S. statutory rate | $ | 1,163 |
| | $ | 524 |
| | $ | (111 | ) |
U.S. state income tax expense (benefit), net of U.S. federal income tax effect | 29 |
| | (21 | ) | | (2 | ) |
| U.S. manufacturing deduction | (28 | ) | | 5 |
| | 7 |
|
| International operations | 46 |
| | 27 |
| | 75 |
|
| Permanent differences | 8 |
| | 8 |
| | (7 | ) |
| Change in tax law | — |
| | 16 |
| | — |
|
| Other, net | 8 |
| | 16 |
| | (5 | ) |
| Income tax expense (benefit) | $ | 1,226 |
| | $ | 575 |
| | $ | (43 | ) |
The Aruba Refinery’s profits through June 1, 2010 were non-taxable in Aruba due to a tax holiday granted by the GOA. The tax holiday, which expired on June 1, 2010, had an immaterial effect on our consolidated results of operat ionsoperations for the years ended December 31, 2010, and 2009, and 2008.
Income taxesThe income tax benefit related to discontinued operations for the years ended December 31, 20102011, 20092010, and 20082009 werewas $4 million, $370 million benefit,, and $1.1 billion benefit, and $29 million expense,, respectively.
VALERO ENERGY CORPORATION AND SUBSIDIARIES
NOTES TO CONSOLIDATED FINANCIAL STATEMENTS (Continu ed)(Continued)
Components of income tax expense (benefit) related to continuing operations were as follows (in millions):
| | | | | | | | | | | |
| | Year Ended December 31, |
| | 2010 | | 2009 | | 2008 |
| Current: | | | | | |
| U.S. federal | $ | (75 | ) | | $ | (309 | ) | | $ | 766 | |
| U.S. state | (13 | ) | | (16 | ) | | 3 | |
| Canada | 39 | | &nbs p; | 120 | | | 45 | |
| Aruba | (17 | ) | | 22 | | | 2 | |
| Total current | (66 | ) | | (183 | ) | | 816 | |
| | | | | | |
| Deferred: | | | | | |
| U.S. federal | 634 | | | 181 | | | 456 | |
| U.S. state | (19 | ) | | 12 | | | 26 | |
| Canada | 26 | | | (53 | ) | | 140 | |
| Total deferred | 641 | | | 140 | | | 622 | |
| Income tax expense (benefit) | $ | 575 |
| | $ | (43 | ) | | $ | 1,438 | | |
| | | | | | | | | | | |
| | Year Ended December 31, |
| | 2011 | | 2010 | | 2009 |
| Current: | | | | | |
| U.S. federal | $ | 562 |
| | $ | (75 | ) | | $ | (309 | ) |
| U.S. state | 13 |
| | (13 | ) | | (16 | ) |
| International | 186 |
| | 22 |
| | 142 |
|
| Total current | 761 |
| | (66 | ) | | (183 | ) |
| | | | | | |
| Deferred: | | | | | |
| U.S. federal | 527 |
| | 634 |
| | 181 |
|
| U.S. state | 32 |
| | (19 | ) | | 12 |
|
| International | (94 | ) | | 26 |
| | (53 | ) |
| Total deferred | 465 |
| | 641 |
| | 140 |
|
| Income tax expense (benefit) | $ | 1,226 |
| | $ | 575 |
| | $ | (43 | ) |
VALERO ENERGY CORPORATION AND SUBSIDIARIES
NOTES TO CONSOLIDATED FINANCIAL STATEMENTS (Continued)
The tax effects of significant temporary differences representing deferred income tax assets and liabilities were as follows (in millions):
| | | | December 31, | December 31, |
| 2010 | | 2009 | 2011 | | 2010 |
| Deferred income tax assets: | | | | | | |
| Tax credit carryforwards | $ | 99 | | | $ | 88 | | $ | 158 |
| | $ | 99 |
|
| Net operating losses (NOL) | 265 | | | 241 | | 300 |
| | 265 |
|
| Compensation and employee benefit liabilities | 286 | | | 304 | | 324 |
| | 286 |
|
| Environmental liabilities | 85 | | | 85 | | 78 |
| | 85 |
|
| Inventories | 170 | | | 152 | | 273 |
| | 170 |
|
| Property, plant and equipment | | 14 |
| | — |
|
| Other | 184 | | | 234 | | 160 |
| | 184 |
|
| Total deferred income tax assets | 1,089 | | | 1,104 | | 1,307 |
| | 1,089 |
|
| Less: Valuation allowance | (270 | ) | | (200 | ) | (295 | ) | | (270 | ) |
| Net deferred income tax assets | 819 | | | 904 | | 1,012 |
| | 819 |
|
| | | | | | | |
| Deferred income tax liabilities: | | | | | | |
| Turnarounds | (256 | ) | | (212 | ) | (310 | ) | | (256 | ) |
| Property, plant and equipment | (4,835 | ) | | (4,280 | ) | (5,292 | ) | | (4,835 | ) |
| Inventories | (260 | ) | | (399 | ) | (274 | ) | | (260 | ) |
| Other | (65 | ) | | (92 | ) | (119 | ) | | (65 | ) |
| Total deferred income tax liabilities | (5,416 | ) | | (4,983 | ) | (5,995 | ) | | (5,416 | ) |
| | | | | |
| Net deferred income tax liabilities | $ | (4,597 | ) | | $ | (4,079 | ) | $ | (4,983 | ) | | $ | (4,597 | ) |
We had the following income tax credit and loss carryforwards as of December 31, 20102011, (in millions):
| | | | Amount | | Expiration | Amount | | Expiration |
| U.S. state income tax credits | $ | 69 | | | 2012 through 2029 | $ | 63 |
| | 2013 through 2027 |
| U.S. state inc ome tax credits | 36 | | | Unlimited | |
| Foreign tax credit | 30 | | | 2012 | |
| U.S. state income tax credits | | 42 |
| | Unlimited |
| U.S. foreign tax credits | | 30 |
| | 2012 |
| U.S. state NOL (gross amount) | 5,492 | | | 2011 through 20 30 | 5,431 |
| | 2012 through 2031 |
| International NOL | | 249 |
| | Unlimited |
| U.S. alternative minimum tax credit | | 59 |
| | Unlimited |
We have recorded a valuation allowance as of December 31, 20102011 and 20092010, due to uncertainties related to our ability to utilize some of our deferred income tax assets, primarily consisting of certain U.S. state NOLs stateand income tax credits, international NOLs, and U.S. foreign tax credits, before they expire. The valuation allowance is based on our estimates of taxable income in the various jurisdictions in which we operate and the period over which deferred income tax assets will be recoverable. The realization of net deferred income
VALERO ENERGY CORPORATION AND SUBSIDIARIES
NOTES TO CONSOLIDATED FINANCIAL STATEMENTS (Continued)
tax assets recorded as of December 31, 20102011 is primarily dependent upon our ability to generate future taxable income in certain U.S. states and international jurisdictions and foreign source income in the U.S.
��
VALERO ENERGY CORPORATION AND SUBSIDIARIES
NOTES TO CONSOLIDATED FINANCIAL STATEMENTS (Continued)
Subsequently recognized ta xtax benefits related to the valuation allowance for deferred income tax assets as of December 31, 20102011 will be allocated as follows (in millions):
| | | Income tax benefit | $ | 261 | | $ | 286 |
|
| Additional paid-in capital | 9 | | 9 |
|
| Total | $ | 270 | | $ | 295 |
|
Deferred income taxes have not been provided on the future tax consequences attributable to differences between the financial statement carrying amounts of existing assets and liabilities and the respective tax bases of our foreigninternational subsidiaries based on the determination that such differences are essentially permanent in duration in that the earnings of these subsidiaries are expected to be indefinitely reinvested in foreignthe international operations. As of December 31, 20102011, the cumulative undistributed ea rningsearnings of these subsidiaries were approximately $4.44.9 billion. If those earnings were not considered indefinitely reinvested, deferred income taxes would have been recorded after consideration of U.S. foreign tax credits. In addition, as a result of our Pembroke Acquisition, certain U.S. tax elections may be available to us. The decision by us to forego these elections could significantly increase our taxable earnings and profits. It is not practicable to estimate the amount of additional tax that might be payable on those earnings, if distributed.
The following is a reconciliation of the change in unrecognized tax benefits, excluding the effect of related penalties and interest and the U.S. federal tax effect of U.S. state unrecognized tax benefits (in millions):
| | | | Year Ended December 31, | Year Ended December 31, |
| | 2010 | | 2009 | | 2008 | 2011 | | 2010 | | 2009 |
| Balance as of beginning of year | $ | 484 | | | $ | 238 | | | $ | 164 | | $ | 330 |
| | $ | 484 |
| | $ | 238 |
|
| Additions based on tax positions related to the current year | 4 | | | 158 | | | 17 | | 14 |
| | 4 |
| | 158 |
|
| Additions for tax positions related to prior years | 49 | | | 106 | | | 67 | | 55 |
| | 49 |
| | 106 |
|
| Reductions for tax positions related to prior years | (203 | ) | | (6 | ) | | (5 | ) | (66 | ) | | (203 | ) | | (6 | ) |
Reductions for tax positions related to the lapse of applicable statute of limitations | (4 | ) | | (1 | ) | | (5 | ) | (3 | ) | | (4 | ) | | (1 | ) |
| Settlements | — | | | (11 | ) | | — | | (4 | ) | | — |
| | (11 | ) |
| Balance as of end of year | $ | 330 | | | $ | 484 | | | $ | 238 | | $ | 326 |
| | $ | 330 |
| | $ | 484 |
|
As of December 31, 20102011, 20092010, and 20082009, there were $153135 million, $155153 million, and $136155 million respectively, of unrecognized tax benefits that if recognized would affect our annual effective tax rate. We do not expect our unrecognized tax benefits to change significantly over the next 12 months.
During the years ended December 31, 20102011, 20092010, and 20082009, we recognized approximately $191 million, $2219 million, and $22 million in interest and penalties, which is reflected within income tax expen seexpense (benefit). We had accrued approximately $109110 million and $90109 million for the payment of interest and penalties as of December 31, 20102011 and 20092010, respectively.
Our tax years through 2001, UDS’s tax years through 2001, and Premcor’s tax years for 2002 and 2003 a re closed to adjustment by the Internal Revenue Service.
VALERO ENERGY CORPORATION AND SUBSIDIARIES
NOTES TO CONSOLIDATED FINANCIAL STATEMENTS (Continued)
Our tax years for 2002 through 2007 are currently under examination2009 and Premcor’sPremcor Inc.’s separate tax years for 2004 and 2005 are currently under examination.examination by the IRS. Premcor Inc. was merged into Valero effective September 1, 2005. The Internal Revenue ServiceIRS proposed adjustments to our taxable income for certain open years, including adjustments related to depreciation methods.methods and how we accounted for line fill, which is the volume of hydrocarbon materials present within our Units and pipelines necessary to maintain pressure and provide uninterrupted flow. We are protesting the proposed adjustments and do not expect
VALERO ENERGY CORPORATION AND SUBSIDIARIES
NOTES TO CONSOLIDATED FINANCIAL STATEMENTS (Continued)
that the ultimate disposition of these findingsadjustments will result in a material change to our financial position or results of operations. We b elieveThus, we believe that adequate provisions for income taxes have been reflected in the consolidated financial statements.
VALERO ENERGY CORPORATION AND SUBSIDIARIES
NOTES TO CONSOLIDATED FINANCIAL STATEMENTS (Continued)
| |
| 17. | EARNINGS (LOSS) PER COMMON SHARE |
Earnings (loss) per common share from continuing operations were computed as follows (dollars and shares in millions, except per share amounts): | | | | | | | | | | | | | | | | | | | | | | |
| | Year Ended December 31, |
| | 2010 | | 2009 | | 2008 |
| | Restricted Stock | | Common Stock | | Restricted Stock | | Common Stock | | Restricted Stock | | Common Stock |
| Earnings (loss) per common share from continuing operations: | | | | | | | | | | | |
| Income (loss) from continuing operations | | | $ | 923 | | | | | $ | (273 | ) | | | | $ | (1,154 | ) |
| Less dividends paid: | | | | | | | | | | | |
| Common stock | | | 113 | | | | | 323 | | | | | 298 | |
| Nonvested restricted stock | | | 1 | | | | | 1 | | | | | 1 | |
| Undistributed earnings (loss) | | | $ | 809 | | | | | $ | (597 | ) | | | | $ | (1,453 | ) |
| Weighted-average common shares outstanding | 3 | | | 563 | | | 2 | | | 541 | | | 1 | | | 524 | |
| Earnings (loss) per common share from continuing operations: | | | | | | | | | | | |
| Distributed earnings | $ | 0.21 | | | $ | 0.20 | | | $ | 0.61 | | | $ | 0.60 | | | $ | 0.56 | | | $ | 0.57 | |
| Undistributed earnings (loss) | 1.43 | | | 1.43 | | | — | | |
(1.10 | ) | | — | | | (2.77 | ) | Total earnings (loss) per common share from continuing operations | $ | 1.64 | | | $ | 1.63 | | | $ | 0.61 | | | $ | (0.50 | ) | | $ | 0.56 | | | $ | (2.20 | ) |
Earnings (loss) per common share from continuing operations – assuming dilution: | | | | | | | | | | | |
Income (loss) from continuing operations | | | $ | 923 | | | | | $ | (273 | ) | | | | $ | (1,154 | ) |
Weighted-average common shares outstanding | | | 563 | | | | | 541 | | | | | 524 | |
Common equivalent shares: | | | | | | | | | | | |
Stock options | | | 3 | | | | | — | | | | | — | |
Performance awards and unvested restricted stock | | | 2 | | | | | — | | | | | —
| |
Weighted-average common shares outstanding – assuming dilution | | | 568 | | | | | 541 | | | | | 524 | |
Earnings (loss) per common share from continuing operations – assuming dilution | | | $ | 1.62 | | | | | $ | (0.50 | ) | | | | $ | (2.20 | ) |
|
| | | | | | | | | | | | | | | | | | | | | | | |
| | Year Ended December 31, |
| | 2011 | | 2010 | | 2009 |
| | Restricted Stock | | Common Stock | | Restricted Stock | | Common Stock | | Restricted Stock | | Common Stock |
| Earnings per common share from continuing operations: | | | | | | | | | | | |
| Net income (loss) attributable to Valero stockholders from continuing operations | | | $ | 2,097 |
|
| |
| $ | 923 |
|
| |
| $ | (273 | ) |
| Less dividends paid: | | | | | | | | | | | |
| Common stock | | | 168 |
| | | | 113 |
| | | | 323 |
|
| Nonvested restricted stock | | | 1 |
| | | | 1 |
| | | | 1 |
|
| Undistributed earnings (loss) | | | $ | 1,928 |
| | | | $ | 809 |
| | | | $ | (597 | ) |
| Weighted-average common shares outstanding | 3 |
| | 563 |
| | 3 |
| | 563 |
| | 2 |
| | 541 |
|
| Earnings per common share from continuing operations: | | | | | | | | | | | |
| Distributed earnings | $ | 0.30 |
| | $ | 0.30 |
| | $ | 0.20 |
| | $ | 0.20 |
| | $ | 0.60 |
| | $ | 0.60 |
|
| Undistributed earnings (loss) | 3.40 |
| | 3.40 |
| | 1.43 |
| | 1.43 |
| | — |
| | (1.10 | ) |
| Total earnings per common share from continuing operations | $ | 3.70 |
| | $ | 3.70 |
| | $ | 1.63 |
| | $ | 1.63 |
| | $ | 0.60 |
| | $ | (0.50 | ) |
| | | | | | | | | | | | |
| Earnings per common share from continuing operations – assuming dilution: | | | | | | | | | | | |
| Net income (loss) attributable to Valero stockholders from continuing operations | | | $ | 2,097 |
| | | | $ | 923 |
| | | | $ | (273 | ) |
| Weighted-average common shares outstanding | | | 563 |
| | | | 563 |
| | | | 541 |
|
| Common equivalent shares: | | | | | | | | | | | |
| Stock options | | | 4 |
| | | | 3 |
| | | | — |
|
| Performance awards and unvested restricted stock | | | 2 |
| | | | 2 |
| | | | — |
|
| Weighted-average common shares outstanding – assuming dilution | | | 569 |
| | | | 568 |
| | | | 541 |
|
| Earnings per common share from continuing operations – assuming dilution | | | $ | 3.69 |
| | | | $ | 1.62 |
| | | | $ | (0.50 | ) |
VALERO ENERGY CORPORATION AND SUBSIDIARIES
NOTES TO CONSOLIDATED FINANCIAL STATEMENTS (Continued)
The following table reflects potentially dilutive securities (in millions) that were excluded from the calculation of “earnings (loss) per common share from continuing operations – assuming dilution” as the effect of including such securities would have been antidilutive. These potentially dilutive securities included common equivalent shares (primarily stock options), which were excluded due to the loss from continuing operations for 2009 and 2008, and stock options for which the exercise prices were greater than the average market price of our common shares during each respective reporting period.
| | | | Year Ended December 31, | Year Ended December 31, |
| | 2010 | | 2009 | | 2008 | 2011 | | 2010 | | 2009 |
| Common equivalent shares | — | | | 4 | | | 7 | | — |
| | — |
| | 4 |
|
| Stock options | 14 | | | 12 | | | 7 | | 6 |
| | 14 |
| | 12 |
|
VALERO ENERGY CORPORATION AND SUBSIDIARIES
NOTES TO CONSOLIDATED FINANCIAL STATEMENTS (Continued)
| |
18. ; | SEGMENT INFORMATION |
Prior to the second quarter of 2009, we had twoWe have three reportable segments, which were refining, retail, and retail. As a result of the VeraSun Acquisition during the second quarter of 2009 (as discussed in Note 2), ethanol is presented as a third reportable segment.ethanol. Our refining segment includes refining operations, wholesale marketing, product supply and distribution, and transportation operations. The retail segment includes company-operated convenience stores, Canadian dealers/jobbers and truckstop facilities, cardlock facilities, and home heating oil operations. Our ethanol segment includes primarily sales of internally-produced ethanol and distillers grains. Operations that are not included in any of the three reportable segments are included in the corporate category.
The reportable segments are strategic business units that offer different products and services. They are managed separately as each business requires unique technology and marketing strategies. Performance is evaluated based on operating income. Intersegment sales are generally derived from transactions made at prevailing market rates.
The following table reflects activity related to continuing operations (in millions):
| | | | | | | | | | | | | | | | | | | |
| | Refining | | Retail | | Ethanol | | Corporate | | Total |
| Year ended December 31, 2010: | | | | | | | | | |
Operating revenues from external customers | $ | 69,854 | | | $ | 9,339 | | | $ | 3,040 | | | $ | — | | | $ | 82,233 | |
| Intersegment revenues | 6,416 | | | — | | | 245 |
| | — | | | 6,661 | | Depreciation and amortization expense | 1,210 | | | 108 | | | 36 | | | 51 | | | 1,405 | |
Operating income (loss) | 1,903 | | | 346 | | | 209 | | | (582 | ) | | 1,876 | |
Total expenditures for long-lived assets | 2,084 | | | 102 | | | — | | | 48 | | | 2,234 | |
| | | | | | | | | |
Year ended December 31, 2009: | | | | | | | | | |
Operating revenues from external
customers | | | | | | | | | | | | | | | | | | | | | | | Refining | | Retail | | Ethanol | | Corporate | | Total | | Year ended December 31, 2011: | | | | | | | | | | Operating revenues from external customers | $ | 109,138 |
| | $ | 11,699 |
| | $ | 5,150 |
| | $ | — |
| | $ | 125,987 |
| | Intersegment revenues | 8,665 |
| | — |
| | 145 |
| | — |
| | 8,810 |
| | Depreciation and amortization expense | 1,338 |
| | 115 |
| | 39 |
| | 42 |
| | 1,534 |
| | Operating income (loss) | 3,516 |
| | 381 |
| | 396 |
| | (613 | ) | | 3,680 |
| | Total expenditures for long-lived assets | 2,556 |
| | 134 |
| | 32 |
| | 265 |
| | 2,987 |
| | | | | | | | | | | | | Year ended December 31, 2010: | | | | | | | | | | Operating revenues from external customers | 69,854 |
| | 9,339 |
| | 3,040 |
| | — |
| | 82,233 |
| | Intersegment revenues | 6,416 |
| | — |
| | 245 |
| | — |
| | 6,661 |
| | Depreciation and amortization expense | 1,210 |
| | 108 |
| | 36 |
| | 51 |
| | 1,405 |
| | Operating income (loss) | 1,903 |
| | 346 |
| | 209 |
| | (582 | ) | | 1,876 |
| | Total expenditures for long-lived assets | 2,084 |
| | 102 |
| | — |
| | 48 |
| | 2,234 |
| | | | | | | | | | | | | Year ended December 31, 2009: | | | | | | | | | | Operating revenues from external customers | 55,516 |
| | 7,885 |
| | 1,198 |
| | — |
| | 64,599 |
| | Intersegment revenues | 5,137 |
| | — |
| | 137 |
| | — |
| | 5,274 |
| | Depreciation and amortization expense | 1,194 |
| | 101 |
| | 18 |
| | 48 |
| | 1,361 |
| | Operating income (loss) | 247 |
| | 293 |
| | 165 |
| | (622 | ) | | 83 |
| | Total expenditures for long-lived assets | 2,338 |
| | 66 |
| | 5 |
| | 39 |
| | 2,448 |
|
| 55,516 | | | 7,885 | | | 1,198 | | | — | | | 64,599 | |
Intersegment revenues | 5,137 | | | — | | | 137 | | | — | | | 5,274 | |
Depreciation and amortization expense | 1,194 | | | 101 | | | 18 | | | 48 | | | 1,361 | |
Operating income (loss) | 247 | | | 293 | | | 165 | | | (622 | ) | | 83 | |
Total expenditures for long-lived assets | 2,338 | | | 66 | | | 5 | | | 39 | | | 2,448 | |
| | | | | | | | |
Year ended December 31, 2008: | | | | | | | | | |
Operating revenues from external
customers
| 96,148 | | | 10,528 | |
| — | | | — | | | 106,676 | | Intersegment revenues | 7,703 | | | — | | | — | | | — | | | 7,703 | |
Depreciation and amortization expense | 1,155 | | | 105 | | | — | | | 44 | | | 1,304 | |
Operating income (loss) | 765 | | | 369 | | | — | | | (603 | ) | | 531 | |
Total expenditures for long-lived assets | 2,476 | | | 104 | | | — | | | 141 | | | 2,721 | |
VALERO ENERGY CORPORATION AND SUBSIDIARIES
NOTES TO CONSOLIDATED FINANCIAL STATEMENTS (Continued)
Our principal products include conventional and CARB gasolines, RBOB (reformulated gasoline blendstock for oxygenate blending), ultra-low-sulfur diesel, and oxygenates and other gasoline blendstocks. We also produce a substantial slate of middle distillates, jet fuel, and petrochemicals, in addition to lube oils and asphalt. Other product revenues include such products as gas oils, No. 6 fuel oil, and petroleum coke. Operating revenues from external cus tomerscustomers for our principal products were as follows (in millions):
| | | | Year Ended December 31, | Year Ended December 31, |
| | 2010 | | 2009 | | 2008 | 2011 | | 2010 | | 2009 |
| Refining: | | | | | | | | | | |
| Gasolines and blendstocks | $ | 35,731 | | | $ | 28,320 | | | $ | 42,647 | | $ | 49,019 |
| | $ | 33,491 |
| | $ | 27,322 |
|
| Distillates | 26,402 | | | 20,526 | | | 40,723 | | 43,713 |
| | 26,402 |
| | 20,526 |
|
| Petrochemicals | 3,161 | | | 2,177 | | | 3,837 | | 4,253 |
| | 3,161 |
| | 2,177 |
|
| Lubes and asphalts | 1,315 | | | 1,126 | | | 1,879 | | 1,948 |
| | 1,315 |
| | 1,126 |
|
| Other product revenues | 3,245 | | | 3,367 | | | 7,062 | | 10,205 |
| | 5,485 |
| | 4,365 |
|
| Total refining operating revenues | 69,854 | | | 55,516 | | | 96,148 | | 109,138 |
| | 69,854 |
| | 55,516 |
|
| Retail: | | | | | | | | | | |
| Fuel sales (gasoline and diesel) | 7,498 | | | 6,148 | | | 8,750 | | 9,730 |
| | 7,498 |
| | 6,148 |
|
| Merchandise sales and other | 1,581 | | | 1,505 | | | 1,446 | | 1,635 |
| | 1,581 |
| | 1,505 |
|
| Home heating oil | 260 | | | 232 | | | 332 | | 334 |
| | 260 |
| | 232 |
|
| Total retail operating revenues | 9,339 | | | 7,885 | | | 10,528 | | 11,699 |
| | 9,339 |
| | 7,885 |
|
| Ethanol: | | | | | | | | | | |
| Ethanol | 2,647 | | | 1,032 | | | — | | 4,436 |
| | 2,647 |
| | 1,032 |
|
| Distillers grains | 393 | | | 166 | | | — | | 714 |
| | 393 |
| | 166 |
|
| Total ethanol operating revenues | 3,040 | | | 1,198 | | | — | | 5,150 |
| | 3,040 |
| | 1,198 |
|
| Consolidated operating revenues | $ | 82,233 | | | $ | 64,599 | | | $ | 106,676 | | $ | 125,987 |
| | $ | 82,233 |
| | $ | 64,599 |
|
Operating revenues by geographic area are shown in the table below (in millions). The geographic area is based on location of customer and no customer accounted for more than 10 percent of our consolidated operating revenues.
| | | | | | | | | | | |
| | Year Ended December 31, |
| | 2010 | | 2009 | | 2008 |
| U.S. | $ | 67,392 | | | $ | 55,247 | | | $ | 88,703 |
| Canada | 6,945 | | | 6,048 | | | 9,961 | |
| Other countries | 7,896 | | | 3,304 | | | 8,012 | |
| Consolidated operating revenues | $ | 82,233 | | |
$ | 64,599 | | | $ | 106,676 | | |
| | | | | | | | | | | |
| | Year Ended December 31, |
| | 2011 | | 2010 | | 2009 |
| U.S. | $ | 98,806 |
| | $ | 67,392 |
| | $ | 55,247 |
|
| Canada | 10,110 |
| | 6,945 |
| | 6,048 |
|
| U.K. | 4,297 |
| | 149 |
| | — |
|
| Other countries | 12,774 |
| | 7,747 |
| | 3,304 |
|
| Consolidated operating revenues | $ | 125,987 |
| | $ | 82,233 |
| | $ | 64,599 |
|
VALERO ENERGY CORPORATION AND SUBSIDIARIES
NOTES TO CONSOLIDATED FINANCIAL STATEMENTS (Continued)
Long-lived assets include property, plant and equipment, intangible assets, and certain long-lived assets included in “deferred charges and other assets, net.” Geographic information by country for long-lived assets including long-lived assets related to discontinued operations, consisted of the following (in millions):
| | | | December 31, | December 31, |
| | 2010 | | 2009 | 2011 | | 2010 |
| U.S. | $ | 20,488 | | | $ | 20,810 | | $ | 22,317 |
| | $ | 20,488 |
|
| Canada | 2,308 | | | 2,239 | | 2,362 |
| | 2,308 |
|
| U.K. | | 848 |
| | — |
|
| Aruba | 981 | | | 1,002 | | 958 |
| | 981 |
|
| Consolidated long-lived assets | $ | 23,777 | | | $ | 24,051 | | |
| Total long-lived assets | | $ | 26,485 |
| | $ | 23,777 |
|
Total assets by reportable segment including assets related to discontinued operations, which are entirely related to our refining segment, were as follows (in million s)millions):
| | | | December 31, | December 31, |
| | 2010 | | 2009 | 2011 | | 2010 |
| Refining | $ | 30,363 | | | $ | 30,844 | | $ | 38,164 |
| | $ | 30,363 |
|
| Retail | 1,925 | | | 1,875 | | 1,999 |
| | 1,925 |
|
| Ethanol | 953 | | | 654 | | 943 |
| | 953 |
|
| Corporate | 4,380 | | | 2,199 | | 1,677 |
| | 4,380 |
|
| Total consolidated assets | $ | 37,621 | | | $ | 35,572 | | |
| Total assets | | $ | 42,783 |
| | $ | 37,621 |
|
VALERO ENERGY CORPORATION AND SUBSIDIARIES
NOTES TO CONSOLIDATED FINANCIAL STATEMENTS (Continued)
| |
| 19. | SUPPLEMENTAL CASH FLOW INFORMATION |
In order to determine net cash provided by operating activities, net income (loss) is adjusted by, among other things, changes in current assets and current liabilities as follows (in millions):
| | | | | | | | | | | |
| Year Ended December 31, |
| 2010 | | 2009 | | 2008 |
Decrease (increase) in current assets: | | | | | |
Receivables, net | $ | (679 | ) | | $
| (806 | ) | | $ | 4,865 | |
Inventories | (407 | ) | | (77 | ) | | (705 | ) |
Income taxes receivable | 545 | | | (668 | ) | | (197 | ) |
Prepaid expenses and other | 107 | | | 56 | | | (107 | ) |
Increase (decrease) in current liabilities: | | | | | |
Accounts payable | 670 | | | 1,475 | | |
(4,985 | ) | Accrued expenses | (99 | ) | | 73 | | | (51 | ) |
Taxes other than income taxes | (66 | ) | | 107 | | | (4 | ) |
Income taxes payable | (3 | ) | | 95 | | | (446 | ) |
Changes in current assets and current liabilities | $
| 68 | | | $ | 255 | | | $ | (1,630 | ) |
|
| | | | | | | | | | | |
| | Year Ended December 31, |
| | 2011 | | 2010 | | 2009 |
| Decrease (increase) in current assets: | | | | | |
| Receivables, net | $ | (3,110 | ) | | $ | (679 | ) | | $ | (806 | ) |
| Inventories | 643 |
| | (407 | ) | | (77 | ) |
| Income taxes receivable | 128 |
| | 545 |
| | (668 | ) |
| Prepaid expenses and other | (2 | ) | | 107 |
| | 56 |
|
| Increase (decrease) in current liabilities: | | | | | |
| Accounts payable | 2,004 |
| | 670 |
| | 1,475 |
|
| Accrued expenses | (18 | ) | | (99 | ) | | 73 |
|
| Taxes other than income taxes | 312 |
| | (66 | ) | | 107 |
|
| Income taxes payable | 124 |
| | (3 | ) | | 95 |
|
| Changes in current assets and current liabilities | $ | 81 |
| | $ | 68 |
| | $ | 255 |
|
The above changes in current assets and current liabilities differ from changes between amounts reflected in the applicable consolidated balance sheets for the respective periods for the following reasons:
| |
• | the amounts shown above exclude changes in cash and temporary cash investments, deferred income taxes, and current portion of debt and capital lease obligations, as well as the effect of certain noncash investing and financing activities discussed below; |
| |
• | the amounts shown above exclude the current assets and current liabilities acquired i n connection with the acquisitions of ASA and Renew assets and the VeraSun Acquisition; |
| |
• | amounts accrued for capital expenditures, deferred turnaround and catalyst costs, and contingent earn-out payments are reflected in investing activities in the consolidated statements of cash flows when such amounts are paid; |
| |
• | amounts accrued for common stock purchases in the open market that are not settled as of the balance sheet date are reflected in financing activities in the consolidated statements of cash flows when the purchases are settled and paid; |
| |
• | changes in assets held for sale and liabilities related to assets held for sale pertaining to the operations of the Paulsboro, Delaware City, and Krotz Springs Refineries prior to their sale are reflected in the line items to which the changes relate in the table above; and |
| |
• | certain differences between consolidated balance sheet changes and consolidated statement of cash flow changes reflected above result from translating foreign currency denominated amounts at different exchange rates. |
the amounts shown above exclude changes in cash and temporary cash investments, deferred income taxes, and current portion of debt and capital lease obligations, as well as the effect of certain noncash investing and financing activities discussed below;
the amounts shown above exclude the current assets and current liabilities acquired in connection with the Meraux Acquisition in October 2011, the Pembroke Acquisition in August 2011, and the acquisitions of ethanol plants in 2010 and 2009;
amounts accrued for capital expenditures and deferred turnaround and catalyst costs are reflected in investing activities when such amounts are paid;
amounts accrued for common stock purchases in the open market that are not settled as of the balance sheet date are reflected in financing activities when the purchases are settled and paid;
changes in assets held for sale and liabilities related to assets held for sale pertaining to the operations of the Paulsboro and Delaware City Refineries prior to their sale are reflected in the line items to which the changes relate in the table above; and
certain differences between balance sheet changes and the changes reflected above result from translating foreign currency denominated amounts at the applicable exchange rates as of each balance sheet date.
VALERO ENERGY CORPORATION AND SUBSIDIARIES
NOTES TO CONSOLIDATED FINANCIAL STATEMENTS (Continued)
Noncash investing activities for the year ended December 31, 2010 consist of the $160 million note receivable from PBF Holding related to the sale of the Paulsboro Refinery discussed in Note 3. Noncash investing activities for the year ended December 31, 2008 consist of the contingent consideration received in the form of the $171 million earn-out agreement related to the sale of the Krotz Springs Refinery discussed in Note 3. There were no significant noncash investing activities for the yearyears ended December 31, 2011 and 2009.
There were no significant noncash financing activities for the years ended December 31, 20102011, 20092010, and 20082009.
Cash flows related to interest and income taxes were as follows (in millions):
| | | | Year Ended December 31, | Year Ended December 31, |
| | 2010 | | 2009 | | 2008 | 2011 | | 2010 | | 2009 |
| Interest paid in excess of amount capitalized | $ | (457 | ) | | $ | (390 | ) | | $ | (351 | ) | $ | (397 | ) | | $ | (457 | ) | | $ | (390 | ) |
| Income taxes received (paid), net | 690 | | | (165 | ) | | 1,455 | | (486 | ) | | 690 |
| | (165 | ) |
Cash flows related to the discontinued operations of the Paulsboro and Delaware City Refineri esRefineries have been combined with the cash flows from continuing operations within each category in the consolidated statements of cash flows for all years presented and are summarized as follows (in millions):
| | | | Year Ended December 31, | Year Ended December 31, |
| | 2010 | | 2009 | | 2008 | 2011 | | 2010 | | 2009 |
| Cash provided by (used in) operating activities: | | | | | | | | | | |
| Paulsboro Refinery | $ | 88 | | | $ | 10 | | | $ | 246 | | $ | — |
| | $ | 88 |
| | $ | 10 |
|
| Delaware City Refinery | (26 | ) | | (126 | ) | | 81 | | — |
| | (26 | ) | | (126 | ) |
| Cash used in investing activities: | | | | | | | | | | |
| Paulsboro Refinery | (41 | ) | | (121 | ) | | (212 | ) | — |
| | (41 | ) | | (121 | ) |
| Delaware City Refinery | — | | | (153 | ) | | (268 | ) | — |
| | — |
| | (153 | ) |
VALERO ENERGY CORPORATION AND SUBSIDIARIES
NOTES TO CONSOLIDATED FINANCIAL STATEMENTS (Continued)
20. FAIR VALUE MEASUREMENTS
| |
| 20. | FAIR VALUE MEASUREMENTS |
General
AGAAP requires that certain financial instruments, such as derivative instruments, be recognized at their fair values in our balance sheets. However, other financial instruments, such as debt obligations, are not required to be recognized at their fair values, but GAAP provides an option to elect fair value accounting for these instruments. GAAP requires the disclosure of the fair values of all financial instruments, regardless of whether they are recognized at their fair values or carrying amounts in our balance sheets. For financial instruments recognized at fair value, GAAP requires the disclosure of their fair values by type of instrument, along with other information, including changes in the fair values of certain financial instruments recognized in income or other comprehensive income, and this information is provided below under “Recurring Fair Value Measurements.” For financial instruments not recognized at fair value, the disclosure of their fair values is provided below under “Other Financial Instruments.”
Nonfinancial assets, such as property, plant and equipment, and nonfinancial liabilities are recognized at their carrying amounts in our balance sheets. GAAP does not permit nonfinancial assets and liabilities to be remeasured at their fair values. However, GAAP requires the remeasurement of such assets and liabilities to their fair values upon the occurrence of certain events, such as the impairment of property, plant and equipment. In addition, if such an event occurs, GAAP requires the disclosure of the fair value of the asset or liability along with other information, including the gain or loss recognized in income in the period the remeasurement occurred. This information is provided below under “Nonrecurring Fair Value Measurements.”
GAAP provides a framework for measuring fair value and establishes a three-level fair value hierarchy (Level 1, Level 2, or Level 3) is usedthat prioritizes inputs to categorize fair value amountsvaluation techniques based on the quality of inputs useddegree to which objective prices in external active markets are available to measure fair value. Accordingly,Following is a description of each of the levels of the fair values determined by value hierarchy.
Level 1 - Observable inputs, utilizesuch as unadjusted quoted prices in active markets for identical assets or liabilities. Fair values determined by
Level 2 inputs are based on quoted prices for similar assets and liabilities in active markets, and inputs - Inputs other than quoted prices included within Level 1 that are observable for the asset or liability. liability, either directly or indirectly. These include quoted prices for similar assets or liabilities in active markets and quoted prices for identical or similar assets or liabilities in markets that are not active.
Level 3 inputs are unobservable - Unobservable inputs for the asset or liability and include situations wherefor which there is little, if any, market activity forat the measurement date. Unobservable inputs reflect our own assumptions about what market participants would use to price the asset or liability. We use appropriate valuation techniquesThe inputs are developed based on the best information available in the circumstances, which might include occasional market quotes or sales of similar instruments or our own financial data such as internally developed pricing models, discounted cash flow methodologies, as well as instruments for which the fair value determination requires significant judgment.
The financial instruments and nonfinancial assets and liabilities included in our disclosure of recurring and nonrecurring fair value measurements are categorized according to the fair value hierarchy based on the inputs used to measure thetheir fair valuesvalues.
VALERO ENERGY CORPORATION AND SUBSIDIARIES
NOTES TO CONSOLIDATED FINANCIAL STATEMENTS (Continued)
Recurring Fair Value Measurements
The tables below present information (in millions) about our financial assets and liabilities measured and recordedinstruments recognized at their fair value on a recurring basis and indicatevalues in our balance sheets categorized according to the fair value hierarchy of the inputs utilized by us to determine the fair values as of December 31, 20102011 and 20092010.
| | | | | | | | | | | | | | | | | | | |
| | Fair Value Measurements Using | | | | |
| | Quoted Prices in Active Markets (Level 1) | | Significant Other Observable Inputs (Level 2) | | Significant Unobservable Inputs (Level 3) | | Netting Adjustments | | Total as of
December 31,
2010 |
| Assets: | | | | | | | | | |
| Commodity derivative contracts | $ | 3,240 | | | $ | 489 | | | $ | — | | | $ | (3,560 | ) | | $ | 169 | |
| Nonqualified benefit plans | 104 | | | — | | | 10 | | | — | | | 114 | |
| Liabilities: | | | | | | | | | |
| Commodity derivative contracts | 3,097 | | | 502 | | | — | | | (3,560 | ) | | 39 | |
| Nonqualified benefit plans | 36 | | | — | | | — | | | — | | | 36 | |
| | | | | | | | | | | | | | | | | | | |
| | Fair Value Measurements Using | | | | |
| | Quoted Prices in Active Markets (Level 1) | | Significant Other Observable Inputs (Level 2) | | Significant Unobservable Inputs (Level 3) | | Netting Adjustments | | Total as of
December 31,
2009 |
| Assets: | | | | | | | | | |
| Commodity derivative contracts | $ | 2,148 | | | $ | 2,517 | | | $ | — | | | $ | (4,306 | ) | | $ | 359 | |
| Nonqualified benefit plans | 99 | | | — | | | 10 | | | — | | | 109 | |
| Liabilities: | | | | | | | | | |
| Commodity derivative contracts | 2,239 | | | 2,176 | | | — | | |
(4,306 | ) | | 109 | | Nonqualified benefit plans | 34 | | | — | | | — | | | — | | | 34 | |
VALERO ENERGY CORPORATION AND SUBSIDIARIES
NOTES TO CONSOLIDATED FINANCIAL STATEMENTS (Continued)
The valuation methods used to measure our financial instruments at fair value are as follows:
| |
• | Commodity derivative contracts, consisting primarily of exchange-traded futures and swaps, are measured at fair value using the market approach. Exchange-traded futures are valued based on quoted prices from the exchange and are categorized in Level 1 of the fair value hierarchy. Swaps are priced using third-party broker quotes, industry pricing services, and exchange-traded curves, with appropriate consideration of counterparty credit risk, but since they have contractual terms that are not identical to exchange-traded futures instruments with a comparable market price, these financial instruments are categorized in Level 2 of the fair value hierarchy. |
| |
• | The nonqualified benefit plan assets and nonqualified benefit plan liabilities categorized in Level 1 of the fair value hierarchy are measured at fair value using a market approach based on quotations from national securities exchanges. The nonqualified benefit plan assets categorized in Level 3 of the fair value hierarchy represent insurance contracts, the fair values of which are provided by the insurer. |
AsCash collateral deposits of December 31, 2010$136 million, cash collateral deposi ts of and $403 million with brokers under master netting arrangements isare included in the fair value of the commodity derivatives reflected in Level 1. As1 as of December 31, 20092011 and December 31, 2010, cash received from brokers of $64 million resulting from the equity in broker accounts covered by master netting arrangements exceeding the minimum margin requirements for such accounts, is netted against the fair value of the commodity derivatives reflected in Level 1.respectively. Certain of our commodity derivative contracts under master netting arrangements include both asset and liability positio ns.positions. We have elected to offset the fair value amounts recognized for multiple similar derivative instruments executed with the same counterparty, including any related cash collateral asset or obligation;obligation under the column “Netting Adjustments” below; however, fair value amounts by hierarchy level are presented on a gross basis in the tables above.below.
|
| | | | | | | | | | | | | | | | | | | |
| | Fair Value Measurements Using | | | | |
| | Quoted Prices in Active Markets (Level 1) | | Significant Other Observable Inputs (Level 2) | | Significant Unobservable Inputs (Level 3) | | Netting Adjustments | | Total as of
December 31,
2011 |
| Assets: | | | | | | | | | |
| Commodity derivative contracts | $ | 2,038 |
| | $ | 78 |
| | $ | — |
| | $ | (1,940 | ) | | $ | 176 |
|
| Physical purchase contracts | — |
| | (2 | ) | | — |
| | — |
| | (2 | ) |
| Investments of certain benefit plans | 84 |
| | — |
| | 11 |
| | — |
| | 95 |
|
| Other investments | — |
| | — |
| | — |
| | — |
| | — |
|
| Liabilities: | | | | | | | | | |
| Commodity derivative contracts | 1,864 |
| | 101 |
| | — |
| | (1,940 | ) | | 25 |
|
| Obligations of certain benefit plans | 34 |
| | — |
| | — |
| | — |
| | 34 |
|
VALERO ENERGY CORPORATION AND SUBSIDIARIES
NOTES TO CONSOLIDATED FINANCIAL STATEMENTS (Continued)
|
| | | | | | | | | | | | | | | | | | | |
| | Fair Value Measurements Using | | | | |
| | Quoted Prices in Active Markets (Level 1) | | Significant Other Observable Inputs (Level 2) | | Significant Unobservable Inputs (Level 3) | | Netting Adjustments | | Total as of
December 31,
2010 |
| Assets: | | | | | | | | | |
| Commodity derivative contracts | $ | 3,240 |
| | $ | 489 |
| | $ | — |
| | $ | (3,560 | ) | | $ | 169 |
|
| Physical purchase contracts | — |
| | 17 |
| | — |
| | — |
| | 17 |
|
| Investments of certain benefit plans | 104 |
| | — |
| | 10 |
| | — |
| | 114 |
|
| Other investments | — |
| | — |
| | — |
| | — |
| | — |
|
| Liabilities: | | | | | | | | | |
| Commodity derivative contracts | 3,097 |
| | 502 |
| | — |
| | (3,560 | ) | | 39 |
|
| Biofuels blending obligation | 51 |
| | — |
| | — |
| | — |
| | 51 |
|
| Obligations of certain benefit plans | 36 |
| | — |
| | — |
| | — |
| | 36 |
|
A description of our financial instruments and the valuation methods used to measure those instruments at fair value are as follows:
Commodity derivative contracts consist primarily of exchange-traded futures and swaps, and as disclosed in Note 21, some of these contracts are designated as hedging instruments. These contracts are measured at fair value using the market approach. Exchange-traded futures are valued based on quoted prices from the exchange and are categorized in Level 1 of the fair value hierarchy. Swaps are priced using third-party broker quotes, industry pricing services, and exchange-traded curves, with appropriate consideration of counterparty credit risk, but because they have contractual terms that are not identical to exchange-traded futures instruments with a comparable market price, these financial instruments are categorized in Level 2 of the fair value hierarchy.
Physical purchase contracts to purchase inventories represent the fair value of firm commitments to purchase crude oil feedstocks and the fair value of fixed-price corn purchase contracts, and as disclosed in Note 21, some of these contracts are designated as hedging instruments. The fair values of these firm commitments and purchase contracts are measured using a market approach based on quoted prices from the commodity exchange, but because these commitments have contractual terms that are not identical to exchange-traded futures instruments with a comparable market price, they are categorized in Level 2 of the fair value hierarchy.
Investments of certain benefit plan assets consist of investment securities held by trusts for the purpose of satisfying a portion of our obligations under certain U.S. nonqualified benefit plans. The assets categorized in Level 1 of the fair value hierarchy are measured at fair value using a market approach based on quotations from national securities exchanges. The assets categorized in Level 3 of the fair value hierarchy represent insurance contracts, the fair value of which is provided by the insurer. Obligations of certain benefit plans relate to certain U.S. nonqualified defined contribution plans under which our obligations to eligible employees are equal to the fair value of the assets held by those plans.
Other investments consist of (i) equity securities of private companies over which we do not exercise significant influence nor whose financial statements are consolidated into our financial statements
VALERO ENERGY CORPORATION AND SUBSIDIARIES
NOTES TO CONSOLIDATED FINANCIAL STATEMENTS (Continued)
and (ii) debt securities of a private company whose financial statements are not consolidated into our financial statements. We have elected to account for these investments at their fair values. These investments are categorized in Level 3 of the fair value hierarchy as the fair values of these investments are determined using the income approach based on internally developed analyses.
Our biofuels blending obligation represents a liability for the purchase of RINs and RTFCs, as defined and described in Note 21 under “Compliance Program Price Risk,” to satisfy our obligation to blend biofuels into the products we produce. Our obligation is based on our deficiency in RINs and RTFCs and the price of these instruments as of the balance sheet date. Our obligation is categorized in Level 1 of the fair value hierarchy and is measured at fair value using the market approach based on quoted prices from an independent pricing service.
The following is a reconciliation of the beginning and ending balances (in millions) for fair value measurements developed using significant unobservable inputs for the years ended December 31.(Level 3).
| | | | | | | | | | | | | | | | | | | | | | | |
| | Nonqualified Benefit Plans | | Earn-Out Agreement |
| | 2010 | | 2009 | | 2008 | | 2010 | | 2009 | | 2008 |
| Balance at beginning of year | $ | 10 | | | $ | — | | | $ | — | | | $ | — | | | $ | 13 | | | $ | — | |
Alon earn-out agreement (see Note 3) | — | | | — | | | — | | | — | | | (33 | ) | | 171 | |
Total gains (losses) included in earnings | — | | | — | | | — | | | — | | | 20 | | | (158 | ) |
Transfers in and/or out of & nbsp;Level 3 | — | | | 10 | | | — | | | — | | | — | | | — | |
| Balance at end of year | $ | 10 | | | $ | 10 | | | $ | — | | | $ | — | | | $ | — | | | $ | 13 | |
The amount of total gains (losses) included in earnings attributable to the change in unrealized gains or losses relating to assets still held at December 31 | $ | — | | | $ | — | | | $ | — | | | $ | — | | | $ | — | | | $ | (158 | ) |
|
| | | | | | | | | | | | | | | | | | | | | | | | | | | | | | | | | | | |
| | Investments of Certain Benefit Plans | | Other Investments | | Earn-Out Agreement |
| | 2011 | | 2010 | | 2009 | | 2011 | | 2010 | | 2009 | | 2011 | | 2010 | | 2009 |
| Balance as of beginning of year | $ | 10 |
| | $ | 10 |
| | $ | — |
| | $ | — |
| | $ | — |
| | $ | — |
| | $ | — |
| | $ | — |
| | $ | 13 |
|
| Purchases | 1 |
| | — |
| | — |
| | 21 |
| | 1 |
| | — |
| | — |
| | — |
| | — |
|
| Settlements | — |
| | — |
| | — |
| | — |
| | — |
| | — |
| | — |
| | — |
| | (33 | ) |
| Total losses included in income | — |
| | — |
| | — |
| | (21 | ) | | (1 | ) | | — |
| | — |
| | — |
| | 20 |
|
| Transfers in and/or out of Level 3 | — |
| | — |
| | 10 |
| | — |
| | — |
| | — |
| | — |
| | — |
| | — |
|
| Balance as of end of year | $ | 11 |
| | $ | 10 |
| | $ | 10 |
| | $ | — |
| | $ | — |
| | $ | — |
| | $ | — |
| | $ | — |
| | $ | — |
|
| The amount of total losses included in income attributable to the change in unrealized losses relating to assets still held at end of period | $ | — |
| | $ | — |
| | $ | — |
| | $ | (21 | ) | | $ | (1 | ) | | $ | — |
| | $ | — |
| | $ | — |
| | $ | — |
|
VALERO ENERGY CORPORATION AND SUBSIDIARIESNOTES TO CONSOLIDATED FINANCIAL STATEMENTS (Continued)
For the yearsyear ended December 31, 2009 and 2008, the amountsamount reflected in “total gains (losses)losses included in earnings”income” in the table above related to the earn-out agreement are reporte dreported in “other income, net.” We entered into thean earn-out agreement with Alon Refining Krotz Springs, Inc. in connection with the sale of our Krotz Springs Refinery in 2008 as discussed in Note 3.2008. We also entered into commodity derivative instruments to hedge the risk of changes in the fair value of the earn-out agreement. The gains (losses) associated with these instruments are also reported in “other income, net.”
Non-recurring
Nonrecurring Fair Value Measurements
The table below presents information (in millions) about our nonfinancial assets and liabilities measured and recorded at fair value on a nonrecurring basis and indicates the fair value hierarchy of the inputs utilized by us to determine the fair values as ofDecember 31, 2009. As of and for the year ended December 31, 2011 and 2010, there were no nonfinancial assets or liabilities that were measured and recorded at fair value on a nonrecurring basis.
| | | | | | | | | | | | | | | | | | |
| Fair Value Measurements Using | | | | |
| Quoted Prices in Active Markets
(Level 1)
| | Significant Other Observable Inputs
(Level 2) |
| Significant Unobservable Inputs
(Level 3)
| | Total as of
December 31,
2009 | | Total Losses | Assets: | | | | | | | | | |
Long-lived assets of
discontinued Delaware City Refinery
| $ | — | | | $
| — | | | $ | 16 | | | $ | 16 | | | $ | (1,901 | ) |
Cancelled capital projects
in progress
| — | | | — | | | — | | | — | | | (607 | ) |
Liabilities: | | | | | | | | | |
Asset retirement
obligations
| — | | | — | | | 95 | | | 95 | | | (95 | ) |
The $16 million fair value of the discontinued Delaware City Refinery represented our estimated net realizable value for the combined cycle power plant, which was the only part of the refinery that was deemed to have any salvage value as of December 31, 2009. The $1.9 billion loss, which is reflected in discontinued operations for the year ended December 31, 2009, relates to the impairment loss reco gnized related to all long-lived assets of the Delaware City Refinery, as discussed in Note 3. See Note 4 for a discussion of the loss resulting from the cancellation of various capital projects in progress.
Asset retirement obligations in the tables above are calculated based on the present value of estimated removal and other closure costs using our internal risk-free rate of return or appropriate equivalent. The $95 million loss relates to asset retirement costs associated with the shutdown of the Delaware City Refinery, which is included in the loss from discontinued operations for the year ended December 31, 2009.
VALERO ENERGY CORPORATION AND SUBSIDIARIES
NOTES TO CONSOLIDATED FINANCIAL STATEMENTS (Continued)
Other Financial Instruments
Financial instruments that we recognize in our balance sheets at their carrying amounts include cash and temporary cash investments, receivables, payables, debt and capital lease obligations. The fair values of these financial instruments approximate their carrying amounts, except for debt as shown in the table below (in millions):
|
| | | | | | | |
| | December 31, |
| | 2011 | | 2010 |
| Carrying amount | $ | 7,690 |
| | $ | 8,300 |
|
| Fair value | 9,298 |
| | 9,492 |
|
The fair value of our debt is determined using the market approach based on quoted prices in active markets (Level 1).
| |
| 21. | PRICE RISK MANAGEMENT ACTIVITIES |
We are exposed to market risks related to the volatility in the price of commodities, the price of financial instruments associated with governmental and regulatory compliance programs, interest rates, and foreign currency exchange rates, and we enter into derivative instruments to manage thosesome of these risks. We also enter into derivative instruments to manage the price risk on other contractual derivatives into which we have entered. The only types of derivative instruments we enter into are those related to the various commodities we purchase or produce, financial instruments we must purchase to maintain compliance with various governmental and regulatory programs, interest rate swaps, and foreign cur rencycurrency exchange and purchase contracts, as described below. All derivative instruments are recorded as either assets or liabilities measured at their fair values.values (see Note 20).
When we enter into a derivative instrument, it is designated as a fair value hedge, a cash flow hedge, an economic hedge, or a trading activity.derivative. The gain or loss on a derivative instrument designated and qualifying as a fair value hedge, as well as the offsetting loss or gain on the hedged item attributable to the hedged risk, areis recognized currently in income in the same period. The effective portion of the gain or loss on a derivative instrument designated and qualifying as a cash flow hedge is initially reported as a component of other comprehensive income and is then recorded in income in the period or periods during which the hedged forecasted transaction affects income. The ineffective portion of t hethe gain or loss on the cash flow derivative instrument, if any, is recognized in income as incurred. For our economic hedging relationships (hedgeshedges (derivative instruments not designated as fair value or cash flow hedges) and for derivative instruments entered into by us for trading purposes, the derivative instrument is recorded at fair value and changes in the fair value of the derivative instrument are recognized currently in income. The cash flow effects of all of our derivative contractsinstruments are reflected in operating activities in the consolidatedour statements of cash flows for all periods presented.
VALERO ENERGY CORPORATION AND SUBSIDIARIES
NOTES TO CONSOLIDATED FINANCIAL STATEMENTS (Continued)
Commodity Price Risk
We are exposed to market risks related to the volatility in the price of crude oil, refined products (primarily gasoline and d istillate)distillate), grain (primarily corn), and natural gas used in our refining operations. To reduce the impact of price volatility on our results of operations and cash flows, we use commodity derivative instruments, including futures, swaps, futures, and options. We use the futures markets for the available liquidity, which provides greater flexibility in transacting our hedging and trading operations. We use swaps primarily to manage our price exposure. Our positions in commodity derivative instruments are monitored and managed on a daily basis by a risk control group to ensure compliance with our stated risk management policy that has been approved by our board of directors.
For risk management purposes, we use fair value hedges, cash flow hedges, and economic hedges. In addition to the use of derivative instruments to manage commodity price risk, we also enter into certain commodity derivative instruments for trading purposes. Our objective for entering into each type of hedge or trading activityderivative is described below.
VALERO ENERGY CORPORATION AND SUBSIDIARIES
NOTES TO CONSOLIDATED FINANCIAL STATEMENTS (Continued)
Fair Value Hedges
Fair value hedges are used to hedge price volatility in certain refining inventories and firm commitments to purchase inventories. The level of activity for our fair value hedges is based on the level of our operating inventories, and generally represents the amount by which o urour inventories differ from our previous year-end LIFO inventory levels.
As of December 31, 20102011, we had the following outstanding commodity derivative instruments that were entered into to hedge crude oil and refined product inventories.inventories and commodity derivative instruments related to the physical purchase of crude oil and refined products at a fixed price. The information presents the notional volume of outstanding contracts by type of instrument and year of maturity (volumes in thousands of barrels).
|
| | | |
| | | Notional Contract Volumes by Year of Maturity |
| Derivative Instrument | | 20112012 |
| Crude oil and refined products: | | |
Futures -– long | | 13,589
15,398 |
|
Futures -– short | | 23,24035,708 |
|
| Physical contracts – long | | 20,310 |
|
VALERO ENERGY CORPORATION AND SUBSIDIARIES
NOTES TO CONSOLIDATED FINANCIAL STATEMENTS (Continued)
Cash Flow Hedges
Cash flow hedges are used to hedge price volatility in certain forecasted feedstock and refined product purchases, refined product sales, and natural gas purchases. The objective of our cash flow hedges is to lock in the price of forecasted feedstock, product or natural gas purchases or refined product sales at existing market prices that we deem favorable.
As of December 31, 20102011, we had nothe following outstanding commodity derivative instruments that were designated as cash flow hedges.entered into to hedge forecasted purchases or sales of crude oil and refined products. The information presents the notional volume of outstanding contracts by type of instrument and year of maturity (volumes in thousands of barrels).
|
| | | |
| | Notional Contract Volumes by Year of Maturity |
| Derivative Instrument | | 2012 |
| Crude oil and refined products: | | |
| Swaps – long | | 5,961 |
|
| Swaps – short | | 5,961 |
|
| Futures – long | | 38,201 |
|
| Futures – short | | 36,637 |
|
| Physical contracts – short | | 1,564 |
|
VALERO ENERGY CORPORATION AND SUBSIDIARIES
NOTES TO CONSOLIDATED FINANCIAL STATEMENTS (Continued)
Economic Hedges
Economic hedges represent commodity derivative instruments that are hedges not designated as fair value or cash flow hedges thatand are used to (i) manage price volatility in certain (i) refinery feedstock, refined product, and corn inventories, and (ii) manage price volatility in certain forecasted refinery feedstock, refined product, and corn purchases, and refined product sales, and natural gas purchases.(iii) fixed-price corn purchase contracts. Our objective infor entering into economi ceconomic hedges is consistent with the objectives discussed above for fair value hedges and cash flow hedges. However, the economic hedges are not designated as a fair value hedge or a cash flow hedge for accounting purposes, usually due to the difficulty of establishing the required documentation at the date that the derivative instrument is entered into that would allow us to achieve “hedge deferral accounting.”
As of December 31, 20102011, we had the following outstanding commodity derivative instruments that were entered into as economic hedges.hedges and commodity derivative instruments related to the physical purchase of corn at a fixed price. The information presents the notional volume of outstanding contracts by type of instrument and year of maturity (volumes in thousands of barrels, except those iden tifiedidentified as corn contracts that are presented in thousands of bushels).
| | | | | | |
| | | Notional Contract Volumes by Year of Maturity |
| Derivative Instrument | | 2011 | | 2012 |
| Crude oil and refin ed products: | | | | |
| Swaps - long | | 149,100 | | | — | |
| Swaps - short | | 147,872 | | | — | |
| Futures - long | | 164,130 | | | 223 | |
| Futures - short | | 164,163 | | | 323 | |
| Options - long | | 2,410 | | | — | |
| Options - short | | 2,400 | | | — | |
| Corn: | | | | |
| Futures - long | | 10,670 | | | 40 | |
| Futures - short | | 56,895 | | | 2,870 | |
|
| | | | | | |
| | | Notional Contract Volumes by Year of Maturity |
| Derivative Instrument | | 2012 | | 2013 |
| Crude oil and refined products: | | | | |
| Swaps – long | | 67,862 |
| | — |
|
| Swaps – short | | 67,040 |
| | — |
|
| Futures – long | | 70,211 |
| | — |
|
| Futures – short | | 65,339 |
| | — |
|
| Options – long | | 10 |
| | — |
|
| Corn: | | | | |
| Futures – long | | 18,530 |
| | — |
|
| Futures – short | | 49,565 |
| | 780 |
|
| Physical contracts – long | | 20,377 |
| | 833 |
|
VALERO ENERGY CORPORATION AND SUBSIDIARIES
NOTES TO CONSOLIDATED FINANCIAL STATEMENTS (Continued)
Trading ActivitiesDerivatives
Derivatives entered into for trading purposes represent commodity derivative instruments held or issued for trading purposes. Our objective infor entering into commodity derivative instruments for trading purposes is to take advantage of existing market conditions related to commodities that we perceive as opportunities to benefit ourfuture results of operations and cash flows, but for which there are no related physical transactions.flows.
As of December 31, 20102011, we had the following outstanding commodity derivative instruments that were entered into for trading purposes. The information presents the notional volume of outstanding contracts by type of instrument and year of maturity (volumes represent thousands of barrels, except those identified as natural gas contracts that are presented in billions of British thermal units and corn contracts that are presented in thousands of bushels).
| | | | | | |
| | | Notional Contract Volumes by Year of Maturity |
| De rivative Instrument | | 2011 | | 2012 |
| Crude oil and refined products: | | | | |
| Swaps - long | | 20,111 | | | — | |
| Swaps - short | | 20,111 | | | — | |
| Futures - long | | 30,400 | | | 969 | |
| Futures - short | | 30,139 | | | 1,094 | |
| Natural gas: | | | | |
| Futures - long | | 2,500 | |
| — | | Futures - short | | 2,500 | | | — | |
Corn: | | | | |
Futures - | | | | | | | | | | | Notional Contract Volumes by Year of Maturity | | Derivative Instrument | | 2012 | | 2013 | | Crude oil and refined products: | | | | | | Swaps – long | | 15,128 |
| | 2,000 |
| | Swaps – short | | 14,968 |
| | 2,000 |
| | Futures – long | | 50,126 |
| | 825 |
| | Futures – short | | 50,133 |
| | 825 |
| | Options – long | | 300 |
| | — |
| | Options – short | | 600 |
| | — |
| | Natural gas: | | | | | | Futures – long | | 400 |
| | — |
| | Futures – short | | 400 |
| | — |
| | Options – long | | 2,000 |
| | — |
| | Corn: | | | | | | Swaps – long | | 1,050 |
| | — |
| | Swaps – short | | 3,355 |
| | — |
| | Futures – long | | 2,510 |
| | — |
| | Futures – short | | 2,310 |
| | — |
|
Compliance Program Price Risk We are exposed to market risks related to the volatility in the price of financial instruments associated with various governmental and regulatory compliance programs that we must purchase in the open market to comply with these programs. These programs are described below.
Obligation to Blend Biofuels We are obligated to blend biofuels into the products we produce in most of the countries in which we operate, and those countries set annual quotas for the percentage of biofuels that must be blended into the motor fuels consumed in these countries. As a producer of motor fuels from petroleum, we are obligated to blend biofuels into the products we produce at a rate that is at least equal to the applicable quota. To the degree we are unable to blend at the applicable rate in the U.S. and the U.K., we must purchase Renewable Identification Numbers (RINs) in the U.S. and Renewable Transport Fuel Obligation certificates (RTFCs) in the U.K., and
VALERO ENERGY CORPORATION AND SUBSIDIARIES NOTES TO CONSOLIDATED FINANCIAL STATEMENTS (Continued)
as such, we are exposed to the volatility in the market price of these financial instruments. We have not entered into derivative instruments to manage this risk, but we purchase RINs and RTFCs when the price of these instruments is deemed favorable. For the years ended December 31, 2011, 2010, and 2009, the cost of meeting our obligations under these compliance programs was $231 million, $66 million, and $96 million, respectively, and these amounts are reflected in cost of sales.
Maintaining Minimum Inventory Quantities In the U.K., we are required to maintain a minimum quantity of refined products as a reserve against shortages or interruptions in the supply of these products. To the degree we decide not to physically hold the minimum quantity of these products, we must purchase Compulsory Stock Obligation (CSO) tickets from other suppliers of refined products in the U.K. or other European Union (EU) member countries, and we make economic decisions as to the cost of maintaining certain quantities of refined products versus the cost of purchasing CSO tickets. We have not entered into derivative instruments to manage the price volatility of CSO tickets. For the year ended December 31, 2011, the cost of purchasing CSO tickets to help meet our obligations under this compliance program was $4 million, and this amount was reflected in cost of sales. We had no obligations under this compliance program prior to completing the Pembroke Acquisition in 2011.
Emission Allowances Our Pembroke Refinery is subject to a maximum amount of carbon dioxide that it can emit each year under the EU Emissions Trading Scheme. Under this cap-and-trade program, we purchase emission allowances on the open market for the difference between the amount of carbon dioxide emitted and the maximum amount allowed under the program. Therefore, we are exposed to the volatility in the market price of these allowances. For the year ended December 31, 2011, the cost of meeting our obligation under this compliance program was $2 million, and this amount is reflected in refining operating expenses. We had no obligations under this compliance program prior to completing the Pembroke Acquisition in 2011.
We enter into derivative instruments (futures) to reduce the impact of this risk on our results of operations and cash flows. Our positions in these derivative instruments are monitored and managed on a daily basis by a risk control group to ensure compliance with our stated risk management policy that has been approved by our board of directors. As of December 31, 2011, we had purchased futures contracts – long | | 1,550 | | | — | |
Futures - short | | 1,150 | | | — | |
for 68,000 metric tons of EU emission allowances that were entered into as economic hedges. As of December 31, 2011, the fair value of these futures contracts was immaterial and therefore not separately presented in the table below under “Fair Values of Derivative Instruments.” For the year ended December 31, 2011, the loss recognized in income on these derivative instruments designated as economic hedges was also immaterial and therefore not separately presented in the table below under “Effect of Derivative Instruments on Statements of Income and Other Comprehensive Income.”
Interest Rate Risk
Our primary market risk exposure for changes in interest rates relates to our debt obligations. We manage our exposure to changing interest rates through the use of a combination of fixed-rate and floating-rate debt. In addition, at times we have used interest rate swap agreements to manage our fixed to floating interest rate position by converting certain fixed-rate debt to floating-rate debt. These interest rate swap agreements are generally accounted for as fair value hedges. However, we have not had any outstanding interest rate swap agreements since 2006.
VALERO ENERGY CORPORATION AND SUBSIDIARIES
NOTES TO CONSOLIDATED FINANCIAL STATEMENTS (Continued)
Foreign Currency Risk
We are exposed to exchange rate fluctuations on transactions related toentered into by our Canadianinternational operations that are denominated in currencies other than the local (functional) currencies of these operations. To manage our exposure to these exchange rate fluctuations, we use foreign currency exchange and purchase contracts. These contrac tscontracts are not designated as hedging instruments for accounting purposes, and therefore they are classified as economic hedges. As of December 31, 20102011, we had commitments to purchase $487751 million of U.S. dollars. These commitments matured on or before January 31, 201126, 2012.
Fair Values of Derivative Instruments
The following tables provide information about the fair values of our derivative instruments as of December 31, 20102011 and 20092010 (in millions) and the line items in the consolidated balance sheetsheets in which the fair values are reflected. See Note 20 for additional information related to the fair values of our derivative instruments.
As indicated in Note 20, we net fair value amounts recognized for multiple similar derivative instruments executed with the same counterparty under master netting arrangements. The tables below, however, are presented on a gross asset and gross liability basis, which results in the reflection of certain assets in liability accounts and certain liabilities in asset accounts. In addition, in Note 20, we included cash collateral on deposit with or received from brokers in the fair value of the commodity derivatives; these cash amounts are not reflected in the tables below.
| | | | | Fair Value as of | | | | | | |
| | | | December 31, 2010 | Balance Sheet Location | | December 31, 2011 |
| | Balance Sheet Location | | Asset Derivatives | | Liability Derivatives | | Asset Derivatives | | Liability Derivatives |
| Derivatives designated as hedging instruments | | | | | | | | | | |
| Commodity contracts: | | | | | | | | | | |
| Futures | Receivables, net | | $ | 120 | | | $ | 183 | | Receivables, net | | $ | 264 |
| | $ | 240 |
|
| Swaps | Prepaid expenses and other | | 55 | | | 39 | | |
| Swaps | Accrued expenses | | 31 | | | 32 | | Accrued expenses | | 36 |
| | 46 |
|
| Total | | | $ | 206 | | | $ | 254 | | | | $ | 300 |
| | $ | 286 |
|
| | | | | | | | | |
| Derivatives not designated as hedging instruments | | | | | | | | | | |
| Commodity contracts: | | | | | | | | | | |
| Futures | Receivables, net | | $ | 2,717 | | | $ | 2,914 | | Receivables, net | | $ | 1,636 |
| | $ | 1,624 |
|
| Swaps | Prepaid expenses and other | | 287 | | | 277 | | Prepaid expenses and other | | 4 |
| | 2 |
|
| Swaps | Accrued expenses | | 116 | | | 148 | | Accrued expenses | | 38 |
| | 51 |
|
| Options | Accrued expenses | | — | | | 6 | | Receivables, net | | 2 |
| | — |
|
| Options | | Accrued expenses | | — |
| | 2 |
|
| Physical purchase contracts | | Inventories | | — |
| | 2 |
|
| Total | | | $ | 3,120 | | | $ | 3,345 | | | | $ | 1,680 |
| | $ | 1,681 |
|
| Total derivatives | | | $ | 3,326 | | | $ | 3,599 | | | | $ | 1,980 |
| | $ | 1,967 |
|
VALERO ENERGY CORPORATION AND SUBSIDIARIES
NOTES TO CONSOLIDATED FINANCIAL STATEMENTS (Continued)
| | | | | | | | | |
| | | Fair Value as of |
| | | December 31, 2009 |
| Balance Sheet
Location
| | Asset
Derivatives
| | Liability
Derivatives
|
Derivatives designated as hedging instruments | | | | | |
Commodity contracts: | | | | | |
Futures | Receivables, net | | $ | 1 | | | $ | 2 | |
Futures | Accrued expenses | | 13 | | | 37 | |
Swaps | Receivables, net | | 308 | | | 271 | |
Swaps | Prepaid expenses and other | | 579 | | | 415 | |
Swaps | Accrued expenses | | 28 | | | 19 | |
Total | | | $ | 929 | | | $ | 744 | |
| | | | | |
Derivatives not designated as hedging instruments | | | | | |
Commodity contracts: | | | | | |
Futures | Receivables, net | | $ | 34 | | | $ | 29 | |
Futures | Accrued expenses | | 2,094 | | | 2,101 | |
Swaps | Receivables, net | | 506 | | | 370 | |
Swaps | Prepaid expenses and other | | 1,049 | | | 1,037 | |
Swaps | Accrued expenses | | 46 | | | 62 | |
Options | Accrued expenses | | — | | | 1 | |
Total | | | $ | 3,729 | | | $ | 3,600 | |
Total derivatives | | | $ | 4,658 | | | $ | 4,344 | |
|
| | | | | | | | | |
| | Balance Sheet Location | | December 31, 2010 |
| | | Asset Derivatives | | Liability Derivatives |
| Derivatives designated as hedging instruments | | | | | |
| Commodity contracts: | | | | | |
| Futures | Receivables, net | | $ | 120 |
| | $ | 183 |
|
| Swaps | Prepaid expenses and other | | 55 |
| | 39 |
|
| Swaps | Accrued expenses | | 31 |
| | 32 |
|
| Total | | | $ | 206 |
| | $ | 254 |
|
| | | | | | |
| Derivatives not designated as hedging instruments | | | | | |
| Commodity contracts: | | | | | |
| Futures | Receivables, net | | $ | 2,717 |
| | $ | 2,914 |
|
| Swaps | Prepaid expenses and other | | 287 |
| | 277 |
|
| Swaps | Accrued expenses | | 116 |
| | 148 |
|
| Options | Accrued expenses | | — |
| | 6 |
|
| Physical purchase contracts | Inventories | | 17 |
| | — |
|
| Total | | | $ | 3,137 |
| | $ | 3,345 |
|
| Total derivatives | | | $ | 3,343 |
| | $ | 3,599 |
|
Market and Counterparty Risk
Our price risk management activities involve th ethe receipt or payment of fixed price commitments into the future. These transactions give rise to market risk, which is the risk that future changes in market conditions may make an instrument less valuable. We closely monitor and manage our exposure to market risk on a daily basis in accordance with policies approved by our board of directors. Market risks are monitored by a risk control group to ensure compliance with our stated risk management policy. Concentrations of customers in the refining industry may impact our overall exposure to counterparty risk because these customers may be similarly affected by changes in economic or other conditions. In addition, financial services companies are the counterparties in certain of our price risk management activities, and such financial services companies may be adversely affected by periods of uncertainty and illiquidity in the credit and capital markets.
As of December 31, 2011, we had net receivables related to derivative instruments of $2 million from counterparties in the refining industry and no amounts from counterparties in the financial services industry. As of December 31, 2010, we had net receivables related to derivative instruments of $4 million from counterparties in the refining industry and $21 million from counterparties in the financial services industry. As of December 31, 2009, we had net receivables related to derivative instruments of $19 million from counterparties in the refining industry and $157 million from counterparties in the financial services industry. These amounts represent the aggregate amount payable to us by companies in those industries, reduced by
VALERO ENERGY CORPORATION AND SUBSIDIARIES
NOTES TO CONSOLIDATED FINANCIAL STATEMENTS (Continued)
payables from us to those companies under master netting arrangements that allow for the setoff of amounts receivable fr omfrom and payable to the same party. We do not require any collateral or other security to support derivative instruments into which we enter. We also do not have any derivative instruments that require us to maintain a minimum investment-grade credit rating.
VALERO ENERGY CORPORATION AND SUBSIDIARIES
NOTES TO CONSOLIDATED FINANCIAL STATEMENTS (Continued)
Effect of Derivative Instruments on Consolidated Statements of Income and Other Comprehensive Income
The following tables provide information about the gain or loss recognized in income and other comprehensive income on our derivative instruments for the years ended December 31, 2010 and 2009 (in millions), and the line items in the consolidated financial statements in which such gains and losses are reflected.reflected (in millions).
| | | | | | | | | | | | | | | | | | | | | | | | | |
Derivatives in Fair Value Hedging Relationships | | | | Gain or (Loss) Recognized in Income on Derivatives | | Gain or (Loss) Recognized in Income on Hedged Item | | Gain or (Loss) Recognized in Income for Ineffective Portion of Derivative |
| | Location | | 2010 | | 2009 | | 2010 | | 2009 | | 2010 | | 2009 |
| Commodity contracts | | Cost of sales | | $ | 45 | | | $ | (75 | ) | | $ | (40 | ) | | $ | 69 | | | $ | 5 | | | $ | (6 | ) |
|
| | | | | | | | | | | | | | |
Derivatives in Fair Value Hedging Relationships | | Location of Gain (Loss) Recognized in Income on Derivatives | | Year Ended December 31, |
| | | 2011 | | 2010 | | 2009 |
| Commodity contracts: | | | | | | | | |
Gain (loss) recognized in income on derivatives | | Cost of sales | | $ | (6 | ) | | $ | 45 |
| | $ | (75 | ) |
Gain (loss) recognized in income on hedged item | | Cost of sales | | (23 | ) | | (40 | ) | | 69 |
|
Gain (loss) recognized in income on derivatives (ineffective portion)
| | Cost of sales | | (29 | ) | | 5 |
| | (6 | ) |
For fair value hedges, no component of the derivative instruments’ gains or losses was excluded from the assessment of hedge effective ness.effectiveness for the years ended December 31, 2011, 2010, and 2009. No amounts were recognized in income for hedged firm commitments that no longer qualify as fair value hedges.hedges for the years ended December 31, 2011, 2010, and 2009.
| | | | | | | | | | | | | | | | | | | | | | | | | | | |
Derivatives in Cash Flow Hedging Relationships | | Gain or (Loss) Recognized in OCI on Derivatives (Effective Portion) | | Gain or (Loss) Reclassified from Accumulated OCI into Income (Effective Portion) | | Gain or (Loss) Recognized in Income on Derivatives (Ineffective Portion) |
| | 2010 | | 2009 | | Location | | 2010 | | 2009 | | Location | 2010 | | 2009 |
| Commodity contracts | | $ | (2 | ) | | $ |
125 | | | Cost of sales | | $ | 178 | | | $ | 337 | | | Cost of sales
| $ | — | | | $ | 3 | | Commodity contracts |
| — | | | — | | | Income (loss) from discontinued operations, net of income taxes | | — | | | (132 | ) | | Income (loss) from discontinued operations, net of income taxes | — | | | —
| |
Total | | $ | (2 | ) | | $ | 125 | | | &nbs p; | | $ | 178 | | | $ | 205 | | | | $ | — | | | $ | 3 | |
|
| | | | | | | | | | | | | | |
Derivatives in Cash Flow Hedging Relationships | | Location of Gain (Loss) Recognized in Income on Derivatives | | Year Ended December 31, |
| | | 2011 | | 2010 | | 2009 |
| Commodity contracts: | | | | | | | | |
Gain (loss) recognized in OCI on derivatives (effective portion) | | | | $ | 32 |
| | $ | (2 | ) | | $ | 125 |
|
Gain (loss) reclassified from accumulated OCI into income (effective portion) | | Cost of sales | | 3 |
| | 178 |
| | 337 |
|
| | | Loss from discontinued operations, net of income taxes | | — |
| | — |
| | (132 | ) |
Gain (loss) recognized in income on derivatives (ineffective portion) | | Cost of sales | | 5 |
| | — |
| | 3 |
|
For cash flow hedges, no component of the derivative instruments’ gains or losses was excluded from the assessment of hedge effectiveness.effectiveness for the years ended December 31, 2011, 2010, and 2009. For the year ended December 31, 2011, cash flow hedges primarily related to forward sales of distillates and associated forward purchases of crude oil, with $19 million of cumulative after-tax gains on cash flow hedges remaining in accumulated other comprehensive income. We estimate that $19 million of the deferred gains as of December 31, 2011 will be reclassified into cost of sales over the next 12 months as a result of hedged transactions that are forecasted to occur. For the years ended December 31, 2011 and 2010, there were no amounts reclassified from accumulated other comprehensive income into income as a result of the
VALERO ENERGY CORPORATION AND SUBSIDIARIES
NOTES TO CONSOLIDATED FINANCIAL STATEMENTS (Continued)
discontinuance of cash flow hedge accounting. For the year ended December 31, 2009, there were$132 million of pre-tax losses reclassified from accumulated other comprehensive income into income as a result of the discontinuance of cash flow hedge accounting. This amount, which is the amount classified as a loss from discontinued operations in the table, relates to the forecasted sales of distillates that did not occur due to the shutdown of the Delaware City Refinery.
|
| | | | | | | | | | | | | | |
Derivatives Designated as Economic Hedges and Other Derivative Instruments | | Location of Gain Recognized in Income on Derivatives | | Year Ended December 31, |
| | | 2011 | | 2010 | | 2009 |
| Commodity contracts | | Cost of sales | | $ | (349 | ) | | $ | (210 | ) | | $ | 55 |
|
| Foreign currency contracts | | Cost of sales | | 18 |
| | (24 | ) | | (22 | ) |
| Other contract | | Cost of sales | | 29 |
| | — |
| | — |
|
| | | | | (302 | ) | | (234 | ) | | 33 |
|
| Alon earn-out agreement | | Other income, net | | — |
| | — |
| | 20 |
|
| Alon earn-out hedge commodity contracts | | Other income, net | | — |
| | — |
| | (62 | ) |
| | | | | — |
| | — |
| | (42 | ) |
| Total | | | | $ | (302 | ) | | $ | (234 | ) | | $ | (9 | ) |
128
VALERO ENERGY CORPORATION AND SUBSIDIARIES
NOTES TO CONSOLIDATED FINANCIAL STATEMENTS (Continued)
For$29 million on the other contract for the year ended December 31, 20102011, cash flow hedges primarily is related to the difference between the fair value of inventories acquired in connection with the Pembroke Acquisition and the amount paid for such inventories based on the terms of the purchase agreement. The loss of $349 million on commodity contracts for the year ended December 31, 2011 includes a $542 million loss related to forward sales of distillates and associated forward purchases of crude oil, with refined products.no amount of cumulative after-tax gains on cash flow hedges remaining in accumulated other comprehensive income as of December 31, 2010.
| | | | | | | | | | |
Derivatives Designated as
Economic Hedges and Other
Derivative Instruments
| | Location of Gain or (Loss) Recognized in Income on Derivatives | | Amount of Gain or (Loss)
Recognized in
Income on Derivatives
|
| | 2010 | | 2009 |
Commodity contracts | | Cost of sales | | $ | (210 | ) |
| $ | 55 | | Foreign currency contracts | | Cost of sales | | (24 | ) | | (22 | ) |
| | | | (234 | ) | | 33 | |
Alon earn-out agreement | | Other income, net | | — | | | 20 | |
Alon earn-out hedge (commodity contracts) | | Other income, net | | — | | | (62 | ) |
| | | | — | | | (42 | ) |
Total | | | | $ | (234 | ) | | $ | (9 | ) |
| | | | | | | | | | |
Derivatives Designated as Trading Activities | | Location of Gain Recognized in Income on Derivatives | | Amount of Gain Recognized in Income on Derivatives |
| | | 2010 | | 2009 |
| Commodity contracts | | Cost of sales | | $ | 8 | | | $ | 126 | |
| |
22. | CONDENSED CONSOLIDATING FINANCIAL INFORMATION |
In conjunction with the Premcor Acquisition on September 1, 2005, Valero Energy Corporation has fully and unconditionally guaranteed the following debt of The Premcor Refining Group Inc. (PRG), a wholly owned subsidiary of Valero Energy Corporation, that was outstanding as of December 31, 2010:
•$210 million of 6.75% senior notes due February 2011, and•$200 million of 6.125% senior notes due May 2011.
In addition, PRG has fully and unconditionally guaranteed all of the outstanding debt issued by Valero Energy Corporation.
The following condensed c onsolidating financial information is provided for Valero and PRG as an alternative to providing separate financial statements for PRG. The accounts for all companies reflected herein are presented using the equity method of accounting for investments in subsidiaries. |
| | | | | | | | | | | | | | |
Trading Derivatives | | Location of Gain (Loss) Recognized in Income on Derivatives | | Year Ended December 31, |
| | | 2011 | | 2010 | | 2009 |
| Commodity contracts | | Cost of sales | | $ | 23 |
| | $ | 8 |
| | $ | 126 |
|
VALERO ENERGY CORPORATION AND SUBSIDIARIES
NOTES TO CONSOLIDATED FINANCIAL STATEMENTS (Continued)
Condensed Consolidating Balance Sheet as of December 31, 2010
(in millions)
| | | | | | | | | | | | | | | | | | | |
| Valero Energy Corporation | | PRG | | Other Non-Guarantor Subsidiaries | | Eliminations | | Consolidated |
| ASSETS |
| Curren t assets: | | | | | | | | | |
| Cash and temporary cash investments | $ | 2,023 | | | $ | — | | | $ | 1,311 | | | $ | — | | | $ | 3,334 | |
| Receivables, net | 160 | | | 33 | | | 4,390 | | | — | | | 4,583 | |
| Inventories | — | | | 420 | | | 4,527 | | | — | | | 4,947 | |
| Income taxes receivable | 293 | | | — | | | 343 | | | (293 | ) | | 343 | |
| Deferred income taxes | — | | | — | | | 190 | | | — | | | 190 | |
| Prepaid expenses and other | — | | | 7 | | | 114 | | | — | | | 121 | |
| Total current assets | 2,476 | | | 460 | | | 10,875 | | | (293 | ) | | 13,518 | |
| Property, plant and equipment, at cost | — | | | 4,284 | | | 24,637 | | | — | | | 28,921 | |
| Accumulated depreciation | — | | & nbsp; | (499 | ) | | (5,753 | ) | | — | | | (6,252 | ) |
| Property, plant and equipment , net | — | | | 3,785 | | | 18,884 | | | — | | | 22,669 | |
| Intangible assets, net | — | | | — | | | 224 | | | — | | | 224 | |
| Investment in Valero Energy affiliates | 6,143 | | | 5,568 | | | 114 | | | (11,825 | ) | | — | |
| Long-term notes receivable from affiliates | 14,579 | | | — | | | — | | | (14,579 | ) | | — | |
| Deferred income tax receivable | 550 | | | — | | | — | | | (550 | ) | | — | |
| Deferred charges and other assets, net | 143 | | | 133 | | | 934 | | | — | | | 1,210 | |
| Total assets | $ | 23,891 | | | $ | 9,946 | | | $ |
31,031 | | | $ | (27,247 | ) | | $ | 37,621 | | LIABILITIES AND STOCKHOLDERS’ EQUITY |
Current liabilities: | | | | | | | | | |
Current portion of debt and capital lease
obligations
| $ | 8 | | | $ | 410 | | | $ | 404 | | | $ | — | | | $ | 822 | |
Accounts payable | 1 | | | 93 | | | 6,347 | | | — | | | 6,441 | |
Accrued expenses | 156 | | | 46 | | | 388 | | | — | | | 590 | |
Taxes other than income taxes | — | | | 15 | | | 656 | | | — | | | 671 | |
Income taxes payable | — | | | — | | | 296 | | | (293 | ) | | 3 | |
Deferred income taxes | 257 | | | — | | | — | | | — | | | 257 | |
Total current liabilities | 422 | | | 564 | | | 8,091 | | | (293 | ) | | 8,784 | |
Debt and capital lease obligations,
less current portion
| 7,482 | | | — | | | 33 | | | — | | | 7,515 | |
Long-term notes payable to affiliates | — | | | 8,190 | | | 6,389 | | | (14,579 | ) | | — | |
Deferred income taxes | — | | | 911 | | | 4,169 | | | (550 | ) | | 4,530 | |
Other long-term liabilities | 962 | | | 167 | | | 638 | | | — | | | 1,767 | |
Stockholders’ equity: | | | | | | | | | |
Common stock | 7 | | | —
| | | 1 | | | (1 | ) | | 7 | |
Additional paid-in capital | 7,704 | | | 3,719 | | | 7,026 | | | (10,745 | ) | | 7,70 4 | |
Treasury stock | (6,462 | ) | |
— | | | — | | | — | | | (6,462 | ) | Retained earnings | 13,388 | | | (3,599 | ) | | 4,709 | | | (1,110 | ) | | 13,388 | |
Accumulated other comprehensive
income (loss)
| 388 | | | (6 | ) | | (25 | ) | | 31 | | | 3 88 | |
Total stockholders’ equity | 15,025 | | | 114 | | | 11,711 | | | (11,825 | ) | | 15,025 | |
Total liabilities and stockholders’ equity | $ | 23,891 | | | $ | 9,946 | | | $ | 31,031 | | | $ | (27,247 | ) | | $ | 37,621 | |
VALERO ENERGY CORPORATION AND SUBSIDIARIES
NOTES TO CONSOLIDATED FINANCIAL STATEMENTS (Continued)
Condensed Consolidating Balance Sheet as of December 31, 2009
(in millions) | | | | | | | | | | | | | | | | | | | |
| | Valero Energy Corporation | | PRG | | Other Non-Guarantor Subsidiaries | | Eliminations | | Consolidated |
| ASSETS |
| Current assets: | | | | | | | | | |
| Cash and temporary cash investments | $ | 78 | | | $ | — | | | $ | 747 | | | $ | — | | | $ | 825 | |
| Receivables, net | — | | | 28 | | | 3,751 | | | — | | | 3,779 | |
| Inventories | — | | | 424 | | | 4,154 | | | — | | | 4,578 | |
| Income taxes receivable | 858 | | | — | | | 887 | | | (858 | ) | | 887 | |
| Deferred income taxes | — | | | — | | | 180 | | | — | | | 180 | |
| Prepaid expenses and other | — | | | 7 | | | 377 | | | — | | | 384 | |
| Assets held for sale | — | | | — | | | 289 | | | — | | | 289 | |
| Total current assets | 936 | | | 459 | | | 10,385 | | | (858 | ) | | 10,922 | |
| Property, plant and equipment, at cost | — | | | 4,087 | | | 22,798 | | | — | | | 26,885 | |
| Accumulated depreciation | — | | | (388 | ) | | (4,882 | ) | | — | | | (5,270 | ) |
| Property, plant and equipment, net | — | | | 3,699 | | | 17,916 | | | — | | | 21,615 | |
| Intangible assets, net | — | | | — | | | 227 | | | — | | | 227 | |
| Investment in Valero Energy affiliates | 6,456 | | | 3,807 | | | 68 | | | (10,331 | ) | | — | |
| Long-term notes receivable from affiliates | 14,181 | | |
— | | | �� | | | (14,181 | ) | | — | | Deferred income tax receivable | 809 | | | — | | | — | | | (809 | ) | | — | |
Deferred charges and other assets, net | 133 | | | 67 | | | 1,147 |
| | — | | | 1,347 | | Long-term assets held for sale | — | | | 157 | | | 1,304 | | | — | | | 1,461 | |
Total assets | $ | 22,515 | | | $ | 8,189 | | | $ | 31,047 | | | $ | (26,179 | ) | | $ | 35,572 | |
LIABILITIES AND STOCKHOLDERS’ EQUITY |
Current liabilities: | | | | | | | | | |
Current portion of debt and capital lease
obligations
| $ | 33 | | | $ | — | | | $ | 204 | | | $ | — | | | $ | 237 | |
Accounts payable | 52 | | | 223 | | | 5,550 | | | — | | | 5,825 | |
Accrued expenses | 117 | | | 222 | | | 302 | | & nbsp; | — | | | 641 | |
Taxes other than income taxes | — | | | 19 | | | 706 | | | — | | | 725 | |
Income taxes payable | — | | | — | | | 953 | | | (858 | ) | | 95 | |
Deferred income taxes | 253 | | | — | | | — | | | — | | | 253 | |
Liabilities related to assets held for sale | — | | | 8 | | | 25 | | — | | | 33 | |
Total current liabilities | 455 | | | 472 | | | 7,740 | | | (858 | ) | | 7,809 | |
Debt and capital lease obligations,
less current portion
| 6,236 | | | 895 | | | 32 | | | — | | | 7,163 | |
Long-term notes payable to affiliates | — | | | 5,924 | | | 8,257 | | | (14,181 | ) | | — | |
Deferred income taxes | — | | | 703 | | | 4,112 | | | (809 | ) | | 4,006 | |
Other long-term liabilities | 1,099 | | | 127 | | | 643 | | | — | | | 1,869 | |
Stockholders’ equity: | | | | | | | | | |
Common stock | 7 | | | — | | | 1 | | | (1 | ) | | 7 | |
Additional paid-in capital | 7,896 | | | 3,719 | | | 6,887 | | | (10,606 | ) | | 7,896 | |
Treasury stock | (6,721 | ) | | — | | | — | | | — | | | (6,721 | ) |
Retained earnings | 13,178 | | | (3,644 | ) | | 3,262 | | | 382 | | | 13,178 | |
Accumulated other comprehensive income
(loss)
| 365 | | | (7 | ) | | 113 | | | (106 | ) | | 365 | |
Total stockholders’ equity | 14,725 | | | 68 | | | 10,263 | | | (10,331 | ) | | 14,725 | |
Total liabilities and stockholders’ equity | $ | 22,515 | | | $ | 8,189 | | | $ | 31,047 | | | $ | (26,179 | ) | | $ | 35,572 | |
VALERO ENERGY CORPORATION AND SUBSIDIARIES
NOTES TO CONSOLIDATED FINANCIAL STATEMENTS (Continued)Condensed Consolidating Statement of Income for the Year Ended December 31, 2010
(in millions)
| | | | | | | | | | | | | | | | | | | |
| | Valero Energy Corporation | | PRG | | Other Non-Guarantor Subsidiaries | | Eliminations | | Consolidated |
| Operating revenues | $ | — | | | $ | 14,610 | | | $ | 80,120 | | | $ | (12,497 | ) | | $ | 82,233 | |
| Costs and expenses: | | | | | | | | | |
| Cost of sales | — | | | 16,155 | | | 70,800 | | | (12,497 | ) | | 74,458 | |
| Operating expenses | — | | | 297 | | | 3,664 | | | — | | | 3,961 | |
| General and administrative expenses | 2 | | | (14 | ) | | 543 | | | — | | | 531 | |
| Depreciation and amortization expense | — | | | 149 | | | 1,256 | | | — | | | 1,405 | |
| Asset impairment loss | — | | | — | | | 2 | | | — | | | 2 | |
| Total costs and expenses | 2 | | | 16,587 | | | 76,265 | | | (12,497 | ) | | 80,357 | |
| Operating income (loss) | (2 | ) | | (1,977 | ) | | 3,855 | | | — | | | 1,876 | |
| Equity in earnings of subsidiaries | 76 | | | 1,649 | | | 46 | | | (1,771 | ) | | — | |
| Other income (expense), net | 1,139 | | | (34 | ) | | 791 | | | (1,790 | ) | | 106 | |
| Interest and debt expense: | | | | | | | | | |
| Incurred | (706 | ) | | (513 | ) | | (1,145 | ) | | 1,790 | | | (574 | ) |
| Capitalized | — | | | 6 | | | 84 | | | — | | | 90 | |
Income (loss) from continuing operations before income tax expense (benefit) | 507 | | | (869 | ) | | 3,631 | | | (1,771 | ) | | 1,498 | |
| Income tax expense (benefit) | 183 | | | (872 | ) | | 1,264 | | | — | | | 575 | |
| Income from continuing operations | 324 | | | 3 | | | 2,367 | | | (1,771 | ) | | 923 | |
Income (loss) from discontinued operations, net of income taxes | — | | | 43 | | | (642 | ) | | — | | | (599 | ) |
Net income | $ | 324 | | | $ | 46 | | | $ | 1,725 | | | $ | (1,771 | ) | | $ | 324 | |
VALERO ENERGY CORPORATION AND SUBSIDIARIES
NOTES TO CONSOLIDATED FINANC IAL STATEMENTS (Continued)
Condensed Consolidating Statement of Income for the Year Ended December 31, 2009
(in millions)
| | | | | | | | | | | | | | | | | | | |
| | Valero Energy Corporation | | PRG | | Other Non-Guarantor Subsidiaries | | Eliminations | | Consolidated |
| Operating revenues | $ | — | | | $ | 10,864 | | | $ | 63,860 | | &nb sp; | $ | (10,125 | ) | | $ | 64,599 | |
| Costs and expenses: | | | | | | | | | |
| Cost of sales | — | | | 11,979 | | | 56,832 | | | (10,125 | ) | | 58,686 | |
| Operating expenses | — | | | 287 | | | 3,388 | | | — | | | 3,675 | |
| General and administrative expenses | 3 | | | 43 | | | 526 | &n bsp; | | — | | | 572 | |
| Depreciation and amortization expense | — | | | 129 | | | 1,232 | | | — | | | 1,361 | |
| Asset impairment loss | — | | | 131 | | | 91 | | | — | | | 222 | |
| Total costs and expenses | 3 | | | 12,569 | | | 62,069 | | | (10,125 | ) | | 64,516 | |
| Operating income (loss) | (3 | ) | | (1,705 | ) | | 1,791 | | | — | | | 83 | |
| Equity in earnings (losses) of subsidiaries | (2,220 | ) | | 947 | | | (2,121 | ) | | 3,394 | | | — | |
| Other income (expense), net | 1,154 | | | (55 | ) | | 727 | | | (1,809 | ) | | 17 | |
| Interest and debt expense: | | | | | | | | | |
| Incurred | (633 | ) | | (542 | ) | | (1,155 | ) | | 1,809 | | | (521 | ) |
| Capitalized | — | | | 13 | | | 92 | | | — | | | 105 | |
Loss from continuing operations before income tax expense (benefit) | (1,702 | ) | | (1,342 | ) | | (666 | ) | | 3,394 | | | (316 | ) |
| Income tax expense (benefit) | 280 | | | (851 | ) | | 528 | | | — | | | (43 | ) |
| Loss from continuing operations | (1,982 | ) | | (491 | ) | | (1,194 | ) | | 3,394 | |
| (273 | ) | Loss from discont inued operations,
net of income taxes
| — | | | (1,630 | ) | | (79 | ) | | — | | | (1,709 | ) |
Net loss | $ | (1,982 | ) | | $ | (2,121 | ) | | $ | (1,273
| ) | | $ | 3,394 | | | $ | (1,982 | ) |
VALERO ENERGY CORPORATION AND SUBSIDIARIES
NOTES TO CONSOLIDATED FINANCIAL STATEMENTS (Continued)
Condensed Consolidating Statement of Income for the Year Ended December 31, 2008
(in millions)
| | | | | | | | | | | | | | | | | | | |
| Valero Energy Corporation | | PRG | | Other Non-Guarantor Subsidiaries | | Eliminations | | Consolidated |
Operating revenues | $ | — | | | $ | 20,105 | | | $ | 103,537 | | | $ | (16,966 | ) | &nbs p; | $ | 106,676 | |
Costs and e xpenses: | | | | | | | | | |
Cost of sales | — | | | 19,683 | | | 93,370 | | | (16,966 | ) | | 96,087 | |
Operating expenses | — | | | 443 | | | 3,964 | | | — | | | 4,407 | |
General and administrative expenses | (9 | ) | | 40 | | | 528 | | | — | | | 559 | |
Depreciation and amortization expense | — | | | 140 | | | 1,164
| | | — | | | 1,304 | |
Asset impairment loss | — | | | 43 | | | 43 | | | — | | | 86 | |
Gain on sale of Krotz Springs Refinery | — | | | — | | | (305 | ) | | — | | | (305 | ) |
Goodwill impairment loss | — | | | 1,796 | | | 2,211 | | | — | | | 4,007 | |
Total costs and expenses | (9 | ) | | 22,145 | | | 100,975 | | | (16,966 | ) | | 106,145 | |
Operating income (loss) | 9 | | | (2,040 | ) | | 2,562 | | | — | | | 531 | |
Equity in earnings (losses) of subsidiaries | (1,436 | ) | | 882 | | | (1,523 | ) | | 2,077 | | | — | |
Other income (expense), net | 1,083 | | | (69 | ) | | 868 | | | (1,769 | ) | | 113 | |
Interest and debt expense: | | | | | | | | | |
Incurred | (577 | ) | | (552 | ) | | (1,092 | ) | | 1,769 | | | (452 | ) |
Capitalized | — | | | 17 | | | 75 | | | — | | | 92 | |
Income (loss) from continuing operations
before income tax expense (benefit)
| (921 | ) | | (1,762 | ) | | 890 | | | 2,077 | | | 284 | |
Income tax expense (benefit) | 210 | | | (358 | ) | | 1,586 | | | — | | | 1,438 | |
Loss from continuing operations | (1,131 | ) | | (1,404 | ) | | (696 | ) | | 2,077 | | | (1,154 | ) |
Income (loss) from discontinued operations,
net of income taxes
| — | | | (119 | ) | | 142 | | | — | | | 23 | |
Net loss | $ | (1,131 | ) | | $ | (1,523 | ) | | $ | (554 | ) | | $ | 2,077 | | | $ | (1,131
| ) |
VALERO ENERGY CORPORATION AND SUBSIDIARIES
NOTES TO CONSOLIDATED FINANCIAL STATEMENTS (Continued)
Condensed Consolidating Statement of Cash Flows for the Year Ended December 31, 2010
(in millions)
| | | | | | | | | | | | | | | | | | | |
| | Valero Energy Corporation | | PRG | | Other Non-Guarantor Subsidiaries | | Eliminations | | Consolidated |
Net cash provided by (used in) operating activities | $ | 687 | | | $ | (1,563 | ) | | $ | 3,921 | | | $ | — | | | $ | 3,045 | |
| Cash flows from investing activities: | | | | | | | | | |
| Capital exp enditures | — | | | (221 | ) | | (1,509 | ) | | — | | | (1,730 | ) |
| Deferred turnaround and catalyst costs | — | | | (85 | ) | | (450 | ) | | — | | | (535 | ) |
| Acquisitions of ethanol plants | — | | | — | | | (260 | ) | | — | | | (260 | ) |
Proceeds from the sale of the Paulsboro Refinery | — | | | — | | | 547 | | | — | | | 547 | |
Proceeds from the sale of the Delaware City Refinery assets and as sociated terminal and pipeline assets | — | | | 210 | | | 10 | | | — | | | 220 | |
Proceeds from the sale of investment in CHOPS | — | | | — | | | 330 | | | — | | | 330 | |
| Net intercompany loan repayments | 36 | | | — | | | — | | | (36 | ) | | — | |
| Investments in subsidiaries | (8 | ) | | (112 | ) | | — | |
| 120 | | | — | | Return of investment | 124 | | | — | | | — | | | (124 | ) | |
— | | Other investing activities, net | — | | | — | | | 23 | | | — | | | 23 | |
Net cash provided by (used in)
investing activities
| 152 | | | (208 | ) | | (1,309 | ) | | (40 | ) | | (1,405 | ) |
Cash flows from financing activities: | | | | | | | | | |
Non-bank debt: | | | | | | | | | |
Borrowings | 1,244 | | | — | | | 300 | | | — | | | 1,544 | |
Repayments | (33 | ) | | (484 | ) | | — | | | — | | | (517 | ) |
Accounts receivable sales program: | | | | | | | | | |
Proceeds from the sale of receivables | — | | | — | | | 1,225 | | | — | | | 1,225 | |
Repayments | — | | | — | | | (1,325 | ) | | — | | | (1,325 | ) |
Purchase of common stock for treasury | (13 | ) | | — | | | — | | | — | | | (13 | ) |
Issuance of common stock in connection
with stock-based compensation plans
| 20 | | | — | | | — | | | — | | | 20 | |
Common stock dividends | (114 | ) | | — | | | — | | | — | | | (114 | ) |
Capital contributions from parent | — | | | — | | | 120 | | | (120 | ) | | — | |
Dividend to parent | — | | | — | | | (124 | ) | | 124 | | | — | |
Net intercompany borrowings | — | | | 2,255 | | | (2,291 | ) | | 36 | | | — | |
Other financing activities, net | 2 | | | —
| | | (6 | )
| | — | | | (4 | ) |
Net cash provided by (used in)
financing activities
| 1,106 | | | 1,771 | | | (2,101 | ) | | 40
| | | 816 | |
Effect of foreign exchange rate
changes on cash
| — | | | — | | | 53 | | | — | | | 53 | |
Net increase (decrease) in cash and
temporary cash investments
| 1,945
| | | — | | | 564 | | | — | | | 2,509 | |
Cash and temporary cash investments
at beginning of year
| 78 | | | — | | | 747 | | | — | | | 825 | |
Cash and temporary cash investments
at end of year
| $ | 2,023 | | | $ | — | | | $ | 1,311 | | | $ | — | | | $ | 3,334 | |
VALERO ENERGY CORPORATION AND SUBSIDIARIES
NOTES TO CONSOLIDATED FINANCIAL STATEMENTS (Continued)
Condensed Consolidating Statement of Cash Flows for the Year Ended December 31, 2009
(in millions)
| | | | | | | | | | | | | | | | | | | |
| | Valero Energy Corporation | &n bsp; | PRG | | Other Non-Guarantor Subsidiaries | | Eliminations | | Consolidated |
Net cash provided by (used in) operating activities | $ | (526 | ) | | $ | (1,198 | ) | | $ | 3,547 | | | $ | — | | | $ | 1,823 | |
| Cash flows f rom investing activities: | | | | | | | | | |
| Capital expenditures | — | | | (526 | ) | | (1,780 | ) | | — | | | (2,306 | ) |
| Deferred turnaround and catalyst costs | — | | | (72 | ) | | (343 | ) | | — | | | (415 | ) |
| Acquisitions of ethanol plants | & mdash; | | | — | | | (556 | ) | | — | | | (556 | ) |
Advance payments related to acquisition of ethanol facilities | — | | | — | | | (21 | ) | | — | | | (21 | ) |
| Investments in subsidiaries | (2,335 | ) | | (142 | ) | | (2,121 | ) | | 4,598 | | | — | |
| Return of investment | 109 | | | — | | | — | | | (109 | ) | | — | |
| Net intercompany loan repayments | 1,422 | | | — | | | — | | | (1,422 | ) | | — | |
| Minor acquisition | — | | | — | | | (29 | ) | | — | | | (29 | ) |
| Other investing activities, net | — | | | — | | | 35 | | | — | | | 35 | |
| Net cash used in investing activities | (804 | ) | | (740 | ) | | (4,815 | ) | | 3,067 | | | (3,292 | ) |
| Cash flows from financing activities: | | | | | | | | | |
| Non-bank debt: | | | | | | | | | |
| Borrowings | 998 | | | — | | | — | | | — | | | 998 | |
| Repayments | (285 | ) | | — | | | — | | | — | | | (285 | ) |
| Bank credit agreements: | | | | | | | | | |
| Borrowings | 39 | | | — | | | — | | | — |
| | 39 | | Repayments
| (39 | ) | | — | | | — | | | — | | | (39 | ) |
Accounts receivable sales program: | | | | | | | | | |
Proceeds from sale of receivables | — | | | — | | | 950 | | | — | | | 950 | |
Repayments | — | | | — | | | (850 | ) | | — | | | (850 | ) |
Proceeds from the sale of common stock,
net of issuance costs
| 799 | | | — | | | — | | | — | | | 799 | |
Purchase of common stock for treasury | (4 | ) | | — | | | — | | | — | | | (4 | ) |
Issuance of common stock in connection with stock-based compensation plans | 11 | | | — | | | — | | | — | | | 11 | |
Common stock dividends | (324 | ) | | — | | | — | | | — | | | (324 | ) |
Dividend to parent | — | | | — | | | (109 | ) | | 109 | | | — | |
Capital contributions from parent | — | | | 2,121 | | | 2,477 | | | (4,598 | ) | | — | |
Net intercompany repayments | — |
| | (183 | ) | | (1,239 | ) | | 1,422 | | | — | |
Other financing activities, net | (2 | ) | | — | | | (4 | ) | | — | | | (6 | ) |
Net cash provided by financing
activities
| 1,193 | | | 1,938 | | | 1,225 | | | (3,067 | ) | | 1,289 | |
Effect of foreign exc hange rate changes
on cash
| — | | | — | | | 65 | | | — | | | 65 | |
Net increase (decrease) in cash and
temporary cash investments
| (137 | ) | | — | | | 22 | | | — | |
| (115 | ) |
Cash and temporary cash investments
at beginning of year
| 215 | | | — | | | 725 | | | — | | | 940 | |
Cash and temporary cash investments
at end of year
| $ | 78 | | | $ | — | | | $ | 747 | | | $ | — | | | $ | 825 | |
VALERO ENERGY CORPORATION AND SUBSIDIARIES
NOTES TO CONSOLIDATED FINA NCIAL STATEMENTS (Continued)
Condensed Consolidating Statement of Cash Flows for the Year Ended December 31, 2008
(in millions)
| | | | | | | | | | | | | | | | | | | |
| | Valero Energy Corporation | | PRG (1) | | Other Non-Guarantor Subsidiaries (1) | | Eliminations | | Consolidated |
| Net cash provided by operating activities | $ | 46 | | | $ | 14 | | | $ | 3,035 | | | $ | — | | | $ | 3,095 | |
| Cash flows from investing activities: | | | | | | | | | |
| Capital expenditures | — | | | (653 | ) | | (2,240 | ) | | — | | | (2,893 | ) |
| Deferred turnaround and catalyst costs | — | | | (93 | ) | | (315 | ) | | — | | | (408 | ) |
Proceeds from the sale of the Krotz Springs Refinery | — | | | — | | | 463 | | | — | | | 463 | |
| Investments in subsidiaries | (1,235 | ) | | — | | | (1,523 | ) | | 2,758 | | | — | |
| Return of investment | 629 | | | 265 | | | — | | | (894 | ) | | — | |
| Net intercompany loan repayments | 596 | | | — | | | — | |
| (596 | ) | | — | | Minor acquisitions | — | | | — | | | (144 | ) | | — | | | (144 | ) |
Other investing activities, net | — | | | — | | | 17 | | | — | | | 17 | |
Net cash used in investing activities | (10 | ) | | (481 | ) | | (3,742 | ) | | 1,268 | | | (2,965 | ) |
Cash flows from financing activities: | | | | | | | | | |
Non-bank debt repayments | (6 | ) | | (368
| ) | | — | | | — | | | (374 | ) |
Bank credit agreements: | | | | | | | | | |
Borrowings | 296 | | | — | | | — | | | — | | | 296 | |
Repayments | (296 | ) | | — | | | — | | | — | | | (296 | ) |
Purchase of common stock for treasury | (955 | ) | | — | | | — | | | — | | | (955 | ) |
Issuance of common stock in connection
with stock-based compensation plans
| 16 | | | — | | | — | | | — | | | 16 | |
Common stock dividends | (299 | ) | | — | | | — | | | — | | | (299 | ) |
Dividend to parent | — | &nb sp; | | — | | | (894 | ) | | 894 | | | — | |
Capital contributions from parent | — | &nb sp; | | 1,523 | | | 1,235 | | | (2,758 | ) | | — | |
Net intercompany borrowings
(repayments)
| — | | | (688 | ) | | 92 | | | 596 | | | — | |
Other financing activities, net | 9 | | | — | | | (4 | ) | | — | | | 5 | |
Net cash provided by (used in)
financing activities
| (1,235 | ) | | 467 | | | 429 | | | (1,268 | ) | | (1,607 | ) |
Effect of foreign exchang e rate changes
on cash
| — | | | —
| | | (47 | ) | | — | | | (47 | ) |
Net decrease in cash and temporary
cash investments
| (1,199 | ) | | — | | | (325 | ) | | — | | | (1,524 | ) |
Cash and temporary cash investments
at beginning of year
| 1,414 | | | — | | | 1,050 | | | — | | | 2,464 | |
Cash and temporary cash investments
at end of year
| $ | 215 | | | $ | — | | | $ | 725 | | | $ | — | | | $ | 940 | |
| |
(1) | The information presented herein excludes a $918 million noncash capital contribution of property and other assets, net of certain liabilities, from PRG to Valero Refining Company – Tennessee, L.L.C. (included in “Other Non-Guarantor Subsidiaries”) on April 1, 2008. |
VALERO ENERGY CORPORATION AND SUBSIDIARIES
NOTES TO CONSOLIDATED FINANCIAL STATEMENTS (Continued)
| |
23. 22. | QUARTERLY FINANCIAL DATA (Unaudited) |
The following table summarizes quarterly financial data for the years ended December 31, 20102011 and 20092010 (in millions, except per share amounts). The amounts shown below differ from those previously reported in our quarterly reports on Form 10-Q for the quarters ended March 31, June 30, and September 30, 2010 due to the sale of the Paulsboro Refinery in December 2010 as discussed in Note 3. The results of operations of the Paulsboro Refinery have been presented as discontinued operations for all periods presented.
| | | | | | | | | | | | | | | |
| | 2010 Quarter Ended |
| | March 31 | | June 30 (a) | | September 30 | | December 31 (b) |
| Operating revenues | $ | 18,493 | | | $ | 20,561 | | | $ | 21,015 | | | $ | 22,164 | |
| Operating income (loss) | 4 | | | 904 | | | 590 | |
| 378 | | Income (loss) from continuing
operations
| (80 | ) | | 520 | | | 303 | | | 180 | |
Net income (loss) | (113 | ) | | 583 | | | 292 | | | (438 | ) |
Earnings (loss) per common share
from continuing operations –
assuming dilution
| (0.14 | ) | | 0.92 | | | 0.53 | | | 0.32 | |
Earnings (loss) per common share –
assuming dilution
| (0.20 | ) | | 1.03 | | | 0.51 | | | (0.77 | ) |
| | | | | | & nbsp; | |
| 2009 Quarter Ended |
| March 31 | | June 30 | | September 30 | | December 31 (c) |
Operating revenues | $ | 12,590 | | | $ | 16,518 | | | $ | 17,607 | | | $ | 17,884 | |
Operating income (loss) | 541 | | | (130 | ) | | (193 | ) | | (135 | ) |
Income (loss) from continuing
operations
| 331 | | | (156 | ) | | (317 | ) | | (131 | ) |
Net income (loss) | 309 | | | (254 | ) | | (629 | ) | | (1,408 | ) |
Earnings (loss) per common share
from continuing operations –
assuming dilution
| 0.64 | | | (0.30 | ) | | (0.56 | ) | | (0.23 | ) |
Earnings (loss) per common share –
assuming dilution
| 0.59 | | | (0.48 | ) | | (1.12 | ) | | (2.51 | ) |
|
| | | | | | | | | | | | | | | |
| | 2011 Quarter Ended |
| | March 31 | | June 30 | | September 30 (a) | | December 31 (b) |
| Operating revenues | $ | 26,308 |
| | $ | 31,293 |
| | $ | 33,713 |
| | $ | 34,673 |
|
| Operating income | 244 |
| | 1,290 |
| | 1,979 |
| | 167 |
|
Income from continuing operations | 104 |
| | 744 |
| | 1,203 |
| | 45 |
|
| Net income | 98 |
| | 743 |
| | 1,203 |
| | 45 |
|
Net income attributable to Valero Energy Corporation stockholders | 98 |
| | 744 |
| | 1,203 |
| | 45 |
|
Earnings per common share from continuing operations – assuming dilution | 0.18 |
| | 1.30 |
| | 2.11 |
| | 0.08 |
|
Earnings per common share – assuming dilution | 0.17 |
| | 1.30 |
| | 2.11 |
| | 0.08 |
|
| | | | | | | | |
| | 2010 Quarter Ended |
| | March 31 | | June 30 (c) | | September 30 | | December 31 (d) |
| Operating revenues | $ | 18,493 |
| | $ | 20,561 |
| | $ | 21,015 |
| | $ | 22,164 |
|
| Operating income | 4 |
| | 904 |
| | 590 |
| | 378 |
|
Income (loss) from continuing operations | (80 | ) | | 520 |
| | 303 |
| | 180 |
|
| Net income (loss) | (113 | ) | | 583 |
| | 292 |
| | (438 | ) |
Net income (loss) attributable to Valero Energy Corporation stockholders | (113 | ) | | 583 |
| | 292 |
| | (438 | ) |
Earnings per common share from continuing operations – assuming dilution | (0.14 | ) | | 0.92 |
| | 0.53 |
| | 0.32 |
|
Earnings per common share – assuming dilution | (0.20 | ) | | 1.03 |
| | 0.51 |
| | (0.77 | ) |
______________
| |
| (a) | Includes the operations related to the Pembroke Acquisition beginning August 1, 2011. |
| |
| (b) | Includes the operations related to the Meraux Acquisition beginning October 1, 2011. |
| |
| (c) | Net income for the quarter ended June 30, 2010 includes the $92 million pre-tax gain related to the sale of the Delaware City Refinery as discussed in Note 3. |
| |
(b) (d) | Net loss for the quarter ended December 31, 2010 includes the $980 million pre-tax loss related to the sale of the Paulsboro Refinery as discussed in Note 3. |
| |
(c) | Net loss for the quarter ended December 31, 2009 includes the $1.9 billion pre-tax loss related to the shutdown of the Delaware City Refinery as discussed in Note 3.
|
ITEM 9. CHANGES IN AND DISAGREEMENTS WITH ACCOUNTANTS ON ACCOUNTING AND FINANCIAL DISCLOSURE
None.
ITEM 9A. CONTROLS AND PROCEDURES
Disclosure Controls and Procedures. Our management has evaluated, with the participation of our principal executive officer and principal financial officer, the effectiveness of our disclosure controls and procedures (as defined in Rule 13a-15(e) under the Securities Exchange Act of 1934) as of the end of the period covered by this report, and has concluded that our disclosure controls and procedures were effective as of December 31, 20102011.
Internal Control over Financial Reporting.
(a) Management’s Report on Internal Control over Financial Reporting.
The management report on Valero’s internal control over financial reporting required by Item 9A appears in Item 8 on page 5556 of this report, and is incorporated herein by reference.
(b) Attestation Report of the Independent Registered Public Accountin gAccounting Firm.
KPMG LLP’s report on Valero’s internal control over financial reporting appears in Item 8 beginning on page 5758 of this report, and is incorporated herein by reference.
(c) Changes in Internal Control over Financial Reporting.
There has been no change in our internal control over financia lfinancial reporting that occurred during our last fiscal quarter that has materially affected, or is reasonably likely to materially affect, our internal control over financial reporting.
ITEM 9B. OTHER INFORMATION
None.
139
133
PART III
ITEMS 10-14.
The information required by Items 10 through 14 of Form 10-K is incorporated herein by reference to the definitive proxy statement for our 20112012 annual meeting of stockholders. We will file the proxy statement with the SEC before March 31, 20112012.
PART IV
ITEM 15. EXHIBITS AND FINANCIAL STATEMENT SCHEDULES
(a) 1. Financial Statements. The following consolidated financial statements of Valero Energy Corporation and its subsidiaries are included in Part II, Item 8 of this Form 10-K:
2. Financial Statement Schedule sSchedules and Other Financial Information. No financial statement schedules are submitted because either they are inapplicable or because the required information is included in the consolidated financial statements or notes thereto.
3. Exhibits. Filed as part of this Form 10-K are the following exhibits:
|
| | | |
| | | |
| 3.01 |
| -- | Amended and Restated Certificate of Incorporation of Valero Energy Corporation, formerly known as Valero Refining and Marketing Company - incorporated by reference to Exhibit 3.1 to Valero’s Registration Statement on Form S-1 (SEC File No. 333-27013) filed May 13, 1997. |
| | | |
| 3.02 |
| -- | Certificate of Amendment (effective July 31, 1997) to Restated Certificate of Incorporation of Valero Energy Corporation - incorporated by reference to Exhibit 3.02 to Valero’s Annual Report on Form 10-K for the year ended December 31, 2003 (SEC File No. 1-13175). |
| | | |
| 3.03 |
| -- | Certificate of Merger of Ultramar Diamond Shamrock Corporation with and into Valero Energy Corporation dated December 31, 2001 - incorporated by reference to Exhibit 3.03 to Valero’s Annual Report on Form 10-K for the year ended December 31, 2003 (SEC File No. 1-13175). |
| | | |
| 3.04 |
| -- | Amendment (effective December 31, 2001) to Restated Certificate of Incorporation of Valero Energy Corporation - incorporated by reference to Exhibit 3.1 to Valero’s Current Report on Form 8-K dated December 31, 2001, and filed January 11, 2002 (SEC File No. 1-13175). |
| | | |
| 3.05 |
| -- | Second Certificate of Amendment (effective September 17, 2004) to Restated Certificate of Incorporation of Valero Energy Corporation - incorporated by reference to Exhibit 3.04 to Valero’s Quarterly Report on Form 10-Q for the quarter ended September 30, 2004 (SEC File No. 1-13175). |
| | | |
| | | |
| 3.06 |
| -- | Certificate of Merger of Premcor Inc. with and into Valero Energy Corporation effective September 1, 2005 - incorporated by reference to Exhibit 2.01 to Valero’s Quarterly Report on Form 10-Q for the quarter ended September 30, 2005 (SEC File No. 1-13175). |
|
| | | |
| | | |
| 3.07 |
| -- | Third Certificate of Amendment (effective December 2, 2005) to Restated Certificate of Incorporation of Valero Energy Corporation - incorporated by reference to Exhibit 3.07 to Valero’s Annual Report on Form 10-K for the year ended December 31, 2005 (SEC File No. 1-13175). |
| | | |
| 3.08 |
| -- | Fourth Certificate of Amendment (effective May 24, 2011) to Restated Certificate of Incorporation of Valero Energy Corporation - incorporated by reference to Exhibit 4.8 to Valero’s Current Report on Form 8-K dated and filed May 24, 2011 (SEC File No. 1-13175). |
| | |
| 3.09 |
| -- | Amended and Restated Bylaws of Valero Energy Corporation (as of July 12, 2007) - incorporated by reference to Exhibit 3.01 to Valero’s Current Report on Form 8-K dated July 11, 2007, and filed July 17, 2007 (SEC File No. 1-13175). |
| | | |
| 4.01 |
| -- | Indenture dated as of December 12, 1997 between Valero Ene rgyEnergy Corporation and The Bank of New York - incorporated by reference to Exhibit 3.4 to Valero’s Registration Statement on Form S-3 (SEC File No. 333-56599) filed June 11, 1998. |
| | | |
| 4.02 |
| -- | First Supplemental Indenture dated as of June 28, 2000 between Valero Energy Corporation and The Bank of New York (including Form of 7 3/4% Senior Deferrable Note due 2005) - incorporated by reference to Exhibit 4.6 to Valero’s Current Report on Form 8-K date ddated June 28, 2000, and filed June 30, 2000 (SEC File No. 1-13175). |
| | | |
| 4.03 |
| -- | Indenture (Senior Indenture) dated as of June 18, 2004 between Valero Energy Corporation and Bank of New York - incorporated by reference to Exhibit 4.7 to Valero’s Registration Statement on Form S-3 (SEC File No. 333-116668) filed June 21, 2004. |
| | |
| 4.04 |
| -- | Form of Indenture related to subordinated debt securities - incorporated by reference to Exhibit 4.8 to Valero’s Registration Statement on Form S-3 (SEC File No. 333-116668) filed June 21, 2004. |
| | | |
| 4.05 | | -- | Third Supplemental Indenture dated as of August 31, 2005 between The Premcor Refining Group Inc. and Deutsche Bank Trust Company Americas - incorporated by reference to Exhibit 4.09 to Valero’s Annual Report on Form 10-K for the year ended December 31, 2005 (SEC File No. 1-13175). |
| | |
4.06 | | -- | Fourth Supplemental Indenture dated as of September 1, 2005 am ong The Premcor Refining Group Inc., Valero Energy Corporation, and Deutsche Bank Trust Company Americas - incorporated by reference to Exhibit 4.10 to Valero’s Annual Report on Form 10-K for the year ended December 31, 2005 (SEC File No. 1-13175). |
| | |
4.07 | | -- | Guaranty dated September 2, 2005 of The Premcor Refining Group Inc. (guaranteeing certain Valero-heritage debt) - incorporated by reference to Exhibit 4.11 to Valero’s Annual Report on Form 10-K for the year ended Dec ember 31, 2005 (SEC File No. 1-13175). |
| | |
4.08 | | -- | Guaranty dated September 2, 2005 of Valero Energy Corporation (guaranteeing certain Premcor-heritage debt) - incorporated by reference to Exhibit 4.12 to Valero’s Annual Report on Form 10-K for the year ended December 31, 2005 (SEC File No. 1-13175). |
| | |
4.09 |
| -- | Specimen Certificate of Common Stock - incorporated by reference to Exhibit 4.1 to Valero’s Registration Statement on Form S-3 (SEC File No. 333-116668) filed June 21, 2004. |
| | | |
| +10.01 |
| -- | Valero Energy Corporation Annual Bonus Plan, amended and restated as of July 29, 2009 - incorporated by reference to Exhibit 10.01 to Valero’s Current Report on Form 8-K dated July 29, 2009, and filed August 4, 2009 (SEC File No. 1-13175). |
| | | |
| +10.02 |
| -- | Valero Energy Corporation 2005 Omnibus Stock Incentive Plan, amended and restated as of October 1, 2005. |
| | |
+10.03 | | -- | Valero Energy Corporation 2001 Executive Stock Incentive Plan, amended and restated as of October 1, 2005 - incorporated by reference to Exhibit 10.0410.02 to Valero’s Annual Report on Form 10-K for the year ended December 31, 20052009 (SEC File No. 1-13175). |
| | |
| +10.03 |
| -- | Valero Energy Corporation 2011 Omnibus Stock Incentive Plan - incorporated by reference to Appendix A to Valero’s Definitive Proxy Statement on Schedule 14A for the 2011 annual meeting of stockholders, filed March 18, 2011 (SEC File No. 1-13175). |
| | | |
| +10.04 |
| -- | Valero Energy Corporation Deferred Compensation Plan, amended and restated as of January 1, 2008 - incorporated by reference to Exhibit 10.04 to Valero’s Annual Report on Form 10-K for the year ended December 31, 2008 (SEC File No. 1-13175). |
| | | |
| *+10.05 |
| -- | Form of 20102011 Elective Deferral Agreement pursuant to the Valero Energy Corporation Deferred Compensation Plan. |
| | | |
| | | |
| *+10.06 |
| -- | Form of Investment Election Form pursuant to the Valero Energy Corporation Deferred Compensation Plan. |
| | | |
| *+10.07 |
| -- | Form of 20102011 Distribution Election Form pursuant to the Valero Energy Corporation Deferred Compensation Plan. |
| | ; | |
| +10.08 |
| -- | Valero Energy Corporation Amended and Restated Supplemental Executive Retirement Plan, amended and restated as of November 10, 2008 - incorporated by reference to Exhibit 10.08 to Valero’s Annual Report on Form 10-K for the year ended December 31, 2008 (SEC File No. 1-13175). |
| | | |
| *+10.09 |
| -- | Valero Energy Corporation Supplemental Retirement Plan for Selected Employees of Canadian Subsidiaries, amended and restated as of December 31, 2011. |
| | |
| *+10.10 |
| -- | Valero Energy Corporation Excess Pension Plan, as amended and restated effective December 31, 2011. |
| | |
|
| | | |
| +10.11 |
| -- | Valero Energy Corporation 2003 Employee Stock Incentive Plan, as amended and restated effective October 1, 2005 - incorporated by reference to Exhibit 10.11 to Valero’s Annual Report on Form 10-K for the year ended December 31, 2005 (SEC File No. 1-13175). |
| | | |
+10.10 10.12 | | -- | Valero Energy Corporation Stock Option Plan, as amended and restated effective January 1, 2009 - incorporated by reference to Exhibit 10.10 to Valero’s Annual Report on Form 10-K for the year ended December 31, 2008 (SEC File No. 1-13175). |
| | |
+10.11 |
| -- | Valero Energy Corporation Restricted Stock Plan for Non-Employee Directors, as amended and restated July 11, 2007 - incorporated by reference to Exhibit 10.02 to Valero’s Current Report on Form 8-K/A dated July 11, 2007, and filed September 18, 2007 (SEC File No. 1-13175). |
| | | |
+10.12 | | -- | Valero Energy Corporation Non-Employee Director Stock Option Plan, as amended and restated effective January 1, 2007 - incorporated by reference to Exhibit 10.02 to Valero’s Quarterly Report on Form 10-Q for the quarter ended September 30, 2006 (SEC File No. 1-13175). |
| | |
+10.13 |
| -- | Form of Indemnity Agreement between Valero Energy Corporation (formerly known as Valero Refining and Marketing Company) and certain officers and directors - incorporated by reference to Exhibit 10.8 to Valero’s Registration Statement on Form S-1 (SEC File No. 333-27013) filed May 13, 1997. |
| | | |
| *+10.14 |
| -- | Schedule of Indemnity Agreements - incorporated by reference to Exhibit 10.9 to Valero’s Registration Statement on Form S-1 (SEC File No. 333-27013) filed May 13, 1997.Agreements. |
| | | |
| *+10.15 |
| -- | Change of Control Agreement (Tier I) dated January 18, 2007 between Valero Energy Corporation and William R. Klesse, - incorporated by reference to Exhibit 10.01 to Valero’s Current Report on Form 8-Kwith IRC Section 409A technical amendment dated January 17, 2007 and filed January 19, 2007 (SEC File No. 1-13175).December 14, 2011. |
| | | |
| *+10.16 |
| -- | Schedule of Change of Control Agreements (Tier I) - incorporated by reference to Exhibit 10.16 to Valero’s Annual Report on Form 10-K for the year ended December 31, 2008 (SEC File No. 1-13175). |
| | | |
| *+10.17 |
| -- | Change of Control Agreement (Tier II) dated March 15, 2007 between Valero Energy Corporation and Kimberly S. Bowers, - incorporated by reference to Exhibit 10.16 to Valero’s Annual Report on Form 10-K for the year endedwith IRC Section 409A technical amendment dated December 31, 2008 (SEC File No. 1-13175).14, 2011. |
| | | |
*+10.18 |
| -- | Form of Performance Award Agreement pursuant to the Valero Energy Corporation 2005 Omnibus Stock Incentive Plan - incorporated by reference to Exhibit 10.18 to Valero’s Annual Report on Form 10-K for the year ended December 31, 2010 (SEC File No. 1-13175). |
| | |
| *+10.19 |
| -- | Form of Performance Award Agreement pursuant to the Valero Energy Corporation 2011 Omnibus Stock Incentive Plan. |
| | | |
+10.19 10.20 |
| -- | Form of Stock Option Agreement pursuant to the Valero Energy Corporation 2005 Omnibus Stock Incentive Plan - incorporated by reference to Exhibit 10.03 to Valero’s Current Report on Form 8-K dated October 20, 2005, and filed October 26, 2005 (SEC File No. 1-13175). |
| | | |
*+10.2010.21 |
| -- | Form of Stock Option Agreement pursuant to the Valero Energy Corporation 2011 Omnibus Stock Incentive Plan. |
| | |
| +10.22 |
| -- | Form of Stock Option Agreement pursuant to the Valero Energy Corporation Non-Employee Director Stock Option Plan - incorporated by reference to Exhibit 10.04 to Valero’s Quarterly Report on Form 10-Q for the quarter ended September 30, 2006 (SEC File No. 1-13175). |
| | | |
+10.2110.23 |
| -- | Form of Restricted Stock Agreement pursuant to the Valero Energy Corporation 2005 Omnibus Stock Incentive Plan - incorporated by reference to Exhibit 10.02 to Valero’s Quarterly Report on Form 10-Q for the quarter ended September 30, 2005 (SEC File No. 1-13175). |
| | | |
*+10.2210.24 |
| -- | Form of Restricted Stock Agreement pursuant to the Valero Energy Corporation 2011 Omnibus Stock Incentive Plan. |
| | |
| +10.25 |
| -- | Form of Restricted Stock Agreement pursuant to the Valero Energy Corporation Restricted Stock Plan for Non-Employee Directors - incorporated by reference to Exhibit 10.03 to Valero’s Quarterly Report on Form 10-Q for the quarter ended September 30, 2006 (SEC File No. 1-13175). |
| | | |
| *10.26 | | | |
10.23 |
| -- | $2,500,000,0003,000,000,000 5-Year Amended and Restated Revolving Credit Agreement, dated as of August 17, 2005,December 5, 2011, among Valero Energy Corporation, as Borrower; JPMorgan Chase Bank, N.A., as Administrative Agent and Global Administrative Agent; and the lenders named therein - incorporated by reference to Exhibit 10.23 to Valero’s Annual Report on Form 10-K for the year ended December 31, 2008 (SEC File No. 1-13175). |
| | |
10.24 | | -- | First Amendment to $2,500,000,000 5-Year Revolving Credit Agreement, dated as of July 24, 2006 - incorporated by reference to Exhibit 10.24 to Valero’s Annual Report on Form 10-K for the year ended December 31, 2008 (SEC File No. 1-13175). |
| | |
10 .25 | | -- | Second Amendment to $2,500,000,000 5-Year Revolving Credit Agreement, dated as of November 9, 2007 - incorporated by reference to Exhibit 10.25 to Valero’s Annual Report on Form 10-K for the year ended December 31, 2008 (SEC File No. 1-13175).therein. |
| | | |
| *12.01 |
| -- | Statements of Computations of Ratios of Earnings to Fixed Charges and Ratios of Earnings to Fixed Charges and Preferred Stock Dividends.Charges. |
| | | |
| 14.01 |
| -- | Code of Ethics for Senior Financial Officers - incorporated by reference to Exhibit 14.01 to Valero'sValero’s Annual Report on Form 10-K for the year ended December 31, 2003 (SEC File No. 1-13175). |
| | | |
| *21.01 |
| -- | Valero Energy Corporation subsidiaries. |
| | | |
| *23.01 |
| -- | Consent of KPMG LLP dated February 25, 2011.24, 2012. |
| | | |
|
| | | |
| *24.01 |
| -- | Power of Attorney dated February 24, 201123, 2012 (on the signature page of this Form 10-K). |
| | | |
| *31.01 |
| -- | Rule 13a-14(a) Certification (under Section 302 of the Sarbanes-Oxley Act of 2002) of principal executive officer. |
| | | |
| *31.02 |
| -- | Rule 13a-14(a) Certification (under Section 302 of the Sarbanes-Oxley Act of 2002) of principal financial officer. |
| | | &n bsp; |
| *32.01 |
| -- | Section 1350 Certifications (under Section 906 of the Sarbanes-Oxley Act of 2002). |
| | | |
| *99.01 |
| -- | Audit Committee Pre-Approval Policy. |
| | | |
| **101 |
| -- | The following materials from Valero Energy Corporation’s Form 10-K for the year ended December 31, 2010, formatted in XBRL (Extensible Business Reporting Language): (i) Consolidated Balance Sheets, (ii) Consolidated Statements of Income, (iii) Consolidated Statements of Stockholders’ Equity, (iv) Consolidated Statements of Cash Flows, (v) Consolidated Statements of Other Comprehensive Income, and (vi) Notes to Consolidated Financial Statements, tagged in detail.Interactive Data Files |
______________
| |
| + | Identifies management contracts or compensatory plans or arrangements required to be filed as an exhibit hereto. |
| |
| ** | Submitted electronically herewith. |
* Filed herewith.
+ Identifies management contracts or compensatory plans or arrangements required to be filed as an exhibit hereto.
** Submitted electronically herewith.
In accordance with Rule 402 of Regulation S-T, the XBRL information in Exhibit 101 to this Annual Report on Form 10-K shall not be deemed to be “filed” for purposes of Section 18 of the Securities Exchange Act of 1934, as amended (Exchange Act), or otherwise subject to the liability of that section, and shall not be incorporated by reference into any registration statement or other document filed under the Securities Act of 1933, as amended, or the Exchange Act, except as shall be expressly set forth by specific reference in such filing.
Copies of exhibits filed as a part of this Form 10-K may be obtained by stockholders of record at a charge of $0.15 per page, minimum $5.00 each request. Direct inquiries to Jay D. Browning, Senior Vice President–President – Corporate Law and Secretary, Valero Energy Corporation, P.O. Box 696000, San Antonio, Texas 78269-6000.
Pursuant to paragraph 601(b)(4)(iii)(A) of Regulation S-K, the registrant has omitted from the foregoing listing of exhibits, and hereby agrees to furnish to the SEC upon its request, copies of certain instruments, each r elatingrelating to debt not exceeding 10 percent of the total assets of the registrant and its subsidiaries on a consolidated basis.
SIGNATURE
Pursuant to the requirements of Section 13 or 15(d) of the Securities Exchange Act of 1934, the registrant has duly caused this report to be signed on its behalf by the undersigned, thereunto duly authorized.
|
| | |
| | VALERO ENERGY CORPORATION (Registrant) |
| | By: | /s/ William R. Klesse |
| | | (William R. Klesse) |
| | | Chief Executive Officer, President, and Chairman of the Board |
Date: February 25, 201124, 2012
POWER OF ATTORNEY
KNOW ALL MENPERSONS BY THESE PRESENTS, that each person whose signature appears below hereby constitutes and appoints William R. Klesse, Michael S. Ciskowski, and Jay D. Browning, or any of them, each with power to act without the other, his true and lawful attorney-in-fact and agent, with full power of substitution and resubstitution, for him and in his name, place and stead, in any and all capacities, to sign any or all subsequent amendments and supplements to this Annual Report on Form 10-K, and to file the same, or cause to be filed the same, with all exhibits thereto, and other documents in connection therewith, with the Securities and Exchange Commission, granting unto each said attorney-in-fact and agent full power to do and perform each and every act and thing requisite and necessary to be done in and about the premises, as fully to all intents and purposes as he might or could do in person, hereby qualifying and confirming all that said attorney-in-fact and agent or his substitute or substitutes may lawfully do or cause to be done by virtue hereof.
Pursuant to the requirements of the Securities Exchange Act of 1934, this report has been signed below by the following persons on behalf of the registrant and in the capacities and on the dates indicated.
|
| | | | |
| Signature | | Title | | Date |
| | | | | |
| /s/ William R. Klesse | | Chief Executive Officer, President, and Chairman of the Board (Principal Executive Officer) | | February 24, 201123, 2012 |
| (William R. Klesse) | | |
| | | | |
| /s/ Michael S. Ciskowski | | Executive Vice President and Chief Financial Officer (Principal Financial and Accounting Officer) | | February 24, 201123, 2012 |
| (Michael S. Ciskowski) | | |
| | | | | |
| /s/ Ronald K. Calgaard | | Director | | February 24, 201123, 2012 |
| (Ronald K. Calgaard) | | |
| | | | | |
| /s/ Jerry D. Choate | | Director | | February 24, 201123, 2012 |
| (Jerry D. Choate) | | |
| | | | | |
| /s/ Ruben M. Escobedo | | Director | | February 24, 201123, 2012 |
| (Ruben M. Escobedo) | | |
| | | | | |
| /s/ Bob Marbut | | Director | | February 24, 201123, 2012 |
| (Bob Marbut) | | |
| | | | | |
| /s/ Donald L. Nickles | | Director | | Februar y 24, 2011February 23, 2012 |
| (Donald L. Nickles) | | |
| | | | | |
| /s/ Robert A. Profusek | | Director | | February 24, 201123, 2012 |
| (Robert A. Profusek) | | |
| | | | | |
| /s/ Susan Kaufman Purcell | | Director | | February 24, 201123, 2012 |
| (Susan Kaufman Purcell) | | |
| | | | |
| /s/ Stephen M. Waters | | Director | | February 24, 201123, 2012 |
| (Stephen M. Waters) | | |
| | | | | |
| /s/ Randall J. Weisenburger | | Director | | February 24, 201123, 2012 |
| (Randall J. Weisenburger) | | |
| | | | | |
| /s/ Rayford Wilkins, Jr. | | Director | | February 24, 201123, 2012 |
| (Rayford Wilkins, Jr.) | | &nbs p; |