UNITED STATES
SECURITIES AND EXCHANGE COMMISSION
Washington, D. C. 20549
FORM 10-K/A
Amendment No. 1
| x | ANNUAL REPORT PURSUANT TO SECTION 13 |
For the fiscal year ended December 31, 2017
| o | TRANSITION REPORT PURSUANT TO SECTION 13 OR 15(d) OF THE SECURITIES EXCHANGE ACT OF 1934 |
| For the transition period from ____________to ______________. | |
Commission File Number | Exact name of registrant as specified in its charter and principal office address and telephone number | State of Incorporation | I.R.S. Employer Identification No. | Name of exchange on which registered | Securities registered pursuant to Section 12(b) of the Act: | Securities registered pursuant to Section 12(g) of the Act: |
| 1-6364 | South Jersey Industries, Inc. 1 South Jersey Plaza Folsom, NJ 08037 (609) 561-9000 | New Jersey | 22-1901645 | New York Stock Exchange | Common Stock - $1.25 par value per share (Title of each class) | None |
| 000-22211 | South Jersey Gas Company 1 South Jersey Plaza Folsom, NJ 08037 (609) 561-9000 | New Jersey | 21-0398330 | |||
| None | ||||||
Indicate by check mark if the registrant is a well-known seasoned issuer, as defined in Rule 405 of the Securities Act:
South Jersey Industries, Inc.: Yes x No o
South Jersey Gas Company: Yes oNo x
Indicate by check mark if theeach registrant is not required to file reports pursuant to Section 13 or 15(d) of the Securities Act: Yes oNo x
Indicate by check mark whether theeach registrant (1) has filed all reports required to be filed by Section 13 or 15(d) of the Securities Exchange Act of 1934 during the preceding 12 months (or for such shorter period that theeach registrant was required to file such reports), and (2) has been subject to such filing requirements for the past 90 days.
Yes xNo o
Indicate by check mark whether theeach registrant has submitted electronically and posted on its corporate Web site, if any, every Interactive Data File required to be submitted and posted pursuant to Rule 405 of Regulation S-T (§232.405 of this chapter) during the preceding 12 months (or for such shorter period that theeach registrant was required to submit and post such files). Yes x No o
Indicate by check mark if disclosure of delinquent filers pursuant to Item 405 of Regulation S-K is not contained herein, and will not be contained, to the best of registrant’sregistrant's knowledge, in definitive proxy or information statements incorporated by reference in Part III of this Form 10-K or any amendment to this Form 10-K.
South Jersey Industries, Inc.: o
South Jersey Gas Company: x
Indicate by check mark whether theeach registrant is a large accelerated filer, an accelerated filer, or a non-accelerated filer.filer, smaller reporting company, or an emerging growth company. See definitionthe definitions of “accelerated filer” and “large accelerated filer”filer,” “accelerated filer,” “smaller reporting company” and "emerging growth company" in Rule 12b-2 of the Exchange Act. (Check one):
| South Jersey Industries, Inc.: | ||
Large accelerated filer x | Accelerated filer o | Non-accelerated filer o |
Smaller reporting company o | Emerging growth company o | |
| South Jersey Gas Company: | ||
Large accelerated filer o | Accelerated filer o | |
Non-accelerated filer x | ||
Smaller reporting company o | Emerging growth company o | |
Indicate by check mark whether any of the registrant isregistrants are a shell company (as defined in Rule 12b-2 of the Exchange Act). Yes oNo x
Documents Incorporated by Reference: None
In Part III of Form 10-K: Portions of South Jersey Industries, Inc.'s definitive proxy statement for its 2018 annual meeting of shareholders to be filed with the Securities and Exchange Commission are incorporated by reference into Part III of this Form 10-K.
EXPLANATORY NOTE:
South Jersey Industries, Inc. (the “Company”) filed its Annual Report on Form 10-K for the fiscal year ended December 31, 2017 (the “Original Filing”) with the U.S. Securities and Exchange Commission (the “SEC”) on February 26, 2018 as part of a combined report also filed separately by its wholly-owned subsidiary, South Jersey Gas Company. The Company is filing this Amendment No. 1 (this “Amendment”) to the Original Filing solely to correct three typographical errors as follows:
1) A date contained in the REPORT OF INDEPENDENT REGISTERED PUBLIC ACCOUNTING FIRM related to its Opinion on the Financial Statements of the Company and its subsidiaries, as shown on page 145 of the Original Filing. In that report, the date cross-referencing the accounting firm’s Opinion on Internal Control over Financial Reporting was inadvertently referenced as February 23, 2018. The correct date of the Opinion on Internal Control over Financial Reporting is February 26, 2018. That error has been corrected in this Amendment.
2) A date contained in the REPORT OF INDEPENDENT REGISTERED PUBLIC ACCOUNTING FIRM related to its Opinion on Internal Control over Financial Reporting of the Company and its subsidiaries, as shown on page 150 of the Original Filing. In that report, the date cross-referencing the accounting firm’s Opinion on the Financial Statements was inadvertently referenced as February 23, 2018. The correct date of the Opinion on the Financial Statements is February 26, 2018. That error has been corrected in this Amendment.
3) A date contained in the REPORT OF INDEPENDENT REGISTERED PUBLIC ACCOUNTING FIRM related to its Opinion on the Financial Statement Schedules of the Company, as shown on page 159 of the Original Filing. In that report, the date cross-referencing the accounting firm’s Opinion on the Financial Statements as well as its Opinion on Internal Control over Financial Reporting was inadvertently referenced as February 23, 2018. The correct date of the Opinion on the Financial Statements as well as the Opinion on Internal Control over Financial Reporting is February 26, 2018. That error has been corrected in this Amendment.
In addition, pursuant to the rules of the SEC, the exhibit list included in Item 15 of Part IV of the Original Filing has been amended to contain currently-dated certifications from the Principal Executive Officer and Chief Financial Officer of each of the Company and South Jersey Gas Company, as required by Sections 302 and 906 of the Sarbanes-Oxley Act of 2002. The certifications of the Company's Chief Executive Officer and Chief Financial Officer are attached as exhibits to this Amendment.
Except as described above, this Amendment does not amend or update any other information contained in the Original Filing. For ease of reference, the Company has included a complete copy of the Original Filing, amended as described above, in this Amendment.
TABLE OF CONTENTS
| Page No. | ||
| PART I | ||
| Item 4A. | ||
| PART II | ||
| South Jersey Industries, Inc. | ||
| South Jersey Gas Company | ||
| Item 9. | ||
| PART III | ||
| PART IV | ||
INTRODUCTION
FILING FORMAT
This Annual Report on Form 10-K is a combined report being filed separately by two registrants: South Jersey Industries, Inc. (SJI) and South Jersey Gas Company (SJG). Information relating to SJI or any of its subsidiaries, other than SJG, is filed by SJI on its own behalf. SJG is only responsible for information about itself.
Except where the content clearly indicates otherwise, any reference in the report to "SJI," "the Company," "we," "us" or "our" is to SJI and all of its subsidiaries, including SJG, which is a wholly-owned subsidiary of SJI.
Management's Discussion and Analysis of Financial Condition and Results of Operations (Management's Discussion) included under Item 7 is divided into two major sections: SJI and SJG. Financial information in this Annual Report on Form 10-K included in Item 8 includes separate financial statements (i.e., statements of income, statements of comprehensive income, statements of cash flows, balance sheets, and statements of changes in equity and comprehensive income) for SJI and SJG. The Notes to Consolidated Financial Statements are presented on a combined basis for both SJI and SJG.
Forward Looking Statements
Certain statements contained in this Annual Report on Form 10-K may qualify as “forward-looking statements” within the meaning of Section 27A of the Securities Act of 1933 and Section 21E of the Securities Exchange Act of 1934. All statements in this Report other than statements of historical fact, included in this Reportincluding statements regarding future results of operations or financial position, expected sources of incremental margin, strategy, financing needs, future capital expenditures and the outcome or effect of ongoing litigation, should be considered forward-looking statements made in good faith by South Jersey Gas Company (SJGIndustries (SJI or the Company) and South Jersey Gas Company (SJG), as applicable, and are intended to qualify for the safe harbor from liability established by the Private Securities Litigation Reform Act of 1995. When used in this Report, or any other of the Company’s documents or oral presentations, words such as “anticipate,” “believe,” "estimate," “expect,” “estimate,” “forecast,” “goal,” “intend,” “objective,” “plan,” “project,” “seek,” “strategy”“strategy,” "target," "will" and similar expressions are intended to identify forward-looking statements. These forward-looking statements are based on the beliefs and assumptions of management at the time that these statements were made and are inherently uncertain. Such forward-looking statements are subject to risks and uncertainties that could cause actual results to differ materially from those expressed or implied in the forward-looking statements. These risks and uncertainties include, but are not limited to the risks set forth under “Risk Factors” in Part I, Item 1A of this Report and elsewhere throughout this Report. These cautionary statements should not be construed by you to be exhaustive and they are made only as of the date of this Report. While the Company believes these forward-looking statements to be reasonable, there can be no assurance that they will approximate actual experience or that the expectations derived from them will be realized. Further, neither SJI nor SJG undertakes no obligation to update or revise any of its forward-looking statements whether as a result of new information, future events or otherwise.
Available Information
| Units of Measurement | ||
| For Natural Gas: | ||
| 1 | = One billion cubic feet | |
| 1dt | = One decatherm | |
| 1 | = One million decatherms | |
| dts/d | = Decatherms per day | |
| MDWQ | = Maximum daily withdrawal quantity | |
| For Electric: | ||
| 1 MMmwh | = One million megawatt hours | |
| 1 mwh | = One megawatt hour | |
South Jersey Industries, Inc.
Part I
PART I
Item 1. Business
Description of Business
South Jersey Industries, Inc. (SJI or the Company), a New Jersey corporation, was formed in 1969 for the purpose of owning and holding all of the outstanding common stock of South Jersey Gas Company, a public utility, and acquiring and developing non-utility lines of business.
SJI currently provides a variety of energy-related products and services, primarily through the following wholly-owned subsidiaries:
South Jersey Gas Company (SJG) is a regulated natural gas utility. SJG distributes natural gas in the seven southernmost counties of New Jersey.
South Jersey Energy Company (SJE) acquires and markets natural gas and electricity to retail end users and provides total energy management services to commercial, industrial and residential customers.
South Jersey Resources Group, LLC (SJRG) markets natural gas storage, commodity and transportation assets along with fuel management services on a wholesale basis in the mid-Atlantic, Appalachian and southern states.
South Jersey Exploration, LLC (SJEX) owns oil, gas and mineral rights in the Marcellus Shale region of Pennsylvania.
Marina Energy, LLC (Marina) develops and operates on-site energy-related projects. It currently operates projects in New Jersey, Maryland, Massachusetts and Vermont. The significant wholly-owned subsidiaries of Marina include:
ACB Energy Partners, LLC (ACB) owns and operates a natural gas fueled combined heating, cooling and power facility located in Atlantic City, New Jersey.
AC Landfill Energy, LLC (ACLE), BC Landfill Energy, LLC (BCLE), SC Landfill Energy, LLC (SCLE) and SX Landfill Energy, LLC (SXLE) own and operate landfill gas-to-energy production facilities in Atlantic, Burlington, Salem and Sussex Counties in New Jersey.
MCS Energy Partners, LLC (MCS), NBS Energy Partners, LLC (NBS) and SBS Energy Partners, LLC (SBS) own and operate solar-generation sites located in New Jersey.
South Jersey Energy Service Plus, LLC (SJESP) serviced residential and small commercial HVAC systems, installed small commercial HVAC systems, provided plumbing services and serviced appliances under warranty via a subcontractor arrangement as well as on a time and materials basis. On September 1, 2017, SJESP sold certain assets of its residential and small commercial HVAC and plumbing business to a third party. SJESP will receive commissions paid on service contracts from the third party on a go forward basis. This transaction did not have a material impact on the consolidated financial statements.
SJI Midstream, LLC (Midstream) invests in infrastructure and other midstream projects, including a current project to build an approximately 118-mile natural gas pipeline in Pennsylvania and New Jersey.
In October 2017, SJI announced that it had entered into agreements to acquire the assets of Elizabethtown Gas and Elkton Gas from Pivotal Utility Holdings, Inc., a subsidiary of Southern Company Gas. SJI is acquiring the assets of both companies for total consideration of $1.7 billion. The transaction is expected to close in mid-2018, and is subject to approvals by the New Jersey Board of Public Utilities (BPU) and the Maryland Public Service Commission (PSC), with limited approvals also required from the Federal Energy Regulatory Commission (FERC) and the Federal Communications Commission (FCC), as well as certain anti-trust filings and approvals.
Additional informationInformation on the nature of our business is incorporated by reference to “Management’sSJI's and SJG's businesses can be found in “Management's Discussion and Analysis of Financial Condition and Results of Operations,” “Market Risk” and Note 3 to the financial statements.under Item 7 of this Report.
South Jersey Industries, Inc.
Part I
Financial Information About Reportable Segments
Information on our rates and regulatory affairsregarding Reportable Segments is incorporated by reference to “Management’s Discussion and AnalysisNote 8 of Financial Condition and Resultsthe consolidated financial statements included under Item 8 of Operations,” and Note 3 to the financial statements.this Report.
Sources and Availability of Raw Materials
South Jersey Gas Company
Transportation and Storage Agreements
SJG has direct connections to the interstate pipeline systems of both Transcontinental Gas Pipe Line Company, LLC (Transco) and Columbia Gas Transmission, LLC (Columbia). During 2015,2017, SJG purchased and had delivered approximately 44.8 million decatherms (MMdts)55.4 MMdts of natural gas for distribution to both on-system and off-system customers and for injections into storage. Of this total, 28.131.9 MMdts were transported on the Transco pipeline system while 16.723.5 MMdts were transported on the Columbia pipeline system. Moreover,Also during 20152017, third-party suppliers delivered 30.427.4 MMdts to SJG's system on behalf of end use customers behind ourSJG's city gate stations. SJG also secures other long-term services from Dominion Transmission, Inc. (Dominion), a pipeline upstream of the Transco and Columbia systems. Services provided by Dominion are utilized to deliver gas into either the Transco or Columbia systems for ultimate delivery to SJG. In addition, effective December 1, 2017, SJG initiated a new firm transportation service with Tennessee Gas Pipeline Company, L.L.C. (Tennessee). Gas transported by Tennessee will be delivered to the Columbia system for subsequent delivery to SJG. Services provided by all of the above-mentioned pipelines are subject to the jurisdiction of the Federal Energy Regulatory Commission (FERC). Unless otherwise indicated, our intentions are to renew or extend these service agreements before they expire.
Transco:
Transco is SJG’sSJG's largest supplier of long-term gas transmission services which includes both year-round and seasonal firm transportation (FT) service arrangements. When combined, these FT services enable SJG to purchase gas from third parties and have delivered to its city gate stations by Transco a total of 297,958 dts per day (dts/d). Of this total, 133,917 dts/d is long-haul FT (where gas can be transported from the production areas of the Southwest to the market areas of the Northeast) while 164,041 dts/d is market area FT. The terms of SJG’sSJG's year-round agreements with Transco extend for various periods through 2025. SJG's seasonalCertain of these agreements are currently operating under their respective evergreen provisions.
Of the 297,958 dts/d of Transco services mentioned above, SJG has released a total of 49,04110,000 dts/d of its long-haul and 20,000 dts/d of its market area FT service. These releases were made in association with SJG’sSJG's Conservation Incentive Program (CIP) discussed further under Item 7, "Management’s"Management's Discussion and Analysis of Financial Condition and Results of Operations." In addition, SJG released a total of 50,00035,000 dts/d of its long-haul FT and 5,000 dts/d of its market area FT as part of Asset Management Agreements (AMA). The AMA-related releases are discussed below under “Gas Supplies.” In addition, SJG released a total of 30,000 dts/d of its long-haul FT as an Off-System Sale capacity release.
SJG currently has six long-term gas storage service agreements with Transco that, when combined, are capable of storing approximately 5.0 MMdts. Through these agreements, SJG can inject gas into market and production area storages during periods of low demand and extract gas at a Maximum Daily Withdrawal Quantity (MDWQ) of up to 107,407 dts during periods of high demand. The longest term of these storage service agreements extends through March 31, 2023.
Dominion:
SJG subscribes to a firm storage service from Dominion, under its Rate Schedule GSS. This storage has an MDWQ of 10,000 dts during the period between November 16 and March 31 of each winter season, with an associated total storage capacity of 423,000 dts. Gas withdrawn from Dominion GSS storage is delivered through both the Dominion and Transco (Leidy Line) pipeline systems for delivery to SJG service territory. The primary term of this agreement extends through March 31, 2019.
Columbia:
SJG subscribes to four firm transportation agreements with Columbia which currently provide for an aggregate of 104,022124,022 dts/d with thed. The term of 9,000 dts/d of this capacity extendingextends through October 31, 2017 while2022; the term of 45,022 dts/d of this deliverability extends through October 31, 2019. The2019; and the remaining 50,00070,000 dts/d continuesextends through October 31, 2030. SJG released 8,671 dts/d of this amount to
South Jersey Resources Group, LLC (SJRG), an affiliate by common ownership, in conjunction with its Conservation Incentive Program ("CIP") thereby reducing the combined availability of firm transportation on the Columbia system to 95,351 dts/d. In addition, SJG released a total of 20,000 dts/d of this capacity to a gas marketer as part of an AMA leaving a net of 75,351 dts/d available to SJG. This AMA-related release is further discussed below under “Gas Supplies.”Industries, Inc.
Part I
SJG also subscribes to a firm storage service with Columbia under its Rate Schedule FSSFederal Supply Schedule (FSS) along with an associated firm transportation service under Rate Schedule SST, each of which extends through October 31, 2019. The CompanySJG has a total FSS MDWQ of 52,891 dts and a related 3,473,022 dts of storage capacity. SJG released to SJRG 19,029 dts/d of its FSS MDWQ along with 1,249,485 dts of its FSS storage capacity. Additionally, SJG released to SJRG 19,029 dts/d of its associated Columbia SST transportation service. Both releases made by SJG were in connection with its CIP and extend through September 30, 2016.2018.
Gas Supplies
During 2015,2017, SJG entered into an AMA with a gas marketer which extends through March 31, 2016.2018. Under this agreement, SJG released to the marketer its firm transportation rights equal to 30,000 dts/d of transportation capacity on Transco. The marketer manages this capacity and provides SJG with up to 30,000 dts/d of firm deliverability each day through March 31, 2016.2018. The marketer's intent was to optimize the capacity released to themSJG under this AMA and pay SJG a monthlyan asset management fee.
Also during 2015,2017, SJG entered into twoan additional AMA'sAMA with twoa separate gas marketersmarketer which both extendextends through October 31, 2016.2018. Under these agreements,this agreement, SJG has released to each of the marketers firm transportation rights equal tomarketer 10,000 dts/d of its firm transportation capacity on Transco.rights. As part of this transition the total quantity is split into two arrangements of 5,000 dts/d each under a separate Transco contract. The marketersmarketer manages their respectiveits capacity and provideprovides SJG with up to 10,000 dts/d each of firm deliverability every dayeveryday through March 31, 2018 in one case and through October 31, 2016. The marketers will seek2018 as to optimize the capacity released to them under these AMA's and pay SJG a one-time asset management fee.
SJG also has a long-term gas purchase agreement with an additional gas producer, with a primary term which extends ten years. The MDQ available for purchase under this agreement has started, effective December 1, 2017, at 55,000 dts/d and will increase to an MDQ of 70,000 dts/d. Gas purchased from this producer will be sourced in Northeast Pennsylvania and delivered into the Columbia pipeline system for delivery to SJG.
As part of its gas purchasing strategy, SJG uses financial contracts to hedge against forward price risk. These contracts are recoverable through SJG’s BGSS,Basic Gas Supply Service Clause (BGSS), subject to the New Jersey Board of Public Utilities (BPU) approval.
Supplemental Gas Supplies
SJG operates peaking facilities, which can storelocated in McKee City, NJ, where it liquefies, stores and vaporize LNGvaporizes liquefied natural gas (LNG) for injection into its distribution system. SJG’sSJG's LNG facility has a storage capacity equivalent to 434,300 dts of natural gas and has an installed capacity to vaporize up to 118,250 dts of LNG per day for injection into its distribution system.
Peak-Day Supply
SJG plans for a winter season peak-day demand on the basis of an average daily temperature of 2 degrees Fahrenheit (F). or 63 Heating Degree Days. Gas demand on such a design day for the 2015-20162017-2018 winter season is estimated to be 503,873527,490 dts (excluding industrial customers). SJG projects that it has adequate supplies and interstate pipeline entitlements to meet its design day requirements. SJG experienced its highest peak-day demand for calendar year 20152017 of 507,219480,820 dts (including industrial customers) on February 15,December 31, while experiencing an average temperature of 10.112.9 degrees F that day.
Natural Gas Prices
South Jersey Industries, Inc.
Part I
South Jersey Energy Company
Transportation and Storage Agreements - Natural Gas
Access to gas suppliers and cost of gas are significant to the operations of SJE. No material part of the business of SJE is dependent upon a single customer or a few customers. SJE purchases delivered gas only, primarily from SJRG. Consequently, SJE maintains no transportation or storage agreements.
Electric Supply
Due to the liquidity in the market, SJE primarily purchases delivered electric in the day-ahead and real-time markets through regional transmission organizations.
South Jersey Resources Group
Transportation and Storage Agreements
National Fuel Gas Supply Corporation:
SJRG has multiple storage service agreements with National Fuel Gas Supply Corporation (National Fuel). Two contracts totaling 2,581,420 dts of capacity have evergreen provisions that extend year to year. One additional contract covering 224,576 dts of storage capacity extends through March 31, 2020, while a final contract covering 150,040 dts of capacity expires March 31, 2023.
SJRG holds long-term firm transportation agreements with National Fuel associated with the above-mentioned agreements which expire between January 31, 2022 and October 31, 2027. Under these agreements, National Fuel provides various receipts and deliveries in Pennsylvania, which total 66,682 dts/d. National Fuel will also provide SJRG with 25,661 dts/d of maximum daily withdrawal transportation quantity, with a primary delivery point of the Transcontinental Gas Pipeline.
Transcontinental Gas Pipeline (Transco):
SJRG has a storage agreement with Transco for storage service at Transco's WSS facility which expires October 31, 2018. Under this contract, up to 24,479 dts/d may be injected and up to 46,380 dts/d may be withdrawn. Total storage capacity under the agreement is 4,406,135 dts.
SJRG holds various firm transportation agreements with Transco. SJRG has 10,000 dts/d of capacity from Leidy, PA to Con Edison, NY expiring March 31, 2043. SJRG also holds evergreen capacity of 41,400 dts/d with receipts in Texas and deliveries in New Jersey, which also expires March 31, 2043.
SJRG has transportation agreements with Transco acquired through a capacity release program from SJG of 47,500 dts/d from Pennsylvania to SJG, and 10,000 dts/d from Texas to SJG. These agreements expire between March 31, 2018 and April 30, 2020.
Dominion Gas Transmission:
SJRG has a firm transportation agreement with Dominion which expires October 31, 2022. Under this agreement, Dominion will provide SJRG with 5,000 dts/d of deliveries to Leidy, PA and receipts at Lebanon, OH.
Columbia Gas Transmission:
SJRG holds various firm transportation agreements with Columbia. SJRG has 50,000 dts/d capacity with receipts from Marcellus to southern NJ expiring October 31, 2018. SJRG also has 36,866 dts/d of capacity from Marcellus to southern NJ and PA expiring between October 31, 2019 and October 31, 2024.
South Jersey Industries, Inc.
Part I
SJRG has a storage agreement with Columbia for service under Columbia's FSS rate schedule. Under this evergreen agreement, Columbia will provide SJRG with storage capacity of 1,249,515 dts. Under this agreement, 19,029 dts/d may be withdrawn from storage and 9,514 dts/d may be injected.
SJRG holds firm transportation related to the above mentioned storage agreement which provides for receipts from storage and deliveries to New Jersey of 19,029 dts/d. Under this evergreen contract, these services with Columbia were released to SJRG by SJG.
Columbia Gulf Transmission:
SJRG holds a firm transportation agreement with Columbia Gulf which expires October 31, 2019. Under this agreement, Columbia Gulf provides receipts in Louisiana with deliveries at Leach, Kentucky in the amount of 15,000 dts/d.
Tennessee Gas Transmission:
SJRG holds firm transportation agreements with the Tennessee Gas Pipeline which expire between October 31, 2018 and May 31, 2033. Under these agreements, the Tennessee Gas Pipeline provides various receipts and deliveries in Pennsylvania, which total 199,770 dts/d.
Texas Eastern Transmission (Tetco):
SJRG holds firm transportation agreements with Tetco. SJRG has an agreement for Tetco to provide 56,250 dts/d of capacity expiring October 31, 2025, and an additional evergreen contract of 15,125 dts/d of capacity expiring March 31, 2019.
Gas Supplies
SJRG has entered into several long-term natural gas supply agreements to purchase a minimum of 604,000 dts/d and up to 954,000 dts/d, depending upon production levels, for terms ranging from three to ten years at index-based prices.
Patents and Franchises
South Jersey Gas Company
SJG holds nonexclusive franchises granted by municipalities in the seven-county area of southern New Jersey that it serves. No other natural gas public utility presently serves the territory covered by SJG’sSJG's franchises. Otherwise, patents, trademarks, licenses, franchises and concessions are not material to the business of SJG.
Seasonal Aspects
South Jersey Gas Company
SJG experiences seasonal fluctuations in sales when selling natural gas for heating purposes. SJG meets this seasonal fluctuation in demand from its firm customers by buying and storing gas during the summer months, and by drawing from storage and purchasing supplemental supplies during the heating season. As a result of this seasonality, SJG’sSJG's revenues and net income are significantly higher during the first and fourth quarters than during the second and third quarters of the year.
Non-Utility Companies
Among SJI's non-utility activities, wholesale (including fuel supply management) and retail gas marketing have seasonal patterns similar to SJG's. Activities such as energy services and energy project development do not follow seasonal patterns. Other activities, such as retail electric marketing, can have seasonal earnings patterns that are different from the utility. The first and fourth quarters remain the periods where most of SJI's revenue and net income is produced.
South Jersey Industries, Inc.
Part I
Working Capital Practices
Reference is made to “Liquidity and Capital Resources” included in Item 7, “Management’s“Management's Discussion and Analysis of Financial Condition and Results of Operations,” of this Report.
Customers
No material part of SJG’sthe Company's business is dependent upon a single customer or a few customers, the loss of which would be expected to have a material adverse effect on SJG’s business.the results of operations of SJI or of SJG on a consolidated basis.
Backlog
Backlog is not material to an understanding of SJG’s business.SJI's business or that of any of its subsidiaries.
Government Contracts
No material portion of SJG’sthe business of SJI or any of its subsidiaries is subject to renegotiation of profits or termination of contracts or subcontracts at the election of any government.
Competition
Information on competition is incorporated by reference tofor SJI and its subsidiaries can be found in Item 7, “Management’s“Management's Discussion and Analysis of Financial Condition and Results of Operations,” of this Report.
Research
During the last three fiscal years, SJG did not engageneither SJI nor any of its subsidiaries engaged in research activities to any material extent.
Environmental Matters
Information on environmental matters for SJI and its subsidiaries can be found in Note 1215 of the consolidated financial statements.statements included under Item 8 of this Report.
Employees
Financial Information About Foreign and Domestic Operations and Export Sales
South Jersey Industries, Inc.
Part I
Item 1A. Risk Factors
SJI and its subsidiaries, including SJG, operatesoperate in an environment that involves risks, many of which are beyond our control. The CompanySJI has identified the following risk factors that could cause the Company’sSJI's operating results and financial condition to be materially adversely affected. Security holders should carefully consider these risk factors and should also be aware that this list is not all-inclusive of existing risks. In addition, new risks may emerge at any time, and the CompanySJI cannot predict those risks or the extent to which they may affect the Company’sSJI's businesses or financial performance. To the extent such risk factors may affect SJI's utility business, SJG, such risk factors may also affect SJG's business or performance.
SJI is a holding company and its assets consist primarily of investments in subsidiaries. Should SJI's subsidiaries be unable to pay dividends or make other payments to SJI for financial, regulatory, legal or other reasons, SJI's ability to pay dividends on its common stock could be limited. SJI's stock price could be adversely affected as a result.
Changes in the regulatory environment or unfavorable rate regulation at its utility may have an unfavorable impact on SJG’sSJI's and SJG's financial performance or condition. SJG’s businessSJG is regulated by the New Jersey Board of Public Utilities (BPU) which has authority over many of the activities of the utility business including, but not limited to, the rates it charges to its customers, the amount and type of securities it can issue, the nature of investments it can make, the nature and quality of services it provides, safety standards and other matters. The extent to which the actions of regulatory commissions restrict or delay SJG’sSJG's ability to earn a reasonable rate of return on invested capital and/or fully recover operating costs may adversely affect itsSJI's and SJG's results of operations, financial condition and cash flows.
SJI and SJG may not be able to respond effectively to competition, which may negatively impact SJG’stheir financial performance or condition.Regulatory initiatives may provide or enhance opportunities for competitors that could reduce utility income obtained from existing or prospective customers. Also, competitors in all of SJI's business lines may be able to provide superior or less costly products or services based upon currently available or newly developed technologies.
Warm weather, high commodity costs, or customer conservation initiatives could result in reduced demand for natural gas.some of SJI's and SJG's energy products and services. SJG currently has a conservation incentive program clause that protects its revenues and gross margin against usage that is lower than a set level. Should this clause be terminated without replacement, lower customer energy utilization levels would likely reduce SJG’sSJI's and SJG's net income. Further, during periods of warmer temperatures, demand and volatility in the natural gas market could decrease, which would negatively impact their financial results.
High natural gas prices could cause more of SJG’sSJI's and SJG's receivables to be uncollectible.Higher levels of uncollectibles from utilityeither residential or commercial customers would negatively impact SJG’sSJI's and SJG's income and could result in higher working capital requirements.
Climate change legislation could impact SJG’sSJI's and SJG's financial performance and condition. Climate change is receiving ever increasing attention from both scientists and legislators. The debate is ongoing as to the extent to which our climate is changing, the potential causes of this change and its future impacts. Some attribute global warming to increased levels of greenhouse gases, which has led to significant legislative and regulatory efforts to limit greenhouse gas emissions. The outcome of federal and state actions to address global climate change could result in a variety of regulatory programs, including additional charges to fund energy efficiency activities or other regulatory actions. These actions could affect the demand for natural gas and electricity, result in increased costs to our business and impact the prices we charge our customers. Because natural gas is a fossil fuel with low carbon content, it is possible that future carbon constraints could create additional demands for natural gas, both for production of electricity and direct use in homes and businesses. Any adoption by federal or state governments mandating a substantial reduction in greenhouse gas emissions could have far-reaching and significant impacts on the energy industry. We cannot predict the potential impact of such laws or regulations on our future consolidated financial condition, results of operations or cash flows.
Increasing interest rates would negatively impact the net income of SJI and SJG. Several of SJI's subsidiaries, including SJG, are capital intensive, resulting in the securityincurrence of significant amounts of debt financing. Some of the long-term debt of SJI and its subsidiaries is issued at fixed rates or has utilized interest rate swaps to mitigate changes in variable rates. However, long-term debt of SJI and SJG at variable rates, along with all variable rate short-term borrowings, are exposed to the impact of rising interest rates.
The inability to obtain capital, particularly short-term capital from commercial banks, could negatively impact the daily operations and financial performance of SJI and SJG. SJI and SJG use short-term borrowings under committed credit facilities provided by commercial banks to supplement cash provided by operations, to support working capital needs, and to finance capital expenditures, as incurred. SJG also relies upon short-term borrowings issued under a commercial paper program supported by a committed bank credit facility to support working capital needs, and to finance capital expenditures, as incurred. If the customary sources of short-term capital were no longer available due to market conditions, SJI and its subsidiaries may not be able to meet their working capital and capital expenditure requirements and borrowing costs could increase.
A downgrade in either SJI's or SJG's credit ratings could negatively affect our computer systems through cyberattacks, hackers or other sources, could haveability to access adequate and cost-effective capital. Our ability to obtain adequate and cost-effective capital depends to a material adverse impactsignificant degree on our businesscredit ratings, which are greatly influenced by our financial condition and results of operations. SJG uses computer systems and services that involve If the storage of confidential information onrating agencies downgrade either SJI's or SJG's credit ratings, particularly below investment grade, our employees, customers and vendors.borrowing costs would increase. In addition, we would likely be required to pay higher interest rates in future financings and potential funding sources would likely decrease. To the extent that a decline in SJG's credit rating has a negative effect on SJI, SJI could be required to provide additional support to certain computer systems monitorcounterparties.
Hedging activities of the Company designed to protect against commodity price or interest rate risk may cause fluctuations in reported financial results and control our distribution processes. Experienced hackers maySJI's stock price could be ableadversely affected as a result. Although SJI enters into various contracts to develop and deploy viruses that exploithedge the securityvalue of our computer systems and thusenergy assets, liabilities, firm commitments or forecasted transactions, the timing of the recognition of gains or losses on these economic hedges in accordance with accounting principles generally accepted in the United States of America does not always match up with the gains or losses on the items being hedged. The difference in accounting can result in volatility in reported results, even though the expected profit margin is essentially unchanged from the dates the transactions were consummated.
The inability to obtain confidential information and/natural gas or disrupt significant business processes. Unauthorized access to confidential information or disruptions to significant business processes could damage our reputation andelectricity from suppliers would negatively impact ourthe financial performance of SJI and SJG. Several of SJI's subsidiaries, including SJG, have businesses based upon the ability to deliver natural gas or electricity to customers. Disruption in the production or transportation to SJI or SJG from its suppliers could prevent SJI or SJG from completing sales to its customers.
South Jersey Industries, Inc.
Part I
Transporting and storing natural gas involves numerous risks that may result in accidents and other operating risks and costs. SJI's and SJG's gas distribution activities involve a variety of inherent hazards and operating risks, such as leaks, accidents, mechanical problems, natural disasters or terrorist activities which could cause substantial financial losses. In addition, these risks could result in loss of human life, significant damage to property, environmental pollution and impairment of operations, which in turn could lead to substantial losses. In accordance with customary industry practice, SJI and SJG maintain insurance against some, but not all, of these risks and losses. The occurrence of any of these events, even if fully covered by insurance, could adversely affect SJI's or SJG's financial position, results of operations and financial condition.cash flows.
Adverse results in legal proceedings could be detrimental to the financial condition of SJI or SJG. The outcomes of legalproceedings can be unpredictable and can result in adverse judgments.
Renewable energy projects at Marina receive significant benefit from regulatory incentives. A significant portion of the expected return on investment of these renewable energy projects is dependent upon the future market for renewable energy credits (RECs). The benefits from RECs are produced during the entire life of the project. As a result, earnings from existing projects would be adversely affected without a liquid REC market. Therefore, these projects are exposed to the risk that favorable regulatory incentives expire or are adversely modified. A decrease in the future value of electricity and Solar RECs (SRECs) impacted by market conditions and/or legislative changes may negatively impact Marina's return on its investments as well as lead to impairment of the respective assets.
Constraints in available pipeline capacity, particularly in the Marcellus Shale producing region, may negatively impact SJI's financial performance. Natural gas production and/or pipeline transportation disruptions in the Marcellus region, where SJI has natural gas receipt requirements, may cause temporary take-away constraints resulting in higher transportation costs and the sale of shale gas at a loss.
SJI's and SJG's business could be adversely impacted by strikes or work stoppages by its unionized employees.employees. The gas utility operations of SJG are dependent upon employees represented by unions and covered under collective bargaining agreements. A work stoppage could negatively impact operations, which could impact financial results as well as customer relationships.
The risk of terrorism may adversely affect the economy as well as SJI's and SJG's business. An act of terror could result in disruptions of natural gas supplies cause price volatility in the cost of natural gas and overall could cause instability in the financial and capital markets. This could adversely impact SJI's or SJG's ability to deliver products or raise capital and could adversely impact its results of operations.
Failure to obtain proper approvals and property rights in the pricePennEast pipeline could hinder SJI's equity investment in the project. Construction, development and availabilityoperation of energy investments, specifically the PennEast pipeline, are subject to federal and state regulatory oversight and require certain property rights from public and private property owners, as well as regulatory approvals, including environmental and other permits and licenses. SJI, as well as our joint venture partners in the PennEast pipeline, may be unable to obtain all such needed property rights, permits and licenses to successfully construct and develop the pipeline, and failing to do so could cause SJI's equity investment in the project to become impaired. Such impairment could have a materially adverse effect on SJI's financial condition and results of operations.
Our business could be harmed by cybersecurity threats and related disruptions. We rely extensively on information technology systems to process transactions, transmit and store information and manage our business. Disruption or failure of our information technology systems could shut down our facilities or otherwise harm our ability to safely deliver natural gas to our customers, serve our customers effectively, manage our assets, or otherwise materially disrupt our business. Cyber threats are constantly evolving, increasing the difficulty of detecting and successfully defending against them. SJI and SJG have experienced such attacks in the past; however, based on information currently available to SJI and SJG, none have had a material impact on our business, financial condition, results of operations or cash flows. In response, we have invested in expanded cybersecurity systems and procedures designed to safeguard the continuous and uninterrupted performance of our information technology systems and protect against unauthorized access. However, all information technology systems are potentially vulnerable to security threats, including hacking, viruses, other malicious software, and other unlawful attempts to disrupt or gain access to such systems. There is no guarantee that our cybersecurity systems and procedures will prevent or detect the unauthorized access by experienced computer programmers, hackers or others. An attack on or failure of our information technology systems could result in the unauthorized disclosure, theft, misuse or destruction of customer or employee data or business or confidential information, or disrupt the performance of our information technology
South Jersey Industries, Inc.
Part I
systems. These events could expose us to potential liability, litigation, governmental inquiries, investigations or regulatory actions, harm our brand and reputation, diminish customer confidence, disrupt operations, and subject us to payment of fines or other penalties, legal claims by our clients and significant remediation costs.
Our stated long-term goals are based on various assumptions and beliefs that may not prove to be accurate, and we may not achieve our stated long-term goals by 2020 or at all. Our current long-term goals are to (i) grow Economic Earnings to $160 million by 2020; (ii) improve the quality of our earnings; (iii) maintain the strength of our balance sheet; and (iv) maintain a low-to-moderate risk profile. The goal of $160 million does not include the expected financial impact of the acquisition of Elizabethtown Gas and Elkton Gas discussed below. Management established those goals in conjunction with our board of directors based upon a number of different internal and external factors that characterize and influence our current and expected future activities. For example, these long-term goals are based on certain assumptions regarding our participation in a current project to build an approximately 118-mile natural gas pipeline in Pennsylvania and New Jersey. However, construction on this project is not expected to begin until 2018 and is estimated to be completed in the second half of 2019, but may be subject to delay. As a result, no assurance can be given that this project will be completed on time or at all. Also, as noted below, the acquisition of Elizabethtown Gas and Gas is subject to many approvals, and no assurance can be given that the acquisition will be consummated, or, if consummated, that these two entities will perform as expected. Further, the economy of Southern New Jersey has remained depressed relative to other regions, which could cause increased customer delinquencies or otherwise negatively affect achievement of our long-term earnings goals. The 2017 New Jersey gubernatorial election resulted in a change in administration which could lead to unfavorable state and local regulatory changes that could delay approvals, require environmental remediation or capital or other expenditures or otherwise adversely affect SJG'sour results of operations, financial condition or cash flows. Other factors, assumptions and beliefs of management and our board of directors on which our long-term goals were based may also prove to differ materially from actual future results. Accordingly, we may not achieve our stated long-term goals by 2020 or at all, or our stated long-term goals may be negatively revised as a result of less than expected progress toward achieving these goals, and you are therefore cautioned not to place undue reliance on these goals.
Our acquisition of Elizabethtown Gas and Elkton Gas may not be consummated, and if consummated, may not perform as expected. Wehave entered into agreements to acquire the assets of New Jersey-based Elizabethtown Gas and Maryland-based Elkton Gas. Completion of the transaction is subject to a number of risks and uncertainties and we can provide no assurance that the various closing conditions to the acquisition agreement will be satisfied, including that the required governmental and other necessary approvals will be obtained. Although we have obtained a bridge commitment, subject to certain conditions, to fund the acquisition, our ability to raise the necessary funds to provide permanent financing through the issuance of equity or debt securities is subject to market conditions and other risks and uncertainties, and there can be no assurance that we will be able to raise the necessary funds on terms we consider favorable, or at all. The inability to complete the transaction, or to obtain permanent financing on terms that are favorable, or at all, could have a material adverse effect on our results of operations, financial condition and prospects. Historically, acquisitions have not been a part of our growth strategy. Although the acquired businesses have significant operating histories, we will have no history of owning and operating these businesses and limited or no experience operating in the territories served by these businesses. We can provide no assurance that the acquired businesses will perform as expected, that integration or other one-time costs will not be greater than expected, that we will not incur unforeseen obligations or liabilities or that the rate of return from such businesses will justify our decision to invest capital to acquire them.
We may experience difficulties in integrating the operations of Elizabethtown Gas and Elkton Gas into our business and in realizing the expected benefits of the proposed acquisition. The success of the proposed acquisition of Elizabethtown Gas and Elkton Gas, if completed, will depend in part on our ability to realize the anticipated business opportunities from combining the operations of Elizabethtown Gas and Elkton Gas with our business in an efficient and effective manner. The integration process could take longer than anticipated and could result in the loss of key employees, the disruption of each company’s ongoing businesses, tax costs or inefficiencies, or inconsistencies in standards, controls, information technology systems, procedures and policies, any of which could adversely affect our ability to maintain relationships with customers, employees or other third parties, or our ability to achieve the anticipated benefits of the transaction, and could harm our financial performance. If we are unable to successfully or timely integrate the operations of Elizabethtown Gas and Elkton Gas with our business, we may incur unanticipated liabilities and be unable to realize the revenue growth, synergies and other anticipated benefits resulting from the proposed transaction, and our business, results of operations and ability to raise capital.financial condition could be materially and adversely affected.
Item 1B. Unresolved Staff Comments
None.
Item 2. Properties
The principal property of SJGSJI consists of itsSJG's gas transmission and distribution systems that include mains, service connections and meters. The transmission facilities carry the gas from the connections with Transco and Columbia to SJG’sSJG's distribution systems for delivery to customers. As of December 31, 2015,2017, there were approximately 122.7146.2 miles of mains in the transmission systems and 6,5036,645 miles of mains in the distribution systems.
SJG owns approximately 154 acres of land in Folsom, New Jersey which is the site of itsSJI's corporate headquarters. Approximately 140 acres of this property areis deed restricted. SJG also has office and service buildings at six other locations in theits territory. There is a liquefied natural gas storage, liquefaction and vaporization facility at one of these locations.
As of December 31, 2015, SJG’s2017, SJG's utility plant had a gross book value of $2.2$2.7 billion and a net book value, after accumulated depreciation, of $1.8$2.2 billion. In 2015, $207.82017, SJG spent $248.9 million was spent on additions to utility plant and there were retirements of property having an aggregate gross carrying valuebook cost of $17.8$26.6 million.
Virtually all of SJG’sSJG's transmission pipeline, distribution mains and service connections are under streets or highways or on the property of others. The transmission and distribution systems are maintained under franchises or permits or rights-of-way, many of which are perpetual. SJG’sSJG's properties (other than property specifically excluded) are subject to a lien of mortgage under which its first mortgage bonds are outstanding. We believe these properties are generally well maintained and in good operating condition.
Nonutility property and equipment with a net book value of $546.1 million consists primarily of Marina's energy projects.
South Jersey Fuel, Inc., an inactive subsidiary, owns land in Deptford Township and owns real estate in Upper Township, New Jersey.
Item 3. Legal Proceedings
SJI and SJG isare subject to claims which arisearising in the ordinary course of business and other legal proceedings. We accrue liabilitiesSJI has been named in, among other actions, certain gas supply and capacity management contract disputes and certain product liability claims related to theseour former sand mining subsidiary.
SJI is currently involved in a pricing dispute related to 2 long-term gas supply contracts. On May 8, 2017, a jury from the United States District Court for the District of Colorado returned a verdict in favor of the plaintiff supplier. On July 21, 2017, the court entered final judgment against SJG and SJRG. As a result of this ruling, SJG and SJRG have accrued $20.4 million and $53.6 million, respectively, through December 31, 2017. We believe that the amount to be paid by SJG reflects a gas cost that ultimately will be recovered from SJG’s customers through adjusted rates. As such, this amount was recorded as both an Accounts Payable and a reduction of Regulatory Liabilities on the consolidated balance sheets of both SJI and SJG as of December 31, 2017. The amount associated with SJRG was also recorded as an Accounts Payable on the consolidated balance sheets of SJI as of December 31, 2017, with charges of $49.6 million to Cost of Sales - Nonutility on the consolidated statements of income of SJI for the year ended December 31, 2017. SJI also recorded $4.0 million to Interest Charges on the consolidated statements of income for the year ended December 31, 2017. The plaintiff supplier filed a second related lawsuit against SJG and SJRG in the United States District Court for the District of Colorado on December 21, 2017, alleging that SJG and SJRG have continued to breach the gas supply contracts notwithstanding the judgmentin the prior lawsuit. The plaintiff supplier is seeking recovery of the amounts disputed by SJI since the earlier judgment, and a declaration regarding the price under the disputed contracts going forward until the contracts terminate in October 2019. SJI moved to stay the second lawsuit pending resolution of the post-judgment motions in the first lawsuit and any appeal of that lawsuit. All legal reserves related to this second lawsuit are recorded as part of the accrued amounts disclosed above.
South Jersey Industries, Inc.
Part I
SJI was involved in a dispute in the Court of Common Pleas of Philadelphia related to a three-year capacity management contract with a counterparty. The counterparty claimed that it was owed approximately $13.3 million, plus interest, from SJRG under a sharing credit within the contract. SJI settled with the counterparty for $9.5 million, which amount was recorded to Cost of Sales - Nonutility on SJI's consolidated statements of income for the year ended December 31, 2017. SJI made the payment in September 2017.
SJI was also involved in a tariff rate dispute with a counterparty, whereby SJI contended that the counterparty was overcharging for storage demand charges over a ten-year period. In November 2017, SJI received a favorable decision from the FERC on this matter, which resulted in a total pre-tax income impact of $9.3 million. Of this amount, $7.4 million related to the actual overcharges and was recorded as a decrease to Cost of Sales - Nonutility on the consolidated statements of income for the year ended December 31, 2017. The remaining $1.9 million related to interest income and was recorded in Other Income on the consolidated statements of income for the year ended December 31, 2017. SJI received payment from the counterparty in November 2017.
Liabilities related to claims are accrued when we can reasonably estimate the amount or range of amounts of probable settlement costs or other charges for these claims. The Companyclaims can be reasonably estimated. For matters other than the disputes that are noted above, SJI has accrued approximately $0.8$3.0 million and $0.5$3.1 million related to all claims in the aggregate as of December 31, 20152017 and 2014,2016, respectively, of which SJG has accrued approximately $0.7 million and $0.6 million as of December 31, 2017 and 2016, respectively. Management doesAlthough SJI and SJG do not presently believe that it is reasonably possible that there would be a material change in the Company's estimated liability in the near term and does not currently anticipate the disposition of any known claims that wouldthese matters will have a material adverse effect on our financial position, resultsits business, given the inherent uncertainties in such situations, SJI and SJG can provide no assurance regarding the outcome of operations or liquidity.litigation.
Item 4. Mine Safety Disclosures
Not applicable.
Item 4A. Executive Officers of the Registrant
Set forth below are the names, ages and positions of SJI's executive officers along with their business experience during the past five years. All executive officers of SJI are elected annually and serve at the discretion of the Board of Directors. All information is as of the date of the filing of this Report.
| Name, age and position with the Company | Period Served | |
Michael J. Renna, Age 50 | ||
| Chief Executive Officer | April 2015 - Present | |
| Director | January 2014 - Present | |
| President | January 2014 - Present | |
| Chief Operating Officer | January 2014 - April 2015 | |
| Senior Vice President | January 2013 - January 2014 | |
Stephen H. Clark, Age 59 | ||
| Executive Vice President | January 2017 - Present | |
| Senior Vice President | April 2015 - December 2016 | |
| Chief Financial Officer | November 2013 - Present | |
| Vice President | January 2013 - November 2013 | |
| Treasurer | January 2004 - April 2014 | |
Kenneth A. Lynch, Age 52 | ||
| Chief Risk Officer | January 2017 - Present | |
| Senior Vice President | April 2015 - Present | |
| Chief Accounting Officer | January 2013 - December 2016 | |
Kathleen A. McEndy, Age 64 | ||
| Chief Administrative Officer | June 2015 - Present | |
| Senior Vice President | April 2015 - Present | |
South Jersey Industries, Inc.
Part I
| Chief Human Resources Officer | March 2013 - June 2015 | |
| Vice President | March 2013 - April 2015 | |
| Principal, The McEndy Group, LLC | January 2009 - March 2013 | |
Gregory M. Nuzzo, Age 43 | ||
| President, South Jersey Energy Solutions | January 2017 - Present | |
| Chief Operating Officer, South Jersey Energy Solutions | January 2017 - Present | |
| Senior Vice President | April 2015 - Present | |
| Vice President | April 2014 - April 2015 | |
| Senior Vice President, South Jersey Energy Solutions | January 2013 - December 2016 | |
| Senior Vice President, South Jersey Resources Group | January 2013 - March 2014 | |
David Robbins, Jr., Age 55 | ||
| President, South Jersey Gas Company | January 2017 - Present | |
| Senior Vice President | April 2015 - Present | |
| Vice President | April 2014 - April 2015 | |
| Senior Vice President, South Jersey Energy Solutions | January 2013 - December 2016 | |
| Chief Operating Officer, South Jersey Energy Solutions | January 2013 - April 2014 | |
Steven R. Cocchi, Age 40 | ||
| Chief Strategy & Development Officer | January 2018 - Present | |
| Interim General Counsel | August 2017 - December 2017 | |
| Senior Vice President, Strategy and Growth | April 2017 - Present | |
| Vice President, Strategy and Growth | January 2017 - April 2017 | |
| Vice President, Rates and Regulatory Affairs | April 2015 - January 2017 | |
| Director, Rates and Revenue Requirements | October 2011 - April 2015 | |
Melissa Orsen, Age 42 | ||
| Senior Vice President & General Counsel | January 2018 - Present | |
| Chief Executive Officer, New Jersey Economic Development Authority | March 2015 - December 2017 | |
| Deputy Commissioner, New Jersey Department of Community Affairs | March 2014 - March 2015 | |
| Chief of Staff & Lieutenant Governor, Office of the New Jersey Governor | January 2011 - March 2014 | |
PART II
Item 5. Market for the Registrant’sRegistrant's Common Equity,
Related Stockholder Matters and Issuer Purchases of Equity Securities
South Jersey Industries, Inc.
Market Price of Common Stock and Related Information
| Quarter Ended | Market Price Per Share | Dividends | Quarter Ended | Market Price Per Share | Dividends | ||||||||||||||||
| Declared | Declared | ||||||||||||||||||||
| 2017 | High | Low | Per Share | 2016 | High | Low | Per Share | ||||||||||||||
| March 31 | $ | 35.97 | $ | 31.39 | $ | 0.273 | March 31 | $ | 29.14 | $ | 22.06 | $ | 0.264 | ||||||||
| June 30 | $ | 38.40 | $ | 33.93 | $ | 0.273 | June 30 | $ | 31.64 | $ | 26.29 | $ | 0.264 | ||||||||
| September 30 | $ | 36.41 | $ | 32.83 | $ | 0.273 | September 30 | $ | 32.03 | $ | 28.17 | $ | 0.264 | ||||||||
| December 31 | $ | 36.01 | $ | 30.75 | $ | 0.280 | December 31 | $ | 34.85 | $ | 27.51 | $ | 0.273 | ||||||||
These quotations are based on the list of composite transactions of the New York Stock Exchange. Our stock is traded on the New York Stock Exchange under the symbol SJI. We have declared and expect to continue to declare regular quarterly cash dividends. As of December 31, 2017, the latest available date, our records indicate there were 6,517 shareholders of record.
Stock Performance Graph
The performance graph below illustrates a five-year comparison of cumulative total returns based on an initial investment of $100 in South Jersey Industries, Inc. common stock, as compared with the S&P 500 Stock Index and the S&P Utility Index for the five-year period through December 31, 2017.
This performance chart assumes:
$100 invested on December 31, 2012 in South Jersey Industries, Inc. common stock, in the S&P 500 Stock Index and in the S&P Utility Index; and
All dividends are reinvested.
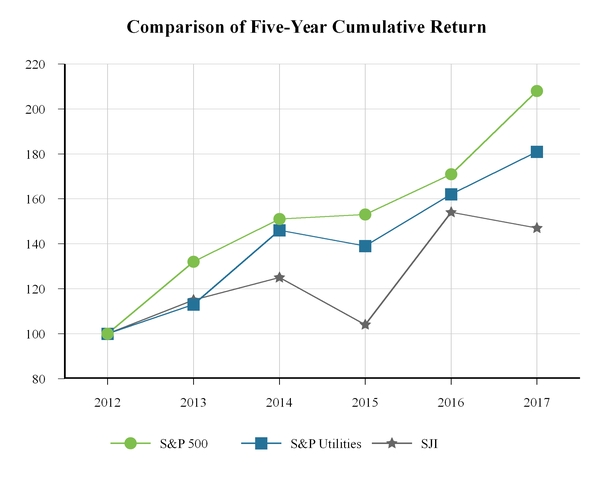
| Dec-12 | Dec-13 | Dec-14 | Dec-15 | Dec-16 | Dec-17 | |||||||||||||
| S&P 500 | $ | 100 | $ | 132 | $ | 151 | $ | 153 | $ | 171 | $ | 208 | ||||||
| S&P Utilities | $ | 100 | $ | 113 | $ | 146 | $ | 139 | $ | 162 | $ | 181 | ||||||
| SJI | $ | 100 | $ | 115 | $ | 125 | $ | 104 | $ | 154 | $ | 147 | ||||||
Information required by this item is also found in Note 6 of the consolidated financial statements included under Item 8 of this Report.
SJI has a history of paying quarterly dividends and has a stated goal of increasing its dividend annually.
In 2017, non-employee members of SJI's Board of Directors received an aggregate of 30,394 shares of restricted stock, valued at that time at $1,022,454, as part of their compensation for serving on the Board.
Issuer Purchases of Equity Securities - There were no purchases by SJI of its own common stock during the year ended December 31, 2017.
South Jersey Gas Company
All of the outstanding common stock of SJG (its only class of equity securities) is owned by its parent company, South Jersey Industries, Inc.SJI. The common stock is not traded on any stock exchange.
SJG is restricted under its First Mortgage Indenture, as supplemented, as to the amount of cash dividends or other distributions that may be paid on its common stock. As of December 31, 2015,2017, these restrictions did not affect the amount that may be distributed from SJG’s retained earnings. SJG declared and paid cash dividends totaling $40.8 and $18.2of $20.0 million in 2017 to SJI. No dividends were declared or paid on itsSJG's common stock in 2015 and 2014, respectively.2016.
Item 6. Selected Financial Data
Five-Year Summary of Selected Financial Data
(In Thousands Where Applicable)
South Jersey Industries, Inc. and Subsidiaries
Year Ended December 31,
The following financial data has been obtained from SJI’s consolidated financial statements (in thousands, except for ratios, shares data and earnings per share):
| 2017 | 2016 | 2015 | 2014 | 2013 | |||||||||||
| Operating Results: | |||||||||||||||
| Operating Revenues | $ | 1,243,068 | $ | 1,036,500 | $ | 959,568 | $ | 886,996 | $ | 731,421 | |||||
| Operating Income | $ | 4,410 | $ | 189,276 | $ | 156,894 | $ | 127,603 | $ | 69,636 | |||||
| (Loss) Income from Continuing Operations | $ | (3,404 | ) | $ | 119,061 | $ | 105,610 | $ | 97,628 | $ | 82,389 | ||||
| Discontinued Operations - Net (1) | (86 | ) | (251 | ) | (503 | ) | (582 | ) | (796 | ) | |||||
| Net (Loss) Income | $ | (3,490 | ) | $ | 118,810 | $ | 105,107 | $ | 97,046 | $ | 81,593 | ||||
| Total Assets | $ | 3,865,086 | $ | 3,730,567 | $ | 3,480,900 | $ | 3,349,425 | $ | 2,924,855 | |||||
| Capitalization: | |||||||||||||||
| Equity | $ | 1,192,409 | $ | 1,289,240 | $ | 1,037,539 | $ | 932,432 | $ | 827,000 | |||||
| Long-Term Debt | 1,122,999 | 808,005 | 1,006,394 | 859,491 | 680,400 | ||||||||||
| Total Capitalization | $ | 2,315,408 | $ | 2,097,245 | $ | 2,043,933 | $ | 1,791,923 | $ | 1,507,400 | |||||
| Ratio of Earnings to Fixed Charges (2) | 0.5 | x | 5.4 | x | 3.8x | 3.8x | 3.0x | ||||||||
| Diluted Earnings Per Common Share (Based on Average Diluted Shares Outstanding) (3): | |||||||||||||||
| Continuing Operations | $ | (0.04 | ) | $ | 1.56 | $ | 1.53 | $ | 1.47 | $ | 1.29 | ||||
| Discontinued Operations - Net (1) | — | — | (0.01 | ) | (0.01 | ) | (0.01 | ) | |||||||
| Diluted Earnings Per Common Share (3) | $ | (0.04 | ) | $ | 1.56 | $ | 1.52 | $ | 1.46 | $ | 1.28 | ||||
| (Loss) Return on Average Equity (4) | (0.3 | )% | 10.2 | % | 10.7 | % | 11.1 | % | 10.5 | % | |||||
| Share Data: | |||||||||||||||
| Number of Shareholders of Record | 6.5 | 6.7 | 6.7 | 6.9 | 6.9 | ||||||||||
| Average Common Shares (3) | 79,541 | 76,362 | 68,735 | 66,278 | 63,978 | ||||||||||
| Common Shares Outstanding at Year End (3) | 79,549 | 79,478 | 70,966 | 68,334 | 65,430 | ||||||||||
| Dividend Reinvestment Plan: | |||||||||||||||
| Number of Shareholders | 5.0 | 5.2 | 5.2 | 5.2 | 5.2 | ||||||||||
| Number of Participating Shares (3) | 3,607 | 3,627 | 4,170 | 4,082 | 4,118 | ||||||||||
| Book Value at Year End (3) | $ | 14.99 | $ | 16.22 | $ | 14.62 | $ | 13.65 | $ | 12.64 | |||||
| Dividends Declared per Common Share (3) | $ | 1.10 | $ | 1.07 | $ | 1.02 | $ | 0.96 | $ | 0.90 | |||||
| Market Price at Year End (3) | $ | 31.23 | $ | 33.69 | $ | 23.52 | $ | 29.46 | $ | 27.98 | |||||
| Market-to-Book Ratio (3) | 2.1 | x | 2.1 | x | 1.6x | 2.2x | 2.2x | ||||||||
| Consolidated Economic Earnings (5) | |||||||||||||||
| (Loss) Income from Continuing Operations | $ | (3,404 | ) | $ | 119,061 | $ | 105,610 | $ | 97,628 | $ | 82,389 | ||||
| Minus/Plus: | |||||||||||||||
| Unrealized Mark-to-Market Losses/(Gains) on Derivatives and Realized Losses/(Gains) on Inventory Injection Hedges (6) | 14,558 | (26,867 | ) | (8,355 | ) | 8,211 | 23,422 | ||||||||
| Net Loss from Affiliated Companies, Not Part of Ongoing Operations (6,7) | — | — | — | — | 1,252 | ||||||||||
| Net Loss from Affiliated Companies (6,8) | — | — | (2,540 | ) | 2,540 | — | |||||||||
| Unrealized Loss on Property, Plant and Equipment (9) | 91,299 | — | — | — | — | ||||||||||
| Net Losses from Legal Proceedings (10) | 56,075 | — | — | — | — | ||||||||||
| Acquisition Costs (11) | 19,564 | — | — | — | — | ||||||||||
| Other (6,12) | 2,227 | (165 | ) | (165 | ) | (165 | ) | (165 | ) | ||||||
| Income Taxes (13) | (70,834 | ) | 10,813 | 4,424 | (4,235 | ) | (9,804 | ) | |||||||
| Additional Tax Adjustments (14) | (11,420 | ) | — | — | — | — | |||||||||
| Economic Earnings | $ | 98,065 | $ | 102,842 | $ | 98,974 | $ | 103,979 | $ | 97,094 | |||||
| (Loss) Earnings per Share from Continuing Operations (3) | $ | (0.04 | ) | $ | 1.56 | $ | 1.53 | $ | 1.47 | $ | 1.29 | ||||
| Minus/Plus: | |||||||||||||||
| Unrealized Mark-to-Market Losses/(Gains) on Derivatives and Realized Losses/(Gains) on Inventory Injection Hedges (6) | 0.18 | (0.35 | ) | (0.12 | ) | 0.12 | 0.36 | ||||||||
| Net Loss from Affiliated Companies, Not Part of Ongoing Operations (6,7) | — | — | — | — | 0.02 | ||||||||||
| Net Loss from Affiliated Companies (6,8) | — | — | (0.04 | ) | 0.04 | — | |||||||||
| Unrealized Loss on Property, Plant and Equipment (9) | 1.14 | — | — | — | — | ||||||||||
| Net Losses from Legal Proceedings (10) | 0.70 | — | — | — | — | ||||||||||
| Acquisition Costs (11) | 0.25 | — | — | — | — | ||||||||||
| Other (6,12) | 0.03 | — | — | — | — | ||||||||||
| Income Taxes (13) | (0.89 | ) | 0.13 | 0.07 | (0.06 | ) | (0.16 | ) | |||||||
| Additional Tax Adjustments (14) | (0.14 | ) | — | — | — | — | |||||||||
| Economic Earnings per Share (3) | $ | 1.23 | $ | 1.34 | $ | 1.44 | $ | 1.57 | $ | 1.51 | |||||
| (1) | Represents discontinued business segments: sand mining and distribution operations sold in 1996 and fuel oil operations with related environmental liabilities in 1986 (See Note 3 to the consolidated financial statements). |
| (2) | Calculated as Income from Continuing Operations before Income Taxes and Interest Expense divided by Total Fixed Charges, which consists of Interest Expense and Capitalized Interest. |
| (3) | All share and per share amounts were adjusted for all periods presented for the 2-for-1 stock split, effected in the form of a stock dividend, effective on May 8, 2015. See Note 1 to the consolidated financial statements. |
| (4) | Calculated based on Income from Continuing Operations. |
| (5) | This section includes the non-generally accepted accounting principles (“non-GAAP”) financial measures of Economic Earnings and Economic Earnings per share. See "Management's Discussion and Analysis of Financial Condition and Results of Operations" in Item 7 of this Report for a discussion regarding the use of non-GAAP financial measures and a reconciliation of income from Continuing Operations and earnings per share to Economic Earnings and Economic Earnings per share, respectively. |
| (6) | Certain reclassifications have been made to the prior period numbers in these tables to conform to the current period presentation. The 2013-2015 numbers in these line items have been adjusted to be presented before income taxes. |
| (7) | Resulting from the termination of the contract at LVE Energy Partners, LLC to design, build, own and operate a district energy system and central energy center for a planned resort in Las Vegas, Nevada. |
| (8) | Resulting from a reserve for uncollectible accounts recorded by an Energenic subsidiary that owned and operated a central energy center and energy distribution system for a hotel, casino and entertainment complex in Atlantic City, New Jersey (see Note 7 to the consolidated financial statements). In 2014, this charge was excluded from Economic Earnings as the total economic impact of the proceedings had not been realized. During the second quarter 2015, the Company, through its investment in Energenic, reduced the carrying value of the investment in this project. As such, this charge is included in Economic Earnings in 2015. |
| (9) | Represents several impairment charges recorded during the year, including impairments on solar generating facilities, landfill gas-to-energy (LFGTE) long-lived assets, LFGTE assets customer relationships, and goodwill (see Note 1 to the consolidated financial statements). The economic impact of these charges will not be realized until a future period. |
| (10) | Represents net losses from three separate legal proceedings: (a) $55.6 million of pre-tax charges, including interest and legal fees, resulting from a ruling in a legal proceeding related to a pricing dispute between SJI and a gas supplier that began in October 2014; (b) a $9.8 million pre-tax charge, including legal fees, resulting from a settlement with a counterparty over a dispute related to a three-year capacity management contract; and (c) a $9.3 million pre-tax gain resulting from a favorable FERC decision, including interest, over a tariff rate dispute with a counterparty, whereby SJI contended that the counterparty was overcharging for storage demand charges over a ten-year period. See Note 15 to the consolidated financial statements. Since these net losses relate to transactions that primarily occurred in prior periods, these net losses are excluded from Economic Earnings. |
| (11) | Represents costs incurred on the agreement to acquire the assets of Elizabethtown Gas and Elkton Gas (see Note 1 to the consolidated financial statements). Since the economic impact will not be realized until future periods, this amount is excluded from Economic Earnings. |
| (12) | Included in this amount are amendments made to an existing interest rate derivative linked to unrealized losses previously recorded in Accumulated Other Comprehensive Loss (AOCL), which SJI reclassified from AOCL to Interest Charges on the consolidated statements of income as a result of the prior hedged transactions being deemed probable of not occurring. Since the economic impact will not be realized until future periods, this amount is excluded from Economic Earnings. Also included is additional depreciation expense within Economic Earnings on two solar generating facilities where an impairment charge was recorded in the past, which reduced the depreciable basis and recurring depreciation expense, and the related reduction in depreciation expense is being added back. |
| (13) | Determined using a combined average statutory tax rate of approximately 39% for 2017 and 40% for 2016 and 2015. |
| (14) | Represents one-time tax adjustments, most notably for Tax Reform, which was signed into law in December 2017. See Note 4 to the consolidated financial statements. |
The following financial data has been obtained from SJG’s audited financial statements (In(in thousands, except for Ratio Dataratios and Customers)customers):
| Year Ended December 31, | Year Ended December 31, | |||||||||||||||||||||||||||||||||||||
| 2015 | 2014 | 2013 | 2012 | 2011 | 2017 | 2016 | 2015 | 2014 | 2013 | |||||||||||||||||||||||||||||
| Operating Revenues | $ | 534,290 | $ | 501,875 | $ | 446,480 | $ | 421,874 | $ | 412,449 | $ | 517,254 | $ | 461,055 | $ | 534,290 | $ | 501,875 | $ | 446,480 | ||||||||||||||||||
| Operating Income | $ | 119,585 | $ | 113,690 | $ | 105,822 | $ | 101,762 | $ | 102,663 | 136,487 | $ | 122,455 | $ | 119,585 | $ | 113,690 | $ | 105,822 | |||||||||||||||||||
| Net Income | $ | 66,578 | $ | 66,483 | $ | 62,236 | $ | 58,241 | $ | 52,889 | $ | 72,557 | $ | 69,045 | $ | 66,578 | $ | 66,483 | $ | 62,236 | ||||||||||||||||||
| Average Shares of Common Stock Outstanding | 2,339 | 2,339 | 2,339 | 2,339 | 2,339 | 2,339 | 2,339 | 2,339 | 2,339 | 2,339 | ||||||||||||||||||||||||||||
| Ratio of Earnings to Fixed Charges (1) | 5.4x | 5.4x | 5.3x | 5.5x | 5.3x | 5.4x | 5.5x | 5.4x | 5.4x | 5.3x | ||||||||||||||||||||||||||||
| As of December 31, | As of December 31, | |||||||||||||||||||||||||||||||||||||
| 2015 | 2014 | 2013 | 2012 | 2011 | 2017 | 2016 | 2015 | 2014 | 2013 | |||||||||||||||||||||||||||||
| Property, Plant and Equipment, Net | $ | 1,770,766 | $ | 1,589,369 | $ | 1,424,775 | $ | 1,285,591 | $ | 1,158,029 | $ | 2,154,083 | $ | 1,952,912 | $ | 1,770,766 | $ | 1,589,369 | $ | 1,424,775 | ||||||||||||||||||
| Total Assets | $ | 2,288,204 | $ | 2,185,672 | $ | 1,909,126 | $ | 1,786,459 | $ | 1,615,723 | $ | 2,865,974 | $ | 2,551,923 | $ | 2,288,204 | $ | 2,185,672 | $ | 1,909,126 | ||||||||||||||||||
| Capitalization: | ||||||||||||||||||||||||||||||||||||||
| Common Equity | $ | 707,927 | $ | 680,568 | $ | 610,969 | $ | 521,395 | $ | 464,186 | $ | 921,433 | $ | 839,900 | $ | 707,927 | $ | 680,568 | $ | 610,969 | ||||||||||||||||||
| Long-Term Debt | 584,082 | 507,091 | 454,000 | 425,000 | 362,813 | 758,052 | 423,177 | 584,082 | 507,091 | 454,000 | ||||||||||||||||||||||||||||
| Total Capitalization | $ | 1,292,009 | $ | 1,187,659 | $ | 1,064,969 | $ | 946,395 | $ | 826,999 | $ | 1,679,485 | $ | 1,263,077 | $ | 1,292,009 | $ | 1,187,659 | $ | 1,064,969 | ||||||||||||||||||
| Total Customers | 373,100 | 366,854 | 362,256 | 357,306 | 351,304 | 383,633 | 377,625 | 373,100 | 366,854 | 362,256 | ||||||||||||||||||||||||||||
(1) The ratio of earnings to fixed charges represents, on a pre-tax basis, the number of times earnings cover fixed charges. Earnings consist of net income, to which has been added fixed charges and taxes based on income of the Company.SJG. Fixed charges consist of interest charges.charges and capitalized interest.
Item 7. Management’sManagement's Discussion and Analysis of Financial Condition and
Management's Discussion is divided into the following two major sections:
SJI - WeThis section describes the financial condition and results of operations of South Jersey Industries, Inc. and its subsidiaries on a consolidated basis. It includes discussions of our regulated operations, including South Jersey Gas Company (SJG), and our non-regulated operations.
SJG - This section describes the financial condition and results of operations of SJG, a subsidiary of SJI, which comprises the gas utility operations segment.
Both sections of Management's Discussion - SJI and SJG - are designed to provide an understanding of each company's respective operations and financial performance and should be read in conjunction with each other as well as in conjunction with the respective company's financial statements and the combined Notes to Consolidated Financial Statements in this Annual Report on Form 10-K.
Unless otherwise noted, earnings per share amounts are presented on a diluted basis, and are based on weighted average common and common equivalent shares outstanding.
OVERVIEW - South Jersey Industries, Inc. (SJI or the Company) is an energy services holding company that provides a variety of products and services through the following wholly-owned subsidiaries:
South Jersey Gas Company (SJG)
SJG, a New Jersey corporation, is an operating public utility company engaged in the purchase, transmission and sale of natural gas for residential, commercial and industrial use. WeSJG also sellsells natural gas and pipeline transportation capacity (off-system sales) on a wholesale basis to various customers on the interstate pipeline system and transporttransports natural gas purchased directly from producers or suppliers to their customers. SJG contributed approximately $72.6 million to SJI's net income on a consolidated basis in 2017.
As of December 31, 2015, we2017, SJG served 373,100383,633 residential, commercial and industrial customers in southern New Jersey, compared with 366,854377,625 customers at December 31, 2014.2016. No material part of ourSJG's business is dependent upon a single customer or a few customers. Gas sales, transportation and capacity release for 20152017 amounted to 136.8151.3 MMdts, (million dekatherms), of which 58.554.3 MMdts were firm sales and transportation, 1.31.1 MMdts were interruptible sales and transportation and 77.095.9 MMdts were off-system sales and capacity release. The breakdown of firm sales and transportation includes 45.0%43.7% residential, 21.8%21.6% commercial, 20.7%20.9% industrial, and 12.5%13.8% cogeneration and electric generation. At year-end 2015, weAs of December 31, 2017, SJG served 348,093 358,026 residential customers, 24,565 25,184 commercial customers and 442 423 industrial customers. This includes 20152017 net additions of 5,9385,599 residential customers and 312 409 commercial and industrial customers.
Supplies of natural gas available to usSJG that are in excess of the quantity required by those customers who use gas as their sole source of fuel (firm customers) make possible the sale and transportation of gas on an interruptible basis to commercial and industrial customers whose equipment is capable of using natural gas or other fuels, such as fuel oil and propane. The term “interruptible” is used in the sense that deliveries of natural gas may be terminated by usSJG at any time if this action is necessary to meet the needs of higher priority customers as described in ourSJG's tariffs. In 2015,2017, usage by interruptible customers, excluding off-system customers, amounted to 1.31.1 MMdts, or approximately 1.0%1% of the total throughput.
South Jersey Energy Solutions, LLC
SJI groups its nonutility operations into two categories: Energy Group and Energy Services. Energy Group includes wholesale energy, retail gas and other, and retail electric operations. Energy Services includes on-site energy production and appliance service operations. SJI established South Jersey Energy Solutions, LLC (SJES) as a direct subsidiary for the purpose of serving as a holding company for all of SJI's non-utility businesses. The following businesses are wholly-owned subsidiaries of SJES:
South Jersey Energy Company (SJE)
SJE provides services for the acquisition and transportation of natural gas and electricity for retail end users and markets total energy management services. SJE markets natural gas and electricity to commercial and industrial customers. SJE became active in the residential market for electricity beginning in March 2016 as a result of several municipal aggregation bids won in the second half of 2015. Most customers served by SJE are located within New Jersey, northwestern Pennsylvania and New England. In 2017, SJE contributed approximately $1.3 million to SJI's net income on a consolidated basis.
South Jersey Resources Group, LLC (SJRG)
SJRG markets natural gas storage, commodity and transportation assets along with fuel management services on a wholesale basis. Customers include energy marketers, electric and gas utilities, power plants and natural gas producers. SJRG's marketing activities occur mainly in the mid-Atlantic, Appalachian and southern regions of the country.
SJRG also conducts price risk management activities by entering into a variety of physical and financial transactions including forward contracts, swap agreements, option contracts and futures contracts. In 2017, SJRG had a net loss of approximately $23.5 million which reduced SJI's net income on a consolidated basis by such amount.
South Jersey Exploration, LLC (SJEX)
SJEX owns oil, gas and mineral rights in the Marcellus Shale region of Pennsylvania. SJEX is a wholly-owned subsidiary of SJES and is also considered part of SJI's wholesale energy operations. In 2017, SJEX contributed approximately $0.2 million to SJI's net income on a consolidated basis.
Marina Energy LLC (Marina)
Marina develops and operates on-site energy-related projects. Marina's largest wholly-owned operating project provides cooling, heating and emergency power to the Borgata Hotel Casino & Spa in Atlantic City, NJ. Marina also owns numerous solar generation projects.
Other entities that are wholly owned by Marina are ACB Energy Partners, LLC (ACB), AC Landfill Energy, LLC (ACLE), BC Landfill Energy, LLC (BCLE), SC Landfill Energy, LLC (SCLE), SX Landfill Energy, LLC (SXLE), MCS Energy Partners, LLC (MCS), NBS Energy Partners, LLC (NBS) & SBS Energy Partners, LLC (SBS).
ACB owns and operates a natural gas fueled combined heating, cooling and power facility located in Atlantic City, New Jersey.
ACLE, BCLE, SCLE and SXLE own and operate landfill gas-to-energy production facilities in Atlantic, Burlington, Salem and Sussex Counties in New Jersey.
MCS, NBS and SBS own and operate solar-generation sites located in New Jersey.
In 2017, Marina had a net loss of approximately $60.5 million which reduced SJI's net income on a consolidated basis by such amount.
South Jersey Energy Service Plus, LLC (SJESP)
SJESP serviced residential and small commercial HVAC systems, installed small commercial HVAC systems, provided plumbing services and serviced appliances under warranty via a subcontractor arrangement as well as on a time and materials basis. On September 1, 2017, SJESP sold certain assets of its residential and small commercial HVAC and plumbing business to a third party. SJESP will receive commissions paid on service contracts from the third party on a go forward basis. This transaction did not have a material impact on the consolidated financial statements. In 2017, SJESP contributed approximately $0.2 million to SJI's net income on a consolidated basis.
SJI Midstream, LLC (Midstream)
Midstream owns a 20% equity investment in PennEast Pipeline Company, LLC, through which SJI, along with other investors, expect to construct an approximately 118-mile natural gas pipeline that will extend from Northeastern Pennsylvania into New Jersey. Construction is expected to begin in 2018 and is estimated to be completed in the second half of 2019. In 2017, Midstream contributed approximately $4.6 million to SJI's net income on a consolidated basis.
Other
In October 2017, SJI announced that it had entered into agreements to acquire the assets of Elizabethtown Gas and Elkton Gas from Pivotal Utility Holdings, Inc., a subsidiary of Southern Company Gas. SJI is acquiring the assets of both companies for total consideration of $1.7 billion. The transaction is expected to close in mid-2018, and is subject to approvals by the New Jersey Board of Public Utilities (BPU) and the Maryland Public Service Commission (PSC), with limited approvals also required from the Federal Energy Regulatory Commission (FERC) and the Federal Communications Commission (FCC), as well as certain anti-trust filings and approvals. Costs incurred through December 31, 2017 were $12.0 million, after-tax, which reduced SJI's net income on a consolidated basis by such amount.
Primary Factors Affecting SJI's Business
SJI's stated long-term goals are to: 1) provide safe, reliable natural gas service atGrow Economic Earnings to $160 million by 2020; 2) Improve the lowest cost reasonably possible; 2) promote natural gas asquality of earnings; 3) Maintain the fuelstrength of choice for residential, commercialthe balance sheet; and industrial customers;4) Maintain a low-to-moderate risk profile. Management established those goals in conjunction with SJI's Board of Directors based upon a number of different internal and 3) aid our customers in becoming more energy efficient.external factors that characterize and influence SJI's current and expected future activities.
The following is a summary of the primary factors we expect to have the greatest impact on ourSJI's performance and our ability to achieve ourthe long-term goals going forward:
Business Model - We are the primaryIn developing SJI's current business model, our focus has been on our core utility and natural extensions of that business. That focus enables us to concentrate on business activities that match our parent, SJI, andcore competencies. Going forward we expect to continue to account for the majority of SJI’s net income by maximizing the growth potential of our service territory.pursue business opportunities that fit this model.
Customer Growth - Southern New Jersey, our primary area of operations, has not been immune to the issues impacting the new housing market nationally. Residential new construction especiallyactivity remains steady, supported by growth in higher density and multi-family units, continues to improve slowly. Net customersunits. Customers for SJG grew 1.7%1.6% for 20152017 as we continue ourSJG continues its focus on customer conversions. In 2015,2017, the 5,8026,108 consumers converting their homes and businesses from other heating fuels, such as electric, propane or oil, represented approximately 66%71% of the total new customer acquisitions for the year. In comparison, conversions over the past five years averaged 5,1955,480 annually. Customers in ourSJG's service territory typically base their decisions to convert on comparisons of fuel costs, environmental considerations and efficiencies. As such,While oil and propane prices have become more competitive with natural gas in the past two years, affecting the number of conversions, SJG began a comprehensive partnership with the State’s Office of Clean Energy to educate consumers on energy efficiency and to promote the rebates and incentives available to natural gas users.
Regulatory Environment - We areSJG is primarily regulated by the New Jersey Board of Public Utilities (BPU). The BPU setsapproves the rates that we charge ourSJG charges its rate-regulated customers for services provided and establishes the terms of service under which we operate. We expect the BPU to continue to setSJG operates. The rates and establishestablished terms of service that willare designed to enable usSJG to obtain a fair and reasonable return on capital invested. TheSJG’s BPU approved a Conservation Incentive Program (CIP), effective October 1, 2006, discussed in greater detail under “Results of Operations,” that protects ourSJG's net income from reductionssevere fluctuations in gas used by our residential, commercial and small industrial customers. In addition, in February 2013, the BPU issued an Order approving the Accelerated Infrastructure Replacement Program (AIRP), a $141.2 million program to replace cast iron and unprotected bare steel mains and services over a four-yearfour -year period. As of December 1, 2016, all AIRP investments are reflected in base rates. Additionally, the BPU issued an Order approving an extension of the AIRP for a 5-year period (“AIRP II”), commencing October 1, 2016, with annualauthorized investments of approximately $35.3 million. The Companyup to $302.5 million to continue replacing cast iron and unprotected bare steel mains and associated services. SJG earns a return on AIRP II investments untilonce they are placed in service and thereafter, once they are included in rate base, in future base rate proceedings.through annual filings. The BPU also issued an Order in August 2014 approving the Storm Hardening and Reliability Program (SHARP), a $103.5 million program to replace low-pressure distribution mains and services with high-pressure mains and services on the barrier islandsin coastal areas that are susceptible to flooding during major storms over a three-year period, withperiod. In September 2017, The BPU issued an Order approving an increase in annual investmentsrevenues from base rates of approximately $34.5 million. The Company earns a return on$3.6 million to reflect the roll-in of $33.3 million SHARP investments until they are included in rate basemade from July 2016 through June 2017, effective October 1, 2017. In November 2017, SJG filed a petition with the BPU to continue its storm hardening program, proposing a three-year effort and total investment of $110.25 million. SJG proposed to recover the SHARP II through annual base rate adjustments.adjustments, with no impact to customers billing until October 2019. The related petition is currently pending BPU approval.
Effective November 1, 2017, the BPU granted a base rate increase of $39.5 million (see Note 10 to the consolidated financial statements).
Weather Conditions and Customer Usage Patterns - Usage patterns can be affected by a number of factors, such as wind, precipitation, temperature extremes and customer conservation. OurSJG's earnings are largely protected from fluctuations in temperatures by the CIP. The CIP has a stabilizing effect on utility earnings as we adjustSJG adjusts revenues when actual usage per customer experienced during an annual period varies from an established baseline usage per customer. Our nonutility retail marketing business is directly affected by weather conditions, as it does not have regulatory mechanisms that address weather volatility. The impact of different weather conditions on the earnings of our nonutility businesses is dependent on a range of different factors. Consequently, weather may impact the earnings of SJI's various subsidiaries in different, or even opposite, ways. Further, the profitability of individual subsidiaries may vary from year-to-year despite experiencing substantially similar weather conditions.
Changes in Natural Gas, Electricity and Solar Renewable Energy Credit (SREC) Prices - GasThe utility's gas costs are passed on directly to customers without any profit margin added. Foradded by SJG. The price the vast majority of ourutility charges its periodic customers the price for natural gas is set annually, with a regulatory mechanism in place to make limited adjustments to that price during the course of a year. In the event that gas cost increases would justify customer price increases greater than those permitted under the regulatory mechanism, weSJG can petition the BPU for an incremental rate increase. High prices can make it more difficult for ourSJG's customers to pay their bills and may result in elevated levels of bad-debt expense. Among our nonutility activities, the business most likely to be impacted by changes in natural gas prices is our wholesale gas marketing business. Wholesale gas marketing typically benefits from volatility in gas prices during different points in time. The actual price of the commodity does not typically have an impact on the performance of this business line. Our ability to add and retain customers at our retail marketing business is affected by the relationship between the price that the utility charges customers for gas or electric and the cost available in the market at specific points in time. However, retail marketing accounts for a very small portion of SJI's overall activities. Marina Energy’s SREC portfolio typically benefits
from increases in individual SREC spot markets for any current or future energy year. Positive spot market movement affords Marina a potential opportunity to sell open production and improve upon or solidify future SREC revenue streams for particular SREC products.
Fuel Supply Management - SJRG has acquired pipeline transportation capacity that allows SJRG to match end users, many of which are merchant generators, with producers looking to find a long-term solution for their supply. We currently have eleven fuel supply management transactions under contract and expect to continue expanding this business.
Midstream Investments - Design, engineering and environmental assessments continue moving forward on a natural gas pipeline in Pennsylvania and New Jersey. In September 2015, Midstream, along with other partners in the project, submitted an application to FERC for a permit to proceed with construction. In January 2018, the Certificate of Public Convenience and Necessity was approved by the FERC. This authorizes PennEast, of which Midstream has a 20% equity interest, to construct, install, own, operate and maintain this pipeline. In February 2018, the New Jersey Department of Environmental Protection filed a motion to the FERC for reconsideration of this approval. We expect to make additional investments in similar midstream projects.
Changes in Interest Rates- We have- SJI has operated in a relatively low interest rate environment over the past several years. Rising interest rates would raise the expense associated with existing variable-rate debt and all issuances of new debt. We have sought to mitigate the impact of a potential rising rate environment by directly issuing fixed-rate debt, or by entering into derivative transactions to hedge against rising interest rates.
Labor and Benefit Costs - Labor and benefit costs have a significant impact on ourSJI's profitability. Benefit costs, especially those related to pension and health care, have risen in recent years. We seek to manage these costs by revising health care plans offered to existing employees, capping postretirement health care benefits, and changing health care and pension packages offered to new hires. We expect savings from these changes to gradually increase as new hires replace retiring employees. SJI's workforce totaled approximately 760 employees at the end of 2017, approximately 530 of which were SJG employees. Of that total, approximately 300 of both SJI and SJG employees are unionized (all of SJI's unionized employees are with SJG).
Balance Sheet Strength - OurSJI's and SJG's goal is to maintain a strong balance sheet with ansheet. SJI's average annual equity-to-capitalization ratio was approximately 47% and 48% as calculated for the four quarters of 46% to 50%. Our2017 and 2016, respectively. SJG's average equity-to-capitalization ratio inclusivewas approximately 54% and 52% as calculated for the four quarters of short-term debt, was 49%2017 and 51% at the end of 2015 and 2014,2016, respectively. A strong balance sheet assists us in maintaining the financial flexibility necessary to take advantage of growth opportunities and to address volatile economic and commodity markets while maintaining a low-risklow-to-moderate risk platform.
Regulatory Accounting- We maintain ourSJI's largest subsidiary, SJG, maintains its accounts according to the Uniform System of Accounts as prescribed by the BPU. As a result of the ratemaking process, we areSJG is required to follow Financial Accounting Standards Board (FASB) ASC Topic 980 –- “Regulated Operations.” We areSJG is required under Topic 980 to recognize the impact of regulatory decisions on ourits financial statements. We areSJG is required under ourits Basic Gas Supply Service (BGSS) clause to forecast ourits natural gas costs and customer consumption in setting ourits rates. Subject to BPU approval, we areSJG is able to recover or return the difference between gas cost recoveries and the actual costs of gas through a BGSS charge to customers. We recordSJG records any over/under recoveries as a regulatory asset or liability on the consolidated balance sheets and reflect itreflects them in the BGSS charge to customers in subsequent years. WeSJG also enterenters into derivatives that are used to hedge natural gas purchases. The offset ofto the resulting derivative assets or liabilities is recorded as a regulatory asset or liability on the consolidated balance sheets. See additional detailed discussions on Rates and Regulatory Actions in Note 310 to the consolidated financial statements.
Derivatives - We recognizeSJI recognizes assets or liabilities for contracts that qualify as derivatives that are entered into by its subsidiaries when such contracts are executed. We record contracts at their fair value in accordance with FASB ASC Topic 815 –- “Derivatives and Hedging.” We record changes in the fair value of the effective portion of derivatives qualifying as cash flow hedges, net of tax, in Accumulated Other Comprehensive Loss (AOCL) and recognize such changes in the income statement when the hedged item affects earnings. Changes in the fair value of derivatives not designated as hedges are recorded in earnings in the current period. Currently we do not designatehave any energy-related derivative instruments designated as cash flow hedges. Hedge accounting has been discontinued for the remaining interest rate derivatives. As a result, unrealized gains and losses on these derivatives, that
were previously recorded in AOCL on the consolidated balance sheets, are being recorded into earnings over the remaining life of the derivative.
Certain derivatives that result in the physical delivery of the commodity may meet the criteria to be accounted for as normal purchases and normal sales, if so designated, in which case the contract is not marked-to-market, but rather is accounted for when the commodity is delivered. Due to the application of regulatory accounting principles under Generally Accepted Accounting Principles (United States)generally accepted in the United States of America (GAAP), derivatives related to SJG's gas purchases that are marked-to-market are recorded through ourthe BGSS. WeSJG periodically enterenters into financial derivatives to hedge against forward price risk. These derivatives are recorded at fair value with an offset to regulatory assets and liabilities through ourSJG's BGSS, subject to BPU approval (See Notes 310 and 411 to the consolidated financial statements). We adjust the fair value of the contracts each reporting period for changes in the market.
As discussed in Notes 1316 and 1417 of the consolidated financial statements, energy-related derivative instruments are traded in both exchange-based and non-exchange-based markets. Exchange-based contracts are valued using unadjusted quoted market sources in active markets and are categorized in Level 1 in the fair value hierarchy established by FASB ASC Topic 820 –- “Fair Value Measurements and Disclosures.” Certain non-exchange-based contracts are valued using indicative non-binding price quotations available through brokers or from over-the-counter, on-line exchanges and are categorized in Level 2. These price quotations reflect the average of the bid-ask mid-point prices and are obtained from sources that management believes provide the most liquid market. Management reviews and corroborates the price quotations with at least one additional source to ensure the prices are observable market information, which includes consideration of actual transaction volumes, market delivery points, bid-ask spreads and contract duration. Derivative instruments that are used to limit our exposure to changes in interest rates on variable-rate, long-term debt are valued using quoted prices on commonly quoted intervals, which are interpolated for periods different than the quoted intervals, as inputs to a market valuation model. Market inputs can generally be verified and model selection does not involve significant management judgment, as a result, these instruments are categorized in Level 2 in the fair value hierarchy. For non-exchange-based derivatives that trade in less liquid markets with limited pricing information, model inputs generally would include both observable and unobservable inputs. In instances where observable data is unavailable, management considers the assumptions that market participants would use in valuing the asset or liability. This includes assumptions about market risks such as liquidity, volatility and contract duration. Such instruments are categorized in Level 3 in the fair value hierarchy as the model inputs generally are not observable. Counterparty credit risk and the credit risk of SJG, isSJI, are incorporated and considered in the valuation of all derivative instruments as appropriate. The effect of counterparty credit risk and the credit risk of SJGSJI on the derivative valuations is not significant.
Significant Unobservable Inputs - Management uses the discounted cash flow model to value Level 3 physical and financial forward contracts, which calculates mark-to-market valuations based on forward market prices, original transaction prices, volumes, risk-free rate of return and credit spreads. Inputs to the valuation model are reviewed and revised as needed, based on historical information, updated market data, market liquidity and relationships, and changes in third party pricing sources. The validity of the mark-to-market valuations and changes in these values from period to period are examined and qualified against historical expectations by the risk management function. If any discrepancies are identified during this process, the mark-to-market valuations or the market pricing information is evaluated further and adjusted, if necessary.
Level 3 valuation methods for natural gas derivative contracts include utilizing another location in close proximity adjusted for certain pipeline charges to derive a basis value. The significant unobservable inputs used in the fair value measurement of certain natural gas contracts consist of forward prices developed based on industry-standard methodologies. Significant increases (decreases) in these forward prices for purchases of natural gas would result in a directionally similar impact to the fair value measurement and for sales of natural gas would result in a directionally opposite impact to the fair value measurement. Level 3 valuation methods for electric represent the value of the contract marked to the forward wholesale curve, as provided by daily exchange quotes for delivered electricity. The significant unobservable inputs used in the fair value measurement of electric contracts consist of fixed contracted electrical load profiles; therefore, no change in unobservable inputs would occur. Unobservable inputs are updated daily using industry-standard techniques. Management reviews and corroborates the price quotations to ensure the prices are observable which includes consideration of actual transaction volumes, market delivery points, bid-ask spreads and contract duration.
Environmental Remediation Costs - We estimate a range of future costs based on projected investigation and work plans using existing technologies. In preparing consolidated financial statements, we recordSJI records liabilities for future costs using the lower end of the range because a single reliable estimation point is not feasible due to the amount of uncertainty involved in the nature of projected remediation efforts and the long period over which remediation efforts will continue. We update estimates each year to take into account past efforts, changes in work plans, remediation technologies, government regulations and site specific requirements (See(see Note 1215 to the consolidated financial statements).
Pension and Other Postretirement Benefit Costs - The costs of providing pension and other postretirement employee benefits are impacted by actual plan experience as well as assumptions of future experience. Employee demographics, plan contributions, investment performance, and assumptions concerning mortality, return on plan assets, discount rates and health care cost trends all have a significant impact on determining our projected benefit obligations. We evaluate these assumptions annually and adjust them accordingly. These adjustments could result in significant changes to the net periodic benefit costs of providing such benefits and the related liabilities recognized by us.SJI.
During 2013, discount rates increased and equity markets continued to outperform management's expectations. As2016, a result, the Company experienced a $4.8 million decrease in the costcombination of providing such benefits in 2014. A subsequent decrease in discount rates, coupled with lower than expected returns on plan assets and the impact of new mortality tables released by the Society of Actuaries in late 2014, resulted in a $5.6 million increase in the cost of providing such benefits in 2015. Management took measures to mitigate this increase by contributing an aggregate of $14.5 million to its pension and postretirement healthcare plans in January 2015. These contributions provided for a $1.1 million incremental earnings credit against expense, resulting in a net increase in retirement benefit costs of $4.5 million in 2015.
During 2017, the Company changed the structureCompany's expected cost of itsproviding pension and other postretirement healthcare plan for retirees to provide them with a fixed contribution to a health reimbursement account and allowing them to obtain coverage from healthcare exchanges, rather than utilizing the Company-provided healthcare plan. These positive factors are partially offset by lower than expected returns on plan assetsin 2018 increased primarily due to poor performance inupdates to census data and decreasing discount rates resulting from lower market interest rates at the equity markets in 2015.end of 2017. As a result, of these factors, the Company is estimating a $0.7$1.8 million net decreaseincrease in the cost of providing these benefits in 2016.
2018. Additional information regarding investment returns and assumptions can be found in Pension and Other Postretirement Benefits in Note 1112 to the consolidated financial statements.
Revenue Recognition - Gas and electricity revenues are recognized in the period the commodity is delivered to customers. WeSJG, SJRG and SJE bill customers monthly at rates approved by the BPU.monthly. A majority of ourSJG and SJE customers have their meters read on a cycle basis throughout the month. As a result, recognized revenues include estimates. For SJG and SJE retail customers that are not billed at the end of each month, we record an estimate to recognize unbilled revenues for gasgas/electricity delivered from the date of the last meter reading to the end of the month. OurSJG's and SJE's unbilled revenue for natural gas is estimated each month based on natural gas delivered monthly deliveries into the system; unaccounted for natural gas based on historical results; customer-specific use factors, when available; actual temperatures during the period; and applicable customer rates. SJE's unbilled revenue for retail electricity is based on customer-specific use factors and applicable customer rates. We bill SJG customers at rates approved by the BPU. SJE and SJRG customers are billed at rates negotiated between the parties.
SJRG presents revenues and expenses related to its energy trading activities on a net basis in Operating Revenues - Nonutility in the statements of consolidated income consistent with GAAP. This net presentation has no effect on operating income or net income.
SJESP will receive commissions paid on service contracts from the third party on a go forward basis. These commissions are recognized as revenue as they are earned.
Marina recognizes revenue on a monthly basis as services are provided and for on-site energy production that is delivered to its customers.
The BPU allows usSJG to recover gas costs in rates through the BGSS price structure. We deferSJG defers over/under recoveries of gas costs and includeincludes them in subsequent adjustments to the BGSS rate. These adjustments result in over/under recoveries of gas costs being included in rates during future periods. As a result of these deferrals, utility revenue recognition does not directly translate to profitability. While we realizeSJG realizes profits on gas sales during the month of providing the utility service, significant shifts in revenue recognition may result from the various recovery clauses approved by the BPU. This revenue recognition process does not shift earnings between periods, as these clauses only provide for cost recovery on a dollar-for-dollar basis (See(see Notes 310 and 411 to the consolidated financial statements).
NEW ACCOUNTING PRONOUNCEMENTS - See detailed discussions concerning New Accounting Pronouncements and their impact on SJI in Note 1 to the consolidated financial statements.
The CIP is a BPU-approved program that is designed to eliminate the link between ourSJG profits and the quantity of natural gas we sell,SJG sells, and to foster conservation efforts. With the CIP, ourSJG's profits are tied to the number of customers we serveserved and how efficiently we serveSJG serves them, thus allowing usSJG to focus on encouraging conservation and energy efficiency among ourits customers without negatively impacting our net income. The CIP tracking mechanism adjusts earnings based on weather, and also adjusts ourSJG's earnings when actual usage per customer experienced during an annual period varies from an established baseline usage per customer.
Utility earnings are recognized during current periods based upon the application of the CIP. The cash impact of variations in customer usage will result in cash being collected from, or returned to, customers during the subsequent CIP year, which runs from October 1 to September 30.
The effects of the CIP on ourSJG's net income for the last three years and the associated weather comparisons were as follows ($’s's in millions):
| 2015 | 2014 | 2013 | 2017 | 2016 | 2015 | |||||||||||||||
| Net Income Impact: | ||||||||||||||||||||
| CIP – Weather Related | 0.9 | (4.7 | ) | (0.3 | ) | |||||||||||||||
| CIP – Usage Related | (1.9 | ) | 2.0 | 3.4 | ||||||||||||||||
| CIP - Weather Related | $ | 8.7 | $ | 5.9 | $ | 0.9 | ||||||||||||||
| CIP - Usage Related | 3.3 | 4.0 | (1.9 | ) | ||||||||||||||||
| Total Net Income Impact | $ | (1.0 | ) | $ | (2.7 | ) | $ | 3.1 | $ | 12.0 | $ | 9.9 | $ | (1.0 | ) | |||||
| Weather Compared to 20-Year Average | 3.1% warmer | 7.5% colder | 0.6% colder | 11.5% warmer | 8.1% warmer | 3.1% warmer | ||||||||||||||
| Weather Compared to Prior Year | 9.6% warmer | 4.6% colder | 20.6% colder | 0.4% warmer | 2.5% warmer | 9.6% warmer | ||||||||||||||
As part of the CIP, we areSJG is required to implement additional conservation programs, including customized customer communication and outreach efforts, targeted upgrade furnace efficiency packages, financing offers, and an outreach program to speak to local and state institutional constituents. We areSJG is also required to reduce gas supply and storage assets and their associated fees. Note that changes in fees associated with supply and storage assets have no effect on ourSJG's net income as these costs are passed through directly to customers on a dollar-for-dollar basis.
Earnings accrued and payments received under the CIP are limited to a level that will not cause ourSJG's return on equity to exceed 9.75%9.6% (excluding earnings from off-system gas sales and certain other tariff clauses) and CIP recoveries are limited by the annualized savings attained from reducing gas supply and storage assets.
See additional detailed discussions on Rates and Regulatory Actions in Note 310 to the consolidated financial statements.
COMPETITION - Our SJG's franchises are non-exclusive. Currently, no other utility provides retail gas distribution services within ourSJG's territory. We doSJG does not expect any other utilities to do so in the foreseeable future because of the extensive investment required for utility plant and related costs. We competeSJG competes with oil, propane and electricity suppliers for residential, commercial and industrial users, with alternative fuel source providers (wind, solar and fuel cells) based upon price, convenience and environmental factors, and with other marketers/brokers in the selling of wholesale natural gas services. The market for natural gas commodity sales is subject to competition due to deregulation. We enhanced ourSJG's competitive position was enhanced while maintaining margins by using an unbundled tariff. This tariff allows full cost-of-service recovery when transporting gas for ourSJG's customers. Under this tariff, we profitSJG profits from transporting, rather than selling, the commodity. OurSJG's residential, commercial and industrial customers can choose their supplier, while we recoverSJG recovers the cost of service through transportation service (see(See Customer Choice Legislation below).
SJRG competes in the wholesale natural gas market against a wide array of competitors on a cost competitive, term of service, and reliability basis. SJRG has been a reliable energy provider in this arena for more than 20 years.
Marina competes with other companies that develop and operate similar types of on-site energy production. Marina also faces competition from customers' preferences for alternative technologies for energy production, as well as those customers that address their energy needs internally.
SJE competes with utilities and other third-party marketers to sell the unregulated natural gas and electricity commodity to customers. Marketers compete largely on price, which is driven by the commodity market. While the utilities are typically indifferent as to where customers get their gas or electricity, the price they set for the commodity they sell creates competition for SJE. Based on its market share, SJE is one of the largest marketers of natural gas in southern New Jersey as of December 31, 2017. In addition, similar to SJG, SJE faces competition from other energy products.
RESULTS OF OPERATIONS:
SJI operates in several different reportable operating segments. These segments are as follows:
Gas utility operations (SJG) consist primarily of natural gas distribution to residential, commercial and 2013, respectively.industrial customers. The results of SJG only are included in this operating segment.
Wholesale energy operations include the activities of SJRG and SJEX.
SJE is involved in both retail gas and retail electric activities.
| ◦ | Retail gas and other operations include natural gas acquisition and transportation service business lines. |
| ◦ | Retail electric operations consist of electricity acquisition and transportation to commercial, industrial and residential customers. |
On-site energy production consists of Marina's thermal energy facility and other energy-related projects. Also included in this segment are the activities of ACB, ACLE, BCLE, SCLE, SXLE, MCS, NBS and SBS.
Appliance service operations includes SJESP, which serviced residential and small commercial HVAC systems, installed small commercial HVAC systems, provided plumbing services and serviced appliances under warranty via a subcontractor arrangement as well as on a time and materials basis. On September 1, 2017, SJESP sold certain assets of its residential and small commercial HVAC and plumbing business to a third party. SJESP will receive commissions paid on service contracts from the third party on a go forward basis. This transaction did not have a material impact on the consolidated financial statements.
Midstream was formed to invest in infrastructure and other midstream projects, including a current project to build a natural gas pipeline in Pennsylvania and New Jersey.
Costs incurred related to the agreement to acquire Elizabethtown Gas and Elkton Gas are recorded in the Corporate & Services segment.
SJI groups its nonutility operations into two categories: Energy Group and Energy Services. Energy Group includes wholesale energy, retail gas and other, and retail electric operations. Energy Services includes on-site energy production and appliance service operations.
SJI's net income for 2017 decreased $122.3 million, or 102.9%, to a net loss of $3.5 million compared to 2016 primarily as a result of the following:
The net income contribution from on-site energy production at Marina decreased $76.5 million to a net loss of $60.5 million, primarily due to the following:
| ◦ | $56.1 million decrease due to several impairment charges recorded during the year, including impairments on solar generating facilities, landfill gas-to-energy (LFGTE) long-lived assets, LFGTE assets customer relationships, and goodwill (see Note 1 to the consolidated financial statements). |
| ◦ | $9.1 million of investment tax credits on renewable energy facilities recorded in 2016, compared with none recorded in 2017, which is consistent with SJI's previously announced strategy of substantially reducing solar development. |
| ◦ | $4.5 million decrease related to gains on two settlements recorded at Marina in 2016 that did not recur in 2017 (see Note 7 to the consolidated financial statements). |
| ◦ | $1.7 million decrease related to the change in unrealized gains and losses on interest rate derivative contracts (see Note 16 to the consolidated financial statements). |
| ◦ | The remaining decrease is primarily due to an overall increase in operating and interest expenses. |
The net income contribution from the wholesale energy operations at SJRG decreased $49.5 million to a net loss of $23.5 million, primarily due to the following:
| ◦ | $32.6 million decrease resulting from an unfavorable court ruling related to a pricing dispute between SJRG and a supplier, including interest (see Note 15 to the consolidated financial statements) |
| ◦ | $20.6 million decrease resulting from the change in unrealized gains and losses on derivatives used by the wholesale energy operations to mitigate natural gas commodity price risk, as discussed under "Operating Revenues - Energy Group" below. |
| ◦ | $5.8 million decrease resulting from a settlement of a legal dispute related to a three-year capacity management contract with a counterparty (see Note 15 to the consolidated financial statements) |
| ◦ | $1.5 million decrease due to legal fees recorded on the two legal disputes noted above |
| ◦ | $5.7 million increase resulting from a favorable FERC decision over a tariff rate dispute with a counterparty, including interest, whereby SJI contended that the counterparty was overcharging for storage demand charges over a ten year period (see Note 15 to the consolidated financial statements). |
| ◦ | $5.3 million increase due to higher margins earned on daily energy trading activities, colder weather conditions experienced in the fourth quarter of 2017 compared to the prior year, additional margins earned during 2017 on gas supply contracts with three electric generation facilities, and an overall decrease in operating expenses (excluding the legal fees discussed above). |
SJI recorded $12.0 million of expenses related to costs incurred on the agreement to acquire the assets of Elizabethtown Gas and Elkton Gas (see Note 1 to the consolidated financial statements). These include finders fees, consulting and legal charges, among others. These costs are recorded in the Corporate & Services segment.
The net income contribution from the retail gas and electric operations at SJE decreased $6.2 million to $1.3 million primarily due to the change in unrealized gains and losses on forward financial contracts used to mitigate price risk on retail gas as discussed under "Operating Revenues – Energy Group" below, along with the expiration of a large electric sales contract with a group of school boards.
SJI recorded $13.5 million of tax gains related to the enactment of Tax Reform. See Note 4 to the consolidated financial statements.
The net income contribution from gas utility operations at SJG increased $3.5 million to $72.6 million primarily due to increased margin resulting from investments included in the rate case, AIRP II and SHARP rolling into base rates during the fourth quarter of 2017, along with customer growth. This is partially offset by increases in depreciation, interest and operations expenses.
SJI recognized an additional gain of $1.7 million related to the sale of real estate during 2017.
SJI's net income for 2016 increased $13.7 million, or 13.0%, to $118.8 million compared to 2015 primarily as a result of the following:
The net income contribution from retail gas and electric operations at SJE increased $8.2 million to $7.5 million, primarily due to the change in unrealized gains and losses on forward financial contracts used to mitigate price risk on retail gas and electric as discussed under "Operating Revenues – Nonutility" below.
The net income contribution from the wholesale energy operations at SJRG increased $4.8 million to $26.0 million, primarily due to an approximately $2.7 million increase related to additional transportation capacity along with margins earned on gas supply contracts with two electric generation facilities compared to the prior year as described in "Gross Margin - Energy Group" below, along with an approximately $2.1 million increase resulting from the change in unrealized gains and losses on derivatives used by the wholesale energy operations to mitigate natural gas commodity price risk as discussed under "Operating Revenues - Energy Group" below.
The net income contribution from gas utility operations at SJG increased $2.5 million to $69.1 million, primarily due to the rolling into base rates of SHARP and AIRP investments, along with customer growth.
The net income contribution from on-site energy production at Marina increased $0.5 million to $16.0 million, primarily due to the following:
| ◦ | $15.2 million increase due to the impact of a reduction in the carrying amount of an investment at one of Energenic's operating subsidiaries, which occurred in 2015 (see Note 7 to the consolidated financial statements), along with other losses incurred at the Energenic operating subsidiaries in 2015. |
| ◦ | $9.3 million increase due to several new renewable energy projects that commenced operations over the past twelve months, along with higher prices on SRECs compared to the previous year as discussed in "Gross Margin - Energy Services" below. |
| ◦ | $4.5 million increase due to a settlement at Marina in 2016 (see Note 7 to the consolidated financial statements). |
| ◦ | $0.7 million increase due to the impact of several entities that became wholly owned by Marina as of December 31, 2015 (see Note 3 to the consolidated financial statements). |
| ◦ | $29.2 million decrease due to the impact of lower renewable energy investments on the investment tax credits available as compared to the prior year. This reduction is consistent with the Company's previously announced strategy of substantially reducing solar development in 2016. |
The net income contribution from SJEX decreased $1.4 million to $0.1 million primarily due to a gain on the sale of a working interest in assets of Potato Creek in 2015, which did not recur in 2016.
A significant portion of the volatility in operating results is due to the impact of the accounting methods associated with SJI's derivative activities. SJI uses derivatives to limit its exposure to market risk on transactions to buy, sell, transport and store natural gas and to buy and sell retail electricity. SJI also uses derivatives to limit its exposure to increasing interest rates on variable-rate debt.
The types of transactions that typically cause the most significant volatility in operating results are as follows:
The wholesale energy operations at SJRG purchases and holds natural gas in storage and maintains capacity on interstate pipelines to earn profit margins in the future. The wholesale energy operations utilize derivatives to mitigate commodity price risk in order to substantially lock-in the profit margin that will ultimately be realized. However, both gas stored in inventory and pipeline capacity are not considered derivatives and are not subject to fair value accounting. Conversely, the derivatives used to reduce the risk associated with a change in the value of inventory and pipeline capacity are accounted for at fair value, with changes in fair value recorded in operating results in the period of change. As a result, earnings are subject to volatility as the market price of derivatives change, even when the underlying hedged value of inventory and pipeline capacity are unchanged. Additionally, volatility in earnings is created when realized gains and losses on derivatives used to mitigate commodity price risk on expected future purchases of gas injected into storage are recognized in earnings when the derivatives settle, but the cost of the related gas in storage is not recognized in earnings until the period of withdrawal. This volatility can be significant from period to period. Over time, gains or losses on the sale of gas in storage, as well as use of capacity, will be offset by losses or gains on the derivatives, resulting in the realization of the profit margin expected when the transactions were initiated.
The retail electric operations at SJE use forward contracts to mitigate commodity price risk on fixed price electric contracts with customers. In accordance with GAAP, the forward contracts are recorded at fair value, with changes in fair value recorded in earnings in the period of change. Several related customer contracts are not considered derivatives and, therefore, are not recorded in earnings until the electricity is delivered. As a result, earnings are subject to volatility as the market price of the forward contracts change, even when the underlying hedged value of the customer contract is unchanged. Over time, gains or losses on the sale of the fixed price electric under contract will be offset by losses or gains on the forward contracts, resulting in the realization of the profit margin expected when the transactions were initiated.
As a result, management also uses the non-generally accepted accounting principles (non-GAAP) financial measures of Economic Earnings and Economic Earnings per share when evaluating the results of operations for its nonutility operations. These non-GAAP financial measures should not be considered as an alternative to GAAP measures, such as net income, operating income, earnings per share from continuing operations or any other GAAP measure of liquidity or financial performance.
We define Economic Earnings as: Income from continuing operations, (a) less the change in unrealized gains and plus the change in unrealized losses on all derivative transactions; (b) less realized gains and plus realized losses on all commodity derivative transactions attributed to expected purchases of gas in storage to match the recognition of these gains and losses with the recognition of the related cost of the gas in storage in the period of withdrawal; (c) less the impact of transactions or contractual arrangements where the true economic impact will be realized in a future period; (d) as adjusted by the impact of a May 2017 jury verdict stemming from a pricing dispute with a gas supplier over costs, including interest charges and legal fees incurred; (e) as adjusted by the impact of a settlement of an outstanding legal claim stemming from a dispute related to a three-year capacity management contract with a counterparty, including legal fees incurred; (f) as adjusted by the impact of a favorable FERC decision over a tariff rate dispute with a counterparty, including interest earned; and (g) as adjusted for various costs related to the agreement to acquire the assets of Elizabethtown Gas and Elkton Gas. With respect to part (c) of the definition of Economic Earnings:
For the year ended December 31, 2017, Economic Earnings excludes an approximately $2.4 million pre-tax loss related to a new interest rate derivative and amendments made to an existing interest rate derivative linked to unrealized losses previously recorded in Accumulated Other Comprehensive Loss (AOCL). SJI reclassified this amount from AOCL to Interest Charges on the consolidated statements of income as a result of the prior hedged transactions being deemed probable of not occurring. Since the economic impact will not be realized until future periods, this amount is excluded from Economic Earnings. See Note 16 to the consolidated financial statements.
For the year ended December 31, 2017, Economic Earnings excludes approximately $91.3 million of pre-tax charges related to several impairment charges recorded during the year, including impairments on solar generating facilities, landfill gas-to-energy (LFGTE) long-lived assets, LFGTE assets customer relationships, and goodwill (see Note 1 to the consolidated financial statements). The economic impact of these charges will not be realized until a future period. An impairment charge was also recorded in 2012 within Income from Continuing Operations on a separate solar generating facility which reduced its depreciable basis and recurring depreciation expense, and this was also excluded from Economic Earnings.
For the year ended December 31, 2017, Economic Earnings excludes approximately $11.4 million for the impact of one-time tax adjustments, most notably related to the Tax Cuts and Jobs Act (Tax Reform), which was signed into law in December 2017.
For the year ended December 31, 2015, Economic Earnings includes a pre-tax loss of $2.5 million from affiliated companies that was excluded from Economic Earnings for the year ended December 31, 2014. These adjustments are the result of a reserve for uncollectible accounts recorded by an Energenic subsidiary that owned and operated a central energy center and energy distribution system for a hotel, casino and entertainment complex in Atlantic City, New Jersey (see Note 7 to the consolidated financial statements). In 2014, this charge was excluded from Economic Earnings as the total economic impact of the proceedings had not been realized. During the second quarter of 2015, the Company, through its investment in Energenic, reduced the carrying value of the investment in this project. As such, this charge is included in Economic Earnings for the year ended December 31, 2015.
Economic Earnings is a significant performance metric used by our management to indicate the amount and timing of income from continuing operations that we expect to earn after taking into account the impact of derivative instruments on the related transactions, and transactions or contractual arrangements where the true economic impact will be realized primarily in a future period or was realized in a previous period. Specifically regarding derivatives, we believe that this financial measure indicates to investors the profitability of the entire derivative-related transaction and not just the portion that is subject to mark-to-market valuation under GAAP. We believe that considering only the change in market value on the derivative side of the transaction can produce a false sense as to the ultimate profitability of the total transaction as no change in value is reflected for the non-derivative portion of the transaction.
Economic Earnings for 2017 decreased $4.8 million, or 4.6%, to $98.1 million compared to 2016, primarily as a result of the following:
The income contribution from on-site energy production at Marina decreased $18.9 million to a net loss of $3.2 million. This was primarily due to the impact of recording no investment tax credits on renewable energy facilities in 2017, compared with $9.1 million in 2016, which is consistent with SJI's previously announced strategy of substantially reducing solar development. Also contributing was $4.5 million for two settlements recorded at Marina during 2016 that did not recur in 2017 (see Note 7 to the consolidated financial statements). The remaining decrease is primarily due to an overall increase in operating and interest expenses.
The income contribution from the retail gas and electric operations at SJE decreased $1.8 million to a net loss of $0.5 million primarily due to the expiration of a large electric sales contract with a group of school boards.
The income contribution from the wholesale energy operations at SJRG increased $5.3 million to $21.6 million, primarily due to higher margins earned on daily energy trading activities, colder weather conditions experienced in the fourth quarter of 2017 compared to the prior year, additional margins earned during 2017 on gas supply contracts with three electric generation facilities, and an overall decrease in operating expenses (excluding the legal fees discussed above).
The income contribution from Midstream increased $4.8 million to $4.6 million primarily due to recognition of Allowance for Funds Used During Construction (AFUDC) at PennEast, of which Midstream has a 20% equity interest.
The income contribution from gas utility operations at SJG increased $3.5 million to $72.6 million primarily due to increased margin resulting from investments included in the rate case, AIRP II and SHARP rolling into base rates during the fourth quarter of 2017, along with customer growth. This is partially offset by increases in depreciation, interest and operations expenses.
SJI recognized an additional gain of $1.7 million related to the sale of real estate during 2017.
Economic Earnings for 2016 increased $3.9 million, or 3.9%, to $102.8 million compared to 2015, primarily as a result of the following:
The income contribution from the wholesale energy operations at SJRG increased $2.7 million to $16.3 million, primarily due to additional transportation capacity along with margins earned on gas supply contracts with two electric generation facilities compared to the prior year as described in "Gross Margin - Energy Group" below.
The income contribution from gas utility operations at SJG increased $2.5 million to $69.1 million, primarily due to the rolling into base rates of SHARP and AIRP investments, along with customer growth.
The income contribution from on-site energy production at Marina increased $1.7 million to $15.7 million, primarily due to the following:
| ◦ | $16.5 million increase due to the impact of a reduction in the carrying amount of an investment at one of Energenic's operating subsidiaries, which occurred in 2015 (see Note 7 to the consolidated financial statements), along with other losses incurred at the Energenic operating subsidiaries in 2015. |
| ◦ | $9.2 million increase due to several new renewable energy projects that commenced operations over the past twelve months, along with higher prices on SRECs compared to the previous year as discussed in "Gross Margin - Energy Services" below. |
| ◦ | $4.5 million increase due to a settlement at Marina in 2016 (see Note 7 to the consolidated financial statements). |
| ◦ | $0.7 million increase due to the impact of several entities that became wholly owned by Marina as of December 31, 2015 (see Note 3 to the consolidated financial statements). |
| ◦ | $29.2 million decrease due to the impact of lower renewable energy investments on the investment tax credits available as compared to the prior year. This reduction is consistent with the Company's previously announced strategy of substantially reducing solar development in 2016. |
The net income contribution from SJEX decreased $1.4 million to $0.1 million primarily due to a gain on the sale of a working interest in assets of Potato Creek in 2015, which did not recur in 2016.
The following table summarizespresents a reconciliation of our income from continuing operations and earnings per share from continuing operations to Economic Earnings and Economic Earnings per share (in thousands, except per share data):
| 2017 | 2016 | 2015 | |||||||
| (Loss) Income from Continuing Operations | $ | (3,404 | ) | $ | 119,061 | $ | 105,610 | ||
| Minus/Plus: | |||||||||
| Unrealized Mark-to-Market Losses/(Gains) on Derivatives* | 14,226 | (27,550 | ) | (8,444 | ) | ||||
| Realized Losses on Inventory Injection Hedges* | 332 | 683 | 89 | ||||||
| Net Loss from Affiliated Companies (A)* | — | — | (2,540 | ) | |||||
| Unrealized Loss on Property, Plant and Equipment (B) | 91,299 | — | — | ||||||
| Net Losses from Legal Proceedings (C) | 56,075 | — | — | ||||||
| Acquisition Costs (D) | 19,564 | — | — | ||||||
| Other (E)* | 2,227 | (165 | ) | (165 | ) | ||||
| Income Taxes (F) | (70,834 | ) | 10,813 | 4,424 | |||||
| Additional Tax Adjustments (G) | (11,420 | ) | — | — | |||||
| Economic Earnings | $ | 98,065 | $ | 102,842 | $ | 98,974 | |||
| (Loss) Earnings per Share from Continuing Operations | $ | (0.04 | ) | $ | 1.56 | $ | 1.53 | ||
| Minus/Plus: | |||||||||
| Unrealized Mark-to-Market Losses/(Gains) on Derivatives* | 0.18 | (0.36 | ) | (0.12 | ) | ||||
| Realized Losses on Inventory Injection Hedges* | — | 0.01 | — | ||||||
| Net Loss from Affiliated Companies (A)* | — | — | (0.04 | ) | |||||
| Unrealized Loss on Property, Plant and Equipment (B) | 1.14 | — | — | ||||||
| Net Losses from Legal Proceedings (C) | 0.70 | — | — | ||||||
| Acquisition Costs (D) | 0.25 | — | — | ||||||
| Other (E)* | 0.03 | — | — | ||||||
| Income Taxes (F) | (0.89 | ) | 0.13 | 0.07 | |||||
| Additional Tax Adjustments (G) | (0.14 | ) | — | — | |||||
| Economic Earnings per Share | $ | 1.23 | $ | 1.34 | $ | 1.44 | |||
The effect of derivative instruments not designated as hedging instruments under GAAP in the statements of consolidated income (see Note 16 to the consolidated financial statements) is as follows (gains (losses) in thousands):
| 2017 | 2016 | 2015 | |||||||||
| (Losses) gains on energy-related commodity contracts | $ | (13,667 | ) | $ | 26,935 | $ | 8,401 | ||||
| (Losses) gains on interest rate contracts | (677 | ) | 647 | 96 | |||||||
| Total before income taxes | (14,344 | ) | 27,582 | 8,497 | |||||||
Unrealized mark-to-market gains (losses) on derivatives held by affiliated companies, before taxes | 118 | (32 | ) | (53 | ) | ||||||
| Total unrealized mark-to-market (losses) gains on derivatives* | (14,226 | ) | 27,550 | 8,444 | |||||||
| Realized losses on inventory injection hedges* | (332 | ) | (683 | ) | (89 | ) | |||||
| Net Loss from Affiliated Companies (A)* | — | — | 2,540 | ||||||||
| Unrealized Loss on Property, Plant and Equipment (B) | (91,299 | ) | — | — | |||||||
| Net Losses from Legal Proceedings (C) | (56,075 | ) | — | — | |||||||
| Acquisition Costs (D) | (19,564 | ) | — | — | |||||||
| Other (E)* | (2,227 | ) | 165 | 165 | |||||||
| Income Taxes (F) | 70,834 | (10,813 | ) | (4,424 | ) | ||||||
| Additional Tax Adjustments (G) | 11,420 | — | — | ||||||||
Total reconciling items between (losses) income from continuing operations and Economic Earnings | $ | (101,469 | ) | $ | 16,219 | $ | 6,636 | ||||
*Certain reclassifications have been made to the prior period numbers in these tables to conform to the current period presentation. The 2015 numbers in these line items have been adjusted to be presented before income taxes.
(A) Resulting from a reserve for uncollectible accounts recorded by an Energenic subsidiary that owned and operated a central energy center and energy distribution system for a hotel, casino and entertainment complex in Atlantic City, New Jersey (see Note 7 to the consolidated financial statements). In 2014, this charge was excluded from Economic Earnings as the total economic impact of the proceedings had not been realized. During the second quarter 2015, the Company, through its investment in Energenic, reduced the carrying value of the investment in this project. As such, this charge is included in Economic Earnings in 2015.
(B) Represents several impairment charges recorded during the year, including impairments on solar generating facilities, landfill gas-to-energy (LFGTE) long-lived assets, LFGTE assets customer relationships, and goodwill (see Note 1 to the consolidated financial statements). The economic impact of these charges will not be realized until a future period.
(C) Represents net losses from three separate legal proceedings: (a) $55.6 million of pre-tax charges, including interest and legal fees, resulting from a ruling in a legal proceeding related to a pricing dispute between SJI and a gas supplier that began in October 2014; (b) a $9.8 million pre-tax charge, including legal fees, resulting from a settlement with a counterparty over a dispute related to a three-year capacity management contract; and (c) a $9.3 million pre-tax gain resulting from a favorable FERC decision, including interest, over a tariff rate dispute with a counterparty, whereby SJI contended that the counterparty was overcharging for storage demand charges over a ten-year period. See Note 15 to the consolidated financial statements. Since these net losses relate to transactions that primarily occurred in prior periods, these net losses are excluded from Economic Earnings.
(D) Represents costs incurred on the agreement to acquire the assets of Elizabethtown Gas and Elkton Gas (see Note 1 to the consolidated financial statements). Since the economic impact will not be realized until future periods, this amount is excluded from Economic Earnings.
(E) Included in this amount are amendments made to an existing interest rate derivative linked to unrealized losses previously recorded in AOCL, which SJI reclassified from AOCL to Interest Charges on the consolidated statements of income as a result of the prior hedged transactions being deemed probable of not occurring. Since the economic impact will not be realized until future periods, this amount is excluded from Economic Earnings. Also included is additional depreciation expense within Economic Earnings on two solar generating facilities where an impairment charge was recorded in the past, which reduced the depreciable basis and recurring depreciation expense, and the related reduction in depreciation expense is being added back.
(F) Determined using a combined average statutory tax rate of approximately 39% for 2017 and 40% for 2016 and 2015.
(G) Represents one-time tax adjustments, most notably for Tax Reform, which was signed into law in December 2017. See Note 4 to the consolidated financial statements.
Gas Utility Operations - The following tables summarize the composition of selected gas utility dataoperations operating revenues and Utility Margin for the three years ended December 31 (in thousands, except for customer and degree day data):
| 2015 | 2014 | 2013 | ||||||||||||||||||
| Utility Throughput – dth: | ||||||||||||||||||||
| Firm Sales - | ||||||||||||||||||||
| Residential | 23,852 | 17 | % | 24,508 | 18 | % | 22,070 | 20 | % | |||||||||||
| Commercial | 5,980 | 4 | % | 5,530 | 4 | % | 5,408 | 5 | % | |||||||||||
| Industrial | 338 | — | 283 | — | 292 | — | ||||||||||||||
| Cogeneration and electric generation | 1,449 | 1 | % | 1,035 | 1 | % | 1,562 | 1 | % | |||||||||||
| Firm Transportation - | ||||||||||||||||||||
| Residential | 2,427 | 2 | % | 3,291 | 2 | % | 3,319 | 3 | % | |||||||||||
| Commercial | 6,783 | 5 | % | 7,103 | 5 | % | 6,780 | 6 | % | |||||||||||
| Industrial | 11,780 | 9 | % | 13,168 | 10 | % | 13,051 | 12 | % | |||||||||||
| Cogeneration and electric generation | 5,870 | 4 | % | 10,307 | 7 | % | 7,977 | 7 | % | |||||||||||
| Total Firm Throughput | 58,479 | 42 | % | 65,225 | 47 | % | 60,459 | 54 | % | |||||||||||
| Interruptible Sales | 20 | — | — | — | 14 | — | ||||||||||||||
| Interruptible Transportation | 1,338 | 1 | % | 1,401 | 1 | % | 1,452 | 1 | % | |||||||||||
| Off-System | 14,603 | 11 | % | 9,411 | 7 | % | 9,685 | 9 | % | |||||||||||
| Capacity Release | 62,349 | 46 | % | 62,193 | 45 | % | 40,088 | 36 | % | |||||||||||
| Total Utility Throughput | 136,789 | 100 | % | 138,230 | 100 | % | 111,698 | 100 | % | |||||||||||
| Utility Operating Revenues: | ||||||||||||||||||||
| Firm Sales- | ||||||||||||||||||||
| Residential | $ | 317,491 | 59 | % | $ | 279,797 | 56 | % | $ | 246,227 | 56 | % | ||||||||
| Commercial | 69,845 | 13 | % | 63,584 | 13 | % | 57,126 | 13 | % | |||||||||||
| Industrial | 4,083 | 1 | % | 4,070 | 1 | % | 3,485 | 1 | % | |||||||||||
| Cogeneration and electric generation | 5,666 | 1 | % | 6,037 | 1 | % | 8,144 | 2 | % | |||||||||||
| Firm Transportation - | ||||||||||||||||||||
| Residential | 16,594 | 3 | % | 20,648 | 4 | % | 21,392 | 5 | % | |||||||||||
| Commercial | 30,602 | 6 | % | 30,850 | 6 | % | 28,165 | 6 | % | |||||||||||
| Industrial | 22,106 | 4 | % | 25,737 | 5 | % | 23,551 | 5 | % | |||||||||||
| Cogeneration and electric generation | 4,920 | 1 | % | 9,531 | 2 | % | 6,982 | 2 | % | |||||||||||
| Total Firm Revenues | 471,307 | 88 | % | 440,254 | 88 | % | 395,072 | 90 | % | |||||||||||
| Interruptible Sales | 300 | — | 15 | — | 342 | — | ||||||||||||||
| Interruptible Transportation | 1,373 | — | 1,694 | — | 1,827 | — | ||||||||||||||
| Off-System | 49,624 | 9 | % | 52,809 | 11 | % | 41,488 | 9 | % | |||||||||||
| Capacity Release | 10,296 | 2 | % | 5,835 | 1 | % | 6,384 | 1 | % | |||||||||||
| Other | 1,390 | 1 | % | 1,268 | — | 1,367 | — | |||||||||||||
| Total Utility Operating Revenues | 534,290 | 100 | % | 501,875 | 100 | % | 446,480 | 100 | % | |||||||||||
| Less: | ||||||||||||||||||||
| Cost of sales | 245,290 | 231,216 | 200,081 | |||||||||||||||||
| Conservation recoveries * | 21,226 | 24,836 | 15,909 | |||||||||||||||||
| RAC recoveries * | 9,134 | 8,255 | 8,137 | |||||||||||||||||
| EET Recoveries * | 3,611 | 4,169 | 4,509 | |||||||||||||||||
| Revenue taxes | 1,250 | 1,141 | 5,247 | |||||||||||||||||
| Utility Margin ** | $ | 253,779 | $ | 232,258 | $ | 212,597 | ||||||||||||||
| December 31, 2017 | December 31, 2016 | December 31, 2015 | ||||||||||||||||||
| Utility Operating Revenues: | ||||||||||||||||||||
| Firm Sales- | ||||||||||||||||||||
| Residential | $ | 269,721 | 52 | % | $ | 259,881 | 56 | % | $ | 317,491 | 59 | % | ||||||||
| Commercial | 61,514 | 12 | % | 55,795 | 12 | % | 69,845 | 13 | % | |||||||||||
| Industrial | 4,235 | 1 | % | 3,126 | 1 | % | 4,083 | 1 | % | |||||||||||
| Cogeneration and Electric Generation | 5,519 | 1 | % | 5,257 | 1 | % | 5,666 | 1 | % | |||||||||||
| Firm Transportation - | ||||||||||||||||||||
| Residential | 14,162 | 3 | % | 14,989 | 3 | % | 16,594 | 3 | % | |||||||||||
| Commercial | 34,986 | 7 | % | 32,423 | 7 | % | 30,602 | 6 | % | |||||||||||
| Industrial | 20,576 | 4 | % | 19,594 | 4 | % | 22,106 | 4 | % | |||||||||||
| Cogeneration and Electric Generation | 4,360 | 1 | % | 4,472 | 1 | % | 4,920 | 1 | % | |||||||||||
| Total Firm Revenues | 415,073 | 81 | % | 395,537 | 85 | % | 471,307 | 88 | % | |||||||||||
| Interruptible Sales | 25 | — | 18 | — | 300 | — | ||||||||||||||
| Interruptible Transportation | 867 | — | 928 | — | 1,373 | — | ||||||||||||||
| Off-System Sales | 92,376 | 18 | % | 51,661 | 11 | % | 49,624 | 9 | % | |||||||||||
| Capacity Release | 7,695 | 1 | % | 11,778 | 3 | % | 10,296 | 2 | % | |||||||||||
| Other | 1,218 | — | % | 1,133 | 1 | % | 1,390 | 1 | % | |||||||||||
| 517,254 | 100 | % | 461,055 | 100 | % | 534,290 | 100 | % | ||||||||||||
| Less: Intercompany Sales | 4,772 | 7,236 | 5,527 | |||||||||||||||||
| Total Utility Operating Revenues | 512,482 | 453,819 | 528,763 | |||||||||||||||||
| Less: | ||||||||||||||||||||
| Cost of Sales - Utility | 204,432 | 174,390 | 245,290 | |||||||||||||||||
| Less: Intercompany Cost of Sales | 4,772 | 7,236 | 5,527 | |||||||||||||||||
| Total Cost of Sales - Utility (Excluding Depreciation) | 199,660 | 167,154 | 239,763 | |||||||||||||||||
| Conservation Recoveries * | 7,003 | 9,202 | 21,226 | |||||||||||||||||
| RAC recoveries * | 11,014 | 9,326 | 9,134 | |||||||||||||||||
| EET Recoveries* | 1,284 | 2,718 | 3,611 | |||||||||||||||||
| Revenue Taxes | 1,162 | 1,109 | 1,250 | |||||||||||||||||
| Utility Margin** | $ | 292,359 | $ | 264,310 | $ | 253,779 | ||||||||||||||
| Utility Margin: | ||||||||||||||||||||
| Residential | $ | 180,106 | 62 | % | $ | 162,820 | 62 | % | $ | 169,455 | 67 | % | ||||||||
| Commercial and Industrial | 76,491 | 26 | % | 69,396 | 26 | % | 72,149 | 28 | % | |||||||||||
| Cogeneration and Electric Generation | 4,762 | 1 | % | 4,898 | 2 | % | 4,738 | 2 | % | |||||||||||
| Interruptible | 63 | — | 79 | — | 120 | — | ||||||||||||||
| Off-system Sales & Capacity Release | 5,051 | 2 | % | 4,731 | 2 | % | 4,270 | 2 | % | |||||||||||
| Other Revenues | 2,107 | 1 | % | 2,213 | 1 | % | 2,582 | 1 | % | |||||||||||
| Margin Before Weather Normalization & Decoupling | 268,580 | 92 | % | 244,137 | 93 | % | 253,314 | 100 | % | |||||||||||
| CIP mechanism | 20,062 | 7 | % | 16,615 | 6 | % | (1,798 | ) | (1 | )% | ||||||||||
| EET mechanism | 3,717 | 1 | % | 3,558 | 1 | % | 2,263 | 1 | % | |||||||||||
| Utility Margin** | $ | 292,359 | 100 | % | $ | 264,310 | 100 | % | $ | 253,779 | 100 | % | ||||||||
| Utility Margin: | ||||||||||||||||||||
| Residential | $ | 169,455 | 67 | % | $ | 159,780 | 69 | % | $ | 138,136 | 65 | % | ||||||||
| Commercial and industrial | 72,149 | 28 | % | 65,492 | 29 | % | 57,495 | 27 | % | |||||||||||
| Cogeneration and electric generation | 4,738 | 2 | % | 5,343 | 2 | % | 5,022 | 2 | % | |||||||||||
| Interruptible | 120 | — | % | 81 | — | 114 | — | |||||||||||||
| Off-system & capacity release | 4,270 | 2 | % | 3,023 | 1 | % | 2,070 | 1 | % | |||||||||||
| Other revenues | 2,582 | 1 | % | 2,131 | 1 | % | 1,752 | 1 | % | |||||||||||
| Margin before incentive mechanisms | 253,314 | 100 | % | 235,850 | 102 | % | 204,589 | 96 | % | |||||||||||
| CIRT mechanism | — | — | % | — | — | % | 2,204 | 1 | % | |||||||||||
| CIP mechanism | (1,798 | ) | (1 | )% | (4,529 | ) | (2 | )% | 5,310 | 3 | % | |||||||||
| EET mechanism | 2,263 | 1 | % | 937 | — | 494 | — | |||||||||||||
| Utility Margin ** | $ | 253,779 | 100 | % | $ | 232,258 | 100 | % | $ | 212,597 | 100 | % | ||||||||
| Number of Customers at Year End: | ||||||||||||||||||||
| Residential | 348,093 | 93 | % | 342,155 | 93 | % | 337,936 | 93 | % | |||||||||||
| Commercial | 24,565 | 7 | % | 24,253 | 7 | % | 23,873 | 7 | % | |||||||||||
| Industrial | 442 | — | 446 | — | 447 | — | ||||||||||||||
| Total Customers | 373,100 | 100 | % | 366,854 | 100 | % | 362,256 | 100 | % | |||||||||||
| Annual Degree-Days*** | 4,402 | 4,872 | 4,658 | |||||||||||||||||
* Represents expenses for which there is a corresponding credit in operating revenues. Therefore, such recoveries have no impact on ourSJG's financial results.
** Utility Margin is a non-GAAP financial measure and is further defined under the caption "Margin (pre-tax)""Utility Margin" below.
Higher OSS volumes and higher unit prices resulted in a $11.3$40.7 million, or 27.3%78.8%, increase in OSS revenues during 2014,2017 compared with 2013. Colder weather led to greater demand during the first quarter of 2014, allowing the Company to increase revenue from such sales. However, the2016. The impact of changes in OSS activity does not have a material impact on the earnings of SJG, as SJG is required to return 85% of the Companyprofits of such activity to its ratepayers.
Operating Revenues - Gas Utility Operations 2016 vs. 2015 - Revenues decreased $74.9 million, or 14.2%, during 2016 compared with 2015 after eliminating intercompany transactions. Total firm revenue was $75.8 million, or 16.1%, lower in 2016 compared to the prior year due to several factors. Firm throughput was lower during 2016, compared to the prior year. The impact of this reduction in throughput lowered SJG’s recovery of natural gas costs through its BGSS mechanism by $38.3 million. In addition, SJG reduced its BGSS rate effective October 1, 2015 and 2016 by 18.6% and 32.9%, respectively, further reducing revenue by $34.7 million during 2016. Finally, SJG provided a $20.0 million and $10.0 million BGSS bill credit to its residential and small commercial customers in January 2016 and December 2016, respectively, of which $28.0 million reduced revenue for 2016, after consideration for sales tax. While changes in natural gas costs and BGSS recoveries/refunds fluctuate from period to period, SJG does not profit from the sale of the commodity. Therefore, fluctuations in Utility Operating Revenue and Cost of Sales, such as those discussed above, did not have an impact on SJG’s profitability. The addition of 4,525 customers in 2016 partially offset the decreases mentioned above. While warmer weather decreased firm sales volume and revenue, the revenue decrease has little impact on SJG profitability under the operation of the CIP, as discussed below under the caption "Utility Margin."
Higher OSS volumes resulted in a $2.0 million, or 4.1%, increase in OSS revenues during 2016, compared with 2015. The impact of changes in OSS activity does not have a material impact on the earnings of SJG, as SJG is required to return 85% of the profits of such activity to its ratepayers. Earnings from OSS can be seen in the "Margin""Utility Margin" table above.
Utility Margin (pre-tax) - Our margin Management uses Utility Margin, a non-GAAP financial measure, when evaluating the operating results of SJG. Utility Margin is defined as natural gas revenues less natural gas costs;costs, regulatory rider expenses and related volumetric and revenue basedrevenue-based energy taxes; and regulatory rider expenses. We believetaxes. Management believes that marginUtility Margin provides a more meaningful basis for evaluating utility operations than revenues since natural gas costs, energy taxes and regulatory rider expenses and related energy taxes are passed through to customers, and, therefore, have no effect on our profitability.customers. Natural gas costs are charged to operating expenses on the basis of therm sales at the prices approved by the BPU through ourSJG’s BGSS tariff.clause. Non-GAAP financial measures are not in accordance with, or an alternative to, GAAP and should be considered in addition to, and not as a substitute for, the comparable GAAP measure.
The CIP tracking mechanism adjusts earnings when actual usage per customer experienced during the period varies from an established baseline usage per customer. As reflected in the margin table and the CIP table above, theThe CIP mechanism reduced margin by $1.8protected $20.1 million, or $1.0$12.0 million after taxes, during 2015, primarily2017, due to weather that was 11.5% warmer than average and customer usage variations.
Total Utility Margin in 2016 increased $10.5 million, or 4.1%, from 2015. The rolling into base rates of SHARP investments of approximately $36.6 million on October 1, 2015 contributed approximately $3.5 million of additional Utility Margin in 2016. In addition, the rolling into base rates of AIRP investments of $74.5 million on December 1, 2016 contributed approximately $1.5 million of additional Utility Margin in 2016. Net customer additions of 4,525 over the twelve-month period ended December 31, 2016, representing 1.2% growth over the prior year, contributed approximately $4.0 million in additional Utility Margin.
The CIP mechanism reduced margin by $4.5protected $16.6 million, or $2.7$9.9 million after taxes, during 2014, primarily2016, due to weather that was colder8.1% warmer than normal. The CIP protected $5.3average and customer usage variations.
Operating Revenues - Energy Group 2017 vs. 2016 - Combined revenues for Energy Group, net of intercompany transactions, increased $147.2 million, or $3.130.3%, to $632.6 million after taxes,in 2017 compared with 2016.
Revenues from retail gas operations at SJE, net of intercompany transactions, increased $18.0 million, or 19.9%, to $108.7 million in 2017 compared with 2016, primarily due to a 26.3% increase in the average monthly NYMEX settle price, along with a 19.3% increase in sales volumes driven by additional contracts entered into in 2017. This was partially offset with the change in unrealized gains and losses recorded on forward financial contracts due to price volatility, which is excluded for Economic Earnings, as defined above, and represented a total decrease of $6.3 million compared to the prior year period.
Revenues from retail electric operations at SJE, net of intercompany transactions, decreased $2.8 million, or 1.6%, to $172.1 million in 2017 compared with 2016 primarily due to the expiration of a large contract with a group of school boards. Also contributing to this decrease was the change in unrealized gains and losses recorded on forward financial contracts due to price volatility, which is excluded for Economic Earnings and represented a total decrease of $0.8 million compared to the prior year period.
SJE uses forward financial contracts to mitigate commodity price risk on fixed price electric contracts. In accordance with GAAP, the forward financial contracts are recorded at fair value, with changes in fair value recorded in earnings in the period of change. The related customer contracts are not considered derivatives and, therefore, are not recorded in earnings until the electricity is delivered. As a result, earnings are subject to volatility as the market price of the forward financial contracts change, even when the underlying hedged value of the customer contract is unchanged. Over time, gains or losses on the sale of the fixed price electric under contract will be offset by losses or gains on the forward financial contracts, resulting in the realization of the profit margin expected when the transactions were initiated. The retail electric operations at SJE serve both fixed and market-priced customers.
Revenues from wholesale energy operations at SJRG, net of intercompany transactions, increased $131.7 million to $351.6 million in 2017 compared with 2016. This increase was primarily due to revenues earned on gas supply contracts with three electric generation facilities, which represented a total increase of $168.1 million. Partially offsetting this increase was the change in unrealized gains and losses recorded on forward financial contracts due to price volatility, which is excluded for Economic Earnings and represented a total decrease of $33.5 million in 2017 compared with 2016.
Operating Revenues - Energy Services 2017 vs. 2016 - Combined revenues for Energy Services, net of intercompany transactions, increased $0.7 million, or 0.7%, to $98.0 million in 2017 compared with 2016.
Revenues from on-site energy production at Marina, net of intercompany transactions, increased $2.1 million, or 2.4%, to $91.5 million in 2017 compared with 2016, primarily due to an increase in solar renewable energy credits (SRECs) transferred as a result of more solar projects being online compared with 2016. Solar revenues, net of intercompany transactions, which is included in revenues from on-site energy production above, increased $1.3 million, or 2.4%, to $56.5 million in 2017 compared with 2016.
SRECs represent the renewable energy attribute of the solar electricity generated that can be sold to customers. Marina does not recognize revenue, or the related margin, until the SREC is certified and transferred to the customer’s electronic account. Customers may purchase SRECs to comply with solar requirements under various state renewable energy regulations. Approximately 73% of Marina’s 2017 solar production is in New Jersey, 9% is in Massachusetts, 15% is in Maryland, and 3% is in Vermont.
Marina hedges a portion of its anticipated SREC production through the use of forward sales contracts. The hedged percentage of projected SREC production related to in-service assets in New Jersey is 93% and 68% for energy years ending May 31, 2018 and 2019, respectively, and in Massachusetts is 54% for energy year ending December 31, 2018. SREC production related to in-service assets in Maryland and Vermont is currently unhedged.
Installed capacity was 201 MW and 198 MW at December 31, 2017 and 2016, respectively.
Revenues from appliance service operations at SJESP, net of intercompany transactions, decreased $1.4 million in 2017 compared with 2016 primarily due to the sale of certain assets of SJESP's residential and small commercial HVAC and plumbing business to a third party, which was completed on September 1, 2017 (see Note 1 to the consolidated financial statements).
Operating Revenues - Energy Group 2016 vs. 2015 - Combined revenues for Energy Group, net of intercompany transactions, increased $125.3 million, or 34.8%, to $485.4 million in 2016 compared with 2015.
Revenues from retail gas operations at SJE, net of intercompany transactions, increased $3.7 million, or 4.3%, to $90.6 million in 2016 compared with 2015. The increase in gas revenues was primarily due to the net change in unrealized gains and losses recorded on forward financial contracts due to price volatility, which is excluded for Economic Earnings and represented a total increase of $12.2 million in 2016 compared with 2015. This was partially offset with a 7.7% decrease in the average monthly NYMEX settle price.
Revenues from retail electric operations at SJE, net of intercompany transactions, increased $30.2 million, or 20.8%, to $174.9 million in 2016 compared with 2015, primarily due to a 17.9% increase in sales volumes, which was driven by additional electric contracts entered into during 20132016. Also contributing was the net change in unrealized gains and losses recorded on forward financial contracts due to price volatility, which is excluded for Economic Earnings and represented a total increase of $2.3 million in 2016 compared with 2015.
SJE uses forward financial contracts to mitigate commodity price risk on fixed price electric contracts. In accordance with GAAP, the forward financial contracts are recorded at fair value, with changes in fair value recorded in earnings in the period of change. The related customer contracts are not considered derivatives and, therefore, are not recorded in earnings until the electricity is delivered. As a result, earnings are subject to volatility as the market price of the forward financial contracts change, even when the underlying hedged value of the customer contract is unchanged. Over time, gains or losses on the sale of the fixed price electric under contract will be offset by losses or gains on the forward financial contracts, resulting in the realization of the profit margin expected when the transactions were initiated. The retail electric operations at SJE serve both fixed and market-priced customers.
Revenues from the wholesale energy operations at SJRG, net of intercompany transactions, increased $91.6 million to $220.7 million in 2016 compared with 2015, primarily due to revenues earned on gas supply contracts with two electric generation facilities, along with additional transportation capacity. Also contributing was the net change in unrealized gains and losses recorded on forward financial contracts due to price volatility, which is excluded for Economic Earnings and represented a total increase of $3.9 million in 2016 compared with 2015. These were partially offset with a 7.7% decrease in the average monthly NYMEX settle price. As discussed in Note 1 to the consolidated financial statements, revenues and expenses related to the energy trading activities of SJRG are presented on a net basis in Operating Revenues - Nonutility on the statements of consolidated income.
Operating Revenues - Energy Services 2016 vs. 2015 - Combined revenues for Energy Services, net of intercompany transactions, increased $26.6 million, or 37.6%, to $97.3 million in 2016 compared with 2015.
Revenues from on-site energy production at Marina, net of intercompany transactions, increased $29.9 million, or 50.2%, to $89.4 million in 2016 compared with 2015. These increases were primarily due to higher prices on SREC's compared to the previous periods, an increase in SRECs transferred due to new solar projects and the revenues earned at several entities that would have been lostbecame wholly owned by Marina as of December 31, 2015. Solar revenues, net of intercompany transactions, which is included in revenues from on-site energy production above, increased $15.3 million, or 38.5%, to $55.1 million in 2016 compared with 2015.
SRECs represent the renewable energy attribute of the solar electricity generated, which can be sold to customers. Marina does not recognize revenue, or the related margin, until the SREC is certified and transferred to a customer’s electronic account. Customers may purchase SRECs to comply with solar requirements under various state renewable energy regulations. Approximately 76% of Marina’s solar production is in New Jersey.
Marina hedges a portion of its anticipated SREC production through the use of forward sales contracts. The hedged percentage of projected SREC production related to in-service assets in New Jersey is 92% and 66% for energy years ending May 31, 2017 and 2018, respectively.
Installed capacity was 198 MW and 135 MW at December 31, 2016 and 2015, respectively.
Revenues from appliance service operations at SJESP, net of intercompany transactions, decreased $3.3 million, or 29.4%, to $7.9 million in 2016 compared with 2015, primarily due to lower customer usage.installation jobs compared to the prior year.
Gross Margin - Nonutility - Gross margin for the nonutility businesses is defined as revenue less all costs that are directly related to the production, selling and delivery of SJI's products and services. These costs primarily include natural gas and electric commodity costs as well as certain payroll and related benefits. On the statements of consolidated income, revenue is reflected in Operating Revenues - Nonutility and the costs are reflected in Cost of Sales - Nonutility. As discussed in Note 1 to the consolidated financial statements, revenues and expenses related to the energy trading activities of the wholesale energy operations at SJRG are presented on a net basis in Operating Revenues - Nonutility on the statements of consolidated income.
Gross Margin - Energy Group 2017 vs. 2016 - For 2017, combined gross margins for Energy Group decreased $87.6 million to a loss of $6.9 million compared with 2016. This decrease is primarily due to the following:
Gross margin from SJE’s retail gas and other operations decreased $6.0 million to $7.5 million in 2017 compared with 2016. This was primarily due to the change in unrealized gains and losses recorded on forward financial contracts due to price volatility, which is excluded for Economic Earnings and represented a total decrease of $6.3 million in 2017 compared with 2016.
Gross margin from SJE’s retail electric operations decreased $3.0 million to $7.5 million in 2017 compared with 2016. This decrease was primarily due to lower sales volumes resulting from the expiration of a large contract with a group of school boards, along with the change in unrealized gains and losses recorded on forward financial contracts due to price volatility, which is excluded for Economic Earnings and represented a total decrease of $0.8 million.
Gross margin from the wholesale energy operations at SJRG decreased $78.8 million to a loss of $22.1 million in 2017 compared with 2016, primarily due to the following:
$49.6 million decrease resulting from an unfavorable court ruling related to a pricing dispute between SJRG and a supplier (see Note 15 to the consolidated financial statements), which is excluded for Economic Earnings.
$33.5 million decrease resulting from the change in unrealized gains and losses recorded on forward financial contracts due to price volatility, which is excluded for Economic Earnings.
$9.5 million decrease resulting from a settlement of a legal dispute related to a three-year capacity management contract, which is excluded for Economic Earnings.
$7.4 million increase resulting from favorable FERC decision over a tariff rate dispute with a counterparty, whereby SJI contended that the counterparty was overcharging for storage demand charges over a ten year period, which is excluded for Economic Earnings.
The remaining $6.4 million increase resulted from higher margins earned on daily energy trading activities, colder weather conditions in the fourth quarter of 2017, and additional margins earned during 2017 on gas supply contracts with three electric generation facilities.
The wholesale energy operations at SJRG expect to continue to add incremental margin from marketing and related opportunities in the Marcellus region, capitalizing on its established presence in the area. Future margins could fluctuate significantly due to the volatile nature of wholesale gas prices. As of December 31, 2017, the wholesale energy operations had 8.7 Bcf of storage and 584,254 dts/day of firm transportation under contract.
Gross Margin - Energy Services 2017 vs. 2016 - For 2017, combined gross margins for Energy Services increased $2.8 million to $90.9 million compared with 2016. This increase is primarily due to the following:
Gross margin from on-site energy production at Marina increased $4.1 million to $88.2 million in 2017 compared with 2016, primarily due to an increase in SRECs transferred as a result of more solar projects being online compared to the same period in 2016, along with better production.
Gross margin from appliance service operations at SJESP decreased $1.4 million in 2017 compared with 2016 primarily due to the sale of certain assets of SJESP's residential and small commercial HVAC and plumbing business to a third party, which was completed on September 1, 2017 (see Note 1 to the consolidated financial statements).
Gross Margin - Energy Group 2016 vs. 2015 - For 2016, combined gross margins for Energy Group, net of intercompany transactions, increased $23.5 million to $80.7 million compared with 2015. This increase is primarily due to the following:
Gross Margin from SJE's retail gas and other operations increased $11.1 million to $13.5 million in 2016 compared with 2015, primarily due to the net change in unrealized gains and losses recorded on forward financial contracts due to price volatility, which is excluded for Economic Earnings and represented a total increase of $12.2 million in 2016 compared with 2015. The partially offsetting decrease does not represent a significant change.
Gross Margin from SJE's retail electric operations increased $4.4 million to $10.5 million in 2016 compared with 2015, primarily due to margins earned on additional electric contracts entered into in 2016. Also contributing was the net change in unrealized gains and losses recorded on forward financial contracts due to price volatility, which is excluded for Economic Earnings and represented a total increase of $2.3 million in 2016 compared with 2015.
Gross Margin from the wholesale energy operations at SJRG increased $8.1 million to $56.7 million in 2016 compared with 2015. The increase in gross margin was primarily due to additional transportation capacity along with margins earned on gas supply contracts with two electric generation facilities. Also contributing was the net change in unrealized gains and losses recorded on forward financial contracts due to price volatility, which is excluded for Economic Earnings and represented a total increase of $3.9 million in 2016 compared with 2015.
The wholesale energy operations at SJRG expect to continue to add incremental margin from marketing and related opportunities in the Marcellus region, capitalizing on its established presence in the area. Future margins could fluctuate significantly due to the volatile nature of wholesale gas prices. As of December 31, 2016, the wholesale energy operations had 7.9 Bcf of storage and 511,587 dts/day of transportation under contract.
Gross Margin - Energy Services 2016 vs. 2015 - For 2016, combined gross margins for Energy Services, net of intercompany transactions, increased $34.1 million to $88.2 million compared with 2015. This increase is primarily due to the following:
Gross Margin from on-site energy production at Marina increased $34.6 million to $84.0 million in 2016 compared with 2015. Gross margin as a percentage of Operating Revenues increased 10.9 percentage points in 2016 compared with 2015. These increases are primarily due to several higher margin renewable energy projects that began operations over the past twelve months, along with higher prices on SRECs compared to the previous year. Also contributing to the increase were margins earned at several entities that became wholly owned by Marina as of December 31, 2015.
Gross Margin from the appliance service operations at SJESP did not change significantly in 2016 compared with 2015.
| 2015 vs. 2014 | 2014 vs. 2013 | ||||||
| Operations | $ | 5,408 | $ | 16,623 | |||
| Maintenance | $ | 2,726 | $ | 322 | |||
| Depreciation | $ | 4,041 | $ | 3,549 | |||
| Energy and Other Taxes | $ | 271 | $ | (4,102 | ) | ||
| 2017 vs. 2016 | 2016 vs. 2015 | |||||
| Gas Utility Operations | $ | 3,383 | $ | (12,227 | ) | |
| Nonutility: | ||||||
| Energy Group: | ||||||
| Wholesale Energy Operations | (130 | ) | 1,175 | |||
| Retail Gas and Other Operations | 1,221 | 3,239 | ||||
| Retail Electric Operations | 273 | (1,778 | ) | |||
| Subtotal Energy Group | 1,364 | 2,636 | ||||
| Energy Services: | ||||||
| On-Site Energy Production | 5,918 | 11,282 | ||||
| Appliance Service Operations | (928 | ) | (586 | ) | ||
| Subtotal Energy Services | 4,990 | 10,696 | ||||
| Total Nonutility | 6,354 | 13,332 | ||||
| Corporate & Services and Intercompany Eliminations | 12,506 | 2,180 | ||||
| Total Operations Expense | $ | 22,243 | $ | 3,285 | ||
Gas utility operations expense decreased $12.2 million in 2016 compared with 2015. This decrease was primarily due to lower expenses associated with the New Jersey Clean Energy Program and Energy Efficiency Programs which decreased $4.2 million in 2015, compared with 2014.Programs. Such costs are recovered on a dollar-for-dollar basis; therefore, SJG experiencedexperiences an offsetting decrease in revenuesrevenue during 2015.
The Corporate & Services segment contributed a $12.5 million increase in total operations expense primarily due to costs incurred on the agreement to acquire the assets of additionalElizabethtown Gas and Elkton Gas (see Note 1 to the consolidated financial statements). These include finders fees, consulting and legal charges, among others. This is partially offset by intercompany eliminations.
Nonutility operations expense increased $13.3 million in 2014, as2016 compared with 2015 primarily due to 2013. Changes in the uncollectible reserve are the result of fluctuations in levels of customer accounts receivables balances. Accounts receivable was higheroperating expenses incurred at several entities that became wholly owned by Marina as of December 31, 2014 due to higher customer billing rates, as approved by2015 along with operating expenses at several renewable energy projects that commenced operations over the BPU effective October 1, 2014, in addition to customer growth.
Other Operating Expenses - A summary of changes in maintenanceother consolidated operating expenses (in thousands):
| 2017 vs. 2016 | 2016 vs. 2015 | |||||
| Impairment Charges | $ | 91,299 | $ | — | ||
| Maintenance | $ | 2,178 | $ | 1,366 | ||
| Depreciation | $ | 10,329 | $ | 17,938 | ||
| Energy and Other Taxes | $ | 145 | $ | 316 | ||
Impairment Charges - Marina incurred approximately $91.3 million of non-cash impairment charges during the year, including impairments on solar generating facilities, landfill gas-to-energy (LFGTE) long-lived assets, LFGTE assets customer relationships, and goodwill (see Note 1 to the consolidated financial statements). These impairment charges were recorded in the On-Site Energy Production segment.
Maintenance Expense - Maintenance expense was higher distribution operations expense. Such expenses increased $1.1$2.2 million in 2015,during 2017 compared with 2014,2016 primarily due to increased maintenance of services activity and higher levels of Remediation Adjustment Clause (RAC) amortization. This increase in RAC-related expenses does not affect earnings, as a result ofSJG recognizes an offsetting amount in revenues. Maintenance expense increased $1.4 million during 2016 compared with 2015 primarily due to increased field activity related to the maintenance of services.
Energy and Other Taxes –Changes- The change in Energyenergy and Other Taxesother taxes in 2015,2017 and 2016 compared with 2014, wereprior years was not significant. The decrease in 2014, compared with 2013, was due to the elimination of the Company's primary energy tax, the Transitional Energy Facilities Assessment, effective January 1, 2014. As this tax was passed through to customers, this decrease in expense had no impact on the financial results of the Company.
Other Income and Expense - Other income and expense was $1.7increased $5.5 million lower in 2015,2017 compared to 2014,with 2016 primarily due to poor financial market performancehigher AFUDC due to increased capital spending and a new AIRP II program at SJG, a gain recorded on a sale of real estate during the latter partfirst quarter of 2017, as well as interest income earned from a favorable FERC decision over a tariff rate dispute at SJRG (see Note 15 to the year. Inconsolidated financial statements). These were partially offset by a settlement at Marina during the second quarter of 2016 as discussed in Note 7 to the consolidated financial statements. The change in other income and expense in 2016 compared with 2015 SJG realized a loss of $0.3 million on its available-for-sale securities, compared to a realized gain of $0.9 million in 2014. Also adding to Other Income in 2014 was a higher allowance for equity funds used during construction as the Company made significant investment in new technology systems. As those investments in systems grew from 2013 to 2014, so did the resulting income. However, once placed in service in the latter part of 2014, such income ceased.not significant.
Interest Charges –- Interest charges increased $2.0 million and $5.3$22.6 million in 20152017 compared with 2016 primarily due to the following:
$11.1 million due to higher amounts of long-term debt outstanding at SJI and 2014, respectively,SJG, along with higher interest rates on variable rate debt outstanding at SJI and SJG.
$5.1 million of charges incurred on the Bridge Credit Facility entered into in conjunction with the agreement to acquire Elizabethtown Gas and Elkton Gas (see Note 1 to the consolidated financial statements).
$4.0 million of interest charges incurred from an unfavorable court ruling related to a pricing dispute between SJRG and a supplier (see Note 15 to the consolidated financial statements),
$2.4 million resulting from an amendment of an existing interest rate derivative contract previously linked to unrealized losses recorded in AOCL, which was reclassified to interest expense as a result of rolling in investments of SJG’s accelerated investment programs into rates in each of the prior two year. Capital investments underhedged transactions being deemed probable of not occurring (see Note 16 to the Company’s AIRP and CIRT programs were rolled into base rates effective October 1, 2014 and 2013, respectively. Such program spendconsolidated financial statements).
The change in interest charges in 2016 compared with 2015 was permitted by the BPU to accrue interest on construction, which reduces interest expense, until such time they were rolled into base rates. The Company also placed two major technology systems into service during the fourth quarter of 2014, thereby lowering the capitalization of interest on construction from 2014 to 2015. The increase from 2013 to 2014 was principally related to an incremental $68.0 million of higher-priced, long-term debt outstanding.not significant.
Income Taxes –- Income taxes changed from a $54.2 million expense in 2016 to a $24.9 million benefit in 2017 primarily due to $13.5 million of adjustments made as a result of the Tax Cuts and Jobs Act, which was enacted in 2017 (see Note 4 to the consolidated financial statements), which are excluded from Economic Earnings. Also contributing was an overall loss before income taxes, as opposed to income in 2016, primarily due to several impairment charges taken as discussed under "Impairment Charges" above (also see Note 1 to the consolidated financial statements), along with an unfavorable court ruling related to a pricing dispute between SJRG and a supplier (see Note 15 to the consolidated financial statements). These were partially offset with the impact of recording no investment tax credits on renewable energy facilities in 2017 as opposed to $9.1 million in 2016, which is consistent with SJI's previously announced strategy of substantially reducing solar development. Income tax expense generally fluctuates asincreased $52.8 million in 2016 compared with 2015 primarily due to a higher effective tax rate due to a decrease in the investment tax credits available on renewable energy facilities at Marina, along with higher income before taxes changes. In 2014, SJG benefitedincome taxes. Investment tax credits from renewable energy facilities at Marina of $9.1 million and $38.3 million were recognized for the years ended December 31, 2016 and 2015 , respectively.
Equity in Earnings of Affiliated Companies - The change in equity in earnings of affiliated companies in 2017 compared with 2016 was not significant. Equity in earnings of affiliated companies increased $33.2 million to earnings of $5.4 million in 2016 compared with 2015 primarily due to the impact of a $3.1 million State tax apportionment adjustment that loweredreduction in the Company's effective New Jersey Corporate Business Tax rate.carrying amount of an investment at one of Energenic's operating subsidiaries, which occurred in the second quarter of 2015, along with a settlement at Marina in the third quarter of 2016 (see Note 7 to the consolidated financial statements).
Discontinued Operations - The losses are primarily comprised of environmental remediation and product liability litigation associated with previously disposed of businesses.
LIQUIDITY AND CAPITAL RESOURCES:RESOURCES:
Liquidity needs are driven by factors that include natural gas commodity prices; the impact of weather on customer bills; lags in fully collecting gas costs from customers under the BGSS charge;charge and other regulatory clauses, and environmental remediation expenditures through the Remediation Adjustment Clause (RAC); working capital needs of SJI's energy trading and marketing activities; the timing of construction and remediation expenditures and related permanent financings; the timing of equity contributions to unconsolidated affiliates; mandated tax payment dates; both discretionary and required repayments of long-term debt; and the amounts and timing of dividend payments.
Cash Flows from Operating Activities - Cash generated fromLiquidity needs are first met with net cash provided by operating activities. Net cash provided by operating activities constitutes our primary source of liquiditytotaled $190.3 million, $262.6 million and $186.7 million in 2017, 2016 and 2015, respectively. Net cash provided by operating activities varies from year-to-year primarily due to the impact of weather on customer demand and related gas purchases, customer usage factors related to conservation efforts and the price of the natural gas commodity, inventory utilization, and recoveriesgas cost recoveries. Operating activities in 2017 produced less net cash than 2016, primarily due to under-recoveries in the BGSS clause at SJG. During the second quarter of 2017, SJG provided through our various rate mechanisms. Net cash provided by operating activities was $164.6a customer BGSS bill credit based on a forecasted over-recovered clause balance at the end of the BGSS year. In addition, SJG experienced higher spending for environmental remediation. Finally, during the first quarter of 2017, SJI made a $10.0 million payment to fund its pension plans. SJI did not make a pension payment in 2015, $103.5 million in 2014 and $148.8 million in 2013.2016. SJI strives to keep its pension plans fully funded. When factors such as lesser than expected asset performance and/or declining discount rates negatively impact the funding status of the plans, SJI increases its contributions to supplant that funding shortfall.
Net cash provided by operationsflow from operating activities increased in 2016 compared to 2015 as compared with 2014primarily due to improvements in working capital due to higher customer receivable collections of previously deferredas well as lower gas costs. Collection of those gas costs had been deferred under the BGSS clause in 2014purchases as a result of the extremely coldwarmer weather experienced during the first quarter of 2014. This benefit was offset by2016. In addition, SJI did not make a $12.0pension payment in 2016. In 2015, SJI made a $15.0 million pension contribution made by SJG as a result of a decline in the discount rate and new mortality tables released at the end of 2014, both of which negatively impacted the funding status of theits pension plans. No such contribution was made in 2014. The Company strives to keep its pension plans fully funded. When factors such as lesser than expected asset performance and/or declining discount rates negatively impact the funding status of the plans, the Company increases its contributions to supplantcompensate for that funding shortfall.
Cash Flows from Investing Activities - We haveSJI has a continuing need for cash resources forand capital, purchases, primarily to invest in new and replacement facilities and equipment. Cash usedNet cash outflows from investing activities, which are primarily construction projects, for capital expenditures was $207.82017, 2016 and 2015 amounted to $287.3 million,, $200.0 $280.3 million and $161.5$387.3 million, in 2015, 2014 respectively. We estimate the net cash outflows for investing activities for 2018, 2019 and 2013, respectively, primarily2020 to be approximately $331.4 million, $389.5 million and $325.8 million, respectively. The high level of investing activities for 2018, 2019 and 2020 is due to a combination of the accelerated infrastructure improvements that continueinvestment programs and a major pipeline project to support SJG’s growth. The increased capital expenditures duringan electric generation facility, both at SJG. Also contributing to the past three years were the direct resulthigh level of the Company’s CIRT, AIRP and SHARP programs; the CIRT and AIRP programs beganinvesting activities are potential SJI Midstream investments, net of potential returns, in 2009 and the SHARP program began in 2014. See additional details under “Rates and Regulation.”
The Company made net investments in unconsolidated affiliates of $32.1 million and $7.5 million in 2017 and 2016, respectively.
During 2017, SJI received approximately $3.1 million related to the sale of real estate. SJI recognized an after-tax gain on this sale of approximately $1.7 million.
During 2017, SJI made an incremental $7.5 million payment above the prior year to fund company-owned life insurance.
During 2017, SJI received the remaining balance in connection with an outstanding note receivable with a third party. Cash proceeds received in 2017 were $22.9 million.
Cash Flows from Financing Activities - Short-term borrowings from the commercial paper program and lines of credit from commercial banks to finance capital expenditures as incurred. From time to time, the Company may refinance the short-term debt incurred to support capital expenditures with long-term debt.
Credit facilities and available liquidity as of December 31, 20152017 were as follows (in thousands):
| Total Facility | Usage | Available Liquidity | Expiration Date | ||||||||||
| Commercial Paper/Revolving Credit Facility | $ | 200,000 | $ | 136,600 | (A) | $ | 63,400 | May 2018 | |||||
| Uncommitted Bank Lines | 10,000 | — | 10,000 | August 2016 | |||||||||
| Total | $ | 210,000 | $ | 136,600 | $ | 73,400 | |||||||
| Company | Total Facility | Usage | Available Liquidity | Expiration Date | |||||||||||
| SJI: | |||||||||||||||
Syndicated Revolving Credit Facility | $ | 400,000 | $ | 251,000 | (A) | $ | 149,000 | August 2022 | (C) | ||||||
Revolving Credit Facility | 50,000 | 50,000 | — | September 2019 | (D) | ||||||||||
| Total SJI | 450,000 | 301,000 | 149,000 | ||||||||||||
| SJG: | |||||||||||||||
Commercial Paper Program/Revolving Credit Facility | 200,000 | 52,800 | (B) | 147,200 | August 2022 | (E) | |||||||||
| Uncommitted Bank Line | 10,000 | — | 10,000 | August 2018 | |||||||||||
| Total SJG | 210,000 | 52,800 | 157,200 | ||||||||||||
| Total | $ | 660,000 | $ | 353,800 | $ | 306,200 | |||||||||
(A) Includes letters of credit outstanding in the amount of $2.2$6.6 million.
(C) In August 2017, SJI entered into a five year, unsecured $400.0 million revolving credit agreement which is syndicated among several banks. In connection with this agreement, SJI terminated its previous $400.0 million revolving credit agreement.
(D) In September 2017, SJI amended an unsecured revolving credit facility containsfor two years. The facility now terminates in September 2019.
(E) In August 2017, SJG entered into a five year, unsecured $200.0 million revolving credit agreement which is syndicated among several banks. In connection with this agreement, SJG terminated its previous $200.0 million revolving credit agreement.
The SJG facilities are restricted as to use and availability specifically to SJG; however, if necessary the SJI facilities can also be used to support SJG's liquidity needs. All committed facilities contain one financial covenant limiting the ratio of indebtedness to total capitalization (as defined in the respective credit agreement)agreements), measured on a quarterly basis. SJI and SJG were in compliance with these covenants as of December 31, 2017. Borrowings under these credit facilities are at market rates. SJI's weighted average interest rate on these borrowings, which changes daily, was 2.46%, 1.47% and 1.13% at December 31, 2017, 2016 and 2015, respectively. SJG's weighted average interest rate on these borrowings, which changes daily, was 1.88%, 0.97% and 0.66% at December 31, 2017, 2016 and 2015, respectively.
SJI's average borrowings outstanding under these credit facilities (which includes SJG), not including letters of credit, during the years ended December 31, 2017 and 2016 were $276.7 million and $321.9 million, respectively. The maximum amounts outstanding under these credit facilities (which includes SJG), not including letters of credit, during the years ended December 31, 2017 and 2016 were $373.8 million and $467.7 million respectively.
SJG's average borrowings outstanding under its credit facilities, not including letters of credit, during the years ended December 31, 2017 and 2016 were $17.6 million and $71.5 million, respectively. The maximum amount outstanding under these credit facilities, not including letters of credit, during the years ended December 31, 2017 and 2016 were $110.1 million and $141.7 million, respectively.
Based upon the existing credit facilities and a regular dialogue with our banks, we believe there will continue to be sufficient credit available to meet our business' future liquidity needs.
The SJI and SJG principal credit facilities are provided by a syndicate of banks and contain one financial covenant limiting the ratio of indebtedness to total capitalization (as defined in the respective credit agreements) to not more than 0.70 to 1, measured at the end of each fiscal quarter. However, as of December 31, 2017, several bank facilities for both SJI and SJG, as well as Senior Unsecured Notes issued by SJI, still contained one financial covenant limiting the ratio of indebtedness to total capitalization (as defined in the respective credit agreements) to not more than 0.65 to 1, measured at the end of each fiscal quarter. SJG was in compliance with this covenantAs a result, as of December 31, 2015.2017, both SJI and SJG needed to ensure that the ratio of indebtedness to total capitalization (as defined in the respective credit agreements) did not exceed 0.65 to 1. SJI and SJG were in compliance with these covenants as of December 31, 2017. All of SJI's bank facilities and Senior Unsecured Notes were amended to the new ratio in January 2018.
SJG has a commercial paper program under which SJG may issue short-term, unsecured promissory notes to qualified investors up to a maximum aggregate amount outstanding at any time of $200.0 million. The notes will have fixed maturities which will vary by note, but may not exceed 270 days from the date of issue. Proceeds from the notes will beare used for general corporate purposes. SJG uses the commercial paper program in tandem with itsthe new $200.0 million revolving credit facility and does not expect the principal amount of borrowings outstanding under the commercial paper program and the credit facility at any time to exceed an aggregate of $200.0 million.
In January 2017, SJG entered into a Supplemental Indenture Amending and Restating First Mortgage Indenture (the “New Mortgage”), which amended and restated in its entirety that Indenture of Mortgage dated October 1, 1947. The New Mortgage provides for the issuance by SJG of bonds, notes or other securities that are secured by a lien on substantially all of the operating properties and franchises of SJG.
SJG had a $200.0 million multiple-draw term facility offered by a syndicate of banks. This facility bore interest at a floating rate based on LIBOR plus a spread determined by SJG's credit ratings. The total outstanding amount under thesethis facility as of December 31, 2016 was $200.0 million, which was classified in current portion of long-term debt on the consolidated balance sheets as of December 31, 2016 as it was due in June 2017. In January 2017, SJG issued $200.0 million aggregate principal amount of MTN's, Series E, 2017, due January 2047, with principal repayments beginning in 2025. The MTN's bear interest at an annual rate of 3.0% payable semiannually. Proceeds were used to pay down the above-mentioned $200.0 million multiple-draw term facility which was set to expire in June 2017.
In January 2017, SJG entered into an unsecured, $200.0 million multiple-draw term loan credit facilitiesagreement ("Credit Agreement"), which is syndicated among seven banks. Term loans under the Credit Agreement bear interest at a variable base rate or a variable LIBOR rate, at SJG's election. Under the Credit Agreement, SJG can borrow up to an aggregate of $200.0 million until July 2018, of which SJG borrowed $200.0 million during 2017. All loans under the Credit Agreement become due in January 2019.
In May 2017, Marina voluntarily redeemed bonds issued by the New Jersey Economic Development Authority (NJEDA) in an aggregate principal amount of $61.4 million, as follows: Thermal Energy Facilities Revenue Bonds (Marina Energy LLC - 2001 Project) Series A ($20.0 million); Thermal Energy Facilities Federally Taxable Revenue Bonds (Marina Energy LLC - 2001 Project) Series B ($25.0 million); and Thermal Energy Facilities Revenue Bonds (Marina Energy LLC Project) Series 2006A ($16.4 million). In connection with the redemptions, separate related letter of credit reimbursement agreements were terminated (see Note 15 to the consolidated financial statements).
In June 2017, SJI redeemed at maturity $16.0 million of 2.71% Senior Unsecured Notes.
In July 2017, SJG redeemed at maturity $15.0 million of 4.657% MTNs.
In August 2017, SJI entered into a note purchase agreement that provides for the issuance of an aggregate of $100.0 million of MTNs. Pursuant to the agreement, SJI issued $50.0 million aggregate principal amount of MTNs, consisting of (a) $25.0 million aggregate principal amount of 3.22% Senior Notes, Series 2017A-1, due August 2024, and (b) $25.0 million aggregate principal amount of 3.46% Senior Notes, Series 2017B-1, due August 2027. The agreement also provided for the issuance of (a) $25.0 million aggregate principal amount of 3.32% Senior Notes, Series 2017A-2, due January 2025 and (b) $25.0
million aggregate principal amount of 3.56% Senior Notes, Series 2017B-2, due January 2028, that SJI issued in January 2018 (see Note 19 to the consolidated financial statements).
In October 2017, SJI entered into a 364-day, $2.6 billion syndicated, committed Bridge Facility to finance the acquisition of the assets of Elizabethtown Gas and Elkton Gas (see Note 1 to the consolidated financial statements). In November 2017 and January 2018, as a result of amendments to various outstanding debt agreements, SJI reduced the bridge commitments to $1.7 billion, or the amount of the purchase price for the assets SJI agreed to acquire. SJI incurred $10.4 million of debt issuance costs, which, net of $2.6 million of amortization, are recorded as a reduction to long-term debt on the consolidated balance sheets. The Bridge Facility is also subject to ticking fees every 90 days, and as a result SJI has paid $2.5 million of ticking fees through December 31, 2017.
In January 2018, SJI verbally agreed to issue an aggregate $250.0 million principal amount of Senior Unsecured Notes via a delayed draw private placement. The first tranche of $90.0 million will close and fund by April 2018, at an interest rate of 3.18% and will mature in April 2021. The second tranche and third tranches, totaling $160.0 million, will close and fund prior to the acquisition date but no later than July 2018. The second tranche is for $80.0 million, matures in 2028, and the coupon rate will be 3.78% plus a 2 basis point premium per month after April 2018 until funding. The third tranche is for $80.0 million, matures in 2030, and the coupon rate will be 3.88% plus a 2 basis point premium per month after April 2018 until funding. For the second and third tranches, the coupon rates will be fixed upon closing.
In January 2016, the Company paid $12.7 million to retire outstanding debt of ACB.
In July 2016, SJG retired $15.0 million of 4.66% MTN's at maturity.
In August 2016, SJG retired $10.0 million of 5.437% MTN's at maturity.
In August 2016, the Company paid an aggregate $8.3 million to retire outstanding long-term debt for ACLE, SCLE and SXLE.
SJG makes payments of $0.9 million annually through December 2025 toward the principal amount of 3.63% MTN's, including a payment made in 2017. As such, $0.9 million of the total outstanding amount on this debt is classified in current portion of long-term debt on the consolidated balance sheets as it is due within one year (see Note 14 to the consolidated financial statements).
No other long-term debt was issued or retired during the twelve monthsyears ended December 31, 20152017 or 2016. In May 2016, the Company issued and 2014sold 8,050,000 shares of its common stock, par value $1.25 per share at a public offering, raising net proceeds of approximately $203.6 million. The net proceeds from this offering were $118.1 million and $52.3 million, respectively. The maximum amount outstanding under these credit facilities during the twelve months ended December 31, 2015 and 2014 were $162.3 million and $105.0 million, respectively.or will be used for capital expenditures, primarily for regulated businesses, including infrastructure investments at its utility business.
| 2015 | 2014 | As of December 31, | ||||||||
| Common Equity | 49 | % | 51 | % | ||||||
| 2017 | 2016 | |||||||||
| Equity | 43.7 | % | 49.1 | % | ||||||
| Long-Term Debt | 42 | % | 41 | % | 43.6 | % | 39.6 | % | ||
| Short-Term Debt | 9 | % | 8 | % | 12.7 | % | 11.3 | % | ||
| Total | 100 | % | 100 | % | 100.0 | % | 100.0 | % | ||
For 2017, 2016 and 2015, SJI paid quarterly dividends to its common shareholders. SJI has paid dividends on its common stock for 66 consecutive years and has increased that dividend each year for the last 18 years. The Company currently seeks to grow that dividend consistent with earnings growth while targeting a payout ratio of between 55% and 70% of Economic Earnings. In setting the dividend rate, the Board of Directors of SJI considers future earnings expectations, payout ratio, and dividend yield relative to those at peer companies, as well as returns available on other income-oriented investments. However, there can be no assurance that SJI will be able to continue to increase the dividend, meet the targeted payout ratio or pay a dividend at all in the future.
COMMITMENTS AND CONTINGENCIES:
STANDBY LETTERLETTERS OF CREDIT -— As of December 31, 2017, SJI provided $6.6 million of standby letters of credit through its revolving credit facility to enable SJE to market retail electricity and for various construction and operating activities. SJG provided a $25.2$0.8 million letter of credit under its revolving credit facility to support the remediation of environmental conditions at certain locations in SJG's service territory. SJG has provided $25.1 million of additional letters of credit under a separate facility outside of the revolving credit facility from those it borrows under to provide liquidity support for the remarketing of variable-rate demand bonds issued through the NJEDA. The bonds were usedNJEDA to finance the expansion of SJG’s natural gas distribution system, as discussed insystem. In May 2017, Marina redeemed its variable-rate demand bonds, and the related letters of credit reimbursement agreements, which totaled $62.3 million, were terminated (see Note 714 to the consolidated financial statements. The replacement letter of credit expires in August 2018, and as a result, the related bonds are included in long-term debt.statements).
In 2011, whileaddition, in itsthe normal course of business, SJG and SJRG have entered into long-term contracts for natural gas supplies. SJRG has committed to purchase a minimum of 604,000 dts/d and up to 954,000 dts/d of natural gas, from various suppliers, for terms ranging from three to ten years at index-based prices. SJG has committed to purchase a minimum of 6,250 dts/d and up to 25,000 dts/d of natural gas, from one supplier, for a term of eight years at index-based prices. SJG has also committed to a purchase of a minimum of 55,000 dts/d and up to 70,000 dts/d, for a term of ten years at index-based prices. The obligations for these purchases have not been included in SJI's contractual obligations discussed below because the actual volumes and prices are not fixed.
The following table summarizes our contractual cash obligations and their applicable payment due dates as of December 31, 2017 (in thousands):
| Up to | Years | Years | More than | ||||||||||||
| Contractual Cash Obligations | Total | 1 Year | 2 & 3 | 4 & 5 | 5 Years | ||||||||||
| Principal Payments on Long-Term Debt | $ | 1,204,173 | $ | 63,809 | $ | 526,818 | $ | 93,993 | $ | 519,553 | |||||
| Interest on Long-Term Debt | 283,418 | 38,694 | 55,763 | 45,359 | 143,602 | ||||||||||
| Construction Obligations | 118,162 | 118,162 | — | — | — | ||||||||||
| Operating Leases | 1,472 | 745 | 624 | 103 | — | ||||||||||
| Commodity Supply Purchase Obligations | 1,622,553 | 650,658 | 406,692 | 119,669 | 445,534 | ||||||||||
| Environmental Remediation Costs | 172,855 | 66,372 | 61,022 | 1,537 | 43,924 | ||||||||||
| New Jersey Clean Energy Program | 13,154 | 13,154 | — | — | — | ||||||||||
| Other Purchase Obligations | 2,437 | 2,437 | — | — | — | ||||||||||
| Total Contractual Cash Obligations | $ | 3,418,224 | $ | 954,031 | $ | 1,050,919 | $ | 260,661 | $ | 1,152,613 | |||||
Long-Term Debt in the table above does not include unamortized debt issuance costs of $17.4 million, which are reclassified to Long-Term Debt on the consolidated balance sheets.
Interest on long-term debt in the table above includes the related interest obligations through maturity on all outstanding long-term debt. Expected asset retirement obligations and the liability for unrecognized tax benefits are not included in the table above as the total obligation cannot be calculated due to the subjective nature of these costs and timing of anticipated payments. SJI contributed $10.0 million to the pension plans, of which SJG contributed $8.0 million, in January 2017. SJI did not make contributions to its employee pension plans in 2016. Future pension contributions cannot be determined at this time. SJG's regulatory obligation to contribute $3.6 million annually to its postretirement benefit plans’ trusts, as discussed in Note 12 to the consolidated financial statements, is also not included as its duration is indefinite.
The total potential consideration related to the agreements to acquire the assets of Elizabethtown Gas and Elkton Gas, along with expected future costs to complete the acquisition, are not included in the table above due to pending approvals as discussed earlier in Management's Discussion. Also see Note 1 to the consolidated financial statements.
Off-Balance Sheet Arrangements - An off-balance sheet arrangement is any contractual arrangement involving an unconsolidated entity under which the Company has either made guarantees or has certain other interests or obligations.
As of December 31, 2017, SJI had issued $6.0 million of parental guarantees on behalf of an unconsolidated subsidiary. These guarantees generally expire within the next two years and were issued to enable the subsidiary to market retail natural gas.
During 2011, subsidiaries of Energenic, in which Marina has a 50% equity interest, entered into 20-year contracts to build, own and operate a central energy center and energy distribution system for a new hotel, casino and entertainment complex in Atlantic City, New Jersey. The complex commenced operations in April 2012, and as a result, Energenic subsidiaries began providing full energy services to the complex.
In June 2014, the parent company of the hotel, casino and entertainment complex filed petitions in U. S. Bankruptcy Court to facilitate a sale of substantially all of its assets. The complex ceased normal business operations in September 2014. Energenic subsidiaries continued to provide limited energy services to the complex during the shutdown period under a temporary agreement with the trustee. The hotel, casino and entertainment complex was sold in April 2015. As of December 31, 2015, the Energenic subsidiaries were providing limited services to the complex under a short-term agreement with the new owner. However, the Energenic subsidiaries had not been able to secure a permanent or long-term energy services agreement with the new owner.
In 2015, management of the Company and Energenic evaluated the carrying value of the investment in this project and a related note receivable. Based on the inability of the Energenic subsidiaries to secure a permanent or long-term energy services agreement, the Company recorded a $7.7 million (net of tax) non-cash charge to earnings during the second quarter of 2015 due to the reduction in the carrying value of the investment in this project recorded by Energenic. This charge is included in Equity in Loss of Affiliated Companies for the year ended December 31, 2015 on the statements of consolidated income.
The central energy center and energy distribution system owned by the Energenic subsidiaries was financed in part by the issuance of bonds during 2011. These bonds were collateralized primarily by certain assets of the central energy center and revenue from the energy services agreement with the hotel, casino and entertainment complex. During 2015, due to the cessation of normal business operations of the complex and the inability of the Energenic subsidiaries to meet its obligations under the bonds, the trustee for the bondholders filed suit to foreclose on certain assets of the central energy center. In November 2015 during settlement discussions, the bondholders alleged, among other things, that they were entitled to recover from Energenic itself, any amounts owed under the bonds that were not covered by the collateral, including principal, interest and attorney’s fees. The bondholders’ assertion was based on inconsistent language in the bond documents. In January 2016, Energenic and certain subsidiaries reached a multi-party settlement with the bondholders. This agreement resolves all outstanding litigation and transfers ownership of the bondholders’ collateral to the owners of the entertainment complex. The Company's share of this settlement was $7.5 million, which was accrued by Energenic as of December 31, 2015 and paid in 2016. The Company entered into agreements with its insurance carrier and external legal advisors to recover, net of legal costs, approximately $7.0 million of costs associated with the bondholder settlement discussed above. The Company received $2.1 million in the second quarter of 2016, which is included in Other Income on the statements of consolidated income for the year ended December 31, 2016, and $5.3 million was received in the third quarter of 2016 and is included in Equity in Earnings of Affiliated Companies on the statements of consolidated income for the year ended December 31, 2016, as the loss recorded in the prior year was included in this line item on the statements of consolidated income for the year ended December 31, 2015.
As of December 31, 2017, SJI had approximately $13.6 million included in Notes Receivable - Affiliate on the consolidated balance sheets, due from Energenic, which is secured by its cogeneration assets for energy service projects. This note is subject to a reimbursement agreement that secures reimbursement for SJI, from its joint venture partner, of a proportionate share of any amounts that are not repaid.
Management will continue to monitor the situation surrounding the cogeneration assets and will evaluate the carrying value of the investment and the note receivable as future events occur.
PENDING LITIGATION - SJI and SJG are subject to claims arising in the ordinary course of business and other legal proceedings. SJI has been named in, among other actions, certain gas supply and capacity management contract disputes and certain product liability claims related to our former sand mining subsidiary.
SJI is currently involved in a pricing dispute related to 2 long-term gas supply contracts. On May 8, 2017, a jury from the United States District Court for the District of Colorado returned a verdict in favor of the plaintiff supplier. On July 21, 2017, the court entered final judgment against SJG and SJRG. As a result of this ruling, SJG and SJRG have accrued $20.4 million and $53.6 million, respectively, through December 31, 2017. We believe that the amount to be paid by SJG reflects a gas cost that ultimately will be recovered from SJG’s customers through adjusted rates. As such, this amount was recorded as both an Accounts Payable and a reduction of Regulatory Liabilities on the consolidated balance sheets of both SJI and SJG as of December 31, 2017. The amount associated with SJRG was also recorded as an Accounts Payable on the consolidated balance sheets of SJI as of December 31, 2017, with charges of $49.6 million to Cost of Sales - Nonutility on the consolidated statements of income of SJI for the year ended December 31, 2017. SJI also recorded $4.0 million to Interest Charges on the consolidated statements of income for the year ended December 31, 2017. The plaintiff supplier filed a second related lawsuit against SJG and SJRG in the United States District Court for the District of Colorado on December 21, 2017, alleging that SJG and SJRG have continued to breach the gas supply contracts notwithstanding the judgmentin the prior lawsuit. The plaintiff supplier is seeking recovery of the amounts disputed by SJI since the earlier judgment, and a declaration regarding the price under the disputed contracts going forward until the contracts terminate in October 2019. SJI moved to stay the second lawsuit pending resolution of the post-judgment motions in the first lawsuit and any appeal of that lawsuit. All legal reserves related to this second lawsuit are recorded as part of the accrued amounts disclosed above.
SJI was involved in a dispute in the Court of Common Pleas of Philadelphia related to a three-year capacity management contract with a counterparty. The counterparty claimed that it was owed approximately $13.3 million, plus interest, from SJRG under a sharing credit within the contract. SJI settled with the counterparty for $9.5 million, which amount was recorded to Cost of Sales - Nonutility on SJI's consolidated statements of income for the year ended December 31, 2017. SJI made the payment in September 2017.
SJI was also involved in a tariff rate dispute with a counterparty, whereby SJI contended that the counterparty was overcharging for storage demand charges over a ten-year period. In November 2017, SJI received a favorable decision from the FERC on this matter, which resulted in a total pre-tax income impact of $9.3 million. Of this amount, $7.4 million related to the actual overcharges and was recorded as a decrease to Cost of Sales - Nonutility on the consolidated statements of income for the year ended December 31, 2017. The remaining $1.9 million related to interest income and was recorded in Other Income on the consolidated statements of income for the year ended December 31, 2017. SJI received payment from the counterparty in November 2017.
Liabilities related to claims are accrued when the amount or range of amounts of probable settlement costs or other charges for these claims can be reasonably estimated. For matters other than the disputes that are noted above, SJI has accrued approximately $3.0 million and $3.1 million related to all claims in the aggregate as of December 31, 2017 and 2016, respectively, of which SJG has accrued approximately $0.7 million and $0.6 million as of December 31, 2017 and 2016, respectively. Although SJI and SJG do not presently believe that these matters will have a material adverse effect on its business, given the inherent uncertainties in such situations, SJI and SJG can provide no assurance regarding the outcome of litigation.
SOUTH JERSEY GAS COMPANY
This section of Management’s Discussion focuses on South Jersey Gas Company (SJG) for the reported periods. In many cases, explanations and disclosures for both SJI and SJG are substantially the same or specific disclosures for SJG are included in the Management's Discussion for SJI.
RESULTS OF OPERATIONS:
The results of operations for the gas utility operations at SJG are described in detail above; therefore, this section primarily focuses on statistical information and other information that is not discussed in the results of operations under South Jersey Industries, Inc. Refer to the section entitled “Results of Operations - Gas Utility Operations” for a detailed discussion of the results of operations for SJG.
The following table summarizes the composition of selected gas utility throughput for the years ended December 31, (in thousands, except for degree day data):
| December 31, 2017 | December 31, 2016 | December 31, 2015 | |||||||||||||||
| Utility Throughput - dth: | |||||||||||||||||
| Firm Sales - | |||||||||||||||||
| Residential | 22,107 | 15 | % | 22,126 | 15 | % | 23,852 | 17 | % | ||||||||
| Commercial | 5,294 | 3 | % | 4,956 | 3 | % | 5,980 | 4 | % | ||||||||
| Industrial | 422 | — | 310 | — | 338 | — | |||||||||||
| Cogeneration and Electric Generation | 1,300 | 1 | % | 1,485 | 1 | % | 1,449 | 1 | % | ||||||||
| Firm Transportation - | |||||||||||||||||
| Residential | 1,635 | 1 | % | 1,975 | 1 | % | 2,427 | 2 | % | ||||||||
| Commercial | 6,422 | 4 | % | 6,892 | 5 | % | 6,783 | 5 | % | ||||||||
| Industrial | 10,894 | 7 | % | 11,612 | 8 | % | 11,780 | 9 | % | ||||||||
| Cogeneration and Electric Generation | 6,199 | 4 | % | 7,451 | 5 | % | 5,870 | 4 | % | ||||||||
| Total Firm Throughput | 54,273 | 35 | % | 56,807 | 38 | % | 58,479 | 42 | % | ||||||||
| Interruptible Sales | 3 | — | 2 | — | 20 | — | |||||||||||
| Interruptible Transportation | 1,140 | 1 | % | 1,149 | 1 | % | 1,338 | 1 | % | ||||||||
| Off-System | 25,560 | 17 | % | 16,526 | 11 | % | 14,603 | 11 | % | ||||||||
| Capacity Release | 70,315 | 47 | % | 73,913 | 50 | % | 62,349 | 46 | % | ||||||||
| Total Throughput - Utility | 151,291 | 100 | % | 148,397 | 100 | % | 136,789 | 100 | % | ||||||||
| Number of Customers at Year End: | |||||||||||||||||
| Residential | 358,026 | 93 | % | 352,427 | 93 | % | 348,093 | 93 | % | ||||||||
| Commercial | 25,184 | 7 | % | 24,767 | 7 | % | 24,565 | 7 | % | ||||||||
| Industrial | 423 | — | 431 | — | 442 | — | |||||||||||
| Total Customers | 383,633 | 100 | % | 377,625 | 100 | % | 373,100 | 100 | % | ||||||||
| Annual Degree Days* | 4,272 | 4,292 | 4,402 | ||||||||||||||
*Each day, each degree of average daily temperature below 65 degrees Fahrenheit is counted as one heating degree-day. Annual degree-days is the sum of the daily totals.
Throughput - Gas Utility Operations 2017 vs. 2016 -Total gas throughput increased 2.9 MMdts, or 2.0%, in 2017 compared with 2016 primarily due to increases in Off-System Sales of 9.0 MMdth. The increase in Off-System volume is primarily relatedto additional Off-System contracts that were entered into April through October of 2017. The increase in Off-System volume was partially offset by a 3.6 MMdts decrease in capacity releases during 2017 compared to 2016. Additionally, third-party supplier deliveries also decreased by 2.8 MMdth during 2017 compared to 2016, primarily due to weather that was 0.4% warmer than the previous year.
Throughput - Gas Utility Operations 2016 vs. 2015 - Total gas throughput increased 11.6 MMdts, or 8.5%, from 2015 to 2016, primarily due to increases in capacity release. The increase in capacity release volume is primarily related to specific releases made of Columbia pipeline capacity that did not occur in 2015. An increase in third-party supplier deliveries on the Columbia pipeline to SJG’s system freed up capacity at SJG and allowed for additional capacity release of 11.6 MMdts during 2016 compared to 2015. Off-System Sales (OSS) volume also increased 1.9 MMdts, or 13.2%, during 2016 compared to 2015, primarily due to increased opportunity to supply natural gas to gas-fired power generation facilities during the summer months of 2016. These increases were partially offset by a 1.7 MMdts, or 2.9%, decrease in firm throughput, primarily due to weather that was 3% warmer than the previous year.
Operating Revenues & Utility Margin - See SJI's Management Discussion section above.
Operating Expenses - A summary of changes in other operating expenses (in thousands):
| 2017 vs. 2016 | 2016 vs. 2015 | ||||
| Operations | 3,383 | $ | (12,227 | ) | |
| Maintenance | 2,178 | $ | 1,366 | ||
| Depreciation | 6,455 | $ | 6,067 | ||
| Energy and Other Taxes | 109 | $ | (411 | ) | |
Operations - See SJI's Management Discussion section above.
Maintenance- See SJI's Management Discussion section above.
Depreciation - Depreciation expense increased $6.5 million and $6.1 million in 2017 and 2016, respectively, compared with the prior year primarily due to continuing investment in utility plant. The increased spending in recent years is a direct result of New Jersey's infrastructure improvement efforts, which included the approval of SJG’s AIRP and SHARP, in addition to significant investment in new technology systems.
Energy and Other Taxes - The change in energy and other taxes in 2017 and 2016 compared with prior years was not significant.
Other Income and Expense - Other Income and Expense increased $2.6 million in 2017 compared with 2016, primarily due to higher AFUDC due to increased capital spending and a new AIRP II program. Changes in Other Income and Expense during 2016 compared with 2015 were not significant.
Interest Charges– Interest charges increased $6.8 million in 2017 compared with 2016, primarily due to higher amounts of long-term debt outstanding (see Note 14 to the consolidated financial statements). Interest charges decreased $2.0 million in 2016 compared with 2015 primarily due to higher capitalization of interest costs on construction during 2016. This was a result of accumulating capital investments under the AIRP. AIRP investments are approved by the BPU to accrue interest on construction until such time they are rolled into base rates. This is partially offset by interest on $61.0 million of long-term debt issued in January 2016.
Income Taxes– Income tax expense generally fluctuates as income before taxes changes. Minor variations will occur period to period as a result of effective tax rate adjustments.
LIQUIDITY AND CAPITAL RESOURCES:
Liquidity and capital resources for SJG are substantially covered in the Management’s Discussion of SJI (except for the items and transactions that relate to SJI and its nonutility subsidiaries). Those explanations are incorporated by reference into this discussion.
Liquidity needs for SJG are driven by factors that include natural gas commodity prices; the impact of weather on customer bills; lags in fully collecting gas costs from customers under the BGSS charge and environmental remediation expenditures through the RAC; the timing of construction and remediation expenditures and related permanent financings; mandated tax payment dates; both discretionary and required repayments of long-term debt; and the amounts and timing of dividend payments.
Cash Flows from Operating Activities - Liquidity needs are first met with net cash provided by operating activities. Net cash provided by operating activities totaled $106.7 million, $142.2 million and $164.6 million for the years ended 2017, 2016 and 2015, respectively. Net cash provided by operating activities varies from year-to-year primarily due to the impact of weather on customer demand and related gas purchases, customer usage factors related to conversion efforts and the price of the natural gas commodity, inventory utilization, and gas cost recoveries. Operating activities for 2017 produced less net cash than the same period in 2016, primarily due to under-recoveries in the BGSS clause at SJG. During the second quarter of 2017, SJG provided a customer BGSS bill credit based on a forecasted over-recovered clause balance at the end of the BGSS year. In addition, SJG experienced higher spending for environmental remediation. Finally, during the first quarter of 2017, SJG made an $8.0 million payment to fund its pension plans. SJG did not make a contribution to its pension plans in 2016.
Cash Flows from Investing Activities - SJG has a continuing need for cash resources for capital expenditures, primarily to invest in new and replacement facilities and equipment. SJG estimates the net cash outflows for capital expenditures for fiscal years 2018, 2019 and 2020 to be approximately $276.8 million, $262.9 million and $363.9 million, respectively. For capital expenditures, including those under the AIRP and SHARP, SJG expects to use short-term borrowings under both its commercial paper program and lines of credit from commercial banks to finance capital expenditures as incurred. From time to time, SJG may refinance the short-term debt incurred to support capital expenditures with long-term debt.
During 2017, SJG made a $4.9 million payment to fund company-owned life insurance.
Cash Flows from Financing Activities - SJG supplements its operating cash flow and credit lines with both debt and equity capital. Over the years, SJG has used long-term debt, primarily in the form of First Mortgage Bonds and MTN's, secured by the same pool of utility assets, to finance its long-term borrowing needs. These needs are primarily capital expenditures for property, plant and equipment.
SJI contributed equity infusions of $40.0 million and $65.0 million to SJG during the years ended December 31, 2017 and 2016, respectively. In December 2017, SJG declared and paid cash dividends of $20.0 million to SJI.
SJG’s capital structure was as follows:
| As of December 31, | |||||
| 2017 | 2016 | ||||
| Common Equity | 51.3% | 53.0 | % | ||
| Long-Term Debt | 45.8% | 40.4 | % | ||
| Short-Term Debt | 2.9% | 6.6 | % | ||
| Total | 100.0% | 100.0 | % | ||
COMMITMENTS AND CONTINGENCIES:
Costs for remediation projects, net of recoveries from ratepayers, for 2017, 2016 and 2015 amounted to net cash outflows of $39.9 million, $39.7 million and $22.1 million, respectively. Total net cash outflows for remediation projects are expected to be $57.2 million, $48.2 million and $12.5 million for 2018, 2019 and 2020, respectively. Environmental remediation costs are subject to recovery from ratepayers.
SJG has certain commitments for both pipeline capacity and gas supply for which SJG pays fees regardless of usage. Those commitments, as of December 31, 2017, averaged $71.8 million annually and totaled $461.8 million over the contracts’ lives. Approximately 21% of the financial commitments under these contracts expire during the next five years. SJG expects to renew each of these contracts under renewal provisions as provided in each contract. SJG recovers all such prudently incurred fees through rates via the BGSS.
SJG has long-term contracts for natural gas supplies. SJG committed to purchase a minimum of 6,250 dts/d and up to 25,000 dts/d of natural gas, from one supplier, for an original term of eight years at index-based prices. SJG has also committed to a purchase of a minimum of 55,000 dts/d and up to 70,000 dts/d, for a term of ten years at index-based prices. The obligationobligations for this purchase hasthese purchases have not been included in the Company'sSJG's contractual obligations discussedtable below because the actual volumes and prices are not fixed.
The following table summarizes ourSJG's contractual cash obligations and their applicable payment due dates as of December 31, 20152017 (in thousands):
| Contractual Cash Obligations | Total | Up to 1 Year | Years 2 & 3 | Years 4 & 5 | More than 5 Years | Total | Up to 1 Year | Years 2 & 3 | Years 4 & 5 | More than 5 Years | ||||||||||||||||||||||||||||
| Principal Payments on Long-Term Debt | $ | 611,991 | $ | 27,909 | $ | 193,818 | $ | 36,818 | $ | 353,446 | $ | 829,173 | $ | 63,809 | $ | 236,818 | $ | 58,993 | $ | 469,553 | ||||||||||||||||||
| Interest on Long-Term Debt | 201,805 | 22,296 | 38,954 | 31,429 | 109,126 | 250,187 | 28,063 | 43,698 | 40,202 | 138,224 | ||||||||||||||||||||||||||||
| Commodity Supply Purchase Obligations | 371,692 | 79,230 | 107,066 | 44,182 | 141,214 | 494,395 | 94,406 | 118,828 | 59,773 | 221,388 | ||||||||||||||||||||||||||||
| Environmental Remediation Costs | 123,194 | 48,323 | 40,744 | 8,469 | 25,658 | 171,696 | 66,040 | 60,697 | 1,386 | 43,573 | ||||||||||||||||||||||||||||
| Construction Obligations | 32,175 | 32,175 | — | — | — | 112,275 | 112,275 | — | — | — | ||||||||||||||||||||||||||||
| Operating Leases | 340 | 153 | 136 | 51 | — | 269 | 180 | 89 | — | — | ||||||||||||||||||||||||||||
| New Jersey Clean Energy Program | 12,410 | 12,410 | — | — | — | 13,154 | 13,154 | — | — | — | ||||||||||||||||||||||||||||
| Other Purchase Obligations | 1,070 | 1,070 | — | — | — | 2,437 | 2,437 | — | — | — | ||||||||||||||||||||||||||||
| Total Contractual Cash Obligations | $ | 1,354,677 | $ | 223,566 | $ | 380,718 | $ | 120,949 | $ | 629,444 | $ | 1,873,586 | $ | 380,364 | $ | 460,130 | $ | 160,354 | $ | 872,738 | ||||||||||||||||||
Long-Term Debt in the table above does not include unamortized debt issuance costs of $7.3 million, which are reclassified to Long-Term Debt on the balance sheets.
Expected asset retirement obligations and the liability for unrecognized tax benefits are not included in the table above as the total obligation cannot be calculated due to the subjective nature of these costs and timing of anticipated payments. SJG made contributions to its employee pension plans totaling $12.0 and $9.1$8.0 million in January 2015 and 2013, respectively.2017; SJG did not make a pension plan contribution in 2016. Future pension contributions cannot be determined at this time. OurSJG's regulatory obligation to contribute $3.6 million annually to ourits postretirement benefit plans’ trusts, as discussed in Note 1112 to the consolidated financial statements, is also not included as its duration is indefinite.
Pending Litigation - See SJG's disclosure in the Commitments and Contingencies section of SJI's Management Discussion above.
Off-Balance Sheet Arrangements- We have SJG has no off-balance sheet financing arrangements.
Item 7a.7A. Quantitative and Qualitative Disclosures about Market Risks
Commodity Market Risks - WeCertain regulated and nonregulated SJI subsidiaries are involved in buying, selling, transporting and storing natural gas, and buying and selling retail electricity and SREC's, for their own accounts as well as managing these activities for third parties. These subsidiaries are subject to market risk due to price fluctuations. To hedge against this risk, we enterSJI enters into a variety of physical and financial transactions including forward contracts, swaps, futures and options agreements. To manage these transactions, we haveSJI has a well-defined risk management policy approved by ourSJI's Board of Directors that includes volumetric and monetary limits. Management reviews reports detailing activity daily. Generally, the derivative activities described above are entered into for risk management purposes.
The majorityretail gas operations of ourSJE transact commodities on a physical basis, and SJE typically does not enter into financial derivative positions directly. SJRG manages risk in the natural gas markets for SJE as well as for its own portfolio by entering into the types of transactions noted above. The retail electric operations of SJE use forward physical and financial contracts to mitigate commodity price risk on fixed price electric contracts. It is management's policy, to the extent practical, within predetermined risk management policy guidelines, to have limited unmatched positions on a deal or portfolio basis while conducting these activities. As a result of holding open positions to a minimal level, the economic impact of changes in value of a particular transaction is substantially offset by an opposite change in the related hedge transaction.
SJI has entered into certain contracts to buy, sell, and transport natural gas and to buy and sell retail electricity. SJI recorded the net pre-tax (loss) gain on these contracts of $(13.7) million, $26.9 million and $8.4 million in earnings during 2017, 2016 and 2015, respectively, which are typically less than twelve-months long.included with realized gains and losses in Operating Revenues - Nonutility on the consolidated statements of income.
The fair value and maturity of these energy trading and hedgingenergy-trading contracts determined usingunder the mark-to-market accountingmethod as of December 31, 20152017 is as follows (in thousands):
| Assets | ||||||||||||
| Source of Fair Value | Maturity < 1 Year | Maturity 1 - 3 Years | Total | |||||||||
| Prices Actively Quoted (NYMEX) | $ | 335 | $ | 64 | $ | 399 | ||||||
| Prices Provided by Other External Sources (Basis) | 143 | 143 | ||||||||||
| Prices based on internal models or other valuable methods | 599 | — | 599 | |||||||||
| Total | $ | 1,077 | $ | 64 | $ | 1,141 | ||||||
| Liabilities | ||||||||||||||||||||||||
| Assets | ||||||||||||||||||||||||
| Source of Fair Value | Maturity < 1 Year | Maturity 1 - 3 Years | Maturity Beyond 3 Years | Total | ||||||||||||||||||||
| Maturity | Maturity | |||||||||||||||||||||||
| Source of Fair Value | < 1 Year | 1 - 3 Years | Total | |||||||||||||||||||||
| Prices Actively Quoted (NYMEX) | $ | 5,073 | $ | 351 | $ | 5,424 | ||||||||||||||||||
| Prices based on internal models or other valuable methods | 416 | — | 416 | |||||||||||||||||||||
| Prices actively quoted | $ | 5,022 | $ | 131 | $ | 2 | $ | 5,155 | ||||||||||||||||
| Prices provided by other external sources | 20,695 | 1,170 | 4 | 21,869 | ||||||||||||||||||||
| Prices based on internal models or other valuation methods | 16,422 | 4,601 | 80 | 21,103 | ||||||||||||||||||||
| Total | $ | 5,489 | $ | 351 | $ | 5,840 | $ | 42,139 | $ | 5,902 | $ | 86 | $ | 48,127 | ||||||||||
| Liabilities | ||||||||||||||||||||||||
| Source of Fair Value | Maturity < 1 Year | Maturity 1 - 3 Years | Maturity Beyond 3 Years | Total | ||||||||||||||||||||
| Prices actively quoted | $ | 9,530 | $ | 1,139 | $ | 18 | $ | 10,687 | ||||||||||||||||
| Prices provided by other external sources | 22,454 | 1,827 | 2 | 24,283 | ||||||||||||||||||||
| Prices based on internal models or other valuation methods | 14,954 | 2,852 | 187 | 17,993 | ||||||||||||||||||||
| Total | $ | 46,938 | $ | 5,818 | $ | 207 | $ | 52,963 | ||||||||||||||||
•NYMEX (New York Mercantile Exchange) is the primary national commodities exchange on which natural gas is traded. Volumes of our NYMEX contracts included in the table above under "Prices actively quoted" are 27.2 MMdts with a weighted average settlement price of $3.02 per dt.
•Basis represents the differential to the NYMEX natural gas futures contract for delivering gas to a specific location. Volumes of our basis contracts, along with volumes of our discounted index related purchase and sales contracts, included in the table above under "Prices provided by other external sources" and "Prices based on internal models or other valuation methods" are 47.4 MMdts with a weighted average settlement price of $(0.50) per dt.
•Fixed Price Gas Daily represents the price of a NYMEX natural gas futures contract adjusted for the difference in price for delivering the gas at another location. Contracted volumesVolumes of our NYMEXFixed Price Gas Daily contracts included in the table above under "Prices provided by other external sources" are 8.3 MMdt with a weighted-average settlement price of $3.10 per dt. Contracted volumes of our Basis contracts are 1.4 MMdt28.7 MMdts with a weighted average settlement price of $(0.10)$3.22 per dt.
•Volumes of electric included in the table above under "Prices based on internal models or other valuation methods" are 0.5 MMWh with a weighted average settlement price of $33.46 per MWh.
A reconciliation of ourSJI's estimated net fair value of energy-related derivatives follows (in thousands):
| Net Derivatives — Energy Related Liability, January 1, 2015 | $ | (5,552 | ) |
| Contracts Settled During the Twelve Months ended December 31, 2015, Net | 4,254 | ||
| Other Changes in Fair Value from Continuing and New Contracts, Net | (3,401 | ) | |
| Net Derivatives — Energy Related Liability, December 31, 2015 | $ | (4,699 | ) |
| Net Derivatives - Energy Related Assets, January 1, 2017 | $ | 16,271 | |
| Contracts Settled During 2017, Net | (12,243 | ) | |
| Other Changes in Fair Value from Continuing and New Contracts, Net | (8,864 | ) | |
| Net Derivatives - Energy Related Liabilities, December 31, 2017 | $ | (4,836 | ) |
Marina’s solar energy projects rely on returns from electricity and SRECs. A decrease in the value of electricity and SRECs impacted by market conditions and/or legislative changes may negatively impact Marina's return on its investments as well as lead to impairment of the respective assets. To hedge against this risk, Marina hedges a portion of its anticipated SREC production through the use of forward sales contracts. The changehedged percentage of projected SREC production related to in-service assets in our derivative position from a $5.6 million liability atNew Jersey is 93% and 68% for energy years ending May 31, 2018 and 2019, respectively, and in Massachusetts is 54% for energy year ending December 31, 20142018. SREC production related to in-service assets in Maryland and Vermont is currently unhedged. During 2017, SJI recorded impairment charges of $71.3 million on solar generating facilities, $43.9 million on those located in the state of Maryland, which was primarily driven as a $4.7 million liability atresult of declining market conditions, specifically market prices of Maryland SRECs. As of December 31, 2015 is primarily due to the settlement2017, Marina had total net solar assets of contracts partially offset by the change$433.7 million, of which $364.3 million are located in fair value of our financial positions.New Jersey, $42.8 million are located in Massachusetts, $10.1 million are located in Maryland, and $16.5 million are located in Vermont.
Interest Rate Risk- Our exposure to interest rateinterest-rate risk relates primarily to short-term and long-term variable-rate borrowings. Variable-rate debt outstanding, including short-term and long-term debt, at December 31, 2015,2017 was $273.4$646.4 million and averaged $203.4$367.9 million during 2015.2017. A hypothetical 100 basis point (1%) increase in interest rates on our average variable-rate debt outstanding would result in a $1.2$2.2 million increase in our annual interest expense, net of tax. The 100 basis point increase was chosen for illustrative purposes, as it provides a simple basis for calculating the impact of interest rate changes under a variety of interest rate scenarios. Over the past five years, the change in basis points (b.p.) of our average monthly interest rates from the beginning to end of each year was as follows: 2017 - 82 b.p. increase; 2016 - 47 b.p. increase; 2015 - 2014 b.p. increase; 2014 - 32 b.p. increase; 2013 - 14 b.p. decrease; 2012 - 1 b.p. decrease; and 20112013 - 1416 b.p. decrease. As ofAt December 31, 2015,2017, our average interest rate on variable-rate debt was 0.89%2.49%.
We typically issue long-term debt either at fixed rates or use interest rate derivatives to limit our exposure to changes in interest rates on variable-rate, long-term debt. As of December 31, 2015,2017, the interest costs on all but $139.0$904.2 million of our long-term debt was either at a fixed rate or hedged via an interest rate derivative.
As of December 31, 2017, SJI's active interest rate swaps were as follows:
| Notional Amount | Fixed Interest Rate | Start Date | Maturity | Obligor | ||||||
| $ | 20,000,000 | 3.049% | 3/15/2017 | 3/15/2027 | SJI | |||||
| $ | 20,000,000 | 3.049% | 3/15/2017 | 3/15/2027 | SJI | |||||
| $ | 10,000,000 | 3.049% | 3/15/2017 | 3/15/2027 | SJI | |||||
| $ | 12,500,000 | 3.530% | 12/1/2006 | 2/1/2036 | SJG | |||||
| $ | 12,500,000 | 3.430% | 12/1/2006 | 2/1/2036 | SJG | |||||
Credit Risk - As of December 31, 2017, SJI had approximately $6.5 million, or 13.5%, of the current and noncurrent Derivatives – Energy Related Assets transacted with one counterparty. This counterparty is investment-grade rated with a rating of BBB+.
As of December 31, 2017, SJRG had $69.2 million of Accounts Receivable under sales contracts. Of that total, 50.8% were with regulated utilities or companies rated investment-grade or guaranteed by an investment-grade-rated parent or were with companies where we have a collateral arrangement or insurance coverage. The remainder of the Accounts Receivable were within approved credit limits.
South Jersey Gas Company:
The fair value and maturity of SJG's energy-trading and hedging contracts determined under the mark-to-market method as of December 31, 2017 is as follows (in thousands):
| Assets | ||||||||||||
| Source of Fair Value | Maturity < 1 Year | Maturity 1 - 3 Years | Maturity Beyond 3 Years | Total | ||||||||
| Prices actively quoted | $ | 203 | $ | 5 | $ | — | $ | 208 | ||||
| Prices provided by other external sources | 230 | — | — | 230 | ||||||||
| Prices based on internal models or other valuation methods | 6,894 | — | 6,894 | |||||||||
| Total | $ | 7,327 | $ | 5 | $ | — | $ | 7,332 | ||||
| Liabilities | ||||||||||||
| Source of Fair Value | Maturity < 1 Year | Maturity 1 - 3 Years | Maturity Beyond 3 Years | Total | ||||||||
| Prices actively quoted | $ | 1,580 | $ | 170 | $ | — | $ | 1,750 | ||||
| Prices provided by other external sources | 2,848 | — | — | 2,848 | ||||||||
| Prices based on internal models or other valuation methods | 4,842 | — | 4,842 | |||||||||
| Total | $ | 9,270 | $ | 170 | $ | — | $ | 9,440 | ||||
Contracted volumes of SJG's NYMEX contracts are 9.0 MMdts with a weighted-average settlement price of $2.98 per dt. Contracted volumes of SJG's Basis contracts are 0.3 MMdts with a weighted-average settlement price of $0.63 per dt.
A reconciliation of SJG's estimated net fair value of energy-related derivatives follows (in thousands):
| Net Derivatives - Energy Related Assets, January 1, 2017 | $ | 4,435 | |
| Contracts Settled During 2017, Net | (4,062 | ) | |
| Other Changes in Fair Value from Continuing and New Contracts, Net | (2,481 | ) | |
| Net Derivatives - Energy Related Liabilities, December 31, 2017 | $ | (2,108 | ) |
Interest Rate Risk - SJG's exposure to interest rate risk relates primarily to variable-rate borrowings. Variable-rate debt, including both short-term and long-term debt outstanding at December 31, 2017, was $252.0 million and averaged $151.6 million during 2017. A hypothetical 100 basis point (1%) increase in interest rates on SJG's average variable-rate debt outstanding would result in a $0.9 million increase in SJG's annual interest expense, net of tax. The 100 basis point increase was chosen for illustrative purposes, as it provides a simple basis for calculating the impact of interest rate changes under a variety of interest rate scenarios. Over the past five years, the change in basis points (b.p.) of SJG's average monthly interest rates from the beginning to end of each year was as follows: 2017 - 91 b.p. increase; 2016 - 19 b.p. increase; 2015 - 20 b.p. increase; 2014 - 32 b.p. increase; and 2013 - 14 b.p. decrease. As of December 31, 2017, SJG's average interest rate on variable-rate debt was 2.28%.
SJG typically issues long-term debt either at fixed rates or uses interest rate derivatives to limit exposure to changes in interest rates on variable-rate, long-term debt. As of December 31, 2017, the interest costs on $629.2 million of long-term debt was either at a fixed-rate or hedged via an interest rate derivative. Consequently, interest expense on existing long-term debt is not significantly impacted by changes in market interest rates.
Item 8. Financial Statements and Supplementary Data
Statements of Consolidated Income
(In Thousands Except for Per Share Data)
| South Jersey Industries, Inc. and Subsidiaries | |||||||||||
| Year Ended December 31, | |||||||||||
| 2017 | 2016 | 2015 | |||||||||
| Operating Revenues: | |||||||||||
| Utility | $ | 512,482 | $ | 453,819 | $ | 528,763 | |||||
| Nonutility | 730,586 | 582,681 | 430,805 | ||||||||
| Total Operating Revenues | 1,243,068 | 1,036,500 | 959,568 | ||||||||
| Operating Expenses: | |||||||||||
| Cost of Sales - (Excluding depreciation) | |||||||||||
| - Utility | 199,660 | 167,154 | 239,763 | ||||||||
| - Nonutility | 646,567 | 413,833 | 319,579 | ||||||||
| Operations | 174,200 | 151,957 | 148,672 | ||||||||
| Impairment Charges | 91,299 | — | — | ||||||||
| Maintenance | 19,727 | 17,549 | 16,183 | ||||||||
| Depreciation | 100,718 | 90,389 | 72,451 | ||||||||
| Energy and Other Taxes | 6,487 | 6,342 | 6,026 | ||||||||
| Total Operating Expenses | 1,238,658 | 847,224 | 802,674 | ||||||||
| Operating Income | 4,410 | 189,276 | 156,894 | ||||||||
| Other Income and Expense | 15,474 | 9,989 | 9,510 | ||||||||
| Interest Charges | (54,019 | ) | (31,449 | ) | (31,622 | ) | |||||
| (Loss) Income Before Income Taxes | (34,135 | ) | 167,816 | 134,782 | |||||||
| Income Taxes | 24,937 | (54,151 | ) | (1,360 | ) | ||||||
| Equity in Earnings (Losses) of Affiliated Companies | 5,794 | 5,396 | (27,812 | ) | |||||||
| (Loss) Income from Continuing Operations | (3,404 | ) | 119,061 | 105,610 | |||||||
| Loss from Discontinued Operations - (Net of tax benefit) | (86 | ) | (251 | ) | (503 | ) | |||||
| Net (Loss) Income | $ | (3,490 | ) | $ | 118,810 | $ | 105,107 | ||||
| Basic (Loss) Earnings per Common Share: | |||||||||||
| Continuing Operations | $ | (0.04 | ) | $ | 1.56 | $ | 1.54 | ||||
| Discontinued Operations | — | — | (0.01 | ) | |||||||
| Basic (Loss) Earnings per Common Share | $ | (0.04 | ) | $ | 1.56 | $ | 1.53 | ||||
| Average Shares of Common Stock Outstanding - Basic | 79,541 | 76,362 | 68,735 | ||||||||
| Diluted (Loss) Earnings per Common Share: | |||||||||||
| Continuing Operations | $ | (0.04 | ) | $ | 1.56 | $ | 1.53 | ||||
| Discontinued Operations | — | — | (0.01 | ) | |||||||
| Diluted (Loss) Earnings per Common Share | $ | (0.04 | ) | $ | 1.56 | $ | 1.52 | ||||
| Average Shares of Common Stock Outstanding - Diluted | 79,541 | 76,475 | 68,931 | ||||||||
Statements of Consolidated Comprehensive Income
(In Thousands)
| South Jersey Industries, Inc. and Subsidiaries | |||||||||||
| Year Ended December 31, | |||||||||||
| 2017 | 2016 | 2015 | |||||||||
| Net (Loss) Income | $ | (3,490 | ) | $ | 118,810 | $ | 105,107 | ||||
| Other Comprehensive Income (Loss), Net of Tax: | |||||||||||
| Postretirement Liability Adjustment (A) | (10,920 | ) | (3,197 | ) | 5,518 | ||||||
| Unrealized Gain (Loss) on Available-for-Sale Securities (B) | — | 118 | (53 | ) | |||||||
| Unrealized Gain on Derivatives - Other (B) | 1,536 | 197 | 321 | ||||||||
| Other Comprehensive Loss of Affiliated Companies (B) | — | — | (27 | ) | |||||||
| Other Comprehensive (Loss) Income - Net of Tax | (9,384 | ) | (2,882 | ) | 5,759 | ||||||
| Comprehensive (Loss) Income | $ | (12,874 | ) | $ | 115,928 | $ | 110,866 | ||||
(A) Determined using a combined average statutory tax rate of Directors27% for 2017 and Stockholder40% for 2016 and 2015.
(B) Determined using a combined average statutory tax rate of
Statements of Consolidated Cash Flows (In Thousands)
| South Jersey Industries, Inc. and Subsidiaries | |||||||||||
| Year Ended December 31, | |||||||||||
| 2017 | 2016 | 2015 | |||||||||
| Cash Flows from Operating Activities: | |||||||||||
| Net (Loss) Income | $ | (3,490 | ) | $ | 118,810 | $ | 105,107 | ||||
| Loss from Discontinued Operations | 86 | 251 | 503 | ||||||||
| (Loss) Income from Continuing Operations | (3,404 | ) | 119,061 | 105,610 | |||||||
| Adjustments to Reconcile Income from Continuing Operations to Net Cash Provided by Operating Activities: | |||||||||||
| Gain on Sale of Assets | (2,563 | ) | — | — | |||||||
| Impairment Charges | 91,299 | — | — | ||||||||
| Loss on Extinguishment of Debt | 543 | — | — | ||||||||
| Depreciation and Amortization | 123,486 | 109,818 | 91,042 | ||||||||
| Net Unrealized Loss (Gain) on Derivatives - Energy Related | 13,667 | (26,935 | ) | (8,401 | ) | ||||||
| Unrealized Loss (Gain) on Derivatives - Other | 677 | (647 | ) | (96 | ) | ||||||
| Provision for Losses on Accounts Receivable | 6,949 | 6,907 | 14,730 | ||||||||
| CIP Receivable/Payable | 915 | (24,943 | ) | (7,324 | ) | ||||||
| Deferred Gas Costs - Net of Recoveries | (28,092 | ) | 11,753 | 28,648 | |||||||
| Deferred SBC Costs - Net of Recoveries | (5,578 | ) | (7,102 | ) | 9,557 | ||||||
| Stock-Based Compensation Expense | 4,254 | 3,892 | 2,213 | ||||||||
| Deferred and Noncurrent Income Taxes - Net | 10,082 | 55,789 | 3,861 | ||||||||
| Environmental Remediation Costs - Net of Recoveries | (39,860 | ) | (39,731 | ) | (22,057 | ) | |||||
| Gas Plant Cost of Removal | (7,062 | ) | (6,070 | ) | (5,096 | ) | |||||
| Pension Contribution | (10,000 | ) | — | (15,000 | ) | ||||||
| Changes in: | |||||||||||
| Accounts Receivable | 21 | (67,160 | ) | 92,624 | |||||||
| Inventories | 5,589 | 387 | 9,226 | ||||||||
| Prepaid and Accrued Taxes - Net | (23,366 | ) | 4,253 | (9,091 | ) | ||||||
| Accounts Payable and Other Accrued Liabilities | 58,858 | 112,199 | (103,410 | ) | |||||||
| Derivatives - Energy Related | 899 | 6,723 | (8,069 | ) | |||||||
| Other Assets and Liabilities (See Note 1) | (6,989 | ) | 4,477 | 8,796 | |||||||
| Cash Flows from Discontinued Operations | (4 | ) | (44 | ) | (1,033 | ) | |||||
| Net Cash Provided by Operating Activities | 190,321 | 262,627 | 186,730 | ||||||||
| Cash Flows from Investing Activities: | |||||||||||
| Capital Expenditures (See Note 1) | (272,965 | ) | (279,423 | ) | (343,883 | ) | |||||
| Purchase of Available for Sale Securities | — | — | (6,059 | ) | |||||||
| Proceeds from Sale of Property, Plant and Equipment | 3,547 | — | — | ||||||||
| Investment in Long-Term Receivables | (9,324 | ) | (10,886 | ) | (19,033 | ) | |||||
| Proceeds from Long-Term Receivables | 9,861 | 10,014 | 8,769 | ||||||||
| Notes Receivable | 22,884 | 9,916 | (9,916 | ) | |||||||
| Purchase of Company-Owned Life Insurance | (9,180 | ) | (2,398 | ) | (2,328 | ) | |||||
| Acquisition of Subsidiary, Net of Cash & Restricted Cash Acquired (See Note 1) | — | — | 3,133 | ||||||||
| Investment in Affiliate | (29,636 | ) | (12,943 | ) | (20,229 | ) | |||||
| Return of Investment in Affiliate | — | 4,750 | — | ||||||||
| Advances on Notes Receivable - Affiliate | (2,451 | ) | — | (2,075 | ) | ||||||
| Net Repayment of Notes Receivable - Affiliate | — | 672 | 4,276 | ||||||||
| Net Cash Used in Investing Activities (See Note 1) | (287,264 | ) | (280,298 | ) | (387,345 | ) | |||||
| Cash Flows from Financing Activities: | |||||||||||
| Net Borrowings from (Repayments of) Short-Term Credit Facilities | 50,300 | (135,600 | ) | 186,000 | |||||||
| Proceeds from Issuance of Long-Term Debt | 450,000 | 61,000 | 130,000 | ||||||||
| Payments for Issuance of Long-Term Debt | (14,204 | ) | (147 | ) | (64 | ) | |||||
| Principal Repayments of Long-Term Debt | (293,309 | ) | (49,366 | ) | (125,009 | ) | |||||
| Dividends on Common Stock | (87,308 | ) | (82,380 | ) | (70,158 | ) | |||||
| Net Settlement of Restricted Stock (See Note 1) | (751 | ) | (387 | ) | (333 | ) | |||||
| Proceeds from Sale of Common Stock | — | 214,426 | 63,192 | ||||||||
| Payment of Lease Obligation | — | (10,600 | ) | — | |||||||
| Net Cash Provided by (Used in) Financing Activities | 104,728 | (3,054 | ) | 183,628 | |||||||
| Net Increase (Decrease) in Cash, Cash Equivalents and Restricted Cash | 7,785 | (20,725 | ) | (16,987 | ) | ||||||
| Cash, Cash Equivalents and Restricted Cash at Beginning of Year (See Note 1) | 31,910 | 52,635 | 69,622 | ||||||||
| Cash, Cash Equivalents and Restricted Cash at End of Year (See Note 1) | $ | 39,695 | $ | 31,910 | $ | 52,635 | |||||
| Supplemental Disclosures of Cash Flow Information | |||||||||||
| Cash paid (received) during the year for: | |||||||||||
| Interest (Net of Amounts Capitalized) | $ | 51,456 | $ | 32,372 | $ | 30,915 | |||||
| Income Taxes (Refunds) Paid | $ | (8,348 | ) | $ | 194 | $ | 1,828 | ||||
| Supplemental Disclosures of Non-Cash Investing Activities | |||||||||||
| Capital Expenditures acquired on account but unpaid as of year-end | $ | 32,253 | $ | 39,130 | $ | 51,433 | |||||
| Notes Receivable from Affiliate Exchanged for Notes Receivable from a Third Party | $ | — | $ | — | $ | 16,389 | |||||
| Notes Receivable Exchanged for Accounts Payable | $ | 3,841 | $ | 10,168 | $ | — | |||||
The accompanying notes are the responsibilityan integral part of the Company's management. Our responsibility is to expressconsolidated financial statements.
Consolidated Balance Sheets
(In Thousands)
| South Jersey Industries, Inc. and Subsidiaries | |||||||
| December 31, | |||||||
| 2017 | 2016 | ||||||
| Assets | |||||||
| Property, Plant and Equipment: | |||||||
| Utility Plant, at original cost | $ | 2,652,244 | $ | 2,424,134 | |||
| Accumulated Depreciation | (498,161 | ) | (471,222 | ) | |||
| Nonutility Property and Equipment, at cost | 741,027 | 821,942 | |||||
| Accumulated Depreciation | (194,913 | ) | (151,084 | ) | |||
| Property, Plant and Equipment - Net | 2,700,197 | 2,623,770 | |||||
| Investments: | |||||||
| Available-for-Sale Securities | 36 | 32 | |||||
| Restricted Investments | 31,876 | 13,628 | |||||
| Investment in Affiliates | 62,292 | 28,906 | |||||
| Total Investments | 94,204 | 42,566 | |||||
| Current Assets: | |||||||
| Cash and Cash Equivalents | 7,819 | 18,282 | |||||
| Accounts Receivable | 202,379 | 222,339 | |||||
| Unbilled Revenues | 73,377 | 59,680 | |||||
| Provision for Uncollectibles | (13,988 | ) | (12,744 | ) | |||
| Notes Receivable | — | 1,454 | |||||
| Notes Receivable - Affiliate | 4,913 | 2,461 | |||||
| Natural Gas in Storage, average cost | 48,513 | 53,857 | |||||
| Materials and Supplies, average cost | 4,239 | 6,753 | |||||
| Prepaid Taxes | 41,355 | 17,471 | |||||
| Derivatives - Energy Related Assets | 42,139 | 72,391 | |||||
| Other Prepayments and Current Assets | 28,247 | 31,369 | |||||
| Total Current Assets | 438,993 | 473,313 | |||||
| Regulatory and Other Noncurrent Assets: | |||||||
| Regulatory Assets | 469,224 | 410,746 | |||||
| Derivatives - Energy Related Assets | 5,988 | 8,502 | |||||
| Notes Receivable - Affiliate | 13,275 | 13,275 | |||||
| Contract Receivables | 28,721 | 29,037 | |||||
| Notes Receivable | — | 25,271 | |||||
| Goodwill | 3,578 | 4,838 | |||||
| Identifiable Intangible Assets | 12,480 | 15,820 | |||||
| Other | 98,426 | 83,429 | |||||
| Total Regulatory and Other Noncurrent Assets | 631,692 | 590,918 | |||||
| Total Assets | $ | 3,865,086 | $ | 3,730,567 | |||
The accompanying notes are an opinion onintegral part of the consolidated financial statementsstatements.
| 2017 | 2016 | ||||||
| Capitalization and Liabilities | |||||||
| Equity: | |||||||
| Common Stock: Par Value $1.25 per share; Authorized 120,000,000 shares; Outstanding Shares: 79,549,080 (2017) and 79,478,055 (2016) | |||||||
| Balance at Beginning of Year | $ | 99,347 | $ | 88,707 | |||
| Common Stock Issued or Granted Under Stock Plans | 89 | 10,640 | |||||
| Balance at End of Year | 99,436 | 99,347 | |||||
| Premium on Common Stock | 709,658 | 706,943 | |||||
| Treasury Stock (at par) | (271 | ) | (266 | ) | |||
| Accumulated Other Comprehensive Loss | (36,765 | ) | (27,381 | ) | |||
| Retained Earnings | 420,351 | 510,597 | |||||
| Total Equity | 1,192,409 | 1,289,240 | |||||
| Long-Term Debt | 1,122,999 | 808,005 | |||||
| Total Capitalization | 2,315,408 | 2,097,245 | |||||
| Current Liabilities: | |||||||
| Notes Payable | 346,400 | 296,100 | |||||
| Current Portion of Long-Term Debt | 63,809 | 231,909 | |||||
| Accounts Payable | 284,899 | 243,669 | |||||
| Customer Deposits and Credit Balances | 43,398 | 48,068 | |||||
| Environmental Remediation Costs | 66,372 | 46,120 | |||||
| Taxes Accrued | 2,932 | 2,082 | |||||
| Derivatives - Energy Related Liabilities | 46,938 | 60,082 | |||||
| Derivatives - Other Current | 748 | 681 | |||||
| Deferred Contract Revenues | 259 | — | |||||
| Interest Accrued | 9,079 | 6,231 | |||||
| Pension Benefits | 2,388 | 2,463 | |||||
| Other Current Liabilities | 15,860 | 15,219 | |||||
| Total Current Liabilities | 883,082 | 952,624 | |||||
| Deferred Credits and Other Noncurrent Liabilities: | |||||||
| Deferred Income Taxes - Net | 86,884 | 343,549 | |||||
| Pension and Other Postretirement Benefits | 101,544 | 95,235 | |||||
| Environmental Remediation Costs | 106,483 | 108,893 | |||||
| Asset Retirement Obligations | 59,497 | 59,427 | |||||
| Derivatives - Energy Related Liabilities | 6,025 | 4,540 | |||||
| Derivatives - Other Noncurrent | 9,622 | 9,349 | |||||
| Regulatory Liabilities | 287,105 | 49,121 | |||||
| Other | 9,436 | 10,584 | |||||
| Total Deferred Credits and Other Noncurrent Liabilities | 666,596 | 680,698 | |||||
| Commitments and Contingencies (Note 15) | |||||||
| Total Capitalization and Liabilities | $ | 3,865,086 | $ | 3,730,567 | |||
The accompanying notes are an integral part of the consolidated financial statements.
Consolidated Statements of Changes in Equity and financial statement schedule based on our audits.Comprehensive Income
(In Thousands)
| South Jersey Industries, Inc. and Subsidiaries | ||||||||||||||||||||||||
| Years Ended December 31, 2015, 2016 and 2017 | ||||||||||||||||||||||||
| Common Stock | Premium on Common Stock | Treasury Stock | Accumulated Other Comprehensive Loss | Retained Earnings | Total | |||||||||||||||||||
| Balance at January 1, 2015 | $ | 85,418 | $ | 438,384 | $ | (330 | ) | $ | (30,258 | ) | $ | 439,218 | $ | 932,432 | ||||||||||
| Net Income | — | — | — | — | 105,107 | 105,107 | ||||||||||||||||||
| Other Comprehensive Income, Net of Tax | — | — | — | 5,759 | — | 5,759 | ||||||||||||||||||
| Common Stock Issued or Granted Under Stock Plans | 3,289 | 61,076 | 34 | — | — | 64,399 | ||||||||||||||||||
| Cash Dividends Declared - Common Stock ($1.02 per share) | — | — | — | — | (70,158 | ) | (70,158 | ) | ||||||||||||||||
| Balance at December 31, 2015 | 88,707 | 499,460 | (296 | ) | (24,499 | ) | 474,167 | 1,037,539 | ||||||||||||||||
| Net Income | — | — | — | — | 118,810 | 118,810 | ||||||||||||||||||
| Other Comprehensive Loss, Net of Tax | — | — | — | (2,882 | ) | — | (2,882 | ) | ||||||||||||||||
| Common Stock Issued or Granted Through Equity Offering or Stock Plans | 10,640 | 207,483 | 30 | — | — | 218,153 | ||||||||||||||||||
| Cash Dividends Declared - Common Stock ($1.07 per share) | — | — | — | — | (82,380 | ) | (82,380 | ) | ||||||||||||||||
| Balance at December 31, 2016 | 99,347 | 706,943 | (266 | ) | (27,381 | ) | 510,597 | 1,289,240 | ||||||||||||||||
| Net Loss | — | — | — | — | (3,490 | ) | (3,490 | ) | ||||||||||||||||
| Other Comprehensive Loss, Net of Tax | — | — | — | (9,384 | ) | — | (9,384 | ) | ||||||||||||||||
| Common Stock Issued or Granted Under Stock Plans | 89 | 2,715 | (5 | ) | — | — | 2,799 | |||||||||||||||||
| Cash Dividends Declared - Common Stock ($1.10 per share) | — | — | — | — | (87,308 | ) | (87,308 | ) | ||||||||||||||||
| Excess Tax Benefit on Restricted Stock | — | — | — | — | 552 | 552 | ||||||||||||||||||
| Balance at December 31, 2017 | $ | 99,436 | $ | 709,658 | $ | (271 | ) | $ | (36,765 | ) | $ | 420,351 | $ | 1,192,409 | ||||||||||
Disclosure of Changes In Accumulated Other Comprehensive Loss Balances (a)
(In Thousands)
Postretirement Liability Adjustment (A) | Unrealized Gain (Loss) on Derivatives-Other (B) | Unrealized Gain (Loss) on Available- for-Sale Securities (B) | Other Comprehensive Income (Loss) of Affiliated Companies (B) | Accumulated Other Comprehensive Loss | ||||||||||||||||
| Balance at January 1, 2015 | $ | (27,663 | ) | $ | (2,450 | ) | $ | (75 | ) | $ | (70 | ) | $ | (30,258 | ) | |||||
| Changes During Year | 5,518 | 321 | (53 | ) | (27 | ) | 5,759 | |||||||||||||
| Balance at December 31, 2015 | (22,145 | ) | (2,129 | ) | (128 | ) | (97 | ) | (24,499 | ) | ||||||||||
| Changes During Year | (3,197 | ) | 197 | 118 | — | (2,882 | ) | |||||||||||||
| Balance at December 31, 2016 | (25,342 | ) | (1,932 | ) | (10 | ) | (97 | ) | (27,381 | ) | ||||||||||
| Changes During Year | (10,920 | ) | 1,536 | — | — | (9,384 | ) | |||||||||||||
| Balance at December 31, 2017 | $ | (36,262 | ) | $ | (396 | ) | $ | (10 | ) | $ | (97 | ) | $ | (36,765 | ) | |||||
(A) Determined using a combined average statutory tax rate of 27% for 2017 and 40% for 2016 and 2015.
(B) Determined using a combined average statutory tax rate of 39% for 2017 and 40% for 2016 and 2015.
The accompanying notes are an integral part of the Public Company Accounting Oversight Board (United States). Those standards require that we plan and perform the audit to obtain reasonable assurance about whether theconsolidated financial statements are free of material misstatement. The Company is not required to have, nor were we engaged to perform, an audit of its internal control over financial reporting. Our audits included consideration of internal control over financial reporting as a basis for designing audit procedures that are appropriate in the circumstances, but not for the purpose of expressing an opinion on the effectiveness of the Company's internal control over financial reporting. Accordingly, we express no such opinion. An audit also includes examining, on a test basis, evidence supporting the amounts and disclosures in the financial statements, assessing the accounting principles used and significant estimates made by management, as well as evaluating the overall financial statement presentation. We believe that our audits provide a reasonable basis for our opinion.statements.
SOUTH JERSEY GAS COMPANY
STATEMENTS OF INCOME
(In Thousands)
| Year Ended December 31, | Year Ended December 31, | |||||||||||||||||||||
| 2015 | 2014 | 2013 | 2017 | 2016 | 2015 | |||||||||||||||||
| Operating Revenues | $ | 534,290 | $ | 501,875 | $ | 446,480 | $ | 517,254 | $ | 461,055 | $ | 534,290 | ||||||||||
| Operating Expenses: | ||||||||||||||||||||||
| Cost of Sales (Excluding depreciation) | 245,290 | 231,216 | 200,081 | 204,432 | 174,390 | 245,290 | ||||||||||||||||
| Operations | 107,836 | 102,428 | 85,805 | 98,992 | 95,609 | 107,836 | ||||||||||||||||
| Maintenance | 16,183 | 13,457 | 13,135 | 19,727 | 17,549 | 16,183 | ||||||||||||||||
| Depreciation | 41,365 | 37,324 | 33,775 | 53,887 | 47,432 | 41,365 | ||||||||||||||||
| Energy and Other Taxes | 4,031 | 3,760 | 7,862 | 3,729 | 3,620 | 4,031 | ||||||||||||||||
| Total Operating Expenses | 414,705 | 388,185 | 340,658 | 380,767 | 338,600 | 414,705 | ||||||||||||||||
| Operating Income | 119,585 | 113,690 | 105,822 | 136,487 | 122,455 | 119,585 | ||||||||||||||||
| Other Income and Expense | 3,844 | 5,560 | 3,797 | 6,475 | 3,831 | 3,844 | ||||||||||||||||
| Interest Charges | (19,906 | ) | (17,872 | ) | (12,550 | ) | (24,705 | ) | (17,875 | ) | (19,906 | ) | ||||||||||
| Income Before Income Taxes | 103,523 | 101,378 | 97,069 | 118,257 | 108,411 | 103,523 | ||||||||||||||||
| Income Taxes | (36,945 | ) | (34,895 | ) | (34,833 | ) | (45,700 | ) | (39,366 | ) | (36,945 | ) | ||||||||||
| Net Income | $ | 66,578 | $ | 66,483 | $ | 62,236 | $ | 72,557 | $ | 69,045 | $ | 66,578 | ||||||||||
The accompanying notes are an integral part of the financial statements.
SOUTH JERSEY GAS COMPANY
STATEMENTS OF COMPREHENSIVE INCOME
(In Thousands)
| Year Ended December 31, | Year Ended December 31, | |||||||||||||||||||||
| 2015 | 2014 | 2013 | 2017 | 2016 | 2015 | |||||||||||||||||
| Net Income | $ | 66,578 | $ | 66,483 | $ | 62,236 | $ | 72,557 | $ | 69,045 | $ | 66,578 | ||||||||||
| Other Comprehensive Income (Loss), Net of Tax:* | ||||||||||||||||||||||
| Other Comprehensive Income (Loss), Net of Tax: | ||||||||||||||||||||||
| Postretirement Liability Adjustment | 1,617 | (3,165 | ) | 2,286 | (11,090 | ) | (2,197 | ) | 1,617 | |||||||||||||
| Unrealized (Loss) Gain on Available-for-Sale Securities | (23 | ) | (472 | ) | 103 | |||||||||||||||||
| Unrealized Gain (Loss) on Available-for-Sale Securities (B) | — | 98 | (23 | ) | ||||||||||||||||||
| Unrealized Gain on Derivatives - Other | 23 | 27 | 27 | 27 | 27 | 23 | ||||||||||||||||
| Other Comprehensive Income (Loss) - Net of Tax* | 1,617 | (3,610 | ) | 2,416 | ||||||||||||||||||
| Other Comprehensive (Loss) Income - Net of Tax | (11,063 | ) | (2,072 | ) | 1,617 | |||||||||||||||||
| Comprehensive Income | $ | 68,195 | $ | 62,873 | $ | 64,652 | $ | 61,494 | $ | 66,973 | $ | 68,195 | ||||||||||
(B) Determined using a combined average statutory tax rate of 201539% for 2017 and 201440% for 2016 and 41% in 2013.
2015.
The accompanying notes are an integral part of the financial statements.
SOUTH JERSEY GAS COMPANY
STATEMENTS OF CASH FLOWS
(In Thousands)
| Year Ended December 31, | |||||||||||
| 2017 | 2016 | 2015 | |||||||||
| Cash Flows from Operating Activities: | |||||||||||
| Net Income | $ | 72,557 | $ | 69,045 | $ | 66,578 | |||||
| Provided by Operating Activities: | |||||||||||
| Depreciation and Amortization | 71,654 | 63,901 | 58,668 | ||||||||
| Provision for Losses on Accounts Receivable | 6,949 | 6,993 | 14,689 | ||||||||
| CIP Receivable/Payable | 915 | (24,943 | ) | (7,324 | ) | ||||||
| Deferred Gas Costs - Net of Recoveries | (28,092 | ) | 11,753 | 28,648 | |||||||
| Deferred SBC Costs - Net of Recoveries | (5,578 | ) | (7,102 | ) | 9,557 | ||||||
| Environmental Remediation Costs - Net of Recoveries | (39,860 | ) | (39,735 | ) | (22,058 | ) | |||||
| Deferred and Noncurrent Income Taxes and Credits - Net | 78,712 | 40,980 | 39,148 | ||||||||
| Gas Plant Cost of Removal | (7,062 | ) | (6,070 | ) | (5,096 | ) | |||||
| Pension Contribution | (7,997 | ) | — | (12,020 | ) | ||||||
| Changes in: | |||||||||||
| Accounts Receivable | (28,129 | ) | (24,867 | ) | 8,597 | ||||||
| Inventories | (3,222 | ) | 2,696 | 11,198 | |||||||
| Prepaid and Accrued Taxes - Net | (20,993 | ) | 3,980 | (7,129 | ) | ||||||
| Other Prepayments and Current Assets | 1,183 | (448 | ) | (9,717 | ) | ||||||
| Gas Purchases Payable | 19,526 | 14,879 | (13,423 | ) | |||||||
| Accounts Payable and Other Accrued Liabilities | (1,753 | ) | 35,982 | (2,264 | ) | ||||||
| Other Assets | (16,925 | ) | (7,065 | ) | 4,996 | ||||||
| Other Liabilities (See Note 1) | 14,784 | 2,183 | 1,504 | ||||||||
| Net Cash Provided by Operating Activities | 106,669 | 142,162 | 164,552 | ||||||||
| Cash Flows from Investing Activities: | |||||||||||
| Capital Expenditures | (248,864 | ) | (225,287 | ) | (207,785 | ) | |||||
| Note Receivable | — | 9,916 | (9,916 | ) | |||||||
| Purchase of Company Owned Life Insurance | (4,875 | ) | — | — | |||||||
| Investment in Long-Term Receivables | (9,324 | ) | (10,886 | ) | (19,033 | ) | |||||
| Proceeds from Long-Term Receivables | 9,861 | 10,014 | 8,769 | ||||||||
| Net Cash Used in Investing Activities (See Note 1) | (253,202 | ) | (216,243 | ) | (227,965 | ) | |||||
| Cash Flows from Financing Activities: | |||||||||||
| Net (Repayments of) Borrowings from Short-Term Credit Facilities | (52,300 | ) | (30,100 | ) | 33,000 | ||||||
| Proceeds from Issuance of Long-Term Debt | 400,000 | 61,000 | 80,000 | ||||||||
| Principal Repayments of Long-Term Debt | (215,909 | ) | (27,909 | ) | (11,009 | ) | |||||
| Payments for Issuance of Long-Term Debt | (2,030 | ) | (63 | ) | (9 | ) | |||||
| Dividends on Common Stock | (20,000 | ) | — | (40,764 | ) | ||||||
| Additional Investment by Shareholder | 40,000 | 65,000 | — | ||||||||
| Net Cash Provided by Financing Activities | 149,761 | 67,928 | 61,218 | ||||||||
| Net Increase (Decrease) in Cash, Cash Equivalents and Restricted Cash | 3,228 | (6,153 | ) | (2,195 | ) | ||||||
| Cash, Cash Equivalents and Restricted Cash at Beginning of Period (See Note 1) | 1,391 | 7,544 | 9,739 | ||||||||
| Cash, Cash Equivalents and Restricted Cash at End of Period (See Note 1) | $ | 4,619 | $ | 1,391 | $ | 7,544 | |||||
| Supplemental Disclosures of Cash Flow Information | |||||||||||
| Year Ended December 31, | |||||||||||
| 2015 | 2014 | 2013 | |||||||||
| Cash Flows from Operating Activities: | |||||||||||
| Net Income | $ | 66,578 | $ | 66,483 | $ | 62,236 | |||||
| Provided by Operating Activities: | |||||||||||
| Depreciation and Amortization | 58,668 | 52,155 | 48,261 | ||||||||
| Provision for Losses on Accounts Receivable | 14,689 | 9,417 | 4,232 | ||||||||
| CIP Receivable/Payable | (7,324 | ) | 15,226 | 21,160 | |||||||
| Deferred Gas Costs - Net of Recoveries | 28,648 | (44,976 | ) | 5,473 | |||||||
| Deferred SBC Costs - Net of Recoveries | 9,557 | 11,048 | 2,393 | ||||||||
| Environmental Remediation Costs - Net of Recoveries | (22,058 | ) | (8,248 | ) | (438 | ) | |||||
| Deferred and Noncurrent Income Taxes and Credits - Net | 39,148 | 32,193 | 31,940 | ||||||||
| Gas Plant Cost of Removal | (5,096 | ) | (4,848 | ) | (6,092 | ) | |||||
| Pension Contribution | (12,020 | ) | — | (9,100 | ) | ||||||
| Changes in: | |||||||||||
| Accounts Receivable | 8,597 | (14,667 | ) | (20,574 | ) | ||||||
| Inventories | 11,198 | (3,820 | ) | (7,153 | ) | ||||||
| Prepaid and Accrued Taxes - Net | (7,129 | ) | (6,508 | ) | 9,456 | ||||||
| Other Prepayments and Current Assets | (9,717 | ) | 131 | (476 | ) | ||||||
| Gas Purchases Payable | (13,423 | ) | (1,873 | ) | 9,306 | ||||||
| Accounts Payable and Other Accrued Liabilities | (2,264 | ) | 11,302 | (5,107 | ) | ||||||
| Other Assets | 4,996 | (7,481 | ) | (7,323 | ) | ||||||
| Other Liabilities | 1,576 | (2,006 | ) | 10,565 | |||||||
| Net Cash Provided by Operating Activities | 164,624 | 103,528 | 148,759 | ||||||||
| Cash Flows from Investing Activities: | |||||||||||
| Capital Expenditures | (207,785 | ) | (200,008 | ) | (161,498 | ) | |||||
| Note Receivable | (9,916 | ) | — | — | |||||||
| Net Sale (Purchase) of Restricted Investments in Margin Accounts | 1,091 | (7,281 | ) | 588 | |||||||
| Net Sale of Restricted Investments from Escrowed Loan Proceeds | 101 | — | — | ||||||||
| Investment in Long-Term Receivables | (19,033 | ) | (13,024 | ) | (7,182 | ) | |||||
| Proceeds from Long-Term Receivables | 8,769 | 6,544 | 5,764 | ||||||||
| Net Cash Used in Investing Activities | (226,773 | ) | (213,769 | ) | (162,328 | ) | |||||
| Cash Flows from Financing Activities: | |||||||||||
| Net Borrowings from (Repayments of) Short-Term Credit Facilities | 33,000 | 35,900 | (36,600 | ) | |||||||
| Proceeds from Issuance of Long-Term Debt | 80,000 | 89,000 | 50,000 | ||||||||
| Principal Repayments of Long-Term Debt | (11,009 | ) | (21,000 | ) | (25,000 | ) | |||||
| Payments for Issuance of Long-Term Debt | (9 | ) | (627 | ) | (411 | ) | |||||
| Dividends on Common Stock | (40,764 | ) | (18,201 | ) | — | ||||||
| Additional Investment by Shareholder | — | 25,000 | 25,000 | ||||||||
| Tax Deficiency from Restricted Stock Plan | (72 | ) | (73 | ) | (78 | ) | |||||
| Net Cash Provided by Financing Activities | 61,146 | 109,999 | 12,911 | ||||||||
| Net Decrease in Cash and Cash Equivalents | (1,003 | ) | (242 | ) | (658 | ) | |||||
| Cash and Cash Equivalents at Beginning of Period | 1,778 | 2,020 | 2,678 | ||||||||
| Cash and Cash Equivalents at End of Period | $ | 775 | $ | 1,778 | $ | 2,020 | |||||
| Supplemental Disclosures of Cash Flow Information | ||||||||||||||||||||||
| Cash paid during the year for: | ||||||||||||||||||||||
| Interest (Net of Amounts Capitalized) | $ | 19,373 | $ | 17,832 | $ | 12,234 | $ | 23,729 | $ | 18,497 | $ | 19,373 | ||||||||||
| Income Taxes (Net of Refunds) | $ | (1,665 | ) | $ | (7,690 | ) | $ | (5,056 | ) | $ | (8,476 | ) | $ | (1 | ) | $ | (1,665 | ) | ||||
| Supplemental Disclosures of Noncash Investing Activities | ||||||||||||||||||||||
| Property and equipment acquired on account but not paid at year-end | $ | 24,857 | $ | 17,551 | $ | 20,055 | ||||||||||||||||
| Capital Expenditures acquired on account but not paid at year-end | $ | 25,889 | $ | 25,275 | $ | 24,857 | ||||||||||||||||
SOUTH JERSEY GAS COMPANY
BALANCE SHEETS
(In Thousands)
| December 31, 2015 | December 31, 2014 | December 31, 2017 | December 31, 2016 | |||||||||||
| Assets | ||||||||||||||
| Property, Plant and Equipment: | ||||||||||||||
| Utility Plant, at original cost | $ | 2,211,239 | $ | 2,002,966 | $ | 2,652,244 | $ | 2,424,134 | ||||||
| Accumulated Depreciation | (440,473 | ) | (413,597 | ) | (498,161 | ) | (471,222 | ) | ||||||
| Property, Plant and Equipment - Net | 1,770,766 | 1,589,369 | 2,154,083 | 1,952,912 | ||||||||||
| Investments: | ||||||||||||||
| Available-for-Sale Securities | 8,788 | 8,894 | ||||||||||||
| Restricted Investments | 6,769 | 7,961 | 2,912 | 32 | ||||||||||
| Total Investments | 15,557 | 16,855 | 2,912 | 32 | ||||||||||
| Current Assets: | ||||||||||||||
| Cash and Cash Equivalents | 775 | 1,778 | 1,707 | 1,359 | ||||||||||
| Notes Receivable | 9,916 | — | ||||||||||||
| Accounts Receivable | 64,445 | 60,535 | 78,571 | 69,651 | ||||||||||
| Accounts Receivable - Related Parties | 1,972 | 1,157 | 988 | 1,355 | ||||||||||
| Unbilled Revenues | 25,613 | 49,910 | 54,980 | 41,754 | ||||||||||
| Provision for Uncollectibles | (9,778 | ) | (6,601 | ) | (13,799 | ) | (12,570 | ) | ||||||
| Natural Gas in Storage, average cost | 14,294 | 25,325 | 14,932 | 11,621 | ||||||||||
| Materials and Supplies, average cost | 937 | 1,104 | 825 | 914 | ||||||||||
| Deferred Income Taxes - Net | — | 44,064 | ||||||||||||
| Prepaid Taxes | 21,483 | 13,601 | 38,326 | 16,428 | ||||||||||
| Derivatives - Energy Related Assets | 1,077 | 2,051 | 7,327 | 5,434 | ||||||||||
| Other Prepayments and Current Assets | 13,405 | 3,688 | 12,670 | 13,853 | ||||||||||
| Total Current Assets | 144,139 | 196,612 | 196,527 | 149,799 | ||||||||||
| Regulatory and Other Noncurrent Assets: | ||||||||||||||
| Regulatory Assets | 323,434 | 357,160 | 469,224 | 410,746 | ||||||||||
| Unamortized Debt Issuance Costs | 6,628 | 7,382 | ||||||||||||
| Long-Term Receivables | 24,950 | 15,223 | 25,851 | 25,758 | ||||||||||
| Derivatives - Energy Related Assets | 64 | — | 5 | 373 | ||||||||||
| Other | 2,666 | 3,071 | 17,372 | 12,303 | ||||||||||
| Total Regulatory and Other Noncurrent Assets | 357,742 | 382,836 | 512,452 | 449,180 | ||||||||||
| Total Assets | $ | 2,288,204 | $ | 2,185,672 | $ | 2,865,974 | $ | 2,551,923 | ||||||
The accompanying notes are an integral part of the financial statements.
SOUTH JERSEY GAS COMPANY
CONDENSED BALANCE SHEETS (UNAUDITED)
(In Thousands, except per share amounts)
| December 31, 2015 | December 31, 2014 | December 31, 2017 | December 31, 2016 | |||||||||||
| Capitalization and Liabilities | ||||||||||||||
| Common Equity: | ||||||||||||||
| Equity: | ||||||||||||||
| Common Stock, Par Value $2.50 per share: | ||||||||||||||
| Authorized - 4,000,000 shares | ||||||||||||||
| Outstanding - 2,339,139 shares | $ | 5,848 | $ | 5,848 | $ | 5,848 | $ | 5,848 | ||||||
| Other Paid-In Capital and Premium on Common Stock | 250,827 | 250,899 | 355,744 | 315,827 | ||||||||||
| Accumulated Other Comprehensive Loss | (12,862 | ) | (14,479 | ) | (25,997 | ) | (14,934 | ) | ||||||
| Retained Earnings | 464,114 | 438,300 | 585,838 | 533,159 | ||||||||||
| Total Common Equity | 707,927 | 680,568 | ||||||||||||
| Total Equity | 921,433 | 839,900 | ||||||||||||
| Long-Term Debt | 584,082 | 507,091 | 758,052 | 423,177 | ||||||||||
| Total Capitalization | 1,292,009 | 1,187,659 | 1,679,485 | 1,263,077 | ||||||||||
| Current Liabilities: | ||||||||||||||
| Notes Payable | 134,400 | 101,400 | 52,000 | 104,300 | ||||||||||
| Current Portion of Long-Term Debt | 27,909 | 35,909 | 63,809 | 215,909 | ||||||||||
| Accounts Payable - Commodity | 8,936 | 22,359 | 43,341 | 23,815 | ||||||||||
| Accounts Payable - Other | 40,579 | 32,711 | 41,365 | 45,370 | ||||||||||
| Accounts Payable - Related Parties | 7,552 | 11,249 | 17,029 | 11,216 | ||||||||||
| Derivatives - Energy Related Liabilities | 5,489 | 6,305 | 9,270 | 1,372 | ||||||||||
| Derivatives - Other Current | 389 | 386 | ||||||||||||
| Customer Deposits and Credit Balances | 19,531 | 17,626 | 41,656 | 45,816 | ||||||||||
| Environmental Remediation Costs | 48,323 | 28,480 | 66,040 | 45,018 | ||||||||||
| Taxes Accrued | 1,930 | 1,177 | 1,760 | 855 | ||||||||||
| Pension Benefits | 2,227 | 1,515 | 2,353 | 2,428 | ||||||||||
| Interest Accrued | 5,989 | 6,099 | 7,615 | 5,369 | ||||||||||
| Other Current Liabilities | 5,686 | 6,580 | 7,027 | 8,011 | ||||||||||
| Total Current Liabilities | 308,551 | 271,410 | 353,654 | 509,865 | ||||||||||
| Regulatory and Other Noncurrent Liabilities: | ||||||||||||||
| Regulatory Liabilities | 42,841 | 41,899 | 287,105 | 49,121 | ||||||||||
| Deferred Income Taxes - Net | 432,674 | 435,022 | 280,746 | 469,408 | ||||||||||
| Environmental Remediation Costs | 74,871 | 95,828 | 105,656 | 108,029 | ||||||||||
| Asset Retirement Obligations | 57,219 | 41,976 | 58,714 | 58,674 | ||||||||||
| Pension and Other Postretirement Benefits | 65,491 | 95,241 | 88,871 | 81,800 | ||||||||||
| Investment Tax Credits | — | 149 | ||||||||||||
| Derivatives - Energy Related Liabilities | 351 | 1,298 | 170 | — | ||||||||||
| Derivatives - Other | 7,631 | 7,325 | ||||||||||||
| Derivatives - Other Noncurrent | 6,639 | 6,979 | ||||||||||||
| Other | 6,566 | 7,865 | 4,934 | 4,970 | ||||||||||
| Total Regulatory and Other Noncurrent Liabilities | 687,644 | 726,603 | 832,835 | 778,981 | ||||||||||
| Commitments and Contingencies (Note 9) | ||||||||||||||
| Commitments and Contingencies (Note 15) | ||||||||||||||
| Total Capitalization and Liabilities | $ | 2,288,204 | $ | 2,185,672 | $ | 2,865,974 | $ | 2,551,923 | ||||||
The accompanying notes are an integral part of the unaudited condensed financial statements.
SOUTH JERSEY GAS COMPANY
STATEMENTS OF CHANGES IN COMMON EQUITY AND COMPREHENSIVE INCOME
(In Thousands)
| Common Stock | Other Paid-In Capital and Premium on Common Stock | Accumulated Other Comprehensive Loss | Retained Earnings | Total | Common Stock | Other Paid-In Capital and Premium on Common Stock | Accumulated Other Comprehensive Loss | Retained Earnings | Total | |||||||||||||||||||||||||||||
| Balance at January 1, 2013 | $ | 5,848 | $ | 201,050 | $ | (13,285 | ) | $ | 327,782 | $ | 521,395 | |||||||||||||||||||||||||||
| Balance at January 1, 2015 | $ | 5,848 | $ | 250,899 | $ | (14,479 | ) | $ | 438,300 | 680,568 | ||||||||||||||||||||||||||||
| Net Income | 62,236 | 62,236 | $ | 66,578 | 66,578 | |||||||||||||||||||||||||||||||||
| Other Comprehensive Gain, Net of Tax: (a) | 2,416 | 2,416 | ||||||||||||||||||||||||||||||||||||
| Cash Dividends Declared – Common Stock | — | — | ||||||||||||||||||||||||||||||||||||
| Additional Investment by Shareholder | 25,000 | 25,000 | ||||||||||||||||||||||||||||||||||||
| Tax Deficiency from Restricted Stock Plan | (78 | ) | (78 | ) | ||||||||||||||||||||||||||||||||||
| Balance at December 31, 2013 | 5,848 | 225,972 | (10,869 | ) | 390,018 | 610,969 | ||||||||||||||||||||||||||||||||
| Net Income | 66,483 | 66,483 | ||||||||||||||||||||||||||||||||||||
| Other Comprehensive Loss, Net of Tax: (a) | (3,610 | ) | (3,610 | ) | ||||||||||||||||||||||||||||||||||
| Cash Dividends Declared – Common Stock | (18,201 | ) | (18,201 | ) | ||||||||||||||||||||||||||||||||||
| Additional Investment by Shareholder | 25,000 | 25,000 | ||||||||||||||||||||||||||||||||||||
| Tax Deficiency from Restricted Stock Plan | (73 | ) | (73 | ) | ||||||||||||||||||||||||||||||||||
| Balance at December 31, 2014 | 5,848 | 250,899 | (14,479 | ) | 438,300 | 680,568 | ||||||||||||||||||||||||||||||||
| Net Income | 66,578 | 66,578 | ||||||||||||||||||||||||||||||||||||
| Other Comprehensive Gain, Net of Tax: (a) | 1,617 | 1,617 | ||||||||||||||||||||||||||||||||||||
| Other Comprehensive Gain, Net of Tax | 1,617 | 1,617 | ||||||||||||||||||||||||||||||||||||
| Cash Dividends Declared – Common Stock | (40,764 | ) | (40,764 | ) | (40,764 | ) | (40,764 | ) | ||||||||||||||||||||||||||||||
| Additional Investment by Shareholder | — | — | — | — | ||||||||||||||||||||||||||||||||||
| Tax Deficiency from Restricted Stock Plan | (72 | ) | (72 | ) | (72 | ) | (72 | ) | ||||||||||||||||||||||||||||||
| Balance at December 31, 2015 | $ | 5,848 | $ | 250,827 | $ | (12,862 | ) | $ | 464,114 | $ | 707,927 | 5,848 | 250,827 | (12,862 | ) | 464,114 | 707,927 | |||||||||||||||||||||
| Net Income | 69,045 | 69,045 | ||||||||||||||||||||||||||||||||||||
| Other Comprehensive Loss, Net of Tax | (2,072 | ) | (2,072 | ) | ||||||||||||||||||||||||||||||||||
| Cash Dividends Declared – Common Stock | — | — | ||||||||||||||||||||||||||||||||||||
| Additional Investment by Shareholder | 65,000 | 65,000 | ||||||||||||||||||||||||||||||||||||
| Tax Deficiency from Restricted Stock Plan | — | — | ||||||||||||||||||||||||||||||||||||
| Balance at December 31, 2016 | 5,848 | 315,827 | (14,934 | ) | 533,159 | 839,900 | ||||||||||||||||||||||||||||||||
| Net Income | 72,557 | 72,557 | ||||||||||||||||||||||||||||||||||||
| Other Comprehensive Loss, Net of Tax | (11,063 | ) | (11,063 | ) | ||||||||||||||||||||||||||||||||||
| Cash Dividends Declared – Common Stock | (20,000 | ) | (20,000 | ) | ||||||||||||||||||||||||||||||||||
| Additional Investment by Shareholder | 40,000 | 40,000 | ||||||||||||||||||||||||||||||||||||
| Excess tax benefit - See Footnote 1 | 122 | 122 | ||||||||||||||||||||||||||||||||||||
| Tax Deficiency from Restricted Stock Plan | (83 | ) | (83 | ) | ||||||||||||||||||||||||||||||||||
| Balance at December 31, 2017 | $ | 5,848 | $ | 355,744 | $ | (25,997 | ) | $ | 585,838 | $ | 921,433 | |||||||||||||||||||||||||||
The accompanying notes are an integral part of the financial statements.
Disclosure of Changes in Accumulated Other Comprehensive Loss Balances (a)
(In Thousands)
| Postretirement Liability Adjustment | Unrealized Gain (Loss) on Available-for-Sale Securities | Unrealized Gain (Loss) on Derivatives | Accumulated Other Comprehensive Income (Loss) | Postretirement Liability Adjustment (A) | Unrealized Gain (Loss) on Available-for-Sale Securities (B) | Unrealized Gain (Loss) on Derivatives (B) | Accumulated Other Comprehensive Income (Loss) | |||||||||||||||||||||||
| Balance at January 1, 2013 | $ | (12,958 | ) | $ | 294 | $ | (621 | ) | $ | (13,285 | ) | |||||||||||||||||||
| Changes During Year | 2,286 | 103 | 27 | 2,416 | ||||||||||||||||||||||||||
| Balance at December 31, 2013 | (10,672 | ) | 397 | (594 | ) | (10,869 | ) | |||||||||||||||||||||||
| Changes During Year | (3,165 | ) | (472 | ) | 27 | (3,610 | ) | |||||||||||||||||||||||
| Balance at December 31, 2014 | (13,837 | ) | (75 | ) | (567 | ) | (14,479 | ) | ||||||||||||||||||||||
| Balance at January 1, 2015 | $ | (13,837 | ) | $ | (75 | ) | $ | (567 | ) | $ | (14,479 | ) | ||||||||||||||||||
| Changes During Year | 1,617 | (23 | ) | 23 | 1,617 | 1,617 | (23 | ) | 23 | 1,617 | ||||||||||||||||||||
| Balance at December 31, 2015 | $ | (12,220 | ) | $ | (98 | ) | $ | (544 | ) | $ | (12,862 | ) | (12,220 | ) | (98 | ) | (544 | ) | (12,862 | ) | ||||||||||
| Changes During Year | (2,197 | ) | 98 | 27 | (2,072 | ) | ||||||||||||||||||||||||
| Balance at December 31, 2016 | (14,417 | ) | — | (517 | ) | (14,934 | ) | |||||||||||||||||||||||
| Changes During Year | (11,090 | ) | — | 27 | (11,063 | ) | ||||||||||||||||||||||||
| Balance at December 31, 2017 | $ | (25,507 | ) | $ | — | $ | (490 | ) | $ | (25,997 | ) | |||||||||||||||||||
(B) Determined using a combined average statutory tax rate of 201539% for 2017 and 201440% for 2016 and 41% in 2013.2015.
The accompanying notes are an integral part of the financial statements.
| 1. | SUMMARY OF SIGNIFICANT ACCOUNTING POLICIES: |
| ▪ | South Jersey Gas Company (SJG) is a regulated natural gas utility. SJG distributes natural gas in the seven southernmost counties of New Jersey. |
| ▪ | South Jersey Energy Company (SJE) acquires and markets natural gas and electricity to retail end users and provides total energy management services to commercial, industrial and residential customers. |
| ▪ | South Jersey Resources Group, LLC (SJRG) markets natural gas storage, commodity and transportation assets along with fuel management services on a wholesale basis in the mid-Atlantic, Appalachian and southern states. |
| ▪ | South Jersey Exploration, LLC (SJEX) owns oil, gas and mineral rights in the Marcellus Shale region of Pennsylvania. |
| ▪ | Marina Energy, LLC (Marina) develops and operates on-site energy-related projects. It currently operates projects in New Jersey, Maryland, Massachusetts and Vermont. The significant wholly-owned subsidiaries of Marina include: |
ACB Energy Partners, LLC (ACB) owns alland operates a natural gas fueled combined heating, cooling and power facility located in Atlantic City, New Jersey.
AC Landfill Energy, LLC (ACLE), BC Landfill Energy, LLC (BCLE), SC Landfill Energy, LLC (SCLE) and SX Landfill Energy, LLC (SXLE) own and operate landfill gas-to-energy production facilities in Atlantic, Burlington, Salem and Sussex Counties in New Jersey.
MCS Energy Partners, LLC (MCS), NBS Energy Partners, LLC (NBS) and SBS Energy Partners, LLC (SBS) own and operate solar-generation sites located in New Jersey.
| ▪ | South Jersey Energy Service Plus, LLC (SJESP) serviced residential and small commercial HVAC systems, installed small commercial HVAC systems, provided plumbing services and serviced appliances under warranty via a subcontractor arrangement as well as on a time and materials basis. On September 1, 2017, SJESP sold certain assets of its residential and small commercial HVAC and plumbing business to a third party. SJESP will receive commissions paid on service contracts from the third party on a go forward basis. This transaction did not have a material impact on the consolidated financial statements. |
SJI Midstream, LLC (Midstream) invests in infrastructure and other midstream projects, including a current project to build an approximately 118-mile natural gas pipeline in Pennsylvania and New Jersey.
In October 2017, SJI announced that it had entered into agreements to acquire the assets of Elizabethtown Gas and Elkton Gas from Pivotal Utility Holdings, Inc., a subsidiary of Southern Company Gas. SJI is acquiring the assets of both companies for total consideration of $1.7 billion. The transaction is expected to close in mid-2018, and is subject to approvals by the New Jersey Board of Public Utilities (BPU) and the Maryland Public Service Commission (PSC), with limited approvals also required from the Federal Energy Regulatory Commission (FERC) and the Federal Communications Commission (FCC), as well as certain anti-trust filings and approvals.
In connection with the acquisition, SJI has incurred total fees of $27.4 million during the year ended December 31, 2017. Of these fees, $14.5 million were related to consulting and legal expenses and recorded as Operating Expenses in the statements of consolidated income for the year ended December 31, 2017. The remaining $12.9 million relates to a 364-day, $2.6 billion senior unsecured bridge facility (the “Bridge Facility”), which was entered into in the fourth quarter of 2017 (see Note 14). Debt issuance costs associated with the Facility totaled $10.4 million and are being amortized over the term of the outstanding common stockFacility, with $2.6 million amortized to interest expense in 2017. Also incurred is $2.5 million of South Jersey Gas Company (SJG).ticking fees which are also recorded as interest expense for the year ended December 31, 2017. The interest expenses noted above are recorded in Interest Charges in the statements of consolidated income. All of the above costs are included in the Corporate & Services segment.
BASIS OF PRESENTATION - The consolidated financial statements include the accounts of SJI, its wholly-owned subsidiaries and subsidiaries in which SJI has a controlling interest. SJI eliminates all significant intercompany accounts and transactions. In ourmanagement's opinion, the consolidated financial statements reflect all normal and recurring adjustments needed to fairly present ourSJI's financial position, and operating results and cash flows at the dates and for the periods presented.
Certain reclassifications have been made to SJI's and SJG's prior period consolidated statements of cash flows to conform to the current period presentation. Restricted cash is now combined with cash and cash equivalents when reconciling the beginning and end of period balances on the consolidated statements of cash flows of SJI, as well as the statements of cash flows for SJG, to conform to ASU 2016-18, which is described below under "New Accounting Pronouncements." This combination of restricted cash and cash and cash equivalents caused Cash Flows from Investing Activities for both SJI and SJG to be adjusted in order to add restricted cash obtained through an acquisition (SJI only), as well as to remove items relating to capital expenditures and proceeds from restricted investments (SJI only), as well as the sale of restricted investments in a margin account and from escrowed loan proceeds (SJI and SJG).
Certain reclassifications have been made to SJI's prior period's regulatory liabilities disclosureperiod consolidated statements of cash flows to conform to the current period presentation. Cash paid by an employer when directly withholding shares for tax-withholding purposes is now classified as a financing activity in the consolidated statements of cash flows to conform to ASU 2016-09, which is described below under "New Accounting Pronouncements." This caused SJI's prior period Cash Flows Provided by Operating Activities (Other Assets and Liabilities) to increase by $0.4 million and $0.3 million for 2016 and 2015, respectively, and Net Cash Flows from Financing Activities (Net Settlement of Restricted Stock) to decrease by the same amount. Also, excess tax benefits from restricted stock are now classified along with other income tax cash flows as an operating activity per the new ASU. This caused $0.4 million and $0.1 million to be reclassed out of SJI's and SJG's, respectively, 2015 Cash Flows Provided by Financing Activities (Other) into Cash Flows Provided by Operating Activities (Other Assets and Liabilities).
Certain reclassifications have been made to SJI's prior period segments disclosures to conform to the current period presentation. The societal benefits cost previously included in "Other Regulatory Liabilities"activities of SJI Midstream, which were reclassified to the line item "Societal Benefits Costs Payable"presented in the regulatory liabilities table disclosedCorporate & Services segment in 2015 and 2016, are now separated into the Midstream segment in 2017. This caused prior period adjustments to Property Additions and Identifiable Assets in Note 4.8.
Certain reclassifications have been made to the prior period's deferred tax asset/liability disclosureSJG's related party transactions disclosures to conform to the current period presentation. The breakoutoperating revenues of current"Marina" and noncurrent assets/liabilities previously disclosed"Other" were adjusted for proper presentation of the SJI wholly-owned subsidiaries (Marina) and the SJI affiliates (Other) in Note 6 was reclassified to separate deferred tax assets and deferred tax liabilities.3.
OPERATING REVENUES - Gas and electric revenues are recognized in the period the commodity is delivered to customers. For SJG and SJE retail customers that are not billed at the end of the month, we record an estimate to recognize unbilled revenues for gas and electricity delivered from the date of the last meter reading to the end of the month. SJRG's gas revenues are recognized in the period the commodity is delivered. Realized and unrealized gains and losses on energy-related derivative instruments are also recognized in operating revenues for SJRG. See further discussion under Derivative Instruments. SJRG presents revenues and expenses related to its energy trading activities on a net basis in operating revenues. This net presentation has no effect on operating income or net income. We recognize revenues on commissions received related to SJESP appliance service contracts from a third party on a monthly basis as these commissions are earned. Marina recognizes revenue on a monthly basis as services are provided, as lease income is earned, and for on-site energy production that is delivered to its customers.
| 2015 | 2014 | ||||||
| Utility Plant: | |||||||
| Production Plant | $ | 296 | $ | 296 | |||
| Storage Plant | 20,872 | 23,023 | |||||
| Transmission Plant | 252,934 | 248,737 | |||||
| Distribution Plant | 1,702,148 | 1,547,218 | |||||
| General Plant | 163,420 | 103,604 | |||||
| Other Plant | 1,855 | 1,855 | |||||
| Utility Plant in Service | 2,141,525 | 1,924,733 | |||||
| Construction Work in Progress | 69,714 | 78,233 | |||||
| Total Utility Plant | $ | 2,211,239 | $ | 2,002,966 | |||
ARO activity during 2015 and 2014 was as follows (in thousands):
| 2015 | 2014 | ||||||
| ARO as of January 1, | $ | 41,976 | $ | 41,178 | |||
| Accretion | 1,658 | 1,595 | |||||
| Additions | 621 | 664 | |||||
| Settlements | (1,110 | ) | (1,461 | ) | |||
| Revisions in Estimated Cash Flows * | 14,074 | — | |||||
| ARO as of December 31, | $ | 57,219 | $ | 41,976 | |||
| 2017 | 2016 | |||||||
| SJI (includes SJG and all other consolidated subsidiaries): | ||||||||
| AROs as of January 1, | $ | 59,427 | $ | 57,943 | ||||
| Accretion | 1,955 | 1,937 | ||||||
| Additions | 1,008 | 1,098 | ||||||
| Settlements | (2,893 | ) | (1,551 | ) | ||||
| ARO's as of December 31, | $ | 59,497 | $ | 59,427 | ||||
| 2017 | 2016 | |||||||
| SJG: | ||||||||
| AROs as of January 1, | $ | 58,674 | $ | 57,219 | ||||
| Accretion | 1,925 | 1,908 | ||||||
| Additions | 1,008 | 1,098 | ||||||
| Settlements | (2,893 | ) | (1,551 | ) | ||||
| ARO's as of December 31, | $ | 58,714 | $ | 58,674 | ||||
SJG Utility Plant balances and SJI Nonutility Property and Equipment as of December 31, 2017 and 2016 were comprised of the following (in thousands):
| 2017 | 2016 | |||||||
| Utility Plant | ||||||||
| Production Plant | $ | 296 | $ | 296 | ||||
| Storage Plant | 61,909 | 60,661 | ||||||
| Transmission Plant | 258,598 | 257,169 | ||||||
| Distribution Plant | 2,044,421 | 1,871,703 | ||||||
| General Plant | 175,599 | 169,464 | ||||||
| Other Plant | 1,855 | 1,855 | ||||||
| Utility Plant In Service | 2,542,678 | 2,361,148 | ||||||
| Construction Work In Progress | 109,566 | 62,986 | ||||||
| Total Utility Plant | $ | 2,652,244 | $ | 2,424,134 | ||||
| Nonutility Property and Equipment | ||||||||
| Solar Assets | $ | 582,379 | $ | 652,683 | ||||
| Cogeneration Assets | 125,614 | 124,172 | ||||||
| Other Assets | 33,034 | 45,087 | ||||||
| Total Nonutility Property and Equipment | $ | 741,027 | $ | 821,942 | ||||
DEPRECIATION - We depreciate utility plant on a straight-line basis over the estimated remaining lives of the various property classes. These estimates are periodically reviewed and adjusted as required after BPU approval. The composite annual rate for all depreciable utility property was approximately 2.2% in 2015, 2.2% in 2014each of 2017, 2016 and 2.3% in 2013.2015. The actual composite rate may differ from the approved rate as the asset mix changes over time. Except for retirements outside of the normal course of business, accumulated depreciation is charged with the cost of depreciable utility property retired, less salvage. Effective October 1, 2014, SJG's compositeNonutility property depreciation rateis computed on a straight-line basis over the estimated useful lives of the property, ranging up to 50 years. Gain or loss on the disposition of nonutility property is recognized in operating income. As of December 31, 2017, total accumulated depreciation for utility and nonutility property and equipment was reduced$498.2 million and $194.9 million, respectively.
DEBT ISSUANCE COSTS - Debt issuance costs are capitalized and amortized as interest expense on a basis which approximates the effective interest method over the term of the related debt. Debt issuance costs are presented as a direct deduction from 2.4% to 2.1%.the carrying amount of the related debt. See Note 3.14 for the total unamortized debt issuance costs that are recorded as a reduction to long-term debt on the consolidated balance sheets of SJI and SJG.
IMPAIRMENT OF LONG-LIVED ASSETS - Long-lived assets that are held and used are reviewed for possible impairment whenever events or changes in circumstances indicate that such amountscarrying values may not be recoverable. Such reviews are performed in accordance with ASC 360. An impairment loss is indicated if the total future estimated undiscounted cash flows expected from an asset are less than its carrying value. An impairment charge is measured by the difference between an asset's carrying amount and fair value with the difference recorded within Impairment Charges on the consolidated statements of income. Fair values can be determined by a variety of valuation methods, including third-party appraisals, sales prices of similar assets, and present value techniques.
In 2017, SJI had reason to believe that, due to a significant decline in the market prices of Maryland solar renewable energy credits (SRECs), combined with an increase of operating expenses, the full carrying value of SJI’s Maryland solar facilities may not be recoverable. As a result, SJI performed an impairment test on the respective assets which led to an impairment charge of $43.9 million. Also, during the fourth quarter of 2017, as the Company updated its estimated future cash flows for the rest of its solar portfolio, the Company determined that the expected future undiscounted cash flows for certain individual solar facilities were below their carrying value and the assets were considered impaired. As a result, SJI recorded an additional impairment charge of $27.4 million in 2017. The fair values of the impaired solar facilities were determined using an income approach by applying a discounted cash flow methodology to the future estimated cash flows, which were Level 3 fair value measurements. The key inputs to the methodology were forecasted SREC and electric revenues, operating expenses, salvage values, and discount rates.
Also in the fourth quarter of 2017, SJI observed its landfill gas-to-energy (LFGTE) assets were incurring continuing cash flow losses specifically due to larger than expected decreases in electric generation and increasing operating expenses, and as a result had reason to believe the carrying value of these assets may no longer be recoverable. As a result, SJI performed an impairment test on the respective assets which led to an impairment charge of $16.5 million. The fair values of the LFGTE assets were determined using a combination of market and cost approaches, which considers similar market transactions that are specific to the LFGTE assets. The cost and market approaches used are deemed Level 3 fair value measurements.
For the year ended December 31, 2017, SJI had total long-lived asset impairment charges (pre-tax) of $87.8 million. These impairment charges are recorded within Impairment Charges on the consolidated statements of income and are included within the On-Site Energy Production segment. No impairments on long-lived assets were identified at SJG for the year ended December 31, 2017. For the years ended 2015, 2014December 31, 2016 and 2013,2015, no significant impairments on long-lived assets were identified.identified at SJI or SJG. See Note 17 for further information on Fair Value methodology.
DERIVATIVE INSTRUMENTS - SJI accounts for derivative instruments in accordance with strict guidelines (See Note 14). These contracts, which haveFASB ASC Topic 815 - “Derivatives and Hedging.” We record all derivatives, whether designated in hedging relationships or not, been designated as hedging instruments under GAAP, are measuredon the consolidated balance sheets at fair value unless the derivative contracts qualify for the normal purchase and sale exemption. In general, if the derivative is designated as a fair value hedge, we recognize the changes in the fair value of the derivative and of the hedged item attributable to the hedged risk in earnings. We currently have no fair value hedges. If the derivative is designated as a cash flow hedge, we record the effective portion of the hedge in Accumulated Other Comprehensive Loss (AOCL) and recognize it in the income statement when the hedged item affects earnings. We recognize ineffective portions of the cash flow hedges immediately in earnings. We currently have no cash flow hedges. We formally document all relationships between hedging instruments and hedged items, as well as our risk management objectives, strategies for undertaking various hedge transactions and our methods for assessing and testing correlation and hedge ineffectiveness. All hedging instruments are linked to the hedged asset, liability, firm commitment or forecasted transaction. Due to the application of regulatory accounting principles under FASB ASC Topic 980, gains and losses on derivatives related to SJG's gas purchases are recorded in Derivatives – Energy Related Assets or Derivatives – Energy Related Liabilities onthrough the balance sheets. The costs or benefits of these short-term contracts are recoverable through SJG’s Basic Gas Supply Service (BGSS) clause, subjectclause.
Initially and on an ongoing basis, we assess whether derivatives designated as hedges are highly effective in offsetting changes in cash flows or fair values of the hedged items. We discontinue hedge accounting prospectively if we decide to BPU approval.discontinue the hedging relationship; determine that the anticipated transaction is no longer likely to occur; or determine that a derivative is no longer highly effective as a hedge. In the event that hedge accounting is discontinued, we will continue to carry the derivative on the balance sheet at its current fair value and recognize subsequent changes in fair value in current period earnings. Unrealized gains and losses on the discontinued hedges that were previously included in AOCL will be reclassified into earnings when the forecasted transaction occurs, or when it is probable that it will not occur. Hedge accounting has been discontinued for all remaining derivatives that were designated as hedging instruments. As a result, the net unrealized pre-tax gains and losses foron these energyderivatives, that were previously recorded in AOCL on the consolidated balance sheets, are being recorded into earnings over the remaining life of the derivative. In March 2017, SJI entered into a new interest rate derivative and amended the existing interest rate derivative linked to unrealized losses previously recorded in AOCL (see Note 16).
GAS EXPLORATION AND DEVELOPMENT - SJI capitalizes all costs associated with gas property acquisition, exploration and development activities under the full cost method of accounting. Capitalized costs include costs related commodity contractsto unproved properties, which are not amortized until proved reserves are found or it is determined that the unproved properties are impaired. All costs related to unproved properties are reviewed quarterly to determine if impairment has occurred. No impairment charges were recorded on these costs during the years ended December 31, 2017, 2016 and 2015. As of December 31, 2017 and 2016, $8.7 million and $8.8 million , respectively, related to interests in proved and unproved properties in Pennsylvania, net of amortization, is included with realized gainsNonutility Property and losses in RegulatoryEquipment and Other Noncurrent Assets or Regulatory Liabilities on the consolidated balance sheets.
TREASURY STOCK – SJI uses the par value method of accounting for treasury stock. As of December 31, 2017 and 2016, SJI held 216,642 and 212,617 shares of treasury stock, respectively. These shares are related to deferred compensation arrangements where the amounts earned are held in the stock of SJI.
CASH AND CASH EQUIVALENTS - For purposes of reporting cash flows, highly liquid investments with original maturities of three months or less are considered cash equivalents.
IDENTIFIABLE INTANGIBLE ASSETS - The primary identifiable intangible assets of the Company are customer relationships. The Company determines the useful lives of identifiable intangible assets after considering the specific facts and circumstances related to each intangible asset. Considerations may include the contractual term of any agreement related to the asset, the historical performance of the asset, the Company's long-term strategy for using the asset, any laws or other local regulations which could impact the useful life of the asset, and other economic factors, including competition and specific market conditions. Intangible assets that are deemed to have definite lives (finite-lived intangible assets) are amortized, primarily on a straight-line basis, over their useful lives, generally ranging from 2 to 20 years. The cost of identifiable intangible assets of $12.5 million and $15.8 million are included in Noncurrent Assets on the consolidated balance sheets as of December 31, 2017 and 2016, respectively. The decrease in intangible assets of $3.3 million was attributable to a $2.2 million pre-tax impairment charge specific to the LFGTE assets customer relationships, which was primarily driven by revised assumptions for decreased electric production and increased operating expenses, and was recorded in Impairment Charges on the consolidated statements of income, and in the Company's On-Site Energy Production segment. Also contributing to the decrease in intangible assets was amortization expense recorded during 2017 of $1.1 million.
GOODWILL - Goodwill represents the excess of the consideration paid over the fair value of identifiable net assets acquired. Goodwill is not amortized, but instead is subject to impairment testing on an annual basis, and between annual tests whenever events or changes in circumstances indicate that the fair value of a reporting unit may be below its carrying amount. The Company performed its annual goodwill impairment test in the fourth quarter of 2017 beginning with a qualitative assessment at the reporting unit level. The reporting unit level is identified by assessing whether the components of our operating segments constitute businesses for which discrete financial information is available, whether segment management regularly reviews the operating results of those components and whether the economic and regulatory characteristics are similar. Factors utilized in the qualitative analysis performed on goodwill in our reporting units include, among other things, macroeconomic conditions, industry and market considerations, cost factors, overall financial performance, company specific operating results and other relevant entity-specific events affecting individual reporting units.
In the absence of sufficient qualitative factors, goodwill impairment is determined using a two-step process. Step one identifies potential impairment by comparing the fair value of a reporting unit to the book value, including goodwill. If the fair value exceeds book value, goodwill of the reporting unit is not considered impaired. If the book value exceeds fair value, proceed to step two, which compares the implied fair value of the reporting unit's goodwill to the book value of the reporting unit goodwill. If the book value of goodwill exceeds the implied fair value, an impairment charge is recognized for the excess.
In connection with the annual goodwill impairment assessment, the Company performed a qualitative assessment over its business units and noted that as a result of the continuing cash flow losses incurred at the LFGTE's business unit, the two-step impairment test was necessary. Based on the results of the goodwill impairment test, the Company determined that the carrying value of the LFGTE's reporting unit was higher than the fair value, and accordingly, the Company recognized a pre-tax impairment charge of $1.3 million during the year ended December 31, 2017, recorded in Impairment Charges on the consolidated statements of income and included in the Company's On-Site Energy Production segment.
The Company concluded based on the results of the annual testing performed that, other than the impairment charges noted above, there were no other impairments identified for the years ended December 31, 2017 and 2016.
Goodwill of $3.6 million and $4.8 million is included in the Company's On-Site Energy Production segment and Noncurrent Assets on the consolidated balance sheets as of December 31, 2017 and 2016, respectively. SJG does not have any goodwill.
The following table summarizes the changes in Goodwill for the years ended December 31, 2017 and 2016, respectively (in thousands):
| 2017 | 2016 | |||||
| Beginning Balance, January 1 | $ | 4,838 | $ | 8,880 | ||
| Impairment of Goodwill (see above) | (1,260 | ) | — | |||
| Fair Value Adjustments During Measurement Period (See Note 3) | — | (4,042 | ) | |||
| Ending Balance, December 31 | $ | 3,578 | $ | 4,838 | ||
NEW ACCOUNTING PRONOUNCEMENTS- Other than as described below, no new accounting pronouncement issued or effective during 2015, 20142017, 2016 or 20132015 had, or is expected to have, a material impact on the consolidated financial statements.
In May 2014, the FASB issued ASU 2014-09, Revenue from Contracts with Customers (Topic 606);. This ASU supersedes the revenue recognition requirements in FASB ASC 605, Revenue Recognition, and in most industry-specific topics. The new guidance identifies how and when entities should recognize revenue. The new rules establish a core principle requiring the recognition of revenue to depict the transfer of promised goods or services to customers in an amount reflecting the consideration to which the entity expects to be entitled in exchange for such goods or services. In connection with this new standard, the FASB has issued several amendments to ASU 2014-09, as follows:
In March 2016, the FASB issued ASU 2016-08, Revenue from Contracts with Customers (Topic 606): Principal versus Agent Considerations (Reporting Revenue Gross versus Net). This standard improves the implementation guidance on principal versus agent considerations and whether an entity reports revenue on a gross or net basis.
In April 2016, the FASB issued ASU 2016-10, Revenue from Contracts with Customers (Topic 606): Identifying Performance Obligations and Licensing. This standard clarifies identifying performance obligations and the licensing implementation guidance.
In May 2016, the FASB issued ASU 2016-12, Revenue from Contracts with Customers (Topic 606): Narrow-Scope Improvements and Practical Expedients. This standard provides additional guidance on (a) the objective of the collectibility criterion, (b) the presentation of sales tax collected from customers, (c) the measurement date of non-cash consideration received, (d) practical expedients in respect of contract modifications and completed contracts at transition, and (e) disclosure of the effects of the accounting change in the period of adoption.
In December 2016, the FASB issued ASU No. 2016-20, Technical Corrections and Improvements to (Topic 606), Revenue from Contracts with Customers, which amends certain narrow aspects of the guidance, including the disclosure of remaining performance obligations and prior-period performance obligations, as well as other amendments to the guidance on loan guarantee fees, contract costs, refund liabilities, advertising costs and the clarification of certain examples.
The new guidance in ASU 2014-09, as well as all amendments discussed above, is effective for fiscal years, and interim periods within those years, beginning after December 15, 2017. Management is currently determiningformed an implementation team that evaluated the impact that adoption of this guidance will have on the Company's financial statement results.
In July 2015, the FASB issued ASU 2015-11,Inventory (Topic 330): Simplifying the Measurement of Inventory. This ASU states that inventory for which cost is determined using a method other than last-in, first-out (LIFO) or the retail method should be subsequently measured at the lower of cost or net realizable value (NRV), rather than at the lower of cost or market. The standard is effective for annual periods, including interim periods within those annual periods, beginning after December 15, 2016. Adoption of this guidance did not have an impact on the financial statement results of SJI or SJG.
In January 2016, the FASB issued ASU 2016-01, Financial Instruments-Overall (Subtopic 825-10): Recognition and Measurement of Financial Assets and Financial Liabilities, which enhances the reporting model for financial instruments and includes amendments to address aspects of recognition, measurement, presentation and disclosure. The standard is effective for annual periods, including interim periods within those annual periods, beginning after December 15, 2017. Early adoption is permitted for only certain portions of the new guidance. Management is currently determining the impact that adoption of this guidance will have on the Company's financial statement results.statements of SJI and SJG.
In August 2015,March 2016, the FASB issued ASU 2015-15,2016-02, Interest - Imputation of Interest (Subtopic 835-30): Presentation and Subsequent Measurement of Debt Issuance Costs Associated with Line-of-Credit Arrangements. Leases (Topic 842)This ASU states that, given the absence of authoritative guidance, which establishes a new lease accounting model for debt issuance costs related to line-of-credit arrangements within ASU 2015-03 (defined above), the SEC staff would not object to an entity deferring and presenting such costslessees. The new standard requires substantially all leases be recognized by lessees on their balance sheet as ana right-of-use asset and subsequently amortizingcorresponding lease liability, including leases currently accounted for as operating leases. The new standard also will result in enhanced quantitative and qualitative disclosures, including significant judgments made by management, to provide greater insight into the deferred debt issuance costs ratably overextent of revenue and expense recognized and expected to be recognized from existing leases. The accounting for leases by the term oflessor remains relatively the line-of-credit arrangement, regardless of whether there are any outstanding borrowings onsame. The standard is effective for annual periods, including interim periods within those annual periods, beginning after December 15, 2018, with early adoption permitted. Management has formed an implementation team that is inventorying leases and evaluating the line-of credit arrangement. Theimpact that adoption of this guidance will have on SJI's and SJG's financial statements, which includes monitoring industry specific developments including the exposure draft issued by the FASB that would introduce a land easement practical expedient to ASC 842. Consistent with the requirements of the standard, SJI and SJG will both transition to the new guidance using the modified retrospective approach. At this time the Company does not plan to early adopt the new guidance.
In March 2016, the FASB issued ASU 2016-05, Derivatives and Hedging (Topic 815): Effect of Derivative Contract Novations on Existing Hedge Accounting Relationships. The amendments in this guidance clarify that a change in the counterparty to a derivative instrument that has been designated as a hedging instrument under Topic 815 does not, in and of itself, require dedesignation of that hedging relationship provided that all other hedge accounting criteria continue to be met. The standard is effective for annual periods, including interim periods within those annual periods, beginning after December 15, 2016, with early adoption permitted. Adoption of this guidance did not have an impact on the Company's financial statement results.statements of SJI or SJG.
In November 2015,March 2016, the FASB issued ASU 2015-17,2016-07, "Balance SheetInvestments- Equity Method and Joint Ventures (Topic 323): Simplifying the Transition to the Equity Method of Accounting, which eliminates the requirement to apply the equity method of accounting retrospectively when a reporting entity obtains significant influence over a previously held investment. The standard is effective for annual periods, including interim periods within those annual periods, beginning after December 15, 2016, with early adoption permitted. Adoption of this guidance did not have an impact on the financial statements of SJI or SJG.
In March 2016, the FASB issued ASU 2016-09, Compensation—Stock Compensation (Topic 718): Improvements to Employee Share-Based Payment Accounting, which simplifies various aspects of accounting for share-based payment arrangements. The standard is effective for annual periods, including interim periods within those annual periods, beginning after December 15, 2016, with early adoption permitted. Adoption of this guidance did not have a material impact on the financial statements of SJI or SJG; however, cash flow presentation was modified for SJI to conform to this guidance, as described under “Basis of Presentation” above.
In August 2016, the FASB issued ASU 2016-15, Statement of Cash Flows (Topic 230): Classification of Deferred Taxes,"Certain Cash Receipts and Cash Payments. which simplifiesThis standard is intended to provide guidance concerning the presentationclassification of deferred taxes by requiring that deferred tax assetscertain cash receipts and liabilities be presented as noncurrentcash payments in the statement of cash flows and to eliminate the diversity in practice related to such classifications. This standard is effective for annual periods, including interim periods within those annual periods, beginning after December 15, 2017, with early adoption permitted. Both SJI and SJG early adopted this ASU in the first quarter of 2017, and adoption of this guidance did not have an impact on the balance sheet.financial statements of SJI or SJG.
In October 2016, the FASB issued ASU 2015-172016-16, Income Taxes (Topic 740); Intra-Entity Transfers of Assets Other Than Inventory. This standard requires recognition of the current and deferred income tax effects of an intra-entity asset transfer, other than inventory, when the transfer occurs, as opposed to current GAAP, which requires companies to defer the income tax effects of intra-entity asset transfers until the asset has been sold to an outside party. The income tax effects of intra-entity inventory transfers will continue to be deferred until the inventory is sold. ASU 2016-16 is effective for annual reporting periods and interim periods therein, beginning after December 15, 2016.2017, including interim reporting periods within those annual reporting periods, with early adoption permitted. The standard is required to be adopted on a modified retrospective basis with a cumulative-effect adjustment recorded to retained earnings as of the beginning of the period of adoption. Management is currently determining the impact that adoption of this guidance will have on the financial statements of SJI and SJG.
In November 2016, the FASB issued ASU 2016-18, Statement of Cash Flows (Topic 230): Restricted Cash. This standard is intended to reduce diversity in practice in the classification and presentation of changes in restricted cash on the consolidated statement of cash flows. The ASU requires that the consolidated statement of cash flows explain the change in total cash and cash equivalents and amounts generally described as restricted cash or restricted cash equivalents when reconciling the beginning-of-period and end-of-period total amounts. The ASU also requires a reconciliation between the total of cash and equivalents and restricted cash presented on the consolidated statement of cash flows and the cash and cash equivalents balance presented on the consolidated balance sheets. ASU 2016-18 is effective for fiscal years beginning after December 15, 2017, and interim periods within those fiscal years, with early adoption permitted. Both SJI and SJG early adopted this ASU in the first quarter of 2017. Accordingly, cash flow presentations were modified for both entities to conform to this guidance, as described under “Basis of Presentation” above.
In January 2017, the FASB issued ASU 2017-01, Business Combinations (Topic 805): Clarifying the Definition of a Business. This new standard provides amended and clarifying guidance regarding whether an integrated set of assets and activities acquired is deemed the acquisition of a business (and, thus, accounted for as a business combination) or the acquisition of assets. This ASU is effective for fiscal years beginning after December 15, 2017, including interim periods within those fiscal years, with early adoption permitted. Management is currently determining the impact that adoption of this guidance will have on the financial statements of SJI and SJG.
In January 2017, the FASB issued ASU 2017-04, Intangibles - Goodwill and Other (Topic 350): Simplifying the Test for Goodwill Impairment. The update simplifies how an entity is required to test goodwill for impairment by eliminating Step 2 from the goodwill impairment test. Step 2 measures a goodwill impairment loss by comparing the implied fair value of a reporting unit’s goodwill with the carrying amount. The amendments in this Update are effective for annual and any interim impairment tests performed in periods beginning after December 31, 2019. Management is currently determining the impact that adoption of this guidance will have on the financial statements of SJI and SJG.
In March 2017, the FASB issued ASU 2017-07, Compensation—Retirement Benefits (Topic 715): Improving the Presentation of Net Periodic Pension Cost and Net Periodic Postretirement Benefit Cost. This ASU is designed to improve guidance related to the presentation of defined benefit costs in the income statement. In particular, this ASU requires an employer to report the service cost component in the same line item(s) as other compensation costs arising from services rendered by the pertinent employees during the period. The standard is effective for annual periods beginning after December 15, 2017, including interim periods within those annual periods. Management is currently determining the impact that adoption of this guidance will have on the financial statements of SJI and SJG.
In May 2017, the FASB issued ASU 2017-09, Compensation - Stock Compensation (Topic 718): Scope of Modification Accounting. This ASU clarifies and reduces both (i) diversity in practice and (ii) cost and complexity when applying the guidance in Topic 718, to a change to the terms and conditions of a share-based payment award. This standard is effective for annual periods beginning after December 15, 2017, including interim periods within those annual periods, with early adoption permitted. The amendments in this ASU should be applied prospectively to an award modified on or after the adoption date. Management is currently determining the impact that adoption of this guidance will have on the financial statements of SJI and SJG.
In August 2017, the FASB issued ASU 2017-12, Derivatives and Hedging (Topic 815): Targeted Improvements to Accounting for Hedging Activities. This ASU is intended to improve the financial reporting of hedging relationships so that it represents a more faithful portrayal of an entity’s risk management activities (i.e. to help financial statement users understand an entity’s risk exposures and the manner in which hedging strategies are used to manage them), as well as to further simplify the application of the hedge accounting guidance in GAAP. The standard is effective for annual periods beginning after December 15, 2018, including interim periods within those annual periods. Management is currently determining the impact that adoption of this guidance will have on the financial statements of SJI and SJG.
In February 2018, the FASB issued ASU 2018-02, Reclassification of Certain Tax Effects From Accumulated Other Comprehensive Income. This ASU allows a reclassification from accumulated other comprehensive income to retained earnings for stranded tax effects resulting from the Tax Cuts and Jobs Act (Tax Reform). Consequently, the amendments eliminate the stranded tax effects resulting from the Tax Reform and will improve the usefulness of information reported to financial statement users. The ASU is effective for all entities for fiscal years beginning after December 15, 2018, and interim periods within those fiscal years. Early adoption is permitted forpermitted. Management is currently determining the impact that adoption of this guidance will have on the financial statements that have not previously been issued. This ASU 2015-17 may be applied either prospectively to all deferred tax liabilitiesof SJI and assets or retrospectively to all periods presented. The Company adopted this guidance, prospectively, as of December 31, 2015 (see note 6).SJG.
| 2. | STOCK-BASED COMPENSATION |
In 2015, SJI also grantedbegan granting time-based shares of restricted stock, one-third of which vests annually over a three-year period and iswhich are limited to 100% payout. Vesting of time-based grants is contingent upon SJI achieving a return on equity (ROE) of at least 7% during the initial year of the grant and meeting the service requirement. Provided that the 7% ROE requirement is met in the initial year, payout is solely contingent upon the service requirement being met in years two and three of the grant. In 2017, 2016, and 2015, SJG Officers and other key employees were granted 7,87853,058, 58,304, and 47,678 shares of time-based restricted stock, respectively, which are included in the shares table below.noted above.
Grants containing market-based performance targets use SJI's total shareholder return (TSR) relative to a peer group to measure performance. As TSR-based grants are contingent upon market and service conditions, SJI is required to measure and recognize stock-based compensation expense based on the fair value at the date of grant on a straight-line basis over the requisite three-year period of each award. In addition, SJI identifies specific forfeitures of share-based awards, and compensation expense is adjusted accordingly over the requisite service period. Compensation expense is not adjusted based on the actual achievement of performance goals. The fair value of TSR-based restricted stock awards on the date of grant is estimated using a Monte Carlo simulation model.
Through 2014, grants containing earnings-based targets were based on SJI's earnings growth rate per share (EPS) growth rate(EGR) relative to a peer group to measure performance. Beginning inIn 2015, earnings-based performance targets include predefined EPSincluded pre-defined EGR and ROE goals to measure performance. Beginning in 2016, performance targets include pre-defined compounded earnings annual growth rate (CEGR) for SJI. As EPS-basedEGR-based, ROE-based and ROE-basedCEGR-based grants are contingent upon performance and service conditions, SJI is required to measure and recognize stock-based compensation expense based on the fair value at the date of grant over the requisite three-year period of each award. The fair value is measured as the market price at the date of grant. The initial accruals of compensation expense are based on the estimated number of shares expected to vest, assuming the requisite service is rendered and probable outcome of the performance condition is achieved. That estimate is revised if subsequent information indicates that the actual number of shares is likely to differ from previous estimates. Compensation expense is ultimately adjusted based on the actual achievement of service and performance targets.
The following table summarizes the SJI nonvested restricted stock awards pertaining to SJG outstanding at December 31, 2015,2017, and the assumptions used to estimate the fair value of the awards:
| Grant Date | Shares Outstanding | Fair Value Per Share | Expected Volatility | Risk-Free Interest Rate | |||||||||
| 2014 - TSR | 10,287 | $ | 21.31 | 20.0 | % | 0.80 | % | ||||||
| 2014 - EPS | 10,287 | $ | 27.22 | n/a | n/a | ||||||||
| 2015 - TSR | 7,250 | $ | 26.31 | 16.0 | % | 1.10 | % | ||||||
| 2015 - EPS, ROE, Time | 18,651 | $ | 29.47 | n/a | n/a | ||||||||
| Grants | Shares Outstanding | Fair Value Per Share | Expected Volatility | Risk-Free Interest Rate | ||||||||||
| Officers & Key Employees - | 2015 - Time | 11,142 | $ | 29.47 | N/A | N/A | ||||||||
| 2016 - TSR | 65,206 | $ | 22.53 | 18.1 | % | 1.31 | % | |||||||
| 2016 - CEGR, Time | 101,987 | $ | 23.52 | N/A | N/A | |||||||||
| 2017 - TSR | 56,191 | $ | 32.17 | 20.8 | % | 1.47 | % | |||||||
| 2017 - CEGR, Time | 108,267 | $ | 33.69 | N/A | N/A | |||||||||
| Directors - | 2017 | 30,394 | $ | 33.64 | N/A | N/A | ||||||||
Expected volatility is based on the actual volatility of SJI’s share price over the preceding three-yearthree-year period as of the valuation date. The risk-free interest rate is based on the zero-coupon U.S. Treasury Bond, with a term equal to the three-yearthree-year term of the Officers' and other key employees' restricted shares. As notional dividend equivalents are credited to the holders during the three yearthree-year service period, no reduction to the fair value of the award is required.
The following table summarizes the total stock-based compensation cost for the years ended December 31 (in thousands):
| 2017 | 2016 | 2015 | |||||||||
| Officers & Key Employees | $ | 3,232 | $ | 3,051 | $ | 1,128 | |||||
| Directors | 1,022 | 841 | 769 | ||||||||
| Total Cost | 4,254 | 3,892 | 1,897 | ||||||||
| Capitalized | (288 | ) | (385 | ) | (216 | ) | |||||
| Net Expense | $ | 3,966 | $ | 3,507 | $ | 1,681 | |||||
The table above reflects the reversal of approximately $1.1 million,, $0.2 $0.1 million and $0.4$1.2 million of previously recorded costs in 2017, 2016 and 2015, 2014 and 2013, respectively. Of these costs, approximately one half was capitalized to Utility Plant in each of those years. These reversals are associated with EPS-based grants for which performance goals were not met.
As of December 31, 2015,2017, there was $0.7$5.0 million of total unrecognized compensation cost related to nonvested share-basedstock-based compensation awards granted under the restricted stock plans. That cost is expected to be recognized over a weighted average period of 1.81.7 years.
The following table summarizes information regarding restricted stock award activity during 2015,2017, excluding accrued dividend equivalents:
| Shares | Weighted Average Grant Date Fair Value | |||||
| Nonvested Shares Outstanding, January 1, 2015 | 36,794 | $ | 24.10 | |||
| Granted | 26,266 | $ | 28.58 | |||
| Vested* | (15,948 | ) | $ | 23.89 | ||
| Cancelled/Forfeited | (637 | ) | $ | 26.71 | ||
| Nonvested Shares Outstanding, December 31, 2015 | 46,475 | $ | 26.67 | |||
| Officers & Other Key Employees | Directors | Weighted Average Fair Value | |||||||
| Nonvested Shares Outstanding, January 1, 2017 | 295,515 | 35,197 | $ | 24.96 | |||||
| Granted | 167,734 | 30,394 | $ | 33.24 | |||||
| Vested* | (114,199 | ) | (35,197 | ) | $ | 24.81 | |||
| Cancelled/Forfeited** | (6,257 | ) | — | $ | 28.77 | ||||
| Nonvested Shares Outstanding, December 31, 2017 | 342,793 | 30,394 | $ | 28.60 | |||||
*Based on performance information available at the filing of this report,Report, management does not expectexpects to award 15,092 shares associated with the 20132015 grants to officersOfficers and other key employees in 2016.2018.
** Represents shares forfeited as a result of separation of employment prior to the satisfaction of service conditions.
During the three-year vesting periods were not attained for the 2011 or 2012 grants that vested atyears ended December 31, 20132017 and 2014, respectively. As a result, no2016, SJI awarded 65,628 and 13,247, respectively, shares were awarded in 2014 or 2015. During 2013, SJG awarded 12,901 shares that had vested at December 31, 2012, to its officersOfficers and other key employees at a market value of $0.6$2.2 million. SJG and $0.3 million, respectively. In 2015, no shares were awarded. Also, during the years ended December 31, 2017, 2016 and 2015, SJI granted 30,394, 35,197 and 26,338 shares to its Directors at a market value of $1.0 million, $0.8 million and $0.8 million, respectively.
SJI has a policy of making cash payments to SJIissuing new shares to satisfy its obligations under the Plan; therefore, there are no cash payment requirements resulting from the normal operation of the Plan. Cash payments to SJI during 2015, 2014 and 2013 were approximately $0.2 million, $0.4 million and $0.4 million, respectively, relating to stock awards. Additionally,However, a change in control could result in the nonvestedsuch shares becoming nonforfeitable or immediately payable in cash. At the discretion of the Officers, Directors and other key employees, the receipt of vested shares can be deferred until future periods. These deferred shares are included in Treasury Stock on the consolidated balance sheets.
SJG - Officers and other key employees of SJG participate in the stock-based compensation plans of SJI. During the years ended December 31, 2017, 2016 and 2015, SJG officers and other key employees were granted 24,001, 33,218 and 26,266 shares of SJI restricted stock, respectively. The cost of outstanding stock awards for SJG during the years ended December 31, 2017, 2016 and 2015 was $0.4 million and $0.6 million and 0.3 million, respectively. Approximately one-half of these costs were capitalized on SJG's balance sheets to Utility Plant.
| 3. | AFFILIATIONS, DISCONTINUED OPERATIONS AND RELATED-PARTY TRANSACTIONS: |
AFFILIATIONS — The following affiliated entities are accounted for under the equity method:
Energenic – US, LLC (Energenic) - Marina and a joint venture partner formed Energenic, in which Marina has a 50% equity interest. Energenic developed and operated on-site, self-contained, energy-related projects.
On December 31, 2015, Energenic, Marina and its joint venture partner entered into two Equity Distribution and Purchase Agreements (the "Transaction"), pursuant to which Marina became the sole owner of eight of the Energenic projects ("Marina Projects") and its joint venture partner became the sole owner of seven other Energenic projects ("Partner Projects"). The Transaction has been accounted for as a distribution of member interests by Energenic to its owners and a business combination through the exchange of member interests in various projects between Marina and its joint venture partner. In connection with the exchange, the joint venture partner provided a $19.5 million note payable to Marina. The note and other existing obligations of the joint venture partner to Marina are included in Notes Receivable on the consolidated balance sheets, with approximately $1.5 million being included as a current asset as of December 31, 2016 as it is due within one year. This note is collateralized by security interests in various energy project assets owned by the joint venture partner, as well as personal guarantees from its principals.
As part of the transaction, each party is relieved of any guarantees related to the Projects in which it no longer has an ownership interest.
The projects that are now wholly-owned by Marina are ACB, ACLE, BCLE, SCLE, SXLE, MCS, NBS and SBS.
Through December 31, 2015, Marina’s investment in Energenic was accounted for under the equity method of accounting. As such, Marina’s share of the equity value of the projects was included within Investment in Affiliates on the consolidated balance sheets and Marina’s share of the loss or earnings from the projects was included within Equity in (Loss) Earnings of Affiliated Companies on the statements of consolidated income for the years ended December 31, 2015 and 2014, respectively. As of December 31, 2015, the assets and liabilities of the projects that are now wholly-owned by Marina are consolidated into the consolidated balance sheets. Beginning in 2016, the respective results from operations and cash flows of the projects that are now wholly-owned by Marina are consolidated into the statements of consolidated income and cash flows, respectively. This transaction represents a non-cash investing and financing activity. The results of the acquired projects are included in the On-Site Energy Production segment.
The following table summarizes the final purchase price allocation and reflects 100% of the fair values of the assets acquired and the liabilities assumed by the Company in connection with the Transaction. Total consideration for the step acquisition of the remaining interest in the Marina Projects was $46.0 million, which represents the fair value of the Company’s interest in the Partner Projects exchanged ($31.5 million) as well as the existing value of the Marina Projects immediately prior to the exchange ($14.5 million) (in thousands):
| Current assets (excluding inventory) | $ | 7,804 | |
| Inventory | 3,154 | ||
| Note Receivable Received | 19,504 | ||
| Fixed Assets | 46,460 | ||
| Intangible Assets: | |||
| Identifiable Intangibles | 16,950 | ||
| Goodwill | 4,838 | ||
| Non-Current Assets | 4,783 | ||
| Current Liabilities | (8,196 | ) | |
| Note Payable - Affiliate | (16,986 | ) | |
| Long-Term Debt, including current portion | (21,642 | ) | |
| Capital Lease Payable | (10,458 | ) | |
| Other Non-Current Liabilities | (181 | ) | |
| Fair Value of Consolidated Assets and Liabilities of Acquired Projects | $ | 46,030 | |
The pro forma impact of this transaction on the operations of the Company is not significant.
Potato Creek, LLC (Potato Creek) - SJI and a joint venture partner formed Potato Creek, in which SJI has a 30% equity interest. Potato Creek owns and manages the oil, gas and mineral rights of certain real estate in Pennsylvania.
PennEast Pipeline Company, LLC (PennEast) - Midstream has a 20% investment in PennEast, which is planning to construct an approximately 118-mile natural gas pipeline that will extend from Northeastern Pennsylvania into New Jersey.
Millennium Account Services, LLC (Millennium) - SJI and a joint venture partner formed Millennium, in which SJI has a 50% equity interest. Millennium reads utility customers’ meters on a monthly basis for a fee.
EnergyMark, LLC (EnergyMark) - SJE has a 33% investment in EnergyMark, an entity that acquires and markets natural gas to retail end users.
For the years ended December 31, 2017 and 2016, SJRG had net sales to EnergyMark of $37.5 million and $31.4 million, respectively.
The Company made net investments in unconsolidated affiliates of $32.1 million and $7.5 million in 2017 and 2016, respectively. As of December 31, 2017 and 2016, the outstanding balance of Notes Receivable – Affiliate was $18.2 million and $15.7 million, respectively. As of December 31, 2017, approximately $13.6 million of these notes are secured by property, plant and equipment of the affiliates, accrue interest at 7.5% and are to be repaid through 2025. The remaining $4.6 million of these notes are unsecured and accrue interest at variable rates.
SJI holds significant variable interests in these entities but is not the primary beneficiary. Consequently, these entities are accounted for under the equity method because SJI does not have both (a) the power to direct the activities of the entity that most significantly impact the entity’s economic performance and (b) the obligation to absorb losses of the entity that could potentially be significant to the entity or the right to receive benefits from the entity that could potentially be significant to the entity. As of December 31, 2017, the Company had a net asset of approximately $62.3 million included in Investment in Affiliates on the consolidated balance sheets related to equity method investees, in addition to Notes Receivable – Affiliate as discussed above. SJI’s maximum exposure to loss from these entities as of December 31, 2017 is limited to its combined equity contributions and the Notes Receivable-Affiliate in the aggregate amount of $80.5 million.
DISCONTINUED OPERATIONS - Discontinued Operations consist of the environmental remediation activities related to the properties of South Jersey Fuel, Inc. (SJF) and the product liability litigation and environmental remediation activities related to the prior business of The Morie Company, Inc. (Morie). SJF is a subsidiary of Energy & Minerals, Inc. (EMI), an SJI subsidiary, which previously operated a fuel oil business. Morie is the former sand mining and processing subsidiary of EMI. EMI sold the common stock of Morie in 1996.
SJI conducts tests annually to estimate the environmental remediation costs for these properties.
Summarized operating results of the discontinued operations for the years ended December 31, were (in thousands, except per share amounts):
| 2017 | 2016 | 2015 | |||||||||
| Loss before Income Taxes: | |||||||||||
| Sand Mining | $ | (84 | ) | $ | (205 | ) | $ | (422 | ) | ||
| Fuel Oil | (175 | ) | (179 | ) | (338 | ) | |||||
| Income Tax Benefits | 173 | 133 | 257 | ||||||||
| Loss from Discontinued Operations — Net | $ | (86 | ) | $ | (251 | ) | $ | (503 | ) | ||
| Earnings Per Common Share from | |||||||||||
| Discontinued Operations — Net: | |||||||||||
| Basic and Diluted | $ | — | $ | — | $ | (0.01 | ) | ||||
SJG RELATED-PARTY TRANSACTIONS - SJG conducts business with its parent, SJI, and several other related parties. A description of each of these affiliates and related transactions is as follows:
South Jersey Energy Solutions, LLC (SJES) - a wholly owned subsidiary of SJI that serves as a holding company for all of SJI’s nonutility operating businesses:
SJE - For SJE’s commercial customers, for which SJG performs billing services, SJG purchases the related accounts receivable at book value and charges them a purchase of receivable fee (POR) for potential uncollectible accounts, and assumes all risk associated with collection.
SJRG - SJG sells natural gas for resale and capacity release to SJRG and also meets some of SJG's gas purchasing requirements by purchasing natural gas from SJRG.
Marina - SJG provides natural gas transportation services to Marina under BPU-approved tariffs.
Millennium - Reads SJG's utility customers’ meters on a monthly basis for a fee.
Sales of gas to SJRG and SJE comply with Section 284.02 of the Regulations of the Federal Energy Regulatory Commission (FERC).
In addition to the above, SJG provides various administrative and professional services to SJI and each of the affiliates discussed above. Likewise, SJI provides substantial administrative services on SJG's behalf. For certain types of transactions, SJG served as central processing agents for the related parties discussed above. Amounts due to and due from these related parties for pass-through items are not considered material to SJG's financial statements as a whole.
A summary of related party transactions involving SJG, excluding pass-through items, included in SJG's Operating Revenues were as follows (in thousands):
| 2017 | 2016 | 2015 | |||||||||
| Operating Revenues/Affiliates (See Note 1): | |||||||||||
| SJRG | $ | 4,458 | $ | 6,934 | $ | 5,342 | |||||
| Marina | 314 | 302 | 185 | ||||||||
| Other | 86 | 83 | 417 | ||||||||
| Total Operating Revenues/Affiliates | $ | 4,858 | $ | 7,319 | $ | 5,944 | |||||
Related-party transactions involving SJG, excluding pass-through items, included in SJG's Cost of Sales and Operating Expenses were as follows (in thousands):
| 2017 | 2016 | 2015 | |||||||||
| Costs of Sales/Affiliates (excluding depreciation) | |||||||||||
| SJRG* | $ | 24,337 | $ | 16,306 | $ | 26,090 | |||||
| Derivative Losses/(Gains) (See Note 1): | |||||||||||
| SJRG | $ | — | $ | — | $ | 64 | |||||
| Operations Expense/Affiliates: | |||||||||||
| SJI | $ | 22,154 | $ | 20,296 | $ | 14,088 | |||||
| Millennium | 2,856 | 2,803 | 2,746 | ||||||||
| Other | (653 | ) | (198 | ) | (412 | ) | |||||
| Total Operations Expense/Affiliates | $ | 24,357 | $ | 22,901 | $ | 16,422 | |||||
*As discussed in Note 1 to the consolidated financial statements, revenues and expenses related to the energy trading activities of the wholesale energy operations at SJRG are presented on a net basis in Operating Revenues - Nonutility on the statements of consolidated income.
| 4. | INCOME TAXES: |
SJI files a consolidated federal income tax return. State income tax returns are filed on a separate company basis in states where SJI has operations and/or a requirement to file.
Total income taxes applicable to operations differ from the tax that would have resulted by applying the statutory Federal income tax rate to pre-tax income for SJI and SJG for the following reasons (in thousands):
| 2017 | 2016 | 2015 | ||||||||||
| SJI (includes SJG and all other consolidated subsidiaries): | ||||||||||||
| Tax at Statutory Rate | $ | (9,915 | ) | $ | 60,624 | $ | 37,440 | |||||
| Increase (Decrease) Resulting from: | ||||||||||||
| State Income Taxes | 2,778 | 6,438 | 3,985 | |||||||||
| ESOP Dividend | (1,314 | ) | (1,300 | ) | (1,298 | ) | ||||||
| Tax Reform Adjustments | (13,521 | ) | — | — | ||||||||
| Amortization of Investment Tax Credits - Utility | — | — | (149 | ) | ||||||||
| AFUDC | (3,094 | ) | (900 | ) | (1,109 | ) | ||||||
| Investment and Other Tax Credits | (666 | ) | (10,706 | ) | (37,503 | ) | ||||||
| Other - Net | 795 | (5 | ) | (6 | ) | |||||||
| Income Taxes: | ||||||||||||
| Continuing Operations | (24,937 | ) | 54,151 | 1,360 | ||||||||
| Discontinued Operations | (173 | ) | (133 | ) | (257 | ) | ||||||
| Total Income Tax (Benefit) Expense | $ | (25,110 | ) | $ | 54,018 | $ | 1,103 | |||||
| SJG: | ||||||||||||
| Tax at Statutory Rate | 41,390 | 37,944 | 36,233 | |||||||||
| Increase (Decrease) Resulting from: | ||||||||||||
| State Income Taxes | 5,955 | 4,096 | 4,584 | |||||||||
| Amortization of Investment Tax Credits | — | — | (149 | ) | ||||||||
| ESOP Dividend | (1,182 | ) | (1,170 | ) | (1,168 | ) | ||||||
| AFUDC | (1,446 | ) | (900 | ) | (1,109 | ) | ||||||
| Research and Development Credits | — | (613 | ) | (1,400 | ) | |||||||
| Other - Net | 983 | 9 | (46 | ) | ||||||||
| Total Income Tax Expense | 45,700 | 39,366 | 36,945 | |||||||||
| The provision for Income Taxes is comprised of the following (in thousands): | ||||||||||||
| SJI (includes SJG and all other consolidated subsidiaries): | 2017 | 2016 | 2015 | |||||||||
| Current: | ||||||||||||
| Federal | $ | (34,971 | ) | $ | — | $ | — | |||||
| State | (48 | ) | (1,638 | ) | (2,352 | ) | ||||||
| Total Current | (35,019 | ) | (1,638 | ) | (2,352 | ) | ||||||
| Deferred: | ||||||||||||
| Federal | 5,761 | 44,246 | (4,622 | ) | ||||||||
| State | 4,321 | 11,543 | 8,483 | |||||||||
| Total Deferred | 10,082 | 55,789 | 3,861 | |||||||||
| Investment Tax Credit - Utility | — | — | (149 | ) | ||||||||
| Income Taxes: | ||||||||||||
| Continuing Operations | (24,937 | ) | 54,151 | 1,360 | ||||||||
| Discontinued Operations | (173 | ) | (133 | ) | (257 | ) | ||||||
| Total Income Tax (Benefit) Expense | $ | (25,110 | ) | $ | 54,018 | $ | 1,103 | |||||
| SJG: | ||||||||||||
| Current: | ||||||||||||
| Federal | (33,012 | ) | — | — | ||||||||
| State | — | (1,614 | ) | (2,203 | ) | |||||||
| Total Current | $ | (33,012 | ) | $ | (1,614 | ) | $ | (2,203 | ) | |||
| Deferred: | ||||||||||||
| Federal | 69,550 | 33,064 | 30,042 | |||||||||
| State | 9,162 | 7,916 | 9,255 | |||||||||
| Total Deferred | $ | 78,712 | $ | 40,980 | $ | 39,297 | ||||||
| Investment Tax Credits | — | — | (149 | ) | ||||||||
| Total Income Tax Expense | $ | 45,700 | $ | 39,366 | $ | 36,945 | ||||||
For the year ended December 31, 2017, the Company's overall taxes went from an expense in 2016 to a benefit in 2017 primarily due to adjustments made as a result of the Tax Cuts and Jobs Act (discussed below) along with an overall loss before income taxes, as opposed to income in 2016, primarily due to several impairment charges taken (see Note 1), along with an unfavorable court ruling related to a pricing dispute between SJRG and a supplier (see Note 15). These were partially offset with the impact of recording no investment tax credits on renewable energy facilities in 2017 which is consistent with SJI's previously announced strategy of substantially reducing solar development.
Investment Tax Credits attributable to SJG are deferred and amortized at the annual rate of 3.0%, which approximates the life of related assets.
On December 22, 2017, the Tax Cuts and Jobs Act ("Tax Reform") was enacted into law, which changes various corporate income tax provisions within the existing Internal Revenue Code. The law became effective January 1, 2018 but is required to be accounted for in the period of enactment, which for SJI and SJG is the fourth quarter of 2017. SJI and SJG were impacted in several ways as a result of Tax Reform, including provisions related to the permanent reduction in the U.S. federal corporate income tax rate from 35% to 21%, modification of bonus depreciation and changes to the deductibility of certain business related expenses. As a result of the change in the federal corporate income tax rate, SJI and SJG revalued deferred tax assets and liabilities to reflect the rates expected to be in effect as a result of Tax Reform. This resulted in SJI recording a $13.5 million income tax benefit for the decrease of its net deferred tax liabilities, which was recorded in Income Taxes on the consolidated statements of income for the year ended December 31, 2017. SJG also recorded a $263.8 million decrease in its net deferred tax liabilities, which resulted in an increase to SJG's regulatory liabilities as of December 31, 2017 as such amounts are probable of settlement or recovery through customer rates. The amount and timing of potential settlements of the established net regulatory liability will be determined by the BPU, subject to certain IRS "normalization" provisions. All adjustments related to Tax Reform were recorded in the Corporate & Services segment.
The SEC staff issued Staff Accounting Bulletin 118 (SAB 118), which provides guidance on accounting for the tax effects of Tax Reform. SAB 118 provides a measurement period that should not extend beyond one year from the enactment date of Tax Reform for companies to complete the accounting under ASC 740. In accordance with SAB 118, a company must reflect the income tax effects of those aspects of Tax Reform for which the accounting under ASC 740 is complete. To the extent that a company’s accounting for certain income tax effects of Tax Reform is incomplete but it is able to determine a reasonable estimate, it must record a provisional estimate in the financial statements. If a company cannot determine a provisional estimate to be included in the financial statements, it should continue to apply ASC 740 on the basis of the provisions of the tax laws that were in effect immediately before the enactment of Tax Reform.
The Company was able to make reasonable, good faith estimates of certain effects and, therefore, recorded provisional adjustments for the following: the tax rules regarding the appropriate bonus deprecation rate that should be applied to assets placed in service after September 27, 2017, including the information required to compute the applicable depreciable tax basis. Further, Tax Reform is unclear in certain respects and will require interpretations and implementing regulations by the Internal Revenue Service, as well as state tax authorities. Tax Reform could also be subject to potential amendments and technical corrections which could impact the Company’s financial statements.
Any required changes to the provisional estimates would result in the recording of regulatory assets or liabilities to the extent such amounts are probable of settlement or recovery through customer rates and a net change to income tax expense for any other amounts. Final adjustments to the provisional amounts are expected to be recorded by the third quarter of 2018. The accounting for all other applicable provisions of Tax Reform is considered complete based on the current interpretation.
The net tax effect of temporary differences between the carrying amounts of assets and liabilities for financial reporting and income tax purposes resulted in the following net deferred tax assets and liabilities for SJI and SJG at December 31 (in thousands):
| SJI (includes SJG and all other consolidated subsidiaries): | 2017 | 2016 | ||||||
| Deferred Tax Assets: | ||||||||
| Net Operating Loss Carryforward | $ | 152,541 | $ | 211,004 | ||||
| Investment and Other Tax Credits | 214,605 | 213,946 | ||||||
| Derivatives / Unrealized Gain | 2,068 | — | ||||||
| Conservation Incentive Program | — | — | ||||||
| Deferred State Tax | 16,905 | 28,833 | ||||||
| Gross Up of Excess Deferred Taxes | 76,426 | — | ||||||
| Pension & Other Post Retirement Benefits | 16,624 | 19,351 | ||||||
| Deferred Revenues | 5,726 | 7,669 | ||||||
| Provision for Uncollectibles | 3,854 | 5,231 | ||||||
| Other | 1,949 | 8,368 | ||||||
| Total Deferred Tax Asset | $ | 490,698 | $ | 494,402 | ||||
| Deferred Tax Liabilities: | ||||||||
| Book versus Tax Basis of Property | $ | 486,854 | $ | 732,535 | ||||
| Deferred Gas Costs - Net | 10,254 | 2,052 | ||||||
| Derivatives / Unrealized Loss | — | 1,794 | ||||||
| Environmental Remediation | 31,393 | 32,885 | ||||||
| Deferred Regulatory Costs | 3,554 | 1,554 | ||||||
| Budget Billing - Customer Accounts | 4,043 | 3,347 | ||||||
| Deferred Pension & Other Post Retirement Benefits | 21,349 | 34,432 | ||||||
| Conservation Incentive Program | 7,721 | 11,846 | ||||||
| Equity In Loss Of Affiliated Companies | 1,377 | 3,092 | ||||||
| Other | 11,037 | 14,414 | ||||||
| Total Deferred Tax Liability | $ | 577,582 | $ | 837,951 | ||||
| Deferred Tax Liability - Net | $ | 86,884 | $ | 343,549 | ||||
| SJG: | ||||||||
| Deferred Tax Assets: | ||||||||
| Net Operating Loss and Tax Credits | $ | 73,785 | $ | 102,290 | ||||
| Deferred State tax | 14,688 | 24,574 | ||||||
| Provision for Uncollectibles | 3,811 | 5,170 | ||||||
| Gross Up of Excess Deferred Taxes | 76,426 | — | ||||||
| Pension & Other Post Retirement Benefits | 15,031 | 17,264 | ||||||
| Deferred Revenues | 6,066 | 7,696 | ||||||
| Other | 2,413 | 3,573 | ||||||
| Total Deferred Tax Assets | $ | 192,220 | $ | 160,567 | ||||
| Deferred Tax Liabilities: | ||||||||
| Book Versus Tax Basis of Property | $ | 386,642 | $ | 532,330 | ||||
| Deferred Fuel Costs - Net | 10,254 | 2,052 | ||||||
| Environmental Remediation | 31,637 | 33,573 | ||||||
| Deferred Regulatory Costs | 3,554 | 1,554 | ||||||
| Deferred Pension & Other Post Retirement Benefits | 21,349 | 34,432 | ||||||
| Budget Billing - Customer Accounts | 4,043 | 3,347 | ||||||
| Section 461 Prepayments | 866 | 1,147 | ||||||
| Conservation Incentive Program | 7,721 | 11,846 | ||||||
| Other | 6,900 | 9,694 | ||||||
| Total Deferred Tax Liabilities | $ | 472,966 | $ | 629,975 | ||||
| Deferred Tax Liability - Net | $ | 280,746 | $ | 469,408 | ||||
SJG is included in the consolidated federal income tax return filed by SJI. The actual taxes, including credits, are allocated by SJI to its subsidiaries, generally on a separate return basis except for net operating loss and credit carryforwards. As of December 31, 2017 and 2016, there were no income taxes due to or from SJI.
As of December 31, 2017, SJI has the following federal and state net operating loss carryforwards (in thousands):
| Net Operating Loss Carryforwards | |||||||
| Expire in: | Federal | State | |||||
| 2031 | $ | 163,572 | $ | 45,866 | |||
| 2032 | 42,988 | 19,356 | |||||
| 2033 | 56,007 | 35,271 | |||||
| 2034 | 105,763 | 28,853 | |||||
| 2035 | 49,572 | 9,956 | |||||
| 2036 | 72,199 | 181,189 | |||||
| 2037 | 96,326 | 74,175 | |||||
| $ | 586,427 | $ | 394,666 | ||||
As of December 31, 2017, SJI has the following investment tax credit carryforwards (in thousands):
| Expire in: | Investment Tax Credit Carryforward | |||
| 2030 | $ | 11,628 | ||
| 2031 | 25,664 | |||
| 2032 | 32,031 | |||
| 2033 | 45,606 | |||
| 2034 | 37,699 | |||
| 2035 | 45,005 | |||
| 2036 | 11,744 | |||
| 2037 | 636 | |||
| $ | 210,013 | |||
SJI has $1.2 million of federal alternative minimum tax credits which have no expiration date. SJI also has research and development credits of $3.2 million that will expire between 2031 and 2035. As of December 31, 2017 and 2016, SJG has total federal net operating loss carryforwards of $261.1 million and $263.0 million, respectively, that will expire between 2031 and 2037. SJG has a state net operating loss carryforward of $208.8 million and $80.2 million that will expire between 2036 and 2037. SJG has research and development credits of $2.7 million which will expire between 2031 and 2035. A valuation allowance is recorded when it is more likely than not that any of SJI's or SJG's deferred tax assets will not be realized. SJI and SJG believe that they will generate sufficient future taxable income to realize the income tax benefits related to their net deferred tax assets.
A reconciliation of the beginning and ending amount of unrecognized tax benefits for the years ended December 31, is as follows (in thousands):
| SJI (includes SJG and all other consolidated subsidiaries): | 2017 | 2016 | 2015 | |||||||||
| Balance at January 1, | $ | 1,445 | $ | 559 | $ | 552 | ||||||
| Increase as a result of tax positions taken in prior years | — | 886 | 7 | |||||||||
| Balance at December 31, | $ | 1,445 | $ | 1,445 | $ | 559 | ||||||
| SJG: | ||||||||||||
| Balance at January 1, | $ | 1,361 | $ | 559 | $ | 552 | ||||||
| Increase as a result of tax position taken in prior years | — | 802 | 7 | |||||||||
| Balance at December 31, | $ | 1,361 | $ | 1,361 | $ | 559 | ||||||
The total unrecognized tax benefits reflected in the table above exclude $0.8 million of accrued interest and penalties as of December 31, 2017 and $0.7 million as of December 31, 2016 and 2015 for both SJI and SJG. The amount of unrecognized tax benefits that, if recognized, would affect the effective tax rate is not significant. The Company's policy is to record interest and penalties related to unrecognized tax benefits as interest expense and other expense, respectively. These amounts were not significant in 2017, 2016 or 2015. The majority of the increased tax position in 2017 is attributable to research and development credits. The Company does not anticipate any significant changes in the total unrecognized tax benefits within the next 12 months.
The unrecognized tax benefits are primarily related to an uncertainty of state income tax issues relating to the Company's nexus in certain states and tax credits. Federal income tax returns from 2013 forward and state income tax returns from 2008 forward are open and subject to examination.
| 5. | PREFERRED STOCK: |
REDEEMABLE CUMULATIVE PREFERRED STOCK - SJI has 2,500,000 authorized shares of Preference Stock, no par value, which has not been issued.
| 6. | COMMON STOCK: |
The following shares were issued and outstanding at December 31 (See Note 1):
| 2017 | 2016 | 2015 | ||||||
| Beginning of Year | 79,478,055 | 70,965,622 | 68,334,860 | |||||
| New Issuances During Year: | ||||||||
| Dividend Reinvestment Plan | — | 417,095 | 2,604,424 | |||||
| Stock-Based Compensation Plan | 71,025 | 45,338 | 26,338 | |||||
| Public Equity Offering | — | 8,050,000 | — | |||||
| End of Year | 79,549,080 | 79,478,055 | 70,965,622 | |||||
The par value ($1.25 per share) of stock issued was recorded in Common Stock and the net excess over par value at December 31, 2017 of approximately $2.7 million was recorded in Premium on Common Stock.
In May 2016, SJI issued and sold 8,050,000 shares of its common stock, par value $1.25 per share pursuant to a public offering, raising net proceeds of approximately $203.6 million. The net proceeds from this offering were or will be used for capital expenditures, primarily for regulated businesses, including infrastructure investments at its utility business.
There were 2,339,139 shares of SJG's common stock (par value $2.50 per share) outstanding as of December 31, 2017. SJG did not issue any new shares during the period. SJI owns all of the outstanding common stock of SJG.
EARNINGS PER COMMON SHARE (EPS) — Basic EPS is based on the weighted-average number of common shares outstanding. The incremental shares required for inclusion in the denominator for the diluted EPS calculation were 112,590 and 195,139 shares for the years ended December 31, 2016 and 2015, respectively. For the year ended December 31, 2017, incremental shares of 141,750 were not included in the denominator for the diluted EPS calculation because they would have an antidilutive effect on EPS. These shares relate to SJI’s restricted stock as discussed in Note 2.
DIVIDENDS PER SHARE - Dividends per share were $1.10, $1.07 and $1.02 for the years ended December 31, 2017, 2016 and 2015, respectively.
DIVIDEND REINVESTMENT PLAN (DRP) — SJI offers a DRP which allows participating shareholders to purchase shares of SJI common stock by automatic reinvestment of dividends or optional purchases. Prior to May 1, 2016, shares of common stock offered by the DRP had been issued directly by SJI from its authorized but unissued shares of common stock. SJI raised $10.8 million of equity capital through the DRP in 2016. Effective May 1, 2016, SJI switched to purchasing shares on the open market to fund share purchases by DRP participants, and as a result SJI did not raise any equity capital through the DRP in 2017. SJI does not intend to issue equity capital via the DRP in 2018.
SJG RETAINED EARNINGS:
Various loan agreements contain potential restrictions regarding the amount of cash dividends or other distributions that SJG may pay on its common stock. As of December 31, 2017, these loan restrictions did not affect the amount that may be distributed from SJG's retained earnings.
SJG declared and paid cash dividends of $20.0 million in 2017 to SJI. Cash dividends were not declared or paid to SJI in 2016. SJG declared and paid cash dividends of $40.8 million in 2015 to SJI. SJG received a $40.0 million and $65.0 million equity infusion from SJI in 2017 and 2016, respectively; there was no equity infusion in 2015. Future equity contributions will occur on an as needed basis.
| 7. | FINANCIAL INSTRUMENTS: |
RESTRICTED INVESTMENTS —Marina is required to maintain escrow accounts related to ongoing capital projects. As of December 31, 2017 and 2016, the escrowed funds, including interest earned, totaled $0.3 million and $1.9 million, respectively, which are recorded in Restricted Investments on the consolidated balance sheets.
SJI and SJG maintain margin accounts with selected counterparties to support their risk management activities. The balances required to be held in these margin accounts increase as the net value of the outstanding energy-related contracts with the respective counterparties decrease. As of December 31, 2017 and 2016, SJI's balances (including SJG) in these accounts totaled $31.6 million and $11.7 million, respectively, held by the counterparty, which is recorded in Restricted Investments on the consolidated balance sheets. As of December 31, 2017, SJG's balance held by the counterparty totaled $2.9 million and was recorded in Restricted Investments on the balance sheets. As of December 31, 2016, SJG's balance held by SJG as collateral was $3.6 million which was recorded in Accounts Payable - Other on the balance sheets.
The carrying amounts of the Restricted Investments for both SJI and SJG approximate their fair values at December 31, 2017 and 2016, which would be included in Level 1 of the fair value hierarchy (see Note 17).
The following table provides a reconciliation of cash, cash equivalents and restricted cash reported within the consolidated balance sheets that sum to the total of the same such amounts shown in the statement of cash flows (in thousands):
| As of December 31, 2017 | |||||||
| Balance Sheet Line Item | SJI | SJG | |||||
| Cash and Cash Equivalents | 7,819 | 1,707 | |||||
| Restricted Investments | 31,876 | 2,912 | |||||
| Total cash, cash equivalents and restricted cash shown in the statement of cash flows | $ | 39,695 | $ | 4,619 | |||
| As of December 31, 2016 | |||||||
| Balance Sheet Line Item | SJI | SJG | |||||
| Cash and Cash Equivalents | 18,282 | 1,359 | |||||
| Restricted Investments | 13,628 | 32 | |||||
| Total cash, cash equivalents and restricted cash shown in the statement of cash flows | $ | 31,910 | $ | 1,391 | |||
INVESTMENT IN AFFILIATES - During 2011, subsidiaries of Energenic, in which Marina has a 50% equity interest, entered into 20-year contracts to build, own and operate a central energy center and energy distribution system for a new hotel, casino and entertainment complex in Atlantic City, New Jersey. The complex commenced operations in April 2012, and as a result, Energenic subsidiaries began providing full energy services to the complex.
In June 2014, the parent company of the hotel, casino and entertainment complex filed petitions in U. S. Bankruptcy Court to facilitate a sale of substantially all of its assets. The complex ceased normal business operations in September 2014. Energenic subsidiaries continued to provide limited energy services to the complex during the shutdown period under a temporary agreement with the trustee. The hotel, casino and entertainment complex was sold in April 2015. As of December 31, 2015, the Energenic subsidiaries were providing limited services to the complex under a short-term agreement with the new owner. However, the Energenic subsidiaries had not been able to secure a permanent or long-term energy services agreement with the new owner.
In 2015, management of the Company and Energenic evaluated the carrying value of the investment in this project and a related note receivable. Based on the inability of the Energenic subsidiaries to secure a permanent or long-term energy services agreement, the Company recorded a $7.7 million (net of tax) non-cash charge to earnings during the second quarter of 2015 due to the reduction in the carrying value of the investment in this project recorded by Energenic. This charge is included in Equity in Loss of Affiliated Companies for the year ended December 31, 2015 on the statements of consolidated income.
The central energy center and energy distribution system owned by the Energenic subsidiaries was financed in part by the issuance of bonds during 2011. These bonds were collateralized primarily by certain assets of the central energy center and revenue from the energy services agreement with the hotel, casino and entertainment complex. During 2015, due to the cessation of normal business operations of the complex and the inability of the Energenic subsidiaries to meet its obligations under the bonds, the trustee for the bondholders filed suit to foreclose on certain assets of the central energy center. In November 2015 during settlement discussions, the bondholders alleged, among other things, that they were entitled to recover from Energenic itself, any amounts owed under the bonds that were not covered by the collateral, including principal, interest and attorney’s fees. The bondholders’ assertion was based on inconsistent language in the bond documents. In January 2016, Energenic and certain subsidiaries reached a multi-party settlement with the bondholders. This agreement resolves all outstanding litigation and transfers ownership of the bondholders’ collateral to the owners of the entertainment complex. The Company's share of this settlement was $7.5 million, which was accrued by Energenic as of December 31, 2015 and paid in 2016. The Company entered into agreements with its insurance carrier and external legal advisors to recover, net of legal costs, approximately $7.0 million of costs associated with the bondholder settlement discussed above. The Company received $2.1 million in the second quarter of 2016, which is included in Other Income on the statements of consolidated income for the year ended December 31, 2016, and $5.3 million was received in the third quarter of 2016 and is included in Equity in Earnings of Affiliated Companies on the statements of consolidated income for the year ended December 31, 2016, as the loss recorded in the prior year was included in this line item on the statements of consolidated income for the year ended December 31, 2015.
As of December 31, 2017, SJI had approximately $13.6 million included in Notes Receivable - Affiliate on the consolidated balance sheets, due from Energenic, which is secured by its cogeneration assets for energy service projects. This note is subject to a reimbursement agreement that secures reimbursement for SJI, from its joint venture partner, of a proportionate share of any amounts that are not repaid.
Management will continue to monitor the situation surrounding the cogeneration assets and will evaluate the carrying value of the investment and the note receivable as future events occur.
NOTE RECEIVABLE - During 2017, SJI received the remaining balance in connection with an outstanding note receivable with a third party. Cash proceeds received in 2017 were $22.9 million.
LONG-TERM RECEIVABLES — SJG provides financing to customers for the purpose of attracting conversions to natural gas heating systems from competing fuel sources. The terms of these loans call for customers to make monthly payments over periods ranging from five to ten years, with no interest. The carrying amounts of such loans were $7.0 million and $9.5 million as of December 31, 2017 and 2016, respectively. The current portion of these receivables is reflected in Accounts Receivable and the non-current portion is reflected in Contract Receivables on the consolidated balance sheets. The carrying amounts noted above are net of unamortized discounts resulting from imputed interest in the amount of $0.7 million and $0.9 million as of December 31, 2017 and 2016, respectively. The annual amortization to interest is not material to SJI's or SJG's consolidated financial statements. The carrying amounts of these receivables approximate their fair value at December 31, 2017 and 2016, which would be included in Level 2 of the fair value hierarchy (see Note 17).
CREDIT RISK - As of December 31, 2017, SJI had approximately $6.5 million, or 13.5%, of current and noncurrent Derivatives–Energy Related Assets transacted with one counterparty. This counterparty is investment-grade rated with a rating of BBB+.
FINANCIAL INSTRUMENTS NOT CARRIED AT FAIR VALUE - The fair value of a financial instrument is the market price to sell an asset or transfer a liability at the measurement date. The carrying amounts of SJI's and SJG's financial instruments approximate their fair values at December 31, 2017 and 2016, except as noted below.
For Long-Term Debt, in estimating the fair value, SJI and SJG use the present value of remaining cash flows at the balance sheet date. SJI and SJG based the estimates on interest rates available at the end of each period for debt with similar terms and maturities (Level 2 in the fair value hierarchy, see Note 17).
The estimated fair values of SJI's long-term debt (which includes SJG and all consolidated subsidiaries), including current maturities, as of December 31, 2017 and 2016, were $1,216.1 million and $1,080.8 million, respectively. The carrying amounts of SJI's long-term debt, including current maturities, as of December 31, 2017 and 2016, were $1,186.8 million and $1,039.9 million, respectively. The carrying amounts as of December 31, 2017 and 2016 are net of unamortized debt issuance costs of $17.4 million and $7.6 million, respectively.
The estimated fair values of SJG's long-term debt, including current maturities, as of December 31, 2017 and 2016, were $838.5 million and $673.1 million, respectively. The carrying amount of SJG's long-term debt, including current maturities, as of December 31, 2017 and 2016, was $821.9 million and $639.1 million, respectively. The carrying amounts as of December 31, 2017 and 2016 are net of unamortized debt issuance costs of $7.3 million and $6.0 million, respectively.
OTHER FINANCIAL INSTRUMENTS - The carrying amounts of SJI's and SJG's other financial instruments approximate their fair values at December 31, 2017 and 2016.
| 8. | SEGMENTS OF BUSINESS: |
SJI operates in several different reportable operating segments which reflect the financial information regularly evaluated by the chief operating decision maker. These segments are as follows:
Gas utility operations (SJG) consist primarily of natural gas distribution to residential, commercial and industrial customers. The result of SJG only are included in this operating segment.
Wholesale energy operations include the activities of SJRG and SJEX.
SJE is involved in both retail gas and retail electric activities.
| ◦ | Retail gas and other operations include natural gas acquisition and transportation service business lines. |
| ◦ | Retail electric operations consist of electricity acquisition and transportation to commercial, industrial and residential customers. |
On-site energy production consists of Marina's thermal energy facility and other energy-related projects. Also included in this segment are the activities of ACB, ACLE, BCLE, SCLE, SXLE, MCS, NBS and SBS.
Appliance service operations includes SJESP, which serviced residential and small commercial HVAC systems, installed small commercial HVAC systems, provided plumbing services and serviced appliances under warranty via a subcontractor arrangement as well as on a time and materials basis. On September 1, 2017, SJESP sold certain assets of its residential and small commercial HVAC and plumbing business to a third party. SJESP will receive commissions paid on service contracts from the third party on a go forward basis. This transaction did not have a material impact on the consolidated financial statements.
Midstream was formed to invest in infrastructure and other midstream projects, including a current project to build a natural gas pipeline in Pennsylvania and New Jersey.
Costs incurred related to the agreement to acquire Elizabethtown Gas and Elkton Gas are recorded in the Corporate & Services segment.
SJI groups its nonutility operations into two categories: Energy Group and Energy Services. Energy Group includes wholesale energy, retail gas and other, and retail electric operations. Energy Services includes on-site energy production and appliance service operations. The accounting policies of the segments are the same as those described in the summary of significant accounting policies. Intersegment sales and transfers are treated as if the sales or transfers were to third parties at current market prices.
Information about SJI’s operations in different reportable operating segments is presented below (in thousands):
| 2017 | 2016 | 2015 | |||||||||
| Operating Revenues: | |||||||||||
| Gas Utility Operations | $ | 517,254 | $ | 461,055 | $ | 534,290 | |||||
| Energy Group: | |||||||||||
| Wholesale Energy Operations | 352,613 | 220,707 | 129,098 | ||||||||
| Retail Gas and Other Operations | 111,048 | 92,371 | 87,198 | ||||||||
| Retail Electric Operations | 179,534 | 182,540 | 150,049 | ||||||||
| Subtotal Energy Group | 643,195 | 495,618 | 366,345 | ||||||||
| Energy Services: | |||||||||||
| On-Site Energy Production | 99,517 | 94,375 | 63,665 | ||||||||
| Appliance Service Operations | 6,488 | 7,898 | 11,186 | ||||||||
| Subtotal Energy Services | 106,005 | 102,273 | 74,851 | ||||||||
| Corporate & Services | 45,024 | 35,147 | 31,156 | ||||||||
| Subtotal | 1,311,478 | 1,094,093 | 1,006,642 | ||||||||
| Intersegment Sales | (68,410 | ) | (57,593 | ) | (47,074 | ) | |||||
| Total Operating Revenues | $ | 1,243,068 | $ | 1,036,500 | $ | 959,568 | |||||
| 2017 | 2016 | 2015 | |||||||||
| Operating Income: | |||||||||||
| Gas Utility Operations | $ | 136,487 | $ | 122,455 | $ | 119,585 | |||||
| Energy Group: | |||||||||||
| Wholesale Energy Operations | (36,815 | ) | 41,667 | 35,024 | |||||||
| Retail Gas and Other Operations | (2,468 | ) | 4,680 | (3,218 | ) | ||||||
| Retail Electric Operations | 3,620 | 7,007 | 1,042 | ||||||||
| Subtotal Energy Group | (35,663 | ) | 53,354 | 32,848 | |||||||
| Energy Services: | |||||||||||
| On-Site Energy Production | (83,654 | ) | 13,301 | 2,027 | |||||||
| Appliance Service Operations | 217 | 582 | 468 | ||||||||
| Subtotal Energy Services | (83,437 | ) | 13,883 | 2,495 | |||||||
| Corporate and Services | (12,977 | ) | (416 | ) | 1,966 | ||||||
| Total Operating Income | $ | 4,410 | $ | 189,276 | $ | 156,894 | |||||
| Depreciation and Amortization: | |||||||||||
| Gas Utility Operations | $ | 71,654 | $ | 63,901 | $ | 58,668 | |||||
| Energy Group: | |||||||||||
| Wholesale Energy Operations | 125 | 484 | 435 | ||||||||
| Retail Gas and Other Operations | 323 | 337 | 161 | ||||||||
| Subtotal Energy Group | 448 | 821 | 596 | ||||||||
| Energy Services: | |||||||||||
| On-Site Energy Production | 46,928 | 43,395 | 30,242 | ||||||||
| Appliance Service Operations | 153 | 301 | 316 | ||||||||
| Subtotal Energy Services | 47,081 | 43,696 | 30,558 | ||||||||
| Corporate and Services | 4,303 | 1,400 | 1,220 | ||||||||
| Total Depreciation and Amortization | $ | 123,486 | $ | 109,818 | $ | 91,042 | |||||
| Interest Charges: | |||||||||||
| Gas Utility Operations | $ | 24,705 | $ | 17,875 | $ | 19,906 | |||||
| Energy Group: | |||||||||||
| Wholesale Energy Operations | 3,150 | — | 441 | ||||||||
| Retail Gas and Other Operations | 250 | 350 | 185 | ||||||||
| Subtotal Energy Group | 3,400 | 350 | 626 | ||||||||
| Energy Services: | |||||||||||
| On-Site Energy Production | 16,838 | 11,961 | 8,169 | ||||||||
| Corporate and Services | 24,804 | 12,118 | 11,822 | ||||||||
| Subtotal | 69,747 | 42,304 | 40,523 | ||||||||
| Intersegment Borrowings | (15,728 | ) | (10,855 | ) | (8,901 | ) | |||||
| Total Interest Charges | $ | 54,019 | $ | 31,449 | $ | 31,622 | |||||
| 2017 | 2016 | 2015 | |||||||||
| Income Taxes: | |||||||||||
| Gas Utility Operations | $ | 45,700 | $ | 39,366 | $ | 36,945 | |||||
| Energy Group: | |||||||||||
| Wholesale Energy Operations | (14,720 | ) | 15,882 | 14,410 | |||||||
| Retail Gas and Other Operations | (544 | ) | 2,118 | (978 | ) | ||||||
| Retail Electric Operations | 1,480 | 2,862 | 426 | ||||||||
| Subtotal Energy Group | (13,784 | ) | 20,862 | 13,858 | |||||||
| Energy Services: | |||||||||||
| On-Site Energy Production | (39,262 | ) | (6,353 | ) | (49,225 | ) | |||||
| Appliance Service Operations | 4 | 232 | 186 | ||||||||
| Subtotal Energy Services | (39,258 | ) | (6,121 | ) | (49,039 | ) | |||||
| Corporate and Services | (17,595 | ) | 44 | (404 | ) | ||||||
| Total Income Taxes | $ | (24,937 | ) | $ | 54,151 | $ | 1,360 | ||||
| Property Additions (See Note 1): | |||||||||||
| Gas Utility Operations | $ | 253,545 | $ | 228,275 | $ | 218,260 | |||||
| Energy Group: | |||||||||||
| Wholesale Energy Operations | 14 | 7 | 382 | ||||||||
| Retail Gas and Other Operations | 889 | 1,642 | 2,053 | ||||||||
| Subtotal Energy Group | 903 | 1,649 | 2,435 | ||||||||
| Energy Services: | |||||||||||
| On-Site Energy Production (1) | 12,588 | 38,193 | 139,018 | ||||||||
| Appliance Service Operations | 260 | 431 | 379 | ||||||||
| Subtotal Energy Services | 12,848 | 38,624 | 139,397 | ||||||||
| Midstream | 218 | 505 | — | ||||||||
| Corporate and Services | 2,233 | 636 | 1,902 | ||||||||
| Total Property Additions | $ | 269,747 | $ | 269,689 | $ | 361,994 | |||||
(1) The property additions for On-Site Energy Production in 2016 and 2015 do not include the approximately $5.6 million and $40.9 million of Property, Plant and Equipment obtained through the acquisition of eight Energenic projects as discussed in Note 3.
| 2017 | 2016 | ||||||
| Identifiable Assets (See Note 1): | |||||||
| Gas Utility Operations | $ | 2,865,974 | $ | 2,551,923 | |||
| Energy Group: | |||||||
| Wholesale Energy Operations | 208,785 | 233,019 | |||||
| Retail Gas and Other Operations | 56,935 | 52,729 | |||||
| Retail Electric Operations | 34,923 | 41,280 | |||||
| Subtotal Energy Group | 300,643 | 327,028 | |||||
| Energy Services: | |||||||
| On-Site Energy Production | 582,587 | 767,710 | |||||
| Appliance Service Operations | 1,338 | 2,879 | |||||
| Subtotal Energy Services | 583,925 | 770,589 | |||||
| Discontinued Operations | 1,757 | 1,756 | |||||
| Midstream | 63,112 | 26,636 | |||||
| Corporate and Services | 711,038 | 623,159 | |||||
| Intersegment Assets | (661,363 | ) | (570,524 | ) | |||
| Total Identifiable Assets | $ | 3,865,086 | $ | 3,730,567 | |||
9. LEASES:
Marina is considered to be the lessor of certain thermal energy generating property and equipment under an operating lease which expires in May 2027. As of December 31, 2017 and 2016, the carrying costs of this property and equipment under operating lease was $74.2 million and $75.9 million, respectively (net of accumulated depreciation of $34.5 million and $31.4 million , respectively), and is included in Nonutility Property and Equipment in the consolidated balance sheets.
Minimum future rentals to be received on this operating lease of property and equipment as of December 31, 2017 for each of the next five years and in the aggregate are (in thousands):
| Year ended December 31, | |||
| 2018 | $ | 5,396 | |
| 2019 | 5,396 | ||
| 2020 | 5,396 | ||
| 2021 | 5,396 | ||
| 2022 | 5,396 | ||
| Thereafter | 23,834 | ||
| Total minimum future rentals | 50,814 | ||
Minimum future rentals do not include additional amounts to be received based on actual use of the leased property.
| 10. | RATES AND REGULATORY ACTIONS: |
In September 2010,January 2017, SJG filed a base rate case with the BPU to increase its base rates in order to obtain a return on new capital investments made by SJG since the settlement of its last base rate case in 2014. In October 2017, SJG settled its base rate case, pursuant to which the BPU granted SJG a base rate increase, effective November 1, 2017, of $42.1$39.5 million, which was predicated in part upon an 8.21%a 6.80% rate of return on rate base that included a 10.3%9.60% return on common equity. The $42.1 million includes $16.6 million of revenue previously recovered through the Conservation Incentive Program (CIP) and $6.8 million of revenues previously recovered through the Capital Investment Recovery Tracker (CIRT), resulting in incremental revenue of $18.7 million.BPU Order allows SJG was permitted to recover regulatory assets contained inrevenues associated with certain infrastructure and system improvement investments made and the related expenses incurred since the approval of its petition and defer certain federally mandated pipeline integrity management program costs for recovery in its nextprevious base rate case. In addition, annual depreciation expense was reduced by $1.2 million as a result of the amortization of excess cost of removal recoveries. The BPU also authorized a Phase II of the base ratecase proceeding to review the costs of CIRT projects not rolled into rate base in the September 2010 settlement. A proceeding took place in 2013 to roll into base rates the remaining $22.5 million of CIRT I project costs that were not included in the 2010 rate increase, as well as CIRT II and III investments totaling $95.0 million that were made subsequent to the 2010 base rate case. These costs were rolled into rate base and reflected in base rates effective October 2013.
Basic Gas Supply Service (BGSS) Clause - The BGSS price structure allows SJG to recover all prudently incurred gas costs. BGSS charges to customers can be either monthly or periodic (annual). Monthly BGSS charges are applicable to large use customers and are referred to as monthly because the rate changes on a monthly basis pursuant to a BPU-approved formula based on commodity market prices. Periodic BGSS charges are applicable to lower usage customers, which include all of ourSJG's residential customers, and are evaluated at least annually by the BPU. However, to some extent, more frequent rate changes to the periodic BGSS are allowed. SJG collects gas costs from customers on a forecasted basis and defers periodic over/under recoveries to the following BGSS year, which runs from October 1 through September 30. If SJG is in a net cumulative undercollected position, gas costs deferrals are reflected on the balance sheet as a regulatory asset. If SJG is in a net cumulative overcollected position, amounts due back to customers are reflected on the balance sheet as a regulatory liability. SJG pays interest on net overcollected BGSS balances at the rate of return on rate base utilized by the BPU to set rates in ourthe last base rate proceeding.
June 2015 - SJG filed its annual BGSS filing with the BPU, requesting a $28.4 million decrease in gas cost recoveries.
September 2015 - The BPU issued an Order approving, on a provisional basis, SJG’s request for a $28.4 million decrease in gas cost recoveries.
January 2016 - SJG provided a BGSS bill credit of approximately $20.0 million to its residential and small commercial customers. This credit was in addition to the overall rate reduction that was approved by the BPU and took effect in 2015.
June 2016 - SJG filed its annual BGSS filing with the BPU, requesting a $47.1 million decrease in gas cost recoveries.
September 2016 - The BPU issued an Order approving, on a provisional basis, SJG’s request for a $47.1 million decrease in gas cost recoveries, effective October 2016.
December 2016 - SJG provided a BGSS bill credit of approximately $10.0 million to its residential and small commercial customers. The credit was in addition to the overall rate reduction that was approved by the BPU and took effect in October 2016.
April 2017 - SJG provided a BGSS bill credit of approximately $8.0 million to its residential and small commercial customers. The credit was in addition to the overall rate reduction that was approved by the BPU and took effect in October 2016.
June 2017 - SJG filed its annual BGSS filing with the BPU, requesting a $4.7 million decrease in gas cost recoveries.
September 2017 - The BPU issued an Order approving, on a provisional basis, SJG’s request for a $4.7 million decrease in gas cost recoveries associated with the 2017-2018 BGSS year, effective October 2017.
Conservation Incentive Program (CIP) - The primary purpose of the CIP is to promote conservation efforts, without negatively impacting financial stability, and to base SJG's profit margin on the number of customers rather than the amount of natural gas distributed to customers. In October 2006, the BPU approved the CIP as a three-year pilot program. In January 2010, the BPU approved an extension of this program through September 2013, with an automatic one year extension through September 2014 if a request for an extension was filed by March 2013. A petition was filed in March 2013 to extend the CIP program and in May 2014 the BPU approved the continuation of the CIP. Each CIP year begins October 1 and ends September 30 of the subsequent year. On a monthly basis during the CIP year, SJG records adjustments to earnings based on weather and customer usage factors, as incurred. Subsequent to each year, SJG makes filings with the BPU to review and approve amounts recorded under the CIP. BPU approvedBPU-approved cash inflows or outflows generally will not begin until the next CIP year.
June 2015 - SJG filed its annual CIP filing with the BPU, requesting a decrease in revenues of $11.3 million, which includes a $8.8 million decrease in non-weather related revenues and a $2.5 million decrease in weather related revenues.
September 2015 - The BPU issued an Order approving, on a provisional basis, the 2015-2016 CIP rates filed in June 2015, effective October 1, 2015.
September 2016 - The BPU issued an Order approving, on a provisional basis, the 2016-2017 CIP rates filed in June 2016, effective October 2016.
June 2017 - SJG filed its annual revenue. This approval also concluded Phase II ofCIP filing with the 2010 base rate case. All CIRT program investments have been rolled into rate baseBPU requesting a $0.2 million increase in revenues, which included a $1.1 million increase in non-weather related revenues and a $0.9 million decrease in weather related revenues.
September 2017 - The BPU issued an Order approving the CIRT program is now concluded.2017-2018 CIP Year rates filed in June 2017, effective October 2017.
Accelerated Infrastructure Replacement Program (AIRP) - In July 2012, SJG filed a petition to implement a five-year, $250.0 million Accelerated Infrastructure Replacement Program. In February 2013, the BPU issued an Order approving a $141.2 million program to replace cast iron and unprotected bare steel mains and services over a four-year period, with annual investments of approximately $35.3 million. Pursuant to the Order, AIRP investments are to be reviewed and included in rate base in future base rate proceedings.
October 2016 - The BPU issued an Order approving an extension of the AIRP for a five-year period (“AIRP II”), commencing October 1, 2016, with authorized investments of up to $302.5 million to continue replacing cast iron and unprotected bare steel mains and associated services. The BPU also approved SJG’s base rate case, which included a $7.5an $11.0 million increase in revenues associated with the roll in of $69.9$80.2 million of AIRP investments, inclusive of $5.7 million of Allowance for Funds Used During Construction (AFUDC) into base rates.rates, effective December 1, 2016.
April 2017 - SJG filed a petition, pursuant to the October 2016 BPU approval of the AIRP II, seeking a base rate adjustment to increase annual revenues by approximately $4.5 million to reflect the roll-in of $42.0 million of AIRP II investments made from October 1, 2016 through June 30, 2017.
September 2017 - The BPU issued an Order approving an increase in annual revenues from base rates of $5.0 million to reflect the roll-in of $46.1 million AIRP II investments made from October 2016 through June 2017, effective October 1, 2017.
Storm Hardening and Reliability Program (SHARP) - In September 2013, SJG filed withAugust 2014, the BPU issued an asset hardening program pursuant to which it will invest approximately $280.0order approving a $103.5 million over seven yearsStorm Hardening and Reliability Program (“SHARP”) to replace low pressure distribution mains and services with high pressure mains and services in coastal areas that are susceptible to flooding during major storm events.events over a three-year period. Pursuant to the Order, SHARP investments are to be recovered through annual base rate adjustments.
April 2015 - SJG filed a petition seeking a base rate adjustment to increase annual revenues by approximately $4.0 million to reflect approximately $36.6 million of SHARP investments made from July 2014 through June 2015.
September 2015 - The BPU approved SJG’s request to increase annual revenues from base rates by $4.0 million, effective October 1, 2015.
April 2016 - SJG filed a petition seeking a base rate adjustment to increase annual revenues by approximately $4.3 million to reflect approximately $33.7 million of SHARP investments made from July 2015 through June 2016.
September 2016 - The BPU approved an increase in annual revenues from base rates of $3.9 million to reflect the roll-in of $33.7 million of SHARP investments made from July 2015 through June 2016, effective October 1, 2016.
April 2017 - SJG filed a petition seeking a base rate adjustment to increase annual revenues by approximately $3.98 million to reflect approximately $35.7 million of SHARP investments made from July 2016 through June 2017.
September 2017 - The BPU issued an Order approving an increase in annual revenues from base rates of $3.6 million to reflect the roll-in of $33.3 million SHARP investments made from July 2016 through June 2017, effective October 1, 2017.
November 2017 - SJG filed a petition with the BPU for approval to continue its storm hardening efforts under a second phase of SHARP (“SHARP II”). Phase one of SJG’s initial SHARP expired in June of 2017. In its petition, SJG proposed a three-year program, with a total investment level of approximately $110.25 million, focused on four system enhancement projects within the coastal regions. SJG also proposed to recover the SHARP II through annual base rate adjustments, with no impact to customer bills until October 2019. The related petition is currently pending BPU approval.
Energy Efficiency Tracker (EET) - In JanuaryJuly 2009, SJG filed a petition with the BPU requesting approval ofissued an Order approving a $17.0 million Energy Efficiency Program (EEP I), under which SJG was permitted to invest in energy efficiency programs (EEPs) for residential, commercial and industrial customers. The BPU approved this petition in July 2009. Under this programcustomers over a two-year period. Pursuant to the Order, SJG was also permitted to invest $17.0 million over two years in energy efficiency measures to be installed in customer homes and businesses. SJG also recoveredrecover incremental operating and maintenance expenses and earn a return of, and return on, program investments.investments annually through the Energy Efficiency Tracker (“EET”). In June 2013, the BPU authorized SJG to continue to offer EEPs through June 2015 with an approved budget of $24.0 million.
Regulatory actions regarding the EET/EEP were as follows:
June 2015, SJG filed its annual EET rate adjustment petition, requesting a $7.6 million decrease in revenues to continue recovering the costs of, and the allowed return on, prior investments associated with EEPs. This petition is currently pending.
August 2015, the BPU approved a two yeartwo-year extension of the Company’sSJG's EEPs through August 31, 2017, with a program budget of $36.3 million. The BPU’s approval permitted SJG to adjust its EET rate, effective September 1, 2015, to increase annual revenues by $2.6 million , to recover projected costs and the allowed return on the first year of its investments in the EEP extension.
February 2016 - The BPU approved a revenue decrease of $7.9 million associated with the two most recent annual EET rate adjustment filings, effective April 1, 2016.
June 2016 - SJG filed its annual EET rate adjustment petition, requesting a $0.8 million decrease in revenues to continue recovering the costs of, and the allowed return on, prior investments associated with EEPs.
October 2016 - The BPU approved a revenue decrease of $1.6 million associated with SJG's annual EET rate adjustment filing, effective November 10, 2016.
November 2016 - SJG filed a letter petition requesting an extension of its current Energy Efficiency Program (“EEP III”) through December 31, 2018, allowing SJG to spend the remainder of its existing BPU approved budget over the extended term. The BPU approved this extension in January 2017.
January 2017 - The BPU issued an Order approving SJG’s request to extend the expiration date of EEP III from August 2017 to December 2018, without any modification to the subprograms or the amount of the previously authorized budget of $36.3 million, inclusive of operation and maintenance expenses.
June 2017 - SJG filed its Eighth Annual EET Filing, requesting a $3.0 million increase in revenues to continue recovering the costs of, and the allowed return on, prior investments associated with EEPs.
November 2017 - The BPU issued an Order approving a revenue increase of $2.6 million associated with the Eighth Annual EET Filing, effective December 1, 2017.
Societal Benefits Clause (SBC) - The SBC allows SJG to recover costs related to several BPU-mandated programs. Within the SBC are a Remediation Adjustment Clause (RAC), a New Jersey Clean Energy Program (NJCEP) and a Universal Service Fund (USF) program.
For the preceding three years, regulatory actions regarding the SBC, with the exception of USF, which requires separate regulatory filings, were as follows:
July 2015 - SJG made its annual 2015-2016 SBC filing, requesting a $5.0 million decrease in SBC revenues. The BPU approved this filing in April 2016.
July 2016 - SJG made its annual 2016-2017 SBC filing, requesting a $16.0 million increase in SBC revenues. The BPU approved this filing in May 2017.
July 2017 - SJG made its annual 2017-2018 SBC filing, requesting an $8.5 million increase in annual revenues. The BPU approved this filing in January 2018.
Remediation Adjustment Clause (RAC) - The RAC recovers environmental remediation costs of 12 former gas manufacturing plants (see Note 15). The BPU allows SJG to recover such costs over seven-year amortization periods. The net between the amounts actually spent and amounts recovered from customers is recorded as a regulatory asset, "Environmental Remediation Cost Expended - Net." RAC activity affects revenue and cash flows but does not directly affect earnings because of the cost recovery over seven-year amortization periods. As of December 31, 2017 and 2016, SJG reflected the unamortized remediation costs of $100.3 million and $72.0 million, respectively, on the consolidated balance sheets under Regulatory Assets (see Note 11). Since implementing the RAC in 1992, SJG has recovered $120.4 million through rates.
Clean Energy Program Clause (CLEP) - The CLEP recovers costs associated with State mandated New Jersey Clean Energy Programs (NJCEP) related to SJG’s energy efficiency and renewable energy programs. In June of 2015, the BPU approved a NJCEP funding level of $345.0 million through June 2016, of which SJG was responsible for $14.6 million. In June of 2016, the BPU approved a NJCEP funding level of $345.0 million through June 2017, of which SJG was responsible for $14.6 million. In June of 2017, the BPU approved a NJCEP funding level of $344.7 million through June 2018, of which SJG is responsible for 12.7 million.
Universal Service Fund (USF) - The USF is a statewide program through which funds for the USF and Lifeline Credit and Tenants Assistance Programs are collected from customers of all New Jersey electric and gas utilities. USF adjustments affect cash flows but do not directly affect revenue or earnings as related costs are deferred and recovered through rates on an ongoingon-going basis.
Separate regulatory actions regarding the USF were as follows:
June 2015 - SJG made its annual USF filing, along with the State’s other electric and gas utilities, proposing to decrease the statewide gas revenues by $46.4 million. This proposal was designed to decrease SJG’s annual USF revenue by $3.4 million.
September 2015 - The BPU approved the statewide budget of $46.4 million for all the State’s gas utilities. SJG's portion of the total is approximately $5.2 million, which decreased rates effective October 1, 2015, resulting in a $3.4 million decrease to its USF recoveries.
June 2016 - SJG made its annual USF filing, along with the State’s other electric and gas utilities, proposing to increase the statewide gas revenues by $56.0 million. This proposal was designed to increase SJG’s annual USF revenue by $1.1 million.
September 2016 - The BPU approved the statewide budget of $56.0 million for all the State’s gas utilities. SJG's portion of the total is approximately $5.6 million, which increased rates effective October 1, 2016, resulting in a $1.1 million increase to its USF recoveries.
June 2017 - SJG made its annual USF filing, along with the State’s other gas utilities, proposing to decrease the statewide gas revenues by $16.3 million. This proposal was designed to decrease SJG’s annual USF revenue by $2.0 million.
September 2017 - The BPU approved the statewide budget of $38.3 million for all the State’s gas utilities. SJG's portion of the total was approximately $3.2 million, resulting in a $2.2 million decrease to its USF recoveries effective October 1, 2017.
The BGSS, CIP and USF approvals discussed above do not impact SJG's earnings. They represent changes in the cash requirements of SJG corresponding to cost changes and/or previously over/under recoveries from ratepayers associated with each respective mechanism.
Other Regulatory Matters-
Unbundling - Effective January 10, 2000, the BPU approved full unbundling of SJG's system. This allows all natural gas consumers to select their natural gas commodity supplier. As of December 31, 2015, 35,4002017, 29,141 of SJG's customers were purchasing their gas commodity from someone other than us.SJG. Customers choosing to purchase natural gas from providers other than the utility are charged for the cost of gas by the marketer. The resulting decrease in SJG'sutility revenues is offset by a corresponding decrease in gas costs. While customer choice can reduce utility revenues, it does not negatively affect SJG's net income or financial condition. The BPU continues to allow for full recovery of prudently incurred natural gas costs through the BGSS. Unbundling did not change the fact that SJG still recoverrecovers cost of service, including certain deferred costs, through base rates.
Pipeline Integrity Costs - SJG is permitted to defer and recover incremental costs incurred as a result of Pipeline Integrity Management regulations, that became effective January 14, 2004, which are aimed at enhancing public safety and reliability. The regulations require that utilities use a comprehensive analysis to assess, evaluate, repair and validate the integrity of certain transmission lines in the event of a leak or failure. As part of SJG's 2014 base rate case, it was permitted to recover previously deferred pipeline integrity costs incurred from October 2010 through June 2014. In addition, SJG is authorized to defer future program costs, including related carrying costs, for recovery in ourthe next base rate proceeding, subject to review by the BPU. As of December 31, 20152017 and 2014,2016, deferred pipeline integrity costs totaled $2.7$0.5 million and $3.4$4.0 million,, respectively, and are included in other regulatory assets (See(see Note 4)11).
Filings and petitions described above are still pending, unless otherwise indicated.
| REGULATORY ASSETS |
The discussion under Note 3,10, Rates and Regulatory Actions, is integral to the following explanations of specific regulatory assets and liabilities.
SJI's and SJG's Regulatory Assets at December 31 consisted of the following items (in thousands):
| 2015 | 2014 | December 31, 2017 | December 31, 2016 | |||||||||||
| Environmental Remediation Costs: | ||||||||||||||
| Expended - Net | $ | 42,032 | $ | 29,540 | $ | 100,327 | $ | 71,997 | ||||||
| Liability for Future Expenditures | 123,194 | 124,308 | 171,696 | 153,047 | ||||||||||
| Deferred Asset Retirement Obligation Costs | 42,430 | 31,584 | 42,368 | 43,014 | ||||||||||
| Deferred Pension and Other Postretirement Benefit Costs | 79,779 | 99,040 | 78,211 | 85,693 | ||||||||||
| Deferred Gas Costs - Net | 2,701 | 32,202 | 16,838 | — | ||||||||||
| Conservation Incentive Program - Receivable | 2,624 | — | ||||||||||||
| Conservation Incentive Program Receivable | 26,652 | 27,567 | ||||||||||||
| Societal Benefit Costs Receivable | — | 385 | 2,484 | — | ||||||||||
| Deferred Interest Rate Contracts | 7,631 | 7,325 | 7,028 | 7,365 | ||||||||||
| Energy Efficiency Tracker | 496 | 11,247 | 2,094 | 219 | ||||||||||
| Pipeline Supplier Service Charges | 3,776 | 5,441 | 708 | 2,122 | ||||||||||
| Pipeline Integrity Cost | 4,596 | 3,431 | 5,280 | 4,810 | ||||||||||
| AFUDC - Equity Related Deferrals | 11,423 | 10,781 | 12,785 | 12,434 | ||||||||||
| Other Regulatory Assets | 2,752 | 1,876 | 2,753 | 2,478 | ||||||||||
| Total Regulatory Assets | $ | 323,434 | $ | 357,160 | $ | 469,224 | $ | 410,746 | ||||||
Except where noted below, all regulatory assets are or will be recovered through utility rate charges, as detailed in the following discussion. We areSJG is currently permitted to recover interest on our Environmental Remediation Costs, Societal Benefit Costs Receivable, Energy Efficiency Tracker and Pipeline Integrity Costs, while the other assets are being recovered without a return on investment.
Environmental Remediation Costs - We haveSJG has two regulatory assets associated with environmental costs related to the cleanup of 12 sites where weSJG or ourits predecessors previously operated gas manufacturing plants. The first asset, Environmental"Environmental Remediation Cost: Expended - Net," represents what was actually spent to clean up the sites, less recoveries through the RAC and insurance carriers. These costs meet the deferral requirements of GAAP, as the BPU allows usSJG to recover such expenditures through the RAC. The other asset, Environmental"Environmental Remediation Cost: Liability for Future Expenditures," relates to estimated future expenditures required to complete the remediation of these sites. WeSJG recorded this estimated amount as a regulatory asset with the corresponding current and noncurrent liabilities on the consolidated balance sheets under the captions Current Liabilities"Current Liabilities" (SJI and RegulatorySJG) and "Deferred Credits and Other Noncurrent Liabilities.Liabilities" (SJI) and "Regulatory and Other Noncurrent Liabilities" (SJG). The BPU allows usSJG to recover the deferred costs over seven-year periods after they are spent (See Notes 3spent. The increase from December 31, 2016 is a result of expenditures made during 2017 and 12).an increase in the expected future expenditures for remediation activities, primarily due to a change in the proposed type of remediation at two of the sites currently under remediation. The proposed change results in an increase in contractor costs.
Deferred Asset Retirement Obligation (ARO) Costs - This regulatory asset resulted from the recording of asset retirement obligations (ARO)ARO and additional utility plant, primarily related to a legal obligation we haveSJG has for certain safety requirements upon the retirement of ourits gas distribution and transmission system. We recoverSJG recovers asset retirement costs through rates charged to customers. All related accumulated accretion and depreciation amounts for these ARO represent timing differences in the recognition of retirement costs that we areSJG is currently recovering in rates and, as such, we areSJG is deferring such differences as regulatory assets.
Deferred Pension and Other Postretirement Benefit Costs - The BPU authorized usSJG to recover costs related to postretirement benefits under the accrual method of accounting consistent with GAAP. In 2006, ourSJG's regulatory asset was increased by $37.1 million representingrepresents the recognition of the underfunded positions of ourSJG's pension and other postretirement benefit plans. Subsequent adjustments to this balance occur annually to reflect changes in the funded positions of these benefit plans caused by changes in actual plan experience as well as assumptions of future experience (See(see Note 11)12).
Deferred Gas Costs - Net - Over/under collections of gas costs are monitored through SJG's BGSS mechanism. Net undercollected gas costs are classified as a regulatory asset and net overcollected gas costs are classified as a regulatory liability (see note 3)Note 10). Derivative contracts used to hedge natural gas purchases are also included in the BGSS, subject to BPU approval (see note 14)Note 16). The change in the BGSS from a $17.8 million regulatory liability at December 31, 2016 to a $16.8 million regulatory asset at December 31, 2017 was primarily due to an unfavorable court ruling related to a pricing dispute between SJG and a supplier (see Note 15) and the actual gas commodity costs exceeding recoveries from customers.
Conservation Incentive Program (CIP) Receivable - The impact of the CIP is recorded as an adjustment totracking mechanism adjusts earnings as incurred, while cash recovery under the CIP generally occurswhen actual usage per customer experienced during the subsequent CIP year (see Note 3).period varies from an established baseline usage per customer. Actual usage per customer was less than the established baseline during 2017, resulting in an increase in the receivable. This is primarily the result of warm weather experienced in the region.
Societal BenefitBenefits Costs (SBC) Receivable - This regulatory asset primarily represents cumulative costs less recoveriesthe deferred expenses incurred under the USFNew Jersey Clean Energy Program, which is a mechanism designed to recover costs associated with energy efficiency and CLEP programs (See Note 3).
Deferred Interest Rate Contracts - These amounts represent the market value of interest rate derivatives as discussed further in Note 13.16.
Energy Efficiency Tracker - This regulatory asset represents cumulative investments less recoveries under the Energy Efficiency Program.
Pipeline Supplier Service Charges - This regulatory asset represents costs necessary to maintain adequate supply and system pressures, which are being recovered on a monthly basis through the BGSS over the term of the underlying supplier contracts (See(see Note 3)10).
Pipeline Integrity Cost - As part of ourSJG's September 2014 base rate increase, we wereSJG was permitted to recover previously deferred pipeline integrity costs incurred through September 2014. In addition, we areSJG is authorized to defer future program costs, including related carrying costs, for recovery in ourSJG's next base rate proceeding, subject to review by the BPU (see Note 3)10).
AFUDC Equity Related Deferrals - This regulatory asset represents the future revenue to recover the future income taxes related to the deferred tax liability for the equity component of AFUDC. Included in the balance is $2.3$1.0 million which is being recovered over a period of three years as approved by the BPU in SJG’s 2014 rate case settlement. The remaining balance is being amortized over the life of the associated utility plant.
Other Regulatory Assets - Some of the assets included in Other Regulatory Assets are currently being recovered from ratepayers as approved by the BPU. Management believes the remaining deferred costs are probable of recovery from ratepayers through future utility rates.
Regulatory Liabilities at December 31 consisted of the following items (in thousands):
| 2015 | 2014 | December 31, 2017 | December 31, 2016 | |||||||||||
| Excess Plant Removal Costs | $ | 32,644 | $ | 35,940 | $ | 23,295 | $ | 28,226 | ||||||
| Conservation Incentive Program - Payable | — | 4,700 | ||||||||||||
| Deferred Revenue - Net | — | 17,800 | ||||||||||||
| Societal Benefit Costs Payable | 10,197 | 1,025 | — | 3,095 | ||||||||||
| Other Regulatory Liabilities | — | 234 | ||||||||||||
| Excess Deferred Taxes | 263,810 | — | ||||||||||||
| Total Regulatory Liabilities | $ | 42,841 | $ | 41,899 | $ | 287,105 | $ | 49,121 | ||||||
Excess Plant Removal Costs – Represents amounts accrued- SJG accrues and collects for cost of removal of its utility property. This regulatory liability represents customer collections in excess of actual utility plantexpenditures, which the company will return to customers as a reduction to depreciation expense. The Excess Plant Removal Costs Liability decreased from $28.2 million at December 31, 2016 to $23.3 million at December 31, 2017 due to higher asset removal costs incurred related to date. As part of our September 2014 base rate increase, we are required to amortize approximately $1.1 million of this balance to depreciation expense each year.the AIRP.
Societal Benefit Costs Payable - This regulatory liability primarily represents cumulative costs less recoveries under the USF and CLEP programs. See previous discussion under "Societal Benefit Costs Receivable" above.
| 2015 | 2014 | 2013 | |||||||||
| Operating Revenues/Affiliates: | |||||||||||
| SJRG | $ | 5,342 | $ | 959 | $ | 1,390 | |||||
| Marina | 602 | 1,083 | 1,297 | ||||||||
| Other | 5 | — | 2 | ||||||||
| Total Operating Revenues/Affiliates | $ | 5,949 | $ | 2,042 | $ | 2,689 | |||||
| 2015 | 2014 | 2013 | |||||||||
| Costs of Sales/Affiliates | |||||||||||
| (Excluding depreciation): | |||||||||||
| SJRG | $ | 26,090 | $ | 15,265 | $ | 14,959 | |||||
| Derivative Losses/ (Gains) (See Note 1): | |||||||||||
| SJRG | $ | 64 | $ | (1,582 | ) | $ | 887 | ||||
| Operations Expense/Affiliates: | |||||||||||
| SJI | $ | 14,088 | $ | 14,110 | $ | 11,990 | |||||
| SJIS | — | — | 5,531 | ||||||||
| Millennium | 2,746 | 2,668 | 2,686 | ||||||||
| Other | (412 | ) | (434 | ) | (428 | ) | |||||
| Total Operations Expense/Affiliates | $ | 16,422 | $ | 16,344 | $ | 19,779 | |||||
| 2015 | 2014 | 2013 | |||||||||
| Tax at Statutory Rate | $ | 36,233 | $ | 35,482 | $ | 33,974 | |||||
| Increase (Decrease) Resulting from: | |||||||||||
| State Income Taxes | 4,584 | 1,935 | 4,833 | ||||||||
| Amortization of Investment Tax Credits | (149 | ) | (211 | ) | (258 | ) | |||||
| ESOP Dividend | (1,168 | ) | (1,109 | ) | (1,058 | ) | |||||
| AFUDC | (1,109 | ) | (1,481 | ) | (916 | ) | |||||
| Research and Development Credits | (1,400 | ) | — | — | |||||||
| Other - Net | (46 | ) | 279 | (1,742 | ) | ||||||
| Total Income Tax Expense | $ | 36,945 | $ | 34,895 | $ | 34,833 | |||||
| 2015 | 2014 | 2013 | |||||||||
| Current: | |||||||||||
| Federal | $ | — | $ | 60 | $ | (53 | ) | ||||
| State | (2,203 | ) | 2,642 | 2,946 | |||||||
| Total Current | (2,203 | ) | 2,702 | 2,893 | |||||||
| Deferred: | |||||||||||
| Federal | 30,042 | 32,069 | 27,707 | ||||||||
| State | 9,255 | 335 | 4,491 | ||||||||
| Total Deferred | 39,297 | 32,404 | 32,198 | ||||||||
| Investment Tax Credits | (149 | ) | (211 | ) | (258 | ) | |||||
| Total Income Tax Expense | $ | 36,945 | $ | 34,895 | $ | 34,833 | |||||
| 2015 | 2014 | ||||||
| Deferred Tax Assets: | |||||||
| Net Operating Loss and Tax Credits | $ | 64,978 | $ | 53,460 | |||
| Deferred State tax | 20,825 | 17,390 | |||||
| Provision for Uncollectibles | 4,030 | 2,676 | |||||
| Conservation Incentive Program | — | 2,027 | |||||
| Investment Tax Basis Gross-Up | — | 77 | |||||
| Pension & Other Post Retirement Benefits | 28,464 | 27,782 | |||||
| Deferred Revenues | 4,844 | 11,452 | |||||
| Other | 3,985 | 3,624 | |||||
| Total Deferred Tax Assets | $ | 127,126 | $ | 118,488 | |||
| Deferred Tax Liabilities: | |||||||
| Book Versus Tax Basis of Property | $ | 480,682 | $ | 417,178 | |||
| Deferred Fuel Costs - Net | 3,998 | 22,959 | |||||
| Environmental Remediation | 20,408 | 13,500 | |||||
| Deferred Regulatory Costs | 566 | 6,333 | |||||
| Deferred Pension & Other Post Retirement Benefits | 42,216 | 39,891 | |||||
| Budget Billing - Customer Accounts | 830 | 1,138 | |||||
| Section 461 Prepayments | 1,017 | 1,026 | |||||
| Conservation Incentive Program | 1,132 | — | |||||
| Other | 8,951 | 7,421 | |||||
| Total Deferred Tax Liabilities | $ | 559,800 | $ | 509,446 | |||
| Current Deferred Tax (Assets) | $ | — | $ | (44,064 | ) | ||
| Noncurrent Deferred Tax Liabilities | 432,674 | 435,022 | |||||
| Deferred Tax Liability - Net | $ | 432,674 | $ | 390,958 | |||
| 2015 | 2014 | 2013 | |||||||||
| Balance at January 1, | $ | 552 | $ | 547 | $ | 503 | |||||
| Increase as a result of tax position taken in prior years | 7 | 5 | 44 | ||||||||
| Decrease due to a lapse in the statue of limitations | — | — | — | ||||||||
| Settlements | — | — | — | ||||||||
| Balance at December 31, | $ | 559 | $ | 552 | $ | 547 | |||||
| 2015 | 2014 | |||||||||
| Long-Term Debt (A): | ||||||||||
| First Mortgage Bonds: (B) | ||||||||||
| 5.387 | % | Series due 2015 (C) | — | 10,000 | ||||||
| 5.437 | % | Series due 2016 | 10,000 | 10,000 | ||||||
| 4.60 | % | Series due 2016 | 17,000 | 17,000 | ||||||
| 4.657 | % | Series due 2017 | 15,000 | 15,000 | ||||||
| 7.97 | % | Series due 2018 | 10,000 | 10,000 | ||||||
| 7.125 | % | Series due 2018 | 20,000 | 20,000 | ||||||
| 5.587 | % | Series due 2019 | 10,000 | 10,000 | ||||||
| 3.00 | % | Series due 2024 | 50,000 | 50,000 | ||||||
| 3.03 | % | Series due 2024 | 35,000 | 35,000 | ||||||
| 3.63 | % | Series due 2025 (D) | 9,091 | 10,000 | ||||||
| 4.84 | % | Series due 2026 | 15,000 | 15,000 | ||||||
| 4.93 | % | Series due 2026 | 45,000 | 45,000 | ||||||
| 4.03 | % | Series due 2027 | 45,000 | 45,000 | ||||||
| 4.01 | % | Series due 2030 | 50,000 | 50,000 | ||||||
| 4.23 | % | Series due 2030 | 30,000 | 30,000 | ||||||
| 3.74 | % | Series due 2032 | 35,000 | 35,000 | ||||||
| 5.55 | % | Series due 2033 | 32,000 | 32,000 | ||||||
| 6.213 | % | Series due 2034 | 10,000 | 10,000 | ||||||
| 5.45 | % | Series due 2035 | 10,000 | 10,000 | ||||||
| Series A 2006 Tax-Exempt First Mortgage Bonds | ||||||||||
| Variable Rate, due 2036 (E) | 24,900 | 25,000 | ||||||||
| Variable Rate Bank Term Facility, due 2017 (F) | 139,000 | 59,000 | ||||||||
| Total Long-Term Debt Outstanding | 611,991 | 543,000 | ||||||||
| Less Current Maturities (A) | (27,909 | ) | (35,909 | ) | ||||||
| Long-Term Debt | $ | 584,082 | $ | 507,091 | ||||||
| Total Facility | Usage | Available Liquidity | Expiration Date | ||||||||||
| Commercial Paper Program/ Revolving Credit Facility | $ | 200,000 | $ | 136,600 | (A) | $ | 63,400 | May 2018 | |||||
| Uncommitted Bank Lines | 10,000 | — | 10,000 | August 2016 | |||||||||
| Total | $ | 210,000 | $ | 136,600 | $ | 73,400 | |||||||
PENSION AND OTHER POSTRETIREMENT BENEFITS: |
Net periodic benefit cost related to the SJI employee and officer pension and other postretirement benefit plans consisted of the following components (in thousands):
| SJI (includes SJG and all other consolidated subsidiaries): | Pension Benefits | ||||||||||
| 2017 | 2016 | 2015 | |||||||||
| Service Cost | $ | 4,989 | $ | 4,843 | $ | 5,337 | |||||
| Interest Cost | 11,772 | 12,125 | 11,168 | ||||||||
| Expected Return on Plan Assets | (14,105 | ) | (13,508 | ) | (14,789 | ) | |||||
| Amortizations: | |||||||||||
| Prior Service Cost | 131 | 212 | 212 | ||||||||
| Actuarial Loss | 10,282 | 9,394 | 10,608 | ||||||||
| Net Periodic Benefit Cost | 13,069 | 13,066 | 12,536 | ||||||||
| Capitalized Benefit Costs | (4,723 | ) | (4,645 | ) | (4,805 | ) | |||||
| Deferred Benefit Costs | (527 | ) | (645 | ) | (1,007 | ) | |||||
| Total Net Periodic Benefit Expense | $ | 7,819 | $ | 7,776 | $ | 6,724 | |||||
| Pension Benefits | Other Postretirement Benefits | |||||||||||||||||||||||||||||||||
| SJI (includes SJG and all other consolidated subsidiaries): | Other Postretirement Benefits | |||||||||||||||||||||||||||||||||
| 2015 | 2014 | 2013 | 2015 | 2014 | 2013 | 2017 | 2016 | 2015 | ||||||||||||||||||||||||||
| Service Cost | $ | 4,430 | $ | 3,697 | $ | 4,487 | $ | 726 | $ | 585 | $ | 771 | $ | 910 | $ | 851 | $ | 1,116 | ||||||||||||||||
| Interest Cost | 9,357 | 8,952 | 7,886 | 2,406 | 2,297 | 2,221 | 2,418 | 2,615 | 2,973 | |||||||||||||||||||||||||
| Expected Return on Plan Assets | (11,914 | ) | (10,818 | ) | (9,435 | ) | (2,708 | ) | (2,467 | ) | (2,158 | ) | (3,411 | ) | (3,104 | ) | (2,993 | ) | ||||||||||||||||
| Amortization: | ||||||||||||||||||||||||||||||||||
| Prior Service Cost (Credits) | 203 | 177 | 208 | 499 | 133 | (195 | ) | |||||||||||||||||||||||||||
| Amortizations: | ||||||||||||||||||||||||||||||||||
| Prior Service (Credits) Cost | (344 | ) | (344 | ) | 608 | |||||||||||||||||||||||||||||
| Actuarial Loss | 8,969 | 4,864 | 7,608 | 1,107 | 770 | 1,555 | 1,238 | 1,109 | 1,342 | |||||||||||||||||||||||||
| Net Periodic Benefit Cost | 11,045 | 6,872 | 10,754 | 2,030 | 1,318 | 2,194 | 811 | 1,127 | 3,046 | |||||||||||||||||||||||||
| Capitalized Benefit Costs | (4,805 | ) | (3,047 | ) | (5,002 | ) | (1,043 | ) | (722 | ) | (1,172 | ) | (46 | ) | (277 | ) | (1,043 | ) | ||||||||||||||||
| Affiliate SERP Allocations | (1,688 | ) | (1,313 | ) | (1,389 | ) | — | — | — | |||||||||||||||||||||||||
| Curtailment Costs (Credit) | (106 | ) | — | — | ||||||||||||||||||||||||||||||
| Deferred Benefit Costs | (1,007 | ) | — | — | (256 | ) | — | — | — | — | (256 | ) | ||||||||||||||||||||||
| Total Net Periodic Benefit Expense | $ | 3,545 | $ | 2,512 | $ | 4,363 | $ | 731 | $ | 596 | $ | 1,022 | $ | 659 | $ | 850 | $ | 1,747 | ||||||||||||||||
Net periodic benefit cost related to the SJG employee and officer pension and other postretirement benefit plans consisted of the following components (in thousands):
| SJG: | Pension Benefits | ||||||||||
| 2017 | 2016 | 2015 | |||||||||
| Service Cost | $ | 4,303 | $ | 4,144 | $ | 4,430 | |||||
| Interest Cost | 9,925 | 10,292 | 9,357 | ||||||||
| Expected Return on Plan Assets | (11,366 | ) | (11,029 | ) | (11,914 | ) | |||||
| Amortization: | |||||||||||
| Prior Service Cost (Credits) | 127 | 203 | 203 | ||||||||
| Actuarial Loss | 8,692 | 7,975 | 8,969 | ||||||||
| Net Periodic Benefit Cost | 11,681 | 11,585 | 11,045 | ||||||||
| Capitalized Benefit Costs | (4,723 | ) | (4,645 | ) | (4,805 | ) | |||||
| Affiliate SERP Allocations | (2,235 | ) | (1,960 | ) | (1,688 | ) | |||||
| Deferred Benefit Costs | (527 | ) | (644 | ) | (1,007 | ) | |||||
| Total Net Periodic Benefit Expense | $ | 4,196 | $ | 4,336 | $ | 3,545 | |||||
| SJG: | Other Postretirement Benefits | ||||||||||
| 2017 | 2016 | 2015 | |||||||||
| Service Cost | $ | 582 | $ | 576 | $ | 726 | |||||
| Interest Cost | 1,897 | 2,120 | 2,406 | ||||||||
| Expected Return on Plan Assets | (3,101 | ) | (2,823 | ) | (2,708 | ) | |||||
| Amortization: | |||||||||||
| Prior Service Cost (Credits) | (257 | ) | (257 | ) | 499 | ||||||
| Actuarial Loss | 972 | 945 | 1,107 | ||||||||
| Net Periodic Benefit Cost | 93 | 561 | 2,030 | ||||||||
| Capitalized Benefit Costs | (46 | ) | (277 | ) | (1,043 | ) | |||||
| Deferred Benefit Costs | — | — | (256 | ) | |||||||
| Total Net Periodic Benefit Expense | $ | 47 | $ | 284 | $ | 731 | |||||
Capitalized benefit costs reflected in the tabletables above relate to ourSJG’s construction program. Deferred benefit costs relate to the deferral of incremental expenses associated with the adoption of new mortality tables (RP-2014 base table with MP-2014 generational projection scale) in 2015. Deferred benefit costs are expected towill be recovered through rates as part of our nextSJG's recent base rate case.case settlement (See Note10)
Companies with publicly traded equity securities that sponsor a postretirement benefit plan are required to fully recognize, as an asset or liability, the overfunded or underfunded status of its benefit plans and recognize changes in the funded status in the year in which the changes occur. Changes in funded status are generally reported in Other Comprehensive Loss; however, since we recoverSJG recovers all prudently incurred pension and postretirement benefit costs from ourits ratepayers, a significant portion of the charges resulting from the recording of additional liabilities under this statementrequirement are reported as regulatory assets (See(see Note 4)11).
Details of the activity within the Regulatory Asset and Accumulated Other Comprehensive Loss associated with Pension and Other Postretirement Benefits are as follows (in thousands):
| SJI (includes SJG and all other consolidated subsidiaries): | Regulatory Assets | Accumulated Other Comprehensive Loss (pre-tax) | ||||||||||||||||||||||||||||
| Regulatory Assets | Accumulated Other Comprehensive Loss (pre-tax) | Pension Benefits | Other Postretirement Benefits | Pension Benefits | Other Postretirement Benefits | |||||||||||||||||||||||||
| Balance at January 1, 2016 | $ | 64,432 | $ | 15,347 | $ | 35,066 | $ | 2,062 | ||||||||||||||||||||||
| Pension Benefits | Other Postretirement Benefits | Pension Benefits | Other Postretirement Benefits | |||||||||||||||||||||||||||
| Balance at January 1, 2014 | $ | 42,632 | $ | 16,652 | $ | 18,043 | $ | — | ||||||||||||||||||||||
| Amounts Arising during the Period: | ||||||||||||||||||||||||||||||
| Net Actuarial Loss | 31,075 | 7,826 | 7,102 | — | ||||||||||||||||||||||||||
| Prior Service Cost | 486 | 4,146 | — | — | ||||||||||||||||||||||||||
| Amounts Amortized to Net Periodic Costs: | ||||||||||||||||||||||||||||||
| Net Actuarial Loss | (2,841 | ) | (628 | ) | (1,975 | ) | — | |||||||||||||||||||||||
| Prior Service Cost | (175 | ) | (133 | ) | — | — | ||||||||||||||||||||||||
| Balance at December 31, 2014 | 71,177 | 27,863 | 23,170 | — | ||||||||||||||||||||||||||
| Amounts Arising during the Period: | ||||||||||||||||||||||||||||||
| Net Actuarial (Gain)/Loss | (463 | ) | (3,155 | ) | 184 | — | ||||||||||||||||||||||||
| Net Actuarial Gain | 9,706 | 2,584 | 8,370 | 829 | ||||||||||||||||||||||||||
| Prior Service Credit | — | (499 | ) | — | — | — | 257 | — | 84 | |||||||||||||||||||||
| Amounts Amortized to Net Periodic Costs: | ||||||||||||||||||||||||||||||
| Net Actuarial Loss | (6,079 | ) | (1,107 | ) | (2,891 | ) | — | (5,485 | ) | (945 | ) | (3,838 | ) | (154 | ) | |||||||||||||||
| Prior Service Cost | (203 | ) | (7,755 | ) | — | — | (203 | ) | — | (8 | ) | — | ||||||||||||||||||
| Balance at December 31, 2015 | $ | 64,432 | $ | 15,347 | $ | 20,463 | $ | — | ||||||||||||||||||||||
| Balance at December 31, 2016 | 68,450 | 17,243 | 39,590 | 2,821 | ||||||||||||||||||||||||||
| Amounts Arising during the Period: | ||||||||||||||||||||||||||||||
| Net Actuarial Gain (Loss) | 2,711 | (3,286 | ) | 18,506 | 1,614 | |||||||||||||||||||||||||
| Prior Service Credit | — | 257 | — | 84 | ||||||||||||||||||||||||||
| Amounts Amortized to Net Periodic Costs: | ||||||||||||||||||||||||||||||
| Net Actuarial Loss | (6,066 | ) | (972 | ) | (4,160 | ) | (1,013 | ) | ||||||||||||||||||||||
| Prior Service Cost | (126 | ) | — | (4 | ) | — | ||||||||||||||||||||||||
| Balance at December 31, 2017 | $ | 64,969 | $ | 13,242 | $ | 53,932 | $ | 3,506 | ||||||||||||||||||||||
| SJG: | Regulatory Assets | Accumulated Other Comprehensive Loss (pre-tax) | |||||||||||||
| Pension Benefits | Other Postretirement Benefits | Pension Benefits | Other Postretirement Benefits | ||||||||||||
| Balance at January 1, 2016 | $ | 64,432 | $ | 15,347 | $ | 20,463 | $ | — | |||||||
| Amounts Arising during the Period: | |||||||||||||||
| Net Actuarial Gain | 9,706 | 2,584 | 6,129 | — | |||||||||||
| Prior Service Credit | — | 257 | — | — | |||||||||||
| Amounts Amortized to Net Periodic Costs: | |||||||||||||||
| Net Actuarial Loss | (5,485 | ) | (945 | ) | (2,490 | ) | — | ||||||||
| Prior Service Cost | (203 | ) | — | — | — | ||||||||||
| Balance at December 31, 2016 | 68,450 | 17,243 | 24,102 | — | |||||||||||
| Amounts Arising during the Period: | |||||||||||||||
| Net Actuarial Gain | 2,711 | (3,286 | ) | 17,881 | — | ||||||||||
| Prior Service Credit | — | 257 | — | — | |||||||||||
| Amounts Amortized to Net Periodic Costs: | |||||||||||||||
| Net Actuarial Loss | (6,066 | ) | (972 | ) | (2,627 | ) | — | ||||||||
| Prior Service Cost | (126 | ) | — | — | — | ||||||||||
| Balance at December 31, 2017 | $ | 64,969 | $ | 13,242 | $ | 39,356 | $ | — | |||||||
The estimated costs that will be amortized from Regulatory Assets for SJI and SJG into net periodic benefit costs in 20152018 are as follows (in thousands):
| Pension Benefits | Other Postretirement Benefits | |||||||||||||
| Prior Service Costs | $ | 203 | $ | (257 | ) | |||||||||
| SJI and SJG (costs are the same for both entities): | Pension Benefits | Other Postretirement Benefits | ||||||||||||
| Prior Service Cost/(Credit) | $ | 124 | $ | (257 | ) | |||||||||
| Net Actuarial Loss | $ | 5,488 | $ | 998 | $ | 5,847 | $ | 743 | ||||||
The estimated costs that will be amortized from for SJI and SJG Accumulated Other Comprehensive Loss into net periodic benefit costs in 20162018 are as follows (in thousands):
| Pension Benefits | Other Postretirement Benefits | ||||||
| Net Actuarial Loss | $ | 2,257 | $ | — | |||
| Pension Benefits | Other Postretirement Benefits | ||||||
| SJI (includes SJG and all other consolidated subsidiaries): | |||||||
| Prior Service Cost/(Credit) | $ | 6 | $ | (87 | ) | ||
| Net Actuarial Loss | $ | 5,665 | $ | 213 | |||
| SJG: | |||||||
| Prior Service Cost/(Credit) | $ | — | $ | — | |||
| Net Actuarial Loss | $ | 4,143 | $ | — | |||
A reconciliation of the plans’plans' benefit obligations, fair value of plan assets, funded status and amounts recognized in ourSJI's consolidated balance sheets follows (in thousands):
| SJI (includes SJG and all other consolidated subsidiaries): | Pension Benefits | Other Postretirement Benefits | ||||||||||||||||||||||||||||
| Other | ||||||||||||||||||||||||||||||
| Pension Benefits | Postretirement Benefits | 2017 | 2016 | 2017 | 2016 | |||||||||||||||||||||||||
| 2015 | 2014 | 2015 | 2014 | |||||||||||||||||||||||||||
Change in Benefit Obligations: | ||||||||||||||||||||||||||||||
| Change in Benefit Obligations: | ||||||||||||||||||||||||||||||
| Benefit Obligation at Beginning of Year | $ | 221,605 | $ | 180,668 | $ | 60,670 | $ | 50,915 | $ | 278,288 | $ | 254,195 | $ | 60,350 | $ | 57,430 | ||||||||||||||
| Service Cost | 4,430 | 3,697 | 726 | 585 | 4,989 | 4,843 | 910 | 851 | ||||||||||||||||||||||
| Interest Cost | 9,357 | 8,952 | 2,406 | 2,297 | 11,772 | 12,125 | 2,418 | 2,615 | ||||||||||||||||||||||
| Actuarial (Gain) Loss | (13,107 | ) | 35,634 | (6,257 | ) | 6,008 | ||||||||||||||||||||||||
| Actuarial Loss (Gain) | 32,893 | 18,254 | 1,411 | 3,121 | ||||||||||||||||||||||||||
| Retiree Contributions | — | — | 608 | 452 | — | — | 19 | 81 | ||||||||||||||||||||||
| Plan Amendments | — | 534 | (7,755 | ) | 4,146 | — | — | — | — | |||||||||||||||||||||
| Benefits Paid | (8,625 | ) | (7,880 | ) | (3,880 | ) | (3,733 | ) | (11,653 | ) | (11,129 | ) | (2,825 | ) | (3,748 | ) | ||||||||||||||
| Benefit Obligation at End of Year | $ | 213,660 | $ | 221,605 | $ | 46,518 | $ | 60,670 | $ | 316,289 | $ | 278,288 | $ | 62,283 | $ | 60,350 | ||||||||||||||
| Change in Plan Assets: | ||||||||||||||||||||||||||||||
| Fair Value of Plan Assets at Beginning of Year | $ | 144,568 | $ | 142,674 | $ | 40,951 | $ | 39,471 | $ | 189,542 | $ | 184,824 | $ | 50,532 | $ | 47,759 | ||||||||||||||
| Actual Return on Plan Assets | (913 | ) | 8,275 | (395 | ) | 507 | 25,807 | 13,569 | 7,390 | 2,784 | ||||||||||||||||||||
| Employer Contributions | 14,002 | 1,499 | 6,144 | 4,254 | 12,369 | 2,278 | 2,806 | 3,656 | ||||||||||||||||||||||
| Retiree Contributions | — | — | 608 | 452 | — | 19 | 81 | |||||||||||||||||||||||
| Benefits Paid | (8,625 | ) | (7,880 | ) | (3,880 | ) | (3,733 | ) | (11,653 | ) | (11,129 | ) | (2,825 | ) | (3,748 | ) | ||||||||||||||
| Fair Value of Plan Assets at End of Year | $ | 149,032 | $ | 144,568 | $ | 43,428 | $ | 40,951 | $ | 216,065 | $ | 189,542 | $ | 57,922 | $ | 50,532 | ||||||||||||||
| Funded Status at End of Year: | $ | (100,224 | ) | $ | (88,746 | ) | $ | (4,361 | ) | $ | (9,818 | ) | ||||||||||||||||||
| Amounts Related to Unconsolidated Affiliate | 135 | 326 | 518 | 540 | ||||||||||||||||||||||||||
| Accrued Net Benefit Cost at End of Year | $ | (100,089 | ) | $ | (88,420 | ) | $ | (3,843 | ) | $ | (9,278 | ) | ||||||||||||||||||
| Amounts Recognized in the Statement of Financial Position Consist of: | ||||||||||||||||||||||||||||||
| Current Liabilities | $ | (2,388 | ) | $ | (2,463 | ) | $ | — | $ | — | ||||||||||||||||||||
| Noncurrent Liabilities | (97,701 | ) | (85,957 | ) | (3,843 | ) | (9,278 | ) | ||||||||||||||||||||||
| Net Amount Recognized at End of Year | $ | (100,089 | ) | $ | (88,420 | ) | $ | (3,843 | ) | $ | (9,278 | ) | ||||||||||||||||||
| Amounts Recognized in Regulatory Assets Consist of: | ||||||||||||||||||||||||||||||
| Prior Service Costs | $ | 428 | $ | 538 | $ | (2,775 | ) | $ | (3,032 | ) | ||||||||||||||||||||
| Net Actuarial Loss | 64,541 | 67,912 | 16,017 | 20,275 | ||||||||||||||||||||||||||
| $ | 64,969 | $ | 68,450 | $ | 13,242 | $ | 17,243 | |||||||||||||||||||||||
| Amounts Recognized in Accumulated Other Comprehensive Loss Consist of (pre-tax): | ||||||||||||||||||||||||||||||
| Prior Service Costs | $ | 47 | $ | 69 | $ | (906 | ) | $ | (989 | ) | ||||||||||||||||||||
| Net Actuarial Loss | 53,885 | 39,521 | 4,412 | 3,810 | ||||||||||||||||||||||||||
| $ | 53,932 | $ | 39,590 | $ | 3,506 | $ | 2,821 | |||||||||||||||||||||||
| SJG: | Other | |||||||||||||||||||||||||||||
| Pension Benefits | Postretirement Benefits | |||||||||||||||||||||||||||||
| 2017 | 2016 | 2017 | 2016 | |||||||||||||||||||||||||||
Change in Benefit Obligations: | ||||||||||||||||||||||||||||||
| Benefit Obligation at Beginning of Year | $ | 236,356 | $ | 213,660 | $ | 48,549 | $ | 46,518 | ||||||||||||||||||||||
| Service Cost | 4,303 | 4,144 | 582 | 576 | ||||||||||||||||||||||||||
| Interest Cost | 9,925 | 10,292 | 1,897 | 2,120 | ||||||||||||||||||||||||||
| Actuarial Loss (Gain) | 27,892 | 17,463 | 328 | 2,292 | ||||||||||||||||||||||||||
| Retiree Contributions | — | — | 15 | 70 | ||||||||||||||||||||||||||
| Plan Amendments | — | — | — | — | ||||||||||||||||||||||||||
| Benefits Paid | (9,410 | ) | (9,203 | ) | (2,273 | ) | (3,027 | ) | ||||||||||||||||||||||
| Benefit Obligation at End of Year | $ | 269,066 | $ | 236,356 | $ | 49,098 | $ | 48,549 | ||||||||||||||||||||||
| Change in Plan Assets: | ||||||||||||||||||||||||||||||
| Fair Value of Plan Assets at Beginning of Year | $ | 154,729 | $ | 149,032 | $ | 45,948 | $ | 43,428 | ||||||||||||||||||||||
| Actual Return on Plan Assets | 18,666 | 12,656 | 6,715 | 2,531 | ||||||||||||||||||||||||||
| Employer Contributions | 10,292 | 2,244 | 2,259 | 2,946 | ||||||||||||||||||||||||||
| Retiree Contributions | — | — | 14 | 70 | ||||||||||||||||||||||||||
| Benefits Paid | (9,410 | ) | (9,203 | ) | (2,273 | ) | (3,027 | ) | ||||||||||||||||||||||
| Fair Value of Plan Assets at End of Year | $ | 174,277 | $ | 154,729 | $ | 52,663 | $ | 45,948 | ||||||||||||||||||||||
Funded Status at End of Year: | ||||||||||||||||||||||||||||||
| Accrued Net Benefit Cost at End of Year | $ | (64,628 | ) | $ | (77,037 | ) | $ | (3,090 | ) | $ | (19,719 | ) | $ | (94,789 | ) | $ | (81,627 | ) | $ | 3,565 | $ | (2,601 | ) | |||||||
| Amounts Recognized in the Statement of Financial Position Consist of: | ||||||||||||||||||||||||||||||
| Current Liabilities | $ | (2,227 | ) | $ | (1,515 | ) | $ | — | $ | — | $ | (2,353 | ) | $ | (2,428 | ) | $ | — | $ | — | ||||||||||
| Noncurrent Liabilities | (62,401 | ) | (75,522 | ) | (3,090 | ) | (19,719 | ) | (92,436 | ) | (79,199 | ) | 3,565 | (2,601 | ) | |||||||||||||||
| Net Amount Recognized at End of Year | $ | (64,628 | ) | $ | (77,037 | ) | $ | (3,090 | ) | $ | (19,719 | ) | $ | (94,789 | ) | $ | (81,627 | ) | $ | 3,565 | $ | (2,601 | ) | |||||||
| Amounts Recognized in Regulatory Assets Consist of: | ||||||||||||||||||||||||||||||
| Prior Service Costs | $ | 741 | $ | 944 | $ | (3,289 | ) | $ | 4,965 | $ | 428 | $ | 538 | $ | (2,775 | ) | $ | (3,032 | ) | |||||||||||
| Net Actuarial Loss | 63,691 | 70,233 | 18,636 | 22,898 | 64,541 | 67,912 | 16,017 | 20,275 | ||||||||||||||||||||||
| Net Amount Recognized at End of Year | $ | 64,432 | $ | 71,177 | $ | 15,347 | $ | 27,863 | $ | 64,969 | $ | 68,450 | $ | 13,242 | $ | 17,243 | ||||||||||||||
| Amounts Recognized in Accumulated Other Comprehensive Loss Consist of: | ||||||||||||||||||||||||||||||
| Net Actuarial Loss | $ | 20,463 | $ | 23,170 | $ | — | $ | — | $ | 39,356 | $ | 24,102 | $ | — | $ | — | ||||||||||||||
The projected benefit obligation (PBO) and accumulated benefit obligation (ABO) of ourSJI's qualified employee pension plans were $167.6$243.9 million and $154.8$227.3 million, respectively, as of December 31, 2015;2017; and $176.3$224.3 million and $161.3$208.3 million, respectively, as of December 31, 2014.2016. The ABO of these plans exceeded the value of the plan assets as of December 31, 20152017 and 2014.2016. The value of these assets were $149.0$216.1 million and $144.6$189.5 million as of December 31, 20152017 and 2014,2016, respectively, and can be seen in the table above. The PBO and ABO for SJI's non-funded SERP were $72.4 million and $63.9 million, respectively, as of December 31, 2017; and $53.9 million and $51.9 million, respectively, as of December 31, 2016. SJI's SERP obligation is reflected in the tables above and has no assets.
The PBO and ABO of SJG's qualified employee pension plans were $197.0 million and $183.5 million, respectively, as of December 31, 2017; and $183.2 million and $170.0 million, respectively, as of December 31, 2016. The ABO of these plans exceeded the value of the plan assets as of December 31, 2017 and 2016. The value of these assets were $174.3 million and $154.7 million as of December 31, 2017 and 2016, respectively, and can be seen in the tables above. The PBO and ABO for ourSJG's non-funded SERP were $46.1$72.0 million and $44.6$63.6 million, respectively, as of December 31, 2015;2017; and $45.3$53.2 million and $44.0$51.2 million, respectively, as of December 31, 2014. The2016. SJG's SERP obligation is reflected in the tables above and has no assets.
The weighted-average assumptions used to determine benefit obligations for SJI and SJG at December 31 were:
| Pension Benefits | Other Postretirement Benefits | Pension Benefits | Other Postretirement Benefits | |||||||||||||||||||
| 2015 | 2014 | 2015 | 2014 | 2017 | 2016 | 2017 | 2016 | |||||||||||||||
| Discount Rate | 4.83 | % | 4.25 | % | 4.73 | % | 4.20 | % | 3.73 | % | 4.30 | % | 3.63 | % | 4.13 | % | ||||||
| Rate of Compensation Increase | 3.50 | % | 3.50 | % | 3.50 | % | 3.50 | % | 3.50 | % | 3.50 | % | 3.50 | % | 3.50 | % | ||||||
The weighted-average assumptions used to determine net periodic benefit cost for SJI and SJG for the years ended December 31 were:
| Pension Benefits | Other Postretirement Benefits | Pension Benefits | Other Postretirement Benefits | |||||||||||||||||||||||||||||||
| 2015 | 2014 | 2013 | 2015 | 2014 | 2013 | 2017 | 2016 | 2015 | 2017 | 2016 | 2015 | |||||||||||||||||||||||
| Discount Rate | 4.25 | % | 5.09 | % | 4.26 | % | 4.20 | % | 4.91 | % | 4.14 | % | 4.30 | % | 4.83 | % | 4.25 | % | 4.13 | % | 4.73 | % | 4.20 | % | ||||||||||
| Expected Long-Term Return on Plan Assets | 7.75 | % | 7.75 | % | 7.50 | % | 6.25 | % | 6.25 | % | 6.60 | % | 7.25 | % | 7.50 | % | 7.75 | % | 6.50 | % | 6.50 | % | 6.25 | % | ||||||||||
| Rate of Compensation Increase | 3.50 | % | 3.50 | % | 3.25 | % | 3.50 | % | 3.50 | % | 3.25 | % | 3.50 | % | 3.50 | % | 3.50 | % | 3.50 | % | 3.50 | % | 3.50 | % | ||||||||||
In 2014, the Society of Actuaries (SOA) released new mortality tables (RP-2014 base table with MP-2014 generational projection scale)(RP-2014), which indicated that the average life expectancyCompany adopted as of both our active and retired plan participants had increased.December 31, 2014. Since then, the SOA has updated the mortality projection on an annual basis. The Company utilizes the most current projection tables available. The obligations as of December 31, 2014, disclosed herein reflect the use of those tables. In 2015, the SOA released an update to the RP-2014 tables (MP-2015 base tables), slightly reducing the average life expectancy previously released. The obligations as of December 31,2017, 2016, and 2015, disclosed herein, reflect the use of the updated 2015 tables. While the adoption of the newprojection tables impacts liabilities significantly as of December 31 of the year of adoption, the impact on expense does not occur until the subsequent year.applicable to those years.
The discount rates used to determine the benefit obligations at December 31, 20152017 and 2014,2016, which are used to determine the net periodic benefit cost for the subsequent year, were based on a portfolio model of high-quality investments with maturities that match the expected benefit payments under our pension and other postretirement benefit plans.
The expected long-term return on plan assets (“return”) has been determined by applying long-term capital market projections provided by our pension plan Trustee to the asset allocation guidelines, as defined in the Company’sSJI's and SJG's investment policy, to arrive at a weighted average return. For certain other equity securities held by an investment manager outside of the control of the Trustee, the return has been determined based on historic performance in combination with long-term expectations. The return for the other postretirement benefits plan is determined in the same manner as discussed above; however, the expected return is reduced based on the taxable nature of the underlying trusts.
| 2015 | 2014 | |||
| Medical Care and Drug Cost Trend Rate Assumed for Next Year | N/A | 7.00 | % | |
| Dental Care Cost Trend Rate Assumed for Next Year | N/A | 4.75 | % | |
| Rate to which Cost Trend Rates are Assumed to Decline (the Ultimate Trend Rate) | N/A | 4.75 | % | |
| Year that the Rate Reaches the Ultimate Trend Rate | N/A | 2023 | ||
The retiree medical plan changed effective January 1, 2016. Retirees are provided a fixed contribution to a health reimbursement account, allowing them to obtain coverage from health-care exchanges, rather than utilizing the Company provided health-care plan. Since the health-care benefits are now a fixed dollar amount under the new plan and will not increase in the future, the plan no longer has health care trend assumptions as of December 31, 2015. As a result, assumed health care cost trend rates no longer have a significant effect on the amounts reported for ourSJI's and SJG's postretirement health care plans.
1-Percentage- Point Increase | 1-Percentage- Point Decrease | ||||||
| Effect on the Total of Service and Interest Cost | $ | 153 | $ | (123 | ) | ||
PLAN ASSETS — The Company’s- SJI's and SJG's overall investment strategy for pension plan assets is to achieve a diversification by asset class, style of manager, and sector and industry limits to achieve investment results that match the actuarially assumed rate of return, while preserving the inflation adjusted value of the plans. The Company hasSJI and SJG have implemented this diversification strategy primarily with commingled common/collective trust funds. The target allocations for pension plan assets are 28-48 percent U.S. equity securities, 13-25 percent international equity securities, 32-42 percent fixed income investments, and 0-140-7 percent to all other types of investments. Equity securities include investments in commingled common/collective trust funds as well as large-cap mid-cap and small-capmid-cap companies. Fixed income securities include commingled common/collective trust funds, group annuity contracts for pension payments, and hedge funds. Other types of investments include investments in private equity funds and real estate funds that follow several different strategies.
The strategy recognizes that risk and volatility are present to some degree with all types of investments. WeSJI and SJG seek to avoid high levels of risk at the total fund level through diversification by asset class, style of manager, and sector and industry limits. Specifically prohibited investments include, but are not limited to, venture capital, margin trading, commodities and securities of companies with less than $250.0 million capitalization (except in the small-cap portion of the fund where capitalization levels as low as $50.0 million are permissible). These restrictions are only applicable to individual investment managers with separately managed portfolios and do not apply to mutual funds or commingled trusts.
GAAP establishes a hierarchy that prioritizes fair value measurements based on the types of inputs used for the various valuation techniques. This hierarchy groups assets into three distinct levels, as fully described in Note 13,17, which will serve as the basis for presentation throughout the remainder of this Note.
The fair values of SJG’sSJI's and SJG's pension plan assets at December 31, 20152017 and 20142016 by asset category are as follows (in thousands):
| SJI (includes SJG and all other consolidated subsidiaries): | |||||||||||||||
| Asset Category | Total | Level 1 | Level 2 | Level 3 | |||||||||||
| As of December 31, 2017 | |||||||||||||||
| Cash / Cash Equivalents: | |||||||||||||||
| Cash | $ | 72 | $ | 72 | $ | — | $ | — | |||||||
| Common/Collective Trust Funds (a) | 477 | — | 477 | — | |||||||||||
| STIF-Type Instrument (b) | 1,522 | — | 1,522 | — | |||||||||||
| Equity securities: | |||||||||||||||
| Common/Collective Trust Funds - U.S. (a) | 75,699 | — | 75,699 | — | |||||||||||
| Common/Collective Trust Funds - International (a) | 39,077 | — | 39,077 | — | |||||||||||
| U.S. Large-Cap (c) | 13,526 | 13,526 | — | — | |||||||||||
| U.S. Mid-Cap (c) | 1,701 | 1,701 | — | — | |||||||||||
| U.S. Small-Cap (c) | 490 | 490 | — | — | |||||||||||
| International (c) | 3,260 | 3,260 | — | — | |||||||||||
| Fixed Income: | |||||||||||||||
| Common/Collective Trust Funds (a) | 54,106 | — | 54,106 | — | |||||||||||
| Guaranteed Insurance Contract (d) | 9,211 | — | — | 9,211 | |||||||||||
| Other types of investments: | |||||||||||||||
| Private Equity Fund (e) | 7,111 | — | — | 7,111 | |||||||||||
| Common/Collective Trust Fund - Real Estate (f) | 9,813 | — | — | 9,813 | |||||||||||
| Total | $ | 216,065 | $ | 19,049 | $ | 170,881 | $ | 26,135 | |||||||
| Asset Category | Total | Level 1 | Level 2 | Level 3 | Total | Level 1 | Level 2 | Level 3 | ||||||||||||||||||||||
| As of December 31, 2015 | ||||||||||||||||||||||||||||||
| As of December 31, 2016 | ||||||||||||||||||||||||||||||
| Cash / Cash Equivalents: | ||||||||||||||||||||||||||||||
| Cash | $ | 28 | $ | 28 | $ | — | $ | — | $ | 63 | $ | 63 | $ | — | $ | — | ||||||||||||||
| Common/Collective Trust Funds (a) | 692 | — | 692 | — | 460 | — | 460 | — | ||||||||||||||||||||||
| STIF-Type Instrument (b) | 1,096 | — | 1,096 | — | 1,431 | — | 1,431 | — | ||||||||||||||||||||||
| Equity securities: | ||||||||||||||||||||||||||||||
| Common/Collective Trust Funds – U.S. (a) | 41,976 | — | 41,976 | — | ||||||||||||||||||||||||||
| Common/Collective Trust Funds – International (a) | 26,800 | — | 26,800 | — | ||||||||||||||||||||||||||
| Common/Collective Trust Funds - U.S. (a) | 51,902 | — | 51,902 | — | ||||||||||||||||||||||||||
| Common/Collective Trust Funds - International (a) | 33,096 | — | 33,096 | — | ||||||||||||||||||||||||||
| U.S. Large-Cap (c) | 11,535 | 11,535 | — | — | 17,792 | 17,792 | — | — | ||||||||||||||||||||||
| U.S. Mid-Cap (c) | 2,748 | 2,748 | — | — | 2,479 | 2,479 | — | — | ||||||||||||||||||||||
| U.S. Small-Cap (c) | 210 | 210 | — | |||||||||||||||||||||||||||
| International (c) | 1,367 | 1,367 | — | — | 3,340 | 3,340 | — | — | ||||||||||||||||||||||
| Fixed Income: | ||||||||||||||||||||||||||||||
| Common/Collective Trust Funds (a) | 40,853 | — | 40,853 | — | 54,970 | — | 54,970 | — | ||||||||||||||||||||||
| Guaranteed Insurance Contract (d) | 8,031 | — | — | 8,031 | 9,714 | — | — | 9,714 | ||||||||||||||||||||||
| Hedge Funds (e) | 3,353 | — | — | 3,353 | ||||||||||||||||||||||||||
| Other types of investments: | ||||||||||||||||||||||||||||||
| Private Equity Fund (f) | 3,477 | — | — | 3,477 | ||||||||||||||||||||||||||
| Common/Collective Trust Fund – Real Estate (g) | 6,866 | — | — | 6,866 | ||||||||||||||||||||||||||
| Private Equity Fund (e) | 5,100 | — | — | 5,100 | ||||||||||||||||||||||||||
| Common/Collective Trust Fund - Real Estate (f) | 9,195 | — | — | 9,195 | ||||||||||||||||||||||||||
| Total | $ | 149,032 | $ | 15,888 | $ | 111,417 | $ | 21,727 | $ | 189,542 | $ | 23,674 | $ | 141,859 | $ | 24,009 | ||||||||||||||
| SJG: | ||||||||||||||||||||||||||||||
| Asset Category | Total | Level 1 | Level 2 | Level 3 | Total | Level 1 | Level 2 | Level 3 | ||||||||||||||||||||||
| As of December 31, 2014 | ||||||||||||||||||||||||||||||
| As of December 31, 2017: | ||||||||||||||||||||||||||||||
| Cash / Cash Equivalents: | ||||||||||||||||||||||||||||||
| Cash | $ | 58 | $ | 58 | $ | — | $ | — | ||||||||||||||||||||||
| Common/Collective Trust Funds (a) | $ | 554 | $ | — | $ | 554 | $ | — | 385 | — | 385 | — | ||||||||||||||||||
| STIF-Type Instrument (b) | 1,003 | — | 1,003 | — | 1,228 | — | 1,228 | — | ||||||||||||||||||||||
| Equity securities: | ||||||||||||||||||||||||||||||
| Common/Collective Trust Funds – U.S. (a) | 41,000 | — | 41,000 | — | 61,057 | — | 61,057 | — | ||||||||||||||||||||||
| Common/Collective Trust Funds – International (a) | 24,796 | — | 24,796 | — | 31,519 | — | 31,519 | — | ||||||||||||||||||||||
| U.S. Large-Cap (c) | 10,380 | 10,380 | — | — | 10,910 | 10,910 | — | — | ||||||||||||||||||||||
| U.S. Mid-Cap (c) | 4,122 | 4,122 | — | — | 1,372 | 1,372 | — | — | ||||||||||||||||||||||
| U.S. Small-Cap (c) | 186 | 186 | 395 | 395 | — | — | ||||||||||||||||||||||||
| International (c) | 2,698 | 2,698 | — | — | 2,629 | 2,629 | — | — | ||||||||||||||||||||||
| Fixed Income: | ||||||||||||||||||||||||||||||
| Common/Collective Trust Funds (a) | 38,740 | — | 38,740 | — | 43,640 | — | 43,640 | — | ||||||||||||||||||||||
| Guaranteed Insurance Contract (d) | 8,738 | — | — | 8,738 | 7,429 | — | — | 7,429 | ||||||||||||||||||||||
| Hedge Funds (e) | 3,469 | — | — | 3,469 | ||||||||||||||||||||||||||
| Other types of investments: | ||||||||||||||||||||||||||||||
| Private Equity Fund (f) | 2,895 | — | — | 2,895 | ||||||||||||||||||||||||||
| Common/Collective Trust Fund – Real Estate (g) | 5,987 | — | — | 5,987 | ||||||||||||||||||||||||||
| Private Equity Fund (e) | 5,735 | — | — | 5,735 | ||||||||||||||||||||||||||
| Common/Collective Trust Fund – Real Estate (f) | 7,920 | — | — | 7,920 | ||||||||||||||||||||||||||
| Total | $ | 144,568 | $ | 17,386 | $ | 106,093 | $ | 21,089 | $ | 174,277 | $ | 15,364 | $ | 137,829 | $ | 21,084 | ||||||||||||||
| Asset Category | Total | Level 1 | Level 2 | Level 3 | |||||||||||
| As of December 31, 2016: | |||||||||||||||
| Cash / Cash Equivalents: | |||||||||||||||
| Cash | $ | 52 | $ | 52 | — | $ | — | ||||||||
| Common/Collective Trust Funds (a) | 376 | — | 376 | — | |||||||||||
| STIF-Type Instrument (b) | 1,168 | — | 1,168 | — | |||||||||||
| Equity securities: | |||||||||||||||
| Common/Collective Trust Funds – U.S. (a) | 42,369 | — | 42,369 | — | |||||||||||
| Common/Collective Trust Funds – International (a) | 27,017 | — | 27,017 | — | |||||||||||
| U.S. Large-Cap (c) | 14,523 | 14,523 | — | — | |||||||||||
| U.S. Mid-Cap (c) | 2,024 | 2,024 | — | — | |||||||||||
| International (c) | 2,727 | 2,727 | — | — | |||||||||||
| Fixed Income: | |||||||||||||||
| Common/Collective Trust Funds (a) | 44,873 | — | 44,873 | — | |||||||||||
| Guaranteed Insurance Contract (d) | 7,930 | — | — | 7,930 | |||||||||||
| Other types of investments: | |||||||||||||||
| Private Equity Fund (e) | 4,164 | — | — | 4,164 | |||||||||||
| Common/Collective Trust Fund – Real Estate (f) | 7,506 | — | — | 7,506 | |||||||||||
| Total | $ | 154,729 | $ | 19,326 | $ | 115,803 | $ | 19,600 | |||||||
| (a) | This category represents common/collective trust fund investments through a commingled employee benefit trust (excluding real estate). These commingled funds are not traded publicly; however, the majority of the underlying assets held in these funds are stocks and bonds that are traded on active |
| (b) | This category represents short-term investment funds held for the purpose of funding disbursement payment arrangements. Underlying assets are valued based on quoted prices in active markets, or where quoted prices are not available, based on models using observable market information. Since not all values can be obtained from quoted prices in active markets, these funds are classified as Level 2 investments. |
| (c) | This category of equity investments represents a managed portfolio of common stock investments in five sectors: telecommunications, electric utilities, gas utilities, water and energy. These common stocks are actively traded on exchanges and price quotes for these shares are readily available. These common stocks are classified as Level 1 investments. |
| (d) | This category represents SJI’s Group Annuity contracts with a nationally recognized life insurance company. The contracts are the assets of the plan, while the underlying assets of the contracts are owned by the contract holder. Valuation is based on a formula and calculation specified within the contract. Since the valuation is based on the reporting entity’s own assumptions, these contracts are classified as Level 3 investments. |
| (e) |
| This category represents a limited partnership which includes several investments in U.S. leveraged buyout, venture capital, and special situation funds. Fund valuations are reported on a 90 to 120 day lag and, therefore, the value reported herein represents the market value as of June or September 30, |
| This category represents real estate common/collective trust fund investments through a commingled employee benefit trust. These commingled funds are part of a direct investment in a pool of real estate properties. These funds are valued by investment managers on a periodic basis using pricing models that use independent appraisals from sources with professional qualifications. Since these valuation inputs are not highly observable, the real estate funds are classified as Level |
Fair Value Measurement Using Significant
Unobservable Inputs (Level 3)
(In thousands)
| SJI (includes SJG and all other consolidated subsidiaries): | Guaranteed | Private | ||||||||||||||||||||||||||||||||||||
| Insurance | Hedge | Equity | Real | |||||||||||||||||||||||||||||||||||
| Contract | Funds | Funds | Estate | Total | ||||||||||||||||||||||||||||||||||
Guaranteed Insurance Contract | Hedge Funds | Private Equity Funds | Real Estate | Total | ||||||||||||||||||||||||||||||||||
| Balance at January 1, 2014 | $ | 9,071 | $ | 3,328 | $ | 2,440 | $ | 5,401 | $ | 20,240 | ||||||||||||||||||||||||||||
| Balance at January 1, 2016 | $ | 9,960 | $ | 4,159 | $ | 4,312 | $ | 8,515 | $ | 26,946 | ||||||||||||||||||||||||||||
| Actual return on plan assets: | ||||||||||||||||||||||||||||||||||||||
| Relating to assets still held at the reporting date | 396 | 141 | (20 | ) | 586 | 1,103 | 541 | (67 | ) | (140 | ) | 680 | 1,014 | |||||||||||||||||||||||||
| Relating to assets sold during the period | 10 | — | 260 | — | 270 | 14 | — | 245 | — | 259 | ||||||||||||||||||||||||||||
| Purchases, Sales and Settlements | (739 | ) | — | 215 | — | (524 | ) | (801 | ) | (4,092 | ) | 683 | — | (4,210 | ) | |||||||||||||||||||||||
| Balance at December 31, 2014 | $ | 8,738 | $ | 3,469 | $ | 2,895 | $ | 5,987 | $ | 21,089 | ||||||||||||||||||||||||||||
| Balance at December 31, 2016 | 9,714 | — | 5,100 | 9,195 | 24,009 | |||||||||||||||||||||||||||||||||
| Actual return on plan assets: | ||||||||||||||||||||||||||||||||||||||
| Relating to assets still held at the reporting date | (26 | ) | (116 | ) | (223 | ) | 879 | 514 | 245 | (214 | ) | 618 | 649 | |||||||||||||||||||||||||
| Relating to assets sold during the period | 21 | — | 346 | — | 367 | 12 | — | 491 | — | 503 | ||||||||||||||||||||||||||||
| Purchases, Sales and Settlements | (702 | ) | — | 459 | — | (243 | ) | (760 | ) | 1,734 | — | 974 | ||||||||||||||||||||||||||
| Balance at December 31, 2015 | $ | 8,031 | $ | 3,353 | $ | 3,477 | $ | 6,866 | $ | 21,727 | ||||||||||||||||||||||||||||
| Balance at December 31, 2017 | $ | 9,211 | $ | — | $ | 7,111 | $ | 9,813 | $ | 26,135 | ||||||||||||||||||||||||||||
| SJG: | Guaranteed Insurance Contract | Hedge Funds | Private Equity Funds | Real Estate | Total | ||||||||||||||
| Balance at January 1, 2016 | $ | 8,031 | $ | 3,353 | $ | 3,477 | $ | 6,866 | $ | 21,727 | |||||||||
| Actual return on plan assets: | |||||||||||||||||||
| Relating to assets still held at the reporting date | 541 | (13 | ) | (71 | ) | 640 | 1,097 | ||||||||||||
| Relating to assets sold during the period | 12 | — | 200 | — | 212 | ||||||||||||||
| Purchases, Sales and Settlements | (654 | ) | (3,340 | ) | 558 | — | (3,436 | ) | |||||||||||
| Balance at December 31, 2016 | $ | 7,930 | $ | — | $ | 4,164 | $ | 7,506 | $ | 19,600 | |||||||||
| Actual return on plan assets: | |||||||||||||||||||
| Relating to assets still held at the reporting date | 103 | — | (224 | ) | 414 | 293 | |||||||||||||
| Relating to assets sold during the period | 9 | — | 396 | — | 405 | ||||||||||||||
| Purchases, Sales and Settlements | (613 | ) | — | 1,399 | — | 786 | |||||||||||||
| Balance at December 31, 2017 | $ | 7,429 | $ | — | $ | 5,735 | $ | 7,920 | $ | 21,084 | |||||||||
As with the pension plan assets, the Company’sSJI's and SJG's overall investment strategy for post-retirement benefit plan assets is to achieve a diversification by asset class, style of manager, and sector and industry limits to achieve investment results that match the actuarially assumed rate of return, while preserving the inflation adjusted value of the plans. The Company hasSJI and SJG have implemented this diversification strategy with a mix of common/collective trust funds, mutual funds and Company-owned life insurance policies. The target allocations for post-retirement benefit plan assets are 30-43 percent U.S. equity securities, 20-30 percent international equity securities, and 32-42 percent fixed income investments and 0-7 percent to all other types of investments. Equity securities include investments in large-cap, mid-cap and small-cap companies within mutual funds or common/collective trust funds. Fixed income securities within the common/collective trust fund include primarily investment grade, U.S. Government and mortgage-backed financial instruments. The insurance policies are backed by a series of commingled trust investments held by the insurance carrier.
The fair values of SJG’sSJI's and SJG's other postretirement benefit plan assets at December 31, 20152017 and 20142016 by asset category are as follows (in thousands):
| SJI (includes SJG and all other consolidated subsidiaries): | |||||||||||||||
| Asset Category | Total | Level 1 | Level 2 | Level 3 | |||||||||||
| As of December 31, 2017: | |||||||||||||||
| Cash | $ | — | $ | — | $ | — | $ | — | |||||||
| Equity Securities: | |||||||||||||||
| Common/Collective Trust Funds - U.S. (a) | 15,101 | — | 15,101 | — | |||||||||||
| Common/Collective Trust Funds - International (a) | 11,378 | — | 11,378 | — | |||||||||||
| Mutual Fund - U.S. (b) | — | — | — | — | |||||||||||
| Mutual Funds - International (b) | — | — | — | — | |||||||||||
| Fixed Income: | |||||||||||||||
| Common/Collective Trust Funds - Bonds (a) | 15,272 | — | 15,272 | — | |||||||||||
| Mutual Funds - Bonds (b) | — | — | — | — | |||||||||||
| Other Types of Investments: | |||||||||||||||
| Mutual Funds - REITS (b) | 864 | 864 | — | — | |||||||||||
| Company Owned Life Insurance (c) | 15,307 | — | 15,307 | — | |||||||||||
| Total | $ | 57,922 | $ | 864 | $ | 57,058 | $ | — | |||||||
| Asset Category | Total | Level 1 | Level 2 | Level 3 | |||||||||||
| As of December 31, 2016: | |||||||||||||||
| Cash | $ | — | $ | — | $ | — | $ | — | |||||||
| Equity Securities: | |||||||||||||||
| Common/Collective Trust Funds - U.S. (a) | 14,878 | — | 14,878 | — | |||||||||||
| Common/Collective Trust Funds - International (a) | 8,674 | — | 8,674 | — | |||||||||||
| Mutual Fund - U.S. (b) | — | — | — | — | |||||||||||
| Mutual Funds - International (b) | — | — | — | — | |||||||||||
| Fixed Income: | |||||||||||||||
| Common/Collective Trust Funds - Bonds (a) | 13,537 | — | 13,537 | — | |||||||||||
| Mutual Funds - Bonds (b) | — | — | — | — | |||||||||||
| Other Types of Investments: | |||||||||||||||
| Mutual Funds - REITS (b) | — | — | — | — | |||||||||||
| Company Owned Life Insurance (c) | 13,443 | — | 13,443 | — | |||||||||||
| Total | $ | 50,532 | $ | — | $ | 50,532 | $ | — | |||||||
| SJG: | ||||||||||||||||||||||||||||||
| Asset Category | Total | Level 1 | Level 2 | Level 3 | Total | Level 1 | Level 2 | Level 3 | ||||||||||||||||||||||
| As of December 31, 2015 | ||||||||||||||||||||||||||||||
| As of December 31, 2017 | ||||||||||||||||||||||||||||||
| Cash | $ | 26 | $ | 26 | $ | — | $ | — | $ | — | $ | — | $ | — | $ | — | ||||||||||||||
| Equity Securities: | ||||||||||||||||||||||||||||||
| Common/Collective Trust Funds - U.S. (a) | 12,154 | — | 12,154 | $ | — | 13,572 | — | 13,572 | — | |||||||||||||||||||||
| Common/Collective Trust Funds - International (a) | 7,471 | — | 7,471 | — | 10,226 | — | 10,226 | — | ||||||||||||||||||||||
| Mutual Fund - U.S. (b) | 1,228 | 1,228 | — | — | — | — | — | — | ||||||||||||||||||||||
| Mutual Funds - International (b) | 922 | 922 | — | — | — | — | — | — | ||||||||||||||||||||||
| Fixed Income: | ||||||||||||||||||||||||||||||
| Common/Collective Trust Funds - Bonds (a) | 11,852 | — | 11,852 | — | 13,726 | — | 13,726 | — | ||||||||||||||||||||||
| Mutual Funds - Bonds (b) | 1,352 | 1,352 | — | — | — | — | — | — | ||||||||||||||||||||||
| Other Types of Investments: | ||||||||||||||||||||||||||||||
| Mutual Funds - REITS (b) | 142 | 142 | — | — | 777 | 777 | — | — | ||||||||||||||||||||||
| Company Owned Life Insurance (c) | 8,281 | — | 8,281 | — | 14,362 | — | 14,362 | — | ||||||||||||||||||||||
| Total | $ | 43,428 | $ | 3,670 | $ | 39,758 | $ | — | $ | 52,663 | $ | 777 | $ | 51,886 | $ | — | ||||||||||||||
| Asset Category | Total | Level 1 | Level 2 | Level 3 | Total | Level 1 | Level 2 | Level 3 | ||||||||||||||||||||||
| As of December 31, 2014 | ||||||||||||||||||||||||||||||
| As of December 31, 2016 | ||||||||||||||||||||||||||||||
| Cash | $ | 142 | $ | 142 | $ | — | $ | — | $ | — | $ | — | $ | — | $ | — | ||||||||||||||
| Equity Securities: | ||||||||||||||||||||||||||||||
| Common/Collective Trust Funds - U.S. (a) | 10,006 | — | 10,006 | $ | — | 13,372 | — | 13,372 | — | |||||||||||||||||||||
| Common/Collective Trust Funds - International (a) | 7,030 | — | 7,030 | — | 7,796 | — | 7,796 | — | ||||||||||||||||||||||
| Mutual Fund - U.S. (b) | 4,447 | 4,447 | — | — | — | — | — | — | ||||||||||||||||||||||
| Mutual Funds - International (b) | 1,671 | 1,671 | — | — | — | — | — | — | ||||||||||||||||||||||
| Fixed Income: | ||||||||||||||||||||||||||||||
| Common/Collective Trust Funds - Bonds (a) | 11,059 | — | 11,059 | — | 12,167 | — | 12,167 | — | ||||||||||||||||||||||
| Mutual Funds - Bonds (b) | 2,624 | 2,624 | — | — | — | — | — | — | ||||||||||||||||||||||
| Other Types of Investments: | ||||||||||||||||||||||||||||||
| Mutual Funds - REITS (b) | 286 | 286 | — | — | — | — | — | — | ||||||||||||||||||||||
| Company Owned Life Insurance (c) | 3,686 | — | 3,686 | — | 12,613 | — | 12,613 | — | ||||||||||||||||||||||
| Total | $ | 40,951 | $ | 9,170 | $ | 31,781 | $ | — | $ | 45,948 | $ | — | $ | 45,948 | $ | — | ||||||||||||||
| (a) | This category represents common/collective trust fund investments through a commingled employee benefit trust (excluding real estate). These commingled funds are not traded publicly; however, the majority of the underlying assets held in these funds are stocks and bonds that are traded on active markets and prices for these assets are readily observable. Also included in these funds are interest rate swaps, asset backed securities, mortgage backed securities and other investments with observable market values. Holdings in these commingled funds are classified as Level 2 investments. |
| (b) | This category represents mutual fund investments. The mutual funds are actively traded on exchanges and price quotes for the shares are readily available. These mutual funds are classified as Level 1 investments. |
| (c) | This category represents Company-owned life insurance policies with a nationally known life insurance company. The value of these policies is backed by a series of common/collective trust funds held by the insurance carrier similar to category (a) above. Holdings in these insurance policies are classified as Level 2 investments. |
| Pension Benefits | Other Postretirement Benefits | |||||||||||||
| 2016 | $ | 9,685 | $ | 3,673 | ||||||||||
| 2017 | $ | 9,992 | $ | 3,657 | ||||||||||
| SJI (includes SJG and all other consolidated subsidiaries): | Pension Benefits | Other Postretirement Benefits | ||||||||||||
| 2018 | $ | 10,364 | $ | 3,634 | $ | 12,596 | $ | 4,291 | ||||||
| 2019 | $ | 11,253 | $ | 3,689 | $ | 13,535 | $ | 4,380 | ||||||
| 2020 | $ | 11,704 | $ | 3,798 | $ | 14,180 | $ | 4,499 | ||||||
| 2021 - 2025 | $ | 68,799 | $ | 18,562 | ||||||||||
| 2021 | $ | 14,851 | $ | 4,503 | ||||||||||
| 2022 | $ | 15,937 | $ | 4,513 | ||||||||||
| 2023 - 2027 | $ | 90,714 | $ | 20,683 | ||||||||||
| SJG: | Pension Benefits | Other Postretirement Benefits | |||||
| 2018 | $ | 10,451 | $ | 3,434 | |||
| 2019 | $ | 11,349 | $ | 3,587 | |||
| 2020 | $ | 11,917 | $ | 3,710 | |||
| 2021 | $ | 12,495 | $ | 3,726 | |||
| 2022 | $ | 13,489 | $ | 3,752 | |||
| 2023 - 2027 | $ | 77,033 | $ | 17,172 | |||
Credit facilities and available liquidity as of December 31, 2017 were as follows (in thousands):
| Company | Total Facility | Usage | Available Liquidity | Expiration Date | |||||||||||
| SJI: | |||||||||||||||
| Syndicated Revolving Credit Facility | $ | 400,000 | $ | 251,000 | (A) | $ | 149,000 | August 2022 | (C) | ||||||
| Revolving Credit Facility | 50,000 | 50,000 | — | September 2019 | (D) | ||||||||||
| Total SJI | 450,000 | 301,000 | 149,000 | ||||||||||||
| SJG: | |||||||||||||||
| Commercial Paper Program/Revolving Credit Facility | 200,000 | 52,800 | (B) | 147,200 | August 2022 | (E) | |||||||||
| Uncommitted Bank Line | 10,000 | — | 10,000 | August 2018 | |||||||||||
| Total SJG | 210,000 | 52,800 | 157,200 | ||||||||||||
| Total | $ | 660,000 | $ | 353,800 | $ | 306,200 | |||||||||
(A) Includes letters of credit outstanding in the amount of $6.6 million.
(B) Includes letters of credit outstanding in the amount of $0.8 million.
(C) In August 2017, SJI entered into a five year, unsecured $400.0 million revolving credit agreement which is syndicated among several banks. In connection with this agreement, SJI terminated its previous $400.0 million revolving credit agreement.
(D) In September 2017, SJI amended an unsecured revolving credit facility for two years. The facility now terminates in September 2019.
(E) In August 2017, SJG entered into a five year, unsecured $200.0 million revolving credit agreement which is syndicated among several banks. In connection with this agreement, SJG terminated its previous $200.0 million revolving credit agreement.
The SJG facilities are restricted as to use and availability specifically to SJG; however, if necessary, the SJI facilities can also be used to support SJG’s liquidity needs. Borrowings under these credit facilities are at market rates. SJI's weighted average interest rate on these borrowings, which changes daily, was 2.46%, 1.47% and 1.13% at December 31, 2017, 2016 and 2015, respectively. SJG's weighted average interest rate on these borrowings, which changes daily, was 1.88%, 0.97% and 0.66% at December 31, 2017, 2016 and 2015, respectively.
SJI's average borrowings outstanding under these credit facilities (which includes SJG), not including letters of credit, during the years ended December 31, 2017 and 2016 were $276.7 million and $321.9 million, respectively. The maximum amounts outstanding under these credit facilities (which includes SJG), not including letters of credit, during the years ended December 31, 2017 and 2016 were $373.8 million and $467.7 million, respectively.
SJG's average borrowings outstanding under its credit facilities, not including letters of credit, during the years ended December 31, 2017 and 2016 were $17.6 million and $71.5 million, respectively. The maximum amount outstanding under these credit facilities, not including letters of credit, during the years ended December 31, 2017 and 2016 were $110.1 million and $141.7 million, respectively.
SJG has a commercial paper program under which SJG may issue short-term, unsecured promissory notes to qualified investors up to a maximum aggregate amount outstanding at any time of $200.0 million. The notes have fixed maturities which vary by note, but may not exceed 270 days from the date of issue. Proceeds from the notes are used for general corporate purposes. SJG uses the commercial paper program in tandem with the new $200.0 million revolving credit facility and does not expect the principal amount of borrowings outstanding under the commercial paper program and the credit facility at any time to exceed an aggregate of $200.0 million.
| 14. | LONG-TERM DEBT: |
Outstanding Long-Term Debt at December 31 consisted of the following:
| 2017 | 2016 | ||||||||
| Long-Term Debt (A): | |||||||||
| South Jersey Gas Company: | |||||||||
| First Mortgage Bonds: (B) | |||||||||
| 4.657% | Series due 2017 (C) | — | 15,000 | ||||||
| 7.97% | Series due 2018 | 10,000 | 10,000 | ||||||
| 7.125% | Series due 2018 | 20,000 | 20,000 | ||||||
| 5.587% | Series due 2019 | 10,000 | 10,000 | ||||||
| 3.00% | Series due 2024 (D) | 50,000 | 50,000 | ||||||
| 3.03% | Series due 2024 (E) | 35,000 | 35,000 | ||||||
| 3.63% | Series due 2025 (F) | 7,273 | 8,182 | ||||||
| 4.84% | Series due 2026 (G) | 15,000 | 15,000 | ||||||
| 4.93% | Series due 2026 (H) | 45,000 | 45,000 | ||||||
| 4.03% | Series due 2027 | 45,000 | 45,000 | ||||||
| 4.01% | Series due 2030 (I) | 50,000 | 50,000 | ||||||
| 4.23% | Series due 2030 | 30,000 | 30,000 | ||||||
| 3.74% | Series due 2032 (J) | 35,000 | 35,000 | ||||||
| 5.55% | Series due 2033 | 32,000 | 32,000 | ||||||
| 6.213% | Series due 2034 | 10,000 | 10,000 | ||||||
| 5.45% | Series due 2035 | 10,000 | 10,000 | ||||||
| 3.00% | Series due 2047 (K) | 200,000 | — | ||||||
| Series A 2006 Bonds at variable rates due 2036 (L) | 24,900 | 24,900 | |||||||
| SJG Term Facility (M) | 200,000 | 200,000 | |||||||
| Total SJG Long-Term Debt Outstanding (S) | $ | 829,173 | $ | 645,082 | |||||
| Less SJG Current Maturities | (63,809 | ) | (215,909 | ) | |||||
| Total SJG Long-Term Debt (S) | $ | 765,364 | $ | 429,173 | |||||
| Marina Energy LLC: (N) | |||||||||
| Series A 2001 Bonds at variable rates due 2031 | $ | — | $ | 20,000 | |||||
| Series B 2001 Bonds at variable rates due 2021 | — | 25,000 | |||||||
| Series A 2006 Bonds at variable rates due 2036 | — | 16,400 | |||||||
| South Jersey Industries: | |||||||||
| 2.71% | Series B 2012 Notes due 2017 (O) | — | 16,000 | ||||||
| 3.05% | Series due 2019 | 60,000 | 60,000 | ||||||
| 3.05% | Series due 2019 | 30,000 | 30,000 | ||||||
| 3.05% | Series due 2019 | 50,000 | 50,000 | ||||||
| 3.46% | Series C 2012 Notes due 2022 | 35,000 | 35,000 | ||||||
| 3.22% | Series due 2024 (P) | 25,000 | — | ||||||
| 3.46% | Series due 2027 (P) | 25,000 | — | ||||||
| Series Notes at variable rates due 2019 (Q) | 40,000 | 40,000 | |||||||
| Series Notes at variable rates due 2019 (Q) | 60,000 | 60,000 | |||||||
| South Jersey Industries Term Loan at variable rates due 2020 (R) | 50,000 | 50,000 | |||||||
| Total SJI Consolidated Long-Term Debt Outstanding (S) | $ | 1,204,173 | $ | 1,047,482 | |||||
| Less SJI Consolidated Current Maturities (all at SJG) | (63,809 | ) | (231,909 | ) | |||||
| Total SJI Consolidated Long-Term Debt (S) | $ | 1,140,364 | $ | 815,573 | |||||
| (A) | Long-term debt maturities for SJI for the succeeding five years are as follows (in thousands): 2018: $63,809; 2019: $458,909; 2020: $67,909; 2021: $27,909; and 2022: $66,084. Long-term debt maturities for SJG for the succeeding five years are as follows (in thousands): 2018: $63,809; 2019: $218,909; 2020: $17,909; 2021: $27,909; and 2022: $31,084. |
| (B) | In January 2017, SJG entered into a Supplemental Indenture Amending and Restating First Mortgage Indenture (the “New Mortgage”), which amended and restated in its entirety that Indenture of Mortgage dated October 1, 1947. The New Mortgage provides for the issuance by SJG of bonds, notes or other securities that are secured by a lien on substantially all of the operating properties and franchises of SJG. |
| (C) | In July 2017, SJG redeemed at maturity $15.0 million of 4.657% Medium Term Notes (MTN's). |
| (D) | SJG has $50.0 million of 3.00% MTN's, with $10.0 million due annually beginning September 2020 with the final payment due September 2024. |
| (E) | SJG has $35.0 million of 3.03% MTN's, with $7.0 million due annually beginning November 2020 with the final payment due November 2024. |
| (F) | SJG pays $0.9 million annually toward the principal amount of 3.63% MTN's, with the final payment to be made December 2025. As such, $0.9 million of the total outstanding amount on this debt is classified in current portion of long-term debt on the consolidated balance sheets as it is due within one year. |
| (G) | SJG has $15.0 million of 4.84% MTN's, with $2.5 million due annually beginning March 2021 with the final payment due March 2026. |
| (H) | SJG has $45.0 million of 4.93% MTN's, with $7.5 million due annually beginning June 2021 with the final payment due June 2026. |
| (I) | SJG has $50.0 million of 4.01% MTN's with several due dates, as follows: $8.0 million each due November 2018 and 2019; $2.0 million due November 2025; $3.0 million due November 2026; $8.0 million due November 2027; and $7.0 million each due November 2028, 2029 and 2030. |
| (J) | SJG has $35.0 million of 3.74% MTN's, with $3.175 million due annually beginning April 2022 with final payment due April 2032. |
| (K) | In January 2017, SJG issued $200.0 million aggregate principal amount of MTN's, Series E, 2017, due January 2047, with principal repayments beginning in 2025. The MTN's bear interest at an annual rate of 3.0% payable semiannually. Proceeds were used to pay down the $200.0 million multiple-draw term facility referenced in (M) below, which was set to expire in June 2017. |
| (L) | These variable rate demand bonds bear interest at a floating rate that resets weekly. The interest rate as of December 31, 2017 was 1.66%. Liquidity support on these bonds is provided under a separate letter of credit facility that expires in August 2018; as such, these bonds are recorded in current portion of long-term debt on the consolidated balance sheets. These bonds contain no financial covenants. |
| (M) | SJG had a $200.0 million multiple-draw term facility offered by a syndicate of banks which was set to expire in June 2017. The total amount outstanding under this facility at December 31, 2016 was $200.0 million, which was classified in current portion of long-term debt on the consolidated balance sheets as it was due within one year. This facility bore interest at a floating rate based on LIBOR plus a spread determined by SJG's credit ratings. In January 2017, this facility was paid down using the $200.0 million MTN's referenced in (K) above. In January 2017, SJG entered into an unsecured, $200.0 million multiple-draw term loan credit agreement ("Credit Agreement"), which is syndicated among seven banks. Term loans under the Credit Agreement bear interest at a variable base rate or a variable LIBOR rate, at SJG's election. Under the Credit Agreement, SJG can borrow up to an aggregate of $200.0 million until July 2018, of which SJG borrowed $200.0 million during 2017. All loans under the Credit Agreement become due in January 2019. |
| (N) | In May 2017, Marina voluntarily redeemed bonds issued by the New Jersey Economic Development Authority (NJEDA) in an aggregate principal amount of $61.4 million, as follows: Thermal Energy Facilities Revenue Bonds (Marina Energy LLC - 2001 Project) Series A ($20.0 million); Thermal Energy Facilities Federally Taxable Revenue Bonds (Marina Energy LLC - 2001 Project) Series B ($25.0 million); and Thermal Energy Facilities Revenue Bonds (Marina Energy LLC Project) Series 2006A ($16.4 million). In connection with the redemptions, separate related letter of credit reimbursement agreements were terminated (see Note 15). |
| (O) | In June 2017, SJI redeemed at maturity $16.0 million of 2.71% Senior Unsecured Notes. |
| (P) | In August 2017, SJI entered into a note purchase agreement that provides for the issuance of an aggregate of $100.0 million of MTNs. Pursuant to the agreement, SJI issued $50.0 million aggregate principal amount of MTNs, consisting of (a) $25.0 million aggregate principal amount of 3.22% Senior Notes, Series 2017A-1, due August 2024, and (b) $25.0 million aggregate principal amount of 3.46% Senior Notes, Series 2017B-1, due August 2027. SJI issued the remaining $50.0 million of MTNs in January 2018 (see Note 19). |
| (Q) | At December 31, 2017, the floating rate on these Senior Notes was 3.01%. |
| (R) | At December 31, 2017, the floating rate on this Term Loan was 2.29%. |
| (S) | Total SJI consolidated Long-Term Debt in the table above does not include unamortized debt issuance costs of $17.4 million and $7.6 million for the years ended December 31, 2017 and 2016, respectively. Total SJG Long-Term Debt in the table above does not include unamortized debt issuance costs of $7.3 million and $6.0 million for the years ended December 31, 2017 and 2016, respectively. |
In October 2017, SJI entered into a 364-day, $2.6 billion syndicated, committed Bridge Facility to finance the acquisition of the assets of Elizabethtown Gas Company and Elkton Gas Company discussed in Note 1. In November 2017 and January 2018, as a result of amendments to various outstanding debt agreements, SJI reduced the bridge commitments to $1.7 billion, or the amount of the purchase price for the assets SJI agreed to acquire. SJI incurred $10.4 million of debt issuance costs, which, net of $2.6 million of amortization, are included in the unamortized debt issuance costs disclosed in (S) above.
| 15. | COMMITMENTS AND CONTINGENCIES: |
GAS SUPPLY CONTRACTS - In the normal course of business, SJG and SJRG have entered into long-term contracts for natural gas supplies, firm transportation and gas storage service. The transportation and storage service agreements with interstate pipeline suppliers were made under FERC approved tariffs. SJRG's cumulative obligation for demand charges and reservation fees paid to suppliers for these services is approximately $1.3 million per month. SJG's cumulative obligation for gas supply-related demand charges and reservation fees paid to suppliers for these services averages approximately $6.0 million per month and is recovered on a current basis through the BGSS. SJRG has also committed to purchase a minimum of 604,000 dts/d and up to 954,000 dts/d of natural gas, from various suppliers, for terms ranging from three to ten years at index based prices.
PENDING LITIGATION - SJI and SJG are subject to claims arising in the ordinary course of business and other legal proceedings. SJI has been named in, among other actions, certain gas supply and capacity management contract disputes and certain product liability claims related to our former sand mining subsidiary.
SJI is currently involved in a pricing dispute related to two long-term gas supply contracts. On May 8, 2017, a jury from the United States District Court for the District of Colorado returned a verdict in favor of the plaintiff supplier. On July 21, 2017, the court entered final judgment against SJG and SJRG. As a result of this ruling, SJG and SJRG have accrued $20.4 million and $53.6 million, respectively, through December 31, 2017. We believe that the amount to be paid by SJG reflects a gas cost that ultimately will be recovered from SJG’s customers through adjusted rates. As such, this amount was recorded as both an Accounts Payable and a reduction of Regulatory Liabilities on the consolidated balance sheets of both SJI and SJG as of December 31, 2017. The amount associated with SJRG was also recorded as an Accounts Payable on the consolidated balance sheets of SJI as of December 31, 2017, with charges of $49.6 million to Cost of Sales - Nonutility on the consolidated statements of income of SJI for the year ended December 31, 2017. SJI also recorded $4.0 million to Interest Charges on the consolidated statements of income for the year ended December 31, 2017. The plaintiff supplier filed a second related lawsuit against SJG and SJRG in the United States District Court for the District of Colorado on December 21, 2017, alleging that SJG and SJRG have continued to breach the gas supply contracts notwithstanding the judgmentin the prior lawsuit. The plaintiff supplier is seeking recovery of the amounts disputed by SJI since the earlier judgment, and a declaration regarding the price under the disputed contracts going forward until the contracts terminate in October 2019. SJI moved to stay the second lawsuit
pending resolution of the post-judgment motions in the first lawsuit and any appeal of that lawsuit. All legal reserves related to this second lawsuit are recorded as part of the accrued amounts disclosed above.
SJI was involved in a dispute in the Court of Common Pleas of Philadelphia related to a three-year capacity management contract with a counterparty. The counterparty claimed that it was owed approximately $13.3 million, plus interest, from SJRG under a sharing credit within the contract. SJI settled with the counterparty for $9.5 million, which amount was recorded to Cost of Sales - Nonutility on SJI's consolidated statements of income for the year ended December 31, 2017. SJI made the payment in September 2017.
SJI was also involved in a tariff rate dispute with a counterparty, whereby SJI contended that the counterparty was overcharging for storage demand charges over a ten-year period. In November 2017, SJI received a favorable decision from the FERC on this matter, which resulted in a total pre-tax income impact of $9.3 million. Of this amount, $7.4 million related to the actual overcharges and was recorded as a decrease to Cost of Sales - Nonutility on the consolidated statements of income for the year ended December 31, 2017. The remaining $1.9 million related to interest income and was recorded in Other Income on the consolidated statements of income for the year ended December 31, 2017. SJI received payment from the counterparty in November 2017.
Liabilities related to claims are accrued when the amount or range of amounts of probable settlement costs or other charges for these claims can be reasonably estimated. For matters other than the disputes that are noted above, SJI has accrued approximately $3.0 million and $3.1 million related to all claims in the aggregate as of December 31, 2017 and 2016, respectively, of which SJG has accrued approximately $0.7 million and $0.6 million as of December 31, 2017 and 2016, respectively. Although SJI and SJG do not presently believe that these matters will have a material adverse effect on its business, given the inherent uncertainties in such situations, SJI and SJG can provide no assurance regarding the outcome of litigation.
COLLECTIVE BARGAINING AGREEMENTS— Unionized personnel represent approximately 39% and 56% of SJI's and SJG's workforce at December 31, 2017, respectively. SJI has collective bargaining agreements with unions that represent these employees: the International Brotherhood of Electrical Workers (IBEW) Local 1293 and the International Association of Machinists and Aerospace Workers (IAM) Local 76. SJG employees represented by the IBEW operate under a collective bargaining agreement that runs through February 2018, for which negotiations are still ongoing. SJG's remaining unionized employees are represented by the IAM and operate under a collective bargaining agreement that runs through August 2021.
GUARANTEES - As of December 31, 2017, SJI, the parent company, has issued guarantees to third parties on behalf of its consolidated subsidiaries. These guarantees were issued to guarantee payment to third parties with whom SJI's consolidated subsidiaries have commodity supply contracts. As of December 31, 2017, these guarantees support future firm commitments of SJI's consolidated subsidiaries and $95.7 million of the Accounts Payable already recorded on SJI's consolidated balance sheet.
As of December 31, 2017, SJI had issued $6.0 million of parental guarantees on behalf of an unconsolidated subsidiary. These guarantees generally expire within the next two years and were issued to enable the subsidiary to market retail natural gas.
STANDBY LETTERS OF CREDIT — As of December 31, 2017, SJI provided $6.6 million of standby letters of credit through its revolving credit facility to enable SJE to market retail electricity and for various construction and operating activities. SJG provided a $25.2$0.8 million letter of credit under its revolving credit facility to support the remediation of environmental conditions at certain locations in SJG's service territory. SJG has provided $25.1 million of additional letters of credit under a separate facility outside of the revolving credit facility to support variable-rate demand bonds issued through the New Jersey Economic Development Authority (NJEDA)NJEDA to finance the expansion of SJG’s natural gas distribution system. In May 2017, Marina redeemed its variable-rate demand bonds and the related letters of credit reimbursement agreements, which totaled $62.3 million, were terminated (see Note 14).
Since the early 1980s, weSJI accrued environmental remediation costs of $359.1$490.7 million,, of which $236.0$317.9 million has been was spent as of December 31, 20152017. SJG accrued environmental remediation costs of $473.3 million. of which $301.6 million was spent as of December 31, 2017.
The following table details the amounts expended and accrued for SJI's and expended forSJG's environmental remediation at December 31during the last two years (in thousands):
| 2015 | 2014 | |||||||||||||
SJI (includes SJG and all other consolidated subsidiaries): | 2017 | 2016 | ||||||||||||
| Beginning of Year | $ | 124,308 | $ | 119,492 | $ | 155,013 | $ | 126,623 | ||||||
| Accruals | 18,747 | 16,453 | 56,405 | 60,713 | ||||||||||
| Expenditures | (19,861 | ) | (11,637 | ) | (38,563 | ) | (32,323 | ) | ||||||
| End of Year | $ | 123,194 | $ | 124,308 | $ | 172,855 | $ | 155,013 | ||||||
| SJG: | 2017 | 2016 | |||||
| Beginning of Year | $ | 153,047 | $ | 123,194 | |||
| Accruals | 55,814 | 61,933 | |||||
| Expenditures | (37,165 | ) | (32,080 | ) | |||
| End of Year | $ | 171,696 | $ | 153,047 | |||
The balances are segregated between current and noncurrent on the consolidated balance sheets under the captions Current Liabilities and RegulatoryDeferred Credits and Other Noncurrent Liabilities.
Management estimates that undiscounted future costs to clean up ourSJG's sites will range from $123.2$171.7 million to $204.7$284.1 million. Six of SJG's sites comprise the majority of these estimates, the sum of the six sites range from a low of $158.2 million. We to a high of $275.7 million. SJG recorded the lower end of this range$123.2 million, as a liability because a single reliable estimation point is not feasible due to the amount of uncertainty involved in the nature of projected remediation efforts and the long period over which remediation efforts will continue.Six of our sites comprise the majority of these estimates, the sum of the six sites range from a low of $110.5 million to a high of $190.5 million. Recorded amounts include estimated costs based on projected investigation and remediation work plans using existing technologies. Actual costs could differ from the estimates due to the long-term nature of the projects, changing technology, government regulations and site-specific requirements. Significant risks surrounding these estimates include unforeseen market price increases for remedial services, property owner acceptance of remedy selection, regulatory approval of selected remedy and remedial investigative findings.
The remediation efforts at ourSJG's six most significant sites include the following:
Site 1 - Several interim remedial actions have been completed at the site. Steps remaining to remediate the balance of the site include selection of the remedial action, confirmation of regulatory compliance of the selected remedy, implementation of the approved remedy, long-term groundwater monitoring, and issuance of a Response Action Outcome.
Site 2 - Various remedial investigation activities have been completed at this site and a final site remedy has been proposed toapproved by the regulatory authority. Steps remainingThe remedial action is underway and preparation for the next step is ongoing. Remaining steps to remediate the site include confirmation of regulatory compliancecompletion of the selected remedy, implementation of the approved remedyremedial action, long-term groundwater monitoring, and issuance of a Response Action Outcome.
Site 3 - Various remedial investigation activities have been completed at this site and a final site remedy is being developed for proposal to the regulatory authority. Steps remaining to remediate the site include selection of a final remedy, confirmation of regulatory compliance of the selected remedy, implementation of the approved remedy and issuance of a Response Action Outcome.
Site 5 -Remedial investigation activities are complete at this site and a final remedy has been proposed to and4 - The remedial action approved by the regulatory authority. Steps remainingauthority is currently being implemented. Remaining steps to remediate the site include in-situ remediation of impacted soil, post remediation groundwater monitoring, ongoing operation of the product recovery system, and issuance of a Response Action Outcome.
Site 65 - Remedial investigation activities have been completed at this site and a final site remedy is being developed for proposalhas been proposed to the regulatory authority. Steps remaining to remediate the site include selection of a final remedy, confirmation of regulatory complianceapproval of the selectedfinal remedy, implementation of the approved remedy, and issuance of a Response Action Outcome.
With Morie's sale in 1996, EMI assumed responsibility for environmental liabilities currently estimated between $0.5 million and $1.0 million. The information available on these sites is sufficient only to establish a range of probable liability and no point within the range is more likely than any other. Therefore, EMI has accrued the lower end of the range. Changes in the accrual are included in the statements of consolidated income under Loss from Discontinued Operations.
SJI and SJF estimate their potential exposure for the future remediation of five sites where fuel oil operations existed years ago to range from $0.6 million to $1.1 million. The lower end of this range has been recorded under Current Liabilities and Deferred Credits and Other Noncurrent Liabilities as of December 31, 2017.
ELIZABETHTOWN GAS AND ELKTON GAS PURCHASE AGREEMENTS — In connection with the acquisition of Elizabethtown Gas and Elkton Gas as disclosed in Note 1, the Company entered into purchase agreements with Pivotal Utility Holdings, Inc., a subsidiary of Southern Company Gas (the "Seller"). The purchase agreements provide that the Seller and/or the Company may terminate the purchase agreements under certain circumstances, including (i) by mutual written consent of the Company and the Seller; (ii) by either the Company or the Seller for certain breaches of the purchase agreements that are not cured; (iii) by either the Company or the Seller if the transactions are not consummated on or before the date that is 12 months following the date of the purchase agreements, subject to a three month extension in certain circumstances; or (iv) by the Company or the Seller if any governmental entity has issued an order, decree or ruling or taken any other action restraining, enjoining or otherwise prohibiting the transactions contemplated by the purchase agreements. If the purchase agreements are terminated under any of these circumstances, or approvals by the BPU or FERC are not obtained, the Company will be required to pay the Seller a termination fee of $80.5 million.
| DERIVATIVE INSTRUMENTS: |
Certain SJI subsidiaries, including SJG, are involved in buying, selling, transporting and storing natural gas and buying and selling retail electricity for their own accounts as well as managing these activities for third parties. These subsidiaries are subject to market risk on expected future purchases and sales due to commodity price fluctuations. SJI and SJG use a variety of derivative instruments to limit this exposure to market risk in accordance with strict corporate guidelines. These derivative instruments include forward contracts, swap agreements, options contracts and futures contracts.
As of December 31, 2017, SJI and SJG had outstanding derivative contracts as follows:
| SJI Consolidated | SJG | |||
| Derivative contracts intended to limit exposure to market risk to: | ||||
| Expected future purchases of natural gas (in MMdts) | 58.8 | 9.7 | ||
| Expected future sales of natural gas (in MMdts) | 60.3 | 0.7 | ||
| Expected future purchases of electricity (in MMmWh) | 2.6 | — | ||
| Expected future sales of electricity (in MMmWh) | 2.1 | — | ||
| Basis and Index related net purchase (sales) contracts (in MMdts) | 47.4 | 0.3 | ||
These contracts, which have not been designated as hedging instruments under GAAP, are measured at fair value and recorded in Derivatives - Energy Related Assets or Derivatives - Energy Related Liabilities on the consolidated balance sheets of SJI and SJG. For SJE and SJRG contracts, the net unrealized pre-tax gains (losses) for these energy-related commodity contracts are included with realized gains (losses) in Operating Revenues – Nonutility on the consolidated statements of income for SJI. These pre-tax (losses) gains were $(13.7) million, $26.9 million and $8.4 million for the years ended December 31, 2017, 2016 and 2015, respectively. For SJG's contracts, the costs or benefits are recoverable through the BGSS clause, subject to BPU approval. As a result, the net unrealized pre-tax gains and losses for these energy-related commodity contracts are included with realized gains and losses in Regulatory Assets or Regulatory Liabilities on the consolidated balance sheets of both SJI and SJG. As of December 31, 2017 and 2016, SJG had $2.1 million of unrealized losses and $4.4 million of unrealized gains, respectively, included in its BGSS related to energy-related commodity contracts.
As part of its gas purchasing strategy, SJG uses financial contracts through SJRG to limit exposure to forward price risk. The costs or benefits of these short-term contracts are recoverable through SJG's BGSS clause, subject to BPU approval.
The retail gas operations of SJE transact commodities on a physical basis and typically does not directly enter into positions that financially settle. SJRG performs this risk management function for SJE and enters into the types of financial transactions noted above. The retail electric operations of SJE use forward physical and financial contracts to mitigate commodity price risk on fixed price electric contracts.
Management takes an active role in the risk management process and has developed policies and procedures that require specific administrative and business functions to assist in identifying, assessing and controlling various risks. Management reviews any open positions in accordance with strict policies to limit exposure to market risk.
SJI, including SJG, has also entered into interest rate derivatives to hedge exposure to increasing interest rates and the impact of those rates on cash flows of variable-rate debt. These interest rate derivatives, some of which had been designated as hedging instruments under GAAP, are measured at fair value and recorded in Derivatives - Other on the consolidated balance sheets. Hedge accounting has been discontinued prospectively for these derivatives. As a result, any unrealized gains and losses on these derivatives, that were previously included in Accumulated Other Comprehensive Loss (AOCL) on the consolidated balance sheets, are being recorded in earnings over the remaining life of the derivative.
In March 2017, SJI entered into a new interest rate derivative and amended the existing interest rate derivative linked to unrealized losses previously recorded in AOCL. SJI reclassified $2.4 million of pre-tax unrealized loss in AOCL to Interest Charges on the consolidated statements of income as a result of the prior hedged transactions being deemed probable of not occurring.
For SJG interest rate derivatives, the fair value represents the amount SJG would have to pay the counterparty to terminate these contracts as of those dates.
SJG previously used derivative transactions known as “Treasury Locks” to hedge against the impact on its cash flows of possible interest rate increases on debt issued in September 2005. The initial $1.4 million cost of the Treasury Locks has been included in AOCL and is being amortized over the 30-year life of the associated debt issue. As of December 31, 2017 and December 31, 2016, the unamortized balance was approximately $0.8 million and $0.9 million, respectively.
As of December 31, 2017, SJI's active interest rate swaps were as follows:
| Notional Amount | Fixed Interest Rate | Start Date | Maturity | Obligor | |||||
| $ | 20,000,000 | 3.049% | 3/15/2017 | 3/15/2027 | SJI | ||||
| $ | 20,000,000 | 3.049% | 3/15/2017 | 3/15/2027 | SJI | ||||
| $ | 10,000,000 | 3.049% | 3/15/2017 | 3/15/2027 | SJI | ||||
| $ | 12,500,000 | 3.530% | 12/1/2006 | 2/1/2036 | SJG | ||||
| $ | 12,500,000 | 3.430% | 12/1/2006 | 2/1/2036 | SJG | ||||
The unrealized gains and losses on interest rate derivatives that are not designated as cash flow hedges are included in Interest Charges. However, for selected interest rate derivatives at SJG, management believes that, subject to BPU approval, the market value upon termination can be recovered in rates and, therefore, these unrealized losses have been included in Other Regulatory Assets in the consolidated balance sheets.
The fair values of all derivative instruments, as reflected in the consolidated balance sheets as of December 31, are as follows (in thousands):
| SJI (includes SJG and all other consolidated subsidiaries): | ||||||||||||||||
| Derivatives not designated as hedging instruments under GAAP | December 31, 2017 | December 31, 2016 | ||||||||||||||
| Assets | Liabilities | Assets | Liabilities | |||||||||||||
| Energy-related commodity contracts: | ||||||||||||||||
| Derivatives - Energy Related - Current | $ | 42,139 | $ | 46,938 | $ | 72,391 | $ | 60,082 | ||||||||
| Derivatives - Energy Related - Non-Current | 5,988 | 6,025 | 8,502 | 4,540 | ||||||||||||
| Interest rate contracts: | ||||||||||||||||
| Derivatives - Other - Current | 748 | — | 681 | |||||||||||||
| Derivatives - Other - Noncurrent | 9,622 | — | 9,349 | |||||||||||||
| Total derivatives not designated as hedging instruments under GAAP | $ | 48,127 | $ | 63,333 | $ | 80,893 | $ | 74,652 | ||||||||
| Total Derivatives | $ | 48,127 | $ | 63,333 | $ | 80,893 | $ | 74,652 | ||||||||
| SJG: | ||||||||||||||||
| Derivatives not designated as hedging instruments under GAAP | 2017 | 2016 | ||||||||||||||
| Assets | Liabilities | Assets | Liabilities | |||||||||||||
| Energy-related commodity contracts: | ||||||||||||||||
| Derivatives – Energy Related – Current | $ | 7,327 | $ | 9,270 | $ | 5,434 | $ | 1,372 | ||||||||
| Derivatives – Energy Related – Non-Current | 5 | 170 | 373 | — | ||||||||||||
| Interest rate contracts: | ||||||||||||||||
| Derivatives - Other - Current | — | 389 | — | 386 | ||||||||||||
| Derivatives - Other - Non-Current | — | 6,639 | — | 6,979 | ||||||||||||
| Total derivatives not designated as hedging instruments under GAAP | 7,332 | 16,468 | 5,807 | 8,737 | ||||||||||||
| Total Derivatives | $ | 7,332 | $ | 16,468 | $ | 5,807 | $ | 8,737 | ||||||||
SJI and SJG enter into derivative contracts with counterparties, some of which are subject to master netting arrangements, which allow net settlements under certain conditions. These derivatives are presented at gross fair values on the consolidated balance sheets.
As of December 31, 2017 and2016, information related to these offsetting arrangements were as follows (in thousands):
| As of December 31, 2017 | ||||||||||||||||||||||||
| Description | Gross amounts of recognized assets/liabilities | Gross amount offset in the balance sheet | Net amounts of assets/liabilities in balance sheet | Gross amounts not offset in the balance sheet | Net amount | |||||||||||||||||||
| Financial Instruments | Cash Collateral Posted | |||||||||||||||||||||||
| SJI (includes SJG and all other consolidated subsidiaries): | ||||||||||||||||||||||||
| Derivatives - Energy Related Assets | $ | 48,127 | $ | — | $ | 48,127 | $ | (24,849 | ) | (A) | $ | — | $ | 23,278 | ||||||||||
| Derivatives - Energy Related Liabilities | $ | (52,963 | ) | $ | — | $ | (52,963 | ) | $ | 24,849 | (B) | $ | 8,832 | $ | (19,282 | ) | ||||||||
| Derivatives - Other | $ | (10,370 | ) | $ | — | $ | (10,370 | ) | $ | — | $ | — | $ | (10,370 | ) | |||||||||
| SJG: | ||||||||||||||||||||||||
| Derivatives - Energy Related Assets | $ | 7,332 | $ | — | $ | 7,332 | $ | (208 | ) | (A) | $ | — | $ | 7,124 | ||||||||||
| Derivatives - Energy Related Liabilities | $ | (9,440 | ) | $ | — | $ | (9,440 | ) | $ | 208 | (B) | $ | 1,543 | $ | (7,689 | ) | ||||||||
| Derivatives - Other | $ | (7,028 | ) | $ | — | $ | (7,028 | ) | $ | — | $ | — | $ | (7,028 | ) | |||||||||
| As of December 31, 2016 | ||||||||||||||||||||||||
| Description | Gross amounts of recognized assets/liabilities | Gross amount offset in the balance sheet | Net amounts of assets/liabilities in balance sheet | Gross amounts not offset in the balance sheet | Net amount | |||||||||||||||||||
| Financial Instruments | Cash Collateral Posted | |||||||||||||||||||||||
| SJI (includes SJG and all other consolidated subsidiaries): | ||||||||||||||||||||||||
| Derivatives - Energy Related Assets | $ | 80,893 | $ | — | $ | 80,893 | $ | (38,809 | ) | (A) | $ | (3,474 | ) | $ | 38,610 | |||||||||
| Derivatives - Energy Related Liabilities | $ | (64,622 | ) | $ | — | $ | (64,622 | ) | $ | 38,809 | (B) | $ | — | $ | (25,813 | ) | ||||||||
| Derivatives - Other | $ | (10,030 | ) | $ | — | $ | (10,030 | ) | $ | — | $ | — | $ | (10,030 | ) | |||||||||
| SJG: | ||||||||||||||||||||||||
| Derivatives - Energy Related Assets | $ | 5,807 | $ | — | $ | 5,807 | $ | (6 | ) | (A) | $ | (3,587 | ) | $ | 2,214 | |||||||||
| Derivatives - Energy Related Liabilities | $ | (1,372 | ) | $ | — | $ | (1,372 | ) | $ | 6 | (B) | $ | — | $ | (1,366 | ) | ||||||||
| Derivatives - Other | $ | (7,365 | ) | $ | — | $ | (7,365 | ) | $ | — | $ | — | $ | (7,365 | ) | |||||||||
(A) The balances at December 31, 2017 and 2016 were related to derivative liabilities which can be net settled against derivative assets.
(B) The balances at December 31, 2017 and 2016 were related to derivative assets which can be net settled against derivative liabilities.
The effect of derivative instruments on the consolidated statements of income for the year ended December 31 is as follows (in thousands):
| Derivatives in Cash Flow Hedging Relationships under GAAP | 2017 | 2016 | 2015 | ||||||||||
| SJI (includes SJG and all other consolidated subsidiaries): | |||||||||||||
| Interest Rate Contracts: | |||||||||||||
| Losses reclassified from AOCL into income (a) | $ | (2,524 | ) | $ | (333 | ) | $ | (551 | ) | ||||
| SJG: | |||||||||||||
| Interest Rate Contracts: | |||||||||||||
| Losses reclassified from AOCL into income (a) | $ | (46 | ) | $ | (46 | ) | (46 | ) | |||||
(a) Included in Interest Charges
| Derivatives Not Designated as Hedging Instruments under GAAP | 2017 | 2016 | 2015 | |||||||||
| SJI (no balances for SJG; includes all other consolidated subsidiaries): | ||||||||||||
| (Losses) gains on energy-related commodity contracts (a) | $ | (13,667 | ) | $ | 26,935 | $ | 8,401 | |||||
| (Losses) gains on interest rate contracts (b) | (677 | ) | 647 | 96 | ||||||||
| Total | $ | (14,344 | ) | $ | 27,582 | $ | 8,497 | |||||
(a) Included in Operating Revenues - Nonutility
(b) Included in Interest Charges
Net realized gains (losses) associated with SJG’s energy-related financial commodity contracts of $0.7 million, $(3.0) million and $(9.1) million for the years ended 2017, 2016 and 2015, respectively, are not included in the above table. These contracts are part of SJG’s regulated risk management activities that serve to mitigate BGSS costs passed on to its customers. As these transactions are entered into pursuant to, and recoverable through, regulatory riders, any changes in the value of SJG’s energy-related financial commodity contracts are deferred in Regulatory Assets or Liabilities, as applicable, and there is no impact on earnings.
Certain of the Company’s derivative instruments contain provisions that require immediate payment or demand immediate and ongoing collateralization on derivative instruments in net liability positions in the event of a material adverse change in the credit standing of the Company. The aggregate fair value of all derivative instruments with credit-risk-related contingent features that are in a liability position on December 31, 2017, is $1.5 million. If the credit-risk-related contingent features underlying these agreements were triggered on December 31, 2017, the Company would have been required to settle the instruments immediately or post collateral to its counterparties of approximately $0.6 million after offsetting asset positions with the same counterparties under master netting arrangements.
| 17. | FAIR VALUE OF FINANCIAL ASSETS AND FINANCIAL |
GAAP establishes a hierarchy that prioritizes fair value measurements based on the types of inputs used for the various valuation techniques. The levels of the hierarchy are described below:
Level 1: Observable inputs, such as quoted prices in active markets for identical assets or liabilities.
Level 2: Inputs other than quoted prices that are observable for the asset or liability, either directly or indirectly; these include quoted prices for similar assets or liabilities in active markets and quoted prices for identical or similar assets or liabilities in markets that are not active.
Level 3: Unobservable inputs that reflect the reporting entity’s own assumptions.
Assessment of the significance of a particular input to the fair value measurement requires judgment and may affect the valuation of financial assets and financial liabilities and their placement within the fair value hierarchy.
For financial assets and financial liabilities measured at fair value on a recurring basis, information about the fair value measurements for each major category is as follows (in thousands):
| As of December 31, 2015 | ||||||||||||||||||||||||||||||
| Total | Level 1 | Level 2 | Level 3 | |||||||||||||||||||||||||||
| As of December 31, 2017 | Total | Level 1 | Level 2 | Level 3 | ||||||||||||||||||||||||||
| Assets | ||||||||||||||||||||||||||||||
| SJI (includes SJG and all other consolidated subsidiaries): | ||||||||||||||||||||||||||||||
| Available-for-Sale Securities (A) | $ | 8,788 | $ | 1,722 | $ | 7,066 | $ | — | $ | 36 | $ | 36 | $ | — | $ | — | ||||||||||||||
| Derivatives – Energy Related Assets (B) | 1,141 | 398 | 144 | 599 | 48,127 | 5,155 | 21,869 | 21,103 | ||||||||||||||||||||||
| $ | 9,929 | $ | 2,120 | $ | 7,210 | $ | 599 | $ | 48,163 | $ | 5,191 | $ | 21,869 | $ | 21,103 | |||||||||||||||
| SJG: | ||||||||||||||||||||||||||||||
| Assets | ||||||||||||||||||||||||||||||
| Derivatives – Energy Related Assets (B) | $ | 7,332 | $ | 208 | $ | 230 | $ | 6,894 | ||||||||||||||||||||||
| $ | 7,332 | $ | 208 | $ | 230 | $ | 6,894 | |||||||||||||||||||||||
| SJI (includes SJG and all other consolidated subsidiaries): | ||||||||||||||||||||||||||||||
| Liabilities | ||||||||||||||||||||||||||||||
| Derivatives – Energy Related Liabilities (B) | $ | 5,840 | $ | 5,424 | $ | — | $ | 416 | $ | 52,963 | $ | 10,687 | $ | 24,283 | $ | 17,993 | ||||||||||||||
| Derivatives – Other (C) | 7,631 | — | 7,631 | — | 10,370 | — | 10,370 | — | ||||||||||||||||||||||
| $ | 13,471 | $ | 5,424 | $ | 7,631 | $ | 416 | $ | 63,333 | $ | 10,687 | $ | 34,653 | $ | 17,993 | |||||||||||||||
| SJG: | ||||||||||||||||||||||||||||||
| Liabilities | ||||||||||||||||||||||||||||||
| Derivatives – Energy Related Liabilities (B) | $ | 9,440 | $ | 1,750 | $ | 2,848 | $ | 4,842 | ||||||||||||||||||||||
| Derivatives – Other (C) | 7,028 | — | 7,028 | — | ||||||||||||||||||||||||||
| $ | 16,468 | $ | 1,750 | $ | 9,876 | $ | 4,842 | |||||||||||||||||||||||
| As of December 31, 2014 | ||||||||||||||||||||||||||||||
| Total | Level 1 | Level 2 | Level 3 | |||||||||||||||||||||||||||
| As of December 31, 2016 | Total | Level 1 | Level 2 | Level 3 | ||||||||||||||||||||||||||
| Assets | ||||||||||||||||||||||||||||||
| SJI (includes SJG and all other consolidated subsidiaries): | ||||||||||||||||||||||||||||||
| Available-for-Sale Securities (A) | $ | 8,894 | $ | 5,924 | $ | 2,970 | $ | — | $ | 32 | $ | 32 | $ | — | $ | — | ||||||||||||||
| Derivatives – Energy Related Assets (B) | 2,051 | 2 | 2,049 | — | 80,893 | 33,994 | 11,814 | 35,085 | ||||||||||||||||||||||
| $ | 10,945 | $ | 5,926 | $ | 5,019 | $ | — | $ | 80,925 | $ | 34,026 | $ | 11,814 | $ | 35,085 | |||||||||||||||
| SJG: | ||||||||||||||||||||||||||||||
| Assets | ||||||||||||||||||||||||||||||
| Derivatives – Energy Related Assets (B) | $ | 5,807 | $ | 4,767 | $ | — | $ | 1,040 | ||||||||||||||||||||||
| $ | 5,807 | $ | 4,767 | $ | — | $ | 1,040 | |||||||||||||||||||||||
| SJI (includes SJG and all other consolidated subsidiaries): | ||||||||||||||||||||||||||||||
| Liabilities | ||||||||||||||||||||||||||||||
| Derivatives – Energy Related Liabilities (B) | $ | 7,603 | $ | 7,254 | $ | 349 | $ | — | $ | 64,622 | $ | 16,502 | $ | 22,070 | $ | 26,050 | ||||||||||||||
| Derivatives – Other (C) | 7,325 | — | 7,325 | — | 10,030 | — | 10,030 | — | ||||||||||||||||||||||
| $ | 14,928 | $ | 7,254 | $ | 7,674 | $ | — | $ | 74,652 | $ | 16,502 | $ | 32,100 | $ | 26,050 | |||||||||||||||
| SJG: | ||||||||||||||||||||||||||||||
Liabilities | ||||||||||||||||||||||||||||||
| Derivatives – Energy Related Liabilities (B) | $ | 1,372 | $ | 6 | $ | 1,252 | $ | 114 | ||||||||||||||||||||||
| Derivatives – Other (C) | 7,365 | — | 7,365 | — | ||||||||||||||||||||||||||
| $ | 8,737 | $ | 6 | $ | 8,617 | $ | 114 | |||||||||||||||||||||||
(A) Available-for-Sale Securities include securities that are traded in active markets and securities that are not traded publicly. The securities traded in active markets are valued using the quoted principal market close prices that are provided by the trustees and are categorized in Level 1 in the fair value hierarchy. The remaining securities consist of funds that are not publicly traded. These funds, which consist of stocks and bonds that are traded individually in active markets, are valued using quoted prices for similar assets and are categorized in Level 2 in the fair value hierarchy.
(B) Derivatives – Energy Related Assets and Liabilities are traded in both exchange-based and non-exchange-based markets. Exchange-based contracts are valued using unadjusted quoted market sources in active markets and are categorized in Level 1 in the fair value hierarchy. Certain non-exchange-based contracts are valued using indicative price quotations available through brokers or over-the-counter, on-line exchanges and are categorized in Level 2. These price quotations reflect the average of the bid-ask mid-point prices and are obtained from sources that management believes provide the most liquid market. For non-exchange-based derivatives that trade in less liquid markets with limited pricing information, model inputs generally would include both observable and unobservable inputs. In instances where observable data is unavailable, management considers the assumptions that market participants would use in valuing the asset or liability. This includes assumptions about market risks such as liquidity, volatility and contract duration. Such instruments are categorized in Level 3 as the model inputs generally are not observable.
Significant Unobservable Inputs - Management uses the discounted cash flow model to value Level 3 physical and financial forwards,forward contracts, which calculates mark-to-market valuations based on forward market prices, original transaction prices, volumes, risk-free rate of return and credit spreads. Inputs to the valuation model are reviewed and revised as needed, based on historical information, updated market data, market liquidity and relationships, and changes in third party pricing sources. The validity of the mark-to-market valuations and changes in mark-to-market valuations from period to period are examined and qualified against historical expectations by the risk management function. If any discrepancies are identified during this process, the mark-to-market valuations or the market pricing information is evaluated further and adjusted, if necessary.
Level 3 valuation methods for natural gas derivative contracts include utilizing another location in close proximity adjusted for certain pipeline charges to derive a basis value. The significant unobservable inputs used in the fair value measurement of certain natural gas contracts consist of forward prices developed based on industry-standard methodologies. Significant increases (decreases) in these forward prices for purchases of natural gas would result in a directionally similar impact to the fair value measurement and for sales of natural gas would result in a directionally opposite impact to the fair value measurement. Level 3 valuation methods for electric represent the value of the contract marked to the forward wholesale curve, as provided by daily exchange quotes for delivered electricity. The significant unobservable inputs used in the fair value measurement of electric contracts consist of fixed contracted electric load profiles; therefore no change in unobservable inputs would occur. Unobservable inputs are updated daily using industry-standard techniques. Management reviews and corroborates the price quotations to ensure the prices are observable which includes consideration of actual transaction volumes, market delivery points, bid-ask spreads and contract duration.
(C) Derivatives – Other include interest rate swaps that are valued using quoted prices on commonly quoted intervals, which are interpolated for periods different than the quoted intervals, as inputs to a market valuation model. Market inputs can generally be verified and model selection does not involve significant management judgment.
The following table provides quantitative information regarding significant unobservable inputs in Level 3 fair value measurements (in thousands)thousands, except for ranges):
SJI (includes SJG and all other consolidated subsidiaries):
| Type | Fair Value at December 31, 2017 | Valuation Technique | Significant Unobservable Input | Range [Weighted Average] | ||||||
| Assets | Liabilities | |||||||||
| Forward Contract - Natural Gas | $ | 13,519 | $ | 15,686 | Discounted Cash Flow | Forward price (per dt) | $1.79 - $12.09 [$3.01] | (A) | ||
| Forward Contract - Electric | $ | 7,584 | $ | 2,307 | Discounted Cash Flow | Fixed electric load profile (on-peak) | 36.36% - 100.00% [53.39%] | (B) | ||
| Fixed electric load profile (off-peak) | 0.00% - 63.64% [46.61%] | (B) | ||||||||
| Type | Fair Value at December 31, 2015 | Valuation Technique | Significant Unobservable Input | Range [Weighted Average] | Fair Value at December 31, 2016 | Valuation Technique | Significant Unobservable Input | Range [Weighted Average] | |||||||
| Assets | Liabilities | Assets | Liabilities | ||||||||||||
| Forward Contract - Natural Gas | $599 | $416 | Discounted Cash Flow | Forward price (per dt) | $1.18 - $5.21 [$2.90] | $ | 23,301 | $ | 18,109 | Discounted Cash Flow | Forward price (per dt) | $1.03 - $11.33 [$2.71] | (A) | ||
| Forward Contract - Electric | $ | 11,784 | $ | 7,941 | Discounted Cash Flow | Fixed electric load profile (on-peak) | 21.43% - 100.00% [55.14%] | (B) | |||||||
| Fixed electric load profile (off-peak) | 0.00% - 78.57% [44.86%] | (B) | |||||||||||||
SJG:
| Type | Fair Value at December 31, 2017 | Valuation Technique | Significant Unobservable Input | Range [Weighted Average] | ||||||
| Assets | Liabilities | |||||||||
| Forward Contract - Natural Gas | $ | 6,894 | $ | 4,842 | Discounted Cash Flow | Forward price (per dt) | $2.42 - $6.67 [$5.25] | (A) | ||
| Type | Fair Value at December 31, 2016 | Valuation Technique | Significant Unobservable Input | Range [Weighted Average] | ||||||
| Assets | Liabilities | |||||||||
| Forward Contract - Natural Gas | $ | 1,040 | $ | 114 | Discounted Cash Flow | Forward price (per dt) | $3.25 - $6.33 [$5.09] | (A) | ||
(A) Represents the range, along with the weighted average, of forward prices for the sale and purchase of natural gas.
(B) Represents the range, along with the weighted average, of the percentage of contracted usage that is loaded during on-peak hours versus off-peak.
The changes in fair value measurements of Derivatives – Energy Related Assets and Liabilities at December 31, 2015,2017 and 2016, using
significant unobservable inputs (Level 3), are as follows (in thousands):
SJI (includes SJG and all other consolidated subsidiaries):
| Year Ended December 31, 2017 | ||||
| Balance at January 1, 2017 | $ | 9,035 | ||
| Other changes in fair value from continuing and new contracts, net | 1,857 | |||
| Transfers in to/(out of) of Level 3 (A) | (954 | ) | ||
| Settlements | (6,828 | ) | ||
| Balance at December 31, 2017 | $ | 3,110 | ||
| Year Ended December 31, 2016 | ||||
| Balance at January 1, 2016 | $ | (632 | ) | |
| Other changes in fair value from continuing and new contracts, net | 5,657 | |||
| Transfers in to/(out of) of Level 3 (A) | 4,116 | |||
| Settlements | (106 | ) | ||
| Balance at December 31, 2016 | $ | 9,035 | ||
SJG:
| Year Ended December 31, 2015 | ||||
| Balance at January 1, 2015 | $ | — | ||
| Other Changes in Fair Value from Continuing and New contracts, Net | 183 | |||
| Settlements | — | |||
| Balance at December 31, 2015 | $ | 183 | ||
| Year Ended December 31, 2017 | ||||
| Balance at January 1, 2017 | $ | 926 | ||
| Other changes in fair value from continuing and new contracts, net | 2,258 | |||
| Transfers in to/(out of) of Level 3 (A) | (206 | ) | ||
| Settlements | (926 | ) | ||
| Balance at December 31, 2017 | $ | 2,052 | ||
| Notional Amount | Fixed Interest Rate | Start Date | Maturity | Type of Debt | Obligor | ||||||||
| $ | 12,500,000 | 3.43 | % | 12/1/2006 | 2/1/2036 | Tax-exempt | SJG | ||||||
| $ | 12,500,000 | 3.43 | % | 12/1/2006 | 2/1/2036 | Tax-exempt | SJG | ||||||
| Year Ended December 31, 2016 | ||||
| Balance at January 1, 2016 | $ | 183 | ||
| Other changes in fair value from continuing and new contracts, net | 926 | |||
| Settlements | (183 | ) | ||
| Balance at December 31, 2016 | $ | 926 | ||
(A) Transfers between different levels of the fair value hierarchy may occur based on the level of observable inputs used to value the instruments from period to period, and are assessed quarterly by management. During the year ended December 31, 2017, $1.0 million and $0.2 million of SJI's and SJG's net derivative assets, respectively, were transferred from Level 3 to Level 2, due to increased observability of market data. During the year ended December 31, 2016, $4.1 million of SJI's net derivative assets were transferred from Level 2 to Level 3, due to decreased observability of market data.
Total gains for 2017 included in earnings for the year ended December 31, 2017 that are attributable to the change in unrealized gains relating to those assets and liabilities included in Level 3 still held as of December 31, 2017, are $1.9 million. These gains are included in Operating Revenues-Nonutility on the statements of consolidated income.
18. ACCUMULATED OTHER COMPREHENSIVE LOSS (AOCL):
The fair values of all derivative instruments, as reflectedfollowing table summarizes the changes in SJI's AOCL for the balance sheets as ofyear ended December 31, 20152017 and(in thousands):
| Postretirement Liability Adjustment (A) | Unrealized Gain (Loss) on Derivatives-Other (B) | Unrealized Gain (Loss) on Available-for-Sale Securities (B) | Other Comprehensive Income (Loss) of Affiliated Companies (B) | Total | |||||||||||||||
| Balance at January 1, 2017 | $ | (25,342 | ) | $ | (1,932 | ) | $ | (10 | ) | $ | (97 | ) | $ | (27,381 | ) | ||||
| Other comprehensive income before reclassifications | (10,920 | ) | — | — | — | (10,920 | ) | ||||||||||||
| Amounts reclassified from AOCL (C) | — | 1,536 | — | — | 1,536 | ||||||||||||||
| Net current period other comprehensive income | (10,920 | ) | 1,536 | — | — | (9,384 | ) | ||||||||||||
| Balance at December 31, 2017 | $ | (36,262 | ) | $ | (396 | ) | $ | (10 | ) | $ | (97 | ) | $ | (36,765 | ) | ||||
(A) Determined using a combined average statutory tax rate of 27% for 2017.
(B) Determined using a combined average statutory tax rate of 39% for 2017.
(C) See table below.
The following table provides details about reclassifications out of SJI's AOCL for the year ended December 31, 20142017, are as follows (in thousands):
| Derivatives not designated as hedging instruments under GAAP | 2015 | 2014 | ||||||||||||||
| Assets | Liabilities | Assets | Liabilities | |||||||||||||
| Energy related commodity contracts: | ||||||||||||||||
| Derivatives – Energy Related – Current | $ | 1,077 | $ | 5,489 | $ | 2,051 | $ | 6,305 | ||||||||
| Derivatives – Energy Related – Non-Current | 64 | 351 | — | 1,298 | ||||||||||||
| Interest rate contracts: | ||||||||||||||||
| Derivatives – Other | — | 7,631 | — | 7,325 | ||||||||||||
| Total derivatives not designated as hedging instruments under GAAP | $ | 1,141 | $ | 13,471 | $ | 2,051 | $ | 14,928 | ||||||||
| As of December 31, 2015 | ||||||||||||||||||||||||
| Description | Gross amounts of recognized assets/liabilities | Gross amount offset in the balance sheet | Net amounts of assets/liabilities in balance sheet | Gross amounts not offset in the balance sheet | Net amount | |||||||||||||||||||
| Financial Instruments | Cash Collateral Posted | |||||||||||||||||||||||
| Derivatives - Energy Related Assets | $ | 1,141 | $ | — | $ | 1,141 | $ | (399 | ) | (A) | $ | — | $ | 742 | ||||||||||
| Derivatives - Energy Related Liabilities | (5,840 | ) | — | (5,840 | ) | 399 | (B) | 5,025 | (416 | ) | ||||||||||||||
| Derivatives - Other | (7,631 | ) | — | (7,631 | ) | — | — | (7,631 | ) | |||||||||||||||
| As of December 31, 2014 | ||||||||||||||||||||||||
| Description | Gross amounts of recognized assets/liabilities | Gross amount offset in the balance sheet | Net amounts of assets/liabilities in balance sheet | Gross amounts not offset in the balance sheet | Net amount | |||||||||||||||||||
| Financial Instruments | Cash Collateral Posted | |||||||||||||||||||||||
| Derivatives - Energy Related Assets | $ | 2,051 | $ | — | $ | 2,051 | $ | (2 | ) | (A) | $ | — | $ | 2,049 | ||||||||||
| Derivatives - Energy Related Liabilities | (7,603 | ) | — | (7,603 | ) | 2 | (B) | 7,253 | (348 | ) | ||||||||||||||
| Derivatives - Other | (7,325 | ) | — | (7,325 | ) | — | — | (7,325 | ) | |||||||||||||||
| Year ended December 31, | |||||||||||
| Derivatives in Cash Flow Hedging Relationships | 2015 | 2014 | 2013 | ||||||||
| Interest Rate Contracts: | |||||||||||
| Losses reclassified from accumulated OCI into income (a) | $ | (46 | ) | $ | (46 | ) | $ | (46 | ) | ||
| Postretirement Liability Adjustment | Unrealized Gain (Loss) on Derivatives-Other | Unrealized Gain (Loss) on Available-for-Sale Securities | Total | ||||||||||||
| Balance at January 1, 2015 (a) | (13,837 | ) | (567 | ) | $ | (75 | ) | $ | (14,479 | ) | |||||
Other comprehensive income before reclassifications | (110 | ) | — | (76 | ) | (186 | ) | ||||||||
| Amounts reclassified from AOCL (b) | 1,727 | 23 | 53 | 1,803 | |||||||||||
| Net current period other comprehensive income | 1,617 | 23 | (23 | ) | 1,617 | ||||||||||
| Balance at December 31, 2015 (a) | $ | (12,220 | ) | $ | (544 | ) | $ | (98 | ) | $ | (12,862 | ) | |||
| Postretirement Liability Adjustment | Unrealized Gain (Loss) on Derivatives-Other | Unrealized Gain (Loss) on Available-for-Sale Securities | Total | ||||||||||||
| Balance at January 1, 2014 (a) | $ | (10,672 | ) | $ | (594 | ) | $ | 397 | $ | (10,869 | ) | ||||
Other comprehensive income before reclassifications | (4,345 | ) | — | 76 | (4,269 | ) | |||||||||
| Amounts reclassified from AOCL (b) | 1,180 | 27 | (548 | ) | 659 | ||||||||||
| Net current period other comprehensive income | (3,165 | ) | 27 | (472 | ) | (3,610 | ) | ||||||||
| Balance at December 31, 2014 (a) | $ | (13,837 | ) | $ | (567 | ) | $ | (75 | ) | $ | (14,479 | ) | |||
| Amounts Reclassified from AOCL | Affected Line Item in the Statements of Consolidated Income | ||||||
| For the Year Ended December 31, 2017 | |||||||
| Unrealized Loss on Derivatives-Other - interest rate contracts designated as cash flow hedges | $ | 2,524 | Interest Charges | ||||
| Income Taxes | (988 | ) | Income Taxes (a) | ||||
| $ | 1,536 | ||||||
(a) Determined using a combined average statutory tax rate of 40% in 2015 and 2014.
The reclassifications out offollowing table summarizes the changes in SJG's AOCL for the yearsyear ended December 31, 2015 and 2014 is as follows2017 (in thousands):
| Components of AOCL | Amounts Reclassified from AOCL | Affected Line Item in the Statements of Income | ||||||||
| For the Year Ended December 31, 2015 | For the Year Ended December 31, 2014 | |||||||||
| Unrealized Loss on Derivatives-Other - Interest Rate Contracts designated as cash flow hedges | $ | 46 | $ | 46 | Interest Charges | |||||
| Income Taxes | (23 | ) | (19 | ) | Income Taxes (a) | |||||
| $ | 23 | $ | 27 | |||||||
| Unrealized Loss(Gain) on Available-for-Sale Securities | 90 | (918 | ) | Other Income & Expense | ||||||
| Income Taxes | (37 | ) | 370 | Income Taxes (a) | ||||||
| $ | 53 | $ | (548 | ) | ||||||
| Actuarial Loss on Postretirement Benefits | 2,891 | 1,975 | Operating Expenses: Operations | |||||||
| Income Taxes | (1,164 | ) | (795 | ) | Income Taxes (a) | |||||
| $ | 1,727 | $ | 1,180 | |||||||
Losses from reclassifications for the period net of tax | $ | 1,803 | $ | 659 | ||||||
| Postretirement Liability Adjustment (A) | Unrealized Gain (Loss) on Derivatives-Other (B) | Total | |||||||||
| Balance at January 1, 2017 | (14,417 | ) | (517 | ) | $ | (14,934 | ) | ||||
Other comprehensive loss before reclassifications | (11,090 | ) | — | (11,090 | ) | ||||||
| Amounts reclassified from AOCL (C) | — | 27 | 27 | ||||||||
| Net current period other comprehensive loss | (11,090 | ) | 27 | (11,063 | ) | ||||||
| Balance at December 31, 2017 | $ | (25,507 | ) | $ | (490 | ) | $ | (25,997 | ) | ||
(A) Determined using a combined average statutory tax rate of 27% for 2017.
(B) Determined using a combined average statutory tax rate of 39% for 2017.
(C) See table below.
The following table provides details about reclassifications out of SJG's AOCL for the year ended December 31, 2017 (in thousands):
| Components of AOCL | Amounts Reclassified from AOCL | Affected Line Item in the Statements of Income | |||
| For the Year Ended December 31, 2017 | |||||
| Unrealized Loss on Derivatives-Other - Interest Rate Contracts designated as cash flow hedges | $ | 46 | Interest Charges | ||
| Income Taxes | (19 | ) | Income Taxes (a) | ||
| $ | 27 | ||||
(a) Determined using a combined average statutory tax rate of 40% in 2015 and 2014.39%.
| 2015 Quarter Ended | 2014 Quarter Ended | ||||||||||||||||||||||||||||||
| March 31 | June 30 | Sept. 30 | Dec. 31 | March 31 | June 30 | Sept. 30 | Dec. 31 | ||||||||||||||||||||||||
| Operating Revenues | $ | 267,658 | $ | 75,812 | $ | 58,634 | $ | 132,186 | $ | 210,545 | $ | 69,159 | $ | 60,952 | $ | 161,219 | |||||||||||||||
| Expenses: | |||||||||||||||||||||||||||||||
| Cost of Sales (excluding depreciation) | 146,102 | 25,419 | 22,934 | 50,835 | 103,293 | 24,879 | 23,400 | 79,644 | |||||||||||||||||||||||
| Operations and Maintenance | |||||||||||||||||||||||||||||||
| Including Fixed Charges | 52,137 | 42,691 | 42,204 | 48,258 | 46,969 | 38,737 | 37,432 | 47,943 | |||||||||||||||||||||||
| Income Taxes | 26,172 | 3,292 | (2,871 | ) | 10,352 | 22,527 | 2,379 | 534 | 9,455 | ||||||||||||||||||||||
| Energy and Other Taxes | 1,420 | 854 | 806 | 951 | 1,185 | 830 | 798 | 947 | |||||||||||||||||||||||
| Total Expenses | 225,831 | 72,256 | 63,073 | 110,396 | 173,974 | 66,825 | 62,164 | 137,989 | |||||||||||||||||||||||
| Other Income and Expense | 760 | 1,670 | 1,010 | 404 | 1,086 | 1,477 | 2,186 | 811 | |||||||||||||||||||||||
| Net Income | $ | 42,587 | $ | 5,226 | $ | (3,429 | ) | $ | 22,194 | $ | 37,657 | $ | 3,811 | $ | 974 | $ | 24,041 | ||||||||||||||
REPORT OF INDEPENDENT REGISTERED PUBLIC ACCOUNTING FIRM
To the stockholders and the Board of Directors of South Jersey Industries, Inc.
Opinion on the Financial Statements
We have audited the accompanying consolidated balance sheets of South Jersey Industries, Inc. and subsidiaries (the "Company") as of December 31, 2017 and 2016, the related consolidated statements of income, comprehensive income, cash flows and changes in equity and comprehensive income for each of the three years in the period ended December 31, 2017, and the related notes and the schedules listed in the Index at Item 15(a)2 (collectively referred to as the "financial statements"). In our opinion, the financial statements present fairly, in all material respects, the financial position of the Company as of December 31, 2017 and 2016, and the results of its operations and its cash flows for each of the three years in the period ended December 31, 2017, in conformity with accounting principles generally accepted in the United States of America.
We have also audited, in accordance with the standards of the Public Company Accounting Oversight Board (United States) (PCAOB), the Company's internal control over financial reporting as of December 31, 2017, based on criteria established in Internal Control - Integrated Framework (2013) issued by the Committee of Sponsoring Organizations of the Treadway Commission and our report dated February 26, 2018, expressed an unqualified opinion on the Company's internal control over financial reporting.
Basis for Opinion
These financial statements are the responsibility of the Company's management. Our responsibility is to express an opinion on the Company's financial statements based on our audits. We are a public accounting firm registered with the PCAOB and are required to be independent with respect to the Company in accordance with the U.S. federal securities laws and the applicable rules and regulations of the Securities and Exchange Commission and the PCAOB.
We conducted our audits in accordance with the standards of the PCAOB. Those standards require that we plan and perform the audit to obtain reasonable assurance about whether the financial statements are free of material misstatement, whether due to error or fraud. Our audits included performing procedures to assess the risks of material misstatement of the financial statements, whether due to error or fraud, and performing procedures that respond to those risks. Such procedures included examining, on a test basis, evidence regarding the amounts and disclosures in the financial statements. Our audits also included evaluating the accounting principles used and significant estimates made by management, as well as evaluating the overall presentation of the financial statements. We believe that our audits provide a reasonable basis for our opinion.
/s/ Deloitte & Touche LLP
Philadelphia, Pennsylvania
February 26, 2018
We have served as the Company's auditor since 1948.
REPORT OF INDEPENDENT REGISTERED PUBLIC ACCOUNTING FIRM
To the stockholder and the Board of Directors of South Jersey Gas Company
Opinion on the Financial Statements
We have audited the accompanying balance sheets of South Jersey Gas Company (the "Company") as of December 31, 2017 and 2016, the related statements of income, comprehensive income, cash flows and changes in common equity and comprehensive income for each of the three years in the period ended December 31, 2017, and the related notes and the schedule listed in the Index at Item 15(a)2 (collectively referred to as the "financial statements"). In our opinion, the financial statements present fairly, in all material respects, the financial position of the Company as of December 31, 2017 and 2016, and the results of its operations and its cash flows for each of the three years in the period ended December 31, 2017, in conformity with accounting principles generally accepted in the United States of America.
Basis for Opinion
These financial statements are the responsibility of the Company's management. Our responsibility is to express an opinion on the Company's financial statements based on our audits. We are a public accounting firm registered with the Public Company Accounting Oversight Board (United States) (PCAOB) and are required to be independent with respect to the Company in accordance with the U.S. federal securities laws and the applicable rules and regulations of the Securities and Exchange Commission and the PCAOB.
We conducted our audits in accordance with the standards of the PCAOB. Those standards require that we plan and perform the audit to obtain reasonable assurance about whether the financial statements are free of material misstatement, whether due to error or fraud. The Company is not required to have, nor were we engaged to perform, an audit of its internal control over financial reporting. As part of our audits, we are required to obtain an understanding of internal control over financial reporting but not for the purpose of expressing an opinion on the effectiveness of the Company’s internal control over financial reporting. Accordingly, we express no such opinion.
Our audits included performing procedures to assess the risks of material misstatement of the financial statements, whether due to error or fraud, and performing procedures that respond to those risks. Such procedures included examining, on a test basis, evidence regarding the amounts and disclosures in the financial statements. Our audits also included evaluating the accounting principles used and significant estimates made by management, as well as evaluating the overall presentation of the financial statements. We believe that our audits provide a reasonable basis for our opinion.
/s/ Deloitte & Touche LLP
Philadelphia, Pennsylvania
February 26, 2018
We have served as the Company's auditor since 1948.
Quarterly Financial Data (Unaudited)
(Summarized quarterly results of SJI's and SJG's operations, in thousands except for per share amounts)
| 2017 Quarter Ended | 2016 Quarter Ended | |||||||||||||||||||||||||||||||
| SJI (includes SJG and all other consolidated subsidiaries): | March 31 | June 30 | Sept. 30 | Dec. 31 | March 31 | June 30 | Sept. 30 | Dec. 31 | ||||||||||||||||||||||||
| Operating Revenues | $ | 425,829 | $ | 244,374 | $ | 227,127 | $ | 345,738 | $ | 333,035 | $ | 154,402 | $ | 219,082 | $ | 329,981 | ||||||||||||||||
| Expenses: | ||||||||||||||||||||||||||||||||
| Cost of Sales - (Excluding depreciation) | 287,143 | 179,684 | 168,815 | 210,585 | 152,975 | 98,340 | 142,988 | 186,684 | ||||||||||||||||||||||||
| Operations, Impairment Charges and Maintenance Including Fixed Charges | 85,675 | 78,681 | 122,617 | 152,990 | 73,042 | 71,034 | 69,410 | 77,858 | ||||||||||||||||||||||||
| Income Taxes | 21,870 | (5,544 | ) | (24,765 | ) | (16,498 | ) | 39,267 | (7,189 | ) | 2,807 | 19,266 | ||||||||||||||||||||
| Energy and Other Taxes | 2,071 | 1,551 | 1,517 | 1,348 | 1,925 | 1,243 | 1,449 | 1,725 | ||||||||||||||||||||||||
| Total Expenses | 396,759 | 254,372 | 268,184 | 348,425 | 267,209 | 163,428 | 216,654 | 285,533 | ||||||||||||||||||||||||
| Other Income and Expense | 8,677 | 2,386 | 3,509 | 6,696 | 2,361 | 4,228 | 7,236 | 1,560 | ||||||||||||||||||||||||
| Income (Loss) from Continuing Operations | 37,747 | (7,612 | ) | (37,548 | ) | 4,009 | 68,187 | (4,798 | ) | 9,664 | 46,008 | |||||||||||||||||||||
| Loss from Discontinued Operations - (Net of tax benefit) | (30 | ) | (47 | ) | (45 | ) | 36 | (118 | ) | (29 | ) | (29 | ) | (75 | ) | |||||||||||||||||
| Net Income (Loss) | $ | 37,717 | $ | (7,659 | ) | $ | (37,593 | ) | $ | 4,045 | $ | 68,069 | $ | (4,827 | ) | $ | 9,635 | $ | 45,933 | |||||||||||||
| Basic Earnings Per Common Share: | ||||||||||||||||||||||||||||||||
| Continuing Operations | $ | 0.47 | $ | (0.10 | ) | $ | (0.47 | ) | $ | 0.05 | $ | 0.96 | $ | (0.06 | ) | $ | 0.12 | $ | 0.58 | |||||||||||||
| Discontinued Operations | — | — | — | — | — | — | — | — | ||||||||||||||||||||||||
| Basic Earnings Per Common Share | $ | 0.47 | $ | (0.10 | ) | $ | (0.47 | ) | $ | 0.05 | $ | 0.96 | $ | (0.06 | ) | $ | 0.12 | $ | 0.58 | |||||||||||||
| Average Shares of Common Stock Outstanding - Basic | 79,519 | 79,534 | 79,539 | 79,549 | 71,127 | 75,298 | 79,478 | 79,478 | ||||||||||||||||||||||||
| Diluted Earnings Per Common Share: | ||||||||||||||||||||||||||||||||
| Continuing Operations | $ | 0.47 | $ | (0.10 | ) | $ | (0.47 | ) | $ | 0.05 | $ | 0.95 | $ | (0.06 | ) | $ | 0.12 | $ | 0.58 | |||||||||||||
| Discontinued Operations | — | — | — | — | — | — | — | — | ||||||||||||||||||||||||
| Diluted Earnings Per Common Share | $ | 0.47 | $ | (0.10 | ) | $ | (0.47 | ) | $ | 0.05 | $ | 0.95 | $ | (0.06 | ) | $ | 0.12 | $ | 0.58 | |||||||||||||
| Average Shares of Common Stock Outstanding - Diluted | 79,641 | 79,670 | 79,539 | 79,705 | 71,416 | 75,298 | 79,635 | 79,643 | ||||||||||||||||||||||||
| 2017 Quarter Ended | 2016 Quarter Ended | |||||||||||||||||||||||||||||||
| SJG: | March 31 | June 30 | Sept. 30 | Dec. 31 | March 31 | June 30 | Sept. 30 | Dec. 31 | ||||||||||||||||||||||||
| Operating Revenues | $ | 196,814 | $ | 83,251 | $ | 66,755 | $ | 170,434 | $ | 187,766 | $ | 68,762 | $ | 62,025 | $ | 142,502 | ||||||||||||||||
| Expenses: | ||||||||||||||||||||||||||||||||
| Cost of Sales (excluding depreciation) | 72,424 | 33,644 | 29,499 | 68,865 | 69,303 | 19,997 | 26,395 | 58,695 | ||||||||||||||||||||||||
| Operations and Maintenance Including Fixed Charges | 48,327 | 46,656 | 47,456 | 54,872 | 46,450 | 42,826 | 41,303 | 47,886 | ||||||||||||||||||||||||
| Income Taxes | 29,911 | 1,431 | (3,688 | ) | 18,046 | 27,404 | 1,415 | (2,007 | ) | 12,554 | ||||||||||||||||||||||
| Energy and Other Taxes | 1,295 | 872 | 865 | 697 | 1,027 | 560 | 838 | 1,195 | ||||||||||||||||||||||||
| Total Expenses | 151,957 | 82,603 | 74,132 | 142,480 | 144,184 | 64,798 | 66,529 | 120,330 | ||||||||||||||||||||||||
| Other Income and Expense | 1,621 | 1,618 | 1,606 | 1,630 | 836 | 1,079 | 1,189 | 727 | ||||||||||||||||||||||||
| Net Income (Loss) | $ | 46,478 | $ | 2,266 | $ | (5,771 | ) | $ | 29,584 | $ | 44,418 | $ | 5,043 | $ | (3,315 | ) | $ | 22,899 | ||||||||||||||
The sum of the quarters for basic and diluted earnings per common share for 2016 does not equal the year's total due to the impact of the equity offering on the average shares of common stock outstanding (see Note 6). The sum of the quarters for basic and diluted earnings per common share may not equal the year's total due to rounding.
| NOTE: | Because of the seasonal nature of the business and the volatility from energy-related derivatives, statements for the 3-month periods are not indicative of the results for a full year. |
Item 9. Changes in and Disagreements with Accountants on
Accounting and Financial Disclosure
Item 9A. Controls and Procedures
Evaluation of Disclosure Controls and Procedures
The Company’s management of each of SJI and SJG, with the participation of its chieftheir respective principal executive officerofficers and chiefprincipal financial officer,officers, evaluated the effectiveness of the design and operation of the Company’sSJI''s and SJG's disclosure controls and procedures (as defined in Rule 13a-15(e) under the Exchange Act) as of December 31, 20152017. Based on that evaluation, the Company’s chiefprincipal executive officer and chiefprincipal financial officer of each of SJI and SJG concluded that the disclosure controls and procedures employed at the CompanySJI and SJG, respectively, are effective.
Changes in Internal Control over Financial Reporting
There has not been any change in the Company's internal control over financial reporting, as defined in Rule 13a-15(f) under the Exchange Act of either SJI or SJG, during the fiscal quarter ended December 31, 20152017 that has materially affected, or is reasonably likely to materially affect, the Company’ssuch company's internal control over financial reporting.
Item 9B. Other Information
REPORT OF INDEPENDENT REGISTERED PUBLIC ACCOUNTING FIRM
To the stockholders and the Board of Directors of South Jersey Industries, Inc.
Opinion on Internal Control over Financial Reporting
We have audited the internal control over financial reporting of South Jersey Industries, Inc. and subsidiaries (the “Company”) as of December 31, 2017, based on criteria established in Internal Control - Integrated Framework (2013) issued by the Committee of Sponsoring Organizations of the Treadway Commission (COSO). In our opinion, the Company maintained, in all material respects, effective internal control over financial reporting as of December 31, 2017, based on criteria established in Internal Control - Integrated Framework (2013) issued by COSO.
We have also audited, in accordance with the standards of the Public Company Accounting Oversight Board (United States) (PCAOB), the consolidated financial statements and financial statement schedules as of and for the year ended December 31, 2017, of the Company and our report dated February 26, 2018, expressed an unqualified opinion on those consolidated financial statements and financial statement schedules.
Basis for Opinion
The Company’s management is responsible for maintaining effective internal control over financial reporting and for its assessment of the effectiveness of internal control over financial reporting, included in the accompanying Management's Report on Internal Controls over Financial Reporting. Our responsibility is to express an opinion on the Company’s internal control over financial reporting based on our audit. We are a public accounting firm registered with the PCAOB and are required to be independent with respect to the Company in accordance with the U.S. federal securities laws and the applicable rules and regulations of the Securities and Exchange Commission and the PCAOB.
We conducted our audit in accordance with the standards of the PCAOB. Those standards require that we plan and perform the audit to obtain reasonable assurance about whether effective internal control over financial reporting was maintained in all material respects. Our audit included obtaining an understanding of internal control over financial reporting, assessing the risk that a material weakness exists, testing and evaluating the design and operating effectiveness of internal control based on the assessed risk, and performing such other procedures as we considered necessary in the circumstances. We believe that our audit provides a reasonable basis for our opinion.
Definition and Limitations of Internal Control over Financial Reporting
A company’s internal control over financial reporting is a process designed to provide reasonable assurance regarding the reliability of financial reporting and the preparation of financial statements for external purposes in accordance with generally accepted accounting principles. A company’s internal control over financial reporting includes those policies and procedures that (1) pertain to the maintenance of records that, in reasonable detail, accurately and fairly reflect the transactions and dispositions of the assets of the company; (2) provide reasonable assurance that transactions are recorded as necessary to permit preparation of financial statements in accordance with generally accepted accounting principles, and that receipts and expenditures of the company are being made only in accordance with authorizations of management and directors of the company; and (3) provide reasonable assurance regarding prevention or timely detection of unauthorized acquisition, use, or disposition of the company’s assets that could have a material effect on the financial statements.
Because of its inherent limitations, internal control over financial reporting may not prevent or detect misstatements. Also, projections of any evaluation of effectiveness to future periods are subject to the risk that controls may become inadequate because of changes in conditions, or that the degree of compliance with the policies or procedures may deteriorate.
/s/ Deloitte & Touche LLP
South Jersey Industries, Inc.
Part III
PART III
Item 10. Directors, Executive Officers and Corporate Governance
Code of Ethics
The Company has adopted a Code of Ethics for its Principal Executive, Financial and Accounting Officers. It is available on SJI's website, www.sjindustries.com, by clicking “Investors” and then “Corporate Governance.” We will post any amendment to or waiver of the Code to our website.
Item 11. Executive Compensation
Item 12. Security Ownership of Certain Beneficial Owners and Management
and Related Stockholder Matters
Item 13. Certain Relationships and Related Transactions,
and Director Independence
Item 14. Principal Accountant Fees and Services
South Jersey Industries, Inc.
Part IV
Item 15. Exhibits and Financial Statement ScheduleSchedules
| (a) | Listed below are all financial statements and schedules filed as part of this |
1 - The consolidated financial statements and notes to consolidated financial statements together with the reportreports thereon of Deloitte & Touche LLP, dated February 29, 201626, 2018, are filefiled as part of this reportReport under Item 8 - Financial Statements and Supplementary Data.
2 - Supplementary Financial Information
Information regarding selected quarterly financial data can be found on page 147 of this Report.
Schedule I - Supplemental Schedules as of December 31, 2017 and 2016 and for the three years ended December 31, 2017, 2016, and 2015 (page 160).
Reports of Independent Registered Public Accounting Firm of Deloitte & Touche LLP (page 159).
Schedule II - Valuation and Qualifying Accounts. See page 82.Accounts (page 164).
All schedules, other than that listed above, are omitted because the information called for is included in the financial statements filed or because they are not applicable or are not required.
| (b) | List of Exhibits (Exhibit Number is in Accordance with the Exhibit Table in Item 601 of Regulation S-K). |
| Exhibit Number | Description | Reference | ||
Asset Purchase Agreement, dated as of October 15, 2017, by and between Pivotal Utility Holdings, Inc. and South Jersey Industries, Inc. | Incorporated by reference from Exhibit 2.1 of Form 8-K of SJI as filed October 16, 2017. | |||
| Certificate of Incorporation of South Jersey Industries, Inc., dated November 10, 1969. | Incorporated by reference from Exhibit 3.1 of Form 8-K of SJI as filed May 10, 2016. | |||
| Certificate of Amendment of the Certificate of Incorporation of SJI, dated April 21, 1983. | Incorporated by reference from Exhibit 3.2 of Form 8-K of SJI as filed May 10, 2016. | |||
| Certificate of Amendment of the Certificate of Incorporation of SJI, dated April 19, 1984. | Incorporated by reference from Exhibit 3.3 of Form 8-K of SJI as filed May 10, 2016. | |||
| Certificate of Amendment of the Certificate of Incorporation of SJI, dated April 23, 1987. | Incorporated by reference from Exhibit 3.4 of Form 8-K of SJI as filed May 10, 2016. | |||
South Jersey Industries, Inc.
Part IV
| Certificate of Amendment of the Certificate of Incorporation of SJI, dated October 7, 1996. | Incorporated by reference from Exhibit 3.6 of Form 8-K of SJI as filed May 10, 2016. | |||
| Certificate of Amendment of the Certificate of Incorporation of SJI, dated May 5, 2005. | Incorporated by reference from Exhibit 3.7 of Form 8-K of SJI as filed May 10, 2016. | |||
| Certificate of Amendment of the Certificate of Incorporation of SJI, dated April 28, 2009. | Incorporated by reference from Exhibit 3.8 of Form 8-K of SJI as filed May 10, 2016. | |||
| Certificate of Amendment of the Certificate of Incorporation of SJI, dated June 2014. | Incorporated by reference from Exhibit 3.9 of Form 8-K of SJI as filed May 10, 2016. | |||
| Certificate of Amendment of the Certificate of Incorporation of SJI, dated February 27, 2015. | Incorporated by reference from Exhibit 3.10 of Form 8-K of SJI as filed May 10, 2016. | |||
| Certificate of Incorporation of South Jersey Gas Company. | Incorporated by reference from Exhibit | |||
| Bylaws of South Jersey Industries, Inc. as amended and restated through April 21, 2017. | Incorporated by reference from Exhibit 3.2(ii) of Form 8-K of SJI as filed April 24, 2017. | |||
| Bylaws of South Jersey Gas Company as amended and restated through | Incorporated by reference from Exhibit | |||
| Form of Stock Certificate for | Incorporated by reference from Exhibit | |||
| Supplemental Indenture Amending and Restating First Mortgage Indenture, dated as of | ||||
| Incorporated by reference from Exhibit 4.1 of Form 8-K of SJG | ||||
| First Supplemental Indenture, dated as of January 23, 2017, for SJG | Incorporated by reference from Exhibit | |||
| First Supplement to Indenture of Trust dated as of June 29, 2000. | Incorporated by reference from Exhibit 4.1 of Form 8-K of SJG dated July 12, 2001. | |||
| Second Supplement to Indenture of Trust dated as of July 5, 2000. | Incorporated by reference from Exhibit 4.2 of Form 8-K of SJG dated July 12, 2001. | |||
| Third Supplement to Indenture of Trust dated as of July 9, 2001. | Incorporated by reference from Exhibit 4.3 of Form 8-K of SJG dated July 12, 2001. | |||
| Fourth Supplement to Indenture of Trust dated as of February 26, 2010. | Incorporated by reference from Exhibit 4.1 of Form | |||
Fifth Supplement, dated | Incorporated by reference from Exhibit | |||
Part IV
| Exhibit Number | Description | Reference | ||
| Deferred Payment Plan for Directors of South Jersey Industries, Inc., South Jersey Gas Company, Energy & Minerals, Inc., R&T Group, Inc. and South Jersey Energy Company as amended and restated October 21, 1994. | Incorporated by reference from Exhibit (10)(l) of Form 10-K | ||||||
| Schedule of Deferred Compensation Agreements. | Incorporated by reference from Exhibit (10)(l)(b) of Form 10-K | ||||||
| Form of Officer Change in Control Agreements, effective January 1, 2013, between certain officers and either South Jersey Industries, Inc. or its subsidiaries. | Incorporated by reference from Exhibit 10.1 of Form 8-K of SJI as filed January 25, 2013. | ||||||
| Schedule of Officer Agreements. | Incorporated by reference from Exhibit 10(e)(iv) of Form 10-K of SJI | ||||||
| Officer Severance Plan. | Incorporated by reference from Exhibit | ||||||
| Supplemental Executive Retirement Program, as amended and restated effective January 1, 2009 and Form of Agreement between certain SJI | Incorporated by reference from Exhibit (10)(f)(ii) of Form 10-K for 2009. | |||
| South Jersey Industries, Inc. 1997 Stock-Based Compensation Plan (As Amended and Restated Effective January 1, 2012). | Incorporated by reference from Exhibit 10.3 of Form 8-K of SJI as filed January 6, 2012. | |||
| Note Purchase Agreement dated as of March 1, 2010. | Incorporated by reference from Exhibit 10 of Form 8-K of SJG dated March 5, 2010. | |||
| Note Purchase Agreement dated as of December 30, 2010. | Incorporated by reference from Exhibit 10 of Form 8-K of SJG dated January 5, 2011. | |||
| Commercial Paper Dealer Agreement, dated as of July 1, | Incorporated by reference from Exhibit 10.1 of Form 8-K of SJG dated July 1, 2011. | |||
| Commercial Paper Dealer Agreement, dated as of January 5, | Incorporated by reference from Exhibit 10.1 of Form 8-K of SJG dated January 9, 2012. | |||
| Letter of Credit Reimbursement Agreements dated as of March 15, 2012. | Incorporated by reference from Exhibit 10.1-10.3 of Form 8-K of SJI dated March 21, 2012. | |||
| Note Purchase Agreement dated as of April 2, 2012. | Incorporated by reference from Exhibit 10.1 of Form 8-K of SJG dated April 3, 2012. | |||
| Incorporated by reference from Exhibit 10.1 of Form 8-K of SJI dated June 29, 2012. | |||||
| Note Purchase Agreement, dated as of September 20, 2012, | Incorporated by reference from Exhibit 10.1 of Form 8-K of SJG dated September 25, 2012. | ||||
| Note Purchase Agreement, dated as of | Incorporated by reference from Exhibit 10.1 of Form 8-K of SJG | ||||
| Note Purchase Agreement, dated as of June 26, 2014, for SJI. | Incorporated by reference from Exhibit 10.1 of Form 8-K of SJI dated June 26, 2014. |
South Jersey Industries, Inc.
Part IV
| Term Loan Credit Agreement, dated as of October 28, 2015, for SJI. | Incorporated by reference from Exhibit 10.1 of Form 8-K of SJI dated November | |||
| First Amendment to Letter of Credit Reimbursement Agreements dated as of March 10, 2016. | Incorporated by reference from Exhibit 10.1-10.3 of Form 8-K of SJI dated March 11, 2016. | |||
| 364-Day Revolving Credit Agreement, dated as of September 7, 2016, for SJI. | Incorporated by reference from Exhibit 10.1 of Form 8-K of SJI dated September 9, 2016. | |||
| Note Purchase Agreement, dated as of January 25, 2017, for SJG. | Incorporated by reference from Exhibit 10.1 of Form 8-K of SJG | |||
| Term Loan Credit Agreement, dated as of | Incorporated by reference from Exhibit 10.1 of Form 8-K of SJG dated | |||
| Loan Agreement by and between New Jersey Economic Development Authority and SJG dated April 1, 2006. | Incorporated by reference from Exhibit 10 of Form 8-K of SJG as filed April 26, 2006. | |||
| Five-Year Revolving Credit Agreement, dated as of August 7, 2017, for SJI. | Incorporated by reference from Exhibit 10.1 of Form 8-K of SJI dated August 10, 2017. | |||
| Five-Year Revolving Credit Agreement, dated as of August 14, 2017, for SJG. | Incorporated by reference from Exhibit 10.1 of Form 8-K of SJG dated August 15, 2017. | |||
| Note Purchase Agreement, dated as of August 16, 2017, for SJI. | Incorporated by reference from Exhibit 10.1 of Form 8-K of SJI dated September 6, 2017. | |||
| First Amendment to 364-Day Revolving Credit Agreement, dated as of September 6, 2017, for SJI. | Incorporated by reference from Exhibit 10.1 of Form 8-K of SJI dated August 16, 2017. | |||
| Equity Distribution and Purchase Agreement, dated as of December 31, 2015, by and among Energenic, Marina and DCO Energy, LLC. | Incorporated by reference from Exhibit 10.1 of Form 8-K of SJI dated January 7, 2016. | |||
| Equity Distribution and Purchase Agreement, dated as of December 31, 2015, by and among Energenic, DCO Energy, LLC and Marina. | Incorporated by reference from Exhibit 10.2 of Form 8-K of SJI dated January 7, 2016. | |||
| SJI - Calculation of Ratio of Earnings to Fixed Charges (Before Federal Income Taxes). | Incorporated by reference from Exhibit 12.1 of Form 10-K of SJI dated February 26, 2018. | |||
| SJG - Calculation of Ratio of Earnings to Fixed Charges (Before Federal Income Taxes). | Incorporated by reference from Exhibit 12.2 of Form 10-K of SJI dated February 26, 2018. | |||
| Code of Ethics. | Incorporated by reference from Exhibit 14 of Form 10-K for 2007. | |||
South Jersey Industries, Inc.
Part IV
| SJI - Subsidiaries of the Registrant. | Incorporated by reference from Exhibit 21 of Form 10-K of SJI dated February 26, 2018. | |||
| Independent Registered Public Accounting Firm's Consent. | Incorporated by reference from Exhibit 23 of Form 10-K of SJI dated February 26, 2018. | |||
| SJI - Certification of Chief Executive Officer pursuant to Section 302 of the Sarbanes-Oxley Act of 2002 (filed herewith). | ||||
| SJG - Certification of Principal Executive Officer pursuant to Section 302 of the Sarbanes-Oxley Act of 2002 (filed herewith). | ||||
| SJI - Certification of Chief Financial Officer pursuant to Section 302 of the Sarbanes-Oxley Act of 2002 (filed herewith). | ||||
| SJG - Certification of Principal Financial Officer pursuant to Section 302 of the Sarbanes-Oxley Act of 2002 (filed herewith). | ||||
| SJI - Certification of Chief Executive Officer pursuant to Section 906 of the Sarbanes-Oxley Act of 2002 (filed herewith). | ||||
| SJG - Certification of Principal Executive Officer pursuant to Section 906 of the Sarbanes-Oxley Act of 2002 (filed herewith). | ||||
| SJI - Certification of Chief Financial Officer pursuant to Section 906 of the Sarbanes-Oxley Act of 2002 (filed herewith). | ||||
| SJG - Certification of Principal Financial Officer pursuant to Section 906 of the Sarbanes-Oxley Act of 2002 (filed herewith). | ||||
| (101.INS) | eXtensible Business Reporting Language (XBRL) Instance Document (filed herewith). | |||
| (101.SCH) | XBRL Taxonomy Extension Schema (filed herewith). | |||
| (101.CAL) | XBRL Taxonomy Extension Calculation Linkbase (filed herewith). | |||
| (101.DEF) | XBRL Taxonomy Extension Definition Linkbase (filed herewith). | |||
| (101.LAB) | XBRL Taxonomy Extension Label Linkbase (filed herewith). | |||
| (101.PRE) | XBRL Taxonomy Extension Presentation Linkbase (filed herewith). | |||
* Constitutes a management contract or a compensatory plan or arrangement.
South Jersey Industries, Inc.
Part IV
SIGNATURES
Pursuant to the requirements of Section 13 or 15(d) of the Securities Exchange Act of 1934, the registrant has duly caused this Report to be signed on its behalf by the undersigned, thereunto duly authorized.
| SOUTH JERSEY INDUSTRIES, INC. | |||
| BY: | /s/ Stephen H. Clark | ||
| Stephen H. Clark | |||
| Executive Vice President & Chief Financial Officer | |||
| Date: | March 1, 2018 | ||
Pursuant to the requirements of the Securities Exchange Act of 1934, this Report has been signed below by the following persons on behalf of the registrant and in the capacities and on the dates indicated.
South Jersey Industries, Inc.
Part IV
SIGNATURES
Pursuant to the requirements of Section 13 or 15(d) of the Securities Exchange Act of 1934, the registrant has duly caused this report to be signed on its behalf by the undersigned, thereunto duly authorized.
| SOUTH JERSEY GAS COMPANY | |||
| BY: | /s/ Stephen H. Clark | ||
| Stephen H. Clark | |||
| Chief Financial Officer | |||
| Date: | March 1, 2018 | ||
Pursuant to the requirements of the Securities Exchange Act of 1934, this report has been signed below by the following persons on behalf of the registrant and in the capacities and on the dates indicated.
South Jersey Industries, Inc.
Part IV
REPORT OF INDEPENDENT REGISTERED PUBLIC ACCOUNTING FIRM
To the Board of Directors and Stockholders of
South Jersey Industries, Inc.
Folsom, New Jersey
Opinion on the Financial Statement Schedules
We have audited the consolidated financial statements of South Jersey Industries, Inc. and subsidiaries (the "Company") as of December 31, 2017 and 2016, and for each of the three years in the period ended December 31, 2017, and the Company's internal control over financial reporting as of December 31, 2017, and have issued our reports thereon dated February 26, 2018; such consolidated financial statements and reports are included elsewhere in this Form 10-K and in your 2017 Annual Report to Shareholders. Our audits also included the financial statement schedules of the Company listed in the Index at Item 15(a) 2. These financial statement schedules are the responsibility of the Company's management. Our responsibility is to express an opinion on the Company’s financial statement schedules based on our audits. In our opinion, such financial statement schedules, when considered in relation to the financial statements taken as a whole, present fairly, in all material respects, the information set forth therein.
/s/ Deloitte & Touche LLP
Philadelphia, Pennsylvania
February 26, 2018
South Jersey Industries, Inc.
Part IV
SCHEDULE I - SOUTH JERSEY INDUSTRIES, INC.
CONDENSED STATEMENTS OF INCOME
(In Thousands)
| 2017 | 2016 | 2015 | ||||||||||
| Management Service Fee Revenues | $ | 34,321 | $ | 25,463 | $ | 20,990 | ||||||
| Operating Expenses: | ||||||||||||
| Operations | 45,182 | 23,852 | 17,979 | |||||||||
| Depreciation | 311 | 377 | 406 | |||||||||
| Energy and Other Taxes | 1,324 | 1,033 | 806 | |||||||||
| Total Operating Expenses | 46,817 | 25,262 | 19,191 | |||||||||
| Operating (Loss) Income | (12,496 | ) | 201 | 1,799 | ||||||||
| Other Income: | ||||||||||||
| Equity in (Losses) Earnings of Subsidiaries (See Note 1) | (2,793 | ) | 119,061 | 105,610 | ||||||||
| Other | 16,752 | 11,953 | 10,145 | |||||||||
| Total Other Income | 13,959 | 131,014 | 115,755 | |||||||||
| Interest Charges | 23,818 | 12,148 | 11,822 | |||||||||
| Income Taxes | (18,951 | ) | 6 | 122 | ||||||||
| (Loss) Income from Continuing Operations | (3,404 | ) | 119,061 | 105,610 | ||||||||
| Equity in Undistributed Earnings of Discontinued Operations | (86 | ) | (251 | ) | (503 | ) | ||||||
| Net (Loss) Income | $ | (3,490 | ) | $ | 118,810 | $ | 105,107 | |||||
SCHEDULE I - SOUTH JERSEY INDUSTRIES, INC.
CONDENSED STATEMENTS OF COMPREHENSIVE INCOME
(In Thousands)
| 2017 | 2016 | 2015 | ||||||||||
| Net (Loss) Income | $ | (3,490 | ) | $ | 118,810 | $ | 105,107 | |||||
| Other Comprehensive Income (Loss) - Net of Tax | ||||||||||||
| Postretirement Liability Adjustment (A) | (10,920 | ) | (3,197 | ) | 5,518 | |||||||
| Unrealized Gain (Loss) on Available-for-Sale Securities (B) | — | 118 | (53 | ) | ||||||||
| Unrealized Gain on Derivatives - Other (B) | 1,536 | 197 | 294 | |||||||||
| Total Other Comprehensive (Loss) Income - Net of Tax | (9,384 | ) | (2,882 | ) | 5,759 | |||||||
| Comprehensive (Loss) Income | $ | (12,874 | ) | $ | 115,928 | $ | 110,866 | |||||
(A) Determined using a combined average statutory tax rate of 27% for 2017 and 40% for 2016 and 2015.
(B) Determined using a combined average statutory tax rate of 39% for 2017 and 40% for 2016 and 2015.
South Jersey Industries, Inc.
Part IV
SCHEDULE I - SOUTH JERSEY INDUSTRIES, INC.
CONDENSED STATEMENTS OF RETAINED EARNINGS
(In Thousands)
| 2017 | 2016 | 2015 | ||||||||||
| Retained Earnings - Beginning | $ | 510,597 | $ | 474,167 | $ | 439,218 | ||||||
| Net (Loss) Income | (3,490 | ) | 118,810 | 105,107 | ||||||||
| 507,107 | 592,977 | 544,325 | ||||||||||
| Dividends Declared - Common Stock | (87,308 | ) | (82,380 | ) | (70,158 | ) | ||||||
| Excess Tax Benefit on Restricted Stock | 552 | — | — | |||||||||
| Retained Earnings - Ending | $ | 420,351 | $ | 510,597 | $ | 474,167 | ||||||
SCHEDULE I - SOUTH JERSEY INDUSTRIES, INC.
CONDENSED STATEMENTS OF CASH FLOWS
FOR THE TWELVE MONTHS ENDED DECEMBER 31,
(In Thousands)
| 2017 | 2016 | 2015 | ||||||||||
| CASH PROVIDED BY OPERATING ACTIVITIES (See Note 1) | $ | 17,339 | $ | 20,507 | $ | 38,926 | ||||||
| CASH FLOWS FROM INVESTING ACTIVITIES: | ||||||||||||
| Net (Advances to) Repayments from Associated Companies | (16,096 | ) | 32,300 | (118,802 | ) | |||||||
| Capital Expenditures | (801 | ) | (345 | ) | (150 | ) | ||||||
| Purchase of Company Owned Life Insurance | (9,180 | ) | (2,398 | ) | (2,328 | ) | ||||||
| Investment in Affiliate | (40,000 | ) | (65,000 | ) | — | |||||||
| Net Cash Used in Investing Activities | (66,077 | ) | (35,443 | ) | (121,280 | ) | ||||||
| CASH FLOWS FROM FINANCING ACTIVITIES: | ||||||||||||
| Proceeds from Issuance of Long Term Debt | 50,000 | — | 50,000 | |||||||||
| Principal Repayments of Long Term Debt | (16,000 | ) | — | (114,000 | ) | |||||||
| Payments for Issuance of Long Term Debt | (12,174 | ) | (84 | ) | (55 | ) | ||||||
| Net Borrowings from (Repayments of) Short-Term Credit Facilities | 102,600 | (105,500 | ) | 153,000 | ||||||||
| Dividends on Common Stock | (87,308 | ) | (82,380 | ) | (70,158 | ) | ||||||
| Net Settlement of Restricted Stock (See Note 1) | (751 | ) | (387 | ) | (333 | ) | ||||||
| Proceeds from Sale of Common Stock | — | 214,426 | 63,192 | |||||||||
| Net Cash Provided by Financing Activities | 36,367 | 26,075 | 81,646 | |||||||||
| Net (Decrease) Increase in Cash, Cash Equivalents and Restricted Cash | (12,371 | ) | 11,139 | (708 | ) | |||||||
| Cash, Cash Equivalents and Restricted Cash at Beginning of Year | 12,847 | 1,708 | 2,416 | |||||||||
| Cash, Cash Equivalents and Restricted Cash at End of Year | $ | 476 | $ | 12,847 | $ | 1,708 | ||||||
South Jersey Industries, Inc.
Part IV
SCHEDULE I - SOUTH JERSEY INDUSTRIES, INC.
CONDENSED BALANCE SHEETS (In Thousands)
| 2017 | 2016 | |||||||
| Assets | ||||||||
| Property Plant and Equipment: | ||||||||
| Nonutility Property, Plant and Equipment, at cost | $ | 3,318 | $ | 2,685 | ||||
| Accumulated Depreciation | (2,194 | ) | (2,026 | ) | ||||
| Property, Plant and Equipment - Net | 1,124 | 659 | ||||||
| Investments: | ||||||||
| Investments in Subsidiaries | 1,209,308 | 1,233,856 | ||||||
| Available-for-Sale Securities | 36 | 32 | ||||||
| Total Investments | 1,209,344 | 1,233,888 | ||||||
| Current Assets: | ||||||||
| Cash and Cash Equivalents | 476 | 12,847 | ||||||
| Receivable from Associated Companies | 636,327 | 550,227 | ||||||
| Accounts Receivable | 52 | 49 | ||||||
| Other | 5,017 | — | ||||||
| Total Current Assets | 641,872 | 563,123 | ||||||
| Other Noncurrent Assets | 50,735 | 44,974 | ||||||
| Total Assets | $ | 1,903,075 | $ | 1,842,644 | ||||
| Capitalization and Liabilities | ||||||||
| Equity: | ||||||||
| Common Stock SJI | ||||||||
| Par Value $1.25 a share | ||||||||
| Authorized - 120,000,000 shares | ||||||||
| Outstanding Shares - 79,549,080 (2017) and 79,478,055 (2016) | $ | 99,436 | $ | 99,347 | ||||
| Premium on Common Stock | 709,658 | 706,943 | ||||||
| Treasury Stock (at par) | (271 | ) | (266 | ) | ||||
| Accumulated Other Comprehensive Loss | (36,765 | ) | (27,381 | ) | ||||
| Retained Earnings | 420,351 | 510,597 | ||||||
| Total Equity | 1,192,409 | 1,289,240 | ||||||
| Long-Term Debt | 364,946 | 323,971 | ||||||
| Current Liabilities: | ||||||||
| Notes Payable - Banks | 294,400 | 191,800 | ||||||
| Current Portion of Long-Term Debt | — | 16,000 | ||||||
| Payable to Associated Companies | 404 | 382 | ||||||
| Accounts Payable | 17,316 | 211 | ||||||
| Other Current Liabilities | 7,763 | 7,707 | ||||||
| Total Current Liabilities | 319,883 | 216,100 | ||||||
| Other Noncurrent Liabilities | 25,837 | 13,333 | ||||||
| Total Capitalization and Liabilities | $ | 1,903,075 | $ | 1,842,644 | ||||
South Jersey Industries, Inc.
Part IV
Notes to Condensed Financial Statements
| 1. | BASIS OF PRESENTATION: |
Pursuant to rules and regulations of the SEC, the parent-company only condensed financial statements of SJI do not reflect all of the information and notes normally included with financial statements prepared in accordance with GAAP in the United States. Therefore, these condensed financial statements should be read in conjunction with the consolidated financial statements and related notes included under Item 8 in this Form 10-K.
Certain reclassifications have been made to SJI's prior period condensed statements of cash flows to conform to the current period presentation. Cash paid by an employer when directly withholding shares for tax-withholding purposes is now classified as a financing activity in the condensed statements of cash flows to conform to ASU 2016-09, which is described under "New Accounting Pronouncements" in Note 1 to the consolidated financial statements. This caused SJI's prior period Cash Flows Provided by Operating Activities to increase by $0.4 million and $0.3 million for 2016 and 2015, respectively, and Net Cash Flows from Financing Activities to decrease by the same amount.
Dividends received from subsidiaries were $20.0 million and $40.8 million for 2017 and 2015, respectively. Dividends were not received from subsidiaries in 2016.
The following table provides a reconciliation between SJI's equity in earnings from its subsidiaries to total income from continuing operations (in thousands):
| Year Ended December 31, 2017 | Year Ended December 31, 2016 | Year Ended December 31, 2015 | ||||||||||
| Equity in (Losses) Earnings of Subsidiaries | $ | (2,793 | ) | $ | 119,061 | $ | 105,610 | |||||
| Acquisition Costs, net of tax (A) | (12,031 | ) | — | — | ||||||||
| Impact of Tax Adjustments (B) | 11,420 | — | — | |||||||||
| (Loss) Income From Continuing Operations | $ | (3,404 | ) | $ | 119,061 | $ | 105,610 | |||||
(A) Represents costs incurred on the agreement to acquire the assets of Elizabethtown Gas and Elkton Gas (see Note 1 to the consolidated financial statements).
(B) Represents one-time tax adjustments, most notably for Tax Reform, which was signed into law in December 2017. See Note 4 to the consolidated financial statements.
South Jersey Industries, Inc.
Part IV
SOUTH JERSEY INDUSTRIES, INC. AND SUBSIDIARIES
SCHEDULE II - VALUATION AND QUALIFYING ACCOUNTS
(In Thousands)
| Col. A | Col. B | Col. C | Col. D | Col. E | ||||||||||||||||
| Additions | ||||||||||||||||||||
| Classification | Balance at Beginning of Period | Charged to Costs and Expenses | Charged to Other Accounts - Describe (a) | Deductions - Describe (b) | Balance at End of Period | |||||||||||||||
| Provision for Uncollectible | ||||||||||||||||||||
| Accounts for the Year Ended | ||||||||||||||||||||
| December 31, 2017 | $ | 12,744 | $ | 6,949 | $ | (394 | ) | $ | 5,311 | $ | 13,988 | |||||||||
| Provision for Uncollectible | ||||||||||||||||||||
| Accounts for the Year Ended | ||||||||||||||||||||
| December 31, 2016 | $ | 10,252 | $ | 6,907 | $ | (47 | ) | $ | 4,368 | $ | 12,744 | |||||||||
| Provision for Uncollectible | ||||||||||||||||||||
| Accounts for the Year Ended | ||||||||||||||||||||
| December 31, 2015 | $ | 7,910 | $ | 14,730 | $ | (79 | ) | $ | 12,309 | $ | 10,252 | |||||||||
SOUTH JERSEY GAS COMPANY
SCHEDULE II - VALUATION AND QUALIFYING ACCOUNTS
(In Thousands)
| Col. A | Col. B | Col. C | Col. D | Col. E | Col. B | Col. C | Col. D | Col. E | ||||||||||||||||||||||||||||||
| Additions | Additions | |||||||||||||||||||||||||||||||||||||
| Classification | Balance at Beginning of Period | Charged to Costs and Expenses | Charged to Other Accounts - Describe (a) | Deductions - Describe (b) | Balance at End of Period | Balance at Beginning of Period | Charged to Costs and Expenses | Charged to Other Accounts - Describe (a) | Deductions - Describe (b) | Balance at End of Period | ||||||||||||||||||||||||||||
| Provision for Uncollectible | ||||||||||||||||||||||||||||||||||||||
| Accounts for the Year Ended | ||||||||||||||||||||||||||||||||||||||
| December 31, 2015 | $ | 6,601 | $ | 14,689 | $ | (235 | ) | $ | 11,277 | $ | 9,778 | |||||||||||||||||||||||||||
| December 31, 2017 | $ | 12,570 | $ | 6,949 | $ | (394 | ) | $ | 5,326 | $ | 13,799 | |||||||||||||||||||||||||||
| Provision for Uncollectible | ||||||||||||||||||||||||||||||||||||||
| Accounts for the Year Ended | ||||||||||||||||||||||||||||||||||||||
| December 31, 2014 | $ | 4,553 | $ | 9,417 | $ | (102 | ) | $ | 7,267 | $ | 6,601 | |||||||||||||||||||||||||||
| December 31, 2016 | $ | 9,778 | $ | 6,993 | $ | (47 | ) | $ | 4,154 | $ | 12,570 | |||||||||||||||||||||||||||
| Provision for Uncollectible | ||||||||||||||||||||||||||||||||||||||
| Accounts for the Year Ended | ||||||||||||||||||||||||||||||||||||||
| December 31, 2013 | $ | 3,985 | $ | 4,232 | $ | (41 | ) | $ | 3,623 | $ | 4,553 | |||||||||||||||||||||||||||
| December 31, 2015 | $ | 6,601 | $ | 14,689 | $ | (235 | ) | $ | 11,277 | $ | 9,778 | |||||||||||||||||||||||||||
(a) Recoveries of accounts previously written off and minor adjustments.
(b) Uncollectible accounts written off.