United States
Securities and Exchange Commission
Washington, D.C. 20549
Form 10-K
Annual Report Pursuant to Section 13 or 15(d) of the Securities Act of 1934
|
| | | | | | | | | | |
| For the fiscal year ended | December 31, 20182021 | Commission File Number | 1-13145 |
Jones Lang LaSalle Incorporated
(Exact name of registrant as specified in its charter)
|
| | | | | | | | | | | | | | | | | | | | | | | | | | | | | | | | | | | | | | | | | | | |
| Maryland | 36-4150422 | 36-4150422 |
| (State or other jurisdiction of incorporation or organization) | | (I.R.S. Employer Identification No.) | |
| 200 East Randolph Drive Chicago, IL | Chicago, | IL | | | 60601 | |
| (Address of principal executive offices) | | (Zip Code) | |
| Registrant's telephone number, including area code: 312-782-5800 | | (312) | 782-5800 | | | | |
| | | | | | | | | | | | | | |
| |
| | |
| | |
| |
| | | | | | | | | | | | | | |
| Securities registered pursuant to Section 12(b) of the Act: |
| Title of each class | | Trading Symbol | | Name of each exchange on which registered |
Common Stock, ($0.01 par value)value $0.01 | | JLL | | The New York Stock Exchange |
| | |
| Securities registered pursuant to Section 12(g) of the Act: None |
Indicate by check mark if the registrant is a well-known seasoned issuer, as defined in Rule 405 of the Securities Act. Yes x No o
Indicate by check mark if the registrant is not required to file reports pursuant to Section 13 or 15(d) of the Act. Yes o No x
Indicate by check mark whether the registrant (1) has filed all reports required to be filed by Section 13 or 15(d) of the Securities Exchange Act of 1934 during the preceding 12 months (or for such shorter period that the registrant was required to file such reports), and (2) has been subject to such filing requirements for the past 90 days. Yes x No o☐
Indicate by check mark whether the registrant has submitted electronically every Interactive Data File required to be submitted pursuant to Rule 405 of Regulation S-T (§232.405 of this chapter) during the preceding 12 months (or for such period that the registrant was required to submit such files). Yes x No o
Indicate by check mark if disclosure of delinquent filers pursuant to Item 405 of Regulation S-K (§229.405 of this chapter) is not contained herein, and will not be contained, to the best of registrant's knowledge, in definitive proxy or information statements incorporated by reference in Part III of this Form 10-K or any amendment to this Form 10-K o☐
Indicate by check mark whether the registrant is a large accelerated filer, an accelerated filer, a non-accelerated filer, a smaller reporting company, or an emerging growth corporation (as defined in Rule 12b-2 of the Exchange Act).
Large accelerated filer x Accelerated filer o Non-accelerated filer o Smaller reporting company o Emerging growth company o | | | | | | | | | | | | | | | | | | | | | | | | | | | | | |
| Large accelerated filer | x | Accelerated filer | ☐ | Non-accelerated filer | ☐ | Smaller reporting company | ☐ | Emerging growth company | ☐ |
If an emerging growth company, indicate by check mark if the registrant has elected not to use the extended transition period for complying with any new or revised financial accounting standards provided pursuant to Section 13(a) of the Exchange Act. o☐
Indicate by check mark whether the registrant is a shell company (as defined in Rule 12b-2 of the Exchange Act). Yes o☐ No x
The aggregate market value of the voting stock (common stock) held by non-affiliates of the registrant as of the close of business on June 30, 20182021 was $7,470,521,871.$9,946,917,181.
The number of shares outstanding of the registrant's common stock (par value $0.01) as of the close of business on February 18, 201922, 2022 was 45,621,647.49,885,103.
Portions of the Registrant's Proxy Statement for its 20192022 Annual Meeting of Shareholders are incorporated by reference in Part III of this report.
JONES LANG LASALLE INCORPORATED
ANNUAL REPORT ON FORM 10-K
TABLE OF CONTENTS
| | | | | | | | |
| | Page |
| | Page |
| | |
| Item 1. | | |
| Item 1A. | | |
| Item 1B. | | |
| Item 2. | | |
| Item 3. | | |
| Item 4. | | |
| | |
| Item 5. | | |
| Item 6. | | |
| Item 7. | | |
| Item 7A. | | |
| Item 8. | | |
| Item 9. | | |
| Item 9A. | | |
| Item 9B. | | |
| Item 9C. | | |
| | |
| Item 10. | | |
| Item 11. | | |
| Item 12. | | |
| Item 13. | | |
| Item 14. | | |
| | |
| Item 15. | | |
| Item 16. | | |
| | |
| | |
| | |
| | |
PART I
ITEM 1. BUSINESS
COMPANY OVERVIEW
Jones Lang LaSalle Incorporated, incorporated in 1997, is a Maryland corporation that was incorporated in 1997.corporation. References to “JLL,” “the Company,” “we,” “us” and “our” refer to Jones Lang LaSalle Incorporated and include all of its consolidated subsidiaries, unless otherwise indicated or the context requires otherwise. Our common stock is listed on The New York Stock Exchange ("NYSE") under the symbol “JLL.”
We areJLL is a leading professional services firm that specializes in real estate and investment management. Our vision is to reimagineWe shape the worldfuture of real estate creatingfor a better world by using the most advanced technology to create rewarding opportunities, and amazing spaces where people can achieve their ambitions. In doing so, we will build a better tomorrowand sustainable real estate solutions for our clients, our people and our communities. JLL is a Fortune 500 company with annual revenue of $16.3$19.4 billion, operations in over 80 countries and a global workforce of over 90,00098,000 as of December 31, 2018.2021. We provide services for a broad range of clients who represent a wide variety of industries and are based in markets throughout the world. Our clients vary greatly in size and include for-profit and not-for-profit entities, public-private partnerships and governmental ("public sector") entities looking to outsource real estate services.entities. Through LaSalle Investment Management, we invest for clients on a global basis in both private assets and publicly traded real estate securities.
Our issuer and senior unsecured ratings are investment grade as of December 31, 2018: Baa1 (stable outlook) from Moody’s Investors Service, Inc. ("Moody’s") and BBB+ (stable outlook) from Standard & Poor’s Ratings Services ("S&P").
We use JLL as our principal trading name. Jones Lang LaSalle Incorporated remains our legal name. JLL is a registered trademark in the countries in which we do business, as is our logo:
LaSalle Investment Management, which uses LaSalle as its principal trading name, is a wholly-owned member of the Jones Lang LaSalle Incorporated group. LaSalle is one of the world's largest and most diversified real estate investment management companies. As of December 31, 2018, LaSalle's assets under management were $60.5 billion. LaSalle is a registered trademark in the countries in which we conduct business, as is the logo:
We deliver an array of services across four business segments. We manage our Real Estate Services (“RES”) offerings across three geographic business segments: (i) the Americas, (ii) Europe, Middle East and Africa ("EMEA"), and (iii) Asia Pacific, and we manage our investment management business globally as (iv) LaSalle Investment Management. In our Americas, EMEA and Asia Pacific operating segments, we provide a full range of leasing, capital markets, integrated property and facility management, project management, advisory, consulting, valuations and digital solutions services locally, regionally and globally.
In 2018, we generated 13% annual growth in both consolidated revenue and fee revenue. Our global platform and diverse service and product offerings position us to take advantage of the opportunities in a consolidating industry and to successfully navigate the dynamic and challenging markets in which we compete worldwide.
ForWe use JLL as our principal trading name. Jones Lang LaSalle Incorporated remains our legal name. JLL is a detailed discussion of our segment results, please see "Results of Operations" and "Market Risks" in Part II, Item 7, Management's Discussion and Analysis of Financial Condition and Results of Operations, as well as Note 3, Business Segments,registered trademark in the Notescountries in which we do business, as is our logo. In addition, LaSalle Investment Management, which uses LaSalle as its principal trading name, is a wholly-owned subsidiary of Jones Lang LaSalle Incorporated. LaSalle is also a registered trademark in the countries in which we conduct business, as is our logo.


Through December 31, 2021, we delivered an array of services across four business segments, managing our Real Estate Services (“RES”) offerings across three geographic segments (i) the Americas, (ii) Europe, Middle East and Africa ("EMEA"), and (iii) Asia Pacific, and managing our investment management business globally as (iv) LaSalle. In our Americas, EMEA and Asia Pacific segments, we provided a full range of leasing, capital markets, integrated property and facility management, project management, advisory, consulting, valuations and technology solutions services locally, regionally and globally. LaSalle is one of the world's largest and most diversified real estate investment management companies with $76.6 billion assets under management as of December 31, 2021.
Effective January 1, 2022, our Real Estate Services operations were reorganized into four global business segments focused on product offerings versus geographical alignment. The new RES segments are: (i) Markets Advisory, (ii) Capital Markets, (iii) Work Dynamics, and (iv) JLL Technologies ("JLLT"). Effective with financial reporting in 2022, prior period results will be restated to Consolidated Financial Statements.conform with our new organizational structure. We will continue to manage our investment management business globally as LaSalle, a distinct segment.
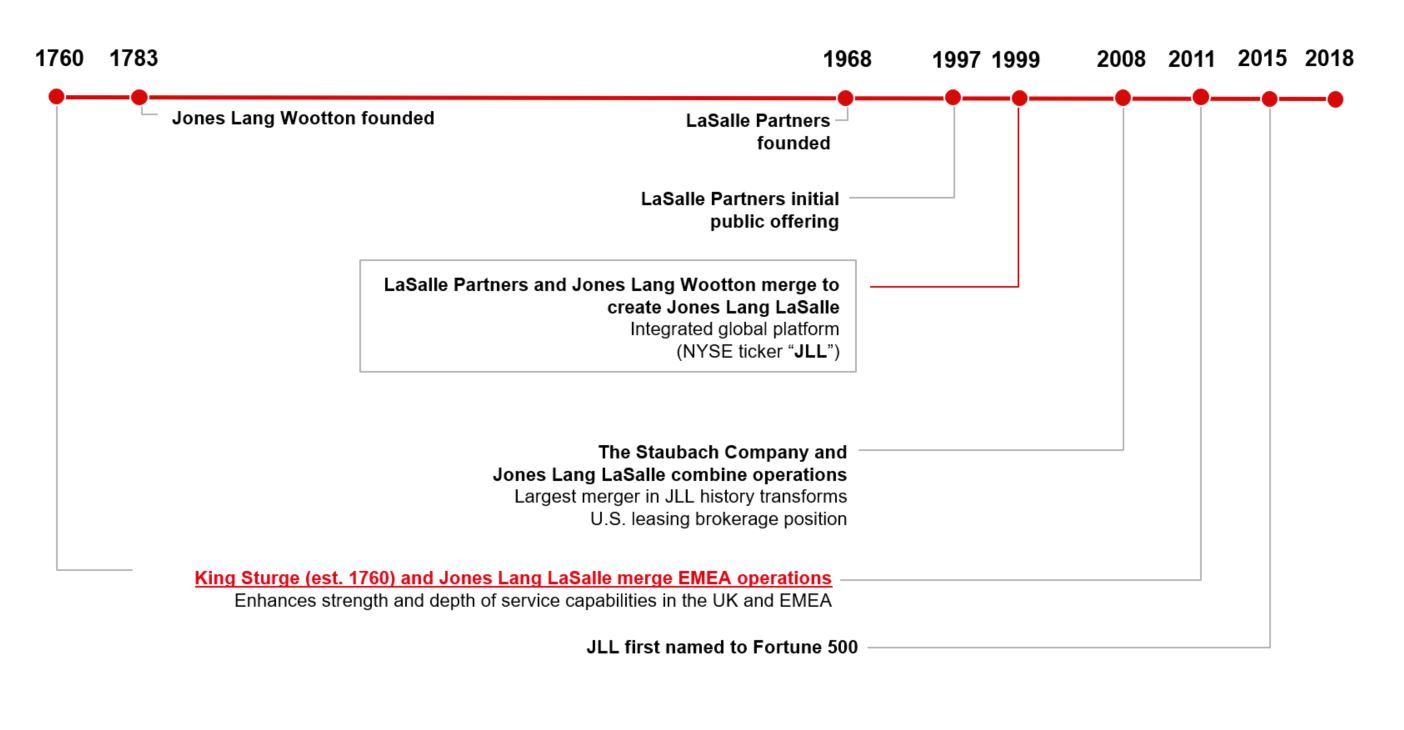
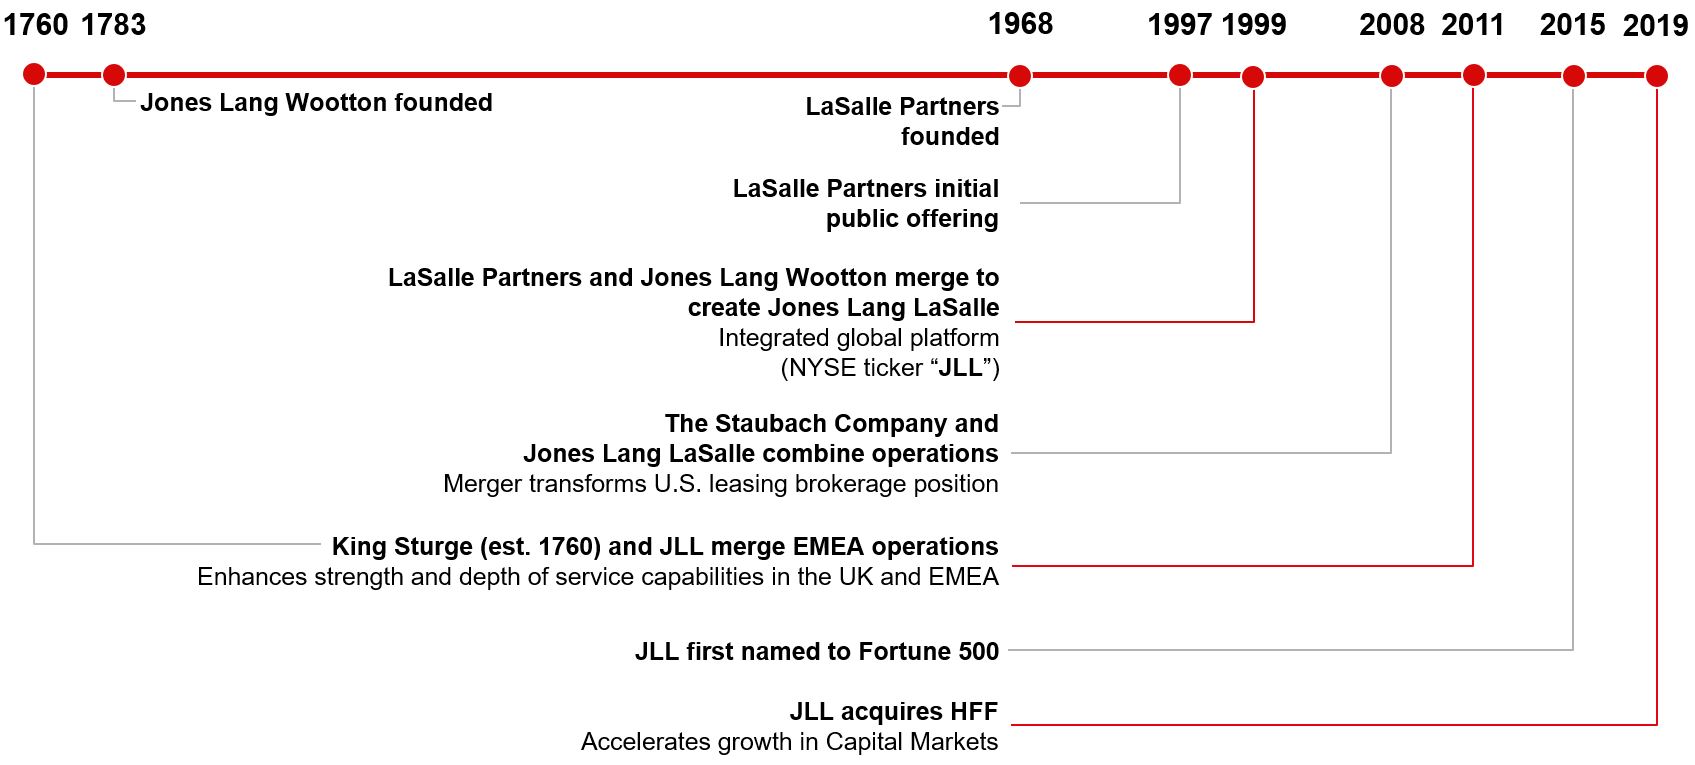
OUR HISTORY
We began to establish our network of services across the globe through the 1999 merger of the Jones Lang Wootton companies ("JLW", founded in England in 1783) with LaSalle Partners Incorporated ("LaSalle Partners", founded in the United States in 1968 and incorporated in 1997). We have grown our business by expanding our client base and the range of our services and products, both organically and through a series of mergers and acquisitions. Our extensive global platform and in-depth knowledge of local real estate markets enable us to serve as a single-source provider of solutions for the full spectrum of our clients' real estate needs.
Over the last ten years, we completed nearly 90 strategic acquisitions as part of our global growth strategy. These mergers and acquisitions have given us additional share and scale in key geographical markets, expanded our capabilities in certain service offerings and further broadened the global platform we make available to our clients.
For information on recent acquisitions, refer to Note 4, Business Combinations, Goodwill and Other Intangibles,Intangible Assets, of the Notes to the Consolidated Financial Statements, included in Item 8.
A timeline of notable milestones in our history is illustrated below.
OUR SERVICES AND BUSINESS SEGMENTS
To addressWe are driven to shape the future of real estate for a better world. We do this by addressing the needs of real estate owners, occupiers and investors, we leverageleveraging our deep real estate expertise and experience to provide clients with a full range of the following services on a local, regional and global scale.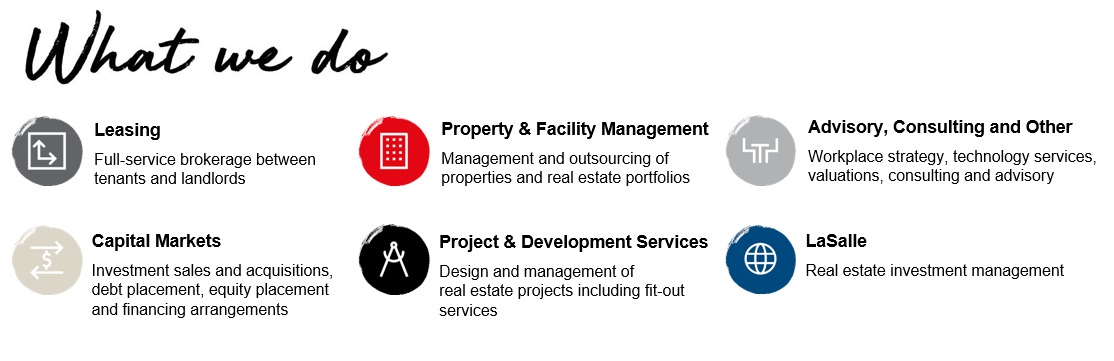
We offer our real estate services locally, regionally and globally to real estate owners, occupiers, investors and developers for a variety of property types, including (ordered alphabetically):
| | | | | | | | |
| • Critical Environments and Data Centers | • Hotels and Hospitality Facilities | • Office (including Flex Space) |
| • Cultural Facilities | • Industrial and Warehouse | • Residential (Individual and Multifamily) |
| • Educational Facilities | • Infrastructure Projects | • Retail and Shopping Malls |
| • Government Facilities | • Logistics (Sort & Fulfillment) | • Sports Facilities |
| • Healthcare and Laboratory Facilities | • Military Housing | • Transportation Centers |
We develop and activate technology to make real estate work for the long-term benefit of our people, clients and communities. Across our service lines, we offer and will continue to develop and invest in unique technology products and services that help us and our clients transform the way they acquire, operate, manage, and experience commercial real estate. Refer to the Technology portion of our Strategic Framework section below for additional information about our technology agenda.
We believe our market reach and depth of service offerings strengthen the long-term value of the enterprise in a number of ways, including: (i) reducing the potential impact of episodic volatility or disruption in any specific region; (ii) enhancing the expertise of our people through knowledge sharing across the globe to facilitate opportunities to engage clients across our service offerings; and (iii) allowing us to identify and quickly react to emerging trends, risks and opportunities.
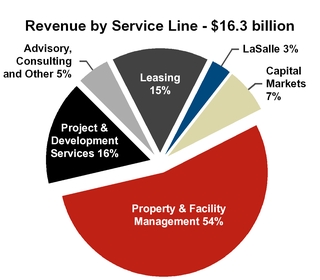
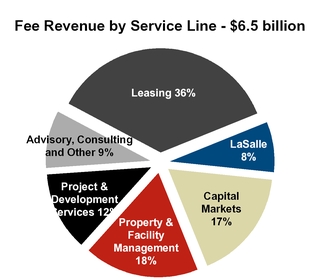
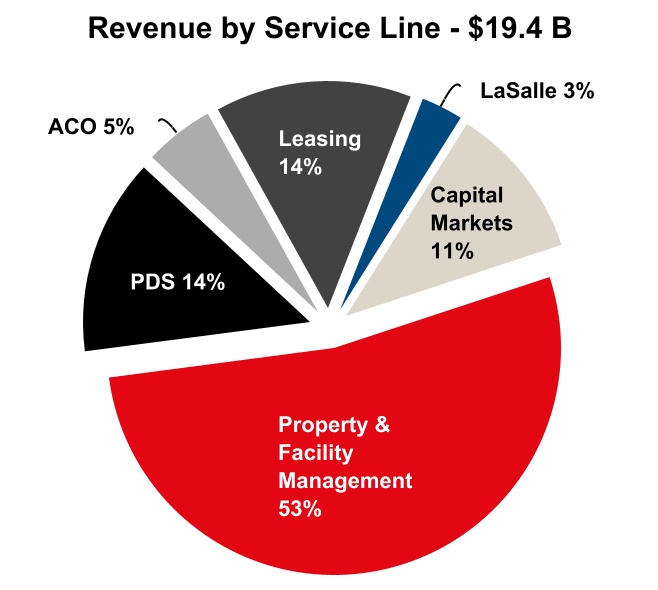
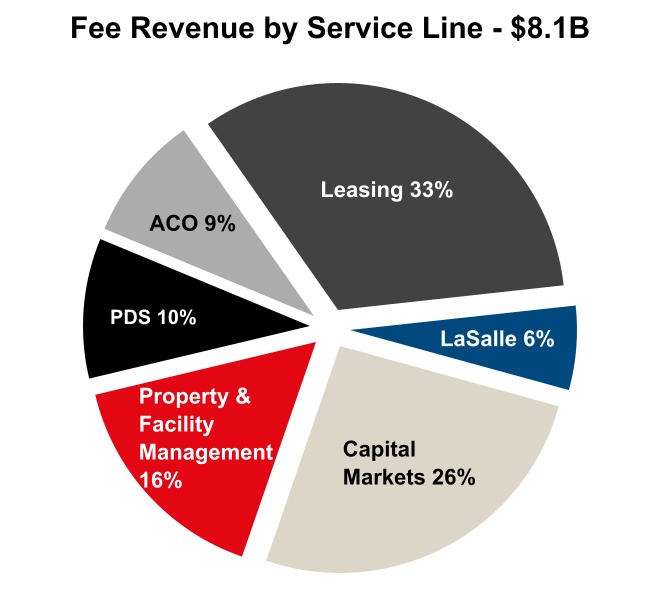
The following reflects our revenue and fee revenue by service line:line for the year ended December 31, 2021:
To calculate fee revenue, we deduct directly reimbursed expenses from revenue and then exclude (i) net non-cash mortgage servicing rights and mortgage banking derivative activity and (ii) gross contract costs associated with client-dedicated labor, and third-party vendors and subcontractors. Refer to Item 7. Management's Discussion and Analysis of Financial Condition and Results of Operations for additional discussion of fee revenue, a non-GAAP measure, and reconciliation from the most comparable U.S. GAAP measure.
The broad range of services we offer includes (in alphabetical order):measure, Revenue.
|
| |
Agency Leasing | Logistics and Supply-Chain Management |
Corporate Finance | Mortgage Origination and Servicing |
Debt Placement | Project and Development Management / Design |
Digital Solutions | Property Management |
Energy and Sustainability Services | Real Estate Investment Banking |
Integrated Facilities Management | Research |
Investment Management & Advisory | Strategic Consulting and Advisory Services |
Investment Sales | Tenant Representation |
Lease Administration | Valuations |
|
| | |
Critical Environments and Data Centers | Hotels and Hospitality Facilities | Residential (Individual and Multifamily) |
Cultural Facilities | Industrial and Warehouse | Retail and Shopping Malls |
Educational Facilities | Infrastructure Projects | Sort & Fulfillment Centers |
Government Facilities | Military Housing | Sports Facilities |
Healthcare and Laboratory Facilities | Office (including flex space) | Transportation Centers |
Individual segments and markets may focus on different property types to a greater or lesser extent depending on local requirements, market conditions, and client needs.
We are committed to transforming our company and our clients through technology. Across our service lines, we offer and will continue to develop and invest in unique digital solutions and products that help us and our clients strategize, build data, offer workplace technology and visualize real estate innovations. Refer to the Digital portion of our Strategic Framework section below for additional information about our digital agenda.
We believe our market reach and depth of service offerings strengthen the long-term value of the enterprise in a number of ways, including: (i) reducing the potential impact of episodic volatility or disruption in any specific region; (ii) enhancing the expertise of our people through knowledge sharing among colleagues across the globe; and (iii) allowing us to identify and quickly react to emerging trends, risks and opportunities.
Real Estate Services: Americas, EMEA, and Asia Pacific
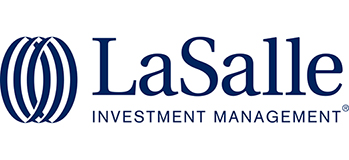
We organize our RES offerings into five major product service lines: (1) Leasing; (2) Capital Markets; (3) Property & Facility Management; (4) Project & Development Services; and (5) Advisory, Consulting and Other Services.
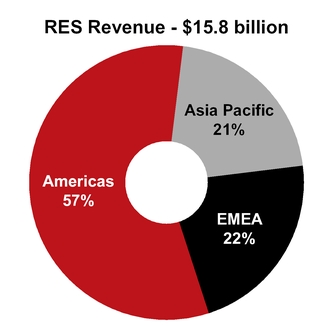
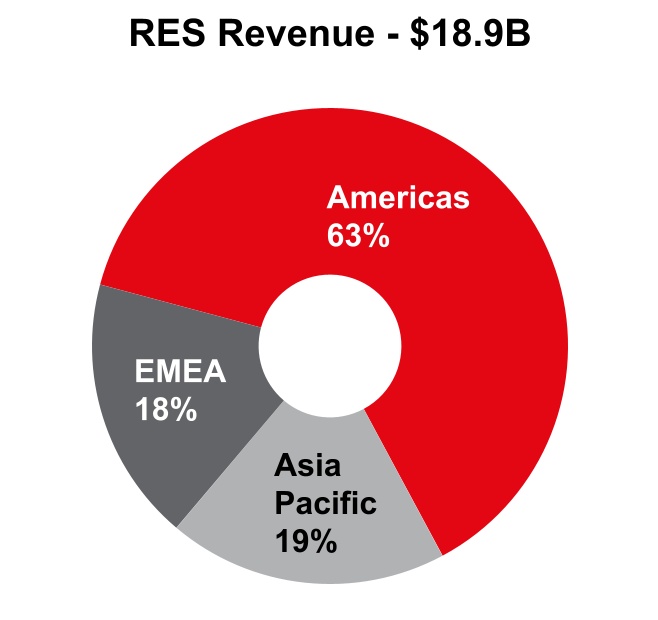
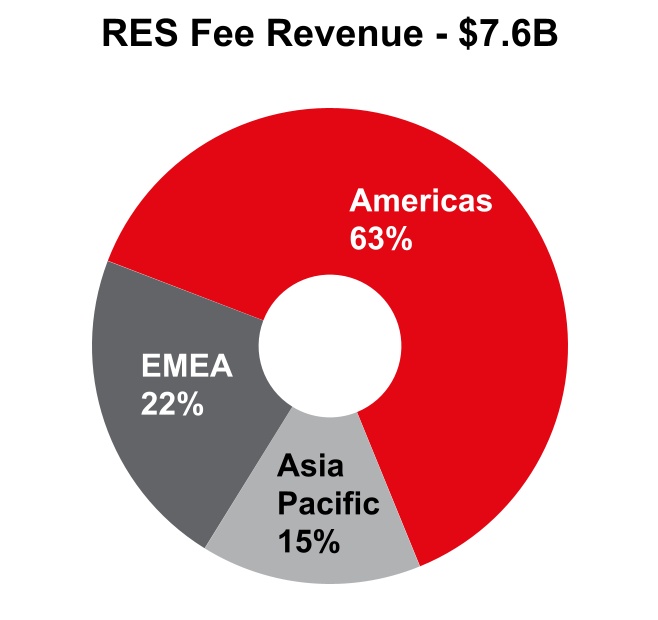
For the year ended December 31, 2018,2021, our RES revenue and fee revenue was generated as follows:was:
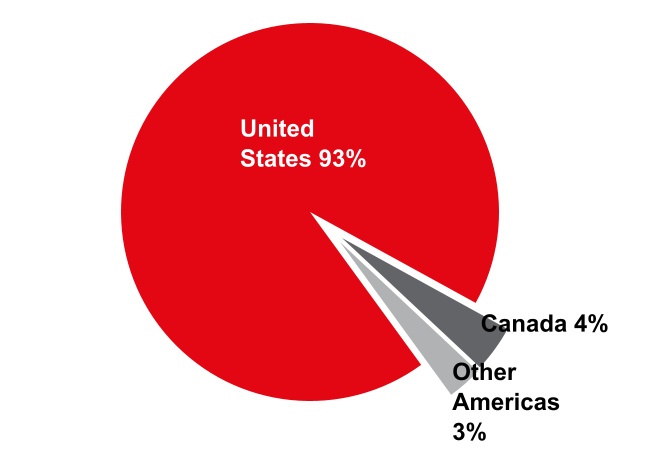
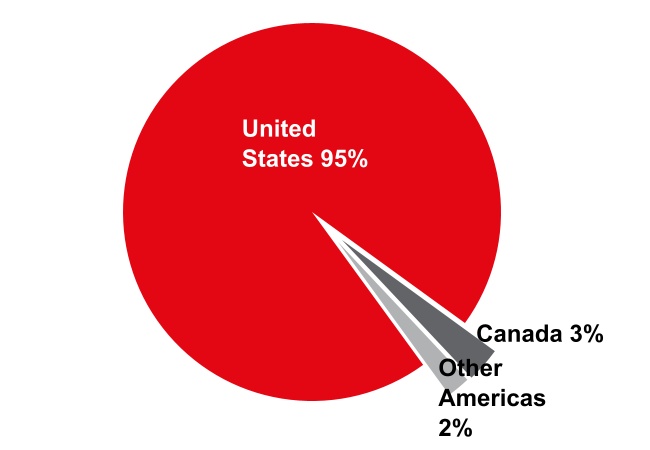
In the Americas, our RES revenue and fee revenue for 20182021 was $9.0 billion, earned geographically as follows:
| | | | | |
| Americas Revenue by Country - $11.9B | Americas Fee Revenue by Country - $4.9B |
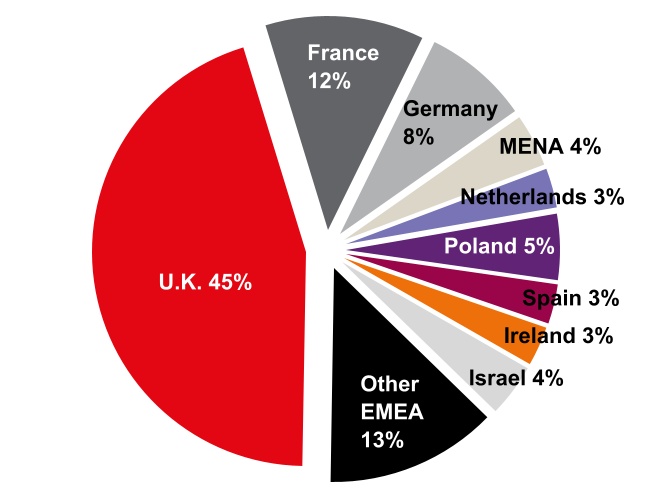
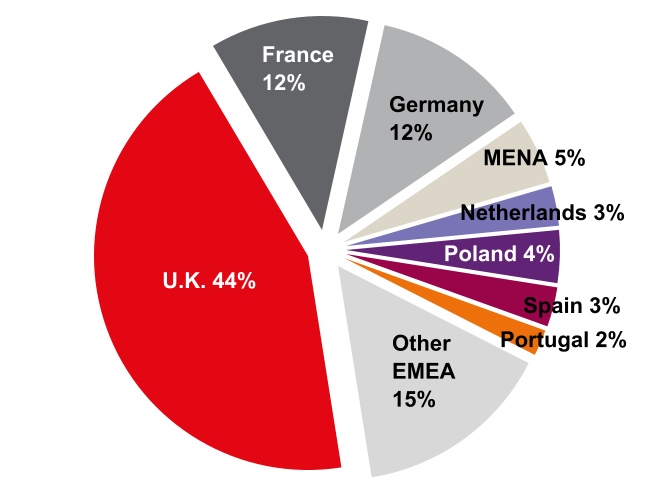
In EMEA, our RES revenue and fee revenue for 20182021 was $3.5 billion, earned geographically as follows:
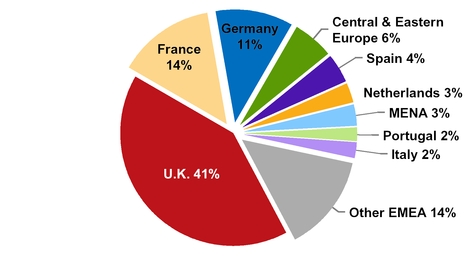
| | | | | |
| EMEA Revenue by Country - $3.5B | EMEA Fee Revenue by Country - $1.6B |
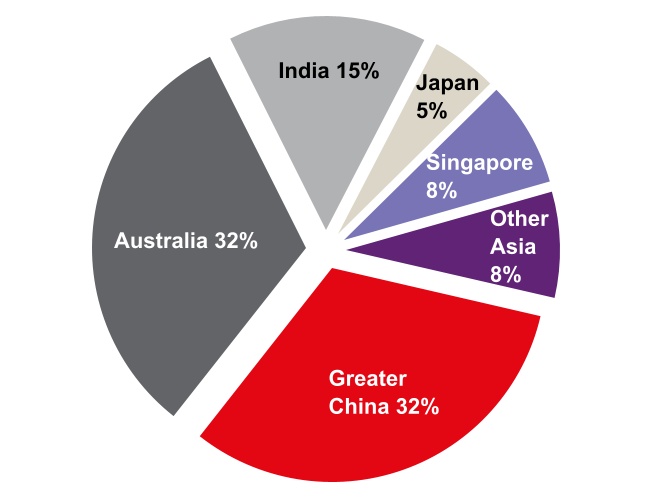
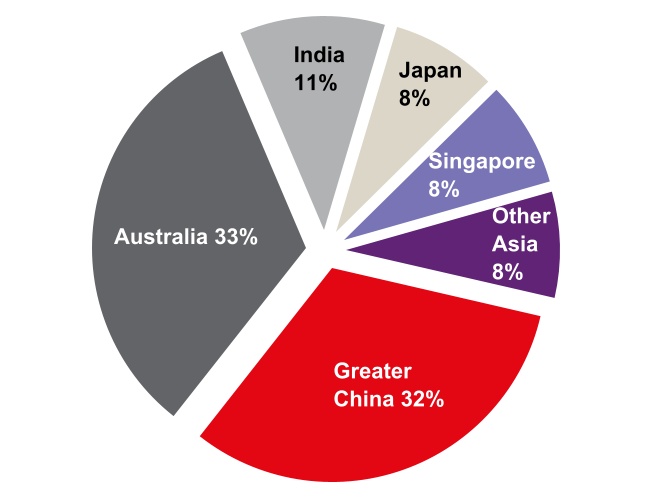
In Asia Pacific, our RES revenue and fee revenue for 20182021 was $3.2 billion, earned geographically as follows:
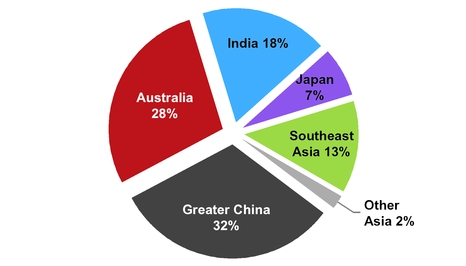
| | | | | |
| Asia Pacific Revenue by Country - $3.5B | Asia Pacific Fee Revenue by Country - $1.1B |
Our five RES service lines, and the services we provide within them, include:
1. Leasing
Agency Leasing executes leasing programs, including marketing, on behalf of property owners (including investors, developers, propertyproperty-owning companies and public entitiesentities) to secure tenants and negotiate leases with terms that reflect our clients' best interests. In 2018,2021, we completed approximately 16,10015,200 agency leasing transactions representing 250298 million square feet of space.
Tenant Representation establishes strategic alliances with occupier clients to help them evaluate and execute transactions to meet their occupancy requirements and ongoing real estate needs. We partner with clients to define space requirements, identify suitable alternatives, recommend appropriate occupancy solutions, and negotiate lease and ownership terms with landlords. Our involvement helps our clients reduce real estate costs, minimize occupancy risk, improve occupancy control and flexibility, and create more productive office environments. In 2021, we completed approximately 27,000 tenant representation transactions representing 722 million square feet of space.
Our agency leasing and tenant representation fees are typically based on a percentage of the value of the lease revenue commitment for executed leases, although in some cases they are based on a dollarmonetary amount per square foot leased.
Tenant Representation establishes strategic alliances with
2. Capital Markets serves our clients which may include helping them: defining space requirements; identifying suitable alternatives; recommending appropriate occupancy solutions; negotiating leaselocally, regionally and ownership terms with landlords;globally by leveraging extensive knowledge of the commercial and reducingresidential real estate costs by analyzing, structuring, and negotiating business and economic incentives. We employ a multi-disciplinary approach to develop occupancy strategies linked to our clients' core business objectives.
Tenant Representation realizes revenue on a negotiated fee basis which, in many cases, landlords are responsible for paying. Fees sometimes reflect performance measures related to targets that wemarkets and our clients establish priorfully-integrated capital markets platform to engagement or, in the caseprovide a broad array of strategic alliances, at future annual intervals. We use quantitative and qualitative measurements to assess performance relative to these goals, and we may be awarded incentive fees for superior performance. In 2018, we completed approximately 21,400 tenant representation transactions representing 821 million square feet of space.advisory services. Our services primarily include (ordered alphabetically):
2. | | | | | | | | |
| ● Corporate Capital Markets | | | | ● Investment sales and advisory |
| ● Debt advisory | | | | ● Loan sales |
● Equity advisory (funds and placement, M&A
and corporate advisory) | | | | ● Loan servicing |
Capital Markets includes property sales and acquisitions, real estate financings, private equity placements, portfolio advisory activities, and corporate finance advice and execution. We provide these services for substantially all types of properties, including hotel and hospitality assets. In the U.S., we are an approved HUD/Ginnie Mae,Freddie Mac, Fannie Mae and Freddie MacHousing and Urban Development/Ginnie Mae commercial multifamily lender and loan servicer. Real Estate Investment Banking includesIn addition, we are one of only 23 Fannie Mae Delegated Underwriting & Servicing ("DUS") lenders. M&A and corporate advisory include sourcing capital, both equity and debt, derivatives structuring, and other traditional investment banking services designed to assist investor and corporate clients in maximizing the value of their real estate. To meet client demands for marketingselling and acquiring real estate assets internationally and investing outside of their home markets, our Capital Markets teams combine local market knowledge with our access to global capital sources to provide superior execution in raising capital for real estate transactions. By researching, developing and introducing innovative new financial products and strategies, Capital Markets is also integral to the business development efforts of our other businesses.
Clients typically compensate Capital Markets units onMost of our revenues are in the basisform of fees, derived from the value of transactions we complete or securities we place. In certain circumstances, we receive retainer fees for portfolio advisory or consulting services. Real Estate Investment BankingIn addition, we also earn fees are generally transaction-specific and conditioned uponfrom commercial loan servicing activities.
For the successful completion of the transaction. During 2018,year ended December 31, 2021, we provided capital markets services for approximately $179$315 billion of client transactions.
3. Property & Facility Management
Property Management provides on-site management services to real estate owners for office, industrial, retail, multifamily residential and specialty properties. We seek to leverage our market share and buying power to deliver superior service and value to our clients. We provide services throughOur extended delivery team includes our own employees or through contracts withpersonnel as well as third-party providers,vendors and subcontractors, striving to maintain high levels of occupancy and tenant satisfaction while lowering clients'partnering with clients to reduce property operating costs. As of December 31, 2018,2021, we provided on-site property management services for properties totaling approximately 3.23.9 billion square feet.
We typically provide property management services through an on-site general manager and staff. Our general managers are responsible for day-to-day property management activities, client satisfaction and financial results. We support them with regional supervisory teams and central resources in such areas as training, technical and environmental services, accounting, marketing, and human resources.
We are generally compensated based upon a percentage of cash collections we make on behalf of our clients or square footage managed; however, in some cases, management agreements provide for incentive compensation relating to operating expense reductions, gross revenue or occupancy objectives, or tenant satisfaction levels. Consistent with industry custom, management contract terms typically range from one to three years, although some contracts can be terminated at will at any time following a short notice period, usually 30 to 120 days, as is typical in the industry.
Integrated Facilities Management ("IFM") provides comprehensive portfolio and facility management services to corporations and institutions that outsource the management of the real estate they occupy. Through digital investments, procurementoccupy, typically those with large portfolios (usually over one million square feet) that offer significant opportunities to reduce costs, meet sustainability targets, improve service delivery and supply chain management expertise, as well as process discipline across a globally integrated platform, we provide services at a lower cost than ourenhance end-user experience. Our IFM offering focuses on the work, worker and workplace to help clients could otherwise achieve themselvesoptimal financial and operational results from their facilities, while also enhancing the human experience and productivity of their employees and other end-users of their space. Technology is the backbone of our IFM delivery, leveraging advanced products such as cloud-based work order management and advanced business intelligence tools that empower clients in their space optimization assessments. Our IFM services focus on the day-to-day management of client locations and include, but are not limited to, repairs and maintenance, call center operations, security and landscaping delivered through an integrated model.end-user. Our extended delivery team includes our own personnel as well as third-party vendors and subcontractors.subcontractors who can meet clients' needs by providing consistent service delivery worldwide and a single point of contact from their real estate service providers.
The scope of IFM solutions offered to clients generally fall within one of the following three categories:
•Full-service IFM outsourcing: Day-to-day operations management of client site locations, delivered through a globally integrated platform with standardized processes. Facilities under management cover all real estate asset classes, including corporate headquarters, distribution facilities, hospitals, research & development facilities, data centers and industrial complexes. As of December 31, 2018,2021, IFM managed approximately 1.41.6 billion square feet of real estate for our clients.
Our target•Technology-enabled IFM solutions: Technology is the backbone of our IFM offering. Facilities teams leverage advanced products to enhance the experience of end users as well as make faster and more informed decisions, manage compliance, and improve efficiency through automation, accountability, assets, and analytics. One example is Corrigo, which enables facilities managers to easily manage work orders, centralizing repair, maintenance, and analytics as well as automating tasks. We also provide technology-enabled predictive maintenance strategies and smart building technologies which can help extend the lifespan of costly equipment while preventing system failures.
•Mobile engineering services: We provide mobile engineeringservices to clients typically havewith large portfolios (usually over one million square feet) that offer significant opportunitiesof sites or where we have multiple clients in proximity to reduceeach other. This model reduces clients' operating costs and improve service delivery. The competitive trends of globalization, outsourcing and off-shoring have prompted many of these clients to demand consistent service delivery worldwide andby offering a single point of contact from their real estate service providers. We tailor our service delivery to individual client needs by combining our large global platform with substantial local expertise. Depending on client needs, our IFM personnel, either alone or as partners with other business units or third-party providers, frequently also providefor services, beyond core IFM including portfolio planning, agency leasing, tenant representation, acquisition, finance, disposition, development management, energybundling on-site services, leveraging resources across multiple accounts, and sustainability services, digital solutions and land advisory services.reducing travel time between sites.
IFM contracts are typically structured to include reimbursement for costs of client-dedicated personnel and third-party vendors and subcontractors in addition to a base fee and a performance bonus. Performance bonus compensation resultsperformance-based fees. Performance-based fees result from achievement ofachieving quantitative performance measures and regularly scheduledand/or target scores on recurring client satisfaction surveys. IFM agreements are typically three to seven years in duration, although most contracts can be terminated at will by the client upon a short notice period, usually 30 to 60 days, as is typical in the industry.
In the U.S., the UK and selected other countries, we provide Mobile Engineeringservices to clients with large portfolios of sites or where we have multiple clients in proximity to each other. Rather than using multiple vendors to perform facility services, clients hire us to provide HVAC, electrical and plumbing services, and general interior repair and maintenance. Our multi-disciplined mobile engineers serve numerous clients in a specified geographic area, performing multiple tasks in a single visit and are responsible for the operational success of the sites they service. This service delivery model reduces clients' operating costs by bundling on-site services, leveraging resources across multiple accounts, and reducing travel time between sites.
4. Project & Development Services
Project & Development Services provides consulting, design, management and build services to tenants of leased space, owners in self-occupied buildings and owners of real estate investments, leveraging technology to drive outstanding service delivery. In addition to strategic occupancy planning services, weWe bring a life-cycle"life cycle" perspective to our clients, from consulting and capital management through design, construction and move in. Project & Development Services also manages all aspects of development and renovation of commercial projects for our clients, in some cases serving as a general contractor.occupancy. In addition, we provide these services to public-sector clients, particularly to military and government entities, as well as educational institutions, primarily in the U.S. and to a growing extent in other countries. Predominantly in Europe, we provide design, fit-out and refurbishment services on a principal basis under the Tétris brand.
Our Project & Development Services business is generally compensated on the basis of negotiated fees andas well as reimbursement of costs when we are principal to a contract (or client). Individual projects are generally completed in less than one year, but client contracts may extend multiple years in duration and govern a number of discrete projects.
5. Advisory, Consulting and Other
Advisory and Consultingdelivers innovative, results-driven real estate solutions that align with client business objectives. We provide provides clients with specialized, value-added real estate consulting services in such areas as technology implementation and optimization, mergers and acquisitions advisory, asset management, occupier portfolio strategy, workplace solutions, location advisory, industry research, financial optimization strategies, organizational strategy and Six Sigma process solutions. Our professionals focus on translating global best practices into local real estate solutions, creating optimal financial and operational results for our clients across asset classes.
We typically negotiate compensation for Advisory and Consulting based on developed work plans that vary based on the scope and complexity of projects.
Valuation helpsAdvisory delivers customized solutions to enable clients determine market valuesto take the fastest, best informed decisions for their investment interests throughout the life cycle. The services include valuation, secured lending advisory, transaction support, data & analytics, development advisory, asset and infrastructure advisory, business valuation, property tax advisory, restructuring and complex litigation. We are a sector-based organization and have strong expertise in retail, alternatives & special use, infrastructure, public sector, office, retail,residential, hotels & hospitality, agribusiness, healthcare, senior living, and industrial mixed-use and other types of properties. These services may involve valuing a single property or a global portfolio of multiple property types. We conduct valuations, which typically involve commercial property, for a variety of purposes supporting our clients, including acquisitions, dispositions, debt and equity financings, mergers and acquisitions, securities offerings (including initial public offerings) and privatization initiatives. Clients include occupiers, investors and financing sources from the public and private sectors. logistics.
We usually negotiate compensation for valuationValuation Advisory services based on the scale and complexity of each assignment, and our fees typically relate in part to the value of the underlying assets.
Energy and Sustainability Services tohelp occupiers and investors realize the positive impact of sustainability on their brand, workforce, financial statements and the environment. Like JLL, our clients are increasingly recognizing that there are both potential risks and opportunities associated with addressing the impacts of climate change, and are turning to help them developpartners like us for guidance and enhance corporateassistance. Our accredited energy and sustainability strategies, address climate risk, green their real estate portfolios, reduce theirspecialists worldwide assist clients with technologies and strategic solutions to deliver measurable improvements that yield clear environmental and societal benefits, as well as operational and cost efficiencies. This includes managing energy consumption and carbon footprint upgradethrough sustainable construction and operations; providing green building performance by managing Leadership in Energyassessments; leading green retrofits/upgrades; advising on occupier experience and Environmental Design ("LEED") construction or retrofits, provide sustainable building operations management,engagement, advising on socio-economic impacts and preparesite locations; and creating corporate social responsibility and sustainability reports. We have energyThe breadth of our sustainability expertise positions us as the best choice to partner with clients, regardless of their focus, from leasing to capital markets transactions, and sustainability accredited professionals worldwide. Our teams can benefit a wide range of clients, including Leasing clients who commission green leases, green interior design and green assessments of prospective buildings; Capital Markets and Investment Management clients who want green building valuation assessments; and Project & Development Services clients who request green retrofitsprojects to existing buildings. facility management.
Refer to our latest Global Sustainability Report, available on jll.com,our website, for metrics on documented energy savings, reduction in greenhouse gas emissions and the work of our sustainability teams.
We generally negotiatehave a variety of compensation models for Energy and Sustainability Services for each assignmentincluding those based on shared savings oras well as a fee for service, depending on the scale and complexity of the project.
Corporate SolutionsTechnology Services help organizations transform the way they acquire, operate, manage, and experience space. We offer multiple cloud-based software solutions that generate value for occupiers and investors by improving the quality of decision-making through improved data and analytics, delivering unique insights, and improving net operating income. For example, Building Engines serves as a comprehensive, easy-to-use system that unites all the technology and applications used to run buildings in one place, streamlining work orders, making maintenance more efficient, and simplifying interactions between building tenants, management and staff. Hankuses machine learning and AI to optimize building energy efficiency, air quality, maintenance costs, and tenant comfort, which ultimately delivers opportunities to reduce operating costs while accelerating the achievement of buildings’ sustainability goals. Corrigo enables facilities managers to easily manage work orders, centralizing repair, maintenance, and analytics as well as automating tasks.JLL Marketplace provides more transparency and efficiency to increase the flow of capital and improve quality of services delivered.
Work Dynamics
As a strategic partner of clients with a global footprint, Work Dynamics offers a single and cohesive team to clients in order to bring together services across our RES service lines, including partnering with other JLL professionals to help clients execute leasing and capital markets transactions. Our global delivery platform enables consistent outcomes on both a local and global scale, and places us in a small cohort of competitors who can deliver on clients’ multi-service, multi-geography needs.
Rapid and complex change, including digitization, increasing regulation, globalization and evolving workforce demographics, have created a newtransformed the world of workwork. Organizations are realizing the potential for workplaces and as a result, a new mandate for corporate real estate with significant opportunities for growth. Our global Corporate Solutions business is positioned to capture this growth by partnering with clients across industries to drive strategic value from their corporate real estate portfolios to help address broader business objectives, such as talent attraction, customer experience, employee well-being and people. During 2018, ourproductivity, financial performance and environmental sustainability (See Growth of Corporate Solutions business continuedOutsourcing in the Industry Trends section below). As clients buy with an increasingly global and/or multi-service mindset, they are looking to expand its client base as follows:
|
| | | | | | |
| FY 2018 JLL Client Wins |
| Total Wins | | New Business | | Expansions | | Renewals |
| 275 | 145 | 78 | 52 |
While each client is unique, they are consistent in looking for real estate to enable business transformation around three key value levers.
Enablinglevers: (1) making informed, data-driven decisions
Achieving and digital transformation, (2) achieving operational excellence through improved productivity and financial performance,
Attracting and (3) attracting and retaining key talent through an enhanced corporate real estate user experienceexperience.
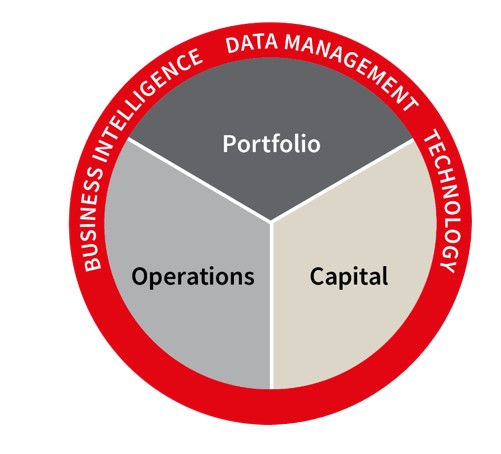
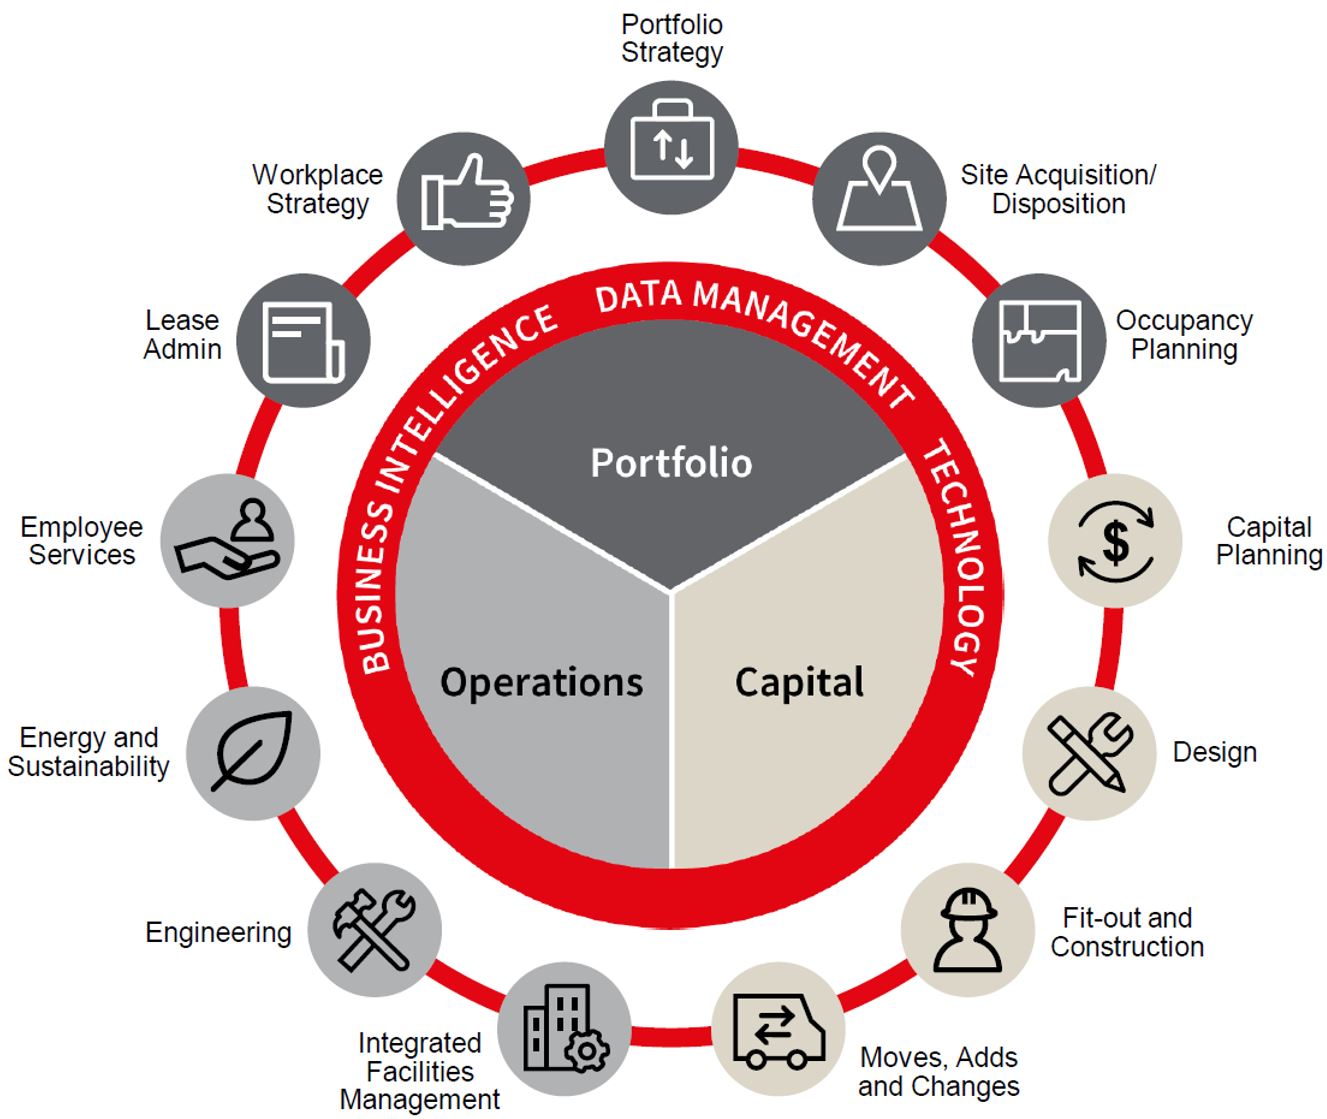
Our comprehensive global service delivery platform is designed to achieve these outcomes through a diverse range of strategy, services and digital solutions that address clients’ entire real estate life cycle on both a local and global scale. We consider the real estate life cycle to include: portfolio, capital and operations decisions.
Portfolio. Through the nexus of services our Corporate Solutions business provides to clients, we gain unique information about their corporate real estate footprints and the organizational strategies they have developed to succeed. Combining this with the expertise we can draw from our broader integrated global platform, we advise our clients about how to optimize their workplace strategies and occupancy planning efforts. More broadly, this advice may extend to our clients’ portfolio strategies. When evolution of strategies dictates change, our Corporate Solutions business partners with other professionals throughout our organization to help clients execute leasing, acquisition and disposition strategies.
Capital. Our Corporate Solutions business advises clients across the world about how and when to make critical capital decisions regarding their workplaces and corporate real estate portfolios to maximize the returns on such investments. In many geographies, our design & build professionals work alongside clients to capture the vision of their organizations through the design of space they occupy. We then manage, and in some cases are responsible for, the successful completion of the fit-out activities to achieve their vision. Helping our clients manage the costs they incur to realize their space and location objectives is essential to that strategy. When capital decisions involve a change in location, our relocation management professionals facilitate smooth transitions.
Operations. IFM is our largest service offering within Corporate Solutions and includes management of integrated services that improve operations and performance of individual facilities, as well as the experience of employees and other end-users of the space. Most frequently, new Corporate Solutions client relationships are formed through IFM business wins, which we accomplish both through transitions from other service providers or conversions from in-sourced real estate management models. In addition to maximizing efficiency and quality of service delivery, our digitally-enabled platform also provides clients with opportunities to tailor the balance of services we provide versus what they self-perform.
In an era of rapid digital evolution, technology is core to the advancement of our Corporate Solutions business in all facets. This is enabled by a best-in-class approach to technology and data management that centers around a structured product management discipline, a holistic build-buy-partner strategy and investments in world-class technology talent. Corporate Solutions brings a unique, comprehensive offering that covers all client technology needs, from consulting and foundational data management and Smart Buildings, to RED(sm) - our proprietary analytics and BI platform - that delivers actionable insights. Through Digital Solutions, which we have grown primarily through strategic acquisitions, our professionals assist clients in their selection and implementation of real estate-related software and applications to better help them understand their portfolios and drive efficiencies. We are committed to innovation to advance our Corporate Solutions business as the digital evolution continues. | | | | | |
| Our offering addresses the entire life cycle, which we consider to include portfolio, capital and operations functions. |
Portfolio. Through the nexus of services our Work Dynamics business provides to clients, we gain deep knowledge and extensive data about their corporate real estate footprints, business strategies and organizational priorities. Combining this with the expertise we draw from JLL's integrated global platform, we advise clients on how to optimize their workplace strategies and occupancy planning efforts to improve utilization and ultimately enhance the productivity and well-being of those who use the space. More broadly, this advice may extend to our clients’ portfolio strategies, including location advisory, technology implementation and optimization, and options to add and integrate flexible space solutions. When evolution of strategies dictates change, our Work Dynamics business partners work with other professionals throughout our organization to help clients execute leasing, acquisition and disposition strategies. | |
Capital. Viewing workplaces as living environments that can help individuals, organizations and communities innovate and thrive, Work Dynamics advises clients about how and when to make critical capital decisions to maximize the human and financial returns on portfolio investments. Our design and build professionals work alongside clients to capture and advance their organization’s brand identity, purpose and sustainability commitments through the design of space they occupy, including owned, leased, static and flexible environments. We then manage, and in some cases are responsible for, the successful completion of the fit-out activities to achieve their vision. Helping our clients manage the costs they incur to realize their space and location objectives is essential to that strategy. When capital decisions involve a change in location, our relocation management professionals facilitate smooth transitions. |
Operations. IFM is our largest Work Dynamics service offering. Composed of integrated, digitally-enabled and flexible services that blend human, digital and experiential elements, this offering helps clients drive enhanced value from their facilities by improving operational performance and the experience of employees and other users of the space. Most frequently, new client relationships are formed through IFM business wins, which we accomplish through transitions from other service providers or conversions from insourced real estate management models. In addition to maximizing efficiency and quality of service delivery, our digitally-enabled platform also provides clients with opportunities to tailor the balance of services we provide versus what they self-perform. |
Business Intelligence, Data Management and Technology. Data and technology are core to all clients’ workplace and business transformation agendas. Our comprehensive data and technology platform underpins all of our offerings, helping clients make fast, informed decisions that enhance the performance of their workplaces, portfolios and people. Experts in our JLLT group guide clients’ selection, implementation and management of real estate-related software and applications. The Corrigo ecosystem opens new client segments by revolutionizing end-to-end facility repair and maintenance service delivery, and helping clients find the best service providers. |
LaSalle
Complementing our real estate services capabilities, our global real estate investment management business, LaSalle, has three priorities:
Deliver superior risk-adjusted investment returns to our clients
Develop and execute investment strategies that meet the specific investment objectives of our clients
Deliver uniformly high levels of client service globally
We areis one of the world's largest managers of institutional and individual capital invested in real estate assets and securities, providing investment management services to institutional and retail investors, including high-net-worth individuals.securities. We seek to establish and maintain relationships of trust with sophisticated investors who value our global platform and extensive local market knowledge. Our three strategic priorities:
•Deliver superior risk-adjusted investment returns to our clients
•Develop and execute investment strategies that meet the specific investment objectives of our clients
•Deliver uniformly high levels of client service globally
LaSalle provides clients with a broad range of real estate investment products and services in the private and public capital markets. We design these products and services to meet the differing strategic, asset allocation, risk/return and liquidity requirements of our clients. The range of investment solutions includes private and public equity investments in multiple real estate property types, including traditional sectors such as office, retail, industrial, health care and multifamily residential, as well as investmentsemerging or specialized sectors such as healthcare, life sciences, self-storage and data centers. We also have established commercial debt investment vehicles in debt.Europe and North America that diversify our capital stack exposure. We act either through commingled investment funds or single client account relationships ("separate accounts"). We also offer global indirect public investments, primarily in private equity funds, joint ventures and co-investments, as well as publicly traded real estate investment trusts ("REITs") and other real estate equities.
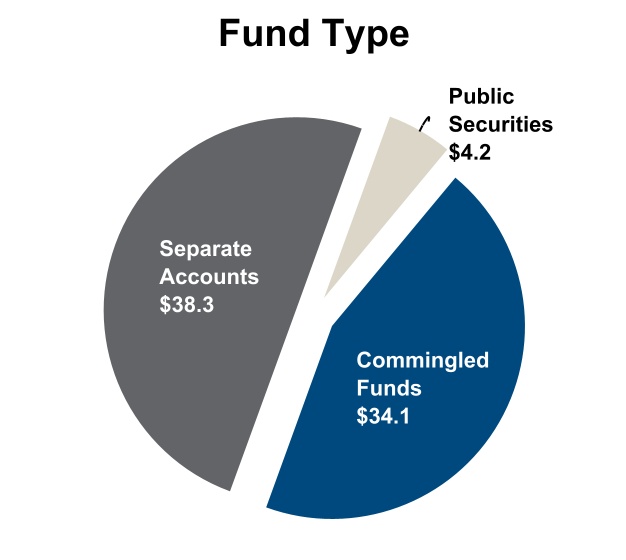
LaSalle's Where consistent with client requirements and market terms and conditions, LaSalle retains JLL to provide services to assets under managementin LaSalle funds in the ordinary course of $60.5 billion, as of December 31, 2018, by geographic distribution and fund type were as follows ($ in billions):
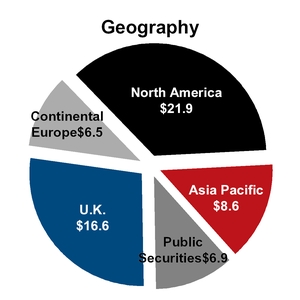
We believe LaSalle's success is the product of our strong investment performance, industry-leading research capabilities, experienced investment professionals, innovative investment strategies, global presence and coordinated platform, local market knowledge and strongsteadfast client focus. Research and strategy are integrated throughout
LaSalle launched its first institutional investment fund in 1979, making us one of the most experienced real estate focused investment management process, from portfolio strategy formulation and property acquisition, through ongoing asset management and disposition.
The investment and capital origination activities of our investment management business have become increasingly global.managers in the industry. We have invested, on behalf of clients, in direct real estate assets in 2028 countries around the globe, as well as in public real estate companies traded on all major stock exchanges.
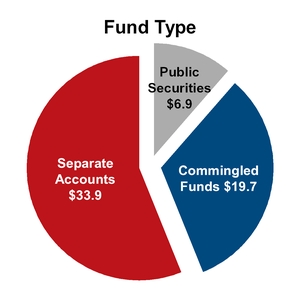
Where consistent with client requirements LaSalle's assets under management ("AUM") of $76.6 billion, as of December 31, 2021, by geographic distribution and market terms and conditions, LaSalle from time to time retains JLL to provide services to assets in LaSalle fundsfund type is detailed in the ordinary course of business.following graphics ($ in billions).
Direct Investments in Real Estate Properties (Separate Accounts and Commingled Funds)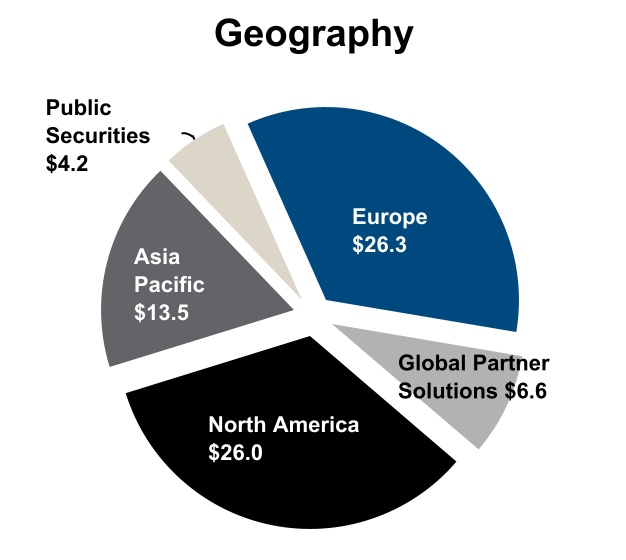
In serving our investment management clients, LaSalle is responsible for the acquisition, financing, leasing, management and divestiture of real estate investments across a broad range of real estate property types. LaSalle launched its first institutional investment fund in 1979 and currently has a series of commingled investment funds, including seven funds that invest in assets in the Americas, seven funds that invest in assets located in Europe, and five funds that invest in assets in Asia Pacific. LaSalle also maintains separate account relationships with investors for whom we manage private real estate investments.
LaSalle is the advisor to Jones Lang LaSalle Income Property Trust, Inc. ("JLL IPT"), a daily valued, non-listed U.S. real estate investment trust launched in 2012 that gives suitable individual investors access to a growing portfolio of diversified commercial real estate investments. As of December 31, 2018, JLL IPT had $2.6 billion in assets under management.
Some investors prefer to partner with investment managers who are willing to co-invest their own funds to more closely align the interests of the investor and the investment manager. We believe that our ability to co-invest alongside our clients' funds will continue to be an important factor in maintaining and continually improving our competitive position. We believe our co-investment strategy strengthens our ability to raise capital for new real estate investments and real estate funds. In addition, co-investment may bring the opportunity to provide additional services related to the acquisition, financing, property management, leasing and disposition of such investments. As of December 31, 2018,2021, we had a total of $306$354.6 million of co-investments, alongside our clients, in real estate ventures included in LaSalle's total assets under management.
AUM.
LaSalle is generally compensated for investment management services for private equity investments based on capital committed, invested and managed (advisory fees), with additional fees (incentive fees) tied to investment performance above benchmark levels.specific hurdles. In some cases, LaSalle also receives fees tied to acquisitions, financings and dispositions. dispositions (transaction fees). Separate account advisory agreements generally have specific terms with "at will" termination provisions, and include fee arrangements linked to the market value of the AUM, plus incentive fees in some cases.
Our investment funds have various life spans, typically ranging between five and nine years, but in some cases they are open-ended. Separate account advisory agreements generally have specific terms with "at will" termination provisions,open ended. In 2021, our open-ended funds grew nearly 20% and include fee arrangements that are linkedrepresented approximately 30% AUM as of December 31, 2021.
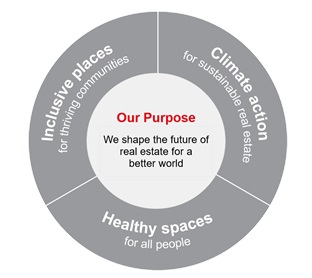
ORGANIZATIONAL PURPOSE
JLL’s organizational purpose is to shape the market value of the assets under management, plus incentive fees in some cases.
Investments in Public Securities
LaSalle also offers clients the ability to invest in separate accounts focused on public real estate securities. We invest the capital of these clients principally in publicly traded securitiesfuture of real estate investment trustsfor a better world. Staying true to this purpose in all that we do enables us to fully align with the best interests and property companies. Asambitions of December 31, 2018, LaSalle had approximately $6.9 billionour clients and all our stakeholders. It exemplifies our commitment to the highest standards of assets under managementenvironmental, social and corporate governance ("ESG"), and to a more sustainable, diverse and inclusive future.
| | |
| We shape the future of real estate for a better world |
This core organizational purpose is fully aligned with, and supported by, our corporate values of teamwork, ethics and excellence. Ultimate responsibility for promoting awareness and ensuring adherence to our values and purpose across the enterprise is held by the JLL Global Executive Board ("GEB") and is endorsed by our Board of Directors. Our purpose guides our strategic growth vision and informs our response to the macro trends prevalent in these types of investments. LaSalle is typically compensated by securities investment clients on the basis of the market value of assets under management.real estate industry. These trends and our strategic framework are summarized below.
INDUSTRY TRENDS
We are focusedInforming our long-term growth strategy, we have identified five macro trends we see as major guiding influences on four major macroeconomic trends affectingthe continued growth and evolution of the real estate sector today, each with an estimatedsector. Each of these trends has a multi-year lifespan:lifespan, and while the COVID-19 pandemic (the "pandemic") has slowed some and accelerated others, we expect all five trends to maintain their long-term trajectory and relevance in the post-pandemic era. These macro trends are:
Rising investment allocations and globalization of capital flows to real estate
Once categorized as alternative investments,During the past decade, real estate has emerged over the past decade asgrown out of its previous 'alternative investment' classification to become a major defined asset class of its own, withattracting a sustained long-term trend of attracting rising investment allocations. InvestorsWhile the initial impacts of the pandemic slowed all transactional markets during 2020, this trend strongly reasserted in 2021. As we move into the post-pandemic economy, pension companies and other institutional investors and capital sources continue to allocate significant portions of their investment capitalbe drawn to real estate. Supporting that,estate's attractive returns and distinctive investment characteristics.
Complementing this, we see parallellong-term sustained growth trajectories instrong transaction volumes and inincreasing capital flows across borders and between continents, creating new opportunities for advisors and investment managers equipped to source and facilitate international real estatethese capital flows and execute cross-border transactions. Our real estate investment expertise, linking seamlessly across the world's major markets, is ideally placed to support our clients' investment ambitions.
As noted above in the LaSalle section, many investors have shown a desire to commit their capital to investment managers willing to co-invest their own capital in specific real estate investments or real estate funds.
Growth in corporate outsourcing
AsWhile corporate outsourcing of real estate services still represents a relatively small proportion of the total commercial-built real estate worldwide, corporatethe steady long-term trend towards outsourcing of real estate serviceswhich began in the early 1990s, originally with U.S.-based corporations, is still atnow a relatively early stage, but it is a trend that continues to move steadily upward as more businesses look to drive efficiency and returns by partnering with dedicated real estate service providers. In recent years, outsourcing of professional real estate services has increased substantially, as corporations focusglobal trend. By focusing their own resources on core competencies. Although some continuecompetencies and partnering with dedicated service providers like JLL to unbundle and separate the sources of theirmanage real estate services, medium-to-large usersstrategy and activities, organizations are better positioned to advance their goals of commercial real estate services continuefinancial and operational performance, talent attraction, customer experience, employee productivity and environmental sustainability.
In corporate boardrooms around the world, the pandemic has significantly enhanced the growing focus on reimagining workplaces and concepts for the future of work. These are areas in which JLL holds deep expertise and sector-leading specialist experience and resources. Across different industries we are positioned to demonstrate an overall preference for working with single-source service providers able to operate seamlessly from a local to global level. The ability to offer a full range of services on this scale requires significant infrastructure investment, including digital applicationsprovide highly adaptive and personnel training. Smaller regionalrelevant solutions that promote organizational culture and local real estate service firms, with limited resources, are less able to make such investments. In addition, public and other non-corporate users of real estate, including government agencies andprioritize health and educational institutions, have begunwell-being, flexible working models and technology enablement. In the post-pandemic era, we predict further growth in the strong and sustained trend for organizations to outsource real estate activities as a meansservices while increasingly seeking strategic advice on reimagining their workspaces and workstyles to reinforce culture, attract talent and drive performance.
Urbanization
While the world of urban living and working was thrown into flux by the initial onset of the pandemic, we believe thereits foundations are deep and secure, and a dynamic future is already taking discernible shape. With the successful rollout of vaccination programs, the concentrations of culture, diversity, opportunity, facilities and creative expression in the world’s major cities will continue to attract strong inflows of ambitious and aspirational people. In the post-pandemic era, cities will again thrive, characterized by vibrant and reimagined office, cultural, retail and residential profiles.
Growth in major urban populations around the world will continue to be significant growth opportunitiesa prevalent trend, and with it comes increasing demand for companies like ours that can provide integratedall forms of real estate services across many geographicand advice. JLL has a well-established global research series - the City Momentum Index - exploring this and associated trends in more depth, including related dynamics in the way the world’s 130 emerging and established markets are growing, adapting and types of clients.evolving.
Many such clients are striving to control costs by outsourcing or off-shoring non-core business activities. Both trends have increased the demand for global real estate services, including facility management, tenant representation and leasing, and property and energy management services. We believe that these trends will favor real estate service providers with the capability to provide services - and at consistently high service levels - in multiple markets around the world. Our diverse outsourcing services, shown below, address clients' needs across the real estate life cycle.
Urbanization
Growing urbanization continues to be a powerful global trend. In its May 2018 report, the United Nations Department of Economic & Social Affairs predicted that 68% of the global population will live in urban areas by 2050, up from 55% as of the publication date (with total global population growth of just over 1% per year). More specifically, the international hub cities where we and our clients do a substantial majority of our business are thriving. This is another sustained trend that successfully overrides national and global political changes and uncertainties.
4thFourth Industrial Revolution
The 4thWorld Economic Forum defines the Fourth Industrial Revolution as the wave of change being driven through advances in technology, data and artificial intelligence. The real estate industry is affected in many ways, a few examples include: (1) the rapidtransition to flexible and hybrid office working models, (2) new data-driven understanding of how all forms of real estate can be more efficient, sustainable and productive, (3) the rise in applications of artificial intelligence ("AI") is changing everything. However,experiential and online retail, (4) new asset management technologies, and (5) the growth of the logistics sector.
While there is currently no single technology disruptor positioned to dominate the real estate industry. Instead,industry, there are thousands of start-ups, applications and concepts are vying to transform the marketplace.marketplace, collectively known as proptech. The challenge to innovate and maximize the potentialcurrent and future benefits of new technology, data and AI usesproptech is constant. At the heart of our Beyond strategy (discussed in detail below), supported by major ongoing investments and innovations, we continue to accelerate progress toward our goal of becoming the widely-recognized leading user of technology and data in real estate.
Sustainability
Addressing and managing climate change and the finite nature of global resources are defining issues for our time. According to the International Energy Agency, real estate and the built environment account for nearly 40% of total global direct and indirect CO₂ emissions. At the same time, stakeholders are demanding greater focus on ESG from businesses and organizations in all areas of society. These and other factors, including heightened awareness of the importance of promoting health and well-being, coalesce into strong rising demand for sustainability services and advice across the real estate industry. JLL has identified meeting this demand as a major growth opportunity and priority, aligning with our purpose to shape the future of real estate for a better world.
Refer to our annual Global Sustainability Report for more detailed research, case studies and information, including JLL's commitment to net-zero carbon operations for our leased offices and updates on progress toward achieving our broader net-zero emissions target, which was certified to the new Net-Zero Standard by the Science Based Target initiative ("SBTi") in 2021.
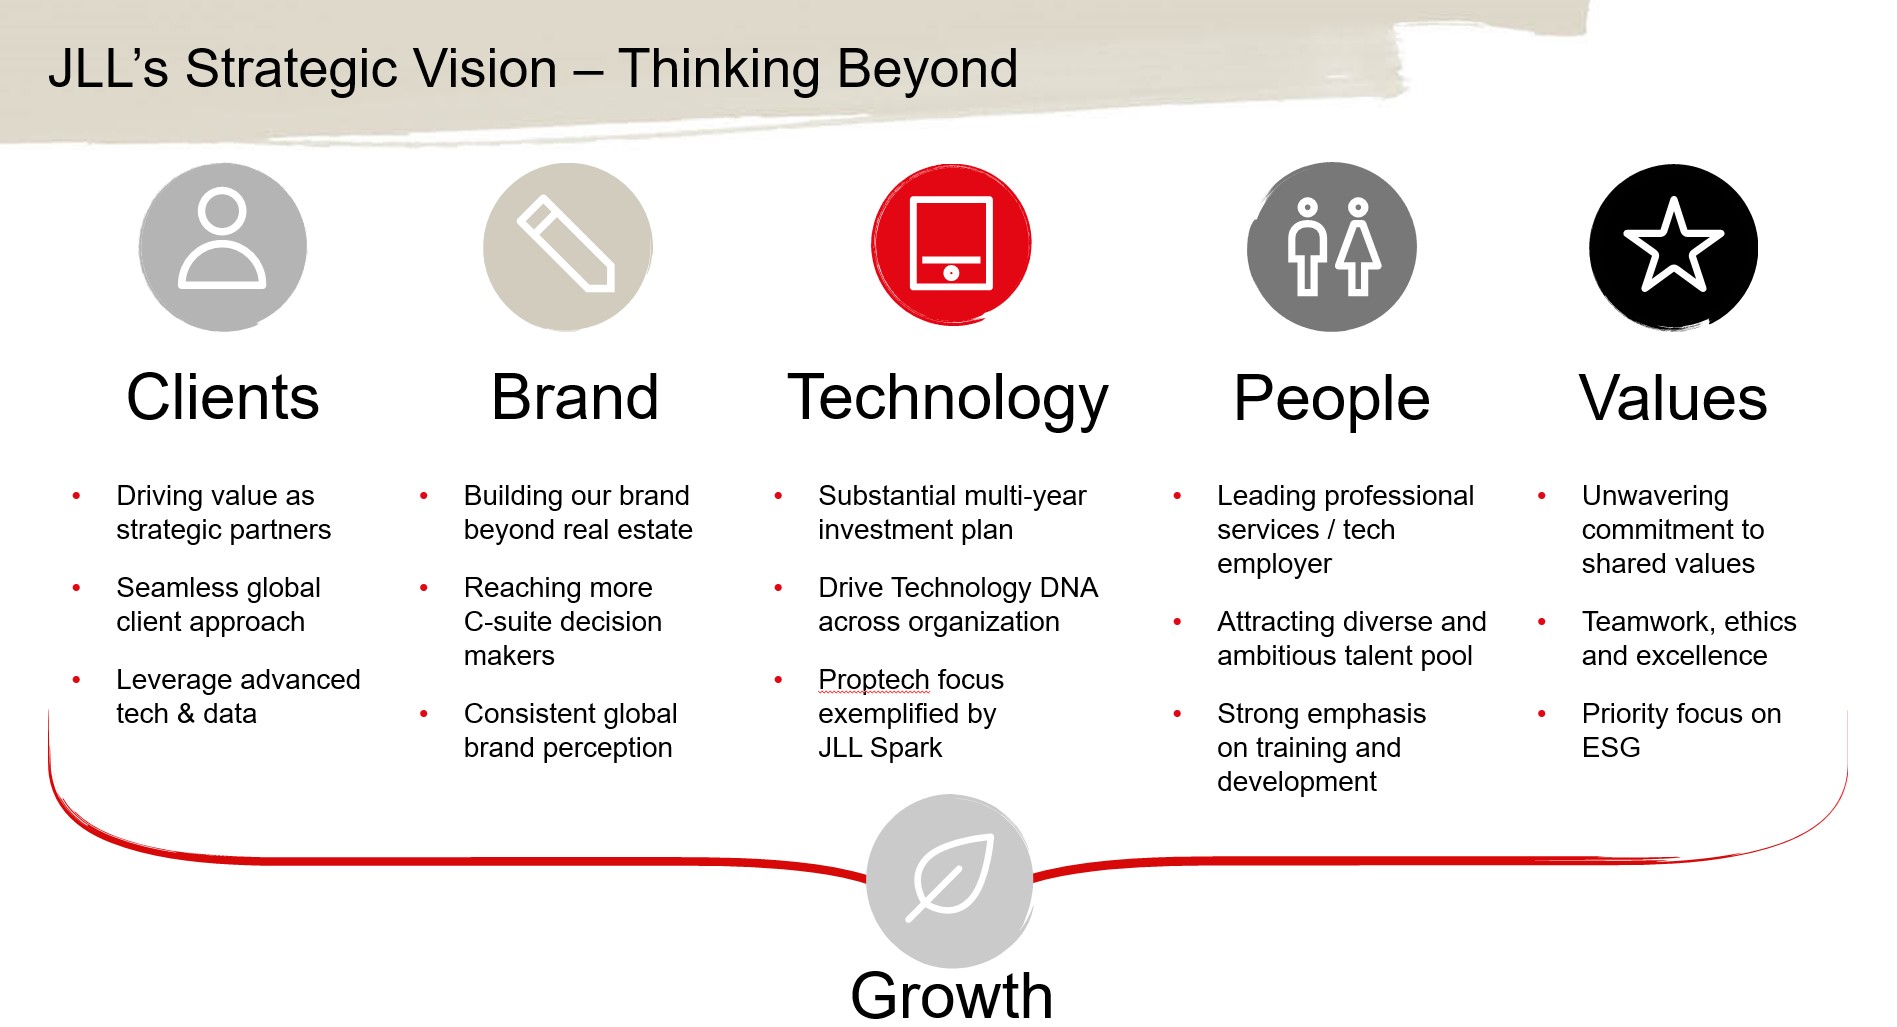
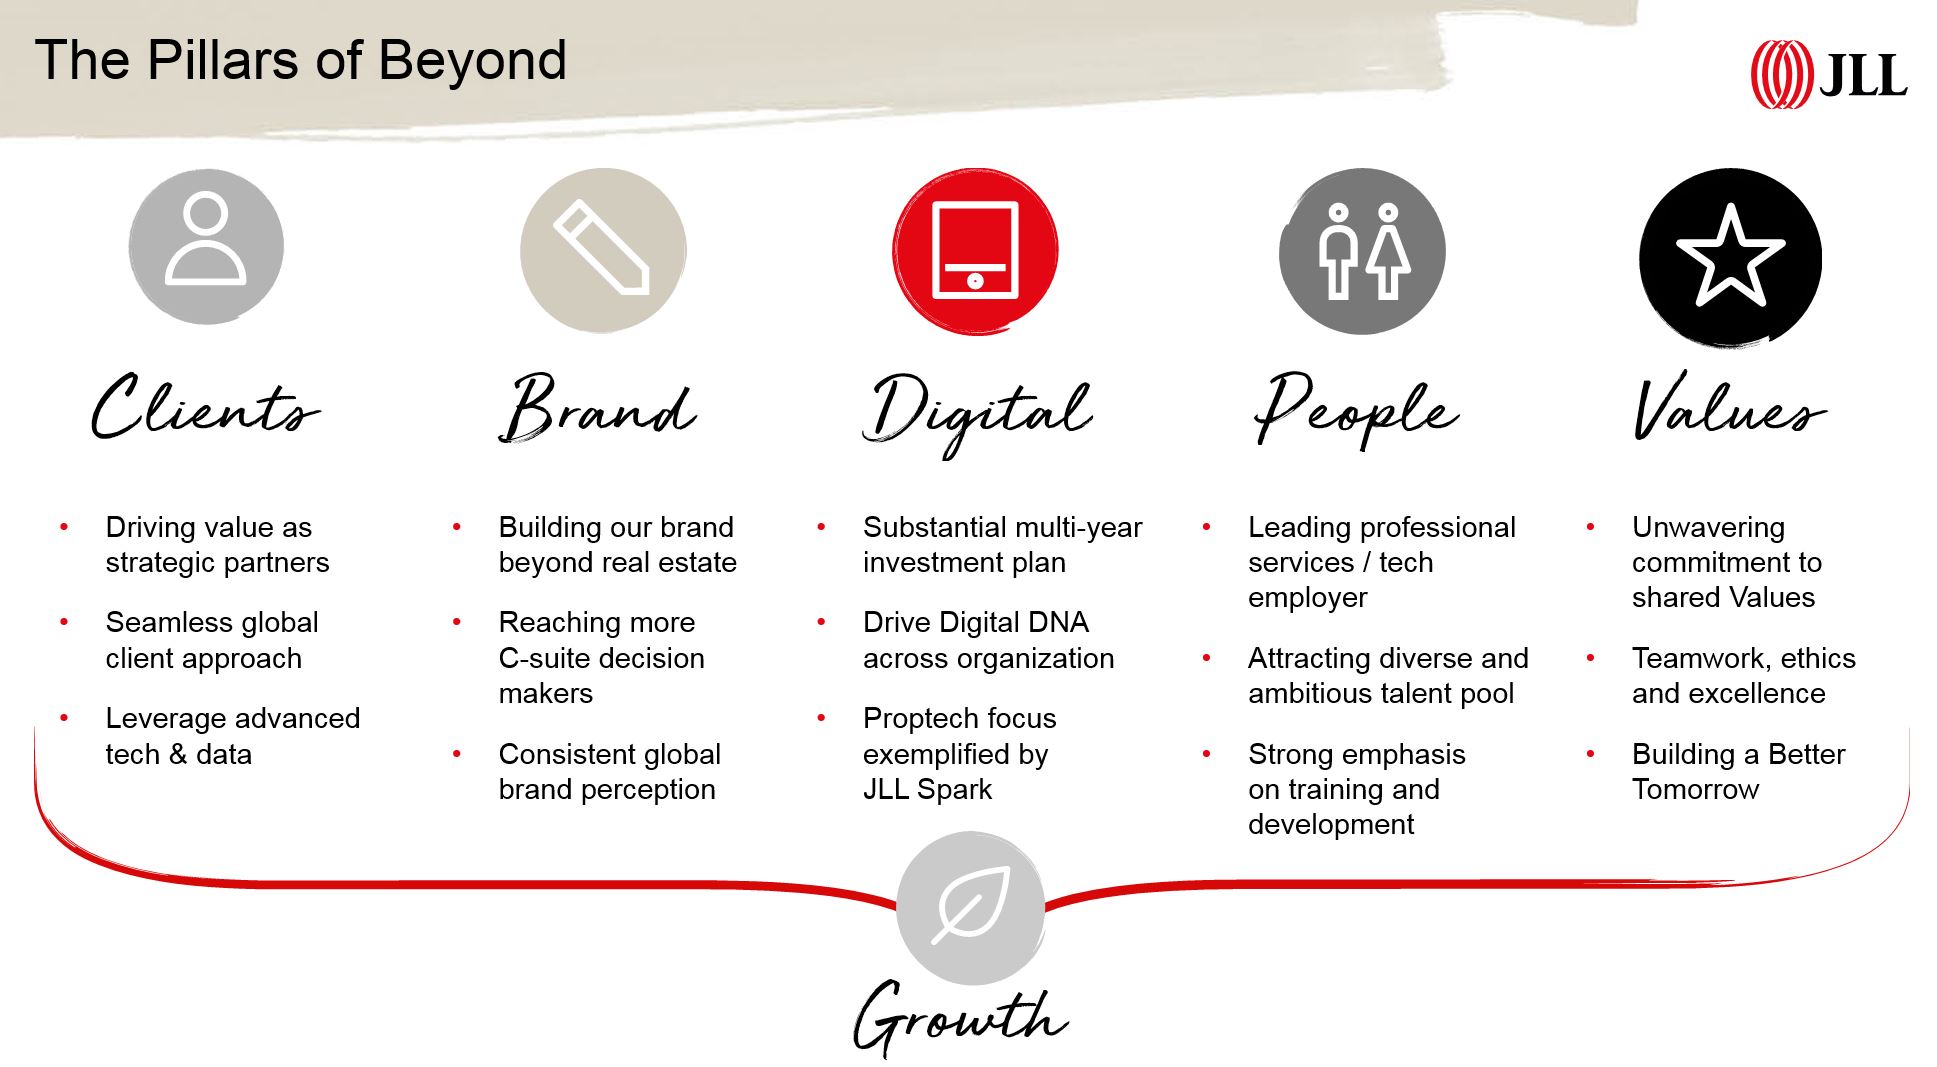
STRATEGIC FRAMEWORK
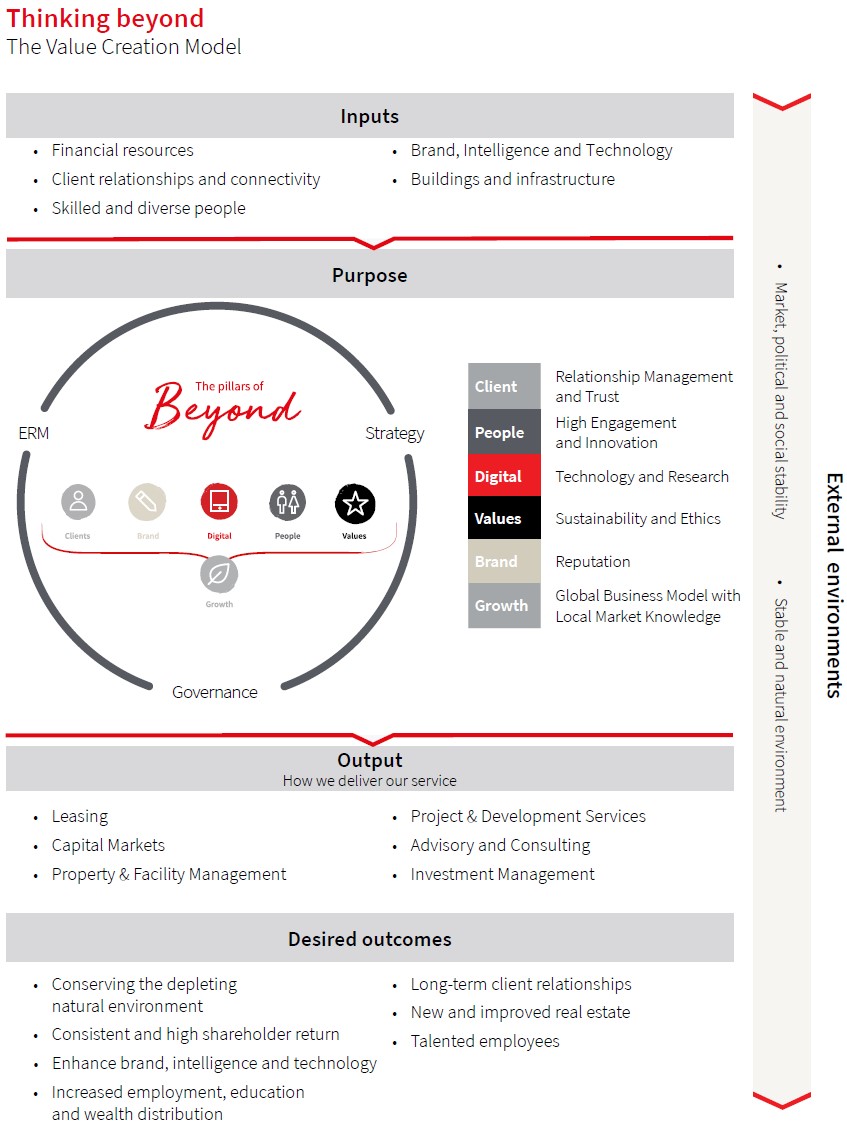
Our GEB has set out the Beyond strategic vision and framework to deliver long-term sustainable and profitable global growth. This framework comprises broad strategic priorities grouped into five pillars – Clients, Brand, Technology, People and Values – which collectively support and drive our ambitious long-term growth trajectory.
Beyond: Our Strategic Vision for Long-Term Sustainable and Profitable Growth
Clients
We successfully completed a multi-year transformation program building fully integrated global organizational structures for all our business lines and functions. As a result, we are now even better positioned to provide seamless and highly consistent services to our clients across the world, as well as smoothly and rapidly deploy innovations, best practice and new technologies.
We continue to enhance our comprehensive service offering to create real value for our clients. Guided by our Beyond strategy, we are making significant ongoing investments in advanced client relationship management processes and tools, ensuring we can quickly assemble the best multidisciplinary teams and expertise tailored to meet each client’s requirements.
Brand
During the height of the pandemic and the subsequent economic recovery, JLL’s status as trusted adviser and partner to our clients has been readily apparent. Clients turned to us for solutions and insights to adapt their real estate strategies and operations to weather unprecedented challenges, and to plan ahead for the post-pandemic world. Our major research-led global focus on reimagining real estate ensured our brand and services were positioned in the vanguard of the industry’s response.
We continue to strengthen and expand awareness of our brand beyond the traditional real estate sector, with a focused goal in our Beyond strategic vision to reach more CEOs and other senior decision makers. Supporting this goal, we are an active strategic partner of the World Economic Forum, member of the World Green Building Council and a founding partner of Bloomberg Green. In November 2021, JLL actively supported the UN climate negotiations and participated in the events surrounding COP26 in Glasgow, UK. Further, in February 2022, Fortune magazine again named JLL as one of the World’s Most Admired Companies (refer to the Distinguishing Attributes and Competitive Differentiators section below for additional awards and recognition during the past year).
Technology
JLL is embracing technology to meet the needs of clients today and anticipate the opportunities of tomorrow. Leading this transformation is core to our growth strategy and reflected in our significant investments. JLLT is a global leader in proptech – expanding and refining our technology capabilities to deliver significant competitive advantage and value for our clients and our company. The group offers multiple cloud-based software solutions that generate value for occupiers and investors by improving the quality of decision-making leveraging data and analytics, delivering unique insights, and reduce operating costs. During 2021, we strengthened our tech capabilities and broadened our offerings by acquiring:
•Skyline, a leading artificial intelligence technology company which uses proprietary machine learning models to gain a competitive advantage in the origination and analysis of real estate opportunities for our producers
•Building Engines, a leading building operations platform
•Hank, a virtual engineering platform focused on sustainability.
Additionally, we continue to be committed to the Spark Global Venture funds, which incubate and drive proptech innovation as well as an increasing array of advanced market-leading technology products and data analytics tools. Visit our website at www.jll.com to see the full portfolio of technology offerings.
Within our own operations, the substantial platform technology investments we made in the early phases of our Beyond journey are benefiting all areas within our enterprise.
People
People are at the heart of our business. We are dedicated to helping our people achieve their ambitions by enabling them to explore new opportunities, build expertise, create long-term careers, and draw inspiration through working with talented colleagues and clients. We are committed to promoting and achieving true diversity and inclusion, as exemplified by the composition of our highly talented and experienced Board of Directors.
Global economic recovery during 2021 has further accelerated the war for talent, resulting in highly fluid and competitive recruitment markets. A successful enterprise-wide coordinated talent strategy is central to our Beyond vision and delivery.This strategy ensures JLL is positioned as an employer of choice for top talent, achieving and sustaining a diverse, inclusive and collaborative culture that strongly appeals to our people and our clients alike.
Values
All of our people are committed to the core values of teamwork, ethics and excellence. These values are the foundation of our organization. Clients, employees, business partners and potential recruits are strongly attracted to these values and to our commitments to strong ESG, including ambitious goals and regular transparent reporting.
In September 2020, we signed the World Green Building Council’s Net Zero Carbon Buildings Commitment, pledging to achieve net zero carbon emissions from JLL-occupied buildings by 2030. Building on this pledge, in October 2021, the SBTi certified our commitment to reach net zero greenhouse gas emissions across our value chain by 2040. This places JLL among a select group of global companies to be recognized for aligning its net zero commitments with climate science. Within this overall target, JLL has committed to:
1.A near-term target to reduce absolute scope 1, 2 and 3 emissions by 51% by 2030 from a 2018 base year
2.A long-term target to reduce absolute scope 1, 2 and 3 emissions by 95% by 2040 from a 2018 base year
We have earned repeated recognition from organizations such as the Ethisphere Institute, which has named JLL as one of the World’s Most Ethical Companies every year since 2008.
In addition, during the fourth quarter of 2021, JLL collaborated with the World Economic Forum in establishing 10 Green Building Principles to guide real estate investors and corporate occupiers on implementing and achieving their net zero targets across their portfolios.
Growth
Our Beyond priorities for Clients, Brand, Technology, People and Values combine to provide an integrated strategic vision and platform for growth. This vision is supported by our commitment to enhance productivity, optimize sustainable and profitable long-term growth, and create value for all of our stakeholders. It embraces our opportunity to play a leading role in understanding and guiding the future of work, workplaces and cities, while enabling clients and communities to deliver on their sustainability targets and ambitions.It recognizes and leverages the vital part continuing innovations in data and technology will play, ensuring JLL has the products and data-driven insights to lead this wave of change.
Our growth strategy and strategic vision places a central focus on diversity and inclusion, ensuring we attract and retain a truly diverse, inclusive and talented global workforce, committed to inspiring each other and delivering outstanding results for our clients.
All of which is infused through our closely integrated global platform and vibrant business culture, combining deep local market knowledge with seamless advice and services tailored to each client’s specific needs.
SUSTAINING OUR ENTERPRISE: A BUSINESS MODEL THAT COMBINES DIFFERENT CAPITAL TO CREATE STAKEHOLDER VALUE
OurAs referenced above, the built environment is estimated to account for over one-third of global sustainability commitment - Building A Better Tomorrow
Our vision is to makefinal energy consumption and nearly 40% of total direct and indirect CO2 emissions, meaning JLL can have a world-leading, sustainable professional services firm by creating spaces, buildings and cities where everyone can thrive. The world’s financial, social and environmental challenges demand a bolder response from businesses aroundsignificant impact through the globe. This is whywork we are committed to new ways of partneringdo with our stakeholders to achieve shared ambitions for a sustainable future.
From serving our clients and engaging our people, to respecting natural resourcesas well as in our workplaces and building community relationships, we are focusedcommunities. | | | | | |
| Our Global Sustainability Program | |
Our organizational purpose - we shape the future of real estate for a better world - has deep roots in our identity and history and is the guiding principle informing our sustainability program. In 2021, we initiated a comprehensive review of our sustainability approach, soliciting input from a variety of internal and external stakeholders. The result was an updated program that is purpose-driven, issues-based and impact-assessed. We bring our purpose to life by collaborating with our stakeholders on three core issue areas where we can deliver the greatest impact: (1) climate action for sustainable real estate, (2) healthy spaces for all people and (3) inclusive places for thriving communities. In addition, we have adopted a new governance structure which underpins the delivery of the program and is aligned to the global structure of our business. This will move us closer to fully embedding sustainability into the way we operate and supporting our long-term strategic vision, Beyond. |
To ensure that JLL’s sustainability strategy and targets home in on what is good forthe key impacts of our business and what matters most to our stakeholders, we engage in a regular assessment of our material issues. In 2020, in large part due to the pandemic, we conducted a deep dive materiality review. Through our process of market evaluation and direct stakeholder input, we identified the top five current environmental and social issues, which are detailed below.
| | | | | | | | | | | |
| Environmental Issues | Social Issues |
| 1. | Energy and climate | 1. | Diversity, Equity and Inclusion |
| 2. | Sustainable buildings | 2. | Corporate culture & reputation |
| 3. | Adaptation and resilience | 3. | Ethics and compliance |
| 4. | Healthy buildings | 4. | Innovation and technology |
| 5. | Responsible supply chain | 5. | Employee well-being |
These results will continue to inform our evaluation of additional opportunities for impact beyond our already ambitious net zero commitments. All targets will be covered in detail in the next annual Global Sustainability Report, due for publication in the second quarter of 2022 at which time it will be available on our website.
Generating sustainable value for our clients. Through industry-leading strategies, tools and technologies, we help our clients achieve their sustainability goals. Increasingly, our clients require innovative and consistent sustainability solutions across all regions in which they operate. In response to this demand, we have expanded our focus on energy and sustainability capabilities with the intent of providing a broader complement of globally scalable, consistent and profitable services.
We have a designated team of energy and sustainability product management professionals, who are responsible for developing industry-leading energy and sustainability products that create differentiated value for our clients, deliver accelerated revenue growth and margin expansion to JLL, and help us shape the future of real estate for a sustainable future.better world. This progressive approach increasesgroup, working in conjunction with our business lines, geographical leaders and operations teams, works collaboratively to develop and enhance our client offerings and is responsible for scaling up our services in the sustainability space, driving global consistency and best practices and bringing forward new offerings ahead of future client needs.
Our expertise addresses the entire life cycle of a building - from its design and planning, through construction, occupation, management, refurbishment and sale. Our professionals offer advice on how sustainability considerations can be embedded at each of these stages to maximize value for all our stakeholdersclients. Our Property & Facility Management professionals, for example, embed sustainability criteria into our supply chain via contractor selection and leadsthe monitoring of sustainability performance against key performance indicators. We also support our clients’ data management and reporting requirements whether it be for frameworks such as 'GRESB', 'WELL' and 'LEED' or waste, water and utility information.
Our commitment to responsible investment decisionstechnological innovation extends to our sustainability service offering for our clients. We utilize a number of technology platforms, both in-house and externally sourced, to help deliver our clients’ sustainability objectives. Our OneView Energy and Sustainability Analytics (OVESA) platform is used to manage the ever-increasing volumes of complex sustainability data on behalf of our clients. This system, along with our other platforms such as well as healthier, saferthe Portfolio Energy and more engaged people. We are Building a Better Tomorrow everywhereEnvironment Reporting System (PEERS) and the Energy and Sustainability Platform (ESP), reflects our commitment to investing in technology, data and information management platforms. By deploying flexible technology solutions, we can.were able to measure, manage and improve environmental impacts for thousands of buildings included on these platforms in 2021. In 2022, JLL will see further investments to simplify, streamline and enhance our tech capabilities.
Creating sustainable value for all our stakeholders
We have designed our business model to (i) create value for our clients, shareholders and employees, (ii) establish high-quality relationships with the suppliers we engage and the communities in which we operate, and (iii) respond to macroeconomic trends impacting the real estate sector. Based on our intimate knowledge of local real estate and capital markets worldwide, as well as our investments in thought leadership and technology, we create value for clients by addressing their real estate needs as well as their broader business, strategic, operating and longer-term sustainability goals.
We strive to create a healthy and dynamic balance between activities that will produce short-term value and returns for our stakeholders through effective management of current transactions and business activities, and investments in people (such as new hires), acquisitions, technologies and systems designed to produce sustainable returns over the long term.
The following diagram"Thinking Beyond" our value creation model (illustrated on the next page) summarizes how we create value for our shareholders and our broader stakeholders. It starts with the capital resources - or inputs - we need to do business. We use these resources in the context of our mission and vision to deliver services - or outputs - for our clients through the business activities we manage.
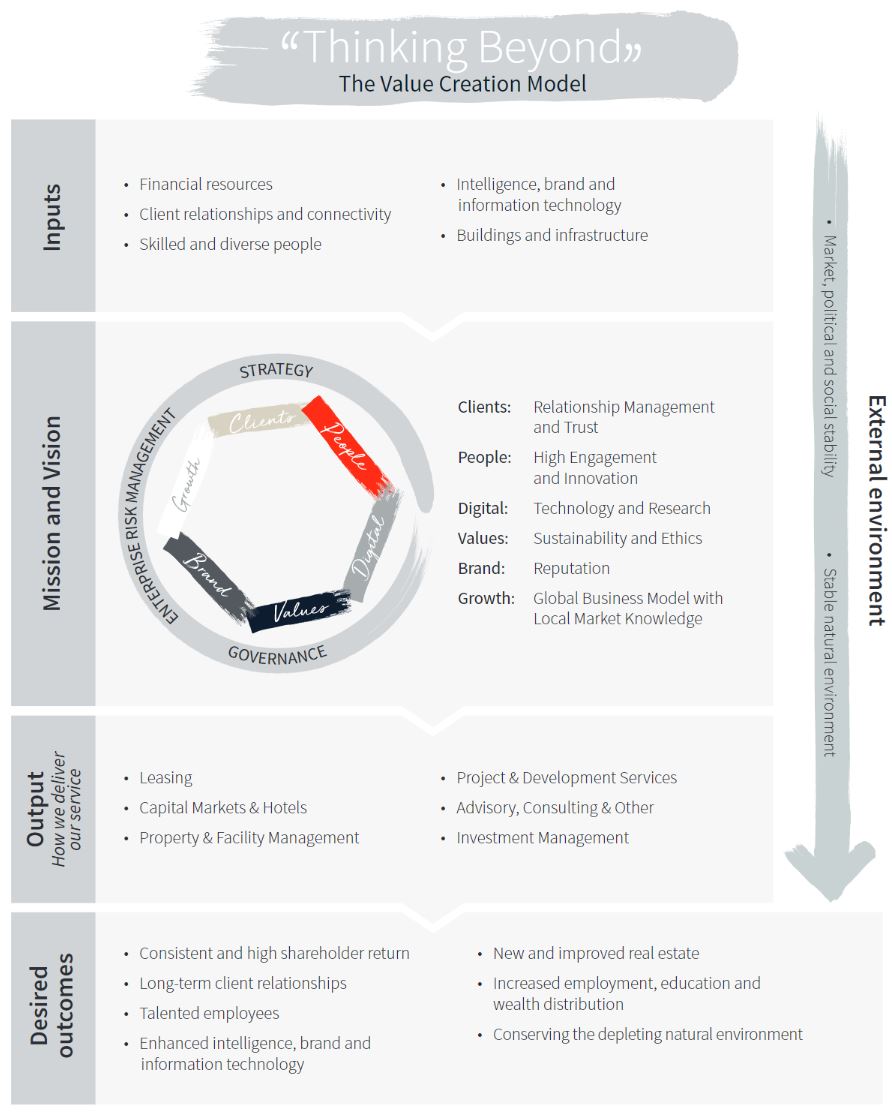
We apply our business model to the resources and capitals thatcapital we employ to provide services. We provide these services through our own employees and, where necessary or appropriate in the case of propertyProperty & Facility Management and facility management and project and development services,Project & Development Services, through the management of third-party contractors. The revenue and profits we earn from those efforts are allocated among further investments in our business, employee compensation and returns to our shareholders. We are increasingly focused on linking our business and sustainability strategies to promote the goal of creating long-term value for our stakeholders, including shareholders, clients, employees, and the global community of which JLL is a part. These efforts help our clients manage their real estate more effectively and efficiently, promote employment globally and create wealthvalue for our shareholders and employees. In turn, they allow us to be an increasingly impactful member of, and positive force within, the communities in which we operate.
STRATEGIC FRAMEWORK
In December 2016, our Global Executive Board (“GEB”) set out the broad framework for Beyond, a new and ambitious strategic vision to drive long-term sustainable and profitable global growth, incorporating transformational enhancements to our digital, data and AI capabilities, and complementing our unwavering commitment to the highest standards of client service, teamwork, ethics and expertise.
During 2017, the GEB developed the specific initiatives, goals and investment priorities to support the Beyond strategic vision and led implementation of the foundational steps. Examples included consolidation of the company’s technology, data and information management resources into a single globally aligned and managed group; initiating work on transformational global platform enhancements for our Finance and Human Resources capabilities; establishing JLL Spark as a global proptech innovation entity based in Silicon Valley; launching our Achieve Ambitions brand identity and accompanying Achieve Your Ambitions employee value proposition; as well as a series of platform investments into further enhancing our global Capital Markets and Corporate Solutions capabilities.
Through 2018, strong ongoing business performance enabled us to accelerate the pace of our multi-year Beyond transformation. Examples included launching the JLL Spark Global Venture Fund and securing several subsequent proptech investments; implementing a new consistent and transparent global career framework and launching a comprehensive single system supporting our human resources interactions for our global employee base of over 90,000 people; introducing CapForce, an advanced and globally integrated CRM system for our Capital Markets teams worldwide; establishing and resourcing a dedicated high-caliber Global Transformation Office to add fresh expertise and impetus to the next phases of our transformation program; business acquisitions to expand our LaSalle platform in Europe and the U.S.; and the launch of our new fully-integrated and wholly-redesigned global website jll.com.
We expect this accelerated momentum in our transformation program to continue through 2019 and 2020. In the following section, we summarize the pillars and guiding priorities in our multi-year Beyond strategic vision.
Beyond: Our Strategic Vision for Long-Term Sustainable and Profitable Growth
Clients
We are a global leader in providing seamlessly integrated services and advice to international corporate and investor clients in all parts of the world. Our Beyond strategic vision sets ambitious goals for continued enhancements to our comprehensive service offering, attracting new talents and skills to our business, marshaling the best new technology and data analytics, and focusing our teams on truly understanding each client’s broader strategic needs. Our service offerings span the whole real estate life cycle, being consistently delivered to the highest quality and creating real value for our clients. Within our Beyond strategy, we are making significant ongoing investments in advanced client relationship management processes and tools, always with a core commitment to ensuring that our own systems and structures never become an obstacle to assembling international and multidisciplinary teams tailored to meet each client’s requirements.
People
Directly supporting our goals to constantly enhance our client services, we continually invest in our people. We are committed to helping our people achieve their ambitions by enabling them to explore new opportunities, build expertise, create long-term careers, work with other talented people, and succeed through inclusion. Achieve your ambitions, our employee value proposition, articulates the key attractions and advantages of a career with JLL. We offer inclusive, collaborative and flexible working environments and an array of developmental and training opportunities. We continue to support our people in their career planning and progression and have refreshed and updated our worldwide career development and management tools, launching MyPerformance as our new performance management platform to guide employees on maintaining and improving performance and implementing a comprehensive single global system to support human resource interactions with all our employees. In 2018, we also introduced a global career framework that provides transparency and clarity on career paths and allows for our people to explore new career opportunities. We support career growth by providing guidance on globally-aligned leadership capabilities and offering formal mentoring and coaching programs. Our people, their skills and aspirations, and their commitment to a consistently high-performance culture and JLL’s core values are central to our ongoing success and sustained profitable growth.
Digital
Technology has transformed the definitions of work, workplace and workforce in all aspects of business. We are only at the front edge of the wave of change that digitization, data and analytics, AI and machine learning will bring to our clients, people and shareholders.
Digital is core to our growth strategy. Examples of our investments in leading-edge technology and data capabilities include the following.
Digitally transforming and enabling delivery of global services with a best-in-class technology foundation and an operational emphasis on data and analytics. This includes increasingly leveraging AI and machine learnings to drive insights, speed and accuracy. A notable example is our 2015 acquisition of Corrigo, which enables our facilities management business globally and continues to grow as a component of our integrated platform
Expanding Digital Solutions, our global digital advisory and implementation services capability, which is unique to our industry. Critical to our Corporate Solutions business, Digital Solutions designs, integrates and implements innovative digital solutions for clients across industry types in the areas of corporate systems of record, smart buildings and workplace experience. In 2018, we nearly doubled the size of this team through the acquisition of ValuD Consulting, a leading provider of software integration and consulting services. The combined team will bring the next generation of technology to our clients to accelerated innovation and deepened expertise in software platforms
Hiring executive leadership from the technology industry to guide our digital transformation
Launching JLL Spark in 2017, focused on creating new property technology products, related strategic investments and incubating technology startups. In mid-2018, we expanded this initiative through the creation18
These investments, along with digital enhancements in our internal platform and throughout our core service offerings, put us in position to extend our role as the digital leader in corporate real estate.
Values
All our people are committed to the core values of teamwork, ethics and excellence. These values are the foundation of our organization. Clients, employees, business partners and potential recruits are strongly attracted to these values and to our commitments to a sustainable future through Building a Better Tomorrow, our sustainability leadership ambition. This has earned us repeated recognition from organizations such as the Ethisphere Institute, which in 2018 named JLL as one of the World’s Most Ethical Companies for the 11th consecutive year.
Brand
We continue to strengthen and expand awareness of our brand beyond the traditional real estate sector, with a focused goal in our Beyond strategicvision to reach more CEOs and other senior decision makers. Supporting this goal, we are an active strategic partner of the World Economic Forum and regular participant in its annual meeting in Davos and at other events. In January 2019, Fortune magazine again named JLL as one of the World’s Most Admired Companies (see below for further awards and recognition during the past year). As part of our Beyond strategy, we launched a new visual identity and brand positioning strategy centered on our Achieve Ambitions theme, which is relevant to all our clients and other stakeholders.
Growth
Our Beyond priorities for clients, people, values, digital and brand combine to provide an integrated strategic vision and platform for growth. This vision is supported by our commitment to enhance productivity in all operations, building margin and creating the basis for long-term sustainable and profitable growth, which reward all our stakeholders, helping them achieve their ambitions.
Consistent with this overarching aim, our Beyond strategic vision overlays and complements additional longstanding strategic priorities for JLL including:
Employing a growth-oriented investment philosophy that best meets client needs while focusing resources on the services, markets and cities generating the highest margin opportunities
Establishing charters for internal business boards to promote more interconnected global approaches to client services and delivery
Leveraging our market-leading research capabilities and data analytics to better inform and advise our clients, enabling them to maximize the value of their real estate portfolios
Deploying additional digital tools, data and metrics to help our people become progressively more productive and efficient
Determining how best to marshal, train, recruit, motivate and retain the human resources that will have the skill sets, diversity and other abilities necessary to accomplish our strategic objectives
Continuing to develop our brand and reputation for high quality client service, integrity, excellence and in-depth local and global market knowledge
Building our brand in digital and social media channels
Continuing to promote best-in-class governance, compliance, enterprise risk management and professional standards to operate a sustainable organization which meets the significant challenges and risks inherent in global markets and minimizes disruptions to, and distractions from, the accomplishment of our corporate mission
Translating our Beyond strategy into best-in-class total shareholder returns
We regularly reevaluate our strategic priorities to optimize sustainable and profitable long-term growth and on-going value creation for all our stakeholders. Our Beyond strategic vision and priorities for growth are built on our closely integrated platform, which combines deep local market knowledge with seamless advice and services tailored to each client’s specific needs.
COMPETITION
We operate across a wide variety of highly competitive business lines within the commercial real estate industry globally. Our significant growth over the last decade, and our ability to take advantage of the substantial consolidation thatwhich has taken place in our industry, have made us one of the largest commercial real estate services and investment management providers on a global basis.
Since we provide a broad range of commercial real estate and investment management services across many geographies, we face significant competition at international, regional and local levels. We also face competition from companies who may not traditionally be thought of as real estate service providers, including institutional lenders, insurance companies, investment banking firms, investment managers, accounting firms, technology firms, software-as-a-service companies, firms providing co-working space, firms providing outsourcing services of various types (including technology, food service and building products), and companies that self-provideself-perform their real estate services with in-house capabilities.
DISTINGUISHING ATTRIBUTES AND COMPETITIVE DIFFERENTIATORS
Our mission is toWe deliver exceptional strategic, fully-integrated services, best practices and innovative solutions for real estate owners, occupiers, investors and developers worldwide. We deliver a combination of services, expertise and technology applications viaworldwide through an integrated global platform that we own (and do not franchise).platform. These characteristics among others distinguish us from our competitors, contribute todrive service excellence and customer loyalty, and affirmdemonstrate our commitment to sustaining our business over the long term. We seek to successfully manage the financial, environmental, and social risks and opportunities our complex organization faces, and help our clients do the same.a sustainable future. While we face high-qualityformidable competition in individual markets, we believe the following are some of the key attributes which make us the best choicedifferentiating JLL for clients seeking real estate and investment management services on a worldwide basis.across the globe.
•Our focus on client relationship management to provide superior client service on a highly coordinated basis
•Our integrated global platformglobally-integrated business model with local market knowledge, including a highly diverse set of service offerings, enablesenabling our ability to deliver our expertise wherever our clients need it
Our ability•Leadership in leveraging technology to deliver innovative solutions and technology applications to helpenhance the services we provide our clients maximize the value of their real estate portfolios
Our ability to organize and analyze the significant data about real estate that we collect in the course of business
The quality and worldwide reach of our industry-leading research function, enhanced by digital applications and our ability to synthesize complex information into practical advice for clients
Our reputation for consistent and trustworthy service delivery worldwide, based on our best practices and the skills, experience, collaborative nature and integrity of our peopleway we operate
•The strength of our brand and reputation,, including our reputation as an ethical organization
•The strength of our financial position
•Our employee engagement as well as our employee value proposition - Achieve your ambitions - which articulates what differentiates JLL as an employer
The quality of our internal governance and enterprise risk management, which clients can rely focus on over the long term
The management of our supply chain for the benefit of the project management, property and facility management, and other services we provide to clients
Oursustainability, with a sustainability leadership agenda, whichstrategy that addresses long-term financial, environmental, and social risks and opportunities for ourselves and our clients
Our culture•The quality and worldwide reach of teamwork, ethicsour industry-leading research function, enhanced by our ability to leverage granular data at a global scale through technology and excellence, which allows usour ability to marshal resources to deliver the greatest possible value and resultssynthesize complex information into practical advice for clients
•Our "client first" and ethical orientation, which enables our people to employee engagement as well as strategic focus on how to best provide what our most critical resource, our employees
•The quality of our internal governance and enterprise risk management, which clients need and want with integrity and transparency
Our strong intellectual capital, long-term approach to business and ability to anticipate, interpret and respond tocan rely on over the trends influencing our industry sector makes us quick and nimble in adapting to new challenges and opportunities in a fast-changing world and in helping our clients do the samelong term
The following is a detailed discussion on selectof these distinguishing attributes and competitive differentiators noted above.differentiators.
Client Relationship Management. We supportOur clients are the center of our ability to deliverbusiness model, and we enable superior service to our clientsdelivery through our ongoing investments in the people, processes and tools that support client relationship management and account management. As an example, CapForce, our sophisticated new CRM tool, links all our capital markets business lines and activities around the world. Our goal is to provide each client with a single pointseamless understanding of contact at our company, an individual responsiveclients' needs across our global capital markets platform, to drive a customized experience and accountableaccountability for all the activities we undertake for the client. We believe that we enhanceachieve superior client service through best practices in client relationship management, seeking and acting on regular client feedback, and recognizing each client's own specific definition of excellence. We also invest in developing the highest caliber talent dedicated to managing our client relationships through an employee compensation and evaluation system aligned with our global career framework and designed to reward client relationship building, teamwork and quality performance.
Our client-driven focus enables us to develop, sustain and grow long-term client relationships that generate repeat business and create recurring revenue sources.opportunities. In many cases, we establish strategic alliances with clients whose ongoing service needs meshalign with our ability to deliver fully integrated real estate services across multiple business units and locations. We support our relationship focus with an employee compensation and evaluation system aligned with our global career framework, designed to reward client relationship building, teamwork and quality performance, in addition to revenue development.
Integrated GlobalGlobally-Integrated Business Model. By combiningThrough the combination of a wide range of high-quality, complementary services and delivering themwe deliver at consistently high service levels globally, through wholly-owned offices with directly employed personnel, we develop and implement real estate strategies that meet the increasingly complex and far-reaching needs of our clients. We also believe that we can grow revenue without a proportionate increase in infrastructure costs due to our established business presence in the world's principal real estate markets. With operations spanning the globe, we have in-depth knowledge of local and regional markets and can provide a full rangeservices which address the entire life cycle of real estate services around the world. This geographic coverage, combined with the ability and willingnessconnectivity of our people, to communicate and connect with each other across a common global platform, positions us to serve the needs of our multinational clients and manage the flow of investment capital on a global basis. We anticipate that ourThis model enables cross-selling potentialopportunities across geographies and productservice lines that we expect will continue to develop new revenue sources and growth.
Technology Leadership. Our globally-coordinated investments in research, technology, data and analytics, people, quality control and innovation provide a foundation for us to develop, share and continually evaluate best practices across our global organization. In recent years, we launched a new global people information system, upgraded our digitally integrated finance system, and scaled the use of CRM tools globally to drive consistency across our organization. In addition, we have been heavily focused on acquiring and/or developing technology-enabled expertise, products and services to better serve our employees and clients. For example, in 2021 we acquired Skyline AI, which uses proprietary machine learning models to gain a competitive advantage in the origination and analysis of real estate opportunities for our producers.
We will continue to develop and deploy technology to support our marketing and client development activities and to make our products and services increasingly accessible.
Brand. The combined strength of our JLL and LaSalle brands represents a significant advantage when we pursue new business opportunities and is also a major motivator for talented people to join our global brand. Large corporations, institutional investors and occupiers of real estate recognize our ability to create value reliably in changing market conditions, based on (i) evidence provided by brand perception surveys we have commissioned, (ii) extensive coverage we receive in top-tier business publications, (iii) awards we receive in real estate, sustainability, innovation, data/technology and ethics, as well as (iv) our significant, long-standing client relationships. Our reputation derives from our deep industry knowledge, excellence in service delivery, integrity and our global provision of high-quality, professional real estate and investment management services.
We believe in uncompromising integrity and the highest ethical conduct, where our Board of Directors and senior management lead by example. We are proud of the global reputation we have earned and are determined to protect and enhance it. The integrity our brand represents is one of our most valuable assets and a strong differentiator for JLL.
The JLL name is our primary trading name; Jones Lang LaSalle Incorporated remains our legal name. Using the shorter JLL name facilitates its adaptation to different communication styles in different countries, languages and channels and especially to the use of digital and online channels for marketing and communications.
Financial Strength. Our broad geographic reach and the range of our global service offerings diversify the sources of our revenue, reducing overall volatility in operating a real estate services business. This further differentiates JLL from firms with more limited service offerings or that are only local/regional and must rely on fewer markets or services.
Confidence in the financial strength of long-term service providers is important to our clients, who require financial strength when they select real estate service providers. We focus on maintaining financial performance metrics, particularly our leverage and debt service coverage ratios, that support investment-grade financial ratings. We continue our long history of investment grade credit ratings from Moody’s Investors Service, Inc. ("Moody’s") and Standard & Poor’s Ratings Services ("S&P"). Our issuer and senior unsecured ratings as of December 31, 2021 are Baa1 from Moody’s and BBB+ from S&P. Accordingly, our ability to present a superior financial condition distinguishes us as we compete for business.
We have ample capacity to fund our business. A key source of liquidity is our unsecured credit facility (the "Facility") provided by an international syndicate of banks, which as of December 31, 2021 had a maximum borrowing capacity of $2.75 billion and a maturity date in April 2026.
Focus on Sustainability. Leading on sustainability is fundamental to both our purpose and our future long-term growth strategy because it’s about creating a positive impact not only today, but also in the future. Being a responsible corporate citizen is the right thing to do and is what our clients and employees expect from us. That commitment was reinforced in October 2021 when we were one of only seven companies globally to have our science-based net-zero target verified by the SBTi.
In addition and as part of our commitment to sustainability, in 2018, we announced our support of the Taskforce on Climate-related Financial Disclosure ("TCFD"). Starting in 2019, we began our multi-year analysis to evaluate (with subsequent refinements) the potential risks and opportunities to our business resulting from climate change in alignment with TCFD.
•In 2019, we identified seven top climate-related risks and opportunities and analyzed the impacts of two climate scenarios: (1) an aggressive mitigation scenario resulting in <2° C warming and (2) an intermediate mitigation scenario resulting in 2° - 3.7° C warming by the end of the century.
•Then in 2020, we expanded our analysis to quantify climate-related physical perils to the headquarter locations of our top eight countries by revenue and, based on stakeholder feedback, added a worst-case climate scenario with >5° C warming.
•Most recently in 2021, we conducted a quantitative climate scenario analysis estimating the financial impacts of physical risks (temperature, sea level rise and extreme climate shocks) in ten higher-risk cities and transaction risks and opportunities (carbon pricing, climate technology disruption, climate change consultancy and climate migration) globally by 2030 and 2050. Based on rapidly evolving climate science and market trends, in 2021 we updated our aggressive mitigation scenario (<2° C warming) with a net zero scenario that aligns with the goal to limit warming to <1.5° C. We anticipate lower climate-related financial risks to JLL as our business model is not carbon-intensive and mitigation measures are already in place for many risks. Additionally, our existing investments in property technology, green building solutions and our climate change consulting provide significant and scalable avenues to realize the identified climate-related opportunities.
Our findings were published in the first and second TCFD reports included within our 2019 and 2020 Global Sustainability Reports, respectively, and in 2022 these findings will enhancebe published in our first standalone TCFD report. These reports are available on www.jll.com.
There is a strong correlation between our ESG performance and the long-term health and success of our business. We address our ESG performance by continuingputting our sustainability program into action, which delivers transformative changes for our business, people, clients, communities and planet.
Our market position enables us to expandtake actions that contribute to a better world. In so doing, it identifies us as a responsible organization, brings our services via complementary or adjacent offerings.purpose to life, adds value to our brand, and helps us attract and retain talent.
Industry-Leading Research Capabilities. We invest in and rely on comprehensive research to support and guide the development of real estate and investment strategy for our clients. With nearly 550approximately 480 research professionals who gather data and cover market and economic conditions around the world, we are an authority on the economics and market dynamics of commercial real estate. Research plays a key role in keeping colleagues throughout the organization attuned to important trends and changing conditions in world markets. We continue to devise and invest in new approaches through data science techniques and other technology to make our research, services and property offerings more readily available to our people and clients.
We believe that our investments in research, technology, data science and analytics, people and thought leadership position JLL as a leading innovator in our industry. Our research initiatives investigate emerging trends to help us anticipate future conditions and shape new services to benefit our clients, which in turn help us secure and maintain profitable long-term relationships with the clients we target: the world's leading real estate owners, occupiers, investors and developers.
Employee Engagement. We believe thatOur people are united by our globally-coordinated investments in research, technology, data science and analytics, people, quality control and innovation, combined withpurpose to shape the facts that our offices are wholly-owned (rather than franchised), and our professionals are directly employed, enable us to develop, share and continually evaluate best practices across our global organization. As a result, we deliver consistently high levels of client service and operational excellence substantially wherever our clients' real estate investment and services needs exist.
Based on our general industry knowledge and on specific client feedback, we believe we are recognized as an industry leader in technology and business intelligence. We provide sophisticated information technology systems on a global basis to serve our clients and support our employees. For example, RED(sm), our client extranet technology, provides clients with detailed and comprehensive insight into their portfolios, the markets in which they operate, and the services we provide to them.
Connect (sm), our intranet technology, offers our employees access to our policies, news and collective thinking regarding our experience, skills and best practices. In addition, we are enhancing the global integration of our systems for finance, human resources and client relationship management, as well as securities management and trading systems for our investment management business. As previously noted, we launched our new global people information system across the globe in 2018. Also this year, select countries in the Americas region have implemented the upgrade to our digitally integrated finance system, with implementation across other geographies continuing in 2019.
We will continue to develop and deploy technology as well as online and social media applications to support our marketing and client development activities and to make our services and real estate property listings increasingly accessible.
Maximizing the Value of Real Estate Portfolios. Our global strategic perspective and presence allow us to assess pricing trends for real estate and know which investors worldwide are investing actively. This gives us an advantage in implementing strategies for acquisitions and dispositions of properties.
During hold periods, our local market research allows us to assess the potential for cash flow enhancement in our clients' assets based on rental-rate trends. When combined, these two perspectives provide us with an optimal view that leads to timely execution and translates into superior investment performance for clients.
Strong Brand and Reputation. We believe that large corporations and institutional investors and occupiersfuture of real estate recognizefor a better world. As individuals and as teams, we celebrate what we do every day and talk about what can we do for a better world tomorrow. Our purpose combined with our ability to create value reliablystrategic focus on People, Technology and Workspaces positions us for exciting business growth. Embedded in changing market conditions, based on (i) evidence provided by marketing surveyseverything we have commissioned, (ii)do, are our Values, Ethics, Teamwork and Excellence. Driving the extensive coverage we receive in top-tier business publications, (iii) the major awards we receive in real estate, sustainability and ethics, as well as (iv)best people experience is imperative, allowing our significant, long-standing client relationships. Our reputation derives from our deep industry knowledge, excellence in service delivery, integrity and our global provision of high-quality, professional real estate and investment management services. We believe that the combined strength of the JLL and LaSalle brands represents a significant advantage when we pursue new business opportunities and is also a major motivator for talented people to join us around the world.
The JLL name, which is also our New York Stock Exchange ticker symbol, is our primary trading name. Jones Lang LaSalle remains our legal name. Using the shorter JLL name facilitates its adaptation to different communication styles in different countries, languages and channels and especially to the use of digital and online channels for marketing and communications.
We believe we hold the "Jones Lang LaSalle," "JLL" and "LaSalle Investment Management" trademarks and the related logos, which we expectemployees to continue to renew, as necessary,grow with JLL while also feeling part of an inclusive and collaborative culture.
Our goal-setting framework uses three categories of goals (clients, growth and people) that align our people’s efforts with enterprise-wide strategy throughout all levels of the organization and build focus and attention on our priorities. Ongoing employee feedback is important to conduct the material aspectscontinued improvement of our business globally. We have obtained the rightorganization and to use the top level domain names of each of ".jll"harness this valuable feedback, we conduct an all employee survey at least twice annually, measuring key aspects such as engagement, leadership, inclusion index and ".lasalle" from the Internet Corporation for Assigned Nameswell-being.
Governance and Numbers.
Financial Strength. We focus on maintaining financial performance metrics, particularly our leverage and debt service coverage ratios, that allow us to maintain investment-grade financial ratings. We believe that confidence in the financial strength of long-term service providers has become increasingly important to our clients, who are increasingly making financial strength an important criterion when they select real estate service providers. Accordingly, our ability to present a superior financial condition distinguishes us as we compete for business.
We also believe that our broad geographic reach and the range of our global service offerings diversify the sources of our revenue, reducing the overall inherent volatility of operating a real estate services business. This creates an additional measure of financial stability relative to other firms with more limited service offerings, or that are only local or regional, and therefore must rely on the strength of fewer markets and services.
We continue our long history of investment grade ratings from Moody's and S&P. Our issuer and senior unsecured ratings as of December 31, 2018 are Baa1 (stable outlook) from Moody’s and BBB+ (stable outlook) from S&P.
Our primary source of credit is our unsecured credit facility (the "Facility") provided by an international syndicate of banks, which as of December 31, 2018 had a maximum borrowing capacity of $2.75 billion and a maturity date in May 2023. In addition, we have €350.0 million of fixed-rate senior notes with half due in June 2027 and the other half due in June 2029 as well as $275 million of fixed-rate senior notes due in November 2022. Our senior notes have increased our proportion of fixed-rate debt.
Strong Governance, Enterprise Risk Management and Integrity. Our overlapping and communicative senior management andManagement. The Chairman of our Board of Directors is an independent Director and is separate from our CEO, who also serves as a Director. This structure together with our transparent senior management promotes an environment of best practices in corporate governance and controls. We believe that these attributes allow us to infuse a culture of internal communication and connectivity throughout the organization.
Successful management of any organization's enterprise risks is critical to its long-term viability. We seek to promote, operate and continually improve a globally-integrated enterprise risk management model that optimizes our overall risk/reward profile through the coordinated and sophisticated interaction of business and corporate staff functions.
Related to our governance and enterprise risk management efforts, we believe in uncompromising integrity and the highest ethical conduct. We are proud of the global reputation we have earned and are determined to protect and enhance it. The integrity our brand represents is one of our most valuable assets and a strong differentiator for our company.
Building a Better Tomorrow - our sustainability leadership ambition. Through Building a Better Tomorrow, we seek to meet our sustainability vision through four Pillars depicted below: Clients, People, Workplaces and Communities. These Pillars are underpinned by three Foundations: our commitment to the highest standards of corporate governance, our efforts to drive sustainability thought leadership and our commitment to deploying innovative, forward thinking solutions for ourselves and our clients. To ensure these efforts support our broader business strategy, Building a Better Tomorrow is an integral part of our long-term strategic vision, Beyond.
By addressing issues which materially affect our clients, investors, employees and communities, we drive positive change through our organization and more widely. For this reason, we recently undertook three reviews to identify our most material sustainability considerations.
In 2017, these reviews were supplemented by additional materiality assessment in collaboration with Ceres, a sustainability nonprofit organization focused on economy-centric solutions, to ensure we are addressing the most significant sustainability impacts through Building a Better Tomorrow. The top five material environmental and social issues identified were:
|
| | | |
| Environmental Issues | Social Issues |
| 1. | Energy consumption and emissions | 1. | Business ethics and integrity |
| 2. | Sustainable buildings | 2. | Innovation and technology |
| 3. | Enhancing client sustainability through our services | 3. | Health, safety and security |
| 4. | Climate risk | 4. | Talent attraction and retention |
| 5. | Responsible supply chain | 5. | Employee wellbeing |
Having exceeded our previous targets at the end of 2017, we set ambitious new goals for JLL based on the results of our materiality process. These goals cover all four Pillars of Building a Better Tomorrow and are covered in detail in our current annual Global Sustainability Report.
Generating sustainable value for our clients. The 4.6 billion square feet of space that we manage globally for our clients gives us the opportunity to have an impact through industry-leading strategies, tools and technologies that significantly improve energy efficiency and societal impacts, as well as reduce costs. Embedding sustainability considerations across our service lines is one of our key priorities, enabling us to offer differentiated and forward-thinking solutions to our clients, as we seek to maximize the positive impact we can have in the world.
Our Energy and Sustainability Services teams provide a range of services covering the construction, operation and maintenance of clients’ facilities as well as advice on occupier behavior, socio-economic impacts and site location. In addition to the clear environmental and societal benefits these activities deliver, they also yield significant operational and cost efficiencies. For these reasons, we invest substantial resources into continuing our development of world-class energy and sustainability solutions for our clients.
Our commitment to technological innovation extends to our sustainability service offering. We have developed a number of in-house technology platforms to help us deliver our clients’ sustainability objectives. For example, our OneView Energy and Sustainability Analytics (OVESA) platform is used to manage the ever-increasing volumes of complex sustainability data.
This system, along with our other platforms such as the Portfolio Energy and Environment Reporting System (PEERS) and the Energy and Sustainability Platform (ESP), reflects our commitment to investing in digital, data and information management platforms. By deploying flexible digital solutions, we are able to measure, manage and improve environmental impacts for the nearly 200,000 buildings included on these platforms.
Sustainability thought leadership. We have earned a reputation for progressive thinking through extensive investments in research and thought leadership. In 2018, we produced sustainability thought leadership covering topics as diverse as climate change adaptation, sustainable building design and employee productivity, and workplace economics. Many of these pieces were published on our LinkedIn sustainability showcase, Green Blog and Real Views web pages. We work with global and local sustainability organizations to develop new ways of thinking around some of the biggest challenges facing our sector. This includes working alongside organizations such as the Global Real Estate Sustainability Benchmark and the World Green Building Council. In addition, we have been a signatory of the United Nations Global Compact since 2009.
Employee Value Proposition. Based on input from our employees about our culture and what makes us stand out as an employer, we developed the employee value proposition - Achieve your ambitions - a shared framework to inspire talent to join us, engage our employees and celebrate the values and culture of JLL around the world. An integral part of our brand, it is our promise to our people - employees and candidates alike - and centers on five unique pillars, depicted in the following graphic.
Our goal-setting framework uses three categories of goals (clients, growth and people) that align our people’s efforts with enterprise-wide strategy throughout all levels of the organization and build focus and attention on our priorities.
Awards. We won numerous awards and recognitions in 2018through January 2022 that reflect the quality of the services we provide to our clients, the integrity of our people and our desirability as a place to work. As examples, we were named:
•A member of the Bloomberg Gender-Equality Index, for the third consecutive year
•A member of the Dow Jones Sustainability Index North America, for the sixth consecutive year
•An Energy Star Sustained Excellence Award recipient, by the U.S. Environmental Protection Agency, for the tenth consecutive year
•One of America's Most Responsible Companies by Newsweek, for the third consecutive year
•One of the World's Most Ethical Companies named by the Ethisphere Institute, for the eleventh consecutiveevery year since 2008
One of the 100 Best Corporate Citizens in the United States, CR Magazine, for the fourth consecutive year
A most JUST company in the real estate industry on the Forbes' "JUST 100" list, for the third consecutive year
A Drucker Institute Management Top 250 for the second consecutive year
•One of the World's Most Admired Companies by Fortune Magazine, for the fourth year
A LinkedIn Top Company for the thirdfifth consecutive year
•One of Working Mother's 100 Best Companies for the second consecutive year
One of the Top 70 Companies for Executive Women, named by the National Association for Female Executives, for the third consecutive year
One of the 50 Out Front for Diversity Leadership: Best Places for Women & Diverse Managers to Work, Diversity MBA, for the fourth consecutive year
A perfect score onTo the Human Rights Campaign Foundation's Corporate Equality Index, a benchmarking survey on corporate policies and practices related to LGBTLGBTQ workplace equality, with a perfect score, for the eighth consecutive year
•One of America's Best Employers for Diversity by Forbes, for the second consecutive year
•A Military Friendly Employer by VIQTORY, for the fifth consecutive year
One of the Global Outsourcing 100, International Association of Outsourcing Professionals, for the tenth consecutive year
An Energy Star Sustained Excellence Award recipient, by the U.S. Environmental Protection Agency, for the seventh consecutive year
•One of the Best Places to Work in Money Management, namedfor Disability Inclusion by Pensions & Investments,Disability:IN and the American Association of People with Disabilities, for the third consecutive year
•A Wall Street Journal ManagementTop 250 company by the Drucker Institute, for the second consecutive year
INTEGRATED REPORTING
As a partJLL was one of the Business Network and Framework Panel offirst U.S. listed companies to participate in the International Integrated Reporting Council ("IIRC"), and we continue to support the general principles set forth by the <IR> Framework, which are designed to promote communications and integrated thinking about how an organization's strategy, governance, and financial and non-financial performance lead to the creation of value over the short, medium and long term.
Components of Our Integrated Report. Reporting.This Annual Report on Form 10-K focuses on our business strategy and our financial performance, including an attempt to illustrate how being a sustainable enterprise is integral to our success. Our citizenship and sustainability efforts for ourselves and our clients are reflected primarily in our annual Global Sustainability Report.
Report, available on our website. Our governance and remuneration practices are reported primarily in the Proxy Statement for our Annual Meeting of Shareholders. The mechanisms we use to make our clients comfortable with respect to our transparency and fair dealing are summarized in our TransparencyEthics Everywhere Annual Report. The behaviors and standards we expect of our employees and of the suppliers we engage for our own company and on behalf of clients are presented in our
Code of Business Ethics and our Vendor Code of Conduct. Our Corporate Facts document is intended to provide an overall summaryWe publish details of the information we believe will be of primary interest to our different stakeholders.
We intend thisethics program and ethics statistics in our Ethics Everywhere Annual Report to satisfy the requirementsincrease transparency and understanding of the International <IR> Framework issued by the IIRC in December 2013 (www.theiirc.org). Following the Exhibit Index, we present a tie-out sheet that cross-references the requirements in the Frameworktypes of concerns and the locations ofissues raised through our responses within this Annual Report.In 2015, we first launched an electronic Integrated Report on our website which provides access to all our information embedded in the documents discussed above through one access portal.reporting channels.
Responsibility for Integrated Reporting.Our Finance, Legal and Legal ServicesSustainability functions are primarily responsible for the integrityintegrity of our integrated reporting efforts, and acknowledge that we have applied a collaborative approachcollaborating in the preparation and presentation of this report. To do so, we have also engaged other senior members ofreport and engaging our organization. In our collective opinion, this report is presented in accordance with the Framework. However, as our effort to comply with the Framework is done voluntarily and continues to evolve, we disclaim any legal liability to the extent that this report is deemed to not comply with the Framework.
Alignment with the Integrated Reporting Framework. Building on our Beyond strategy and as an important part of our aim to align more closely with the Integrated Reporting Framework, in 2017 we began to identify the medium- to long-term global megatrends with the greatest potential to materially impact our business. To do this, we used the 'six capitals' model advocated by the IIRC: financial, human, intellectual, manufactured, social and natural capitals.
While we are most heavily dependent on the financial, human and intellectual capitals to execute our own operations successfully, we identified significant trends with implications for our business across all six capitals. Furthermore, changes in the availability of all six capitals impact our clients’ businesses and by extension, our service provision.
We have identified a number of global trends as significant for our business in the medium to long term. All of these, which we are tracking and/or actively managing, are illustrated below. The "JLL Activities," which address these trends, are summarized in the table below primarily via a combination of references to sections within Items 1 and 1A in this Annual Report on Form 10-K and resources we publish on our website, where we discuss relevant points in more detail.
Driving improvements in Integrated Reporting. We recognize Integrated Reporting is a journey rather than a destination. We are constantly seeking to enhance the way we disclose our corporate information, striving to convey our value-creation story in the fullest way possible. To support these efforts, we have established an Integrated Reporting Working Group made up of representatives of key business functions. The group is tasked not only with furthering efforts to improve our reporting processes and increase our alignment with the <IR> Framework, but also to foster a culture of integrated thinking within the business. Through this Working Group, we are also considering how best to take forward the recommendations from the Sustainability Accounting Standards Board and the Taskforce on Climate-related Financial Disclosures.
Our Materiality Process. We actively identify our long-term risks and opportunities specifically with a view to furthering our integrated reporting journey. This effort complements the Enterprise Risk Management processes we conduct and has enabled further engagement with internal executives; prioritized our long-term risks and opportunities to generate further business value based on the IIRC’s guidance; and helped us articulate how to manage and take advantage of long-term risks and opportunities in reports like this and in our sustainability reporting.
We used the 'six capitals' model from the IR Framework to identify and investigate a number of global trends with the potential to impact our business. This process helped us identify where and how different trends interact with one another. Using this model, we created an initial list of 36 trends and their potential implications for us. We then undertook one-on-one engagements with around 30 executives from different disciplines and geographies across JLL to present the six capitals model; discuss the trends identified; and understand, based on these trends, what the potential risks and opportunities are to JLL and how we are, or should be, responding to them. We then developed comprehensive qualitative and quantitative analyses based on these internal engagements and aligned them with our existing risk-management matrix. We scored the long-term trends according to likelihood and magnitude, taking account of potential impacts on different areas of the business. The result of this scoring is the six capitals risks and opportunities materiality matrices, shown below, which allowed us to identify the most material long-term risks and opportunities for our company.
Since 2014, our GEB and other senior leadership have continued to monitor the evolution of both our opportunities and risks. On a macro basis, they have remained broadly consistent, with some changes in relative significance as, for example, threats of cyber attacks and data theft that have continued to rise. For additional discussion of our risks and the ways we mitigate them, refer to Item 1A. Risk Factors.
|
| | |
Type of Capital | Global Trends | JLL Activities |
Financial | Continued risk of financial crises | • Maintaining our financial strength as a differentiator; Financial Risk Factors |
Potential increase in disruptive market cycles | • Enterprise Risk Management; Strategic Risk Factors; Financial Risk Factors |
Shift toward emerging markets | • Building our Leading Local and Regional Service Operations
• Strategic focus on potential growth markets and cities |
Regulatory reform in banking & other sectors | • Enterprise Risk Management; Operational Risk Factors; Legal and Compliance Risk Factors |
Global push against tax avoidance | • Enterprise Risk Management; Strategic Risk Factors; Financial Risk Factors; Legal and Compliance Risk Factors |
Human | Changing demographics affects workplace profiles | • Enterprise Risk Management; Operational Risk Factors |
Shift of business model to technology-based which demands:
· digital capabilities of who we hire, who we train, needs to appeal to a younger generation,
· drives different needs in leadership, demands a truly global way of leading, more flexibility, a focus on social values | • Leadership development programs
• Acquisitions of technology platforms
• Data & technology and social media programs
• Yammer platform encouraging employees to share and exchange online |
Diversity is equated with "good business" | • Business leaders as diversity champions in all our business segments
• Annual Diversity and Inclusion Report (on our website)
• Global Diversity and Inclusion Website
• Annual Global Sustainability Report (on our website) |
Intellectual | Increased risk of cyber attacks and data theft | • Enterprise Risk Management; Operational Risk Factors |
Intellectual capital becomes increasingly disseminated | • Strategic focus on technology, digital and social media
• Enterprise Risk Management; Operational Risk Factors |
Digital technology transforms how people live and work | • Launch of JLL Spark
• Strategic focus on technology, digital and social media |
Manufactured | Rapid urbanization and ‘megacities' trends | • Build our Leading Local and Regional Service Operations
• Strategic focus on potential growth markets and cities
• JLL Cities Research Centre (on our website) |
Changing levels of demand for different types of real estate | • Strategic focus on most lucrative potential services
• JLL Research |
Expansion of the global investable real estate universe | • Strategic goal to capture the leading share of global real estate capital flows
• Strengthen LaSalle Investment Management's leadership position |
Social | Unprecedented levels of transparency | • Code of Business Ethics and Corporate Sustainability
• Transparency Report (on our website)
• Enterprise Risk Management; Strategic Risk Factors
• Introduction of global career framework |
Increasing political instability and conflict | • Enterprise Risk Management; Strategic Risk Factors |
Businesses need to demonstrate social contribution | • Annual Global Sustainability Report (on our website) |
Natural | Increase in extreme weather events | • Enterprise Risk Management; Strategic Risk Factors
• Global Sustainability & Cities Research
• Enhanced disaster recovery protocols |
Natural resources in increasingly short supply | • Enterprise Risk Management; Operational Risk Factors
• Global Sustainability Report (on our website) |
organization's leadership.SEASONALITY
A large portion of our revenue is seasonal, which investors should keep in mind when comparing our financial condition and results of operations from quarter to quarter. Historically, our quarterly revenue and profits have tended to increase from quarter to quarter as the year progresses. This is a result of a general focus in the real estate industry on completing or documenting transactions by calendar year-endyear end and the fact that certain expenses are constant throughthroughout the year. Historically, we have reported a relatively smaller profit in the first quarter and then increasingly larger profits during each of the following three quarters, excluding the recognition of investment-generated performance fees and realized and unrealized co-investment equity earnings and losses each(each of which is inherently unpredictable. We generallycan be unpredictable). Generally, we recognize such performanceincentives fees and realized co-investment equity earnings or losses when assets are sold or as a result of valuation increases in the portfolio, the timing of which is geared towardmay not be predicable or recurring. In addition, co-investment equity gains and losses are primarily dependent on underlying valuations, the benefitdirection and magnitude of our clients.changes to such valuations are not predictable. Non-variable operating expenses, which we treat as expenses when incurred during the year, are relatively constant on a quarterly basis. In 2020 and 2021, macroeconomic conditions influenced by the COVID-19 pandemic impacted the historical seasonality of our revenue and profits. By the end of 2021, the historical seasonality trends began to return.
EMPLOYEESHUMAN CAPITAL
The following table reflectsdetails our global headcount for reimbursable and non-reimbursable employees.
| | | (in thousands) | December 31, 2018 | December 31, 2017 | (in thousands) | December 31, 2021 | December 31, 2020 |
| Professional non-reimbursable employees | 47.8 |
| 42.3 |
| Professional non-reimbursable employees | 53.7 | | 49.7 | |
| Directly reimbursable employees | 42.2 |
| 39.6 |
| Directly reimbursable employees | 44.5 | | 41.1 | |
| Total employees | 90.0 |
| 81.9 |
| Total employees | 98.2 | | 90.8 | |
Directly reimbursable employees have costs which are fully reimbursed by clients, primarily in our Corporate SolutionsWork Dynamics business. Specifically, reimbursable employees include our property and IFMfacility management professionals, as well asincluding our building maintenance employees.
Our employees do not report being members of any labor unions, with the exception of approximately 2,3003,100 property maintenance employees in the United States, 80%78% of whom are reimbursable. As of both December 31, 2018,2021 and 2017,December 31, 2020, approximately 70% of our employees were based in countries other than the United States.
Diversity, Equity and Inclusion (DE&I)
We have a steadfast commitment to a more diverse and inclusive future, which is core to our purpose of shaping the future of real estate for a better world. We are focused on accelerating a culture of DE&I by holding ourselves accountable, setting short-term and long-term goals and taking comprehensive action - ultimately providing environments where all of our people feel they belong, creating a company culture we are proud of, and enabling higher performing teams. Some examples of our actions and progress include:
•Continued to advance our gender diversity
◦35% of our global workforce is female
◦45% of our independent board members are female
◦Half of our largest eight countries are led by female CEOs
◦Signed the Commercial Real Estate Women (CREW) Pledge for Action to support the advancement of women in real estate
◦Published our fourth Gender Pay Gap report in the UK
•Support Business Resource Groups in all three regions provide a supportive and safe platform to navigate career development and facilitate networking
•Offer targeted development programs for female and diverse talent, including Black Leadership Summit, Women's Leadership Summit and an inaugural Latinx Summit
•Launched programs to break down financial barriers for underrepresented populations to entering the real estate industry, including a college loan repayment program and an investment fund for entry-level compensation to supplement the industry's traditionally commission-based salary models
•Continue to be recognized for our commitment to diversity; refer to the Distinguishing Attributes and Competitive Differentiators section above for awards and recognition during the past year
Training and Development
Using extensive internal and external research, we have a set of core capabilities that define our leadership behaviors to drive our near and long-term success. Those capabilities are the foundation for our employee talent assessments, succession planning and other talent processes. Further, just as our business needs to constantly evolve, so too does the learning and leadership development venues and products that we use to serve the business. Our employees can self-assess and be assessed against these capabilities to participate in our award-winning development platform, Real Leadership.
In 2019, we launched Real Leadership, our end-to-end platform that helps our employees grow their leadership skills from frontline to executive. This award-winning program has served over 10,000 employees worldwide with 10 different programs including partnerships with Harvard, Stanford, and many other prestigious partnerships. In addition, we continue to upskill our workforce on future focused skills, ensuring our employees worldwide have the development they need whether for technical or professional development leveraging our JLL Virtual Learning library. Nearly 90,000 employees annually have been able to learn, in seven different languages, through our virtual on-demand offerings this year. Our total learning platforms have resulted in over 2 million learning assets consumed to accelerate our development of our employees.
Well-being
In 2020, we launched a well-being framework consisting of four pillars: physical, mental, financial, and inclusion. We provided resources on our Well-being site in 15 languages including online courses, webinars and resources for caregivers. Since its launch, the Well-being site has over 27,000 unique users and has had 177,000 visits. In addition, we implemented well-being training for managers across the globe.
As we navigated the challenges of the COVID-19 pandemic over 2021, we continued our efforts to elevate the care for our people and support their well-being. We added resources to our JLL Well-being site, including self-care tips, information about employee assistance programs, webinars on stress management and guidance for managers about leading through uncertain times. We also continued to build out resources for working caregivers and grew our new business resource group, PACE – Parent and Caregiver Experience. Through our two people surveys, we also continued to listen to our people and understand how they were feeling about their health, safety and return to the office. More than 80 percent of our employees told us they would like to be at a JLL office or at a client site full-time or on a hybrid schedule, and we have continued to welcome employees back to our spaces, in accordance with local mandates and guidelines, to drive innovation, collaboration and networking.
Health and Safety
Health and safety is at the forefront of JLL's operations. With over 600 health and safety professionals, we are committed to creating an environment that unequivocally protects our employees, clients and supply partners.
To effectively manage health and safety, our program is aligned to the principles of the internationally recognized health and safety management standard ISO 45001. We implement global health and safety standards that ensure we apply a consistent approach to harm prevention and operate assurance programs to ensure legal compliance.
We recognize that successful health and safety programs are built on proactive individual and collective safe behaviors. Through our health and safety vision, ‘One team S.A.F.E.R together’, we create a stronger culture of health and safety, underpinned by our S.A.F.E.R. behaviors: S – Speak about safety; A – Act safely; F – Focus on safety standards; E – Engage in safety initiatives; R – Recognize safe performance.
To monitor the strength of our safety culture, in 2021 we benchmarked our organization against data from other companies using the UK Health and Safety Laboratory’s Safety Climate Survey Tool. Our global survey received over 12,500 responses and showed our culture continued to be in the 95th percentile when compared against the all-industry scores and exceeded the 2020 highest average scores for Real Estate & Facilities Management organizations. While this score sets a high internal benchmark, our goal is to improve our culture and improve our scores year on year.
Through our safety vision and our awareness and education programs, like Global Safety Week, the strength of our program is realized in the low accident rates for the year 2021, compared with the U.S. Occupational Safety and Health Administration ("OSHA") industry average accident rates for our industry (NAICS Code 531: Real Estate).
•Lost Time Incident Rate was 0.31 (OSHA industry average was 0.70): 12-month average of OSHA recordable illness and injuries per 100 JLL employees that resulted in days away from work.
•Total Recordable Incident Rate was 0.50 (OSHA industry average was 2.10): 12-month average of OSHA recordable illness and injuries per 100 JLL employees.
•Days Away, Restricted Duty and Transfer was 0.31 (OSHA industry average was 1.00): 12-month average of OSHA recordable illness and injuries per 100 full-time employees that resulted in days away from work or restricted duties.
•There were zero JLL employee workplace fatalities reported in 2021.
We continue to react to the ongoing COVID threat and now have robust procedures in place that ensure the safety of JLL employees and enable us to react to local situations and legislation changes as they happen. This includes the ability for employees to have flexible working that is also beneficial to their personal well-being.
JLL began a journey toward the WELL building standard in 2017 with the certification of our New York City office. Now, with over 19 offices certified or in progress across the globe, we are more committed than ever to lead the market and invest in technology to build healthy workplaces for our people and our clients. Over the past several years, we have strengthened our commitment to health and wellness and enrolled our own assets into the WELL Portfolio Program, expanding from APAC to North America and now including EMEA.
Our WELL Portfolio now covers more than 4,000,000 square feet, impacting 23,550 JLL employees in well over 250 offices. We have pushed ourselves to be transparent about our performance, acknowledging both areas of success and where we have room for improvement. WELL Portfolio has allowed us to have a reputable, and equitable, way to benchmark our performance against science-based methodology and create a roadmap for ongoing improvement.
INTELLECTUAL PROPERTY
We regard our technology and other intellectual property, including our brands, as a critical part of our business.
We hold various trademarks, trade dress and trade names and rely on a combination of patent, copyright, trademark, service mark and trade secret laws, as well as contractual restrictions to establish and protect our proprietary rights. We own numerous domain names, have registered numerous trademarks, and have filed applications for the registration of a number of our other trademarks and service marks in the United States and in foreign countries. We hold the "Jones Lang LaSalle," "JLL" and "LaSalle Investment Management" trademarks and the related logos to conduct the material aspects of our business globally. We own the rights to use the dot-jll (.jll)".jll" and dot-lasalle (.lasalle)".lasalle" top level domain names, which we acquired during 2015.names.
Although we believe our intellectual property plays a role in maintaining our competitive position in a number of the markets that we serve, we do not believe we would be materially adversely affected by the expiration or termination of our trademarks or trade names or the loss of any of our other intellectual property rights other than the “JLL,” "Jones Lang LaSalle," “LaSalle,” and "LaSalle Investment Management" names, and our Design (Three Circles) mark that is also trademarked. Our trademark registrations have to be renewed every ten years.years, which we expect to continue to renew, as necessary. Based on our most recent trademark registrations, the JLL mark would expire in 2024, while the Jones Lang LaSalle name would expire in 2022 and the Design (Three Circles) mark would expire in 2021.2031. Our LaSalle and LaSalle Investment Management marks will expire in 2026.
In addition to our trademarks and trade names, we also have proprietary technologies for the provision of complex services and analysis. Consistent with our belief that we are recognized as an industry leader in technology as discussed above, we currently have a patented process in the United States for a "System and Method for Evaluating Real Estate Financing Structures" that assists clients with determining the optimal financing structure for controlling their real estate assets, including, for example, whether a client should own a particular asset, lease the asset, or control the asset by means of some other financing structure. In addition, we have patented an electrical panel in the United States entitled, “Energized Parts Guard,” which consists of a device to prevent contact with exposed energized electrical conductors during electrical maintenance. In 2018, JLL was granted another patent, Blackbird (sm), a geospatial intelligence tool. We also have a number of pending United States patent applications in the U.S. to further enable us to provide high levels of client service and operational excellence. Our products that have pending patent applications include CRC Website, a cities comparison tool, and Sign and Ladder safety, as examples. We will continue to file additional patent applications on new inventions, as appropriate, demonstrating our commitment to technology and innovation.
CORPORATE GOVERNANCE; CODE OF BUSINESS ETHICS; CORPORATE SUSTAINABILITY AND RELATED MATTERS
We are committed to the values of effective corporate governance, operating our business to the highest ethical standards and conducting ourselves in an environmentally and socially responsible manner. We believe that these values promote the best long-term performance of JLL for the benefit of our shareholders, clients, staff and other constituencies.
Corporate Governance. We believe our policies and practices reflect corporate governance initiatives that comply with:
Thewith the listing requirements of the New York Stock Exchange ("NYSE"), on which our Common Stock is traded
TheNYSE, the corporate governance requirements of the Sarbanes‑Oxley Act of 2002, as currently in effect
U.S. Securities and Exchange Commission ("SEC") regulations,
The the Dodd-Frank Wall Street Reform and Consumer Protection Act, as currently in effect
Theand the General Corporation Law of the State of Maryland, where we are incorporatedincorporated.
Our Board of Directors ("the Board") regularly reviews corporate governance developments and modifies our By-Laws,Bylaws, Guidelines and Committee Charters accordingly. As a result, we have adopted the following corporate governance policies and approaches that are considered to be best practices in corporate governance.
•Annual elections of all members of our Board
•Annual "say on pay" votes by shareholders with respect to executive compensation
•Right of shareholders owning 30% of the outstanding shares of our Common Stockstock to call a special meeting of shareholders for any purpose
•Majority voting in Director elections
•Separation of Chairman and CEO roles, with the Chairman serving as Lead Independent Director
•Required approval by the Nominating and Governance Committee of any related-party transactions
•Executive session among the Non-Executive Directors at each in-person meeting
•Annual self-assessment by the Board and each of its Committees
Periodic assessment by our senior executive management of the operation of our Board
Code of Business Ethics. The ethics principles that guide our operations globally are embodied in our Code of Business Ethics, which applies to all employees of JLL including our Chief Executive Officer, Chief Financial Officer, Global Controller and the members of our Board. The Code of Business Ethics is the cornerstone of our Ethics Everywhere Program, by which we establish the operating framework to communicate, monitor and monitor the overall elements ofenhance our efforts. ethical culture and maintain compliance with our Code. We are proud of, and are determined to protect and enhance, the global reputation we have established since,established. As we operate in a service business such as ours,industry, the integrity that our brand represents is one of our most valuable assets. For a number of yearsSince 2008 we have applied for and receivedcontinuously held Ethics Inside™ certification from NYSE Governance Services,the Ethisphere Institute, a leading organization dedicated to best practices in ethics, compliance, corporate governance and citizenship. We believe it is the only available independent verification of a company's ethics program. As previously noted, we werehave been named to Ethisphere Institute’s list of the World's Most Ethical Companies for the eleventh consecutive time in 2018. We™ every year since 2008.
Our Whistleblower and Non-Retaliation Policy and our Human Rights Policy also were recertified under the Ethics Inside program by the Ethisphere Institute.
support our values and our commitment to ethical business practices. We support the principles of the United Nations Global Compact and the United Nations Principles of Responsible Investing and, given that our clients include a number of the major companies within the electronic industry, the Electronic Industry Code of Conduct.Investing. We are also a member of the Partnering Against Corruption Initiative sponsored by the World Economic Forum.
Vendor Code of Conduct. We expect each of our vendors, meaning any firm or individual providing a product or service to us, or indirectly to our clients as a contractor or subcontractor, will share and embrace the letter and spirit of our commitment to integrity. While vendors are independent entities, their business practices may significantly reflect upon us, our reputation and our brand. Accordingly, we expect all vendors to adhere to the JLL Vendor Code of Conduct, which we publish in multiple languages on our website. We continue to evaluate and implement new ways to monitor the quality and integrity of our supply chain, includingchain. This includes developing means to efficiently survey and compare responses about the ethical environment and riskiness of current and potential suppliers that we engage both for our own company and on behalf of clients.
Professional Standards Guide. Our guide to professional standards seeks to establish principles under which our people will perform services for clients. It is published on our website.
Corporate Sustainability. We encourage and promote the principles of sustainability everywhere we operate, seeking to improve the communities and environment in which our people work and live. We design our corporate policies to reflect the highest standards of corporate governance and transparency, and we hold ourselves responsible for our social, environmental and economic performance. We seek to incorporate sustainability practices and principles into our client investments and asset management. These priorities guide the interactions we have with our shareholders, clients, employees, regulators and vendors, as well as with all others with whom we come into contact. We recognize both the risks and opportunities presented by climate change and seek to address these impacts both in and beyond our business.
We also work to foster an environment thatwhich values the richness of our differences and reflects the diverse world in which we live and work. By cultivating a dynamic mix of people and ideas, we enrich our performance, the communities in which we operate, and the lives of our employees. We seek to recruit a diverse workforce, develop and promote exceptional talent from diverse backgrounds, and embrace the varied experiences of all our employees.
Corporate Political Activities. Given the diversity of our clients, shareholders, staff and other constituencies, ourOur general approach is to not take positions as an organization on social or political issues or on political campaigns. Accordingly, our use of corporate funds or other resourceswe do not permit contributions in JLL's name for political activities has been negligible.activities. From time to time, we may comment on proposed legislation or regulations that directly affect our business interests and therefore the interests of our shareholders. We may also belong to industry trade associations that do become involved in attempts to influence legislation in the interests of the industry generally.
Conflicts Minerals. Since we are not a manufacturer, nor do we contract to manufacture, we do not believe that we engage in the purchase or procurement of conflicts minerals, either for ourselves or our clients.
COMPANY WEBSITE AND AVAILABLE INFORMATION
JLL's website address is www.us.jll.comwww.jll.com. We use our website as a channel of distribution for company, financial and other information. Our website also includes information about our corporate governance. We intend to post on our website any amendment or waiver of the Code of Business Ethics with respect to a member of our Board or any of the executive officers named in our proxy statement.
On the Investor Relations page on our website, we make available our Annual Report on Form 10-K, our Proxy Statement on Schedule14A, our Quarterly Reports on Form 10-Q, our Current Reports on Form 8-K and any amendments to those reports filed or furnished pursuant to Section 13(a) or 15(d) of the Securities Exchange Act of 1934 (the “Exchange Act”). Any document we file with the SEC may also be read and copied at the SEC's public reference room at 100 F Street, NE, Washington, D.C. 20549. Information about its public reference room can be obtained by calling the SEC at 1.800.SEC.0330. The SEC maintains www.sec.gov, containing annual, quarterly and current reports, proxy statements and other information that we file electronically with the SEC.
Our website includes information about our corporate governance. We will also make the following materials available in print to any shareholder who requests them in writing from our Corporate Secretary at the address of our principal executive office set forth on the cover page of this Annual Report on Form 10-K:
|
| | | |
Code of Business Ethics | Vendor Code of Conduct | Corporate Facts | Global Sustainability Report |
|
| | | |
Transparency Report | Business Continuity | Modern Slavery Statement | Health & Safety Report |
In addition to the above, the following are also available:
|
| | | | | | | | | | | |
● | Disaster Recovery Report | ● | Bylaws and Corporate Governance Guidelines | ● | Charters for our Audit, Compensation, and Nominating and Governance Committees |
● | Statement of Qualifications for Members of the Board of Directors | ● | Compliant procedures for Accounting and Auditing Matters | ● | Statements of Beneficial Ownership of our Equity Securities by our Directors/Officers |
We intend to post on our website any amendment or waiver of the Code of Business Ethics with respect to a member of our Board or any of the executive officers named in our proxy statement.
ITEM 1A. RISK FACTORS
In addition to the other information set forth in this report, you should carefully consider the following risks that based upon current knowledge, information and factors thatassumptions could materially adversely affect our business, financial condition and results of operations, including revenues, profitability and/or stock price. However, theoperations. Some of these risks and uncertainties could affect particular service lines or geographies, while others could affect all of our businesses. Although each risk is discussed separately, many are interrelated.
These risk factors do not identify all risks we face areface; our operations could also be affected by factors not limitedpresently known to those described below.us or that we currently consider to be not significant to our operations. Our business is also subject to general risks and uncertainties that maywhich broadly affect all companies. Furthermore, additional risks and uncertainties not currently known to us or that we currently deem to be immaterial (but that later become material) may also adversely affect our business.
General Overview. Our business environment is complex, dynamic and international. Accordingly, it is subject to a number of significant risks in the ordinary course of its operations. If we cannot or do not successfully manage the risks associated with the services we provide, our operations, business, operating results, reputation and/or financial condition could be materially and adversely affected.
One of the challenges of a global business such as ours is to determine in a sophisticated manner the critical enterprise risks that exist or may newly develop over time as our business evolves. We must then determine how best to employ reasonably available resources to prevent, mitigate and/or minimize those risks that we are able to identify as having the greatest potential to cause significant damage from an operational, financial, or reputational standpoint. An important dynamic we must also consider and appropriately manage is how much and what types of commercial insurance to obtain and how much potential liability may remain uninsured consistent with the infrastructure that is in place within the organization to identify and properly manage it.
Various factors over which we have no control significantly affect commercial real estate markets. These include:
Macro movements of the stock, bond, currency and derivatives markets
The political environment
Government policy and regulations, in each case whether at local, national or international levels
Interest rates and the availability of real estate debt financing for our clients
The cost and availability of natural and non-renewable resources used to operate real estate
Emerging technologies that are potentially disruptive
Governance over Enterprise Risk Management. In 2018, we continued to make enhancements to our enterprise risk management methodology across the globe. Through a framework and methodology designed to: (i) improve and align our understanding of the most significant risks facing us; (ii) improve decision making in governance, strategy, objective setting and day-to-day operations; (iii) decide on what actions to take to lessen the likelihood that significant risks will result in financial or reputational harm to us; and (iv) assign priorities and ownership for purposes of executing those actions. Based on the execution of the enterprise risk management framework and methodology, the top risks are then communicated to the GEB, the Audit Committee and the full Board.
Our Board and its Committees take active roles in overseeing management's identification, disclosure and mitigation of our enterprise risks. The Audit Committee focuses on the process by which management continuously identifies its enterprise risks and monitors the mitigation efforts that have been established. The Board focuses on substantive aspects of management's evaluation of our enterprise risks and the efforts we take to contain and mitigate them. The Compensation Committee and the Nominating and Governance Committee also monitor and discuss with management those risks that are inherent in the matters that are within each such Committee's purview.
As a regular part of its establishment of executive compensation, the Compensation Committee considers how the structuring of our compensation programs will affect risk-taking and the extent to which they will drive alignment with the long-term success of the enterprise and the interests of our shareholders.
In the normal course of its activities, our Nominating and Governance Committee reviews emerging best practices in corporate governance and stays abreast of changes in laws and regulations that affect the way we conduct our corporate governance, which represents another important aspect of overallOur ongoing enterprise risk management.management efforts have significantly shaped the following risk factors and their discussion.
Risk Mitigation Efforts. We do not attempt to discuss in this section all of the various significant efforts we employ to attempt to mitigate or contain the risks we identify, although we believe we have a robust program to do so in a systematic way. These efforts include: (i) the implementation of a continuously improving global safety management system focused on integrating best practice into our operations, including the elimination of hazards, the replacement of hazards with one that is manageable, training of personnel, and the review of our operating procedures; (ii) quarterly reviews of operational errors and litigation events so that we can consider whether there are steps we can take, such as changes to policies or additional staff training, that will prevent similar issues from recurring; (iii) monthly reviews by our global team of Ethics Officers of internal ethics matters (including the cost of investigating and resolving them) and general external ethics issues, as well as consideration of whether there are new or different activities we can establish within our Ethics Everywhere program in order to proactively address them; (iv) the risk mitigation activities and strategies deployed by our business, corporate staff functions and our internal auditors to coordinate enterprise risk mitigation and prevention across the Company; and (v) monthly reviews by our Cyber Committee to evaluate and adapt current prevention efforts and risk mitigation strategies against ever-changing cyber threats.
Seeking Opportunities in Risks. Risks in business can also mean opportunity if they can be translated into services that help clients mitigate their own risks and for which they are willing to pay fees that adequately compensate the provider for the risks being absorbed. An example of how we may be able to monetize the absorption of risks is our ability to charge fees for taking on, as principal, the risks of performance of subcontractors so that our clients do not have to bear them directly. Another example is our experience and ability to conduct business with integrity in emerging markets that are generally perceived to be less transparent. This allows us to charge fees to multi-national firms that want to expand their footprint into new markets with the assistance of service providers they can trust to protect their interests and act according to ethical and other best practices.
Categorization of Enterprise Risks. This section reflects our current views, as of the issuance of this report, concerning the most significant risks we believe our business faces, both in the short term and the long term. We do not, however, purport to include every possible risk from which we might sustain a loss. For purposes of the following analysis and discussion, we generally group the risks we face according to fourfive principal categories:
Operational Risk Factors
Strategic Risk Factors
Legal and Compliance Risk Factors
| | | | | |
| • Operational Risk Factors | • Financial Risk Factors |
| • Strategic Risk Factors | • General Risk Factors |
| • Legal and Compliance Risk Factors | |
We could appropriately place some of the risks we identify in more than one category, but we have chosen the one category we view as primary. We do not necessarily present the risks below in their order of significance, the relative likelihood that we will experience a loss, or the magnitude of any such loss. Certain of these risks also may give rise to business opportunities for us, but our discussion of risk factors in Item 1A is limited to the adverse effects the risks may have on our business.
Operational Risk Factors
Operational risk relates to risks arising from systems, processes, people and external events that affect the operation of our businesses. It includes information management and data protection and security, including cyber security; supply chain and business disruption, including health and safety; and other risks, including human resources and reputation.
REPUTATIONAL AND BRAND RISKS.
The value and premium status of our brand is one of our most important assets. An inherent risk in maintaining our brand is that we may fail to successfully differentiate the scope and quality of our service and product offerings from those of our competitors, or that we may fail to sufficiently innovate or develop improved products or services that will be attractive to our clients. In addition, given the rigors of the competitive marketplace in which we operate, there is the risk that we may not be able to continue to find ways to operate more productively and more cost-effectively, including by achieving economies of scale, or that we will be limited in our ability to further reduce the costs required to operate on a globally coordinated platform.
The rapid dissemination and increasing transparency of information, particularly for public companies, increases the risks to our business that could result from negative media or announcements about ethics lapses or other operational problems, which could lead clients to terminate or reduce their relationships with us. As such, any negative media, allegations or litigation against us, irrespective of the final outcome, could potentially harm our professional reputation and damage our business. We are also subject to misappropriation of one of the names or trademarks we own by third parties that do not have the right to use them so that they can trade off ofbenefit from the goodwill we have built up in our intellectual property, andproperty; further, our efforts to police usage of our intellectual property may not be successful in all situations.
OPERATIONAL TRANSFORMATION INITIATIVES.
Sustainable long-term growth and differentiating ourselves from our competitors depend on investments in people, technology, data and innovation-focused capital expenditures. We are undergoing a multi-year transformation to position for long-term profitable growth through ongoing investments focused on innovation and cutting-edge digital solutions as well as an enhanced operational platform. Over the courseIn 2018, we invested in transformation initiatives, such as our global enterprise resource planning implementation and client-facing technology; our patent for Blackbird, a proprietary visualization and data capability that enables quicker client site selection; and the creation of JLL Spark Global Venture Fund, which invests in technology focused on real estate. While we expect to realize efficiencies from these initiatives, there is no guarantee that we will recognize the full efficiency, cost reduction and other benefits of these activities that we expect. In connection with such activities, we may experience a disruption in our ability to perform functions critical to our strategy. If our business transformation initiatives are not successful, or if they are not executed effectively, our business, financial condition and results of operations could be adversely affected. These initiatives involve costs relating to hiring outside experts and implementing these projects, and could have unanticipated costs or unrealized savings. In particular, our transformation initiatives may fail, and our business and financial results may be adversely affected, if we are not able to carry out certain shifts in our corporate culture to achieve our transformation objectives.
COMPETITION FOR TALENT;TALENT WORLD-WIDE; EMPLOYEE RETENTION; DIVERSITY, EQUITY AND INCLUSION INITIATIVES; SUCCESSION OF KEY LEADERS.
We depend, in large part, on the members of our senior management team who possess extensive knowledge and a deep understanding of our business and strategy, as well as the colleagues who are critical to developing and retaining client relationships. Our business depends on the continued availability of skilled personnel with industry experience and knowledge, including our senior management team and other key employees. If we are unableOur success depends on the continued availability of skilled personnel with industry experience and knowledge, and our ability to recruit, attract and retain qualified personnel, or to successfully plan forsenior management and other key employees, including through the implementation of diversity, equity and inclusion initiatives, and the succession of employees holding key management positions,senior management. We are working to advance culture change through the continued implementation of diversity, equity and inclusion initiatives throughout our businessorganization. If we do not (or are perceived not to) successfully implement these initiatives, our ability to recruit, attract and operating results could suffer. retain talent may be adversely impacted.
There is a further risk of losing talent (and intellectual property and client contacts) to competitors, particularly in the context of increased use of social media networks and transparency of employment information. There is also the risk of losing top producers who provide a materialmeaningful margin contribution Company-wide.contribution. These risks increase as we continue to grow as an organization and increase the number of staff, which has expanded significantly over the past decade. There may also be an increase in recruitment and compensation costs. We and our competitors use equity incentives and
bonuses to help attract, retain and incentivize key personnel. As competition is significant for the services of such personnel, the expense of such incentives and bonuses may increase and we may be unable to attract or retain such personnel to the same extent that we have in the past. We are also challenged
The challenge to find and retain sufficiently trained staff in emerging marketsis world-wide and, as a result, we may need to provide our own training programs, which increase both our costs as well asincreases the risk of performance for clients. In particular,the current competitive labor market, labor and recruitment costs are rising and are expected to increase further. Corporate payrolls are likely to increase as greater competition for labor and social pressure to raise salaries in successful emerging markets suchline with productivity growth cause even greater wage inflation. It is increasingly challenging to predict regional and national labor policies, as India, attrition by highly informed and mobile staff is a challenge for all companies.well as regulations. The indirect implications of these changes are difficult to assess.
THIRD PARTY SPEND MANAGEMENT AND HEALTH AND SAFETY RISK.
We rely on third parties, and in some cases subcontractors, to perform activities on behalf of our organization to improve quality, increase efficiencies, cutreduce costs and lower operational risks across our business and support functions that are criticalfunctions. We have instituted a Vendor Code of Conduct, which is published in multiple languages on our website, and which is intended to communicate to our vendors the operationsstandards of conduct we expect them to uphold. Our contracts with vendors also generally impose a contractual obligation to comply with our Vendor Code. In addition, we leverage technology at an increasing rate to help us better screen vendors, with the aim of gaining a deeper understanding of the risks posed to our business to allow us to focus on our core business objectives.by potential and existing vendors. If our third parties do not have the proper safeguards and controls in place, or appropriate oversight cannot be provided, we could be exposed to increased operational, regulatory, financial or reputational risks. A failure by third parties to comply with service level agreements or regulatory or legal requirements in a high quality and timely manner, particularly during periods of peak demand for their services, could result in economic and reputational harm to us. In addition, these third parties face their own technology, operating, business and economic risks, and any significant failures by them, including the improper use or disclosure of our confidential client, employee or company information, could cause damage to our reputation and harm to our business.
Our contractors and their subcontractors are more integrated into our operations than ever before and, as a result, also involved in a significant proportion of the safety incidents we experience. Health and safety is a prominent part of our Beyond strategy, so we take steps to engage with our supply chain and improve our safety performance. This includes producing a dedicated Global Health and Safety Report detailing our approach to managing this important topic. Our goal is to ensure those we work and interact with are unharmed by our operations. We have a multi-disciplinary safety management structure, with executive sponsorship, aimed at managing existing and emerging health and safety risks, and achieving continuous improvement. Our structure aims to empower our workers and dedicated health and safety professionals to promote best practices. However, despite investment in our safety platform, management systems and vendor due diligence program, additional efforts are necessary to ensure vendors are aware of our high health and safety expectations.
WE FACE BUSINESS DISRUPTION AND RELATED RISKS RESULTING FROM HEALTH EPIDEMICS, ESPECIALLY THE NOVEL CORONAVIRUS (COVID-19) PANDEMIC.
Health epidemics that affect the general conduct of business in one or more urban areas (including as the result of travel restrictions and the inability to conduct face-to-face meetings) have occurred in the past, for example from influenza or COVID-19, and may occur in the future from other types of outbreak. Such instances can adversely affect the volume of business transactions, real estate markets and the cost of operating real estate or providing real estate services.
At present, efforts to contain and mitigate the COVID-19 pandemic are still occurring in many countries where we operate, including the United States. This year saw an increasing percentage of the global population receive a COVID-19 vaccine, but access and availability to COVID-19 vaccines and tests varies across geographies. New COVID-19 variants continue to emerge which, at times, has resulted in significant spikes in the number of local, regional, and global cases, and uncertainties exist as to the efficacy of vaccines against new variants or mutations of COVID-19. To mitigate the spread of COVID-19, local, state, and federal governments have imposed various restrictions on businesses, including closures, travel restrictions, vaccine and testing mandates, among other requirements.
While the increased availability of vaccines and vaccination rates gave rise to increased optimism in 2021, the pandemic continued to have a material effect on our financial results in 2021, although less pronounced of an impact on our financial results when compared against the prior year.
Although there has been an easing of restrictions in certain jurisdictions, some of these restrictions have been reinstated in other jurisdictions, or could be reinstated in the future, to manage a resurgence or new outbreak of COVID-19, including in connection with new variants or mutations of the virus. In addition, the reopening of businesses and economies in certain countries is creating a variety of new challenges, including, for example, higher prices for goods and services, limited availability of products, and disruptions to supply chains. Furthermore, our management team has spent, and will likely continue to spend, significant time, attention and resources monitoring the COVID-19 pandemic and seeking to manage its effects on our business and workforce. A long-term continuation of these restrictions could, among other things, negatively impact employee morale and productivity.
Significant uncertainty remains as to the full impact of the COVID-19 pandemic on our operations, and on the global economy as a whole, including potential short-term and long-term changes in commercial behavior. It is currently not possible to predict how long the pandemic will last or the time that it will take for economic activity to fully return to pre-pandemic levels. We expect the ultimate significance of the impact of these disruptions, including the extent of their adverse impact on our financial and operational results, will be dictated by the length of time that such disruptions continue, which will, in turn, depend on the currently unknowable duration of the COVID-19 pandemic and the impact of governmental regulations that might be imposed in response. COVID-19 also makes it more challenging for management to estimate future performance of our businesses, particularly over the near to medium term.
TECHNOLOGY AND INFORMATION SYSTEMS; CYBERSECURITY, MANAGEMENT OF DATA.
Our business is highly dependent on our ability to collect, use, store and manage organizational and client data to make business decisions and increase the efficiency and competitiveness of our operations.data. If any of our information and data management systems do not operate properly or are disabled, we could suffer a disruption of our businesses, liability to clients, loss of client data, loss of employee data, regulatory intervention, breach of confidentiality or other contract provisions, or reputational damage. These systems may fail to operate properly or become disabled as a result of events that are wholly or partially beyond our control, including disruptions of electrical or communications services, disruptions caused by natural disasters, political instability, terrorist attacks, sabotage, computer viruses, or problems with the internet, deliberate attempts to disrupt our computer systems through "hacking," "phishing," or other forms of cyber-attack, or our inability to occupy one or more of our office buildings.locations. As we outsource significant portions of our information technology functions to third-party providers, such as cloud computing, we bear the risk of having somewhat less direct control over the manner and quality of performance than we would if done by our own employees. An exampleperformance.
We are exposed to the risk of cyber attackscyber-attacks in the normal course of business. In general, cyber incidents can result from deliberate attacks or unintentional events. We have observedcontinue to observe an increased level of attentioncyber threats focused on cyber attacks that include gaining unauthorized access to digital systems for purposes of misappropriating assets or sensitive information, corrupting data, or causing operational disruption. During the last few years, some major corporationsThe risk of cyber threats also extends to suppliers and other entities have reported that they had experienced broad-based theft of customer and internal data, with material financial and reputational consequences. To the extent that our technology systems interact with thosevendors we engage on a principal basis to perform various services. Additionally, like many large enterprises, since 2020, a portion of our clients (including by way ofworkforce has worked remotely in some capacity in response to the “internet of things”), they mayCOVID-19 pandemic. This arrangement introduces potential new vulnerabilities to cyber threats. We also face similar potential problemsincreased cybersecurity risk as we deploy additional mobile and losses as the result of cyber attacks throughcloud technologies. We are continuously hardening our infrastructure built on these technologies, monitoring for threats, and evaluating our capability to respond to any incidents to minimize any impact to our systems, that then impact their systems. Certain high-profile cyber attacks at other firms have come through the systems of suppliers.
data, or business operations.
We have experienced various types of cyber-attack incidents, which to dateto-date have been contained and have not been material to the organizationus as a whole. As the result of such incidents, we have continued to implement new controls, governance, technical protections and other procedures. We may incur substantial costs and suffer other negative consequences such as liability, reputational harm and significant remediation costs and experience material harm to our business and financial results if we, or vendors or suppliers we engage on behalf of our clients, fall victim to other successful cyber attacks. Such negative consequences could include: remediation costs that may include liabilitycyber-attacks.
The legislative and regulatory framework for stolen moneyprivacy and data protection issues worldwide continues to evolve. We collect personally identifiable information ("PII") and other assets or information and repairing system damage that may have been caused; increased cyber-security protection costs that may include organizational changes, deploying additional personnel and protection technologies, training employees, and engaging third-party experts and consultants; lost revenues resulting from unauthorized use of proprietary information or the failure to retain or attract clients following an attack; litigation; and reputational damage adversely affecting client or investor confidence.
We are increasingly recognizing both the challenges and opportunities involved in mining the data in our systems so that we "know what we know" and can use that knowledge for the benefit of our clients and our organization in the most sophisticated possible ways.
The development of new software systems used to operate one or more aspectsas part of our business processes and activities. This data is complicated, particularly onsubject to a customized basis or in order to coordinate or consolidate financial, human resources or other typesvariety of infrastructure data reporting, client accounting, or funds processing. In addition, the effort may result in costs that we cannot recoup in the event of the failure to complete a planned software development. A new software system that has defects may cause reputational issuesU.S. and client or employee dissatisfaction and/or damages, with our incurring liabilities and/or experiencing lost business as possible results. The acquisition or development of software systems is often dependent to one degree or another on the quality, ability and/or financial stability of one or more third-party vendors, over which we may not have control beyond the rights we negotiate in our contracts.
Privacy regulations vary by jurisdiction (or across a region such as the European Union) and may restrict our ability to share or collect data on a global basis, and this may limit the utility of otherwise available technology. When we transfer data between countries and continents for the purpose of managing and reporting on our global business, both internally within JLL or LaSalle systems and externally through third-party providers, we are exposed to the risk that our systems and operations may not meet all of the data privacy and protection laws of the countries from which the data originates. Furthermore, third-party providers who previously relied on the EU-U.S. Safe Harbor framework have now had to find alternative methods to meet EU standards for data transfers in the wake of the European Commission’s invalidation of Safe Harbor in late 2015. Although we try to stay abreast of data privacy laws worldwide and keep track of our data flows in order to assess where and what compliance requirements apply, the rapid development and changes in systems and technology, along with corresponding changes inforeign laws and regulations, make this a difficult challenge. As one example, effective May 25, 2018,including oversight by various regulatory or other governmental bodies. Many foreign countries and governmental bodies have laws and regulations concerning the collection and use of PII and other data obtained from their residents or by businesses operating within their jurisdictions. The European Union General Data Protection Regulation, (GDPR) came into effectfor example, imposes stringent data protection requirements and the GDPR will replace the UK’s Data Protection Act 1998 (DPA). The GDPR has a greater territorial reach than existingprovides significant penalties for noncompliance. Any inability, or perceived inability, to adequately address privacy and data protection concerns, even if unfounded, or comply with applicable laws, regulations, policies, industry standards, contractual obligations, or other legal obligations (including at newly acquired companies) could result in additional cost and so will applyliability to many ofus or company officials, damage our contractsreputation, inhibit sales, and agreement around the world. We will be forced to update allotherwise adversely affect our agreements, which may take significant time and cost.
business.
CONCENTRATIONS OF BUSINESS WITH CORPORATE AND INVESTOR CLIENTS CAUSE INCREASED CREDIT RISK AND GREATER IMPACT FROM THE LOSS OF CERTAIN CLIENTS AND INCREASED RISKS FROM HIGHER LIMITATIONS OF LIABILITY IN CONTRACTS.
While our client base remains highly diversified across industries and geographies, weWe value the expansion of business relationships with individual corporate clients and institutional investors because of the increased efficiency and economics (both to our clients and us) that can result from developing repeat business and performing an increasingly broad range of services for the same client. Having increasingly large and concentrated clients also can lead to greater or more concentrated risks of loss if, among other possibilities, such a client (i) experiences its own financial problems, which can lead to larger individual credit risks; (ii) becomes bankrupt or insolvent, which can lead to our failure to be paid for services we have previously provided or funds we have previously advanced; (iii) decides to reduce its operations or its real estate facilities; (iv) makes a change in its real estate strategy, such as no longer outsourcing its real estate operations; (v) decides to change its providers of real estate services; or (vi) merges with another corporation or otherwise undergoes a change of control, which may result in new management taking over with a different real estate philosophy or in different relationships with other real estate providers. In the case of LaSalle, concentration of investor clients can also lead to fewer sources of investment capital, which can negatively affect assets under management in case a higher-volume client withdraws its funds or does not re-invest them. This is also the case within LaSalle's securities business and for JLL IPT,businesses which are both dependent on the continued ability and willingness of certain brokerage firms to attract investment funds from their clients.
In addition, competitive conditions, particularly in connection with increasingly large clients, may require us to compromise on certain contract terms with respect to the payment of fees, the extent of risk transfer, or acting as principal rather than agent in connection with supplier relationships, liability limitations, credit terms and other contractual terms, or in connection with disputes or potential litigation. Where competitive pressures result in higher levels of potential liability under our contracts, the cost of operational errors and other activities for which we have indemnified our clients will be greater and may not be fully insured.
The global economic downturn provided an example
Where we provide services to firms in the financial services industry, including banks and investment banks, we are experiencing indirectly the increasing extent of the regulatory environment to which they are subject in the aftermath of the global financial crisis. This increases the cost of doing business with them, which we are not always able to pass on, as the result of the additional resources and processes we are required to provide as a critical supplier. This dynamic has continued more recently with the privacy and cyber-security requirements within the financial services industry. We expect that Brexit will continue to result in changes in the dynamics of the financial industry in Europe, which will have consequences on the uses of real estate that we cannot yet foresee.
CONTRACTUAL LIABILITIES AS PRINCIPAL AND FOR WARRANTED PRICING.
We may, on behalf of our clients, hire and supervise third-party contractors to provide construction, engineering, maintenance and various other services for properties we are managing or developing on behalf of clients. Depending upon (i) the terms of our contracts with clients, which, for example, may place us in the position of a principal rather than an agent, or (ii) the responsibilities we assume or are legally deemed to have assumed in the course of a client engagement (whether or not memorialized in a contract), we may be subjected to, or become liable for, claims for construction defects, negligent performance of work, or other similar actions by third parties who we engage.
Adverse outcomes of property management disputes or litigation could negatively impact our business, operating results and/or financial condition, particularly if we have not limited in our contracts the extent of damages to which we may be liable for the consequences of our actions, or if our liabilities exceed the amounts of the commercial third-party insurance that we carry. Moreover, our clients may seek to hold us accountable for the actions of contractors because of our role as property manager even if we have technically disclaimed liability as a legal matter, in which case we may find it commercially prudent to participate in a financial settlement for purposes of preserving the client relationship.
Acting as a principal may also mean that we pay a contractor before we have been reimbursed by the client, which exposes us to additional risks of collection from the client in the event of a dispute with the client or an intervening bankruptcy or insolvency of the client. The reverse can occur as well, where a contractor we have paid files bankruptcy or commits fraud with the funds before completing a project for which we have paid it in part or in full. As part of our project management business, we may enter into agreements with clients that provide for a warranted or guaranteed cost for a project that we manage. In these situations, we are responsible for managing the various other contractors required for a project, including general contractors, in order to ensure that the cost of a project does not exceed the contract price and that the project is completed on time. In the event one of the other contractors on the project does not or cannot perform as a result of bankruptcy or for some other reason, we may be responsible for any cost overruns as well as the consequences for late delivery. In the event, for whatever reason we have not accurately estimated our own costs of providing services under warranted or guaranteed cost contracts, we may lose money on such contracts until such time as we can legally terminate them. Also, the application of indirect taxes, such as sales taxes, goods and services taxes, and value-added taxes may be less clear for these agreements, potentially impacting our margins.
During an economic downturn in a given country or region, we would expect to experience credit-related problems at a higher level than usual with vendors and contractors due to their increased financial instability. For example, this became a reality during the global financial crisis.
PERFORMANCE AND FIDUCIARY OBLIGATIONS UNDER CLIENT CONTRACTS; REVENUE RECOGNITION; SCOPE CREEP; RISING COST OF INSURANCE RESULTING FROM NEGLIGENCE CLAIMS; RESPONSIBILITY FOR SAFETY OF CONTRACTORS.CONTRACTORS; SCOPE CREEP.
In certain cases, we are subject to fiduciary obligations to our clients, which may result in a higher level of legal obligation compared to basic contractual obligations. These relate to, among other matters, the decisions we make on behalf of a client with respect to managing assets on its behalf or purchasing products or services from third parties or other divisions within our Company. Our services may involve handling substantial amounts of client funds in connection with managing their properties.
They may also involveproperties or complicated and high-profile transactions which involve significant amounts of money.transactions. We face legal and reputational risks in the event we do not perform, or are perceived to have not performed, under those contracts or in accordance with those obligations, or in the event we are negligent in the handling of client funds or in the way in which we have delivered our professional services. The increased potential for the fraudulent diversion of funds from a "hacking" or "phishing" attack exacerbates these risks.
We have certain business lines, such as valuations and lease administration, where the size of the transactions we handle is much greater than the fees we generate from them. As a result, the consequences of errors that lead to damages can be disproportionately large in the event our contractual protections or our insurance coverage are inadequate to protect us fully.
The precautions we take to prevent these types of occurrences, which represent a significant commitment of corporate resources, may nevertheless be ineffective in certain cases. Unexpected costs or delays could make our client contracts or engagements less profitable than anticipated. Any increased or unexpected costs or unanticipated delays in connection with the performance of these engagements, including delays caused by factors outside our control, could have an adverse effect on profit margins.
In the event we perform services for clients without executing sufficient contractual documentation, we may be unable to realize our full compensation potential or recognize revenue for accounting and reporting purposes, and we may not be able to effectively limit our liability in the event of client disputes. If we perform services for clients that are beyond, or different from, what were originally contemplated in the governing contracts (known as "scope creep"), we may not be fully reimbursed for the services provided, realize our full compensation potential or our potential liability in the case of a negligence claim may not have been as limited as it normally would have been or may be unclear.
If we make a large insurance claim on our professional indemnity policy due to a situation involving our negligence, we would expect subsequent premiums to increase materially, the size of deductibles we are required to retain could increase substantially, and the availability of future coverage could be negatively impacted.
ABILITY TO CONTINUE TO MAINTAIN SATISFACTORY INTERNAL FINANCIAL REPORTING CONTROLS AND PROCEDURES.
If we are not able to continue to operate successfully under the requirements of Section 404 of the United States Sarbanes-Oxley Act of 2002, or if there is a failure of one or more controls over financial reporting due to fraud, improper execution or the failure of such controls to adjust adequately as our business evolves, then our reputation, financial results and the market price of our stock could suffer. Our accounting can be complex and requires that management make judgments with respect to revenue recognition and other aspects of our business. While we believe that we have adequate internal financial reporting control procedures over financial reporting in place, we may be exposed to potential risks from this legislation, which requires companies to evaluate the effectiveness of their internal controls, and such internal control over financial reporting is subject to audit by their independent registered public accounting firm on an annual basis. We have evaluated our internal control over financial reporting as required for purposes of this Annual Report on Form 10-K for the year ended December 31, 2018. Our management concluded our internal control over financial reporting was effective as of December 31, 2018. Our independent registered public accounting firm has issued an unqualified opinion on the effectiveness of our internal control over financial reporting. However, there can be no assurance that we will continue to receive an unqualified opinion in future years, particularly since standards continue to evolve and are not necessarily being applied consistently from one independent registered public accounting firm to another. If we identify one or more material weaknesses in our internal control over financial reporting in the future that we cannot remediate in a timely fashion, we may be unable to receive an unqualified opinion at some time in the future from our independent registered public accounting firm with respect to our internal control over financial reporting.
CORPORATE CONFLICTS OF INTEREST.
All providers of professional services to clients, including our Company, must manage potential conflicts of interest. This occurs principally where the primary duty of loyalty we owe to one client may potentially be weakened or compromised by a relationship we also maintain with another client or third party. Corporate conflicts of interest arise in the context of the services we provide as a company to our different clients. Personal conflicts of interest on the part of our employees are separately considered as issues within the context of our Code of Business Ethics. Our failure or inability to identify, disclose and resolve potential conflicts of interest in a significant situation could have a material adverse effect.
An example of a In addition, it is possible that in some jurisdictions, regulations could be changed to limit our ability to act for certain parties where potential conflictconflicts may exist even with informed consent, which could limit our market share in those markets. There can be no assurance potential conflicts of interest situation is that in the ordinary course of its business, LaSalle hires property managers for the investment properties it holds on behalf of clients. In that case, LaSalle may hire JLL to provide such services, or it may hire a firm that is a competitor of JLL. In the event it retains JLL, it may appear to have a conflict of interest with respect to the selection. As a fiduciary with respect to its client funds, LaSalle resolves such potential conflicts by acting independently of JLL and following certain internal procedures designed to select the service provider that can best represent the interests of the investment management client or fund.
Another example is that in certain countries, based upon applicable regulations and local market dynamics, we have established alliances or other arrangements with insurance brokers through which insurance coverage is offered to clients, tenants in buildings we manage, and vendors to those buildings. Although we fully disclose our arrangements and dowill not require anyone to use the insurance services, JLL has a financial interest in the placement of insurance with such third parties, and therefore we may be deemed to have certain conflicts of interest.
There are occasions when one JLL team represents the landlord of a building in leasing its space and a separate JLL team represents a tenant that is considering, or selects, space in that building. In those situations, we fully disclose our dual roles to both clients, obtain their informed consent to continue and put "ethical wall" and other protections in place (such as ring-fenced compensation protocols) so that each client benefits from the zealous representation by its JLL team.adversely affect us.
After reductions in the market values of the underlying properties, firms engaged in the business of providing valuations are inherently subject to a higher risk of claims with respect to conflicts of interest based on the circumstances of valuations they previously issued. Regardless of the ultimate merits of these claims, the allegations themselves can cause reputational damage and can be expensive to defend in terms of counsel fees and otherwise.
CLIENT AND VENDOR DUE DILIGENCE.
There are circumstances where the conduct or identity of our clients could cause us reputational damage or financial harm or could lead to our non-compliance with certain laws. An example would be the attempt by a client to "launder" funds through its relationship with us, namely to disguise the illegal source of funds that are put into otherwise legitimate real estate investments. Additional examples are (i) our inadvertently doing business with a client that has been listed on one of the "prohibited persons" lists now issued by many governments around the world and (ii) our inadvertently doing business with a private client or governmental entity within a country that is prohibited under applicable regulations such as those published in the United States by the Office of Foreign Asset Control ("OFAC"). We may also from time to time legally invest the sovereign wealth funds of a government entity client which is subsequently deemed to be inappropriate either from a reputational or legal standpoint.
Similar problems can arise with respect to the vendors or suppliers we hire to provide services or products to us or for our clients. In the normal course of business, we spend significant amounts in order to purchase goods and services for the properties we manage on behalf of clients. A potential problem would be an intermediary that makes illegal payments on our behalf or on behalf of a client, even where contrary to our stated policies and to our specific agreement with such intermediary, under the U.S. Foreign Corrupt Practices Act or the U.K. Bribery Act.
Our efforts to evaluate clients, vendors and government entities before doing business with them to avoid conducting business with a prohibited party, or within a prohibited country, and to avoid attempts to launder money, make bribery payments or otherwise to exploit their relationship with us may not be successful in all situations since compliance for a business such as ours is very complex and also since we take a risk-based approach to the procedures we have employed. The ability to conduct due diligence is inherently diminished in less-developed countries with lower levels of transparency and fewer public records.
In addition, it is not always possible to accurately determine the ultimate owners or control persons within our clients' organizations or other entities with which we do business, particularly if they are actively attempting to hide such information from regulatory authorities. We may therefore unknowingly be doing business with entities that are otherwise involved in illegal activities that do not involve us or that are ultimately controlled by persons with whom engaging in business has been prohibited by applicable regulatory authorities.
DIFFICULTIES AND COSTS OF STAFFING AND MANAGING INTERNATIONAL OPERATIONS.
The coordination and management of international operations pose additional costs and difficulties. We must manage operations that are in many time zones and that involve people with language and cultural differences. Our success depends on finding and retaining people who will deal with these challenges effectively, who will represent us with the highest levels of integrity, and who will communicate and cooperate well with colleagues and clients across multiple geographies. If we are unable to attract and retain qualified personnel, or to successfully plan for succession of employees holding key management positions, our growth may not be sustainable, and our business and operating results could suffer. These risks increase as we continue to grow as an organization and increase the number of staff, which has expanded significantly over the past decade.
Among the challenges we face in retaining our people is maintaining a compensation system that rewards them consistent with local market practices and with our profitability. This can be especially difficult where competitors may be aggressively attempting to hire our best people at rates of compensation that are well above the current market level. Another continuing challenge we have is to maintain compensation systems that align financial incentives with our strategic goals as an organization and the business and ethics behaviors we want to drive among our people, while at the same time not creating incentives to engage in overly risky business pursuits or behaviors. How we manage compensation, our biggest expense, can significantly affect our financial results.
We have committed resources to effectively coordinate our business activities around the world to meet our clients' needs, whether they are local, regional, or global. We also consistently attempt to enhance the establishment, organization and communication of corporate policies, particularly where we determine that the nature of our business poses the greatest risk of noncompliance. The failure of our people to carry out their responsibilities in accordance with our client contracts, our corporate and operating policies, our standard operating procedures, or their negligence in doing so, could result in liability to clients or other third parties, which could have a material adverse effect. This is true, not only with respect to individuals we employ directly, but also with individuals who work for third-party vendors whom we manage on behalf of clients, especially where we are acting in a principal capacity.
We believe these risks may be higher for our company than for others given that the nature of our business requires our people to be spread across numerous corporate offices and client facilities globally, which makes communications and consistency of standards more challenging. In addition, the nature of our global outsourcing business means that we regularly must on-board significant numbers of new staff at one time as part of the transition into our company of new global accounts, which again makes communications of our policies and driving performance consistency particularly challenging.
Employees we hire may be subject to restrictions under employment agreements with previous employers that can restrict their activities, and therefore their contributions, for a period of time after they join us. For example, they may be prohibited from soliciting business from certain clients, or from soliciting other individuals to join us as employees.
In the event that we would have to restructure an organization when faced with a downturn in economic conditions or activity, we would need to take into account the employment laws of the countries in which such actions would be contemplated. In some cases, a restructure could result in significant costs, time delays in implementing headcount adjustments and, potentially, litigation regarding allegedly improper employment practices.
Labor costs are rising in emerging economies and are expected to increase further. Corporate payrolls are projected to increase as greater competition for labor and social pressure to raise salaries in line with productivity growth cause even greater wage inflation. It is becoming increasingly challenging to predict regional and national labor policies, and regulations are becoming increasingly hard to predict. The potential indirect implications of these changes are difficult to assess. For example, rising employment costs for clients could bring about an increase in outsourcing that could benefit our business.
Similarly, changes in immigration regulations are becoming increasingly hard to predict, and also as the result of the Brexit vote in the United Kingdom. This may impact our ability, not only to run day-to-day operations with key resources traveling to and from the United States and the United Kingdom, but also in the longer term, our ability to attract and retain some of our key talent working in or in connection with either of those countries.
EMPLOYEE, VENDOR AND THIRD-PARTY MISCONDUCT.
Like any business, we run the risk that employee fraud or other misconduct could occur. In a company such as ours with approximately 90,000 employees, it is not possible to successfully deter all employee misconduct, and the precautions we take to prevent and detect this activity may not be effective in all cases. Employee misconduct, including fraud and involvement in incoming or outgoing bribery situations, can cause significant financial or reputational harm to any business, from which full recovery cannot be assured. We also may not have insurance that covers any losses in full or that covers losses from particular criminal acts.
Because we often hire third-party vendors and suppliers to perform services for our own account or for clients, we are also subject to the consequences of fraud, bribery, or misconduct by employees of our vendors, which also can result in significant financial or reputational harm (even if we have been adequately protected from a legal standpoint). We have instituted a Vendor Code of Conduct, which is published in multiple languages on our public website, and which is intended to communicate to our vendors the standards of conduct we expect them to uphold. Our contracts with vendors also generally impose a contractual obligation to comply with that Vendor Code. In addition, we are investing in technology to help us better screen vendors, with the aim of gaining a deeper understanding of the risks posed to our business by potential and existing vendors.
Anecdotally, the risk that we will be the victim of fraud, both from employees and third parties, is generally thought to increase during times of broad economic stress. An example of a third-party fraud would be attempts to draw on bank accounts by way of forged checks or by corporate identity theft, increasingly including cyber attacks by way of "hacking" or "phishing" methods. We have increasingly experienced both types of attempts in recent years and have realized losses from some of them, although none has caused us material financial loss.
SCRUTINY OF EXECUTIVE COMPENSATION PROGRAMS; AND INFLUENCE OF SHAREHOLDER ADVOCACY GROUPS.
In recent years, there has been increasing scrutiny of the executive compensation practices of all public companies in the United States. Shareholders have been given increasing rights to vote on the acceptability of pay practices and the issuance of equity compensation. Independent shareholder advocacy groups have also had increasing influence on the decisions of institutional investors on how to vote on executive compensation matters. In connection with our 2017 Annual Meeting, we received public criticism of our executive pay levels and compensation policies from one of our larger shareholders. Since we
have always greatly valued the input and feedback of our shareholders, especially as it relates to corporate governance, we revisited our executive compensation program based in part on feedback we have received from our shareholders. Changes to our pay practices or our ability to issue equity compensation to executives or otherwise to deduct executive compensation may make it difficult to retain our executives or we could experience additional tax costs with respect to our compensation programs.
Strategic Risk Factors
Strategic risk relates to JLL’s future business plans and strategies, including the risks associated with: the global macro-environment in which we operate; mergers and acquisitions and restructuring activities; intellectual property; and other risks, including the demand for our services, competitive threats, technology and innovation, and public policy.
DISRUPTIVE TECHNOLOGIES, INNOVATION AND COMPETITION.
Mobile technologies and online collaboration tools are transforming how business gets done. Information technology has entered a “big data” era. Process power and data storage are becoming almost free; networks and the cloud provide global access and a wide range of services; social media is pervasive in the global society, and work and cybersecurity is increasingly important as "hacking" and "phishing" become more sophisticated. The evolution of digital and information technology presents significant challenges for businesses and societies, which must find ways to capture the benefits of new technologies while dealing with the new threats that those technologies present. Within the Real Estate Servicesreal estate services industry, managing big data is a critical competitive differentiator and we risk being surpassed if our peers leverage big data more effectively.
ABILITY TO PROTECT INTELLECTUAL PROPERTY; INFRINGEMENT OF THIRD-PARTY INTELLECTUAL PROPERTY RIGHTS.
Our business depends, in part, on our ability to identify and protect proprietary information and other intellectual property such as our service marks, domain names, client lists and information, business methods and technology innovations, and platforms that we may create or acquire. Existing laws of some countries in which we provide or intend to provide services, or the extent to which their laws are actually enforced, may offer only limited protections of our intellectual property rights. We rely on a combination of trade secrets, confidentiality policies, non-disclosure and other contractual arrangements, and on patent, copyright and trademark laws to protect our intellectual property rights. In particular, we hold various trademarks and trade names, including our principal trade names, "JLL" and "LaSalle." If either of our registered trade names were to expire or terminate, our competitive position in certain markets could be materially and adversely affected. Our inability to detect unauthorized use (for example, by current or former employees) or take appropriate or timely steps to enforce our intellectual property rights may have an adverse effect on our business.
We cannot be sure that the intellectual property that we may use in the course of operating our business or the services we offer to clients do not infringe on the rights of third parties, although, in order to mitigate the risk,parties. Although, we do obtain from the licensors representations and warranties, as well as indemnities, which they do not infringe.from the licensors in order to mitigate this risk. We may have infringement claims asserted against us or against our clients. These claims may harm our reputation, cost us money and prevent us from offering some services.
Confidential intellectual property is increasingly stored or carried on mobile devices, such as laptop computers, tablets and smartphones, which makes inadvertent disclosure more of a risk in the event the mobile devices are lost or stolen and the information has not been adequately safeguarded or encrypted. This also makes it easier for a third party with access to our systems, or a third party who gains unauthorized access by "hacking," "phishing," or other type of cyber-attack, to steal information and use it to the disadvantage of our company, our clients, or our people. We believe that the risk from cyber attacks has increased significantly as major firms and other entities during the past few years reported that they had experienced broad-based theft of customer and internal data, with material financial and reputational consequences. We have experienced various types of cyber-attack incidents, which to-date have been contained and have not been material to the organization as a whole. As a result, we have continued to implement new governance, technical protections and other procedures.
Advances in technology, which permit increasingly large amounts of information to be stored on smaller devices or on third-party "cloud" servers, as well as the proliferation of social media techniques, tend to exacerbate these risks. On the other hand, cloud capabilities also allow us to conduct more monitoring of our email and other knowledge storing mechanisms to pro-actively detect misuse of our intellectual property. We have and continue to enhance certain additional monitoring systems, as well as various data analytics designed to detect potential conflicts of interests and other inappropriate behaviors. While we believe these activities are beneficial from the perspective of protecting our assets, including clients' intellectual property to which we may have access, they carry certain risks related to compliance with privacy and other applicable regulations in certain countries.
GENERAL ECONOMIC CONDITIONS AND REAL ESTATE MARKET CONDITIONS.CONDITIONS; SUPPLY-CHAIN PRESSURES
The success of our business is significantly related to general economic conditions, andconditions. Further, our business and financial conditions correlate strongly to local, national and nationalregional economic and political conditions or, at least, to the perceptions of and confidence of investors and users as to the relevant economic outlook. For example, corporations may be hesitant to expand space or enter into long-term commitments if they are concerned about the general economic or political environment. Corporations that are under individual financial pressure for any reason, or are attempting to more aggressively manage their expenses, may (i) reduce the size of their workforces, (ii) reduce spending on capital expenditures, including with respect to their offices, (iii) permit more of their staff to work from home offices and/or (iv) seek corresponding reductions in office space and related management services.those conditions.
We have previously experienced and expect in the future that we will be negatively impacted by periods of economic slowdown or recession and corresponding declines in the demand for real estate and related services. The global economic crisis during the 2007-2009 period was extraordinary for its worldwide scope, severity and impact on major financial institutions, as well as for the extent of governmental stimulus and regulatory responses. From 2011 through the first part of 2016, core real estate markets in the major urban centers of most countries were supported by the low interest rates promoted by central banks. While interest rates in certain countries have rebounded to an extent through the end of 2018, the interest rate environment across the globe is quite low in a historical context. These dynamics have been favorable to our LaSalle business, particularly as they have helped us raise new capital to invest and sell properties into strong markets, which benefits our clients and generates incentive fees and equity earnings. However,Since then, many of our markets have been affected generally by various geo-political and economic uncertainties, among them: the vote in June 2016 by the United Kingdom to leave the European Union; trade tensions; instability in the Middle East that has exacerbated the randomness in other parts of the world (such as France and Germany) of terrorism and caused pressures from an immigration perspective (such as in the European Union countries); continued significant volatility in energy costs, including oil and commodity prices; the developing effects of climate change and severe weather; and the continued uncertainty on the direction of global tax policy; andpolicy. Most recently, we have continued to assess the continuing uncertainty about the directionpotential adverse effects of the politicalongoing global COVID-19 pandemic on general economic conditions and increased supply-chain pressures which have emerged and may impact our ability to deliver goods and services to our clients.
In this environment, in many countries.
Although we have been able to continuecontinued to grow our business largely by gaining market share and as the result of targeted acquisitions, itacquisitions. It is inherently difficult for us to predict how these types of significant global forces will affect our business in the future and whether we will continue to be able to generate revenue growth to the same extent as we have in the past.
The speed with which markets change, both positively and negatively, has accelerated due to the increased global interconnectivity that has resulted from the immediacy and availability of information permitted by the Internet and social media, among other reasons. This has added to the challenges of anticipating and quickly adapting to changes in business and revenue, particularly since real estate transactions are inherently complicated and longer-term in nature.
Negative economic conditions and declines in demand for real estate and related services in several markets or in significant markets could have a material adverse effect on our performance asdriven by (i) a result of the following factors:
Decline in Acquisition and Disposition Activity
A general decline in acquisition and disposition activity, for commercial real estate can lead to(ii) a reduction in the fees and commissions we receive for arranging such transactions, as well as in fees and commissions we earn for arranging financing for acquirers. This can affect both our Capital Markets business and LaSalle business, although not necessarily always negatively. For example, major credit contractions, such as those that took place during the 2008 global financial crisis, negatively impact real estate pricing and transaction volumes, which reduced our Capital Markets transaction fees. Higher interest rates, which increase the cost of debt financing to clients, will also negatively impact transaction volumes. However, a continued bias by investors toward conservatism means their appetite for core investment products, a LaSalle strength, remains noticeably higher than for opportunistic or speculative products.
Decline in Real Estate Values and Performance, Leasing Activity and Rental Rates
A general decline in the value and performance of real estate and in rental rates can lead to a reduction in both (i) investment management fees, a significant portion of which are generally based on the performance of investments and net asset values, and (ii) the value of the co-investments we make with our investment management clients. In addition, such declines can lead to a reduction in fees and commissions that are based on the value of, or revenue produced by, the properties to which we provide services. This may include fees and commissions (i) for property management and valuations, (ii) generated by our Capital Markets service line and other businesses for arranging acquisitions, dispositions and financings, and (iii) for arranging leasing transactions. Such declines can also lead to an unwillingness or inability of clients to make new (or honor existing) capital commitments to funds sponsored by our investment management business, which can result in a decline of both investment management fees and incentive fees, and can also restrict our ability to deploy capital for new investments in current funds or establish new funds.
Historically for organizations in our industry, a significant decline in real estate values inand performance, leasing activity and rental rates, (iii) a given market has also generally tended to result in increased litigation and claims regarding advisory and valuation work performed prior to the decline, as well as pressure from investment management clients regarding performance.
Decline in Value of Real Estate Securities
A general decline in the value of real estate securities, (for example, REITs) will have a negative effect on(iv) the value of the portfolios that our LaSalle business manages, on any securities held in accounts that LaSalle manages, and therefore the fees we earn on assets under management. In addition, a general decline in the value of real estate securities could negatively impact the amount of money that investors are willing to allocate to real estate securities and the pace of engaging new investor clients.
Cyclicality in the Real Estate Markets; Lag in Recovery Relative to Broader Markets
Cyclicalitycyclicality in the real estate markets; lag in recovery relative to broader markets, may lead to cyclicality in our earnings and significant volatility in our stock price, which in recent years has continued to be highly sensitive to market perceptionor (v) the effect of both the global economy and our industry. This volatility was evident during the significant stock market decline at the beginning of 2016, when JLL’s stock declined significantly even though our underlying business realized record-setting performance in 2015. Real estate markets are also thought to "lag" the broader economy. As such, even when underlying economic fundamentals improve in a given market, it may take additional time for these improvements to translate into strength in real estate markets. This may be exacerbated when banks delay their resolution of commercial real estate assets whose values are less than their associated loans.
Effect of Changes in Non-Real Estate Markets
Changeschanges in non-real estate markets can also affect our business in different ways for different types of investors. For example, relative strength in the equity markets can lead certain investors to lower the level of capital allocated to real estate, which in turn can mean that our ability to generate fees from the operation of our investment management business will be negatively impacted. Strength in the equity markets can also negatively impact the perception of relative performance of real estate as an asset class, which in turn means that the incentive fees relating to the performance of our investment funds may be negatively impacted. Offsetting these factors, a low interest rate environment, as we have experienced in recent years, can make yields from real estate more attractive compared to bonds, which has supported REIT stocks.
markets.
POLITICAL AND ECONOMIC INSTABILITY AND TRANSPARENCY: PROTECTIONISM; TERRORIST ACTIVITIES; HEALTH EPIDEMICS.ACTIVITIES.
Global events could affect our business. These include the possibility of protectionist economic policies of the United States or foreign governments, the escalation of terrorist attacks and their increasing unpredictability, health epidemics, changing immigration policies of the United States or foreign governments and the increasing globalization of our multinational clients, which creates pressure to further expand our own geographical reach into less developed countries.
We provide services in over 80 countries with varying degrees of political and economic stability and transparency. For example, within the past few years, certain Middle Eastern, Asian, European and South Americanemerging as well as mature countries in which we operate have experienced serious political and economic instability that will likely continue to arise from time to time in countries in which we have operations. Throughout 2018, the results of the Brexit vote and aftermath in the United Kingdom created uncertainties about its political and economic future direction. It is difficult for us to predict where or when a significant change in the political leadership or regime within a given country may occur, or the implications of such a change on our operations given that legislative, regulatory, tax and business environments can change quickly and dramatically. For example, continuing political activities in Russia, Turkey, Brazil, and separately in various Middle Eastern countries, have significantly disrupted business activity in those countries. Also, intime. In recent years there have been significant political changes in a number ofseveral countries including, India, Brazil and the United States as examples,where we have significant operations, resulting in changes to financial, tax, tariffs, healthcare, governance, immigration and other laws that may directly affect our business and continue to evolve.
Our ability to operate inThe withdrawal of the ordinary course of businessUnited Kingdom from the European Union on January 31, 2020 (Brexit) and our willingness to commit new resources or investments may be affected or disrupted in one way or another, such as reductions in revenue, increases in taxes (due to more aggressive taxation policies), increases in other expenses (such asthe ongoing uncertainty with respect to employee healthcare), restrictionsthe future relationship of the United Kingdom and the European Union, notwithstanding the impact of the provisional free-trade agreement entered into between the United Kingdom and the European Union on repatriating funds, difficultiesDecember 24, 2020, may adversely affect business activity, political stability and economic conditions in collecting receivables from clients, difficulties in recruiting staff, increased corruption, or other material adverse effects.
In the event that governments engage in protectionist policies which favor local firms over foreign firms or which restrict cross-border capital flows, our ability to utilizeUnited Kingdom, the European Union and benefit from our global platformelsewhere. The economic conditions and integrated business modeloutlook could be further adversely affected. The global financial crisis in Russia, Greeceaffected by (i) new or modified trading arrangements between the United Kingdom and Venezuela significantly added to other countries, (ii) the deficit spending of certain governments in countries where we do business, and also called into question the creditworthiness of some countries. While the U.S. Federal Reserve loosened its monetary policies through low interest rates and quantitative easing programs for a number of years, some European governments instituted austerity programs in an effort to contract spending and avoid defaults on sovereign debt, some of which resulted in social unrest. The social unrest resulting from the implementation of the austerity programs has diminished, and some European countries seem to have emerged successfully as they have also more recently loosened their own monetary policies. There has been some speculationrisk that one or more other European Union countries may stop usingcould come under increasing pressure to leave the European Union, or (iii) the risk the euro as theirthe single currency of the Eurozone could cease to exist. Any of these developments, or that additional countries may exitthe perception any of these developments are likely to occur, could significantly affect economic growth or business activity in the United Kingdom or the European Union, and could result in the wakerelocation of businesses, cause business interruptions, lead to economic recession or depression, and impact the stability of the Brexit vote. The United Statesfinancial markets, availability of credit, currency exchange rates, interest rates, financial institutions, and the European Union have instituted various sanctions against Russia as a resultpolitical, financial and monetary systems. Any of that country's actions with respect to Ukraine and Crimea. It is inherently difficult to predict what the consequences to our business may be from these situations as they develop further.
In addition, terrorist activities have escalated in recent years, have become increasingly unpredictable, and at times have affected cities in which we operate. There have been serious situations in cities where we have operations including: Paris, Barcelona, Berlin, Brussels, Nice, Istanbul, Orlando, Las Vegas and Stockholm. To the extent that similar terrorist activities continue to occur, they may adverselydevelopments could affect our business because they tend to target the same typebusinesses, liquidity, results of high-profile urban areas in which we do business.
Health epidemics that affect the general conduct of business in one or more urban areas (including as the result of travel restrictionsoperations and the inability to conduct face-to-face meetings), such as occurred in the past from influenza, or may occur in the future from other types of outbreak, can also adversely affect the volume of business transactions, real estate markets and the cost of operating real estate or providing real estate services.
The increasing globalization of our multinational clients creates pressure to further expand our own geographical reach into less developed countries, including for example within Africa, which tends to exacerbate the above risks. As we continue to provide services in countries that have relatively higher security risks and lower levels of transparency, our exposure to the risks inherent in doing business in less developed markets increases.
financial position.
REAL ESTATE SERVICES AND INVESTMENT MANAGEMENT MARKETS ARE HIGHLY COMPETITIVE.
We provide a broad range of commercial real estate and investment management services. There is significant competition on international, regional and local levels with respect to many of these services and in commercial real estate services generally. Depending on the service, we may face significant competition from other real estate service providers, institutional lenders, insurance companies, investment banking firms, investment managers, accounting firms, technology firms, consulting firms, co-locating providers, temporary space providers and firms providing outsourcing of various types (including technology and building products), any of which may be a global, regional or local firm, and from firms that self-provideself-perform their real estate services with in-house capabilities.
Many of our competitors are local or regional firms. Although theyfirms, which may be substantially smaller in overall size than we are they may bebut hold a larger than we are inshare of a specific local or regional market. Some of our competitors have expanded the services they offer in an attempt to gain additional business. Some may be providing outsourced facility management services to sell clients products (such as HVAC systems or food services) that we do not offer. In some sectors of our business, particularly Corporate Solutions,Work Dynamics, some of our competitors may have greater financial, technical and marketing resources, larger customer bases, and more established relationships with their customers and suppliers than we have. Larger or better-capitalized competitors in those sectors may be able to respond faster to the need for technological change, price their services more aggressively, compete more effectively for skilled professionals, finance acquisitions more easily, develop innovative products more effectively, and generally compete more aggressively for market share. This can also lead to increasing commoditization of the services we provide and increasing downward pressure on the fees we can charge.
New competitors, or alliances among competitors that increase their ability to service clients, could emerge and gain market share, develop a lower cost structure, adopt more aggressive pricing policies, aggressively recruit our people at above-market compensation, develop a descriptive technology that captures market share, or provide services that gain greater market acceptance than the services we offer. Some of these may come from non-traditional sources, such as information aggregators or digital technology firms. To respond to increased competition and pricing pressure, we may have to lower our prices, loosen contractual terms (such as liability limitations), develop our own innovative approaches to mining data and using information, develop our own disruptive technologies, or increase compensation, which may have an adverse effect on our revenue and profit margins. We may also need to become increasingly productive and efficient in the way we deliver services, or with respect to the cost structure supporting our businesses, which may in turn require more innovative uses of technology as well as data gathering and data mining.
Our industry has continued to consolidate, as evidenced by alliances in recent history that have resulted in the Newmark Knight Frank business and the merger first between DTZ and Cassidy Turley and then between DTZ and Cushman & Wakefield. In December 2017, Newmark Group, Inc., a subsidiary of BGC Partners, Inc. (“BGC”) which acquired Newmark Grubb Knight Frank, announced the closing of its initial public offering dropping the name Grubb in preparation for the public offering. Cushman & Wakefield ("CWK") announced the closing of its initial public offering and began trading in the third quarter of 2018. Therethere is an inherent risk that competitive firms may be more successful than we are at growing through merger and acquisition activity. While we have successfully grown organically and through a series of acquisitions, sourcing and completing acquisitions are complex and sensitive activities. In light ofConsidering the continuing need to provide clients with more comprehensive services on a more productive and cost-efficient basis, we expect acquisition opportunities to continue to emerge. We are considering, and will continue to consider, acquisitions that we believe will strengthen our market position, increase our profitability, and supplement our organic growth. However, there is no assurance that we will be able to continue our acquisition activity in the
future at the same pace as we have in the past, particularly as we weigh acquisition opportunities against other potential uses of capital for technology and other investments in systems and human resources, as well as returning capital to shareholders.
Various factors may in some cases lead to a willingness on the part of a competitor to engage in aggressive pricing, advertising or hiring practices in order to maintain market share or client relationships. To the extent this occurs, it increases the competitive risks and the fee and compensation pressures we face, although ramifications will differ from one competitor to another given their different positions within the marketplace and their different financial situations.
We are substantially dependent on long-term client relationships and on revenue received for services under various service agreements. Many of these agreements may be canceled by the client for any reason with as little as 30 to 60 days' notice, as is typical in the industry. In this competitive market, if we are unable to maintain these relationships or are otherwise unable to retain existing clients and develop new clients, our business, results of operations and/or financial condition may be materially adversely affected. Weaknesses in the markets in which they themselves compete may lead to additional pricing pressure from clients as they themselves came under financial pressure. While conditions across the globe were strong during 2018, they could decline in the wake of continuing political and economic uncertainties within the European Union, the United States, China, India, Russia, or the Middle East, including as a result of volatility in oil and commodity prices, changes in trade policies, and other political and commercial factors over which we have no control.
THE SEASONALITY OF OUR REAL ESTATE SERVICES BUSINESS EXPOSES US TO RISKS.
Within our Real Estate Services business, our revenue and profits have historically grown progressively by quarter throughout the year. This is a result of a general focus in the real estate industry onyear mostly due to completing or documenting transactions by fiscal year-end and the fact that certain of our expenses are constant through the year. Historically, we have reported a relatively smaller profit in the first quarter and then increasingly larger profits during each of the following three quarters, excluding the recognition of investment-generated performance fees and co-investment equity gains or losses, each of which can be particularly unpredictable.vary from period to period.
The seasonality of our business makes it difficult to determine during the course of the year whether planned results will be achieved, and thus to budget, and to adjust to changes in expectations. In addition, negative economic or other conditions that arise at a time when they impact performance in the fourth quarter, such as the particular timing of when larger transactions close or changes in the value of the U.S. dollar against other currencies occur, may have a more pronounced impact than if they occurred earlier in the year. To the extent we are not able to identify and adjust for changes in expectations, or we are confronted with negative conditions that inordinatelydisproportionately impact the fourth quarter of a calendar year, we could experience a material adverse effect on our financial performance.
Growth in our property management and integrated facilities management businesses and other services related to the growth of outsourcing of corporate real estate services has, lessened, to an extent, lessened the seasonality in our revenue and profits during the past few years. However,several years, partially offset by certain acquisitions of heavily-weighted transaction-based companies, most notably HFF, Inc. in 2019. While the ongoing effects of COVID-19 continued to impact the historic seasonality of our business into 2021, though to a lesser extent than it did in 2020, we believe that some level of seasonality will always be inherent to our industry and outside of our control, as was the case in 2018. We are unable to predict whether the dynamic nature of the markets in which we operate, or any change in their economic or political structures, will have a material effect on the historical seasonality of our business in 2019 and beyond.control.
RISKS INHERENT IN MAKING ACQUISITIONS AND ENTERING INTO JOINT VENTURES.
Historically, a significant component of our growth has been generated by acquisitions. Any future growth through acquisitions will depend in part on the continued availability of suitable acquisitions at favorable prices and with advantageous terms and conditions, which may not be available to us. Over the last ten years, we completed nearly 90 acquisitions as part of our global growth strategy, with 48 acquisitions completed in 2015 and 2016. In 2017 and 2018, we intentionally reduced the pace of acquisitions to focus on the continued integration of companies we previously acquired.
Acquisitions subject us to a number ofseveral significant risks, any of which may prevent us from realizing the anticipated benefits or synergies of the acquisition. The integration of companies is a complex and time-consuming process that could significantly disrupt the businesses of JLL and the acquired company. The challenges involved in integration and realizing the benefits of an acquisition include:
Diversioncompany such as: diversion of management attention, and financial resources from existing operations
Difficulties in integrating cultures, compensation structures, operations, existing contracts, accounting processes and methodologies, technology, and in realizing the anticipated synergies of the combined businesses
Failurefailure to identify potentialcertain liabilities and issues during the due diligence process,
Failure to identify improper accounting practices during and the due diligence process
Inabilityinability to retain the management, key personnel and other employees of the acquired business
Inability to retain clients of the acquired business
Exposure to legal, environmental, employment, professional standards, bribery, money-laundering, ethics, antitrust and other types of claims for improper activities of the acquired business prior to acquisition, including those that may not have been adequately identified during the pre-acquisition due diligence investigation or those which the legal documentation associated with the transaction did not successfully terminate or transfer
Addition of business lines in which we have not previously engaged or geographical locations where we have not previously conducted business
Potential impairment of intangible assets, which could adversely affect our reported results
Our failure to meet the challenges involved in successfully integrating our operations with those of another company or otherwise to realize any of the anticipated benefits of an acquisition could have a material adverse effect. Liabilities that we may either knowingly or inadvertently assume may not be fully insured. In addition, the price we pay or other resources that we devote to an acquisition may exceed the value we realize, or the value we could have realized if we had reallocated the consideration payable for the acquisition or other resources to another opportunity.business.
To a much lesser degree, we have occasionally entered into joint ventures to conduct certain businesses or enter new geographies, and we will consider doing so in appropriate situations in the future. Joint ventures have many of the same risk characteristics as we discuss above with respect to acquisitions, particularly with respect to the due diligence and ongoing relationship with joint venture partners, given that each partner has inherently less control in a joint venture and will be subject to the authority and economics of the particular structure that is negotiated. Given a particular structure,Accordingly, we may not have the authority to direct the management and policies of the joint venture. If a joint venture participant acts contrary to our interest,sinterests, it could harm our brand, business, results of operations and financial condition.
INVESTMENT (INCLUDING CO-INVESTMENT) AND REAL ESTATE INVESTMENT BANKING ACTIVITIES.
An important part of our business strategy includes investing in (i) real estate, both individually and along with our investment management clients.clients, and (ii) proptech funds and early-stage proptech companies. As of December 31, 2018,2021, we have potential unfunded commitment obligations of $240.6up to $372.4 million to fund future co-investments.investments across our investment strategies. To remain competitive with well-capitalized financial services firms, we also may make merchant banking investments for which we may use our capital to acquire properties before the related investment management funds have been established or investment commitments have been received from third-party clients.
Certain service lines we operate have the acquisition, development, management and sale of real estate and proptech investments as part of their strategy. Investing in any of these types of situations exposes us to a number ofseveral risks.
Investing in real estate for the above reasons poses the following risks:
•We may lose some or all of the capital we invest if the investments underperform. Real
◦For real estate investments, can underperform as theunderperformance may result offrom many factors outside of our control, including the general reduction in asset values within a particular geography or asset class. Starting in 2007
◦For proptech investments, the concepts and continuing through 2009, for example, real estate prices in many markets declined asstrategic plans underpinning the resultvalue of the significant tighteningfund or entity may not be realized or could be poorly executed. In addition, the fund or entity may be negatively impacted by risks they are exposed to (some of credit marketswhich we are also exposed to and the effects of recessionary economies and significant unemployment. We had no notable impairment activity during the years ended December 31, 2018, 2017 and 2016. In contrast, as real estate investments benefited from favorable interest rate environments globally, and with continuing recoveryare discussed elsewhere in many of our markets, we recognized equity earnings from our co-investments of $32.8 million, $44.4 million and $33.8 million for the years ended December 31, 2018, 2017, and 2016, respectivelythis Item).
•We will have fluctuations in earnings and cash flow as we recognize gains or losses, and receive cash upon the disposition of investments, the timing of which ismay be geared toward the benefit of our clientsclients.
•We generally hold many of our investments in real estate through subsidiaries with limited liability; however, in certain circumstances, it is possible that this limited exposure may be expanded in the future based on, among other things, changes in applicable laws. To the extent this occurs, our liability could exceed the amount we have investedinvested.
•We make co-investments in real estateinvestments in many countries, and this presents tax, political/legislative, currency, and other risks as described above. This may include changes to tax treaties, tax policy, foreign investment policy, or other local political or legislative changes that may adversely affect the performance of our co-investments. Countries’ efforts to lessen legal tax avoidance through changeselsewhere in their domestic tax laws and treaties and to reform their tax laws to broaden the bases of income which are subject to taxation have increased in recent years and may continue at a rapid pace, which could produce adverse effects
We generally make co-investments in the local currency of the country in which the investment asset exists. We will therefore be subject to the risks described below under "Currency Restrictions and Exchange Rate Fluctuations"this Item.
In certain situations, although they have been relatively limited historically, we raise funds from outside investors where we are the sponsor of real estate investments, developments, or projects. To the extent we return less than the investors' original investments because the investments, developments, or projects have underperformed relative to expectations, the investors could attempt to recoup the full amount of their investments under securities law theories such as lack of adequate disclosure when funds were initially raised. Sponsoring funds into which retail investors are able tocan invest, such as the investment funds sponsored by LaSalle, may increase this risk.
INFRASTRUCTURE DISRUPTIONS.
Our ability to conduct a global business may be adversely impacted by disruptions to the infrastructure that supports our businesses and the communities in which they are located. This may include disruptions involving electrical, communications, information technology, transportation, or other services used by JLL or third parties with which we conduct business. It may also include disruptions as a result of political instability, general labor strikes or turmoil, cyber attacks, terrorist attacks, and also as a result of natural disasters such as hurricanes, earthquakes, and floods, whether as a result of climate change or otherwise. The infrastructure disruptions we experience as a result of such disasters also disrupt our ability to manage real estate for clients or may adversely affect the value of real estate investments we make on behalf of clients.
These disruptions may occur, for example, as a result of events affecting only the buildings in which we operate (such as fires or targeted terrorist attacks), or as a result of events with a broader impact on the cities where those buildings are located (including, potentially, the longer-term effects of global climate change). Nearly all of our employees in our primary locations, including Chicago, Washington, D.C., New York, London, Singapore, Frankfurt and Sydney, work in close proximity to each other in one or more buildings. If a disruption occurs in one location and our employees in that location are unable to communicate with or travel to other locations, our ability to service and interact with our clients may suffer, and we may not be able to successfully implement contingency plans that depend on communication or travel.
The infrastructure disruptions we describe above may also disrupt our ability to manage real estate for clients or may adversely affect the value of real estate investments we make on behalf of clients. The buildings we manage for clients, which include some of the world's largest office properties and retail centers, are used by many people daily. As a result, fires, earthquakes, floods, other natural disasters and terrorist attacks can result in significant loss of life. To the extent we are held to have been negligent in connection with our management of affected properties, we could incur significant financial liabilities and reputational harm.
The occurrence of natural disasters and terrorist attacks can also significantly impact the availability and/or cost of commercial insurance policies covering real estate, both for our own business and for those clients whose properties we manage and who may purchase their insurance through the insurance buying programs we make available to them. Sometimes, even where policies are available, specific coverage for wind, flooding, earthquakes, or terrorism may not be available or may be very expensive.
There can be no assurance that the disaster recovery and crisis management procedures we employ will suffice in any particular situation to avoid a significant loss. Since our employees are increasingly mobile and less reliant on physical presence in a JLL or LaSalle office, our disaster recovery plans increasingly rely on the availability of the internet (including cloud-based technology) and mobile phone technology, so the disruption of those systems, such as because of a cyber attack, would likely affect our ability to recover promptly from a crisis.
In addition, our ability to foresee or mitigate the potential consequences to managed properties, and real estate generally, from the effects of climate change, may be limited. We have significant operations and client relationships in cities with coastal exposure, such as New York and Miami.
Legal and Compliance Risk Factors
Legal and compliance risk relates to risks arising from the government and regulatory environment and action, and legal proceedings and compliance with integrity policies and procedures. Government and regulatory risk includesrisks include the risk that government or regulatory actions will impose additional cost on us or cause us to have to change our business models or practices.
BURDEN OF COMPLYING WITH MULTIPLE AND POTENTIALLY CONFLICTING LAWS AND REGULATIONS AND DEALING WITH CHANGES IN LEGAL AND REGULATORY REQUIREMENTS.
We face a broad range of legal and regulatory environments in the countries in which we do business. Coordinating our activities to deal with these requirements presents significant challenges. For example, in the United Kingdom, the Financial Conduct Authority ("FCA") regulates the conduct of investment businesses, often by implementing regulation imposed on it by the European Union, and the Royal Institute of Chartered Surveyors ("RICS") regulates the profession of Chartered Surveyors, which is the professional qualification required for certain services we provide in the United Kingdom, in each case through upholding standards of competence and conduct. As another example, activities associated with raising capital, offering investment funds and completing investment sales are regulated in the United States by the SEC and in other countries by similar securities regulatory authorities.
As a publicly traded company, we are subject to various corporate governance and other requirements established by statute, pursuant to SEC regulations and under the rules of the New York Stock Exchange. The Sarbanes-Oxley and Dodd-Frank legislative initiatives in the United States have added significant requirements to various aspects of our governance. In addition, changesChanges in legal and regulatory requirements can impact our ability to engage in business in certain jurisdictions or increase the cost of doing so. The legal requirements of U.S. statutes may also conflict with local legal requirements in a particular country. For example, anonymous hotlines required under U.S. law were construed to conflict in part with French privacy laws. Avoiding regulatory pitfalls as a result of conflicting laws will continue to be a key focus as non-U.S. statutory law and court decisions create more ambiguity. The jurisdictional reach of laws may be unclear as well, such as when laws in one country purport to regulate the behavior of affiliated corporations within our group that aresubsidiaries or affiliates operating in other countries. There is some uncertainty, for example, in the jurisdictional reachanother country.
Identifying the regulations with which we must comply and then complying with them is complex. We may not be successful in complying with regulations in all situations, as a result of which we could be subject to regulatory actions and fines for non-compliance. The global economic crisis resulted in an unusual level of related government and legislative activities, including for example the Dodd-Frank Wall Street Reform and Consumer Protection Act, which we expect will continue into the future, exacerbating these risks. We are also seeing increasing levels of labor regulation in emerging markets, such as China, which affect many of our businesses.
The Iran Threat Reduction and Syria Human Rights Act of 2012 added Section 13(r) ofOur global operations must comply with all applicable anti-corruption laws, including the U.S. Securities ExchangeForeign Corrupt Practices Act and the UK Bribery Act. These anti-corruption laws generally prohibit companies and their intermediaries from making improper payments or providing anything of 1934, as amended ("Section 13(r)"). Section 13(r) requires disclosure wherevalue to improperly influence government officials or private individuals for the purpose of obtaining or retaining a business advantage. Such prohibitions exist regardless of whether those practices are legal or culturally expected in a particular jurisdiction. Although we have a compliance program in place designed to reduce the likelihood of potential violations of such laws, violations of these laws could result in criminal or anycivil sanctions and have an adverse effect on our reputation, business and results of our affiliates have knowingly engaged, among other things, in certain transactions involving Iran, the Government of Iran, or persons or entities designated under certain executive orders. We must also file a notice with the SEC if any disclosable activities under Section 13(r) have been included in an annual or quarterly report. Section 13(r) applies to all annualoperations and quarterly reports required to be made after February 6, 2013, and applies to all contracts, including those in existence on or before that date.financial condition.
U.S. laws and regulations govern the provision of products and services to, and of other trade-related activities involving, certain targeted countries and parties. These measures include U.S. economic sanctions targeting Iran to which we are subject. As a result, we have had longstanding policies and procedures to restrict or prohibit sales of our services into countries that are subject to embargoes and sanctions, or to countries designated as state sponsors of terrorism, such as Iran. In conjunction with such policies, we have also implemented certain procedures to evaluate whether existing or potential clients appear on the "Specially Designated Nationals and Blocked Persons List" ("SDN List") maintained by OFAC.
Changes in governments or majority political parties may result in significant changes in enforcement priorities with respect to employment, health and safety, tax, securities disclosure and other regulations, which, in turn, could negatively affect our business.
CIVIL AND REGULATORY CLAIMS; LITIGATING DISPUTES IN DIFFERENT JURISDICTIONS.
Substantial civil legal liability or a significant regulatory action against our Company could have a material adverse financial effect or cause us significant reputational harm, which in turn could seriously harm our business prospects. Many legal systems, including in the United States, have fairly significant barriers against recovering legal fees from plaintiffs that file cases we consider frivolous, so the costs to us of defending such cases can be substantial even if we prevail.
While we maintain commercial insurance in an amount we believe is appropriate, we also maintain a significant level of self-insurance for liabilities we may incur. Although we place our commercial insurance only with highly-rated firms, the value of otherwise valid claims we hold under insurance policies may become uncollectible due to the insolvency of the applicable insurance company.
In addition, the claims we have can be complex, and insurance companies can prove difficult or bureaucratic in resolving them, which may result in payments to us being delayed or reduced, or that we must litigate to enforce an insurance policy claim.
Any disputes we have with third parties, or any government regulatory matters, generally must be adjudicated within the jurisdiction in which the dispute arose. Therefore, our ability to resolve such disputes successfully depends on the local laws that apply and the operation of the local judicial system. The timeliness, quality, transparency, integrity and sophistication of judicial systems vary widely from one jurisdiction to another. Our geographic diversity therefore may expose us to disputes in certain jurisdictions that could be challenging to resolve efficiently and/or effectively, particularly as there appears to be an increasing tendency toward litigation in emerging markets, where the rule of law is less reliable, legal systems are less mature and transparent, and the potential for judicial corruption remains a practical reality. It may also be more difficult to collect receivables from clients who do not pay their bills in certain jurisdictions, since resorting to the judicial system in certain countries may not be an effective alternative, given the delays and costs involved.
LICENSING AND REGULATORY REQUIREMENTS.
The brokerage of real estate sales and leasing transactions; multifamily real estate lending; servicing and asset management; property management; construction; mobile engineering; conducting valuations; trading in securities for clients; and the operation of the investment advisory business, among other business lines, may require us to maintain licenses in various jurisdictions in which we operate and to comply with particular regulations. We believe that licensing requirements, including protectionist policies which favor local firms over foreign firms, have generally been increasing in recent years. If we fail to maintain our licenses or conduct regulated activities without a license or in contravention of applicable regulations, we may be required to pay fines, or return commissions or investment capital from investors. Weinvestors or may also have a given license suspended or revoked, meaning that we would need to suspend or cease business activities for which the license was required.revoked. Our acquisition activity increases these risks, because we must successfully transfer licenses of acquired entities and their staff, as appropriate. Licensing requirements may also preclude us from engaging in certain types of transactions or change the way in which we conduct business or the cost of doing so. In addition, because the size and scope of real estate sales transactions, and the number of countries in which we operate or invest, and the areas we offer services have increased significantly during the past several years, both the difficulty of ensuring compliance with the numerous licensing regimes and the possible loss resulting from noncompliance, have increased. To the extent we continue to expand our service offerings further into more heavily regulated sectors, such as healthcare, environmental, pharmaceutical, scientific and medical laboratories, airports, and industrial, the regulatory framework within which we operate may get more complicated and the consequences of noncompliance more serious.
With respect to our status as an approved lender for Fannie Mae, Freddie Mac and as a HUD-approved originator and issuer of Ginnie Mae securities (collectively the “Agencies”), we are required to comply with various eligibility criteria established by the Agencies, such as minimum net worth, operational liquidity and collateral requirements. In addition, we are required to originate and service loans in accordance with the applicable program requirements and guidelines established from time to time by the Agencies. Failure to comply with any of these program requirements may result in the termination or withdrawal of our approval to sell loans to the Agencies and service their loans.
To fund the Agency loans we originate, we require short-term funding capacity. As of December 31, 2018,2021, we had $1,250.0 million$2.6 billion of committed loan funding available through three commercial banks. Consistent with industry practice, our existing warehouse facilities are short-term, requiring annual renewal. Although we believe that our current warehouse facilities are sufficient to meet our current needs in connection with our participation in the Agency programs, in the event any of our warehouse lines are terminated or are not renewed, we may be unable to find replacement financing on favorable terms, or at all, and we might not be able to originate loans.
The regulatory environment facing the investment management industry has also grown significantly more complex in recent years.years, principally in terms of marketing products and services and screening and advising clients. Countries are expanding the criteria requiring registration of investment advisors and funds, whether based in their country or not, and expanding the rules applicable to those that are registered, all in an effort to provide more protection to investors located within their countries. In some cases, rules from different countries are applicable to more than one of our investment advisory businesses and can conflict with those of their home countries. Although we believe we have good processes, policies and controls in place to address the new requirements, these additional registrations and increasingly complex rules increase the possibility that violations may occur.
These risks also apply separately to the LaSalle-managed public real estate investment trust we launched during 2012 that is managed by LaSalle.2012. That entity has registered the securities it is issuing with the SEC in the United States and is subject to regulation as a public company, albeit not one separately listed on a stock exchange.
Laws and regulations applicable to our business, both in the United States and in other countries, may change in ways that materially increase the costs of compliance. Particularly in emerging markets, there can be relatively less transparency around the standards and conditions under which licenses are granted, maintained, or renewed. It also may be difficult to defend against the arbitrary revocation of a license in a jurisdiction where the rule of law is less well developed.
As a licensed real estate service provider and advisor in various jurisdictions, we and our licensed employees may be subject to various due diligence, disclosure, standard-of-care, anti-money laundering and other obligations in the jurisdictions in which we operate. Failure to fulfill these obligations could subject us to litigation from parties who purchased, sold, or leased properties we brokered or managed, or who invested in our funds. We could become subject to claims by participants in real estate sales or other services claiming that we did not fulfill our obligations as a service provider or broker. This may include claims with respect to conflicts of interest where we are acting, or are perceived to be acting, for two or more clients with potentially contrary interests.
Licensing requirements may also preclude us from engaging in certain types of transactions or change the way in which we conduct business or the cost of doing so. In addition, because the size and scope of real estate sales transactions and the number of countries in which we operate or invest have increased significantly during the past several years, both the difficulty of ensuring compliance with the numerous licensing regimes and the possible loss resulting from noncompliance have increased. To the extent we expand our service offerings further into more heavily regulated sectors, such as healthcare, environmental, pharmaceutical, scientific and medical laboratories, airports and industrial, the regulatory framework within which we operate may get more complicated and the consequences of noncompliance more serious.
POTENTIALLY ADVERSE TAX CONSEQUENCES; CHANGES IN TAX LEGISLATION, REGULATION AND TAX RATES.
We face a variety of risks of increased future taxation on our earnings as a corporate taxpayer in the countries in which we have operations. Moving funds between countries can produce adverse tax consequences in the countries from which and to which funds are transferred, as well as in other countries, such as the United States, in which we are potentially subject to the taxation of earnings of other countries' operations. In addition, as our operations are global, we face challenges in effectively gaining a tax benefit for costs incurred in one country that benefit our operations in other countries.
Changes in tax legislation or tax rates may occur in one or more jurisdictions in which we operate that may materially impact the cost of operating our business. In December 2017, the U.S. government enacted comprehensive federal tax legislation commonly referred to as the Tax Cuts and Jobs Act (the "Act"). The Act includes a decrease in the U.S. federal corporate tax rate, new limitations on business-related deductions and two new taxes which may cause foreign earnings to be taxable in the U.S. The Act changes were generally effective for taxable years beginning after December 31, 2017. During 2018, the U.S. Treasury Department and the Internal Revenue Service issued significant guidance interpreting the Act, and additional guidance will be forthcoming in 2019 and future years. These changes could result in significant charges and payments in future taxable years and increase our future U.S. tax expense.
The implementation of new practices and processes designed to comply with, and benefit from, the Act and its rules and regulations could require us to make substantial changes to our business practices and allocate additional compliance resources. These responses may increase our costs, which could negatively affect our business, results of operations and financial condition.
In addition, the potential exists for significant legislative policy change in the taxation of multinational corporations, as has recently been the subject of the Base Erosion and Profit Shifting project of the Organization for Economic Co-operation and Development, the European Union Anti-Tax Avoidance Directives, and legislation inspired or required by those initiatives. It is also possible that some governments will make significant changes to their tax policies as part of their responses to budgetary positions.
Further, interpretations of existing tax law in various countries may change due to the activities of tax authorities, which we believe are generally increasing the level of examination activities of major corporations, and the decisions of courts. In addition, the views of the business community and the public on acceptable tax planning activities, expressed through increased media scrutiny and the activities of non-governmental activist organizations, may influence further changes in tax law, affecting corporate taxpayers broadly.
We face such risks both in our own business and also in the investment funds that LaSalle operates. Adverse or unanticipated tax consequences to the funds can negatively impact fund performance, incentive fees and the value of co-investments that we have made. We are uncertain as to the ultimate results of these potential changes or what their effects will be on our business in particular.
NONCOMPLIANCE WITH POLICIES; COMMUNICATIONS AND ENFORCEMENT OF OUR POLICIES AND OUR CODE OF BUSINESS ETHICS.
The geographic and cultural diversity in our organization makes it more challenging to communicate the importance of adherence to our global corporate policies, our Code of Business Ethics and our Vendor Code of Conduct, and to monitor and enforce compliance with their provisions on a worldwide basis, which includes local compliance with United States, United Kingdom and other laws and regulations that apply globally in certain circumstances. These include the U.S. Foreign Corrupt Practices Act, the Patriot Act and the Sarbanes-Oxley Act of 2002 in the United States, the Bribery Act in the United Kingdom, the General Data Protection Regulation in the European Union, and the Anti-Corruption Law in Brazil.
Breaches of our Code of Business Ethics, particularly by our executive management, could have a material adverse effect. Breaches of our Vendor Code of Conduct by vendors whom we retain in our role as a principal for client engagements can also lead to significant losses to clients and our Company from financial liabilities that might result. Breaches of our corporate policies could lead to risk of improper conduct and an increase in chances of certain legal and compliance violations that could lead to monetary losses.
ENVIRONMENTAL LIABILITIES AND REGULATIONS; CLIMATE CHANGE RISKS; AND AIR QUALITY RISKS.
Our operations are affected by federal, state and/or local environmental laws in the countries in which we maintain office space for our own operationsoperate, and where we manage properties for clients. We may face liability with respect to environmental issues occurring at properties that we manage or occupy, or in which we invest. Various laws and regulations restrict the levels of certain substances that may be discharged into the environment by properties, or they may impose liability on current or previous real estate owners or operators for the cost of investigating, cleaning up or removing contamination caused by hazardous or toxic substances at the property. We may face costs or liabilities under these laws as a result of our role as an on-site property manager or a manager of construction projects. Our risks for such liabilities may increase as we expand our services to include more industrial and/or manufacturing facilities than has been the case in the past. In addition, we may face liability if such laws are applied to expand our limited liabilitypast, or with respect to our co-investments in real estate as discussed above. Within our own operations, we face additional costs from rising energy costs which make it more expensive to power our corporate offices.
Given that our own operations are generally conducted within leased office building space, we do not currently anticipate that regulations restricting the emissions of greenhouse gases, or taxes that may be imposed on their release, would result in material costs or capital expenditures. However, we cannot be certain about the extent to which such regulations will develop, as there are higher levels of understanding and commitments by different governments around the world regarding the risks of climate change and how they should be mitigated. Regulations relating to climate change may affect the scope of services we provide to clients in their managed properties, but clients would typically bear any additional costs of doing so under their contracts with us. In any event, we anticipate that the burden and cost of climate change disclosure and carbon reporting will increase over time.
We are not aware of any material noncompliance with the environmental laws or regulations currently applicable to us, and we are not the subject of any material claim for liability with respect to contamination at any location. However, these laws and regulations may discourage sales and leasing activities and mortgage lending with respect to some properties, which may adversely affect both us and the commercial real estate services industry in general. Environmental contamination or other environmental liabilities may also negatively affect the value of commercial real estate assets held by entities that are managed by our investment management business, which could adversely affect the results of operations of this business segment.
The impact of climate change presents a significant risk. Damage to assets caused by extreme weather events linked to climate change is becoming more evident, highlighting the fragility of global infrastructure. As an example, there is a significant risk to coastal properties as sea levels rise.
We also anticipate that the potential effects of climate change will increasingly impact our own operations and those of client properties we manage, especially when they are located in coastal cities. For example, in 2018, the impact of natural disasters was significant with a series of devastating wildfires in the U.S. as well as floods in several geographies around the globe.
We anticipate that the potential effects of climate change will increasingly impact the decisions and analysis that LaSalle makes with respect to investments in the properties it manages as well as those it considers for acquisition or disposition on behalf of clients, since climate change considerations can impact the relative desirability of locations and the cost of operating and insuring acquired properties. Future legislation that requires specific performance levels for building operations could make non-compliant buildings obsolete, which could materially affect investments in properties we have made on behalf of clients, including those in which we may have co-invested. Climate change considerations will likely also increasingly be part of the consulting work that JLL does for clients to the extent it is relevant to the decisions our clients are seeking to make.
Around the world, many countries are enacting stricter regulations to protect the environment and preserve their natural resources. Those regulations are likely to become more rigorous over time. Firms also may face several layers of national, regional and regionallocal regulations. In Europe, the EU’s Environmental Liability Directive establishes a comprehensive liability standard, but individual EU countries may have stricter regulations. The risks may not be limited to fines and the costs of remediation. In Brazil, employees can risk jail sentences as well as fines in connection with pollution incidents. In April 2014,September 2020, China passed the biggest changesannounced a commitment to itsbe carbon neutral by 2060. This follows environmental protection laws passed in 25 years, outlining plans to punish polluters more severely as leaders work2014 designed to limit contaminated water, air and soil linked to economic growth and public health. New environmental legislation and regulations may require the Company to make material changes to its operations, which could adversely affect our operating results. Furthermore, the perspectives of shareholders, employees and other stakeholders regarding these standards may affect our business activities and increase disclosure requirements, which may increase our costs.
Declining air quality in major cities Beijing being an example, may have consequences for our business in various ways, including the need to respond to new regulations that affect the management of buildings, declines in the desire of investors or corporates to invest in or occupy properties in such cities, and our ability to retain staff in locations that may be relatively undesirable as places to live.
THE CHARTER AND THE BYLAWS OF JONES LANG LASALLE, OR THE MARYLAND GENERAL CORPORATION LAW, COULD DELAY, DEFER OR PREVENT A CHANGE OF CONTROL.
Our charter and bylaws include provisions that may discourage, delay, defer or prevent a takeover attempt that may be in the best interest of our shareholders and may adversely affect the market price of our common stock.
The charter and bylaws provide for:
The ability of the Board to establish one or more classes and series of capital stock including the ability to issue up to 10,000,000 shares of preferred stock, and to determine the price, rights, preferences and privileges of such capital stock without any further shareholder approval
A requirement that any shareholder action taken without a meeting be pursuant to unanimous written consent
Certain advance notice procedures for our shareholders nominating candidates for election to our Board
Under the Maryland General Corporation Law (the "MGCL"), certain "Business Combinations" (including a merger, consolidation, share exchange or, in certain circumstances, an asset transfer or issuance or reclassification of equity securities) between a Maryland corporation and any person who beneficially owns 10% or more of the voting power of the corporation's shares, or an affiliate of the corporation who, at any time within the two-year period prior to the date in question, was the beneficial owner of 10% or more of the voting power of the then-outstanding voting stock of the corporation (an "Interested Shareholder") or an affiliate of the Interested Shareholder, are prohibited for five years after the most recent date on which the Interested Shareholder became an Interested Shareholder. Thereafter, any such Business Combination must be recommended by the board of directors of such corporation and approved by the affirmative vote of at least (i) 80% of the votes entitled to be cast by holders of outstanding voting shares of the corporation and (ii) 66 2/3% of the votes entitled to be cast by holders of outstanding voting shares of the corporation other than shares held by the Interested Shareholder with whom the Business Combination is to be effected, unless, among other things, the corporation's shareholders receive a minimum price (as defined in the MGCL) for their shares and the consideration is received in cash or in the same form as previously paid by the Interested Shareholder for its shares. Pursuant to the MGCL, these provisions also do not apply to Business Combinations approved or exempted by the board of directors of the corporation prior to the time that the Interested Shareholder becomes an Interested Shareholder.
Financial Risk Factors
Financial risk relates to our ability to meet financial obligations and mitigate exposure to broad market risks, including volatility in foreign currency exchange rates and interest rates; credit risk; and liquidity risk, including risk related to our credit ratings and our availability and cost of funding.
INDEBTEDNESS WITH FIXED OR VARIABLE INTEREST RATES AND CERTAIN COVENANTS WITH WHICH WE MUST COMPLY.
As of December 31, 2018, we had the ability to borrow, from a syndicate of lenders, up to $2.75 billion on an unsecured revolving credit facility that matures in 2023. Borrowings under our Facility bear variable interest rates ranging from LIBOR plus 0.875% to 1.35%. As of December 31, 2018, we had no outstanding borrowings under the Facility and outstanding letters of credit of $8.6 million. Our average outstanding borrowings under the Facility were $364.1 million during the year ended December 31, 2018 at an effective interest rate of 2.9%. In addition to the Facility, we also have $275.0 million of unsecured long-term senior notes (the "Notes") that are due in 2022. The Notes bear an annual interest rate of 4.4%, subject to adjustment if a credit rating assigned to the Notes is downgraded below an investment grade rating (or subsequently upgraded).
On June 29, 2017, we issued and sold an aggregate principal amount of €350.0 million of senior unsecured notes ("Euro Notes") as a private placement to certain institutional investors in an offering exempt from the registration requirements of the Securities Act of 1933, as amended (“Securities Act”). The fixed-rate Euro Notes have 10-year and 12-year maturities. The proceeds, net of debt issuance costs, were $393.2 million, using June 29, 2017 exchange rates, and were used to reduce outstanding borrowings on our Facility. The Euro Notes are unsecured obligations and rank equally in right of payment with all of our existing and future unsubordinated indebtedness, including our guarantee under the Facility.
Our outstanding borrowings under the Facility fluctuate during the year primarily due to varying working capital requirements and acquisition activities. For example, payment of annual incentive compensation represents a significant cash
requirement commanding increased borrowings in the first half of the year, while historically our seasonal earnings pattern provides more cash flow in the second half of the year. To the extent we continue our acquisition activities in the future, the level of our indebtedness could increase materially if we use the Facility to fund such purchases.
The terms of the Facility, and to a lesser degree the Notes, contain a number of covenants that could restrict our flexibility to finance future operations or capital needs, or to engage in other business activities that may be in our best interest. The debt covenants have the effect of limiting our ability, among other things, to encumber or dispose of assets and to make significant investments.
In addition, the Facility requires that we comply with various financial covenants, including minimum leverage and cash interest coverage ratios. If we are unable to make required payments under the Facility or required by the Notes, or if we breach any of the covenants, we will be in default, which could cause acceleration of repayment of outstanding amounts as well as defaults under other existing and future debt obligations.
DOWNGRADES IN OUR CREDIT RATINGS COULD INCREASE OUR BORROWING COSTS OR REDUCE OUR ACCESS TO FUNDING SOURCES IN THE CREDIT AND CAPITAL MARKETS.
We are currently assigned corporate credit ratings from Moody's and S&P based on their evaluation of our creditworthiness. As of the date of this filing, our debt ratings remain investment grade, but there can be no assurance that we will not be downgraded or that any of our ratings will remain investment grade in the future. If our credit ratings are downgraded or other negative action is taken, we could be required, among other things, to pay additional interest on our Notes. Credit rating reductions by one or more rating agencies could also adversely affect our access to funding sources, the cost and other terms of obtaining funding as well as our overall financial condition, operating results and cash flow.
VOLATILITY IN LASALLE INVESTMENT MANAGEMENT INCENTIVE FEETRANSACTIONAL-BASED REVENUE.
LaSalle's portfolio is of sufficient size to periodically generate large incentive fees and equity gains (losses) that significantly influence our earnings and the changes in earnings from one year to the next. Volatility in this component of our earnings is inevitable due to the nature of this aspect of our business, and the amount of incentive fees or equity earnings or losses we may recognize in future quarters is inherently unpredictable and relates to market and other dynamics in effect at the time. For example, underlying market conditions, particular decisions regarding the acquisition and disposition of fund assets, and the specifics of client mandates will determine the timing and size of incentive fees or equity earnings or losses from one fund or investment to another.
While LaSalle has focused over the past several years on developing more predictable annuity-type revenue, incentive fees should continue to be an important part of our revenue and earnings as long as real estate markets remain healthy. However, it is likely that the volatility described above will continue, and competitive pressures may in some cases restrict our ability to negotiate incentive fees.
Where incentive fees on a given transaction or portfolio are particularly large, certain clients have attempted to renegotiate fees even though contractually obligated to pay them, and we expect this to occur from time to time in the future. Our efforts to collect our fees in these situations may lead to significant legal fees and/or significant delays in collection due to extended negotiations, arbitration or litigation. They may also result in either negotiated reductions in fees that take into account the future value of the relationship or loss of the client.
VOLATILITY IN CAPITAL MARKETS FEES.
We have business lines other than LaSalleproduct offerings, such as Leasing and Capital Markets, that also generate fees based on the timing, size and pricing of closed transactions, and these fees may significantly contribute to our earnings and to changes in earnings from one quarter or year to the next. Volatility in this component of our earnings is inevitable due to the nature of these businesses and the amount of the fees we will recognize in future quarters is inherently unpredictable.
LASALLE'S BANKING AND CLIENT RELATIONSHIPS.
Although not highly leveraged by general industry standards,In addition, LaSalle's portfolio is of sufficient size to periodically generate large incentive fees and equity earnings (losses) that significantly influence our earnings and the investment funds that LaSalle operateschanges in earnings from one year to the ordinary coursenext. Volatility in this component of our earnings is also inevitable due to the nature of this aspect of our business, borrow money from a variety of institutional lenders. The loans typically are secured by liens on specific investment properties, but are otherwise non-recourse. During the global financial crisis, the values of specific properties were in some cases less thanand the amount of incentive fees or equity earnings or losses we may recognize in future quarters is inherently unpredictable as it relates to client needs, the outstanding loan onmarket and other dynamics in effect at the property, which gave the lender the right to foreclose on the property, in which case the equity invested by the fund would be without value. These situations were typically addressed on a case-by-case basis and, because we maintain good relationships with our lenders, we were generally successful in renegotiations to retain the management of substantially all fund properties, which provided additional time for values to recover. A similar phenomenon could occur in connection with future economic recessions or liquidity contractions.
Some clients of LaSalle that had open commitments to provide additional investments came under stress due to the financial downturn, became less able financially to honor their commitments and sought to renegotiate the terms of their commitments or the fees that they pay. These activities did not result in materially adverse consequences to LaSalle or any of its funds. Clients adversely affected due to a future downturn may react similarly.
Within a difficult economic environment, raising new funds takes longer and may be less successful as current and prospective clients may be less able or willing to commit new funds to real estate investments, which are inherently less liquid than many competing investments. In addition, certain clients may decide to manage all or a portion of their real estate investments with internal resources rather than hiring outside investment managers.time.
CURRENCY RESTRICTIONS AND EXCHANGE RATE FLUCTUATIONS.FLUCTUATIONS; INFLATIONARY RISK.
We produce positive cash flows of cash in various countries and currencies that can be most effectively used to fund operations in other countries or to repay our indebtedness, which is currently primarily denominated in U.S. dollars and euros. We face restrictions in certain countries that limit or prevent the transfer of funds to other countries or the exchange of the local currency to other currencies. We also face risks associated with fluctuations in currency exchange rates that may lead to a decline in the value of the funds earned in certain jurisdictions.
Although we operate globally, we report our results in U.S. dollars, and thus our reported results may be positively or negativelyare impacted by the strengthening or weakening of currencies against the U.S. dollar. As an example, the euro and the pound sterling, each a currency used in a significant portion of our operations, have fluctuated significantlynotably in recent years. Our revenue from outside of the United States approximated 48%42% of our total revenue for 2018 and 2017.2021. In addition to the potential negative impact on reported earnings, fluctuations in currencies relative to the U.S. dollar may make it more difficult to perform period-to-period comparisons of the reported results of operations.
We are authorized to use currency-hedging instruments, including foreign currency forward contracts, purchased currency options and borrowings in foreign currency. There can be no assurance that such hedging will be economically effective. We do not use hedging instruments for speculative purposes.
As currency forward and option contracts are generally conducted off-exchange or over-the-counter ("OTC"), many of the safeguards accorded to participants on organized exchanges, such as the performance guarantee of an exchange clearing house, are generally unavailable in connection with OTC transactions. In addition, there can be no guarantee that the counterparty will fulfill its obligations under the contractual agreement, especially in the event of a bankruptcy or insolvency of the counterparty, which would effectively leave us unhedged.
GREATER DIFFICULTY IN COLLECTING ACCOUNTS RECEIVABLE IN CERTAIN GEOGRAPHIES.
The COVID-19 pandemic caused significant volatility in U.S. and international markets. The impact of the pandemic may increase the possibility of uncertainty in the global financial markets, high inflation and extended economic downturn. We face challengesare subject to inflationary pressures on employee wages, salaries, and the cost of various goods and services including energy costs that we procure which can materially impact our financial results. In addition, while we attempt to mitigate the impact of inflation in our client agreements, some client agreements may be entered into on a fixed or guaranteed maximum price basis where our ability to efficiently and/make price adjustments to take into account inflation may be limited.
DOWNGRADES IN OUR CREDIT RATINGS COULD INCREASE OUR BORROWING COSTS OR REDUCE OUR ACCESS TO FUNDING SOURCES IN THE CREDIT AND CAPITAL MARKETS.
We are currently assigned corporate credit ratings from Moody's and S&P based on their evaluation of our creditworthiness. As of the date of this filing, our debt ratings remain investment grade, but there can be no assurance we will not be downgraded or effectively collect accounts receivable in certain countries and regions. For example, various countries have underdeveloped insolvency laws, and clients often are slow to pay. In some countries, clients typically tend to delay payments, reflecting a different business culture over which we do not necessarily havethat any control. Less-developed countries may have very lengthy or difficult judicial processes that can make collections through the court system more problematic than they would otherwise be. In addition, weaknessof our ratings will remain investment grade in the global economy can putfuture. If our credit ratings are downgraded or other negative action is taken, we could be required, among other things, to pay additional financial stressinterest on clients and landlords, who sometimes arecertain of our senior notes. Credit rating reductions by one or more rating agencies could also adversely affect our access to funding sources, the parties that pay our commissions where we have placed a tenant representation client into their buildings. This in turn can negatively impact our ability to collect our receivables fully or in a timely manner. We cannot be sure that the procedures we use to identify and rectify slowly paid receivables, and to protect ourselves against the insolvencies or bankruptcies of clients, landlordscost and other third parties with which we do business, which may involve placing liens on properties or litigating, will be effective in all cases.
terms of obtaining funding as well as our overall financial condition, operating results and cash flow.
INCREASING FINANCIAL RISK OF COUNTERPARTIES, INCLUDING REFINANCING RISK.
Unprecedented disruptions and dynamic changes in the financial markets, and particularly insofar as they have led to major changes in the status and creditworthiness of some of the world's largest banks, investment banks and insurance companies, among others, have generally increased the counterparty risk to us from a financial standpoint, including with respect to:
•Obtaining new credit commitments from lenders
•Refinancing credit commitments or loans that have terminated or matured according to their terms, including funds sponsored by our LaSalle which use leverage in the ordinary course of their investment activities
•Placing insurance
•Engaging in hedging transactions
•Maintaining cash deposits or other investments, both our own and those we hold for the benefit of clients, which are generally much larger than the maximum amount of government-sponsored deposit insurance in effect for a particular account
While these risks remain higher than theyIn addition, certain of LaSalle’s sponsored funds act as a lender to real estate owners with the risk of default by the borrower and the potential for the LaSalle fund to take ownership of those assets. Defaults by borrowers can also have been historically,a negative impact on investment performance.
General Risk Factors
ABILITY TO CONTINUE TO MAINTAIN SATISFACTORY INTERNAL FINANCIAL REPORTING CONTROLS AND PROCEDURES.
If we believe they have moderated as financial markets have stabilized in recent years. During 2012 and 2017, we also diversified someare not able to continue to operate successfully under the requirements of Section 404 of the counterparty risk underUnited States Sarbanes-Oxley Act of 2002, or if there is a failure of one or more controls over financial reporting due to fraud, improper execution or the Facilityfailure of such controls to adjust adequately as our business evolves, then our reputation, financial results and the market price of our stock could suffer. We may be exposed to potential risks from this legislation, which requires companies to evaluate the effectiveness of their internal controls, and such internal control over financial reporting is subject to audit by issuing long-term senior notes,their independent registered public accounting firm on an annual basis. We have evaluated our internal control over financial reporting as required for purposes of this Annual Report on Form 10-K for the proceedsyear ended December 31, 2021. Our management concluded our internal control over financial reporting was effective as of which were initially used to reduceDecember 31, 2021. Our independent registered public accounting firm has issued an unqualified opinion on the outstanding loans under the Facility. We believe counterpartyeffectiveness of our internal control over financial risks still remain elevated due mainly to the potential liquidity issues within certain European financial institutions.
We generally attempt to conduct business with only the highest-quality and most well-known counterparties, butreporting. However, there can be no assurance (i)we will continue to receive an unqualified opinion in future years, particularly since standards continue to evolve and are not necessarily being applied consistently from one independent registered public accounting firm to another. If we identify one or more material weaknesses in our internal control over financial reporting in the future that we cannot remediate in a timely fashion, we may be unable to receive an unqualified opinion at some time in the future from our effortsindependent registered public accounting firm.
POTENTIALLY ADVERSE TAX CONSEQUENCES; CHANGES IN TAX LEGISLATION, REGULATION AND TAX RATES.
We face a variety of risks of increased future taxation on our earnings as a corporate taxpayer in the countries in which we have operations. Moving funds between countries can produce adverse tax consequences. In addition, as our operations are global, we face challenges in effectively gaining a tax benefit for costs incurred in one country that benefit our operations in other countries.
Changes in tax legislation or tax rates may occur in one or more jurisdictions in which we operate that may materially impact the cost of operating our business. In December 2017, the U.S. government enacted comprehensive federal tax legislation commonly referred to evaluate their creditworthiness will be effective in all cases, particularly as the qualityTax Cuts and Jobs Act (the "Act"). The Act included limitations on business-related deductions and increased taxation of credit ratings provided byforeign earnings in the nationally recognized rating agencies hasU.S., which could increase our future tax expense. Further changes to U.S. corporate tax law have been called into question, (ii) that we will always be able to obtainproposed in the full benefitpast year, including the proposed Build Back Better Act, some of the financial commitments made to us by lenders, insurance companies, hedging counterparties or other organizations with which we do business, or (iii) that we will always be able to refinance existing indebtedness, or commitments to provide indebtedness, which has matured by its terms, including funds sponsored bycould further increase our investment management subsidiary.future tax expense if enacted.
In addition, the abilitypotential exists for significant legislative policy change in the taxation of governmentmultinational corporations, as has recently been the subject of the “Pillar One” and “Pillar Two” initiatives of the Organization for Economic Co-operation and Development, the European Union Anti-Tax Avoidance Directives, and legislation inspired or required by those initiatives. It is also possible that some governments will make significant changes to their tax policies in response to factors such as budgetary needs, feedback from the business community and the public view on applicable tax planning activities. Further, interpretations of existing tax law in various countries may change due to the regulatory and examination policies of the tax authorities and the decisions of courts.
We face such risks both in our own business and in the investment funds LaSalle operates. Adverse or unanticipated tax consequences to adequately monitorthe funds can negatively impact fund performance, incentive fees and regulate banks, investment banks, securities firms and insurance companies was significantly called into question during the recent financial crisis (for example, in identifying and preventing "pyramid schemes," "bubbles" in different asset classes and othervalue of co-investments we have made. We are uncertain as to the ultimate results of these potential systemic failures in a timely fashion), as the resultchanges or what their effects will be on our business.
ITEM 1B. UNRESOLVED STAFF COMMENTS
None.
ITEM 2. PROPERTIES
Our principal corporate holding company headquarters are located at 200 East Randolph Drive, Chicago, Illinois, where we currently occupy over 165,000 square feet of office space under a lease that expires in May 2032. Our regional headquarters for our Americas, EMEA and Asia Pacific businesses are located in Chicago, London and Singapore, respectively. We have 299328 corporate offices worldwide located in most major cities and metropolitan areas as follows: 144140 offices in 911 countries in the Americas (including 122116 in the United States), 79114 offices in 2726 countries in EMEA, and 7674 offices in 16 countries in Asia Pacific. In addition, we have on-site property and corporate offices located throughout the world. On-site property and facility management offices, are generally located within properties we manage, and are provided to us without cost.
ITEM 3. LEGAL PROCEEDINGS
We have contingent liabilities from various pending claims and litigation matters arising in the ordinary course of business, some of which involve claims for damages that are substantial in amount. Many of these matters are covered by insurance (including insurance provided through a wholly-owned captive insurance company), although they may nevertheless be subject to large deductibles or retentions, and the amounts being claimed may exceed the available insurance. Although the ultimate liability for these matters cannot be determined, based upon information currently available, we believe the ultimate resolution of such claims and litigation will not have a material adverse effect on our financial position, results of operations, or liquidity.
ITEM 4. MINE SAFETY DISCLOSURES
Not applicable.
PART II
ITEM 5. MARKET FOR REGISTRANT'S COMMON EQUITY, RELATED SHAREHOLDER MATTERS AND ISSUER PURCHASES OF EQUITY SECURITIES
Our common stock is listed for trading on the New York Stock ExchangeNYSE under the symbol "JLL." As of February 15, 2019,14, 2022, there were 348approximately 500 shareholders of record of our common stock and more than 45,00085,000 additional street name holders whose shares were held of record by banks, brokers and other financial institutions.
DividendsShare Repurchases
OnIn February 2021, our Board of Directors authorized $500.0 million for share repurchases, an addition to the $100.0 million remaining, as of December 14, 2018,31, 2020, from the Board of Directors' October 31, 2019 authorization. During the year ended December 31, 2021 we paid a semi-annual dividendrepurchased nearly 1,452,000 shares for $343.3 million, compared with nearly 897,000 shares repurchased for $100.0 million in 2020.
In February 2022, our Board of $0.41 perDirectors authorized an additional $1.5 billion for share repurchases.
The following table provides information about our purchases of our common stockequity securities that are registered by us pursuant to holdersSection 12 of record at the close of business on November 16, 2018. We also paid a cash dividend of $0.41 per share of its common stock on June 15, 2018, to holders of record atExchange Act during the close of business on May 18, 2018. Dividend-equivalents in the same amounts were also paid simultaneously on eligible outstanding but unvested restricted stock units.quarter ended December 31, 2021:
| | | | | | | | | | | | | | | | | | | | |
| Period | Total number of shares purchased | Weighted average price paid per share | Total number of shares purchased as part of publicly announced plan | Approximate dollar value of shares that may yet be purchased under the plan (in millions) |
| October 1, 2021 - October 31, 2021 | 116,780 | | | $ | 256.84 | | 116,780 | | | |
| November 1, 2021 - November 30, 2021 | 115,039 | | | $ | 262.21 | | 115,039 | | | |
| December 1, 2021 - December 31, 2021 | 361,001 | | | $ | 255.10 | | 361,001 | | | $ | 256.8 | |
| Total | 592,820 | | | | 592,820 | | | |
Dividends
We paid our first cash dividenddid not declare or pay any dividends in October 14, 2005,2021 or 2020. Any future decision to declare and have paid semi-annualpay dividends each year since 2006. There can be no assurance future dividends will be declared since the actual declaration of future dividends and the establishment of record and payment dates remains subject to final determination bythe discretion of our Board of Directors.
Share Repurchases
We have made no share repurchases under our share repurchase program in 2018 or 2017.
Transfer Agent
Computershare
P.O. Box 505000
Louisville, KY 40233
Equity Compensation Plan Information
For information regarding our equity compensation plans, including both shareholder approved plans and plans not approved by shareholders, see Part III, Item 12. Security Ownership of Certain Beneficial Owners and Management.Management and Related Shareholder Matters.
Comparison of Cumulative Total Shareholder Return
The following graph compares the cumulative 5-year total return to shareholders of JLL's common stock relative to the cumulative total returns of the S&P 500 Index, and a customized peer group that includes:comprising: 1) CBRE Group Inc. (CBG)(CBRE), a global commercial real estate services company publicly traded in the U.S., 2) Cushman & Wakefield plc (CWK), a global commercial real estate services company publicly traded in the U.S., 3) Colliers International Group Inc. (CIGI), a global commercial real estate services company, traded in the U.S., and 4) Savills Plc.plc (SVS.L), a real estate services company traded on the London Stock Exchange. With the exception of Cushman & Wakefield, the following graph assumes the value of the investment in JLL's common stock, the S&P 500 Index, and the peer group (including reinvestment of dividends) was $100 on December 31, 2013.2016. For Cushman & Wakefield, the $100 is assumed to be invested on August 2, 2018, the date of their initial public offering.
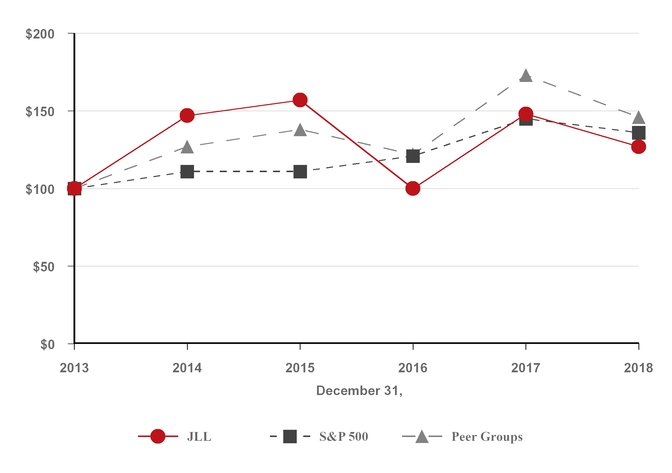
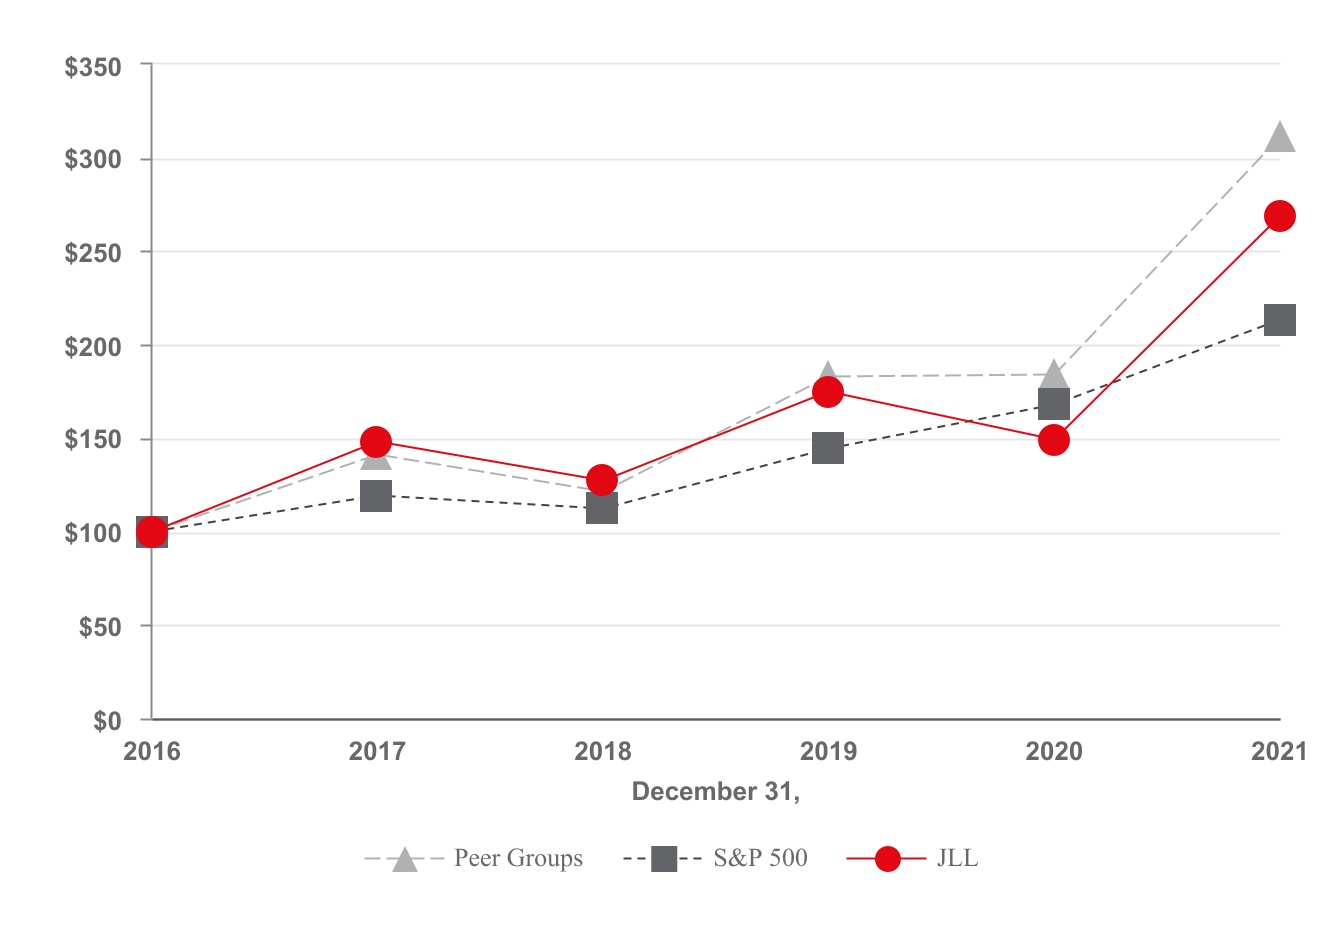
| | | | | | | | | | | | | | | | | | | | |
| December 31, |
| 2016 | 2017 | 2018 | 2019 | 2020 | 2021 |
| JLL | $ | 100 | | $ | 148 | | $ | 127 | | $ | 175 | | $ | 149 | | $ | 269 | |
| S&P 500 | 100 | | 119 | | 112 | | 144 | | 168 | | 213 | |
| Peer Group | 100 | | 141 | | 121 | | 183 | | 184 | | 311 | |
|
| | | | | | | | | | | | | | | | | | |
| | December 31, |
| | 2013 | 2014 | 2015 | 2016 | 2017 | 2018 |
| JLL | $ | 100 |
| $ | 147 |
| $ | 157 |
| $ | 100 |
| $ | 148 |
| $ | 127 |
|
| S&P 500 | 100 |
| 111 |
| 111 |
| 121 |
| 145 |
| 136 |
|
| Peer Group | 100 |
| 127 |
| 138 |
| 122 |
| 173 |
| 146 |
|
ITEM 6. SELECTED FINANCIAL DATA (UNAUDITED)
The following table sets forth our summary historical consolidated financial data. The information should be read in conjunction with Item 8. Financial Statements and Supplementary Data and Item 7. Management's Discussion and Analysis of Financial Condition and Results of Operations.[Reserved]
|
| | | | | | | | | | | |
| | Year Ended December 31, |
| (in millions, except share and per share data) | 2018 | 2017 (2) | 2016 (2) | 2015 | 2014 |
| Statements of Operations Data: | | | | | |
| Revenue | $ | 16,318.4 |
| 14,453.2 |
| 12,991.2 |
| 5,965.7 |
| 5,429.6 |
|
| | | | | | |
| Operating income | 706.9 |
| 545.9 |
| 455.7 |
| 529.8 |
| 465.6 |
|
| Interest expense, net of interest income | 51.1 |
| 56.2 |
| 45.3 |
| 28.1 |
| 28.3 |
|
| Equity earnings from real estate ventures | 32.8 |
| 44.4 |
| 33.8 |
| 77.4 |
| 48.3 |
|
| Other income | 17.4 |
| 1.7 |
| 19.5 |
| — |
| — |
|
| Income before provision for income taxes and noncontrolling interest | 706.0 |
| 535.8 |
| 463.7 |
| 579.1 |
| 485.6 |
|
| Provision for income taxes | 214.3 |
| 256.3 |
| 117.8 |
| 132.8 |
| 97.6 |
|
| Net income | 491.7 |
| 279.5 |
| 345.9 |
| 446.3 |
| 388.0 |
|
| Net income attributable to noncontrolling interest | 7.2 |
| 3.1 |
| 16.2 |
| 7.6 |
| 2.0 |
|
| Net income attributable to the Company | 484.5 |
| 276.4 |
| 329.7 |
| 438.7 |
| 386.0 |
|
| Dividends on unvested common stock, net of tax | 0.4 |
| 0.4 |
| 0.4 |
| 0.3 |
| 0.3 |
|
| Net income attributable to common shareholders | $ | 484.1 |
| 276.0 |
| 329.3 |
| 438.4 |
| 385.7 |
|
| | | | | | |
| Basic earnings per common share before dividends on unvested common stock | $ | 10.65 |
| 6.10 |
| 7.30 |
| 9.76 |
| 8.64 |
|
| Dividends on unvested common stock, net of tax | (0.01 | ) | (0.01 | ) | (0.01 | ) | (0.01 | ) | (0.01 | ) |
| Basic earnings per common share | $ | 10.64 |
| 6.09 |
| 7.29 |
| 9.75 |
| 8.63 |
|
| Basic weighted average shares outstanding (in 000's) | 45,517 |
| 45,316 |
| 45,154 |
| 44,940 |
| 44,684 |
|
| | | | | | |
| Diluted earnings per common share dividends on unvested common stock | $ | 10.55 |
| 6.04 |
| 7.24 |
| 9.66 |
| 8.53 |
|
| Dividends on unvested common stock, net of tax | (0.01 | ) | (0.01 | ) | (0.01 | ) | (0.01 | ) | (0.01 | ) |
| Diluted earnings per common share | $ | 10.54 |
| 6.03 |
| 7.23 |
| 9.65 |
| 8.52 |
|
| Diluted weighted average shares outstanding (in 000's) | 45,931 |
| 45,758 |
| 45,528 |
| 45,415 |
| 45,261 |
|
| | | | | | |
| Cash dividends declared per common share | $ | 0.82 |
| 0.72 |
| 0.64 |
| 0.56 |
| 0.48 |
|
|
| | | | | | | | | | | |
| | As of and for the Year Ended December 31, |
| (in millions, except ratios and Assets under management) | 2018 | 2017 (2) | 2016 (2) | 2015 | 2014 |
| Other Data: | | | | | |
EBITDA (1) | $ | 935.6 |
| 755.7 |
| 634.2 |
| 707.4 |
| 606.0 |
|
Ratio of earnings to fixed charges (3) | 7.53X |
| 5.42X |
| 5.66X |
| 8.21X |
| 6.93X |
|
| | | | | | |
| Cash flows provided by (used in): | | | | | |
| Operating activities | $ | 604.1 |
| 798.7 |
| 222.6 |
| 375.8 |
| 498.9 |
|
| Investing activities | (280.4 | ) | (170.8 | ) | (805.5 | ) | (584.6 | ) | (188.0 | ) |
| Financing activities | (141.3 | ) | (623.5 | ) | 636.4 |
| 191.6 |
| (203.0 | ) |
| | | | | | |
Assets under management (in billions) (4) | $ | 60.5 |
| 58.1 |
| 60.1 |
| 56.4 |
| 53.6 |
|
| Total square feet under management | 4,633 |
| 4,555 |
| 4,402 |
| 3,994 |
| 3,440 |
|
| | | | | | |
| Balance Sheet Data: | | | | | |
| Cash and cash equivalents | $ | 480.9 |
| 268.0 |
| 258.5 |
| 216.6 |
| 250.4 |
|
| Total assets | 10,025.5 |
| 9,254.4 |
| 8,629.9 |
| 6,187.1 |
| 5,075.3 |
|
Total debt (5) | 688.3 |
| 752.7 |
| 1,267.6 |
| 561.1 |
| 294.6 |
|
Deferred business acquisition obligations (6) | 62.3 |
| 81.9 |
| 102.4 |
| 97.6 |
| 118.1 |
|
| Total liabilities | 6,291.0 |
| 5,872.4 |
| 5,734.7 |
| 3,457.7 |
| 2,652.8 |
|
| Total Company shareholders' equity | 3,691.5 |
| 3,340.1 |
| 2,863.5 |
| 2,688.8 |
| 2,386.8 |
|
(1) We define EBITDA attributable to common shareholders ("EBITDA") as Net income attributable to common shareholders before (i) Interest expense, net of interest income, (ii) Provision for income taxes, and (iii) Depreciation and amortization. Although EBITDA is a non-GAAP financial measure, it is used extensively by management in normal business operations to develop budgets and forecasts as well as measure and reward performance against those budgets and forecasts, exclusive of the impact from capital expenditures, reflected through depreciation expense, along with other components of our capital structure. EBITDA is believed to be useful to investors and other external stakeholders as a supplemental measure of performance and is used in the calculation of certain covenants related to our revolving credit facility. However, this measure should not be considered an alternative to net income determined in accordance with U.S. generally accepted accounting principles ("U.S. GAAP"). Any measure that eliminates components of a company's capital and investment structure as well as costs associated with operations has limitations as a performance measure. In light of these limitations, management also considers results determined in accordance with U.S. GAAP and does not solely rely on EBITDA. Because EBITDA is not calculated under U.S. GAAP, it may not be comparable to similarly titled measures used by other companies.
Below is a reconciliation of our Net income attributable to common shareholders to EBITDA as presented in Item 7. Management's Discussion and Analysis of Financial Condition and Results of Operations.
|
| | | | | | | | | | | |
| | Year Ended December 31, |
| ($ in millions) | 2018 | 2017 (2) | 2016 (2) | 2015 | 2014 |
| Net income attributable to common shareholders | $ | 484.1 |
| 276.0 |
| 329.3 |
| 438.4 |
| 385.7 |
|
| Interest expense, net of interest income | 51.1 |
| 56.2 |
| 45.3 |
| 28.1 |
| 28.3 |
|
| Provision for income taxes | 214.3 |
| 256.3 |
| 117.8 |
| 132.8 |
| 97.6 |
|
| Depreciation and amortization | 186.1 |
| 167.2 |
| 141.8 |
| 108.1 |
| 94.4 |
|
| EBITDA | $ | 935.6 |
| 755.7 |
| 634.2 |
| 707.4 |
| 606.0 |
|
Below is a reconciliation of our net cash provided by operating activities, the most comparable cash flow measure on the statements of cash flows, to EBITDA.
|
| | | | | | | | | | | |
| | Year Ended December 31, |
| ($ in millions) | 2018 | 2017 (2) | 2016 (2) | 2015 | 2014 |
| Net cash provided by operating activities | $ | 604.1 |
| 798.7 |
| 222.6 |
| 375.8 |
| 498.9 |
|
| Interest expense, net of interest income | 51.1 |
| 56.2 |
| 45.3 |
| 28.1 |
| 28.3 |
|
| Provision for income taxes | 214.3 |
| 256.3 |
| 117.8 |
| 132.8 |
| 97.6 |
|
| Change in working capital and non-cash expenses | 66.1 |
| (368.2 | ) | 245.1 |
| 170.7 |
| (18.8 | ) |
| EBITDA | $ | 935.6 |
| 743.0 |
| 630.8 |
| 707.4 |
| 606.0 |
|
(2) Selected Financial Data for 2016 and 2017 has been re-stated in accordance with ASC Topic 606, Revenue from Contracts with Customers, ("ASC 606") and Accounting Standards Update ("ASU") No. 2017-07, Improving the Presentation of Net Periodic Pension Cost and Net Periodic Postretirement Benefit Cost, to align with the re-stated periods on the Consolidated Statements of Comprehensive Income. For information on our adoption of these accounting standards, refer to Note 2, Summary of Significant Accounting Policies, of the Notes to the Consolidated Financial Statements, included in Item 8.
(3) For purposes of computing the ratio of earnings to fixed charges, "earnings" represents net earnings before income taxes, and certain adjustments for activity relative to equity earnings, plus fixed charges, less capitalized interest. Fixed charges consist of (i) interest expense, net of interest income, (ii) amortization of debt discount and financing costs, (iii) capitalized interest, and (iv) one-third of rental expense, which we believe is representative of the interest component of rental expense.
(4) Assets under management represent the aggregate fair value or cost basis (where an appraisal is not available) of assets managed by LaSalle. Assets under management data for separate account and fund management amounts are reported on a one quarter lag.
(5) Total debt includes long-term borrowings under the Facility and Long-term senior notes (net of debt issuance costs except for 2014) and Short-term borrowings, primarily local overdraft facilities.
(6) Deferred business acquisition obligations include both the short-term and long-term obligations to sellers of business for acquisitions closed as of December 31, 2018, with the only condition on these payments being the passage of time. We include these obligations as debt in the calculation of our leverage ratio under the Facility.
ITEM 7. MANAGEMENT'S DISCUSSION AND ANALYSIS OF FINANCIAL CONDITION AND RESULTS OF OPERATIONS
The following discussion and analysis contains certain forward-looking statements generally identified by the words: anticipates, believes, estimates, expects, forecasts, plans, intends and other similar expressions. Such forward-looking statements involve known and unknown risks, uncertainties, and other factors that may cause our actual results, performance, achievements, plans, and objectives to be materially different from any future results, performance, achievements, plans, and objectives expressed or implied by such forward-looking statements. See the Cautionary Note Regarding Forward-Looking Statements after Part IV, Item 15. Exhibits and Financial Statement Schedules.
We present our Management's Discussion and Analysis in the following sections:
(1) An executive summary of our business;
(2) A summary of our critical accounting policies and estimates;
(3)(2) Certain items affecting the comparability of results;
(4)(3) Certain market and other risks we face;
(5)(4) The results of our operations, first on a consolidated basis and then for each of our business segments; and
(6)(5) Liquidity and capital resources.
EXECUTIVE SUMMARY
JLL provides comprehensive integrated real estate and investment management expertise on a local, regional and global level to owner, occupier and investor clients and developers. We are an industry leader in property and corporate integrated facilities management services, with a portfolio of approximately 4.6 billion square feet worldwide. We deliver our array of RES product offerings across our three geographic business segments: (i)In this Item, we discuss results for the Americas, (ii) EMEA and (iii) Asia Pacific. LaSalle, our fourth business segment, is one of the world's largest and most diversified real estate investment management firms, with $60.5 billion of global assets under management as ofyears ended December 31, 2018.
In 2018, we generated revenue2021 and 2020 and the comparison between these years. Discussions of $16.3 billion across our four business segments. In addition to U.S. dollars, we also generated revenue in a variety of other currencies, primarily: British pounds, euros and Australian dollars.
The broad range of real estate services we offer includes (in alphabetical order):
|
| |
Agency Leasing | Logistics and Supply-Chain Management |
Corporate Finance | Mortgage Origination and Servicing |
Debt Placement | Project and Development Management / Design |
Digital Solutions | Property Management |
Energy and Sustainability Services | Real Estate Investment Banking |
Integrated Facilities Management | Research |
Investment Management & Advisory | Strategic Consulting and Advisory Services |
Investment Sales | Tenant Representation |
Lease Administration | Valuations |
We work for a broad range of clients that represent a wide variety of industries and are based in markets throughout the world. Our clients vary greatly in size and include for-profit and not-for-profit entities of all kinds, public-private partnerships and governmental ("public sector") entities looking to outsource real estate services. Through LaSalle, we invest for clients on a global basis in both publicly traded real estate securities and private assets.
See Part I, Item 1. Business for additional information on the services we provide, as well as "Industry Trends", our "Strategic Framework," and our "Distinguishing Attributes and Competitive Differentiators." See also Part I, Item 1A. Risk Factorsresults for the
various risk factors that impactyear ended December 31, 2019 and comparisons between 2020 and 2019 results can be found in Item 7. "Management's Discussion and Analysis of Financial Condition and Results of Operations" of our
business.Annual Report on Form 10-K for the year ended December 31, 2020.
SUMMARY OF CRITICAL ACCOUNTING POLICIES AND ESTIMATES
An understanding of our accounting policies is necessary for a complete analysis of our results, financial position, liquidity and trends. The preparation of our financial statements requires management to make certain critical accounting estimates and judgments that impact (i) the stated amount of assets and liabilities, (ii) disclosure of contingent assets and liabilities as of the date of the financial statements and (iii) the reported amounts of revenue and expenses during the reporting periods. These accounting estimates are based on management's judgment. We consider them to be critical because of their significance to the financial statements and the possibility future events may differ from current judgments, or that the use of different assumptions could result in materially different estimates. We review these estimates on a periodic basis to ensure reasonableness. Although actual amounts may differ from such estimated amounts, we believe such differences are not likely to be material. For additional detail regarding our critical accounting policies and estimates discussed below, see Note 2, Summary of Significant Accounting Policies, of the Notes to Consolidated Financial Statements, included in Item 8.
Revenue Recognition
We earn revenue from the following:
•Leasing;
•Capital Markets;
•Property & Facility Management;
•Project & Development Services;
•Advisory, Consulting and Other; and
•LaSalle.
Our services are generally earned and billed in the form of transaction commissions, advisory and management fees, and incentive fees. Some of the contractual terms related to the services we provide, and thus the revenue we recognize, can be complex and so requires us to make judgments about our performance obligations and the timing and extent of revenue to recognize. In addition, a significant portion of our revenue represents the reimbursement of costs we incur on behalf of clients.
Business Combinations,
Goodwill and Other Intangible Assets
Business Combinations
HistoricallyConsistent with the services nature of the businesses we have grown,acquired, the largest asset on the Consolidated Balance Sheets is goodwill. We do not amortize goodwill; instead, we evaluate goodwill for impairment at least annually, or as events or changes in part, through a series of acquisitions. We account for business combinations usingcircumstances indicate the acquisition method of accounting, which requires that once control is obtained, all of the assets acquired and liabilities assumed, including amounts attributable to noncontrolling interests,carrying value may be recorded at their respective fair values as of the acquisition date. Determination of the fair values of the assets and liabilities acquired requires estimates and the use of valuation techniques when market values are not readily available.impaired.
ForIn addition, we may record intangible assets weas a result of acquisitions, which are primarily composed of customer relationships, management contracts and customer backlog, and are amortized on a straight-line basis over their estimated useful lives. We generally use the income approach to determine fair value, which requires management to make significant estimates and assumptions. These estimates and assumptions primarily include discount rates, terminal growth rates, forecasts of revenue, operating income and capital expenditures. The discount rates reflect the risk factors, from the perspective of a market participant, associated with forecasts of cash flows.
In addition, terms for our acquisitions typically include cash paid atwe establish an intangible upon closing with provisions for additional consideration as well as earn-out payments subject to certain contract provisions and performance. The additional consideration, recorded as deferred business acquisition obligations on the Consolidated Balance Sheets, representssale of a mortgage loan we originated, concurrent with the current discounted valueretention of paymentsits servicing rights and amortize the intangible over the estimated period net servicing income is projected to sellers of businesses for which our acquisition has closed as of the balance sheet dates and for which the only remaining condition on those payments is the passage of time.
Payment of earn-out consideration related to these acquisitions is contingent upon certain conditions being met. Earn-out liabilities are recorded at the acquisition date fair value. Adjustments to earn-out liabilities during the measurement period related to information known or available as of the acquisition date are reflected within Goodwill in the Consolidated Balance Sheets. Adjustments to earn-out liabilities in periods subsequent to the measurement period or related to information known or available after the acquisition date are reflected within Restructuring and acquisition charges on the Consolidated Statements of Comprehensive Income.
be received.
Although we believe our intangible asset estimates of fair value are reasonable, actual financial results could differ from those estimates due to the inherent uncertainty involved in making such estimates. Changes in assumptions concerning future financial results or other underlying assumptions could have a significant impact on the determination of the fair value of the identified intangible assets acquired. Judgment is also required in determining the useful life of a finite-lived intangible asset.
Goodwill and Other Intangible Assets
Consistent with the services nature of the businesses we have acquired, the largest asset on the Consolidated Balance Sheets is goodwill. We do not amortize this goodwill; instead, we evaluate goodwill for impairment at least annually, or as events or changes in circumstances indicate the carrying value may be impaired.
We also record intangible assets as a result of acquisitions, which are primarily composed of management contracts and customer backlog, and are amortized on a straight-line basis over their estimated useful lives. We evaluate our identified intangibles for impairment at least annually, or as events or changes in circumstances indicate the carrying value may be impaired.
Investments in Real Estate Ventures
WeSubstantially all of our investments are grouped within one of the following two categories.
First, we invest in certain real estate ventures that primarily own and operate commercial real estate. Historically, these investments have primarily beenestate, historically through co-investments in funds that LaSalle establishes in the ordinary course of business for its clients. These investments include non-controlling ownership interests generally ranging from less than 1% to 10% of the respective ventures. We account for these investments at fair value or under the equity method of accounting. We
Second, JLL Technologies invests in proptech funds and early to mid-stage companies to improve our strategic position within the real estate technology landscape, including investments through the JLL Spark Global Venture funds. Generally, we account for these investments at fair value.
Where applicable, we estimate fair value of our investments using the net asset value ("NAV") per share (or its equivalent) our investees provide. Critical inputs to NAV estimates includedinclude valuations of the underlying real estate assets and borrowings, which incorporate investment-specific assumptions such as discount rates, capitalization rates, rental and expense growth rates, and asset-specific market borrowing rates. In circumstances where the NAV provided by the investee has a reporting date different than ours or when the NAV is not calculated consistent with U.S. GAAP measurement principles, we adjust the NAV accordingly.
For InvestmentsJLL Technologies investments in real estate venturesproptech companies, we primarily estimate the fair value based on the per-share pricing. Subsequent funding rounds or changes in the companies' business strategy/outlook are indicators of a change in fair value.
For all investments reported at fair value, our investment is increased or decreased each reporting period by the difference between the fair value of the investment and the carrying value as of the balance sheet date. We reflect these fair value adjustments as gains or losses on the Consolidated Statements of Comprehensive Income within Equity earnings from real estate ventures.earnings.
Income Taxes
We account for income taxes under the asset and liability method. We recognize deferred tax assets and liabilities for the expected future tax consequences attributable to (i) differences between the financial statement carrying amounts of existing assets and liabilities and their respective tax bases and (ii) operating loss and tax credit carryforwards. We measure deferred tax assets and liabilities using the enacted tax rates expected to apply to taxable income in the years in which we expect those temporary differences to be recovered or settled. We recognize into income the effect on deferred tax assets and liabilities of a change in tax rates in the period including the enactment date.
Because of the global and cross-border nature of our business, our corporate tax position is complex. We generally provide for taxes in each tax jurisdiction in which we operate based on local tax regulations and rules. Such taxes are provided on netpre-tax earnings and include the provision offor taxes on substantively all differences between financial statement amounts and amounts used in tax returns, excluding certain non-deductible items and permanent differences.
Our global effective tax rate is sensitive to the complexity of our operations as well as to changes in the mix of our geographic profitability. Local statutory tax rates range from 10%0% to 39%38.1% in the countries in which we have significant operations. We evaluate our estimated effective tax rate on a quarterly basis to reflect forecast changes in our geographic mix of income and legislative actions on statutory tax rates.
We provide for the effects of income taxes on interim financial statements based on our estimate of the effective tax rate for the full year.
Our effective tax ratesrate was 21.6%, 20.2% and 22.9% for the yearsyear ended December 31, 2018, 20172021, 2020, and 2016 were 23.7%, (excluding the final provision for the enactment of tax legislation in the U.S. in December 2017), 24.4% (excluding the provisional estimated expense in response to the enactment of tax legislation in the U.S. in December 2017), and 25.5%,2019, respectively.
Very low tax rate jurisdictions (those with effective national and local combined tax rates of 25% or lower) providing the most significant contributions to our effective tax rate include: Hong Kong (16.5%), Singapore (17%), the United Kingdom (19%) and Saudi Arabia (20%).
Based on our historical experience and future business plans, we do not expect to repatriate our foreign source earnings to the U.S. As of December 31, 2018,2021, we have therefore not provided for withholding tax, dividend distribution tax, capital gains taxes, or other taxes which could arise upon such distribution. We believe our policy of permanently reinvesting earnings of foreign subsidiaries does not significantly impact our liquidity.
We have established valuation allowances against deferred tax assets where expected future taxable income does not support their realization on a more-likely-than-not basis. We formally assess the likelihood of being able to utilize current tax losses in the future on a country-by-country basis, commensurate with the determination of each quarter’s income tax provision. We establish or increase valuation allowances upon specific indications the carrying value of a tax asset may not be recoverable. Alternatively, we reduce valuation allowances upon (i) specific indications the carrying value of the related tax asset is more-likely-than-not recoverable or (ii) the implementation of tax planning strategies which allow an asset we previously determined to be not realizable to be viewed as realizable.
The table below summarizes certain information regarding the gross deferred tax assets and valuation allowance.
| | | | | | | | December 31, |
| | December 31, | |
| ($ in millions) | 2018 | 2017 | |
| (in millions) | | (in millions) | 2021 | 2020 |
| Gross deferred tax assets | $ | 429.4 |
| 417.5 |
| Gross deferred tax assets | $ | 708.6 | | 584.8 | |
| Valuation allowance | 79.2 |
| 59.7 |
| Valuation allowance | 128.8 | | 71.4 | |
The increase in gross deferred tax assets in 20182021 was primarily the result of increases(i) the revaluation of existing UK net operating loss carryovers, (ii) net operating losses from acquired companies and (iii) U.S. capital loss carryovers. The increase in valuation reserves was primarily the result of new reserves on the acquired net operating losses and the U.S. capital loss carryovers.
We evaluate our segment operating performance before tax, and do not consider it meaningful to allocate tax by segment. Estimations and judgments relevant to the determination of tax expense, assets, and liabilities require analysis of the tax environment and the future profitability, for tax purposes, of local statutory legal entities rather than business segments. Our statutory legal entity structure generally does not mirror the way we organize, manage, and report our business operations. For example, the same legal entity may include both LaSalle and RES businesses in a particular country.
As of December 31, 2018,2021, the amount of unrecognized tax benefits was $62.7$79.3 million. We believe it is reasonably possible that matters for which we have recorded $23.4$32.0 million of unrecognized tax benefits as of December 31, 2018,2021, will be resolved during 2019.2022. The recognition of tax benefits, and other changes to the amounts of our unrecognized tax benefits, may occur as the result of ongoing operations, the outcomes of audits or other examinations by tax authorities, or the passing of statutes of limitations. We do not expect changes to our unrecognized tax benefits to have a significant impact on net income, the financial position, or the cash flows of JLL. We do not believe we have material tax positions for which the ultimate deductibility is highly certain but for which there is uncertainty about the timing of such deductibility.
NEW ACCOUNTING STANDARDS
Effective January 1, 2019, we will adopt ASU No. 2016-02, Leases (Topic 842), which increases transparency and comparability by requiring the recognition of lease assets and lease liabilities on the balance sheet as well as requiring the disclosure of key information about leasing arrangements. We will apply the optional transition method upon adoption, which does not require the restatement of prior period information. The adoption of this ASU will result in a significant increase to the Consolidated Balance Sheet to reflect right-of-use assets and lease liabilities primarily associated with our office leases around the world.
For additional discussion about ASU No. 2016-02 and other new accounting standards, referRefer to Note 2, Summary of Significant Accounting Policies of the Notes to Consolidated Financial Statements, included in Item 8 of the Consolidated Financial Statements.8.
ITEMS AFFECTING COMPARABILITY
Macroeconomic Conditions
Our results of operations and the variability of these results are significantly influenced by (i) macroeconomic trends, (ii) the geopolitical environment, (iii) the global and regional real estate markets and (iv) the financial and credit markets. These macroeconomic and other conditions have had, and we expect will continue to have, a significant impact on the variability of our results of operations. Specifically in 2020 and also into 2021, macroeconomic conditions influenced by the COVID-19 pandemic impacted our operations.
Acquisitions
The timing of acquisitions may impact the comparability of our results on a year-over-year basis. Our results include incremental revenues and expenses fromfollowing the completion date of an acquisition. In addition, there is generally an initial adverse impact on net income from an acquisition as a result of pre-acquisition due diligence expenditures, transaction/deal costs and post-acquisition integration costs, such as fees from third-party advisors engaged to assist with onboarding and process alignment.alignment, retention and severance expense, early lease termination costs, and other integration expenses.
LaSalle Revenue
Our investment management business is, in part, compensated through incentive fees where performance of underlying funds' investments exceeds agreed-to benchmark levels. Depending upon performance, disposition activityEquity Earnings and the contractual timing of measurement periods with clients, these fees can be significant and vary substantially from period to period.Incentive Fees
Equity earnings from real estate ventures also may vary substantially from period to period for a variety of reasons, including as a result of:of (i) gains (losses)valuation increases (decreases) on investments reported at fair value, (ii) gains (losses) on asset dispositions and (iii) impairment charges. The timing of recognition of these items may impact comparability between quarters, in any one year, or compared to a prior year.
LaSalle, our investment management business, is in part compensated through incentive fees where performance of underlying funds' investments exceeds agreed-to return hurdles. Depending upon performance, disposition activity and the contractual timing of measurement periods with clients, these fees can be significant and may vary substantially from period to period.
The comparability of these items can be seen in Note 3, Business Segments, of the Notes to Consolidated Financial Statements, included in Item 8, and is discussed further in Segment Operating Results included herein.
Foreign Currency
We conduct business using a variety of currencies, but we report our results in U.S. dollars. As a result, the volatility of currencies against the U.S. dollar may positively or negatively impact our results. This volatility can make it more difficult to perform period-to-period comparisons of the reported U.S. dollar results of operations because such results may indicate a rate of growth or decline that might not have been consistent with the real underlying rate of growth or decline in the local operations. Consequently, we provide information about the impact of foreign currencies in the period-to-period comparisons of the reported results of operations in our discussion and analysis of financial condition in the Results of Operations section below.
Transactional-BasedTransaction-Based Revenue
Transactional-basedTransaction-based fees, that are impacted by the size and timing of our clients' transactions, from real estate investment banking, capital markets activities, leasing activities and other services within our RES business, and LaSalle, increase the variability of the revenue we earn. The timing and the magnitude of these fees can vary significantly from year-to-year and quarter-to-quarter, and from segment-to-segment.
MARKET RISKS
Market Risk
The principal market risks we face due to the risk of loss arising from adverse changes in market rates and prices are:
•Interest rates on theour unsecured credit facility (the "Facility"); and
•Foreign exchange risks.
In the normal course of business, we manage these risks through a variety of strategies, including hedging transactions using various derivative financial instruments such as foreign currency forward contracts. We enter into derivative instruments that are short-term in duration with high credit-quality counterparties and diversify our positions across such counterparties in order to reduce our exposure to credit losses. We do not enter into derivative transactions for trading or speculative purposes.
Interest Rates
We centrally manage our debt, considering investment opportunities and risks, tax consequences, and overall financing strategies. Our overall interest rate risk management objectives are to limit the impact of interest rate changes on earnings and cash flows and to lower our overall borrowing costs. We are primarily exposed to interest rate risk on our Facility, which had a borrowing capacity of $2.75 billion as of December 31, 2018.2021. The Facility consists of revolving credit available for working capital, investments, capital expenditures and acquisitions. Our average outstanding borrowings under the Facility during 20182021 were $364.1$432.0 million, with an effective interest rate of 2.9%0.9%. We had no$138.2 million of outstanding borrowings under the Facility and outstanding letters of credit of $8.6 million as of December 31, 2018.2021. The Facility bears a variable rate of interest that fluctuates based on market rates.
Our Notes, $275.0 million face value due in November 2022, bear interest at an annual rate of 4.4%, subject to adjustment if a credit rating assigned to the Notes is downgraded below an investment grade rating (or subsequently upgraded). Our €350.0 million face value of Euro Notes is split between €175.0 million due in June 2027 and €175.0 million due in June 2029, bearing interest at an annual rate of 1.96% and 2.21%, respectively. The issuance of the Notes and Euro Notes at a fixed interest rates has helped to limit our exposure to future movements in interest rates. Our overall interest rate risk management objective is to limit the impact of interest rate changes on earnings and cash flows and to lower our overall borrowing costs.
We assess interest rate sensitivity to estimate the potential effect of rising short-term interest rates on our variable rate debt. If short-term interest rates were 50 basis points higher during 2018, our results would reflect an increase of $1.8 million to2021, Interest expense, net of interest income.income, would have been $2.2 million higher.
Foreign Exchange
Foreign exchange risk is the risk we will incur economic losses due to adverse changes in foreign currency exchange rates. Our revenue from outside of the U.S. approximated 48%42% and 43% of our total revenue for 20182021 and 2017,2020, respectively, as outlined in the table below. Operating in international markets means we are exposed to movements in foreign exchange rates, most significantly by the British pound and the euro.
We mitigate our foreign currency exchange risk principally by (i) establishing local operations in the markets we serve and (ii) invoicing customers in the same currency as the source of the costs. The impact of translating expenses incurred in foreign currencies into U.S. dollars reduces the impact of translating revenue earned in foreign currencies into U.S. dollars. In addition, British pound and Singapore dollar expenses incurred as a result of our regional headquarters being located in London and Singapore, respectively, act as ongoing partial operational hedges against our translation exposures to British pounds and Singapore dollars.those currencies.
We enter into forward foreign currency exchange contracts to manage currency risks associated with intercompany loan balances. Generally, the maturity of these contracts is less than 60 days. As of December 31, 2018,2021, we had forward exchange contracts in effect with a gross notional value of $1.99$2.61 billion ($0.841.51 billion on a net basis). This corresponding net carrying gain is generally offset by a carrying loss in associated intercompany loans.
Although we operate globally, we report our results in U.S. dollars. As a result, the strengthening or weakening of the U.S. dollar in relation to currencies we are exposed to may positively or negatively impact our reported results. The following table sets forth the revenue derived from our most significant currencies. |
| | | | | | | | | | | |
| | Year Ended December 31, |
| ($ in millions) | 2018 | % of Total | | 2017 | % of Total |
| United States dollar | $ | 8,523.8 |
| 52.2 | % | | $ | 7,572.1 |
| 52.4 | % |
| Euro | 1,527.1 |
| 9.4 |
| | 1,244.8 |
| 8.6 |
|
| British pound | 1,526.3 |
| 9.4 |
| | 1,447.3 |
| 10.0 |
|
| Australian dollar | 916.7 |
| 5.6 |
| | 909.7 |
| 6.3 |
|
| Indian rupee | 580.4 |
| 3.6 |
| | 516.2 |
| 3.6 |
|
| Chinese yuan | 505.5 |
| 3.1 |
| | 439.7 |
| 3.0 |
|
| Hong Kong dollar | 487.2 |
| 3.0 |
| | 450.0 |
| 3.1 |
|
| Singapore dollar | 458.7 |
| 2.8 |
| | 268.0 |
| 1.9 |
|
| Canadian dollar | 390.5 |
| 2.4 |
| | 333.4 |
| 2.3 |
|
| Japanese yen | 285.2 |
| 1.7 |
| | 238.2 |
| 1.6 |
|
| Other currencies | 1,117.0 |
| 6.8 |
| | 1,033.8 |
| 7.2 |
|
| Total revenue | $ | 16,318.4 |
| 100.0 | % | | $ | 14,453.2 |
| 100.0 | % |
| | | | | | | | | | | | | | | | | |
| Year Ended December 31, |
| ($ in millions) | 2021 | % of Total | | 2020 | % of Total |
| United States dollar | $ | 11,283.1 | | 58.3 | % | | $ | 9,457.8 | | 57.0 | % |
| British pound | 1,626.6 | | 8.4 | | | 1,341.1 | | 8.1 | |
| Euro | 1,393.3 | | 7.2 | | | 1,350.6 | | 8.1 | |
| Australian dollar | 1,118.7 | | 5.8 | | | 876.1 | | 5.3 | |
| Hong Kong dollar | 545.6 | | 2.8 | | | 512.2 | | 3.1 | |
| Chinese yuan | 539.1 | | 2.8 | | | 473.1 | | 2.9 | |
| Canadian dollar | 508.3 | | 2.6 | | | 432.6 | | 2.6 | |
| Indian rupee | 508.2 | | 2.6 | | | 524.5 | | 3.2 | |
| Singapore dollar | 327.4 | | 1.7 | | | 246.6 | | 1.5 | |
| Japanese yen | 256.8 | | 1.3 | | | 257.9 | | 1.6 | |
| Other currencies | 1,259.9 | | 6.5 | | | 1,117.4 | | 6.7 | |
| Total revenue | $ | 19,367.0 | | 100.0 | % | | $ | 16,589.9 | | 100.0 | % |
Had the British pound-to-U.S. dollar exchange rates been 10% higher throughout the course of 2018,2021, we estimate our reported operating income would have increaseddecreased by $10.2$2.2 million. Had euro-to-U.S. dollar exchange rates been 10% higher throughout the course of 2018,2021, we estimate our reported operating income would have increased by $41.5$9.2 million. These hypothetical calculations estimate the impact of translating results into U.S. dollars and do not include an estimate of the impact a 10% increase in the U.S. dollar against other currencies would have on our foreign operations.
Seasonality
Historically, our quarterly revenue and profits have tended to increase from quarter to quarter as the year progresses. This is a result of a general focus in the real estate industry on completing or documenting transactions by calendar year-endyear end and the fact that certain expenses are constant throughthroughout the year. Historically, we have reported a relatively smaller profit in the first quarter and then increasingly larger profits during each of the following three quarters, excluding the recognition of investment-generated performance fees and realized and unrealized co-investment equity earnings and losses (each of which can be unpredictable). We generallyGenerally, we recognize such performanceincentives fees and realized co-investment equity earnings or losses when assets are sold or as a result of valuation increases in the portfolio, the timing of which is geared towardmay not be predicable or recurring. In addition, co-investment equity gains and losses are primarily dependent on underlying valuations, the benefitdirection and magnitude of our clients.changes to such valuations are not predictable. Non-variable operating expenses, which we treat as expenses when incurred during the year, are relatively constant on a quarterly basis. In 2020 and 2021, macroeconomic conditions influenced by the COVID-19 pandemic impacted the historical seasonality of our revenue and profits. By the end of 2021, the historical seasonality trends began to return.
Inflation
Our operating expenses fluctuate with our revenue and general economic conditions including inflation. However, we do not believe inflation has had a material impact on our results of operations during the three-year period ended December 31, 2018.2021.
RESULTS OF OPERATIONS
Definitions
•We define market volumes for Leasing as gross absorption of office real estate space in square feet for the U.S., Europe and selected markets in Asia Pacific. We define market volumes for Capital Markets as the U.S. dollar equivalent value of investment sales transactions globally. "n.m."
•Assets under management data for LaSalle is defined asreported on a one-quarter lag.
•"MENA": Middle East and North Africa. "Greater China": China, Hong Kong, Macau and Taiwan.
•"n.m.": not meaningful, represented by a percentage change of greater than 100%,1,000% favorable or unfavorable. "Greater China" is defined as China, Hong Kong, Macau and Taiwan.
Reclassifications
•We have reclassified certain prior year amountsrenamed our Corporate Solutions business to conform to the current presentation, including the change to our calculation of the non-GAAP measure "Fee revenue" further discussed below. In addition, comparative periods have been restated to reflect the adoption of ASC Topic 606. Refer to New Accounting Standards within Note 2, Summary of Significant Accounting Policies, of the Consolidated Financial Statements for additional information.
"Work Dynamics" effective June 2021.
Year Ended December 31, 20182021 compared with Year Ended December 31, 20172020
| | | | | | | | | | | | | | | | | |
| Year Ended December 31, | Change in | % Change in Local Currency |
| ($ in millions) | 2021 | 2020 | U.S. dollars |
| Leasing | $ | 2,794.0 | | 1,884.2 | | 909.8 | | 48 | % | 47 | % |
| Capital Markets | 2,193.5 | | 1,407.4 | | 786.1 | | 56 | | 54 | |
| Property & Facility Management | 10,222.7 | | 9,485.4 | | 737.3 | | 8 | | 6 | |
| Project & Development Services | 2,684.9 | | 2,530.1 | | 154.8 | | 6 | | 4 | |
| Advisory, Consulting and Other | 971.8 | | 861.0 | | 110.8 | | 13 | | 10 | |
| Real Estate Services ("RES") revenue | $ | 18,866.9 | | 16,168.1 | | 2,698.8 | | 17 | % | 15 | % |
| LaSalle | 500.1 | | 421.8 | | 78.3 | | 19 | | 17 | |
| Revenue | $ | 19,367.0 | | 16,589.9 | | 2,777.1 | | 17 | % | 15 | % |
| Reimbursements | 8,321.4 | | 7,689.8 | | 631.6 | | 8 | | 7 | |
| Revenue before reimbursements | 11,045.6 | | 8,900.1 | | 2,145.5 | | 24 | | 22 | |
| Gross contract costs | (2,881.5) | | (2,703.2) | | (178.3) | | 7 | | 4 | |
| Net non-cash MSR and mortgage banking derivative activity | (59.3) | | (66.6) | | 7.3 | | (11) | | (12) | |
| Fee revenue | $ | 8,104.8 | | 6,130.3 | | 1,974.5 | | 32 | % | 31 | % |
| Leasing | 2,712.7 | | 1,817.8 | | 894.9 | | 49 | | 48 | |
| Capital Markets | 2,099.5 | | 1,309.2 | | 790.3 | | 60 | | 59 | |
| Property & Facility Management | 1,286.2 | | 1,199.5 | | 86.7 | | 7 | | 5 | |
| Project & Development Services | 805.9 | | 776.1 | | 29.8 | | 4 | | 2 | |
| Advisory, Consulting and Other | 727.3 | | 627.0 | | 100.3 | | 16 | | 13 | |
| RES fee revenue | $ | 7,631.6 | | 5,729.6 | | 1,902.0 | | 33 | % | 31 | % |
| LaSalle | 473.2 | | 400.7 | | 72.5 | | 18 | | 17 | |
| | | | | |
| Compensation and benefits excluding gross contract costs | $ | 5,731.3 | | 4,277.1 | | 1,454.2 | | 34 | % | 32 | % |
| Operating, administrative and other expenses excluding gross contract costs | 1,087.1 | | 991.9 | | 95.2 | | 10 | | 8 | |
| Depreciation and amortization | 217.5 | | 226.4 | | (8.9) | | (4) | | (6) | |
| Restructuring and acquisition charges | 84.7 | | 142.4 | | (57.7) | | (41) | | (40) | |
| Total fee-based operating expenses | 7,120.6 | | 5,637.8 | | 1,482.8 | | 26 | | 25 | |
| Gross contract costs | 2,881.5 | | 2,703.2 | | 178.3 | | 7 | | 4 | |
| Total operating expenses, excluding reimbursed expenses | $ | 10,002.1 | | 8,341.0 | | 1,661.1 | | 20 | % | 18 | % |
| Operating income | $ | 1,043.5 | | 559.1 | | 484.4 | | 87 | % | 86 | % |
| Equity earnings | $ | 209.4 | | 8.0 | | 201.4 | | n.m. | n.m. |
| Adjusted EBITDA | $ | 1,496.5 | | 859.6 | | 636.9 | | 74 | % | 73 | % |
|
| | | | | | | | | | | |
| | Year Ended December 31, | Change in | % Change in Local Currency |
| ($ in millions) | 2018 | 2017 | U.S. dollars |
| Leasing | $ | 2,372.1 |
| 2,051.9 |
| 320.2 |
| 16 | % | 16 | % |
| Capital Markets | 1,145.4 |
| 1,149.4 |
| (4.0 | ) | — |
| (1 | ) |
| Property & Facility Management | 8,782.8 |
| 7,821.3 |
| 961.5 |
| 12 |
| 13 |
|
| Project & Development Services | 2,669.0 |
| 2,344.5 |
| 324.5 |
| 14 |
| 13 |
|
| Advisory, Consulting and Other | 815.2 |
| 730.3 |
| 84.9 |
| 12 |
| 11 |
|
| Real Estate Services ("RES") revenue | $ | 15,784.5 |
| 14,097.4 |
| 1,687.1 |
| 12 | % | 12 | % |
| LaSalle | 533.9 |
| 355.8 |
| 178.1 |
| 50 |
| 49 |
|
| Revenue | $ | 16,318.4 |
| 14,453.2 |
| 1,865.2 |
| 13 | % | 13 | % |
| Reimbursements | 7,228.9 |
| 6,485.8 |
| 743.1 |
| 11 |
| 12 |
|
| Revenue before reimbursements | 9,089.5 |
| 7,967.4 |
| 1,122.1 |
| 14 |
| 14 |
|
| Gross contract costs | (2,595.0 | ) | (2,215.5 | ) | (379.5 | ) | 17 |
| 16 |
|
| Net non-cash MSR and mortgage banking derivative activity | (8.3 | ) | (15.7 | ) | 7.4 |
| (47 | ) | (47 | ) |
| Fee revenue | $ | 6,486.2 |
| 5,736.2 |
| 750.0 |
| 13 | % | 13 | % |
| Leasing | 2,303.5 |
| 2,000.8 |
| 302.7 |
| 15 |
| 15 |
|
| Capital Markets | 1,093.5 |
| 1,108.3 |
| (14.8 | ) | (1 | ) | (2 | ) |
| Property & Facility Management | 1,163.1 |
| 1,048.5 |
| 114.6 |
| 11 |
| 10 |
|
| Project & Development Services | 798.0 |
| 690.9 |
| 107.1 |
| 16 |
| 15 |
|
| Advisory, Consulting and Other | 616.2 |
| 554.5 |
| 61.7 |
| 11 |
| 12 |
|
| RES fee revenue | $ | 5,974.3 |
| 5,403.0 |
| 571.3 |
| 11 | % | 10 | % |
| LaSalle | 511.9 |
| 333.2 |
| 178.7 |
| 54 |
| 52 |
|
| Compensation and benefits excluding gross contract costs | 4,466.9 |
| 4,023.5 |
| 443.4 |
| 11 |
| 10 |
|
| Operating, administrative and other expenses excluding gross contract costs | 1,095.8 |
| 984.6 |
| 111.2 |
| 11 |
| 11 |
|
| Depreciation and amortization | 186.1 |
| 167.2 |
| 18.9 |
| 11 |
| 11 |
|
| Restructuring and acquisition charges | 38.8 |
| 30.7 |
| 8.1 |
| 26 |
| 30 |
|
| Total fee-based operating expenses | 5,787.6 |
| 5,206.0 |
| 581.6 |
| 11 |
| 11 |
|
| Gross contract costs | 2,595.0 |
| 2,215.5 |
| 379.5 |
| 17 |
| 16 |
|
| Total operating expenses, excluding reimbursed expenses | $ | 8,382.6 |
| 7,421.5 |
| 961.1 |
| 13 | % | 12 | % |
| Operating income | $ | 706.9 |
| 545.9 |
| 161.0 |
| 29 | % | 32 | % |
| Equity earnings | $ | 32.8 |
| 44.4 |
| (11.6 | ) | (26 | )% | (26 | )% |
| Adjusted EBITDA | $ | 953.2 |
| 770.7 |
| 182.5 |
| 24 | % | 25 | % |
Non-GAAP Financial Measures
Management uses certain non-GAAP financial measures to develop budgets and forecasts, measure and reward performance against those budgets and forecasts, and enhance comparability to prior periods. These measures are believed to be useful to investors and other external stakeholders as supplemental measures of core operating performance and include the following:following.
(i)Fee revenue and Fee-basedfee-based operating expenses
(ii)Adjusted EBITDA and Adjusted EBITDA margin and
(iii)Percentage changes against prior periods, presented on a local currency basis.basis
However, non-GAAP financial measures should not be considered alternatives to measures determined in accordance with U.S. GAAP. Any measure that eliminates components of a company’s capital structure, cost of operations or investments, or other results has limitations as a performance measure. In light of these limitations, management also considers U.S. GAAP financial measures and does not rely solely on non-GAAP financial measures. Because our non-GAAP financial measures are not calculated in accordance with U.S. GAAP, they may not be comparable to similarly titled measures used by other companies.
Adjustments to GAAP Financial Measures Used to Calculate non-GAAP Financial Measures
Gross Contract Costs
Gross contract costs represent certain costs associated with client-dedicated employees and third-party vendors and subcontractors and are indirectly reimbursed through the feefees we receive. These costs are presented on a gross basis in Operating expenses with the equal amount of corresponding feefees in Revenue before reimbursements. However, as we generally earn little to no margin on such costs,Consistent with our treatment of directly reimbursed expenses, excluding gross contract costs from both Fee revenue and Fee-based operating expenses more accurately reflects how we manage our expense base and operating margins and also enables a more consistent performance assessment across a portfolio of contracts with varying payment terms and structures, including those with direct versus indirect reimbursement of such costs.
Effective January 1, 2018, we adopted ASC Topic 606, Revenue from Contracts with Customers, ("ASC 606") on a full retrospective basis. The adoption of ASC 606, together with the continued changes in our business mix, prompted us to expand the types of costs excluded from the calculation of our non-GAAP measure "Fee revenue." Specifically, the drivers were (i) the increase in compensation and benefits associated with client-dedicated personnel presented on a gross basis and (ii) the expansion of annuity businesses engaged to provide outsourced services to clients. The most notable change is the inclusion of compensation and benefits associated with client-dedicated employees in gross contract costs. In addition, the previous calculation of gross contract costs applied only to Project & Development Services and Property & Facility Management but now applies to all service lines and businesses. The largest impacts of the change to our definition of fee revenue are within Project & Development Services and Property & Facility Management. See Note 2, Summary of Significant Accounting Policies, for additional information.
Net Non-Cash MSR and Mortgage Banking Derivative Activity
Net non-cash mortgage servicing rights ("MSR") and mortgage banking derivative activity consists of the balances presented within Revenue composed of (i) derivative gains/losses resulting from mortgage banking loan commitment and warehousing activity and (ii) gains recognized from the retention of MSR upon origination and sale of mortgage loans, offset by (iii) amortization of MSR intangible assets over the period that net servicing income is projected to be received. Non-cash derivative gains/losses resulting from mortgage banking loan commitment and warehousing activity are calculated as the estimated fair value of loan commitments and subsequent changes thereof, primarily represented by the estimated net cash flows associated with future servicing rights. MSR gains and corresponding MSR intangible assets are calculated as the present value of estimated net cash flows over the estimated mortgage servicing periods. The above activity is reported entirely within Revenue of the Capital Markets service line of the Americas segment. Excluding net non-cash MSR and mortgage banking derivative activity reflects how we manage and evaluate performance because the excluded activity is non-cash in nature.
Restructuring and Acquisition Charges
Restructuring and acquisition charges primarily consist of:of (i) severance and employment-related charges, including those related to external service providers, incurred in conjunction with a structural business shift, which can be represented by a notable change in headcount, change in leadership or transformation of business processes;processes, (ii) acquisition, transaction and integration-related charges, including non-cash fair value adjustments to assets and liabilities recorded in purchase accounting such as earn-out liabilities and intangible assets;assets and (iii) lease exit charges. Such activity is excluded as the amounts are generally either non-cash in nature or the anticipated benefits from the expenditures would not likely be fully realized until future periods. Restructuring and acquisition charges are excluded from segment operating results and therefore not a line item in the segments’ reconciliation to Adjusted EBITDA.
Gain on Disposition
The gain on disposition reflects the net gain recognized on the sale of a business inbusinesses. Given the Asia Pacific reporting segment. Given our low frequency of business disposals by the company historically, we exclude the gain directly associated with such activity is excluded as it is not considered indicative of core operating performance. In 2021, $12.0 million of the activity related to a business disposition within Americas and $0.4 million related to a sold business within EMEA, while activity in 2020 related to the sale of property management businesses in continental Europe.
Reconciliation of Non-GAAP Financial Measures
Below are the reconciliations of (i) Revenue to fee revenue and (ii) Operating expenses to fee-based operating expenses.
| | | | | | | | Year Ended December 31, |
| | Year Ended December 31, | |
| ($ in millions) | 2018 | 2017 | |
| (in millions) | | (in millions) | 2021 | 2020 |
| Revenue | $ | 16,318.4 |
| 14,453.2 |
| Revenue | $ | 19,367.0 | | 16,589.9 | |
| Reimbursements | 7,228.9 |
| 6,485.8 |
| Reimbursements | (8,321.4) | | (7,689.8) | |
| Revenue before reimbursements | 9,089.5 |
| 7,967.4 |
| Revenue before reimbursements | 11,045.6 | | 8,900.1 | |
| Adjustments: | | | Adjustments: | |
| Gross contract costs | (2,595.0 | ) | (2,215.5 | ) | Gross contract costs | (2,881.5) | | (2,703.2) | |
| Net non-cash MSR and mortgage banking derivative activity | (8.3 | ) | (15.7 | ) | Net non-cash MSR and mortgage banking derivative activity | (59.3) | | (66.6) | |
| Fee revenue | $ | 6,486.2 |
| 5,736.2 |
| Fee revenue | $ | 8,104.8 | | 6,130.3 | |
| | | | |
| Operating expenses | $ | 15,611.5 |
| 13,907.3 |
| Operating expenses | $ | 18,323.5 | | 16,030.8 | |
| Reimbursed expenses | 7,228.9 |
| 6,485.8 |
| Reimbursed expenses | (8,321.4) | | (7,689.8) | |
| Operating expenses, excluding reimbursed expenses | 8,382.6 |
| 7,421.5 |
| Operating expenses, excluding reimbursed expenses | 10,002.1 | | 8,341.0 | |
Less: Gross contract costs | (2,595.0 | ) | (2,215.5 | ) | Less: Gross contract costs | (2,881.5) | | (2,703.2) | |
| Fee-based operating expenses | $ | 5,787.6 |
| 5,206.0 |
| Fee-based operating expenses | $ | 7,120.6 | | 5,637.8 | |
| | | | |
| Operating income | $ | 706.9 |
| 545.9 |
| Operating income | $ | 1,043.5 | | 559.1 | |
Below is (i) a reconciliation of Net income attributable to common shareholders to EBITDA and Adjusted EBITDA, (ii) the Net income margin attributable to common shareholders (measured on Revenue before reimbursements), and (ii)(iii) the Adjusted EBITDA margin (on a(measured on fee-revenue basis),and presented on a local currency basis.basis).
| | | | | | | | | | | |
| Year Ended December 31, |
| (in millions) | 2021 | | 2020 |
| Net income attributable to common shareholders | $ | 961.6 | | | 402.5 | |
| Add: | | | |
| Interest expense, net of interest income | 40.1 | | | 52.8 | |
| Provision for income taxes | 264.3 | | | 106.9 | |
| Depreciation and amortization | 217.5 | | | 226.4 | |
| EBITDA | $ | 1,483.5 | | | 788.6 | |
| Adjustments: | | | |
| Restructuring and acquisition charges | 84.7 | | | 142.4 | |
| Gain on disposition | (12.4) | | | (4.8) | |
| Net non-cash MSR and mortgage banking derivative activity | (59.3) | | | (66.6) | |
| Adjusted EBITDA | $ | 1,496.5 | | | 859.6 | |
| | | |
| Net income margin attributable to common shareholders | 8.7 | % | | 4.5 | % |
| | | |
| Adjusted EBITDA margin | 18.6 | % | | 14.0 | % |
|
| | | | | | |
| | Year Ended December 31, |
| ($ in millions) | 2018 | | 2017 |
| Net income attributable to common shareholders | $ | 484.1 |
| | 276.0 |
|
| Add: | | | |
| Interest expense, net of interest income | 51.1 |
| | 56.2 |
|
| Provision for income taxes | 214.3 |
| | 256.3 |
|
| Depreciation and amortization | 186.1 |
| | 167.2 |
|
| EBITDA | $ | 935.6 |
| | 755.7 |
|
| Adjustments: | | | |
| Restructuring and acquisition charges | 38.8 |
| | 30.7 |
|
| Gain on disposition | (12.9 | ) | | — |
|
| Net non-cash MSR and mortgage banking derivative activity | (8.3 | ) | | (15.7 | ) |
| Adjusted EBITDA | $ | 953.2 |
| | 770.7 |
|
| | | | |
Net income margin attributable to common shareholders1 | 5.3 | % | | 3.5 |
|
| | | | |
| Adjusted EBITDA margin | 14.9 | % | | 13.4 |
|
1 measured against Revenue before reimbursements
In discussing our operating results, we report Adjusted EBITDA margins and refer to percentage changes in local currency, unless otherwise noted. Amounts presented on a local currency basis are calculated by translating the current period results of our foreign operations to U.S. dollars using the foreign currency exchange rates from the comparative period. We believe this methodology provides a framework for assessing performance and operations excluding the effect of foreign currency fluctuations.
The following table reflects the reconciliation to local currency amounts for consolidated (i) Revenue, (ii) fee revenue, (iii) Operating income and (iv) Adjusted EBITDA.
| | | | | | | | |
| Year Ended December 31, |
| ($ in millions) | 2021 | % Change |
| Revenue: | | |
| At current period exchange rates | $ | 19,367.0 | | 17 | % |
| Impact of change in exchange rates | (297.5) | | n/a |
| At comparative period exchange rates | $ | 19,069.5 | | 15 | % |
| | |
| Fee revenue: | | |
| At current period exchange rates | $ | 8,104.8 | | 32 | % |
| Impact of change in exchange rates | (103.6) | | n/a |
| At comparative period exchange rates | $ | 8,001.2 | | 31 | % |
| | |
| Operating income: | | |
| At current period exchange rates | $ | 1,043.5 | | 87 | % |
| Impact of change in exchange rates | (3.8) | | n/a |
| At comparative period exchange rates | $ | 1,039.7 | | 86 | % |
| | |
| Adjusted EBITDA: | | |
| At current period exchange rates | $ | 1,496.5 | | 74 | % |
| Impact of change in exchange rates | (7.4) | | n/a |
| At comparative period exchange rates | $ | 1,489.1 | | 73 | % |
|
| | | | | |
| | Year Ended December 31, |
| ($ in millions) | 2018 | % Change |
| Revenue: | | |
| At current period exchange rates | $ | 16,318.4 |
| 13 | % |
| Impact of change in exchange rates | (2.8 | ) | n/a |
|
| At comparative period exchange rates | $ | 16,315.6 |
| 13 | % |
| | | |
| Fee Revenue: | | |
| At current period exchange rates | $ | 6,486.2 |
| 13 | % |
| Impact of change in exchange rates | (11.2 | ) | n/a |
|
| At comparative period exchange rates | $ | 6,475.0 |
| 13 | % |
| | | |
| Operating Income: | | |
| At current period exchange rates | $ | 706.9 |
| 29 | % |
| Impact of change in exchange rates | 13.7 |
| n/a |
|
| At comparative period exchange rates | $ | 720.6 |
| 32 | % |
| | | |
| Adjusted EBITDA: | | |
| At current period exchange rates | $ | 953.2 |
| 24 | % |
| Impact of change in exchange rates | 13.7 |
| n/a |
|
| At comparative period exchange rates | $ | 966.9 |
| 25 | % |
Revenue
Consolidated RES revenue and consolidated fee revenue for 2018 were $16.3increased 15% to $18.9 billion and $6.5 billion, respectively, both increases of 13% from prior year. Annual RES revenue growth was substantially all organic and reflected contributions from all three RES segments. From a service line perspective, Property & Facility Management led RES revenue growth for the year (58% of the growth) with notable contributions from Leasing and Project & Development Services. LaSalle revenue increased 49% from 2017, driven by record incentive fee performance from real estate dispositions on behalf of clients.
The increase in RES fee revenue was led by Leasing, which represented 55% of the growth, with Property & Facility Management and Project & Development Services each representing nearly 20% of the service-line growth. Capital Markets fee revenue decreased 2% from 2017 as declines in Asia Pacific and EMEA more than offset growth in Americas. Geographically, the increase in consolidated RES fee revenue comprises 71% from our Americas segment, 19% from EMEA,increased 31% to $7.6 billion, compared with 2020, with broad-based growth across all geographic segments and 10% from Asia Pacific.
Consolidatedservice lines. Leasing led the consolidated RES revenue and fee revenue growth with increases of 47% and 48%, respectively, versus the prior year. Capital Markets also experienced significant year-over-year growth achieving revenue and fee revenue increases of 54% and 59%, respectively. New wins and expansions of existing client mandates primarily drove the revenue increase in Property & Facility Management, was primarily due to incremental revenue fromup $737.3 million compared with 2020. In addition, strong performance by Valuation Advisory drove the growth in Advisory, Consulting and Other.
Geographically across service lines, Americas (over two-thirdscontributed 78% of the service-line revenue growth and nearly half of theyear-over-year RES fee revenue growth), specifically Corporate Solutions, as well asincrease on a local currency basis; EMEA contributed 12% and Asia Pacific. For Leasing, Americas represented approximately three-fourthsPacific 10%. The following highlights the proportion of both the revenue andRES service line consolidated fee revenue growth, on a local currency basis.basis, compared with 2020, by notable segment.
•Leasing — Americas (82%), EMEA (10%) and Asia Pacific (8%)
•Capital Markets — Americas (75%), EMEA (16%) and Asia Pacific (9%)
•Property & Facility Management — Americas drove nearly two-thirds98% of the revenue increase in consolidated growth
•Project & Development Services — Americas (92%) and nearly half the feeAsia Pacific (49%), partially offset by EMEA
•Advisory, Consulting and Other — Americas (48%), Asia Pacific (43%) and EMEA (9%)
LaSalle's 17% revenue increase.growth, compared with 2020, was driven by higher incentive and advisory fees.
Refer to segment operating results for further detail.
Our consolidated revenue increased 13%17% in both U.S. dollars and 15% on a local currency basis, for 2018, compared with 2017;2020, while consolidated fee revenue increased 13%32% in both U.S. dollars and 31% on a local currency basis. Abasis, compared with 2020. The spread between U.S. dollars and local currency was driven by a strengthening of the U.S. dollar against most currencies, especially the British pound, and euro, against the U.S. dollar was offset by the weakening of the Australian dollar, Canadian dollar and Indian rupee in relation to the U.S. dollar.Chinese yuan.
Operating Expenses
In 2018,2021, consolidated operating expenses, excluding reimbursed expenses, increased 12%18% to $8.4 billion from last year.$10.0 billion. Consolidated fee-based operating expenses, were $5.8$7.1 billion in 2018, an 11%2021, a 25% increase from prior year. The growthhigher expenses were primarily attributable to Americas, which represented 73% of the increase in fee-based operating expenses correspondedon a local currency basis - EMEA represented 14%, Asia Pacific 12% and LaSalle 4%. Refer to segment operating results for additional detail.
The overall expense increase is net of a partial offset from a decrease in Restructuring and acquisition charges; refer to the following table and commentary below for additional detail.
| | | | | | | | | | | |
| | | Year ended December 31, |
| (in millions) | | | | 2021 | 2020 |
| Severance and other employment-related charges | | | | $ | 14.3 | | 69.0 | |
| Restructuring, pre-acquisition and post-acquisition charges | | | | 67.8 | | 88.2 | |
| Fair value adjustments that resulted in a net increase to earn-out liabilities from prior-period acquisition activity | | | | 2.6 | | (14.8) | |
| Total restructuring & acquisition charges | | | | $ | 84.7 | | 142.4 | |
| Portion of total restructuring & acquisition charges related to the acquisition and integration of HFF | | | | $ | 40.0 | | 75.9 | |
Charges associated with the respective revenueacquisition and fee revenue growth and also reflects increased investments in peopleintegration of HFF, Inc. ("HFF") primarily included expenses from retention awards granted to employees upon acquisition as well as technology and platform initiatives. In addition, depreciation and amortization expense increased 11% for the year to $186.1 millionother integration expenses, such as early lease termination costs.
The decrease in 2018. This increase was due to incremental depreciation expense primarily from an increase in technology-related capital expenditures recently placed into service. Amortization expense attributable to acquisition-related intangible assets decreased 6% compared with 2017.
Restructuring and acquisition charges were $38.8 million for the year, compared with $30.7 million in 2017. Charges in 2018 included (i) $25.5 million of severance and other employment-related charges, incurredcompared with respect2020, reflected notable cost mitigation actions taken across the globe in response to headcount reductions or other activities considered to represent structural changes to our local, regional and/or global business operations, (ii) $5.9 millionthe pandemic in 2020.
Interest Expense
Interest expense, net of interest income, for 20182021 was $51.1$40.1 million, down from $56.2$52.8 million in 2017. A decline in the outstanding average borrowings, partially offset2020. The decrease was driven by a higherlower effective interest rate on our Credit Facility wasand a year-over-year reduction in the largest driver of the decrease in net interest expense compared with 2017.average outstanding borrowings. The average outstanding borrowings under our Credit Facility decreased from $888.5to $432.0 million, with an average effective interest rate of 2.0%0.9%, during 2017 to $364.1in 2021, from $865.1 million, with an average effective interest rate of 2.9%1.6%, in 2018. Deferred acquisition obligations, which are recorded at present value in purchase accounting with subsequent accretion reflected within Interest expense, net of interest income, decreased from $81.9 million as of December 31, 2017 to $62.3 million as of December 31, 2018. This decrease was the result of payments made in 2018 relating to acquisitions in prior years and contributed to the decrease in annual net interest expense.
during 2020.
Equity Earnings from Real Estate Ventures
Equity earnings decreased from $44.4were $209.4 million in 2017 to $32.82021, up from $8.0 million in 2018. Substantially all2020.
Valuation increases related to JLL Technologies' investments resulted in $140.8 million of equity earnings this year, compared with $5.8 million in 2020, reflecting continued progress in the activitystrategy to invest in each year was attributableearly-stage proptech companies; refer to LaSalle; referthe Americas segment discussion for additional detail.
LaSalle recognized $62.6 million of equity earnings in 2021, compared with $12.4 million of equity losses in the prior year. Refer to the LaSalle segment results discussion for additional details.detail.
Provision for In addition, substantially all of the $12.7 million of first-quarter 2020 equity earnings in the Americas segment were attributable to gains by consolidated variable interest entities in which we held no equity interest; these gains are also reflected in net income attributable to noncontrolling interest and, therefore, have no impact to net income attributable to common shareholders.
Income Taxes
The provision for income taxes was $214.3$264.3 million inand $106.9 million for the current year, reflecting a consolidatedyears ended December 31, 2021 and 2020, respectively, representing effective tax raterates ("ETR") of 30.4%. The current year provision reflects a $42.0 million decrease from 2017, where the ETR was 47.8%. In 2017, the provision included an additional expense of $125.9 million which represented (i) our provisional estimate of the transition tax on deemed repatriated earnings of foreign subsidiaries ("transition tax")21.6% and (ii) the net remeasurement of U.S. deferred tax assets and liabilities in response to the U.S. tax legislation enacted in December 2017. In 2018, we did not anticipate a significant true-up to the provisional estimate of the transition tax until the fourth quarter, when our interpretation of U.S. Department of Treasury guidelines released during that period resulted in the recognition of an additional $47.0 million predominantly related to the transition tax.
Excluding the additional expense related to the U.S. tax legislation, our consolidated ETR was 23.7% in 2018 and 24.4% in 2017.20.2%, respectively. Refer to the Income Tax discussion in the Summary of Critical Accounting Policies and Estimates and Note 8, Income Taxes, of the Notes to Consolidated Financial Statements, included in Item 8, for a further discussion of our effective tax rate, included in Item 8.rate.
Net Income and Adjusted EBITDA
Net income attributable to common shareholders was $484.1$961.6 million for the year, or $10.54$18.47 per diluted common share, compared with $276.0$402.5 million for 2017,2020, or $6.03$7.70 per diluted common share. Adjusted EBITDA increased 73% from the prior year to $1,496.5 million in 2021. Net income margin attributable to common shareholders was 5.3%8.7% in 2018,2021 up from 3.5%4.5% in the prior year. Adjusted EBITDA, which increased 25% from the prior year, was $953.2 million this year. Adjusted EBITDA margin, calculated on a fee revenue basis, was 14.7%18.5% in USD for 2018 (14.9%2021 (18.6% in local currency), compared with 13.4%14.0% last year. The 450 basis point margin expansion and improvementwas primarily driven by the significant increase in adjusted EBITDArevenue, particularly from higher margin transaction-based service lines, as well as higher equity earnings, as noted above. These drivers were primarily due to (i) our RES businesses, most notably Americas and EMEA and (ii) LaSalle incentive fees, partially offset by the expected reduction of certain non-permanent cost savings from 2020 and incremental investments in platformpeople and transformation initiatives.technology.
Segment Operating Results
We manageThrough 2021, we managed and reportreported our operations as four business segments:
Thesegments. Our three geographic regions of RES including:
(1)segments include Americas,
(2) EMEA and
(3) Asia Pacific;
and
(4)Pacific. Our fourth segment, LaSalle, which offers investment management services on a global basis.
Each geographic region offers our full range of real estate services, including agency leasing and tenant representation, capital markets, property management, facility management, project and development services, and advisory, consulting and valuation services, including technology solutions. We define "property management" to be services we provide to non-occupying property investors and "facility management" to be services we provide to owner-occupiers. LaSalle provides investment management services to institutional investors and high-net-worth individuals.
Operating income represents total revenue less direct and allocated indirect expenses. We allocate all indirect expenses to our segments, other than interest and income taxes, as nearly all expenses incurred benefit one or more of the segments. Allocated expenses primarily consist of corporate global platform overhead, which we allocate to the business segments based on the budgeted operating expenses of each segment.
For segment reporting, (i) gross contract costs and (ii) net non-cash MSR and mortgage banking derivative activity are both excluded from revenue in determining "fee revenue". Gross contract costs are excluded from operating expenses in determining "fee-based operating expenses". In addition, our measure of segment results, Segment income, excludes Restructuring and acquisition charges.
Americas - Real Estate Services
| | | | | | | | | | | | | | | | | |
| | | | | % Change |
| Year Ended December 31, | Change in | in Local |
| ($ in millions) | 2021 | 2020 | U.S. dollars | Currency |
| Revenue | $ | 11,887.1 | | 10,005.2 | | 1,881.9 | | 19 | % | 18 | % |
| Reimbursements | (6,034.2) | | (5,643.5) | | (390.7) | | 7 | | 7 | |
| Revenue before reimbursements | $ | 5,852.9 | | 4,361.7 | | 1,491.2 | | 34 | % | 34 | % |
| Gross contract costs | (918.0) | | (842.5) | | (75.5) | | 9 | | 9 | |
| Net non-cash MSR and mortgage banking derivative activity | (59.3) | | (66.6) | | 7.3 | | (11) | | (11) | |
| Fee revenue | $ | 4,875.6 | | 3,452.6 | | 1,423.0 | | 41 | % | 41 | % |
| Leasing | 2,132.1 | | 1,403.7 | | 728.4 | | 52 | | 52 | |
| Capital Markets | 1,463.4 | | 881.3 | | 582.1 | | 66 | | 66 | |
| Property & Facility Management | 648.6 | | 592.5 | | 56.1 | | 9 | | 9 | |
| Project & Development Services | 393.3 | | 376.4 | | 16.9 | | 4 | | 4 | |
| Advisory, Consulting and Other | 238.2 | | 198.7 | | 39.5 | | 20 | | 20 | |
| Compensation, operating and administrative expenses excluding gross contract costs | 3,864.8 | | 2,831.9 | | 1,032.9 | | 36 | | 36 | |
| Depreciation and amortization | 138.5 | | 151.4 | | (12.9) | | (9) | | 16 | |
| Segment fee-based operating expenses (excluding restructuring & acquisition charges) | 4,003.3 | | 2,983.3 | | 1,020.0 | | 34 | | 34 | |
| Gross contract costs | 918.0 | | 842.5 | | 75.5 | | 9 | | 9 | |
| Segment operating expenses, excluding reimbursed expenses | $ | 4,921.3 | | 3,825.8 | | 1,095.5 | | 29 | % | 28 | % |
| | | | | |
| Equity earnings | $ | 142.2 | | 19.0 | | 123.2 | | 648 | % | 648 | % |
| Segment income | $ | 1,073.8 | | 554.9 | | 518.9 | | 94 | % | 93 | % |
| Adjusted EBITDA | $ | 1,157.6 | | 626.6 | | 531.0 | | 85 | % | 84 | % |
|
| | | | | | | | | | | |
| | | | | | % Change |
| | Year Ended December 31, | Change in | in Local |
| ($ in millions) | 2018 | 2017 | U.S. dollars | Currency |
| Revenue | $ | 9,041.0 |
| 8,015.1 |
| 1,025.9 |
| 13 | % | 13 | % |
| Reimbursements | (5,164.7 | ) | (4,648.5 | ) | (516.2 | ) | 11 |
| 11 |
|
| Revenue before reimbursements | $ | 3,876.3 |
| 3,366.6 |
| 509.7 |
| 15 | % | 16 | % |
| Gross contract costs | (652.9 | ) | (521.0 | ) | (131.9 | ) | 25 |
| 27 |
|
| Net non-cash MSR and mortgage banking derivative activity | (8.3 | ) | (15.7 | ) | 7.4 |
| (47 | ) | (47 | ) |
| Fee Revenue | $ | 3,215.1 |
| 2,829.9 |
| 385.2 |
| 14 | % | 14 | % |
| Leasing | 1,711.3 |
| 1,471.2 |
| 240.1 |
| 16 |
| 17 |
|
| Capital Markets | 490.5 |
| 456.6 |
| 33.9 |
| 7 |
| 7 |
|
| Property & Facility Management | 472.2 |
| 419.3 |
| 52.9 |
| 13 |
| 13 |
|
| Project & Development Services | 368.8 |
| 342.2 |
| 26.6 |
| 8 |
| 9 |
|
| Advisory, Consulting and Other | 172.3 |
| 140.6 |
| 31.7 |
| 23 |
| 27 |
|
| Compensation, operating and administrative expenses excluding gross contract costs | 2,692.4 |
| 2,397.6 |
| 294.8 |
| 12 |
| 13 |
|
| Depreciation and amortization | 109.1 |
| 97.5 |
| 11.6 |
| 12 |
| 12 |
|
| Segment fee-based operating expenses (excluding restructuring & acquisition charges) | 2,801.5 |
| 2,495.1 |
| 306.4 |
| 12 |
| 13 |
|
| Gross contract costs | 652.9 |
| 521.0 |
| 131.9 |
| 25 |
| 27 |
|
| Segment operating expenses, excluding reimbursed expenses | $ | 3,454.4 |
| 3,016.1 |
| 438.3 |
| 15 | % | 15 | % |
| Segment operating income | $ | 421.9 |
| 350.5 |
| 71.4 |
| 20 | % | 21 | % |
| Equity earnings (losses) | $ | 0.8 |
| (0.2 | ) | 1.0 |
| n.m. |
| n.m. |
|
| Adjusted EBITDA | $ | 522.5 |
| 430.2 |
| 92.3 |
| 21 | % | 22 | % |
AmericasTransaction-based service lines led revenue and fee revenue increases were broad-based across all service lines. Property & Facility Management contributed over 60% of the growth in revenue. Leasing led the segmentAmericas, compared with 2020. In addition, organic fee revenue exceeded 2019 activity. Leasing growth as outstanding performancewas driven by higher transaction volumes and an increase in the New York, Mid-Atlantic and Midwest U.S. markets drove outperformance against U.S. office market gross absorption, as reported by JLL Research. In addition to brokering more leases year over year, average deal size also increased.in the U.S., with strong performance across all sectors, especially office and industrial. Capital Markets growth reflected investment sales up over 80% for the year, continued momentum in debt and equity advisory (both up approximately 70% compared with last year), and a 28% increase in servicing revenue from our multi-housing business. The growthincrease in Property & Facility Management fee revenue reflected the ramp-up ofmanagement was driven by new client wins and expansionsexpansion of existing facility management relationshipsclient mandates, especially in Work Dynamics, and was particularly notable given the prior year grew 23% compared with Corporate Solutions clients. Our multifamily and debt placement services drove Capital Markets fee revenue growth.2019.
Equity earnings from JLL Technologies' investments were $140.8 million in 2021, compared with $5.8 million in 2020, primarily due to valuation increases on the investments as a result of subsequent rounds of funding at higher per-share valuations. In the prior year, substantially all of the $12.7 million first-quarter equity earnings were attributable to gains by consolidated variable interest entities in which the company held no equity interest; therefore, these gains had no net impact to Adjusted EBITDA.
The increaseincreases in segment operating expenses, excluding reimbursed expenses, and segment fee-based operating expenses, compared with 2020, were primarily due to higher revenue-related expenses, the expected reduction of certain non-permanent cost savings from prior year (including the benefit related to government relief programs recognized in 2018 was attributable to (i) expenses which directly correlate to the revenue growth noted above, and (ii)2020), incremental strategic investments in platformpeople and technology, transformation programs, partially offset by cost management initiatives.and $17.6 million of higher medical and dental self-insurance expense compared with the prior year.
Adjusted EBITDA margin for the year, calculated on a fee revenue basis, was 16.3%23.7% in USD and local currency in 2018,2021, compared with 15.2%18.1% in 2017.2020. The increase in segment operating income and adjusted EBITDA, as well as560 basis point margin expansion reflect Leasingwas driven by transaction-based revenue growth and yields from cost management initiatives,higher equity earnings, partially offset by the incremental investments noted above.above-noted expense drivers.
EMEA - Real Estate Services
| | | | | | | | | | | | | | | | | |
| | | | | % Change |
| Year Ended December 31, | Change in | in Local |
| ($ in millions) | 2021 | 2020 | U.S. dollars | Currency |
| Revenue | $ | 3,477.7 | | 3,092.8 | | 384.9 | | 12 | % | 8 | % |
| Reimbursements | (741.2) | | (708.3) | | (32.9) | | 5 | | — | |
| Revenue before reimbursements | $ | 2,736.5 | | 2,384.5 | | 352.0 | | 15 | % | 11 | % |
| Gross contract costs | (1,092.1) | | (1,005.0) | | (87.1) | | 9 | | 4 | |
| Fee revenue | $ | 1,644.4 | | 1,379.5 | | 264.9 | | 19 | % | 15 | % |
| Leasing | 331.1 | | 239.2 | | 91.9 | | 38 | | 36 | |
| Capital Markets | 450.9 | | 313.7 | | 137.2 | | 44 | | 40 | |
| Property & Facility Management | 321.9 | | 302.8 | | 19.1 | | 6 | | — | |
| Project & Development Services | 276.0 | | 276.0 | | — | | — | | (3) | |
| Advisory, Consulting and Other | 264.5 | | 247.8 | | 16.7 | | 7 | | 3 | |
| Compensation, operating and administrative expenses excluding gross contract costs | 1,607.8 | | 1,355.5 | | 252.3 | | 19 | | 15 | |
| Depreciation and amortization | 42.2 | | 40.0 | | 2.2 | | 6 | | — | |
| Segment fee-based operating expenses (excluding restructuring & acquisition charges) | 1,650.0 | | 1,395.5 | | 254.5 | | 18 | | 14 | |
| Gross contract costs | 1,092.1 | | 1,005.0 | | 87.1 | | 9 | | 4 | |
| Segment operating expenses, excluding reimbursed expenses | $ | 2,742.1 | | 2,400.5 | | 341.6 | | 14 | % | 10 | % |
| | | | | |
| Equity earnings | $ | — | | — | | — | | — | % | — | % |
| Segment loss | $ | (5.6) | | (16.0) | | 10.4 | | 65 | % | 81 | % |
| Adjusted EBITDA | $ | 34.4 | | 27.3 | | 7.1 | | 26 | % | 26 | % |
|
| | | | | | | | | | | |
| | | | | | % Change |
| | Year Ended December 31, | Change in | in Local |
| ($ in millions) | 2018 | 2017 | U.S. dollars | Currency |
| Revenue | $ | 3,495.0 |
| 3,075.0 |
| 420.0 |
| 14 | % | 11 | % |
| Reimbursements | (677.5 | ) | (471.9 | ) | (205.6 | ) | 44 |
| 41 |
|
| Revenue before reimbursements | $ | 2,817.5 |
| 2,603.1 |
| 214.4 |
| 8 | % | 5 | % |
| Gross contract costs | (1,108.0 | ) | (1,038.7 | ) | (69.3 | ) | 7 |
| 3 |
|
| Fee Revenue | $ | 1,709.5 |
| 1,564.4 |
| 145.1 |
| 9 | % | 7 | % |
| Leasing | 323.3 |
| 296.6 |
| 26.7 |
| 9 |
| 7 |
|
| Capital Markets | 440.9 |
| 448.4 |
| (7.5 | ) | (2 | ) | (4 | ) |
| Property & Facility Management | 383.6 |
| 337.9 |
| 45.7 |
| 14 |
| 11 |
|
| Project & Development Services | 288.7 |
| 230.2 |
| 58.5 |
| 25 |
| 22 |
|
| Advisory, Consulting and Other | 273.0 |
| 251.3 |
| 21.7 |
| 9 |
| 6 |
|
| Compensation, operating and administrative expenses excluding gross contract costs | 1,581.7 |
| 1,469.2 |
| 112.5 |
| 8 |
| 5 |
|
| Depreciation and amortization | 50.8 |
| 44.6 |
| 6.2 |
| 14 |
| 12 |
|
| Segment fee-based operating expenses (excluding restructuring & acquisition charges) | 1,632.5 |
| 1,513.8 |
| 118.7 |
| 8 |
| 5 |
|
| Gross contract costs | 1,108.0 |
| 1,038.7 |
| 69.3 |
| 7 |
| 3 |
|
| Segment operating expenses, excluding reimbursed expenses | $ | 2,740.5 |
| 2,552.5 |
| 188.0 |
| 7 | % | 4 | % |
| Segment operating income | $ | 77.0 |
| 50.6 |
| 26.4 |
| 52 | % | 62 | % |
| Equity earnings | $ | — |
| 0.3 |
| (0.3 | ) | (100 | )% | (100 | )% |
| Adjusted EBITDA | $ | 130.8 |
| 97.8 |
| 33.0 |
| 34 | % | 38 | % |
EMEAEMEA's revenue and fee revenue growth in 2018 was led by Project & Development Servicestransaction-based revenue, reflecting a continued recovery in most geographies. Notably, Capital Markets and Property & Facility Management. Geographically,Leasing both increased nearly 10% compared with their respective 2019 fee revenues. The growth in Capital Markets was primarily due to higher deal volumes in investment sales across all sectors, particularly in industrial and office, compared with 2020. The increase in Leasing revenue was driven by transaction volume increases, primarily in office and industrial, and an increase in average deal size, which in the segmentfourth quarter eclipsed the comparative 2019 quarter for the first time this year. Geographically across service lines, fee revenue growth in EMEA was led by the UK, Middle East & North Africa ("MENA") and France. Project & Development Services fee revenue growth was driven by our Tetris fit-out business, primarily in Continental Europe, and projects in MENA. The increase to Property & Facility Management fee revenue was driven by the stabilization of our Integral business in the UK; 2017 included additional gross contract costs associated with the $20 million of contract losses discussed last year. Capital Markets fee revenue declines partially offset growth across the other services lines as notable growth in France and Portugal were overshadowed by decreases in Switzerland - attributable to an outsized 2017 transaction - Germany and the UK.Germany.
The increaseincreases in segment operating expenses, excluding reimbursed expenses, and segment fee-based operating expenses reflectswere primarily due to higher revenue-related expense growth, partially offset by an $11.0expenses, the expected reduction of certain non-permanent cost savings from prior year (including the benefit related to government relief programs recognized in 2020), incremental investments in people and technology, and a $7.5 million greater year-over-year improvementprovision for bad debts (a net provision in the bad debt provision, primarily associated2021 compared with Integral.a net reduction in 2020).
Adjusted EBITDA margin, calculated on a fee revenue basis, was 7.7%2.1% in USD for the year (8.1%(2.2% in local currency), compared with 6.3%2.0% in 2017.2020. The stabilizationslight margin improvement was primarily attributable to increased higher margin transaction-based revenue, largely offset by the expense drivers noted above.
Asia Pacific - Real Estate Services
| | | | | | | | | | | | | | | | | |
| | | | | % Change |
| Year Ended December 31, | Change in | in Local |
| ($ in millions) | 2021 | 2020 | U.S. dollars | Currency |
| Revenue | $ | 3,502.1 | | 3,070.1 | | 432.0 | | 14 | % | 10 | % |
| Reimbursements | (1,538.9) | | (1,333.2) | | (205.7) | | 15 | | 11 | |
| Revenue before reimbursements | $ | 1,963.2 | | 1,736.9 | | 226.3 | | 13 | % | 10 | % |
| Gross contract costs | (851.6) | | (839.4) | | (12.2) | | 1 | | (1) | |
| Fee revenue | $ | 1,111.6 | | 897.5 | | 214.1 | | 24 | % | 20 | % |
| Leasing | 249.5 | | 174.9 | | 74.6 | | 43 | | 40 | |
| Capital Markets | 185.2 | | 114.2 | | 71.0 | | 62 | | 57 | |
| Property & Facility Management | 315.7 | | 304.2 | | 11.5 | | 4 | | — | |
| Project & Development Services | 136.6 | | 123.7 | | 12.9 | | 10 | | 7 | |
| Advisory, Consulting and Other | 224.6 | | 180.5 | | 44.1 | | 24 | | 19 | |
| Compensation, operating and administrative expenses excluding gross contract costs | 955.8 | | 754.7 | | 201.1 | | 27 | | 23 | |
| Depreciation and amortization | 30.2 | | 27.8 | | 2.4 | | 9 | | 6 | |
| Segment fee-based operating expenses (excluding restructuring & acquisition charges) | 986.0 | | 782.5 | | 203.5 | | 26 | | 22 | |
| Gross contract costs | 851.6 | | 839.4 | | 12.2 | | 1 | | (1) | |
| Segment operating expenses, excluding reimbursed expenses | $ | 1,837.6 | | 1,621.9 | | 215.7 | | 13 | % | 10 | % |
| | | | | |
| Equity earnings | $ | 4.6 | | 1.4 | | 3.2 | | 229 | % | 208 | % |
| Segment income | $ | 130.2 | | 116.4 | | 13.8 | | 12 | % | 8 | % |
| Adjusted EBITDA | $ | 160.4 | | 144.9 | | 15.5 | | 11 | % | 7 | % |
|
| | | | | | | | | | | |
| | | | | | % Change |
| | Year Ended December 31, | Change in | in Local |
| ($ in millions) | 2018 | 2017 | U.S. dollars | Currency |
| Revenue | $ | 3,248.5 |
| 3,007.3 |
| 241.2 |
| 8 | % | 10 | % |
| Reimbursements | (1,369.2 | ) | (1,347.9 | ) | (21.3 | ) | 2 |
| 3 |
|
| Revenue before reimbursements | $ | 1,879.3 |
| 1,659.4 |
| 219.9 |
| 13 | % | 15 | % |
| Gross contract costs | (829.6 | ) | (650.7 | ) | (178.9 | ) | 27 |
| 29 |
|
| Fee Revenue | $ | 1,049.7 |
| 1,008.7 |
| 41.0 |
| 4 | % | 6 | % |
| Leasing | 268.9 |
| 233.0 |
| 35.9 |
| 15 |
| 18 |
|
| Capital Markets | 162.1 |
| 203.3 |
| (41.2 | ) | (20 | ) | (19 | ) |
| Property & Facility Management | 307.3 |
| 291.3 |
| 16.0 |
| 5 |
| 7 |
|
| Project & Development Services | 140.5 |
| 118.5 |
| 22.0 |
| 19 |
| 20 |
|
| Advisory, Consulting and Other | 170.9 |
| 162.6 |
| 8.3 |
| 5 |
| 6 |
|
| Compensation, operating and administrative expenses excluding gross contract costs | 913.4 |
| 869.4 |
| 44.0 |
| 5 |
| 6 |
|
| Depreciation and amortization | 23.2 |
| 22.1 |
| 1.1 |
| 5 |
| 5 |
|
| Segment fee-based operating expenses (excluding restructuring & acquisition charges) | 936.6 |
| 891.5 |
| 45.1 |
| 5 |
| 6 |
|
| Gross contract costs | 829.6 |
| 650.7 |
| 178.9 |
| 27 |
| 29 |
|
| Segment operating expenses, excluding reimbursed expenses | $ | 1,766.2 |
| 1,542.2 |
| 224.0 |
| 15 | % | 16 | % |
| Segment operating income | $ | 113.1 |
| 117.2 |
| (4.1 | ) | (3 | )% | 3 | % |
| Equity earnings | $ | 2.0 |
| 3.2 |
| (1.2 | ) | (38 | )% | (32 | )% |
| Adjusted EBITDA | $ | 138.2 |
| 142.4 |
| (4.2 | ) | (3 | )% | 3 | % |
Property & Facility Management drove nearly three-fourths of the increase in Asia Pacific revenue. Leasing ledPacific's double-digit revenue and fee revenue growth for the segment,increases were primarily from office and industrial sectorsdue to a rebound in Greater China, Australia and Japan. Project & Development Services growth was driven by Australia, while Property & Facility Management fee revenue growth was attributable to both new business and expansion of existing client mandates. Geographically across service lines, the increasetransaction-based revenue. Growth in fee revenueLeasing was led by Greater China, Australia and India, reflecting momentum in office and industrial throughout 2021. Revenue expansion in Capital Markets was driven by a continued increase in large transactions across most asset classes, highlighted by Australia and Singapore and partially offset by Japan. Significant business growth continued in Valuation Advisory, predominantly in Australia, which primarily drove the fee revenue increase in Advisory, Consulting and Other. Geographically across service lines, fee revenue growth was led by Australia, Greater China and Singapore.
The increases in segment operating expenses, excluding reimbursed expenses, and segment fee-based operating expenses reflectwere primarily attributable to higher revenue-related expense growth, increasedexpenses, the expected reduction of certain non-permanent cost savings from prior year (including the benefit related to government relief programs recognized in 2020), and incremental investments in people and higher than anticipated costs on certain client assignments in the first half of 2018.technology.
Adjusted EBITDA margin, calculated on a fee revenue basis, was 13.2%14.4% in USD and local currency for 2018 (13.7% in local currency),2021, compared with 14.1%16.1% in 2017.2020. The lower margin contraction reflects lower Capital Markets revenue andwas attributable to the expense itemsdrivers noted above.above, which more than offset the increase from incremental transaction-based revenue.
LaSalle
| | | | | | % Change | | % Change |
| | Year Ended December 31, | Change in | in Local | | Year Ended December 31, | Change in | in Local |
| ($ in millions) | 2018 | 2017 | U.S. dollars | Currency | ($ in millions) | 2021 | 2020 | U.S. dollars | Currency |
| Revenue | $ | 533.9 |
| 355.8 |
| 178.1 |
| 50 | % | 49 | % | Revenue | $ | 500.1 | | 421.8 | | 78.3 | | 19 | % | 17 | % |
| Reimbursements | (17.5 | ) | (17.5 | ) | — |
| — |
| (1 | ) | Reimbursements | (7.1) | | (4.8) | | (2.3) | | 48 | | 40 | |
| Revenue before reimbursements | $ | 516.4 |
| 338.3 |
| 178.1 |
| 53 | % | 51 | % | Revenue before reimbursements | $ | 493.0 | | 417.0 | | 76.0 | | 18 | % | 17 | % |
| Gross contract costs | (4.5 | ) | (5.1 | ) | 0.6 |
| (12 | ) | (15 | ) | Gross contract costs | (19.8) | | (16.3) | | (3.5) | | 21 | | 21 | |
| Fee Revenue | $ | 511.9 |
| 333.2 |
| 178.7 |
| 54 | % | 52 | % | |
| Fee revenue | | Fee revenue | $ | 473.2 | | 400.7 | | 72.5 | | 18 | % | 17 | % |
| Advisory fees | 264.6 |
| 253.0 |
| 11.6 |
| 5 |
| 3 |
| Advisory fees | 345.7 | | 320.7 | | 25.0 | | 8 | | 6 | |
| Transaction fees & other | 31.5 |
| 23.3 |
| 8.2 |
| 35 |
| 32 |
| Transaction fees & other | 33.6 | | 38.5 | | (4.9) | | (13) | | (13) | |
| Incentive fees | 215.8 |
| 56.9 |
| 158.9 |
| n.m. |
| n.m. |
| Incentive fees | 93.9 | | 41.5 | | 52.4 | | 126 | | 128 | |
| Compensation, operating and administrative expenses excluding gross contract costs | 375.2 |
| 271.9 |
| 103.3 |
| 38 |
| 37 |
| Compensation, operating and administrative expenses excluding gross contract costs | 390.0 | | 326.9 | | 63.1 | | 19 | | 18 | |
| Depreciation and amortization | 3.0 |
| 3.0 |
| — |
| — |
| (1 | ) | Depreciation and amortization | 6.6 | | 7.2 | | (0.6) | | (9) | | (11) | |
| Segment fee-based operating expenses (excluding restructuring & acquisition charges) | 378.2 |
| 274.9 |
| 103.3 |
| 38 |
| 36 |
| Segment fee-based operating expenses (excluding restructuring & acquisition charges) | 396.6 | | 334.1 | | 62.5 | | 19 | | 17 | |
| Gross contract costs | 4.5 |
| 5.1 |
| (0.6 | ) | (12 | ) | (15 | ) | Gross contract costs | 19.8 | | 16.3 | | 3.5 | | 21 | | 21 | |
| Segment operating expenses, excluding reimbursed expenses | $ | 382.7 |
| 280.0 |
| 102.7 |
| 37 | % | 36 | % | Segment operating expenses, excluding reimbursed expenses | $ | 416.4 | | 350.4 | | 66.0 | | 19 | % | 19 | % |
| Segment operating income | $ | 133.7 |
| 58.3 |
| 75.4 |
| n.m. |
| n.m. |
| |
| Equity earnings | $ | 30.0 |
| 41.1 |
| (11.1 | ) | (27 | )% | (27 | )% | |
| | Equity earnings (losses) | | Equity earnings (losses) | $ | 62.6 | | (12.4) | | 75.0 | | 605 | % | 602 | % |
| Segment income | | Segment income | $ | 139.2 | | 54.2 | | 85.0 | | 157 | % | 154 | % |
| Adjusted EBITDA | $ | 162.2 |
| 100.7 |
| 61.5 |
| 61 | % | 59 | % | Adjusted EBITDA | $ | 144.1 | | 60.8 | | 83.3 | | 137 | % | 134 | % |
LaSalle revenueadvisory fee growth was led by core open-end funds, a result of recent capital raising and fee revenue growth were driven by recordvaluation increases in assets under management ("AUM"), as well as a recently launched fund in Asia Pacific. The increase in incentive feefees reflected the strong fund performance fromin the U.S. and real estate dispositions on behalf of clients predominantly in Asia Pacific. Continued expansionPacific and continental Europe.
Equity earnings in 2021 were primarily attributable to increases to the estimated fair value of private equity mandates drove solid growth in advisory fees;underlying real estate investments within LaSalle's co-investment portfolio across asset classes and geographies. In the prior year, included approximately $7 million of catch-up advisory fees earned as a result of new investor commitments in previously established funds.
Equity earnings both yearsequity losses were primarilylargely driven by net valuation increases for investments in Europe and Asia. For 2018, equity earnings also included gainsthe pandemic's impact on real estate prices which drove lower estimated fair values within the sale of legacy investments.portfolio.
The year-over-year increases in segment operating expenses, excluding reimbursed expenses and segment fee-based operating expenses, reflectcompared with 2020, were primarily driven by compensation expense related to the current portion of higher incentive fees, deferred variable compensation expense due to additional incentive fees. The related deferredexpenses associated with the run-off of a previous compensation expense will be recognizedprogram, and incremental investments in future periods.people and technology.
Adjusted EBITDA margin, calculated on a fee revenue basis, was 31.7%30.4% in USD (31.6%(30.5% in local currency) for 2018,2021, compared with 30.2%15.2% in 2017.2020. The significant margin expansion was attributable to the incremental contribution fromlargely driven by higher equity earnings and incentive fees, which more thanpartially offset by the notable margin impactexpense drivers noted above.
As of reduced equity earnings.
Assets under management ("AUM") were $60.5December 31, 2021, LaSalle had $76.6 billion of AUM, an increase of 11% in USD and local currency from $68.9 billion as of December 31, 2018, an increase of 4% in USD (6% in local currency) from $58.1 billion as of December 31, 2017.2020. The net increase in AUM during the year resulted from $9.0(i) $7.3 billion of acquisitions and $4.5 billion of net valuation increases, partially offset by $10.1 billion of dispositions and withdrawals, and $1.0 billion of foreign currency decreases.
Year Ended December 31, 2017 compared with Year Ended December 31, 2016
|
| | | | | | | | | | | |
| | | | | | % Change |
| | Year Ended December 31, | Change in | in Local |
| ($ in millions) | 2017 | 2016 | U.S. dollars | Currency |
| Leasing | $ | 2,051.9 |
| 1,798.4 |
| 253.5 |
| 14 | % | 14 | % |
| Capital Markets | 1,149.4 |
| 980.1 |
| 169.3 |
| 17 |
| 16 |
|
| Property & Facility Management | 7,821.3 |
| 7,136.5 |
| 684.8 |
| 10 |
| 10 |
|
| Project & Development Services | 2,344.5 |
| 2,070.3 |
| 274.2 |
| 13 |
| 12 |
|
| Advisory, Consulting and Other | 730.3 |
| 597.8 |
| 132.5 |
| 22 |
| 22 |
|
| Real Estate Services ("RES") revenue | $ | 14,097.4 |
| 12,583.1 |
| 1,514.3 |
| 12 | % | 12 | % |
| LaSalle | 355.8 |
| 408.1 |
| (52.3 | ) | (13 | ) | (12 | ) |
| Revenue | $ | 14,453.2 |
| 12,991.2 |
| 1,462.0 |
| 11 | % | 11 | % |
| Reimbursements | 6,485.8 |
| 6,080.6 |
| 405.2 |
| 7 |
| 7 |
|
| Revenue before reimbursements | 7,967.4 |
| 6,910.6 |
| 1,056.8 |
| 15 |
| 15 |
|
| Gross contract costs | (2,215.5 | ) | (1,812.8 | ) | (402.7 | ) | 22 |
| 21 |
|
| Net non-cash MSR and mortgage banking derivative activity | (15.7 | ) | (23.5 | ) | 7.8 |
| (33 | ) | (33 | ) |
| Fee Revenue | $ | 5,736.2 |
| 5,074.3 |
| 661.9 |
| 13 | % | 14 | % |
| Leasing | 2,000.8 |
| 1,753.5 |
| 247.3 |
| 14 | % | 14 | % |
| Capital Markets | 1,108.3 |
| 935.6 |
| 172.7 |
| 18 |
| 18 |
|
| Property & Facility Management | 1,048.5 |
| 929.4 |
| 119.1 |
| 13 |
| 18 |
|
| Project & Development Services | 690.9 |
| 607.5 |
| 83.4 |
| 14 |
| 13 |
|
| Advisory, Consulting and Other | 554.5 |
| 465.8 |
| 88.7 |
| 19 | % | 19 | % |
| RES fee revenue | 5,403.0 |
| 4,691.8 |
| 711.2 |
| 15 | % | 16 | % |
| LaSalle | 333.2 |
| 382.5 |
| (49.3 | ) | (13 | )% | (12 | )% |
| Compensation and benefits excluding gross contract costs | 4,023.5 |
| 3,532.1 |
| 491.4 |
| 14 |
| 14 |
|
| Operating, administrative and other expenses excluding gross contract costs | 984.6 |
| 899.7 |
| 84.9 |
| 9 |
| 19 |
|
| Depreciation and amortization | 167.2 |
| 141.8 |
| 25.4 |
| 18 |
| 19 |
|
| Restructuring and acquisition charges | 30.7 |
| 68.5 |
| (37.8 | ) | (55 | ) | (53 | ) |
| Total fee-based operating expenses | $ | 5,206.0 |
| 4,642.1 |
| 563.9 |
| 12 | % | 13 | % |
| Gross contract costs | 2,215.5 |
| 1,812.8 |
| 402.7 |
| 22 |
| 21 |
|
| Total operating expenses, excluding reimbursed expenses | $ | 7,421.5 |
| 6,454.9 |
| 966.6 |
| 15 | % | 15 | % |
| Operating income | $ | 545.9 |
| 455.7 |
| 90.2 |
| 20 | % | 16 | % |
| Equity Earnings | $ | 44.4 |
| 33.8 |
| 10.6 |
| 31 | % | 31 | % |
| Adjusted EBITDA | $ | 770.7 |
| 679.2 |
| 91.5 |
| 13 | % | 11 | % |
Reconciliation of Non-GAAP Financial Measures
Below reconciliations of Revenue before reimbursements to fee revenue and Operating expenses, excluding reimbursed expenses, to fee-based operating expenses.
|
| | | | | |
| | Year Ended December 31, |
| ($ in millions) | 2017 | 2016 |
| Revenue | $ | 14,453.2 |
| 12,991.2 |
|
| Reimbursements | 6,485.8 |
| 6,080.6 |
|
| Revenue before reimbursements | 7,967.4 |
| 6,910.6 |
|
| Adjustments: | | |
| Gross contract costs | (2,215.5 | ) | (1,812.8 | ) |
| Net non-cash MSR and mortgage banking derivative activity | (15.7 | ) | (23.5 | ) |
| Fee revenue | $ | 5,736.2 |
| 5,074.3 |
|
| | | |
| Operating expenses | $ | 13,907.3 |
| 12,535.5 |
|
| Reimbursed expenses | 6,485.8 |
| 6,080.6 |
|
| Operating expenses, excluding reimbursed expenses | 7,421.5 |
| 6,454.9 |
|
| Less: Gross contract costs | (2,215.5 | ) | (1,812.8 | ) |
| Fee-based operating expenses | $ | 5,206.0 |
| 4,642.1 |
|
| | | |
| Operating Income | $ | 545.9 |
| 455.7 |
|
To conform to current presentation, 2016 amounts were recast for fee revenue to reflect the adjustment associated with Net non-cash MSR and mortgage banking derivative activity.
Adjusted EBITDA attributable to common shareholders ("Adjusted EBITDA") represents EBITDA attributable to common shareholders (“EBITDA”) further adjusted for certain items we do not consider directly indicative of our ongoing performance in the context of certain performance measurements. Below is (i) a reconciliation of Net income attributable to common shareholders to EBITDA and Adjusted EBITDA and (ii) the Adjusted EBITDA margin (on a fee-revenue basis), on a local currency basis.
|
| | | | | |
| | Year Ended December 31, |
| ($ in millions) | 2017 | 2016 |
| Net income attributable to common shareholders | $ | 276.0 |
| 329.3 |
|
| Add: | | |
| Interest expense, net of interest income | 56.2 |
| 45.3 |
|
| Provision for income taxes | 256.3 |
| 117.8 |
|
| Depreciation and amortization | 167.2 |
| 141.8 |
|
| EBITDA | $ | 755.7 |
| 634.2 |
|
| Adjustments: | | |
| Restructuring and acquisition charges | 30.7 |
| 68.5 |
|
| Net non-cash MSR and mortgage banking derivative activity | (15.7 | ) | (23.5 | ) |
| Adjusted EBITDA | $ | 770.7 |
| 679.2 |
|
| | | |
Net income margin attributable to common shareholders1 | 3.5 | % | 4.8 | % |
| | | |
| Adjusted EBITDA margin | 13.1 | % | 13.4 | % |
1 measured against Revenue before reimbursements
The following table reflects the reconciliation to local currency amounts for consolidated (i) Revenue, (ii) fee revenue, (iii) Operating income and (iv) Adjusted EBITDA.
|
| | | | | |
| | Year Ended December 31, |
| ($ in millions) | 2017 | % Change |
| Revenue: | | |
| At current period exchange rates | $ | 14,453.2 |
| 11 | % |
| Impact of change in exchange rates | 1.3 |
| n/a |
|
| At comparative period exchange rates | $ | 14,454.5 |
| 11 | % |
| | | |
| Fee Revenue: | | |
| At current period exchange rates | $ | 5,736.2 |
| 13 | % |
| Impact of change in exchange rates | 50.2 |
| n/a |
|
| At comparative period exchange rates | $ | 5,786.4 |
| 14 | % |
| | | |
| Operating Income: | | |
| At current period exchange rates | $ | 545.9 |
| 20 | % |
| Impact of change in exchange rates | (19.3 | ) | n/a |
|
| At comparative period exchange rates | $ | 526.6 |
| 16 | % |
| | | |
| Adjusted EBITDA: | | |
| At current period exchange rates | $ | 770.7 |
| 13 | % |
| Impact of change in exchange rates | (17.0 | ) | n/a |
|
| At comparative period exchange rates | $ | 753.7 |
| 11 | % |
Revenue
In 2017, consolidated revenue was $14.5 billion and consolidated fee revenue was $5.7 billion, increases of 11% and 14%, respectively, from 2016. RES Revenue growth for the year was led by Property & Facility Management, up nearly $700 million, while Leasing led fee revenue growth, with an increase of approximately $250 million. Annual RES fee revenue growth reflects double-digit expansion across all service lines and in all three RES segments, with organic growth representing the majority of the year-over-year increase. Geographically, the increase in RES fee revenue comprised 47% from our Americas segment, 36% from our EMEA segment, and 17% from our Asia Pacific segment. LaSalle revenue and fee revenue both declined 12% compared with 2016 as growth in advisory fees was more than offset by decreases in transaction and incentive fees.
Consolidated revenue growth in Property & Facility Management was primarily due to incremental revenue from our August 2016 acquisition of Integral UK Ltd. ("Integral") (approximately half of the noted growth), along with organic expansion in EMEA and Asia Pacific.
For Leasing, the increase in revenue and fee revenue was substantially driven by Americas (over 80% of both consolidated revenue and fee revenue growth). Project & Facility Management fee revenue was up 18%, with incremental fee revenue from Integral driving 75% of this growth. Capital Markets, also up 18% against 2016, reflected double-digit growth in all three RES segments.
Our consolidated revenue increased 11% in both U.S. dollars and on a local currency basis for 2017, compared with 2016; consolidated fee revenue increased 13% in U.S. dollars and 14% on a local currency basis. A strengthening of the British pound and Australian dollar against the U.S. dollar was offset by the weakening of the euro in relation to the U.S. dollar.
Operating Expenses
In 2017, consolidated annual operating expenses increased 15% to $7.4 billion. Consolidated fee-based operating expenses, were $5.2 billion in 2017, a 13% increase from the prior year. The growth in expenses corresponded with the noted revenue growth as well as continued increases to investments in data, technology and people. In addition, depreciation and amortization expense increased 19% year-over-year to $167.2 million in 2017. This increase was due to incremental depreciation expense from recent capital expenditures placed into service (approximately 70% of the increase) as well as incremental amortization expense attributable to intangible assets recorded in conjunction with recent acquisition activity (approximately 30% of the increase).
Restructuring and acquisition charges were $30.7 million for the year, compared with $68.5 million in 2016. Charges in 2017 included (i) $21.6 million of severance and other employment-related charges incurred with respect to headcount reductions or other activities considered to represent structural changes to our local, regional and/or global business operations, (ii) $7.2 million of costs incurred for pre-acquisition due diligence and post-acquisition integration activities, a result of our recent increase in acquisition activity and (iii) $1.9 million of net non-cash fair value adjustments relating to net increases to earn-out liabilities that arose from prior period acquisition activity. Comparatively, charges in 2016 included (i) $28.0 million of severance and other employment-related charges, (ii) $20.5 million of costs incurred as part of pre-acquisition due diligence and post-acquisition integration activities and (iii) $20.0 million of net non-cash fair value adjustments and other charges to amounts recorded in purchase accounting, including the $6.5 million write-off of an indefinite-lived intangible asset associated with a legacy LaSalle acquisition.
Interest Expense
Interest expense, net of interest income, for 2017 was $56.2 million, up from $45.3 million in 2016 primarily the result of a higher effective interest rate on debt. The average outstanding borrowings under our credit facility decreased from $981.6 million during 2016, with an effective interest rate of 1.5%, to $888.5 million in 2017, with an effective interest rate of 2.0%. Deferred acquisition obligations, which are recorded at present value in purchase accounting with subsequent accretion reflected within Interest expense, net of interest income, decreased from $102.4 million as of December 31, 2016 to $81.9 million as of December 31, 2017. This decrease was the result of payments made in 2017 relating to acquisitions in prior years.
Equity Earnings from Real Estate Ventures
Equity earnings increased from $33.8 million in 2016 to $44.4 million in 2017. In both years, equity earnings primarily represented net valuation increases of co-investment portfolio assets reported at fair value, geographically from assets in Europe and Asia. Substantially all of the activity in each year was attributable to LaSalle; refer to the LaSalle segment results discussion for additional details.
Provision for Income Taxes
The provision for income taxes was $256.3 million in 2017, an increase of $138.5 million from the prior year, which resulted in a consolidated effective tax rate of 47.8%. The 2017 provision included an additional expense of $125.9 million, which represents (i) the Company's provisional estimate of the transition tax on deemed repatriated earnings of foreign subsidiaries and (ii) the net remeasurement of U.S. deferred tax assets and liabilities in response to the December 2017 enactment of the U.S. Tax Cuts and Jobs Act. Excluding this additional expense, our 2017 consolidated effective tax rate was 24.4%; the 2016 consolidated effective tax rate was 25.5%. Refer to the Income Tax discussion in the Summary of Critical Accounting Policies and Estimates and Note 8, Income Taxes, of the Notes to Consolidated Financial Statements for a further discussion of our effective tax rate, included in Item 8.
Net Income and Adjusted EBITDA
Net income attributable to common shareholders was $276.0 million for the year, or $6.03 per diluted common share, compared with $329.3 million for 2016, or $7.23 per diluted common share. Net income margin attributable to common shareholders was 3.5% in 2017, down from 4.8% in the prior year. Adjusted EBITDA, which increased 11% from the prior year, was $770.7 million this year. Adjusted EBITDA margin, calculated on a fee revenue basis, was 13.4% in USD (13.1% in local currency) for the current year, compared with 13.4% in 2016. Our profitability measures reflect strong performance in Americas and Asia Pacific, with notable contributions from transactional businesses, offset by performance in Integral, lower incentive and transaction fees in LaSalle, and continued increases to investments in data, technology and people.
Americas - Real Estate Services
|
| | | | | | | | | | | |
| | | | | | % Change |
| | Year Ended December 31, | Change in | in Local |
| ($ in millions) | 2017 | 2016 | U.S. dollars | Currency |
| Revenue | $ | 8,015.1 |
| 7,516.8 |
| 498.3 |
| 7 | % | 7 | % |
| Reimbursements | (4,648.5 | ) | (4,460.1 | ) | (188.4 | ) | 4 | % | 4 |
|
| Revenue before reimbursements | $ | 3,366.6 |
| 3,056.7 |
| 309.9 |
| 10 | % | 10 | % |
| Gross contract costs | (521.0 | ) | (554.0 | ) | 33.0 |
| (6 | ) | (6 | ) |
| Net non-cash MSR and mortgage banking derivative activity | (15.7 | ) | (23.5 | ) | 7.8 |
| (33 | ) | (33 | ) |
| Fee Revenue | $ | 2,829.9 |
| 2,479.2 |
| 350.7 |
| 14 | % | 14 | % |
| Leasing | 1,471.2 |
| 1,277.0 |
| 194.2 |
| 15 |
| 15 |
|
| Capital Markets | 456.6 |
| 403.8 |
| 52.8 |
| 13 |
| 13 |
|
| Property & Facility Management | 419.3 |
| 401.0 |
| 18.3 |
| 5 |
| 4 |
|
| Project & Development Services | 342.2 |
| 308.3 |
| 33.9 |
| 11 |
| 11 |
|
| Advisory, Consulting and Other | 140.6 |
| 89.1 |
| 51.5 |
| 58 |
| 57 |
|
| Compensation, operating and administrative expenses excluding gross contract costs | 2,397.6 |
| 2,132.4 |
| 265.2 |
| 12 |
| 12 |
|
| Depreciation and amortization | 97.5 |
| 84.3 |
| 13.2 |
| 16 |
| 15 |
|
| Segment fee-based operating expenses (excluding restructuring & acquisition charges) | 2,495.1 |
| 2,216.7 |
| 278.4 |
| 13 |
| 12 |
|
| Gross contract costs | 521.0 |
| 554.0 |
| (33.0 | ) | (6 | ) | (6 | ) |
| Segment operating expenses, excluding reimbursed expenses | $ | 3,016.1 |
| 2,770.7 |
| 245.4 |
| 9 | % | 9 | % |
| Segment operating income | $ | 350.5 |
| 286.0 |
| 64.5 |
| 23 | % | 23 | % |
| Equity earnings | $ | (0.2 | ) | 1.3 |
| (1.5 | ) | n.m. |
| n.m. |
|
| Adjusted EBITDA | $ | 430.2 |
| 347.0 |
| 83.2 |
| 24 | % | 24 | % |
Americas revenue and fee revenue expansion in 2017 was broad-based and led by strong U.S. Leasing performance in favorable market conditions, specifically the Northwest, New York, New England, Midwest and Atlanta markets. A particularly strong fourth quarter, reflecting an increase in average deal size and an increase in client demand to close transactions prior to year-end, contributed to our annual Leasing performance, up 15% from 2016. This compared favorably to U.S. market gross absorption, which increased 3% for 2017 according to JLL Research. In addition, the Advisory, Consulting and Other fee revenue increase reflected incremental contributions from Technology Solutions and the recently acquired U.S. valuations platform. Capital Markets reflected growth in multifamily originations and servicing as well as notable hotels investment sales activity. Project & Development Services growth was driven by expansion of existing client mandates together with new wins.
The increase in segment operating expenses, excluding reimbursed expenses, and segment fee-based operating expenses in 2017 was attributable to (i) direct expenses which correlate with the revenue growth noted above and (ii) increased strategic investments for technology and data, including a replacement of our enterprise resource planning system.
Adjusted EBITDA margin, calculated on a fee revenue basis, was 15.2% in USD and local currency in 2017, compared with 14.0% in 2016. The increase in profitability was driven by strong transactional business performance augmented by management initiatives to contain controllable expenses.
EMEA - Real Estate Services
|
| | | | | | | | | | | |
| | | | | | % Change |
| | Year Ended December 31, | Change in | in Local |
| ($ in millions) | 2017 | 2016 | U.S. dollars | Currency |
| Revenue | $ | 3,075.0 |
| 2,447.6 |
| 627.4 |
| 26 | % | 27 | % |
| Reimbursements | (471.9 | ) | (352.0 | ) | (119.9 | ) | 34 |
| 40 |
|
| Revenue before reimbursements | $ | 2,603.1 |
| 2,095.6 |
| 507.5 |
| 24 | % | 25 | % |
| Gross contract costs | (1,038.7 | ) | (757.7 | ) | (281.0 | ) | 37 |
| 34 |
|
| Fee Revenue | $ | 1,564.4 |
| 1,337.9 |
| 226.5 |
| 17 | % | 17 | % |
| Leasing | 296.6 |
| 264.2 |
| 32.4 |
| 12 |
| 11 |
|
| Capital Markets | 448.4 |
| 376.2 |
| 72.2 |
| 19 |
| 18 |
|
| Property & Facility Management | 337.9 |
| 261.7 |
| 76.2 |
| 29 |
| 34 |
|
| Project & Development Services | 230.2 |
| 204.9 |
| 25.3 |
| 12 |
| 11 |
|
| Advisory, Consulting and Other | 251.3 |
| 230.9 |
| 20.4 |
| 9 |
| 9 |
|
| Compensation, operating and administrative expenses excluding gross contract costs | 1,469.2 |
| 1,234.8 |
| 234.4 |
| 19 |
| 24 |
|
| Depreciation and amortization | 44.6 |
| 37.4 |
| 7.2 |
| 19 |
| 23 |
|
| Segment fee-based operating expenses (excluding restructuring & acquisition charges) | 1,513.8 |
| 1,272.2 |
| 241.6 |
| 19 |
| 23 |
|
| Gross contract costs | 1,038.7 |
| 757.7 |
| 281.0 |
| 37 |
| 34 |
|
| Segment operating expenses, excluding reimbursed expenses | $ | 2,552.5 |
| 2,029.9 |
| 522.6 |
| 26 | % | 27 | % |
| Segment operating income | $ | 50.6 |
| 65.7 |
| (15.1 | ) | (23 | )% | (45 | )% |
| Equity earnings | $ | 0.3 |
| (0.1 | ) | 0.4 |
| n.m. |
| n.m. |
|
| Adjusted EBITDA | $ | 97.8 |
| 108.9 |
| (11.1 | ) | (10 | )% | (23 | )% |
EMEA achieved revenue and fee revenue growth across all services lines in 2017, led by Property & Facility Management. Integral contributed approximately half of EMEA’s overall revenue and fee revenue expansion. In addition, Capital Markets delivered strong performance, primarily from brokering client investment sales in the UK, Germany and Switzerland. The revenue and fee revenue expansion in Leasing was consistent with a 10% year-over-year increase in market leasing volumes according to JLL Research. Geographically, revenue and fee revenue growth in the segment was led by contributions from Integral in the UK as well as Germany.
Incremental operating expenses relating to Integral drove over half of the increase in segment operating expenses and segment fee-based operating expenses. In addition, the increase in expenses reflects revenue-related growth as well as continued increases to investments in data, technology and people.
Adjusted EBITDA margin, calculated on a fee revenue basis, was 6.3% in USD (5.2% in local currency) for the year, compared with 8.1% in 2016. Strong transactional business performance in the UK and Continental Europe was offset by Integral, reflecting (i) the margin dilutive impact from the August 2016 acquisition date, (ii) over $20 million of contract losses, nearly $15 million from contracts terminated prior to year-end and (iii) investments and continued integration spend.
Asia Pacific - Real Estate Services
|
| | | | | | | | | | | |
| | | | | | % Change |
| | Year Ended December 31, | Change in | in Local |
| ($ in millions) | 2017 | 2016 | U.S. dollars | Currency |
| Revenue | $ | 3,007.3 |
| 2,618.7 |
| 388.6 |
| 15 | % | 13 | % |
| Reimbursements | (1,347.9 | ) | (1,248.3 | ) | (99.6 | ) | 8 |
| 6 |
|
| Revenue before reimbursements | $ | 1,659.4 |
| 1,370.4 |
| 289.0 |
| 21 | % | 20 | % |
| Gross contract costs | (650.7 | ) | (495.7 | ) | (155.0 | ) | 31 |
| 30 |
|
| Fee Revenue | $ | 1,008.7 |
| 874.7 |
| 134.0 |
| 15 | % | 14 | % |
| Leasing | 233.0 |
| 212.3 |
| 20.7 |
| 10 |
| 8 |
|
| Capital Markets | 203.3 |
| 155.6 |
| 47.7 |
| 31 |
| 30 |
|
| Property & Facility Management | 291.3 |
| 266.7 |
| 24.6 |
| 9 |
| 8 |
|
| Project & Development Services | 118.5 |
| 94.3 |
| 24.2 |
| 26 |
| 25 |
|
| Advisory, Consulting and Other | 162.6 |
| 145.8 |
| 16.8 |
| 12 |
| 10 |
|
| Compensation, operating and administrative expenses excluding gross contract costs | 869.4 |
| 768.5 |
| 100.9 |
| 13 |
| 12 |
|
| Depreciation and amortization | 22.1 |
| 17.3 |
| 4.8 |
| 28 |
| 27 |
|
| Segment fee-based operating expenses (excluding restructuring & acquisition charges) | 891.5 |
| 785.8 |
| 105.7 |
| 13 |
| 13 |
|
| Gross contract costs | 650.7 |
| 495.7 |
| 155.0 |
| 31 |
| 30 |
|
| Segment operating expenses, excluding reimbursed expenses | $ | 1,542.2 |
| 1,281.5 |
| 260.7 |
| 20 | % | 19 | % |
| Segment operating income | $ | 117.2 |
| 88.9 |
| 28.3 |
| 32 | % | 28 | % |
| Equity earnings | $ | 3.2 |
| 1.1 |
| 2.1 |
| n.m. |
| n.m. |
|
| Adjusted EBITDA | $ | 142.4 |
| 107.3 |
| 35.1 |
| 33 | % | 29 | % |
Asia Pacific had revenue and fee revenue increases across all service lines. Property & Facility Management led growth in revenue, driven by organic expansion, while Capital Markets led fee revenue growth, reflecting notable contributions from large transactions in Japan and Greater China. The increase in Project & Development Services fee revenue was both organic and acquisition-related. Geographically, the increase in fee revenue was led by Greater China, Australia, Japan and Singapore.
The increase in segment operating expenses, excluding reimbursed expenses, and segment fee-based operating expenses for the year generally corresponded with 2017 growth in the corresponding revenue metric.
Adjusted EBITDA margin, calculated on a fee revenue basis, was 14.1% in USD (13.9% in local currency) for 2017, compared with 12.3% in 2016. The increase in profitability reflected robust organic growth, greater revenue contributions from higher margin transactional businesses, and strong cost management discipline.
LaSalle
|
| | | | | | | | | | | |
| | | | | | % Change |
| | Year Ended December 31, | Change in | in Local |
| ($ in millions) | 2017 | 2016 | U.S. dollars | Currency |
| Revenue | $ | 355.8 |
| 408.1 |
| (52.3 | ) | (13 | )% | (12 | )% |
| Reimbursements | (17.5 | ) | (20.2 | ) | 2.7 |
| (13 | ) | (13 | ) |
| Revenue before reimbursements | $ | 338.3 |
| 387.9 |
| (49.6 | ) | (13 | )% | (12 | )% |
| Gross contract costs | (5.1 | ) | (5.4 | ) | 0.3 |
| (6 | ) | (5 | ) |
| Fee Revenue | $ | 333.2 |
| 382.5 |
| (49.3 | ) | (13 | )% | (12 | )% |
| Advisory fees | 253.0 |
| 246.7 |
| 6.3 |
| 3 |
| 3 |
|
| Transaction fees & other | 23.3 |
| 39.9 |
| (16.6 | ) | (42 | ) | (42 | ) |
| Incentive fees | 56.9 |
| 95.9 |
| (39.0 | ) | (41 | ) | (40 | ) |
| Compensation, operating and administrative expenses excluding gross contract costs | 271.9 |
| 296.1 |
| (24.2 | ) | (8 | ) | (7 | ) |
| Depreciation and amortization | 3.0 |
| 2.8 |
| 0.2 |
| 7 |
| 10 |
|
| Segment fee-based operating expenses (excluding restructuring & acquisition charges) | 274.9 |
| 298.9 |
| (24.0 | ) | (8 | ) | (7 | ) |
| Gross contract costs | 5.1 |
| 5.4 |
| (0.3 | ) | (6 | ) | (5 | ) |
| Segment operating expenses, excluding reimbursed expenses | $ | 280.0 |
| 304.3 |
| (24.3 | ) | (8 | )% | (7 | )% |
| Segment operating income | $ | 58.3 |
| 83.6 |
| (25.3 | ) | (30 | )% | (29 | )% |
| Equity earnings | $ | 41.1 |
| 31.5 |
| 9.6 |
| 30 | % | 30 | % |
| Adjusted EBITDA | $ | 100.7 |
| 116.4 |
| (15.7 | ) | (13 | )% | (13 | )% |
The decline in LaSalle revenue was due to lower incentive and transaction fees. Incentive fees in 2016 were primarily earned on opportunistic dispositions of real estate assets, while transaction fees in 2016 were a result of the successful January 2016 launch of the LaSalle Logiport REIT in Japan. The increase in advisory fees reflects approximately $7 million of catch-up advisory fees earned as a result of new equity commitments in established funds.
Equity earnings in both years were primarily driven by net valuation increases for investments in Europe and Asia.
The decrease in segment operating expenses, excluding reimbursed expenses, and segment fee-based operating expenses compared with 2016 reflects lower variable compensation expense as a result of the decrease in incentive and transaction fees.
Adjusted EBITDA margin was 30.2% in USD and local currency for 2017, compared with 30.4% in 2016.
In 2017, LaSalle’s capital raise efforts yielded $4.8 billion in equity commitments, predominantly for future investment in private equity.
Assets under management ("AUM") were $58.1 billion as of December 31, 2017, a decrease of 3% in USD (5% in local currency) from $60.1 billion as of December 31, 2016. The net decrease in AUM during the year resulted from $13.1 billion of dispositions and withdrawals, partially offset by $6.8 billion of acquisitions, $3.4$7.6 billion of net valuation increases and $0.9(iii) $0.2 billion of foreign currency increases.increases, partially offset by (iv) $7.4 billion of dispositions and withdrawals.
LIQUIDITY AND CAPITAL RESOURCES
We finance our operations, co-investment activity, share repurchases and dividend payments, capital expenditures, and business acquisitions with internally generated funds, borrowings from our credit facilities, and through issuance of our Long-term senior notes.
Cash Flows from Operating Activities
During 2018,Operating activities provided $972.4 million of cash flows provided by operating activities were $604.1 million, a decrease of $194.6 million from $798.7in 2021, compared to $1,114.7 million in 2017.2020. The decrease in cash provided was primarily due to (i) lower cash collections in the first quarter of 2021 compared with the first quarter of 2020 (trade receivables balance was $1,636.1 million as of December 31, 2020 versus $2,034.3 million as of December 31, 2019) and (ii) the timing of payments related to taxes and other government obligations, partially offset by operating activities is driven by (i) an increase in reimbursable receivables net of reimbursable payables, reflecting growth of our outsourcing and project management businesses, (ii) net working capital changes as a result of our operational expansion, (iii) the results of implementing certain working capital management initiatives, including revamped cash collection efforts and payment term governance in 2017 and (iv) higherlower annual incentive compensation paid to employees in 2018 asearly 2021 compared with 2017, reflecting our performance in the previous annual periods. This was partially offsetearly 2020 and (iv) higher cash provided by the $212.2 million year-over-yearearnings, driven by an increase in Netnet income.
During 2017, cash flows provided by operating activities were $798.7 million, an increase of $576.1 million from $222.6 million in 2016. This increase was driven by a year-over-year improvement in operating income, enhanced working capital management processes implemented in 2017, and lower incentive compensation paid to employees in 2017 compared with 2016, reflecting our 2016 performance compared with 2015.
Cash Flows from Investing Activities
In 2018, weWe used $280.4$805.8 million of cash for investing activities a $109.6 million increase from the $170.8during 2021, compared with $170.6 million used in 2017.2020. The increase in cash used was primarily driven by higher payments relating to (i) business acquisitions and (ii) property and equipment net capital additions (including acquisitions of investment properties by consolidated less-than-wholly-owned subsidiaries), partially offset by net capital contribution/distribution activity related to co-investmentsincremental JLL Technologies investments in real estate ventures.early-stage proptech companies. We discuss these key drivers, individually below in further detail.
In 2017, we used $170.8 million foralong with other investing activities, a $634.7 million decrease from the $805.5 million used in 2016. This decrease was primarily driven by a reduction in cash used for (i) payments relating to business acquisitions, (ii) property and equipment net capital additions (including acquisition of investment properties by consolidated less-than-wholly-owned subsidiaries) and (iii) net capital contribution/distribution activity related to investments in real estate ventures. We discuss these key drivers individually below in further detail.
Cash Flows from Financing Activities
NetFinancing activities used $143.8 million of cash during 2021, compared with $771.2 million used during 2020. The reduction in cash flows used by financing activities was $141.3 million in 2018, compared with $623.5 million used in 2017. The net decrease of $482.2 million in cash used from financing activities reflects net payments made in 2017 to reduce the outstanding balance on our Facility to zero as of December 31, 2017. As the Facility was also zero as of December 31, 2018, cash usedlargely driven by financing activities in 2018 was lower, but reflected the continued strong cash flows from operations.
Net cash used by financing activities was $623.5 million in 2017, compared with $636.4 million provided by financing activities in 2016. This net change of $1.3 billion reflects net payments of $925.0 million under the Facility in 2017 compared to net borrowings of $689.0 million in 2016, partially offset by the receipt of $395.7 million of proceeds from the issuance of the Euro Notes in the second quarter of 2017. Greater cash flows from operating activities coupled with lower cash needs relating to investing activities in 2017 facilitated the year-over-year change in net borrowing activity related to our Facility ($150.0 million of net borrowings in 2021 compared with $525.0 million of net repayments in 2020). The change in net borrowing activity reflected higher cash flowsoutflows from financinginvesting activities (discussed elsewhere in this section), $243.3 million of incremental share repurchases this year and lower cash provided by operating activities.
Credit FacilityDebt
On May 17, 2018, we amended ourOur $2.75 billion Facility which improved pricingmatures on April 14, 2026 and extended the maturity date to May 17, 2023.bears a variable rate of interest. As of December 31, 2018,2021, we had outstanding borrowings under the Facility of $138.2 million. As of December 31, 2020, we had no outstanding borrowings under the Facility and outstanding letters of credit of $8.6 million. As of December 31, 2017, we had no outstanding borrowings under the Facility outstanding letters of credit of $9.0 million.Facility. The average outstanding borrowings under the Facility were $364.1$432.0 million (with an average effective interest rate of 0.9%) and $888.5$865.1 million (with an average effective interest rate of 1.6%) during the years ended December 31, 20182021 and 2017,2020, respectively.
We had Short-term borrowings (including financing lease obligations, overdrawn bank accounts and local overdraft facilities) of $147.9 million as of December 31, 2021, including $132.7 million related to overdrawn bank accounts and $9.2 million attributable to local overdraft facilities. As of December 31, 2020 short-term borrowings was $62.0 million, including $44.8 million related to overdrawn bank accounts and $12.0 million attributable to local overdraft facilities. As of December 31, 2021, we had the capacity to borrow up to an additional $55.5 million under local overdraft facilities.
In addition, as of December 31, 2021, we had the following outstanding senior notes:
•$275.0 million of Notes due November 2022 (with an fixed interest rate of 4.4%)
•€350.0 million of Euro Notes, evenly divided between maturities of June 2027 (with a fixed interest rate of 1.96%) and June 2029 (with a fixed interest rate of 2.21%).
We will continue to use the Facility for working capital needs (including payment of accrued incentive compensation), co-investment activities, dividend payments, share repurchases, capital expenditures and acquisitions.
Short-Term Borrowings
In additionRefer to our Facility, we had the capacity to borrow up to an additional $61.5 million under local overdraft facilities as of December 31, 2018. We had Short-term borrowings (including capital lease obligations, overdrawn bank accounts and local overdraft facilities) of $32.7 million and $77.4 million as of December 31, 2018 and 2017, respectively, of which $17.0 million and $45.4 million as of December 31, 2018 and 2017, respectively, were attributable to local overdraft facilities.
See Note 10, Debt ofin the Notes to Consolidated Financial Statements, included in Item 8, for additional information on our Facility, Short-term borrowings and Long-term debt included in Item 8.debt.
Co-InvestmentInvestment Activity
As of December 31, 2018,2021, we had total investmentsa carrying value of $356.9$745.7 million in separate property or fundInvestments, primarily related to LaSalle co-investments and real estate technology ventures. The substantial majority of co-investments relate to LaSalle.investments by JLL Technologies in early-stage proptech companies. In 2018,2021 and 2020, funding of co-investmentsinvestments exceeded returns of capital by $6.9$107.1 million whereas in 2017, return of capital exceeded funding of co-investments by $4.6 million. In 2016, net funding activity of $38.1and $38.8 million, was driven by our investment in the newly launched LaSalle Logiport REIT in Japan.respectively. We expect to continue to pursuecontinued investments by JLL Technologies as well as strategic co-investment opportunities with our investment management clients across the globeglobally as co-investment remains an important foundation to the continued growth of LaSalle's business. Separately, we plan
In addition, JLL Technologies funded a $45.0 million convertible note in the second quarter of 2021. This activity is included within "Other" in the cash flows from investing activities and primarily included in Long-term receivables on the Consolidated Balance Sheet.
We have unfunded capital commitments to invest up to $100investment vehicles and direct investments totaling a maximum of $372.4 million via our JLL Spark Global Venture Fund in proptech ventures.as of December 31, 2021.
See Note 5, Investments, in Real Estate Ventures, of the Notes to Consolidated Financial Statements, included in Item 8, for additional information on our co-investment activity, included in Item 8.investment activity.
Share Repurchase and Dividend Programs
Since October 2002,On February 21, 2021, our Board of Directors has approved five shareauthorized an additional $500.0 million for the repurchase programs. As of December 31, 2018, we have 1,563,100 shares we remain authorized to repurchase under the current share repurchase program. We have made no share repurchases in the last three years under this authorization. Our current share repurchase program allows JLL to purchase our common stock in the open market and in privately negotiated transactions.transactions in addition to the $100.0 million remaining as of December 31, 2020, from the initial authorization. The number of shares repurchased and cash paid for repurchases is noted in table below.
Our Board declared and we paid total annual dividends and dividend-equivalents | | | | | | | | | | | |
| | | Year Ended December 31, |
| ($'s in millions) | | | | 2021 | 2020 |
| Total number of shares repurchased (in 000's) | | | | 1,451.7 | | 897.0 | |
| Total paid for shares repurchased | | | | $ | 343.3 | | 100.0 | |
As of $0.82, $0.72 and $0.64 per commonDecember 31, 2021, $256.8 million remained authorized for repurchases under our share in 2018, 2017 and 2016, respectively, including a semi-annual cash dividend of $0.41 per share in the fourth quarter of 2018. There can be no assurance dividends will be declared in the future since the actual declaration of future dividends and the establishment of record and payment dates remains subject to final determination by our Board of Directors.repurchase program.
Capital Expenditures
Capital expenditures, excluding those made by a consolidated VIE in which we held no equity interest, were $161.9 million, $151.4 million$175.9 and $216.2$149.4 million in 2018, 20172021 and 2016, respectively. Our capital expenditures are2020, respectively, were primarily for purchased and developed software, computer hardware and improvements to leased office space. The increase of capital expenditures compared with 2017 is primarily due to year-over-year increases in purchased and developed software as well as computer hardware. The decrease from 2016 to 2017 was primarily due to a reduction in cash spent on improvements to leased office space improvements, hardware and a year-over-year decrease in computer hardware purchases.purchased/developed software.
Investment Asset Activity of Consolidated Less Than Wholly-Owned Entities
Net property acquisitions and capital expendituresadditions made by consolidated VIEs were $47.1 million, $2.3 million and $99.8 million in 2018, 2017 and 2016, respectively, of which $63.4 million in 2016 was attributable to two consolidated VIEs in which we held equity interests ranging between 20% and 25%, and the remainder attributable to a consolidated VIE in which we hold no equity interest. interest were net acquisitions of $70.9 million in 2021, compared with net proceeds of $1.0 million in 2020, primarily to acquire (and dispose of) real estate.
Refer to Note 5, Investments, in Real Estate Ventures, of the Notes to the Consolidated Financial Statements, included in Item 8, for further information on our consolidated VIE investments, included in Item 8.investments.
Business Acquisitions
In 2018,2021, we paid $173.6$505.5 million for business acquisitions. This included $101.3$416.8 million of cash payments relating to 2018 acquisitions that closed in 2021 and $72.3$88.7 million for deferred business acquisition and earn-out obligations related to acquisitions completed in prior years. This compares to the $69.4 million paidyears, which are primarily reflected in 2017 and the $537.8 million paid in 2016. The notable decreasecash flows from 2016 to 2017 reflected the significant acquisition activity in 2016, which included the acquisition of Integral.
financing activities.
Terms for our acquisitions have typically included cash paid at closing with provisions for additional consideration and earn-out payments subject to certain contract provisions and performance. Deferred business acquisition obligations totaled $62.3$28.1 million and $81.9$50.1 million on the Consolidated Balance Sheets as of December 31, 20182021 and 2017,2020, respectively. These obligations represent the current discounted values of payments to sellers of businesses for which our acquisition has closed as of the balance sheet dates and for which the only remaining condition on those payments is the passage of time. As of December 31, 2018,2021, we had the potential to make earn-out payments on 19 acquisitions subject to the achievement of certain performance conditions, representing $84.1 million accrued for potential earn-out payments, of a potential maximum of $407.3$149.9 million (undiscounted), subject to the achievement of certain performance conditions. These earn-outs will come due at various times over the next sixfive years, assuming the achievement of the applicable performance conditions.
We will continue to consider acquisitions we believe will strengthen our market position, increase our profitability and supplement our organic growth.
Refer to Note 4, Business Combinations, Goodwill and Other Intangibles,Intangible Assets, of the Notes to the Consolidated Financial Statements, included in Item 8, for further information on business acquisitions, included in Item 8.acquisitions.
Repatriation of Foreign Earnings
Based on our historical experience and future business plans, we do not expect to repatriate our foreign source earnings to the U.S. We believe our policy of permanently reinvesting earnings of foreign subsidiaries does not significantly impact our liquidity. As of December 31, 20182021 and 2017,2020, we had total cash and cash equivalents of $480.9$593.7 million and $268.0$574.3 million, respectively, of which approximately $429.1$487.9 million and $198.9$445.2 million, respectively, was held by our foreign subsidiaries.
Restricted Net Assets
We face regulatory restrictions in certain countries that limit or prevent the transfer of funds to other countries or the exchange of the local currency to other currencies, however, we generally face no such restrictions with regard to the use or application of funds for ordinary course business activities within such countries. The total assets of these countries in aggregate totaled approximately 6%4% of our total assets as of both December 31, 20182021 and 2017.2020, respectively.
Contractual Obligations
We have obligations and commitments to make future payments under contracts in the normal course of business. The following table summarizes our minimum contractual obligations as of December 31, 2018.
|
| | | | | | | | | | | |
| ($ in millions) | PAYMENTS DUE BY PERIOD |
| CONTRACTUAL OBLIGATIONS | TOTAL | LESS THAN 1 YEAR | 1-3 YEARS | 3-5 YEARS | MORE THAN 5 YEARS |
| 1. Debt obligations | $ | 702.9 |
| 27.7 |
| — |
| 275.0 |
| 400.2 |
|
| 2. Interest on debt obligations | 127.2 |
| 20.9 |
| 40.9 |
| 27.3 |
| 38.1 |
|
| 3. Business acquisition obligations | 62.3 |
| 27.6 |
| 31.3 |
| 3.2 |
| 0.2 |
|
| 4. Lease obligations | 890.9 |
| 167.8 |
| 285.4 |
| 180.4 |
| 257.3 |
|
| 5. Deferred compensation | 52.2 |
| 6.1 |
| 36.5 |
| 9.6 |
| — |
|
| 6. Defined benefit plan obligations | 171.9 |
| 15.4 |
| 32.0 |
| 33.7 |
| 90.8 |
|
| 7. Vendor and other purchase obligations | 148.4 |
| 80.9 |
| 50.5 |
| 13.9 |
| 3.1 |
|
| Total | $ | 2,155.8 |
| 346.4 |
| 476.6 |
| 543.1 |
| 789.7 |
|
1. Debt Obligations. As of December 31, 2018, we had no outstanding borrowings under our Facility; we had outstanding borrowings of $17.0 million under our local overdraft facilities and $10.7 million related to overdrawn bank accounts. We had the ability to borrow up to $2.75 billion on the Facility with a maturity date in 2023. We had the capacity to borrow up to an additional $61.5 million under local overdraft facilities. In addition, we had $275.0 million of Notes due November 2022 and €350.0 million of Euro Notes, with €175.0 million of the Euro Notes due June 2027 and June 2029, respectively.
2. Interest on Debt Obligations. Our debt obligations incur interest charges primarily at variable rates. For purposes of preparing an estimated projection of interest on debt obligations for this table, we have estimated our future interest payments based on our borrowing rates and amounts outstanding as of December 31, 2018 and assuming each of our debt obligations is held to maturity. As of December 31, 2018, the annual interest rate on our Notes was 4.4%. As of December 31, 2018, the annual interest rates on our Euro Notes were 1.96% and 2.21% for the 10-year and 12-year notes, respectively.
3. Business Acquisition Obligations. Our business acquisition obligations represent payments to sellers of businesses for acquisitions closed as of December 31, 2018, with the only condition on those payments being the passage of time.
The contractual obligations table above does not include possible contingent earn-out payments associated with our acquisitions. As of December 31, 2018, we had the potential to make earn-out payments on 54 acquisitions subject to the achievement of certain performance conditions. The maximum amount of the potential earn-out payments was $407.3 million as of December 31, 2018. We anticipate these earn-out payments will come due at various times over the next six years assuming the achievement of the applicable performance conditions.
4. Lease Obligations. Our lease obligations primarily consist of operating leases of office space in various buildings for our own use as well as operating leases for equipment. The total minimum rentals to be received in the future as sublessor under noncancelable operating subleases as of December 31, 20182021 was $34.9$43.7 million.
5. Refer to Note 11, Leases, of the Notes to the Consolidated Financial Statements, included in Item 8, for further information on our lease obligations.
Deferred Compensation.
Deferred compensation obligations in the table above represent payments expected to be made pursuant to long-term deferred compensation plans and are inclusive of amounts attributable to service conditions satisfied as of December 31, 2018,2021, as well as service conditions expected to be satisfied in future periods.
The contractual obligations table above does notdeferred compensation plans include a provision for deferred compensation plans, predominantly in the U.S., that allow employees to defer portions of their compensation. Generally, we invest directly in insurance contracts which yield returns to fund these deferred compensation obligations. We recognize an asset for the amount that could be realized under these insurance contracts at the balance sheet date, and the deferred compensation obligation is adjusted to reflect the changes in the fair value of the amount owed to the employees. Such plans are recordedThe timing of payments to employees is, in part, dependent on their employment with JLL and, therefore, cannot be determined with precision.
Refer to the Consolidated Balance Sheets, as of December 31, 2018 as Deferred compensation plan assetsthe Consolidated Financial Statements, and Note 9, Fair Value Measurements, of $258.2 million and long-term deferred compensation liabilities,the Notes to the Consolidated Financial Statements, included in Deferred compensation, of $251.8 million.Item 8, for further information on our deferred compensation.
6. Defined Benefit Plan Obligations. Plans
The defined benefit plan obligations represent estimates of the expected benefits to be paid out by our defined benefit plans over the next ten years.plans. We will fund these obligations from the assets held by these plans. If the assets these plans hold are not sufficient to fund these payments, JLL will fund the remaining obligations. We have historically funded pension costs as actuarially determined and as applicable laws and regulations require. We expect to contribute $7.8$8.6 million to our defined benefit pension plans in 2019.
7. Vendor and Other Purchase Obligations. Our other purchase obligations primarily relate2022. As payments to various information technology servicing agreements, telephone communicationsrecipients are based on their retirement date, age and other administrative support functions.factors, we cannot determine the timing of such payments with precision.
Other. We have unfunded capital commitmentsRefer to LIC II, an unconsolidated joint venture that serves as a vehicle for our co-investment activity, and to direct investments for future fundings of co-investments in underlying funds, totaling a maximum of $240.6 million as of December 31, 2018. We are not able to predict if, when, or in what amounts such capital calls will be made, and therefore we exclude such commitments from the above table. However, in relation to this activity, we made capital contributions and advances to investments in real estate ventures of $58.8 million, $40.1 million and $96.4 million in 2018, 2017 and 2016, respectively.
For additional information on the contractual obligations presented above, see our discussion in Note 4, Business Combinations, Goodwill and Other Intangibles, Note 5, Investments in Real Estate Ventures, Note 7, Retirement Plans, Note 10, Debt and Note 11, Leases, inof the Notes to the Consolidated Financial Statements, included in Item 8.8, for further information on our defined benefit plans.
Off-Balance Sheet Arrangements
We have unfunded capital commitments to investment vehicles and direct investments for future co-investments, totaling a maximum of $240.6 million as of December 31, 2018. See our discussion of unfunded commitments in Note 5, Investments in Real Estate Ventures, of the Notes to Consolidated Financial Statements, included in Item 8.
ITEM 7A. QUANTITATIVE AND QUALITATIVE DISCLOSURES ABOUT MARKET RISK
Information regarding market risk is included in Item 7. Management's Discussion and Analysis of Financial Condition and Results of Operations under the caption "Market Risks" and is incorporated by reference herein.
Disclosure of Limitations
As the information presented above includes only those exposures that exist as of December 31, 2018,2021, it does not consider those exposures or positions which could arise after that date. The information we present has limited predictive value. As a result, the ultimate realized gain or loss with respect to interest rate and foreign currency fluctuations will depend on the exposures that arise during the applicable period, the hedging strategies at the time, and interest and foreign currency rates.
ITEM 8. FINANCIAL STATEMENTS AND SUPPLEMENTARY DATA
| | | | | |
| Index to Consolidated Financial Statements | Page |
| |
Index to Consolidated Financial Statements | Page |
| |
| JONES LANG LASALLE INCORPORATED CONSOLIDATED FINANCIAL STATEMENTS | |
| |
| Report of Independent Registered Public Accounting Firm, KPMG LLP, on Consolidated Financial Statements | |
| |
| Report of Independent Registered Public Accounting Firm, KPMG LLP, on Internal Control Over Financial Reporting | |
| |
Consolidated Balance Sheets as of December 31, 20182021 and 20172020 | |
| |
Consolidated Statements of Comprehensive Income for the Years Ended December 31, 2018, 2017,2021, 2020, and 20162019 | |
| |
Consolidated Statements of Changes in Equity for the Years Ended December 31, 2018, 2017,2021, 2020, and 20162019 | |
| |
Consolidated Statements of Cash Flows for the Years Ended December 31, 2018, 2017,2021, 2020, and 20162019 | |
| |
| Notes to Consolidated Financial Statements | |
| |
Quarterly Results of Operations (Unaudited) | |
Report of Independent Registered Public Accounting Firm
The stockholdersTo the Shareholders and boardBoard of directorsDirectors
Jones Lang LaSalle Incorporated:
Opinion on the Consolidated Financial Statements
We have audited the accompanying consolidated balance sheets of Jones Lang LaSalle Incorporated and subsidiaries (the Company) as of December 31, 20182021 and 2017, and2020, the related consolidated statements of comprehensive income, changes in equity, and cash flows for each of the years in the three-year period ended December 31, 2018,2021, and the related notes (collectively, the consolidated financial statements). In our opinion, the consolidated financial statements present fairly, in all material respects, the financial position of the Company as of December 31, 20182021 and 2017,2020, and the results of its operations and its cash flows for each of the years in the three-year period ended December 31, 2018,2021, in conformity with U.S. generally accepted accounting principles.
We also have audited, in accordance with the standards of the Public Company Accounting Oversight Board (United States) (PCAOB), the Company’s internal control over financial reporting as of December 31, 2018,2021, based on criteria established in Internal Control – Integrated Framework (2013) issued by the Committee of Sponsoring Organizations of the Treadway Commission, and our report dated February 25, 201928, 2022 expressed an unqualified opinion on the effectiveness of the Company’s internal control over financial reporting.
Change in Accounting Principle
As discussed in Note 2 to the consolidated financial statements, the Company has changed its method of accounting for revenue from contracts with customers in 2018 due to the adoption of ASC Topic 606, Revenue Recognition – Revenue from Contracts with Customers.
Basis for Opinion
These consolidated financial statements are the responsibility of the Company’s management. Our responsibility is to express an opinion on these consolidated financial statements based on our audits. We are a public accounting firm registered with the PCAOB and are required to be independent with respect to the Company in accordance with the U.S. federal securities laws and the applicable rules and regulations of the Securities and Exchange Commission and the PCAOB.
We conducted our audits in accordance with the standards of the PCAOB. Those standards require that we plan and perform the audit to obtain reasonable assurance about whether the consolidated financial statements are free of material misstatement, whether due to error or fraud. Our audits included performing procedures to assess the risks of material misstatement of the consolidated financial statements, whether due to error or fraud, and performing procedures that respond to those risks. Such procedures included examining, on a test basis, evidence regarding the amounts and disclosures in the consolidated financial statements. Our audits also included evaluating the accounting principles used and significant estimates made by management, as well as evaluating the overall presentation of the consolidated financial statements. We believe that our audits provide a reasonable basis for our opinion.
Critical Audit Matter
The critical audit matter communicated below is a matter arising from the current period audit of the consolidated financial statements that was communicated or required to be communicated to the audit committee and that: (1) relates to accounts or disclosures that are material to the consolidated financial statements and (2) involved our especially challenging, subjective, or complex judgments. The communication of a critical audit matter does not alter in any way our opinion on the consolidated financial statements, taken as a whole, and we are not, by communicating the critical audit matter below, providing a separate opinion on the critical audit matter or on the accounts or disclosures to which it relates.
Sufficiency of audit evidence over income taxes
As described in Notes 2 and 8 to the consolidated financial statements, the Company recorded a provision for income taxes of $264.3 million for the year ended December 31, 2021 based on local tax rules and regulations for the tax jurisdictions in which they operate. The Company has operations which constitute a taxable income presence in 92 countries or other taxable jurisdictions outside of the U.S.
We identified the evaluation of the sufficiency of audit evidence over income tax expense as a critical audit matter. The Company’s global tax structure adds complexity that required subjective auditor judgment to evaluate the sufficiency of audit evidence obtained. This required the involvement of domestic and international tax professionals with specialized skills and knowledge, in order to assess the nature and extent of procedures performed in relation to the amounts recorded and disclosed in the consolidated financial statements.
The following are the primary procedures we performed to address this critical audit matter. We evaluated the design and tested the operating effectiveness of certain internal controls over the Company’s income tax process, including controls over the amounts recorded. We applied auditor judgment to determine the nature and extent of procedures to be performed over income tax expense. For certain taxing jurisdictions, we analyzed supporting documentation for the provision for income taxes. In addition, we involved tax professionals with specialized skills and knowledge who evaluated certain of the Company’s interpretations and applications of the tax rules and regulations. We evaluated the sufficiency of audit evidence obtained by assessing the results of procedures performed over income tax expense, including the appropriateness of the nature and extent of such evidence.
/s/ KPMG LLP
We have served as the Company’s auditor since 1988./s
/KPMG LLP
Chicago, Illinois
February 25, 201928, 2022
Report of Independent Registered Public Accounting Firm
The stockholdersTo the Shareholders and boardBoard of directorsDirectors
Jones Lang LaSalle Incorporated:
Opinion on Internal Control overOver Financial Reporting
We have audited Jones Lang LaSalle Incorporated and subsidiaries' (the Company) internal control over financial reporting as of December 31, 2018,2021, based on criteria established in Internal Control – Integrated Framework (2013) issued by the Committee of Sponsoring Organizations of the Treadway Commission. In our opinion, the Company maintained, in all material respects, effective internal control over financial reporting as of December 31, 2018,2021, based on criteria established in Internal Control – Integrated Framework (2013) issued by the Committee of Sponsoring Organizations of the Treadway Commission.
We also have audited, in accordance with the standards of the Public Company Accounting Oversight Board (United States) (PCAOB), the consolidated balance sheets of the Company as of December 31, 20182021 and 2017,2020, and the related consolidated statements of comprehensive income, changes in equity, and cash flows for each of the years in the three-year period ended December 31, 2018,2021, and the related notes (collectively, the consolidated financial statements), and our report dated February 25, 201928, 2022 expressed an unqualified opinion on those consolidated financial statements.
Basis for Opinion
The Company’s management is responsible for maintaining effective internal control over financial reporting and for its assessment of the effectiveness of internal control over financial reporting, included in the accompanying Management’s Report on Internal Control over Financial Reporting. Our responsibility is to express an opinion on the Company’s internal control over financial reporting based on our audit.
We are a public accounting firm registered with the PCAOB and are required to be independent with respect to the Company in accordance with the U.S. federal securities laws and the applicable rules and regulations of the Securities and Exchange Commission and the PCAOB.
We conducted our audit in accordance with the standards of the PCAOB. Those standards require that we plan and perform the audit to obtain reasonable assurance about whether effective internal control over financial reporting was maintained in all material respects. Our audit of internal control over financial reporting included obtaining an understanding of internal control over financial reporting, assessing the risk that a material weakness exists, and testing and evaluating the design and operating effectiveness of internal control based on the assessed risk. Our audit also included performing such other procedures as we considered necessary in the circumstances. We believe that our audit provides a reasonable basis for our opinion.
Definition and Limitations of Internal Control overOver Financial Reporting
A company’s internal control over financial reporting is a process designed to provide reasonable assurance regarding the reliability of financial reporting and the preparation of financial statements for external purposes in accordance with generally accepted accounting principles. A company’s internal control over financial reporting includes those policies and procedures that (1) pertain to the maintenance of records that, in reasonable detail, accurately and fairly reflect the transactions and dispositions of the assets of the company; (2) provide reasonable assurance that transactions are recorded as necessary to permit preparation of financial statements in accordance with generally accepted accounting principles, and that receipts and expenditures of the company are being made only in accordance with authorizations of management and directors of the company; and (3) provide reasonable assurance regarding prevention or timely detection of unauthorized acquisition, use, or disposition of the company’s assets that could have a material effect on the financial statements.
Because of its inherent limitations, internal control over financial reporting may not prevent or detect misstatements. Also, projections of any evaluation of effectiveness to future periods are subject to the risk that controls may become inadequate because of changes in conditions, or that the degree of compliance with the policies or procedures may deteriorate.
/s/ KPMG LLP
Chicago, Illinois
February 25, 201928, 2022
JONES LANG LASALLE INCORPORATED
CONSOLIDATED BALANCE SHEETS
| | | | | | | | December 31, |
| | December 31, | |
| ($ in millions, except share and per share data) | 2018 | 2017 | |
| (in millions, except share and per share data) | | (in millions, except share and per share data) | 2021 | 2020 |
| Assets | | | Assets | |
| Current assets: | | | Current assets: | | |
| Cash and cash equivalents | $ | 480.9 |
| 268.0 |
| Cash and cash equivalents | $ | 593.7 | | 574.3 | |
| Trade receivables, net of allowances of $52.0 and $51.3 | 1,854.0 |
| 1,739.4 |
| |
| Trade receivables, net of allowance of $67.6 and $66.5 | | Trade receivables, net of allowance of $67.6 and $66.5 | 2,004.1 | | 1,636.1 | |
| Notes and other receivables | 363.0 |
| 385.3 |
| Notes and other receivables | 389.3 | | 469.9 | |
| Reimbursable receivables | 1,540.5 |
| 1,263.3 |
| Reimbursable receivables | 1,734.5 | | 1,461.3 | |
| Warehouse receivables | 331.2 |
| 317.5 |
| Warehouse receivables | 822.3 | | 1,529.2 | |
| Short-term contract assets | 314.7 |
| 178.4 |
| |
| Short-term contract assets, net of allowance of $2.5 and $1.8 | | Short-term contract assets, net of allowance of $2.5 and $1.8 | 343.1 | | 265.8 | |
| Prepaid & other | 321.7 |
| 389.1 |
| Prepaid & other | 500.7 | | 517.1 | |
| Total current assets | 5,206.0 |
| 4,541.0 |
| Total current assets | 6,387.7 | | 6,453.7 | |
| Property and equipment, net of accumulated depreciation of $588.3 and $514.9 | 567.9 |
| 543.9 |
| |
| Property and equipment, net of accumulated depreciation of $909.1 and $806.2 | | Property and equipment, net of accumulated depreciation of $909.1 and $806.2 | 740.0 | | 663.9 | |
| Operating lease right-of-use assets | | Operating lease right-of-use assets | 723.4 | | 707.4 | |
| Goodwill | 2,697.8 |
| 2,709.3 |
| Goodwill | 4,611.6 | | 4,224.7 | |
| Identified intangibles, net of accumulated amortization of $169.8 and $165.9 | 336.9 |
| 305.0 |
| |
| Investments in real estate ventures, including $247.3 and $242.3 at fair value | 356.9 |
| 376.2 |
| |
| Identified intangibles, net of accumulated amortization of $340.1 and $295.3 | | Identified intangibles, net of accumulated amortization of $340.1 and $295.3 | 887.0 | | 679.8 | |
| Investments, including $639.6 and $340.3 at fair value | | Investments, including $639.6 and $340.3 at fair value | 745.7 | | 430.8 | |
| Long-term receivables | 199.0 |
| 164.7 |
| Long-term receivables | 316.4 | | 231.1 | |
| Deferred tax assets, net | 210.1 |
| 229.1 |
| Deferred tax assets, net | 330.8 | | 296.5 | |
| Deferred compensation plan | 258.2 |
| 229.7 |
| Deferred compensation plan | 528.8 | | 446.3 | |
| Other | 192.7 |
| 155.5 |
| Other | 233.6 | | 182.3 | |
| Total assets | 10,025.5 |
| 9,254.4 |
| Total assets | $ | 15,505.0 | | 14,316.5 | |
| Liabilities and Equity | |
| |
| Liabilities and Equity | | |
| Current liabilities: | |
| |
| Current liabilities: | | |
| Accounts payable and accrued liabilities | $ | 1,261.4 |
| 993.1 |
| Accounts payable and accrued liabilities | $ | 1,262.8 | | 1,229.8 | |
| Reimbursable payables | 1,090.7 |
| 1,022.6 |
| Reimbursable payables | 1,350.0 | | 1,154.5 | |
| Accrued compensation & benefits | 1,604.5 |
| 1,419.1 |
| Accrued compensation & benefits | 2,029.5 | | 1,433.2 | |
| Short-term borrowings | 32.7 |
| 77.4 |
| Short-term borrowings | 147.9 | | 62.0 | |
| Current maturities of long-term debt, net of debt issuance costs of $0.3 and $— | | Current maturities of long-term debt, net of debt issuance costs of $0.3 and $— | 274.7 | | — | |
| | Short-term contract liabilities and deferred income | 190.4 |
| 155.4 |
| Short-term contract liabilities and deferred income | 208.2 | | 192.9 | |
| Short-term acquisition-related obligations | 78.5 |
| 80.1 |
| Short-term acquisition-related obligations | 45.8 | | 91.7 | |
| Warehouse facilities | 317.9 |
| 309.2 |
| Warehouse facilities | 795.7 | | 1,498.4 | |
| | Short-term operating lease liabilities | | Short-term operating lease liabilities | 153.8 | | 165.7 | |
| Other | 185.7 |
| 256.8 |
| Other | 218.1 | | 299.6 | |
| Total current liabilities | 4,761.8 |
| 4,313.7 |
| Total current liabilities | 6,486.5 | | 6,127.8 | |
| Credit facility, net of debt issuance costs of $15.9 and $15.3 | (15.9 | ) | (15.3 | ) | |
| Long-term debt, net of debt issuance costs of $3.7 and $4.3 | 671.5 |
| 690.6 |
| |
| Credit facility, net of debt issuance costs of $11.8 and $8.7 | | Credit facility, net of debt issuance costs of $11.8 and $8.7 | 138.2 | | (8.7) | |
| Long-term debt, net of debt issuance costs of $1.4 and $2.5 | | Long-term debt, net of debt issuance costs of $1.4 and $2.5 | 395.6 | | 702.0 | |
| Deferred tax liabilities, net | 32.7 |
| 63.2 |
| Deferred tax liabilities, net | 179.7 | | 120.0 | |
| Deferred compensation | 277.8 |
| 259.0 |
| Deferred compensation | 525.4 | | 450.0 | |
| | Long-term acquisition-related obligations | 175.8 |
| 228.9 |
| Long-term acquisition-related obligations | 66.3 | | 26.2 | |
| | Long-term operating lease liabilities | | Long-term operating lease liabilities | 714.4 | | 683.9 | |
| Other | 387.3 |
| 332.3 |
| Other | 577.7 | | 597.5 | |
| Total liabilities | 6,291.0 |
| 5,872.4 |
| Total liabilities | 9,083.8 | | 8,698.7 | |
| | Redeemable noncontrolling interest | — |
| 3.8 |
| Redeemable noncontrolling interest | 7.8 | | 7.8 | |
| Company shareholders' equity: | |
| |
| Company shareholders' equity: | | |
| Common stock, $0.01 par value per share, 100,000,000 shares authorized; 45,599,418 and 45,373,817 shares issued and outstanding | 0.5 |
| 0.5 |
| |
| Common stock, $0.01 par value per share, 100,000,000 shares authorized; 52,076,800 and 51,970,307 shares issued; 50,024,139 and 51,105,417 outstanding | | Common stock, $0.01 par value per share, 100,000,000 shares authorized; 52,076,800 and 51,970,307 shares issued; 50,024,139 and 51,105,417 outstanding | 0.5 | | 0.5 | |
| Additional paid-in capital | 1,057.3 |
| 1,037.6 |
| Additional paid-in capital | 2,053.7 | | 2,023.3 | |
| Retained earnings | 3,095.7 |
| 2,649.0 |
| Retained earnings | 4,937.6 | | 3,975.9 | |
| Treasury stock, at cost, 2,052,661 and 864,890 shares | | Treasury stock, at cost, 2,052,661 and 864,890 shares | (406.3) | | (96.1) | |
| Shares held in trust | (5.8 | ) | (5.9 | ) | Shares held in trust | (5.2) | | (5.6) | |
| Accumulated other comprehensive loss | (456.2 | ) | (341.1 | ) | Accumulated other comprehensive loss | (395.4) | | (377.2) | |
| Total Company shareholders' equity | 3,691.5 |
| 3,340.1 |
| Total Company shareholders' equity | 6,184.9 | | 5,520.8 | |
| Noncontrolling interest | 43.0 |
| 38.1 |
| Noncontrolling interest | 228.5 | | 89.2 | |
| Total equity | 3,734.5 |
| 3,378.2 |
| Total equity | 6,413.4 | | 5,610.0 | |
| Total liabilities and equity | 10,025.5 |
| 9,254.4 |
| |
| Total liabilities, redeemable noncontrolling interest and equity | | Total liabilities, redeemable noncontrolling interest and equity | $ | 15,505.0 | | 14,316.5 | |
See accompanying notes to Consolidated Financial Statements.
JONES LANG LASALLE INCORPORATED
CONSOLIDATED STATEMENTS OF COMPREHENSIVE INCOME
| | | | | | | | | | Year Ended December 31, |
| | Year Ended December 31, | |
| ($ in millions, except share and per share data) | 2018 | 2017 | 2016 | |
| (in millions, except share and per share data) | | (in millions, except share and per share data) | 2021 | 2020 | 2019 |
| Revenue: | | | Revenue: | |
| Revenue before reimbursements | $ | 9,089.5 |
| 7,967.4 |
| 6,910.6 |
| Revenue before reimbursements | $ | 11,045.6 | | 8,900.1 | | 10,030.6 | |
| Reimbursements | 7,228.9 |
| 6,485.8 |
| 6,080.6 |
| Reimbursements | 8,321.4 | | 7,689.8 | | 7,952.6 | |
| Total revenue | $ | 16,318.4 |
| 14,453.2 |
| 12,991.2 |
| Total revenue | $ | 19,367.0 | | 16,589.9 | | 17,983.2 | |
| Operating expenses: | |
| |
| |
| Operating expenses: | | |
| Compensation and benefits | 5,206.8 |
| 4,622.4 |
| 4,040.5 |
| Compensation and benefits | $ | 6,819.9 | | 5,268.8 | | 5,812.7 | |
| Operating, administrative and other | 2,950.9 |
| 2,601.2 |
| 2,204.1 |
| Operating, administrative and other | 2,880.0 | | 2,703.4 | | 3,115.7 | |
| Reimbursed expenses | 7,228.9 |
| 6,485.8 |
| 6,080.6 |
| Reimbursed expenses | 8,321.4 | | 7,689.8 | | 7,952.6 | |
| Depreciation and amortization | 186.1 |
| 167.2 |
| 141.8 |
| Depreciation and amortization | 217.5 | | 226.4 | | 202.4 | |
| Restructuring and acquisition charges | 38.8 |
| 30.7 |
| 68.5 |
| Restructuring and acquisition charges | 84.7 | | 142.4 | | 184.4 | |
| Total operating expenses | 15,611.5 |
| 13,907.3 |
| 12,535.5 |
| Total operating expenses | $ | 18,323.5 | | 16,030.8 | | 17,267.8 | |
| Operating income | 706.9 |
| 545.9 |
| 455.7 |
| Operating income | $ | 1,043.5 | | 559.1 | | 715.4 | |
| Interest expense, net of interest income | 51.1 |
| 56.2 |
| 45.3 |
| Interest expense, net of interest income | 40.1 | | 52.8 | | 56.4 | |
| Equity earnings from real estate ventures | 32.8 |
| 44.4 |
| 33.8 |
| |
| Equity earnings | | Equity earnings | 209.4 | | 8.0 | | 36.3 | |
| Other income | 17.4 |
| 1.7 |
| 19.5 |
| Other income | 10.8 | | 15.3 | | 2.3 | |
| Income before income taxes and noncontrolling interest | 706.0 |
| 535.8 |
| 463.7 |
| Income before income taxes and noncontrolling interest | 1,223.6 | | 529.6 | | 697.6 | |
| Provision for income taxes | 214.3 |
| 256.3 |
| 117.8 |
| Provision for income taxes | 264.3 | | 106.9 | | 159.7 | |
| Net income | 491.7 |
| 279.5 |
| 345.9 |
| Net income | 959.3 | | 422.7 | | 537.9 | |
| Net income attributable to noncontrolling interest | 7.2 |
| 3.1 |
| 16.2 |
| |
| Net (loss) income attributable to noncontrolling interest | | Net (loss) income attributable to noncontrolling interest | (2.3) | | 20.2 | | 2.6 | |
| Net income attributable to the Company | 484.5 |
| 276.4 |
| 329.7 |
| Net income attributable to the Company | 961.6 | | 402.5 | | 535.3 | |
| Dividends on unvested common stock, net of tax benefit | 0.4 |
| 0.4 |
| 0.4 |
| Dividends on unvested common stock, net of tax benefit | — | | — | | 0.9 | |
| Net income attributable to common shareholders | $ | 484.1 |
| 276.0 |
| 329.3 |
| Net income attributable to common shareholders | $ | 961.6 | | 402.5 | | 534.4 | |
| Basic earnings per common share | $ | 10.64 |
| 6.09 |
| 7.29 |
| Basic earnings per common share | $ | 18.89 | | 7.79 | | 10.98 | |
| Basic weighted average shares outstanding (in 000's) | 45,517 |
| 45,316 |
| 45,154 |
| Basic weighted average shares outstanding (in 000's) | 50,917 | | 51,683 | | 48,647 | |
| Diluted earnings per common share | $ | 10.54 |
| 6.03 |
| 7.23 |
| Diluted earnings per common share | $ | 18.47 | | 7.70 | | 10.87 | |
| Diluted weighted average shares outstanding (in 000's) | 45,931 |
| 45,758 |
| 45,528 |
| Diluted weighted average shares outstanding (in 000's) | 52,071 | | 52,282 | | 49,154 | |
| Net income attributable to the Company | $ | 484.5 |
| 276.4 |
| 329.7 |
| Net income attributable to the Company | $ | 961.6 | | 402.5 | | 535.3 | |
| Change in pension liabilities, net of tax | 3.1 |
| 8.2 |
| (32.9 | ) | Change in pension liabilities, net of tax | 38.5 | | (9.2) | | (14.6) | |
| Foreign currency translation adjustments | (118.2 | ) | 202.0 |
| (182.1 | ) | Foreign currency translation adjustments | (56.7) | | 59.8 | | 43.0 | |
| Comprehensive income attributable to the Company | $ | 369.4 |
| 486.6 |
| 114.7 |
| Comprehensive income attributable to the Company | $ | 943.4 | | 453.1 | | 563.7 | |
See accompanying notes to Consolidated Financial Statements.
JONES LANG LASALLE INCORPORATED
CONSOLIDATED STATEMENTS OF CHANGES IN EQUITY
FOR THE YEARS ENDED DECEMBER 31, 2018, 20172021, 2020 AND 20162019
| | ($ in millions, except share and per share data) | Company Shareholders' Equity | | | |
| | | Accumulated | | | |
| | Additional | | Shares | Other | | | |
| Common Stock | Paid-In | Retained | Held | Comprehensive | Noncontrolling | Total | |
| Shares | Amount | Capital | Earnings | in Trust | Income (Loss) | Interest | Equity | |
| December 31, 2015 | 45,049,503 |
| $ | 0.5 |
| 986.6 |
| 2,044.2 |
| (6.2 | ) | (336.3 | ) | 29.5 |
| $ | 2,718.3 |
| |
Net income (1) | — |
| — |
| — |
| 329.7 |
| — |
| — |
| 16.1 |
| 345.8 |
| |
(in millions, except share and
per share data) | | (in millions, except share and
per share data) | Company Shareholders' Equity | | | |
| | Common Stock | Additional | | Shares | | |
| Shares Outstanding | Amount | Paid-In | Retained | Held | Treasury | | Total |
| Capital | Earnings | in Trust | Stock | AOCI(1) | NCI(2) | | Equity |
| December 31, 2018 | | December 31, 2018 | 45,599,418 | | $ | 0.5 | | 1,057.3 | | 3,095.7 | | (5.8) | | — | | (456.2) | | 43.0 | | | $ | 3,734.5 | |
Net income (3) | | Net income (3) | — | | — | | — | | 535.3 | | — | | — | | — | | 2.4 | | | 537.7 | |
| Shares issued under stock compensation programs | 225,255 |
| — |
| 1.6 |
| — |
| — |
| — |
| — |
| 1.6 |
| Shares issued under stock compensation programs | 301,670 | | — | | 3.7 | | — | | — | | — | | — | | — | | | 3.7 | |
| Acquisition of HFF | | Acquisition of HFF | 5,733,603 | | — | | 841.2 | | — | | — | | — | | — | | — | | | 841.2 | |
| Shares repurchased for payment of taxes on stock awards | (60,926 | ) | — |
| (7.0 | ) | — |
| — |
| — |
| — |
| (7.0 | ) | Shares repurchased for payment of taxes on stock awards | (85,037) | | — | | (13.6) | | — | | — | | — | | — | | — | | | (13.6) | |
| Tax adjustments due to vestings and exercises | — |
| — |
| 1.2 |
| — |
| — |
| — |
| — |
| 1.2 |
| |
| Amortization of stock-based compensation | — |
| — |
| 30.1 |
| — |
| — |
| — |
| — |
| 30.1 |
| Amortization of stock-based compensation | — | | — | | 74.2 | | — | | — | | — | | — | | — | | | 74.2 | |
| Cumulative effect from adoption of new accounting for revenue prior to 2016 | — |
| — |
| — |
| 62.5 |
| — |
| — |
| — |
| 62.5 |
| |
| Shares held in trust | — |
| — |
| — |
| — |
| 0.2 |
| — |
| — |
| 0.2 |
| Shares held in trust | — | | — | | — | | — | | 0.1 | | — | | — | | — | | | 0.1 | |
| Dividends paid, $0.64 per share | — |
| — |
| — |
| (29.4 | ) | — |
| — |
| — |
| (29.4 | ) | |
| Dividends paid, $0.86 per share | | Dividends paid, $0.86 per share | — | | — | | — | | (42.7) | | — | | — | | — | | — | | | (42.7) | |
| Change in pension liabilities, net of tax | — |
| — |
| — |
| — |
| — |
| (32.9 | ) | — |
| (32.9 | ) | Change in pension liabilities, net of tax | — | | — | | — | | — | | — | | — | | (14.6) | | — | | | (14.6) | |
| Foreign currency translation adjustments | — |
| — |
| — |
| — |
| — |
| (182.1 | ) | — |
| (182.1 | ) | Foreign currency translation adjustments | — | | — | | — | | — | | — | | — | | 43.0 | | — | | | 43.0 | |
| Net increase in amount attributable to noncontrolling interest | — |
| — |
| — |
| — |
| — |
| — |
| (20.6 | ) | (20.6 | ) | |
| Acquisition of redeemable noncontrolling interest | — |
| — |
| 0.8 |
| — |
| — |
| — |
| — |
| 0.8 |
| |
| December 31, 2016 | 45,213,832 |
| $ | 0.5 |
| 1,013.3 |
| 2,407.0 |
| (6.0 | ) | (551.3 | ) | 25.0 |
| $ | 2,888.5 |
| |
Net income (1) | — |
| — |
| — |
| 276.4 |
| — |
| — |
| 3.2 |
| 279.6 |
| |
| Shares issued under stock compensation programs | 216,831 |
| — |
| 3.6 |
| — |
| — |
| — |
| — |
| 3.6 |
| |
| Shares repurchased for payment of taxes on stock awards | (56,846 | ) | — |
| (6.6 | ) | — |
| — |
| — |
| — |
| (6.6 | ) | |
| Amortization of stock-based compensation | — |
| — |
| 24.9 |
| — |
| — |
| — |
| — |
| 24.9 |
| |
| Cumulative effect from adoption of new accounting for stock-based compensation | — |
| — |
| 1.3 |
| (1.3 | ) | — |
| — |
| — |
| — |
| |
| Shares held in trust | — |
| — |
| — |
| — |
| 0.1 |
| — |
| — |
| 0.1 |
| |
| Dividends paid, $0.72 per share | — |
| — |
| — |
| (33.1 | ) | — |
| — |
| — |
| (33.1 | ) | |
| Change in pension liabilities, net of tax | — |
| — |
| — |
| — |
| — |
| 8.2 |
| — |
| 8.2 |
| |
| Foreign currency translation adjustments | — |
| — |
| — |
| — |
| — |
| 202.0 |
| — |
| 202.0 |
| |
| Net decrease in amounts attributable to noncontrolling interest | — |
| — |
| — |
| — |
| — |
| — |
| 9.9 |
| 9.9 |
| |
| Acquisition of redeemable noncontrolling interest | — |
| — |
| 1.1 |
| — |
| — |
| — |
| — |
| 1.1 |
| |
| December 31, 2017 | 45,373,817 |
| $ | 0.5 |
| 1,037.6 |
| 2,649.0 |
| (5.9 | ) | (341.1 | ) | 38.1 |
| $ | 3,378.2 |
| |
| Net income | — |
| — |
| — |
| 484.5 |
| — |
| — |
| 7.2 |
| 491.7 |
| |
| Net increase in amounts attributable to noncontrolling interest | | Net increase in amounts attributable to noncontrolling interest | — | | — | | — | | — | | — | | — | | — | | 41.2 | | | 41.2 | |
| December 31, 2019 | | December 31, 2019 | 51,549,654 | | $ | 0.5 | | 1,962.8 | | 3,588.3 | | (5.7) | | — | | (427.8) | | 86.6 | | | $ | 5,204.7 | |
Net income (3) | | Net income (3) | — | | — | | — | | 402.5 | | — | | — | | — | | 20.5 | | | 423.0 | |
| Shares issued under stock-based compensation programs | 308,843 |
| — |
| 2.9 |
| — |
| — |
| — |
| — |
| 2.9 |
| Shares issued under stock-based compensation programs | 632,638 | | — | | 0.2 | | — | | — | | 3.9 | | — | | — | | | 4.1 | |
| Shares repurchased for payment of taxes on stock-based compensation | (83,242 | ) | — |
| (12.4 | ) | — |
| — |
| — |
| — |
| (12.4 | ) | Shares repurchased for payment of taxes on stock-based compensation | (179,938) | | — | | (23.5) | | — | | — | | — | | — | | — | | | (23.5) | |
| Amortization of stock-based compensation | — |
| — |
| 26.8 |
| — |
| — |
| — |
| — |
| 26.8 |
| Amortization of stock-based compensation | — | | — | | 83.8 | | — | | — | | — | | — | | — | | | 83.8 | |
| Shares held in trust | — |
| — |
| — |
| — |
| 0.1 |
| — |
| — |
| 0.1 |
| Shares held in trust | — | | — | | — | | — | | 0.1 | | — | | — | | — | | | 0.1 | |
| Dividends paid, $0.82 per share | — |
| — |
| — |
| (37.8 | ) | — |
| — |
| — |
| (37.8 | ) | |
| Cumulative effect from adoption of new accounting for credit losses | | Cumulative effect from adoption of new accounting for credit losses | — | | — | | — | | (14.9) | | — | | — | | — | | — | | | (14.9) | |
| Repurchase of common stock | | Repurchase of common stock | (896,937) | | — | | — | | — | | — | | (100.0) | | — | | — | | | (100.0) | |
| Change in pension liabilities, net of tax | | Change in pension liabilities, net of tax | — | | — | | — | | — | | — | | — | | (9.2) | | — | | | (9.2) | |
| Foreign currency translation adjustments | | Foreign currency translation adjustments | — | | — | | — | | — | | — | | — | | 59.8 | | — | | | 59.8 | |
| Net decrease in amounts attributable to noncontrolling interest | | Net decrease in amounts attributable to noncontrolling interest | — | | — | | — | | — | | — | | — | | — | | (17.9) | | | (17.9) | |
| December 31, 2020 | | December 31, 2020 | 51,105,417 | | $ | 0.5 | | 2,023.3 | | 3,975.9 | | (5.6) | | (96.1) | | (377.2) | | 89.2 | | | $ | 5,610.0 | |
Net income (3) | | Net income (3) | — | | — | | — | | 961.6 | | — | | — | | — | | (2.2) | | | 959.4 | |
| Shares issued under stock-based compensation programs | | Shares issued under stock-based compensation programs | 558,573 | | — | | (37.7) | | — | | — | | 57.3 | | — | | — | | | 19.6 | |
| | Shares repurchased for payment of taxes on stock-based compensation | | Shares repurchased for payment of taxes on stock-based compensation | (188,131) | | — | | (28.3) | | — | | — | | (24.2) | | — | | — | | | (52.5) | |
| Amortization of stock-based compensation | | Amortization of stock-based compensation | — | | — | | 96.4 | | — | | — | | — | | — | | — | | | 96.4 | |
| Shares held in trust | | Shares held in trust | — | | — | | — | | — | | 0.4 | | — | | — | | — | | | 0.4 | |
| Dividends from vested historic award | | Dividends from vested historic award | — | | — | | — | | 0.1 | | — | | — | | — | | — | | | 0.1 | |
| Repurchase of common stock | | Repurchase of common stock | (1,451,720) | | — | | — | | — | | — | | (343.3) | | — | | — | | | (343.3) | |
| Change in pension liabilities, net of tax | — |
| — |
| — |
| — |
| — |
| 3.1 |
| — |
| 3.1 |
| Change in pension liabilities, net of tax | — | | — | | — | | — | | — | | — | | 38.5 | | — | | | 38.5 | |
| Foreign currency translation adjustments | — |
| — |
| — |
| — |
| — |
| (118.2 | ) | — |
| (118.2 | ) | Foreign currency translation adjustments | — | | — | | — | | — | | — | | — | | (56.7) | | — | | | (56.7) | |
| Net increase in amounts attributable to noncontrolling interest | — |
| — |
| — |
| — |
| — |
| — |
| (2.3 | ) | (2.3 | ) | Net increase in amounts attributable to noncontrolling interest | — | | — | | — | | — | | — | | — | | — | | 141.5 | | | 141.5 | |
| Acquisition of redeemable noncontrolling interest | — |
| — |
| 2.4 |
| — |
| — |
| — |
| — |
| 2.4 |
| |
| Balances at December 31, 2018 | 45,599,418 |
| $ | 0.5 |
| 1,057.3 |
| 3,095.7 |
| (5.8 | ) | (456.2 | ) | 43.0 |
| $ | 3,734.5 |
| |
| December 31, 2021 | | December 31, 2021 | 50,024,139 | | $ | 0.5 | | 2,053.7 | | 4,937.6 | | (5.2) | | (406.3) | | (395.4) | | 228.5 | | | $ | 6,413.4 | |
(1) AOCI: Accumulated other comprehensive income (loss)
(2) NCI: Noncontrolling interest
(3) Excludes net (loss) income attributable to redeemable noncontrolling interest of $(0.1) million, $(0.3) million and $0.1$0.2 million for the years ended December 31, 20172021, 2020 and 2016,2019, respectively.
See accompanying notes to Consolidated Financial Statements.
JONES LANG LASALLE INCORPORATED
CONSOLIDATED STATEMENTS OF CASH FLOWS |
| | | | | | | |
| | Year Ended December 31, |
| ($ in millions) | 2018 | 2017 | 2016 |
| Cash flows provided by operating activities: | | | |
| Net income | $ | 491.7 |
| 279.5 |
| 345.9 |
|
| Reconciliation of net income to net cash provided by operating activities: | |
| |
| |
|
| Depreciation and amortization | 186.1 |
| 167.2 |
| 141.8 |
|
| Equity earnings from real estate ventures | (32.8 | ) | (44.4 | ) | (33.8 | ) |
| Loss (gain) on the disposition of assets | (12.9 | ) | 3.5 |
| (10.3 | ) |
| Distributions of earnings from real estate ventures | 59.5 |
| 30.3 |
| 30.9 |
|
| Provision for loss on receivables and other assets | 18.8 |
| 26.3 |
| 21.3 |
|
| Amortization of stock-based compensation | 26.8 |
| 24.9 |
| 30.1 |
|
| (Gains) losses on mortgage servicing rights and derivatives | (1.2 | ) | 10.1 |
| (23.5 | ) |
| Accretion of interest and amortization of debt issuance costs | 4.9 |
| 6.2 |
| 7.8 |
|
| Other, net | (17.1 | ) | (20.7 | ) | 20.0 |
|
| Change in: | |
| |
| |
|
| Receivables | (229.5 | ) | (203.7 | ) | (238.8 | ) |
| Reimbursable receivables and reimbursable payables | (215.6 | ) | (34.5 | ) | (40.3 | ) |
| Prepaid expenses and other assets | (229.2 | ) | (114.5 | ) | (71.6 | ) |
| Deferred tax assets, net | (25.2 | ) | (44.0 | ) | 8.4 |
|
| Accounts payable and accrued liabilities | 372.4 |
| 435.7 |
| 24.7 |
|
| Accrued compensation | 207.4 |
| 276.8 |
| 10.0 |
|
| Net cash provided by operating activities | 604.1 |
| 798.7 |
| 222.6 |
|
| Cash flows used in investing activities: | |
| |
| |
| Net capital additions – property and equipment | (161.9 | ) | (151.4 | ) | (216.2 | ) |
| Acquisition of investment properties (less than wholly-owned) | (47.1 | ) | (2.3 | ) | (99.8 | ) |
| Proceeds from the sale of assets (less than wholly-owned) | 32.8 |
| — |
| 34.0 |
|
| Business acquisitions, net of cash acquired | (101.3 | ) | (18.7 | ) | (483.9 | ) |
| Capital contributions to real estate ventures | (58.8 | ) | (40.1 | ) | (96.4 | ) |
| Distributions of capital from real estate ventures | 51.9 |
| 44.7 |
| 58.3 |
|
| Other, net | 4.0 |
| (3.0 | ) | (1.5 | ) |
| Net cash used in investing activities | (280.4 | ) | (170.8 | ) | (805.5 | ) |
| Cash flows (used in) provided by financing activities: | |
| |
| |
| Proceeds from issuance of senior notes | — |
| 395.7 |
| — |
|
| Proceeds from borrowings under credit facility | 3,145.0 |
| 3,072.0 |
| 3,145.0 |
|
| Repayments of borrowings under credit facility | (3,145.0 | ) | (3,997.0 | ) | (2,456.0 | ) |
| Payments of deferred business acquisition obligations and earn-outs | (57.1 | ) | (47.0 | ) | (53.9 | ) |
| Shares repurchased for payment of employee taxes on stock awards | (12.4 | ) | (6.6 | ) | (7.0 | ) |
| Common stock issued under compensation plans including tax benefit | 2.9 |
| 3.6 |
| 2.8 |
|
| Payment of dividends | (37.8 | ) | (33.1 | ) | (29.4 | ) |
| Noncontrolling interest contributions, net | 3.6 |
| 7.5 |
| 11.3 |
|
| Other, net | (40.5 | ) | (18.6 | ) | 23.6 |
|
| Net cash (used in) provided by financing activities | (141.3 | ) | (623.5 | ) | 636.4 |
|
| Effect of currency exchange rate changes on cash and cash equivalents | (19.9 | ) | 13.3 |
| (7.0 | ) |
| Net change in cash and cash equivalents | 162.5 |
| 17.7 |
| 46.5 |
|
| Cash and cash equivalents, beginning of the year | 471.7 |
| 454.0 |
| 407.5 |
|
| Cash and cash equivalents, end of the year | $ | 634.2 |
| 471.7 |
| 454.0 |
|
| Supplemental disclosure of cash flow information: |
|
|
|
|
|
|
| Restricted cash, end of the year | $ | 153.3 |
| 203.7 |
| 195.5 |
|
| Cash paid during the year for: | |
| |
| |
| Interest | $ | 49.2 |
| 47.6 |
| 34.8 |
|
| Income taxes, net of refunds | 153.4 |
| 144.7 |
| 143.6 |
|
| Non-cash activities: | |
| |
| |
|
| Business acquisitions, contingent consideration | $ | 11.6 |
| 11.5 |
| 103.3 |
|
| Capital leases | 3.7 |
| 4.1 |
| 9.8 |
|
| Deconsolidation of investment properties (less than wholly-owned) | — |
| — |
| 63.4 |
|
| Deferred business acquisition obligations | 3.9 |
| 1.8 |
| 62.7 |
|
| Deconsolidation of noncontrolling interest and related debt | — |
| — |
| 65.2 |
|
| | | | | | | | | | | |
| Year Ended December 31, |
| (in millions) | 2021 | 2020 | 2019 |
| Cash flows from operating activities: | | | |
| Net income | $ | 959.3 | | 422.7 | | 537.9 | |
| Reconciliation of net income to net cash provided by operating activities: | | | |
| Depreciation and amortization | 217.5 | | 226.4 | | 202.4 | |
| Equity earnings | (209.4) | | (8.0) | | (36.3) | |
| Net (gain) loss on the disposition of assets | (10.9) | | 1.2 | | 0.9 | |
| Distributions of earnings from real estate ventures | 28.6 | | 11.7 | | 21.0 | |
| Provision for loss on receivables and other assets | 12.1 | | 45.6 | | 30.8 | |
| Amortization of stock-based compensation | 96.4 | | 83.8 | | 74.2 | |
| Net non-cash mortgage servicing rights and mortgage banking derivative activity | (59.3) | | (66.6) | | (21.2) | |
| Accretion of interest and amortization of debt issuance costs | 4.4 | | 5.1 | | 5.3 | |
| Other, net | (14.0) | | (27.1) | | 11.3 | |
| Change in: | | | |
| Receivables | (402.0) | | 414.3 | | (330.0) | |
| Reimbursable receivables and reimbursable payables | (82.4) | | 122.2 | | 26.2 | |
| Prepaid expenses and other assets | (232.1) | | (32.9) | | (110.0) | |
| Deferred tax assets, net | (0.4) | | (37.1) | | (18.7) | |
| | | |
| Accounts payable and accrued liabilities | (11.6) | | 177.1 | | (64.7) | |
| Accrued compensation | 676.2 | | (223.7) | | 154.7 | |
| Net cash provided by operating activities | 972.4 | | 1,114.7 | | 483.8 | |
| Cash flows from investing activities: | | | |
| Net capital additions – property and equipment | (175.9) | | (149.4) | | (187.8) | |
| Net investment asset activity (less than wholly-owned) | (70.9) | | 1.0 | | (79.2) | |
| Business acquisitions, net of cash acquired | (416.8) | | — | | (801.3) | |
| Capital contributions to real estate ventures | (181.1) | | (80.3) | | (137.7) | |
| Distributions of capital from real estate ventures | 74.0 | | 41.5 | | 113.8 | |
| Other, net | (35.1) | | 16.6 | | 42.5 | |
| Net cash used in investing activities | (805.8) | | (170.6) | | (1,049.7) | |
| Cash flows from financing activities: | | | |
| | | |
| Proceeds from borrowings under credit facility | 5,094.0 | | 5,217.0 | | 5,864.0 | |
| Repayments of borrowings under credit facility | (4,944.0) | | (5,742.0) | | (5,339.0) | |
| Net proceeds from (repayments of) short-term borrowings | 91.8 | | (64.3) | | 86.8 | |
| Payments of deferred business acquisition obligations and earn-outs | (63.7) | | (44.4) | | (77.3) | |
| Shares repurchased for payment of employee taxes on stock awards | (52.5) | | (23.5) | | (13.6) | |
| Repurchase of common stock | (343.3) | | (100.0) | | — | |
| | | |
| | | |
| Payment of dividends | — | | — | | (42.7) | |
| Noncontrolling interest contributions (distributions), net | 19.0 | | (0.9) | | 40.6 | |
| Other, net | 54.9 | | (13.1) | | 65.8 | |
| Net cash (used in) provided by financing activities | (143.8) | | (771.2) | | 584.6 | |
| Effect of currency exchange rate changes on cash, cash equivalents and restricted cash | (21.0) | | 14.8 | | (0.8) | |
| Net change in cash, cash equivalents and restricted cash | 1.8 | | 187.7 | | 17.9 | |
| Cash, cash equivalents and restricted cash, beginning of the year | 839.8 | | 652.1 | | 634.2 | |
| Cash, cash equivalents and restricted cash, end of the year | $ | 841.6 | | 839.8 | | 652.1 | |
| Supplemental disclosure of cash flow information: | | | |
| Restricted cash, beginning of the year | $ | 265.5 | | 200.2 | | 153.3 | |
| Restricted cash, end of the year | 247.9 | | 265.5 | | 200.2 | |
| Cash paid during the year for: | | | |
| Interest | $ | 38.8 | | 50.2 | | 58.5 | |
| Income taxes, net of refunds | 262.5 | | 138.5 | | 280.8 | |
| Operating leases | 196.7 | | 191.4 | | 171.2 | |
| Non-cash activities: | | | |
| Business acquisitions (including contingent consideration) | $ | 68.6 | | — | | 846.1 | |
| Deferred business acquisition obligations | 10.0 | | — | | 17.0 | |
| Non-cash consideration received for disposition | 23.9 | | — | | — | |
| | | |
| | | |
| | | |
See accompanying notes to Consolidated Financial Statements.
JONES LANG LASALLE INCORPORATED
NOTES TO CONSOLIDATED FINANCIAL STATEMENTS
1.ORGANIZATION
Jones Lang LaSalle Incorporated ("Jones Lang LaSalle," which we may refer to as "JLL," "we," "us," "our," or the "Company") was incorporated in 1997. We have corporate offices worldwide and over 90,00098,000 employees, including approximately 42,20044,500 employees whose costs are reimbursed by our clients. We provide comprehensive integrated real estate and investment management expertise on a local, regional and global level to owner, occupier and investor clients. We are an industry leader in property and corporate facility management services, with a managed portfolio of approximately 4.65.4 billion square feet worldwide as of December 31, 2018.2021. LaSalle Investment Management ("LaSalle") is one of the world's largest and most diversified real estate investment management firms, with approximately $60.5$76.6 billion of assets under management (unaudited) as of December 31, 2018.2021.
The following table shows the revenue for the major product categories into which we group theseour services.
| | | | | | | | | | Year Ended December 31, |
| | Year Ended December 31, | |
| ($ in millions) | 2018 | 2017 | 2016 | |
| (in millions) | | (in millions) | 2021 | 2020 | 2019 |
| Real Estate Services: | | | Real Estate Services: | |
| Leasing | $ | 2,372.1 |
| 2,051.9 |
| 1,798.4 |
| Leasing | $ | 2,794.0 | | 1,884.2 | | 2,524.0 | |
| Capital Markets | 1,145.4 |
| 1,149.4 |
| 980.1 |
| Capital Markets | 2,193.5 | | 1,407.4 | | 1,542.2 | |
| Property & Facility Management | 8,782.8 |
| 7,821.3 |
| 7,136.5 |
| Property & Facility Management | 10,222.7 | | 9,485.4 | | 9,364.7 | |
| Project & Development Services | 2,669.0 |
| 2,344.5 |
| 2,070.3 |
| Project & Development Services | 2,684.9 | | 2,530.1 | | 3,121.5 | |
| Advisory, Consulting and Other | 815.2 |
| 730.3 |
| 597.8 |
| Advisory, Consulting and Other | 971.8 | | 861.0 | | 904.7 | |
| LaSalle | 533.9 |
| 355.8 |
| 408.1 |
| LaSalle | 500.1 | | 421.8 | | 526.1 | |
| Total revenue | $ | 16,318.4 |
| 14,453.2 |
| 12,991.2 |
| Total revenue | $ | 19,367.0 | | 16,589.9 | | 17,983.2 | |
We work for a broad range of clients representing a wide variety of industries in markets throughout the world. Our clients vary greatly in size and include for-profit and not-for-profit entities of all kinds, public-private partnerships and governmental (public sector) entities looking to outsource real estate services.entities. We provide real estate investment management services on a global basis for both public and private assets through LaSalle. Our integrated global business model, industry-leading research capabilities, client relationship management focus, consistent worldwide service delivery and strong brand are attributes that enhance our services.
| |
2. | SUMMARY OF SIGNIFICANT ACCOUNTING POLICIES |
2.SUMMARY OF SIGNIFICANT ACCOUNTING POLICIES
Principles of Consolidation
Our Consolidated Financial Statements have been prepared in conformity with accounting principles generally accepted in the United States of America ("U.S. GAAP") and include the accounts of JLL and its majority-owned and controlled subsidiaries. Intercompany balances and transactions have been eliminated. Investments in real estate ventures over which we exercise significant influence, but do not control, are accounted for either at fair value or under the equity method.
When applying principles of consolidation, we begin by determining whether an investee entity is a variable interest entity ("VIE") or a voting interest entity. U.S. GAAP draws a distinction between voting interest entities, which are embodied by common and traditional corporate and certain partnership structures, and VIEs, broadly defined as entities for which control is achieved through means other than voting rights. For voting interest entities, the interest holder with control through majority ownership and majority voting rights consolidates the entity. For VIEs, determination of the "primary beneficiary" dictates the accounting treatment. We identify the primary beneficiary of a VIE as the enterprise that hashaving both (i) the power to direct the activities of the VIE that most significantly impact the entity's economic performance and (ii) the obligation to absorb losses or receive benefits of the VIE that could potentially be significant to the VIE. We perform the primary beneficiary analysis as of the inception of our investment and upon the occurrence of a reconsideration event. When we determine we are the primary beneficiary of a VIE, we consolidate the VIE; when we determine we are not the primary beneficiary of the VIE, we account for our investment in the VIE at fair value or under the equity method, based upon an election made at the time of investment.
Our determination of the appropriate accounting method to apply for unconsolidated investments is based on the level of influence we have in the underlying entity. When we have an asset advisory contract with a real estate limited partnership in which we also hold an ownership interest, the combination of our limited partner interest and the advisory agreement generally provides us with significant influence over such real estate limited partnership. Accordingly, we account for such investments either at fair value or under the equity method. We eliminate transactions with such subsidiaries to the extent of our ownership in such subsidiaries.
For less-than-wholly-owned consolidated subsidiaries, noncontrolling interest is the portion of equity not attributable, directly or indirectly, to JLL. We evaluate whether noncontrolling interests possess any redemption features outside of our control. If such features exist, the noncontrolling interests are presented outside of permanent equity on the Consolidated Balance Sheets within Redeemable noncontrolling interest. Redeemable noncontrolling interests are adjusted to the greater of their fair value or carrying value as of each balance sheet date through a charge to Additional paid-in capital, if necessary. If classification and presentation outside of permanent equity is not considered necessary, noncontrolling interests are presented as a component of permanent equity on the Consolidated Balance Sheets. We report revenues, expenses and net income (loss) from less-than-wholly-owned consolidated subsidiaries at the consolidated amounts, including both the amounts attributable to the Company and noncontrolling interests; the income or loss attributable to the noncontrolling interest holders is reflected in Net income attributable to noncontrolling interest on the Consolidated Statements of Comprehensive Income.
Changes in amounts attributable tonon-redeemable noncontrolling interests are reflected in the Consolidated Statements of Changes in Equity. Changes in amounts attributable to redeemable noncontrolling interests are presented in the following table.
|
| | | |
| ($ in millions) | |
| Redeemable noncontrolling interests as of December 31, 2015 | $ | 11.1 |
|
Acquisition of redeemable noncontrolling interest (1) | (3.6 | ) |
| Net income | 0.1 |
|
| Impact of exchange rate movements | (0.8 | ) |
| Redeemable noncontrolling interests as of December 31, 2016 | 6.8 |
|
Acquisition of redeemable noncontrolling interest (1) | (3.5 | ) |
| Net loss | (0.1 | ) |
| Impact of exchange rate movements | 0.6 |
|
| Redeemable noncontrolling interests as of December 31, 2017 | 3.8 |
|
Acquisition of redeemable noncontrolling interest (1) | (3.8 | ) |
| Redeemable noncontrolling interests as of December 31, 2018 | $ | — |
|
| | | | | |
| (in millions) | |
| Redeemable noncontrolling interests as of December 31, 2018 | $ | — | |
Business acquisition (1) | 8.4 | |
| Net income | 0.2 | |
| |
| Redeemable noncontrolling interests as of December 31, 2019 | 8.6 | |
| |
| Net loss | (0.3) | |
| Distribution to redeemable noncontrolling interest | (0.5) | |
| Redeemable noncontrolling interests as December 31, 2020 | 7.8 | |
| |
| Net loss | (0.1) | |
| |
| Other | 0.1 | |
| Redeemable noncontrolling interests as of December 31, 2021 | $ | 7.8 | |
(1) Reflects the ownership interests retained by the seller associated with our redemption of a portion of the redeemable noncontrolling interest related to our 20142019 acquisition of Tenzing AB and includes $2.3 million, $1.1 million, and $0.8 million representing the difference between the redemption value and the carrying value of the acquired interest as of December 31, 2018, 2017, and 2016, respectively.Latitude Real Estate Investors.
Use of Estimates
The preparation of the Consolidated Financial Statements in conformity with U.S. GAAP requires us to make estimates and assumptions about future events that affect the reported amounts of assets and liabilities, the disclosure of contingent assets and liabilities, as of the dates of the financial statements, and the reported amounts of revenue and expenses during the reporting periods. Such estimates include the value and allocation of purchase consideration, valuation of accounts receivable, reimbursableReimbursable receivables, warehouseWarehouse receivables, investments in real estate ventures, goodwill,Investments, Goodwill, intangible assets, derivative financial instruments, other long-lived assets, earn-out liabilities, legal contingencies, assumptions used in the calculation of income taxes, incentive compensation, self-insurance program liabilities, and retirement and other post-employment benefits, among others.
These estimates and assumptions are based on management's best estimate and judgment. We evaluate these estimates and assumptions on an ongoing basis using historical experience and other factors, including the current economic environment, which we believe to be reasonable under the circumstances. We adjust such estimates and assumptions when facts and circumstances dictate. Market factors, such as illiquid credit markets, volatile equity markets and foreign currency exchange rate fluctuations can increase the uncertainty in such estimates and assumptions. Because future events and their effects cannot be determined with precision, actual results could differ significantly from these estimates. Changes in those estimates
resulting from continuing changes in the economic environment will be reflected in the financial statements in future periods. Although actual amounts may differ from such estimated amounts, we believe such differences are not likely to be material.
Revenue Recognition
We earn revenue from the following:
•Leasing;
•Capital Markets;
•Property & Facility Management;
•Project & Development Services;
•Advisory, Consulting and Other; and
•LaSalle.
Leasing
Leasing revenue is earned from brokerage commissions as we represent tenants and/or landlords in connection with real estate leases. Our performance obligation is to facilitate the execution of a lease agreement, which is satisfied at a point in time, upon lease execution. Generally, we are either entitled to the full consideration upon lease execution or in part upon lease execution with the remainder upon the occurrence of a future event outside of our control (e.g. tenant occupancy, lease commencement, or rent commencement). The majority of the events that preclude our entitlement to the full consideration upon lease execution are considered to be “normal course of business” and, therefore, do not result in a constraint upon the recognition of revenue. In the infrequent instance our fee entitlement in a contract with a customer is predicated on the occurrence of a future event(s) uncertain of occurring, we constrain the recognition of revenue until the uncertainty is resolved or the future event occurs. Generally, less than 5% of our Leasing revenue recognized in a period had previously been constrained.
Capital Markets
Capital Markets provides brokerage and other services for capital transactions, such as real estate sales or loan originations and refinancings.refinancing. Our performance obligation is to facilitate the execution of capital transactions, and we are generally entitled to the full consideration at the point in time upon which our performance obligation is satisfied, at which time we recognize revenue. Our mortgage banking and servicing operations - such as activities related to mortgage servicing rights ("MSR" or "MSRs"), loan origination fees and servicing income - are excluded from the scope of ASCAccounting Standards Codification ("ASC") Topic 606, Revenue from Contracts with Customers, ("ASC Topic 606"). Such out-of-scope revenue was $135.8 million, $126.9 million,included entirely within Americas Capital Markets and $104.6 million for the years ended December 31, 2018, 2017, and 2016, respectively.is presented below.
| | | | | | | | | | | |
| Year Ended December 31, |
| (in millions) | 2021 | 2020 | 2019 |
| Revenue excluded from scope of ASC Topic 606 | $ | 337.1 | | 305.3 | | 204.6 | |
Property & Facility Management
Property Management provides on-site day-to-day real estate management services for owners of office, industrial, retail, multifamily residential and various other types of properties, representing a series of daily performance obligations delivered over time. Pricing is generally in the form of a monthly management fee based upon property-level cash receipts, square footage under management or some other variable metric.
Although we are principal in limited situations, we generally act as agent on behalf of our Property Management clients in relation to third-party vendors and subcontractors engaged to deliver operational services to our clients' properties. In these situations, we arrange, but do not control, the services provided by third-party vendors and subcontractors prior to the transfer of the services to the client. As a result, the costs incurred on behalf of clients, along with the corresponding revenue, are presented net on our Consolidated Statements of Comprehensive Income.
Facility Management primarily provides comprehensive, on-site day-to-day real estate management services to corporations and institutions across a broad range of industries that outsource the management of the real estate they occupy, representing a series of daily performance obligations delivered over time. Pricing generally includes a management fee and, in many instances, an incentive fee or other form of variable consideration.
Although we may act as agent on behalf of our clients with respect to certain mandates, we generally act as principal for our Facility Management contracts with respect to third-party vendors and subcontractors engaged to deliver operational services to our clients' facilities. In these situations, we control the services provided by such third-party vendors and subcontractors prior to the transfer of the services to the client. As a result, the costs incurred on behalf of our clients, along with the corresponding reimbursement revenue, are presented gross on our Consolidated Statements of Comprehensive Income.
Project & Development Services
Project & Development Services provides short-term construction-related services ranging from general contracting to project management for owners and occupiers of real estate. Depending on the terms of our engagement, our performance obligation is either to arrange for the completion of a project or to assume responsibility for completing a project on behalf of a client. Our obligations to clients are satisfied over time due to the continuous transfer of control of the underlying asset. Therefore, we recognize revenue over time, generally using input measures (e.g. to-date costs incurred relative to total estimated costs at completion). Typically, we are entitled to consideration at distinct milestones over the term of an engagement.
For certain contracts where we assume responsibility for completing a project, we control the services provided by third-party vendors and subcontractors prior to transfer of the assets to the client. In these situations, the costs incurred on behalf of clients, along with the associated reimbursement revenue are presented gross on our Consolidated Statements of Comprehensive Income. For situations in which we act as agent on behalf of clients, costs incurred and the associated revenue are presented net on our Consolidated Statements of Comprehensive Income.
Advisory, Consulting and Other
Advisory, Consulting and Other includes a variety of different service offerings, whereby our performance obligation is to provide services as specified in the contract. Occasionally, our entitlement to consideration is predicated on the occurrence of an event such as the delivery of a report for which client acceptance is required. However, except for event-driven point-in-time transactions, the majority of services provided within this service line are delivered over time due to the continuous transfer of control to our clients.
LaSalle
LaSalle provides real estate investment management services to clients and generally earns consideration in the form of advisory fees, transaction fees and incentive fees. Typically, our performance obligation is to manage clients’ capital for a specified period of time and is delivered as a series of daily performance obligations over time. Revenue recognition for transaction and incentive fees is generally constrained until all contingencies have cleared due to the possibility of a significant reversal until completion of the events necessary to realize the associated consideration. Substantially all incentive fees recognized as revenue were previously constrained.
Contract Costs
Expenses, primarily employee commissions, incurred on leasing and capital markets transactions represent substantially all our incremental costs to obtain revenue contracts. We apply the applicable practical expedient offered by ASC Topic 606 when the amortization period is one year or less and, therefore, recognize these costs as an operating expense as they are incurred.
We also incur costs to fulfill revenue contracts, primarily related to transition costs incurred prior to delivering Property & Facility Management services. These costs are not expensed as incurred but are deferred and amortized as an operating expense over the expected life of the contract in accordance with the transfer of related services. These deferred costs are assessed periodically for impairment.
Contract Assets and Liabilities
Contract assets include amounts recognized as revenue for which we are not yet entitled to payment for reasons other than the passage of time, but that do not constrain revenue recognition. AsWe include Contract assets in our reserving process and assess the risk of December 31, 2018 and December 31, 2017,loss similar to our methodology for Trade receivables, since Contract assets are reclassified to Trade receivables when we had $396.2 million and $236.0 millionbecome entitled to payment. Accordingly, a reserve is applied upon recognition of the contract asset.
Contract liabilities include advance payments we have received which relate to performance obligations we have not yet satisfied. Our contract assets, respectively, whichnet of allowance, are included in Short-term contract assets and Other assets on the Consolidated Balance Sheets.
Contract Liabilities
Contract liabilities include advance payments related to performance obligations that have not yet been satisfied. As of December 31, 2018 and December 31, 2017, we had $98.9 million and $73.7 million ofour contract liabilities respectively, which are included in Short-term contract liabilities and deferred income on our Consolidated Balance Sheets. The majority of contract liabilities are recognized as revenue within 90 days.
Detail of our contract assets and liabilities is presented below.
| | | | | | | | |
| (in millions) | December 31, 2021 | December 31, 2020 |
| Contract assets, gross | $ | 438.7 | | 347.8 | |
| Allowance for contract assets | (2.8) | | (2.1) | |
| Contract assets, net | $ | 435.9 | | 345.7 | |
| | |
| Contract liabilities | $ | 128.9 | | 111.0 | |
Deferred Income
Deferred income includes payments received from customers for which we have satisfied our performance obligations but are not yet able to recognize the related revenue because of contractual requirements.
Remaining Performance Obligations
Remaining performance obligations represent the aggregate transaction price for contracts where our performance obligations have not yet been satisfied. As of December 31, 2018,2021, the aggregate amount of transaction price allocated to remaining performance obligations represented approximatelyless than 5% of our total revenue. In accordance with ASC Topic 606, excluded from the aforementioned remaining performance obligations are (i) amounts attributable to contracts expected to be completed within 12 months and (ii) variable consideration for services performed as a series of daily performance obligations, such as property and facility management contracts and LaSalle advisory contracts. Contracts within these businesses represent a significant portion of our contracts with customers not expected to be completed within 12 months.
Cash and Cash Equivalents
We consider all highly-liquid investments purchased with maturities of less than three months to be cash equivalents. The carrying amount of cash equivalents approximates fair value due to the short-term maturity of these investments.
Financing Receivables
We account for Trade receivables, Notes and other receivables, Long-term receivables, Reimbursable receivables, and Warehouse receivables as financing receivables.
Trade Receivables
Pursuant to contractual arrangements, Trade receivables, net of allowances include unbilled amounts of $531.4$600.6 million and $505.6$460.1 million as of December 31, 20182021 and 2017,2020, respectively.
We estimate the allowance necessary to provide for uncollectible accounts receivable. The estimate includes specific amounts for which payment has become unlikely. We also base this estimate on historical experience combined with a review of current developments and client credit quality. The process by which we calculate the allowance begins with the individual business units where specific accounts for which collectability is uncertain are identified and reserved as part of an overall reserve that is formulaic and driven by the age profile of the receivables and our historical experience. We then review these allowances on a quarterly basis to ensure they are appropriate. After all collection efforts have been exhausted by management, the outstanding balance considered not collectible is written off against the allowance.
The following table details the changes in the allowance for uncollectible receivables.
| | | | | | | | | | | |
| (in millions) | 2021 | 2020 | 2019 |
Allowance as of January 1,(1) | $ | 66.5 | | 71.7 | | 52.0 | |
| Charged to income | 25.5 | | 24.3 | | 30.8 | |
| Write-off of uncollectible receivables | (22.1) | | (29.5) | | (13.8) | |
| | | |
| Impact of exchange rate movements and other | (2.3) | | — | | (0.9) | |
| Allowance as of December 31, | $ | 67.6 | | 66.5 | | 68.1 | |
|
| | | | | | | |
| ($ in millions) | 2018 | 2017 | 2016 |
| Allowance as of January 1, | $ | 51.3 |
| 37.1 |
| 23.2 |
|
| Charged to income | 18.8 |
| 26.3 |
| 21.3 |
|
| Write-off of uncollectible receivables | (13.9 | ) | (14.2 | ) | (7.6 | ) |
| Reserves acquired from acquisitions | — |
| — |
| 0.3 |
|
| Impact of exchange rate movements and other | (4.2 | ) | 2.1 |
| (0.1 | ) |
| Allowance as of December 31, | $ | 52.0 |
| 51.3 |
| 37.1 |
|
(1) January 1, 2020 includes $3.6 million adjustment due to the adoption of ASC Topic 326.
Notes and Other Receivables and Long-Term Receivables
We make ongoing assessments of the collectability of outstanding Notes and other receivables and Long-term receivables, considering both objective and subjective factors such as the ageaging profile of outstanding balances, the contractual terms of repayment, and credit quality. Aspects of credit quality considered in our assessments of collectability include historical experience, current developments and the status ofexpected economic conditions, and our broader business relationship with the obligor. We record an allowance against the outstanding balance when our assessments result in a determination thatdetermine payment has become unlikely. After all collection efforts have been exhausted by management, the outstanding balance considered uncollectible is written off against the reserve. Historically, credit quality deterioration to the point of impairment or non-performance in our Notes and other receivables and Long-term receivables has been limited and has not had a material impact on the Consolidated Financial Statements.
Reimbursable Receivables
We recognize Reimbursable receivables for costs incurred on behalf of clients, primarily while performing Property & Facility Management services. These costs include direct reimbursements, primarily payroll and third-party vendor and subcontractor costs. As our clients are contractually obligated to reimburse us for these costs, we onlyWe record an allowance based on specific identification of an uncollectible reimbursable receivable.receivable, considering current and future economic conditions as well as client credit quality. Historically, we have not experienced any material collection issues and, as such, have not applied a formulaic reserve to these receivables. Reimbursable receivables relate to our Reimbursable payables, which are typically satisfied on a pay-when-paid basis.
Warehouse Receivables
We classify Warehouse receivables as held-for-sale as they represent originated mortgage loans for which we have simultaneously executed commitments to sell to a third-party investor, primarily the Government NationalFederal Home Loan Mortgage AssociationCorporation (Ginnie MaeFreddie Mac), the Federal National Mortgage Association (Fannie Mae), and the Federal Home LoanGovernment National Mortgage CorporationAssociation (Freddie MacGinnie Mae). These loans (also referred to as "Warehouse receivables") are funded directly to borrowers by our warehouse facilities and are generally repaid within a 45-day period after origination when the third-party investor buys the loan(s); upon surrender of control over each loan, we account for the transfer as a sale. Warehouse receivables are measured and reported at fair value in accordance with our entity-wide election of the fair value option. As such, increases or decreases in the fair value of loans (originated after this election) are recognized as Revenue on the Consolidated Statements of Comprehensive Income. Historically, we have not experienced credit quality deterioration or uncollectible balances considered uncollectible with respect to our Warehouse receivables.
We generally retain certain servicing rights upon sale of the mortgage loan (refer to the Mortgage Servicing Rights section below). We typically retain no exposure for credit losses on loans subsequent to sale, except for loans under Fannie Mae's Delegated Underwriting and Servicing ("DUS") program. See the following section, Financial Guarantees, as well as Note 13, Commitments and Contingencies for additional information on the risk of loss retained related to DUS program loans.
Contractually specified servicing fees related to sold warehouse receivables were $49.6$101.8 million, $43.3$80.0 million and $37.0$63.0 million for the years ended December 31, 2018, 2017,2021, 2020, and 2016,2019, respectively, and are included in Revenue on the Consolidated Statements of Comprehensive Income.
Financial Guarantees
Certain loans we originate and sell under the Fannie Mae DUS program retain a percentage of the risk of loss. This loss-sharing aspect of the program represents an off-balance sheet credit exposure, and we have established a contingent reserve ("loan loss guarantee reserve") for this risk in accordance with ASC Topic 326. To estimate the reserve, we use a model that analyzes historical losses, current and expected economic conditions, and reasonable and supportable forecasts. The model also considers specific details of the underlying property used as collateral, such as occupancy and financial performance. The loan loss guarantee reserve is calculated on an individual loan level. As of December 31, 2021 and 2020, the loan loss guarantee reserve was $22.9 million and $36.7 million, respectively, and was included within Other liabilities on the Consolidated Balance Sheets. The balance as of December 31, 2021 reflects a notable decrease from the prior year as a result of improving economic conditions and projections over the course of 2021.
For all DUS program loans with loss-sharing obligations, we record a non-contingent liability equal to the estimated fair value of the guarantee obligations undertaken upon sale of the loan, which reduces our gain on sale of the loan. Subsequently, this liability is amortized over the estimated life of the loan and recognized as Revenue on the Consolidated Statements of Comprehensive Income. The loss-sharing guarantee obligation (in accordance with ASC Topic 460, Guarantees) is separate from the loan loss guarantee reserve discussed above. As of December 31, 2021 and 2020, loss-sharing guarantee obligations were $24.6 million and $22.1 million, respectively, and was included in Other liabilities on the Consolidated Balance Sheets.
See Note 13, Commitments and Contingencies, for further information on the DUS program.
Mortgage Servicing Rights
We generally retain certain servicing rights in connection with the origination and sale of Warehouse receivables. We initially record mortgage servicing rights ("MSR" or "MSRs")MSRs based on the fair value of these rights on the date the loans are sold, which could result in net gains which we recognize as Revenue on the Consolidated Statements of Comprehensive Income. As of December 31, 20182021 and 2017,2020, we had $193.8$478.7 million and $186.7$424.3 million, respectively, of MSRs carried at the lower of amortized cost or fair value in Identified intangibles on the Consolidated Balance Sheets.
We amortize servicing rights over the estimated period that net servicing income is projected to be received. In addition, we evaluate MSR intangible assets for impairment on a quarterly basis, or more frequently if circumstances or events indicate a change in fair value. Other than write-offs due to prepayments of sold Warehouse receivables for which we retained the servicing rights, (generally during only the last six months of loan term given the punitive contractual terms of any earlier prepayment), there have been no significant instances of impairment during the three-year period ended December 31, 2018.2021. However, an increase in loan prepayment activity or deterioration in the credit quality of borrowers could result in a decrease to our MSR balance. MSRs do not actively trade in an open market with readily available observable prices; therefore, if necessary, the fair value of these rights would beare determined in part based on certain assumptions and judgments that are unobservable
within the fair value hierarchy, including the estimation of the present value of future cash flows to be realized from servicing the underlying mortgages. The estimated fair value of MSRs was $246.8$561.5 million and $220.1$459.6 million as of December 31, 20182021 and 2017,2020, respectively.
See Note 4, Business Combinations, Goodwill and Other IntangiblesIntangible Assets for additional information on MSRs.
Restricted Cash
Restricted cash primarily consists of cash amounts set aside to satisfy legal or contractual requirements arising in the normal course of business. We are restricted in our ability to withdraw these funds other than for their specified use. Restricted cash was included in Prepaid and other current assets on the Consolidated Balance Sheets.
Property and Equipment
We record property and equipment at cost and depreciate these assets over their relevant useful lives. We capitalize certain direct costs relating to internal-use software development when incurred during the application development phase.
We evaluate property and equipment for impairment whenever events or circumstances indicate the carrying value of an asset group may not be recoverable. We record an impairment loss to the extent the carrying value exceeds the estimated fair value. We did not recognize any significant impairment losses related to property and equipment during the three years ended December 31, 2018.2021.
We calculate depreciation on property and equipment for financial reporting purposes by using the straight-line method based on the estimated useful lives of our assets. Depreciation expense related to property and equipment for the years ended December 31, 2018, 20172021, 2020 and 20162019 was $156.5$164.2 million, $136.0$169.3 million, and $117.7$157.6 million, respectively. The following table shows the gross value of major asset categories and the standard depreciable lives, as of December 31, 2018,2021, for each of these asset categories.
| | | | December 31, | | | December 31, | |
| ($ in millions) | 2018 | 2017 | Depreciable Life | ($ in millions) | 2021 | 2020 | Depreciable Life |
| Furniture, fixtures and equipment | $ | 98.7 |
| 96.7 |
| 3 to 13 years | Furniture, fixtures and equipment | $ | 132.5 | | 127.9 | | 3 to 13 years |
| Computer equipment and software | 683.6 |
| 635.1 |
| 2.5 to 10 years | Computer equipment and software | 886.9 | | 829.8 | | 2 to 7 years |
| Leasehold improvements | 274.0 |
| 260.6 |
| 1 to 10 years | Leasehold improvements | 396.0 | | 352.4 | | 1 to 15 years |
Other (1) | 99.9 |
| 66.4 |
| 1 to 30 years | Other (1) | 233.6 | | 160.0 | | 2 to 30 years |
| Total | 1,156.2 |
| 1,058.8 |
| | Total | 1,649.0 | | 1,470.1 | | |
| Less: Accumulated depreciation | 588.3 |
| 514.9 |
| | Less: Accumulated depreciation | 909.1 | | 806.2 | | |
| Net property and equipment | $ | 567.9 |
| 543.9 |
| | Net property and equipment | $ | 740.0 | | 663.9 | | |
(1) Other includes certain assets, such as land, which are not depreciated.
Business Combinations, Goodwill and Other Intangible Assets
We have historically grown, in part, through a series of acquisitions. Consistent with the services nature of the majority of businesses we have acquired, we have recognized significant goodwill and intangible assets resulting from these acquisitions. Intangible assets are initially recorded at their respective acquisition date fair values and amortized on a straight-line basis over their estimated useful lives. They primarily represent customer relationships, management contracts and customer backlogs acquired as part of our acquisitions.
We evaluate goodwill for impairment at least annually. We define our four reporting units as the three geographic regions of RES:RES (i) Americas, (ii) Europe, Middle East and Africa ("EMEA") and (iii) Asia Pacific; and (iv) LaSalle.
We have considered qualitative and quantitative factors while performing our annual impairment test of goodwill (as of July 1, 2021) and determined it is not more-likely-than-not that the fair value of all our reporting units are less than their respective carrying values. In performing our assessments of all reporting units, we primarily considered (i) macroeconomic and industry trends, (ii) our overall financial performance, and nature of the key drivers thereof, during the year at both the reporting unit and consolidated reporting levels, (iii) near and longer-term forecasts of operating income and cash flows generated by our reporting units in relation to the carrying values of the net assets of each reporting unit, and (iv) our market capitalization in relation to the aggregate carrying value of our net assets.
In addition to our annual impairment evaluation, we evaluated whether events or circumstances have occurred in the period subsequent to our annual impairment testing and determined it is not more-likely-than-not that the fair value of all our reporting units are less than their respective carrying values. It is possible our determination that goodwill for a reporting unit is not impaired could change in the future if current economic or other conditions deteriorate. We will continue to monitor the relationship between our market capitalization and carrying value, as well as the ability of our reporting units to deliver current and projected earnings and cash flows sufficient to support the carrying values of the net assets of their respective businesses.
We evaluate our Identified intangibles for impairment annually or more frequently if other events or circumstances indicate the carrying value may be impaired.
See Note 4, Business Combinations, Goodwill and Other Intangibles,Intangible Assets, for additional information on business combinations, goodwill and other intangible assets.
Investments in Real Estate Ventures
We invest in certain ventures that primarily own and operate commercial real estate on a global basis across a wide array of sectors including retail, residential and office. Historically, these investments have primarily been co-investments in funds our LaSalle business establishes in the ordinary course of business for its clients. These investments take the form of equity ownership interests generally ranging from less than 1% to 10% of the respective ventures and, based upon investment-specific objectives, have generally included five to nine-year investment periods. Typically, our investments in real estate ventures are not redeemable until the earlier of the disposition of the underlying real estate investments or the end of the fund's life. When in place, such restrictions are a result of our role beyond that of a passive investor, which generally means an advisory or management responsibility on behalf of the other investors who are typically clients of our LaSalle business. We primarily account for these investments at fair value utilizing information provided by investees, however, as further discussed below, we report certain of our investments under the equity method.
ForIn addition to our LaSalle investments, JLL Technologies has strategic investments in property technology ("proptech") funds and early to mid-stage proptech companies to improve our strategic position within the real estate technology landscape, including investments through the JLL Spark Global Venture funds. We generally account for these investments at fair value. The fair value of these investments was $330.1 million and $69.9 million as of December 31, 2021, and 2020, respectively.
For limited partnerships in which we are a general partner, the entities are generally well-capitalized and grant the limited partners substantive participating rights, such as the right to replace the general partner without cause, to dissolve or liquidate the partnership, to approve the sale or refinancing of the principal partnership assets, or to approve the acquisition of principal partnership assets. We account for such general partner interests at fair value or under the equity method.
For limited partnerships in which we are a limited partner, management has concluded we do not have a controlling interest in these limited partnerships. When we have an asset advisory contract with the limited partnership, the combination of our limited partner interest and the advisory agreement generally provides us with significant influence over the real estate limited partnership venture. Accordingly, we account for such investments at fair value or under the equity method.
See "Principles of Consolidation" above for additional discussion of the accounting for our co-investments.
For investments in real estate ventures reported at fair value, we maintain an investment account that is increased or decreased each reporting period by the difference between the fair value of the investment and the carrying value as of the balance sheet date. These fair value adjustments are reflected as gains or losses on the Consolidated Statements of Comprehensive Income within Equity earnings from real estate ventures. Theearnings. To the extent applicable, we estimate fair value of theseour investments as ofusing the balance sheet date is generally determined using net asset value ("NAV") per share (or its equivalent), an unobservable input our investees provide. For JLL Technologies investments in proptech companies, we primarily estimate the fair value hierarchy, provided bybased on the investee. See "Principlesper-share pricing. Subsequent funding rounds or changes in the companies' business strategy/outlook are indicators of Consolidation" above for additional discussion of the accounting for our co-investments.a change in fair value.
For investments in real estate ventures accounted for under the equity method, we maintain an investment account that is (i) increased by contributions made and by our share of net income earned by the real estate ventures, and (ii) decreased by distributions received and by our share of net losses realized by the real estate ventures. Our share of each real estate venture's net income or loss, including gains and losses from capital transactions, is reflected on the Consolidated Statements of Comprehensive Income as Equity earnings from real estate ventures.
earnings. We evaluate our investments in real estate ventures accounted for under the equity method for other-than-temporary impairment on a quarterly basis, or as events or changes in circumstances warrant such an evaluation. Our evaluations consider the existence of impairment indicators in the underlying real estate assets that compose the majority of our investments. We base such evaluations, in regard to both the investment and the investment’s underlying asset levels, on regular updates to future cash flow models, our share of co-investment cash flows, and factors such as operational performance, market conditions, major tenancy matters, legal and environmental concerns, and our ability and intent to hold each investment. If an investment is considered other-than-temporarily impaired, we record the excess of the carrying value over the estimated fair value as an impairment charge.
Impairment charges to write down the carrying value of the real estate assets underlying our investments are generally based on the result of discounted cash flow models that primarily rely upon unobservable inputs to determine fair value. We recognize our proportionate share of such impairment within Equity earnings from real estate ventures on the Consolidated Statements of Comprehensive Income.
See NotesNote 5, Investments and Note 9, Fair Value Measurements for additional information on Investments in real estate ventures.Investments.
Stock-Based Compensation
Stock-based compensation in the form of restricted stock units ("RSUs") and performance stock units ("PSUs") areis an important element of our compensation programs. We determine the fair value of RSUs, subject only to service requirements, based on the closing market price of our common stock on the grant date. PSUs are subject to service requirements and performance measures. All PSUs contain one or more performance measures, including (i) performance conditions, (e.g. achievement againstsuch as a pre-defined target based on the Company’s cumulative earnings per share targets) and (ii) forover a multi-year period. For certain awards,executives there is an additional performance measure, a market condition, (e.g.based on total shareholder return performance("TSR") against a peer group).group. The number of shares that will be issued upon vesting of these PSUs can range from 0% to 150% of the target award, depending on the achievement of each performance condition. We determine the fair value of PSUs based on the (i) closing market price of our common stock on the grant date taking, into consideration(ii) the likelihood of achievingachievement probability for each performance condition, and (iii) the market condition valuation, as applicable, based on the output of Monte Carlo simulations. We periodically assess the achievement probability for performance conditions. As of December 31, 2021, approximately 8% of unvested shares were subject to a market condition.
Employees of a specific age, with a sum of age plus years of service with the Company which meets or exceeds 65, based on the terms of the Jones Lang LaSalle 20172019 Stock Award and Incentive Plan ("SAIP"), are eligible to be considered for receipt of retirement benefits upon departure from the Company. These award provisions trigger application of certain elements of ASC Topic 718, Compensation - Stock Compensation, whereby the recognitionrequire acceleration of compensation expense for restricted stock unit awards granted to employees meeting the age plus service criteria is accelerated such that all expense is recognized by the time these employees are considered retirement eligible.
We do not estimate forfeitures; instead, we recognize forfeitures in Compensation & benefits expense as they occur.
We also have a "noncompensatory" Employee Stock Purchase Plan ("ESPP") for U.S. employees and a Jones Lang LaSalle Savings Related Share Option Plan ("Save As You Earn" or "SAYE") for U.K. employees. The fair value of options granted under the SAYE plan are determined on the grant date and amortized over the associated vesting period.
See Note 6, Share-BasedStock-Based Compensation, for additional information on our stock-based compensation plans.
Income Taxes
We account for income taxes under the asset and liability method. We recognize deferred tax assets and liabilities for the expected future tax consequences of events that have been included in our financial statements or tax returns. Under this method, we determine deferred tax assets and liabilities based on the differences between the financial reporting and tax bases of assets and liabilities using enacted tax rates in effect for the year in which the differences are expected to reverse.
An increase or decrease in a deferred tax asset or liability that results from a change in circumstances, and that causes a change in our judgment about expected future tax consequences of events, would be included in the tax provision when the changes in circumstances and our judgment occurs. Deferred income taxes also reflect the impact of operating loss and tax credit carryforwards. A valuation allowance is established if we believe it is more-likely-than-not all or some portion of a deferred tax asset will not be realized. An increase or decrease in a valuation allowance that results from a change in circumstances, and that causes a change in our judgment about the ability to realize the related deferred tax asset, would be included in the tax provision when the changes in circumstances and our judgment occurs.
See Note 8, Income Taxes, for additional information on income taxes.
Derivatives and Hedging Activities
We do not enter into derivative financial instruments for trading or speculative purposes. However, in the normal course of business, we do use derivative financial instruments in the form of foreign currency forward contracts to manage our foreign currency exchange rate risk. We currently do not use hedge accounting for these contracts, which are marked-to-market each period with changes in unrealized gains or losses recognized in earnings and offset by foreign currency gains and losses on associated intercompany loans and other foreign currency balances. Gains and losses from the revaluation of these contracts are recognized as a component of Operating, administrative and other expense and are offset by the gains and losses recognized on the revaluation of intercompany loans and other foreign currency balances such that the impact to net income was not significant for the three years ended December 31, 2018.2021.
For presentation and disclosure, we net our exposure by counterparty for all counterparties subject to International Swaps and Derivatives Association Master Agreements.
We have considered the counterparty credit risk related to these forward foreign currency exchange contracts and do not deem any counterparty credit risk to be material as of December 31, 2018,2021, in part due to the short-term nature of these contracts.
In addition, certain loan commitments and forward sales commitments related to our Warehouse receivables meet the definition of a derivative and are recorded at fair value on the Consolidated Balance Sheets. The estimated fair value of loan commitments includes the fair value of the expected net cash flows associated with servicing of the loan, other net cash flows associated with origination and sale of the loan, and the effects of market interest rate movements. The estimated fair value of forward sale commitments includes the effects of market interest rate movements. Therefore, the effect of market interest rate movements on estimated fair value offset between the loan commitments and the forward sale commitments. Adjustments to fair value related to loan and forward sale commitments are included within Revenue on the Consolidated Statements of Comprehensive Income.
See Note 9, Fair Value Measurements, for additional information on derivative financial instruments.
Leases
Substantially all of our operating leases are related to office space we lease in various buildings for our own use. The terms of these non-cancelable operating leases typically require us to pay rent and a share of operating expenses and real estate taxes, generally with an inflation-based rent increase included. We also lease equipment under both operating and finance lease arrangements. Our lease agreements do not contain any material residual value guarantees or material restrictive covenants.
Operating lease right-of-use assets and operating lease liabilities are recognized based on the present value of the future minimum lease payments (e.g. rent) over the lease term beginning at the commencement date. The Operating lease right-of-use assets are adjusted for lease incentives, deferred rent, and initial direct costs, if incurred. Our leases generally do not include an implicit rate; therefore, we use an incremental borrowing rate based on information available at the lease commencement date in determining the present value of future minimum lease payments. The related lease expense is recognized on a straight-line basis over the lease term.
Finance leases are included in Property and equipment, net of accumulated depreciation, Short-term borrowings, and Other liabilities on our Consolidated Balance Sheets. Our finance leases do not represent a significant portion of our leasing activity.
See Note 11, Leases, for additional information on leases.
Foreign Currency Translation
We prepare the financial statements of our subsidiaries located outside the U.S. using local currency as the functional currency. The assets and liabilities of these subsidiaries are translated to U.S. dollars at the rates of exchange as of the balance sheet date with the resulting translation adjustments included as a separate component of equity on the Consolidated Balance Sheets (Accumulated other comprehensive loss) and on the Consolidated Statements of Comprehensive Income (Other comprehensive income-foreign currency translation adjustments).
See Note 15, Accumulated Other Comprehensive Income (Loss), for additional information on the components of Accumulated other comprehensive loss.
Income and expenses are translated at the average monthly rates of exchange. We include gains and losses from foreign currency transactions in net earnings as a component of Operating, administrative and other expense. For the years ended December 31, 20182021, 2020 and 2017,2019 we had net foreign currency transaction losses of $4.1$8.1 million, $4.6 million, and $4.8$2.4 million, respectively. For the year ended December 31, 2016, we had a net foreign currency gain of $6.2 million.
The effect of foreign currency exchange rate changes on Cash, and cash equivalents and restricted cash is presented as a separate caption in the Consolidated Statements of Cash Flows.
Cash Held for Others
We manage significant amounts of cash and cash equivalents in our role as agent for certain of our investment, facility management and property management clients. We do not include such amounts on the Consolidated Balance Sheets.
Taxes Collected from Clients and Remitted to Governmental Authorities
We account for tax assessed by a governmental authority that is based on a revenue or transaction value (i.e., sales, use and value-added taxes) on a net basis, excluded from revenue, and recorded as current liabilities until paid.
Other Commitments and Contingencies
We are subject to various claims and contingencies related to disputes, lawsuits and taxes as well as commitments under contractual obligations. Many of these claims are covered under our current insurance programs, subject to deductibles. Our current insurance programs include professional, auto and general liability.
For professional indemnity coverage, the level of risk retained by our captive insurance company is limited per claim, inclusive of the deductible. We contract third-party insurance companies to provide coverage of risk in excess of the policy limits. We recognize the liability associated with a loss contingency when a loss is probable and estimable.
See Note 13, Commitments and Contingencies, for additional information on commitments and contingencies.
Earnings Per Share; Net Income Available to Common Shareholders
The difference between basic weighted average shares outstanding and diluted weighted average shares outstanding represents the dilutive impact of our common stock equivalents. Common stock equivalents consist of shares to be issued under employee stock-based compensation programs. Anti-dilutive shares were de minimusminimis for all periods presented.
See Note 6, Share-BasedStock-Based Compensation, for additional information on our stock-based compensation plans.
New Accounting Standards
Recently adopted accounting guidance
EffectiveIn January 1, 2018, we adopted Accounting Standards Update ("ASU") No. 2017-07, Improving the Presentation of Net Periodic Pension Cost and Net Periodic Postretirement Benefit Cost, which requires an employer to disaggregate the employer service cost component from the other components of net periodic pension cost. The primary impact for JLL is the requirement to present the components of net periodic pension cost that do not represent the employer service cost outside of the subtotal "Operating income" on the Consolidated Statements of Comprehensive Income. As full retrospective application is required, we recast our comparative information, reclassifying the components of net periodic pension cost, other than the employer service cost component, from Compensation and benefits expense to Other income on the Consolidated Statements of Comprehensive Income. For the years ended December 31, 2017 and 2016, the amounts reclassified were benefits of $1.7 million and $6.3 million, respectively. The adoption of ASU 2017-07 had no impact on our Consolidated Balance Sheets or Consolidated Statements of Cash Flows. Refer to the table below for the impact of adopting this ASU on our comparative Consolidated Statement of Comprehensive Income.
Effective January 1, 2018, we adopted ASU No. 2016-18, Restricted Cash, which addresses classification and presentation of changes in restricted cash on the statement of cash flows. Specifically, this ASU requires a statement of cash flows to explain the changes during the period in cash, cash equivalents, and amounts reported as restricted cash or restricted cash equivalents. The primary effect of the adoption was the inclusion of restricted cash along with cash and cash equivalents in reconciling the beginning and ending total amounts shown on the Consolidated Statements of Cash Flows. We adopted this ASU on a full retrospective basis. Restricted cash is included in Prepaid and other current assets on the Consolidated Balance Sheets.
In May 2014,2020, the Financial Accounting Standards Board ("FASB") issued ASU No. 2014-09, Revenue from Contracts with CustomersAccounting Standards Update ("ASU") 2020‑01, Investments-Equity Securities (Topic 321), Investments-Equity Method and Joint Ventures (Topic 323), and Derivatives and Hedging (Topic 815), which, requires an entityamong other things, clarifies that a company should consider observable transactions that require a company to recognizeeither apply or discontinue the amountequity method of revenue to whichaccounting under Topic 323. In addition, it expects to be entitled forclarifies that, when determining the transfer of promised goods or services to customers; in March 2016, the FASB issued ASU No. 2016-08, Principal versus Agent Considerations (Reporting Revenue Gross versus Net), which clarifies the implementation guidance on principal versus agent considerations and together with ASU No. 2014-09 (collectively the "ASUs"), amends and comprises ASC Topic 606. These ASUs, and other related ASUs, replaced most existing revenue recognition guidance in U.S. generally accepted accounting principles ("U.S. GAAP"). Effective January 1, 2018, we adopted ASC Topic 606 on a full retrospective basis.
The adoption of ASC Topic 606 resulted in an acceleration of the timing of revenue recognition for certain brokerage-related transaction commissionsforward contracts and advisory services. These items include variable considerationpurchased options a company should not consider, whether upon settlement or other aspects, such as contingencies, that precluded revenue recognition contemporaneous withexercise, if the satisfaction of our performance obligations withinunderlying securities would be accounted for under the previous revenue recognition framework. The acceleration of the timing of revenue recognition also resulted in the acceleration of expense recognition relating to direct commissions expense payable to brokers.
Implementation of the updated principal versus agent considerations in ASC Topic 606 resulted in a significant increase to the proportion of our Property & Facility Management and Project & Development Services contracts presented on a gross basis (hereafter “gross contracts”). Under the previous principal versus agent framework, our evaluations for presentation of a service contract contemplated both performance and payment risk. Contractual provisions with clients and third-party vendors and subcontractors, such as “pay-when-paid”, that substantially mitigate our payment risk with respect to on-site personnel and other expenses incurred on our clients’ behalf have historically resulted in the majority of our service contracts being presented on a net basis. However, within ASC Topic 606, payment risk is not an evaluation factor; instead, control of the service before transfer to the customer is the focal point of current principal versus agent assessments. As a result, we determined that costs associated with all client-dedicated JLL personnel, even when directly reimbursed by clients, and arrangements where we control the services provided by a third-party prior to the transfer to the customer will now be presented on a gross basis. The incremental expenses and corresponding revenue recognized as a result of the adoption of the new principal versus agent framework are presented in new financial statement captions, Reimbursed expenses and Reimbursements, respectively, in our Consolidated Statements of Comprehensive Income. We have reclassified reimbursable activity in our comparative financial statements.
Finally, the adoption of ASC Topic 606 resulted in a material increase to total assets and total liabilities to reflect (i) contract assets and accrued commissions payable recognized upon acceleration of the timing of revenue recognition for certain transactions commissions and advisory services and (ii) assets and liabilities relating to service contracts now reported on a gross basis. Balance sheet activity associated with contracts now reported on a gross basis is most prominently reflected within Reimbursable receivables and Reimbursable payables, new financial statement captions established in conjunction with our adoption of ASC Topic 606. We have reclassified reimbursable balances in our comparative financial statements.
The impact of adopting new accounting pronouncements on a retrospective basis to the Consolidated Balance Sheet as of December 31, 2017, and Consolidated Statement of Comprehensive Income for the years ended December 31, 2017 and 2016, were as follows (for impacted financial statement captions): |
| | | | | | | | | |
| (in millions) | Original Published December 31, 2017 | Adjustment due to ASC Topic 606 | | As Restated December 31, 2017 |
| Assets | | | | |
Trade receivables, net of allowances(1) | $ | 2,118.1 |
| (378.7 | ) | | $ | 1,739.4 |
|
Note and other receivables(1) | 393.6 |
| (8.3 | ) | | 385.3 |
|
| Reimbursable receivables | n/a |
| 1,263.3 |
| | 1,263.3 |
|
| Short-term contract assets | n/a |
| 178.4 |
| | 178.4 |
|
Prepaid & other current assets(2) | 257.7 |
| 131.4 |
| | 389.1 |
|
| Long-term receivables | 168.6 |
| (3.9 | ) | | 164.7 |
|
| Other assets | 97.8 |
| 57.7 |
| | 155.5 |
|
| Liabilities and equity | | | | |
Accounts payable and accrued liabilities(1) | $ | 1,011.6 |
| (18.5 | ) | | $ | 993.1 |
|
| Reimbursable payables | n/a |
| 1,022.6 |
| | 1,022.6 |
|
| Accrued compensation & benefits | 1,309.0 |
| 110.1 |
| | 1,419.1 |
|
Short-term contract liabilities and deferred income(1) | 158.9 |
| (3.5 | ) | | 155.4 |
|
Other current liabilities(1) | 263.8 |
| (7.0 | ) | | 256.8 |
|
| Deferred tax liabilities, net | 23.9 |
| 39.3 |
| | 63.2 |
|
| Retained earnings | 2,552.8 |
| 96.2 |
| | 2,649.0 |
|
| Accumulated other comprehensive (loss) income | (341.8 | ) | 0.7 |
| | (341.1 | ) |
(1) Adjustments in these captions reflect reclassifications to new financial statement captions, Reimbursable receivables and Reimbursable payables.(2) Adjustments in this caption reflect an increase to restricted cash held on behalf of clients for contracts now presented on a gross basis.
|
| | | | | | | | | | | |
| (in millions) | Original Published
Year ended
December 31, 2017 | Adjustment due to ASC Topic 606 | Adjustment due to ASU 2017-07 | | As Restated
Year ended
December 31, 2017 |
| Revenue | | | | | |
Revenue before reimbursements(1) | $ | 7,932.4 |
| 35.0 |
| — |
| | $ | 7,967.4 |
|
Reimbursements(1) | n/a |
| 6,485.8 |
| — |
| | 6,485.8 |
|
| Total revenue | 7,932.4 |
| 6,520.8 |
| — |
| | 14,453.2 |
|
| Operating expenses | | | | | |
Compensation and benefits(1) | 4,572.2 |
| 48.5 |
| 1.7 |
| | 4,622.4 |
|
Operating, administrative and other(1) | 2,625.4 |
| (24.2 | ) | — |
| | 2,601.2 |
|
Reimbursed expenses(1) | n/a |
| 6,485.8 |
| — |
| | 6,485.8 |
|
| Operating income | 536.9 |
| 10.7 |
| (1.7 | ) | | 545.9 |
|
| Other income | — |
| — |
| 1.7 |
| | 1.7 |
|
| Provision for income taxes | 267.8 |
| (11.5 | ) | — |
| | 256.3 |
|
| Net income | 257.3 |
| 22.2 |
| — |
| | 279.5 |
|
| Basic earnings per common share | $ | 5.60 |
| 0.49 |
| — |
| | $ | 6.09 |
|
| Diluted earnings per common share | $ | 5.55 |
| 0.48 |
| — |
| | $ | 6.03 |
|
(1) Included in "Adjustments due to ASC Topic 606" is $56.8 million representing the reclassification of historical reimbursed expenses and the corresponding reimbursement revenue into new financial statement captions, Reimbursements and Reimbursed expenses.
|
| | | | | | | | | | | |
| (in millions) | Original Published
Year ended
December 31, 2016 | Adjustment due to ASC Topic 606 | Adjustment due to ASU 2017-07 | | As Restated
Year ended
December 31, 2016 |
| Revenue | | | | | |
Revenue before reimbursements(1) | $ | 6,803.8 |
| 106.8 |
| — |
| | $ | 6,910.6 |
|
Reimbursements(1) | n/a |
| 6,080.6 |
| — |
| | 6,080.6 |
|
| Total revenue | 6,803.8 |
| 6,187.4 |
| — |
| | 12,991.2 |
|
| Operating expenses | | | | | |
Compensation and benefits(1) | 3,983.1 |
| 51.1 |
| 6.3 |
| | 4,040.5 |
|
Operating, administrative and other(1) | 2,169.8 |
| 34.3 |
| — |
| | 2,204.1 |
|
Reimbursed expenses(1) | n/a |
| 6,080.6 |
| — |
| | 6,080.6 |
|
| Operating income | 440.6 |
| 21.4 |
| (6.3 | ) | | 455.7 |
|
| Other income | 13.3 |
| (0.1 | ) | 6.3 |
| | 19.5 |
|
| Provision for income taxes | 108.0 |
| 9.8 |
| — |
| | 117.8 |
|
| Net income | 334.4 |
| 11.5 |
| — |
| | 345.9 |
|
| Basic earnings per common share | $ | 7.04 |
| 0.25 |
| — |
| | $ | 7.29 |
|
| Diluted earnings per common share | $ | 6.98 |
| 0.25 |
| — |
| | $ | 7.23 |
|
(1) Included in "Adjustments due to ASC Topic 606" is $60.2 million representing the reclassification of historical reimbursed expenses and the corresponding reimbursement revenue into new financial statement captions, Reimbursements and Reimbursed expenses.
The cumulative impact to our retained earnings and Consolidated Statement of Comprehensive Income includes certain direct expenses, such as accrued commissions and deferred income taxes, resulting from the changes in accounting principle in accordance with ASC Topic 250, which partially offset the impact of the acceleration of revenue. Refer to the Consolidated Statement of Changes in Equity for the cumulative impact to our retained earnings from the adoption of ASC Topic 606, as of January 1, 2016.
Recently issued accounting guidance, not yet adopted
In February 2016, the FASB issued ASU No. 2016-02, Leases (Topic 842), which increases transparency and comparability by requiring the recognition of lease assets and lease liabilities on the balance sheet as well as requiring the disclosure of key information about leasing arrangements.equity method or fair value option. This ASU is effective for annual and interim periods beginning after December 15, 2018,2020, with early adoption permitted. In July 2018, the FASB codified an alternative (and optional) transition method via ASU No. 2018-11, Leases (Topic 842): Targeted Improvements; we will elect the use ofWe adopted this optional transition method.
The adoption of ASC Topic 842 will result in the recognition of additional balances on the Consolidated Balance Sheet to reflect right-of-use assets and lease liabilities primarily associated with operating leases for the corporate real estate we occupy around the globe. The balance of our lease population comprises vehicle and other equipment leases. As of December 31, 2018, we have substantially completed the identification of our real estate and non-real estate leases population, compiled and calculated the relevant inputs to derive ASC Topic 842's impact, and are assessing the functionality of our selected technology to facilitate ongoing compliance and designing post-implementation processes and associated internal controls. We intend to elect certain practical expedients permitted under ASC Topic 842's transition guidance such as the practical expedients to not reassess lease classification, lease term or initial direct costs for the existing lease portfolio, as well as to not separate lease and non-lease components. Based upon current evaluations, we expect to recognize additional assets and liabilities upon implementation of ASC Topic 842 ranging from $650 million to $700 million to reflect right-of-use assets and lease liabilities as ofeffective January 1, 2019. However, because our evaluations are ongoing,2021, and the expectedadoption did not impact associated with the implementation of ASC Topic 842 is subject to change. Our disclosures related to leases will expand to comply with the requirements of ASC Topic 842; we continue to evaluate other effects ASC Topic 842 will have on our financial statements and related disclosures.
In June 2016,October 2021, the FASB issued ASU No. 2016-13, Financial Instruments - Credit Losses2021-08 Business Combination (Topic 326), 805): Accounting for Contract Assets and Contract Liabilities from Contracts with Customers, which createsrequirescompanies to apply ASC Topic 606 to recognize and measure contract assets and liabilities from contracts with customers acquired in a new framework to evaluate financial instruments, such as trade receivables, for expected credit losses.business combination. This new framework replaces the existing incurred loss approach and is expected togenerally will result in more timely recognition of credit losses. ASU No. 2016-13 is effective for annualcompanies recognizing contract assets and interim periods beginning after December 15, 2019 and early adoption is not permitted until years beginning after December 15, 2018. We are evaluatingliabilities at amounts consistent with those recorded by the effect this guidance will have on our financial statements and related disclosures.
In January 2017,acquiree immediately before the FASB issued ASU No. 2017-04, Simplifying the Test for Goodwill Impairment, which eliminates Step 2 from the goodwill impairment test.acquisition date. The annual goodwill impairment test will require companies to compare the fair value of a reporting unit with its carrying amount and recognize an impairment charge when the carrying amount exceeds the fair value of the reporting unit. This ASU is effective for annual and interim goodwill impairment tests beginning after December 15, 2019, with early adoption permitted. We do not believe this guidance will have a material impact on our financial statements and related disclosures.
In August 2018, the FASB issued ASU No. 2018-13, Fair Value Measurement (Topic 820) Disclosure Framework-Changes to the Disclosure Requirements for Fair Value Measurement, which updates the disclosure requirements in Topic 820 by removing, adding and modifying certain disclosure requirements for fair value measurements. This ASU is effective for annual and interim periods beginning after December 15, 2019,2022, with early adoption permitted. In addition, entities have the optionWe early adopted this guidance effective December 31, 2021, and applied it retrospectively to partially adopt ASU No. 2018-13 with respect to any subset of removed or modified disclosures and defer theall business combinations in 2021. The adoption of additive disclosures and any remaining disclosures not early adopted. In the fourth quarter of 2018, we adopted the portion of the ASU No. 2018-13 relating to eliminated disclosure requirements, but deferred the adoption of modified and additive disclosure requirements; we expect the remaining aspects of this ASU willdid not have a material impact on our fair value disclosures.
In August 2018, the FASB issued ASU No. 2018-15, Customer's Accounting for Implementation Costs Incurred in a Cloud Computing Arrangement That is a Service Contract, which requires a customer in a cloud computing arrangement that is a service contract to follow the internal-use software guidance in ASC 350-40 when determining which implementation costs to capitalize as intangible assets. This ASU is effective for annual and interim periods beginning after December 15, 2019, with early adoption permitted. We do not believe this guidance will have a material impact on our financial statements and related disclosures.
3. BUSINESS SEGMENTS
We manage and report our operations as four business segments:
The three geographic regions of RES including:
(1) Americas,
(2) EMEAEurope, Middle East and Africa ("EMEA"), and
(3) Asia Pacific;
and
(4) LaSalle, which offers investment management services on a global basis.LaSalle.
Each geographic region offers our full range of real estate services, including agency leasing and tenant representation, capital markets, property and facility management, project and development management, energy management and sustainability, construction management, and advisory, consulting and valuation services. LaSalle provides investment management services on a global basis to institutional investors and high-net-worth individuals.
Operating income represents total revenue less direct and allocated indirect expenses. We allocate all indirect expenses to our segments, other than interest and income taxes, as nearly all expenses incurred benefit one or more of the segments. Allocated expenses primarily consist of corporate global overhead, which we allocate to the business segments based on the budgeted operating expenses of each segment.
For segment reporting, (a) gross contract costsSegment income does not include (i) restructuring and (b)acquisition charges, (ii) interest expense, net non-cash mortgage servicing rights ("MSR")of interest income, (iii) other income, and mortgage banking derivative activity(iv) provision for income tax, which are both excluded from revenue in determining "fee revenue". Gross contract costs are excluded from operating expenses in determining "fee-based operating expenses." Excluding these costs from revenue and expenses results in a net presentation which we believe more accurately reflects how we manage our expense base, operating margins and performance. Refer to Results of Operations,otherwise included in Item 2. Management's Discussion and AnalysisNet income on the Consolidated Statements of Financial Condition and Results of Operations, for a full description of gross contract costs. In addition, our measure of segment results excludes Restructuring and acquisition charges.
Effective January 1, 2018, management expanded the types of costs we include within gross contract costs. Most notably, this refinement includes the compensation and benefits associated with client-dedicated employees. Comparative periods were recast for consistency. This change in gross contract costs resulted in a decrease to fee revenue and was prompted by (i) the increase in compensation and benefits associated with client-dedicated personnel presented on a gross basis as a result of the adoption of ASC Topic 606 and (ii) the continued changes in our business mix, reflecting expansion of businesses that most commonly incorporate client-dedicated employees in the delivery of services. The most significant impacts are within Property & Facility Management and Project & Development Services.Comprehensive Income.
The Chief Operating Decision Maker ("CODM") of JLL measures and evaluates the segment results excluding (a) gross contract costs, (b) net non-cash MSRbased on Segment income for purposes of making decisions about allocating resources and mortgage banking derivative activityassessing performance. Our CODM is not provided with total asset information by segment and, (c) Restructuring and acquisition charges.accordingly, does not measure performance or allocate resources based on total asset information. Therefore, we have not disclosed asset information by segment. As of December 31, 2018,2021, we define the Chief Operating Decision MakerGlobal Executive Board, collectively, as our Global Executive Board, which comprises the following:CODM.
|
| |
• Global Chief Executive Officer | |
• Global Chief Financial Officer | |
• Chief Executive Officers of each of our four business segments | |
• Global Chief Administrative Officer | |
• Global Chief Executive Officer of Corporate Solutions | |
• Global Head of Capital Markets | |
Summarized financial information by business segment is as follows.
| | | | | | | | | | | |
| Year Ended December 31, |
| (in millions) | 2021 | 2020 | 2019 |
| Americas - Real Estate Services | | | |
| Leasing | $ | 2,179.1 | | 1,451.2 | | 1,960.5 | |
| Capital Markets | 1,525.9 | | 952.0 | | 914.2 | |
| Property & Facility Management | 6,375.3 | | 5,878.2 | | 5,607.9 | |
| Project & Development Services | 1,366.3 | | 1,333.5 | | 1,689.6 | |
| Advisory, Consulting and Other | 440.5 | | 390.3 | | 406.7 | |
| Revenue | $ | 11,887.1 | | 10,005.2 | | 10,578.9 | |
| Depreciation and amortization | $ | 138.5 | | 151.4 | | 126.5 | |
| Equity earnings | $ | 142.2 | | 19.0 | | 1.7 | |
| Segment income | $ | 1,073.8 | | 554.9 | | 613.1 | |
| | | |
| EMEA - Real Estate Services | | | |
| Leasing | $ | 347.3 | | 245.6 | | 302.7 | |
| Capital Markets | 473.4 | | 330.7 | | 411.9 | |
| Property & Facility Management | 1,504.7 | | 1,456.6 | | 1,551.6 | |
| Project & Development Services | 870.8 | | 785.6 | | 904.3 | |
| Advisory, Consulting and Other | 281.5 | | 274.3 | | 300.2 | |
| Revenue | $ | 3,477.7 | | 3,092.8 | | 3,470.7 | |
| Depreciation and amortization | $ | 42.2 | | 40.0 | | 43.1 | |
| Equity losses | $ | — | | — | | (1.0) | |
| Segment (loss) income | $ | (5.6) | | (16.0) | | 46.0 | |
| | | |
| | | | | | | | | | | |
| Asia Pacific - Real Estate Services | | | |
| Leasing | $ | 267.6 | | 187.4 | | 260.8 | |
| Capital Markets | 194.2 | | 124.7 | | 216.1 | |
| Property & Facility Management | 2,342.7 | | 2,150.6 | | 2,205.2 | |
| Project & Development Services | 447.8 | | 411.0 | | 527.6 | |
| Advisory, Consulting and Other | 249.8 | | 196.4 | | 197.8 | |
| Revenue | $ | 3,502.1 | | 3,070.1 | | 3,407.5 | |
| Depreciation and amortization | $ | 30.2 | | 27.8 | | 26.4 | |
| Equity earnings | $ | 4.6 | | 1.4 | | 2.3 | |
| Segment income | $ | 130.2 | | 116.4 | | 129.6 | |
| | | |
| LaSalle | | | |
| Advisory fees | $ | 364.7 | | 336.4 | | 326.4 | |
| Transaction fees & other | 41.5 | | 43.9 | | 61.3 | |
| Incentive fees | 93.9 | | 41.5 | | 138.4 | |
| Revenue | $ | 500.1 | | 421.8 | | 526.1 | |
| Depreciation and amortization | $ | 6.6 | | 7.2 | | 6.4 | |
| Equity earnings (losses) | $ | 62.6 | | (12.4) | | 33.3 | |
| Segment income | $ | 139.2 | | 54.2 | | 147.4 | |
|
| | | | | | | |
| | Year Ended December 31, |
| ($ in millions) | 2018 | 2017 | 2016 |
| Americas - Real Estate Services | | | |
| Leasing | $ | 1,754.1 |
| 1,510.1 |
| 1,311.5 |
|
| Capital Markets | 500.3 |
| 473.0 |
| 428.0 |
|
| Property & Facility Management | 5,142.2 |
| 4,503.5 |
| 4,475.0 |
|
| Project & Development Services | 1,301.7 |
| 1,242.8 |
| 1,104.4 |
|
| Advisory, Consulting and Other | 342.7 |
| 285.7 |
| 197.9 |
|
| Revenue | 9,041.0 |
| 8,015.1 |
| 7,516.8 |
|
| Reimbursements | (5,164.7 | ) | (4,648.5 | ) | (4,460.1 | ) |
| Revenue before reimbursements | 3,876.3 |
| 3,366.6 |
| 3,056.7 |
|
| Gross contract costs | (652.9 | ) | (521.0 | ) | (554.0 | ) |
| Net non-cash MSR and mortgage banking derivative activity | (8.3 | ) | (15.7 | ) | (23.5 | ) |
| Fee revenue | 3,215.1 |
| 2,829.9 |
| 2,479.2 |
|
| Operating expenses, excluding reimbursed expenses: | | | |
| Compensation, operating and administrative expenses | 3,345.3 |
| 2,918.6 |
| 2,686.4 |
|
| Depreciation and amortization | 109.1 |
| 97.5 |
| 84.3 |
|
| Segment operating expenses, excluding reimbursed expenses | 3,454.4 |
| 3,016.1 |
| 2,770.7 |
|
| Gross contract costs | (652.9 | ) | (521.0 | ) | (554.0 | ) |
| Fee-based segment operating expenses | 2,801.5 |
| 2,495.1 |
| 2,216.7 |
|
| Segment operating income | $ | 421.9 |
| 350.5 |
| 286.0 |
|
| Equity earnings (losses) | 0.8 |
| (0.2 | ) | 1.3 |
|
| Segment income | $ | 422.7 |
| 350.3 |
| 287.3 |
|
| | | | |
| EMEA - Real Estate Services | | | |
| Leasing | $ | 333.0 |
| 303.6 |
| 270.0 |
|
| Capital Markets | 464.1 |
| 465.1 |
| 390.0 |
|
| Property & Facility Management | 1,482.2 |
| 1,342.7 |
| 881.1 |
|
| Project & Development Services | 920.3 |
| 691.1 |
| 659.7 |
|
| Advisory, Consulting and Other | 295.4 |
| 272.5 |
| 246.8 |
|
| Revenue | 3,495.0 |
| 3,075.0 |
| 2,447.6 |
|
| Reimbursements | (677.5 | ) | (471.9 | ) | (352.0 | ) |
| Revenue before reimbursements | 2,817.5 |
| 2,603.1 |
| 2,095.6 |
|
| Gross contract costs | (1,108.0 | ) | (1,038.7 | ) | (757.7 | ) |
| Fee revenue | 1,709.5 |
| 1,564.4 |
| 1,337.9 |
|
| Operating expenses, excluding reimbursed expenses: | | | |
| Compensation, operating and administrative expenses | 2,689.7 |
| 2,507.9 |
| 1,992.5 |
|
| Depreciation and amortization | 50.8 |
| 44.6 |
| 37.4 |
|
| Segment operating expenses, excluding reimbursed expenses | 2,740.5 |
| 2,552.5 |
| 2,029.9 |
|
| Gross contract costs | (1,108.0 | ) | (1,038.7 | ) | (757.7 | ) |
| Fee-based segment operating expenses | 1,632.5 |
| 1,513.8 |
| 1,272.2 |
|
| Segment operating income | $ | 77.0 |
| 50.6 |
| 65.7 |
|
| Equity earnings (losses) | — |
| 0.3 |
| (0.1 | ) |
| Segment income | $ | 77.0 |
| 50.9 |
| 65.6 |
|
| | | | | | | | | | | |
| Year Ended December 31, |
| (in millions) | 2021 | 2020 | 2019 |
| Segment income - Americas | $ | 1,073.8 | | 554.9 | | 613.1 | |
| Segment (loss) income - EMEA | (5.6) | | (16.0) | | 46.0 | |
| Segment income - Asia Pacific | 130.2 | | 116.4 | | 129.6 | |
| Segment income - LaSalle | 139.2 | | 54.2 | | 147.4 | |
| Less: Equity earnings | (209.4) | | (8.0) | | (36.3) | |
| Add: Restructuring and acquisition charges | (84.7) | | (142.4) | | (184.4) | |
| Operating income | $ | 1,043.5 | | 559.1 | | 715.4 | |
Continued: Summarized financial information by business segment is as follows.
|
| | | | | | | |
| | Year Ended December 31, |
| ($ in millions) | 2018 | 2017 | 2016 |
| Asia Pacific - Real Estate Services | | | |
| Leasing | $ | 285.0 |
| 238.2 |
| 216.9 |
|
| Capital Markets | 181.0 |
| 211.3 |
| 162.1 |
|
| Property & Facility Management | 2,158.4 |
| 1,975.1 |
| 1,780.4 |
|
| Project & Development Services | 447.0 |
| 410.6 |
| 306.2 |
|
| Advisory, Consulting and Other | 177.1 |
| 172.1 |
| 153.1 |
|
| Revenue | 3,248.5 |
| 3,007.3 |
| 2,618.7 |
|
| Reimbursements | (1,369.2 | ) | (1,347.9 | ) | (1,248.3 | ) |
| Revenue before reimbursements | 1,879.3 |
| 1,659.4 |
| 1,370.4 |
|
| Gross contract costs | (829.6 | ) | (650.7 | ) | (495.7 | ) |
| Fee revenue | 1,049.7 |
| 1,008.7 |
| 874.7 |
|
| Operating expenses, excluding reimbursed expenses: | | | |
| Compensation, operating and administrative expenses | 1,743.0 |
| 1,520.1 |
| 1,264.2 |
|
| Depreciation and amortization | 23.2 |
| 22.1 |
| 17.3 |
|
| Segment operating expenses, excluding reimbursed expenses | 1,766.2 |
| 1,542.2 |
| 1,281.5 |
|
| Gross contract costs | (829.6 | ) | (650.7 | ) | (495.7 | ) |
| Fee-based segment operating expenses | 936.6 |
| 891.5 |
| 785.8 |
|
| Segment operating income | $ | 113.1 |
| 117.2 |
| 88.9 |
|
| Equity earnings | 2.0 |
| 3.2 |
| 1.1 |
|
| Segment income | $ | 115.1 |
| 120.4 |
| 90.0 |
|
| | | | |
| LaSalle | | | |
| Advisory fees | $ | 276.7 |
| 265.5 |
| 260.4 |
|
| Transaction fees & other | 41.4 |
| 33.4 |
| 51.8 |
|
| Incentive fees | 215.8 |
| 56.9 |
| 95.9 |
|
| Revenue | 533.9 |
| 355.8 |
| 408.1 |
|
| Reimbursements | (17.5 | ) | (17.5 | ) | (20.2 | ) |
| Revenue before reimbursements | 516.4 |
| 338.3 |
| 387.9 |
|
| Gross contract costs | (4.5 | ) | (5.1 | ) | (5.4 | ) |
| Fee revenue | 511.9 |
| 333.2 |
| 382.5 |
|
| Operating expenses, excluding reimbursed expenses: | | | |
| Compensation, operating and administrative expenses | 379.7 |
| 277.0 |
| 301.5 |
|
| Depreciation and amortization | 3.0 |
| 3.0 |
| 2.8 |
|
| Segment operating expenses, excluding reimbursed expenses | 382.7 |
| 280.0 |
| 304.3 |
|
| Gross contract costs | (4.5 | ) | (5.1 | ) | (5.4 | ) |
| Fee-based segment operating expenses | 378.2 |
| 274.9 |
| 298.9 |
|
| Segment operating income | $ | 133.7 |
| 58.3 |
| 83.6 |
|
| Equity earnings | 30.0 |
| 41.1 |
| 31.5 |
|
| Segment income | $ | 163.7 |
| 99.4 |
| 115.1 |
|
|
| | | | | | | |
| | Year Ended December 31, |
| (in millions) | 2018 | 2017 | 2016 |
| Segment Reconciling Items | | | |
| Fee revenue | $ | 6,486.2 |
| 5,736.2 |
| 5,074.3 |
|
| Gross contract costs | 2,595.0 |
| 2,215.5 |
| 1,812.8 |
|
| Net non-cash MSR and mortgage banking derivative activity | 8.3 |
| 15.7 |
| 23.5 |
|
| Revenue before reimbursements | 9,089.5 |
| 7,967.4 |
| 6,910.6 |
|
| Reimbursements | 7,228.9 |
| 6,485.8 |
| 6,080.6 |
|
| Revenue | $ | 16,318.4 |
| 14,453.2 |
| 12,991.2 |
|
| Total segment operating expenses, excluding reimbursed expenses & before restructuring and acquisition charges | $ | 8,343.8 |
| 7,390.8 |
| 6,386.4 |
|
| Reimbursed expenses | 7,228.9 |
| 6,485.8 |
| 6,080.6 |
|
| Total segment operating expenses before restructuring and acquisition charges | $ | 15,572.7 |
| 13,876.6 |
| 12,467.0 |
|
| Operating income before restructuring and acquisition charges | $ | 745.7 |
| 576.6 |
| 524.2 |
|
| Restructuring and acquisition charges | 38.8 |
| 30.7 |
| 68.5 |
|
| Operating income | $ | 706.9 |
| 545.9 |
| 455.7 |
|
Identifiable assets by segment are those assets used by, or result from, each segment's business. Corporate assets are principally cash and cash equivalents, software, and computer hardware. The following table reconciles segment identifiable assets and investments in real estate ventures to consolidated amounts.
|
| | | | | | | | | | | |
| | 12/31/2018 | | 12/31/2017 |
| ($ in millions) | IDENTIFIABLE ASSETS | INVESTMENTS IN REAL ESTATE VENTURES | | IDENTIFIABLE ASSETS | INVESTMENTS IN REAL ESTATE VENTURES |
| Real Estate Services: | | | | | |
| Americas | $ | 5,288.9 |
| 17.0 |
| | $ | 4,745.4 |
| 14.5 |
|
| EMEA | 2,325.4 |
| 3.5 |
| | 2,367.5 |
| 3.5 |
|
| Asia Pacific | 1,437.3 |
| 11.9 |
| | 1,305.0 |
| 9.6 |
|
| LaSalle | 666.8 |
| 305.8 |
| | 548.6 |
| 346.9 |
|
| Corporate | 307.1 |
| 18.7 |
| | 287.9 |
| 1.7 |
|
| Consolidated | $ | 10,025.5 |
| 356.9 |
| | $ | 9,254.4 |
| 376.2 |
|
The table below reconciles segment property and equipment expenditures to consolidated expenditures.
|
| | | | | | | |
| | Year Ended December 31, |
| ($ in millions) | 2018 | 2017 | 2016 |
| Real Estate Services: | | | |
| Americas | $ | 109.1 |
| 62.6 |
| 141.6 |
|
| EMEA | 39.0 |
| 44.5 |
| 54.2 |
|
| Asia Pacific | 25.4 |
| 20.3 |
| 16.1 |
|
| LaSalle | 3.0 |
| 1.2 |
| 67.9 |
|
| Corporate | 32.5 |
| 25.1 |
| 36.2 |
|
Total capital expenditures (1) | $ | 209.0 |
| 153.7 |
| 316.0 |
|
(1) Included in total capital expenditures for the years ended December 31, 2018, 2017 and 2016, were $47.1 million, $2.3 million, and $99.8 million, respectively, related to acquisition of investment properties by less than wholly-owned consolidated VIEs.
The0The following table sets forth the revenue and assets from our most significant currencies.
| | | | | | | | | | | |
| TOTAL REVENUE |
| Year Ended December 31, |
| (in millions) | 2021 | 2020 | 2019 |
| United States dollar | $ | 11,283.1 | | 9,457.8 | | 10,054.9 | |
| British pound | 1,626.6 | | 1,341.1 | | 1,514.8 | |
| Euro | 1,393.3 | | 1,350.6 | | 1,507.7 | |
| Australian dollar | 1,118.7 | | 876.1 | | 924.5 | |
| Hong Kong dollar | 545.6 | | 512.2 | | 533.8 | |
| Chinese yuan | 539.1 | | 473.1 | | 505.9 | |
| Canadian dollar | 508.3 | | 432.6 | | 435.5 | |
| Indian rupee | 508.2 | | 524.5 | | 651.8 | |
| Singapore dollar | 327.4 | | 246.6 | | 309.2 | |
| Japanese yen | 256.8 | | 257.9 | | 349.4 | |
| Other currencies | 1,259.9 | | 1,117.4 | | 1,195.7 | |
| $ | 19,367.0 | | 16,589.9 | | 17,983.2 | |
Change in Reporting Segments
Effective January 1, 2022, our Real Estate Services segments (Americas, EMEA and Asia Pacific) were reorganized into four global business segments focused on product offerings versus geographical alignment. The new segments are: (i) Markets Advisory, (ii) Capital Markets, (iii) Work Dynamics and (iv) JLL Technologies ("JLLT"). We will continue to manage our investment management business globally as LaSalle, a distinct segment.
Effective with financial reporting in 2022, prior period results will be restated to conform with our new reporting structure.
|
| | | | | | | | | | | | | |
| | TOTAL REVENUE | | TOTAL ASSETS |
| | Year Ended December 31, | | December 31, |
| ($ in millions) | 2018 | 2017 | 2016 | | 2018 | 2017 |
| United States dollar | $ | 8,523.8 |
| 7,572.1 |
| 7,235.8 |
| | $ | 5,866.4 |
| 5,363.6 |
|
| Euro | 1,527.1 |
| 1,244.8 |
| 1,020.0 |
| | 932.2 |
| 810.5 |
|
| British pound | 1,526.3 |
| 1,447.3 |
| 1,124.6 |
| | 1,187.3 |
| 1,228.1 |
|
| Australian dollar | 916.7 |
| 909.7 |
| 820.0 |
| | 291.6 |
| 331.8 |
|
| Indian rupee | 580.4 |
| 516.2 |
| 434.9 |
| | 317.5 |
| 260.5 |
|
| Chinese yuan | 505.5 |
| 439.7 |
| 358.1 |
| | 190.4 |
| 163.1 |
|
| Hong Kong dollar | 487.2 |
| 450.0 |
| 420.1 |
| | 187.1 |
| 189.9 |
|
| Singapore dollar | 458.7 |
| 268.0 |
| 218.3 |
| | 236.5 |
| 160.3 |
|
| Canadian dollar | 390.5 |
| 333.4 |
| 300.4 |
| | 172.0 |
| 127.4 |
|
| Japanese yen | 285.2 |
| 238.2 |
| 235.5 |
| | 96.4 |
| 85.4 |
|
| Other currencies | 1,117.0 |
| 1,033.8 |
| 823.5 |
| | 548.1 |
| 533.8 |
|
| | $ | 16,318.4 |
| 14,453.2 |
| 12,991.2 |
| | $ | 10,025.5 |
| 9,254.4 |
|
We face restrictions4. BUSINESS COMBINATIONS, GOODWILL AND OTHER INTANGIBLE ASSETS
2021 Business Combinations Activity
During 2021, we completed 4 new strategic acquisitions, expanding our capabilities and increasing our presence in certain countries that limit or prevent the transfer of funds to other countries or the exchange of the local currency to other currencies, however, we generally face no such restrictions with regard to the use or application of funds for ordinary course business activities within such countries. The assets of these countries represented approximately 6% of our total assets as of both December 31, 2018, and 2017.key regional markets. These strategic acquisitions are presented below.
| | | | | | | | | | | |
4.Acquired Company | BUSINESS COMBINATIONS, GOODWILL AND OTHER INTANGIBLE ASSETSQuarter of Acquisition | Country | Primary Service Line |
| | | |
| Skyline AI (Skyline) | Q3 | Israel | Capital Markets |
Sterling Bay Property Management, LLC(1) | Q4 | United States | Property & Facility Management |
| Building Engines, Inc. | Q4 | United States | Property & Facility Management |
| Enerdapt, Inc. (Hank) | Q4 | United States | Advisory, Consulting and Other |
2018 Business Combinations Activity(1) We acquired a 50.1% interest in a joint venture with Sterling Bay, LLC.
Aggregate terms of our acquisitions included: (i) cash paid at closing of $101.3$416.8 million (net of $13.9 million in cash acquired), (ii) guaranteed deferred consideration of $3.9$10.0 million and (iii) contingent earn-out consideration of $11.6$68.6 million, payable upon satisfaction of certain performance conditions and which we have initially recorded at their respective acquisition date fair value.
A preliminary allocation of this purchase consideration resulted in goodwill of $60.8$442.3 million, identifiable intangibles of $57.1$210.2 million, and other net liabilities (assumed liabilities less acquired assets) of $1.1$34.6 million. The noncontrolling interest of 49.9% in the less-than-wholly-owned acquisition was $122.5 million at the acquisition date. As of December 31, 2018,2021, we have not completed our analysis to assign fair values to all of the material identifiable intangible and tangible assets acquired and, therefore, we maydo not anticipate further refinerefinement to the purchase price allocations for 2018 acquisitions during respective open measurement periods.our 2021 acquisitions.
During the year ended December 31, 2018,2021, we also paid $72.3$88.7 million for deferred business acquisition and earn-out obligations for acquisitions completed in prior years. We also paid $1.5 million to acquire a portion of the redeemable noncontrolling interest related to our 2014 acquisition of Tenzing AB, a Swedish real estate services provider.
Of the $60.8$442.3 million of total additions to goodwill in 2018,2021, we expected to amortize and deduct $35.5$99.8 million for tax purposes as of December 31, 2018,2021, subject to statutory amortization periods.
Within the 2018 acquisition activity, we completed six new strategic acquisitions, as presented in the below table.
|
| | | |
Acquired Company | Quarter of Acquisition | Primary Country | Primary Service Line |
Stessa Inc. | Q1 | United States | Advisory, Consulting and Other |
Raymond Chabot Grant Thornton & Co. LLP | Q1 | Canada | Advisory, Consulting and Other |
JCL International Inc. | Q1 | Philippines | Project & Development Services |
Northwest Atlantic | Q3 | Canada | Leasing |
ValuD | Q4 | United States | Advisory, Consulting and Other |
Aviva | Q4 | England | LaSalle |
20172020 Business Combinations Activity
During the year ended December 31, 2017,2020, we completed fiveno new strategic acquisitions: two located in the Americas and three located in EMEA.
Aggregate terms of these acquisitions included: (i) cash paid at closing of $22.4 million (which excludes $5.6 million in cash acquired), (ii) guaranteed deferred consideration of $1.8 million subject only to the passage of time and (iii) contingent earn-out consideration of $11.5 million recorded at their respective acquisition date fair value, which we will pay upon satisfaction of certain performance conditions.
As of December 31, 2017, a preliminary allocation of this purchase consideration resulted in goodwill of $24.1 million, identifiable intangibles of $9.7 million, and other net assets (acquired assets less assumed liabilities) of $1.9 million. During 2018, we did not make any adjustments to the fair values of all identifiable intangible and tangible assets acquired in 2017. As of December 31, 2018, the purchase price allocations for our 2017 acquisitions was final.
During the year ended December 31, 2017, we also paid $50.7 million for deferred business acquisition and earn-out obligations for acquisitions completed in prior years. In addition, we paid $2.4 million to acquire a portion of the redeemable noncontrolling interest related to our 2014 acquisition of Tenzing AB.
Of the $29.7 million of total additions to goodwill in 2017, we expected to amortize and deduct $3.5 million for tax purposes as of December 31, 2017, subject to statutory amortization periods.
During the year ended December 31, 2017, we made adjustments to our preliminary allocation of the purchase consideration for certain acquisitions completed in 2016 during their respective open measurement periods. These adjustments resulted in a $5.6 million increase to goodwill, which included a $1.9 million net working capital adjustment payment, and a $0.4 million reduction to identifiable intangibles.acquisitions.
Earn-Out Payments
| | | | | | | | | | | |
| ($ in millions) | December 31, 2021 | | December 31, 2020 |
| Number of acquisitions with earn-out payments subject to the achievement of certain performance criteria | 19 | | | 35 | |
| Maximum earn-out payments (undiscounted) | $ | 149.9 | | | 199.2 | |
Short-term earn-out liabilities (fair value)(1) | 39.0 | | | 77.2 | |
Long-term earn-out liabilities (fair value)(1) | 45.1 | | | 8.5 | |
|
| | | | | | |
| ($ in millions) | December 31, 2018 | | December 31, 2017 |
| Number of acquisitions with earn-out payments subject to the achievement of certain performance criteria | 54 |
| | 56 |
|
| Maximum earn-out payments (undiscounted) | $ | 407.3 |
| | 436.2 |
|
Short-term earn-out liabilities (fair value)1 | 50.9 |
| | 49.6 |
|
Long-term earn-out liabilities (fair value)1 | 141.1 |
| | 177.5 |
|
1(1) Included in Short-term and Long-term acquisition obligations on the Consolidated Balance SheetsSheets.
Assuming the achievement of the applicable performance criteria, we anticipate making these earn-out payments over the next sixfive years. Refer to Note 9, Fair Value Measurements, and Note 14, Restructuring and Acquisition Charges, for additional discussion of our earn-out liabilities.
Goodwill and Other Intangible Assets
Goodwill and unamortized intangibles as of December 31, 20182021 consisted of: (i) goodwill of $2,697.8$4,611.6 million, (ii) identifiable intangibles of $287.7$836.4 million amortized over their remaining finite useful lives and (iii) $49.3$50.6 million of identifiable intangibles with indefinite useful lives that are not amortized. Significant portions of our goodwill and unamortized intangibles are denominated in currencies other than the U.S. dollar, which means a portion of the movements in the reported book value of these balances is attributable to movements in foreign currency exchange rates.
The following table details, by reporting segment, the annual movements in goodwill.
| | (in millions) | | (in millions) | Americas | EMEA | Asia
Pacific | LaSalle | Consolidated |
| Balance as of December 31, 2019 | | Balance as of December 31, 2019 | $ | 2,877.6 | | 915.9 | | 317.6 | | 57.1 | | | $ | 4,168.2 | |
| | ($ in millions) | Americas | EMEA | Asia Pacific | LaSalle | Consolidated | |
| Balance as of December 31, 2016 | $ | 1,406.1 |
| 851.7 |
| 306.1 |
| 15.4 |
| | $ | 2,579.3 |
| |
| Additions, net of adjustments | 5.3 |
| 17.7 |
| 6.7 |
| — |
| | 29.7 |
| |
| Dispositions | | Dispositions | — | | (0.7) | | — | | — | | | (0.7) | |
| Impact of exchange rate movements | 0.8 |
| 88.2 |
| 10.2 |
| 1.1 |
| | 100.3 |
| Impact of exchange rate movements | 0.4 | | 44.5 | | 11.6 | | 0.7 | | | 57.2 | |
| Balance as of December 31, 2017 | 1,412.2 |
| 957.6 |
| 323.0 |
| 16.5 |
| | 2,709.3 |
| |
| Balance as of December 31, 2020 | | Balance as of December 31, 2020 | 2,878.0 | | 959.7 | | 329.2 | | 57.8 | | | 4,224.7 | |
| Additions, net of adjustments | 42.0 |
| 1.9 |
| 8.7 |
| 6.4 |
| | 59.0 |
| Additions, net of adjustments | 442.3 | | — | | — | | — | | | 442.3 | |
| Dispositions | — |
| — |
| (3.9 | ) | — |
| | (3.9 | ) | Dispositions | (11.0) | | (1.0) | | — | | — | | | (12.0) | |
| Impact of exchange rate movements | (2.2 | ) | (52.7 | ) | (11.0 | ) | (0.7 | ) | | (66.6 | ) | Impact of exchange rate movements | — | | (34.3) | | (8.7) | | (0.4) | | | (43.4) | |
| Balance as of December 31, 2018 | $ | 1,452.0 |
| 906.8 |
| 316.8 |
| 22.2 |
| | $ | 2,697.8 |
| |
| Balance as of December 31, 2021 | | Balance as of December 31, 2021 | $ | 3,309.3 | | 924.4 | | 320.5 | | 57.4 | | | $ | 4,611.6 | |
The following table details, by reporting segment, the annual movements in the gross carrying amount and accumulated amortization of our identifiable intangibles.
| | | | | | | | | | | | | | | | MSR | | Other Intangibles | |
| | MSR | | Other Intangibles | | | |
| ($ in millions) | Americas | | Americas | EMEA | Asia Pacific | LaSalle | | Consolidated | |
| (in millions) | | (in millions) | Americas | | Americas | EMEA | Asia Pacific | LaSalle | | Consolidated |
| Gross Carrying Amount | | | | | | | Gross Carrying Amount | | | | | | |
| Balance as of December 31, 2016 | $ | 193.1 |
| | 167.1 |
| 91.1 |
| 24.2 |
| 0.1 |
| | $ | 475.6 |
| |
| Balance as of December 31, 2019 | | Balance as of December 31, 2019 | $ | 480.4 | | | 285.7 | | 55.9 | | 21.4 | | 54.0 | | | $ | 897.4 | |
Additions, net of adjustments (1) | 66.6 |
| | 0.4 |
| 3.1 |
| 5.8 |
| — |
| | 75.9 |
| Additions, net of adjustments (1) | 139.0 | | | — | | — | | 0.5 | | — | | | 139.5 | |
| Adjustment for fully amortized intangibles | (17.9 | ) | | (50.7 | ) | (13.6 | ) | (7.9 | ) | (0.1 | ) | | (90.2 | ) | Adjustment for fully amortized intangibles | (47.3) | | | (19.9) | | (1.9) | | (0.1) | | — | | | (69.2) | |
| Impact of exchange rate movements | — |
| | 0.2 |
| 8.2 |
| 1.2 |
| — |
| | 9.6 |
| Impact of exchange rate movements | — | | | — | | 1.7 | | 1.8 | | 3.9 | | | 7.4 | |
| Balance as of December 31, 2017 | 241.8 |
| | 117.0 |
| 88.8 |
| 23.3 |
| — |
| | 470.9 |
| |
| Balance as of December 31, 2020 | | Balance as of December 31, 2020 | 572.1 | | | 265.8 | | 55.7 | | 23.6 | | 57.9 | | | 975.1 | |
Additions, net of adjustments (1) | 49.9 |
| | 9.1 |
| 0.3 |
| 3.8 |
| 43.9 |
| | 107.0 |
| Additions, net of adjustments (1) | 161.1 | | | 206.4 | | 3.8 | | — | | — | | | 371.3 | |
| Adjustment for fully amortized intangibles | (25.5 | ) | | (36.2 | ) | (1.7 | ) | (1.0 | ) | — |
| | (64.4 | ) | Adjustment for fully amortized intangibles | (63.5) | | | (15.8) | | (30.0) | | (4.7) | | — | | | (114.0) | |
| | Impact of exchange rate movements | — |
| | 0.1 |
| (4.3 | ) | (2.6 | ) | — |
| | (6.8 | ) | Impact of exchange rate movements | — | | | — | | (0.9) | | (1.0) | | (3.4) | | | (5.3) | |
| Balance as of December 31, 2018 | $ | 266.2 |
| | 90.0 |
| 83.1 |
| 23.5 |
| 43.9 |
| | $ | 506.7 |
| |
| Balance as of December 31, 2021 | | Balance as of December 31, 2021 | $ | 669.7 | | | 456.4 | | 28.6 | | 17.9 | | 54.5 | | | $ | 1,227.1 | |
| | | | | | | |
| Accumulated Amortization | |
| | |
| |
| |
| |
| | |
| Accumulated Amortization | | | | | |
| Balance as of December 31, 2016 | $ | (32.3 | ) | | (98.7 | ) | (38.0 | ) | (11.5 | ) | (0.1 | ) | | $ | (180.6 | ) | |
| Balance as of December 31, 2019 | | Balance as of December 31, 2019 | $ | (104.0) | | | (68.3) | | (33.1) | | (6.7) | | (2.7) | | | $ | (214.8) | |
Amortization expense, net (2) | (40.7 | ) | | (13.7 | ) | (14.8 | ) | (2.6 | ) | — |
| | (71.8 | ) | Amortization expense, net (2) | (91.1) | | | (46.0) | | (7.1) | | (1.4) | | (2.6) | | | (148.2) | |
| Adjustment for fully amortized intangibles | 17.9 |
| | 50.7 |
| 13.6 |
| 7.9 |
| 0.1 |
| | 90.2 |
| Adjustment for fully amortized intangibles | 47.3 | | | 19.9 | | 1.9 | | 0.1 | | — | | | 69.2 | |
| Impact of exchange rate movements | — |
| | 0.4 |
| (3.9 | ) | (0.2 | ) | — |
| | (3.7 | ) | Impact of exchange rate movements | — | | | 0.3 | | (1.2) | | (0.6) | | — | | | (1.5) | |
| Balance as of December 31, 2017 | (55.1 | ) | | (61.3 | ) | (43.1 | ) | (6.4 | ) | — |
| | (165.9 | ) | |
| Balance as of December 31, 2020 | | Balance as of December 31, 2020 | (147.8) | | | (94.1) | | (39.5) | | (8.6) | | (5.3) | | | (295.3) | |
Amortization expense, net (2) | (42.8 | ) | | (14.0 | ) | (12.8 | ) | (2.6 | ) | — |
| | (72.2 | ) | Amortization expense, net (2) | (106.7) | | | (43.9) | | (6.4) | | (1.2) | | (1.7) | | | (159.9) | |
| Adjustment for fully amortized intangibles | 25.5 |
| | 36.2 |
| 1.7 |
| 1.0 |
| — |
| | 64.4 |
| Adjustment for fully amortized intangibles | 63.5 | | | 15.8 | | 30.0 | | 4.7 | | — | | | 114.0 | |
| | Impact of exchange rate movements | — |
| | 0.3 |
| 2.4 |
| 1.2 |
| — |
| | 3.9 |
| Impact of exchange rate movements | — | | | 0.2 | | 0.7 | | 0.2 | | — | | | 1.1 | |
| Balance as of December 31, 2018 | $ | (72.4 | ) | | (38.8 | ) | (51.8 | ) | (6.8 | ) | — |
| | $ | (169.8 | ) | |
| Balance as of December 31, 2021 | | Balance as of December 31, 2021 | $ | (191.0) | | | (122.0) | | (15.2) | | (4.9) | | (7.0) | | | $ | (340.1) | |
| | | | | | | |
| Net book value as of December 31, 2018 | $ | 193.8 |
| | 51.2 |
| 31.3 |
| 16.7 |
| 43.9 |
| | $ | 336.9 |
| |
| Net book value as of December 31, 2021 | | Net book value as of December 31, 2021 | $ | 478.7 | | | 334.4 | | 13.4 | | 13.0 | | 47.5 | | | $ | 887.0 | |
(1) Included in this amount for MSRs was $11.4(i) $31.2 million and $10.8$23.7 million for 20182021 and 2017,2020, respectively, relating to write-offs due to prepayments of sold warehouse receivables for which we retained the servicing rights.rights and (ii) $(0.1) million and $0.1 million for 2021 and 2020, respectively, relating to an impairment valuation allowance.
(2) Amortization of MSRs is included in Revenue within the Consolidated Statements of Comprehensive Income.
The remaining weighted average amortization period of MSRs and other finite-lived identifiable intangible assets is 4.64.3 years and 3.94.9 years, respectively, and the remaining estimated future amortization expense by year, as of December 31, 2018,2021, is presented in the following table.
| | | | | | | | | | | |
| (in millions) | MSRs | Other Intangibles | Total |
| 2022 | $ | 81.6 | | 66.6 | | $ | 148.2 | |
| 2023 | 76.5 | | 62.2 | | 138.7 | |
| 2024 | 69.8 | | 57.4 | | 127.2 | |
| 2025 | 60.6 | | 39.7 | | 100.3 | |
| 2026 | 49.9 | | 17.4 | | 67.3 | |
| Thereafter | 140.3 | | 114.4 | | 254.7 | |
| Total | $ | 478.7 | | 357.7 | | $ | 836.4 | |
5. INVESTMENTS
|
| | | | | | | | |
| ($ in millions) | MSRs | Other Intangibles | Total |
| 2019 | $ | 30.7 |
| 25.2 |
| $ | 55.9 |
|
| 2020 | 28.9 |
| 21.0 |
| 49.9 |
|
| 2021 | 26.3 |
| 14.0 |
| 40.3 |
|
| 2022 | 23.5 |
| 8.4 |
| 31.9 |
|
| 2023 | 20.1 |
| 5.9 |
| 26.0 |
|
| Thereafter | 64.3 |
| 19.4 |
| 83.7 |
|
| Total | $ | 193.8 |
| 93.9 |
| $ | 287.7 |
|
| |
5. | INVESTMENTS IN REAL ESTATE VENTURES |
As of December 31, 20182021 and 2017,2020, we had Investments in real estate ventures of $356.9$745.7 million and $376.2$430.8 million, respectively. Summarized investment balances is presented in the following table.
| | | | | | | | |
| December 31, |
| (in millions) | 2021 | 2020 |
| LaSalle co-investments | $ | 354.6 | | 300.3 | |
| JLL Technologies investments | 353.6 | | 94.0 | |
| Other investments | 37.5 | | 36.5 | |
| Total | $ | 745.7 | | 430.8 | |
Approximately 75%90% of our investments, as of December 31, 2018,2021, are (i) in 4550 separate property or commingled funds, where we co-invest alongside our clients and for which we also have an advisory agreement.agreement, or (ii) investments by JLL Technologies in proptech funds and early to mid-stage proptech companies. The remaining 25% 10% of our Investments, in real estate ventures, as ofDecember 31, 2018,2021, were attributable to investment vehicles that use our capital and outside capital generally provided by institutional investors to invest, primarily, in certain real estate ventures that own and operate real estate. Of our investments attributable to investment vehicles, the majority was invested in LaSalle Investment Company II ("LIC II"), in which we held an effective ownership interest of 48.78%.
We have maximum potential unfunded commitments to direct investments or investment vehicles of $240.6$372.4 million as of December 31, 2018, of which $60.42021. Of this amount, while we remain contractually obligated, we do not expect a call on the $60.3 million relatesrelating to our commitmentinvestment in LIC II as its fund life terminated in January 2020.
We evaluate our less-than-wholly-owned investments to LIC II.
Our investments in real estate ventures include investments indetermine whether the underlying entities are classified as VIEs, whichvariable interest entities ("VIEs"); we analyze for potential consolidation.assess each identified VIE to determine whether we are the primary beneficiary. We had equity method investments, either directly or indirectly of $37.0$95.2 million and $7.8$76.4 million as of December 31, 20182021 and 2017,2020, respectively, in entities classified as VIEs. We have determined that we are the primary beneficiary of certain VIEs and accordingly, we have consolidated such entities. The assets of the consolidated VIEs are available only for the settlement of the obligations of the respective entities and the mortgage loans of the consolidated VIEs are non-recourse to JLL.
Summarized financial information for our consolidated VIEs is presented in the following tables.
| | | | | | | | |
| December 31, |
| (in millions) | 2021 | 2020 |
| Property and equipment, net | $ | 184.7 | | 117.4 | |
| Investments | 10.2 | | 9.0 | |
| Other assets | 17.7 | | 21.0 | |
| Total assets | $ | 212.6 | | 147.4 | |
| Other current liabilities | $ | 2.1 | | 1.9 | |
| Mortgage indebtedness (included in Other liabilities) | 107.5 | | 60.3 | |
| | |
| Total liabilities | 109.6 | | 62.2 | |
| Members' equity (included in Noncontrolling interest) | 103.0 | | 85.2 | |
| Total liabilities and members' equity | $ | 212.6 | | 147.4 | |
|
| | | | | |
| | December 31, |
| ($ in millions) | 2018 | 2017 |
| Property and equipment, net | $ | 48.5 |
| 15.7 |
|
| Investments in real estate ventures | 14.0 |
| 12.6 |
|
Other assets (1) | 4.4 |
| 44.4 |
|
| Total assets | $ | 66.9 |
| 72.7 |
|
Other current liabilities (1) | $ | 0.9 |
| 30.9 |
|
| Mortgage indebtedness (included in Other liabilities) | 28.2 |
| 9.2 |
|
| Total liabilities | 29.1 |
| 40.1 |
|
| Members' equity (included in Noncontrolling interest) | 37.8 |
| 32.6 |
|
| Total liabilities and members' equity | $ | 66.9 |
| 72.7 |
|
| | | | | | | | | | | |
| Year Ended December 31, |
| (in millions) | 2021 | 2020 | 2019 |
| Revenue | $ | 11.0 | | 13.9 | | 7.6 | |
| Operating and other expenses | (14.9) | | (15.6) | | (8.6) | |
Net gains on sale of investments(1) | — | | 22.1 | | — | |
| Net (loss) income | $ | (3.9) | | 20.4 | | (1.0) | |
(1) Balances as$12.3 million of December 31, 2017 primarily represented investment properties and their corresponding liabilities, classified as held-for-sale.
|
| | | | | | | |
| | Year Ended December 31, |
| ($ in millions) | 2018 | 2017 | 2016 |
| Revenue | $ | 5.8 |
| 5.9 |
| 6.6 |
|
| Operating and other expenses | (5.1 | ) | (4.2 | ) | (7.1 | ) |
| Gain on sale of investment | 2.0 |
| — |
| 13.3 |
|
| Net income | $ | 2.7 |
| 1.7 |
| 12.8 |
|
We allocate the members' equity and net income of the consolidated VIEs to the noncontrolling interest holders as Noncontrolling interest on the Consolidated Balance Sheets and as Net income attributable to noncontrolling interest in the Consolidated Statements of Comprehensive Income, respectively.
The following tables summarize the combined financial information for certain of our unconsolidated real estate ventures (including those held via LIC II)investments accounted for under the equity method or at fair value.
| | | | | | | | | | | | December 31, |
| | | December 31, | |
| ($ in millions) | | 2018 | 2017 | |
| (in millions) | | (in millions) | | 2021 | 2020 |
| Balance Sheets: | Balance Sheets: | | | Balance Sheets: | |
| | Investments in real estate, net of depreciation | | $ | 13,217.7 |
| 17,407.4 |
| | Investments, net of depreciation | | $ | 31,084.0 | | 24,320.4 | |
| | Total assets | | 15,561.2 |
| 19,589.7 |
| | Total assets | | 34,816.3 | | 28,129.3 | |
| | Mortgage indebtedness | | 4,968.0 |
| 6,170.5 |
| | Mortgage indebtedness | | 9,708.5 | | 7,980.2 | |
| | Other borrowings | | 561.7 |
| 926.3 |
| | Other borrowings | | 1,864.1 | | 1,332.9 | |
| | Total liabilities | | 6,155.8 |
| 8,301.1 |
| | Total liabilities | | 13,275.3 | | 10,720.5 | |
| | Total equity | | 9,405.4 |
| 11,288.6 |
| | Total equity | | 21,541.0 | | 17,408.8 | |
| | | | | |
| | | Year Ended December 31, | | Year Ended December 31, |
| ($ in millions) | 2018 | 2017 | 2016 | |
| (in millions) | | (in millions) | 2021 | 2020 | 2019 |
| Statements of Operations: | Statements of Operations: | | | Statements of Operations: | |
| | Revenue | $ | 1,199.5 |
| 1,319.0 |
| 1,266.8 |
| | Revenue | $ | 2,103.6 | | 1,702.3 | | 1,247.6 | |
| | Net income | 1,046.3 |
| 895.7 |
| 874.7 |
| | Net income | 1,850.7 | | 241.5 | | 831.2 | |
Impairment
There were no significant other-than-temporary impairment charges on properties held by our investments which were other-than-temporarily impaired during theInvestments for each of the years in the three-year period ended December 31, 2018.2021.
Fair Value
Based upon elections made at the date of investment, weWe report a majority of our investments in real estate ventures at fair value. For such investments, we increase or decrease our investment each reporting period by the change in the fair value and we report these fair value adjustments in theour Consolidated Statements of Comprehensive Income within Equity earnings from real estate ventures.earnings. The table below shows the movement in our investments in real estate ventures reported at fair value.
| | | | | | | | | | Year Ended December 31, |
| | Year Ended December 31, | |
| ($ in millions) | 2018 | 2017 | 2016 | |
| (in millions) | | (in millions) | 2021 | 2020 | 2019 |
| Fair value investments as of January 1, | $ | 242.3 |
| 212.7 |
| 155.2 |
| Fair value investments as of January 1, | $ | 340.3 | | 328.6 | | 247.3 | |
| Investments | 55.2 |
| 33.5 |
| 105.8 |
| Investments | 190.3 | | 51.7 | | 144.9 | |
| Distributions | (63.8 | ) | (37.1 | ) | (62.1 | ) | Distributions | (84.0) | | (46.8) | | (101.7) | |
| Change in fair value | 13.9 |
| 28.1 |
| 16.6 |
| Change in fair value | 201.2 | | (1.0) | | 35.3 | |
| Foreign currency translation adjustments, net | (0.3 | ) | 5.1 |
| (2.8 | ) | Foreign currency translation adjustments, net | (8.2) | | 7.8 | | 2.8 | |
| Fair value investments as of December 31, | $ | 247.3 |
| 242.3 |
| 212.7 |
| Fair value investments as of December 31, | $ | 639.6 | | 340.3 | | 328.6 | |
See Note 9, Fair Value Measurements, for additionalfurther discussion of our investments in real estate ventures reported at fair value.
92
| |
6. | STOCK-BASED COMPENSATION |
6. STOCK-BASED COMPENSATION
The SAIPStock Award and Incentive Plan ("SAIP") provides for the granting of various stock awards to eligible employees of JLL. SuchThese awards have historically been solely RSUs which generally vest over three years (either cliff or graded vesting) and generally have vested in three years. In 2018, we issued PSUs for the first time to certain employees under the SAIP, a supplement to the continued issuance RSU awards. PSU awardswhich generally vest in three years (cliff vesting), subject to performance and, for certain awards, market conditions as applicable.conditions.
There were approximately 1.31.1 million shares available for grant under the SAIP as of December 31, 2018.2021. We also have a stock-based compensation plan for our UK-based employees, the SAYE plan, that allows for the purchase of stock at a 15% discount from the market price at the beginning of the plan's vesting periods. While there have been no options granted under the SAYE plan since 2017, approximately 281 thousand shares remain available for grant as of December 31, 2021.
Stock-based compensation expense, excluding expense related to HFF retention awards issued in conjunction with the HFF acquisition, is included within Compensation and benefits expense on the Consolidated Statements of Comprehensive Income. The expense related to HFF retention awards issued in conjunction with the HFF acquisition is included within Restructuring and acquisition charges. Stock-based compensation expense consisted of the following.by award type is presented below.
| | | | | | | | | | Year Ended December 31, |
| | Year Ended December 31, | |
| ($ in millions) | 2018 | 2017 | 2016 | |
| Stock unit awards | $ | 25.6 |
| 23.8 |
| 25.5 |
| |
| (in millions) | | (in millions) | 2021 | 2020 | 2019 |
| Restricted stock unit awards | | Restricted stock unit awards | $ | 37.7 | | 41.8 | | 61.6 | |
| Performance stock unit awards | | Performance stock unit awards | 42.4 | | 5.5 | | 13.6 | |
| SAYE | 1.3 |
| 1.4 |
| 1.4 |
| SAYE | — | | 0.2 | | 1.2 | |
| Total | $ | 26.9 |
| 25.2 |
| 26.9 |
| Total | $ | 80.1 | | 47.5 | | 76.4 | |
Restricted Stock Units and Performance Stock Units
RSU and PSU activity is presented in the below table. | | | | | | | | | | | | | | | | | | | | | | | |
| RSU Shares
(in 000's) | PSU Shares
(in 000's) | | Total Shares
(in 000's) | | Weighted Average
Grant Date
Fair Value | Weighted Average
Remaining
Contractual Life (in years) |
| Unvested as of December 31, 2018 | 559.6 | | 93.1 | | | 652.7 | | | $ | 131.32 | | 2.02 |
| Granted | 1,298.0 | | 196.5 | | | 1,494.5 | | | 141.06 | | |
| Vested | (287.7) | | — | | | (287.7) | | | 116.32 | | |
| Forfeited | (37.6) | | (2.8) | | | (40.4) | | | 137.49 | | |
| Unvested as of December 31, 2019 | 1,532.3 | | 286.8 | | | 1,819.1 | | | 141.51 | | 2.39 |
| Granted | 173.1 | | 276.4 | | | 449.5 | | | 124.98 | | |
| Vested | (571.1) | | — | | | (571.1) | | | 137.99 | | |
| Forfeited | (38.1) | | (31.7) | | | (69.8) | | | 136.00 | | |
| Unvested as of December 31, 2020 | 1,096.2 | | 531.5 | | | 1,627.7 | | | 137.42 | | 1.69 |
| Granted | 335.7 | | 218.9 | | | 554.6 | | | 189.40 | | |
| Vested | (471.1) | | (79.0) | | | (550.1) | | | 145.54 | | |
| Forfeited | (48.4) | | (25.4) | | | (73.8) | | | 148.97 | | |
| Unvested as of December 31, 2021 | 912.4 | | 646.0 | | | 1,558.4 | | | $ | 152.27 | | 1.99 |
|
| | | | | | | |
| | Shares
(in thousands) | | Weighted Average
Grant Date
Fair Value | Weighted Average
Remaining
Contractual Life (in years) |
| Unvested as of December 31, 2015 | 706.0 |
| | $ | 111.78 |
| |
| Granted | 299.3 |
| | 107.74 |
| |
| Vested | (203.6 | ) | | 96.37 |
| |
| Forfeited | (50.8 | ) | | 117.48 |
| |
| Unvested as of December 31, 2016 | 750.9 |
| | 113.97 |
| 1.71 |
| Granted | 188.4 |
| | 119.08 |
| |
| Vested | (186.5 | ) | | 99.23 |
| |
| Forfeited | (25.1 | ) | | 117.07 |
| |
| Unvested as of December 31, 2017 | 727.7 |
| | 118.96 |
| 1.24 |
| Granted | 277.2 |
| | 156.13 |
| |
| Vested | (292.5 | ) | | 125.01 |
| |
| Forfeited | (59.7 | ) | | 131.84 |
| |
| Unvested as of December 31, 2018 | 652.7 |
| | $ | 131.32 |
| 2.02 |
We determine the fair value of RSUs, subject only to service requirements, based on the closing market price of our common stock on the grant date. PSUs are subject to service requirements and one or more performance measures, including (i) performance conditions (e.g. achievement against earnings per share targets) and (ii) for certain awards, a market condition (e.g. total shareholder return performance against a peer group). We determine the fair value of PSUs based on the closing market price of our common stock on the grant date taking into consideration the likelihood of achieving each performance condition and the market condition valuation, as applicable, based on the output of Monte Carlo simulations. Less than 10% of the unvested awards as of December 31, 2018 contained a market condition, and approximately 10% of the grant date fair value of these awards was linked to the market condition. The portion of PSU awards with a market condition was not material. As of December 31, 2018,2021, we had $36.6$101.8 million of unamortized deferred compensation related to unvested RSUs and PSUs, which we anticipate to be recognized over varying periods into 2022.
2026; $9.0 million relates to the awards issued in conjunction with the HFF acquisition in 2019.
Shares vested during the years ended December 31, 2018, 20172021, 2020 and 2016,2019, had grant date fair values of $43.3$80.1 million, $18.5$78.8 million, and $19.6$33.5 million, respectively. The increase in 2018 reflects the additional PSUs awarded during the year. Shares granted during the years ended December 31, 2018, 20172021, 2020 and 20162019 had grant date fair values of $36.5$105.0 million, $22.4$56.2 million and $32.2$210.8 million, respectively.
Other Stock-Based Compensation Programs
As previously discussed, During the year ended December 31, 2019, we also maintain the SAYE plan for our UK-based employees. There were approximately 260granted 1,111.3 thousand shares available for grant underof RSU awards to HFF employees in conjunction with the SAYE plan asHFF acquisition.
Options activity under the SAYE plan is presented in the following table.
|
| | | | | | | | | |
| | Year Ended December 31, |
| (options in thousands) | 2018 | 2017 | 2016 |
| Options granted | — |
| 85 |
| — |
|
| Exercise price - options granted | $ | — |
| $ | 90.97 |
| $ | — |
|
| | | | |
| Options exercised | 19 |
| 28 |
| 20 |
|
| Weighted average exercise price | $ | 142.96 |
| $ | 121.70 |
| $ | 70.37 |
|
The fair values of options granted under the SAYE plan are amortized over their respective vesting periods. There were approximately 97 thousand, 133 thousand, and 128 thousand options outstanding under the SAYE plan as of December 31, 2018, 2017 and 2016, respectively.
Defined Contribution Plans
We have a qualified profit sharing plan subject to United States Internal Revenue Code Section 401(k) for eligible U.S. employees. We make employer contributions under this qualified profit sharing plan that are reflected in Compensation and benefits in the accompanying Consolidated Statements of Comprehensive Income. Based on the impact from the COVID-19 pandemic, the employer contributions were suspended between May and December of 2020. The related trust assets of this plan are managed by trustees and are excluded from the accompanying Consolidated Financial Statements. In addition, we maintain several defined contribution retirement plans for eligible non-U.S. employees. The table below provides detail of employer contributions for these plans.
| | | | | | | | | | Year Ended December 31, |
| | Year Ended December 31, | |
| ($ in millions) | 2018 | 2017 | 2016 | |
| (in millions) | | (in millions) | 2021 | 2020 | 2019 |
| Employer contributions (US employees) | $ | 28.8 |
| 27.8 |
| 23.4 |
| Employer contributions (US employees) | $ | 42.7 | | 14.6 | | 37.1 | |
| Employer contributions (non-US employees) | 30.7 |
| 25.5 |
| 27.2 |
| Employer contributions (non-US employees) | 42.4 | | 37.9 | | 35.2 | |
Defined Benefit Plans
We maintain five5 defined benefit pension plans across Europe. It is our policy to fund at least the minimum annual contributions as actuarially determined and as required by applicable laws and regulations. Our contributions to these plans are invested by the plan trustee and, if the investment performance is not sufficient, we may be required to provide additional contributions to cover any pension underfunding. Our largest plan has been closed to new entrants since 2013. The following table provides the projected benefit obligation and plan assets, the net of which represents our funded status, as well as the accumulated benefit obligations of our defined benefit pension plans.
| | | | | | | | |
| Year Ended December 31, |
| (in millions) | 2021 | 2020 |
| Projected benefit obligation | $ | 442.4 | | 486.6 | |
| Fair value of plan assets | 506.2 | | 497.7 | |
| Funded status and net amount recognized | 63.8 | | 11.1 | |
| | |
| Accumulated benefit obligation | $ | 442.0 | | 486.2 | |
|
| | | | | |
| | Year Ended December 31, |
| ($ in millions) | 2018 | 2017 |
| Projected benefit obligation | $ | 365.6 |
| 402.2 |
|
| Fair value of plan assets | 384.3 |
| 408.9 |
|
| Funded status and net amount recognized | 18.7 |
| 6.7 |
|
| | | |
| Accumulated benefit obligation | $ | 365.6 |
| 402.2 |
|
The primary driver for the year-over-year change in projected benefit obligation is an actuarial gain driven by an increase in the discount rate assumptions.
Defined benefit pension plan amounts recorded in the Consolidated Balance Sheets are presented in the below table.
| | | | | | | | December 31, |
| | December 31, | |
| ($ in millions) | 2018 | 2017 | |
| (in millions) | | (in millions) | 2021 | 2020 |
| Pension assets (included in Other assets) | $ | 25.2 |
| 22.4 |
| Pension assets (included in Other assets) | $ | 72.9 | | 26.2 | |
| Pension liabilities (included in Other liabilities) | (6.5 | ) | (15.7 | ) | Pension liabilities (included in Other liabilities) | (9.1) | | (15.1) | |
| Net asset recognized | $ | 18.7 |
| 6.7 |
| Net asset recognized | $ | 63.8 | | 11.1 | |
| | | | |
| Accumulated other comprehensive loss | $ | 84.7 |
| 92.2 |
| Accumulated other comprehensive loss | $ | 70.1 | | 116.2 | |
Net periodic pension cost (benefit) was not material for the years ended December 31, 2018, 2017,2021, 2020, and 2016.2019.
8. INCOME TAXES
Our provision for income taxes consisted of the following:
| | | | | | | | | | | Year Ended December 31, |
| | Year Ended December 31, | |
| ($ in millions) | 2018 | 2017 | 2016 | |
| (in millions) | | (in millions) | 2021 | 2020 | 2019 |
| U.S. federal: | U.S. federal: | | | U.S. federal: | |
| | Current | $ | 39.8 |
| 12.2 |
| 1.3 |
| | Current | $ | 95.1 | | 16.4 | | 38.2 | |
| | Noncurrent | 35.7 |
| 122.2 |
| — |
| | Noncurrent | — | | — | | 0.7 | |
| | Deferred | (20.1 | ) | (23.7 | ) | (5.4 | ) | | Deferred | 29.1 | | 3.8 | | (12.9) | |
| | | $ | 55.4 |
| 110.7 |
| (4.1 | ) | | | $ | 124.2 | | 20.2 | | 26.0 | |
| State and Local: | State and Local: | | | State and Local: | |
| | Current | $ | 12.5 |
| 5.4 |
| 8.2 |
| | Current | $ | 34.6 | | 12.5 | | 15.1 | |
| | Noncurrent | 7.5 |
| 19.1 |
| — |
| | Noncurrent | — | | — | | — | |
| | Deferred | (5.0 | ) | (5.0 | ) | (0.9 | ) | | Deferred | 11.8 | | 0.2 | | (7.0) | |
| | | $ | 15.0 |
| 19.5 |
| 7.3 |
| | | $ | 46.4 | | 12.7 | | 8.1 | |
| International: | International: | | | International: | |
| | Current | $ | 145.3 |
| 141.2 |
| 105.4 |
| | Current | $ | 156.0 | | 103.7 | | 156.9 | |
| | Deferred | (1.4 | ) | (15.1 | ) | 9.2 |
| | Deferred | (62.3) | | (29.7) | | (31.3) | |
| | | $ | 143.9 |
| 126.1 |
| 114.6 |
| | | $ | 93.7 | | 74.0 | | 125.6 | |
| Total | Total | $ | 214.3 |
| 256.3 |
| 117.8 |
| Total | $ | 264.3 | | 106.9 | | 159.7 | |
Our 2017 and 2018 income tax expense was significantlytaxes in 2019 were impacted by tax legislation enacted in the United States late in 2017 and by interpretive regulatory guidance issued through December 2018. On December 22, 2017, the U.S. government enacted tax reform legislation, commonly known as the Tax Cuts and Jobs Act (the Act).("the Act"), and by interpretive regulatory guidance afterward. The Act brought significant changes to the U.S. corporate income tax system, including (i) a federal corporate rate reduction from 35% to 21%; (ii) transition of U.S. international taxation from a worldwide tax system to a modified territorial tax system, including a "transition tax" payable over an eight year period for those foreign earnings not previously taxed in the U.S.; (iii) limitations on the deductibility In 2019, we recorded $4.3 million of interest expenseadjustments to lower our prior provision, due to further regulatory interpretation and executive compensation; (iv) creation of a new minimumstate income tax otherwise known as the Base Erosion Anti-Abuse Tax; and (v) a requirement that certain income such as Global Intangible Low-Taxed Income earned by foreign subsidiaries be included in U.S. taxable income.
Throughout 2018, the U.S. Internal Revenue Service and the U.S. Treasury Department issued notices, proposed regulations, and final regulations which provided interpretive guidance to taxpayers on the Act. Most significantly to our position, proposed regulations issued in November 2018 provided guidance on the application of the foreign tax credit to the transition tax. For U.S. tax purposes, our foreign subsidiaries have a November 30 fiscal year end. Our interpretation of the proposed regulations determined foreign tax credit computations for such subsidiaries was less favorable than we originally concluded. As such, we lowered the foreign tax credit amount in the calculation of our transition tax and, therefore, recognized additional expense in 2018, as noted below.
The SEC staff issued guidance on accounting for the tax effects of the Act, including allowing a one-year measurement period for companies to complete the accounting. In accordance with that guidance, we recorded additional income tax expense of $47.0 million within our 2018 income tax provision for the transition tax noted above. This is an increment to the $125.9 million recognized in 2017 income tax expense. In the aggregate, we have recognized $172.9 million of expense associated with the Act, which is composed of (i) a $184.4 million tax liability on deemed repatriation of foreign earnings dating back to 1997, partially offset by (ii) a benefit for the remeasurement of deferred tax liabilities reflecting the new lower U.S. federal tax rate. As of December 31, 2018, we believe our accounting for the effect of the Act is complete.
Our provisional expense amount recorded in the fourth quarter of 2017 reflected our estimation of the transition tax based upon the statute and its legislative history, together with an estimation of the deferred income tax consequences of the change in the U.S. federal income tax rate. The additional expense recorded in the fourth quarter of 2018 reflected (i) the additional transition tax made clear by the proposed regulations on foreign tax credits issued in November 2018 and (ii) an adjustment to the deferred tax consequences based upon the filing of our 2017 U.S. income tax return in October 2018.Act.
With respect to the Base Erosion Anti-Abuse Tax and Global Intangible Low-Taxed Income Tax, we treat any associated income tax as a period cost such that we will record an expense provision for any year we are subject to the taxes. Accordingly, we have included provisions in 2018 tax expense to reflect the estimated impact of these taxes.taxes was included in our provision for income taxes in 2021, 2020 and 2019.
In 20182021, 2020 and 2016,2019 our current tax expense was increased by $22.2$52.4 million, $2.9 million and $21.8$0.3 million, respectively, and our deferred tax expense reduced by a corresponding amount, due to the generation of net operating loss carryovers. In 2017, our current tax expense was decreased by $3.0 million due to the utilization of net operating loss carryovers.
Income tax expense differed from the amounts computed by applying the U.S. federal income tax rate of 21% to earnings before provision for income taxes as a result of the following:
| | | | | | | | | | | | | | | | | | | | | | | | | | | | | |
| Year Ended December 31, |
| ($ in millions) | 2021 | | 2020 | | 2019 |
| Income tax expense at statutory rates | $ | 256.9 | | 21.0 | % | | $ | 111.2 | | 21.0 | % | | $ | 146.5 | | 21.0 | % |
| Increase (reduction) in income taxes from: | | | | | | | | |
| State and local income taxes, net of federal income tax benefit | 39.7 | | 3.2 | | | 9.4 | | 1.8 | | | 4.9 | | 0.7 | |
| | | | | | | | | |
| Nondeductible expenses | 17.6 | | 1.4 | | | 11.2 | | 2.1 | | | 18.9 | | 2.7 | |
| International earnings taxed at various rates | (22.6) | | (1.8) | | | (20.5) | | (3.9) | | | (8.7) | | (1.3) | |
| U.S. capital loss carryover | (35.2) | | (2.9) | | | — | | — | | | — | | — | |
| Valuation allowance | 34.2 | | 2.8 | | | 4.3 | | 0.8 | | | 7.2 | | 1.0 | |
| | | | | | | | | |
| Other, net | (26.3) | | (2.1) | | | (8.7) | | (1.6) | | | (9.1) | | (1.2) | |
| Total | $ | 264.3 | | 21.6 | % | | $ | 106.9 | | 20.2 | % | | $ | 159.7 | | 22.9 | % |
|
| | | | | | | | | | | | | | | | | | |
| | Year Ended December 31, |
| ($ in millions) | 2018 | | 2017 | | 2016 |
| Income tax expense at statutory rates | $ | 148.3 |
| 21.0 | % | | $ | 187.5 |
| 35.0 | % | | $ | 162.3 |
| 35.0 | % |
| | Increase (reduction) in income taxes from: | | | | | | | | |
| | State and local income taxes, net of federal income tax benefit | 2.8 |
| 0.4 |
| | (0.1 | ) | — |
| | 5.9 |
| 1.3 |
|
| | Amortization of goodwill and other intangibles | (3.4 | ) | (0.5 | ) | | (6.7 | ) | (1.3 | ) | | (5.7 | ) | (1.2 | ) |
| | Nondeductible expenses | 14.6 |
| 2.1 |
| | 7.0 |
| 1.3 |
| | 6.7 |
| 1.4 |
|
| | International earnings taxed at various rates | (21.1 | ) | (3.0 | ) | | (69.0 | ) | (12.9 | ) | | (59.8 | ) | (12.9 | ) |
| | Valuation allowances | 12.4 |
| 1.8 |
| | 5.8 |
| 1.1 |
| | 8.3 |
| 1.8 |
|
| | Transition tax and deferred tax due to U.S. tax reform | 47.0 |
| 6.7 |
| | 125.9 |
| 23.5 |
| | — |
| — |
|
| | Other, net | 13.7 |
| 1.9 |
| | 5.9 |
| 1.1 |
| | 0.1 |
| 0.1 |
|
| Total | $ | 214.3 |
| 30.4 | % | | $ | 256.3 |
| 47.8 | % | | $ | 117.8 |
| 25.5 | % |
With respect to international earnings taxed at varying rates, we have operations which constitute a taxable income presence in 9192 countries or other taxable jurisdictions outside of the U.S. which are treated as such by the U.S. Internal Revenue Code. Of those countries or other taxable jurisdictions, 6968 had income tax rates lower than the combined U.S. federal and state income tax rate in 2018.2021.
With respect to jurisdictions in which we operate with very low tax rates (those with effective national and local combined tax rates of 25% or lower), income from Hong Kong (16.5%), Singapore (17%), the United Kingdom (19%) and Saudi Arabia (20%) represent the most significant components of the international earnings line item in our effective tax rate reconciliation. In the aggregate, these very low rate jurisdictions contributed substantially all of the difference between the actual income tax provision for international earnings and the equivalent provision at the U.S. federal and state statutory rate in 2018. The remaining difference was contributed by earnings in jurisdictions with effective tax rates above 25% and by earnings of insignificant amounts in verydefining "very low tax rate jurisdictions other than those noted above.
In defining very low tax rate jurisdictions,jurisdictions", we consider effective tax rates which applied in 20182021 based upon income levels and including national and municipal, state or provincial taxes also based upon income levels, which may cause those effective rates to differ from the maximum national statutory rates for the jurisdictions. We consider jurisdictions with a tax rate of 25% or lower to be very low tax rate jurisdictions, based upon our historical practice. Effective January 1, 2018, the U.S. federal income tax rate was reduced to 21%. However, factoring in the impact of state income taxes, we do not consider the U.S. to be a very low tax rate jurisdiction. With respect to very low tax rate jurisdictions in which we operate, income from Hong Kong (16.5%), Singapore (17%), and Saudi Arabia (20%) represent the most significant components of the international earnings line item in our effective tax rate reconciliation. In the aggregate, these very low rate jurisdictions contributed substantially all of the difference between the actual income tax provision for international earnings and the equivalent provision at the U.S. federal and state statutory rate in 2021.
Our income before taxes from domestic (U.S.) and international sources is presented in the following table.
| | | | | | | | | | Year Ended December 31, |
| | Year Ended December 31, | |
| ($ in millions) | 2018 | 2017 | 2016 | |
| (in millions) | | (in millions) | 2021 | 2020 | 2019 |
| Domestic | $ | 101.3 |
| 62.7 |
| 73.6 |
| Domestic | $ | 798.9 | | 165.2 | | 145.9 | |
| International | 604.7 |
| 473.1 |
| 390.1 |
| International | 424.7 | | 364.4 | | 551.7 | |
| Total | $ | 706.0 |
| 535.8 |
| 463.7 |
| Total | $ | 1,223.6 | | 529.6 | | 697.6 | |
The tax effects of temporary differences that give rise to significant portions of the deferred tax assets and deferred tax liabilities are presented below.
| | | | | | | | | |
| December 31, |
| (in millions) | 2021 | 2020 | |
| Deferred tax assets attributable to: | | | |
| Accrued expenses | $ | 354.2 | | 344.3 | | |
| U.S. federal and state loss and credit carryovers | 82.0 | | 17.9 | | |
| Allowances for uncollectible accounts | 27.1 | | 21.1 | | |
| International loss carryovers | 225.8 | | 163.4 | | |
| | | |
| Pension liabilities | 17.6 | | 25.0 | | |
| Other | 1.9 | | 13.1 | | |
| Deferred tax assets | 708.6 | | 584.8 | | |
| Less: valuation allowances | (128.8) | | (71.4) | | |
| Net deferred tax assets | $ | 579.8 | | 513.4 | | |
| | | |
| Deferred tax liabilities attributable to: | | | |
| Property and equipment | $ | 23.1 | | 14.8 | | |
| Intangible assets | 342.8 | | 296.8 | | |
| Income deferred for tax purposes | 6.3 | | 10.1 | | |
| Investments | 56.2 | | 14.1 | | |
| Other | 0.3 | | 1.1 | | |
| Deferred tax liabilities | $ | 428.7 | | 336.9 | | |
| Net deferred taxes | $ | 151.1 | | 176.5 | | |
|
| | | | | |
| | December 31, |
| ($ in millions) | 2018 | 2017 |
| Deferred tax assets attributable to: | | |
| Accrued expenses | $ | 216.0 |
| 230.6 |
|
| U.S. federal and state loss and credit carryovers | 24.1 |
| 15.2 |
|
| Allowances for uncollectible accounts | 17.5 |
| 16.5 |
|
| International loss carryovers | 142.5 |
| 134.8 |
|
| Pension liabilities | 17.7 |
| 20.4 |
|
| Other | 11.6 |
| — |
|
| Deferred tax assets | 429.4 |
| 417.5 |
|
| Less: valuation allowances | (79.2 | ) | (59.7 | ) |
| Net deferred tax assets | $ | 350.2 |
| 357.8 |
|
| | | |
| Deferred tax liabilities attributable to: | | |
| Property and equipment | $ | 14.2 |
| 17.9 |
|
| Intangible assets | 132.2 |
| 121.6 |
|
| Income deferred for tax purposes | 5.9 |
| 43.4 |
|
| Investment in real estate ventures | 8.0 |
| 2.0 |
|
| Other | 12.6 |
| 7.0 |
|
| Deferred tax liabilities | $ | 172.9 |
| 191.9 |
|
| Net deferred taxes | $ | 177.3 |
| 165.9 |
|
We have not provided a deferred tax liability on the unremitted foreign earnings of international subsidiaries because it is our intent to permanently reinvest such earnings outside of the U.S. If repatriation of all such earnings were to occur, we would incur withholding taxes, dividend distribution taxes, and potentially an amount of gain taxation which is not presently determinable.
As of December 31, 2018,2021, we had an available U.S. federal net operating loss carryover of $49.8$62.5 million from an acquired company,companies, for which we have established a full valuation allowance due to significant statutory limitations on its usage, and which will begin to expire in 2020.2028. We have U.S. state net operating loss ("NOL") carryovers with a tax effect of $13.6$19.2 million, which expire at various dates through 2038,2041, and international net operating lossNOL carryovers of $646.8$1,014.2 million, which generally do not have expiration dates. The change in deferred tax balances for net operating lossNOL carryovers from 20172020 to 20182021 included increases from current year losses, acquired NOL carryovers and changes in the tax rates at which carryovers will be utilized; and decreases from current year estimated utilization.
As of December 31, 2018,2021, we believe it is more-likely-than-not the net deferred tax assets of $177.3$151.1 million will be realized based upon our estimates of future income and the consideration of net operating losses, earnings trends and tax planning strategies. Valuation allowances have been provided with regard to the tax benefit of certain international net operating loss carryovers, for which we have concluded recognition is not yet appropriate. In 2018,2021, we reduced valuation allowances by $9.5$6.0 million on some jurisdictions' net operating losses due to the utilization or expiration of those losses,losses; and we increased valuation allowances by $32.3$66.7 million for other jurisdictions based upon circumstances that caused us to establish or continue to provide valuation allowances on current or prior year losses (including acquired NOL carryovers) in addition to those provided in prior years.years, and for capital loss carryovers incurred in 2021. The balance of the movement in valuation allowances comparing December 31, 20182021 to December 31, 20172020 was attributable to the effect of changes in foreign currency exchange rates.
As of December 31, 2018,2021, our net current payable for income tax was $59.1$33.7 million, consisting of a current receivable of $156.2$187.3 million and current payable of $215.3$221.1 million, and our net noncurrent liability was $171.2$144.6 million, entirely a noncurrent payable. As of December 31, 2017,2020, our net current receivable for income tax was $35.9$20.6 million, consisting of a current receivable of $144.7$221.5 million and a current payable of $108.8$200.9 million, and our net noncurrent liability was $177.6$163.6 million, entirely a noncurrent payable.
We file income tax returns in the U.S. (including 46 states, 25 cities, the District of Columbia and Puerto Rico), the United Kingdom (including England, Scotland and Scotland)Wales), Australia, Germany, The People's Republic of China (including Hong Kong and Macau), France, Japan, Singapore, India, the Netherlands, Spain and 8178 other countries. Generally, the Company's open tax years include those from 20142017 to the present, although reviews of taxing authorities for more recent years have been completed or are in process in a number of jurisdictions.
As of December 31, 2018,2021, we were under examination in Belgium, the United Kingdom, France,Germany, Poland, Russia, Turkey, Australia, China, India, Indonesia, Japan, Korea, Malaysia, the Philippines, Singapore and Thailand; in the U.S., we were under examination in the states of Colorado, Massachusetts, MichiganMinnesota, and Minnesota.in New York City.
A reconciliation of the beginning and ending amount of unrecognized tax benefits is presented in the following table.
|
| | | | | |
| ($ in millions) | 2018 | 2017 |
| Balance as of January 1 | $ | 49.4 |
| 37.6 |
|
| Additions based on tax positions related to the current year | 8.3 |
| 8.0 |
|
| Increase/(Decrease) related to tax positions of prior years | 5.0 |
| 3.8 |
|
| Lapse of statute of limitations | — |
| — |
|
| Balance as of December 31 | $ | 62.7 |
| 49.4 |
|
| | | | | | | | |
| (in millions) | 2021 | 2020 |
| Balance as of January 1, | $ | 75.3 | | 78.2 | |
| Additions based on tax positions related to the current year | 5.7 | | 2.8 | |
| Increase related to tax positions of prior years | (1.7) | | (5.0) | |
| Settlements with taxing authorities | — | | (0.7) | |
| Balance as of December 31, | $ | 79.3 | | 75.3 | |
We believe it is reasonably possible that matters for which we have recorded $23.4$32.0 million of unrecognized tax benefits as of December 31, 2018,2021, will be resolved during 2019.2022. The recognition of tax benefits, and other changes to the amounts of our unrecognized tax benefits, may occur as the result of ongoing operations, the outcomes of audits or other examinations by tax authorities, or the passing of statutes of limitations. We do not expect changes to our unrecognized tax benefits to have a significant impact on net income, the financial position, or the cash flows of JLL. We do not believe we have material tax positions for which the ultimate deductibility is highly certain, but there is uncertainty about the timing of such deductibility.
We recognize interest accrued and penalties, if any, related to income taxes as a component of income tax expense. During the years ended December 31, 2018,2021, 2020 and 2017, we recognized $1.6 million and $1.1 million, respectively, in2019, the amount of interest expense and no penalties. Duringpenalties was not material. In addition, the year ended December 31, 2016, we recognized no interest expense or penalties. We had approximately $4.4 million and $2.8 millionamount of accrued interest related to income taxes was not material as of December 31, 20182021, 2020 and 2017, respectively.2019.
| |
9. | FAIR VALUE MEASUREMENTS |
9. FAIR VALUE MEASUREMENTS
We measure certain assets and liabilities in accordance with ASC 820, Fair Value Measurements and Disclosures, which defines fair value as the price that would be received for an asset, or paid to transfer a liability, in an orderly transaction between market participants on the measurement date. In addition, it establishes a framework for measuring fair value according to the following three-tier fair value hierarchy:
•Level 1 - Quoted prices for identical assets or liabilities in active markets accessible as of the measurement date;
•Level 2 - Inputs, other than quoted prices in active markets, that are observable either directly or indirectly; and
•Level 3 - Unobservable inputs in which there is little or no market data, which require the reporting entity to develop its own assumptions.
Financial Instruments
Our financial instruments include Cash and cash equivalents, Trade receivables, Notes and other receivables, Reimbursable receivables, Warehouse receivables, restricted cash, contract assets, Accounts payable, Reimbursable payables, Short-term borrowings, Current portion of long-term debt, contract liabilities, Warehouse facilities, Credit facility, Long-term debt and foreign currency forward contracts. The carrying amounts of Cash and cash equivalents, Trade receivables, Notes and other receivables, Reimbursable receivables, restricted cash, contract assets, Accounts payable, Reimbursable payables, contract liabilities and the Warehouse facilities approximate their estimated fair values due to the short-term nature of these instruments. The carrying values of our Credit facility and Short-term borrowings approximate their estimated fair values given the variable interest rate terms and market spreads.
We estimated the fair value of our Long-termlong-term debt, including its current portion, as $671.4$687.2 million and $712.6$723.7 million as of December 31, 20182021 and 2017,2020, respectively, using dealer quotes that are Level 2 inputs in the fair value hierarchy. The carrying value of our Long-termlong-term debt was $671.5includes the current portion of $274.7 million, net of $0.3 million debt issuance costs, as of December 31, 2021, and the long-term portion of $395.6 million and $690.6$702.0 million as of December 31, 20182021 and 2017,2020, respectively, which included debt issuance costs of $3.7$1.4 million and $4.3$2.5 million, respectively.
Investments in Real Estate Ventures at Fair Value - Net Asset Value ("NAV")
We report aFor the majority of our investments in real estate ventures at fair value. For such investments, we increase or decrease our investment each reporting period by the change in the fair value and we report these fair value adjustments in the Consolidated Statements of Comprehensive Income within Equity earnings from real estate ventures.
Of our investments reported at fair value, we generally estimate the fair value using the NAV per share (or its equivalent) our investees provide. Critical inputs to NAV estimates included valuations of the underlying real estate assets and borrowings, which incorporate investment-specific assumptions such as discount rates, capitalization rates, rental and expense growth rates, and asset-specific market borrowing rates. In instances where the reported NAV per share did not fully incorporate the COVID-19 pandemic’s impact on the fair value of underlying investments, we recognized an adjustment to decrease the reported NAV. As of December 31, 2021, there were no such adjustments compared with adjustments of $22.8 million as of December 31, 2020. We did not consider any other adjustments to NAV estimates provided by investees, including adjustments for any restrictions to the transferability of ownership interests embedded within investment agreements to which we are a party, to be necessary based upon (i) our understanding of the methodology utilized and inputs incorporated to estimate NAV at the investee level, (ii) consideration of market demand for the specific types of real estate assets held by each venture and (iii) contemplation of real estate and capital markets conditions in the localities in which these ventures operate. As of December 31, 20182021 and 2017,2020, investments in real estate ventures at fair value using NAV were $191.2$372.8 million and $195.0$203.8 million, respectively. As these investments are not required to be classified in the fair value hierarchy, they have been excluded from the following table.
Recurring Fair Value Measurements
The following table categorizes by level in the fair value hierarchy the estimated fair value of our assets and liabilities measured at fair value on a recurring basis.
| | | | | | | | | | | | | | | | | December 31, |
| | December 31, | | 2021 | | 2020 |
| | 2018 | | 2017 | |
| ($ in millions) | Level 1 | Level 2 | Level 3 | | Level 1 | Level 2 | Level 3 | |
| (in millions) | | (in millions) | Level 1 | Level 2 | Level 3 | | Level 1 | Level 2 | Level 3 |
| Assets | | | | | | Assets | |
| Investments in real estate ventures - fair value | $ | 44.6 |
| — |
| 11.5 |
| | 47.3 |
| — |
| — |
| |
| Investments - fair value | | Investments - fair value | $ | 84.5 | | — | | 182.3 | | | 77.2 | | — | | 59.3 | |
| Foreign currency forward contracts receivable | — |
| 6.5 |
| — |
| | — |
| 13.2 |
| — |
| Foreign currency forward contracts receivable | — | | 15.9 | | — | | | — | | 13.1 | | — | |
| Warehouse receivables | — |
| 331.2 |
| — |
| | — |
| 317.5 |
| — |
| Warehouse receivables | — | | 822.3 | | — | | | — | | 1,529.2 | | — | |
| Deferred compensation plan assets | — |
| 258.2 |
| — |
| | — |
| 229.7 |
| — |
| Deferred compensation plan assets | — | | 528.8 | | — | | | — | | 446.3 | | — | |
| Mortgage banking derivative assets | — |
| — |
| 32.4 |
| | — |
| — |
| 19.0 |
| Mortgage banking derivative assets | — | | — | | 60.4 | | | — | | — | | 87.1 | |
| Total assets at fair value | $ | 44.6 |
| 595.9 |
| 43.9 |
| | 47.3 |
| 560.4 |
| 19.0 |
| Total assets at fair value | $ | 84.5 | | 1,367.0 | | 242.7 | | | 77.2 | | 1,988.6 | | 146.4 | |
| Liabilities | | | | | Liabilities | |
| Foreign currency forward contracts payable | $ | — |
| 8.6 |
| — |
| | — |
| 1.9 |
| — |
| Foreign currency forward contracts payable | $ | — | | 0.8 | | — | | | — | | 3.4 | | — | |
| Deferred compensation plan liabilities | — |
| 251.8 |
| — |
| | — |
| 228.4 |
| — |
| Deferred compensation plan liabilities | — | | 513.0 | | — | | | — | | 427.6 | | — | |
| Earn-out liabilities | — |
| — |
| 192.0 |
| | — |
| — |
| 227.1 |
| Earn-out liabilities | — | | — | | 84.1 | | | — | | — | | 85.7 | |
| Mortgage banking derivative liabilities | — |
| — |
| 26.1 |
| | — |
| — |
| 10.3 |
| Mortgage banking derivative liabilities | — | | — | | 38.5 | | | — | | — | | 73.4 | |
| Total liabilities at fair value | $ | — |
| 260.4 |
| 218.1 |
| | — |
| 230.3 |
| 237.4 |
| Total liabilities at fair value | $ | — | | 513.8 | | 122.6 | | | — | | 431.0 | | 159.1 | |
Investments in Real Estate Ventures
We classify one investment as Level 1 in the fair value hierarchy as a quoted price is readily available. We increase or decrease our investment each reporting period by the change in the fair value of the investment. We report thesethe fair value adjustments in the Consolidated Statements of Comprehensive Income within Equity earnings from real estate ventures.earnings.
Investments classified as Level 3 in the fair value hierarchy represent investments in early-stage non-public entities where we elected the fair value option. The carrying value is generally deemed to approximate the fair value of these investments due to the proximity of the investment date to the balance sheet date as well as investee-level performance updates. To the extent there are changes in fair value, a result of pricing in subsequent funding rounds or changes in business strategy, for example, we recognize such changes through Equity earnings.
Foreign Currency Forward Contracts
We regularly use foreign currency forward contracts to manage our currency exchange rate risk related to intercompany lending and cash management practices. These contracts are on the Consolidated Balance Sheets as current assets and current liabilities. We determine the fair values of these contracts based on current market rates. The inputs for these valuations are Level 2 in the fair value hierarchy. As of December 31, 20182021 and 2017,2020, these contracts had a gross notional value of $1.99$2.61 billion ($0.841.51 billion on a net basis) and $2.43$2.34 billion ($1.821.42 billion on a net basis), respectively.
We record the asset and liability positions for our foreign currency forward contracts based on the net payable or net receivable position with the financial institutions from which we purchase these contracts. The $6.5$15.9 million asset as of December 31, 20182021 was composed of gross contracts with receivable positions of $6.7$19.2 million and payable positions of $0.2$3.3 million. The $8.6$0.8 million liability position as of December 31, 20182021 was composed of gross contracts with receivable positions of $0.6$0.2 million and payable positions of $9.2$1.0 million. As of December 31, 2017,2020, the $13.2$13.1 million asset was composed of gross contracts with receivable positions of $14.4$13.5 million and payable positions of $1.2$0.4 million. The $1.9$3.4 million liability position as of December 31, 2017,2020, was composed of gross contracts with receivable positions of $2.3$2.7 million and payable positions of $4.2$6.1 million.
Warehouse Receivables
The fair value of the Warehouse receivables is based on already locked-in security-buy prices. As of December 31, 20182021 and 2017,2020, all of our Warehouse receivables included in the Consolidated Balance Sheets were under commitment to be purchased by government-sponsored enterprises ("GSEs") or by a qualifying investor as part of a U.S. government or GSE mortgage-
backedmortgage-backed security program. The Warehouse receivables are classified as Level 2 in the fair value hierarchy as all significant inputs are readily observable.
Deferred Compensation Plan
We maintain a deferred compensation plan for certain of our U.S. employees that allows them to defer portions of their compensation. We invest directly in insurance contracts which yield returns to fund these deferred compensation obligations. We recognize an asset for the amount that could be realized under these insurance contracts as of the balance sheet date, and we adjust the deferred compensation obligation to reflect the changes in the fair value of the amount owed to the employees. The inputs for this valuation are Level 2 in the fair value hierarchy. We recorded this plan on the Consolidated Balance Sheets as of December 31, 20182021 as Deferred compensation plan assets of $258.2$528.8 million, long-term deferred compensation plan liabilities of $251.8$513.0 million, included in Deferred compensation, and as a reduction of equity, Shares held in trust, of $5.8$5.2 million. We recorded this plan on the Consolidated Balance Sheets as of December 31, 20172020 as Deferred compensation plan assets of $229.7$446.3 million, long-term deferred compensation plan liabilities of $228.4$427.6 million, included in Deferred compensation, and as a reduction of equity, Shares held in trust, of $5.9$5.6 million.
Earn-Out Liabilities
We classify our Earn-out liabilities within Level 3 in the fair value hierarchy because the inputs we use to develop the estimated fair value include unobservable inputs. We base the fair value of our Earn-out liabilities on the present value of probability-weighted future cash flows related to the earn-out performance criteria on each reporting date. We determine the probabilities of achievement we assign to the performance criteria based on the due diligence we performed at the time of acquisition as well as actual performance achieved subsequent to acquisition. An increase to a probability of achievement would result in a higher fair value measurement. See Note 4, Business Combinations, Goodwill and Other Intangibles,Intangible Assets, for additional discussion of our Earn-out liabilities.
Mortgage Banking Derivatives
In the normal course of business, we enter into simultaneous contractual commitments to originate and sell multi-family mortgage loans at fixed prices with fixed expiration dates. Commitments to borrowers become effective when the borrowers "lock-in" a specified interest rate and maximum principal balance for an established time frame (hereinafter referred to as an interest rate lock commitment or "IRLC"). All mortgagors are evaluated for creditworthiness prior to execution of an IRLC.
We are exposed to market interest risk (the risk of movement in market interest rates following the execution of an IRLC) until a loan is funded and onwards through delivery. To mitigate the effect of the interest rate risk inherent in providing IRLCs to borrowers, we simultaneously enter into a forward commitment to sell the eventual loan associated with the IRLC to a GSE or other investor. Similar to the IRLC, the forward sale commitment locks in an interest rate, maximum principal balance, and price for the sale of the loan. Ultimately, the terms of the forward sale commitment and the IRLC are matched in substantially all respects, with the objective of eliminating market interest rate and other balance sheet risk to the extent practical. As an additional element of protection, forward sale commitments extend for a longer period of time as compared to IRLCs to allow, among other things, for the closing of the loan and processing of paperwork to deliver the loan in accordance with the terms of the sale commitment.
The fair value of our IRLCs to prospective borrowers and the related inputs primarily include, as applicable, the expected net cash flows associated with servicing the loan and the effects of interest rate movements between the date of the IRLC and the balance sheet date based on applicable published U.S. Treasury rates.
The fair value of our forward sales contracts to prospective investors considers the market price movement of a similar security between the trade date and the balance sheet date. The market price changes are multiplied by the notional amount of the forward sales contracts to measure the fair value.
Both the rate lock commitments to prospective borrowers and the forward sale contracts to prospective investors are undesignated derivatives and considered Level 3 valuations due to significant unobservable inputs related to counterparty credit risk. An increase in counterparty credit risk assumptions would result in a lower fair value measurement. The fair valuation is determined using discounted cash flow techniques, and the derivatives are marked to fair value through Revenue in the Consolidated Statements on Comprehensive Income.
The tables below present a reconciliation for assets and liabilities measured at fair value on a recurring basis using significant unobservable inputs (Level 3).
| | | | | | | | | | | | | | | | | | | | | | | | | | |
| (in millions) | Balance as of December 31, 2020 | Net change in fair value | Foreign CTA(1) | Purchases / Additions | Settlements | Level Transfers Out(2) | Balance as of December 31, 2021 |
| Investments | $ | 59.3 | | 67.6 | | 0.2 | | 57.1 | | — | | (1.9) | | | $ | 182.3 | |
| Mortgage banking derivative assets and liabilities, net | 13.7 | | 19.1 | | — | | 187.4 | | (198.3) | | — | | | 21.9 | |
| Earn-out liabilities | 85.7 | | 3.0 | | (0.4) | | 70.2 | | (74.4) | | — | | | 84.1 | |
| | | ($ in millions) | Balance as of December 31, 2017 | Net change in fair value | Foreign CTA1 | Purchases / Additions | Settlements2 | Balance as of December 31, 2018 | |
| (in millions) | | (in millions) | Balance as of December 31, 2019 | Net change in fair value | Foreign CTA(1) | Purchases / Additions | Settlements | Balance as of December 31, 2020 |
| Investments | | Investments | $ | 34.4 | | 6.8 | | — | | 18.1 | | — | | | $ | 59.3 | |
| Mortgage banking derivative assets and liabilities, net | $ | 8.7 |
| 1.1 |
| — |
| 70.4 |
| (73.9 | ) | 6.3 |
| Mortgage banking derivative assets and liabilities, net | 10.2 | | (94.1) | | — | | 197.1 | | (99.5) | | | 13.7 | |
| Earn-out liabilities | 227.1 |
| 7.4 |
| (4.0 | ) | 11.6 |
| (50.1 | ) | 192.0 |
| Earn-out liabilities | 148.5 | | (14.8) | | 1.1 | | — | | (49.1) | | | 85.7 | |
| Investments in real estate ventures | — |
| — |
| — |
| 11.5 |
| — |
| 11.5 |
| |
|
| | | | | | | | | | | | | |
| ($ in millions) | Balance as of December 31, 2016 | Net change in fair value | Foreign CTA1 | Purchases / Additions | Settlements | Balance as of December 31, 2017 |
| Mortgage banking derivative assets and liabilities, net | $ | 15.5 |
| 13.7 |
| — |
| 75.7 |
| (96.2 | ) | 8.7 |
|
| Earn-out liabilities | 229.6 |
| 1.9 |
| 8.4 |
| 11.4 |
| (24.2 | ) | 227.1 |
|
1 (1) CTA: Currency translation adjustments
2 (2) In 2018, earn-out liabilities of $9.1 million were reclassified to guaranteed deferred acquisition obligations.May 2021, an investment previously classified as a Level 3 investment became publicly traded on the NYSE and was considered a Level 1 investment immediately.
Net change in fair value, included in the tables above, is reported in Net income as follows.
|
| | | | |
| Category of Assets/Liabilities using Unobservable Inputs | Consolidated Statements
of Comprehensive Income Account Caption |
Earn-out liabilities (Short-term(short-term and Long-term)long-term) | Restructuring and acquisition charges |
| Investments | Equity earnings |
| Other current assets - Mortgage banking derivative assets | Revenue before reimbursements |
| Other current liabilities - Mortgage banking derivative liabilities | Revenue before reimbursements |
Non-Recurring Fair Value Measurements
We review our investments, in real estate ventures, except those investments otherwise reported at fair value, on a quarterly basis, or as otherwise deemed necessary, for indications of whether we may be unable to recover the carrying value of our investments and whether such investments are other than temporarily impaired. When the carrying amount of the investment is in excess of the estimated future undiscounted cash flows, we use a discounted cash flow approach or other acceptable method to determine the fair value of the investment in computing the amount of the impairment. Our determination of fair value primarily relies on Level 3 inputs. We did not recognize any significant investment-level impairment losses during the three-year period ended December 31, 2018.2021. See Note 5, Investments, in Real Estate Ventures, for additional information, including information related to impairment charges recorded at the investee level.
Short-term borrowings and long-term debt obligations are
10. DEBT
Debt is composed of the following.following obligations.
|
| | | | | |
| | December 31, |
| ($ in millions) | 2018 | 2017 |
| Short-term borrowings: | | |
| Local overdraft facilities | $ | 17.0 |
| 45.4 |
|
| Other short-term borrowings | 15.7 |
| 32.0 |
|
| Total short-term borrowings | 32.7 |
| 77.4 |
|
| Credit facility, net of debt issuance costs of $15.9 and $15.3 | (15.9 | ) | (15.3 | ) |
| Long-term senior notes, 4.4%, face amount of $275.0, due November 2022, net of debt issuance costs of $1.5 and $2.0 | 273.5 |
| 273.0 |
|
| Long-term senior notes, 1.96%, face amount of €175.0, due June 2027, net of debt issuance costs of $1.1 and $1.2 | 199.0 |
| 208.8 |
|
| Long-term senior notes, 2.21%, face amount of €175.0, due June 2029, net of debt issuance costs of $1.1 and $1.1 | 199.0 |
| 208.8 |
|
| Total debt | $ | 688.3 |
| 752.7 |
|
| | | | | | | | |
| December 31, |
| ($ in millions) | 2021 | 2020 |
| Short-term debt: | | |
| Local overdraft facilities | $ | 9.2 | | 12.0 | |
| Other short-term borrowings | 138.7 | | 50.0 | |
| Long-term senior notes, 4.4%, face amount of $275.0, due November 2022, net of debt issuance costs of $0.3 and $— | 274.7 | | — | |
| Total short-term debt | $ | 422.6 | | 62.0 | |
| Credit facility, net of debt issuance costs of $11.8 and $8.7 | 138.2 | | (8.7) | |
| Long-term senior notes, 4.4%, face amount of $275.0, due November 2022, net of debt issuance costs of $— and $0.8 | — | | 274.2 | |
| Long-term senior notes, 1.96%, face amount of €175.0, due June 2027, net of debt issuance costs of $0.6 and $0.8 | 197.9 | | 213.9 | |
| Long-term senior notes, 2.21%, face amount of €175.0, due June 2029, net of debt issuance costs of $0.8 and $0.9 | 197.7 | | 213.9 | |
| Total debt | $ | 956.4 | | 755.3 | |
Credit Facility
On May 17, 2018, we amended ourWe have a $2.75 billion unsecured revolving credit facility (the "Facility"), which improved pricing and extended the maturity date from June 21, 2021 to May 17, 2023. that matures on April 14, 2026. Pricing on the amended Facility ranges from LIBOR plus 0.875% to 1.35%, with pricing as of December 31, 2018,2021, at LIBOR plus 0.95%0.88%. In addition to outstanding borrowings under the Facility presented in the above table, we had outstanding letters of credit under the Facility of $8.6 million and $9.0$0.7 million as of both December 31, 20182021 and 2017, respectively.2020.
The following table provides additional information on our Facility.
| | | | Twelve months ended December 31, | | | Year Ended December 31, |
| ($ in millions) | 2018 | 2017 | ($ in millions) | | 2021 | 2020 |
| Average outstanding borrowings under the Facility | $ | 364.1 |
| 888.5 |
| Average outstanding borrowings under the Facility | | $ | 432.0 | | 865.1 | |
| Effective interest rate on the Facility | 2.9 | % | 2.0 | % | |
| Average effective interest rate on the Facility | | Average effective interest rate on the Facility | | 0.9 | % | 1.6 | % |
We will continue to use the Facility for, but not limited to, business acquisitions, working capital needs (including payment of accrued incentive compensation), co-investment activities, dividend payments, share repurchases and capital expenditures.
Short-Term Borrowings and Long-Term Debt
In addition to our Facility, we have the capacity to borrow up to an additional $61.5$55.5 million under local overdraft facilities. Amounts outstanding are presented in the debt table presented above.
As of December 31, 2018,2021, our senior notes due November 2022 were classified as a current liability as the maturity was within one year.
As of December 31, 2021, our issuer and senior unsecured ratings arewere investment grade: Baa1 (stable outlook) from Moody’s Investors Service, Inc. and BBB+ (stable outlook) from Standard & Poor’s Ratings Services.
Covenants
Our Facility and senior notes are subject to customary financial and other covenants, including cash interest coverage ratios and leverage ratios, as well as event of default conditions. We remained in compliance with all covenants as of December 31, 2018.2021.
Warehouse Facilities
| | | | | | | | | | | | | | | | | |
| December 31, 2021 | | December 31, 2020 |
| ($ in millions) | Outstanding Balance | Maximum Capacity | | Outstanding Balance | Maximum Capacity |
| Warehouse facilities: | | | | | |
BSBY plus 1.30%, expires September 19, 2022(1) | $ | 516.9 | | 700.0 | | | 144.4 | | 400.0 | |
LIBOR plus 1.30%, expires September 16, 2022(2) | 74.7 | | 1,200.0 | | | 768.9 | | 1,600.0 | |
LIBOR plus 1.30%, expires August 27, 2022(3) | 192.8 | | 300.0 | | | 195.9 | | 900.0 | |
LIBOR plus 1.60%, expires July 30, 2022(4) | — | | 400.0 | | | — | | — | |
Fannie Mae ASAP(5) program, SOFR plus 1.25%(6) | 12.5 | | n/a | | 128.8 | | n/a |
| LIBOR plus 1.50% | — | | — | | | 261.6 | | 300.0 | |
| Gross warehouse facilities | 796.9 | | 2,600.0 | | | 1,499.6 | | 3,200.0 | |
| Debt issuance costs | (1.2) | | n/a | | (1.2) | | n/a |
| Total warehouse facilities | $ | 795.7 | | 2,600.0 | | | 1,498.4 | | 3,200.0 | |
|
| | | | | | | | | | |
| | December 31, 2018 | | December 31, 2017 |
| ($ in millions) | Outstanding Balance | Maximum Capacity | | Outstanding Balance | Maximum Capacity |
| Warehouse Facilities: | | | | | |
LIBOR plus 1.30%, expires September 23, 2019 (1) | $ | 217.3 |
| 375.0 |
| | 156.4 |
| 375.0 |
|
LIBOR plus 1.25%, expires September 20, 2019 (2) | 82.9 |
| 775.0 |
| | 74.8 |
| 375.0 |
|
LIBOR plus 1.30%, expires August 31, 2019 (3) | — |
| 100.0 |
| | — |
| 100.0 |
|
| Fannie Mae ASAP program, LIBOR plus 1.30% to 1.45% | 18.9 |
| n/a |
| | 79.2 |
| n/a |
|
| Gross warehouse facilities | 319.1 |
| 1,250.0 |
| | 310.4 |
| 850.0 |
|
| Debt issuance costs | (1.2 | ) | n/a |
| | (1.2 | ) | n/a |
|
| Total warehouse facilities | $ | 317.9 |
| 1,250.0 |
| | 309.2 |
| 850.0 |
|
(1) In 2018,2021, JLL extended the Warehouse facility with an increase to the maximum capacity; previously, the facility had a maturity date of September 20, 2021 and negotiateda maximum capacity of $400.0 million. JLL amended the interest rate to Bloomberg Short-Term Bank Yield Index rate ("BSBY") plus 1.30%; previously, the facility had an interest rate of LIBOR plus 1.40%.
(2) In 2021, JLL extended the Warehouse facility with a decrease to the interest rate; previously, the facility had a maturity date of September 24, 201818, 2021 and an interest rate of LIBOR plus 1.4%1.40%. The temporary maximum capacity increase to $1,600.0 million in the fourth quarter of 2020 expired on January 31, 2021 and the temporary maximum increase to $2,000.0 million in the third quarter of 2021 expired on December 31, 2021; thereafter, the maximum capacity reverted to its original contractual amount.
(2)(3) In 2018,2021, JLL extended the Warehouse facility increased the maximum capacity, and negotiatedwith a decrease to the interest rate; previously, the facility had a maturity date of September 29, 2018, a maximum capacity of $375.0 million,rate and an interest rate of LIBOR plus 1.35%.
(3) In 2018, JLL extended the Warehouse facility, and negotiated a decreaseincrease to the interest rate;maximum capacity; previously, the facility had a maturity date of August 31, 201827, 2021 and interest rate of LIBOR plus 1.40%. The temporary maximum capacity of $900.0 million expired on January 6, 2021.
(4) In 2021, JLL added a new secured borrowing for $400.0 million under a master repurchase agreement that is scheduled to expire on July 30, 2022. Advances are made at 100% of the loan balance and borrowings are secured by the related warehouse receivables and bear interest at LIBOR plus 1.60%.
(5) As Soon As Pooled ("ASAP") funding program.
(6) JLL amended the Fannie Mae ASAP program interest rate to Secured Overnight Financing Rate ("SOFR") plus 1.25%; previously, the facility had an interest rate of LIBOR plus 1.5%1.15%.
We have lines of credit established for the sole purpose of funding our Warehouse receivables. These lines of credit exist with financial institutions and are secured by the related warehouse receivables. Pursuant to these warehouse facilities, we are required to comply with certain financial covenants regarding (i) minimum net worth, (ii) minimum servicing-related loans and (iii) minimum adjusted leverage ratios. We remained in compliance with all covenants under our Warehouse facilities as of December 31, 2018.2021.
As a supplement to our lines of credit, we have an uncommitted facility with Fannie Mae under its As Soon As Pooled ("ASAP") funding program. After origination, we sell certain warehouse receivables to Fannie Mae; the proceeds are used to repay the original lines of credit used to fund the loan. The ASAP funding program requires us to repurchase these loans, generally within 45 days, followed by an immediate, ultimate, sale back to Fannie Mae. The difference between the price paid upon the original sale to Fannie Mae and the ultimate sale reflects borrowing costs.
We
11. LEASES
For the years ended December 31, 2021, 2020, and 2019, operating lease office spaceexpense was $189.2 million, $187.3 million, and $170.5 million, respectively, and variable and short-term lease expense was $37.0 million, $36.0 million, and $33.3 million, respectively. In addition, $148.5 million and $94.3 million of Operating lease right-of-use assets were obtained in various buildingsexchange for lease obligations during the year ended December 31, 2021 and 2020, respectively.
As of December 31, 2021, our own use. The termstotal commitments related to finance leases was $15.3 million. Leases in which we sublet also do not represent a significant portion of these non-cancelable operating leases provide for us to pay base rent and a share of operating expenses and real estate taxes in excess of defined amounts. We also lease equipment under both operating and capital lease arrangements. our leasing activity.
Minimum future lease payments (e.g., base rent for leases of office space) due in each of the next five years and thereafter, as of December 31, 2018,2021, are presented in the below table.table below.
| | | | | | | | |
| (in millions) | | |
| 2022 | | $ | 177.7 | |
| 2023 | | 155.1 | |
| 2024 | | 134.9 | |
| 2025 | | 110.4 | |
| 2026 | | 90.7 | |
| Thereafter | | 308.1 | |
| Total future minimum lease payments | | $ | 976.9 | |
| Less imputed interest | | 108.7 | |
| Total | | $ | 868.2 | |
|
| | | |
| ($ in millions) | |
| 2019 | $ | 167.8 |
|
| 2020 | 153.1 |
|
| 2021 | 132.3 |
|
| 2022 | 99.4 |
|
| 2023 | 81.0 |
|
| Thereafter | 257.3 |
|
| Total | $ | 890.9 |
|
The total of minimum rentals to be received in the future as sublessor under noncancelable operating subleases was $34.9 million as of December 31, 2018.
Total rent expense, including office space and other rentals, was $195.3 million, $197.3 million and $170.4 million for the years ended December 31, 2018, 2017 and 2016, respectively.
| | | | | | | | |
12. | TRANSACTIONS WITH AFFILIATES | December 31, 2021 |
| Weighted average remaining lease term | | 7.1 years |
| Weighted average discount rate | | 3.2 | % |
12. TRANSACTIONS WITH AFFILIATES
As part of our co-investment strategy, we have equity interests in real estate ventures, some of which have certain of our officers as trustees or board of director members, and from which we earn advisory and management fees.
Included in the accompanying Consolidated Financial Statements iswas revenue of $447.8$723.3 million, $231.3$516.4 million, and $251.3$490.0 million for 2018, 20172021, 2020 and 2016,2019, respectively, as well as receivables of $146.5$152.9 million and $63.4$102.2 million as of December 31, 20182021 and 2017,2020, respectively, related to transactions with affiliates. These amounts primarily relate to transactions with the real estate ventures in which we have equity interests.
The outstanding balance of loans to employees are presented in the following table. Such amounts are included in Notes and other receivables and Long-term receivables on our Consolidated Balance Sheets. | | | | | | | | December 31, |
| | December 31, | |
| ($ in millions) | 2018 | 2017 | |
| (in millions) | | (in millions) | 2021 | 2020 |
Loans related to co-investments (1) | $ | 13.8 |
| 11.4 |
| Loans related to co-investments (1) | $ | 16.9 | | 16.4 | |
Advances, travel and other (2) | 202.5 |
| 178.1 |
| Advances, travel and other (2) | 272.7 | | 233.7 | |
| Total | $ | 216.3 |
| 189.5 |
| Total | $ | 289.6 | | 250.1 | |
(1) These nonrecourse loans have been made to allow employees the ability to participate in investment fund opportunities.
(2) Consists primarily of commissions and other compensation advances to employees that are amortized to Compensation and benefits based on performance over required service periods.
The Company does not extend credit or provide personal loans to any director or executive officer of JLL.
104
| |
13. | COMMITMENTS AND CONTINGENCIES |
13. COMMITMENTS AND CONTINGENCIES
We are a defendant in various litigation matters arising in the ordinary course of business, some of which involve claims for damages that are substantial in amount. Many of these litigation matters are covered by insurance (including insurance provided through a consolidated captive insurance company as further discussed below), but they may nevertheless be subject to large deductibles and the amounts being claimed may exceed the available insurance. Although we cannot determine the ultimate liability for these matters, based upon information currently available, we believe the ultimate resolution of such claims and litigation will not have a material adverse effect on our financial position, results of operations or liquidity.
Professional Indemnity Insurance
In order to better manage our global insurance program and support our risk management efforts, we supplement our traditional insurance coverage for certain types of claims by using a wholly-owned captive insurance company. The level of risk retained by our captive insurance company, with respect to professional indemnity claims, is up to $2.5 million per claim, inclusive of the deductible. We contract third-party insurance companies to provide coverage of risk in excess of this amount. When a potential loss event occurs, we estimate the ultimate cost of the claim and accrue the amount in Other current and long-term liabilities on the Consolidated Balance Sheets when probable and estimable. In addition, we have established receivables from third-party insurance providers for claim amounts in excess of the risk retained by our captive insurance company. In total, these receivables were $40.6$22.5 million and $22.0$44.0 million as of December 31, 20182021 and 2017,2020, respectively, and are included in Notes and other receivables and Long-term receivables on the Consolidated Balance Sheets.
The following table shows the professional indemnity accrual activity and related payments.
| | | | | |
| (in millions) | |
| December 31, 2018 | $ | 43.1 | |
| New claims | 0.1 | |
| Prior year claims adjustments (including foreign currency changes) | (2.9) | |
| Claims paid | (2.2) | |
| December 31, 2019 | 38.1 | |
| New claims | 6.7 | |
| Prior year claims adjustments (including foreign currency changes) | 3.8 | |
| Claims paid | (0.4) | |
| December 31, 2020 | 48.2 | |
| New claims | 1.6 | |
| Prior year claims adjustments (including foreign currency changes) | (10.5) | |
| Claims paid | (38.1) | |
| December 31, 2021 | $ | 1.2 | |
|
| | | |
| ($ in millions) | |
| December 31, 2015 | $ | 19.2 |
|
| New claims | 8.0 |
|
| Prior year claims adjustments | — |
|
| Claims paid | (19.9 | ) |
| December 31, 2016 | 7.3 |
|
| New claims | 21.0 |
|
| Prior year claims adjustments | 1.4 |
|
| Claims paid | (3.0 | ) |
| December 31, 2017 | 26.7 |
|
| New claims | 3.5 |
|
| Prior year claims adjustments | 20.5 |
|
| Claims paid | (7.6 | ) |
| December 31, 2018 | $ | 43.1 |
|
As a lenderparticipant in the Fannie Mae DUS program, we retain a portion of the risk of loss for loans we originatethat are originated and sellsold under the DUS program. Net losses on defaulted loans are shared with Fannie Mae based upon established loss-sharing ratios. Generally, ourwe share approximately one-third of incurred losses, is capped atsubject to a cap of 20% of the principal balance of the mortgage at origination. As of December 31, 20182021 and 2017,2020, we had loans, funded and sold, subject to loss-sharing arrangements with an aggregate unpaid principal balance of $8.4$15.4 billion and $8.0$12.2 billion, respectively.
For all DUS program loans with loss-sharing obligations, we record a There were no loan loss accrual equal to the estimated fair value of the guarantee obligations undertaken upon sale of the loan, which reduces our gain on sale of the loan. Subsequently, this accrual is amortized over the life of the loan and recorded as an increase in Revenue on the Statements of Comprehensive Income. At least semi-annually, we perform an analysis of the servicing portfolio with loss-sharing obligations to determine estimated probable losses. If estimated probable losses exceed the existing unamortized guarantee obligation, we record an expense to increase the loan loss accrualincurred for this difference. As of December 31, 2018 and 2017, loan loss accruals were $17.5 million and $16.0 million, respectively, and are included in Other liabilities on the Consolidated Balance Sheets.
| |
14. | RESTRUCTURING AND ACQUISITION CHARGES |
For the years ended December 31, 2018, 20172021, 2020 and 2016, we recognized 2019. See "Financial Guarantees" section of Note 2, Summary of Significant Accounting Policies for additional information.
14. RESTRUCTURING AND ACQUISITION CHARGES
Restructuring and acquisition charges of $38.8 million, $30.7 millioninclude cash and $68.5 million, respectively.
For the year ended December 31, 2018, we recognized $7.4 million related to net increases to earn-out liabilities that arose from prior period acquisition activity. In 2017, we recognized $1.9 million related to net increases to earn-out liabilities that arose from prior period acquisition activity. In 2016, we recognized $6.5 million related to the write-off of an indefinite-lived asset that arose from prior period acquisition activity and $13.5 million related to net increases to earn-out liabilities that arose from prior period acquisition activity.
In all periods, the remainingnon-cash expenses. Cash-based charges primarily consist of (i)(1) severance and employment-related charges, including those related to external service providers, incurred in conjunction with a structural business shift, which can be represented by a notable change in headcount, change in leadership, or transformation of business processes, (ii)(2) acquisition, transaction and integration-related charges, and (3) other restructuring including lease exit charges. Non-cash charges and (iii) otherinclude (1) stock-based compensation expense for retention awards issued in conjunction with the HFF, Inc. ("HFF") acquisition and integration-related charges. (2) fair value adjustments to earn-out liabilities relating to prior-period acquisition activity. Restructuring and acquisition charges are presented in table below.
| | | | | | | | | | | |
| Year Ended December 31, |
| (in millions) | 2021 | 2020 | 2019 |
| Severance and other employment-related charges | $ | 14.3 | | 69.0 | | 31.1 | |
| Restructuring, pre-acquisition and post-acquisition charges | 50.0 | | 51.5 | | 96.9 | |
| Stock-based compensation expense for HFF retention awards | 17.8 | | 36.7 | | 28.0 | |
| Fair value adjustments to earn-out liabilities | 2.6 | | (14.8) | | 28.4 | |
| Restructuring and acquisition charges | $ | 84.7 | | 142.4 | | 184.4 | |
| Portion of total restructuring & acquisition charges related to the acquisition and integration of HFF | $ | 40.0 | | 75.9 | | 115.1 | |
Charges associated with the acquisition and integration of HFF primarily included transaction/deal costs, expenses associated with retention and severance, and other integration expenses, such as early lease termination costs.
The following table showstables show the restructuring and acquisition accrual activity and related payments which are exclusive of the adjustments individually noted above.
|
| | | | | | | | | | | |
| ($ in millions) | Severance & Employment-Related | Lease Exit | Other Restructuring and Acquisition Costs | Total |
| December 31, 2015 | $ | 2.7 |
| 5.7 |
| 0.2 |
| | $ | 8.6 |
|
| Accruals | 28.0 |
| 0.3 |
| 20.2 |
| | 48.5 |
|
| Payments made | (11.0 | ) | (0.5 | ) | (14.6 | ) | | (26.1 | ) |
| December 31, 2016 | 19.7 |
| 5.5 |
| 5.8 |
| | 31.0 |
|
| Accruals | 21.6 |
| 1.3 |
| 5.9 |
| | 28.8 |
|
| Payments made | (27.1 | ) | (1.1 | ) | (10.3 | ) | | (38.5 | ) |
| December 31, 2017 | 14.2 |
| 5.7 |
| 1.4 |
| | 21.3 |
|
| Accruals | 25.5 |
| 0.7 |
| 5.2 |
| | 31.4 |
|
| Payments made | (25.7 | ) | (5.8 | ) | (6.1 | ) | | (37.6 | ) |
| December 31, 2018 | $ | 14.0 |
| 0.6 |
| 0.5 |
| | $ | 15.1 |
|
| | | | | | | | | | | | | | | | | |
| (in millions) | Severance & Employment-Related | Lease
Exit | Other Restructuring and
Acquisition
Costs | Total |
| December 31, 2018 | $ | 14.0 | | 0.6 | | 0.5 | | | $ | 15.1 | |
| Accruals | 31.1 | | 11.1 | | 85.8 | | | 128.0 | |
| Payments made | (20.8) | | (3.3) | | (82.5) | | | (106.6) | |
| December 31, 2019 | 24.3 | | 8.4 | | 3.8 | | | 36.5 | |
| Accruals | 69.0 | | 25.0 | | 26.5 | | | 120.5 | |
| Payments made | (52.0) | | (30.9) | | (29.1) | | | (112.0) | |
| December 31, 2020 | 41.3 | | 2.5 | | 1.2 | | | 45.0 | |
| Accruals | 14.3 | | 11.6 | | 38.4 | | | 64.3 | |
| Payments made | (34.7) | | (13.2) | | (31.6) | | | (79.5) | |
| December 31, 2021 | $ | 20.9 | | 0.9 | | 8.0 | | | $ | 29.8 | |
We expect the majority of accrued severance and employment-related charges and other accrued acquisition costs as of December 31, 20182021 will be paid during the next twelve months. Lease exit payments depend on the terms of various leases, which extend as far out as 2022.2026.
106
| |
15. | ACCUMULATED OTHER COMPREHENSIVE INCOME (LOSS) |
15. ACCUMULATED OTHER COMPREHENSIVE INCOME (LOSS)
The table below presents the changes in Accumulated other comprehensive income (loss) by component.
|
| | | | | | | |
| ($ in millions) | Pension and postretirement benefit | Cumulative foreign currency translation adjustment | Total |
| Balance as of December 31, 2016 | $ | (68.7 | ) | (482.6 | ) | (551.3 | ) |
| Other comprehensive loss before reclassification | 4.4 |
| 202.0 |
| 206.4 |
|
| Amounts reclassified from AOCI after tax expense of $0.9, $- and $0.9 | 3.8 |
| — |
| 3.8 |
|
| Other comprehensive loss after tax benefit of $0.3, $- and $0.3 | 8.2 |
| 202.0 |
| 210.2 |
|
| Balance as of December 31, 2017 | (60.5 | ) | (280.6 | ) | (341.1 | ) |
| Other comprehensive income before reclassification | 0.7 |
| (118.2 | ) | (117.5 | ) |
| Amounts reclassified from AOCI after tax expense of $0.6, $- and $0.6 | 2.4 |
| — |
| 2.4 |
|
| Other comprehensive income after tax expense of $0.3, $- and $0.3 | 3.1 |
| (118.2 | ) | (115.1 | ) |
| Balance as of December 31, 2018 | $ | (57.4 | ) | (398.8 | ) | (456.2 | ) |
| | | | | | | | | | | | | | |
| (in millions) | Pension and postretirement benefit | Cumulative foreign currency translation adjustment | | Total |
| Balance as of December 31, 2019 | $ | (72.0) | | (355.8) | | | $ | (427.8) | |
| Other comprehensive income before reclassification | (12.3) | | 59.8 | | | 47.5 | |
| Amounts reclassified from AOCI after tax expense of $0.7, $- and $0.7 | 3.1 | | — | | | 3.1 | |
| Other comprehensive income after tax benefit of $3.2, $- and $3.2 | (9.2) | | 59.8 | | | 50.6 | |
| Balance as of December 31, 2020 | (81.2) | | (296.0) | | | (377.2) | |
| Other comprehensive income before reclassification | 35.3 | | (56.7) | | | (21.4) | |
| Amounts reclassified from AOCI after tax expense of $0.7, $- and $0.7 | 3.2 | | — | | | 3.2 | |
| Other comprehensive income after tax expense of $7.6, $- and $7.6 | 38.5 | | (56.7) | | | (18.2) | |
| Balance as of December 31, 2021 | $ | (42.7) | | (352.7) | | | $ | (395.4) | |
For pension and postretirement benefits, we report amounts reclassified from Accumulated other comprehensive income (loss) in Other income within the Consolidated Statements of Comprehensive Income.
QUARTERLY RESULTS OF OPERATIONS (UNAUDITED)
The tables on the following pages set forth certain unaudited consolidated statements of operations data for each of our past eight quarters. In our opinion, this information has been presented on the same basis as the audited Consolidated Financial Statements appearing elsewhere in this report, and includes all adjustments, consisting only of normal recurring adjustments and accruals, we consider necessary for a fair presentation. The unaudited consolidated quarterly information should be read in conjunction with our Consolidated Financial Statements and the notes thereto as well as the "Summary of Critical Accounting Policies and Estimates" section within Item 7. Management's Discussion and Analysis of Financial Condition and Results of Operations. The operating results for any quarter are not necessarily indicative of the results for any future period. We note the following points regarding how we prepare and present our financial statements on a periodic basis.
Periodic Accounting for Incentive Compensation
An important part of our overall compensation package is incentive compensation, which we typically pay to employees in the year after it is earned. In our interim financial statements, we have accrued for incentive compensation based on the percentage of compensation costs and adjusted operating income relative to forecasted compensation costs and adjusted operating income for the full year, as substantially all incentive compensation pools are based upon full year results. The impact of this incentive compensation accrual methodology is that we accrue less compensation in the first six months of the year, with the majority of our incentive compensation accrued in the second half of the year, particularly in the fourth quarter, in line with the general trend of increasing revenue and profit as the year progresses as further discussed below. We exclude from our standard accrual methodology incentive compensation pools not subject to the normal performance criteria. These pools are generally accrued for on a straight-line basis.
Income Taxes
We provide for the effects of income taxes on interim financial statements based on our estimate of the effective tax rate for the full year. We assess our effective tax rate on a quarterly basis and reflect the benefit from tax planning actions when we believe it is probable they will be successful. We account for the cumulative catch-up impact of any change in estimated effective tax rate our business realizes in the quarter a change is made. In the fourth quarter of 2017, our provision included $125.9 million of additional expense representing (i) our provisional estimate of the transition tax on deemed repatriated earnings of foreign subsidiaries ("transition tax") and (ii) the net remeasurement of U.S. deferred tax assets and liabilities in response to the enactment of the U.S. tax legislation enacted in December 2017. In the fourth quarter of 2018, we recognized an additional $47.0 million related to the finalization of those items.
Seasonality
Historically, our quarterly revenue and profits have tended to increase from quarter to quarter as the year progresses. This is a result of a general focus in the real estate industry on completing or documenting transactions by calendar year-end and the fact that certain expenses are constant through the year. Historically, we have reported a relatively smaller profit in the first quarter and then increasingly larger profits during each of the following three quarters, excluding the recognition of investment-generated performance fees and realized and unrealized co-investment equity earnings and losses (each of which can be unpredictable). We generally recognize such performance fees and realized co-investment equity earnings or losses when assets are sold, the timing of which is geared toward the benefit of our clients. Non-variable operating expenses, which we treat as expenses when incurred during the year, are relatively constant on a quarterly basis.
JONES LANG LASALLE INCORPORATED QUARTERLY INFORMATION - 2018 (UNAUDITED)
|
| | | | | | | | | | | | | |
| | Quarter Ended | | Year Ended |
| ($ in millions, except per share data) | March 31, 2018 | June 30, 2018 | September 30, 2018 | December 31, 2018 | | December 31, 2018 |
| Revenue: | | | | | | |
| Real Estate Services: | | | | | | |
| Americas | $ | 1,941.0 |
| 2,152.5 |
| 2,201.6 |
| 2,745.9 |
| | $ | 9,041.0 |
|
| EMEA | 783.6 |
| 846.6 |
| 805.6 |
| 1,059.2 |
| | 3,495.0 |
|
| Asia Pacific | 711.3 |
| 812.9 |
| 790.0 |
| 934.3 |
| | 3,248.5 |
|
| LaSalle Investment Management | 119.3 |
| 91.7 |
| 172.6 |
| 150.3 |
| | 533.9 |
|
| Total revenue | 3,555.2 |
| 3,903.7 |
| 3,969.8 |
| 4,889.7 |
| | 16,318.4 |
|
| | | | | | | |
| Operating expenses: | | | | | | |
| Real Estate Services: | | | | | | |
| Americas | 1,894.7 |
| 2,051.6 |
| 2,097.2 |
| 2,575.6 |
| | 8,619.1 |
|
| EMEA | 803.6 |
| 848.0 |
| 794.5 |
| 971.9 |
| | 3,418.0 |
|
| Asia Pacific | 712.2 |
| 789.5 |
| 768.2 |
| 865.5 |
| | 3,135.4 |
|
| LaSalle Investment Management | 90.2 |
| 75.9 |
| 115.3 |
| 118.8 |
| | 400.2 |
|
| Plus: | | | | | | |
| Restructuring charges | 0.7 |
| (11.1 | ) | 3.7 |
| 45.5 |
| | 38.8 |
|
| Total operating expenses | 3,501.4 |
| 3,753.9 |
| 3,778.9 |
| 4,577.3 |
| | 15,611.5 |
|
| | | | | | | |
| Operating income | 53.8 |
| 149.8 |
| 190.9 |
| 312.4 |
| | 706.9 |
|
| | | | | | | |
| Net income attributable to common shareholders | $ | 40.3 |
| 107.8 |
| 134.9 |
| 201.1 |
| | $ | 484.1 |
|
| | | | | | | |
Basic earnings per common share (1) | $ | 0.89 |
| 2.37 |
| 2.96 |
| 4.41 |
| | $ | 10.64 |
|
| | | | | | | |
| Diluted earnings per common share | $ | 0.88 |
| 2.35 |
| 2.93 |
| 4.37 |
| | $ | 10.54 |
|
(1) Earnings per common share amounts are individually calculated for each quarter as well as the full annual period. As a result, quarterly earnings per common share may not sum to the total for the full year.
JONES LANG LASALLE INCORPORATED QUARTERLY INFORMATION - 2017 (UNAUDITED)
|
| | | | | | | | | | | | | |
| | Quarter Ended | | Year Ended |
| ($ in millions, except per share data) | March 31, 2017 | June 30, 2017 | September 30, 2017 | December 31, 2017 | | December 31, 2017 |
| Revenue: | | | | | | |
| Real Estate Services: | | | | | | |
| Americas | $ | 1,799.9 |
| 1,932.5 |
| 1,920.6 |
| 2,362.1 |
| | $ | 8,015.1 |
|
| EMEA | 603.2 |
| 721.2 |
| 750.0 |
| 1,000.6 |
| | 3,075.0 |
|
| Asia Pacific | 626.3 |
| 743.7 |
| 749.4 |
| 887.9 |
| | 3,007.3 |
|
| LaSalle Investment Management | 88.3 |
| 72.9 |
| 102.2 |
| 92.4 |
| | 355.8 |
|
| Total revenue | 3,117.7 |
| 3,470.3 |
| 3,522.2 |
| 4,343.0 |
| | 14,453.2 |
|
| | | | | | | |
| Operating expenses: | | | | | | |
| Real Estate Services: | | | | | | |
| Americas | 1,767.6 |
| 1,836.1 |
| 1,829.3 |
| 2,231.6 |
| | 7,664.6 |
|
| EMEA | 635.2 |
| 711.2 |
| 746.0 |
| 932.0 |
| | 3,024.4 |
|
| Asia Pacific | 621.3 |
| 722.3 |
| 725.2 |
| 821.3 |
| | 2,890.1 |
|
| LaSalle Investment Management | 73.7 |
| 64.5 |
| 80.5 |
| 78.8 |
| | 297.5 |
|
| Plus: | | | | | | |
| Restructuring charges | 4.5 |
| 5.4 |
| 3.4 |
| 17.4 |
| | 30.7 |
|
| Total operating expenses | 3,102.3 |
| 3,339.5 |
| 3,384.4 |
| 4,081.1 |
| | 13,907.3 |
|
| | | | | | | |
| Operating income | 15.4 |
| 130.8 |
| 137.8 |
| 261.9 |
| | 545.9 |
|
| | | | | | | |
| Net income attributable to common shareholders | $ | 7.2 |
| 94.3 |
| 98.3 |
| 76.2 |
| | $ | 276.0 |
|
| | | | | | | |
| Basic earnings per common share | $ | 0.16 |
| 2.08 |
| 2.17 |
| 1.68 |
| | $ | 6.09 |
|
| | | | | | | |
| Diluted earnings per common share | $ | 0.16 |
| 2.06 |
| 2.15 |
| 1.66 |
| | $ | 6.03 |
|
ITEM 9. CHANGES IN AND DISAGREEMENTS WITH ACCOUNTANTS ON ACCOUNTING AND FINANCIAL DISCLOSURE
None.
ITEM 9A. CONTROLS AND PROCEDURES EVALUATION OF DISCLOSURE CONTROLS AND PROCEDURES
The Company has established disclosure controls and procedures to ensure material information relating to the Company, including its consolidated subsidiaries, is made known to the officers who certify the Company's financial reports and to the members of senior management and the Board of Directors.
Based on management's evaluation as of December 31, 2018,2021, the principal executive officer and principal financial officer of the Company have concluded the Company's disclosure controls and procedures (as defined in Rules 13a-15(e) and 15d-15(e) under the Securities Exchange Act of 1934) are effective.
MANAGEMENT'S REPORT ON INTERNAL CONTROL OVER FINANCIAL REPORTING
The Company's management is responsible for establishing and maintaining adequate internal control over financial reporting, as such term is defined in Exchange Act Rules 13a-15(f) and 15d-15(f). Under the supervision and with the participation of our management, including our principal executive officer, we conducted an evaluation of the effectiveness of our internal control over financial reporting based on the framework in Internal Control-Integrated Framework (2013) issued by the Committee of Sponsoring Organizations of the Treadway Commission. Based on our evaluation under the framework in Internal Control-Integrated Framework (2013), our management concluded our internal control over financial reporting was effective as of December 31, 2018.2021.
KPMG LLP, the Independent Registered Public Accounting Firm that audited the Consolidated Financial Statements included in this Annual Report on Form 10-K, issued an audit report on the Company's internal control over financial reporting. That Report of Independent Registered Public Accounting Firm is included in Item 8. Financial Statements and Supplementary Data.
CHANGES IN INTERNAL CONTROLS OVER FINANCIAL REPORTING
There were no changes to the Company's internal controls over financial reporting during the quarter ended December 31, 20182021 that have materially affected, or are reasonably likely to materially affect, the Company's internal controls over financial reporting.
ITEM 9B. OTHER INFORMATION
Not applicable.
ITEM 9C. DISCLOSURE REGARDING FOREIGN JURISDICTION THAT PREVENT INSPECTIONS
Not applicable.
PART III
ITEM 10. DIRECTORS, EXECUTIVE OFFICERS AND CORPORATE GOVERNANCE
The information required by this item is incorporated by reference toItem 401 of Regulation S-K in the material in Jones Lang LaSalle's Proxy Statementdefinitive proxy statement for the 2018 Annual Meetingannual meeting of Shareholders (the "Proxy Statement"shareholders to be held on or about May 26, 2022 (“Proxy Statement”), under the captions "Directors and Corporate Officers," and "Section 16(a) Beneficial Ownership Reporting Compliance" and in Part I,"Corporate Governance - Item 1 - Election of Directors" and “Executive Officers” is incorporated herein by reference. The information in the Proxy Statement required by Item 405 of Regulation S-K under the caption “Security Ownership - Delinquent Section 16 Reports” is incorporated herein by reference. The information in the Proxy Statement required by Items 407(d)(4) and 407(d)(5) of Regulation S-K under the caption “Corporate Governance - Board Committees” is incorporated herein by reference.
JLL has adopted a code of ethics that applies to its executives, including its principal executive officer, principal financial officer and principal accounting officer. This code of ethics and JLL's corporate governance policies are posted on JLL's website at www.jll.com. JLL intends to satisfy disclosure requirements regarding amendments to or waivers from its code of ethics by posting such information on this Annual Reportwebsite. The charters of the Audit, Nominating and Governance, and Compensation committees of JLL's Board of Directors are available on Form 10-K.JLL's website as well. This information is also available in print free of charge to any person who requests it.
ITEM 11. EXECUTIVE COMPENSATION
The information required by this item is incorporated by reference to the materialItem 402 and 407(e)(4) and (e)(5) of Regulation S-K in the Proxy Statement under the caption "Executive Compensation."Compensation" is incorporated herein by reference.
ITEM 12. SECURITY OWNERSHIP OF CERTAIN BENEFICIAL OWNERS AND MANAGEMENT AND RELATED SHAREHOLDER MATTERS
The information required by this item is incorporated by reference to the materialItem 403 of Regulation S-K in the Proxy Statement under the caption "Common Stock Security Ownership of Certain Beneficial Owners and Management.""Security Ownership" is incorporated herein by reference. The following table provides information with respect to Jones Lang LaSalle's common shares issuable under our equity compensation plans.
| | | | | | | | | | | |
| December 31, 2021 |
(in thousands, except exercise price)
PLAN CATEGORY | NUMBER OF
SECURITIES
TO BE ISSUED
UPON EXERCISE
OF OUTSTANDING
OPTIONS, WARRANTS
AND RIGHTS | WEIGHTED
AVERAGE
EXERCISE PRICE
OF OUTSTANDING
OPTIONS,
WARRANTS AND
RIGHTS | NUMBER OF SECURITIES
REMAINING AVAILABLE FOR
FUTURE ISSUANCE UNDER
EQUITY COMPENSATION
PLANS (EXCLUDING SECURITIES
REFLECTED IN COLUMN (A)) |
| | (A) | (B) | (C) |
| Equity compensation plans approved by security holders | | | |
| SAIP | 1,488 | $149.98 | 1,142 |
| ESPP | n/a | n/a | 113 |
| Subtotal | 1,488 | | 1,255 |
| Equity compensation plans not approved by security holders | | | |
SAYE (1) | 10 | 90.97 | 281 |
| Total | 1,498 | | 1,536 |
(1) In November 2001, we adopted the SAYE plan for eligible employees of our U.K. based operations. In November 2006, the SAYE plan was extended to employees in our Ireland operations. Under this plan, employee contributions for stock purchases are enhanced by us through an additional contribution of a 15% discount on the purchase price. Options granted under the SAYE plan vest over a period of three to five years. The original SAYE plan was not approved by shareholders since such approval was not required under applicable rules at the time of the adoption of this plan. In 2006, our shareholders approved an amendment to the SAYE plan that increased the number of shares reserved for issuance by 500,000.
|
| | | |
| | December 31, 2018 |
(in thousands, except exercise price)
PLAN CATEGORY | NUMBER OF SECURITIES TO BE ISSUED UPON EXERCISE OF OUTSTANDING OPTIONS, WARRANTS AND RIGHTS | WEIGHTED AVERAGE EXERCISE PRICE OF OUTSTANDING OPTIONS, WARRANTS AND RIGHTS | NUMBER OF SECURITIES REMAINING AVAILABLE FOR FUTURE ISSUANCE UNDER EQUITY COMPENSATION PLANS (EXCLUDING SECURITIES REFLECTEDIN COLUMN (A)) |
| | (A) | (B) | (C) |
| Equity compensation plans approved by security holders | | | |
SAIP (1) | 653 | $131.32 | 1,306 |
ESPP (2) | n/a | n/a | 113 |
| Subtotal | 653 | | 1,419 |
| Equity compensation plans not approved by security holders | | | |
SAYE (3) | 97 | 99.17 | 260 |
| Total | 750 | | 1,679 |
| |
(1) | In 1997, we adopted the SAIP, which provides for the granting of options to purchase a specified number of shares of common stock and other stock awards to eligible participants of Jones Lang LaSalle. |
| |
(2) | In 1998, we adopted an ESPP for eligible U.S. based employees. Under this plan, employee contributions for stock purchases were enhanced through an additional contribution of a 5% discount on the purchase price. Effective April 1, 2009, the 5% discount has been discontinued and purchases are broker-assisted on the open market. |
| |
(3) | In November 2001, we adopted the SAYE plan for eligible employees of our U.K. based operations. In November 2006, the SAYE plan was extended to employees in our Ireland operations. Under this plan, employee contributions for stock purchases are enhanced by us through an additional contribution of a 15% discount on the purchase price. Options granted under the SAYE plan vest over a period of three to five years. The original SAYE plan was not approved by shareholders since such approval was not required under applicable rules at the time of the adoption of this plan. In 2006, our shareholders approved an amendment to the SAYE plan that increased the number of shares reserved for issuance by 500,000. |
ITEM 13. CERTAIN RELATIONSHIPS AND RELATED TRANSACTIONS, AND DIRECTOR INDEPENDENCE
The information required by this item is incorporated by reference to the material appearingItem 404 of Regulation S-K in the Proxy Statement under the caption "Certain“Security Ownership - Certain Relationships and Related Transactions."Transactions” is incorporated herein by reference. The information required by Item 407(a) of Regulation S-K in the Proxy Statement under the caption “Corporate Governance-Director Independence” is incorporated herein by reference.
ITEM 14. PRINCIPAL ACCOUNTING FEES AND SERVICES
The Company's independent registered public accounting firm is KPMG, LLP, Chicago, IL, Auditor Firm ID: 185.
The information required by this itemItem 14 is incorporated by reference to the material appearingset forth in the Proxy Statement under the caption "Information about thecaptions "Audit Matters - Information About Our Independent Registered Public Accounting Firm."Firm” and incorporated herein by reference.
PART IV
ITEM 15. EXHIBITS AND FINANCIAL STATEMENT SCHEDULES
The following documents are filed as part of this report:
| |
1. | 1.Financial Statements. See Index to Consolidated Financial Statements in Part II, Item 8 of this report. 2.Financial Statement Schedules. No financial statement schedules are included because they are not required or are not applicable, or the required information is set forth in the applicable statements or related notes. 3.Exhibits. A list of exhibits is set forth in the Exhibit Index, included below. ITEM 16. FORM 10-K SUMMARY None. Financial Statements. See Index to Consolidated Financial Statements in Part II, Item 8 of this report.
|
| |
2. | Financial Statement Schedules. No financial statement schedules are included because they are not required or are not applicable, or the required information is set forth in the applicable statements or related notes.
|
| |
3. | Exhibits. A list of exhibits is set forth in the Exhibit Index, included below.
|
Cautionary Note Regarding Forward-Looking Statements
Certain statements inThis report, including this filing and elsewhere (such as in reports, other filings with the SEC, press releases, presentations and communications by JLL or its management and written and oral statements) regarding, among other things, future financial results and performance, achievements, plans and objectives, and dividend payments may constitute forward-looking statements within the meaning of the Private Securities Litigation Reform Act of 1995. Such forward-looking statements involve known and unknown risks, uncertainties and other factors that may cause JLL's actual results, performance, achievements, plans and objectives, and dividends to be materially different from any of the future results, performance, achievements, plans and objectives, and dividends expressed or implied by such forward-looking statements.
We discuss those risks, uncertainties and other factors in (i) this report in Part I, Item 1A. Risk Factors; Part II, Item 7. Management's Discussion and Analysis of Financial Condition and Results of Operations; Part II, Item 7A. QuantitativeOperations, contains “forward-looking statements” within the meaning of the federal securities laws. All such statements are qualified by this cautionary note, which is provided pursuant to the safe harbor provisions of Section 27A of the Securities Act of 1933, as amended, and Qualitative Disclosures About Market Risk; Part II, Item 8. Financial Section 21E of the Securities Exchange Act of 1934, as amended. Forward-looking statements may also be included in our other public filings, press releases, our website, and oral and written presentations by management.
Statements in the future tense, and Supplementary Data - Notesall statements accompanied by terms such as “believe,” “will,” “may,” “could,” “project,” “expect,” “estimate,” “assume,” “intend,” “anticipate,” “target,” “plan” and variations thereof and similar terms, are intended to Consolidated Financial Statements;be forward-looking statements. Such statements do not relate strictly to historical or current facts as they relate to our intent, belief and elsewhere,current expectations about our strategic direction, prospects and (ii)future results, and give our current expectations or forecasts of future events. This includes, but is not limited to, our expectations regarding the other reports we file withcontinuing impact of the SEC.COVID-19 pandemic and the efficacy of vaccines and therapeutics on reducing the spread of the virus, the economy as a whole, and/or related government and regulatory restrictions issued to combat the global pandemic, including any adverse changes in such restrictions that may impact us. Management believes that these forward-looking statements are reasonable as and when made. However, caution should be taken not to place undue reliance on any such forward-looking statements because such statements speak only as of the date when made.
Important factorsForward-looking statements are subject to certain risks and uncertainties that could cause actual results to differ materially from thoseour historical experience and our present expectations or anticipated results. These risks and uncertainties are described in Part I, Item 1A. Risk Factors and may also be described from time to time in our future reports filed with the SEC. You should consider the limitations on, and risks associated with, forward-looking statements include (without limitation):
|
| | |
| ● | The effect of political, economic and market conditions and geopolitical events; |
| ● | The logistical and other challenges inherent in operating in numerous different countries; |
| ● | The actions and initiatives of current and potential competitors; |
| ● | The level and volatility of real estate prices, interest rates, currency values and other market indices; |
| ● | The outcome of pending litigation; and |
| ● | The impact of current, pending and future legislation and regulation. |
Moreover, there can be no assurance future dividends will be declared sinceand not unduly rely on the actual declarationaccuracy of future dividends (and the establishment of record and payment dates) remains subject to final determination by the Company's Board of Directors.
Accordingly, we caution our readers not to place undue reliance onpredictions contained in such forward-looking statements. The forward-looking statements which speakin this report represent our estimates and assumptions only as of the date on which they are made. Except to the extent required by applicable securities law, JLL expressly disclaimsof this report. We do not undertake any obligation or undertaking to publicly update or revise any forward-looking statements to reflect anyevents, circumstances, changes in events or circumstances or in its expectations or results.the occurrence of unanticipated events after the date of those statements.
Power of Attorney
KNOW ALL MEN BY THESE PRESENTS, that each of Jones Lang LaSalle Incorporated, a Maryland corporation, and the undersigned Directors and officers of Jones Lang LaSalle Incorporated, hereby constitutes and appoints Christian Ulbrich, Patricia MaxsonKaren Brennan and Louis F. Bowers its, his or her true and lawful attorneys-in-fact and agents, for it, him or her and in its, his or her name, place and stead, in any and all capacities, with full power to act alone, to sign any and all amendments to this report, and to file each such amendment to this report, with all exhibits thereto, and any and all documents in connection therewith, with the Securities and Exchange Commission, hereby granting unto said attorneys-in-fact and agents, and each of them, full power and authority to do and perform any and all acts and things requisite and necessary to be done in and about the premises, as fully to all intents and purposes as it, he or she might or could do in person, hereby ratifying and confirming all that said attorneys-in-fact and agents, or any of them, may lawfully do or cause to be done by virtue hereof.
| | | | | | | | |
| EXHIBIT | | |
| NUMBER | | DESCRIPTION |
| | |
EXHIBIT2.1 | | Agreement and Plan of Merger, dated as of March 18, 2019, by and among Jones Lang LaSalle Incorporated, JLL CM, Inc., JLL CMD, LLC and HFF, Inc. (Incorporated by reference to Exhibit 2.1 to the Current Report on Form 8-K dated March 21, 2019 (File No. 001-13145)) |
NUMBER | | DESCRIPTION |
| 3.1 | | |
3.1 | | Articles of Restatement of Jones Lang LaSalle Incorporated filed with the Maryland Department of Assessments and Taxation on June 24, 2014 (Incorporated by reference to Exhibit 3.1 to the Quarterly Report on Form 10-Q for the quarter ended June 30, 2014 (File No. 001-13145)) |
| | |
| 3.2 | | Third Amended and Restated Bylaws of the Registrant effective as of March 2, 2018 (Incorporated by reference to Exhibit 3.1 to the Current Report on Form 8-K dated March 8, 2018 (File No. 001-13145)) |
| | |
| 4.1 | | Form of certificate representing shares of Jones Lang LaSalle Incorporated common stock (Incorporated by reference to Exhibit 4.1 to the Quarterly Report on Form 10-Q for the quarter ended March 31, 2001 (File No. 001-13145)) |
| | |
| 4.2 | | Indenture, dated as of November 9, 2012 between Jones Lang LaSalle Incorporated and The Bank of New York Mellon Trust Company, National Association (Incorporated by reference to Exhibit 4.1 to the Current Report on Form 8-K dated November 9, 2012 (File No. 001-13145)) |
| | |
| 4.3 | | First Supplemental Indenture (including the form of 4.400% Senior Notes due 2011), dated as of November 9, 2012 between Jones Lang LaSalle Incorporated and The Bank of New York Mellon Trust Company, National Association (Incorporated by reference to Exhibit 4.2 to the Report on Form 8-K dated November 9, 2012 (File No. 001-13145)) |
| | |
10.14.4 | | Description of Jones Lang LaSalle Incorporated Capital Stock (Incorporated by reference to Exhibit 4.4 to the Annual Report on Form 10-K for the year ended December 31, 2019 (File No. 001-13145)) |
| | |
| 10.1 | | Second Amended and Restated Multicurrency Credit Agreement dated as of June 21, 2016 (Incorporated by reference to Exhibit 10.1 to the Current Report on Form 8-K dated June 23, 2016 (File No. 001-13145)) |
| | |
| 10.2 | | Amendment No.1 dated May 16, 2018 to the Second Amended and Restated Multicurrency Credit Agreement dated as of June 21, 2016 (Incorporated by reference to Exhibit 10.1 to the Quarterly Report on Form 10-Q for the quarter ended June 30, 2018 (File No. 001-13145)) |
| | |
| 10.3 | | 2017 Stock AwardAmendment No.2 to the Second Amended and Incentive Plan effectiveRestated Multicurrency Credit Agreement, dated as of May 31, 2017 (as approved by the Shareholders of Jones Lang LaSalle Incorporated on May 31, 2017 and incorporatedApril 14, 2021 (Incorporated by reference to Schedule 14A filedExhibit 10.1 to the Current Report on Form 8-K dated April 21, 201716, 2021 (File No. 001-13145)) |
| | |
10.410.4+ | | Form of Jones Lang LaSalle Incorporated Restricted Stock Unit Agreement used for the Non-Executive Directors' Annual Grants (Incorporated by reference to Exhibit 10.3 to the Quarterly Report on Form 10-Q for the quarter ended June 30, 2016 (File No. 001-13145)) |
| | |
10.510.5+ | | Form of Jones Lang LaSalle Incorporated Performance Stock Unit Agreement (Under the 2017 Stock Award and Incentive Plan) used for certain Employees'; Incentive Grants. (Incorporated by reference to Exhibit 10.2 to the Quarterly Report on Form 10-Q for the quarter ended June 30, 2018 (File No. 001-13145)) |
| | |
10.610.6+ | | Form of Jones Lang LaSalle Incorporated Restricted Stock Unit Agreement used for Employees'; Annual Grants (Incorporated by reference to Exhibit 10.4 to the Quarterly Report on Form 10-Q for the quarter ended June 30, 2016 (File No. 001-13145)) |
| | |
10.710.7+ | | 2019 Stock Award and Incentive Plan effective as of May 29, 2019 (as approved by the Shareholders of Jones Lang LaSalle Incorporated on May 29, 2019 and incorporated by reference to ANNEX C to the Proxy Statement included in Schedule 14A filed on April 18, 2019 (File No. 001-13145)). |
| | |
| 10.8+ | | Amended and Restated 2019 Stock Award and Incentive Plan effective as of May 27, 2021 (as approved by the Shareholders of Jones Lang LaSalle Incorporated on May 27, 2021 and incorporated by reference to Annex C to the Proxy Statement included in Schedule 14A filed on April 16, 2021 (File No. 001-13145)). |
| | |
| 10.9+ | | Form of Jones Lang LaSalle Incorporated Performance Stock Unit Agreement used for certain Employees' Incentive Grants under the 2019 Stock Award and Incentive Plan, incorporated by reference to Exhibit 10.8 to the Annual Report on Form 10-K for the year ended December 31, 2019 (File No. 001-13145) |
| | |
| | | | | | | | |
| EXHIBIT | | |
| NUMBER | | DESCRIPTION |
| | |
| 10.10+ | | Form of Jones Lang LaSalle Incorporated Restricted Stock Unit Agreement used for Employees' Annual Grants Agreement under the 2019 Stock Award and Incentive Plan, incorporated by reference to Exhibit 10.8 to the Annual Report on Form 10-K for the year ended December 31, 2019 (File No. 001-13145) |
| | |
| 10.11+ | | HFF, Inc. 2016 Equity Incentive Plan (assumed by the Company in connection with its acquisition of HFF, Inc. pursuant to an Agreement and Plan of Merger, dated as of March 18, 2019, by and among the Company, JLL CM, Inc., JLL CMD, LCC and HFF, Inc. (Incorporated by reference to Exhibit 99.1 to the Registration Statement on Form S-8 dated July 1, 2019 (File No. 333-232500)) |
| | |
| 10.12+ | | Amended and Restated Severance Pay Plan effective July 1, 2010 (Incorporated by reference to Exhibit 10.9 to the Annual Report on Form 10-K for the year ended December 31, 2011 (File No. 001-13145)) |
| | |
10.810.13+ | | Letter Agreement Regarding Compensation of the Chairman of the Board of Directors dated as of January 1, 2005 (Incorporated by reference to Exhibit 99.1 to the Current Report on Form 8-K dated January 10, 2005 (File No. 001-13145)) |
| | |
10.9 | | LaSalle Investment Management Long Term Incentive Compensation Program, amended and restated January 1, 2013 (Incorporated by reference to Exhibit 10.12 to the Annual Report on Form 10-K for the year ended December 31, 2013 (File No. 001-13145)) |
| | |
10.1010.14+ | | Jones Lang LaSalle Incorporated Deferred Compensation Plan, as amended and restated effective January 1, 2009 (Incorporated by reference to Exhibit 10.25 to the Annual Report on Form 10-K for the year ended December 31, 2008 (File No. 001-13145)) |
|
| | |
EXHIBIT10.15+ | | |
NUMBER | | DESCRIPTION |
| | |
10.11 | | Jones Lang LaSalle Incorporated First Amendment to Deferred Compensation Plan dated as of December 5, 2011 (Incorporated by reference to Exhibit 4.2 to the Registration Statement on Form S-8 dated March 28, 2012 (File No. 333-180405)) |
| | |
10.12 | | Jones Lang LaSalle Incorporated Non-Executive DirectorSecond Amendment to Deferred Compensation Plan Summary of Terms and Conditions, Amended and Restateddated as of May 28, 2016 (Incorporated by reference to Exhibit 10.5 to the Quarterly Report on Form 10-Q for the quarter ended June 30, 2016 (File No. 001-13145))March 25, 2014 |
| | |
10.13 | | Jones Lang LaSalle Incorporated Third Amendment to Deferred Compensation Plan dated as of October 1, 2018 |
| | |
| | Jones Lang LaSalle Incorporated Fourth Amendment to Deferred Compensation Plan dated as of July 1, 2019 |
| | |
| | Jones Lang LaSalle Incorporated Fifth Amendment to Deferred Compensation Plan dated as of June 15, 2020 |
| | |
| | Jones Lang LaSalle Incorporated Sixth Amendment to Deferred Compensation Plan dated as of January 1, 2022 |
| | |
| 10.21+ | | Jones Lang LaSalle Incorporated GEB 2015-2020 Long-Term Incentive Compensation Program effective as of January 1, 2015 (Incorporated by reference to Exhibit 10.2 to the Current Report on Form 8-K dated July 15, 2015)2015 (File 001-13145)) |
| | |
10.1410.22+ | | Letter Agreement dated May 15, 2013 between Jones Lang LaSalle Incorporated and Christie B. Kelly (Incorporated by reference to Exhibit 10.1 to the Current Report on Form 8-K dated May 16, 2013 (File No. 001-13145)) |
| | |
10.15 | | Letter Agreement dated January 16, 2014 between Jones Lang LaSalle Incorporated and Gregory P. O'Brien (Incorporated by reference to Exhibit 10.1 to the Current Report on Form 8-K (File No. 001-13145)) |
| | |
10.1610.23+ | | Letter Agreement dated August 23, 2016 between Jones Lang LaSalle Incorporated and Christian Ulbrich (Incorporated by reference to Exhibit 10.2 to the Current Report on Form 8-K dated August 25, 2016 (File 001-13145)) |
| | |
10.1710.24+ | | Letter Agreement, dated September 17, 2018,22, 2019 between Jones Lang LaSalle Incorporated and Christie B. KellyMihir Shah (Incorporated by reference to Exhibit 10.1 to the Quarterly Report on Form 10-Q for the quarter ended September 30, 20182019 (File No. 001-13145)) |
| | |
1110.25+ | | Letter Agreement dated September 22, 2019 between Jones Lang LaSalle Incorporated and Yishai Lerner (Incorporated by reference to Exhibit 10.2 to the Quarterly Report on Form 10-Q for the quarter ended September 30, 2019 (File No. 001-13145)) |
| | |
| 10.26+ | | Letter Agreement, dated June 18, 2020, between Jones Lang LaSalle Incorporated and Karen Brennan (Incorporated by reference to Exhibit 10.1 to the Current Report on Form 8-K dated June 22, 2020 (File No. 001-13145)) |
| | | | | | | | |
| EXHIBIT | | |
| NUMBER | | DESCRIPTION |
| | |
| 10.27+ | | Form Change in Control Agreement for Global Executive Board (Incorporated by reference to Exhibit 99.1 to the Current Report on Form 8-K dated March 4, 2021 (File No. 001-13145)) |
| | |
| 10.28+ | | Letter Agreement dated December 4, 2020, between Jones Lang LaSalle Incorporated and Jeff A. Jacobson (Incorporated by reference to Exhibit 10.25 to the Current Report on Form 10-K for the year ended December 31, 2020 (File No. 001-13145)) |
| | |
| 11 | | Statement concerning computation of per share earnings (filed in Item 8, Consolidated Statements of Comprehensive Income) |
| | |
| | ComputationList of Ratio of Earnings to Fixed ChargesSubsidiaries |
| | |
| | List of Subsidiaries |
| | |
| | Consent of Independent Registered Public Accounting Firm |
| | |
| 24.1* | | Power of Attorney (Set forth on page preceding signature page of this report) |
| | |
| | Certification of Chief Executive Officer pursuant to Rule 13a-14(a) under the Securities and Exchange Act of 1934, as adopted pursuant to Section 302 of the Sarbanes-Oxley Act of 2002 |
| | |
| | Certification of Chief Financial Officer pursuant to Rule 13a-14(a) under the Securities and Exchange Act of 1934, as adopted pursuant to Section 302 of the Sarbanes-Oxley Act of 2002 |
| | |
| | Certification of Chief Executive Officer and Chief Financial Officer pursuant to 18 U.S.C. Section 1350, as adopted pursuant to Section 906 of the Sarbanes-Oxley Act of 2002 |
| | |
101*101.INS | | The following materials fromInline XBRL Instance Document - the Company's Annual Report on Form 10-K forinstance document does not appear in the year ended December 31, 2017, formattedInteractive Data File because its XBRL tags are embedded within the Inline XBRL document |
| | |
| 101.SCH | | Inline XBRL Taxonomy Extension Schema Document |
| | |
| 101.CAL | | Inline XBRL Taxonomy Extension Calculation Linkbase Document |
| | |
| 101.DEF | | Inline XBRL Taxonomy Extension Definition Linkbase Document |
| | |
| 101.LAB | | Inline XBRL Taxonomy Extension Label Linkbase Document |
| | |
| 101.PRE | | Inline XBRL Taxonomy Extension Presentation Linkbase Document |
| | |
| 104 | | Cover Page Interactive Data File (formatted as Inline XBRL and contained in XBRL (eXtensible Business Reporting Language): (i) Consolidated Balance Sheets as of December 31, 2017 and 2016, (ii) Consolidated Statements of Comprehensive Income for the years ended December 31, 2017, 2016 and 2015, (iii) Consolidated Statements of Equity for the years ended December 31, 2017, 2016 and 2015, (iv) Consolidated Statements of Cash Flows for the years ended December 31, 2017, 2016 and 2015 and (v) Notes to Consolidated Financial Statements.Exhibit 101) |
* Filed herewith
+ Indicates management compensatory plan, contract, or arrangement.
SIGNATURES
Pursuant to the requirements of Section 13 or 15(d) of the Securities Exchange Act of 1934, the Registrant has duly caused this report to be signed on its behalf by the undersigned, thereunto duly authorized, on the 25th28th day of February, 2019.
|
| | | | | | | | | | |
| JONES LANG LASALLE INCORPORATED |
| |
| By | | /s/ Patricia MaxsonKaren Brennan | |
| | Patricia MaxsonKaren Brennan | |
| | Chief Administrative Officer and Interim Chief Financial Officer |
| | (Authorized Officer and Principal Financial Officer) | |
Pursuant to the requirements of the Securities Exchange Act of 1934, this report has been signed below by the following persons on behalf of the Registrant and in the capacities indicated on the 21st28th day of February, 2019.
| | | | | | | | | | | |
| Signature | | Title |
| | | |
| /s/ Siddharth N. Mehta | | Chairman of the Board of Directors and Director |
| Siddharth N. Mehta | | |
| | | |
| Signature | | Title |
| | | |
| /s/ Sheila A. Penrose | | Chairman of the Board of Directors and Director |
| Sheila A. Penrose | | |
| | | |
| /s/ Christian Ulbrich | | President, Chief Executive Officer and Director |
| Christian Ulbrich | | (Principal Executive Officer) |
| | | |
| /s/ Hugo Bagué | | Director |
| Hugo Bagué | | |
| | | |
| /s/ Matthew Carter | | Director |
| Matthew Carter | | |
| | | |
| /s/ Samuel A. Di Piazza, Jr. | | Director |
| Samuel A. Di Piazza, Jr. | | |
| | | |
| /s/ Dame DeAnne JuliusTina Ju | | Director |
| Dame DeAnne JuliusTina Ju | | |
| | | |
| /s/ Ming Lu | | Director |
| Ming Lu | | |
| | | |
| /s/ Bridget Macaskill | | Director |
| Bridget Macaskill | | |
| | | |
| /s/ MartinDeborah H. NesbittMcAneny | | Director |
| MartinDeborah H. NesbittMcAneny | | |
| | | |
| /s/ Jeetu Patel | | Director |
| Jeetu Patel | | |
| | | |
| /s/ Sheila A. Penrose | | Director |
| Sheila A. Penrose | | |
| | | |
| /s/ Ann Marie Petach | | Director |
| Ann Marie Petach | | |
| | | |
| /s/ Patricia MaxsonEfrain Rivera | | Chief Administrative Officer and Interim Director |
| Efrain Rivera | | |
| | | |
| /s/ Karen Brennan | | Chief Financial Officer |
| Patricia MaxsonKaren Brennan | | (Principal Financial Officer) |
| | | |
| /s/ Louis F. Bowers | | Executive Vice President and Global Controller |
| Louis F. Bowers | | (Principal Accounting Officer) |
INTERNATIONAL INTEGRATED REPORTING COUNCIL CROSS REFERENCE
The table below provides a cross reference to the requirements of The International Framework (the "Framework") issued by the International Integrated Reporting Council ("IIRC") (December, 2013 Version) and the Location of the Responses in the Jones Lang LaSalle Annual Report on Form 10-K.
|
| | | | |
| Requirement in IIRC Framework | | Location in Jones Lang LaSalle 10-K |
| Section | Requirement | | Page | Title of Section |
| 1.12 | Form of report and relationship with other information | | 25 | Integrated Reporting |
| 1.17-1.18 | Application of the Framework | | | International Integrated Reporting Council Cross Reference |
| 1.20 | Responsibility for an integrated report | | 25 | Integrated Reporting: Responsibility for Integrated Reporting |
| 3.3 | Strategic focus and future orientation | | 15, 16 | Thinking Beyond, Strategic Framework |
| 3.6 | Connectivity of information | | 14 | Sustaining our Enterprise: A Business Model that Combines Different Capital to Create Stakeholder Value |
| 3.10 | Stakeholder relationships | | 14 | Sustaining our Enterprise: A Business Model that Combines Different Capital to Create Stakeholder Value |
| 3.17 | Materiality | | 19, 20 | Competition; Distinguishing Attributes and Competitive Differentiators |
| 3.36 | Conciseness | | | Throughout |
| 3.39 | Reliability and completeness | | 3, 32 | Company Overview; Part I, Item 1A: Risk Factors |
| 3.54 | Consistency and comparability | | | Part II, Item 6: Selected Financial Data (Unaudited) |
| | | | | Part II, Item 7: Management's Discussion and Analysis of Financial Condition and Results of Operations |
| 4.4 | Organizational overview and external environment | | 3, 13, 19, 20 | Company Overview; Industry Trends; Competition; Distinguishing Attributes and Competitive Differentiators |
| 4.8 | Governance | | 29 | Corporate Governance; Code of Business Ethics, Corporate Sustainability and related matters |
| 4.10 | Business model | | 14 | Sustaining our Enterprise: A Business Model that Combines Different Capital to Create Stakeholder Value |
| 4.23 | Risks and opportunities | | | Part I, Item 1A: Risk Factors |
| 4.27 | Strategy and resource allocation | | 15, 16 | Thinking Beyond, Strategic Framework |
| 4.30 | Performance | | | Part II, Item 6: Selected Financial Data (Unaudited) |
| | | | | Part II, Item 7: Management's Discussion and Analysis of Financial Condition and Results of Operations |
| 4.34 | Outlook | | 15, 16, 32 | Thinking Beyond, Strategic Framework; Part I, Item 1A: Risk Factors |
| 4.40 | Basis of preparation and presentation | | 25 | Integrated Reporting: Responsibility for Integrated Reporting |