UNITED STATES
SECURITIES AND EXCHANGE COMMISSION
Washington, D.C. 20549
FORM 10-K
(Mark One)
☒ ANNUAL REPORT PURSUANT TO SECTION 13 OR 15(d) OF THE SECURITIES EXCHANGE ACT OF 1934
For the fiscal year ended December 26, 202030, 2023
Or
☐ TRANSITION REPORT PURSUANT TO SECTION 13 OR 15(d) OF THE SECURITIES EXCHANGE ACT OF 1934
For the transition period from to
Commission file number: 000-50307
FormFactor, Inc.
(Exact name of registrant as specified in its charter)
| | | | | | | | |
| Delaware | | 13-3711155 |
(State or other jurisdiction of incorporation or organization) | | (I.R.S. Employer Identification No.) |
| | |
| 7005 Southfront Road, Livermore, California | | 94551 |
| (Address of principal executive offices) | | (Zip Code) |
7005 Southfront Road, Livermore, California 94551
(Address of principal executive offices, including zip code)
(925) 290-4000
(Registrant's telephone number, including area code)
Securities registered pursuant to Section 12(b) of the Act:
| | | | | | | | | | | | | | | | | | | | |
| Title of each class | | | Trading Symbol(s) | | Name of each exchange on which registered |
| Common stock, $0.001 par value | | | FORM | | Nasdaq Global Market |
None
Indicate by check mark if the registrant is a well-known seasoned issuer, as defined in Rule 405 of the Securities Act. Yes ☐ No ☒
Indicate by check mark if the registrant is not required to file reports pursuant to Section 13 or Section 15(d) of the Act. Yes ☐ No ☒
Indicate by check mark whether the registrant: (1) has filed all reports required to be filed by Section 13 or 15(d) of the Securities Exchange Act of 1934 during the preceding 12 months (or for such shorter period that the registrant was required to file such reports), and (2) has been subject to such filing requirements for the past 90 days. Yes ☒ No ☐
Indicate by check mark whether the registrant submitted electronically every Interactive Data File required to be submitted pursuant to Rule 405 of the Regulation S-T (§232.405 of this chapter) during the preceding 12 months (or for such shorter period that the registrant was required to submit such files). Yes ☒ No ☐
Indicate by check mark whether the registrant is a large accelerated filer, an accelerated filer, a non-accelerated filer, a smaller reporting company, or an emerging growth company. See the definitions of "large“large accelerated filer," "accelerated” “accelerated filer," "smaller” “smaller reporting company"company” and "emerging“emerging growth company"company” in Rule 12b-2 of the Exchange Act:
| | | | | | | | | | | | | | | | | | | | | | | | | | | | | |
| Large accelerated filer | ☒ | Accelerated filer | ☐ | | Non-accelerated filer | ☐ | | Smaller reporting company | ☐ | Emerging growth company | ☐ |
If an emerging growth company, indicate by check mark if the registrant has elected not to use the extended transition period for complying with any new or revised financial accounting standards provided pursuant to Section 13(a) of the Exchange Act. ☐
Indicate by check mark whether the registrant has filed a report on and attestation to its management’s assessment of the effectiveness of its internal control over financial reporting under Section 404(b) of the Sarbanes-Oxley Act (15 U.S.C. 7262(b)) by the registered public accounting firm that prepares or issued its audit report. ☒
If securities are registered pursuant to Section 12(b) of the Act, indicate by check mark whether the financial statements of the registrant included in the filing reflect the correction of an error to previously issued financial statements. ☐
Indicate by check mark whether any of those error corrections are restatements that required a recovery analysis of incentive-based compensation received by any of the registrant’s executive officers during the relevant recovery period pursuant to §240.10D-1(b). ☐
Indicate by check mark whether the registrant is a shell company (as defined in Rule 12b-2 of the Exchange Act). Yes ☐ No ☒
Aggregate market value of registrant's common stock held by non-affiliates of the registrant, based upon the closing price of a share of the registrant's common stock on June 26, 2020July 1, 2023 (the last business day of the registrant's most recently completed second quarter) as reported by Nasdaq Global Market on that date: $1,046.0$1,891.7 million.
The number of shares of the registrant's common stock, par value $0.001 per share, outstanding as of February 16, 20212024 was 77,749,91477,598,433 shares.
DOCUMENTS INCORPORATED BY REFERENCE
Portions of the registrant's definitive Proxy Statement for the 20212024 Annual Meeting of Stockholders, which will be filed within 120 days of the end of the registrant's fiscal year ended December 26, 2020,30, 2023, are incorporated by reference in Part III hereof. Except with respect to information specifically incorporated by reference in this Annual Report on Form 10-K, the Proxy Statement is not deemed to be filed as a part of this Annual Report on Form 10-K.
FORMFACTOR, INC.
Form 10-K for the Fiscal Year Ended December 26, 202030, 2023
Index
| | | | | | | | |
| | | Page |
| Part I |
| | |
| | |
| | |
| | |
| | |
| | |
| | |
| Part II |
| | |
| | |
| | |
| | |
| | |
| | |
| | |
| | |
| | |
| Part III |
| | |
| | |
| | |
| | |
| | |
| Part IV |
| | |
| | |
| |
| |
______________
Throughout this Annual Report on Form 10-K, we refer to FormFactor, Inc. and its consolidated subsidiaries as "the“the Company," "FormFactor," "we," "us,"” “FormFactor,” “we,” “us,” and "our."“our.” Our fiscal year ends on the last Saturday in December. Our last three fiscal years ended on December 26, 2020,30, 2023, December 28, 201931, 2022 and December 29, 2018.25, 2021.
NOTE REGARDING FORWARD-LOOKING STATEMENTS
This Annual Report on Form 10-K contains forward-looking statements within the meaning of the Securities Exchange Act of 1934 and the Securities Act of 1933, which are subject to known and unknown risks and uncertainties. The forward-looking statements include statements concerning, among other things, our business strategy (including the influence of anticipated trends and developments in our business and the markets in which we operate), financial results, operating results, revenues, gross margin,margins, liquidity, operating expenses, products, projected costs and capital expenditures, research and development programs, sales and marketing initiatives, competition, and the impact of accounting standards. In some cases, you can identify these statements by our use of forward-looking words, such as "may," "might," "will," "could," "should," "expect," "plan," "anticipate," "believe," "estimate," "predict," "intend"“may,” “might,” “will,” “could,” “should,” “expect,” “plan,” “anticipate,” “believe,” “estimate,” “predict,” “intend” and "continue,"“continue,” the negative or plural of these words and other comparable terminology. Forward-looking statements are based on information available to us as of the filing date of this Annual Report on Form 10-K and our current expectations about future events, which are inherently subject to change and involve known and unknown risks and uncertainties. You should not place undue reliance on these forward-looking statements. We have no obligation to update any of these statements, and we assume no obligation to do so. Actual events or results may differ materially from those expressed or implied by these statements due to various factors, including but not limited to the matters discussed below in the section entitled "Item“Item 1A: Risk Factors,"” and elsewhere in this Annual Report on Form 10-K.
Our operating results have fluctuated in the past and are likely to continue to fluctuate. You should not rely on period-to-period comparisons of our financial results as indicators of our future performance. Some of the important factors that could cause our revenues, operating results and outlook to fluctuate from period to period include:
◦customer demand for and adoption of our products;
◦market and competitive conditions in our industry, the semiconductor industry and the economy as a whole;
◦the timing and success of new technologies and product introductions by our competitors and by us;
◦our ability to work efficiently with our customers on their qualification of our new technologies and products;
◦our ability to deliver reliable, cost-effective products that meet our customers’ testing requirements in a timely manner;
◦our ability to transition to new product architectures to solve next-generation semiconductor test and measurement challenges, and to bring new products into volume production on time and at acceptable yields and cost;
◦our ability to implement measures for enabling efficiencies and supporting growth in our design, applications, manufacturing and other operational activities;
◦changes in trade, tariff or export regulations in the markets where we produce or sell our products;
◦the reduction, rescheduling or cancellation of orders by our customers;
◦our ability to collect accounts receivablesreceivable owed by our customers;
◦our product and customer sales mix and geographical sales mix;
◦reductions in the prices or the profitability of our products due to competitive pressures or other factors;
◦the timely availability or the cost of labor, components and materials utilized in our products;
◦our ability to efficiently optimize manufacturing capacity and production yields as necessary to meet customer demand and ramp variable production volumes at our manufacturing facilities;
◦our ability to protect our intellectual property against infringement and continue our investment in research and development and design activities;
◦the timing of and return on our investments in research and development;
◦any disruption in the operation of our manufacturing facilities;
◦risks to the Company’s realization of benefits from acquisitions and investments in capacity and data systems;
◦changes in trade, tariff or export regulations in the markets where we produce or sell our products; and
◦factors impacting political and global economic stability, including natural disasters, epidemics (such as the current COVID-19, or coronavirus pandemic),pandemics, military conflicts, climate change, and other factors acting alone or in combination;combination.
PART I
Item 1: Business
General
FormFactor, Inc., headquartered in Livermore, California, is a leading provider of essential test and measurement technologies.technologies along the full semiconductor product lifecycle - from characterization, modeling, reliability, and design de-bug, to qualification and production test. We provide a broad range of high-performance probe cards, analytical probes, probe stations, metrology systems, thermal systems, and cryogenic systems to both semiconductor companies and scientific institutions. Our products provide electrical and physical information from a variety of semiconductor and electro-optical devices and integrated circuits from early research, through development, to high-volume production. Customers use our products and services to lower production costs, improve yields,accelerate profitability by optimizing device performance, reducing scrap, and enable development of their complex next generation products.improving yields.
FormFactor, Inc. was incorporatedFounded in 1993, and we introduced our first product in 1995. In October 2012,From time to time, we have acquired Astria Semiconductor Holdings, Inc., including its subsidiary Micro-Probe Incorporated (together "MicroProbe"); in June 2016, we acquired Cascade Microtech, Inc. ("Cascade Microtech" or "CMI"); in October 2019, we acquired FRT GmbH ("FRT"); in July 2020, we acquired the probe card assets of Advantest Corporation ("Baldwin Park"); and in October 2020, we acquired High Precision Devices, Inc. ("HPD"). These acquisitions have helpedbusinesses to help transform our business into a semiconductor test and measurement market leader with greater scale, diversification, breadth and market opportunities.opportunities from Lab to Fab. We continue to evaluate opportunities to acquire businesses and technologies to further these goals.
As of December 26, 2020,30, 2023, we operate in two reportable segments consisting of the Probe Cards Segmentsegment and the Systems Segment.segment. Sales of our probe cards and analytical probes are included in the Probe Cards Segment,segment, while sales of our probe stations, metrology systems, and thermal systems and cryogenic systems are included in the Systems Segment.segment.
Products
We design, manufacture and sell multiple product lines, including probe cards, analytical probes, probe stations, metrology systems, thermal systems, and cryogenic systems, and related services. On November 1, 2023, we completed the sale of our FRT Metrology business.
Probe cards.Cards. Our probe cards utilize a variety of technologies and product architectures, including micro-electromechanical systems (MEMS) technologies. We use advanced design and automation technologies to enable rapid and cost-effective manufacturing of resilient composite contact elements with characteristic length scales of a few microns. These contact elements are designed to provide a specific range of forces on and across a chip’s bond pad, solder bump, micro-bump, through-silicon-via (TSV), or copper pillar, during the test process, and maintain their shape and position over a range of compression levels. In addition, while maintaining these mechanical characteristics, the contact elements must achieve reliable and high-fidelity electrical contact through wafer surfaces that are generally oxidized or otherwise contaminated, and must maintain these attributes over hundreds of thousands, and even millions, of compression cycles. Our range of capabilities enable us to rapidly produce customer-design specific probe cards that deliver leading precision, quality, reliability, and electro-mechanical performance.
Our probe cards are customized for our customers’ unique wafer and chip designs by modifying and adapting our standard product architectures to meet an individual customer’s specific wafer and chip design layouts and electrical test requirements. We offer probe cards to test a variety of semiconductor device types, including systems on a chip (SoC)(SoCs), mobile application processors, microprocessors, quantum processors, microcontrollers, graphic processors, radio frequency, analog, mixed signal, image sensors, electro-optical, DRAM memory (including high-bandwidth memory, or “HBM”), NAND flash memory, and NOR flash memory, and quantum computer processor devices.
For many advanced applications, our products must maintain tens of thousands of simultaneous high-fidelity low-impedance electrical contacts with the corresponding chip contacts on the wafer. Our present technologies enable probe cards with over 100,000 contact elements with spacings as small as 24040 microns over geometries as large as an entire 300mm wafer. In addition, for high signal-fidelity devices such as wireless radio frequency transceivers and automotive radar chips, our probe card technologies are capable of testing at millimeter-wave frequencies range, currently up to 81 GHz.
We have invested, and intend to continue to invest, considerable resources in proprietary probe card design tools and processes. These tools and processes are intended to enable the rapid and accurate customization of products required to meet customer requirements, including automated routing and trace length adjustment within our probe cards, to rapidly design complex structures.
In addition, some of our customers test certain chips over a large range of operating temperatures, such as for automotive and cryogenic applications. We design probe cards to provide for a precise match with the thermal expansion characteristics of the wafer under test across the range of test operating temperatures. For many of our products, our customers can use the same probe card
probe card for both low and high temperature testing. We also design probe cards for customers that require extreme positional accuracy at a specific temperature.
Through ongoing investments in both our technology and operations, we continue to innovate and improve so that our products will meet customers’ future technical roadmap performance, quality, and commercial requirements. We also focus uponon leveraging these ongoing investments across all advanced probe card markets to realize synergies and economies of scale to benefit our competitiveness, time-to-market and overall profitability.
Analytical Probes. We offer over 50 different analytical probe models for engineering and production testing. Analytical probes are used for a diverse set of applications, including device characterization, electrical simulation model development, failure analysis, and prototype design debugging. Our customers for analytical probes include universities, research institutions, semiconductor integrated device manufacturers, semiconductor foundries, and fabless semiconductor companies. We continue to add new models of analytical probes that address measurements with higher complexities and at higher frequencies.
Probe Stations. Probe stations, also referred to as probingprobe systems, are a critical tool for the development of new generations of semiconductor and electro-optical processes and designs. Probe stations are highly configurable for the required measurements, the size and type of wafer under test, the characteristics of the device design to be tested, and the temperatures at which testing is to be performed. Process development and design complexities have continually increased with each new generation of semiconductor technology to accommodate smaller design geometries, complex 3-D architectures, new materials and more layers. ProbingProbe systems are a fundamental tool for characterizing and verifying electrical performance and reliability to enable new semiconductor technologies. We design our probingprobe systems for semiconductor design engineers to capture and analyze more accurate data in a shorter amount of time and to be able to control and manage testing at temperatures from near absolute zero to hundreds of degrees centigrade.
We build upon our probe stations to create integrated measurement systems that provide complete solutions for our customers’ complex measurement requirements. These systems include test instrumentation, probe, cabling configurations, and software to enable fast, accurate, on-wafer data collection for complex application and measurement needs. We offer pre-configured and customized measurement systems for production testing, power device characterization, vacuum probing, cryogenic probing, high-pressure probing, photonics testing, and a variety of other specific applications.
Metrology Systems. We offerUntil the sale of FRT in November 2023, we offered surface metrology systems for various applications including the development, production and quality control of semiconductor products. With resolution down to nanometer scales, these systems measuremeasured topography, structure, step height, roughness, wear, thickness variation, film thickness and other parameters. The modular architecture of the systems allowsallowed for the sensor configuration to be customized for the application while leveraging a common platform. These systems integrateintegrated hybrid metrology capabilities and proprietary software to enable non-destructive and rapid measurement of multiple features and parameters simultaneously, which hashad multiple applications but is particularly useful in the growing space of advanced packaging, Silicon Carbide (SiC) power, Silicon Photonics, and MEMS applications.
Thermal Subsystems. Our thermal subsystems include thermal chucks and other test systems used in probe stations and other applications where precise temperature management is required. Thermal chuck systems enable the testing of devices at precise temperatures or across a range of temperatures. These systems are both marketed externally and allow for vertical integration with our probe stations.
Cryogenic Subsystems.Systems. Our cryogenic subsystemssystems include the manufacture of precision cryogenic instruments.instruments and semiconductor test and measurement systems. These include advanced cryogenic probe stations that function both at the wafer and the chip level,systems to test complete wafers or singulated die, as well as Dilution Refrigerator (DR) and Adiabatic Demagnetization Refrigerator (ADR) cryostats used in various applications at temperatures close to absolute zero, including cryogenic probe stations, sensor applications, quantum and super-conductingsuperconducting computing applications, astronomy, and other situations where cryogenic temperature management is required. These systems are marketed externally and also allow for vertical integration with our existing cryogenic wafer and chip probe stations and cryogenic engineering probes.
Services and Support. In addition to routine installation services at the time of sale, we offer services to enable our customers to maintain and more effectively utilize our products and to enhance our customer relationships. In addition to traditional maintenance services, ourOur applications engineers assist our customers in test methodologies to make advanced measurements during process and product development, and during mass production.production, along with offering traditional maintenance services.
Customers
Our customers include companies, universities and institutions that design or make semiconductor and semiconductor related products in the Foundryfoundry & Logic,logic, DRAM, Flash, Displayflash, display, sensor and Sensorquantum computer markets. Our customers use our products
to test nearly all semiconductor device types, including SoCs, mobile application processors, microprocessors, quantum processors,
microcontrollers, graphic processors, radio frequency, analog, mixed signal, image sensors, electro-optical, DRAM memory (including HBM), NAND flash memory, and NOR flash memory, and quantum computer processor devices.
Fabless semiconductor suppliers do not manufacture their own semiconductors, but they purchase our analytical probes, probe stations, and other System segment products for research and development, and device characterization. They also purchase, or direct their foundries or wafer test facilities to purchase, our probe cards to test wafers manufactured for them.
We believe our customers consider timely service and support to be an important aspect of our relationship as our products are critical elements of high-volume manufacturing and design-specific product ramps. Our probe stations and metrology systems are installed at customer sites either by us, our manufacturers’ representatives or our distributors, depending on the complexity of the installation and the customer’s geographic location. We assist our customers in the selection, integration and use of our products through application engineering support. We also provide worldwide on-site probe card maintenance and service training, seminars and telephone support. In certain geographic regions, and for selected products, our manufacturers’ representatives and distributors provide additional service and support.
Information concerning revenue by geographic region and by country based upon ship-to location appears under Item 7: Management's Discussion and Analysis of Financial Condition and Results of Operations - Revenues - Revenues by Geographic Region and Note 15 of the Notes to Consolidated Financial Statements included in Part II, Item 8 of this Annual Report on Form 10-K.
Information concerning revenue concentration by customer appears under Note 2 of the Notes to Consolidated Financial Statements included in Part II, Item 8 of this Annual Report on Form 10-K. The following customers representrepresented 10% or more of our quarterly revenues:revenues for the quarters indicated:
| | Fiscal Quarters Ended |
| Dec. 26,
2020 | | Sep. 26,
2020 | | June 27, 2020 | | Mar. 28, 2020 | | Dec. 28,
2019 | | Sep. 28,
2019 | | June 29, 2019 | | Mar. 30, 2019 |
| Fiscal Quarters Ended | | | Fiscal Quarters Ended |
| Dec. 30,
2023 | | | Dec. 30,
2023 | | Sep. 30,
2023 | | Jul. 1,
2023 | | Apr. 1,
2023 | | Dec. 31,
2022 | | Sep. 24,
2022 | | Jun. 25,
2022 | | Mar. 26,
2022 |
| Intel Corporation | Intel Corporation | 29.3 | % | | 25.6 | % | | 36.1 | % | | 36.2 | % | | 28.4 | % | | 23.9 | % | | 26.1 | % | | 21.3 | % | Intel Corporation | 16.7 | % | | 17.1 | % | | 14.2 | % | | 20.0 | % | | 16.5 | % | | 17.0 | % | | 20.9 | % | | 20.8 | % |
| Samsung Electronics., LTD. | 12.5 | % | | 10.6 | % | | * | | * | | 14.8 | % | | * | | 11.1 | % | | 13.8 | % |
| SK hynix Inc. | SK hynix Inc. | * | | * | | * | | * | | * | | 13.5 | % | | * | | * | SK hynix Inc. | 10.7 | % | | * | | 10.7 | % | | * |
| Micron Technology, Inc. | * | | 10.1 | % | | * | | * | | * | | 11.9 | % | | 10.1 | % | | * |
| Samsung Electronics Co., LTD. | | Samsung Electronics Co., LTD. | * | | 11.2 | % | | * |
| Taiwan Semiconductor Manufacturing Co., LTD. | Taiwan Semiconductor Manufacturing Co., LTD. | * | | 10.6 | % | | * | | * | | * | | * | | * | | * | Taiwan Semiconductor Manufacturing Co., LTD. | * | | * | | 10.7 | % |
| | 41.8 | % | | 56.9 | % | | 36.1 | % | | 36.2 | % | | 43.2 | % | | 49.3 | % | | 47.3 | % | | 35.1 | % |
| 27.4 | |
| 27.4 | |
| 27.4 | | % | | 28.3 | % | | 14.2 | % | | 20.0 | % | | 16.5 | % | | 27.7 | % | | 20.9 | % | | 31.5 | % |
* Less than 10% of revenues.
Segment and Enterprise-Wide Disclosures
See Note 15 of the Notes to Consolidated Financial Statements included in Part II, Item 8 of this Annual Report on Form 10-K for certain financial information related to our segments and our enterprise-wide disclosures.
Manufacturing
Our probe cards are designed for each of our customers' unique designs, by modifying and adapting our product architectures to meet an individual customer’s chip layout and test requirements. Our proprietary manufacturing processes for our probe cards include a complex interconnection system-level design process; a front-end process, which may include wire bonding, photolithography, plating and metallurgical processes, dry and electro-deposition, and pick and place assembly; and a back-end process, which includes general assembly and test. Critical steps in our manufacturing process are performed in a variety of clean room environments as stringent as a Class 100, depending on the requirements of the specific manufacturing processes.
Our probe stations and metrology systems are designed to provide highly accurate electrical and optical measurements enabled by precise and reliable mechanical components and assemblies. We prototype and perform robust testing of our product designs and components to ensure high electrical signal integrity, mechanical accuracy and safety. We also monitor our product quality throughout the various stages of our manufacturing processes using a variety of process control methods and tests.
We depend on suppliers for materials and some critical components of our manufacturing processes, including ceramic and organic substrates and complex printed circuit boards. We also rely on suppliers to provide certain contact elements and interconnects that are incorporated into our products. Some of these components and materials are supplied by a single vendor, and some are subject to certain minimum order quantities. Generally, we rely on purchase orders rather than long-term contracts
with our suppliers, which subjects us to risks, including price increases, manufacturing capacity constraints and component shortages. We continuallyregularly assess and evaluate alternative sources of supply for all components and materials.
Our primary manufacturing facilities are located in Livermore, San Jose, Carlsbad, and Baldwin Park, California,California; Beaverton, Oregon,Oregon; Boulder, Colorado,Colorado; and Woburn, Massachusetts, all in the United States,States; and in Thiendorf and Munich, Germany. We also performhave smaller manufacturing operations in our facilities in Munich and Bergisch Gladbach, Germany; Suzhou, China;China and Yokohama, Japan.
We maintain repair and service capabilities in Livermore, San Jose,Carlsbad, and Carlsbad,Baldwin Park, California and Beaverton, Oregon, United States; Thiendorf, Dresden and Munich Germany; Montbonnot Saint Martin, France; Bundang, South Korea; Yokohama and Hiroshima, Japan; Suzhou and Shanghai, China; Hsinchu, Taiwan; and Singapore.
In February 2024, we entered into an agreement with Grand Junction Semiconductor Pte. Ltd. to divest our operations in China and establish an exclusive distribution and partnership agreement to continue sales and support of our products in the region (the “China Transaction”). The China Transaction is expected to close in the first half of 2024.
Research, Development and Engineering
The semiconductor industry is subject to rapid technological change with a continuous stream of new product introductions and technology enhancements. We believe that our continued commitment to research and development and our timely introduction of new and enhanced products and technologies are integral to maintaining and enhancing our competitive position. We allocate significant resources to these efforts and prioritize those resources to prepare for our customers’ next generation electrical test and measurement challenges. We also increasingly seek to deploy our resources to solve fundamental challenges that are both common to, and provide competitive advantage across, our probe card and system product offerings and roadmaps.
Sales and Marketing
We sell our products worldwide through a global direct sales force and through a combination of manufacturers’ representatives and distributors.
Our direct sales and marketing staff is located in the United States, China (pending the close of the China Transaction), France, Germany, Italy, United Kingdom, Japan, Singapore, South Korea, and Taiwan. They work closely with customers in the effort to understand their businesses, anticipate trends and define products that will provide significant technical and economic advantages to our customers. We employ a highly skilled team of application and customer support engineers that support our customers as they integrate our products into their research, development and manufacturing processes. Through these customer relationships, we seek to develop a closestrong understanding of customer and product requirements to align our capabilities with our customers’ roadmaps and production ramps.
We also have a network of representatives and distributors across the globe to broaden our reach. We engage sales representatives to act as independent third parties that agree to promote our products, at our prices and on terms set by us, in return for a commission based on sales. We typically use sales representatives in areas that we believe require greater levels of customer support than we can deliver from our own sales offices and where local language capabilities can offer an advantage. Our distributors purchase our products and resell them at prices and upon terms set by the particular distributor. We typically use distributors in particular geographies due to local regulations or business customs.
Governmental Regulations
We are subject to international, federal, state and local regulations that are customary to businesses in our industry. These regulations relate to, among other things, environmental matters, anti-corruption, marketing, fraud and abuse, trade, employment, and privacy.
Environmental Matters
We are subject to U.S. federal, state, local, and foreign governmental laws and regulations relating to the protection of the environment, including those governing the discharge of pollutants into the air and water, the management and disposal of hazardous substances and wastes, the clean-up of contaminated sites and the maintenance of a safe workplace. We believe that we comply in all material respects with the environmental laws and regulations that apply to us as of December 26, 2020. We did not receive any notices30, 2023. There are no matters pending that we currently believe are reasonably possible of violationshaving a material impact to our business, consolidated financial condition, results of environmental laws and regulations in fiscal 2020, 2019operations or 2018.cash flows. In the future, we may receive notices of violations of environmental regulations, or otherwise learn of such violations. Environmental contamination or violations may negatively impact our business.
Import and Export Control
We manufacture, market and sell our products both inside and outside the U.S. Certain products are subject to export control regulations. Failure to comply with these laws could result in sanctions by the U.S. or other respective governments, including substantial monetary penalties, denial of import, export or other privileges, and debarment from government contracts. Approximately 14% of our fiscal 2023 revenue and 22% of our fiscal 2022 revenue was derived from sales to customers in China, which were subject to the expanded export license requirements imposed by the United States government. The revenue derived from large multinational customers with a presence in China represented 5% of fiscal 2023 revenue, with the remaining 9% representing regional customers in China. As noted above, we have entered into an agreement to divest our China operations, which is expected to close in the first half of 2024.
Competition
The markets for our products are highly competitive, and we anticipate that these markets will continually evolve and be subject to rapid technological change. Our current and potential competitors are as below:
Probe Card Market.Cards. The probe card market comprisesis comprised of many domestic and foreign companies, and has historically been fragmented with many local suppliers servicing individual customers in often differentiated applications. Our primary competitors are AMST Co., Ltd., Chungwa Precision Technology, Feinmetall GmbH, Japan Electronic Materials Corporation, Korea Instrument Co., Ltd., M2N Co., Ltd., Microfriend Inc., Micronics Japan Co., Ltd., MPI Corporation, Micro Square Technology Inc., NHK Spring Co., Ltd., Soulbrain Engineering, Nidec SV TCL, Synergie CAD, TechnoProbe S.p.A, TSE Co., Ltd., WinWay Technology Co., Ltd., WILL-Technology Co., Ltd., and Yokowo, among others.
Probe card vendors such as Japan Electronic Materials Corporation, Micronics Japan Company, Ltd.Co., and TechnoProbe offer probe cards built using similar types of MEMS technology as do we.we do. The high capital investment and other costs associated with the development of MEMS probe cards and the time and high cost of the customer evaluation process represent significant barriers to entry for this type of technology.
We believe that the primary competitive factors in the production probe card market depend upon the type of integrated circuit being tested, but alsoand include customer service, knowledge of measurement techniques, delivery time, price, probe card lifetime, chip damage prevention, probe tip touch-down accuracy, electrical signal speed and frequencycurrent carrying capability of the probe card, number of chips contacted in parallel, number of probe tips and their layout and pitch, signal integrity, and frequency and effectiveness of any required cleaning. As a result of our relative strengths in these areas, we believe that we compete favorably in the advanced probe card market, and in probe cards for parallel testing of chips with densely-packed bond pads, bumps or pillars, and in high signal integrity testing of wireless radio frequency devices that operate up to millimeter-wave frequencies, a capability needed for components used in 5G applications.
Analytical Probes. Our primary competitorcompetitors in the analytical probe market isare GGB Industries Inc. Regional competitors include Yokowo and TechnoProbe Co Ltd. in Japan, and MPI/Allstron in Taiwan.MPI Corporation. We believe that the primary competitive factors in this market are breadth of probe types, probe frequency and electrical signal integrity, contact integrity and the related cleaning required, knowledge of measurement techniques, calibration support, delivery time and price. We believe that we compete favorably with respect to these factors.
Probe Stations. Our primary competitors in the probe station market are HiSOL, Inc., LTD/Accretech, The Micromanipulator Company Inc., MPI Corporation, Semiprobe, Signatone Corporation, Tokyo Electron (“TEL”), Tokyo Seimitsu Co., Vector Semiconductor Co. Ltd., and Wentworth Laboratories Inc. We believe that the primary competitive factors in the probe station market are measurement accuracy and versatility at temperature, including cryogenic temperatures, measurement speed, automation features, knowledge of measurement techniques, completeness of the measurement solutions, delivery time and price. We believe that we compete favorably with respect to these factors.
Metrology Systems. Our primary competitors in the metrology system market are Bruker Corporation, Camtek Ltd., Cohu, Inc., Filmetrics, Onto Innovation, and Unity SC. We believe that the primary competitive factors in this market are breadth of measurement types, measurement accuracy, measurement speed and throughput, ability apply algorithms to multiple sensor inputs to indirectly measure attributes not otherwise directly observable, knowledge of measurement techniques and applications, delivery time and price. We believe that we compete favorably with respect to these factors.
Thermal Subsystems. In the market for thermal subsystems, we compete principally against ERS Electronic GmbH, Espec Corp, and Temptronic Corporation. In addition, many of our probe station competitors develop and produce their own thermal subsystems for use in their products. We believe the primary competitive factors in this market are thermal performance, reliability, flexibility and completeness of product offerings. We believe that we compete favorably with respect to these factors.
Cryogenic Subsystems.Systems. In the market for cryogenic subsystems,systems, we compete principally against Bluefors Oy, Entropy, Lakeshore Cryotronics, Inc. (which recently acquired Janis Research), Leiden Cryogenics B.V., Montana Instruments, Nagase Techno-Engineering Co., Oxford Instruments, and STAR Cryoelectronics. We believe the primary competitive factors in this market are cryogenic performance, reliability, throughput and application expertise. We believe we compete favorably with respect to these factors.
Some of our competitors are also suppliers of other types of test and measurement equipment or other semiconductor equipment and may have greater financial and other resources than we do. Our competitors may enhance their current products and may introduce new products that will be competitive with ours. New alternatives to our products may also be introduced, by our current competitors or others, which may reduce the value of one or more of our products.
Semiconductor manufacturers may implement chip designs that include capabilities or use other methodologies that increase test throughput and reduce test content. This may reduce or eliminate some or all of our current products’ advantages. Semiconductor manufacturers may also increase their use of test strategies that include low performance semiconductor testers, less complex probe cards, or test procedures that do not involve our products. Our ability to compete favorably may also be adversely be affected by the long-standing relationships between our competitors and certain semiconductor manufacturers.
Intellectual Property
Our success depends in part upon our ability to continue to innovate and invest in research and development to meet the test and measurement requirements of our customers, to maintain and protect our proprietary technology, and to conduct our business
without infringing on the proprietary rights of others. We rely on a combination of patents, trade secrets, trademarks and contractual restrictions on disclosure to protect our intellectual property rights. We have filed actions to enforce those rights against third parties in the past, and may pursue such actions in the future.
We have generated, and continue to generate and maintain, patents and other intellectual property rights covering innovations that are intended to create a competitive advantage, and to support the protection of our investments in research and development. We believe that we possess one of the most substantial patent portfolios relevant to our products.
Although we believe that our patents and other intellectual property rights have significant value for each of our segments, we do not believe that maintaining or growing our business is materially dependent on any single patent. Due to the rapid pace of innovation within the markets that we serve, it is possible that our protection through patents may be less important than factors such as our technological expertise, continuing development of new products and technologies, protection of trade secrets, market penetration, customer relationships, and our ability to provide comprehensive support and service to customers worldwide.
No assurance can be given that any patents will not be challenged, invalidated or circumvented, or that the rights granted thereunder will provide us with a sustained competitive advantage. In addition, there can be no assurance that we will be able to protect our technology, or that competitors will not be able to independently develop similar or functionally competitive technologies, design around our patents, or attempt to manufacture and sell infringing products in countries that do not strongly enforce intellectual property rights.
Human CapitalOur People
We believe that each employee contributes to our culture of integrity, innovation, and teamwork. We reinforce this culture through our human capitalpeople development programs that drive talent acquisition, retention and employee engagement. These programs include carefully designed compensation atprograms across all levels, a variety of training, diversity and inclusion objectives,programs, and other initiatives.
Our compensation programs help attract and retain key talent and are designed for our employees to share in our company’s success. These programs focus on compensation that we believe is market-competitive, reflectreflects company performance, and alignaligns with drivers of stockholder value with differentiation based on performance, skills, geographic location, and tenure. We use information from outside compensation and benefits consulting firms to evaluate the competitiveness of the compensation we offer to employees in specific job types, and to evaluate the structure of our compensation programs, to help provide benchmarkingas a benchmark against our peers within the industry.
We also offer a variety of benefits such as health insurance, paid and unpaid leaves, retirement, and life and disability/accident coverage as applicable to their geographic location. We also offer a variety of other benefits which allow employees to select the options which meet their needs such as for wellness, insurance and professional services.
Our training initiatives promote the continuous improvement of our workforce to keep pace with an ever-increasinglyincreasingly complex business and industry.industry, and are designed to foster skills development and compliance and promote our company values. In addition to formal training, the capabilities of our workforce are intended to grow through structured feedback, mentorships,mentorship, team building, career progression, tuition assistance, and a culture of transparency. In 2020, we implemented a new training management platform, allowing for a more organized and efficient administration of training to our employees. Our training initiatives are designed to foster skills development, compliance and our company values.
We leverage both formal and informal programs to identify, foster,reward, and retain top talent. On an annual basis, we have conductedconduct a talent review process with our chief executive officer,Chief Executive Officer and leaders of our business units and functions that is focused uponon performance, potential, diversity, and succession for critical roles.
Our commitment to diversity and inclusion is a significant part of our human capitalpeople development programs. We believe that the recruitment, retention and promotion of a balanced workforce is an important driver of company performance. We support these values through sponsored events, networking groups, and management objectives. As an equal opportunity employer, we develop and implement an annual and targeted affirmative action plan reflecting specific metrics.plan.
We also inspire employee engagement through our commitment to corporate social responsibility, including in defined focus areas of sustainable technology, health and safety, labor and human rights, energy and climate change, supply chain responsibility, and waste and chemical management.
Our workplace health and safety programs include robust policies, procedures, training programs, and self-audits. Nearly all of our manufacturing employees are located in California, Oregon and Germany, where workplace safety and labor regulations
support maintaining high standards of employee protection. We have also been demonstrating a focus on health and safety in our response to the COVID-19 pandemic world-wide, including work-from-home flexibility, requiring those who may be sick to stay home; COVID-19 safety protocols across all locations, including social distancing, personal protective equipment and cleanings; regular internal communication regarding impacts of the COVID-19 pandemic and safety protocols; temperature screening at our manufacturing facilities; and restrictions on domestic and international non-essential travel.
We believe that our current human capital is appropriate to serve the requirements of our business, and that our human capital development programs and other initiatives are well designed to maintain the quality of our human capital.
For our manufacturing activities, the speed at which we can recruit, train and deploy quality new and replacement personnel is an important part of our ability to ramp up and maintain our production capacity. We rely upon both employees and resources from staffing firms to meet our needs for direct labor. Speed, accuracy and agility in this process is important to our business. Similarly, it is important to our business that we are able to regularly recruit and train quality new and replacement design and engineering staff. For example, our probe card products require that we develop custom designs for our customers’ new product designs. We face strong competition from companies in a variety of technology fields to secure the engineering talent that we require. In addition, restrictions on immigration and skilled-worker visas in a variety of jurisdictions impacts the ease and flexibility with which we can develop these resources.
As of December 26, 2020,30, 2023, we had 2,1662,115 regular full-time employees, including 1,3221,225 in operations, 383425 in research and development, 301276 in sales and marketing and 160189 in general and administrative functions. By region, 1,5661,469 of our employees were in North America, 347391 in Asia, and 253255 in Europe. As of December 26, 2020,30, 2023, our Probe Cards Segment had 1,5671,565 regular full-time employees, our Systems Segment had 399362 regular full-time employees, plus we had 200188 regular full-time employees in corporate functions. None of our employees in the United States are covered by a collective bargaining agreement. Certain employees at our manufacturing facility in Germany are represented by a works council. Our employees take pride in their work and we believe that our overall relations with our employees is positive.
Available Information
We maintain a website at http://www.formfactor.com. We make available free of charge on our website our Annual Reports on Form 10-K, Quarterly Reports on Form 10-Q, current reports on Form 8-K, and amendments to those reports filed or furnished pursuant to Section 13(a) or 15(d) of the Exchange Act, as soon as reasonably practicable after we electronically file such material with, or furnish it to, the United State Securities and Exchange Commission, or SEC. The reference to our website does not constitute incorporation by reference of the information contained at the site.
Directors and Executive Officers
The information required by this item is incorporated by reference to the proxy statement for our 2021 Annual Meeting of Stockholders.
Item 1A: Risk Factors
In addition to the other information in this Annual Report on Form 10-K, you should carefully consider the risk factors discussed in this Annual Report on Form 10-K in evaluating FormFactor and our business. If any of the identified risks actually occur, our business, financial condition and results of operations could be materially adversely affected, the trading price of our common stock could decline, and you may lose all or part of your investment in our common stock. The risks and uncertainties described in this Annual Report on Form 10-K are not the only ones we face. Additional risks that we currently do not know about, or that we do not consider sufficiently important to describe here in accordance with applicable regulations, may also impair our business operations or the trading price of our common stock.
Risks Relating to our Operations and the Nature of Our Business
The markets in which we participate are competitive, and if we do not compete effectively, our operating results could be harmed.
We have experienced increased competition in the markets in which we operate, and we expect competition to intensify in the future. Increased competition has resulted in, and in the future is likely tomay result in, price reductions, reduced gross margins or loss of market share.
Existing competitors might introduce new competitive products for the same markets that our products currently serve. These products may have better performance, lower prices, shorter delivery times or broader acceptance than our products.
In addition, new competitors, including test equipment manufacturers, may offer comparable or new technologies that reduce the value of our products. Also, semiconductor manufacturers may implement chip designs or methodologies that increase test throughput, reduce test content, or change their test procedures, thereby eliminating some or all of our current product advantages.
Our current or potential competitors may have larger customer bases, more established customer relationships or greater financial, technical, manufacturing, marketing and other resources than we do. As a result, they might be able to respond more quickly to new or emerging technologies and changes in customer requirements, devote greater resources to the development, promotion, sale and support of their products, and reduce prices to increase market share.
If we do not innovate and keep pace with technological developments in the semiconductor industry, our products might not be competitive, and our revenues and operating results could suffer.
We must continue to innovate and to invest in research and development to improve our competitive position and to meet the test and measurement requirements of our customers. Our future growth depends, in significant part, upon our ability to work effectively with and anticipate the future technical and operational needs of our customers and to develop and support new
products and product enhancements to meet thesethose needs on a timely and cost-effective basis. This may become more difficult to do as the semiconductor industry innovates to address demand for AI-related products, which may develop more slowly than we anticipate or change from one period to another. Our customers’ needs are becoming more challenging as the semiconductor industry continues to experience rapid technological change driven by the demand for complex circuits that are shrinking in size, are increasing in speed and functionality, and are produced on shorter cycle times and at reduced unit cost.
Successful product design, development and introduction on a timely basis require that we:
•collaborate with customers to understand their future requirements;
•design innovative and performance-enhancing product architectures, technologies and features that differentiate our products from those of our competitors;
•in some cases, engage with third parties who have particular expertise in order to complete one or more aspects of the design and manufacturing process;
•qualify with the customer(s) thecustomers new product,products, or an existing product incorporating new technology;
•transition our products to new manufacturing technologies;technologies, as necessary;
•offer our products for sale at competitive price levels while maintaining our gross-marginsgross margins within our financial model;
•identify emerging technological trends in our target markets;
•maintain effective marketing strategies;
•obtain and maintain intellectual property rights where necessary;
•hire and retain high performing engineering personnel;
•respond effectively to technological changes or product announcements by others; and
•adjust to changing market conditions quickly and cost-effectively.
Not only do we need the technical expertise to implement the changes necessary to keep our technologies current, but we must also rely heavily on the judgment of our management to anticipate future market trends. If we are unable to timely predict industry changes or industry trends, or if we are unable to modify our products or design, manufacture and deliver new products on a timely basis, or if a third party with which we engage does not timely deliver a component or service for one of our product modifications or new products, we might lose customers or market share. In addition, we might not be able to recover our research and development expenditures, which could harm our operating results.
We depend upon the sale of our probe card products for the substantial majority of our revenues.
We derive the majority of our revenues from the sale of our probe card products, primarily to manufacturers of microprocessor,microprocessors, foundry & logic and memory devices, despite progress in diversifying our product offerings. We anticipate that sales of probe cards will represent a substantial majority of our revenues for the foreseeable future. Our success depends in large part upon the continued acceptance of our products on the basis of a variety of factors including performance, quality, timely delivery and price, and depends upon our ability to continue to develop and introduce new products that meet our customers’ requirements. The degree to which we depend upon the sales of our probe card products for our revenues may increase our susceptibility to failures to satisfy the customers for such products, which may adversely affect our revenues and our ability to grow our business.
We derive a substantial portion of our revenues from a small number of customers.
A relatively small number of customers account for a significant portion of our revenues. One customer represented 31.5%17.1% of total revenues in fiscal 2020, two customers represented a combined 36.8% of total revenues in fiscal 2019 and2023, one customer represented 19.0% of total revenues in fiscal 2018.2022 and two customers represented a combined 31.8% of total revenues in fiscal 2021. We anticipate that sales of our products to a relatively small number of customers will continue to account for a significant portion of our revenues, andwhich can drive material fluctuations in sales volume.volume, gross margins due to changes in mix, and leverage on fixed costs. Consolidation in the semiconductor industry may increase this concentration. In the future, the loss of any of these customers, or cancellation, reduction or deferral of even a small number of purchases of our products by these customers, could
significantly reduce our revenues. A decline in our customers' market share and commercial success, including their ability to compete favorably within their respective end markets, could significantly impact demand for our products and reduce our revenues. Cancellations, reductions, deferrals or non-payment of invoices could result from another downturndownturns in the semiconductor industry, including the cyclical downturn we are now experiencing, manufacturing delays, quality or reliability issues with our products, or from interruptions to our customers’ operations due to fire, natural disasters or other events, or other issues with the financial stability of our customers. Furthermore, because our probe cards are custom products designed for our customers’ unique wafer designs, any cancellations, reductions or delays can result in significant non-recoverable costs.costs, including but not limited to the potential for impairment of inventories. In some situations, our customers might be able to cancel or reduce orders without a significant penalty.
If our relationships with our customers deteriorate, our product development activities could be harmed.
The success of our product development efforts depends upon our ability to anticipate market trends and to collaborate closely with our customers. Our relationships with these customers provide us with access to valuable information regarding manufacturing and process technology trends in the semiconductor industry, which enables us to better plan our product development activities. These relationships also provide us with opportunities to understand the performance and functionality requirements of our customers, which improves our ability to customize our products to fulfill their needs. Our relationships with our customers could deteriorate as a result of a variety of factors, such as if they become concerned about our ability to deliver quality products on a timely basis or to protect their intellectual property. Many of our customers are large companies that place significant orders with us, and the consequences of deterioration in our relationship with any of these companies could be significant due to the competitiveness of our industry and the significant influence that these companies exert in our market.
Consolidation in the semiconductor industry and within the semiconductor test equipment market could adversely affect the market for our products and negatively impact our ability to compete.
Consolidation in the semiconductor industry may reduce our customer base and could adversely affect the market for our products, which could cause a decline innegatively impact our revenues. With consolidation, the number of actual and potential customers for our products has decreased in recent years. Consolidation may lead to relatively fewer opportunities to sell our products if we are not chosen as a supplier by any given prospective customer, and may lead to increased pricing pressures from customers that have greater volume purchasing power.
There has also been consolidation within the semiconductor test equipment market. This consolidation trend could change our interactions and relationships with complementary tester, instrument, and proberprobe card suppliers, and negatively impact our revenue and operating results.
Changes in customers’ test strategies, equipment and processes could decrease customer demand for our products.
The demand for our products depends in large part upon the number of semiconductor designs, the pace of technology and architecture transitions in chip designs and overall semiconductor unit volume. The number of probe cards involved in a customer’s wafer testing can depend upon the number of devices being tested, the complexity of these devices, the test software program, the test equipment itself, and the utilization of chip designs featuring design-for-testability or self-testing capabilities. Customers may demand fewer probe cards or probing systems if they use test strategies that reduce the technical requirements on test equipment, improve available data on device performance earlier in the manufacturing process, or test devices later in the manufacturing process. Changes in the effectiveness of test technologies and test strategies used by customers may cause us to lose sales and revenues.
We may also lose sales if new semiconductor technologies or designs are implemented which cannot be efficiently tested using the products that we offer, or if semiconductor manufacturers reduce the amount or degree of testing that they perform. We may also incur significant research and development expenses in order to introduce new product architectures and platforms to serve the testing needs of new semiconductor technologies. These expenses are often incurred in advance of customer adoption or other anticipated benefits, and the return on these investments may be lower, or may develop more slowly, than we expect. If we do not achieve the benefits anticipated from these investments, or if the achievement of these benefits is delayed, our operating results may be negatively impacted.
Cyclicality in the semiconductor industry has in the past and may in the future adversely impact our sales.
The semiconductor industry has historically been cyclical and is characterized by wide fluctuations in product supply and demand. From time to time, this industry has experienced significant downturns, often in connection with, or in anticipation of, maturing product and technology cycles, excess inventories, and declines in general economic conditions. The global economic and semiconductor downturns have caused and may in the future cause our operating results to decline dramatically from one period to the next. For example, the semiconductor industry has been experiencing a cyclical downturn since the second half of fiscal 2022, which has extended through fiscal 2023, resulting in a significant decline in demand for foundry & logic and DRAM products over the same period. Global economic stability can be negatively affected by a variety of factors and interrelationships, including the potential impactimpacts of Brexit, epidemics and pandemics, (such as the current COVID-19 pandemic), military conflicts or regional tensions, climate change, trade barriers (such as the U.S.-China trade restrictions implemented since fiscal 2022) and other factors acting alone or in combination. Some of these factors can also have a more direct adverse impact upon our operations to varying degrees. Our business depends heavily upon the development and manufacture of new semiconductors, the rate at which semiconductor manufacturers make transitions to smaller nanometer technology nodes and implement tooling cycles, the volume of production by semiconductor manufacturers, and the overall financial strength of
our customers, which, in turn, depend upon the current and anticipated market demand for semiconductors and products that use semiconductors, such as servers, personal computers, automobiles and cell phones, that use semiconductors.phones. During industry downturns, semiconductor manufacturers sharply curtail their spending, including their spending on our products, which may adversely impact our revenues, gross margins and results of operations. Further, a
protracted downturn could cause one or more of our customers to become insolvent, resulting in a loss of revenue and impacting our ability to collect on accounts receivable. The timing, length and severity of these cyclical downturns are difficult to predict, and our business depends on our ability to plan for and react to these cyclical changes.
Because we generally do not have a sufficient backlog of unfilled orders to meet our quarterly revenue targets, revenues in any quarter are substantially dependent upon customer orders received and fulfilled in that quarter.
Our revenues are difficult to forecast because we generally do not have sufficient backlog of unfilled orders to meet our quarterly revenue targets at the beginning of a quarter. Rather, a substantial percentage of our revenues in any quarter depend upon customer orders for our products that we receive and fulfill in that quarter. Because our expense levels are based in part on our expectations as to future revenues and to a large extent are fixed in the short term, we might be unable to adjust spending in time to compensate for any unexpected shortfall in revenues. Accordingly, any significant shortfall of revenues in relation to our expectations could hurt our operating results.
If our ability to forecast demand for our products or the predictability of our manufacturing yields deteriorates, we could incur high inventory losses.
Each semiconductor chip design requires a custom probe card. Because our probe card products are design-specific, demand for these products is difficult to forecast. Due to our customers’ short delivery time requirements, we often design and procure materials and, at times, produce our products in anticipation of demand for our products rather than in response to an order. Our manufacturing yields and inventory requirements, particularly for new products or when we are operating at high output levels, have at times been unpredictable. If we do not obtain orders as we anticipate, if we suffer manufacturing errors, or if we build additional inventory to compensate for unpredictable manufacturing yields, we could have excess or obsolete inventory that we may not be able to sell, which would likely result in inventory write-offs or material charges for scrap.
If we are unable to efficiently manufacture our existing and new products, our business may be materially adversely affected.
We must continuously improve our manufacturing processes in an effort to increase yields and product performance, lower our costs and reduce the time required for us to design, manufacture and deliver our products in volume. If we cannotfail to do these things,so, both our existing products and our new products may not be commercially successful, our revenues and profitability may be adversely affected, our customer relationships and our reputation may be harmed, and our business may be materially adversely affected.
To improve our manufacturing processes, we have incurred, and may incur in the future, substantial costs in an effort to optimize capacity and yields, open new manufacturing facilities, implement new manufacturing technologies, methods and processes, purchase new equipment, upgrade existing equipment, and train technical personnel. We have experienced, and may experience in the future, manufacturing delays and other inefficiencies in connection with implementation of these improvements and customer qualifications of new processes or products, which have caused and could cause in the future, our operating results to decline.products. These delays and other inefficiencies may arise from a variety of factors, including disruptions to or the unavailability of sufficient electrical power as a result of insufficient electrical power infrastructurefactors. Further, these investments may consume available cash in the regions where weshort term for anticipated benefit that may or may not occur. Our operating results and liquidity have manufacturing facilities such asbeen and may in California.the future be negatively impacted by these factors.
We have also experienced, and may experience in the future, difficulties in manufacturing our complex products in volume, on time, and at acceptable yields and cost, andand/or have installation issues in the field, due to the complexity of customer requirements. These challenges, if not timely resolved could have a material adverse effect on operating results and our ability to compete effectively.
If we are unable to continue to reduce the time it takes for us to design and produce products, our growth could be impeded.
Our customers continuously seek to reduce the time it takes them to introduce new products to market. The cyclicality of the semiconductor industry, coupled with changing demands for semiconductor products, requires our customers to be flexible and highly adaptable to changes in the design, volume and mix of products they must produce. We may be unable to design, configure and produce our products within the short cycle times required to respond to such rapid changes. We have lost sales in the past where we were unable to meet a customer’s required delivery schedules. If we are unable to continue to reduce the time it takes for us to design, manufacture and ship our products in response to the needs of our customers, our competitive position could be harmed and we could lose sales.
Products that do not meet specifications or that contain defects could damage our reputation, decrease market acceptance of our technology, cause us to lose customers and revenues, and result in liability to us.
The complexity and ongoing development of our product designs and manufacturing processes could lead to design or manufacturing problems. Problems might result from a number of factors, including design defects, materials failure, failure of
components manufactured by our suppliers to meet our specifications, contamination in the manufacturing environment, impurities in the materials used, and unknown sensitivities to process conditions such as temperature and humidity, and equipment failures. Any errors or defects could:
•cause lower than anticipated yields and lengthen delivery schedules;
•cause delays in product shipments;
•cause delays in new product introductions;
•cause us to incur warranty expenses;
•result in increased costs and diversion of development resources;
•cause us to incur increased charges due to unusable inventory;
•require design modifications;
•could have implications for timing of revenue recognition and associated costs; or
•decrease market acceptance or customer satisfaction with these products.
The occurrence of any one or more of these events could adversely affect our business, reputation and operating results.
As part of our sales process, we could incur substantial sales and engineering expenses that do not result in revenues.
Our customers generally expend significant efforts evaluating and qualifying our products prior to placing an order. While our customers are evaluating our products, we might incur substantial sales, marketing, and research and development expenses. For example, we typically expend significant resources educating our prospective customers regarding the uses and benefits of our products and customizing them to the potential customer’s needs, for which we might not be reimbursed. The substantial resources we commit to our sales efforts may not result in any revenues from a customer. For example, many semiconductor processes, architectures, and designs never reach production, including those for which we may have expended development effort and expense. In addition, prospective customers might decide not to use our products or use our products for a relatively small percentage of their requirements after we have expended significant effort and expense toward product design, development, and/or manufacture.manufacturing. If we do not achieve the benefits anticipated from any of these investments, or if the achievement any of these benefits is delayed, our operating results may be negatively impacted.
We obtain some of the components and materials we use in our products from a sole source or a limited group of suppliers, and the partial or complete loss of one of these suppliers, or scarcity of raw materials from one of these suppliers, could cause production delays.
We obtain some of the components and materials used in our products, such as printed circuit board assemblies, plating materials and ceramic substrates, from a sole source or a limited group of suppliers, and in some cases alternative sources are not currently available. Because we rely on purchase orders rather than long-term contracts with the majority of our suppliers, we cannot guarantee our ability to obtain components and materials in the long term. A sole or limited source supplier could increase prices, which could lead to a decline in our gross profit. Our dependence upon sole or limited source suppliers exposes us to several other risks, including inability to obtain an adequate supply of materials, late deliveries, poor component quality, and business disruptions while we seek to identify and qualify alternative suppliers. This could be exacerbated by certain events outside the control of either the supplier or us, such as the COVID-19 pandemic.global, regional or national health crises, armed conflicts, regional tensions or other adverse global, regional and national events. The occurrence of any of these risks could adversely impact our business, results of operations and financial condition.
We are dependent on the availability of certain key raw materials and natural resources used in our products and various manufacturing processes, and we rely on third parties to supply us with these materials in a cost-effective and timely manner. Our access to raw materials may be adversely affected if our suppliers’ operations were disrupted as a result of limited or delayed access to key raw materials and natural resources, which may result in increased cost for these items.
Our operations, or those of our important suppliers, business partners and customers, could be adversely affected by events outside of our control such as natural disasters, pandemics and man-made disasters.
Our business is vulnerable to the direct and indirect impact of natural and man-made disasters, such as floods, earthquakes, volcanic eruptions, nuclear accidents, acts of terrorism, epidemics, pandemics, military conflicts, climate change, and other factors acting alone or in combination. It is also possible that future natural and man-made disasters could negatively impact the sales of our products as a result of impacts upon our customers’ ability to make or sell their products, or impacts upon our suppliers’ ability to supply components to us on a timely basis.
For example, the COVID-19 pandemic has shown the extent to which new pathogens are capable of disrupting business operations and economic activity locally and worldwide. Epidemics and pandemicsHealth crises can severely disrupt global supply chains, including for parts and materials that we use to manufacture our products, and affect economic conditions in the markets for our products. The circumstances which give rise to epidemics and pandemics from new or existing pathogens with similar impacts are expected to persist indefinitely.
Another example of events outside of our control arises from our manufacturing facilities being located in seismically active areas in California and Oregon. The manufacturing equipment and processes that we use can be severely disrupted by seismic activity. A significant seismic event in the areasan area of our operations could have a materially negative impact on our operations, financial results or financial condition.
Much of the infrastructure on which we rely for our operations is outside of our control, such as for electric power.power infrastructure. We have recentlypreviously experienced disruptions to electrical power at some of our premises in California and China, especially when aging infrastructure or inadequate electric power service has been impacted by high demand, fires, and weather which may worsen over time with climate change, and other events. Our efforts to mitigate the effects on us from interruptions in the availability of electric power, or other infrastructure, may not adequately prevent materially negative impacts on our operations, and in turn our financial results.
Climate change, or legal, regulatory or market measures to address climate change, may negatively affect our business and operations.
The COVID-19 pandemic has impacted, and is expected to continue to negativelyphysical impacts of climate change could adversely impact our operations,costs and thoseoperations. There has been public discussion that climate change may be associated with rising sea levels as well as extreme weather conditions such as more intense hurricanes, thunderstorms, tornadoes, drought, and snow or ice storms. Extreme weather conditions may increase our costs or cause damage to our facilities, and any damage resulting from extreme weather may not be fully insured, and may also limit our ability to fully insure facilities on a cost-effective basis in the future. Periods of extended inclement weather may inhibit construction of our important suppliers, business partnerscapital improvement projects. Any such events could adversely impact our costs or results of operations.
Concerns relating to climate change have led to a range of local, state, federal, and customers.
Weinternational regulatory and policy efforts to seek to address greenhouse gas (“GHG”) emissions. In the U.S., various approaches are exposed to risks associated with public health crisesbeing proposed or adopted at the federal, state, and outbreaks of contagious diseases,local government levels, such as COVID-19. To date, COVID-19 has had, and may continuerecent legislation enacted in California. These efforts could lead to have, an adverse impactadditional costs on our operations, our supply chains and our expenses, including as a result of precautionary measures that we take in response to COVID-19. A variety of health orders and regulations arising from the pandemic apply to our operations and employees in the regions where we operate which have had, and will continue to have, negative affects upon our operations and business. Even as the availability of vaccines may begin to relieve the economic effects of the COVID-19 pandemicCompany now or in the future, there remains substantial risk that vaccination rates will remain slow, new variants ofincluding increased energy and other capital or operational costs, or additional legal requirements on the virus may impede the vaccines’ efficacy, or other factors may prolong or worsen the pandemic and its direct and indirect affects upon our business.
A significant amount of our management resources have been, and will continue to be, focused on mitigating the negative impacts of COVID-19 on our business. This has required, and will continue to require, a substantial investment of time and resources across our enterprise which may continue to negatively impact other valuable activities, such as the development of new technologies, products or capabilities. In addition, many of our employees are working remotely for an extended period, which can increase operational risk and cybersecurity risks. If we do not respond appropriately to the COVID-19 pandemic, or if employees, customers or others do not perceive our response positively, we could suffer damage to our reputation, whichCompany. These efforts could also adversely affectmaterially increase our business.
We obtain somecosts of the components and materials used in our products from a sole sourceevaluating potential manufacturing sites, or a limited group of suppliers, and in some cases eliminate some potential locations as feasible sites. In addition to the potential for additional GHG regulation or incentives, enhanced corporate, public, and stakeholder awareness of climate change could affect the Company's reputation or customer demand. Climate change concerns and GHG regulatory efforts could also affect the Company's customers themselves. We could also face pressure from these groups to adapt our physical facilities for alternative sources are not readily available. The COVID-19 pandemicof energy, which may heighten the risks posed by our dependence upon solebe less cost-effective than current sources. Any of these factors, individually or limited source suppliers to the extent that the pandemic could disrupt the operations ofcombined with one or more factors, or other unforeseen factors or other impacts of these suppliers, resulting in an inability to obtain an adequate supply of materials, late deliveriesclimate change, could affect the Company and adversely impact our business, operations, or poor component quality while we seek to identify and qualify alternative suppliers.
The extent to which the COVID-19 pandemic impacts our operations and those of our important, suppliers, business partners and customers will depend on numerous evolving factors and future developments that we are not able to predict, including but not limited to: the severity and duration of the pandemic; governmental, business and other actions (which could include further restrictions on our operations); the ongoing requirements of social distancing and health orders; the impacts on our supply chain; the impact of the pandemic on economic activity; the extent and duration of the effect on business confidence and investments by our customers; the effects of changes to our operations that may continue indefinitely; the effects on our workforce and our ability to meet our staffing needs, particularly if members of our workforce are exposed or infected; any impairments in the value of our assets; and the potential impacts upon our internal controls, including those over financial reporting, that may result from changes in working environments and other circumstances. All of these circumstances are highly uncertain and cannot be predicted. In addition, the circumstances which give rise to new or existing infectious diseases becoming epidemics or pandemics with potentially similar impacts are expected to persist.condition.
Adverse global, regional and national economic conditions resulting from the COVID-19 pandemic could have a negative effect on our business, results of operations, and financial condition, liquidity, and liquidity.access to capital markets.
The COVID-19 pandemic has adversely affected,A variety of factors, including natural disasters, health crises, climate change, military conflicts and other geopolitical events, may continue to adversely affect national, regional and global economies and financial markets. Although the long-term macroeconomic effects of the pandemic cannot be predicted with certainty, the continued progression or persistence of the pandemicAny such adverse events may result in global, regional or national economic slowdowns or other economic downturns. Such downturns could curtail or delay spending by businesses and consumers which may ultimately result in reductions in the demand for our products, and greater volatility in demand and supply conditions. The COVID-19 pandemic hasconditions and other adverse impacts. For example, any deterioration in the relations between Taiwan and China, and other factors affecting military, political or economic conditions in Taiwan or elsewhere in Asia, could adversely impact our suppliers, manufacturers and customers with operations located in the region, which could disrupt our business operations, affect demand for our products or increase our costs, negatively impacting our revenues, gross margins, and overall results of operations. Additionally, these events may also increasedincrease uncertainty in global credit and financial markets. The impacts of such uncertainty and disruptions to the availability of credit or other sources of capital as the pandemic continues or worsens, could also adversely affect our ability to access capital on favorable terms or on a timely basis to meet our objectives. Any of these factors could have a material adverse impact on our business, results of operations, financial condition and cash flows.
In addition, governmentsSustained inflation could have a material adverse effect on our business, financial condition, results of operations and liquidity.
Inflation rates in several countries where we operate, including the United States, have enacted stabilization and stimulus measures in an effort to counteract some of the economic impacts of COVID-19. The demand and business environmentsmarkets in which we operate have benefitedincreased and may continue to rise. Inflation in recent periods has led us to experience higher costs related to labor, materials from suppliers, and transportation. Our suppliers raised their prices and may continue to raise prices, and in the competitive markets in which we operate, we may not be able to make corresponding price increases, productivity improvements or cost reductions to preserve our gross margins and profitability. If inflation rates continue to rise or remain elevated for a sustained period of time, they could have a material adverse effect on our business, financial condition, results of operations and liquidity. We have generally been able to offset increases in these costs through various productivity improvement and cost reduction initiatives, as well as by adjusting our selling prices to pass through some of these measures, while the long-term economic impacts ofhigher costs to our customers; however, our ability to raise our selling prices depends on market conditions and
increased government borrowing to fund these measures may have future negative effects on certain economies. Any significant discontinuations, reductions, or other changes to such stabilization and stimulus programs may harm our customers’ or suppliers’ financial results and financial condition, and could also have an adverse macroeconomic impact that may lead to reductions incompetitive dynamics. Given the demand for our products. Even if maintained or expanded, such stimulus and stabilization measures may fail over the long term to mitigate the adverse economic effects of the pandemic, and may fail to prevent or exacerbate any long-term economic downturns.
As a result of the uncertain scope and duration of the COVID-19 pandemic and the uncertain timing of any national, regional or global recovery and economic normalization,our actions compared to the timing of these inflationary pressures, there may be periods during which we are unable to estimatefully recover the ultimate impacts onincreases in our operations and financial results.costs.
We rely on the security and integrity of our electronic data systems, managed both internally and the proper design and implementation of these systemsby third parties, for our business requirements, and our business can be damaged by deficiencies, disruptions, security breaches or compromises of these systems.
We rely on electronic data systems, including a variety of software and networking, computing and storage equipment and other information technologies, to operate and manage our business and to collect, process, maintain, and safeguard information, including information belonging to our customers, partners, and personnel.
Our electronic data systems may be subject to defects, failures or disruptions as a result of, among other things, natural disasters, accidents, power disruptions, telecommunications failures, deficiencies in new system designs and implementations, acts of terrorism or war, physical security breaches, computer viruses or other cyber security attacks.
For example, in June 2020, we discovered a data breach incident involving malware and related behaviors that resulted in unauthorized access to our information technology systems. Although we do not believe this incident had any significant impacts on our production and ordinary course operations, such Such incidents or other system failures or disruptions could subject us to downtime and delays, compromise or loss of sensitive or proprietary information, destruction or corruption of data, financial losses from remedial actions, breaches of obligations to third parties under privacy laws or contracts, or damage to our reputation or customer relationships. Any of the foregoing could have a material adverse effect on our business, operating results and financial condition.
In addition, we are actively implementing new electronic data systems relating to substantial parts of our business, operations and accounting.The process of implementing and commencing our reliance on these new systems involves particularly higher risks of deficiencies or disruptions than the continued use of systems which have had a longer history of use and observed performance in the Company.
Because we conduct most of our business internationally, we are subject to operational, economic, financial and political risks abroad.
Sales of our products to customers outside of the United States represent a significant part of our past and anticipated revenues. Our international sales as a percentage of our revenues were 82%74%, 74%83% and 75%84% for fiscal 2020, 20192023, 2022 and 2018,2021, respectively. Certain of our non-U.S. based customers also purchase through their subsidiaries in the United States. In the future we expect international sales to continue to account for a significant percentage of our revenues. Accordingly, we will be subject to risks and challenges that we would not otherwise face if we conducted our business solely in the United States.
These risks and challenges include:
•compliance with a wide variety of foreign laws and regulations;regulations, including social, political, immigration, and tax and trade policies;
•legal uncertainties regarding taxes, tariffs, quotas, export controls, export licenses and other trade barriers;
•political and economic instability or foreign conflicts, including trade wars, that involve or affect the countries of our customers;
•government restrictions on, or nationalization of, our operations in any country, or restrictions on our ability to repatriate earnings from or distribute compensation or other funds in a particular country;
•adverse changes relating to government grants, tax credits, or other government incentives, including more favorable incentives provided to competitors;
•difficulties in collecting accounts receivable and longer accounts receivable payment cycles;
•difficulties in staffing and managing personnel, distributors and representatives;
•reduced protection for intellectual property rights in some countries;
•currency exchange rate fluctuations, which could affect the value of our assets denominated in local currency, as well as the price of our products relative to locally produced products;
•the impact of pandemicsglobal, regional and national geopolitical or other disruptions to tradeevents, such as political instability, acts of war or terrorism, regional tensions, health crises and production;natural disasters;
•seasonal fluctuations in purchasing patterns in other countries; and
•fluctuations in freight rates and transportation disruptions.
Any of these factors could harm our existing international operations, impair our ability to continue expanding into international markets or materially adversely affect our operating results. Political developments in the United States and elsewhere may increase the risks and uncertainties associated with conducting international business, including the possibilities of greater tariffs and other trade barriers in the regions where we conduct business. In fiscal 2020,2023, we observed a continuing trend of increasing risks and challenges in the conduct of our international business activities, including expanded tariffs and other trade barriers affecting the United States and China. Additionally, we are required to comply with foreign import and export requirements, customs and value added tax standards that can be unclear or complex. Our failure to meet these requirements and standards could negatively impact our business operations.
Our foreign operations expose us to additional risks relating to currency fluctuations.
Our international operations are significant to our revenues and net income, and we plan to continue to grow internationally. We have significant business operations located in Germany. While we report our financial results in U.S. dollars, we incur certain costs in other currencies, and have certain foreign currency denominated assets and liabilities. We, therefore, face
exposure to fluctuations in currency exchange rates. Significant fluctuations in exchange rates between the U.S. dollar and foreign currencies may adversely affect our revenues and earnings, despite our hedging of a portion of our international currency exposures. Additionally, hedging programs are inherently risky and could expose us to additional costs and risks that could adversely affect our financial condition and results of operations.
Increasingly restrictive export regulations and other trade barriers may materially harm our business.
Sales of our products to customers outside of the United States represent a significant part of our past and anticipated revenues, including sales involving exports from the United States to China. There is a continuing trend of increasingGeopolitical and trade barriers affecting exports and importstensions between the United States and China.China, one of our largest markets, have led to increased tariffs and trade restrictions and have affected customer ordering patterns, and this dynamic between the countries may persist or increase for the foreseeable future. For example, the U.S. Department of Commerce, Bureau of Industry and Security (BIS)(“BIS”), has recently amended the U.S. Export Administration Regulations to expand license requirements on exports to entities in China that may support military end uses. These rules expand export license requirements on a broader set of items from the U.S., including many of our products, and for a broader set of customers in China and elsewhere. The BIS has also broadened the application of U.S. export controls to certain items which are the foreign direct products of the U.S. technologies which can affect a variety of customers outside of China who supplier productsmay be subject to certain entities in China.Foreign Direct Product Rules (“FDPR”). There is no assurance that we will obtain any export licenses on a timely basis or at all. There also remains considerable uncertainty regarding the interpretation and implementation of new regulations. In addition, the reaction to these rules byU.S. trade regulations, governments and private businesses outside the U.S.,United States, particularly in China, may be expected to includeimplement retaliatory controls and preferences for non-U.S. or local suppliers. Insuppliers, which can increase our manufacturing costs, make our products less competitive, reduce demand for our products, limit our ability to sell to certain customers, limit our ability to procure components or raw materials, or impede or slow the movement of our goods across borders. For example, China has restricted U.S. access to certain minerals and has blocked certain companies that provide products to Taiwan's military from selling products in China. Also, in China, we are already observing stronger preferences for non-U.S. suppliers in general, and in favor of new and existing local suppliers in particular. These and other regulatory and policy changes, and the reactions of customers to such changes, in the U.S. and elsewhere, could materially and negatively affect our future sales and operating results.
If we fail to protect our proprietary rights, our competitors might gain access to our technology, which could adversely affect our ability to compete successfully in our markets.
If we choose not to protect our proprietary rights or fail in our efforts to protect our proprietary rights, our competitors might gain access to our technology. Unauthorized parties might attempt to copy aspects of our products or to obtain and use information that we regard as proprietary. Others might independently develop similar or competing technologies or methods or design around our patents. In addition, the laws of many foreign countries in which we or our customers do business do not protect our intellectual property rights to the same extent as the laws of the United States. As a result, our proprietary rights could be compromised, our competitors might offer products similar to ours, and we might not be able to compete successfully. We also cannot assure that:
•our means of protecting our proprietary rights will be adequate;
•patents will be issued from our pending or future applications;
•our existing or future patents will be sufficient in scope or strength to provide any meaningful protection or commercial advantage to us;
•our patents or other intellectual property will not be invalidated, circumvented or successfully challenged in the United States or foreign countries; or
•others will not misappropriate our proprietary technologies or independently develop similar technologies, duplicate our products or design around any of our patents or other intellectual property, or attempt to manufacture and sell infringing products in countries that do not strongly enforce intellectual property rights.
We have spent, and may be required to spend in the future, significant resources to monitor and protect our intellectual property rights. Any litigation, whether or not resolved in our favor, and whether initiated by us or by a third party, could result in significant and possibly material expenses to us and divert the efforts of our management and technical personnel.
We might be subject to claims of infringement of other parties’ proprietary rights.
Our industry is characterized by uncertain and conflicting intellectual property claims. As we have in the past, we may receive claims that we are infringing intellectual property rights of others. The resolution of intellectual property claims, with or without merit, could be time consuming, result in costly litigation with highly uncertain outcomes, or impact our delivery of products. In the event of an adverse judgement or settlement, we might be required to pay substantial amounts, cease the use or sale of infringing products, spend significant resources to develop non-infringing technology, discontinue the use of certain technology, or enter into license agreements. License agreements might not be available on terms acceptable to us or at all. In addition, certain of our customer contracts contain provisions that require us to defend or indemnify our customers for third
party intellectual property infringement claims, which could increase the costs and negative impacts of intellectual property claims.
We have recorded restructuring, inventory write-offs and asset impairment charges in the past, and may do so again in the future, which could have a material negative impact on our business.
We have recorded significant restructuring charges in fiscal 2019prior periods, and 2018. Wewe may implement restructuring plans in the future, which would require us to take additional, potentially material, restructuring charges related to employee terminations, asset disposal or exit costs. We may also be required to write offwrite-off additional inventory if our product build plans or usage of inventory experience declines, and such additional write-offs could constitute material charges. In addition, significant adverse changes in market conditions could require us to take additional material impairment charges related to our long-lived assets if the changes impact the critical assumptions or estimates that we use in our assessment of the recoverability of our long-lived assets. Any such additional charges, whether related to restructuring, asset impairment or factory underutilization, may have a material negative impact on our operating results and related financial statements.
We may not be able to recruit or retain qualified personnel.
We believe our ability to manage successfully and grow our business and to develop new products depends, in large part, on our ability to recruit and retain qualified employees, particularly highly skilled technical, sales, management, and other key staff personnel. Competition for qualified resources is intense and otherintense. Other companies may have greater resources available to provide substantial inducements to lure key personnel away from us or to offer more competitive compensation packages to individuals we are trying to hire.
Our failure to comply with environmental laws and regulations could subject us to significant fines and liabilities, and new laws and regulations or changes in regulatory interpretation or enforcement could make compliance more difficult and costly.
We are subject to various U.S. federal, state and local, and foreign governmental laws and regulations relating to the protection of the environment, including those governing the discharge of pollutants into the air and water, the management and disposal of hazardous substances and wastes, the cleanup of contaminated sites and the maintenance of a safe workplace. We could incur substantial costs, including cleanup costs, civil or criminal fines or sanctions, and third-party claims for property damage or personal injury, as a result of violations of or liabilities under environmental laws and regulations or non-compliance with the environmental permits required at our facilities.
Environmental laws, regulations and permits could require the installation of costly pollution or waste control equipment or operational changes to limit waste or emissions or decrease the likelihood of accidental releases of hazardous substances. In addition, changing laws and regulations, new laws and regulations, stricter enforcement of existing laws and regulations, the discovery of previously unknown contamination at our or others’ sites, or the imposition of new cleanup requirements could require us to curtail our operations, restrict our future expansion, subject us to liability and cause us to incur future costs that could harm our operations, thereby adversely impacting our operating results and cash flow.
We are exposed to additional risks as a result of increased attention by our stakeholders to environmental, social and governance (“ESG”) matters.
Our stakeholders, including customers, investors, advisory firms, employees, and suppliers, among others, are increasing their attention to, and establishing expectations for, ESG and related matters. These expectations can extend to our corporate practices, initiatives, and disclosures, as well as stakeholder standards or preferences for investments or doing business. Third-party agencies have also established or added standards for rating companies on a range of ESG-related factors that may be inconsistent and subject to change. As a result, these expectations may impact the attractiveness of our business, the manner in which we do business, our reputation, the costs of doing business, and the willingness of these stakeholders to engage with, invest in, or retain us. We may be further impacted by the adoption and evolution of ESG-related regulation and legislation in the jurisdictions in which we do business, which could result in increased compliance, operational, and other costs.
In addition, the Company has provided voluntary disclosures on ESG matters, including energy usage, greenhouse gas emissions, health and safety, diversity and inclusion, and labor and human rights. Such disclosures are aspirational and based on frameworks and standards for such initiatives and progress that are still developing, assumptions that may change, and disclosure control and procedures that continue to evolve. We may fail, or be perceived to fail, in attaining or maintaining our ESG-related initiatives. The topics on which we focus may not be popular with our stakeholders. These events or perceptions may expose us to additional reputational and operational risks.
Risks Relating to Our Acquisitions
We have made acquisitions, and may make additional acquisitions or investments in the future, which could put a strain on our resources, cause ownership dilution to our stockholders, or adversely affect our financial results.
Our acquisitions or investments may subject us to new or heightened risks. Integrating any newly acquired businesses, products or technologies into our company draws upon on our resources in ways that can be expensive and time consuming. These activities can substantially affect our financial resources, could cause delays in product delivery and might not be successful. Acquisitions and investments can divert management’s attention and expose our business to new liabilities or risks associated with entering into new business activities. In addition, we might lose key employees while integrating new organizations. We might not be successful in integrating any acquired businesses, products or technologies, and might not achieve anticipated revenues and cost benefits. Investments that we make may not result in a return consistent with our projections upon which such investments are made, or may require additional investment that we did not originally anticipate. In addition, acquisitions can result in customer dissatisfaction, performance problems with an acquired company, potentially dilutive issuances of equity
securities or the incurrence of debt and restrictive debt covenants, contingent liabilities, possible impairment charges related to goodwill or other intangible assets, or other adverse impacts or circumstances. If any of these risks were to come about, our business, financial results and stock price could be materially and adversely affected.
If goodwill or other intangible assets that we recorded, or will record, in connection with our acquisitions become impaired, we could be required to take significant charges against earnings.
In connection with our accounting for acquired businesses, we record a significant amount of goodwill and other intangible assets. Under U.S. generally accepted accounting principles, or GAAP, we must assess, at least annually and potentially more frequently, whether the value of goodwill and other indefinite-lived intangible assets have been impaired. Finite-lived intangible assets are assessed for impairment in the event of an impairment indicator. Any reduction or impairment of the value of goodwill or other intangible assets will result in a charge against earnings, which could materially adversely affect our results of operations and stockholders’ equity in future periods.
Risks Relating to Owning Our Stock
If we fail to maintain an effective system of internal and disclosure controls and procedures, we may not be able to accurately report our financial results or prevent fraud.
Effective internal and disclosure controls and procedures are necessary for us to provide reliable financial reports, to prevent fraud and to operate successfully as a public company. If we cannot provide reliable financial reports or prevent fraud, our business and reputation may be harmed. We regularly review and assess our internal controls over financial reporting and our disclosure controls and procedures. As part of that process, we may discover material weaknesses in our internal controls.
In addition, we are actively implementing new electronic data systems relating to substantial parts of our business, operations and accounting.The process of implementing and commencing our reliance on these new systems involves particularly higher risks of deficiencies or disruptions in relation to our internal controls and disclosure controls and procedures than the continued use of systems which have had a longer history of use and observed performance in the Company.
If we fail to maintain effective controls or timely effectimplement any necessary improvement of our internal and disclosure controls, we may not have accurate information to make management decisions, our operating results could be harmed, or we may fail to meet our reporting obligations. Ineffective internal and disclosure controls could also cause stockholders to lose confidence in our reported financial information and our ability to manage our business, which would likely have a negative effect on the trading price of our securities.
The trading price of our common stock has been and is likely to continue to be volatile, and you might not be able to sell your shares at or above the price that you paid for them.
The trading prices of the securities of technology companies have been highly volatile. During fiscal 2020,2023, our stock price (Nasdaq Global Market close price) ranged from $16.66$21.92 per share to $45.20$42.01 per share. The trading price of our common stock is likely to continue to be subject to wide fluctuations. Factors affecting the trading price of our common stock could include:
•variations in our operating results;
•our forecasts and financial guidance for future periods;
•announcements of technological innovations, new products or product enhancements, new product adoptions at semiconductor customers or significant agreements by us or by our competitors;
•reports regarding our ability to bring new products into volume production efficiently;
•the gain or loss of significant orders or customers;
•changes in the estimates of our operating results or changes in recommendations by any securities analysts that elect to follow our common stock;
•rulings on litigation and proceedings;
•seasonality, principally due to our customers' purchasing cycles;
•market and competitive conditions in our industry, the entire semiconductor industry and the economy as a whole;
•recruitment or departure of key personnel; and
•announcements of mergers and acquisition transactions and the ability to successfully integrate the business activities of the acquired/merged company; and
•political and global economic instability, including as a result of trade barriers, natural disasters, epidemics and pandemics, (such as the current COVID-19 pandemic), military conflicts, climate change, and other factors acting alone or in combination.
In addition, if the market for technology stocks or the stock market in general experiences loss of investor confidence, the trading price of our common stock could decline for reasons unrelated to our business, operating results or financial condition. The trading price of our common stock also might decline in reaction to events that affect other companies in our industry even if these events do not directly affect us.
Provisions of our certificate of incorporation and bylaws or Delaware law might discourage, delay or prevent a change of control of our company or changes in our management and, therefore, depress the trading price of our common stock.
Delaware corporate law and our certificate of incorporation and bylaws contain provisions that could discourage, delay or prevent a change in control of our company or changes in our management that the stockholders of our company may deem advantageous. These provisions:
•establish a transition from a classified board of directors soto a declassified board of directors, such that, until the annual shareholder meeting in 2024, not all members of our board are elected at one time;
•provide that directors may only be removed “for cause” and only with the approval of 66.7% of our stockholders;
•require super-majority voting to amend some provisions in our certificate of incorporation and bylaws;
•authorize the issuance of “blank check” preferred stock that our board could issue to increase the number of outstanding shares and to discourage a takeover attempt;
•limit the ability of our stockholders to call special meetings of stockholders;
•prohibit stockholder action by written consent, which requires all stockholder actions to be taken at a meeting of our stockholders;
•provide that the board of directors is expressly authorized to make, alter or repeal our bylaws; and
•establish advance notice requirements for nominations for election to our board or for proposing matters that can be acted upon by stockholders at stockholder meetings.
In addition, Section 203 of the Delaware General Corporation Law may discourage, delay or prevent a change in control of our company. In addition,Also, each of our named executive officers and certain other executives of the company have entered into change of control severance agreements, which were approved by our Compensation Committee, which could increase the costs associated with a change of control and thus potentially deter such a transaction.
Item 1B: Unresolved Staff Comments
None.
Item 1C: Cybersecurity
Risk Management and Strategy
We recognize the importance of assessing, identifying, and managing material risks associated with cybersecurity threats. These risks include, among other things, operational risks; intellectual property theft; fraud; extortion; harm to our employees or customers; violation of applicable privacy or security laws and other litigation and legal risk; and reputational risks.
Manage Material Risks & Integrated Overall Risks
We maintain an incident response plan to coordinate the activities we take to protect against, detect, respond to, mitigate the impact of, and remediate cybersecurity incidents, as well as to comply with applicable legal obligations and mitigate reputational damage.
We have strategically integrated cybersecurity risk management into our broader risk management framework to promote company-wide awareness of the importance of cybersecurity risk management. This integration ensures that cybersecurity considerations are incorporated in our strategic and operational decision-making processes. Our management team works closely with our Information Technology (“IT”) team to continuously evaluate and address cybersecurity risks to ensure these efforts are in alignment with our business objectives and operational needs. We have implemented several cybersecurity processes, technologies, and controls to aid in our efforts to identify, assess, and manage material risks, as well as to test and improve our incident response plan. Our approach includes, among other things:
•conducting regular network and endpoint monitoring, vulnerability assessments, and penetration testing to improve our information systems;
•regular cybersecurity training for employees, including management, and conducting regular cybersecurity management and incident training for employees involved in execution of our incident response plan;
•comparing our processes to standards set by the National Institute of Standards and Technology (“NIST”);
•leveraging the NIST incident handling framework to help us identify, protect, detect, respond, and recover when there is an actual or potential cybersecurity incident;
•operating threat intelligence processes designed to model and research our adversaries;
•monitoring emerging data protection laws and implementing changes to our processes designed to comply;
•conducting regular phishing email simulations for all employees and all contractors with access to corporate email systems to enhance awareness and responsiveness to such possible threats;
•through policy, practice and contract (as applicable) requiring employees, as well as third-parties who provide services on our behalf, to treat customer information and data with care;
•carrying information security risk insurance that provides protection against the potential losses arising from a cybersecurity incident; and
•leveraging third-party score cards within our supply chain to regularly evaluate and report on our cybersecurity environment, including by integrating certain metrics into our corporate goal setting processes.
These approaches vary in maturity across the business, and we work continually to improve them.
Engage Third Parties on Risk Management
Recognizing the complexity and evolving nature of cybersecurity threats, we engage with a range of external experts, including cybersecurity assessors, consultants, and auditors in evaluating and testing our cybersecurity environment. These partnerships enable us to leverage specialized knowledge and insights, ensuring our cybersecurity strategies and processes are responsive to our identified risks. Our collaboration with these third parties include regular audits, threat assessments, and consultation on security enhancements.
Oversee Third-party Risk
We are aware of and have processes in place to manage and mitigate the risks associated with third-party service providers. As needed in connection with certain third-party providers, we conduct risk-based diligence and assessment before engagement, implement contractual security provisions and maintain ongoing monitoring to ensure compliance with applicable cybersecurity standards or requirements.
Risks from Cybersecurity Threats
We have not experienced any material cybersecurity incidents, and the expenses we have incurred from cybersecurity incidents were immaterial.
Governance
The Board is acutely aware of the critical nature of managing risks associated with cybersecurity threats. The Board has established oversight mechanisms to ensure effective governance in managing risks associated with cybersecurity threats because we recognize the potential significance of these threats to our operational integrity and financial condition.
Board of Directors' Oversight
The Governance and Nominating Committee is central to the Board’s oversight of cybersecurity risks and bears the primary responsibility for this domain. The Governance and Nominating Committee and the Board are composed of Board members with diverse expertise including, risk management, technology, and finance, equipping them to oversee cybersecurity risks effectively.
Management’s Role Managing Risk
The management team provides comprehensive briefings to the Governance and Nominating Committee of our Board on a regular basis, with a minimum frequency of once per year. These briefings encompass a broad range of topics as discussed in Reporting to Board of Directors below.
In addition, the IT team maintains an ongoing dialog with our management team regarding emerging or potential cybersecurity risks. The management team receives updates on any significant developments in the cybersecurity domain, ensuring oversight is proactive and responsive. This involvement ensures that cybersecurity considerations are integrated into our broader strategic objectives.
Risk Management Personnel
Our Chief Information Officer is primarily responsible for the overall assessment, monitoring, and management of our cybersecurity risks. Our Chief Information Officer has over 20 years of experience in information technology and holds a B.S. in accounting and management information systems. Our management team members are responsible for the management of cybersecurity risks within their respective functions. Our management team includes the Chief Financial Officer, Chief Executive Officer, and leaders of our business units and functions. Collectively their backgrounds include a wealth of expertise relevant to their roles.
Monitor Cybersecurity Incidents
The Chief Information Officer and executive management team are informed about the latest developments in cybersecurity, including risk management techniques, as well as significant potential threats, through their ongoing management of and participation in the cybersecurity risk management processes described above. This ongoing knowledge is crucial for the effective prevention, detection, mitigation, and remediation of cybersecurity incidents. The Chief Information Officer implements and oversees processes for the regular monitoring of our information systems. This includes the deployment of security measures and system audits to identify potential vulnerabilities.
Reporting to the Board of Directors
The Chief Information Officer regularly informs the Chief Financial Officer and Chief Executive Officer of critical aspects related to cybersecurity risks and incidents. This ensures that the highest levels of management are kept abreast of the Company’s cybersecurity posture and potential risks. The Governance and Nominating Committee receives regular updates from management on cybersecurity risk, including:
•current cybersecurity landscape and emerging threats;
•status of ongoing cybersecurity initiatives and strategies;
•incident reporting and learnings from any cybersecurity events;
•information regarding the effectiveness of the Company’s cybersecurity awareness program; and
•compliance with regulatory requirements and industry standards.
In such updates, the Governance and Nominating Committee generally receives materials including a cybersecurity scorecard and other materials indicating current and emerging cybersecurity threat risks and describing our ability to mitigate those risks, and discusses such matters with our Chief Information Officer.
Significant cybersecurity matters, and strategic risk management decisions are escalated to the Board, ensuring that they have comprehensive oversight and can provide guidance on critical cybersecurity matters.
Item 2: Properties
Our corporate headquarters, which includes sales, marketing, administration, manufacturing, engineering, and research and development facilities, is located in Livermore, California, United States. Our corporate headquarters comprises a campus of five buildings totaling approximately 259,000 square feet. We presently lease four of the buildings and own one of the buildings. Adjacent to our campus we own approximately 6 acres of vacant land for future expansion. In addition, we lease office, repair and service, manufacturing and/or research and development space both inside and outside of the United States. The leases expire at various times through 2028.2034. We believe that our existing and planned facilities are suitable for our current needs.
Information concerning our properties as of December 26, 202030, 2023 is set forth below:
| | | | | | | | | | | | | | | | | | | | | | | | | | |
| Location | | Principal Use | | Segment | | Square
Footage | | Ownership |
| Livermore, California, United States | | Manufacturing | | Probe Cards | | 90,508 | | | Owned |
| Livermore, California, United States | | Corporate headquarters, sales, marketing, administration, product design, manufacturing, service and repair, distribution, research and development | | All | | 168,636 | | | Leased |
Livermore, California, United StatesThiendorf, Germany | | ManufacturingSales, marketing, administration, manufacturing, service and repair, distribution, research and development | | 90,508 Systems | | 101,291 | | | OwnedLeased |
| Beaverton, Oregon, United States | | Sales, marketing, administration, product design, manufacturing, service and repair, distribution, research and development | | 98,946 Probe Cards | | 101,205 | | | Leased |
| Baldwin Park, California, United States | | Manufacturing, service and repair, distribution, research and development | | Probe Cards | | 44,000 | | | Leased |
| Boulder, Colorado, United States | | Sales, marketing, administration, manufacturing, distribution, research and development | | Systems | | 34,133 | | | Leased |
| Carlsbad, California, United States | | Sales, product design, administration, manufacturing, service and repair, distribution, research and development | | 30,876 Probe Cards | | 42,080 | | | Leased |
San Jose, California,Woburn, Massachusetts, United States | | Administration, product design,Sales, marketing, administration, manufacturing, service and repair, distribution, research and development | | 24,758 Systems | | | Leased |
Baldwin Park, California, United States26,070 | | | Manufacturing | 26,000 | | | Leased |
Boulder, Colorado, United States | | Manufacturing, distribution, research and development | | 34,133 | | | Leased |
Thiendorf, Germany | | Sales, marketing, administration, manufacturing, service and repair, distribution, research and development | | 54,361 | | | Leased |
Munich, Germany | | Sales, manufacturing, service and repair, distribution, research and development | | 10,656 | | | Leased |
Dresden, Germany | | Sales and service | | 2,960 | | | Leased |
Bergisch Gladbach, Germany | | Manufacturing, service and repair, distribution, research and development | | 12,235 | | | Leased |
Singapore | | Sales, administration, product design, service, and field service | | 24,413 | | | Leased |
| Jubei City, Hsinchu, Taiwan | | Sales, administration, product design, field service and repair center | | 18,568 All | | 25,631 | | | Leased |
Bundang, South KoreaSingapore | | Sales, administration, product design, field service, and repair centerfield service | | 17,161 All | | 24,413 | | | Leased |
Yokohama City, JapanSuzhou, China(1)
| | Sales, marketing, administration, product design, manufacturing, service and repair, distribution, research and development | | 13,309 All | | 22,777 | | | Leased |
Hiroshima, JapanSan Jose, California, United States | | Repair centerSales, marketing, and distribution | | 1,007 Systems | | 21,489 | | | Leased |
Suzhou, ChinaBundang, South Korea | | Sales, administration, product design, field service, and repair center | | All | | 17,161 | | | Leased |
| Yokohama City, Japan | | Sales, marketing, administration, product design, manufacturing, service and repair, distribution, research and development | | 15,177 All | | 16,150 | | | Leased |
| Munich, Germany | | Sales, manufacturing, administration, service and repair, distribution, research and development | | Systems | | 18,786 | | | Leased |
Shanghai, China(1) | | Sales and service | | All | | 3,348 | | | Leased |
Montbonnot Saint Martin, FranceDresden, Germany | | Sales and service | | 4,736 All | | 2,960 | | | Leased |
Legnano, ItalyHiroshima, Japan | | Sales officeRepair center | | 215 Probe Cards | | 1,007 | | | Leased |
(1) On February 7, 2024, the Company signed an agreement with Grand Junction Semiconductor Pte. Ltd. to divest its China operations. These leased locations are to be included as part of the divestiture. See Note 19 of the Notes to Consolidated Financial Statements included in Part II, Item 8 of this Annual Report on Form 10-K for further details.
Item 3: Legal Proceedings
From timeInformation with respect to time, wethis item may be subject found under the caption “Legal Matters” in Note 12, Commitments and Contingencies, to legal proceedings and claims in the ordinary course of business. As of December 26, 2020, and as of the filing ofour consolidated financial statements included herein, which information is incorporated into this Annual Report on Form 10-K, we were not involved in any material legal proceedings. In the future, we may become a party to additional legal proceedings that may require us to spend significant resources, including proceedings designed to protect our intellectual property rights. Litigation can be expensive and disruptive to normal business operations. Moreover, the results of legal proceedings are difficult to predict, and the costs incurred in litigation can be substantial, regardless of outcome.Item 3 by reference.
Item 4: Mine Safety Disclosures
Not applicable.
PART II
Item 5: Market for Registrant's Common Equity, Related Stockholder Matters and Issuer Purchases of Equity Securities
MarketStock Information
Our common stock is listed on theThe Nasdaq Global Market under the symbol "FORM."“FORM.” As of February 16, 2021,2024, there were 142115 registered holders of record of our common stock.stock, which does not include beneficial owners of stock held in street name (i.e., through a brokerage firm, bank, broker-dealer, trust or other similar organization).
Dividends
No cash dividends have been declared on shares of our common stock, and the Company currently does not intend to pay dividends in the future.
RepurchaseRepurchases of Common Stock
In October 2020,2023, our Board of Directors authorized a program to repurchase up to $50.0$75.0 million of outstanding common stock to offset potential dilution from issuances of our common stock under our employee stock purchase plan and equity incentive plan. This authorization was in addition to the program authorized in May 2022 to repurchase up to $75.0 million of outstanding common stock that was fully utilized as of December 30, 2023. Under the current stock repurchase program, we may repurchase shares from time to time on the open market. The pace of repurchase activity will depend on levels of cash generation, the Company's current stock price, and other factors. The program may be modified or discontinued at any time. The current share repurchase program will expire on October 28, 2022.2025.
DuringThe following table provides information as of December 30, 2023 with respect to the shares of common stock repurchased during the fourth quarter of fiscal 2020, 2019, and 2018, we did not repurchase any shares.2023 pursuant to the foregoing Board authorization.
| | | | | | | | | | | | | | | | | | | | | | | | | | |
| Period (fiscal months) | | Total Number of Shares Purchased | | Average Price Paid per Share | | Total Number of Shares Purchased as Part of Publicly Announced Plans or Programs | | Maximum Amount that May Yet Be Purchased Under the Plans or Programs |
| October 1, 2023 - October 28, 2023 | | — | | | $ | — | | | — | | | $ | 93,634,446 | |
| October 29, 2023 - November 25, 2023 | | 184,464 | | | 36.77 | | | 184,464 | | | 86,851,705 | |
| November 26, 2023 - December 30, 2023 | | 351,908 | | | 36.99 | | | 351,908 | | | 73,834,628 | |
| | 536,372 | | | $ | 36.92 | | | 536,372 | | | |
Stock Price Performance Graph
The following graph shows the total stockholder return of an investment of $100 in cash on December 26, 201529, 2018 through December 26, 202030, 2023 for (1) our common stock, (2) the S&P 500 Index, and (3) the RDG Semiconductor CompositeS&P Semiconductors Select Industry Index. All values assume reinvestment of the full amount of all dividends. Stockholder returns over the indicated period are based on historical data and are not necessarily indicative of future stockholder returns.
COMPARISON OF 5 YEAR CUMULATIVE TOTAL RETURN*
Among FormFactor, Inc., the S&P 500 Index, and the RDG Semiconductor CompositeS&P Semiconductors Select Industry Index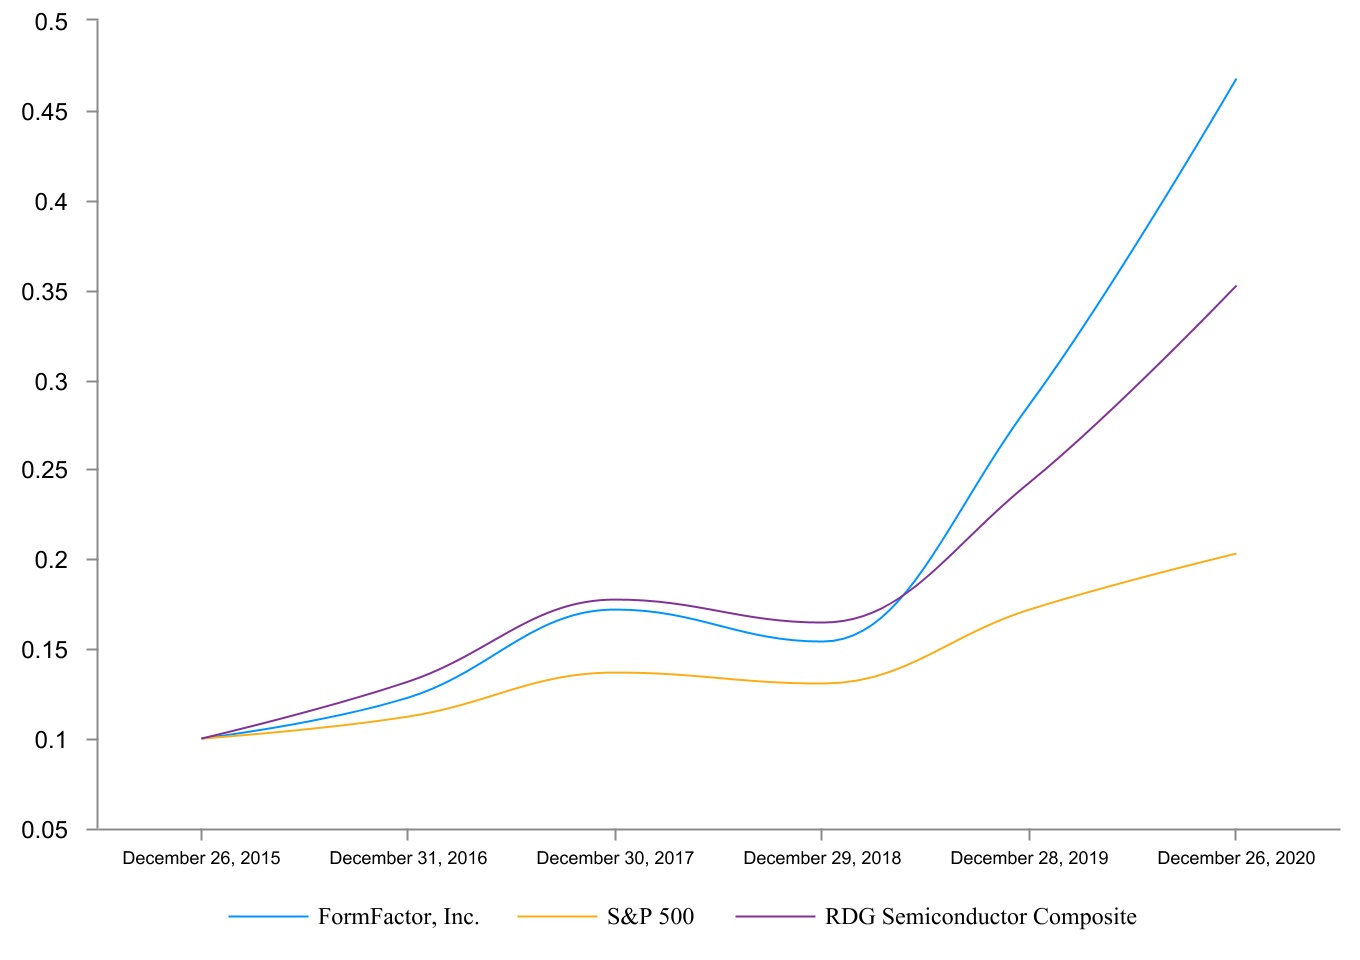
 *$100 invested on December
 26, 201529, 2018 in stock or index, including reinvestment of dividends. | | | | | | | | | | | | | | | | | | | | | | | | | | | | | | | | | | | |
| | Cumulative Total Return |
| | December 29, 2018 | | December 28, 2019 | | December 26, 2020 | | December 25, 2021 | | December 31, 2022 | | December 30, 2023 |
| FormFactor, Inc. | $ | 100.00 | | | $ | 185.87 | | | $ | 303.93 | | | $ | 317.70 | | | $ | 158.67 | | | $ | 297.72 | |
| S&P 500 Index | 100.00 | | | 131.49 | | | 155.68 | | | 200.37 | | | 164.08 | | | 207.21 | |
| S&P Semiconductors Select Industry Index | 100.00 | | | 165.23 | | | 268.27 | | | 383.86 | | | 265.98 | | | 359.96 | |
| | | | | | | | | | | | | | | | | | | | | | | | | | | | | | | | | | | |
| | Cumulative Total Return |
| | December 26, 2015 | | December 31, 2016 | | December 30, 2017 | | December 29, 2018 | | December 28, 2019 | | December 26, 2020 |
| FormFactor, Inc. | $ | 100.00 | | | $ | 122.94 | | | $ | 171.79 | | | $ | 153.79 | | | $ | 285.84 | | | $ | 467.40 | |
| S&P 500 | 100.00 | | | 111.96 | | | 136.40 | | | 130.42 | | | 171.49 | | | 203.04 | |
| RDG Semiconductor Composite | 100.00 | | | 131.64 | | | 177.48 | | | 164.63 | | | 242.61 | | | 351.91 | |
Item 7: Management's Discussion and Analysis of Financial Condition and Results of Operations
The following discussion and analysis of our financial condition and results of operations should be read in conjunction with our consolidated financial statements and the related notes included elsewhere in this Annual Report on Form 10-K. In addition to historical consolidated financial information, the following discussion and analysis contains forward-looking statements that involve risks, uncertainties and assumptions as described under the "Note“Note Regarding Forward-Looking Statements"Statements” that appears earlier in this Annual Report on Form 10-K. Our actual results could differ materially from those
anticipated by these forward-looking statements as a result of many factors, including those discussed under "Item“Item 1A: Risk Factors"Factors” and elsewhere in this Annual Report on Form 10-K.
Overview
FormFactor, Inc., headquartered in Livermore, California, is a leading provider of essential test and measurement solutions.technologies along the full semiconductor product lifecycle - from characterization, modeling, reliability, and design de-bug, to qualification and production test. We provide a broad range of high-performance probe cards, analytical probes, probe stations, metrology systems, thermal systems, and cryogenic systems to both semiconductor companies and scientific institutions. Our products provide electrical and optical information from a variety of semiconductor and electro-optical devices and integrated circuits from early research, through development, to high-volume production. Customers use our products and services to lower production costs, improve yields,accelerate profitability by optimizing device performance, reducing scrap, and enable development of their complex next-generation products.improving yields.
We operate in two reportable segments consisting of the Probe Cards segment and the Systems segment. Sales of our probe cards and analytical probes are included in the Probe Cards segment, while sales of our probe stations, metrology systems, thermal systems and cryogenic systems are included in the Systems segment.
We generated net income of $78.5$82.4 million in fiscal 20202023 compared to net income of $39.3$50.7 million in fiscal 20192022 and net income of $104.0$83.9 million in fiscal 2018. 2021. On November 1, 2023, we completed the sale of our FRT Metrology (“FRT”) business. As a result of the transaction, we received aggregate net consideration of $99.8 million and the transaction resulted in a gain of $73.0 million.
The increase in net income in fiscal 20202023 compared to fiscal 20192022 was primarily due to increasedthe $73.0 million gain recognized from the sale of our FRT business. Apart from this gain, the semiconductor industry weakness that began in the third quarter of fiscal 2022 continued into fiscal 2023, impacting our Probe Cards segment with a $93.5 million reduction in revenue and leverage on operating expenses, which only marginally increased on significantly higher operating levels, as wellthe associated decline in gross margins as a decreaseresult of the lower operating levels. Despite the overall semiconductor industry weakness that impacted the Probe Cards segment, the Systems segment continued to show strength with revenue increasing $8.7 million, or about 5.6% in provisionfiscal 2022, since customer spending for income taxes due to a lower effective tax rateproducts in 2020. this segment is driven by research and development of next-generation innovation.
The decrease in net income in fiscal 20192022 compared to fiscal 20182021 was primarily due to decreased revenues, lower margins driven primarily by a $75.8less favorable product mix and lower factory utilization, and increased restructuring charges. This was partially offset by a reduction in the amortization of intangibles and in the annual effective tax rate. The first half of fiscal 2022 was strong, producing net income of $60.1 million income tax benefitwith $401.1 million in revenue at 47.0% gross margins. In the second half of fiscal 2022, revenues declined, mainly within the Probe Cards segment, and mix became less favorable, resulting in a net loss of $9.4 million with $346.9 million in revenue at 31.0% gross margins. Despite the decline in total revenues in the second half of fiscal 2022, the Systems segment recognized record revenue levels in the third and fourth quarters of fiscal 2018 related to the release of valuation allowances against certain U.S. deferred tax assets and the increase in provision for income taxes due to the recognition of deferred tax expense.2022.
Impact of COVID-19Recent Development
The COVID-19 pandemic continuesOn February 7, 2024, we signed an agreement with Grand Junction Semiconductor Pte. Ltd. to cause serious illnessdivest our China operations and death in many of the regions that we, our customersestablish an exclusive distribution and our suppliers operate. The COVID-19 pandemic has resulted in significant governmental actions designed to control the spread of the virus, including the imposition of safety requirements and other orders in locations where we have manufacturing and other activities. We have maintained social distancing, contact tracing, and various other measures to enable our manufacturing sitespartnership agreement to continue efficient production.
We believe that we operate in a critical infrastructure industry, as defined by the U.S. Department of Homeland Security. This reduces the currentsales and anticipated impacts of the COVID-19 pandemic on our major customers and suppliers, and upon our operations, as compared to companies that are not part of the critical infrastructure. We currently continue to operate in allsupport of our manufacturing sites at production levels comparable to those prior toproducts in the pandemic, albeit subject to certain safety and related constraints. Our other operations are similarly continuing with substantial work-from-home activities.
If the provisions of governmental health orders or other safety requirements applicable to us or our customers or suppliers become more restrictive for an extended period of time, or if we have repeated occurrences of COVID-19 in any of our facilities, we may experience disruptions or delays in manufacturing, product design, product development, customer support, manufacturing and sales, and an overall loss of productivity and efficiency.
Even with our continued operations, COVID-19 has had, and may have further, negative impacts on our supply chain, workforce and customers.region (the “China Transaction”). The continued progression of the COVID-19 pandemic and associated macro-economic, trade-related, and site-specific restrictions, including but not limited to the effects of any overall global, regional or national economic slowdowns or other economic downturns, increased trade and transport costs, and inability to access customer sites for certain activities could also negatively impact our business or results of operations.
As the COVID-19 pandemicChina Transaction is a widespread public health crisis, it is adversely affecting major economies and financial markets world-wide. A resulting economic downturn can be expected to eventually negatively affectclose in the demand for our products, and contribute to volatile demand and supply conditions affecting the markets for our products.
Governments in several countries where we operate, including the United States, have enacted stabilization and stimulus measures in an effort to counteract somefirst half of the impacts of COVID-19. We have benefited and may continue to benefit from some of these measures directly or indirectly, although we do not believe those benefits have had or will have a material effect upon our financial results or financial condition. Governments may discontinue, amend, replace or otherwise change or supplement such stabilization and stimulus measures in ways that are difficult to predict, and it is possible that such changes could have a material effect upon our financial results or financial condition, or the financial results or financial condition of our customers or suppliers.
While to date the disruptions in our operations, supply chain and customer demand as a result of the COVID-19 pandemic have been somewhat limited, we believe that the COVID-19 pandemic represents a sustained threat that may give rise to a variety of more significant adverse impacts on our business and financial results. We consider this as a near or longer term trend, although we cannot identify or quantify the specific impacts given current levels of uncertainty and the broad variety of effects that may arise from a pandemic of this magnitude. For a further description of the uncertainties and business risks associated with the COVID-19 pandemic, see Part I, Item 1A, "Risk Factors" in this Annual Report on Form 10-K.2024.
Fiscal Year
WeWe operate on a 52/53 week fiscal year, whereby the fiscal year ends on the last Saturday of December. The fiscal years ended December 26, 2020,30, 2023, December 28, 201931, 2022 and December 29, 2018 each25, 2021 included 52 weeks.weeks, 53 weeks (with 14 weeks in the fourth quarter) and 52 weeks, respectively.
Use of Estimates
Preparation of our financial statements requires management to make estimates and assumptions that affect the reported amounts of assets, liabilities, revenues and expenses. Management bases its estimates on historical experience and on various other assumptions that it believes to be reasonable under the circumstances, the results of which form the basis for making judgments about the carrying values of assets and liabilities that are not readily apparent from other sources. Actual results may differ from these estimates under different assumptions or conditions.
Critical Accounting Policies
Our discussion and analysis of our financial condition and results of operations are based upon our consolidated financial statements, which have been prepared in accordance with generally accepted accounting principles ("GAAP"(“GAAP”). The preparation of these financial statements requires us to make estimates and assumptions that affect the reported amounts of assets and liabilities at the date of the financial statements and the reported amounts of net revenue and expenses in the reporting period. Our accounting policies are fundamental to understanding our financial condition and results of operations reported in our financial statements and related disclosures. We have identified the following accounting policies as being critical because they require our management to make particularly difficult, subjective and/or complex judgments about the effect of matters that are inherently uncertain. Our management has discussed the development, selection, application and disclosure of these critical accounting policies with the Audit Committee of our Board of Directors.
Inventory Valuation
We state our inventories at the lower of cost (principally standard cost which approximates actual cost on a first in, first out basis) or net realizable value. We continuallyregularly assess the value of our inventory and will periodically write down its value for estimated excess inventory and product obsolescence based upon an analysis of existing inventory quantities compared to estimated future consumption. Future consumption is estimated based upon assumptions about how past consumption, recent purchases, backlog and other factors may indicate future consumption. On a quarterly basis, we review existing inventory quantities in comparison to our past consumption, recent purchases, backlog and other factors to determine what inventory quantities, if any, may not be sellable. Based on this analysis, we record an adjustment to the cost basis of inventory when evidence exists that the net realizable value of inventory is lower than its cost, which occurs when we have excess and/or obsolete inventory.
At the point of loss recognition, a new, lower cost basis for that inventory is established, and subsequent changes in facts and circumstances do not result in the restoration or increase in that newly established cost basis. Market conditions are subject to change, and demand for our products can fluctuate significantly. Actual consumption of inventories could differ from forecasted demand, and this difference could have a material impact on our gross profit and inventory balances based on additional provisions for excess or obsolete inventories, or a benefit from the sale of inventories previously written down.
Revenue Recognition
We recognize revenueRevenue is recognized upon transferring control of products and services, and the amounts recognized reflect the consideration we expect to be entitled to receive in exchange for these products and services. An arrangement may include some or all of the following products and services: probe cards, systems, accessories, engineering services, installation services, service contracts and extended warranty contracts.
A performance obligation is a promise in a contract to transfer a distinct good or service to the customer. In contracts with multiple performance obligations, we identify each performance obligation and evaluate whether the performance obligation is distinct within the context of the contract at contract inception. Performance obligations that are not distinct at contract inception are combined and accounted for as one unit.unit of account. Generally, the performance obligations in a contract are considered distinct within the context of the contract and are accounted for as separate units.
Our products may be customized to our customers’ specifications,specifications; however, control of our product is typically transferred to the
customer at the point in time the product is either shipped or delivered, depending on the terms of the arrangement, as the criteria for over time recognition areis not met. In limited circumstances, substantive acceptance by the customer exists which results in the deferral of revenue until acceptance is formally received from the customer. Judgment may be required in determining if the acceptance clause is substantive. In certain instances control of products is transferred to the customer over time based on performance and in those instances we utilize an appropriate input or output measure to determine to what extent control has transferred to the customer. Judgment may be required in determining an appropriate measure of performance.
Installation services are routinely provided to customers purchasing our systems. Installation services are a distinct performance obligation apart from the systems and are recognized in the period they are performed. Service contracts, which include repair and maintenance service contracts, and extended warranty contracts are also distinct performance obligations and are recognized over the contractual service period, which ranges from one to three years. For these service contracts recognized over time, we use a days-elapsedthe input measure of days elapsed to measure progress.
A contract’s transaction price is allocated to each distinct performance obligation and recognized as revenue when, or as, the performance obligation is satisfied. In determining the transaction price, we evaluate whether the price is subject to refund or adjustment to determine the net consideration to which we expect to be entitled. We generally do not grant return privileges, except for defective products during the warranty period. Sales incentives and other programs that we may make available to
our customers are considered to be a form of variable consideration, which is estimated in determining the contract’s transaction price to be allocated to the performance obligations.
For contracts with multiple performance obligations, we allocate the contract’s transaction price to each performance obligation
based on its relative stand-alone selling price. The stand-alone selling prices are determined based on observable prices, which are the prices at which we separately sell thethese products. For items which do not have observable prices, we use our best estimate of the stand-alone selling prices.
We account for tax assessed by a governmental authority that is directly imposed on a revenue-producing transaction (i.e., sales, use, value added) on a net (excluded from revenue) basis.
Results of Operations
In this section, we discuss the results of our operations for the year ended December 26, 202030, 2023 compared to the year ended December 28, 2019.31, 2022. For a discussion of the year ended December 28, 201931, 2022 compared to the year ended December 29, 2018,25, 2021, please refer to Part II, Item 7, "Management's“Management's Discussion and Analysis of Financial Condition and Results of Operations"Operations” in our Annual Report on Form 10-K for the year ended December 28, 2019.
The following table sets forth our operating results as a percentage of revenues:
| | | | | | | | | | | | | | | | | |
| | Fiscal 2020 | | Fiscal 2019 | | Fiscal 2018 |
| Revenues | 100.0 | % | | 100.0 | % | | 100.0 | % |
| Cost of revenues | 58.5 | | | 59.7 | | | 60.3 | |
| Gross profit | 41.5 | | | 40.3 | | | 39.7 | |
| Operating expenses: | | | | | |
| Research and development | 12.8 | | | 13.8 | | | 14.2 | |
| Selling, general and administrative | 16.6 | | | 18.0 | | | 18.7 | |
| | | | | |
| | | | | |
| | | | | |
| | | | | |
| Total operating expenses | 29.4 | | | 31.8 | | | 32.9 | |
| Operating income | 12.1 | | | 8.5 | | | 6.8 | |
| Interest income | 0.2 | | | 0.5 | | | 0.3 | |
| Interest expense | (0.1) | | | (0.3) | | | (0.6) | |
| Other income (expense), net | 0.1 | | * | | * |
| Income before income taxes | 12.3 | | | 8.7 | | | 6.5 | |
| Provision (benefit) for income taxes | 1.0 | | | 2.0 | | | (13.2) | |
| Net income | 11.3 | % | | 6.7 | % | | 19.7 | % |
* Amounts insignificant and not greater than 0.1%. | | | | | | | | | | | | | | | | | |
| | Fiscal 2023 | | Fiscal 2022 | | Fiscal 2021 |
| Revenues | 100.0 | % | | 100.0 | % | | 100.0 | % |
| Cost of revenues | 61.0 | | | 60.4 | | | 58.1 | |
| Gross profit | 39.0 | | | 39.6 | | | 41.9 | |
| Operating expenses: | | | | | |
| Research and development | 17.5 | | | 14.6 | | | 13.1 | |
| Selling, general and administrative | 20.1 | | | 17.6 | | | 16.1 | |
| | | | | |
| Total operating expenses | 37.6 | | | 32.2 | | | 29.2 | |
| Gain on sale of business | 11.0 | | | — | | | — | |
| Operating income | 12.4 | | | 7.4 | | | 12.7 | |
| Interest income | 1.1 | | | 0.3 | | | 0.1 | |
| Interest expense | (0.1) | | | (0.1) | | | (0.1) | |
| Other income (expense), net | — | | 0.2 | | 0.1 |
| Income before income taxes | 13.4 | | | 7.8 | | | 12.8 | |
| Provision for income taxes | 1.0 | | | 1.0 | | | 1.9 | |
| Net income | 12.4 | % | | 6.8 | % | | 10.9 | % |
Revenues by Segment
| | | | | Fiscal 2023 | | Fiscal 2022 | | Fiscal 2021 |
| | | | | Fiscal 2020 | | Fiscal 2019 | | Fiscal 2018 |
| | | (In thousands) | (In thousands) |
| Probe Cards | Probe Cards | $ | 581,739 | | | $ | 491,363 | | | $ | 434,269 | |
| Systems | 111,877 | | | 98,101 | | | 95,406 | |
Systems(1) | |
| Total | Total | $ | 693,616 | | | $ | 589,464 | | | $ | 529,675 | |
Revenues by Market
| | | | | | | | | | | | | | | | | | | | | | | | | | | | | | | | | | | |
| Fiscal | | % of | | Fiscal | | % of | | Change |
| 2020 | | Revenues | | 2019 | | Revenues | | $ | | % |
| (In thousands, except percentages) |
| Probe Cards Markets: | | | | | | | | | | | |
| Foundry & Logic | $ | 446,183 | | | 64.3 | % | | $ | 318,552 | | | 54.0 | % | | $ | 127,631 | | | 40.1 | % |
| DRAM | 109,734 | | | 15.8 | | | 147,257 | | | 25.0 | | | (37,523) | | | (25.5) | |
| Flash | 25,822 | | | 3.7 | | | 25,554 | | | 4.3 | | | 268 | | | 1.0 | |
| Systems Market: | | | | | | | | | | | |
| Systems | 111,877 | | | 16.2 | | | 98,101 | | | 16.7 | | | 13,776 | | | 14.0 | |
| Total revenues | $ | 693,616 | | | 100.0 | % | | $ | 589,464 | | | 100.0 | % | | $ | 104,152 | | | 17.7 | % |
| | | | | | | | | | | | | | | | | | | | | | | | | | | | | | | | | | | |
| Fiscal | | % of | | Fiscal | | % of | | Change |
| 2019 | | Revenues | | 2018 | | Revenues | | $ | | % |
| (In thousands, except percentages) |
| Probe Cards Markets: | | | | | | | | | | | |
| Foundry & Logic | $ | 318,552 | | | 54.0 | % | | $ | 258,459 | | | 48.8 | % | | $ | 60,093 | | | 23.3 | % |
| DRAM | 147,257 | | | 25.0 | | | 135,333 | | | 25.6 | | | 11,924 | | | 8.8 | |
| Flash | 25,554 | | | 4.3 | | | 40,477 | | | 7.6 | | | (14,923) | | | (36.9) | |
| Systems Market: | | | | | | | | | | | |
| Systems | 98,101 | | | 16.7 | | | 95,406 | | | 18.0 | | | 2,695 | | | 2.8 | |
| Total revenues | $ | 589,464 | | | 100.0 | % | | $ | 529,675 | | | 100.0 | % | | $ | 59,789 | | | 11.3 | % |
Revenues by Market | | | | | | | | | | | | | | | | | | | | | | | | | | | | | | | | | | | |
| Fiscal | | % of | | Fiscal | | % of | | Change |
| 2023 | | Revenues | | 2022 | | Revenues | | $ | | % |
| | | | | | | | | | | |
| (In thousands, except percentages) |
| Probe Cards Markets: | | | | | | | | | | | |
| Foundry & Logic | $ | 363,539 | | | 54.8 | % | | $ | 409,196 | | | 54.7 | % | | $ | (45,657) | | | (11.2) | % |
| DRAM | 113,779 | | | 17.2 | | | 133,446 | | | 17.8 | | | (19,667) | | | (14.7) | |
| Flash | 20,585 | | | 3.1 | | | 48,780 | | | 6.5 | | | (28,195) | | | (57.8) | |
| Systems Market: | | | | | | | | | | | |
Systems(1) | 165,199 | | | 24.9 | | | 156,515 | | | 21.0 | | | 8,684 | | | 5.5 | |
| Total revenues | $ | 663,102 | | | 100.0 | % | | $ | 747,937 | | | 100.0 | % | | $ | (84,835) | | | (11.3) | % |
| | | | | | | | | | | | | | | | | | | | | | | | | | | | | | | | | | | |
| Fiscal | | % of | | Fiscal | | % of | | Change |
| 2022 | | Revenues | | 2021 | | Revenues | | $ | | % |
| | | | | | | | | | | |
| (In thousands, except percentages) |
| Probe Cards Markets: | | | | | | | | | | | |
| Foundry & Logic | $ | 409,196 | | | 54.7 | % | | $ | 435,812 | | | 56.6 | % | | $ | (26,616) | | | (6.1) | % |
| DRAM | 133,446 | | | 17.8 | | | 156,049 | | | 20.3 | | | (22,603) | | | (14.5) | |
| Flash | 48,780 | | | 6.5 | | | 41,420 | | | 5.4 | | | 7,360 | | | 17.8 | |
| Systems Market: | | | | | | | | | | | |
| Systems | 156,515 | | | 21.0 | | | 136,393 | | | 17.7 | | | 20,122 | | | 14.8 | |
| Total revenues | $ | 747,937 | | | 100.0 | % | | $ | 769,674 | | | 100.0 | % | | $ | (21,737) | | | (2.8) | % |
(1) During the fourth quarter of fiscal 2023, we completed the sale of our FRT business. As a result, Metrology Systems revenue will not recur in future periods. The increaseyear ended December 30, 2023 includes Metrology Systems revenue of $21.2 million. The years ended December 31, 2022 and December 25, 2021 include Metrology Systems revenue of $29.0 million million and $23.7 million, respectively.
Foundry & Logic — The decrease in Foundry & Logic product revenue in fiscal 20202023 compared to fiscal 20192022 was driven principally by increasedthe weakening demand in the semiconductor industry, especially in the personal computer and mobile sectors, that began in the third quarter of fiscal 2022 and continued into fiscal 2023, resulting in decreased unit sales to large semiconductor foundriesacross several of our major customers for both us and integrated device manufacturers, demonstrating success in diversifying across our strategic accounts. Additionally, sales have increased due to the demand for 5G handsets and devices and infrastructure spending to support working from home and distance learning.competitors.
DRAM — The decrease in DRAM product revenues in fiscal 20202023 compared to fiscal 20192022 was driven by a decreasedlower customer production activity and demand for our products in light of worldwide excess supply of DRAM chips, along with weaker demand in the overall semiconductor industry, as discussed above. These declines were partially offset due to increased demand for HBM chips utilized in generative artificial intelligence applications.
Flash — The decrease in Flash product revenue in fiscal 2023 compared to fiscal 2022 was driven by lower customer production activity and demand for our products in light of worldwide excess supply, a result of weaker demand in the absorption of large purchases in fiscal 2019.overall semiconductor industry, as discussed above, and Flash market weakness.
Flash product revenue stayed relatively flat in fiscal 2020 compared to fiscal 2019 driven by the acquisition of Baldwin Park. This offset what would have otherwise been a decrease in demand. Our revenue in this market continues to be highly variable.
— The increase in Systems product revenue in fiscal 20202023 compared to fiscal 20192022 was driven by additional revenue from the acquisitions of FRT and HPD and increased sales of probe stations and thermal systems, partially offset by lower revenue from thermaldecreased sales of our metrology systems.
Due to COVID-19, there were various impacts across our segments due to governmental mandates of social distancing. This resulted in a temporary factory shutdown in certain locations for almost two weeks during our first fiscal quarter of 2020, limiting our manufacturing capacity. We believe these shutdowns and governmental mandates negatively affected revenue and impacted our ability to maintain typical lead times throughout fiscal 2020, especially in our Probe Cards segment.
Revenues by Geographic Region
| | | | | | | | | | | | | | | | | | | | | | | | | | | | | | | | | | | |
| Fiscal 2020 | | % of
Revenues | | Fiscal 2019 | | % of
Revenues | | Fiscal 2018 | | % of
Revenues |
| (In thousands, except percentages) |
| China | $ | 174,915 | | | 25.2 | % | | $ | 106,256 | | | 18.0 | % | | $ | 77,851 | | | 14.7 | % |
| Taiwan | 150,837 | | | 21.7 | | | 86,539 | | | 14.7 | | | 107,476 | | | 20.3 | |
| United States | 127,628 | | | 18.4 | | | 155,202 | | | 26.3 | | | 133,648 | | | 25.2 | |
| South Korea | 86,951 | | | 12.5 | | | 116,882 | | | 19.8 | | | 91,247 | | | 17.2 | |
| Europe | 65,572 | | | 9.5 | | | 41,473 | | | 7.0 | | | 39,671 | | | 7.5 | |
| Japan | 43,605 | | | 6.3 | | | 52,584 | | | 8.9 | | | 49,814 | | | 9.4 | |
Asia-Pacific (1) | 32,991 | | | 4.8 | | | 21,468 | | | 3.7 | | | 25,980 | | | 4.9 | |
| Rest of World | 11,117 | | | 1.6 | | | 9,060 | | | 1.6 | | | 3,988 | | | 0.8 | |
| Total Revenues | $ | 693,616 | | | 100.0 | % | | $ | 589,464 | | | 100.0 | % | | $ | 529,675 | | | 100.0 | % |
(1) Asia-Pacific includes all countries in the region except Taiwan, South Korea, China and Japan, which are disclosed separately. | | | | | | | | | | | | | | | | | | | | | | | | | | | | | | | | | | | |
| Fiscal 2023 | | % of
Revenues | | Fiscal 2022 | | % of
Revenues | | Fiscal 2021 | | % of
Revenues |
| | | | | | | | | | | |
| (In thousands, except percentages) |
| United States | $ | 171,781 | | | 25.9 | % | | $ | 127,730 | | | 17.1 | % | | $ | 122,147 | | | 15.9 | % |
| Taiwan | 147,842 | | | 22.3 | | | 169,789 | | | 22.7 | | | 185,925 | | | 24.2 | |
| South Korea | 117,747 | | | 17.8 | | | 111,419 | | | 14.9 | | | 123,463 | | | 16.0 | |
| China | 91,736 | | | 13.8 | | | 160,668 | | | 21.5 | | | 163,069 | | | 21.2 | |
| Europe | 38,858 | | | 5.9 | | | 39,246 | | | 5.2 | | | 43,705 | | | 5.7 | |
| Japan | 36,791 | | | 5.5 | | | 38,419 | | | 5.1 | | | 36,504 | | | 4.7 | |
| Malaysia | 26,601 | | | 4.0 | | | 50,067 | | | 6.7 | | | 49,485 | | | 6.4 | |
| Singapore | 18,335 | | | 2.8 | | | 39,388 | | | 5.3 | | | 36,197 | | | 4.7 | |
| Rest of World | 13,411 | | | 2.0 | | | 11,211 | | | 1.5 | | | 9,179 | | | 1.2 | |
| Total Revenues | $ | 663,102 | | | 100.0 | % | | $ | 747,937 | | | 100.0 | % | | $ | 769,674 | | | 100.0 | % |
Geographic revenue information is based on the location to which we ship the product. For example, if a certain South Korean customer purchases through their U.S. subsidiary and requests the products to be shipped to an address in South Korea, this sale will be reflected in the revenue for South Korea rather than U.S.
Changes in revenue by geographic region in fiscal 20202023 compared to fiscal 20192022 were primarily attributable to changes in customer demand, shifts in customer regional manufacturing strategies, particularly with our large multinational customers, for exampleand product sales mix. More specifically, the increase in revenues for the United States, and decreases in revenues for China and Malaysia, were driven principally by a single large U.S.-based company with operations in these regions that shifted shipments from these regions to the United States. We expect the trade restrictions to continue to drive multinational customers to concentrate operations in regions other than China, impacting our geographical mix. The decrease in revenues for China was also impacted by lowered demand from a large Chinese DRAM integrated device manufacturer and the impact of expanded export license requirements imposed by the U.S. government beginning the fourth quarter of fiscal 2020,2022 for exporting advanced U.S. semiconductor technology to China. These uncertain trade barriers affecting exports and product sales mix.imports between the United States and China contributed to the Company's decision to proceed with the China Transaction.
Cost of Revenues and Gross Margins
Cost of revenues consists primarily of manufacturing materials, compensation and benefits, shipping and handling costs, manufacturing-related overhead (including equipment costs, related occupancy, and computer services), warranty adjustments, inventory adjustments (including write-downs for inventory obsolescence), and amortization of certain intangible assets. Our manufacturing operations rely on a limited number of suppliers to provide key components and materials for our products, some of which are a sole source. We order materials and supplies based on backlog and forecasted customer orders. Tooling and setup costs related to changing manufacturing lots at our suppliers are also included in the cost of revenues. We expense all warranty costs, inventory provisions and amortization of certain intangible assets as cost of revenues.
Gross profit and gross margin by segment were as follows (dollars in thousands):
| | Fiscal 2020 |
| Probe Cards | | Systems | | Corporate and Other | | Total |
| Fiscal 2023 | | | Fiscal 2023 |
| Probe Cards | | | Probe Cards | | Systems | | Corporate and Other | | Total |
| Gross profit | Gross profit | $ | 263,215 | | | $ | 51,835 | | | $ | (27,130) | | | $ | 287,920 | |
| Gross margin | Gross margin | 45.2 | % | | 46.3 | % | | — | % | | 41.5 | % | Gross margin | 37.2 | % | | 51.3 | % | | | | 39.0 | % |
| | | | | | | | | | | | | | | | | | | | | | | |
| Fiscal 2022 |
| Probe Cards | | Systems | | Corporate and Other | | Total |
| Gross profit | $ | 235,562 | | | $ | 80,937 | | | $ | (20,490) | | | $ | 296,009 | |
| Gross margin | 39.8 | % | | 51.7 | % | | | | 39.6 | % |
| | | | | | | | | | | | | | | | | | | | | | | |
| Fiscal 2021 |
| Probe Cards | | Systems | | Corporate and Other | | Total |
| Gross profit | $ | 279,873 | | | $ | 65,834 | | | $ | (22,940) | | | $ | 322,767 | |
| Gross margin | 44.2 | % | | 48.3 | % | | | | 41.9 | % |
| | | | | | | | | | | | | | | | | | | | | | | |
| Fiscal 2019 |
| Probe Cards | | Systems | | Corporate and Other | | Total |
| Gross profit | $ | 211,382 | | | $ | 50,927 | | | $ | (24,813) | | | $ | 237,496 | |
| Gross margin | 43.0 | % | | 51.9 | % | | — | % | | 40.3 | % |
| | | | | | | | | | | | | | | | | | | | | | | |
| Fiscal 2018 |
| Probe Cards | | Systems | | Corporate and Other | | Total |
| Gross profit | $ | 187,320 | | | $ | 47,074 | | | $ | (24,055) | | | $ | 210,339 | |
| Gross margin | 43.1 | % | | 49.3 | % | | — | % | | 39.7 | % |
Probe Cards
—Gross profit and gross margin in the Probe Cards segment increaseddecreased in fiscal 20202023 compared to fiscal 2019,2022, primarily due to increased sales, higher factory utilization,lower revenues and product mix.unfavorable absorption of costs on these lower production volumes, partially offset by lower inventory excess and obsolescence reserves.
Systems
—Gross profit and gross margin in the Systems segment decreasedremained relatively flat in fiscal 20202023 compared to fiscal 2019,2022, despite the increase in revenue primarily as a result of less favorable product mix.
Corporate and Other
—Corporate and Other includes unallocated expenses relating to amortization of intangible assets, inventory, and fixed asset, and deferred revenue fair value adjustments due to acquisitions, share-basedstock-based compensation, and restructuring charges, net, which are not used in evaluating the results of, or in allocating resources to, our reportable segments. The reduction in Corporate and Other in fiscal 2023, compared to fiscal 2022, is primarily due to a reduction in restructuring charges, partially offset by the increase in stock-based compensation expense. In fiscal 2022, there was $11.8 million in restructuring charges arising from a change in estimate of excess and obsolete inventories and a headcount reduction targeted at aligning our cost structure with reduced demand levels within the Probe Cards segment.
Overall
—Gross profit and gross margin fluctuate with revenue levels, product mix, selling prices, factory loading and material costs. For fiscal 20202023 compared to fiscal 2019,2022, gross profit increased due to increased sales whileand gross margins increasedhave decreased on lower revenue levels and unfavorable absorption of costs on lower production volumes, partially offset by only 1.2% with fluctuations in product mix.a reduction of restructuring charges.
Stock-based compensation expense included in gross profitcost of revenues for fiscal 20202023 and 20192022 was $4.0$6.9 million and $4.1$3.8 million, respectively. The increase of stock-based compensation in fiscal 2023 compared to fiscal 2022 was driven by an increase in weighted average fair value of awards outstanding and the timing of awards.
Research and Development
| | | | | | | | | | | | | | | | | | | | | | | |
| Fiscal Year Ended |
| December 26, 2020 | | December 28, 2019 | | $ Change | | % Change |
| (Dollars in thousands) |
| Research and development | $ | 89,034 | | | $ | 81,499 | | | $ | 7,535 | | | 9.2 | % |
| % of revenues | 12.8 | % | | 13.8 | % | | | | |
| | | | | | | |
| Fiscal Year Ended |
| December 28, 2019 | | December 29, 2018 | | $ Change | | % Change |
| (Dollars in thousands) |
| Research and development | $ | 81,499 | | | $ | 74,976 | | | $ | 6,523 | | | 8.7 | % |
| % of revenues | 13.8 | % | | 14.2 | % | | | | |
| | | | | | | | | | | | | | | | | | | | | | | |
| Fiscal Year Ended |
| December 30, 2023 | | December 31, 2022 | | $ Change | | % Change |
| | | | | | | |
| (Dollars in thousands) |
| Research and development | $ | 115,765 | | | $ | 109,222 | | | $ | 6,543 | | | 6.0 | % |
| % of revenues | 17.5 | % | | 14.6 | % | | | | |
| | | | | | | |
| Fiscal Year Ended |
| December 31, 2022 | | December 25, 2021 | | $ Change | | % Change |
| | | | | | | |
| (Dollars in thousands) |
| Research and development | $ | 109,222 | | | $ | 100,937 | | | $ | 8,285 | | | 8.2 | % |
| % of revenues | 14.6 | % | | 13.1 | % | | | | |
The increase in research and development expensesexpense in fiscal 20202023 compared to fiscal 20192022 was primarily driven by an increase in employeeheadcount designed to support our continued investment in technology leadership. Increased stock-based compensation, depreciation, and general operational costs, causedalso contributed to the increase. These increases were partially offset by increases in headcount combined with higher variablelower performance-based compensation a full year of expenses for FRT, which was acquired in the last quarter of fiscal 2019, as well as incremental expenses from newly acquired Baldwin Park, acquired in the third quarter of fiscal 2020, and HPD, acquired in the fourth quarter of fiscal 2020. There was also an increase in project material costs. restructuring charges.
The components of this increase were as follows (in thousands):
| | | | | | | | |
| | Fiscal 20202023 compared to Fiscal 20192022 |
| Employee compensation costs | | $ | 7,1283,861 | |
Project material costs | 1,152 | |
Depreciation | 245 | |
General operating expenses | (447) | |
| Stock-based compensation | | (543)2,435 | |
| Depreciation | | 892 | |
| General operational costs | | 562 | |
| Restructuring charges | | (1,207) | |
| | |
| | $ | 7,5356,543 | |
Stock-based compensation expense included within research and development in fiscal 20202023 and 20192022 was $5.8$10.7 million and $6.4$8.2 million, respectively. The increase of stock-based compensation expense in fiscal 2023 compared to fiscal 2022 was driven by an increase in weighted average fair value of awards outstanding and the timing of awards.
Selling, General and Administrative
| | Fiscal Year Ended | | | Fiscal Year Ended |
| December 30, 2023 | | | December 30, 2023 | | December 31, 2022 | | $ Change | | % Change |
| | Fiscal Year Ended |
| December 26, 2020 | | December 28, 2019 | | $ Change | | % Change |
| (Dollars in thousands) |
| (Dollars in thousands) | |
| (Dollars in thousands) | |
| (Dollars in thousands) | |
| Selling, general and administrative | Selling, general and administrative | $ | 115,098 | | | $ | 106,335 | | | $ | 8,763 | | | 8.2 | % | Selling, general and administrative | $ | 133,012 | | | $ | | $ | 131,875 | | | $ | | $ | 1,137 | | | 0.9 | | 0.9 | % |
| % of revenues | % of revenues | 16.6 | % | | 18.0 | % | |
| | Fiscal Year Ended | |
| | Fiscal Year Ended |
| Fiscal Year Ended | |
| | December 28, 2019 | | December 29, 2018 | | $ Change | | % Change |
| Fiscal Year Ended | |
| December 31, 2022 | | | December 31, 2022 | | December 25, 2021 | | $ Change | | % Change |
| | (Dollars in thousands) |
| (Dollars in thousands) | |
| (Dollars in thousands) | |
| (Dollars in thousands) | |
| Selling, general and administrative | Selling, general and administrative | $ | 106,335 | | | $ | 99,254 | | | $ | 7,081 | | | 7.1 | % | Selling, general and administrative | $ | 131,875 | | | $ | | $ | 123,792 | | | $ | | $ | 8,083 | | | 6.5 | | 6.5 | % |
| % of revenues | % of revenues | 18.0 | % | | 18.7 | % | |
The increase in selling, general and administrative expense in fiscal 20202023 compared to fiscal 20192022 was primarily due to an increase in variabledriven by increased general operating expenses, increased costs withfrom the increased sales volumes, increase in headcount with recent acquisitions,sale of our FRT business, higher variable performance basedstock-based compensation expense, and higher consulting fees primarily related to information technology security remediation costs, partially offset by a gain on contingent consideration related to the acquisition of FRT,lower employee compensation from decreased travel due to travel restrictions,headcount and decreasedlower performance-based compensation, lower amortization of intangibles, as certain intangibles recognized in the acquisition of MicroProbe and Cascade Microtech reached the end of their useful lives, which was only partially offset by the additions of intangibles arising from the more recent acquisitions for FRT, Baldwin Park, and HPD.lower restructuring charges.
The components of this overall increase were as follows (in thousands):
| | | | | | | | |
| | Fiscal 20202023 compared to Fiscal 20192022 |
Employee compensation | $ | 10,417 | |
Consulting fees | 3,580 | |
Stock-based compensation | 1,302 | |
Amortization of intangibles | (1,254) | |
Gain on contingent consideration | (2,879) | |
Travel related costs | (3,576) | |
| General operating expenses | | 1,173 |
| $ | 8,7632,428 | |
| Sale of business | | 2,407 | |
| Stock-based compensation | | 1,797 | |
| Consulting fees | | 1,339 | |
| Restructuring charges | | (1,274) | |
| Amortization of intangibles | | (2,396) | |
| Employee compensation | | (3,164) | |
| | |
| | $ | 1,137 | |
Stock-based compensation expense included within selling, general and administrative in fiscal 20202023 and 20192022 was $14.1$21.1 million and $12.8$19.3 million, respectively. The increase of stock-based compensation in fiscal 2023 compared to fiscal 2022 was driven by an increase in weighted average fair value of awards outstanding and the timing of awards.
Gain on sale of business
Gain on sale of business represents the gain on the sale of our FRT business of $73.0 million during the fourth quarter of fiscal 2023. See Note 5, Divestiture, for additional information.
Interest Income and Interest Expense
| | | | | | | | | | | | | | | | | |
| | Fiscal Year Ended |
| | December 26, 2020 | | December 28, 2019 | | December 29, 2018 |
| | (Dollars in thousands) |
| Interest income | $ | 1,501 | | | $ | 2,714 | | | $ | 1,356 | |
| Weighted average balance of cash and investments | $ | 230,310 | | | $ | 179,526 | | | $ | 138,467 | |
| Weighted average yield on cash and investments | 0.90 | % | | 2.05 | % | | 1.51 | % |
| | | | | |
| Interest expense | $ | 864 | | | $ | 1,915 | | | $ | 3,314 | |
| Average debt outstanding | $ | 37,563 | | | $ | 56,776 | | | $ | 90,086 | |
| Weighted average interest rate on debt | 1.94 | % | | 4.09 | % | | 3.98 | % |
Interest income is earned on our cash, cash equivalents, restricted cash and marketable securities. The decreaseincrease in interest income in fiscal 20202023 compared to fiscal 20192022 was attributable to loweran increase in investment yields due to the lowhigher interest rate environment despite higheras well as an increased average invested balances.balance.
Interest expense primarily includes interest on our term loans,loan, interest rate swap derivative contracts,contract, and term loan issuance costs amortization charges. The decrease in interest expense in fiscal 20202023 compared to fiscal 20192022 was primarily due to lower outstanding debt balances due to the pay-off of the CMI Term Loan on June 30, 2020, partially offset by the FRT Term Loan originated in the fourth quarter of 2019 and the Building Term Loan originated in the second quarter of 2020. This activity lowers interest expense due to lower interest rates on the outstanding debt.balances.
Other Income (Expense), Net
Other income (expense), net primarily
Other income (expense), net, includes the effects of foreign currency impact and various other gains and losses. The decrease in Other income (expense), net, in fiscal 2023 compared to fiscal 2022 was primarily attributable to an other than temporary impairment on a debt receivable for $1.1 million and a decrease in foreign exchange gains. Foreign exchange gains for fiscal 2023 were $0.6 million.
Provision (Benefit) For Income Taxesfor income taxes
| | Fiscal Year Ended | | | Fiscal Year Ended |
| December 30, 2023 | | | December 30, 2023 | | December 31, 2022 | | December 25, 2021 |
| | Fiscal Year Ended |
| December 26, 2020 | | December 28, 2019 | | December 29, 2018 |
| (Dollars in thousands) |
| Provision (benefit) for income taxes | $ | 6,652 | | | $ | 11,717 | | | $ | (70,109) | |
| (Dollars in thousands) | |
| (Dollars in thousands) | |
| (Dollars in thousands) | |
| Provision for income taxes | |
| Effective tax rate | Effective tax rate | 7.8 | % | | 22.9 | % | | (206.6) | % | Effective tax rate | 7.7 | % | | 12.3 | % | | 14.8 | % |
Provision (benefit) for income taxes reflects the tax provision on our operations in foreign and U.S. jurisdictions, offset by tax benefits from tax credits and the foreign-derived intangible income ("FDII"(“FDII”) deduction. On July 23, 2020, the U.S. Department of Treasury and the Internal Revenue Service finalized regulations T.D. 9902 with respect to the global intangible low-taxes
income high-tax exemption, resulting in a decrease in our effective tax rate. This adjustment was retroactive to the fiscal years 2018 and 2019 and the cumulative impact is taken into account during fiscal 2020. Furthermore, the benefit derived from the FDII deduction is influenced by the relative weighting of export sales and domestic sales and when export sales are proportionally higher the expected effective tax rate is reduced due to a larger realized deduction. In addition to these impacts, the effective tax rate was impacted favorably by additional deductions for stock compensation due to increased stock prices between the grant date and vest date.
Our effective tax rate may vary from period to period based on changes in estimated taxable income or loss by jurisdiction, the relative mix of export sales and domestic sales, changes to the valuation allowance, changes to U.S. federal, state or foreign tax laws, changes in stock-based compensation expense/benefit, future expansion into areas with varying country, state, and local income tax rates, and deductibility of certain costs and expenses by jurisdiction.
The decrease in our effective tax rate for the fiscal year ended December 30, 2023, when compared to the corresponding period in the prior year, was primarily driven by the sale of our FRT business and the related capital gain exclusion for German tax purposes. This significant benefit was offset by other items impacting the effective tax rate at a different percentage amount than the prior year due to increased income before taxes in fiscal 2023.
The Creating Helpful Incentives to Produce Semiconductors and Science Act of 2022 (the “CHIPS Act”) was signed into law on August 9, 2022. The CHIPS Act provides for various incentives and tax credits, among other items, including the Advanced Manufacturing Investment Credit (“AMIC”), which equals 25% of qualified investments in an advanced manufacturing facility that is placed in service after December 31, 2022. At least a portion of our future capital expenditures and research and development costs will qualify for this credit, which benefits us by allowing us to net the credit received against our costs. The AMIC credit is accounted for outside of ASC 740 as a reduction to the depreciable basis of the assets used in operations and will not have an impact on our effective tax rate.
Beginning in 2022, the U.S. Tax Cuts and Jobs Act of 2017 eliminated the existing option to deduct research and development expenditures and requires taxpayers to amortize such expenditures attributable to domestic and foreign research over five and fifteen years, respectively, pursuant to IRC Section 174. While the capitalization requirement has a negative impact on our cash flows, there are offsetting benefits from the enactment of this provision that we have included in our estimated annual effective tax rate. While it is possible that Congress may defer, modify, or repeal this provision, potentially with retroactive effect, we have no assurance that this provision will be deferred, modified, or repealed. Changes in our tax provisions or an increase in our tax liabilities, whether due to changes in applicable laws and regulations, the interpretation or application thereof, or a final determination of tax audits or litigation or agreements, could have a material adverse effect on our financial position, results of operations and/or cash flows.
Liquidity and Capital Resources
Capital Resources
Our working capital increased to $332.5$442.7 million at December 26, 202030, 2023 compared to $282.5$324.9 million at December 28, 2019, primarily due to higher cash and cash equivalents resulting from cash generated from operations and higher inventories and accounts receivable on higher operating levels, partially offset by higher accounts payable and accrued liabilities on higher volumes and higher deferred revenue.31, 2022.
Cash and cash equivalents primarily consist of deposits held at banks, and money market funds.funds, and U.S. treasuries. Marketable securities primarily consist of corporate bonds, U.S. treasuries and corporate bonds.agency securities, and commercial paper. We typically invest in highly-rated securities with low probabilities of default. Our investment policy requires investments to be rated single A or better, and limits the types of acceptable investments, issuer concentration and duration of the investment.
Our cash, cash equivalents and marketable securities totaled approximately $255.0$328.3 million at December 26, 202030, 2023 compared to $220.9$238.1 million at December 28, 2019. We believe31, 2022. Based on our historical results of operations, we expect that our cash, cash equivalents, and marketable securities on hand, and the cash we expect to generate from operations, will be ablesufficient to satisfy our working capital requirements forfund, through at least the next twelve12 months, our liquidity requirements including those arising from: research and development, capital expenditures, working capital, outstanding commitments, and other liquidity requirements associated with the liquidity provided byexisting operations. However, we cannot be certain that our existing cash, cash equivalents, and marketable securities on hand, and cash provided by operations.generated from operations, will be available in the future to fund all of our capital and operating requirements. In addition, any future strategic investments and significant acquisitions may require additional cash and capital resources. To the extent necessary, we may consider entering into short and long-term debt obligations, raising cash through a stock issuance, or obtaining new financing facilities, which may not be available on terms favorable to us. Our futureIf we are unable to obtain sufficient cash or capital requirements may vary materially from those now planned.
The COVID-19 pandemic has negatively impacted the global economy, disrupted global supply chainsto meet our needs on a timely basis and created significant volatility and disruption of financial markets. An extended period of global supply chain and economic disruption could materially affecton favorable terms, our business results ofand operations access to sources of liquiditycould be materially and financial condition. As a result of the current and uncertain future impact of COVID-19, we have taken actions to preserve and improve our liquidity primarily by limiting our exposures to volatile markets and investments, as well as actively working to minimize counterparty risk, for example, by directly investing in securities where the counterparty is the U.S. Government rather than a similar investment where the counterparty is a bank.adversely affected.
If we are unsuccessful in maintaining or growing our revenues, maintaining or reducing our cost structure, (in response to a potential reduction in demand due to an industry downturn, COVID-19, or other event), or increasing our available cash through debt or equity financings, our cash, cash equivalents and marketable securities may decline.
We utilize a variety of tax planning and financing strategies in an effort to manage our worldwide cash and deploy funds to locations where they are needed. As part of these strategies, we indefinitely reinvest a portion of our foreign earnings. Should we require additional capital in the U.S.,United States, we may elect to repatriate indefinitely-reinvested foreign funds or raise capital in the United States.
Cash Flows
| | | | | | | | | | | | | | | | | |
| Fiscal Year Ended |
| December 26, 2020 | | December 28, 2019 | | December 29, 2018 |
| (Dollars in thousands) |
| Net cash provided by operating activities | $ | 169,256 | | | $ | 121,048 | | | $ | 68,700 | |
| Net cash used in investing activities | (98,922) | | | (66,352) | | | (21,295) | |
| Net cash used in financing activities | (30,935) | | | (6,578) | | | (39,329) | |
| | | | | | | | | | | | | | | | | |
| Fiscal Year Ended |
| December 30, 2023 | | December 31, 2022 | | December 25, 2021 |
| | | | | |
| (Dollars in thousands) |
| Net cash provided by operating activities | $ | 64,602 | | | $ | 131,786 | | | $ | 139,364 | |
| Net cash provided by (used in) investing activities | 29,049 | | | (75,704) | | | (124,741) | |
| Net cash used in financing activities | (22,711) | | | (95,932) | | | (47,199) | |
Operating Activities
Net cash provided by operating activities consists of net income for the period adjusted for certain non-cash items and changes in certain operating assets and liabilities. The $67.2 million decrease in cash provided by operating activities for fiscal 2023, as compared to fiscal 2022, was primarily related to decreased net income, after adjusting for the impact from the $73.0 million gain recognized on the sale of our FRT business, and an investment in working capital of $14.1 million, due primarily to higher accounts receivable and lower deferred revenue that were partially offset by an increase from a deferred grant of $18.0 million and lower inventories. In January 2023, we received $18.0 million in cash from a California Competes Grant awarded from the California Governor’s Office of Business and Economic Development, subject to job creation and other commitments over a 5-year term. See Note 2, Government Assistance, of Notes to Consolidated Financial Statements for additional information.
Net cash provided by operating activities in fiscal 20202023 was primarily attributable to net income of $78.5$82.4 million which included $88.9 million ofand net non-cash items offset by changes in operating assetsof $14.4 million, which include depreciation, amortization, stock-based compensation, and liabilities using $1.9 million of cash as discussed in more detail below.
Accounts receivable increased $9.7 million to $107.6 million at December 26, 2020 compared to $97.9 million at December 28, 2019, as a result of higher operating levels and the acquisitions of Baldwin Park and HPD, offset by timing of customer payments and diligent management of collections.
Inventories, net, increased $16.0 million to $99.2 million at December 26, 2020 compared to $83.3 million at December 28, 2019, as a result of anticipated projected customer demand and the increased inventory due to the acquisitions of Baldwin Park and HPD, partially offset by a $13.1 million increase to our provision for excess and obsolete inventories.inventories, partially offset by the adjustment for the $73.0 million gain from the sale of our FRT business. Net working capital resulted in an outflow of $32.2 million, primarily related to an increase in accounts receivable of $23.3 million, a decrease in deferred revenues of $10.2 million, an increase in inventories of $9.5 million, and a reduction in operating lease liabilities of $7.6 million, partially offset by an increase from a deferred grant of $18.0 million.
Accrued liabilities increased $18.9 million to $55.3 million at December 26, 2020 compared to $36.4 million at December 28, 2019, as a result of an increase in employee performance-based compensation and benefits, increases in the contributions withheld for employee stock purchase plan, increases to accrued warranty, and the increased liabilities due to the acquisitions of FRT, Baldwin Park, and HPD.
Accounts payable increased $21.1 million to $62.0 million at December 26, 2020 compared to $40.9 million at December 28, 2019, as a result of higher volumes, timing of vendor payments and the increased accounts payable due to the acquisitions of Baldwin Park and HPD.
Investing Activities
Net cash used inprovided by investing activities in fiscal 20202023 primarily related to $55.9$101.8 million cash provided by the sale of our FRT business, partially offset by $56.0 million of cash used in the acquisition of property, plant and equipment including a new production facility in Livermore California, $51.9 million paid (net of cash acquired) as part of the consideration for the acquisition of Baldwin Park and HPD, and $8.7$16.7 million used for the purchase of marketable securities, net of maturities.
Financing Activities
Net cash used in financing activities in fiscal 20202023 primarily related to $43.4$19.8 million used to purchase common stock under our stock repurchase program, $10.7 million used to pay tax withholdings for net share settlements of employee equity awards, and $1.0 million of principal payments made towards the repayment of our term loans and $15.5 million related to tax withholdings associated with the net share settlements of our equity awards,loan, partially offset by $18.0 million of proceeds from a term loan to fund the purchase of the building in Livermore and $10.0$8.8 million of proceeds received from issuances of common stock under our stock incentive plans.
Debt
CMI Term Loan
On June 24, 2016, we entered into a Credit Agreement (the “Credit Agreement”) with HSBC Bank USA, National Association ("HSBC"), as administrative agent, co-lead arranger, sole bookrunner and syndication agent, other lenders that may from time-to-time be a party to the Credit Agreement, and certain guarantors. Pursuant to the Credit Agreement, the lenders provided us with a senior secured term loan facility of $150 million (the “CMI Term Loan”). The proceeds of the CMI Term Loan were used to finance a portion of the purchase price paid in connection with the Cascade Microtech acquisition in fiscal 2016 and to pay related bank fees and expenses.
The CMI Term Loan bore interest at a rate equal to, at our option, (i) the applicable London Interbank Offered Rate ("LIBOR") rate plus 2.00% per annum or (ii) Base Rate (as defined in the Credit Agreement) plus 1.00% per annum. We elected to pay interest at 2.00% over the one-month LIBOR rate. Interest payments were payable in quarterly installments over a five-year period.
The principal payments on the CMI Term Loan were scheduled to be paid in equal quarterly installments that began June 30, 2016, in an annual amount equal to 5% for year one, 10% for year two, 20% for year three, 30% for year four and 35% for year five. We accelerated payments of these scheduled amounts and made the final payment on the CMI Term Loan on June 30, 2020, approximately one year before the original maturity. We are no longer subject to the terms of the Credit Agreement.
FRT Term Loan
On October 25, 2019, we entered into a euro denominated $23.4 million, three-year credit facility loan agreement (the "FRT Term Loan") with HSBC Trinkaus & Burkhardt AG, Germany, to fund the acquisition of FRT GmbH, which we acquired on October 9, 2019.
The FRT Term Loan bears interest at a rate equal to the Euro Interbank Offered Rate ("EURIBOR") plus 1.75 % per annum and will be repaid in quarterly installments of approximately $2.0 million plus interest. The interest rate at December 26, 2020 was 1.24%.
The obligations under the FRT Term Loan are fully and unconditionally guaranteed by FormFactor, Inc. The FRT Term Loan contains negative covenants customary for financing of this type, including covenants that place limitations on the incurrence of additional indebtedness, the creation of liens, the payment of dividends; dispositions; fundamental changes, including mergers and acquisitions; loans and investments; sale leasebacks; negative pledges; transactions with affiliates; changes in fiscal year; sanctions and anti-bribery laws and regulations, and modifications to charter documents in a manner materially adverse to the Lenders. The FRT Term Loan also contains affirmative covenants and representations and warranties customary for financing of this type. As of December 26, 2020, the balance outstanding pursuant to the FRT term loan was $17.1 million and we were in compliance with all covenants.
Building Term Loan
On June 22, 2020, we entered into an $18.0 million 15-year credit facility loan agreement (the “Building Term Loan”) with MUFG Union Bank, National Association ("(“Union Bank"Bank”). The proceeds of the Building Term Loan were used to purchase a building adjacent to our leased facilities in Livermore, California. On May 19, 2023, we amended the Building Term Loan, replacing the benchmark reference rate LIBOR with SOFR, with no change to the amount or timing of contractual cash flows.
The Building Term Loan bears interest at a rate equal to the applicable LIBORSOFR rate, plus 0.1148%, plus 1.75% per annum. Interest payments are payable in monthly installments over a fifteen-year period. The interest rate at December 26, 202030, 2023, before consideration of the interest rate swap, was 1.90%7.20%.
On March 17, 2020, we entered into an interest rate swap agreement with Union Bank to hedge the interest payments on the Building Term Loan for the notional amount of $18.0 million. As future levels of LIBOR over the life of the loan arewere uncertain, we entered into this interest-rate swap agreement to hedge the exposure in interest rate risks associated with movement in LIBOR rates. By entering intoThis agreement was amended on May 19, 2023 to replace the benchmark reference rate LIBOR with SOFR to match the Building Term Loan agreement we convert a floating rate interest at one-month LIBOR plus 1.75% into a fixed rate interest at 2.75%(as amended). TheAfter the amendment, the interest rate swap also includescontinues to convert our floating-rate interest into a 0% floor that is effective for one year from the datefixed-rate of the swap.2.75%. As of December 26, 2020,30, 2023, the notional amount of the loan that is subject to this interest rate swap is $17.5was $14.4 million. See Note 10, Fair Value, for additional information.
The obligations under the Building Term Loan are guaranteed by a deed of trust covering certain real property and improvements and certain personal property used in connection therewith. The deed of trust creates a first priority lien or encumbrance on the property with only such exceptions as may be approved by the Union Bank in writing.
The Credit AgreementBuilding Term Loan contains covenants customary for financing of this type. As of December 26, 2020,30, 2023, the balance outstanding pursuant to the Building Term Loan was $17.5$14.4 million, and we were in compliance with all covenants under the Credit Agreement.agreement.
Stock Repurchase ProgramPrograms
InOn October 26, 2020, our Board of Directors authorized a two-year program to repurchase up to $50 million of outstanding common stock to offset potential dilution from issuances of common stock under our stock-based incentive plans. Thecompensation programs. During fiscal 2021 and 2022, we repurchased and retired 622,400 shares of common stock for $24.0 million and 676,408 shares of common stock for $26.0 million, respectively, utilizing the remaining shares available for repurchase under the program.
On May 20, 2022, our Board of Directors authorized a two-year program to repurchase up to $75 million of outstanding common stock to offset potential dilution from issuance of common stock under our stock-based compensation programs. During fiscal 2022 and 2023, we repurchased and retired 1,700,893 shares of common stock for $56.4 million and 504,352 shares of common stock for $18.6 million, respectively, utilizing the remaining shares available for repurchase under the program.
On October 30, 2023, our Board of Directors authorized an additional program to repurchase up to $75 million of outstanding common stock, also with the primary purpose of offsetting potential dilution from issuance of common stock under our stock-based compensation programs. This share repurchase program will expire on October 28, 2022. This repurchase program replaced the previous repurchase program that expired in February 2020 to purchase up to $25.0 million of outstanding common stock.30, 2025. During fiscal 2020, 20192023, we repurchased and 2018, we did not repurchase any shares.retired 32,020 shares of common stock for $1.2 million and as of December 30, 2023 $73.8 million remained available for future repurchases.
Contractual Obligations and Commitments
The following table summarizes our significant contractual commitments to make future payments in cash under contractual obligations as of December 26, 202030, 2023 (in thousands):
| | Payments Due In Fiscal Year |
| 2021 | | 2022 | | 2023 | | 2024 | | 2025 | | 2026 and thereafter | | Total |
| Payments Due In Fiscal Year | | | Payments Due In Fiscal Year |
| 2024 | | | 2024 | | 2025 | | 2026 | | 2027 | | 2028 | | 2029 and thereafter | | Total |
| Operating leases | Operating leases | $ | 7,349 | | | $ | 6,115 | | | $ | 5,254 | | | $ | 4,903 | | | $ | 4,863 | | | $ | 12,531 | | | $ | 41,015 | |
| Term loans - principal payments | 9,521 | | | 9,549 | | | 1,050 | | | 1,080 | | | 1,111 | | | 12,258 | | | 34,569 | |
Term loans - interest payments(1) | 503 | | | 377 | | | 290 | | | 271 | | | 248 | | | 1,185 | | | 2,874 | |
| Term loan - principal payments | |
Term loan - interest payments(1) | |
| Total | Total | $ | 17,373 | | | $ | 16,041 | | | $ | 6,594 | | | $ | 6,254 | | | $ | 6,222 | | | $ | 25,974 | | | $ | 78,458 | |
(1) Represents our minimum interest payment commitments at 1.24%7.20% per annum, forexcluding the FRT Term Loan and 1.90% per annum for the Building Term Loan.interest rate swap described in Debt, above.
The table above excludes our gross liability for unrecognized tax benefits which totaled $32.5and our deferred grant. The gross liability for unrecognized tax benefits was $45.6 million as of December 26, 2020.30, 2023. The timing of any payments which could result from these unrecognized tax benefits will depend upon a number of factors. Accordingly,factors and, accordingly, the timing of payment cannot be estimated and has been excluded from the table above.
Off-Balance Sheet Arrangements
Historically, we have not participated in transactions that have generated relationships with unconsolidated entities or financial partnerships, suchestimated. The deferred grant was $18.0 million as entities often referred to as structured finance or special purpose entities, which would have been established for the purpose of facilitating off-balance sheet arrangements or other contractually narrow or limited purposes. As of December 26, 2020, we were not involved in30, 2023. The timing of any off-balance sheet arrangements.potential repayments is dependent upon a number of factors, including the number of employees and capital investments. Accordingly, the timing of any repayment cannot be estimated.
Indemnification AgreementsArrangements
We have entered, and may from time to time in the ordinary course of our business enter, into contractual arrangements with third parties that include indemnification obligations. Under these contractual arrangements, we have agreed to defend, indemnify and/or hold the third party harmless from and against certain liabilities. These arrangements include indemnities in favor of customers in the event that our products or services infringe a third party's intellectual property, or cause property damage or other indemnities in favor of our lessors in connection with facility leasehold liabilities that we may cause. In addition, we have entered into indemnification agreements with our directors and certain of our officers, and our bylaws contain indemnification obligations in favor of our directors, officers and agents. These indemnity arrangements may limit the type of the claim, the total amount that we can be required to pay in connection with the indemnification obligation and the time within which an indemnification claim can be made. The duration of the indemnification obligation may vary, and for most arrangements, survives the agreement term and is indefinite. We believe that substantially all of our indemnity arrangements provide either for limitations on the maximum potential future payments we could be obligated to make, or for limitations on the types of claims and damages we could be obligated to indemnify, or both. However, it is not possible to determine or reasonably estimate the maximum potential amount of future payments under these indemnification obligations due to the varying terms of such obligations, a lack of history of prior indemnification claims, the unique facts and circumstances involved in each particular contractual arrangement and in each potential future claim for indemnification, and the contingency of any potential liabilities upon the occurrence of events that are not reasonably determinable. We have not had any material requests for indemnification under these arrangements. We have not recorded any liabilities for these indemnification arrangements on our Consolidated Balance Sheets as of December 26, 202030, 2023 or December 28, 2019.31, 2022.
New Accounting Pronouncements
See Note 16,18, New Accounting Pronouncements, of Notes to Consolidated Financial Statements.
Item 7A: Quantitative and Qualitative Disclosures about Market Risk
Foreign Currency Exchange Risk
We conduct certain operations in foreign currencies. We enter into currency forward exchange contracts to hedge a portion, but not all, of existing foreign currency denominated amounts. Gains and losses on these contracts are generally recognized in
Other income (expense), net in our Consolidated Statements of Income. Because the effect of movements in currency exchange rates on the currency forward exchange contracts generally offsets the related effect on the underlying items being hedged, these financial instruments are not expected to subject us to risks that would otherwise result from changes in currency exchange rates as of December 26, 2020.30, 2023. We do not use derivative financial instruments for trading or speculative purposes.
We recognized a net lossgain from our foreign exchange of $0.5$0.6 million, $1.1 million, and $0.3 million, respectivelyzero in fiscal 20202023, 2022, and 2018, and a net gain of $0.4 million in fiscal 2019.2021, respectively.
Interest Rate Sensitivity
Our exposure to market risk for changes in interest rates relates primarily to our investment portfolio. We invest in a number of securities including U.S. treasuries, U.S. agency discount notes, money market funds, corporate bonds, and commercial paper. We attempt to maintain the safety and preservation of our invested principal funds by limiting default risk, market risk and reinvestment risk. We mitigate default risk by investing in high grade investment securities. By policy, we limit the amount of credit exposure to an issuer, except U.S. Treasuriestreasuries and U.S. agencies.
Our exposure to interest rate risk arising from our Term Loan (see Note 5,6, Debt, of Notes to Consolidated Financial Statements) is insignificant as a result of the interest-rate swap agreement (see Note 7,9, Derivative Financial Instruments, of Notes to Consolidated Financial Statements) that we entered into with Union Bank to hedge the interest payments on our Building Term Loan.
We use interest rate derivative instruments to manage certain interest rate exposures. We do not use derivative instruments for trading or speculative purposes. The fair market value of our fixed rate securities may be adversely impacted by increases in interest rates while income earned on floating rate securities may decline as a result of decreases in interest rates. A hypothetical 100 basis-point (one percentage point) increase or decrease in interest rates compared to rates at December 26, 202030, 2023 and December 28, 201931, 2022 would have affected the fair value of our investment portfolio by $0.1$2.5 million and $1.3$2.1 million, respectively.
Item 8: Financial Statements and Supplementary Data
Consolidated Financial Statements
The consolidated financial statements and supplementary data required by this item are included in the section entitled "Consolidated“Consolidated Financial Statements"Statements” of this Annual Report on Form 10-K. See Part VI, Item 15 for a list of our consolidated financial statements.
Item 9: Changes in and Disagreements with Accountants on Accounting and Financial Disclosure
None.
Item 9A: Controls and Procedures
Evaluation of Disclosure Controls and Procedures
Based on our management’s evaluation (with the participation of our principal executive officer and principal financial officer), as of the end of the period covered by this report, our principal executive officer and principal financial officer have concluded that our disclosure controls and procedures (as defined in Rules 13a-15(e) and 15d-15(e) under the Securities Exchange Act of 1934, as amended, (the “Exchange Act”)) were effective as of December 30, 2023 to ensure that information required to be disclosed by us in reports that we file or submit under the Exchange Act is recorded, processed, summarized and reported within the time periods specified in Securities and Exchange Commission rules and forms and is accumulated and communicated to our management, including our principal executive officer and principal financial officer, as appropriate to allow timely decisions regarding required disclosure.
Changes in Internal Control over Financial Reporting
There have been no changes in our internal control over financial reporting (as defined in Rules 13a-15(f) and 15d-15(f) under the Exchange Act) except ad described below that occurred during the fourth quarter of fiscal year ended December 26, 2020,2023 that have materially affected, or are reasonably likely to materially affect, our internal control over financial reporting.
On July 30, 2020, we completed the acquisition of the probe card assets of Advantest Corporation ("Baldwin Park"), located in Baldwin Park, California, and on October 19, 2020, we acquired 100% of the shares of High Precision Devices, Inc. ("HPD"),
located in Boulder, Colorado, and are integrating the acquired businesses into our overall internal control over financial reporting process. Our management is in the process of assessing the internal control over financial reporting and is implementing or revising internal controls where necessary.
Management's Report on Internal Control over Financial Reporting
Our management is responsible for establishing and maintaining adequate internal control over financial reporting as defined in Rules 13a-15(f) and 15d-15(f) under the Exchange Act. Internal control over financial reporting is a process designed by, or under the supervision of, our Principal Executive Officerprincipal executive officer and Principal Financial Officer,principal financial officer, and effected by our board of directors,
management and other personnel and consultants, to provide reasonable assurance regarding the reliability of financial reporting and the preparation of financial statements for external purposes in accordance with generally accepted accounting principles, and includes those policies and procedures that:
(i) pertain to the maintenance of records that in reasonable detail accurately and fairly reflect our transactions and dispositions of assets;
(ii) provide reasonable assurance that transactions are recorded as necessary to permit preparation of financial statements in accordance with generally accepted accounting principles, and that our receipts and expenditures are being made only in accordance with the authorization of our management and directors; and
(iii) provide reasonable assurance regarding prevention or timely detection of unauthorized acquisition, use or disposition of our assets that could have a material effect on the financial statements.
Because of its inherent limitations, internal control over financial reporting may not prevent or detect misstatements. Also, projections of any evaluation of effectiveness to future periods are subject to the risk that controls may become inadequate because of changes in conditions, or that the degree of compliance with the policies or procedures may deteriorate.
We acquired Baldwin Park and HPD on July 30, 2020 and October 19, 2020, respectively, and have not yet completed the process of integrating the acquired business’ internal control over financial reporting into our overall internal control over financial reporting process. Accordingly, excluded from our assessment of internal control over financial reporting as of December 26, 2020 are the internal controls of Baldwin Park and HPD. Baldwin Park's total assets, including goodwill and identified intangibles, and total revenues represented approximately 4% and less than 1%, respectively, of the Consolidated Financial Statement amounts as of and for the year ended December 26, 2020. HPD's total assets, including goodwill and identified intangibles, and total revenues represented approximately 3% and less than 1%, respectively, of the Consolidated Financial Statement amounts as of and for the year ended December 26, 2020.
Under the supervision and with the participation of our management, including our Principal Executive Officerprincipal executive officer and Principal Financial Officer,principal financial officer, we conducted an assessment of the effectiveness of our internal control over financial reporting as of December 26, 2020.30, 2023. In making this assessment, our management used the criteria set forth in Internal Control-Integrated Framework (2013) issued by the Committee of Sponsoring Organizations of the Treadway Commission ("COSO"(“COSO”). Based on the results of this assessment, management has concluded that our internal control over financial reporting was effective as of December 26, 2020.30, 2023.
The effectiveness of our internal control over financial reporting as of December 26, 202030, 2023 has been audited by KPMG LLP, an independent registered public accounting firm, as stated in their report which appears in this Annual Report on Form 10-K.
Limitations on the Effectiveness of Controls
Control systems, no matter how well designed and operated, can provide only reasonable, not absolute, assurance that the control systems’ objectives are being met. Further, the design of any control systems must reflect the fact that there are resource constraints, and the benefits of all controls must be considered relative to their costs. Because of the inherent limitations in all control systems, no evaluation of controls can provide absolute assurance that all control issues and instances of fraud, if any, within our company have been detected. These inherent limitations include the realities that judgments in decision making can be faulty and that breakdowns can occur because of simple error or mistake. Control systems can also be circumvented by the individual acts of some persons, by collusion of two or more people, or by management override of the controls. The design of any system of controls is based, in part, on certain assumptions about the likelihood of future events, and there can be no assurance that any design will succeed in achieving its stated goals under all potential future conditions. Over time, controls may become inadequate because of changes in conditions or deterioration in the degree of compliance with policies or procedures.
CEO and CFO Certifications
We have attached as exhibits to this Annual Report on Form 10-K the certifications of our Chief Executive Officer and Chief Financial Officer, which are required in accordance with the Exchange Act. We recommend that this Item 9A be read in conjunction with the certifications for a more complete understanding of the subject matter presented.
Item 9B: Other Information
None.Insider Trading Arrangements
During the quarter ended December 30, 2023, none of our directors or officers (as defined in Rule 16a-1(f) of the Exchange Act) adopted or terminated a “Rule 10b5-1 trading arrangement” or “non-Rule 10b5-1 trading arrangement” (as those terms are defined in Item 408 of Regulation S-K), except as follows:
Dr. Mike Slessor, the Company’s Chief Executive Officer, adopted a Rule 10b5-1 trading arrangement on November 20, 2023. Under this arrangement, a total of 84,002 shares of our common stock may be sold, subject to certain conditions, after March 1, 2024 and before the arrangement expires on November 5, 2025.
The above arrangement is intended to satisfy the affirmative defense conditions of Rule 10b5-1(c) of the Exchange Act.
Item 9C: Disclosure Regarding Foreign Jurisdictions that Prevent Inspections
None.
PART III
Item 10: Directors, Executive Officers and Corporate Governance
The information required by this item is incorporated by reference to the proxy statement for our 20212024 Annual Meeting of Stockholders.Stockholders under the captions Corporate Governance, Executive Officers, and, if applicable, Delinquent Section 16 Reports.
Item 11: Executive Compensation
The information required by this item is incorporated by reference to the proxy statement for our 20212024 Annual Meeting of Stockholders under the captioncaptions Executive Compensation and Related Information.Information, Compensation Committee Interlocks and Insider Participation and Report of the Compensation Committee.
Item 12: Security Ownership of Certain Beneficial Owners and Management and Related Stockholder Matters
The information required by this item is incorporated by reference to the proxy statement for our 20212024 Annual Meeting of Stockholders under the captioncaptions Security Ownership of Certain Beneficial Owners and Management and Related Stockholder Matters.Matters, and Equity Compensation Plans.
Item 13: Certain Relationships and Related Transactions, and Director Independence
The information required by this item is incorporated by reference to the proxy statement for our 20212024 Annual Meeting of Stockholders under the captioncaptions Certain Relationships and Related Transactions.Transactions and Independence of Directors.
Item 14: Principal Accountant Fees and Services
Our independent registered public accounting firm is KPMG, LLP; Portland, Oregon; Auditor Firm ID: 185.
The information required by this item is incorporated by reference to the proxy statement for our 20212024 Annual Meeting of Stockholders under the caption Principal Auditor Fees and Services.
PART IV
Item 15: Exhibits and Financial Statement Schedules
Financial Statements and Schedules
The Consolidated Financial Statements, together with the report thereon of KPMG LLP, are included on the pages indicated below:
| | | | | | | | |
| | Page |
| Report of Independent Registered Public Accounting Firm | | |
Consolidated Balance Sheets as of December 26, 202030, 2023 and December 28, 201931, 2022 | | |
Consolidated Statements of Income for the fiscal years ended December 26, 2020,30, 2023, December 28, 201931, 2022 and December 29, 201825, 2021 | | |
Consolidated Statements of Comprehensive Income for the fiscal years ended December 26, 2020,30, 2023, December 28, 201931, 2022 and December 29, 201825, 2021 | | |
Consolidated Statements of Stockholders' Equity for the fiscal years ended December 26, 2020,30, 2023, December 28, 201931, 2022 and December 29, 201825, 2021 | | |
Consolidated Statements of Cash Flows for the fiscal years ended December 26, 2020,30, 2023, December 28, 201931, 2022 and December 29, 201825, 2021 | | |
| Notes to Consolidated Financial Statements | | |
Financial statement schedules have been omitted because they are not applicable or the required information is shown in the consolidated financial statements or notes thereto.
Exhibits
The exhibits listed in the accompanying index to exhibits are filed or incorporated by reference as part of this Annual Report on Form 10-K.
Item 16: Form 10-K Summary
None.
EXHIBIT INDEX
| | | | | | | | | | | | | | | | | | | | | | | | | | | | | | | | | | | | | | |
| | | | Incorporated by Reference | | |
Exhibit
Number | | Exhibit Description | | Form | | File No | | Date of
First Filing | | Exhibit
Number | | Filed
Herewith |
| | Amended and Restated Certificate of Incorporation of the Registrant as filed with the Delaware Secretary of State on June 17, 2003 | | S-1 | | 333-109815 | | 10/20/2003 | | 3.01 | | | |
| | Amended and Restated Bylaws of the Registrant | | 8-K | | 000-50307 | | 7/22/2016 | | 3.2 | | | |
| | Specimen Common Stock Certificate | | S-1/A | | 333-86738 | | 5/28/2002 | | 4.01 | | | |
| | Description of Securities | | — | | | — | | | — | | | — | | | X |
| | Form of Indemnity Agreement | | S-1/A | | 333-86738 | | 5/28/2002 | | 10.01 | | | |
| | Form of Change of Control Severance Agreement | | 10-K | | 000-50307 | | 3/14/2005 | | 10.48 | | | |
| | Employee Incentive Plan, as amended and restated effective October 1, 2019 | | 10-K | | 000-50307 | | 2/21/2020 | | 10.9 | | | |
| | Equity Incentive Plan, as amended and restated effective May 15, 2020 | | DEF 14A | | 000-50307 | | 4/3/2020 | | Appendix A | | |
| | Employee Stock Purchase Plan, as amended and restated May 18, 2018 | | DEF 14A | | 000-50307 | | 4/3/2018 | | Appendix A | | |
| | Pacific Corporate Center Lease (Building 1) by and between Greenville Holding Company LLC (successor to Greenville Investors, L.P.) ("Greenville") and the Registrant dated May 3, 2001 | | S-1/A | | 333-86738 | | 6/10/2003 | | 10.18 | | | |
| | First Amendment to Pacific Corporate Center Lease (Building 1) by and between Greenville and the Registrant dated January 31, 2003 | | S-1/A | | 333-86738 | | 5/7/2003 | | 10.18.1 | | |
| | Pacific Corporate Center Lease (Building 2) by and between Greenville and the Registrant dated May 3, 2001 | | S-1/A | | 333-86738 | | 6/10/2003 | | 10.19 | | | |
| | First Amendment to Pacific Corporate Center Lease (Building 2) by and between Greenville and the Registrant dated January 31, 2003 | | S-1/A | | 333-86738 | | 5/7/2003 | | 10.19.1 | | |
| | Pacific Corporate Center Lease (Building 3) by and between Greenville and the Registrant dated May 3, 2001 | | S-1/A | | 333-86738 | | 6/10/2003 | | 10.20 | | | |
| | First Amendment to Pacific Corporate Center Lease (Building 3) by and between Greenville and the Registrant dated January 31, 2003 | | S-1/A | | 333-86738 | | 5/7/2003 | | 10.20.1 | | |
| | Third Amendment, dated December 19, 2016, between FormFactor, Inc. and MOHR PCC, LP, to Pacific Corporate Center Leases (Buildings 1, 2 and 3), dated May 3, 2001, by and between Greenville Investors, L.P. and FormFactor, Inc., as amended | | 8-K | | 000-50307 | | 12/23/2016 | | 10.2 | | | |
| | Pacific Corporate Center Lease by and between Greenville and the Registrant dated September 7, 2004, as amended by First Amendment to Building 6 Lease dated August 16, 2006 | | 10-Q | | 000-50307 | | 11/7/2006 | | 10.01 | | | |
| | Second Amendment, dated December 19, 2016, between FormFactor, Inc. and MOHR PCC, LP, to Pacific Corporate Center Lease, dated October 5, 2004, by and between Greenville Investors, L.P. and FormFactor, Inc., as amended | | 8-K | | 000-50307 | | 12/23/2016 | | 10.1 | | | |
| | Third Amendment, dated October 1, 2018, between FormFactor, Inc. and MOHR PCC, LP, to Pacific Corporate Center Lease, dated October 5, 2004, by and between Greenville Investors, L.P. and FormFactor, Inc., as amended | | 8-K | | 000-50307 | | 10/2/2018 | | 10.1 | | | |
| | Fourth Amendment, dated October 1, 2018, between FormFactor, Inc. and MOHR PCC, LP, to Pacific Corporate Center Lease, dated October 5, 2004, by and between Greenville Investors, L.P. and FormFactor, Inc., as amended | | 8-K | | 000-50307 | | 10/2/2018 | | 10.2 | | | |
| | Rental Agreement by and between Cascade Microtech Dresden GmbH and Süss Grundstücksverwaltungs GbR dated as of June 17, 2011. | | 10-Q | | 000-51072 | | 8/10/2011 | | 10.3 | | | |
| | First Amendment to Lease dated January 10, 2007, between Nimbus Center LLC (as successor in interest to Spieker Properties, L.P.) and Cascade Microtech, Inc. | | 10-Q | | 000-51072 | | 5/9/2014 | | 10.1 | | | |
| | Second Amendment to Lease dated February 25, 2013, between Nimbus Center LLC and Cascade Microtech, Inc. | | 10-Q | | 000-51072 | | 5/8/2013 | | 10.2 | | | |
| | | | | | | | | | | | | | | | | | | | | | | | | | | | | | | | | | | | | | |
| | | | Incorporated by Reference | | |
Exhibit
Number | | Exhibit Description | | Form | | File No | | Date of
First Filing | | Exhibit
Number | | Filed
Herewith |
| | Certificate of Amendment of Amended and Restated Certificate of Incorporation of FormFactor, Inc. | | 8-K | | 000-50307 | | 6/3/2022 | | 3.1 | | | |
| | Restated Certificate of Incorporation of FormFactor, Inc. | | 8-K | | 000-50307 | | 6/3/2022 | | 3.2 | | | |
| | Amended and Restated By-laws of FormFactor, Inc. | | 8-K | | 000-50307 | | 6/3/2022 | | 3.3 | | | |
| | Specimen Common Stock Certificate | | S-1/A | | 333-86738 | | 5/28/2002 | | 4.01 | | | |
| | Description of Securities | | 10-K | | 000-50307 | | 2/22/2021 | | 4.2 | | | |
| | Form of Indemnity Agreement | | S-1/A | | 333-86738 | | 5/28/2002 | | 10.01 | | | |
| | Form of Change of Control Severance Agreement | | 8-K | | 000-50307 | | 7/26/2022 | | 10.1 | | | |
| | Employee Incentive Plan, as amended and restated effective January 25, 2022 | | — | | | — | | | — | | | — | | | X |
| | Equity Incentive Plan, as amended and restated effective May 27, 2022 | | DEF 14A | | 000-50307 | | 4/13/2022 | | Appendix B | | |
| | Employee Stock Purchase Plan, as amended and restated May 19, 2023 | | DEF 14A | | 000-50307 | | 4/4/2023 | | Appendix A | | |
| | Pacific Corporate Center Lease (Building 1) by and between Greenville Holding Company LLC (successor to Greenville Investors, L.P.) (“Greenville”) and the Registrant dated May 3, 2001 | | S-1/A | | 333-86738 | | 6/10/2003 | | 10.18 | | | |
| | First Amendment to Pacific Corporate Center Lease (Building 1) by and between Greenville and the Registrant dated January 31, 2003 | | S-1/A | | 333-86738 | | 5/7/2003 | | 10.18.1 | | |
| | Pacific Corporate Center Lease (Building 2) by and between Greenville and the Registrant dated May 3, 2001 | | S-1/A | | 333-86738 | | 6/10/2003 | | 10.19 | | | |
| | First Amendment to Pacific Corporate Center Lease (Building 2) by and between Greenville and the Registrant dated January 31, 2003 | | S-1/A | | 333-86738 | | 5/7/2003 | | 10.19.1 | | |
| | Pacific Corporate Center Lease (Building 3) by and between Greenville and the Registrant dated May 3, 2001 | | S-1/A | | 333-86738 | | 6/10/2003 | | 10.20 | | | |
| | First Amendment to Pacific Corporate Center Lease (Building 3) by and between Greenville and the Registrant dated January 31, 2003 | | S-1/A | | 333-86738 | | 5/7/2003 | | 10.20.1 | | |
| | Third Amendment, dated December 19, 2016, between FormFactor, Inc. and MOHR PCC, LP, to Pacific Corporate Center Leases (Buildings 1, 2 and 3), dated May 3, 2001, by and between Greenville Investors, L.P. and FormFactor, Inc., as amended | | 8-K | | 000-50307 | | 12/23/2016 | | 10.2 | | | |
| | Pacific Corporate Center Lease by and between Greenville and the Registrant dated September 7, 2004, as amended by First Amendment to Building 6 Lease dated August 16, 2006 | | 10-Q | | 000-50307 | | 11/7/2006 | | 10.01 | | | |
| | Second Amendment, dated December 19, 2016, between FormFactor, Inc. and MOHR PCC, LP, to Pacific Corporate Center Lease, dated October 5, 2004, by and between Greenville Investors, L.P. and FormFactor, Inc., as amended | | 8-K | | 000-50307 | | 12/23/2016 | | 10.1 | | | |
| | Third Amendment, dated October 1, 2018, between FormFactor, Inc. and MOHR PCC, LP, to Pacific Corporate Center Lease, dated October 5, 2004, by and between Greenville Investors, L.P. and FormFactor, Inc., as amended | | 8-K | | 000-50307 | | 10/2/2018 | | 10.1 | | | |
| | Fourth Amendment, dated October 1, 2018, between FormFactor, Inc. and MOHR PCC, LP, to Pacific Corporate Center Lease, dated October 5, 2004, by and between Greenville Investors, L.P. and FormFactor, Inc., as amended | | 8-K | | 000-50307 | | 10/2/2018 | | 10.2 | | | |
| | Rental Agreement by and between Cascade Microtech Dresden GmbH and Süss Grundstücksverwaltungs GbR dated as of June 17, 2011. | | 10-Q | | 000-51072 | | 8/10/2011 | | 10.3 | | | |
| | First Amendment to Lease dated January 10, 2007, between Nimbus Center LLC (as successor in interest to Spieker Properties, L.P.) and Cascade Microtech, Inc. | | 10-Q | | 000-51072 | | 5/9/2014 | | 10.1 | | | |
| | Second Amendment to Lease dated February 25, 2013, between Nimbus Center LLC and Cascade Microtech, Inc. | | 10-Q | | 000-51072 | | 5/8/2013 | | 10.2 | | | |
| | | | | Incorporated by Reference | |
Exhibit
Number | |
Exhibit
Number | |
Exhibit
Number | | | Exhibit Description | | Form | | File No | | Date of
First Filing | | Exhibit
Number | | Filed
Herewith |
| | | Third Amendment to Lease dated January 23, 2014, between Nimbus Center LLC and Cascade Microtech, Inc. | | 10-Q | | 000-51072 | | 5/9/2014 | | 10.2 | | |
| | | Fourth Amendment to Lease dated March 31, 2014, between Nimbus Center LLC and Cascade Microtech, Inc. | | 10-Q | | 000-51072 | | 5/9/2014 | | 10.3 | | |
| |
| |
| |
| |
| | | Fifth Amendment to Lease dated September 24, 2014, between Nimbus Center LLC and Cascade Microtech, Inc. | | 10-K | | 000-51072 | | 3/72016 | | 10.22 | | |
| | | Sixth Amendment to Lease dated July 8, 2015, between Nimbus Center LLC and Cascade Microtech, Inc. | | 10-K | | 000-51072 | | 3/72016 | | 10.23 | | |
| | Employment Offer Letter, dated August 29, 2012 to Mike Slessor | | 10-K | | 000-50307 | | 3/13/2013 | | 10.19+ | |
| |
| |
| |
| |
| |
| |
| |
| |
| | | CEO Change of Control and Severance Agreement, dated April 28, 2016 by and between Mike Slessor and the Registrant | | 10-K | | 000-50307 | | 3/15/2017 | | 10.35 | | |
| |
| |
| |
| |
| |
| | | Employment Offer Letter, dated February 15, 2018 to Shai Shahar | | 10-Q | | 000-50307 | | 5/8/2018 | | 10.1 | | |
| |
| |
| |
| |
| |
| |
| |
| |
| |
| |
| | | List of Registrant's subsidiaries | | — | | | — | | | — | | | — | | | X | | List of Registrant's subsidiaries | | — | | | — | | — | | | — | | — | | | — | | — | | | X | | X |
| | | Consent of Independent Registered Public Accounting Firm - KPMG LLP | | — | | | — | | | — | | | — | | | X | | | Consent of Independent Registered Public Accounting Firm - KPMG LLP | | — | | | — | | — | | | — | | — | | | — | | — | | | X | | X |
| | | Power of Attorney (included on the signature page of this Form 10-K) | | — | | | — | | | — | | | — | | | X | | | Power of Attorney (included on the signature page of this Form 10-K) | | — | | | — | | — | | | — | | — | | | — | | — | | | X | | X |
| | | Certification of Chief Executive Officer pursuant to 15 U.S.C. Section 7241, as adopted pursuant to Section 302 of the Sarbanes-Oxley Act of 2002 | | — | | | — | | | — | | | — | | | X | | | Certification of Chief Executive Officer pursuant to 15 U.S.C. Section 7241, as adopted pursuant to Section 302 of the Sarbanes-Oxley Act of 2002 | | — | | | — | | — | | | — | | — | | | — | | — | | | X | | X |
| | | Certification of Chief Financial Officer pursuant to 15 U.S.C. Section 7241, as adopted pursuant to Section 302 of the Sarbanes-Oxley Act of 2002 | | — | | | — | | | — | | | — | | | X | | | Certification of Chief Financial Officer pursuant to 15 U.S.C. Section 7241, as adopted pursuant to Section 302 of the Sarbanes-Oxley Act of 2002 | | — | | | — | | — | | | — | | — | | | — | | — | | | X | | X |
| | | Certification of Chief Executive Officer and Chief Financial Officer pursuant to 18 U.S.C. Section 1350, as adopted pursuant to Section 906 of the Sarbanes-Oxley Act of 2002 | | — | | | — | | | — | | | — | | | X | | | Certification of Chief Executive Officer and Chief Financial Officer pursuant to 18 U.S.C. Section 1350, as adopted pursuant to Section 906 of the Sarbanes-Oxley Act of 2002 | | — | | | — | | — | | | — | | — | | | — | | — | | | X | | X |
| | | | Incentive Compensation Clawback Policy, effective October 2, 2023 | | — | | | — | | | — | | | — | | | X |
| 101** | 101** | | The following financial statements from the Company’s Annual Report on Form 10-K for the year ended December 26, 2020, formatted in Inline XBRL: (i) Consolidated Balance Sheets, (ii) Consolidated Statements of Income, (iii) Consolidated Statements of Comprehensive Income, (iv) Consolidated Statements of Cash Flows, and (v) Notes to Consolidated Financial Statements, tagged as blocks of text and including detailed tags. | | — | | | — | | | — | | | — | | | X | 101** | | The following financial statements from the Company’s Annual Report on Form 10-K for the year ended December 30, 2023, formatted in Inline XBRL: (i) Consolidated Balance Sheets, (ii) Consolidated Statements of Income, (iii) Consolidated Statements of Comprehensive Income, (iv) Consolidated Statements of Cash Flows, and (v) Notes to Consolidated Financial Statements, tagged as blocks of text and including detailed tags. | | — | | | — | | — | | | — | | — | | | — | | — | | | X | | X |
| 101.SCH** | 101.SCH** | | XBRL Taxonomy Extension Schema Document | | — | | | — | | | — | | | — | | | X | 101.SCH** | | XBRL Taxonomy Extension Schema Document | | — | | | — | | — | | | — | | — | | | — | | — | | | X | | X |
| 101.CAL** | 101.CAL** | | XBRL Taxonomy Extension Calculation Linkbase Document | | — | | | — | | | — | | | — | | | X | 101.CAL** | | XBRL Taxonomy Extension Calculation Linkbase Document | | — | | | — | | — | | | — | | — | | | — | | — | | | X | | X |
| 101.DEF** | 101.DEF** | | XBRL Taxonomy Extension Definition Linkbase Document | | — | | | — | | | — | | | — | | | X | 101.DEF** | | XBRL Taxonomy Extension Definition Linkbase Document | | — | | | — | | — | | | — | | — | | | — | | — | | | X | | X |
| 101.LAB** | 101.LAB** | | XBRL Taxonomy Extension Label Linkbase Document | | — | | | — | | | — | | | — | | | X | 101.LAB** | | XBRL Taxonomy Extension Label Linkbase Document | | — | | | — | | — | | | — | | — | | | — | | — | | | X | | X |
| 101.PRE** | | XBRL Taxonomy Extension Presentation Linkbase Document | | — | | | — | | | — | | | — | | | X |
| 104 | | | The cover page from the Company’s Annual Report on Form 10-K for the year ended December 26, 2020, formatted in Inline XBRL (included as Exhibit 101). | | — | | | — | | | — | | | — | | | X |
| | | | | | | | | | | | | | | | | | | | | | | | | | | | | | | | | | | | | | |
| | | | Incorporated by Reference | | |
Exhibit
Number | | Exhibit Description | | Form | | File No | | Date of
First Filing | | Exhibit
Number | | Filed
Herewith |
| 101.PRE** | | XBRL Taxonomy Extension Presentation Linkbase Document | | — | | | — | | | — | | | — | | | X |
| 104 | | | The cover page from the Company’s Annual Report on Form 10-K for the year ended December 30, 2023, formatted in Inline XBRL (included as Exhibit 101). | | — | | | — | | | — | | | — | | | X |
* This exhibit shall not be deemed "filed"“filed” for purposes of Section 18 of the Securities Exchange Act of 1934 or otherwise subject to the liabilities of that section, nor shall it be deemed incorporated by reference in any filing under the Securities Act of 1933 or the Securities Exchange Act of 1934, whether made before or after the date hereof and irrespective of any general incorporation language in any filings.
** Pursuant to Rule 406T of Regulation S-T, these interactive data files are deemed not filed or part of a registration statement or prospectus for purposes of Sections 11 or 12 of the Securities Act of 1933 or Section 18 of the Securities Exchange Act of 1934 and otherwise are not subject to liability.
*** The schedules, exhibits, and annexes to this exhibit have been omitted in reliance on Item 601(b)(2) of Regulation S-K and will be furnished supplementally to the SEC upon request.
+ Indicates a management contract or compensatory plan or arrangement.
SIGNATURES
Pursuant to the requirements of Section 13 or 15(d) of the Securities Exchange Act of 1934, the Registrant has duly caused this report to be signed on its behalf by the undersigned, thereunto duly authorized.
| | | | | | | | | | | | | | | | | | | | | | | |
| | | | | | FORMFACTOR, INC. |
| Date: | | February 22, 202123, 2024 | | By: | | /s/ SHAI SHAHAR |
| | | | | | | | Shai Shahar Chief Financial Officer (Principal Financial Officer and Principal
Accounting Officer)
|
POWER OF ATTORNEY
KNOW BY ALL PERSONS BY THESE PRESENTS, that each of the undersigned whose signature appears below constitutes and appoints Shai Shahar and Jason Cohen, and each of them, the undersigned's true and lawful attorneys in-fact and agents with full power of substitution, for the undersigned and in the undersigned's name, place and stead, in any and all capacities, to sign any and all amendments to this Annual Report on Form 10-K and any other documents in connection therewith, and to file the same, with all exhibits thereto, with the Securities and Exchange Commission, granting unto said attorneys-in-fact and agents, and each of them, full power and authority to do and perform each and every act requisite and necessary to be done with respect to this Annual Report on Form 10-K, including amendments, as fully to all intents and purposes as the undersigned might or could do in person, hereby ratifying and confirming all that said attorneys-in-fact and agents, or his or their substitute or substitutes, may lawfully do or cause to be done by virtue hereof.
IN WITNESS WHEREOF, each of the undersigned has executed this Power of Attorney as of the date indicated below.
Pursuant to the requirements of the Securities Exchange Act of 1934, this report has been signed below by the following persons on behalf of the Registrant and in the capacities and on the dates indicated.
| | | | | | | | | | | | | | |
| Signature | Title | Date |
| | | | |
| Principal Executive Officer: | | | |
| /s/ MICHAEL D. SLESSOR | Chief Executive Officer and Director | | February 22, 2021 |
| Michael D. Slessor |
| Principal Financial Officer and Principal
Accounting Officer: | | | |
| /s/ SHAI SHAHAR | Chief Financial Officer | | February 22, 2021 |
| Shai Shahar |
Pursuant to the requirements of the Securities Exchange Act of 1934, this report has been signed below by the following persons on behalf of the Registrant and in the capacities and on the dates indicated.
| | | | | | | | | | | | | | |
| Signature | Title | | Date |
| | | | |
| /s/ MICHAEL D. SLESSOR | President, Chief Executive Officer and Director (Principal Executive Officer) | | February 23, 2024 |
| Additional Directors: | | | Michael D. Slessor |
| | | | |
| /s/ LOTHAR MAIERSHAI SHAHAR | DirectorChief Financial Officer (Principal Financial Officer and Principal Accounting Officer) | | February 22, 202123, 2024 |
| Shai Shahar | | Lothar Maier
| | | | |
| /s/ EDWARD ROGAS, JR | Director | February 22, 2021 |
| Edward Rogas, Jr |
| | | |
| /s/ KELLEY STEVEN-WAISS | Director | February 22, 2021 |
| Kelley Steven-Waiss |
| | | |
| /s/ SHERI RHODES | Director | February 22, 2021 |
| Sheri Rhodes |
| | | |
| /s/ RAYMOND LINK | Director | February 22, 2021 |
| Raymond Link |
| | | |
| /s/ REBECA OBREGON-JIMENEZ | Director | February 22, 2021 |
| Rebeca Obregon-Jimenez |
| | | |
| /s/ THOMAS ST. DENNIS | Director | | February 22, 202123, 2024 |
| Thomas St. Dennis |
| | | | |
| /s/ LOTHAR MAIER | Director | | February 23, 2024 |
| Lothar Maier | |
| | | | |
| /s/ REBECA OBREGON-JIMENEZ | Director | | February 23, 2024 |
| Rebeca Obregon-Jimenez | |
| | | | |
| /s/ SHERI RHODES | Director | | February 23, 2024 |
| Sheri Rhodes | |
| | | | |
| /s/ KELLEY STEVEN-WAISS | Director | | February 23, 2024 |
| Kelley Steven-Waiss | |
| | | | |
| /s/ JORGE TITINGER | Director | | February 23, 2024 |
| Jorge Titinger | |
| | | | |
| /s/ BRIAN WHITE | Director | | February 23, 2024 |
| Brian White |
Report of Independent Registered Public Accounting Firm
To the Stockholders and Board of Directors
FormFactor, Inc.:
Opinions on the Consolidated Financial Statements and Internal Control Over Financial Reporting
We have audited the accompanying consolidated balance sheets of FormFactor, Inc. and subsidiaries (the Company) as of December 26, 202030, 2023 and December 28, 2019,31, 2022, the related consolidated statements of income, comprehensive income, stockholders’ equity, and cash flows for each of the years in the three-year period ended December 26, 2020,30, 2023, and the related notes (collectively, the consolidated financial statements). We also have audited the Company’s internal control over financial reporting as of December 26, 2020,30, 2023, based on the criteria established in Internal Control -– Integrated Framework (2013) issued by the Committee of Sponsoring Organizations of the Treadway Commission.
In our opinion, the consolidated financial statements referred to above present fairly, in all material respects, the financial position of the Company as of December 26, 202030, 2023 and December 28, 2019,31, 2022, and the results of its operations and its cash flows for each of the years in the three-year period ended December 26, 2020,30, 2023, in conformity with U.S. generally accepted accounting principles. Also in our opinion, the Company maintained, in all material respects, effective internal control over financial reporting as of December 26, 2020,30, 2023 based on the criteria established in Internal Control -– Integrated Framework (2013) issued by the Committee of Sponsoring Organizations of the Treadway Commission.
The Company acquired the probe card assets of Advantest Corporation (Baldwin Park) and 100% of the shares of High Precision Devices, Inc. ("HPD") during 2020, and management excluded from its assessment of the effectiveness of the Company’s internal control over financial reporting as of December 26, 2020, Baldwin Park’s and HPD’s internal control over financial reporting associated with total assets representing approximately 4% and 3% of consolidated assets as of December 26, 2020, respectively, and total revenues each representing less than 1% of consolidated revenues as of and for the year ended December 26, 2020. Our audit of internal control over financial reporting of the Company also excluded an evaluation of the internal control over financial reporting of Baldwin Park and HPD.
Change in Accounting Principle
As discussed in note 6 to the consolidated financial statements, the Company has changed its method of accounting for leases as of December 30, 2018 due to the adoption of Accounting Standards Update ("ASU") 2016-02, “Leases (Topic 842),” ASU 2018-10, “Codification Improvements to Topic 842, Leases,” ASU 2018-11, “Leases (Topic 842): Targeted Improvements,” and ASU 2019-01, “Leases (Topic 842): Codification Improvements.”
Basis for Opinions
The Company’s management is responsible for these consolidated financial statements, for maintaining effective internal control over financial reporting, and for its assessment of the effectiveness of internal control over financial reporting, included in the accompanying Management’sManagement's Report on Internal Control over Financial Reporting appearing under Item 9A.Reporting. Our responsibility is to express an opinion on the Company’s consolidated financial statements and an opinion on the Company’s internal control over financial reporting based on our audits. We are a public accounting firm registered with the Public Company Accounting Oversight Board (United States) (PCAOB) and are required to be independent with respect to the Company in accordance with the U.S. federal securities laws and the applicable rules and regulations of the Securities and Exchange Commission and the PCAOB.
We conducted our audits in accordance with the standards of the PCAOB. Those standards require that we plan and perform the audits to obtain reasonable assurance about whether the consolidated financial statements are free of material misstatement, whether due to error or fraud, and whether effective internal control over financial reporting was maintained in all material respects.
Our audits of the consolidated financial statements included performing procedures to assess the risks of material misstatement of the consolidated financial statements, whether due to error or fraud, and performing procedures that respond to those risks. Such procedures included examining, on a test basis, evidence regarding the amounts and disclosures in the consolidated financial statements. Our audits also included evaluating the accounting principles used and significant estimates made by management, as well as evaluating the overall presentation of the consolidated financial statements. Our audit of internal control over financial reporting included obtaining an understanding of internal control over financial reporting, assessing the risk that a material weakness exists, and testing and evaluating the design and operating effectiveness of internal control based on the assessed risk. Our audits also included performing such other procedures as we considered necessary in the circumstances. We believe that our audits provide a reasonable basis for our opinions.
Definition and Limitations of Internal Control Over Financial Reporting
A company’s internal control over financial reporting is a process designed to provide reasonable assurance regarding the reliability of financial reporting and the preparation of financial statements for external purposes in accordance with generally accepted accounting principles. A company’s internal control over financial reporting includes those policies and procedures that (1) pertain to the maintenance of records that, in reasonable detail, accurately and fairly reflect the transactions and dispositions of the assets of the company; (2) provide reasonable assurance that transactions are recorded as necessary to permit preparation of financial statements in accordance with generally accepted accounting principles, and that receipts and expenditures of the company are being made only in accordance with authorizations of management and directors of the company; and (3) provide reasonable assurance regarding prevention or timely detection of unauthorized acquisition, use, or disposition of the company’s assets that could have a material effect on the financial statements.
Because of its inherent limitations, internal control over financial reporting may not prevent or detect misstatements. Also, projections of any evaluation of effectiveness to future periods are subject to the risk that controls may become inadequate because of changes in conditions, or that the degree of compliance with the policies or procedures may deteriorate.
Critical Audit Matter
The critical audit matter communicated below is a matter arising from the current period audit of the consolidated financial statements that was communicated or required to be communicated to the audit committee and that: (1) relates to accounts or disclosures that are material to the consolidated financial statements and (2) involved our especially challenging, subjective, or complex judgment.judgments. The communication of a critical audit matter does not alter in any way our opinion on the consolidated financial statements, taken as a whole, and we are not, by communicating the critical audit matter below, providing a separate opinion on the critical audit matter or on the accounts or disclosures to which it relates.
Evaluation of inventory excess and obsolescence
As discussed in notes 2 and 3 to the consolidated financial statements, the Company’s net inventories were $99.2$111.7 million as of December 26, 2020,30, 2023, and inventory write-downs totaled $13.1$15.0 million for the year ended December 26, 2020. The30, 2023. The Company states its inventories at the lower of cost or net realizable value. The Company records an adjustment to the cost basis of inventory when evidence exists that the net realizable value of inventory is lower than its cost, which occurs when the Company has excess and/or obsolete inventory. The Company’s model to estimate the excess and/or obsolete inventory is based on an analysis of existing inventory quantities compared to estimated future consumption. Future consumption is estimated based upon assumptions about how past consumption, recent purchases, backlog or other factors indicate future consumption.
We identified the evaluation of inventory excess and obsolescence as a critical audit matter. Complex auditor judgment was required to evaluate that past consumption, recent purchases, or backlog accurately indicatecertain assumptions used to estimate future consumption of inventory in the Company’s model, specifically qualitative other factors that have a high degree of subjectivity and thus meetare based on the accounting objectiveoutcome of recording inventory at the lower of its cost or net realizable value.uncertain future events.
The following are the primary procedures we performed to address this critical audit matter. We evaluated the design and tested the operating effectiveness of certain internal controls related to the critical audit matter.Company’s process to estimate inventory excess and obsolescence. This included controls related to the Company’s process to develop thedevelopment of certain assumptions used to predictestimate future consumption of inventory. Weinventory, including qualitative other factors.We assessed the Company’s assumptions about how past consumption, recent purchases, or backlog indicateused to estimate future consumption of inventory, including qualitative other factors by: (1) Evaluating
•evaluating historical cumulative write down trends and relevant changes to the overall business environment, including key customers and product lines in order to evaluate
•evaluating the Company’s methodology thatability to accurately estimate future consumption by comparing certain assumptions made in prior year to actual past consumption history, recent purchases, or backlog are relevant as predictorsresults in the subsequent period
•performing inquiries with nonfinancial personnel, including sales and production employees, for a selection of futureproducts within inventory consumption, and (2) Selectingfor which the Company recorded an adjustment to the cost basis based on qualitative other factors
•selecting a sample of products within inventory for which the Company recorded an adjustment to the cost basis based on qualitative other factors and for each sample selection, (a) evaluating how past consumption, recent purchases, we inspected internal and/or backlog indicate future consumption ofexternal information underlying the specific sampled inventory product,qualitative other factors and (b) recalculatingrecalculated the Company’s estimate of the cumulative inventory write-downs based on the actual quantity of product on hand compared to the estimate of future consumption.
/s/ KPMG LLP
We have served as the Company’s auditor since 2013.
Portland, Oregon
February 22, 202123, 2024
FORMFACTOR, INC.
CONSOLIDATED BALANCE SHEETS
| | | | | | | | | | | |
| December 26, 2020 | | December 28, 2019 |
| | (In thousands, except share
and per share data) |
| ASSETS | | | |
| Current assets: | | | |
| Cash and cash equivalents | $ | 187,225 | | | $ | 144,545 | |
| Marketable securities | 67,810 | | | 76,327 | |
| Accounts receivable, net | 107,603 | | | 97,868 | |
| Inventories, net | 99,229 | | | 83,258 | |
| Restricted cash | 1,904 | | | 1,981 | |
| | | |
| Prepaid expenses and other current assets | 23,303 | | | 15,064 | |
| Total current assets | 487,074 | | | 419,043 | |
| Restricted cash | 1,969 | | | 1,411 | |
| Operating lease, right-of-use-assets | 30,756 | | | 31,420 | |
| Property, plant and equipment, net | 104,103 | | | 58,747 | |
| Goodwill | 212,761 | | | 199,196 | |
| Intangibles, net | 59,147 | | | 57,610 | |
| Deferred tax assets | 66,242 | | | 71,252 | |
| Other assets | 1,165 | | | 1,203 | |
| Total assets | $ | 963,217 | | | $ | 839,882 | |
| LIABILITIES AND STOCKHOLDERS' EQUITY | | | |
| Current liabilities: | | | |
| Accounts payable | $ | 62,045 | | | $ | 40,914 | |
| Accrued liabilities | 55,342 | | | 36,439 | |
| Current portion of term loans, net of unamortized issuance cost of $5 and $29 | 9,516 | | | 42,846 | |
| Deferred revenue | 20,964 | | | 9,810 | |
| Operating lease liabilities | 6,704 | | | 6,551 | |
| Total current liabilities | 154,571 | | | 136,560 | |
| Term loans, less current portion, net of unamortized issuance cost of $70 and $0 | 24,978 | | | 15,639 | |
| Deferred tax liabilities | 5,346 | | | 6,986 | |
| Long-term operating lease liabilities | 27,996 | | | 29,088 | |
| Other liabilities | 6,242 | | | 10,612 | |
| Total liabilities | 219,133 | | | 198,885 | |
| | | |
| Stockholders' equity: | | | |
| Preferred stock, $0.001 par value: | | | |
| 10,000,000 shares authorized; 0 shares issued and outstanding | 0 | | | 0 | |
| Common stock, $0.001 par value: | | | |
| 250,000,000 shares authorized; 77,437,997 and 75,764,990 shares issued and outstanding | 78 | | | 76 | |
| Additional paid-in capital | 903,838 | | | 885,821 | |
| Accumulated other comprehensive income (loss) | 5,886 | | | (659) | |
| Accumulated deficit | (165,718) | | | (244,241) | |
| Total stockholders' equity | 744,084 | | | 640,997 | |
| Total liabilities and stockholders' equity | $ | 963,217 | | | $ | 839,882 | |
| | | | | | | | | | | |
| December 30, 2023 | | December 31, 2022 |
| | | |
| | (In thousands, except share and per share data) |
| ASSETS | | | |
| Current assets: | | | |
| Cash and cash equivalents | $ | 177,812 | | | $ | 109,130 | |
| Marketable securities | 150,507 | | | 129,006 | |
| Accounts receivable, net | 102,957 | | | 88,143 | |
| Inventories, net | 111,685 | | | 123,157 | |
| Restricted cash | 1,152 | | | 1,221 | |
| | | |
| Prepaid expenses and other current assets | 29,667 | | | 23,895 | |
| Total current assets | 573,780 | | | 474,552 | |
| Restricted cash | 2,309 | | | 2,631 | |
| Operating lease, right-of-use-assets | 30,519 | | | 31,362 | |
| Property, plant and equipment, net | 204,399 | | | 189,848 | |
| Goodwill | 201,090 | | | 211,444 | |
| Intangibles, net | 12,938 | | | 26,751 | |
| Deferred tax assets | 78,964 | | | 67,646 | |
| Other assets | 2,795 | | | 3,994 | |
| Total assets | $ | 1,106,794 | | | $ | 1,008,228 | |
| LIABILITIES AND STOCKHOLDERS' EQUITY | | | |
| Current liabilities: | | | |
| Accounts payable | $ | 63,857 | | | $ | 69,308 | |
| Accrued liabilities | 41,037 | | | 42,115 | |
| Current portion of term loans, net of unamortized issuance cost of $5 and $5 | 1,075 | | | 1,045 | |
| Deferred revenue | 16,704 | | | 29,846 | |
| Operating lease liabilities | 8,422 | | | 7,353 | |
| Total current liabilities | 131,095 | | | 149,667 | |
| Term loans, less current portion, net of unamortized issuance cost of $55 and $60 | 13,314 | | | 14,389 | |
| Deferred tax liabilities | — | | | 2,732 | |
| Long-term operating lease liabilities | 25,334 | | | 27,587 | |
| Deferred grant | 18,000 | | | — | |
| Other liabilities | 10,247 | | | 5,568 | |
| Total liabilities | 197,990 | | | 199,943 | |
| | | |
| Stockholders’ equity: | | | |
| Preferred stock, $0.001 par value: | | | |
| 10,000,000 shares authorized; no shares issued and outstanding | — | | | — | |
| Common stock, $0.001 par value: | | | |
| 250,000,000 shares authorized; 77,376,903 and 76,914,590 shares issued and outstanding | 77 | | | 77 | |
| Additional paid-in capital | 861,448 | | | 844,842 | |
| Accumulated other comprehensive loss | (4,052) | | | (5,578) | |
| Accumulated income (deficit) | 51,331 | | | (31,056) | |
| Total stockholders’ equity | 908,804 | | | 808,285 | |
| Total liabilities and stockholders’ equity | $ | 1,106,794 | | | $ | 1,008,228 | |
The accompanying notes are an integral part of these consolidated financial statements.
FORMFACTOR, INC.
CONSOLIDATED STATEMENTS OF INCOME
| | | | | | | | | | | | | | | | | |
| | Fiscal Year Ended |
| | December 26, 2020 | | December 28, 2019 | | December 29, 2018 |
| | (In thousands, except per share data) |
| Revenues | $ | 693,616 | | | $ | 589,464 | | | $ | 529,675 | |
| Cost of revenues | 405,696 | | | 351,968 | | | 319,336 | |
| Gross profit | 287,920 | | | 237,496 | | | 210,339 | |
| Operating expenses: | | | | | |
| Research and development | 89,034 | | | 81,499 | | | 74,976 | |
| Selling, general and administrative | 115,098 | | | 106,335 | | | 99,254 | |
| | | | | |
| | | | | |
| | | | | |
| | | | | |
| Total operating expenses | 204,132 | | | 187,834 | | | 174,230 | |
| Operating income | 83,788 | | | 49,662 | | | 36,109 | |
| Interest income | 1,501 | | | 2,714 | | | 1,356 | |
| Interest expense | (864) | | | (1,915) | | | (3,314) | |
| Other income (expense), net | 750 | | | 602 | | | (224) | |
| Income before income taxes | 85,175 | | | 51,063 | | | 33,927 | |
| Provision (benefit) for income taxes | 6,652 | | | 11,717 | | | (70,109) | |
| Net income | $ | 78,523 | | | $ | 39,346 | | | $ | 104,036 | |
| Net income per share: | | | | | |
| Basic | $ | 1.02 | | | $ | 0.52 | | | $ | 1.42 | |
| Diluted | $ | 0.99 | | | $ | 0.51 | | | $ | 1.38 | |
| Weighted-average number of shares used in per share calculations: | | | | | |
| Basic | 76,681 | | | 74,994 | | | 73,482 | |
| Diluted | 79,001 | | | 77,286 | | | 75,182 | |
| | | | | | | | | | | | | | | | | |
| | Fiscal Year Ended |
| | December 30, 2023 | | December 31, 2022 | | December 25, 2021 |
| | | | | |
| | (In thousands, except per share data) |
| Revenues | $ | 663,102 | | | $ | 747,937 | | | $ | 769,674 | |
| Cost of revenues | 404,522 | | | 451,928 | | | 446,907 | |
| Gross profit | 258,580 | | | 296,009 | | | 322,767 | |
| Operating expenses: | | | | | |
| Research and development | 115,765 | | | 109,222 | | | 100,937 | |
| Selling, general and administrative | 133,012 | | | 131,875 | | | 123,792 | |
| | | | | |
| Total operating expenses | 248,777 | | | 241,097 | | | 224,729 | |
| Gain on sale of business | 72,953 | | | — | | | — | |
| Operating income | 82,756 | | | 54,912 | | | 98,038 | |
| Interest income | 7,217 | | | 2,220 | | | 569 | |
| Interest expense | (421) | | | (579) | | | (602) | |
| Other income (expense), net | (285) | | | 1,317 | | | 495 | |
| Income before income taxes | 89,267 | | | 57,870 | | | 98,500 | |
| Provision for income taxes | 6,880 | | | 7,132 | | | 14,576 | |
| Net income | $ | 82,387 | | | $ | 50,738 | | | $ | 83,924 | |
| Net income per share: | | | | | |
| Basic | $ | 1.06 | | | $ | 0.65 | | | $ | 1.08 | |
| Diluted | $ | 1.05 | | | $ | 0.65 | | | $ | 1.06 | |
| Weighted-average number of shares used in per share calculations: | | | | | |
| Basic | 77,370 | | | 77,578 | | | 77,787 | |
| Diluted | 78,159 | | | 78,201 | | | 79,133 | |
The accompanying notes are an integral part of these consolidated financial statements.
FORMFACTOR, INC.
CONSOLIDATED STATEMENTS OF COMPREHENSIVE INCOME
| | Fiscal Year Ended | | | Fiscal Year Ended |
| December 30, 2023 | | | December 30, 2023 | | December 31, 2022 | | December 25, 2021 |
| | Fiscal Year Ended |
| December 26, 2020 | | December 28, 2019 | | December 29, 2018 |
| (In thousands) |
| (In thousands) | |
| (In thousands) | |
| (In thousands) | |
| Net income | Net income | $ | 78,523 | | | $ | 39,346 | | | $ | 104,036 | |
| Other comprehensive income (loss), net of tax: | Other comprehensive income (loss), net of tax: | |
| Translation adjustments and other | 5,131 | | | (1,028) | | | (1,902) | |
| Translation adjustments | |
| Translation adjustments | |
| Translation adjustments | |
| Unrealized gains (losses) on available-for-sale marketable securities | Unrealized gains (losses) on available-for-sale marketable securities | 226 | | | 316 | | | (8) | |
| Unrealized gains (losses) on derivative instruments | Unrealized gains (losses) on derivative instruments | 1,188 | | | (727) | | | (331) | |
| Other comprehensive income (loss), net of tax | Other comprehensive income (loss), net of tax | 6,545 | | | (1,439) | | | (2,241) | |
| Comprehensive income | Comprehensive income | $ | 85,068 | | | $ | 37,907 | | | $ | 101,795 | |
The accompanying notes are an integral part of these consolidated financial statements.
FORMFACTOR, INC.
CONSOLIDATED STATEMENTS OF STOCKHOLDERS' EQUITY
| | | | | | | | | | | | | | | | | | | | | | | | | | | | | | | | | | | |
| | Common Stock | | Additional Paid-in Capital | | Accumulated Other Comprehensive Income (Loss) | | Accumulated Deficit | | Total |
| |
| | Shares | | Amount |
| | (In thousands, except shares) |
| Balances, December 30, 2017 | 72,532,176 | | | $ | 73 | | | $ | 843,116 | | | $ | 3,021 | | | $ | (387,573) | | | $ | 458,637 | |
| Issuance of common stock under the Employee Stock Purchase Plan | 610,297 | | | 1 | | | 6,661 | | | — | | | — | | | 6,662 | |
| Issuance of common stock pursuant to exercise of options for cash | 134,609 | | | — | | | 1,158 | | | — | | | — | | | 1,158 | |
| Issuance of common stock pursuant to vesting of restricted stock units, net of stock withheld for tax | 862,630 | | | — | | | (5,791) | | | — | | | — | | | (5,791) | |
| | | | | | | | | | | |
| Stock-based compensation | — | | | — | | | 17,753 | | | — | | | — | | | 17,753 | |
| ASU 2017-12 Adoption | — | | | — | | | — | | | — | | | (50) | | | (50) | |
| Other comprehensive loss | — | | | — | | | — | | | (2,241) | | | — | | | (2,241) | |
| Net income | — | | | — | | | — | | | — | | | 104,036 | | | 104,036 | |
| Balances, December 29, 2018 | 74,139,712 | | | 74 | | | 862,897 | | | 780 | | | (283,587) | | | 580,164 | |
| Issuance of common stock under the Employee Stock Purchase Plan | 544,271 | | | 1 | | | 6,806 | | | — | | | — | | | 6,807 | |
| Issuance of common stock pursuant to exercise of options for cash | 162,956 | | | — | | | 1,176 | | | — | | | — | | | 1,176 | |
| Issuance of common stock pursuant to vesting of restricted stock units, net of stock withheld for tax | 918,051 | | | 1 | | | (8,026) | | | — | | | — | | | (8,025) | |
| | | | | | | | | | | |
| Stock-based compensation | — | | | — | | | 22,968 | | | — | | | — | | | 22,968 | |
| Other comprehensive loss | — | | | — | | | — | | | (1,439) | | | — | | | (1,439) | |
| Net income | — | | | — | | | — | | | — | | | 39,346 | | | 39,346 | |
| Balances, December 28, 2019 | 75,764,990 | | | 76 | | | 885,821 | | | (659) | | | (244,241) | | | 640,997 | |
| Issuance of common stock under the Employee Stock Purchase Plan | 485,566 | | | | | 7,875 | | | — | | | — | | | 7,875 | |
| Issuance of common stock pursuant to exercise of options for cash | 255,769 | | | 1 | | | 2,134 | | | — | | | — | | | 2,135 | |
| Issuance of common stock pursuant to vesting of restricted stock units, net of stock withheld for tax | 931,672 | | | 1 | | | (15,451) | | | — | | | — | | | (15,450) | |
| | | | | | | | | | | |
| Stock-based compensation | — | | | — | | | 23,459 | | | — | | | — | | | 23,459 | |
| Other comprehensive income | — | | | — | | | — | | | 6,545 | | | — | | | 6,545 | |
| Net income | — | | | — | | | — | | | — | | | 78,523 | | | 78,523 | |
| Balances, December 26, 2020 | 77,437,997 | | | $ | 78 | | | $ | 903,838 | | | $ | 5,886 | | | $ | (165,718) | | | $ | 744,084 | |
| | | | | | | | | | | | | | | | | | | | | | | | | | | | | | | | | | | |
| | Common Stock | | Additional Paid-in Capital | | Accumulated Other Comprehensive Income (Loss) | | Accumulated Income (Deficit) | | Total |
| |
| | Shares | | Amount |
| | | | | | | | | | | |
| | (In thousands, except shares) |
| Balances, December 26, 2020 | 77,437,997 | | | $ | 78 | | | $ | 903,838 | | | $ | 5,886 | | | $ | (165,718) | | | $ | 744,084 | |
| Issuance of common stock under the Employee Stock Purchase Plan | 378,584 | | | — | | | 9,809 | | | — | | | — | | | 9,809 | |
| Issuance of common stock pursuant to exercise of options for cash | 100,000 | | | — | | | 844 | | | — | | | — | | | 844 | |
| Issuance of common stock pursuant to vesting of restricted stock units, net of stock withheld for tax | 946,325 | | | 1 | | | (20,604) | | | — | | | — | | | (20,603) | |
| Purchase and retirement of common stock | (622,400) | | | (1) | | | (24,037) | | | — | | | — | | | (24,038) | |
| Stock-based compensation | — | | | — | | | 29,095 | | | — | | | — | | | 29,095 | |
| Other comprehensive loss | — | | | — | | | — | | | (7,335) | | | — | | | (7,335) | |
| Net income | — | | | — | | | — | | | — | | | 83,924 | | | 83,924 | |
| Balances, December 25, 2021 | 78,240,506 | | | 78 | | | 898,945 | | | (1,449) | | | (81,794) | | | 815,780 | |
| Issuance of common stock under the Employee Stock Purchase Plan | 316,861 | | | — | | | 10,457 | | | — | | | — | | | 10,457 | |
| Issuance of common stock pursuant to exercise of options for cash | 6,000 | | | — | | | 42 | | | — | | | — | | | 42 | |
| Issuance of common stock pursuant to vesting of restricted stock units, net of stock withheld for tax | 728,524 | | | 1 | | | (15,706) | | | — | | | — | | | (15,705) | |
| Purchase and retirement of common stock | (2,377,301) | | | (2) | | | (82,326) | | | — | | | — | | | (82,328) | |
| Stock-based compensation | — | | | — | | | 33,430 | | | — | | | — | | | 33,430 | |
| Other comprehensive loss | — | | | — | | | — | | | (4,129) | | | — | | | (4,129) | |
| Net income | — | | | — | | | — | | | — | | | 50,738 | | | 50,738 | |
| Balances, December 31, 2022 | 76,914,590 | | | 77 | | | 844,842 | | | (5,578) | | | (31,056) | | | 808,285 | |
| Issuance of common stock under the Employee Stock Purchase Plan | 363,190 | | | — | | | 8,822 | | | — | | | — | | | 8,822 | |
| | | | | | | | | | | |
| Issuance of common stock pursuant to vesting of restricted stock units, net of stock withheld for tax | 635,495 | | | 1 | | | (10,688) | | | — | | | — | | | (10,687) | |
| Purchase and retirement of common stock | (536,372) | | | (1) | | | (19,800) | | | — | | | — | | | (19,801) | |
| Stock-based compensation | — | | | — | | | 38,272 | | | — | | | — | | | 38,272 | |
| Other comprehensive income | — | | | — | | | — | | | 1,526 | | | — | | | 1,526 | |
| Net income | — | | | — | | | — | | | — | | | 82,387 | | | 82,387 | |
| Balances, December 30, 2023 | 77,376,903 | | | $ | 77 | | | $ | 861,448 | | | $ | (4,052) | | | $ | 51,331 | | | $ | 908,804 | |
The accompanying notes are an integral part of these consolidated financial statements.
FORMFACTOR, INC.
CONSOLIDATED STATEMENTS OF CASH FLOWS
| | | | | | | | | | | | | | | | | |
| | Fiscal Year Ended |
| | December 26, 2020 | | December 28, 2019 | | December 29, 2018 |
| | (In thousands) |
| Cash flows from operating activities: | | | | | |
| Net income | $ | 78,523 | | | $ | 39,346 | | | $ | 104,036 | |
| Adjustments to reconcile net income to net cash provided by operating activities: | | | | | |
| Depreciation | 20,694 | | | 17,185 | | | 14,314 | |
| Amortization | 27,991 | | | 27,672 | | | 29,373 | |
| Accretion of discount on investments | (2) | | | (365) | | | (10) | |
| Reduction in the carrying amount of right-of-use assets | 5,955 | | | 5,269 | | | 0 | |
| Stock-based compensation expense | 23,830 | | | 23,176 | | | 17,827 | |
| Amortization of debt issuance costs | 32 | | | 160 | | | 390 | |
| Deferred income tax provision (benefit) | (562) | | | 4,954 | | | (74,908) | |
| | | | | |
| Provision for excess and obsolete inventories | 13,117 | | | 10,421 | | | 10,479 | |
| Acquired inventory step-up amortization | 838 | | | 465 | | | 0 | |
| Loss on disposal of long-lived assets | 451 | | | 486 | | | 325 | |
| Gain on contingent consideration | (2,879) | | | 0 | | | 0 | |
| Foreign currency transaction losses (gains) | (968) | | | 408 | | | 125 | |
| Loss on derivative instruments | 372 | | | 110 | | | 0 | |
| Changes in assets and liabilities: | | | | | |
| Accounts receivable | (3,545) | | | 481 | | | (13,830) | |
| Inventories | (22,191) | | | (14,295) | | | (21,298) | |
| Prepaid expenses and other current assets | (6,207) | | | 230 | | | 1,204 | |
| | | | | |
| Other assets | 179 | | | (441) | | | 707 | |
| Accounts payable | 16,788 | | | (27) | | | 3,050 | |
| Accrued liabilities | 13,892 | | | 7,517 | | | (6,219) | |
| | | | | |
| Other liabilities | 362 | | | 166 | | | 3,109 | |
| Deferred revenues | 8,901 | | | 3,130 | | | 26 | |
| Operating lease liabilities | (6,315) | | | (5,000) | | | 0 | |
| Net cash provided by operating activities | 169,256 | | | 121,048 | | | 68,700 | |
| Cash flows from investing activities: | | | | | |
| Acquisition of property, plant and equipment | (55,865) | | | (20,847) | | | (19,869) | |
| Acquisition of business, net of cash acquired | (51,880) | | | (20,524) | | | 0 | |
| Proceeds from sale of subsidiary | 82 | | | 132 | | | 94 | |
| Proceeds from sale of property and property, plant and equipment | 0 | | | 0 | | | 23 | |
| Purchases of marketable securities | (51,224) | | | (76,327) | | | (30,566) | |
| Proceeds from maturities of marketable securities | 59,965 | | | 51,214 | | | 29,023 | |
| | | | | |
| Net cash used in investing activities | (98,922) | | | (66,352) | | | (21,295) | |
| Cash flows from financing activities: | | | | | |
| Proceeds from issuances of common stock | 10,010 | | | 8,093 | | | 7,712 | |
| | | | | |
| Tax withholdings related to net share settlements of equity awards | (15,450) | | | (8,025) | | | (5,791) | |
| Proceeds from term loan | 18,000 | | | 23,354 | | | 0 | |
| Payments on term loan | (43,417) | | | (30,000) | | | (41,250) | |
| Payment of term loan issuance costs | (78) | | | 0 | | | 0 | |
| | | | | |
| Net cash used in financing activities | (30,935) | | | (6,578) | | | (39,329) | |
| Effect of exchange rate changes on cash, cash equivalents and restricted cash | 3,762 | | | (727) | | | (256) | |
| Net increase in cash, cash equivalents and restricted cash | 43,161 | | | 47,391 | | | 7,820 | |
| Cash, cash equivalents and restricted cash, beginning of year | 147,937 | | | 100,546 | | | 92,726 | |
| Cash, cash equivalents and restricted cash, end of year | $ | 191,098 | | | $ | 147,937 | | | $ | 100,546 | |
| | | | | |
| The accompanying notes are an integral part of these consolidated financial statements. |
| | | | | |
| | | | | |
| | | | | | | | | | | | | | | | | |
| | Fiscal Year Ended |
| | December 30, 2023 | | December 31, 2022 | | December 25, 2021 |
| | | | | |
| | (In thousands) |
| Cash flows from operating activities: | | | | | |
| Net income | $ | 82,387 | | | $ | 50,738 | | | $ | 83,924 | |
| Adjustments to reconcile net income to net cash provided by operating activities: | | | | | |
| Depreciation | 30,603 | | | 28,646 | | | 25,772 | |
| Amortization | 6,850 | | | 9,391 | | | 18,747 | |
| Amortization (accretion) of discount on investments | (2,828) | | | 182 | | | 403 | |
| Reduction in the carrying amount of right-of-use assets | 7,389 | | | 8,153 | | | 7,172 | |
| Stock-based compensation expense | 38,616 | | | 31,337 | | | 29,384 | |
| | | | | |
| Deferred income tax provision (benefit) | (12,100) | | | (6,343) | | | 3,869 | |
| Gain on sale of business | (72,953) | | | — | | | — | |
| Provision for excess and obsolete inventories | 15,003 | | | 24,632 | | | 15,544 | |
| Acquired inventory step-up amortization | 501 | | | 476 | | | 723 | |
| Loss on disposal of long-lived assets | — | | | 296 | | | 449 | |
| Non-cash restructuring charges | — | | | 200 | | | 1,646 | |
| Gain on contingent consideration | — | | | — | | | (95) | |
| Foreign currency transaction losses | 2,282 | | | 2,251 | | | 1,582 | |
| Other than temporary impairment on debt receivable | 1,083 | | | — | | | — | |
| Changes in assets and liabilities: | | | | | |
| Accounts receivable | (23,304) | | | 26,028 | | | (9,086) | |
| Inventories | (9,488) | | | (28,780) | | | (31,655) | |
| Prepaid expenses and other current assets | (3,057) | | | (4,591) | | | 3,808 | |
| | | | | |
| Other assets | (146) | | | 66 | | | (326) | |
| Accounts payable | 1,319 | | | 3,899 | | | (6,589) | |
| Accrued liabilities | (2,424) | | | (8,002) | | | (725) | |
| | | | | |
| Other liabilities | 4,660 | | | (63) | | | 285 | |
| Deferred revenues | (10,176) | | | 1,286 | | | 1,974 | |
| Deferred grant | 18,000 | | | — | | | — | |
| Operating lease liabilities | (7,615) | | | (8,016) | | | (7,442) | |
| Net cash provided by operating activities | 64,602 | | | 131,786 | | | 139,364 | |
| Cash flows from investing activities: | | | | | |
| Acquisition of property, plant and equipment | (56,027) | | | (65,254) | | | (66,496) | |
| Acquisition of business, net of cash acquired | — | | | (3,350) | | | — | |
| Proceeds from sale of business | 101,785 | | | — | | | — | |
| Purchase of promissory note receivable | — | | | (1,000) | | | — | |
| Purchases of marketable securities | (135,462) | | | (101,894) | | | (149,979) | |
| Proceeds from maturities of marketable securities | 118,753 | | | 95,794 | | | 91,734 | |
| | | | | |
| Net cash provided by (used in) investing activities | 29,049 | | | (75,704) | | | (124,741) | |
| Cash flows from financing activities: | | | | | |
| Proceeds from issuances of common stock | 8,822 | | | 10,499 | | | 10,653 | |
| Purchase of common stock through stock repurchase program | (19,801) | | | (82,328) | | | (24,038) | |
| Tax withholdings related to net share settlements of equity awards | (10,687) | | | (15,705) | | | (20,604) | |
| | | | | |
| Payments on term loan | (1,045) | | | (8,398) | | | (9,337) | |
| | | | | |
| Payment of contingent consideration | — | | | — | | | (3,873) | |
| | | | | |
| Net cash used in financing activities | (22,711) | | | (95,932) | | | (47,199) | |
| Effect of exchange rate changes on cash, cash equivalents and restricted cash | (2,649) | | | (2,510) | | | (3,180) | |
| Net increase (decrease) in cash, cash equivalents and restricted cash | 68,291 | | | (42,360) | | | (35,756) | |
| Cash, cash equivalents and restricted cash, beginning of year | 112,982 | | | 155,342 | | | 191,098 | |
| Cash, cash equivalents and restricted cash, end of year | $ | 181,273 | | | $ | 112,982 | | | $ | 155,342 | |
| | | | | |
| | | | | |
| The accompanying notes are an integral part of these consolidated financial statements. |
| | | | | |
| | | | | |
| | | | | |
| | | | | |
| | FORMFACTOR, INC. | | FORMFACTOR, INC. | |
| FORMFACTOR, INC. | |
| CONSOLIDATED STATEMENTS OF CASH FLOWS | CONSOLIDATED STATEMENTS OF CASH FLOWS | CONSOLIDATED STATEMENTS OF CASH FLOWS |
| | Fiscal Year Ended | |
| Fiscal Year Ended | |
| Fiscal Year Ended | |
| December 30, 2023 | | | December 30, 2023 | | December 31, 2022 | | December 25, 2021 |
| | Fiscal Year Ended |
| December 26, 2020 | | December 28, 2019 | | December 29, 2018 |
| (In thousands) |
| (In thousands) | |
| (In thousands) | |
| (In thousands) | |
| Supplemental disclosure of non-cash investing and financing activities: | Supplemental disclosure of non-cash investing and financing activities: | | | | | | Supplemental disclosure of non-cash investing and financing activities: | | | |
| Operating lease, right-of-use assets obtained in exchange for lease obligations | Operating lease, right-of-use assets obtained in exchange for lease obligations | $ | 1,912 | | | $ | 36,709 | | | $ | 0 | |
| | Contingent consideration payable related to FRT acquisition | 0 | | | 5,364 | | | 0 | |
| Change in accounts payable and accrued liabilities related to property, plant and equipment purchases | 2,545 | | | 866 | | | 2,290 | |
| Increase (decrease) in accounts payable and accrued liabilities related to property, plant and equipment purchases | |
| Increase (decrease) in accounts payable and accrued liabilities related to property, plant and equipment purchases | |
| Increase (decrease) in accounts payable and accrued liabilities related to property, plant and equipment purchases | |
| | Supplemental disclosure of cash flow information: | Supplemental disclosure of cash flow information: | | | | | |
| Supplemental disclosure of cash flow information: | |
| Supplemental disclosure of cash flow information: | | | | |
| Income taxes paid, net | Income taxes paid, net | $ | 9,150 | | | $ | 4,324 | | | $ | 4,576 | |
| Cash paid for interest | 867 | | | 1,405 | | | 3,113 | |
| Cash paid for interest, net | |
| Operating cash outflows from operating leases | |
| | Reconciliation of cash, cash equivalents and restricted cash: | Reconciliation of cash, cash equivalents and restricted cash: | |
| Reconciliation of cash, cash equivalents and restricted cash: | |
| Reconciliation of cash, cash equivalents and restricted cash: | |
| Cash and cash equivalents | |
| Cash and cash equivalents | |
| Cash and cash equivalents | Cash and cash equivalents | $ | 187,225 | | | $ | 144,545 | | | $ | 98,472 | |
| Restricted cash, current | Restricted cash, current | 1,904 | | | 1,981 | | | 849 | |
| Restricted cash | Restricted cash | 1,969 | | | 1,411 | | | 1,225 | |
| Total cash, cash equivalents and restricted cash | Total cash, cash equivalents and restricted cash | $ | 191,098 | | | $ | 147,937 | | | $ | 100,546 | |
| |
The accompanying notes are an integral part of these consolidated financial statements.
FORMFACTOR, INC.
NOTES TO CONSOLIDATED FINANCIAL STATEMENTS
Note 1—Formation and Nature of Business
FormFactor, Inc. was incorporated in Delaware on April 15, 1993 and is headquartered in Livermore, California. We are a leading provider of essential test and measurement technologies.technologies along the full semiconductor product lifecycle - from characterization, modeling, reliability, and design de-bug, to qualification and production test. We provide a broad range of high-performance probe cards, analytical probes, probe stations, metrology systems, thermal systems, and cryogenic systems to both semiconductor companies and scientific institutions. Our products provide electrical and physical information from a variety of semiconductor and electro-optical devices and integrated circuits from early research, through development, to high-volume production. Customers use our products and services to lower production costs, improve yields,accelerate profitability by optimizing device performance, reducing scrap, and enable development of complex next generation products. We believe our technology leadership enables critical roadmap advances for our customers.improving yields.
Design, development and manufacturing operations are located in Livermore, San Jose, Carlsbad, and Baldwin Park, California,California; Beaverton, OregonOregon; Boulder, Colorado; and Boulder, Colorado,Woburn, Massachusetts, all in the United States and Bergisch Gladbach,States; Munich and Thiendorf, Germany, and sales, service and support operations are located in the United States, Germany, France, Italy, South Korea, Japan, Taiwan, China and Singapore.
Fiscal Year
Our fiscal year ends on the last Saturday in December. The fiscal years ended on December 26, 2020,30, 2023, December 28, 201931, 2022 and December 29, 2018, each25, 2021 consisted of 52 weeks, 53 weeks, and 52 weeks, respectively. The first three fiscal quarters in our fiscal year ended December 31, 2022 contained 13 weeks, and the fourth fiscal quarter contained 14 weeks.
Note 2—Summary of Significant Accounting Policies
Basis of Consolidation and Foreign Currency Translation
The consolidated financial statements include our accounts and those of our wholly-owned subsidiaries. All intercompany balances and transactions have been eliminated.
We completed the acquisitions of FRT GmbH ("FRT") on October 9, 2019, the probe card assets of Advantest Corporation ("Baldwin Park") on July 30, 2020, and High Precision Devises, Inc. ("HPD") on October 19, 2020. Accordingly, our Consolidated Statements of Income include the results of operations of FRT, Baldwin Park, and HPD since those dates. See Note 4, Acquisitions.
The functional currencies of certain of our foreign subsidiaries are the local currencies and, accordingly, all assets and liabilities of these foreign operations are translated to U.S. Dollars at current period-end exchange rates, and revenues and expenses are translated to U.S. Dollars using average exchange rates in effect during the period. The gains and losses from the foreign currency translation of these subsidiaries' financial statements are included as a separate component of stockholders' equity on our Consolidated Balance Sheets under Accumulated other comprehensive income (loss).loss.
Certain other of our foreign subsidiaries use the U.S. Dollar as their functional currency. Accordingly, monetary assets and liabilities in non-functional currencies of these subsidiaries are remeasured using exchange rates in effect at the end of the period. Revenues and costs in local currency are remeasured using average exchange rates for the period, except for costs related to those balance sheet items that are remeasured using historical exchange rates. The resulting remeasurement gains and losses are included in the Consolidated Statements of Income as a component of Other income (expense), net as incurred.
Use of Estimates
The preparation of consolidated financial statements in conformity with accounting principles generally accepted in the United States of America ("GAAP"(“GAAP”) requires management to make estimates and assumptions that affect the reported amounts of assets and liabilities, the disclosure of contingent assets and liabilities at the date of the financial statements, and the reported amounts of revenues and expenses during the reporting period. Estimates may change as new information is obtained. We believe that the estimates, assumptions and judgments involved in revenue recognition, fair value of marketable securities, fair value of derivative financial instruments used to hedge both foreign currency and interest rate exposures, allowance for doubtful accounts,credit losses, reserves for product warranty, valuation of obsolete and slow moving inventory, assets acquired and liabilities assumed in business combinations, legal contingencies, valuation of goodwill, the assessment of recoverability of long-lived assets, valuation and recognition of stock-based compensation, loss contingencies, provision for income taxes and valuation of deferred tax assets have the greatest potential impact on our consolidated financial statements. Actual results could differ from those estimates.
FORMFACTOR, INC.
NOTES TO CONSOLIDATED FINANCIAL STATEMENTS (Continued)
Business Acquisitions
Our consolidated financial statements include the operations of acquired businesses after the completion of their respective acquisitions. We account for acquired businesses using the acquisition method of accounting, which requires, among other things, that assets acquired and liabilities assumed be recognized at their estimated fair values as of the acquisition date, and
FORMFACTOR, INC.
NOTES TO CONSOLIDATED FINANCIAL STATEMENTS (Continued)
that the fair value of acquired intangibles be recorded on the balance sheet. Transaction costs are expensed as incurred. Any excess of the purchase price over the assigned fair values of the net assets acquired is recorded as goodwill.
Cash and Cash Equivalents and Marketable Securities
Cash and cash equivalents consist of deposits and financial instruments which are readily convertible into cash and have original maturities of 90 days or less at the time of acquisition. Marketable securities consist primarily of highly liquid investments with maturities of greater than 90 days when purchased. We classify our available-for-sale marketable securities as available-for-sale and, accordingly,current assets because they represent investments of cash available for current operations. As a result, the Company recorded all its marketable securities in short-term investments regardless of the contractual maturity date of the securities. Furthermore, we report them at fair value with the related unrealized gains and losses included in Accumulated other comprehensive income (loss)loss in our Consolidated Balance Sheets. Any unrealized losses which are considered to be other-than-temporary are recorded in Other income (expense), net, in the Consolidated Statements of Income. Realized gains and losses on the sale of marketable securities are determined using the specific-identification method and recorded in Other income (expense), net, in the Consolidated Statements of Income.
All of our available-for-sale investments are subject to a periodic impairment review. If an available-for-sale debt security’s fair value is less than its amortized cost basis, then we evaluate whether the decline is the result of a credit loss, in which case an impairment is recorded through an allowance for credit losses. Unrealized gains and losses not attributable to credit losses are included, net of tax, in Accumulated other comprehensive income (loss)loss in our Consolidated Balance Sheets. We did not record an allowance for credit losses related to our available-for-sale investments during fiscal 2020.2023.
Foreign Exchange Management
We transact business in various foreign currencies. We enter into forward foreign exchange contracts in an effort to mitigate the risks associated with currency fluctuations on certain foreign currency balance sheet exposures and certain operational costs denominated in local currency impacting our statement of income. For accounting purposes, certain of our foreign currency forward contracts are not designated as hedging instruments and, accordingly, we record the fair value of these contracts as of the end of our reporting period in our Consolidated Balance Sheets with changes in fair value recorded within Other income (expense), net in our Consolidated Statements of Income for both realized and unrealized gains and losses. Certain of our foreign currency forward contracts are designated as cash flow hedges, and, accordingly, we record the fair value of these contracts as of the end of our reporting period in our Consolidated Balance Sheets with changes in fair value recorded as a component of accumulatedAccumulated other comprehensive income (loss)loss and reclassified into earnings in the same period in which the hedged transaction affects earnings, and in the same line item on the Consolidated Statements of Income as the impact of the hedge transaction. We do not use derivative financial instruments for trading or speculative purposes.
Accounts Receivable and Allowance for Doubtful AccountsCredit Losses
The majority of our accounts receivable are derived from sales to large multinational semiconductor manufacturers throughout the world, are recorded at their invoiced amount, and do not bear interest.
In order to monitor potential credit losses, we perform ongoing credit evaluations of our customers' financial condition. An allowance for doubtful accountscredit losses is maintained based upon our assessment of the expected collectability of all accounts receivable. The allowance for doubtful accountscredit losses is reviewed and assessed for adequacy on a quarterly basis. We take into consideration (1) any circumstances of which we are aware of a customer's inability to meet its financial obligations and (2) our judgments as to prevailing economic conditions in the industry and their impact on our customers. If circumstances change, and the financial condition of our customers is adversely affected and they are unable to meet their financial obligations, we may need to take additional allowances, which would result in an increase in our operating expense.
Activity related to our allowance for doubtful accounts receivablecredit losses was as follows (in thousands):
| | Fiscal Year Ended |
| December 26, 2020 | | December 28, 2019 | | December 29, 2018 |
| Fiscal Year Ended | | | Fiscal Year Ended |
| December 30, 2023 | | | December 30, 2023 | | December 31, 2022 | | December 25, 2021 |
| Balance at beginning of year | Balance at beginning of year | $ | 222 | | | $ | 185 | | | $ | 200 | |
| Charges (reversals) to costs and expenses | Charges (reversals) to costs and expenses | 26 | | | 37 | | | (15) | |
| Balance at end of year | Balance at end of year | $ | 248 | | | $ | 222 | | | $ | 185 | |
FORMFACTOR, INC.
NOTES TO CONSOLIDATED FINANCIAL STATEMENTS (Continued)
Inventories
We state our inventories at the lower of cost (principally standard cost which approximates actual cost on a first in, first out basis) or net realizable value. We continuallyregularly assess the value of our inventory and will periodically write down its value for
FORMFACTOR, INC.
NOTES TO CONSOLIDATED FINANCIAL STATEMENTS (Continued)
estimated excess inventory and product obsolescence based upon an analysis of existing inventory quantities compared to estimated future consumption. Future consumption is estimated based upon assumptions about how past consumption, recent purchases, backlog and other factors may indicate future consumption. On a quarterly basis, we review existing inventory quantities in comparison to our past consumption, recent purchases, backlog and other factors to determine what inventory quantities, if any, may not be sellable. Based on this analysis, we record an adjustment to the cost basis of inventory when evidence exists that the net realizable value of inventory is lower than its cost, which occurs when we have excess and/or obsolete inventory. Once the value is adjusted, the original cost of our inventory, less the related inventory write-down, represents the new cost basis. Reversal of these write downs is recognized only when the related inventory has been scrapped or sold. Shipping and handling costs are classified as a component of Cost of revenues in the Consolidated Statements of Income.
We design, manufacture and sell a custom product into a market that has been subject to cyclicality and significant demand fluctuations. Many of our products are complex, custom to a specific chip design and have to be delivered on short lead-times. Probe cards are manufactured in low volumes, but, for certain materials, the purchases are often subject to minimum order quantities in excess of the actual underlying probe card demand. It is not uncommon for us to acquire production materials and commence production activities based on estimated production yields and forecasted demand prior to, or in excess of, actual demand for our probe cards. These factors result in normal recurring inventory valuation charges to Cost of revenues.
Inventory write downs totaled $13.1$15.0 million, $10.4$24.6 million and $10.5$15.5 million for fiscal 2020, 20192023, 2022 and 2018,2021, respectively.
Restricted Cash
Restricted cash is comprised primarily of funds held by our foreign subsidiaries for employee obligations, office leases, customer deposits,environmental remediation, and temporary customs import permits and environmental remediation.
Property, Plant, and Equipment
Property, plant and equipment is stated at cost less accumulated depreciation and amortization. Depreciation is providedrecorded on a straight-line method. Machinery and equipment, computer equipment and software, and furniture and fixtures are depreciated over 13 to 5 years.
Leasehold improvements are amortized over the shorter of the lease term or the estimated useful life of the related asset.7 years. Building and building improvements are depreciated over 30 years. Construction-in-progress assets are not depreciated until the assets are placed in service. Upon sale or retirement of assets, the cost and related accumulated depreciation or amortization are removed from the Consolidated Balance Sheets and the resulting gain or loss, if any, is reflected in Operating income in our Consolidated Statements of Income.
Leases
The Company determines if an arrangement is a lease at its inception. Right-of-use (“ROU”) assets and liabilities are recognized at the lease commencement date based on the present value of lease payments over the lease term. We usesuse our estimated incremental borrowing rate in determining the present value of lease payments considering the term of the lease, which is derived from information available at the lease commencement date. The lease term includes renewal options when it is reasonably certain that the option will be exercised and excludes termination options. To the extent that the Company’s agreements have variable lease payments, the Company includes variable lease payments that depend on an index or a rate and excludes those that depend on facts or circumstances occurring after the commencement date, other than the passage of time.
Lease expense for these leases is recognized on a straight-line basis over the lease term. We have elected not to recognize ROU assets and lease liabilities that arise from short-term leases for any class of underlying asset. Operating leases are included in Operating lease, right-of-use-assets, Operating lease liabilities, and Long-term operating lease liabilities in our Consolidated Balance Sheets.
Goodwill
Goodwill represents the excess of the purchase price over the fair value of identifiable assets acquired and liabilities assumed. Goodwill is not amortized, rather assessed, at least annually, for impairment at a reporting unit level. Impairment of goodwill exists when the carrying amount of a reporting unit exceeds its fair value. A goodwill impairment loss is recognized for the amount that the carrying amount of the reporting unit, including goodwill, exceeds its fair value, limited to the total amount of goodwill allocated to that reporting unit. If the fair value of a reporting unit exceeds the carrying amount, goodwill of the reporting unit is not considered impaired.
FORMFACTOR, INC.
NOTES TO CONSOLIDATED FINANCIAL STATEMENTS (Continued)
We evaluate impairment by first assessing qualitative factors to determine whether it is necessary to perform a quantitative impairment test. If we determine, as a result of the qualitative assessment, that it is more likely than not that the fair value of a reporting unit is less than its carrying amount, then the quantitative impairment test is required. Otherwise, no further testing is required.
FORMFACTOR, INC.
NOTES TO CONSOLIDATED FINANCIAL STATEMENTS (Continued)
We perform our annual goodwill impairment test in the fourth quarter of each year by assessing qualitative factors, including, but not limited to, an assessment of our market capitalization, which was significantly higher than our book value. Based on these tests, we determined that the quantitative impairment test was not required and no impairment charges were recorded in fiscal 2020, 20192023, 2022 or 2018.2021.
The evaluation of goodwill for impairment requires the exercise of judgment. In the event of future changes in business conditions, we will be required to reassess and update our forecasts and estimates used in future impairment analysis. If the results of these analysis are lower than current estimates, a material impairment charge may result at that time.
See Note 9,11, Goodwill and Intangible Assets, for additional information.
Intangible Assets
Intangible assets consist of acquisition related intangible assets and intellectual property. The intangible assets are being amortized over periods of 1 to 10 years, which reflect the pattern in which economic benefits of the assets are expected to be realized. We perform a review of intangible assets when facts and circumstances indicate that the useful life is shorter than originally estimated or that the carrying amount of assets may not be recoverable. Such facts and circumstances include significant adverse changes in the business climate or legal factors; current period cash flow or operating losses combined with a history of losses or a forecast of continuing losses associated with the use of the intangible assets; and current expectation that the intangible assets will more likely than not be sold or disposed of before the end of their estimated useful lives. We assess the recoverability of identified intangible assets by comparing the projected undiscounted net cash flows associated with the related asset or group of assets over their remaining lives against their respective carrying amounts. Impairments, if any, are based on the excess of the carrying amount over the fair value of those assets.
See Note 9,11, Goodwill and Intangible Assets, for additional information.
Impairment of Long-Lived Assets
We test long-lived assets or asset groups, such as property, plant and equipment and intangible assets, for recoverability when events or changes in circumstances indicate that their carrying amounts may not be recoverable. Circumstances which could trigger a review include, but are not limited to: significant decreases in the market price of the asset; significant adverse changes in the business climate or legal factors; accumulation of costs significantly in excess of the amount originally expected for the acquisition or construction of the asset; current period cash flow or operating losses combined with a history of losses or a forecast of continuing losses associated with the use of the asset; and current expectation that the asset will more likely than not be sold or disposed of before the end of its estimated useful life.
Recoverability is assessed based on the carrying amounts of the asset or asset group and the sum of the undiscounted cash flows expected to result from the use and the eventual disposal of the asset. An impairment loss is recognized when the carrying amount is not recoverable and exceeds fair value.
Concentration of Credit Risk and Other Risks and Uncertainties
Financial instruments that potentially subject us to concentrations of credit risk consist primarily of cash equivalents, marketable securities and accounts receivable. Our cash equivalents and marketable securities are held in safekeeping by large, credit worthycredit-worthy financial institutions. We invest our excess cash primarily in U.S. banks, government and agency bonds, money market funds and corporate obligations. We have established guidelines relative to credit ratings, diversification and maturities that seek to maintain safety and liquidity. Deposits in these banks may exceed the amounts of insurance provided on such deposits. To date, we have not experienced any losses on our deposits of cash and cash equivalents. We market and sell our products to a relatively narrow base of customers and generally do not require collateral.
The following customers represented 10% or more of our revenues:
| | | | | | | | | | | | | | | | | |
| Fiscal Year Ended |
| December 30, 2023 | | December 31, 2022 | | December 25, 2021 |
| Intel Corporation | 17.1 | % | | 19.0 | % | | 20.4 | % |
| Samsung Electronics Co., LTD. | * | | * | | 11.4 | % |
| | | | | |
| | | | | |
* Less than 10% of revenues.
FORMFACTOR, INC.
NOTES TO CONSOLIDATED FINANCIAL STATEMENTS (Continued)
The following customers represented 10% or more of our revenues:
| | | | | | | | | | | | | | | | | |
| Fiscal Year Ended |
| December 26, 2020 | | December 28, 2019 | | December 29, 2018 |
| Intel Corporation | 31.5 | % | | 25.3 | % | | 19.0 | % |
| Samsung Electronics., LTD. | * | | 11.5 | | | * |
| | | | | |
| | | | | |
* Less than 10% of revenues.
At December 26, 2020,30, 2023, two customers accounted for 15.3%17.8% and 13.7%11.0% of gross accounts receivable, respectively.receivable. At December 28, 2019, three customers31, 2022, one customer accounted for 25.7%, 15.1%, and 11.5%13.8% of gross accounts receivable, respectively.receivable. No other customers accounted for 10% or more of gross accounts receivable for these fiscal period ends.
We are exposed to non-performance risk by counterparties on our derivative instruments used in hedging activities. We seek to minimize risk by diversifying our hedging program across multiple financial institutions. These counterparties are large international financial institutions, and, to date, no such counterparty has failed to meet its financial obligations to us.
Government Assistance
In January 2023, we received $18.0 million in cash from a California Competes Grant (the “Grant”) awarded from the California Governor’s Office of Business and Economic Development. The Grant requires us to create and maintain full-time jobs and make significant infrastructure investments within California over a 5-year term. If we do not meet the requirements of the Grant, we will be required to repay all or a portion of the Grant.
The Grant is included in our Consolidated Balance Sheets within Deferred grant and we will recognize the Grant over time when earned as an offset to Cost of revenues and Operating expenses within our Consolidated Statements of Income. We have presented the proceeds from the Grant as cash provided by operating activities within our Consolidated Statements of Cash Flows as the Grant is to offset operations. No amounts were recognized as an offset to expenses in fiscal 2023 and the full grant remains deferred.
Revenue Recognition
Revenue is recognized upon transferring control of products and services, and the amounts recognized reflect the consideration we expect to be entitled to receive in exchange for these products and services. Revenue is recognized net of any taxes collected from customers, which are subsequently remitted to governmental authorities. An arrangement may include some or all of the following products and services: probe cards, systems, accessories, engineering services, installation services, service contracts and extended warranty contracts. We sell our products and services direct to customers and to partners in two distribution channels: global direct sales force and through a combination of manufacturers’ representatives and distributors.
A performance obligation is a promise in a contract to transfer a distinct good or service to the customer. In contracts with multiple performance obligations, we identify each performance obligation and evaluate whether the performance obligation is distinct within the context of the contract at contract inception. Performance obligations that are not distinct at contract inception are combined and accounted for as one unit of account. Generally, the performance obligations in a contract are considered distinct within the context of the contract and are accounted for as separate units of account.
Our products may be customized to our customers’ specifications,specifications; however, control of our product is typically transferred to the customer at the point in time the product is either shipped or delivered, depending on the terms of the arrangement, as the criteria for overtimeover time recognition is not met. In limited circumstances, substantive acceptance by the customer exists which results in the deferral of revenue until acceptance is formally received from the customer. Judgment may be required in determining if the acceptance clause is substantive. In certain instances control of products is transferred to the customer over time based on performance and in those instances we utilize an appropriate input or output measure to determine to what extent control has transferred to the customer. Judgment may be required in determining an appropriate measure of performance.
Installation services are routinely provided to customers purchasing our systems. Installation services are a distinct performance obligation apart from the systems and are recognized in the period they are performed. Service contracts, which include repair and maintenance service contracts, and extended warranty contracts are also distinct performance obligations and are recognized over the contractual service period, which ranges from one to three years. For these service contracts recognized over time, we use anthe input measure of days elapsed to measure progress.
A contract’s transaction price is allocated to each distinct performance obligation and recognized as revenue when, or as, the performance obligation is satisfied. In determining the transaction price, we evaluate whether the price is subject to refund or adjustment to determine the net consideration to which we expect to be entitled. We generally do not grant return privileges, except for defective products during the warranty period. Sales incentives and other programs that we may make available to theseour customers are considered to be a form of variable consideration, which is estimated in determining the contract’s transaction price to be allocated to the performance obligations.
For contracts with multiple performance obligations, we allocate the contract’s transaction price to each performance obligation based on its relative stand-alone selling price. The stand-alone selling prices are determined based on observable prices, which
FORMFACTOR, INC.
NOTES TO CONSOLIDATED FINANCIAL STATEMENTS (Continued)
are the prices at which we separately sell these products. For items which do not have observable prices, we use our best estimate of the stand-alone selling prices.
Transaction price allocated to the remaining performance obligations: On December 26, 2020,30, 2023, we had $7.9$12.4 million of remaining performance obligations, which were comprised of deferred service contracts, and extended warranty contracts, and
FORMFACTOR, INC.
NOTES TO CONSOLIDATED FINANCIAL STATEMENTS (Continued)
contracts with overtimeover time revenue recognition that are not yet delivered. We expect to recognize approximately 84.1%86.7% of our remaining performance obligations as revenue in fiscal 2021,2024, approximately 9.5%9.1% in fiscal 2022,2025, and approximately 6.4%4.2% in fiscal 20232026 and thereafter. The foregoing excludes the value of remaining performance obligations that have original durations of one year or less, and also excludes information about variable consideration allocated entirely to a wholly unsatisfied performance obligation.
Contract balances: The timing of revenue recognition may differ from the timing of invoicing to customers. Accounts receivable is recorded at the invoiced amount, net of an allowance for doubtful accounts.credit losses. A receivable is recognized in the period we deliver goods or provide services or when our right to consideration is unconditional. A contract asset is recorded when we have performed under the contract but our right to consideration is conditional on something other than the passage of time. Contract assets as of December 26, 202030, 2023 and December 28, 201931, 2022 were $3.7$3.8 million and $0.9$1.9 million, respectively, and are reported on the Consolidated Balance Sheets as a component of Prepaid expenses and other current assets.
Contract liabilities include payments received and payments due in advance of performance under a contract and are satisfied as the associated revenue is recognized. Contract liabilities are reported on the Consolidated Balance Sheets on a contract-by-contract basis at the end of each reporting period as a component of Deferred revenue and Other liabilities. Contract liabilities totaled $22.2$18.0 million and $10.8$30.9 million at December 26, 202030, 2023 and December 28, 2019,31, 2022, respectively. During fiscal 2020,2023, we recognized $9.5$27.5 million of revenue that was included in contract liabilities as of December 28, 2019.31, 2022.
Costs to obtain a contract: We generally expense sales commissions when incurred as a component of Selling, general and administrative expense as the amortization period is typically less than one year.
Revenue by Category: Refer to Note 15,17, Segments and Geographic Information, for further details.
Warranty Obligations
We offer warranties on certain products and record a liability for the estimated future costs associated with warranty claims at the time revenue is recognized. The warranty liability is based upon historical experience and our estimate of the level of future costs. While we engage in product quality programs and processes, our warranty obligation is affected by product failure rates, material usage and service delivery costs incurred in correcting a product failure. We continuously monitor product returns for warranty and maintain a reserve for the related expenses based upon our historical experience and any specifically identified field failures. As we sell new products to our customers, we must exercise considerable judgment in estimating the expected failure rates. This estimating process is based on historical experience of similar products, as well as various other assumptions that we believe to be reasonable under the circumstances.
We provide for the estimated cost of product warranties at the time revenue is recognized. Warranty costs are reflected in the Consolidated Statement of Income as a Cost of revenues.
A reconciliation of the changes in our warranty liability is as follows (in thousands):
| | | | Fiscal Year Ended | | Fiscal Year Ended |
| | | December 26, 2020 | | December 28, 2019 | | December 29, 2018 | | December 30, 2023 | | December 31, 2022 | | December 25, 2021 |
| Balance at beginning of year | Balance at beginning of year | $ | 1,942 | | | $ | 2,102 | | | $ | 3,662 | |
| | Accruals | Accruals | 5,727 | | | 3,881 | | | 3,181 | |
| Settlements | Settlements | (3,751) | | | (4,041) | | | (4,741) | |
| Reduction - FRT divestiture | |
| Balance at end of year | Balance at end of year | $ | 3,918 | | | $ | 1,942 | | | $ | 2,102 | |
Research and Development
Research and development expenses include expenses related to product development, engineering and material costs. All research and development costs are expensed as incurred.
FORMFACTOR, INC.
NOTES TO CONSOLIDATED FINANCIAL STATEMENTS (Continued)
Income Taxes
We utilize the asset and liability method of accounting for income taxes, under which deferred taxes are determined based on the temporary differences between the financial statement and tax basis of assets and liabilities using tax rates expected to be in effect during the years in which the basis differences reverse and for operating losses and tax credit carryforwards. We estimate our provision for income taxes and amounts ultimately payable or recoverable in numerous tax jurisdictions around the world. Estimates involve interpretations of regulations and are inherently complex. Resolution of income tax treatments in individual jurisdictions may not be known for many years after completion of any fiscal year. We are required to evaluate the realizability
FORMFACTOR, INC.
NOTES TO CONSOLIDATED FINANCIAL STATEMENTS (Continued)
of our deferred tax assets on an ongoing basis to determine whether there is a need for a valuation allowance with respect to such deferred tax assets. A valuation allowance is recorded when it is more likely than not that some or all of the deferred tax assets will not be realized. In evaluating the ability to recover deferred tax assets, we consider all available positive and negative evidence giving greater weight to our recent cumulative income, our historical ability to utilize net operating losses in recent years, and our forecast of future taxable income, including the reversal of temporary differences and the implementation of feasible and prudent tax planning strategies.
We recognize and measure uncertain tax positions taken or expected to be taken in a tax return if it is more likely than not that the tax position will be sustained on examination by the taxing authorities, based on the technical merits of the position. The tax benefits recognized are then measured based on the largest benefit that has a greater than 50 percent likelihood of being realized upon ultimate settlement. We report a liability for unrecognized tax benefits resulting from uncertain tax positions taken or expected to be taken in a tax return. We adjust these reserves in light of changing facts and circumstances, such as the closing of a tax audit or the refinement of an estimate. To the extent that the final tax outcome of these matters is different than the amounts recorded, such differences will impact the provision for income taxes in the period in which such determination is made. The provision for income taxes includes the impact of reserve provisions and changes to reserves, that are considered appropriate, as well as the related net interest. We recognize interest and penalties related to unrecognized tax benefits within the income tax provision. Accrued interest and penalties are included within the related tax liability in the Consolidated Balance Sheets.
We file annual income tax returns in multiple taxing jurisdictions around the world. A number of years may elapse before an uncertain tax position is audited and finally resolved. While it is often difficult to predict the final outcome or the timing of resolution of any particular uncertain tax position, we believe that our related liability reflects the most likely outcome. We adjust the liability, as well as the related interest, in light of changing facts and circumstances. Settlement of any particular position could require the use of cash.
Stock-Based Compensation
We recognize compensation expense for all stock-based awards based on the grant-date estimated fair values. The value of the portion of the award that is ultimately expected to vest is recognized as expense ratably over the requisite service periods in our Consolidated Statements of Income. The fair value of stock options is measured using the Black-Scholes option pricing model, while the fair value for restricted stock units ("RSUs"(“RSUs”) is measured based on the closing market price of our common stock on the date of grant. The fair value of Performance RSUs ("PRSU"(“PRSU”) is based on certain market performance criteria and is measured using thea Monte Carlo simulation pricing model.
See Notes 11,Note 13, Stockholders' Equity, and 12,Note 14, Stock-Based Compensation, for additional information.
Net Income Per Share
Basic net income per share is computed by dividing net income by the weighted-average number of common shares outstanding for the period. Diluted net income per share is computed giving effect to all potentially dilutive common stock and common stock equivalents, including stock options, RSUs and common stock subject to repurchase.
The following table reconciles the shares used in calculating basic net income per share and diluted net income per share (in thousands):
| | | | Fiscal Year Ended | | Fiscal Year Ended |
| | | December 26, 2020 | | December 28, 2019 | | December 29, 2018 | | December 30, 2023 | | December 31, 2022 | | December 25, 2021 |
| | Weighted-average shares used in computing basic net income per share | Weighted-average shares used in computing basic net income per share | 76,681 | | | 74,994 | | | 73,482 | |
| | Weighted-average shares used in computing basic net income per share | |
| | Weighted-average shares used in computing basic net income per share | |
| Add potentially dilutive securities | Add potentially dilutive securities | 2,320 | | | 2,292 | | | 1,700 | |
| Weighted-average shares used in computing basic and diluted net income per share | Weighted-average shares used in computing basic and diluted net income per share | 79,001 | | | 77,286 | | | 75,182 | |
FORMFACTOR, INC.
NOTES TO CONSOLIDATED FINANCIAL STATEMENTS (Continued)
Accumulated Other Comprehensive Income (Loss)other comprehensive loss
Accumulated other comprehensive income (loss) ("OCI"loss (“AOCL”) includes the following items, the impact of which has been excluded from earnings and reflected as components of stockholders' equity as shown below (in thousands):
| | | | | | | | | | | | |
| December 26, 2020 | | December 28, 2019 | |
| Unrealized losses on available-for-sale marketable securities | $ | (126) | | | $ | (352) | | |
| Translation adjustments and other | 5,184 | | | 53 | | |
| Unrealized gains (losses) on derivative instruments | 828 | | | (360) | | |
| Accumulated other comprehensive income (loss) | $ | 5,886 | | | $ | (659) | | |
| | | | | | | | | | | | |
| December 30, 2023 | | December 31, 2022 | |
| Unrealized losses on available-for-sale marketable securities and other investments | $ | (727) | | | $ | (2,749) | | |
| Translation adjustments | (5,568) | | | (5,675) | | |
| Unrealized gains on derivative instruments | 2,243 | | | 2,846 | | |
| Accumulated other comprehensive loss | $ | (4,052) | | | $ | (5,578) | | |
Note 3—Balance Sheet Components
Marketable Securities
Marketable securities consisted of the following (in thousands):
| | | | | | | | | | | | | | | | | | | | | | | |
| December 26, 2020 | Amortized Cost | | Gross Unrealized Gains | | Gross Unrealized Losses | | Fair Value |
| U.S. Treasuries | $ | 40,602 | | | $ | 124 | | | $ | 0 | | | $ | 40,726 | |
| | | | | | | |
| Corporate bonds | 24,156 | | | 176 | | | (2) | | | 24,330 | |
| Certificate of deposit | 2,160 | | | 19 | | | 0 | | | 2,179 | |
| Agency securities | 575 | | | 0 | | | 0 | | | 575 | |
| $ | 67,493 | | | $ | 319 | | | $ | (2) | | | $ | 67,810 | |
| | | | | | | | | | | | | | | | | | | | | | | |
| December 30, 2023 | Amortized Cost | | Gross Unrealized Gains | | Gross Unrealized Losses | | Fair Value |
| U.S. treasuries | $ | 45,772 | | | $ | 91 | | | $ | (26) | | | $ | 45,837 | |
| Commercial paper | 13,319 | | | — | | | (2) | | | 13,317 | |
| Corporate bonds | 81,612 | | | 267 | | | (529) | | | 81,350 | |
| | | | | | | |
| U.S. agency securities | 10,086 | | | 9 | | | (92) | | | 10,003 | |
| $ | 150,789 | | | $ | 367 | | | $ | (649) | | | $ | 150,507 | |
| | | | | | | | | | | | | | | | | | | | | | | |
| December 28, 2019 | Amortized Cost | | Gross Unrealized Gains | | Gross Unrealized Losses | | Fair Value |
| U.S. Treasuries | $ | 10,458 | | | $ | 11 | | | $ | 0 | | | $ | 10,469 | |
| Commercial paper | 3,914 | | | 1 | | | (4) | | | 3,911 | |
| Corporate bond | 33,867 | | | 68 | | | (7) | | | 33,928 | |
| Certificate of deposit | 3,584 | | | 5 | | | 0 | | | 3,589 | |
| Agency securities | 24,408 | | | 38 | | | (16) | | | 24,430 | |
| $ | 76,231 | | | $ | 123 | | | $ | (27) | | | $ | 76,327 | |
We classify our marketable securities as available-for-sale. All marketable securities represent the investment of funds available for current operations, notwithstanding their contractual maturities. Such marketable securities are recorded at fair value and unrealized gains and losses are recorded in Accumulated other comprehensive income (loss) until realized. | | | | | | | | | | | | | | | | | | | | | | | |
| December 31, 2022 | Amortized Cost | | Gross Unrealized Gains | | Gross Unrealized Losses | | Fair Value |
| U.S. treasuries | $ | 25,498 | | | $ | — | | | $ | (479) | | | $ | 25,019 | |
| Commercial paper | 24,893 | | | — | | | (53) | | | 24,840 | |
| Corporate bonds | 68,845 | | | — | | | (1,449) | | | 67,396 | |
| Certificates of deposit | 720 | | | — | | | (14) | | | 706 | |
| U.S. agency securities | 11,295 | | | — | | | (250) | | | 11,045 | |
| $ | 131,251 | | | $ | — | | | $ | (2,245) | | | $ | 129,006 | |
We typically invest in highly-rated securities with low probabilities of default. Our investment policy requires investments to be rated single A or better, limits the types of acceptable investments, concentration as to security holder and duration of the investment. The gross unrealized gains and losses in fiscal 20202023 and 20192022 were caused primarily by changes in interest rates.
The longer the duration of marketable securities, the more susceptible they are to changes in market interest rates and bond yields. As yields increase, those securities with a lower yield-at-cost show a mark-to-market unrealized loss. We anticipate recovering the full cost of the securities either as market conditions improve or as the securities mature. Accordingly, we believe that the unrealized losses are not as a result of a credit loss. As
The contractual maturities of December 26, 2020 and December 28, 2019, gross unrealized losses related to our marketable securities portfolio were not material.as follows (in thousands):
| | | | | | | | | | | | | | | | | | | | | | | |
| | December 30, 2023 | | December 31, 2022 |
| | Amortized Cost | | Fair Value | | Amortized Cost | | Fair Value |
| Due in one year or less | $ | 94,772 | | | $ | 94,370 | | | $ | 77,663 | | | $ | 76,902 | |
| Due after one year to five years | 56,017 | | | 56,137 | | | 53,588 | | | 52,104 | |
| $ | 150,789 | | | $ | 150,507 | | | $ | 131,251 | | | $ | 129,006 | |
See also Note 10, Fair Value.
FORMFACTOR, INC.
NOTES TO CONSOLIDATED FINANCIAL STATEMENTS (Continued)
The contractual maturities of marketable securities were as follows (in thousands):
| | | | | | | | | | | | | | | | | | | | | | | |
| | December 26, 2020 | | December 28, 2019 |
| | Amortized Cost | | Fair Value | | Amortized Cost | | Fair Value |
| Due in one year or less | $ | 50,500 | | | $ | 50,679 | | | $ | 38,899 | | | $ | 38,944 | |
| Due after one year to five years | 16,993 | | | 17,131 | | | 37,332 | | | 37,383 | |
| $ | 67,493 | | | $ | 67,810 | | | $ | 76,231 | | | $ | 76,327 | |
See also Note 8, Fair Value.
Inventories, net
Inventories consisted of the following (in thousands):
| | | | December 26, 2020 | | December 28, 2019 | | December 30, 2023 | | December 31, 2022 |
| Raw materials | Raw materials | $ | 48,122 | | | $ | 38,528 | |
| Work-in-progress | Work-in-progress | 30,806 | | | 29,720 | |
| Finished goods | Finished goods | 20,301 | | | 15,010 | |
| $ | 99,229 | | | $ | 83,258 | |
| $ | |
Property, Plant and Equipment, net
Property, plant and equipment, net consisted of the following (in thousands):
| | December 26, 2020 | | December 28, 2019 |
| December 30, 2023 | | | December 30, 2023 | | December 31, 2022 |
| Land | Land | $ | 4,751 | | | $ | 0 | |
| Building and building improvements | |
| Machinery and equipment | Machinery and equipment | 226,185 | | | 201,861 | |
| Computer equipment and software | Computer equipment and software | 36,361 | | | 35,192 | |
| Furniture and fixtures | Furniture and fixtures | 6,894 | | | 6,756 | |
| Leasehold improvements | Leasehold improvements | 79,144 | | | 76,081 | |
| Sub-total | Sub-total | 353,335 | | | 319,890 | |
| Less: Accumulated depreciation and amortization | Less: Accumulated depreciation and amortization | (294,468) | | | (273,001) | |
| Net property, plant and equipment | Net property, plant and equipment | 58,867 | | | 46,889 | |
| Construction-in-progress | Construction-in-progress | 45,236 | | | 11,858 | |
| Total | Total | $ | 104,103 | | | $ | 58,747 | |
Accrued Liabilities
Accrued liabilities consisted of the following (in thousands):
| | December 26, 2020 | | December 28, 2019 |
| December 30, 2023 | | | December 30, 2023 | | December 31, 2022 |
| Accrued compensation and benefits | Accrued compensation and benefits | $ | 33,110 | | | $ | 21,329 | |
| Accrued income and other taxes | |
| Accrued employee stock purchase plan contributions withheld | Accrued employee stock purchase plan contributions withheld | 4,240 | | | 3,331 | |
| Accrued warranty | Accrued warranty | 3,918 | | | 1,942 | |
| Accrued income and other taxes | 6,976 | | | 6,846 | |
| Accrued contingent consideration | 4,012 | | | 0 | |
| Accrued restructuring charges | |
| | Other accrued expenses | Other accrued expenses | 3,086 | | | 2,991 | |
| $ | 55,342 | | | $ | 36,439 | |
| Other accrued expenses | |
| Other accrued expenses | |
| $ | |
Note 4—Acquisitions
High Precision Devises, Inc.Woburn Acquisition
On October 19, 2020,June 9, 2022 we acquired 100%the assets of the sharesdilution refrigerator product line of HPDAmerican ULT Cryogenics, formerly d/b/a JanisULT (“Woburn”), for total consideration of $16.9 million, net of cash acquired of $1.7 million, which included an estimated adjustment for changes in working capital, which are not yet finalized. This
acquisition brings highly specialized skills and know-how to address the unique test challenges within the emerging quantum computing, superconducting computing, and ultra-sensitive sensor markets which operate at temperatures as low as 30 millikelvin.
The acquisition was accounted for using the acquisition method of accounting, with FormFactor treated as the acquirer. The acquired assets and liabilities of HPD were recorded at their respective fair values including an amount for goodwill representing the difference between the acquisition consideration and the fair value of the identifiable net assets.
Our Consolidated Statements of Income include the financial results of HPD subsequent to the acquisition date of October 19, 2020. Revenue related to HPD since the acquisition date that was included in our Consolidated Statements of Income for fiscal 2020 was not material.
The acquisition price was allocated to the tangible and identified intangible assets acquired and liabilities assumed as of the closing date of the acquisition based upon their respective fair values. The fair values assigned to assets acquired and liabilities assumed were based on management’s assumptions as of the reporting date.
As of the reporting date, we have not completed the valuation of assets acquired and liabilities assumed. While the quantification of identifiable intangible assets is still in process, we expect certain amounts provisionally recorded as goodwill to be allocated to such assets as customer relationships, developed technologies, backlog and potentially other technology-related assets as we complete purchase accounting. While we have recorded a provisional allocation of value based on the best estimates available at this time, we do not yet have a final allocation of value between amortizing and non-amortizing intangible assets. The items pending include finalizing our evaluation of acquired tangible and financial assets, finalizing the working capital adjustment under the purchase agreement, and finalizing certain key assumptions used to value intangible assets. We expect that some amount of intangible assets provisionally recorded as goodwill may ultimately be allocated to an amortizing intangible asset or vice versa, and similarly the relative values of intangible assets may change as the valuation is finalized. We have recorded estimated amortization based on these provisional amounts from the acquisition date through December 26, 2020. To the extent that upon finalization the required amortization changes, we will record an adjustment to appropriately reflect amortization of the related assets between the acquisition date and the date at which the amounts become estimable. We have one year over which to finalize purchase accounting, and while we expect to complete purchasing accounting before that time, the impact of the potential changes to estimated amounts or related amortization to the financial statements as a whole is not expected to be material.
As described above, adjustments to fair value for intangible assets have not yet been finalized, however provisional amounts are included in the table below and in the Consolidated Balance Sheets and are subject to revision as the fair value of the associated assets acquired and liabilities assumed is finalized. The total estimated purchase price allocated to the underlying assets acquired and liabilities assumed based on the provisional amounts are as follows (in thousands):`
| | | | | | | | |
| | Amount |
Cash and cash equivalents | | $ | 1,680 | |
Accounts receivable | | 1,017 | |
Inventory | | 3,047 | |
Property, plant and equipment | | 669 | |
Operating lease, right-of-use-assets | | 2,554 | |
Prepaid expenses and other assets | | 599 | |
Tangible assets acquired | | 9,566 | |
Deferred revenue | | (2,393) | |
Accounts payable and accrued liabilities | | (1,268) | |
Operating lease liabilities | | (2,554) | |
Deferred tax liability | | (3,465) | |
Total net tangible assets acquired and liabilities assumed | | (114) | |
Intangible assets | | 14,020 | |
Goodwill | | 4,654 | |
Net assets acquired | | $ | 18,560 | |
The preliminary intangible assets as of the closing date of the acquisition included (in thousands):
| | | | | | | | | | | | | | |
| | Amount | | Weighted Average Useful Life (in years) |
| Developed technologies | | $ | 8,000 | | | 10.0 |
| Customer relationships | | 5,400 | | | 5.0 |
| Order backlog | | 400 | | | 0.5 |
| Trade names | | 220 | | | 5.0 |
| Total intangible assets | | $ | 14,020 | | | 7.7 |
The fair value of the intangible assets acquired in connection with the acquisition was determined using either the income, market or replacement cost methodologies. The intangible assets are being amortized over periods which reflect the pattern in which economic benefits of the assets are expected to be realized.
Identifiable Intangible Assets
Valuation of intangible assets involves multiple assumptions. The key assumptions are described below.
Developed technology acquired primarily consists of existing technology related to cryogenic probe stations, Adiabatic Demagnetization Refrigerator ("ADR"), and continuous ADR cryostats and similar tools, and technology related to other cryogenic applications. We valued the developed technology using the multi-period excess earnings method under the income approach. Using this approach, the estimated fair values were calculated using expected future cash flows from specific products discounted to their net present values at an appropriate risk-adjusted rate of return.
Customer relationships represent the fair value of future projected revenues that will be derived from the sale of products to HPD's existing customers. We valued customer relationships using the incremental cash flow method. This method estimates value based on the incremental cash flow afforded by having the customers relationships in place on the acquisition date versus having no relationships in place and needing to replicate or replace those relationships. The incremental cash flows are then discounted to a present value to arrive at an estimate of fair value for this asset class.
Order backlog represents business under existing contractual obligations. Expected cash flow from order backlog was valued on a discounted direct cash flow basis, net of returns on contributory assets such as working capital, property and equipment, trade name and assembled workforce.
The identified trade names intangibles relate to the estimated fair value of future cash flows related to the HPD brand. We valued trade names by applying the relief-from-royalty method under the income approach. This method is based on the application of a royalty rate to forecasted revenue under the trade name.
Goodwill
The excess of purchase price over the fair value assigned to the assets acquired and liabilities assumed represents the amount of goodwill resulting from the acquisition. We believe the factors that contributed to goodwill include synergies that are specific to our consolidated business, such as cost savings and operational efficiencies, and the acquisition of a talented workforce that expands our expertise in business development and commercializing semiconductor test products, none of which qualify for recognition as a separate intangible asset. We do not expect any portion of this goodwill to be deductible for tax purposes. The goodwill attributable to the acquisition was recorded as a non-current asset and is not amortized, but is subject to an annual review for impairment.
The goodwill arising from the acquisition was allocated to the HPD reporting unit within the Systems reportable segment.
We have not presented unaudited combined pro forma financial information as the HPD acquisition was not significant to our consolidated results of operations and financial position.
Baldwin Park Acquisition
On July 30, 2020, we acquired the probe card assets of Advantest Corporation for total cash consideration of $35.0$3.4 million. This acquisition brings important enabling technologies and capabilitiesadded cryogen-free dilution refrigerators capable of cooling to sub-10 millikelvin to our product portfolio, which is required for designing and manufacturing advanced probe cards, and adds a complementary 3D-NAND Flash probe-card product that is qualified and in production at oneoperation of the world's leading NAND Flash manufacturers.
The acquisition was accounted for using the acquisition method of accounting, with FormFactor treated as the acquirer. The acquired assets and liabilities of Baldwin Park were recorded at their respective fair values including an amount for goodwill representing the difference between the acquisition consideration and the fair value of the identifiable net assets.
Our Consolidated Statements of Income include the financial results of Baldwin Park subsequent to the acquisition date of July 30, 2020. Revenue related to Baldwin Park since the acquisition date that was included in our Consolidated Statements of Income for fiscal 2020 was not material.superconducting quantum computers.
The acquisition price was allocated to the tangible and identified intangible assets acquired and liabilities assumed as of the closing date of the acquisition based upon their respective fair values. The fair values assigned to assets acquired and liabilities assumed were based on management’s assumptions as of the reporting date. Our purchase accounting remains open as ofGoodwill represents the reporting date, subject to finalization of the fair value of certain acquired assets and liabilities. The item pending includes finalizing certain key assumptions used to value intangible assets. The estimated fair value of assets acquired, including goodwill and intangibles, and liabilities assumed for the purchase as follows (in thousands):
| | | | | | | | |
| | Amount |
Accounts receivable | | $ | 4,365 | |
Inventory | | 2,579 | |
Property, plant and equipment | | 9,053 | |
Operating lease, right-of-use-assets | | 519 | |
Prepaid expenses and other assets | | 56 | |
Tangible assets acquired | | 16,572 | |
Accounts payable and accrued liabilities | | (743) | |
Operating lease liabilities | | (519) | |
Total net tangible assets acquired and liabilities assumed | | 15,310 | |
Intangible assets | | 14,100 | |
Goodwill | | 5,590 | |
Net assets acquired | | $ | 35,000 | |
The preliminary intangible assets as of the closing date of the acquisition included (in thousands):
| | | | | | | | | | | | | | |
| | Amount | | Weighted Average Useful Life (in years) |
| Developed technologies | | $ | 10,400 | | | 10.0 |
| Customer relationships | | 3,300 | | | 3.0 |
| In-process research and development | | 400 | | | N/A |
| Total intangible assets | | $ | 14,100 | | | 8.3 |
Indications of fair value of the intangible assets acquired in connection with the acquisition were determined using either the income, market or replacement cost methodologies. The intangible assets are being amortized over periods which reflect the pattern in which economic benefits of the assets are expected to be realized.
Identifiable Intangible Assets
Valuation of intangible assets involves multiple assumptions. The key assumptions are described below.
Developed technology acquired consists of existing technology related to 3D NAND Flash probe cards and the value of cost savings expected to be derived from Low Temperature Co-fired Ceramic ("LTCC") technology. We valued the developed technology related to 3D NAND Flash using the multi-period excess earnings method under the income approach. Using this approach, the estimated fair values were calculated using expected future cash flows from specific products discounted to their net present values at an appropriate risk-adjusted rate of return. We valued the LTCC developed technology asset using the incremental cash flow method. This method estimates value based on the incremental cash flow afforded by having the LTCC capability in place on the acquisition date versus having no capability in place and needing to replicate or replace that capability. The incremental cash flows are then discounted to a present value to arrive at an estimate of fair value for this asset class.
In-process research and development acquired primarily consists of research and development projects that were in process at the time of acquisition related to technologies used in DRAM probe cards. Once these projects are complete they will be placed in developed technologies and amortized over its useful life. We valued the IPR&D using the multi-period excess earnings method under the income approach. Using this approach, the estimated fair values were calculated using expected future cash flows from specific products discounted to their net present values at an appropriate risk-adjusted rate of return.
Customer relationships represent the fair value of future projected revenues that will be derived from the sale of products to Baldwin Park's existing customers. We valued customer relationships using the incremental cash flow method. This method estimates value based on the incremental cash flow afforded by having the customers relationships in place on the acquisition date versus having no relationships in place and needing to replicate or replace those relationships. The incremental cash flows are then discounted to a present value to arrive at an estimate of fair value for this asset class.
Goodwill
The excess of purchase price over the fair value assigned to the assets acquired and liabilities assumed represents the amount of goodwill resulting from the acquisition. We believe the factors that contributed to goodwill include synergies that are specific to our consolidated business, such as cost savings and operational efficiencies, and the acquisition of a talented workforce that expands our expertise in business development, none of which qualify for recognition as a separate intangible asset. We expect this goodwill to be deductible for tax purposes. The goodwill attributable to the acquisition was recorded as a non-current asset and is not amortized, but is subject to an annual review for impairment.
The goodwill arising from the acquisition was allocated to the Probe Cards reporting unit within the Probe Cards reportable segment.
We have not presented unaudited combined pro forma financial information as the Baldwin Park acquisition was not significant to our consolidated results of operations and financial position.
FRT GmbH Acquisition
On October 9, 2019, we acquired 100% of the shares of FRT, a German-based company, for total consideration of $26.9 million, net of cash acquired of $1.7 million. The fair value of the purchase consideration was comprised of a $22.2 million cash payment and $6.5 million of contingent consideration. The contingent consideration is a cash amount equal to 1.5x Earnings Before Interest and Tax ("EBIT") as defined in the purchase agreement, from a minimum of 0 up to a maximum of €10.3 million, payable subject to the performance of the acquired business in calendar 2020. We estimated the fair value of contingent consideration using a probability weighted approach. Key assumptions in determining the fair value of contingent consideration include estimating the probability of achieving certain EBIT levels and discounting at an appropriate discount rate. See Note 8, Fair Value, for additional information. This acquisition strengthens our leadership in test and measurement by expanding our addressable market into 3D hybrid surface metrology and extending the optical applications scope of our existing Systems segment.
The acquisition was accounted for using the acquisition method of accounting, with FormFactor treated as the acquirer. The acquired assets and liabilities of FRT were recorded at their respective fair values including an amount for goodwill representing the difference between the acquisition consideration and the fair value of the identifiable net assets.
Our Consolidated Statements of Income include the financial results of FRT subsequent to the acquisition date of October 9, 2019. Revenue in fiscal 2019 related to FRT subsequent to the acquisition date that was included in our Consolidated Statements of Income was not material.
Separate from the purchase agreement, we entered into a term loan agreement with a lender for an aggregate amount of $23.4 million to finance the acquisition. See Note 5, Debt, for additional information.
The acquisition price was allocated to the tangible and identified intangible assets acquired and liabilities assumed as of the closing date of the acquisition based upon their respective fair values. The fair values assigned to assets acquired and liabilities assumed were based on management’s assumptions as of the reporting date. We have finalized our allocation of the assets acquired, including goodwill and intangibles, and liabilities assumed for the purchase as follows (in thousands):
| | | | | | | | |
| | Amount |
Cash and cash equivalents | | $ | 1,687 | |
Accounts receivable | | 3,079 | |
Inventory | | 2,643 | |
Property, plant and equipment | | 696 | |
Operating lease, right-of-use-assets | | 335 | |
Prepaid expenses and other assets | | 838 | |
Tangible assets acquired | | 9,278 | |
Customer deposits | | (1,933) | |
Accounts payable and accrued liabilities | | (1,182) | |
Operating lease liabilities | | (335) | |
Deferred tax liabilities | | (5,757) | |
| | |
Total net tangible assets acquired and liabilities assumed | | 71 | |
Intangible assets | | 17,429 | |
Goodwill | | 11,123 | |
Net assets acquired | | $ | 28,623 | |
The intangible assets as of the closing date of the acquisition included (in thousands):
| | | | | | | | | | | | | | |
| | Amount | | Weighted Average Useful Life (in years) |
| Developed technologies | | $ | 12,505 | | | 8.0 |
| Customer relationships | | 3,071 | | | 6.0 |
| Order backlog | | 1,645 | | | 0.5 |
| Trade names | | 208 | | | 2.0 |
| | | | |
| Total intangible assets | | $ | 17,429 | | | 6.9 |
Indications of fair value of the intangible assets acquired in connection with the acquisition were determined using either the income, market or replacement cost methodologies. The intangible assets are being amortized over periods which reflect the pattern in which economic benefits of the assets are expected to be realized.
Identifiable Intangible Assets
Valuation of intangible assets involves multiple assumptions. The key assumptions are described below.
Developed technology acquired primarily consists of existing technology related to hybrid 3D surface metrology measurement equipment. We valued the developed technology using the multi-period excess earnings method under the income approach. Using this approach, the estimated fair values were calculated using expected future cash flows from specific products discounted to their net present values at an appropriate risk-adjusted rate of return.
Customer relationships represent the fair value of future projected revenues that will be derived from the sale of products to FRT's existing customers. We valued customer relationships using the incremental cash flow method. This method estimates value based on the incremental cash flow afforded by having the customers relationships in place on the acquisition date versus having no relationships in place and needing to replicate or replace those relationships. The incremental cash flows are then discounted to a present value to arrive at an estimate of fair value for this asset class.
Order backlog represents business under existing contractual obligations. Expected cash flow from order backlog was valued on a direct cash flow basis.
The identified trade names intangibles relate to the estimated fair value of future cash flows related to the FRT brand. We valued trade names by applying the relief-from-royalty method under the income approach. This method is based on the application of a royalty rate to forecasted revenue under the trade name.
Goodwill
The excess of purchase price over the fair value assigned to the assets acquired and liabilities assumed represents the amount of goodwill resulting from the acquisition. We believe the factors that contributed to goodwill include synergies that are specific to our consolidated business, such as cost savings and operational efficiencies, and the acquisition of a talented workforce that expands our expertise in business development and commercializing semiconductor test products, none of which qualify for recognition as a separate intangible asset. We do not expect any portion of this goodwill to be deductible for tax purposes. The goodwill attributable to the acquisition was recorded as a non-current asset and is not amortized, but is subject to an annual review for impairment.
The goodwill arising from the acquisition was allocated to the FRTHPD reporting unit within the Systems reportable segment. The identified intangible asset, developed technology, has a useful life of three years.
We have not presented unaudited combined pro forma financial information as the FRT acquisition was not significant to our consolidated results of operations and financial position.
Note 5—Debt
Our debt consisted of the following (in thousands):
| | | | | | | | | | | |
| December 26, 2020 | | December 28, 2019 |
| Term loans | $ | 34,569 | | | $ | 58,514 | |
| Less unamortized issuance costs | (75) | | | (29) | |
| Term loans less issuance costs | $ | 34,494 | | | $ | 58,485 | |
CMI Term Loan
On June 24, 2016, we entered into a Credit Agreement (the “Credit Agreement”) with HSBC Bank USA, National Association ("HSBC"), as administrative agent, co-lead arranger, sole bookrunner and syndication agent, other lenders that may from time-to-time be a party to the Credit Agreement, and certain guarantors. Pursuant to the Credit Agreement, the lenders provided us with a senior secured term loan facility of $150 million (the “CMI Term Loan”). The proceeds of the CMI Term Loan were used to finance a portion of the purchase price paid in connection with the Cascade Microtech acquisition in fiscal 2016 and to pay related bank fees and expenses.
The CMI Term Loan bore interest at a rate equal to, at our option, (i) the applicable London Interbank Offered Rate ("LIBOR") rate plus 2.00% per annum or (ii) Base Rate (as defined in the Credit Agreement) plus 1.00% per annum. We elected to pay interest at 2.00% over the one-month LIBOR rate. Interest payments were payable in quarterly installments over a five-year period.
The principal payments on the CMI Term Loan were scheduled to be paid in equal quarterly installments that began June 30, 2016, in an annual amount equal to 5% for year one, 10% for year two, 20% for year three, 30% for year four and 35% for year five. We accelerated payments of these scheduled amounts and made the final payment on the CMI Term Loan on June 30, 2020, approximately one year before the original maturity. We are no longer subject to the terms of the Credit Agreement.
FRT Term Loan
On October 25, 2019, we entered into a euro denominated $23.4 million three-year credit facility loan agreement (the "FRT Term Loan") with HSBC Trinkaus & Burkhardt AG, Germany, to fund the acquisition of FRT GmbH, which we acquired on October 9, 2019. See Note 4, Acquisitions, for further details of the acquisition.
The FRT Term Loan bears interest at a rate equal to the Euro Interbank Offered Rate ("EURIBOR") plus 1.75 % per annum and will be repaid in quarterly installments of approximately $2.0 million plus interest. The interest rate at December 26, 2020 was 1.24%.
The obligations under the FRT Term Loan are fully and unconditionally guaranteed by FormFactor, Inc. The FRT Term Loan contains negative covenants customary for financing of this type, including covenants that place limitations on the incurrence of additional indebtedness, the creation of liens, the payment of dividends; dispositions; fundamental changes, including mergers and acquisitions; loans and investments; sale leasebacks; negative pledges; transactions with affiliates; changes in fiscal year; sanctions and anti-bribery laws and regulations, and modifications to charter documents in a manner materially adverse to the Lenders. The FRT Term Loan also contains affirmative covenants and representations and warranties customary for financing of this type. As of December 26, 2020, the balance outstanding pursuant to the FRT term loan was $17.1 million.
FORMFACTOR, INC.
NOTES TO CONSOLIDATED FINANCIAL STATEMENTS (Continued)
The fair value of assets acquired, including goodwill and intangibles, and liabilities assumed for the purchase are as follows (in thousands):
| | | | | | | | |
| | Amount |
| | |
| Accounts receivable | | 178 | |
| Inventories | | 7,041 | |
| Property, plant and equipment | | 479 | |
| | |
| Prepaid expenses and other assets | | 117 | |
| Other asset | | 28 | |
| Tangible assets acquired | | 7,843 | |
| Deferred revenue | | (5,513) | |
| Accounts payable and accrued liabilities | | (30) | |
| | |
| | |
| | |
| Total net tangible assets acquired and liabilities assumed | | 2,300 | |
| Intangible assets | | 500 | |
| Goodwill | | 550 | |
| Net assets acquired | | $ | 3,350 | |
Building Term Loan
Note 5—Divestiture
On September 18, 2023, the Company announced entry into a definitive agreement to sell its FRT Metrology (“FRT”) business to Camtek Ltd. (“Camtek”) for $100 million in cash, subject to customary purchase price adjustments. The Company acquired FRT GmbH in fiscal 2019 for total consideration of $24.4 million, net of cash acquired. Headquartered in Bergisch Gladbach, Germany, the FRT business is a leading supplier of high-precision metrology solutions for the Advanced Packaging and Silicon Carbide markets, and was part of the Company's Systems segment.
On November 1, 2023, we closed on the sale of the FRT business to Camtek and received net cash proceeds of $99.8 million, net of cash transferred and transaction expenses, and after customary adjustments for indebtedness and changes in net working capital. The disposition of the FRT business did not meet the criteria to be classified as a discontinued operation in the Company’s financial statements because the disposition did not represent a strategic shift that had, or will have, a major effect on the Company’s operations and financial results.
The following table summarizes the fair value of the sale proceeds received in connection with the divestiture, which are subject to further post-closing adjustment (in thousands):
| | | | | | | | |
| | November 1, 2023 |
| Fair value of sale consideration | | $ | 99,031 | |
| Estimated working capital adjustment | | 4,029 | |
| Cash transferred to the buyer at closing | | (2,049) | |
| Direct costs to sell | | (1,225) | |
| Fair value of sale consideration | | $ | 99,786 | |
FORMFACTOR, INC.
NOTES TO CONSOLIDATED FINANCIAL STATEMENTS (Continued)
The carrying amount of net assets associated with the FRT business was approximately $26.8 million. The major classes of assets and liabilities sold consisted of the following:
| | | | | | | | |
| | November 1, 2023 |
| ASSETS | | |
| Accounts receivable, net | | $ | 7,738 | |
| Inventories, net | | 6,446 | |
| Other current assets | | 635 | |
| Total current assets | | 14,819 | |
| Intangibles, net | | 6,897 | |
| Goodwill | | 10,660 | |
| Other assets | | 1,612 | |
| Total assets | | $ | 33,988 | |
| LIABILITIES | | |
| Current liabilities | | $ | 4,300 | |
| Other liabilities | | 2,856 | |
| Total liabilities | | $ | 7,156 | |
As a result of the divestiture, the Company recognized a pre-tax gain of $73.0 million. The Company recorded an income tax liability associated with the divestiture of approximately $5.9 million.
Note 6—Debt
Our debt consisted of the following (in thousands):
| | | | | | | | | | | |
| December 30, 2023 | | December 31, 2022 |
| Term loan | $ | 14,448 | | | $ | 15,499 | |
| Less unamortized issuance costs | (59) | | | (65) | |
| Term loan less issuance costs | $ | 14,389 | | | $ | 15,434 | |
On June 22, 2020, we entered into an $18.0 million 15-year credit facility loan agreement (the “Building Term Loan”) with MUFG Union Bank, National Association ("(“Union Bank"Bank”). The proceeds of the Building Term Loan were used to purchase a building adjacent to our leased facilities in Livermore, California. On May 19, 2023, we amended the Building Term Loan, replacing the benchmark reference rate LIBOR with SOFR, with no change to the amount or timing of contractual cash flows.
The Building Term Loan bears interest at a rate equal to the applicable LIBORSOFR rate, plus 0.1148%, plus 1.75% per annum. Interest payments are payable in monthly installments over a fifteen-year period. The interest rate at December 26, 202030, 2023 was 1.90%.7.20% before consideration of the interest rate swap.
On March 17, 2020, we entered into an interest rate swap agreement with Union Bank to hedge the interest payments on the Building Term Loan for the notional amount of $18.0 million. As future levels of LIBOR over the life of the loan arewere uncertain, we entered into this interest-rate swap agreement to hedge the exposure in interest rate risks associated with movement in LIBOR rates. By entering intoThis agreement was amended on May 19, 2023 to replace the benchmark reference rate LIBOR with SOFR to match the Building Term Loan agreement we convert a floating rate interest at one-month LIBOR plus 1.75% into a fixed rate interest at 2.75%(as amended). TheAfter the amendment, the interest rate swap also includescontinues to convert our floating-rate interest into a 0% floor that is effective for one year from the datefixed-rate of the swap.2.75%. As of December 26, 2020,30, 2023, the notional amount of the loan that is subject to this interest rate swap is $17.5was $14.4 million. See Note 8,10, Fair Value and Derivative Instruments, for additional information.
The obligations under the Building Term Loan are guaranteed by a deed of trust covering certain real property and improvements and certain personal property used in connection therewith. The deed of trust creates a first priority lien or encumbrance on the property with only such exceptions as may be approved by the Union Bank in writing.
The Credit AgreementBuilding Term Loan contains covenants customary for financing of this type. As of December 26, 2020,30, 2023, the balance outstanding pursuant to the Building Term Loan was $17.5$14.4 million.
FORMFACTOR, INC.
NOTES TO CONSOLIDATED FINANCIAL STATEMENTS (Continued)
Future principal and interest payments on our term loans as of December 26, 2020,30, 2023, based on the interest rate in effect at that date were as follows (in thousands):
| | Payments Due In Fiscal Year |
| 2021 | | 2022 | | 2023 | | 2024 | | 2025 | | 2026 and thereafter | | Total |
| Term loans - principal payments | $ | 9,521 | | | $ | 9,549 | | | $ | 1,050 | | | $ | 1,080 | | | $ | 1,111 | | | $ | 12,258 | | | $ | 34,569 | |
| Payments Due In Fiscal Year | | | Payments Due In Fiscal Year |
| 2024 | | | 2024 | | 2025 | | 2026 | | 2027 | | 2028 | | 2029 and thereafter | | Total |
| Term loan - principal payments | |
Term loans - interest payments(1) | Term loans - interest payments(1) | 503 | | | 377 | | | 290 | | | 271 | | | 248 | | | 1,185 | | | 2,874 | |
| $ | 10,024 | | | $ | 9,926 | | | $ | 1,340 | | | $ | 1,351 | | | $ | 1,359 | | | $ | 13,443 | | | $ | 37,443 | |
| $ | |
(1) Represents our minimum interest payment commitmentscommitment at 1.24%7.20% per annum, forexcluding the FRT Term Loan and 1.90% per annum for the Building Term Loan.interest rate swap described above.
Note 6—7—Leases
We adopted Accounting Standards Update ("ASU") 2016-02, “Leases (Topic 842),” ASU 2018-10, “Codification Improvements to Topic 842, Leases,” ASU 2018-11, “Leases (Topic 842): Targeted Improvements,” and ASU 2019-01, “Leases (Topic 842): Codification Improvements," on December 30, 2018, the first day of fiscal 2019, using the modified transition approach. The modified transition approach permitted a company to use its effective date as the date of initial application and to apply the standard to its leases, and, therefore, not restate comparative prior period financial information. Consequently, prior period financial information is not updated, and the disclosures required under the new standard are not provided for the period before December 30, 2018.
Our operating lease, right-of-use assets relate to real estate space under non-cancelable operating lease agreements for commercial and industrial space, as well as for our corporate headquarters located in Livermore, California. Our leases have remaining terms of 1 to 811 years, and some leases include options to extend up to 20 years. We also have operating leases for automobiles with remaining lease terms of 1 to 3 years. We did not include any of our renewal options in our lease terms for calculating our lease liability as the renewal options allow us to maintain operational flexibility and we are not reasonably certain we will exercise these options at this time. The weighted-average remaining lease term for our operating leases was 6.64.6 years at December 26, 202030, 2023 and the weighted-average discount rate was 4.33%4.60%.
FORMFACTOR, INC.
NOTES TO CONSOLIDATED FINANCIAL STATEMENTS (Continued)
The components of lease expense were as follows (in thousands):
| | | | | | | | | | | |
| Lease Expense |
| December 26, 2020 | | December 28, 2019 |
| Operating lease expense | $ | 7,468 | | | $ | 6,985 | |
| Short-term lease expense | 136 | | | 142 | |
| Variable lease expense | 1,574 | | | 1,286 | |
| $ | 9,178 | | | $ | 8,413 | |
| | | |
| | | |
| | | |
Operating lease expense for the year ended December 29, 2018 was $8.4 million. | | | | | | | | | | | | | | | | | |
| Lease Expense |
| December 30, 2023 | | December 31, 2022 | | December 25, 2021 |
| Operating lease expense | $ | 8,453 | | | $ | 8,595 | | | $ | 8,485 | |
| Short-term lease expense | 524 | | | 385 | | | 180 | |
| Variable lease expense | 2,389 | | | 2,393 | | | 1,842 | |
| $ | 11,366 | | | $ | 11,373 | | | $ | 10,507 | |
Future minimum payments under our non-cancelable operating leases were as follows as of December 26, 202030, 2023 (in thousands):
| | Fiscal Year | Fiscal Year | | Amount | Fiscal Year | | Amount |
| 2021 | | $ | 7,349 | |
| 2022 | | 6,115 | |
| 2023 | | 5,254 | |
| 2024 | 2024 | | 4,903 | |
| 2025 | 2025 | | 4,863 | |
| 2026 | |
| 2027 | |
| 2028 | |
| Thereafter | Thereafter | | 12,531 | |
| Total minimum lease payments | Total minimum lease payments | | 41,015 | |
| Less: interest | Less: interest | | (6,315) | |
| Present value of net minimum lease payments | Present value of net minimum lease payments | | 34,700 | |
| Less: current portion | Less: current portion | | (6,704) | |
| Total long-term operating lease liabilities | Total long-term operating lease liabilities | | $ | 27,996 | |
Note 7—8—Restructuring Charges
2022 Restructuring Plan
On October 25, 2022, we adopted a restructuring plan (“2022 restructuring plan”) to align our cost structure with reduced demand levels, by streamlining and improving the efficiency and business effectiveness of our operations. This plan included lowering headcount by approximately 13% of our workforce.
The Company recognized 2022 restructuring plan charges of approximately $1.1 million for the year ended December 30, 2023, all within the Probe Cards segment. The Company has recognized total 2022 restructuring plan charges of $8.1 million for
FORMFACTOR, INC.
NOTES TO CONSOLIDATED FINANCIAL STATEMENTS (Continued)
severance and employee-related costs, including $0.3 million for stock-based compensation, with $7.1 million within the Probe Cards segment, $0.5 million within the Systems segment, and $0.5 million within Corporate. We do not expect to incur additional material costs related to the 2022 restructuring plan.
2021 Restructuring Plan
On September 25, 2021, we adopted restructuring plans (“2021 restructuring plans”) to improve our business effectiveness and streamline our operations by consolidating certain manufacturing facilities for both the Probe Cards segment and the Systems segment. This included plans to consolidate or relocate certain leased locations in the United States to other locations in the United States, Germany and Asia. As a result of these changes to certain work locations, we have incurred personnel related costs to sever, relocate, or retain select employees. Additionally, as part of these plans we have undertaken actions to adjust capacity for certain product offerings, which included contract termination costs to satisfy contract obligations.
The Company recognized 2021 restructuring plans charges of approximately $0.8 million for the year ended December 30, 2023, with $0.3 million within the Probe Cards segment and $0.5 million within the Systems segment. The Company has recognized total 2021 restructuring plan charges of $13.3 million, with $10.1 million within the Probe Cards segment and $3.2 million within the Systems segment, and were comprised of $1.4 million of severance and employee-related costs, $2.0 million in contract and lease termination costs, $9.4 million in inventory impairments and other inventory related costs, and $0.5 million of cost related to impairment of leasehold improvements, facility exits and other costs. We do not expect to incur additional material costs related to the 2021 Restructuring Plans.
Total restructuring charges for both the 2022 and 2021 restructuring plans included in our Consolidated Statements of Income were as follows (in thousands):
| | | | | | | | | | | | | | | | | |
| Fiscal Year Ended |
| December 30, 2023 | | December 31, 2022 | | December 25, 2021 |
| Cost of revenues | $ | 357 | | | $ | 11,775 | | | $ | 3,205 | |
| Research and development | 291 | | | 1,498 | | | 869 | |
| Selling, general and administrative | 1,187 | | | 2,166 | | | 50 | |
| $ | 1,835 | | | $ | 15,439 | | | $ | 4,124 | |
Changes to the restructuring accrual during the years ended December 31, 2022 and December 30, 2023 were as follows (in thousands):
| | | | | | | | | | | | | | | | | | | | | | | | | | | | | | | | | | | | | |
| Employee
Severance
and Benefits | | Stock-based Compensation | | Inventory
Impairments &
Other Inventory
Related Costs | | Property and
Equipment
Impairments &
Other Asset
Related Costs | | Contract
Termination &
Other Costs | | | | Total |
| December 25, 2021 | $ | 1,028 | | | $ | — | | | $ | — | | | $ | — | | | $ | 1,450 | | | | | $ | 2,478 | |
| Restructuring charges | 7,269 | | | — | | | 7,629 | | | 186 | | | 502 | | | | | 15,586 | |
| Cash payments | (7,048) | | | — | | | (1,112) | | | (112) | | | (1,719) | | | | | (9,991) | |
| Adjustment to restructuring charges | — | | | — | | | — | | | — | | | (147) | | | | | (147) | |
| Non-cash settlement | — | | | — | | | (6,517) | | | (74) | | | (86) | | | | | (6,677) | |
| December 31, 2022 | 1,249 | | | $ | — | | | — | | | — | | | — | | | | | 1,249 | |
| Restructuring charges | 917 | | | 295 | | | 390 | | | — | | | 233 | | | | | 1,835 | |
| Cash payments | (2,166) | | | — | | | (89) | | | — | | | (233) | | | | | (2,488) | |
| | | | | | | | | | | | | |
| Non-cash settlement | — | | | (295) | | | (301) | | | — | | | — | | | | | (596) | |
| December 30, 2023 | $ | — | | | $ | — | | | $ | — | | | $ | — | | | $ | — | | | | | $ | — | |
Note 9—Derivative Financial Instruments
Foreign Exchange Derivative Contracts
We operate and sell our products in various global markets. As a result, we are exposed to changes in foreign currency exchange rates. We utilize foreign currency forward contracts to hedge against future movements in foreign exchange rates that affect certain existing foreign currency denominated assets and liabilities and forecasted foreign currency revenue and expense transactions. Under this program, our strategy is to have increases or decreases in our foreign currency exposures mitigated by gains or losses on the foreign currency forward contracts in order to mitigate the risks and volatility associated with foreign
FORMFACTOR, INC.
NOTES TO CONSOLIDATED FINANCIAL STATEMENTS (Continued)
currency transaction gains or losses.
We do not use derivative financial instruments for speculative or trading purposes. For accounting purposes, certain of our foreign currency forward contracts are not designated as hedging instruments and, accordingly, we record the fair value of these contracts as of the end of our reporting period in our Consolidated Balance Sheets with changes in fair value recorded within Other income (expense), net in our Consolidated Statements of Income for both realized and unrealized gains and losses. Certain of our foreign currency forward contracts are designated as cash flow hedges, and, accordingly, we record the fair value of these contracts as of the end of our reporting period in our Consolidated Balance Sheets with changes in fair value recorded as a component of Accumulated other comprehensive income (loss)loss and reclassified into earnings in the same period in which the hedged transaction affects earnings, and in the same line item on the Consolidated Statements of Income as the impact of the hedge transaction. At December 26, 2020,30, 2023, we expect to reclassify $0.9$0.3 million of the amount accumulated in other comprehensive income (loss)loss to earnings during the next 12 months, due to the recognition in earnings of the hedged forecasted transactions.
The fair value of our foreign exchange derivative contracts was determined based on current foreign currency exchange rates and forward points. All of our foreign exchange derivative contracts outstanding at December 26, 202030, 2023 will mature by the fourth quarter of fiscal 2021.2024.
FORMFACTOR, INC.
NOTES TO CONSOLIDATED FINANCIAL STATEMENTS (Continued)
The following table provides information about our foreign currency forward contracts outstanding as of December 26, 202030, 2023 (in thousands):
| | Currency | Currency | | Contract Position | | Contract Amount (Local Currency) | | Contract Amount (U.S. Dollars) | Currency | | Contract Position | | Contract Amount (Local Currency) | | Contract Amount (U.S. Dollars) |
| Euro | |
| | Euro | | Buy | | (11,350) | | | $ | (13,019) | |
| Euro | | Sell | | 12,304 | | | 15,002 | |
| Japanese Yen | |
| Japanese Yen | |
| Japanese Yen | Japanese Yen | | Sell | | 1,707,934 | | | 16,479 | |
| Korean Won | Korean Won | | Sell | | 2,309,079 | | | 2,093 | |
| Total USD notional amount of outstanding foreign exchange contracts | | $ | 20,555 | |
| Taiwan Dollar | |
Our foreign currency contracts are classified within Level 2 of the fair value hierarchy as they are valued using pricing models that utilize observable market inputs.
The location and amount of gains (losses) related to non-designated derivative instruments in the Consolidated Statements of Income were as follows (in thousands):
| | | | | Location of Gain (Loss) Recognized
on Derivatives | | Fiscal Year Ended |
| Derivatives Not Designated as Hedging Instruments | Derivatives Not Designated as Hedging Instruments | | December 26, 2020 | | December 28, 2019 | | December 29, 2018 | Derivatives Not Designated as Hedging Instruments | | Location of Gain Recognized | | Fiscal Year Ended |
| Derivatives Not Designated as Hedging Instruments | | | | December 30, 2023 | | December 31, 2022 | | December 25, 2021 |
| Foreign exchange forward contracts | | Other income (expense), net | | $ | (1,437) | | | $ | 248 | | | $ | 906 | |
FORMFACTOR, INC.
NOTES TO CONSOLIDATED FINANCIAL STATEMENTS (Continued)
The location and amount of gains (losses) related to foreign currency derivative instruments designated as cash flow hedges on our Consolidated Statements of Income was as follows (in thousands):
| | | | | | | | | | | | | | | | | | | | |
| | Amount of Gain or (Loss) Recognized in Accumulated OCI on Derivative | | Location of Gain or (Loss) Reclassified from Accumulated OCI into Income | | Amount of Gain or (Loss) Reclassified from Accumulated OCI into Income |
| Fiscal 2020 | | 1,142 | | | Cost of revenues | | $ | 89 | |
| | | | Research and development | | 77 | |
| | | | Selling, general and administrative | | 25 | |
| | | | | | $ | 191 | |
| | | | | | |
| Fiscal 2019 | | $ | 93 | | | Cost of revenues | | $ | (526) | |
| | | | Research and development | | (75) | |
| | | | Selling, general and administrative | | (172) | |
| | | | | | (773) | |
| | | | | | |
| | | | | | |
| | | | | | |
| | | | | | |
| | | | | | |
| | | | | | | | | | | | | | | | | | | | |
| | Amount of Gain or (Loss) Recognized in AOCL on Derivative | | Location of Gain or (Loss) Reclassified from AOCL into Income | | Amount of Gain or (Loss) Reclassified from AOCL into Income |
| Fiscal 2023 | | $ | 160 | | | Cost of revenues | | $ | 222 | |
| | | | Research and development | | 75 | |
| | | | Selling, general and administrative | | 80 | |
| | | | | | $ | 377 | |
| | | | | | |
| Fiscal 2022 | | $ | (1,688) | | | Cost of revenues | | $ | (1,816) | |
| | | | Research and development | | (376) | |
| | | | Selling, general and administrative | | (456) | |
| | | | | | $ | (2,648) | |
| | | | | | |
| Fiscal 2021 | | $ | (1,096) | | | Cost of revenues | | $ | 184 | |
| | | | Research and development | | 3 | |
| | | | Selling, general and administrative | | 64 | |
| | | | | | $ | 251 | |
Interest Rate Swaps
Pursuant to our interest rate and risk management strategy, during fiscal 2016 we entered into an interest rate swap agreement with HSBC and other lenders to hedge the interest payments on the Term Loan for the notional amount of $95.6 million. As future levels of LIBOR over the life of the loan are uncertain, we entered into these interest-rate swap agreements to hedge the exposure in interest rate risks associated with the movement in LIBOR rates. By entering into the agreements, we converted a floating rate interest at one-month LIBOR plus 2.00% into a fixed rate interest at 2.94%. The interest rate swap agreement ended as of March 28, 2020.
During fiscal 2020 we entered into an interest rate swap agreement with Union Bank to hedge the interest payments on the Building Term Loan for the notional amount of $18.0 million. As future levels of LIBOR over the life of the loan are uncertain, we entered into this interest-rate swap agreement to hedge the exposure in interest rate risks associated with movement in LIBOR rates. By entering into the agreement, we convert a floating rate interest at one-month LIBOR plus 1.75% into a fixed rate interest at 2.75%. TheThis agreement was amended in fiscal 2023 to replace the benchmark reference rate LIBOR with SOFR to match the Building Term Loan agreement (as amended). After the amendment, the interest rate swap also includescontinues to convert our floating-rate interest into a 0% floor that is effective for one year from the date of the swap.fixed-rate at 2.75%. As of December 26, 2020,30, 2023, the notional amount of the loan that is subject to this interest rate swap was $17.5$14.4 million. See Note 5,6, Debt, for additional information.
For accounting purposes, the interest-rate swap contracts qualify for and are designated as cash flow hedges. All hedging relationships are formally documented, and the hedges are designed to offset changes to future cash flows on hedged transactions. We evaluate hedge effectiveness at hedge inception and on an ongoing basis.
FORMFACTOR, INC.
NOTES TO CONSOLIDATED FINANCIAL STATEMENTS (Continued)
The fair value of our interest rate swap contracts isare determined at the end of each reporting period based on valuation models that use interest rate yield curves as inputs. For accounting purposes, our interest rate swap contracts qualify for, and are designated as, cash flow hedges. The cash flows associated with the interest rate swaps are reported in Net cash provided by operating activities in our Consolidated Statements of Cash Flows and the fair value of the interest rate swap contracts are recorded within Accrued LiabilitiesPrepaid expenses and other current assets and Other assets.
The impact of the interest rate swaps on the Consolidated Statements of Income was as follows (in thousands):
| | | | | | | | | | | | | | | | | | | | | | | | |
| | Amount of Gain or (Loss) Recognized in OCI on Derivative (Effective Portion) | | Location of Gain or (Loss) Reclassified from Accumulated OCI into Income (Effective Portion) | | Amount of Gain or (Loss) Reclassified from Accumulated OCI into Income (Effective Portion) | | | | |
| Fiscal 2020 | | $ | (119) | | | Other income (expense), net | | $ | (64) | | | | | |
| Fiscal 2019 | | $ | (86) | | | Other income (expense), net | | $ | 548 | | | | | |
| Fiscal 2018 | | $ | 340 | | | Other income (expense), net | | $ | 721 | | | | | |
| | | | | | | | | | | | | | | | | | | | | | | | |
| | Amount of Gain Recognized in AOCL on Derivative (Effective Portion) | | Location of Gain Reclassified from AOCL into Income (Effective Portion) | | Amount of Gain or (Loss) Reclassified from AOCL into Income (Effective Portion) | | | | |
| Fiscal 2023 | | $ | 230 | | | Other income (expense), net | | $ | 615 | | | | | |
| Fiscal 2022 | | 1,906 | | | Other income (expense), net | | 106 | | | | | |
| Fiscal 2021 | | 451 | | | Other income (expense), net | | (154) | | | | | |
See also Note 8,10, Fair Value.
Note 8—10—Fair Value
Whenever possible, the fair values of our financial assets and liabilities are determined using quoted market prices of identical securities or quoted market prices of similar securities from active markets. The three levels of inputs that may be used to measure fair value are as follows:
FORMFACTOR, INC.
NOTES TO CONSOLIDATED FINANCIAL STATEMENTS (Continued)
•Level 1 valuations are obtained from real-time quotes for transactions in active exchange markets involving identical securities;
•Level 2 valuations utilize significant observable inputs, such as quoted prices for similar assets or liabilities, quoted prices near the reporting date in markets that are less active, or other inputs that are observable or can be corroborated by observable market data for substantially the full term of the assets or liabilities; and
•Level 3 valuations utilize unobservable inputs to the valuation methodology and include our own data about assumptions market participants would use in pricing the asset or liability based on the best information available under the circumstances.
We did not have any transfers of assets or liabilities measured at fair value on a recurring basis to or from Level 1, Level 2 or Level 3 during fiscal 2020, 20192023, 2022 or 2018.2021.
The carrying values of Cash, Accounts receivable, net, Restricted cash, Prepaid expenses and other current assets, Accounts payable, and Accrued liabilities and Current portion of term loans, net of unamortized issuance costs approximate fair value due to their short maturities.
No changes were made to our valuation techniques during fiscal 2020.2023.
Cash Equivalents
The fair value of our cash equivalents is determined based on quoted market prices for similar or identical securities.
Marketable Securities
We classify our marketable securities as available-for-sale and value them utilizing a market approach. Our investments are priced by pricing vendors who provide observable inputs for their pricing without applying significant judgment. Broker pricing is used mainly when a quoted price is not available, the investment is not priced by our pricing vendors or when a broker price is more reflective of fair value. Our broker-priced investments are categorized as Level 2 investments because fair value is based on similar assets without applying significant judgments. In addition, all of our investments have a sufficient level of trading volume to demonstrate that the fair value is appropriate.
Contingent Consideration
Contingent consideration, arising from the acquisition of FRT (see Note 4, Acquisitions), is a cash amount equal to 1.5x EBIT as defined in the purchase agreement, up to a maximum of €10.3 million, payable subject to the performance of the acquired
FORMFACTOR, INC.
NOTES TO CONSOLIDATED FINANCIAL STATEMENTS (Continued)
business in calendar 2020. We originally estimated the fair value of contingent consideration at acquisition using a probability weighted approach. Key assumptions in determining the fair value of contingent consideration included estimating the probability of achieving certain EBIT levels and discounting at an appropriate discount rate. Based on actual results during the earnout period, contingent consideration as of December 26, 2020 was estimated to be $4.0 million, a net decrease of $1.4 million from $5.4 million as of December 28, 2019.
Assets and liabilities Measured at Fair Value on a Recurring Basis
Assets and liabilities measured at fair value on a recurring basis were as follows (in thousands):
| | December 26, 2020 | Level 1 | | Level 2 | | Level 3 | | Total |
| December 30, 2023 | | December 30, 2023 | Level 1 | | Level 2 | | Level 3 | | Total |
| Assets: | Assets: | | | | | | | |
| Cash equivalents: | Cash equivalents: | |
| Cash equivalents: | |
| Cash equivalents: | |
| Money market funds | Money market funds | $ | 43,019 | | | $ | 0 | | | $ | 0 | | | $ | 43,019 | |
| | Marketable securities: | |
| U.S. Treasuries | 40,726 | | | 0 | | | 0 | | | 40,726 | |
| Certificates of deposit | 0 | | | 2,179 | | | 0 | | | 2,179 | |
| Agency securities | 0 | | | 575 | | | 0 | | | 575 | |
| Corporate bonds | 0 | | | 24,330 | | | 0 | | | 24,330 | |
| Money market funds | |
| Money market funds | |
| U.S. treasuries | |
| | | 40,726 | | | 27,084 | | | 0 | | | 67,810 | |
| 115,561 | |
| | 115,561 | |
| | 115,561 | |
| Marketable securities: | |
| U.S. treasuries | |
| U.S. treasuries | |
| U.S. treasuries | |
| | U.S. agency securities | |
| U.S. agency securities | |
| U.S. agency securities | |
| Corporate bonds | |
| Commercial paper | |
| 45,837 | |
| Foreign exchange derivative contracts | Foreign exchange derivative contracts | 0 | | | 1,057 | | | 0 | | | 1,057 | |
| | Interest rate swap derivative contracts | |
| Interest rate swap derivative contracts | |
| Interest rate swap derivative contracts | Interest rate swap derivative contracts | 0 | | | 57 | | | 0 | | | 57 | |
| Total assets | Total assets | $ | 83,745 | | | $ | 28,198 | | | $ | 0 | | | $ | 111,943 | |
| Liabilities: | Liabilities: | | | | | | | |
| Foreign exchange derivative contracts | Foreign exchange derivative contracts | $ | 0 | | | $ | 0 | | | $ | 0 | | | $ | 0 | |
| Interest rate swap derivative contracts | 0 | | | (87) | | | 0 | | | (87) | |
| Contingent consideration | 0 | | | 0 | | | (4,012) | | | (4,012) | |
| Foreign exchange derivative contracts | |
| Foreign exchange derivative contracts | |
| | Total liabilities | Total liabilities | $ | 0 | | | $ | (87) | | | $ | (4,012) | | | $ | (4,099) | |
| | Total liabilities | |
| | Total liabilities | |
FORMFACTOR, INC.
| | December 28, 2019 | Level 1 | | Level 2 | | Level 3 | | Total |
| December 31, 2022 | | December 31, 2022 | Level 1 | | Level 2 | | Level 3 | | Total |
| Assets: | Assets: | | | | | | | |
| Cash equivalents: | Cash equivalents: | |
| Cash equivalents: | |
| Cash equivalents: | |
| Money market funds | |
| Money market funds | |
| Money market funds | Money market funds | $ | 17,056 | | | $ | 0 | | | $ | 0 | | | $ | 17,056 | |
| | Commercial paper | |
| Commercial paper | |
| Commercial paper | |
| U.S. agency securities | |
| 21,279 | |
| Marketable securities: | Marketable securities: | |
| U.S. Treasuries | 10,468 | | | 0 | | | 0 | | | 10,468 | |
| U.S. treasuries | |
| U.S. treasuries | |
| U.S. treasuries | |
| Certificates of deposit | Certificates of deposit | 0 | | | 3,590 | | | 0 | | | 3,590 | |
| Agency securities | 0 | | | 24,430 | | | 0 | | | 24,430 | |
| U.S. agency securities | |
| Corporate bonds | Corporate bonds | 0 | | | 33,928 | | | 0 | | | 33,928 | |
| Commercial paper | Commercial paper | 0 | | | 3,911 | | | 0 | | | 3,911 | |
| 10,468 | | | 65,859 | | | 0 | | | 76,327 | |
| Foreign exchange derivative contract | 0 | | | 41 | | | 0 | | | 41 | |
| 25,019 | |
| Foreign exchange derivative contracts | |
| Promissory note receivable | |
| Interest rate swap derivative contracts | Interest rate swap derivative contracts | 0 | | | 26 | | | 0 | | | 26 | |
| Total assets | Total assets | $ | 27,524 | | | $ | 65,926 | | | $ | 0 | | | $ | 93,450 | |
| Liabilities: | Liabilities: | | | | | | | |
| Foreign exchange derivative contracts | Foreign exchange derivative contracts | $ | 0 | | | $ | (240) | | | $ | 0 | | | $ | (240) | |
| Contingent consideration | 0 | | | 0 | | | (5,364) | | | (5,364) | |
| Foreign exchange derivative contracts | |
| Foreign exchange derivative contracts | |
| | Total liabilities | Total liabilities | $ | 0 | | | $ | (240) | | | $ | (5,364) | | | $ | (5,604) | |
| | Total liabilities | |
| | Total liabilities | |
Assets and Liabilities Measured at Fair Value on a Non-Recurring Basis
We measure and report our non-financial assets such as Property, plant and equipment, Goodwill and Intangible assets at fair value on a non-recurring basis if we determine these assets to be impaired or in the period when we make a business
FORMFACTOR, INC.
NOTES TO CONSOLIDATED FINANCIAL STATEMENTS (Continued)
acquisition. Other than as discussed in Note 4, Acquisitions,and Note 8, Restructuring Charges, there were 0no assets or liabilities measured at fair value on a nonrecurringnon-recurring basis during fiscal 2020, 20192023, 2022 or 2018.2021.
Note 9—11—Goodwill and Intangible Assets
Goodwill
Goodwill by reportable segment was as follows (in thousands):
| | | | | | | | | | | | | | | | | | | | |
| | Probe Cards | | Systems | | Total |
| Goodwill, gross, as of December 30, 2017 | | $ | 172,482 | | | $ | 17,438 | | | $ | 189,920 | |
| Foreign currency translation | | 0 | | | (706) | | | (706) | |
| Goodwill, gross, as of December 29, 2018 | | 172,482 | | | 16,732 | | | 189,214 | |
| Addition - FRT acquisition | | 0 | | | 10,148 | | | 10,148 | |
| Foreign currency translation | | 0 | | | (166) | | | (166) | |
| Goodwill, gross, as of December 28, 2019 | | 172,482 | | | 26,714 | | | 199,196 | |
| Addition - FRT acquisition | | 0 | | | 975 | | | 975 | |
| Addition - Baldwin Park acquisition | | 5,590 | | | 0 | | | 5,590 | |
| Addition - HPD acquisition | | 0 | | | 4,654 | | | 4,654 | |
| Foreign currency translation | | 0 | | | 2,346 | | | 2,346 | |
| Goodwill, gross, as of December 26, 2020 | | $ | 178,072 | | | $ | 34,689 | | | $ | 212,761 | |
| | | | | | | | | | | | | | | | | | | | |
| | Probe Cards | | Systems | | Total |
| Goodwill, as of December 25, 2021 | | $ | 178,424 | | | $ | 33,875 | | | $ | 212,299 | |
| | | | | | |
| | | | | | |
| Addition - Woburn acquisition | | — | | | 550 | | | 550 | |
| Foreign currency translation | | — | | | (1,405) | | | (1,405) | |
| Goodwill, as of December 31, 2022 | | 178,424 | | | 33,020 | | | 211,444 | |
| | | | | | |
| Reduction - FRT divestiture | | — | | | (10,660) | | | (10,660) | |
| Foreign currency translation | | — | | | 306 | | | 306 | |
| Goodwill, as of December 30, 2023 | | $ | 178,424 | | | $ | 22,666 | | | $ | 201,090 | |
We have 0t recorded any goodwill impairments as of December 26, 2020.
FORMFACTOR, INC.
Intangible Assets
Intangible assets were as follows (in thousands):
| | December 26, 2020 | | December 28, 2019 |
| | December 30, 2023 | | | | December 30, 2023 | | December 31, 2022 |
| Other Intangible Assets | Other Intangible Assets | | Gross | | Accumulated Amortization | | Net | | Gross | | Accumulated Amortization | | Net | Other Intangible Assets | | Gross | | Accumulated Amortization | | Net | | Gross | | Accumulated Amortization | | Net |
| Existing developed technologies | Existing developed technologies | | $ | 176,265 | | | $ | 137,754 | | | $ | 38,511 | | | $ | 154,951 | | | $ | 116,138 | | | $ | 38,813 | |
| Trade name | Trade name | | 8,162 | | | 7,363 | | | 799 | | | 7,816 | | | 6,976 | | | 840 | |
| Customer relationships | Customer relationships | | 52,488 | | | 33,378 | | | 19,110 | | | 44,229 | | | 27,057 | | | 17,172 | |
| Backlog | | 2,227 | | | 1,900 | | | 327 | | | 1,676 | | | 891 | | | 785 | |
| | In-process research and development | In-process research and development | | 400 | | | 0 | | | 400 | | | 0 | | | 0 | | | 0 | |
| $ | 239,542 | | | $ | 180,395 | | | $ | 59,147 | | | $ | 208,672 | | | $ | 151,062 | | | $ | 57,610 | |
| In-process research and development | |
| In-process research and development | |
| | $ | |
Amortization expense was included in our Consolidated Statements of Income as follows (in thousands):
| | Fiscal Year Ended |
| December 26,
2020 | | December 28,
2019 | | December 29,
2018 |
| | Fiscal Year Ended | | | | Fiscal Year Ended |
| | December 30,
2023 | | | | December 30,
2023 | | December 31,
2022 | | December 25,
2021 |
| Cost of revenues | Cost of revenues | | $ | 21,609 | | | $ | 20,036 | | | $ | 20,530 | |
| Selling, general and administrative | Selling, general and administrative | | 6,382 | | | 7,636 | | | 8,843 | |
| $ | 27,991 | | | $ | 27,672 | | | $ | 29,373 | |
| | $ | |
FORMFACTOR, INC.
NOTES TO CONSOLIDATED FINANCIAL STATEMENTS (Continued)
The estimated future amortization of definite-lived intangible assets, excluding in-process research and development, is as follows (in thousands):
| | Fiscal Year | Fiscal Year | | Amount | Fiscal Year | | Amount |
| 2021 | | $ | 20,207 | |
| 2022 | | 10,594 | |
| 2023 | | 8,364 | |
| 2024 | 2024 | | 5,951 | |
| 2025 | 2025 | | 4,398 | |
| 2026 | |
| 2027 | |
| 2028 | |
| Thereafter | Thereafter | | 9,233 | |
| Total | Total | | $ | 58,747 | |
We did 0tnot record any impairment of intangible assets in fiscal 2020, 20192023, 2022 and 2018.2021.
Note 10—12—Commitments and Contingencies
Leases
See Note 6,7, Leases.
Government Assistance
In January 2023, we received a $18.0 million Grant from the California Governor’s Office of Business and Economic Development. The Grant requires us to create and maintain full-time jobs and make significant infrastructure investments within California over a 5-year term. If we do not meet the requirements of the Grant, we will be required to repay all or a portion of the Grant. See Note 2, Summary of Significant Accounting Policies under the caption “Government Assistance,” for additional information.
Environmental Matters
We are subject to U.S. federal, state, local, and foreign governmental laws and regulations relating to the protection of the environment, including those governing the discharge of pollutants into the air and water, the management and disposal of hazardous substances and wastes, the clean-up of contaminated sites and the maintenance of a safe workplace. We believe that we comply in all material respects with the environmental laws and regulations that apply to us. We did not receive any noticesus as of violationsDecember 30, 2023. There are no matters pending that we currently believe are reasonably possible of environmental laws and regulations in fiscal 2020, 2019having a material impact to our business, consolidated financial condition, results of operations or 2018.cash flows. In the future, we may receive notices of violations of environmental regulations, or otherwise learn of such violations. Environmental contamination or violations may negatively impact our business.
FORMFACTOR, INC.
NOTES TO CONSOLIDATED FINANCIAL STATEMENTS (Continued)
Indemnification Arrangements
We have entered, and may from time to time in the ordinary course of our business enter, into contractual arrangements with third parties that include indemnification obligations. Under these contractual arrangements, we have agreed to defend, indemnify and/or hold the third party harmless from and against certain liabilities. These arrangements include indemnities in favor of customers in the event that our products or services infringe a third party's intellectual property, or cause property damage or other indemnities in favor of our lessors in connection with facility leasehold liabilities that we may cause. In addition, we have entered into indemnification agreements with our directors and certain of our officers, and our bylaws contain indemnification obligations in favor of our directors, officers and agents. These indemnity arrangements may limit the type of the claim, the total amount that we can be required to pay in connection with the indemnification obligation and the time within which an indemnification claim can be made. The duration of the indemnification obligation may vary, and for most arrangements, survives the agreement term and is indefinite. We believe that substantially all of our indemnity arrangements provide either for limitations on the maximum potential future payments we could be obligated to make, or for limitations on the types of claims and damages we could be obligated to indemnify, or both. However, it is not possible to determine or reasonably estimate the maximum potential amount of future payments under these indemnification obligations due to the varying terms of such obligations, a lack of history of prior indemnification claims, the unique facts and circumstances involved in each particular contractual arrangement and in each potential future claim for indemnification, and the contingency of any potential liabilities upon the occurrence of events that are not reasonably determinable. We have not had any material requests for indemnification under these arrangements. We have not recorded any liabilities for these indemnification arrangements on our Consolidated Balance Sheets as of December 26, 202030, 2023 or December 28, 2019.31, 2022.
Legal Matters
From time to time, we may beare subject to legal proceedings and claims in the ordinary course of business. Asbusiness, the outcomes of December 26, 2020,which cannot be estimated with certainty. Our ability to estimate the outcomes may change in the near term and asthe effect of the filing of theseany such change could have a material adverse effect on our financial statements, we were not involved in any material legal proceedings. In the future, we may become a party to additional legal proceedings that may require us to spend significant resources. Litigation can be expensive and disruptive to normal business operations. Theposition, results of legal proceedings are difficult to predict, and the costs incurred in litigation can be substantial, regardless of outcome.operations or cash flows.
FORMFACTOR, INC.
NOTES TO CONSOLIDATED FINANCIAL STATEMENTS (Continued)
Note 11—13—Stockholders' Equity
Preferred Stock
We have authorized 10,000,000 shares of undesignated preferred stock, $0.001 par value, none of which is issued and outstanding. Our Board of Directors shall determine the rights, preferences, privileges and restrictions of the preferred stock, including dividendsdividend rights, conversion rights, voting rights, terms of redemption, liquidation preferences, sinking fund terms and the number of shares constituting any series or the designation of any series.
Common Stock
Each share of common stock has the right to one vote. The holders of common stock are also entitled to receive dividends whenever funds are legally available and when declared by the Board of Directors, subject to the prior rights of holders, if any, of all classes of stock outstanding having priority rights as to dividends. NaNNo dividends have been declared or paid as of December 26, 2020.30, 2023.
Common Stock Repurchase ProgramPrograms
On October 26, 2020, our Board of Directors authorized a two-year program to repurchase up to $50 million of outstanding common stock to offset potential dilution from issuances of common stock under our stock-based incentive plans. Thecompensation programs. During fiscal 2021 and 2022, we repurchased and retired 622,400 shares of common stock for $24.0 million and 676,408 shares of common stock for $26.0 million, respectively, utilizing the remaining shares available for repurchase under the program.
On May 20, 2022, our Board of Directors authorized a two-year program to repurchase up to $75 million of outstanding common stock to offset potential dilution from issuance of common stock under our stock-based compensation programs. During fiscal 2022 and 2023, we repurchased and retired 1,700,893 shares of common stock for $56.4 million and 504,352 shares of common stock for $18.6 million, respectively, utilizing the remaining shares available for repurchase under the program.
On October 30, 2023, our Board of Directors authorized an additional program to repurchase up to $75 million of outstanding common stock, also with the primary purpose of offsetting potential dilution from issuance of common stock under our stock-based compensation programs. This share repurchase program will expire on October 28, 2022. This repurchase program replaced the previous repurchase program that expired in February 2020 to purchase up to $25.0 million of outstanding common stock.30, 2025. During fiscal 2020, 20192023, we repurchased and 2018, we did not repurchase any shares.retired 32,020 shares of common stock for $1.2 million and as of December 30, 2023 $73.8 million remained available for future repurchases.
FORMFACTOR, INC.
NOTES TO CONSOLIDATED FINANCIAL STATEMENTS (Continued)
Equity Incentive Plan
We currently grant equity-based awards under our Equity Incentive Plan, as amended (the "2012 Plan"“2012 Plan”) which was approved by our stockholders. As amended, the 2012 Plan has authorized for issuance a total of 16.827.4 million shares, 6.05.0 million of which were available for grant as of December 26, 2020.30, 2023.
RSUsRestricted stock units (“RSUs”) granted under the 2012 Plan generally vest over three years in annual tranches, though we have granted, and will continue to grant, such awards that vest over a shorter term for employee retention purposes.
The 2012 Plan provides that incentive stock options may be granted to our employees and nonqualified stock options, and all awards other than incentive stock options, may be granted to employees, directors and consultants. The exercise price of incentive stock options must be at least equal to the fair market value of our common stock on the date of grant. All restricted stock units and options granted under the 2012 Plan generally vest over three years and expire after seven years, unless otherwise determined by the Compensation Committee of the Board of Directors.
Stock Options
Stock option activity was as follows:
| | | | | | | | | | | | | | | | | | | | | | | |
| | Outstanding Options | | |
| | Number of
Shares | | Weighted
Average
Exercise Price | | Weighted
Average
Remaining
Contractual
Life in Years | | Aggregate
Intrinsic
Value |
| Outstanding at December 28, 2019 | 361,769 | | | $ | 8.35 | | | | | |
| | | | | | | |
| Options exercised | (255,769) | | | 8.35 | | | | | |
| | | | | | | |
| Outstanding at December 26, 2020 | 106,000 | | | $ | 8.35 | | | 2.16 | | $ | 3,627,900 | |
| Vested and expected to vest at December 26, 2020 | 106,000 | | | $ | 8.35 | | | 2.16 | | $ | 3,627,900 | |
| Exercisable at December 26, 2020 | 106,000 | | | $ | 8.35 | | | 2.16 | | $ | 3,627,900 | |
FORMFACTOR, INC.
NOTES TO CONSOLIDATED FINANCIAL STATEMENTS (Continued)
Restricted Stock Units
RSUs, including Performance Restricted Stock Units ("PRSUs"(“PRSUs”) are converted into shares of our common stock upon vesting on a one-for-one basis. The vesting of RSUs is subject to the employee's continuing service.
RSU activity was as follows:
| | Number of
Shares | | Weighted
Average Grant
Date Fair Value |
| Restricted stock units at December 28, 2019 | 3,069,000 | | | $ | 14.30 | |
| Number of
Shares | | | Number of
Shares | | Weighted
Average Grant
Date Fair Value |
| Restricted stock units at December 31, 2022 | |
| Granted | Granted | 1,274,453 | | | 25.96 | |
| Vested | Vested | (1,453,378) | | | 13.72 | |
| Canceled | Canceled | (49,153) | | | 15.70 | |
| Restricted stock units at December 26, 2020 | 2,840,922 | | | 19.80 | |
| Restricted stock units at December 30, 2023 | |
The PRSUs granted in fiscal 2020, 20192023, 2022 and 20182021 listed below vest based on us achieving certain market performance criteria. The performance criteria are based on a metric called Total Shareholder Return ("TSR"(“TSR”) for the performance period of three years, relative to the TSR of the companies identified as being part of the S&P Semiconductor Select Industry Index (FormFactor peer companies) as of a specific date.
Of the 333,000258,000 PRSUs granted in fiscal 2017, 78,333 shares were forfeited, resulting2020, none of the 191,400 outstanding PRSU awards vested in 255,000 shares vesting in fiscal 2020. These shares achieved2023, at the maximum 125%end of the requisite service period, as the TSR performance which resulted in an additional 63,750 shares issued in fiscal 2020 related to the fiscal 2017 PRSU grant.was not met.
PRSU grant activity was as follows:
| | Fiscal Year Ended |
| December 26, 2020 | | December 28, 2019 | | December 29, 2018 |
| | Fiscal Year Ended | | | | Fiscal Year Ended |
| | December 30, 2023 | | | | December 30, 2023 | | December 31, 2022 | | December 25, 2021 |
| Grant Date | Grant Date | | August 27, 2020 | | June 4, 2019 | | August 16, 2018 | Grant Date | | August 7, 2023 | | August 1, 2022 | | August 2, 2021 |
| Performance period | Performance period | | July 1, 2020 - June 30, 2023 | | July 1, 2019 - June 30, 2022 | | July 1, 2018 - June 30, 2021 | Performance period | | July 1, 2023 - June 30, 2026 | | July 1, 2022 - June 30, 2025 | | July 1, 2021 - June 30, 2024 |
| Number of shares | Number of shares | | 258,000 | | 273,000 | | 318,100 | Number of shares | | 172,680 | | 204,903 | | 197,128 |
| TSR as-of date | TSR as-of date | | August 27, 2020 | | June 4, 2019 | | August 16, 2018 | TSR as-of date | | August 7, 2023 | | August 1, 2022 | | August 2, 2021 |
| Stock-based compensation | Stock-based compensation | | $6.9 million | | $4.4 million | | $4.7 million | Stock-based compensation | | $8.6 million |
Employee Stock Purchase Plan
Our 2012 Employee Stock Purchase Plan (the "ESPP"“ESPP”), as amended, allows for the issuance of a total of 7,000,00012,137,559 shares. The offering periods under the ESPP are 12 months commencing on February 1 of each calendar year and ending on January 31 of the subsequent calendar year, and a six-month fixed offering period commencing on August 1 of each calendar year and ending on January 31 of the subsequent calendar year. The 12-month offering period consists of 2two six-month purchase periods and the six-month offering period consists of 1one six-month purchase period. The price of the common stock purchased is 85% of the lesser of the fair market value of the common stock on the first day of the applicable offering period or the last day of each purchase period. We have treated the 2012 ESPP as a compensatory plan.
During fiscal 2020,2023, employees purchased 485,566363,190 shares under this program at a weighted average exercise price of $16.47$24.29 per share, which represented a weighted average discount of $11.00$7.65 per share from the fair value of the stock purchased. As of December 26, 2020, 2,171,65630, 2023, 3,613,021 shares remained available for issuance.
FORMFACTOR, INC.
NOTES TO CONSOLIDATED FINANCIAL STATEMENTS (Continued)
Note 12—14—Stock-Based Compensation
Stock-Based Compensation Expense
Certain information regarding our stock-based compensation was as follows (in thousands, except per share amounts):
| | Fiscal Year Ended | | | Fiscal Year Ended |
| December 30, 2023 | | | December 30, 2023 | | December 31, 2022 | | December 25, 2021 |
| | Fiscal Year Ended |
| December 26, 2020 | | December 28, 2019 | | December 29, 2018 |
| | Weighted average grant date per share fair value of RSUs granted | |
| Weighted average grant date per share fair value of RSUs granted | |
| Weighted average grant date per share fair value of RSUs granted | Weighted average grant date per share fair value of RSUs granted | $ | 25.96 | | | $ | 15.12 | | | $ | 13.79 | |
| Total intrinsic value of stock options exercised | Total intrinsic value of stock options exercised | 4,688 | | | 1,814 | | | 631 | |
| Fair value of RSUs vested | Fair value of RSUs vested | $ | 42,597 | | | $ | 23,450 | | | $ | 17,541 | |
Pre-tax stock-based compensation expense by financial statement line and related tax benefit in the Consolidated Statements of Income are as follows (in thousands):
| | | | Fiscal Year Ended | | Fiscal Year Ended |
| | | December 26, 2020 | | December 28, 2019 | | December 29, 2018 | | December 30, 2023 | | December 31, 2022 | | December 25, 2021 |
| Stock-based compensation expense included in: | Stock-based compensation expense included in: | | | | | |
| Cost of revenues | Cost of revenues | $ | 3,951 | | | $ | 4,055 | | | $ | 3,525 | |
| Cost of revenues | |
| Cost of revenues | |
| Research and development | Research and development | 5,824 | | | 6,367 | | | 5,398 | |
| Selling, general and administrative | Selling, general and administrative | 14,055 | | | 12,754 | | | 8,904 | |
| | Total stock-based compensation | Total stock-based compensation | $ | 23,830 | | | $ | 23,176 | | | $ | 17,827 | |
| Stock-based compensation tax benefit | $ | 4,962 | | | $ | 911 | | | $ | 453 | |
| Total stock-based compensation | |
| Total stock-based compensation | |
| Stock-based compensation tax benefit (expense) | |
Unrecognized Stock-Based Compensation Expense
Unrecognized stock-based compensation expense at December 26, 202030, 2023 consisted of the following (in thousands):
| | | Unrecognized Expense | | | | Unrecognized Expense | | Weighted Average Recognition Period (Years) |
| | Unrecognized Expense | | Weighted Average Recognition Period (Years) |
| | Restricted stock units | |
| Restricted stock units | |
| Restricted stock units | Restricted stock units | | $ | 32,122 | | | 2.2 | | $ | 48,040 | | | 2.0 | | 2.0 |
| Performance restricted stock units | Performance restricted stock units | | 9,075 | | | 2.1 | Performance restricted stock units | | 10,902 | | | 2.0 | | 2.0 |
| Employee stock purchase plan | Employee stock purchase plan | | 248 | | | 0.1 | Employee stock purchase plan | | 375 | | | 0.1 | | 0.1 |
| Total unrecognized stock-based compensation expense | Total unrecognized stock-based compensation expense | | $ | 41,445 | | | 2.2 | Total unrecognized stock-based compensation expense | | $ | 59,317 | | | 2.0 | | 2.0 |
Valuation Assumptions
The following assumptions were used in estimating the fair value of PRSUs:
| | | | | | | | | | | | | | | | | |
| Fiscal Year Ended |
| December 30, 2023 | | December 31, 2022 | | December 25, 2021 |
| PRSUs: | | | | | |
| Dividend yield | — | % | | — | % | | — | % |
| Expected volatility | 50.7 | % | | 53.0 | % | | 52.5 | % |
| Risk-free interest rate | 4.4 | % | | 2.8 | % | | 0.3 | % |
| Expected life (in years) | 2.9 | | 2.9 | | 2.9 |
FORMFACTOR, INC.
NOTES TO CONSOLIDATED FINANCIAL STATEMENTS (Continued)
Valuation Assumptions
The following assumptions were used in estimating the fair value of PRSUs:
| | | | | | | | | | | | | | | | | |
| Fiscal Year Ended |
| December 26, 2020 | | December 28, 2019 | | December 29, 2018 |
| PRSUs: | | | | | |
| Dividend yield | 0 | % | | 0 | % | | 0 | % |
| Expected volatility | 52.01 | % | | 47.34 | % | | 45.61 | % |
| Risk-free interest rate | 0.18 | % | | 1.83 | % | | 2.67 | % |
| Expected life (in years) | 2.8 | | 3.1 | | 2.9 |
The following assumptions were used in estimating the fair value of shares under the Employee Stock Purchase Plan:
| | | | | | | | | | | | | | | | | |
| Fiscal Year Ended |
| December 26, 2020 | | December 28, 2019 | | December 29, 2018 |
| Employee Stock Purchase Plan: | | | | | |
| Dividend yield | 0 | % | | 0 | % | | 0 | % |
| Expected volatility | 30.4% - 74.4% | | 36.6% - 59.5% | | 44.9% - 48.9% |
| Risk-free interest rate | 0.10% - 1.54% | | 2.04% - 2.46% | | 0.83% - 2.22% |
| Expected life (in years) | 0.5 - 1.0 | | 0.5 - 1.0 | | 0.5 - 1.0 |
| | | | | | | | | | | | | | | | | |
| Fiscal Year Ended |
| December 30, 2023 | | December 31, 2022 | | December 25, 2021 |
| Employee Stock Purchase Plan: | | | | | |
| Dividend yield | — | % | | — | % | | — | % |
| Expected volatility | 40.6% - 60.2% | | 42.6% - 60.8% | | 33.6% - 74.4% |
| Risk-free interest rate | 0.8% - 5.5% | | 0.1% - 3.0% | | 0.1% - 1.5% |
| Expected life (in years) | 0.5 - 1.0 | | 0.5 - 1.0 | | 0.5 - 1.0 |
Note 13—15—Income Taxes
Components of Income Before Income Taxes
The components of income before income taxes were as follows (in thousands):
| | | | Fiscal Year Ended | | Fiscal Year Ended |
| | | December 26, 2020 | | December 28, 2019 | | December 29, 2018 | | December 30, 2023 | | December 31, 2022 | | December 25, 2021 |
| United States | United States | $ | 72,950 | | | $ | 41,115 | | | $ | 20,877 | |
| Foreign | Foreign | 12,225 | | | 9,948 | | | 13,050 | |
| $ | 85,175 | | | $ | 51,063 | | | $ | 33,927 | |
| $ | |
Provision for Income Taxes
The components of the provision (benefit) for income taxes are as follows (in thousands):
| | | | Fiscal Year Ended | | Fiscal Year Ended |
| | | December 26, 2020 | | December 28, 2019 | | December 29, 2018 | | December 30, 2023 | | December 31, 2022 | | December 25, 2021 |
| Current provision: | Current provision: | | | | | | Current provision: | | | |
| Federal | Federal | $ | 1,799 | | | $ | 179 | | | $ | 79 | |
| State | State | 1,194 | | | 2,302 | | | 388 | |
| Foreign | Foreign | 4,278 | | | 4,202 | | | 4,687 | |
| 7,271 | | | 6,683 | | | 5,154 | |
| 18,980 | |
| Deferred provision (benefit): | Deferred provision (benefit): | | | | | | Deferred provision (benefit): | | | |
| Federal | Federal | 1,472 | | | 8,128 | | | (72,295) | |
| State | State | (267) | | | (1,898) | | | (2,056) | |
| Foreign | Foreign | (1,824) | | | (1,196) | | | (912) | |
| (619) | | | 5,034 | | | (75,263) | |
| Total provision (benefit) for income taxes | $ | 6,652 | | | $ | 11,717 | | | $ | (70,109) | |
| (12,100) | |
| Total provision for income taxes | |
FORMFACTOR, INC.
NOTES TO CONSOLIDATED FINANCIAL STATEMENTS (Continued)
Tax Rate Reconciliation
The following is a reconciliation of the difference between income taxes computed by applying the federal statutory rate of 21% and the provision (benefit) from income taxes (in thousands):
| | | | Fiscal Year Ended | | Fiscal Year Ended |
| | | December 26, 2020 | | December 28, 2019 | | December 29, 2018 | | December 30, 2023 | | December 31, 2022 | | December 25, 2021 |
| U.S. statutory federal tax rate | U.S. statutory federal tax rate | $ | 17,887 | | | $ | 10,723 | | | $ | 7,125 | |
| State taxes, net of federal benefit | 663 | | | 441 | | | 778 | |
| State taxes and credits, net of federal benefit | |
| Stock-based compensation | Stock-based compensation | (4,962) | | | (911) | | | (453) | |
| Research and development credits | (6,576) | | | (6,436) | | | (3,213) | |
| Tax credits | |
| Foreign taxes at rates different than the U.S. | Foreign taxes at rates different than the U.S. | 415 | | | 1,454 | | | 1,287 | |
| Other permanent differences | Other permanent differences | 400 | | | (148) | | | 152 | |
Foreign gain exclusion(1) | |
| Global intangible low-taxed income | Global intangible low-taxed income | 0 | | | 1,369 | | | 1,828 | |
| Foreign Derived Intangible Income | (3,668) | | | 0 | | | 0 | |
| Foreign derived intangible income | |
| Change in valuation allowance | Change in valuation allowance | 1,862 | | | 2,567 | | | (75,803) | |
| Tax contingencies, net of reversals | |
| Other | Other | 631 | | | 2,658 | | | (1,810) | |
| Total | Total | $ | 6,652 | | | $ | 11,717 | | | $ | (70,109) | |
(1) The rate reconciliation includes an exclusion of a portion of the gain on the sale of the FRT business under German tax law.
Deferred Tax Assets and Liabilities
Deferred tax assets and liabilities are recognized for the future tax consequences of differences between the carrying amounts of assets and liabilities and their respective tax basis using enacted tax rates in effect for the year in which the differences are expected to be reversed.
Significant deferred tax assets and liabilities consisted of the following (in thousands):
| | | |
| | |
| | |
| | | | As of |
| | | December 26, 2020 | | December 28, 2019 |
| Tax credits | Tax credits | $ | 42,927 | | | $ | 44,696 | |
| Tax credits | |
| Tax credits | |
| Inventory reserve | |
| Inventory reserve | |
| Inventory reserve | Inventory reserve | 13,401 | | | 12,350 | |
| Other reserves and accruals | Other reserves and accruals | 9,470 | | | 5,852 | |
| Other reserves and accruals | |
| Other reserves and accruals | |
| Non-statutory stock options | Non-statutory stock options | 2,794 | | | 2,982 | |
| Depreciation and amortization | 20,961 | | | 27,758 | |
| Non-statutory stock options | |
| Non-statutory stock options | |
| Lease liability | |
| Lease liability | |
| Lease liability | |
| Research and development expenditures capitalization | |
| Research and development expenditures capitalization | |
| Research and development expenditures capitalization | |
| Net operating loss carryforwards | |
| Net operating loss carryforwards | |
| Net operating loss carryforwards | Net operating loss carryforwards | 18,421 | | | 21,410 | |
| Gross deferred tax assets | Gross deferred tax assets | 107,974 | | | 115,048 | |
| Gross deferred tax assets | |
| Gross deferred tax assets | |
| Valuation allowance | |
| Valuation allowance | |
| Valuation allowance | Valuation allowance | (38,466) | | | (36,604) | |
| Total deferred tax assets | Total deferred tax assets | 69,508 | | | 78,444 | |
| Total deferred tax assets | |
| Total deferred tax assets | |
| Right-of-use assets | |
| Right-of-use assets | |
| Right-of-use assets | |
| Acquired intangibles and fixed assets | |
| Acquired intangibles and fixed assets | |
| Acquired intangibles and fixed assets | Acquired intangibles and fixed assets | (8,395) | | | (13,997) | |
| Unrealized investment gains | Unrealized investment gains | (106) | | | (106) | |
| Unrealized investment gains | |
| Unrealized investment gains | |
| Tax on undistributed earnings | |
| Tax on undistributed earnings | |
| Tax on undistributed earnings | Tax on undistributed earnings | (110) | | | (75) | |
| Total deferred tax liabilities | Total deferred tax liabilities | (8,611) | | | (14,178) | |
| Total deferred tax liabilities | |
| Total deferred tax liabilities | |
| Net deferred tax assets | Net deferred tax assets | $ | 60,897 | | | $ | 64,266 | |
| Net deferred tax assets | |
| Net deferred tax assets | |
We are required to evaluate the realizability of our deferred tax assets in both our U.S. and non-U.S. jurisdictions on an ongoing basis to determine whether there is a need for a valuation allowance with respect to such deferred tax assets. From the fourth quarterAs of fiscal 2009 to the third quarter of fiscal 2018,December 30, 2023, we maintained a 100% valuation allowance against most of our U.S.$45.9 million, primarily related to California deferred tax assets because there was insufficient positive evidence to overcome the existing negative evidence such that it was not more likely than not that the U.S. deferred tax assets were realizable. While we reported U.S. pre-tax income in fiscal 2015 and fiscal 2017, because we reported U.S. pre-tax losses during the previous seven fiscal years, we continued to maintain the 100% valuation allowance through the third quarter of fiscal 2018.
The valuation allowance decreased by $75.8 million in fiscal 2018 as we released the valuation allowance against a significant portion of the U.S. federal deferred tax assets and a portion of the U.S. state deferred tax assets. We determined that the positive
FORMFACTOR, INC.
NOTES TO CONSOLIDATED FINANCIAL STATEMENTS (Continued)
evidence overcame any negative evidence and concluded that it was more likely than not that the U.S. deferred tax assets were realizable after considering the reported positive operating performance in the U.S. for two consecutive fiscal years, the reported cumulative three-year U.S. pre-tax profit, and the expected positive operating performance in the U.S. for 2019.
As of December 26, 2020, we maintained a valuation allowance of $38.5 million, primarily related to California deferred tax assets arising from research credits and foreign tax credit carryovers, due to uncertainty about the future realization of these assets. We believe that future reversals of taxable temporary differences, and our forecast of continued earnings in both our U.S. and non-U.S. jurisdictions, support our decision to not record a valuation allowance on other deferred tax assets.
Tax Credits and Carryforwards
Tax credits and carryforwards available to us at December 26, 202030, 2023 consisted of the following (in thousands):
| | | | | | | | | | | | | | |
| | Amount | | Latest Expiration Date |
| Federal research and development tax credit | | $ | 36,57919,672 | | | 2023-20402040-2042 |
| Foreign tax credit carryforwards | | 1,059948 | | | 2021-20272024-2027 |
| California research credits | | 42,61557,077 | | | Indefinite |
| State net operating loss carryforwards | | 247,990241,241 | | | 2022-Indefinite2026-Indefinite |
| Singapore net operating loss carryforwards | | 7,0464,279 | | | Indefinite |
Undistributed Earnings
As of December 26, 2020,30, 2023, unremitted earnings of foreign subsidiaries was estimated at $34.4$39.3 million. We intend to permanently invest $12.0 million of undistributed earnings indefinitely outside of the U.S. To the extent we repatriate the remaining $22.4$27.3 million of undistributed foreign earnings to the U.S., we established a deferred tax liability of $0.1$0.2 million for foreign withholding taxes. Our estimates are provisional and subject to further analysis.change because of the complexity and variety of assumptions necessary to compute the tax.
Unrecognized Tax Benefits
We recognize the benefits of tax return positions if we determine that the positions are “more-likely-than-not” to be sustained by the taxing authority. Interest and penalties accrued on unrecognized tax benefits are recorded as tax expense in the period incurred.
The following table reflects changes in the unrecognized tax benefits (in thousands):
| | | | Fiscal Year Ended | | Fiscal Year Ended |
| | | December 26, 2020 | | December 28, 2019 | | December 29, 2018 | | December 30, 2023 | | December 31, 2022 | | December 25, 2021 |
| Unrecognized tax benefit, beginning balance | Unrecognized tax benefit, beginning balance | $ | 28,800 | | | $ | 25,224 | | | $ | 18,296 | |
| Additions based on tax positions related to the current year | Additions based on tax positions related to the current year | 3,072 | | | 3,679 | | | 1,677 | |
| Additions based on tax positions from prior years | Additions based on tax positions from prior years | 702 | | | 0 | | | 5,332 | |
| Reductions for tax positions of prior years | Reductions for tax positions of prior years | 0 | | | (5) | | | (7) | |
| Reductions due to lapse of the applicable statute of limitations | Reductions due to lapse of the applicable statute of limitations | (77) | | | (98) | | | (74) | |
| Unrecognized tax benefit, ending balance | Unrecognized tax benefit, ending balance | $ | 32,497 | | | $ | 28,800 | | | $ | 25,224 | |
| | Interest and penalties recognized as a component of Provision (benefit) for income taxes | $ | 50 | | | $ | 59 | | | $ | 71 | |
| Interest and penalties recognized as a component of provision for income taxes | |
| Interest and penalties recognized as a component of provision for income taxes | |
| Interest and penalties recognized as a component of provision for income taxes | |
| Interest and penalties accrued at period end | Interest and penalties accrued at period end | 204 | | | 212 | | | 230 | |
Of the unrecognized tax benefits at December 26, 2020, $15.830, 2023, $24.0 million would impact the effective tax rate if recognized.
The amount of income taxes we pay is subject to ongoing audits by federal, state and foreign tax authorities which might result in proposed assessments. Our estimate for the potential outcome for any uncertain tax issue is judgmental in nature. However, we believe we have adequately provided for any reasonably foreseeable outcome related to those matters. Our future results may include favorable or unfavorable adjustments to our estimated tax liabilities in the period the assessments are made or resolved or when statutes of limitation on potential assessments expire. As of December 26, 2020,30, 2023, changes to our uncertain tax positions in the next 12 months that are reasonably possible are not expected to have a significant impact on our financial position or results of operations.
FORMFACTOR, INC.
NOTES TO CONSOLIDATED FINANCIAL STATEMENTS (Continued)
At December 26, 2020,30, 2023, our tax years 20172020 through 2020, 20162023, 2019 through 20202023 and 20152018 through 2020,2023 remain open for examination in the federal, state and foreign jurisdictions, respectively. However, to the extent allowed by law, the taxing authorities may have the right to examine prior periods where net operating losses and credits were generated and carried forward, and make adjustments up to the net operating loss and credit carryforward amounts.
FORMFACTOR, INC.
NOTES TO CONSOLIDATED FINANCIAL STATEMENTS (Continued)
Note 14—16—Employee Benefit Plans
We have an employee savings plan that qualifies as a deferred salary arrangement under Section 401(k) of the Internal Revenue Code. The plan is designed to provide employees with an accumulation of funds for retirement on a tax-deferred basis and provide for annual discretionary employer contributions. The total charge to net income under the 401(k) plan for fiscal 2020, 20192023, 2022 and 20182021 aggregated $2.2to $2.3 million, $2.1$2.7 million and $2.0$2.7 million, respectively.
Note 15—17—Segments and Geographic Information
We operate in 2two reportable segments consisting of the Probe Cards Segment and the Systems Segment.
Our chief operating decision maker ("CODM"(“CODM”) is our Chief Executive Officer, who reviews operating results to make decisions about allocating resources and assessing performance for the entire company.
The following table summarizes the operating results by reportable segment (dollars in thousands):
| | Fiscal 2020 |
| Probe Cards | | Systems | | Corporate and Other | | Total |
| Fiscal 2023 | | | Fiscal 2023 |
| Probe Cards | | | Probe Cards | | Systems | | Corporate and Other | | Total |
| Revenues | Revenues | $ | 581,739 | | | $ | 111,877 | | | $ | 0 | | | $ | 693,616 | |
| Gross profit | Gross profit | $ | 263,215 | | | $ | 51,835 | | | $ | (27,130) | | | $ | 287,920 | |
| Gross margin | Gross margin | 45.2 | % | | 46.3 | % | | 0 | % | | 41.5 | % | Gross margin | 37.2 | % | | 51.3 | % | | | | 39.0 | % |
| | | | | | | | | | | | | | | | | | | | | | | |
| Fiscal 2022 |
| Probe Cards | | Systems | | Corporate and Other | | Total |
| Revenues | $ | 591,422 | | | $ | 156,515 | | | $ | — | | | $ | 747,937 | |
| Gross profit | 235,562 | | | 80,937 | | | (20,490) | | | 296,009 | |
| Gross margin | 39.8 | % | | 51.7 | % | | | | 39.6 | % |
| | | | | | | | | | | | | | | | | | | | | | | |
| Fiscal 2019 |
| Probe Cards | | Systems | | Corporate and Other | | Total |
| Revenues | $ | 491,363 | | | $ | 98,101 | | | $ | 0 | | | $ | 589,464 | |
| Gross profit | $ | 211,382 | | | $ | 50,927 | | | $ | (24,813) | | | $ | 237,496 | |
| Gross margin | 43.0 | % | | 51.9 | % | | 0 | % | | 40.3 | % |
| | Fiscal 2018 |
| Probe Cards | | Systems | | Corporate and Other | | Total |
| Fiscal 2021 | | | Fiscal 2021 |
| Probe Cards | | | Probe Cards | | Systems | | Corporate and Other | | Total |
| Revenues | Revenues | $ | 434,269 | | | $ | 95,406 | | | $ | 0 | | | $ | 529,675 | |
| Gross profit | Gross profit | $ | 187,320 | | | $ | 47,074 | | | $ | (24,055) | | | $ | 210,339 | |
| Gross margin | Gross margin | 43.1 | % | | 49.3% | | 0 | % | | 39.7 | % | Gross margin | 44.2 | % | | 48.3 | % | | | | 41.9 | % |
Operating results provide useful information to our management for assessment of our performance and results of operations. Certain components of our operating results are utilized to determine executive compensation along with other measures.
Corporate and Other includes unallocated expenses relating to amortization of stock-based compensation expense, intangible assets, share-based compensation expense, acquisition-related costs, including charges related to inventory and fixed assets stepped up to fair value, restructuring charges, and other costs, which are not used in evaluating the results of, or in allocating resources to, our reportable segments. Acquisition-related costs include transaction costs and any costs directly related to the acquisition and integration of acquired businesses.
FORMFACTOR, INC.
NOTES TO CONSOLIDATED FINANCIAL STATEMENTS (Continued)
The following table summarizes revenue, by geographic region, as a percentage of total revenues based upon ship-to location:
| | | | | | | | | | | | | | | | | |
| Fiscal Year Ended |
| December 26, 2020 | | December 28, 2019 | | December 29, 2018 |
| China | 25.2 | % | | 18.0 | % | | 14.7 | % |
| Taiwan | 21.7 | | | 14.7 | | | 20.3 | |
| United States | 18.4 | | | 26.3 | | | 25.2 | |
| South Korea | 12.5 | | | 19.8 | | | 17.2 | |
| Europe | 9.5 | | | 7.0 | | | 7.5 | |
| Japan | 6.3 | | | 8.9 | | | 9.4 | |
Asia-Pacific (1) | 4.8 | | | 3.7 | | | 4.9 | |
| Rest of World | 1.6 | | | 1.6 | | | 0.8 | |
| Total Revenues | 100.0 | % | | 100.0 | % | | 100.0 | % |
(1)Asia-Pacific includes all countries in the region except Taiwan, South Korea, China, and Japan, which are disclosed separately. | | | | | | | | | | | | | | | | | |
| Fiscal Year Ended |
| December 30, 2023 | | December 31, 2022 | | December 25, 2021 |
| United States | 25.9 | % | | 17.1 | % | | 15.9 | % |
| Taiwan | 22.3 | | | 22.7 | | | 24.2 | |
| South Korea | 17.8 | | | 14.9 | | | 16.0 | |
| China | 13.8 | | | 21.5 | | | 21.2 | |
| Europe | 5.9 | | | 5.2 | | | 5.7 | |
| Japan | 5.5 | | | 5.1 | | | 4.7 | |
| Malaysia | 4.0 | | | 6.7 | | | 6.4 | |
| Singapore | 2.8 | | | 5.3 | | | 4.7 | |
| Rest of World | 2.0 | | | 1.5 | | | 1.2 | |
| Total Revenues | 100.0 | % | | 100.0 | % | | 100.0 | % |
The following table summarizes revenue by market (in thousands):
| | | | Fiscal Year Ended | | Fiscal Year Ended |
| | | December 26, 2020 | | December 28, 2019 | | December 29, 2018 | | December 30, 2023 | | December 31, 2022 | | December 25, 2021 |
| Foundry & Logic | Foundry & Logic | $ | 446,183 | | | $ | 318,552 | | | $ | 258,459 | |
| DRAM | DRAM | 109,734 | | | 147,257 | | | 135,333 | |
| Flash | Flash | 25,822 | | | 25,554 | | | 40,477 | |
| Systems | Systems | 111,877 | | | 98,101 | | | 95,406 | |
| Total revenues | Total revenues | $ | 693,616 | | | $ | 589,464 | | | $ | 529,675 | |
The following table summarizes revenue by timing of revenue recognition (in thousands):
| | Fiscal Year Ended |
| December 26,
2020 | | December 28,
2019 | | December 29,
2018 |
| Probe Cards | | Systems | | Total | | Probe Cards | | Systems | | Total | | Probe Cards | | Systems | | Total |
| Fiscal Year Ended | | | Fiscal Year Ended |
| December 30, 2023 | | | December 30, 2023 | | December 31, 2022 | | December 25, 2021 |
| Probe Cards | | | Probe Cards | | Systems | | Total | | Probe Cards | | Systems | | Total | | Probe Cards | | Systems | | Total |
| Products transferred at a point in time | Products transferred at a point in time | $ | 579,569 | | | $ | 104,858 | | | $ | 684,427 | | | $ | 488,925 | | | $ | 93,837 | | | $ | 582,762 | | | $ | 432,033 | | | $ | 91,514 | | | $ | 523,547 | |
| Services transferred over time | Services transferred over time | 2,170 | | | 7,019 | | | 9,189 | | | 2,438 | | | 4,264 | | | 6,702 | | | 2,236 | | | 3,892 | | | 6,128 | |
| Total | Total | $ | 581,739 | | | $ | 111,877 | | | $ | 693,616 | | | $ | 491,363 | | | $ | 98,101 | | | $ | 589,464 | | | $ | 434,269 | | | $ | 95,406 | | | $ | 529,675 | |
Long-lived assets, comprised of Operating lease, right-of-use-assets,Right-of-use assets, Property, plant and equipment, net, Goodwill and Intangibles, net, reported based on the location of the asset was as follows (in thousands):
| | December 26, 2020 | | December 28, 2019 | | December 29, 2018 |
| December 30, 2023 | | | December 30, 2023 | | December 31, 2022 | | December 25, 2021 |
| United States | United States | $ | 347,654 | | | $ | 287,600 | | | $ | 280,405 | |
| Europe | Europe | 51,791 | | | 52,309 | | | 26,118 | |
| Asia-Pacific | Asia-Pacific | 7,322 | | | 7,064 | | | 4,385 | |
| Total | Total | $ | 406,767 | | | $ | 346,973 | | | $ | 310,908 | |
Note 16—18—New Accounting Pronouncements
ASU 2016-132023-09
In June 2016,December 2023, the Financial Accounting StandardStandards Board ("FASB"(the “FASB”) issued Accounting Standards Update (“ASU”) 2023-09, “Income Taxes (Topic 740): Improvements to Income Tax Disclosures.”The ASU No. 2016-13, "Measurementincludes requirements that an entity disclose specific categories in the rate reconciliation and provide additional information for reconciling items that are greater than five percent of Credit Losses on Financial Instruments (Topic 326)."the amount computed by multiplying pretax income by the applicable statutory income tax rate. The provisions of this standard require financial assets measured at amortized cost to bealso requires that entities disclose income before income taxes and provision for income taxes disaggregated between
FORMFACTOR, INC.
NOTES TO CONSOLIDATED FINANCIAL STATEMENTS (Continued)
presented atdomestic and foreign. This ASU is effective for annual periods beginning after December 15, 2024, with early adoption permitted. We have not yet determined the net amount expected to be collected. An allowance account would be established to present the net carrying value at the amount expected to be collected. ASU 2016-13 also provides that credit losses relating to available-for-sale debt securities should be recorded through an allowance for credit losses. The guidance was amended through various ASU's subsequent to ASU 2016-13, allimpact of which was effective beginning fiscal 2020. We adopted ASU 2016-13 on a prospective basis on December 29, 2019, the first day of fiscal 2020. The adoption did not have a material effectthis standard on our financial position, results of operations or cash flows.statements.
ASU 2018-152023-07
In August 2018,November 2023, the FASB issued ASU 2018-15, "Intangibles-Goodwill2023-07, “Segment Reporting (Topic 280): Improvements to Reportable Segment Disclosures.” The ASU includes requirements that an entity disclose the title of the CODM and Other-Internal-Use Software (Subtopic 350-40): Customer’s Accountingon an interim and annual basis, significant segment expenses and the composition of other segment items for Implementation Costs Incurred in a Cloud Computing Arrangement That Is a Service Contract."each segment's reported profit. The new guidance clarifies the accounting for implementation costs in cloud computing arrangements.standard also permits disclosure of additional measures of segment profit. This ASU 2018-15 is effective for fiscal years, including interim periods within those fiscal years beginning after December 15, 2019. We adopted ASU 2018-15 on a prospective basis on December 29, 2019, the first day of fiscal 2020. The adoption did not have a material effect on our financial position, results of operations or cash flows.
ASU 2019-12
In December 2019, the FASB issued ASU 2019-12, “Income Taxes (Topic 740),” which simplifies the accounting for income taxes by removing certain exceptions to the general principles in Topic 740. The amendments also improve consistent application of and simplify GAAP for other areas of Topic 740 by clarifying and amending existing guidance. This guidance is effective for fiscal years,2023, and interim periods within those fiscal years beginning after December 15, 2020. Early2024, on a retrospective basis, with early adoption of the amendments is permitted, including adoption in any interim period for which financial statementspermitted. We have not yet been issued. Depending ondetermined the amendment, adoption may be applied on the retrospective, modified retrospective or prospective basis. We do not expect the adoptionimpact of ASU 2019-12 to have a material effectthis standard on our financial position, results of operations or cash flows.statements.
ASU 2020-04
In March 2020, the FASB issued ASU 2020-04, "Referenced“Reference Rate Reform (Topic 848) -: Facilitation of the Effects of Reference Rate Reform on Financial Reporting." ” The amendments in this update apply onlyASU provides temporary optional expedients and exceptions for applying GAAP to contractscontract modifications and hedging relationships, subject to meeting certain criteria, that reference LIBORthe London Interbank Offered Rate (“LIBOR“) or another reference rate expected to be discontinued duediscontinued. In December 2022, the FASB issued ASU 2022-06, “Reference Rate Reform (Topic 848): Deferral of the Sunset Date of Topic 848,” extending the relief offered in Topic 848 from December 31, 2022 to reference rate reform. TheDecember 31, 2024, after which entities will no longer be permitted to apply the optional expedients and exceptions provided byin Topic 848.
In May 2023, the amendments do not apply to contract modifications made and hedging relationshipsCompany entered into or evaluated after December 31, 2022.a rate replacement amendment to its credit facility loan agreement to replace LIBOR with the Secured Overnight Financing Rate (“SOFR”) and concurrently signed an amendment to modify the floating rate option on its interest rate swap to match that of the debt. The amendmentsCompany applied practical expedients provided in this updateTopic 848 allowing the modified instrument to be accounted for and presented in the same manner as the instrument existing before the modification. These modifications did not have a significant impact on our financial statements.
Note 19-Subsequent Events
On February 7, 2024, the Company announced entry into a definitive agreement to sell its China operations to Grand Junction Semiconductor Pte. Ltd. for $25.0 million in cash, subject to customary purchase price adjustments, and establish an exclusive distribution and partnership agreement to continue sales and support of our products to the region. The following subsidiaries are electiveincluded as part of the divestiture: Microprobe HongKong Limited, FormFactor Technology (Suzhou) Co. Ltd., Cascade Microtech Singapore Pte, Ltd, and are effective upon issuance for all entities. We have not yet evaluated the transition approach for our LIBOR indexed contracts and have not determined whether we will be electing such expedients and exceptions.FormFactor International (Shanghai) Trading Co., Ltd.