
| (Mark One) | |||||
| ☒ | ANNUAL REPORT PURSUANT TO SECTION 13 OR 15(d) OF THE SECURITIES EXCHANGE ACT OF 1934 | ||||
| For the fiscal year ended December 31, | |||||
| or | |||||
| ☐ | TRANSITION REPORT PURSUANT TO SECTION 13 OR 15(d) OF THE SECURITIES EXCHANGE ACT OF 1934 | ||||
For the transition period from to | |||||
| Iowa | 42-1447959 | ||||
| (State or other jurisdiction of Incorporation) | (I.R.S. Employer Identification No.) | ||||
| Title of each class | Trading Symbol(s) | Name of each exchange on which registered | ||||||||||||
| Common stock, par value $1 | AEL | New York Stock Exchange | ||||||||||||
| Depositary Shares, each representing a 1/1,000th interest in a share of 5.95% Fixed-Rate Reset Non-Cumulative Preferred Stock, Series A | AELPRA | New York Stock Exchange | ||||||||||||
| Depositary Shares, each representing a 1/1,000th interest in a share of 6.625% Fixed-Rate Reset Non-Cumulative Preferred Stock, Series B | AELPRB | New York Stock Exchange | ||||||||||||
| Large accelerated filer | ☒ | Accelerated filer | ☐ | ||||||||
| Non-accelerated filer | ☐ | Smaller reporting company | ☐ | ||||||||
| Emerging growth company | ☐ | ||||||||||
F-1 | ||||||||
| Exhibit 21.2 | Subsidiaries of American Equity Investment Life Holding Company | |||||||
| Exhibit 23.1 | Consent of Independent Registered Public Accounting Firm | |||||||
| Exhibit 31.1 | Certification | |||||||
| Exhibit 31.2 | Certification | |||||||
| Exhibit 32.1 | Certification | |||||||
| Exhibit 32.2 | Certification | |||||||
| Year Ended December 31, | ||||||||||||||||||||||||||||||||||||||||||||||||||||||||||||||||||||||||||||||||||||||||||||||||||||||||||||||||||||
| 2022 | 2021 | 2020 | ||||||||||||||||||||||||||||||||||||||||||||||||||||||||||||||||||||||||||||||||||||||||||||||||||||||||||||||||||
| Year Ended December 31, | Year Ended December 31, | |||||||||||||||||||||||||||||||||||||||||||||||||||||||||||||||||||||||||||||||||||||||||||||||||||||||||||||||||||
| 2023 | 2023 | 2022 | 2021 | |||||||||||||||||||||||||||||||||||||||||||||||||||||||||||||||||||||||||||||||||||||||||||||||||||||||||||||||||
| Product Type | Product Type | Deposits Collected | Deposits as a % of Total | Deposits Collected | Deposits as a % of Total | Deposits Collected | Deposits as a % of Total | Product Type | Deposits Collected | Deposits as a % of Total | Deposits Collected | Deposits as a % of Total | Deposits Collected | Deposits as a % of Total | ||||||||||||||||||||||||||||||||||||||||||||||||||||||||||||||||||||||||||||||||||||||||||||||||||||||
| (Dollars in thousands) | ||||||||||||||||||||||||||||||||||||||||||||||||||||||||||||||||||||||||||||||||||||||||||||||||||||||||||||||||||||
| (Dollars in thousands) | (Dollars in thousands) | |||||||||||||||||||||||||||||||||||||||||||||||||||||||||||||||||||||||||||||||||||||||||||||||||||||||||||||||||||
| Fixed index annuities | Fixed index annuities | $ | 3,171,420 | 95 | % | $ | 3,450,547 | 58 | % | $ | 2,337,578 | 64 | % | Fixed index annuities | $ | 7,034,426 | 93 | 93 | % | $ | 3,171,420 | 95 | 95 | % | $ | 3,450,547 | 58 | 58 | % | |||||||||||||||||||||||||||||||||||||||||||||||||||||||||||||||||||||||||||||||||||||||
| Annual reset fixed rate annuities | Annual reset fixed rate annuities | 5,709 | — | % | 6,483 | — | % | 8,225 | — | % | Annual reset fixed rate annuities | 5,092 | — | — | % | 5,709 | — | — | % | 6,483 | — | — | % | |||||||||||||||||||||||||||||||||||||||||||||||||||||||||||||||||||||||||||||||||||||||||||||
| Multi-year fixed rate annuities | Multi-year fixed rate annuities | 139,092 | 4 | % | 2,452,994 | 41 | % | 1,303,133 | 35 | % | Multi-year fixed rate annuities | 565,788 | 7 | 7 | % | 139,092 | 4 | 4 | % | 2,452,994 | 41 | 41 | % | |||||||||||||||||||||||||||||||||||||||||||||||||||||||||||||||||||||||||||||||||||||||||||||
| Single premium immediate annuities | Single premium immediate annuities | 18,935 | 1 | % | 59,816 | 1 | % | 33,461 | 1 | % | Single premium immediate annuities | 1,224 | — | — | % | 18,935 | 1 | 1 | % | 59,816 | 1 | 1 | % | |||||||||||||||||||||||||||||||||||||||||||||||||||||||||||||||||||||||||||||||||||||||||||||
| $ | 3,335,156 | 100 | % | $ | 5,969,840 | 100 | % | $ | 3,682,397 | 100 | % | |||||||||||||||||||||||||||||||||||||||||||||||||||||||||||||||||||||||||||||||||||||||||||||||||||||||||
| $ | $ | 7,606,530 | 100 | % | $ | 3,335,156 | 100 | % | $ | 5,969,840 | 100 | % | ||||||||||||||||||||||||||||||||||||||||||||||||||||||||||||||||||||||||||||||||||||||||||||||||||||||||
| December 31, | ||||||||||||||||||||||||||||||||||||||||||||||||||||||||||||||
| 2022 | 2021 | 2020 | ||||||||||||||||||||||||||||||||||||||||||||||||||||||||||||
| (Dollars in thousands) | ||||||||||||||||||||||||||||||||||||||||||||||||||||||||||||||
| December 31, | December 31, | |||||||||||||||||||||||||||||||||||||||||||||||||||||||||||||
| 2023 | 2023 | 2022 | 2021 | |||||||||||||||||||||||||||||||||||||||||||||||||||||||||||
| (Dollars in thousands) | (Dollars in thousands) | |||||||||||||||||||||||||||||||||||||||||||||||||||||||||||||
| Annuity Surrender Charges: | Annuity Surrender Charges: | |||||||||||||||||||||||||||||||||||||||||||||||||||||||||||||
| Average years at issue | ||||||||||||||||||||||||||||||||||||||||||||||||||||||||||||||
| Average years at issue | ||||||||||||||||||||||||||||||||||||||||||||||||||||||||||||||
| Average years at issue | Average years at issue | 11.6 | 11.8 | 12.4 | 11.2 | 11.6 | 11.8 | |||||||||||||||||||||||||||||||||||||||||||||||||||||||
| Average years remaining | Average years remaining | 4.6 | 5.5 | 6.1 | Average years remaining | 4.6 | 5.5 | |||||||||||||||||||||||||||||||||||||||||||||||||||||||
| Average surrender charge percentage remaining | Average surrender charge percentage remaining | 7.9 | % | 9.1 | % | 9.9 | % | Average surrender charge percentage remaining | 7.9 | % | 7.9 | % | 9.1 | % | ||||||||||||||||||||||||||||||||||||||||||||||||
| Annuity Account Value (net of coinsurance) | Annuity Account Value (net of coinsurance) | $ | 47,504,615 | $ | 53,191,277 | $ | 54,056,725 | |||||||||||||||||||||||||||||||||||||||||||||||||||||||
| Financial Strength Rating | Outlook Statement | ||||||||||
| A.M. Best Company, Inc. | |||||||||||
| August 2023 - current | A- | Watch | |||||||||
| January 2011 - | A- | Stable | |||||||||
| S&P Global | |||||||||||
| July 2023 - current | A- | Watch | |||||||||
| August 2020 - | A- | Stable | |||||||||
| March 2020 - August 2020 | A- | Negative | |||||||||
| August 2015 - March 2020 | A- | Stable | |||||||||
| June 2013 - August 2015 | BBB+ | Positive | |||||||||
| October 2011 - June 2013 | BBB+ | Stable | |||||||||
| Fitch Ratings Ltd. | |||||||||||
| April 2021 - current | A- | Stable | |||||||||
| April 2020 - April 2021 | A- | Negative | |||||||||
| August 2019 - April 2020 | A- | Stable | |||||||||
| September 2018 - August 2019 | BBB+ | Positive | |||||||||
| May 2013 - September 2018 | BBB+ | Stable | |||||||||
| High | Low | |||||||||||||||||||||||||||||
| 2022 | ||||||||||||||||||||||||||||||
| High | High | Low | ||||||||||||||||||||||||||||
| 2023 | ||||||||||||||||||||||||||||||
| First Quarter | ||||||||||||||||||||||||||||||
| First Quarter | ||||||||||||||||||||||||||||||
| First Quarter | First Quarter | $44.49 | $35.05 | $48.37 | $31.57 | |||||||||||||||||||||||||
| Second Quarter | Second Quarter | $42.18 | $32.65 | Second Quarter | $53.68 | $35.22 | ||||||||||||||||||||||||
| Third Quarter | Third Quarter | $43.55 | $33.22 | Third Quarter | $54.44 | $51.73 | ||||||||||||||||||||||||
| Fourth Quarter | Fourth Quarter | $46.76 | $28.05 | Fourth Quarter | $56.09 | $52.70 | ||||||||||||||||||||||||
| 2021 | ||||||||||||||||||||||||||||||
| 2022 | ||||||||||||||||||||||||||||||
| First Quarter | ||||||||||||||||||||||||||||||
| First Quarter | ||||||||||||||||||||||||||||||
| First Quarter | First Quarter | $32.54 | $26.21 | $44.49 | $35.05 | |||||||||||||||||||||||||
| Second Quarter | Second Quarter | $33.68 | $29.18 | Second Quarter | $42.18 | $32.65 | ||||||||||||||||||||||||
| Third Quarter | Third Quarter | $33.79 | $27.12 | Third Quarter | $43.55 | $33.22 | ||||||||||||||||||||||||
| Fourth Quarter | Fourth Quarter | $39.88 | $29.46 | Fourth Quarter | $46.76 | $28.05 | ||||||||||||||||||||||||
| Total Number of Shares Purchased | Average Price Paid Per Share | Total Number of Shares Purchased as Part of Publicly Announced Program (a) | Approximate Dollar Value of Shares That May Yet Be Purchased Under Program | |||||||||||||||||||||||
| Period | (shares) | (dollars) | (shares) | (dollars in thousands) | ||||||||||||||||||||||
| October 1, 2022 - October 31, 2022 | 304,688 | $ | 37.84 | 304,688 | $ | 201,586 | ||||||||||||||||||||
| November 1, 2022 - November 30, 2022 | 842,749 | $ | 36.32 | 842,749 | $ | 570,975 | ||||||||||||||||||||
| December 1, 2022 - December 31, 2022 | 50,272 | $ | 38.91 | 50,272 | $ | 569,018 | ||||||||||||||||||||
| Total | 1,197,709 | 1,197,709 | ||||||||||||||||||||||||
| Total Number of Shares Purchased | Average Price Paid Per Share | Total Number of Shares Purchased as Part of Publicly Announced Program (a) | Approximate Dollar Value of Shares That May Yet Be Purchased Under Program | |||||||||||||||||||||||
| Period | (shares) | (dollars) | (shares) | (dollars in thousands) | ||||||||||||||||||||||
| October 1, 2023 - October 31, 2023 | — | $ | — | — | $ | 275,825 | ||||||||||||||||||||
| November 1, 2023 - November 30, 2023 | — | $ | — | — | $ | 275,825 | ||||||||||||||||||||
| December 1, 2023 - December 31, 2023 | — | $ | — | — | $ | 275,825 | ||||||||||||||||||||
| Total | — | — | ||||||||||||||||||||||||
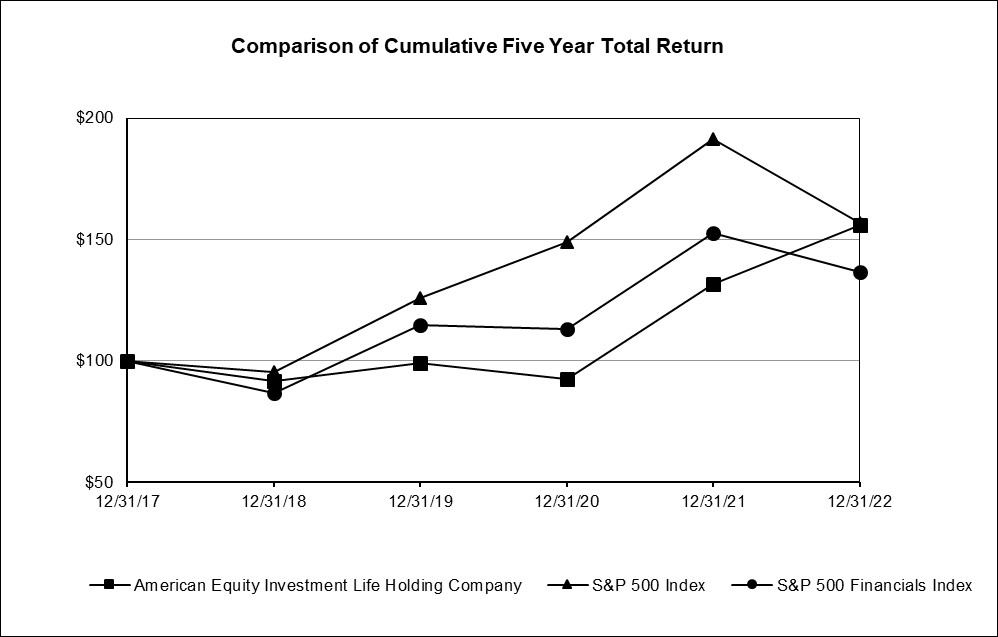
| 12/31/2017 | 12/31/2018 | 12/31/2019 | 12/31/2020 | 12/31/2021 | 12/31/2022 | ||||||||||||||||||||||||||||||||||||||||
| 12/31/2018 | 12/31/2018 | 12/31/2019 | 12/31/2020 | 12/31/2021 | 12/31/2022 | 12/31/2023 | |||||||||||||||||||||||||||||||||||||||
| American Equity Investment Life Holding Co. | American Equity Investment Life Holding Co. | 100.00 | 91.67 | 99.20 | 92.74 | 131.73 | 155.83 | ||||||||||||||||||||||||||||||||||||||
| S&P 500 Index | S&P 500 Index | 100.00 | 95.62 | 125.72 | 148.85 | 191.58 | 156.88 | ||||||||||||||||||||||||||||||||||||||
| S&P 500 Financials Index | S&P 500 Financials Index | 100.00 | 86.97 | 114.91 | 112.96 | 152.54 | 136.48 | ||||||||||||||||||||||||||||||||||||||
| Year Ended December 31, | |||||||||||||||||||||||||||||||||||||||||||||||||||
| 2022 | 2021 | 2020 | |||||||||||||||||||||||||||||||||||||||||||||||||
| Year Ended December 31, | Year Ended December 31, | ||||||||||||||||||||||||||||||||||||||||||||||||||
| 2023 | 2023 | 2022 | 2021 | ||||||||||||||||||||||||||||||||||||||||||||||||
| Average yield on invested assets | Average yield on invested assets | 4.34% | 3.73% | 4.12% | Average yield on invested assets | 4.55% | 4.34% | 3.73% | |||||||||||||||||||||||||||||||||||||||||||
| Aggregate cost of money | Aggregate cost of money | 1.71% | 1.55% | 1.69% | Aggregate cost of money | 1.90% | 1.71% | 1.55% | |||||||||||||||||||||||||||||||||||||||||||
| Aggregate investment spread | Aggregate investment spread | 2.63% | 2.18% | 2.43% | Aggregate investment spread | 2.65% | 2.63% | 2.18% | |||||||||||||||||||||||||||||||||||||||||||
| Impact of: | Impact of: | ||||||||||||||||||||||||||||||||||||||||||||||||||
| Impact of: | |||||||||||||||||||||||||||||||||||||||||||||||||||
| Impact of: | |||||||||||||||||||||||||||||||||||||||||||||||||||
| Investment yield - additional prepayment income | |||||||||||||||||||||||||||||||||||||||||||||||||||
| Investment yield - additional prepayment income | |||||||||||||||||||||||||||||||||||||||||||||||||||
| Investment yield - additional prepayment income | Investment yield - additional prepayment income | 0.03% | 0.11% | 0.08% | 0.01% | 0.03% | 0.11% | ||||||||||||||||||||||||||||||||||||||||||||
| Cost of money benefit from over hedging | Cost of money benefit from over hedging | 0.01% | 0.07% | 0.02% | Cost of money benefit from over hedging | 0.04% | 0.01% | 0.07% | |||||||||||||||||||||||||||||||||||||||||||
| Year Ended December 31, | ||||||||||||||||||||||||||||||||||||||||||||||||||||||||||||||
| Year Ended December 31, | Year Ended December 31, | |||||||||||||||||||||||||||||||||||||||||||||||||||||||||||||
| Product Type | Product Type | 2022 | 2021 | 2020 | Product Type | 2023 | 2022 | 2021 | ||||||||||||||||||||||||||||||||||||||||||||||||||||||
| (Dollars in thousands) | ||||||||||||||||||||||||||||||||||||||||||||||||||||||||||||||
| (Dollars in thousands) | (Dollars in thousands) | |||||||||||||||||||||||||||||||||||||||||||||||||||||||||||||
| American Equity Life: | American Equity Life: | |||||||||||||||||||||||||||||||||||||||||||||||||||||||||||||
| Fixed index annuities | ||||||||||||||||||||||||||||||||||||||||||||||||||||||||||||||
| Fixed index annuities | ||||||||||||||||||||||||||||||||||||||||||||||||||||||||||||||
| Fixed index annuities | Fixed index annuities | $ | 2,692,141 | $ | 2,753,479 | $ | 1,992,059 | |||||||||||||||||||||||||||||||||||||||||||||||||||||||
| Annual reset fixed rate annuities | Annual reset fixed rate annuities | 5,329 | 6,133 | 8,128 | ||||||||||||||||||||||||||||||||||||||||||||||||||||||||||
| Multi-year fixed rate annuities | Multi-year fixed rate annuities | 56,511 | 855,702 | 395,982 | ||||||||||||||||||||||||||||||||||||||||||||||||||||||||||
| Single premium immediate annuities | Single premium immediate annuities | 18,935 | 59,816 | 33,461 | ||||||||||||||||||||||||||||||||||||||||||||||||||||||||||
| 2,772,916 | 3,675,130 | 2,429,630 | ||||||||||||||||||||||||||||||||||||||||||||||||||||||||||||
| 5,689,883 | ||||||||||||||||||||||||||||||||||||||||||||||||||||||||||||||
| Eagle Life: | Eagle Life: | |||||||||||||||||||||||||||||||||||||||||||||||||||||||||||||
| Fixed index annuities | ||||||||||||||||||||||||||||||||||||||||||||||||||||||||||||||
| Fixed index annuities | ||||||||||||||||||||||||||||||||||||||||||||||||||||||||||||||
| Fixed index annuities | Fixed index annuities | 479,279 | 697,068 | 345,519 | ||||||||||||||||||||||||||||||||||||||||||||||||||||||||||
| Annual reset fixed rate annuities | Annual reset fixed rate annuities | 380 | 350 | 97 | ||||||||||||||||||||||||||||||||||||||||||||||||||||||||||
| Multi-year fixed rate annuities | Multi-year fixed rate annuities | 82,581 | 1,597,292 | 907,151 | ||||||||||||||||||||||||||||||||||||||||||||||||||||||||||
| 562,240 | 2,294,710 | 1,252,767 | ||||||||||||||||||||||||||||||||||||||||||||||||||||||||||||
| 1,916,647 | ||||||||||||||||||||||||||||||||||||||||||||||||||||||||||||||
| Consolidated: | Consolidated: | |||||||||||||||||||||||||||||||||||||||||||||||||||||||||||||
| Fixed index annuities | ||||||||||||||||||||||||||||||||||||||||||||||||||||||||||||||
| Fixed index annuities | ||||||||||||||||||||||||||||||||||||||||||||||||||||||||||||||
| Fixed index annuities | Fixed index annuities | 3,171,420 | 3,450,547 | 2,337,578 | ||||||||||||||||||||||||||||||||||||||||||||||||||||||||||
| Annual reset fixed rate annuities | Annual reset fixed rate annuities | 5,709 | 6,483 | 8,225 | ||||||||||||||||||||||||||||||||||||||||||||||||||||||||||
| Multi-year fixed rate annuities | Multi-year fixed rate annuities | 139,092 | 2,452,994 | 1,303,133 | ||||||||||||||||||||||||||||||||||||||||||||||||||||||||||
| Single premium immediate annuities | Single premium immediate annuities | 18,935 | 59,816 | 33,461 | ||||||||||||||||||||||||||||||||||||||||||||||||||||||||||
| Total before coinsurance ceded | Total before coinsurance ceded | 3,335,156 | 5,969,840 | 3,682,397 | ||||||||||||||||||||||||||||||||||||||||||||||||||||||||||
| Coinsurance ceded | Coinsurance ceded | 968,906 | 424,819 | 35,667 | ||||||||||||||||||||||||||||||||||||||||||||||||||||||||||
| Net after coinsurance ceded | Net after coinsurance ceded | $ | 2,366,250 | $ | 5,545,021 | $ | 3,646,730 | |||||||||||||||||||||||||||||||||||||||||||||||||||||||
| Year Ended December 31, | |||||||||||||||||
| 2022 | 2021 | 2020 | |||||||||||||||
| (Dollars in thousands) | |||||||||||||||||
| Increase (decrease) in amortization of deferred sales inducements | $ | 45,682 | $ | (45,107) | $ | 428,101 | |||||||||||
| Increase (decrease) in amortization of deferred policy acquisition costs | 56,853 | (45,662) | 646,785 | ||||||||||||||
| Increase (decrease) in interest sensitive and index product benefits | (53,042) | 243,658 | 285,825 | ||||||||||||||
| Decrease in change in fair value of embedded derivatives | (94,770) | (122,294) | (2,341,279) | ||||||||||||||
| Effect on net income available to common stockholders | 35,543 | (24,017) | 769,611 | ||||||||||||||
| Year Ended December 31, | |||||||||||||||||
| 2023 | 2022 | 2021 | |||||||||||||||
| (Dollars in thousands) | |||||||||||||||||
| Increase (decrease) in market risk benefit (gain) loss | $ | (63,294) | $ | 229,439 | $ | 398,759 | |||||||||||
| Increase (decrease) in policy benefit reserves (1) | (2,296) | 3,051 | 801 | ||||||||||||||
| Increase (decrease) in change in fair value of embedded derivatives | 84,381 | (94,770) | (122,294) | ||||||||||||||
| Effect on net income available to common stockholders | (14,750) | (106,905) | (219,100) | ||||||||||||||
| Year Ended December 31, | |||||||||||||||||||||||||||||||||||||||||||||||||||
| 2022 | 2021 | 2020 | |||||||||||||||||||||||||||||||||||||||||||||||||
| (Dollars in thousands) | |||||||||||||||||||||||||||||||||||||||||||||||||||
| Reconciliation from net income available to common stockholders to non-GAAP operating income available to common stockholders: | |||||||||||||||||||||||||||||||||||||||||||||||||||
| Net income available to common stockholders | $ | 1,177,269 | $ | 430,317 | $ | 637,945 | |||||||||||||||||||||||||||||||||||||||||||||
| Adjustments to arrive at non-GAAP operating income available to common stockholders: | |||||||||||||||||||||||||||||||||||||||||||||||||||
| Year Ended December 31, | Year Ended December 31, | ||||||||||||||||||||||||||||||||||||||||||||||||||
| 2023 | 2023 | 2022 | 2021 | ||||||||||||||||||||||||||||||||||||||||||||||||
| (Dollars in thousands) | (Dollars in thousands) | ||||||||||||||||||||||||||||||||||||||||||||||||||
| Reconciliation from net income available to common stockholders to non-GAAP operating income (loss) available to common stockholders: | |||||||||||||||||||||||||||||||||||||||||||||||||||
| Net income available to American Equity Investment Life Holding Company common stockholders | |||||||||||||||||||||||||||||||||||||||||||||||||||
| Net income available to American Equity Investment Life Holding Company common stockholders | |||||||||||||||||||||||||||||||||||||||||||||||||||
| Net income available to American Equity Investment Life Holding Company common stockholders | |||||||||||||||||||||||||||||||||||||||||||||||||||
| Adjustments to arrive at non-GAAP operating income (loss) available to common stockholders: | |||||||||||||||||||||||||||||||||||||||||||||||||||
| Net realized losses on financial assets, including credit losses | |||||||||||||||||||||||||||||||||||||||||||||||||||
| Net realized losses on financial assets, including credit losses | |||||||||||||||||||||||||||||||||||||||||||||||||||
| Net realized losses on financial assets, including credit losses | Net realized losses on financial assets, including credit losses | 36,428 | 10,299 | 59,355 | |||||||||||||||||||||||||||||||||||||||||||||||
| Change in fair value of derivatives and embedded derivatives | Change in fair value of derivatives and embedded derivatives | (1,080,356) | (187,290) | (784,005) | |||||||||||||||||||||||||||||||||||||||||||||||
| Capital markets impact on the change in fair value of market risk benefits | |||||||||||||||||||||||||||||||||||||||||||||||||||
| Net investment income | Net investment income | 664 | — | — | |||||||||||||||||||||||||||||||||||||||||||||||
| Other revenue | Other revenue | 5,969 | — | — | |||||||||||||||||||||||||||||||||||||||||||||||
| Expenses incurred related to acquisition | |||||||||||||||||||||||||||||||||||||||||||||||||||
| Income taxes | Income taxes | 222,966 | 37,184 | 155,808 | |||||||||||||||||||||||||||||||||||||||||||||||
| Non-GAAP operating income available to common stockholders | 362,940 | 290,510 | 69,103 | ||||||||||||||||||||||||||||||||||||||||||||||||
| Non-GAAP operating income (loss) available to common stockholders | |||||||||||||||||||||||||||||||||||||||||||||||||||
| Impact of excluding notable items | Impact of excluding notable items | (26,572) | 78,036 | 310,117 | |||||||||||||||||||||||||||||||||||||||||||||||
| Non-GAAP operating income available to common stockholders, excluding notable items | $ | 336,368 | $ | 368,546 | $ | 379,220 | |||||||||||||||||||||||||||||||||||||||||||||
| Per common share - assuming dilution: | Per common share - assuming dilution: | ||||||||||||||||||||||||||||||||||||||||||||||||||
| Non-GAAP operating income available to common stockholders | $ | 3.96 | $ | 3.07 | $ | 0.75 | |||||||||||||||||||||||||||||||||||||||||||||
| Per common share - assuming dilution: | |||||||||||||||||||||||||||||||||||||||||||||||||||
| Per common share - assuming dilution: | |||||||||||||||||||||||||||||||||||||||||||||||||||
| Non-GAAP operating income (loss) available to common stockholders | |||||||||||||||||||||||||||||||||||||||||||||||||||
| Non-GAAP operating income (loss) available to common stockholders | |||||||||||||||||||||||||||||||||||||||||||||||||||
| Non-GAAP operating income (loss) available to common stockholders | |||||||||||||||||||||||||||||||||||||||||||||||||||
| Impact of excluding notable items | Impact of excluding notable items | (0.29) | 0.83 | 3.36 | |||||||||||||||||||||||||||||||||||||||||||||||
| Non-GAAP operating income available to common stockholders, excluding notable items | $ | 3.67 | $ | 3.90 | $ | 4.11 | |||||||||||||||||||||||||||||||||||||||||||||
| Notable items impacting non-GAAP operating income available to common stockholders: | Notable items impacting non-GAAP operating income available to common stockholders: | ||||||||||||||||||||||||||||||||||||||||||||||||||
| Notable items impacting non-GAAP operating income available to common stockholders: | |||||||||||||||||||||||||||||||||||||||||||||||||||
| Notable items impacting non-GAAP operating income available to common stockholders: | |||||||||||||||||||||||||||||||||||||||||||||||||||
| Expense associated with strategic incentive award | |||||||||||||||||||||||||||||||||||||||||||||||||||
| Expense associated with strategic incentive award | |||||||||||||||||||||||||||||||||||||||||||||||||||
| Expense associated with strategic incentive award | |||||||||||||||||||||||||||||||||||||||||||||||||||
| Impact of actuarial assumption updates | |||||||||||||||||||||||||||||||||||||||||||||||||||
| Impact of actuarial assumption updates | $ | (26,572) | $ | 78,036 | $ | 340,895 | |||||||||||||||||||||||||||||||||||||||||||||
| Tax benefit related to the CARES Act | — | — | (30,778) | ||||||||||||||||||||||||||||||||||||||||||||||||
| Total notable items | Total notable items | $ | (26,572) | $ | 78,036 | $ | 310,117 | ||||||||||||||||||||||||||||||||||||||||||||
| Total notable items | |||||||||||||||||||||||||||||||||||||||||||||||||||
| Total notable items | |||||||||||||||||||||||||||||||||||||||||||||||||||
| Year Ended December 31, | |||||||||||||||||
| 2022 | 2021 | 2020 | |||||||||||||||
| (Dollars in thousands) | |||||||||||||||||
| Increase (decrease) in amortization of deferred sales inducements | $ | 8,670 | $ | (66,066) | $ | 57,467 | |||||||||||
| Increase (decrease) in amortization of deferred policy acquisition costs | 10,520 | (78,183) | 90,970 | ||||||||||||||
| Increase (decrease) in interest sensitive and index product benefits | (53,042) | 243,658 | 285,825 | ||||||||||||||
| Effect on non-GAAP operating income available to common stockholders | 26,572 | (78,036) | (340,895) | ||||||||||||||
| Year Ended December 31, | |||||||||||||||||
| 2023 | 2022 | 2021 | |||||||||||||||
| (Dollars in thousands) | |||||||||||||||||
| Increase (decrease) in market risk benefit (gain) loss | $ | (32,822) | $ | 230,832 | $ | 398,753 | |||||||||||
| Increase (decrease) in policy benefit reserves (1) | (2,296) | 3,051 | 3,051 | ||||||||||||||
| Effect on non-GAAP operating income (loss) available to common stockholders | 27,568 | (181,890) | 317,425 | ||||||||||||||
| Year Ended December 31, | |||||||||||||||||||||||||||||||||||||||||||||||||||
| 2022 | 2021 | 2020 | |||||||||||||||||||||||||||||||||||||||||||||||||
| (Dollars in thousands) | |||||||||||||||||||||||||||||||||||||||||||||||||||
| Year Ended December 31, | Year Ended December 31, | ||||||||||||||||||||||||||||||||||||||||||||||||||
| 2023 | 2023 | 2022 | 2021 | ||||||||||||||||||||||||||||||||||||||||||||||||
| (Dollars in thousands) | (Dollars in thousands) | ||||||||||||||||||||||||||||||||||||||||||||||||||
| Surrender charges | Surrender charges | $ | 72,699 | $ | 67,657 | $ | 72,551 | ||||||||||||||||||||||||||||||||||||||||||||
| Lifetime income benefit riders (LIBR) fees | Lifetime income benefit riders (LIBR) fees | 157,655 | 174,974 | 178,676 | |||||||||||||||||||||||||||||||||||||||||||||||
| $ | |||||||||||||||||||||||||||||||||||||||||||||||||||
| $ | 230,354 | $ | 242,631 | $ | 251,227 | ||||||||||||||||||||||||||||||||||||||||||||||
| Withdrawals from annuity policies subject to surrender charges | |||||||||||||||||||||||||||||||||||||||||||||||||||
| Withdrawals from annuity policies subject to surrender charges | |||||||||||||||||||||||||||||||||||||||||||||||||||
| Withdrawals from annuity policies subject to surrender charges | Withdrawals from annuity policies subject to surrender charges | $ | 1,145,415 | $ | 1,099,098 | $ | 776,305 | ||||||||||||||||||||||||||||||||||||||||||||
| Average surrender charge collected on withdrawals subject to surrender charges | Average surrender charge collected on withdrawals subject to surrender charges | 6.3 | % | 6.2 | % | 9.3 | % | Average surrender charge collected on withdrawals subject to surrender charges | 6.4 | % | 6.3 | % | 6.2 | % | |||||||||||||||||||||||||||||||||||||
| Fund values on policies subject to LIBR fees | Fund values on policies subject to LIBR fees | $ | 19,473,279 | $ | 22,183,623 | $ | 22,986,903 | ||||||||||||||||||||||||||||||||||||||||||||
| Fund values on policies subject to LIBR fees | |||||||||||||||||||||||||||||||||||||||||||||||||||
| Fund values on policies subject to LIBR fees | |||||||||||||||||||||||||||||||||||||||||||||||||||
| Weighted average per policy LIBR fee | Weighted average per policy LIBR fee | 0.81 | % | 0.79 | % | 0.78 | % | Weighted average per policy LIBR fee | 0.89 | % | 0.81 | % | 0.79 | % | |||||||||||||||||||||||||||||||||||||
| Year Ended December 31, | |||||||||||||||||
| 2022 | 2021 | 2020 | |||||||||||||||
| (Dollars in thousands) | |||||||||||||||||
| Call options: | |||||||||||||||||
| Gain (loss) on option expiration | $ | (287,328) | $ | 1,368,381 | $ | 15,042 | |||||||||||
| Change in unrealized gains/losses | (831,440) | (20,456) | 19,562 | ||||||||||||||
| Warrants | 264 | 810 | — | ||||||||||||||
| Interest rate swaps | (19,624) | — | — | ||||||||||||||
| Interest rate caps | — | — | 62 | ||||||||||||||
| $ | (1,138,128) | $ | 1,348,735 | $ | 34,666 | ||||||||||||
| Year Ended December 31, | |||||||||||||||||
| 2023 | 2022 | 2021 | |||||||||||||||
| (Dollars in thousands) | |||||||||||||||||
| Call options: | |||||||||||||||||
| Proceeds received at option expiration | $ | 344,876 | $ | 312,133 | $ | 2,019,477 | |||||||||||
| Pro rata amortization of option cost | (682,918) | (647,132) | (630,015) | ||||||||||||||
| Change in unrealized gains/losses | 586,786 | (783,769) | (41,537) | ||||||||||||||
| Warrants | 1,206 | 264 | 810 | ||||||||||||||
| Interest rate swaps | 9,096 | (19,624) | — | ||||||||||||||
| $ | 259,046 | $ | (1,138,128) | $ | 1,348,735 | ||||||||||||
| Year Ended December 31, | |||||||||||||||||||||||||||||||||||||||||||||||||||
| 2022 | 2021 | 2020 | |||||||||||||||||||||||||||||||||||||||||||||||||
| Year Ended December 31, | Year Ended December 31, | ||||||||||||||||||||||||||||||||||||||||||||||||||
| 2023 | 2023 | 2022 | 2021 | ||||||||||||||||||||||||||||||||||||||||||||||||
| S&P 500 Index | S&P 500 Index | ||||||||||||||||||||||||||||||||||||||||||||||||||
| Point-to-point strategy | |||||||||||||||||||||||||||||||||||||||||||||||||||
| Point-to-point strategy | |||||||||||||||||||||||||||||||||||||||||||||||||||
| Point-to-point strategy | Point-to-point strategy | 0.0% - 12.5% | 0.0% - 42.6% | 0.0% - 17.4% | 0.0% - 14.0% | 0.0% - 12.5% | 0.0% - 42.6% | ||||||||||||||||||||||||||||||||||||||||||||
| Monthly average strategy | Monthly average strategy | 0.0% - 8.6% | 0.0% - 29.4% | 0.0% - 11.9% | Monthly average strategy | 0.0% - 8.7% | 0.0% - 8.6% | 0.0% - 29.4% | |||||||||||||||||||||||||||||||||||||||||||
| Monthly point-to-point strategy | Monthly point-to-point strategy | 0.0% - 12.9% | 0.0% - 21.7% | 0.0% - 14.0% | Monthly point-to-point strategy | 0.0% - 14.2% | 0.0% - 12.9% | 0.0% - 21.7% | |||||||||||||||||||||||||||||||||||||||||||
| Volatility control index point-to-point strategy | Volatility control index point-to-point strategy | 0.0% - 7.3% | 0.0% - 9.7% | 0.0% - 9.3% | Volatility control index point-to-point strategy | 0.0% - 5.6% | 0.0% - 7.3% | 0.0% - 9.7% | |||||||||||||||||||||||||||||||||||||||||||
| Fixed income (bond index) strategies | Fixed income (bond index) strategies | 0.0% - 6.5% | 0.0% - 10.0% | 0.0% - 13.6% | Fixed income (bond index) strategies | 0.0% - 6.0% | 0.0% - 6.5% | 0.0% - 10.0% | |||||||||||||||||||||||||||||||||||||||||||
| Year Ended December 31, | |||||||||||||||||
| 2023 | 2022 | 2021 | |||||||||||||||
| (Dollars in thousands) | |||||||||||||||||
| Asset liability management fees | $ | 22,448 | $ | 12,686 | $ | 5,470 | |||||||||||
| Amortization of deferred gain | 53,418 | 29,559 | 10,690 | ||||||||||||||
| $ | 75,866 | $ | 42,245 | $ | 16,160 | ||||||||||||
| Year Ended December 31, | |||||||||||||||||
| 2022 | 2021 | 2020 | |||||||||||||||
| (Dollars in thousands) | |||||||||||||||||
| Asset liability management fees | $ | 12,686 | $ | 5,470 | $ | — | |||||||||||
| Amortization of deferred gain | 31,235 | 10,200 | — | ||||||||||||||
| $ | 43,921 | $ | 15,670 | $ | — | ||||||||||||
| Year Ended December 31, | |||||||||||||||||
| 2022 | 2021 | 2020 | |||||||||||||||
| (Dollars in thousands) | |||||||||||||||||
| Index credits on index policies | $ | 305,292 | $ | 1,977,888 | $ | 747,489 | |||||||||||
| Interest credited (including changes in minimum guaranteed interest for fixed index annuities) | 249,579 | 253,725 | 198,745 | ||||||||||||||
| Lifetime income benefit riders | 334,779 | 449,793 | 597,036 | ||||||||||||||
| $ | 889,650 | $ | 2,681,406 | $ | 1,543,270 | ||||||||||||
| Year Ended December 31, | |||||||||||||||||
| 2023 | 2022 | 2021 | |||||||||||||||
| (Dollars in thousands) | |||||||||||||||||
| Index credits on index policies | $ | 326,471 | $ | 305,292 | $ | 1,977,888 | |||||||||||
| Interest credited (including changes in minimum guaranteed interest for fixed index annuities) | 240,952 | 249,579 | 253,679 | ||||||||||||||
| $ | 567,423 | $ | 554,871 | $ | 2,231,567 | ||||||||||||
| Year Ended December 31, | |||||||||||||||||
| 2022 | 2021 | 2020 | |||||||||||||||
| (Dollars in thousands) | |||||||||||||||||
| Amortization of deferred sales inducements before gross profit adjustments | $ | 234,778 | $ | 112,790 | $ | 243,067 | |||||||||||
| Gross profit adjustments: | |||||||||||||||||
| Fair value accounting for derivatives and embedded derivatives | 177,131 | 40,899 | 202,660 | ||||||||||||||
| Net realized losses on investments | (3,361) | (997) | (7,563) | ||||||||||||||
| Amortization of deferred sales inducements after gross profit adjustments | $ | 408,548 | $ | 152,692 | $ | 438,164 | |||||||||||
| Year Ended December 31, | |||||||||||||||||||||||||||||||||||||||||||||||||||
| 2022 | 2021 | 2020 | |||||||||||||||||||||||||||||||||||||||||||||||||
| (Dollars in thousands) | |||||||||||||||||||||||||||||||||||||||||||||||||||
| Year Ended December 31, | Year Ended December 31, | ||||||||||||||||||||||||||||||||||||||||||||||||||
| 2023 | 2023 | 2022 | 2021 | ||||||||||||||||||||||||||||||||||||||||||||||||
| (Dollars in thousands) | (Dollars in thousands) | ||||||||||||||||||||||||||||||||||||||||||||||||||
| Fixed index annuities - embedded derivatives | Fixed index annuities - embedded derivatives | $ | (2,561,676) | $ | (876,803) | $ | (1,922,085) | ||||||||||||||||||||||||||||||||||||||||||||
| Other changes in difference between policy benefit reserves computed using derivative accounting vs. long-duration contracts accounting | 648,580 | 520,863 | 635,298 | ||||||||||||||||||||||||||||||||||||||||||||||||
| Reinsurance related embedded derivative | Reinsurance related embedded derivative | (439,502) | (2,362) | — | |||||||||||||||||||||||||||||||||||||||||||||||
| $ | (2,352,598) | $ | (358,302) | $ | (1,286,787) | ||||||||||||||||||||||||||||||||||||||||||||||
| $ | |||||||||||||||||||||||||||||||||||||||||||||||||||
| Year Ended December 31, | |||||||||||||||||
| 2022 | 2021 | 2020 | |||||||||||||||
| (Dollars in thousands) | |||||||||||||||||
| Amortization of deferred policy acquisition costs before gross profit adjustments | $ | 330,290 | $ | 181,589 | $ | 368,139 | |||||||||||
| Gross profit adjustments: | |||||||||||||||||
| Fair value accounting for derivatives and embedded derivatives | 290,905 | 88,576 | 293,827 | ||||||||||||||
| Net realized losses on investments | (5,895) | (1,837) | (12,412) | ||||||||||||||
| Amortization of deferred policy acquisition costs after gross profit adjustments | $ | 615,300 | $ | 268,328 | $ | 649,554 | |||||||||||
| Year Ended December 31, | |||||||||||||||||||||||||||||||||||||||||||||||||||
| 2022 | 2021 | 2020 | |||||||||||||||||||||||||||||||||||||||||||||||||
| (Dollars in thousands) | |||||||||||||||||||||||||||||||||||||||||||||||||||
| Year Ended December 31, | Year Ended December 31, | ||||||||||||||||||||||||||||||||||||||||||||||||||
| 2023 | 2023 | 2022 | 2021 | ||||||||||||||||||||||||||||||||||||||||||||||||
| (Dollars in thousands) | (Dollars in thousands) | ||||||||||||||||||||||||||||||||||||||||||||||||||
| Salary and benefits | Salary and benefits | $ | 162,061 | $ | 139,155 | $ | 95,815 | ||||||||||||||||||||||||||||||||||||||||||||
| Other | Other | 77,555 | 104,557 | 87,821 | |||||||||||||||||||||||||||||||||||||||||||||||
| Total other operating costs and expenses | Total other operating costs and expenses | $ | 239,616 | $ | 243,712 | $ | 183,636 | ||||||||||||||||||||||||||||||||||||||||||||
| December 31, | |||||||||||||||||||||||||||||||||||||||||||||||||||||||||||||||||||||
| 2022 | 2021 | ||||||||||||||||||||||||||||||||||||||||||||||||||||||||||||||||||||
| Carrying Amount | Percent | Carrying Amount | Percent | ||||||||||||||||||||||||||||||||||||||||||||||||||||||||||||||||||
| (Dollars in thousands) | |||||||||||||||||||||||||||||||||||||||||||||||||||||||||||||||||||||
| December 31, | December 31, | ||||||||||||||||||||||||||||||||||||||||||||||||||||||||||||||||||||
| 2023 | 2023 | 2022 | |||||||||||||||||||||||||||||||||||||||||||||||||||||||||||||||||||
| Carrying Amount | Carrying Amount | Percent | Carrying Amount | Percent | |||||||||||||||||||||||||||||||||||||||||||||||||||||||||||||||||
| (Dollars in thousands) | (Dollars in thousands) | ||||||||||||||||||||||||||||||||||||||||||||||||||||||||||||||||||||
| Fixed maturity securities: | Fixed maturity securities: | ||||||||||||||||||||||||||||||||||||||||||||||||||||||||||||||||||||
| U.S. Government and agencies | |||||||||||||||||||||||||||||||||||||||||||||||||||||||||||||||||||||
| U.S. Government and agencies | |||||||||||||||||||||||||||||||||||||||||||||||||||||||||||||||||||||
| U.S. Government and agencies | U.S. Government and agencies | $ | 169,071 | 0.4 | % | $ | 1,078,746 | 1.9 | % | $ | 171,141 | 0.4 | 0.4 | % | $ | 169,071 | 0.4 | 0.4 | % | ||||||||||||||||||||||||||||||||||||||||||||||||||
| States, municipalities and territories | States, municipalities and territories | 3,822,943 | 8.5 | % | 3,758,761 | 6.5 | % | States, municipalities and territories | 3,075,024 | 7.7 | 7.7 | % | 3,822,943 | 8.5 | 8.5 | % | |||||||||||||||||||||||||||||||||||||||||||||||||||||
| Foreign corporate securities and foreign governments | Foreign corporate securities and foreign governments | 616,938 | 1.4 | % | 375,097 | 0.6 | % | Foreign corporate securities and foreign governments | 408,936 | 1.0 | 1.0 | % | 616,938 | 1.4 | 1.4 | % | |||||||||||||||||||||||||||||||||||||||||||||||||||||
| Corporate securities | Corporate securities | 20,201,774 | 44.8 | % | 32,631,189 | 57.0 | % | Corporate securities | 16,076,506 | 40.0 | 40.0 | % | 20,201,774 | 44.8 | 44.8 | % | |||||||||||||||||||||||||||||||||||||||||||||||||||||
| Residential mortgage backed securities | Residential mortgage backed securities | 1,366,927 | 3.0 | % | 1,125,049 | 2.0 | % | Residential mortgage backed securities | 1,208,317 | 3.0 | 3.0 | % | 1,366,927 | 3.0 | 3.0 | % | |||||||||||||||||||||||||||||||||||||||||||||||||||||
| Commercial mortgage backed securities | Commercial mortgage backed securities | 3,447,075 | 7.6 | % | 4,682,900 | 8.2 | % | Commercial mortgage backed securities | 2,624,123 | 6.5 | 6.5 | % | 3,447,075 | 7.6 | 7.6 | % | |||||||||||||||||||||||||||||||||||||||||||||||||||||
| Other asset backed securities | Other asset backed securities | 5,155,254 | 11.4 | % | 5,146,567 | 9.0 | % | Other asset backed securities | 5,202,395 | 12.9 | 12.9 | % | 5,155,254 | 11.4 | 11.4 | % | |||||||||||||||||||||||||||||||||||||||||||||||||||||
| Total fixed maturity securities | Total fixed maturity securities | 34,779,982 | 77.1 | % | 48,798,309 | 85.2 | % | Total fixed maturity securities | 28,766,442 | 71.5 | 71.5 | % | 34,779,982 | 77.1 | 77.1 | % | |||||||||||||||||||||||||||||||||||||||||||||||||||||
| Mortgage loans on real estate | Mortgage loans on real estate | 6,778,977 | 15.0 | % | 5,650,480 | 9.9 | % | ||||||||||||||||||||||||||||||||||||||||||||||||||||||||||||||
| Mortgage loans on real estate | |||||||||||||||||||||||||||||||||||||||||||||||||||||||||||||||||||||
| Mortgage loans on real estate | 7,231,667 | 18.0 | % | 6,778,977 | 15.0 | % | |||||||||||||||||||||||||||||||||||||||||||||||||||||||||||||||
| Real estate investments | Real estate investments | 1,056,063 | 2.3 | % | 337,939 | 0.6 | % | Real estate investments | 1,334,247 | 3.3 | 3.3 | % | 1,056,063 | 2.3 | 2.3 | % | |||||||||||||||||||||||||||||||||||||||||||||||||||||
| Limited partnerships and limited liability companies | Limited partnerships and limited liability companies | 1,266,779 | 2.8 | % | 520,120 | 0.9 | % | Limited partnerships and limited liability companies | 1,089,591 | 2.7 | 2.7 | % | 1,266,779 | 2.8 | 2.8 | % | |||||||||||||||||||||||||||||||||||||||||||||||||||||
| Derivative instruments | Derivative instruments | 431,727 | 1.0 | % | 1,277,480 | 2.2 | % | Derivative instruments | 1,207,288 | 3.0 | 3.0 | % | 431,727 | 1.0 | 1.0 | % | |||||||||||||||||||||||||||||||||||||||||||||||||||||
| Other investments | Other investments | 829,900 | 1.8 | % | 690,344 | 1.2 | % | Other investments | 590,271 | 1.5 | 1.5 | % | 829,900 | 1.8 | 1.8 | % | |||||||||||||||||||||||||||||||||||||||||||||||||||||
| 45,143,428 | 100.0 | % | 57,274,672 | 100.0 | % | ||||||||||||||||||||||||||||||||||||||||||||||||||||||||||||||||
| 40,219,506 | 40,219,506 | 100.0 | % | 45,143,428 | 100.0 | % | |||||||||||||||||||||||||||||||||||||||||||||||||||||||||||||||
| Coinsurance investments (1) | Coinsurance investments (1) | 6,181,870 | 3,101,832 | ||||||||||||||||||||||||||||||||||||||||||||||||||||||||||||||||||
| $ | 51,325,298 | $ | 60,376,504 | ||||||||||||||||||||||||||||||||||||||||||||||||||||||||||||||||||
| $ | |||||||||||||||||||||||||||||||||||||||||||||||||||||||||||||||||||||
| $ | |||||||||||||||||||||||||||||||||||||||||||||||||||||||||||||||||||||
| $ | |||||||||||||||||||||||||||||||||||||||||||||||||||||||||||||||||||||
| December 31, | |||||||||||||||||||||||||||||||||||||||||||||||||||||||||||||||||||||||||||||||||||||||||||||||||||||||||
| 2022 | 2021 | ||||||||||||||||||||||||||||||||||||||||||||||||||||||||||||||||||||||||||||||||||||||||||||||||||||||||
| Rating Agency Rating | Amortized Cost | Carrying Amount | Percent of Fixed Maturity Securities | Amortized Cost | Carrying Amount | Percent of Fixed Maturity Securities | |||||||||||||||||||||||||||||||||||||||||||||||||||||||||||||||||||||||||||||||||||||||||||||||||||
| (Dollars in thousands) | |||||||||||||||||||||||||||||||||||||||||||||||||||||||||||||||||||||||||||||||||||||||||||||||||||||||||
| December 31, | December 31, | ||||||||||||||||||||||||||||||||||||||||||||||||||||||||||||||||||||||||||||||||||||||||||||||||||||||||
| 2023 | 2023 | 2022 | |||||||||||||||||||||||||||||||||||||||||||||||||||||||||||||||||||||||||||||||||||||||||||||||||||||||
| Rating Agency Rating (2) | Rating Agency Rating (2) | Amortized Cost | Carrying Amount | Percent of Fixed Maturity Securities | Amortized Cost | Carrying Amount | Percent of Fixed Maturity Securities | ||||||||||||||||||||||||||||||||||||||||||||||||||||||||||||||||||||||||||||||||||||||||||||||||||
| (Dollars in thousands) | (Dollars in thousands) | ||||||||||||||||||||||||||||||||||||||||||||||||||||||||||||||||||||||||||||||||||||||||||||||||||||||||
| Aaa/Aa/A | Aaa/Aa/A | $ | 24,462,459 | $ | 21,723,282 | 62.5 | % | $ | 24,943,232 | $ | 27,496,506 | 56.4 | % | Aaa/Aa/A | $ | 19,237,683 | $ | $ | 17,030,736 | 59.8 | 59.8 | % | $ | 24,462,459 | $ | $ | 21,723,282 | 62.5 | 62.5 | % | |||||||||||||||||||||||||||||||||||||||||||||||||||||||||||||||||||||||||||
| Baa | Baa | 14,228,490 | 12,434,302 | 35.7 | % | 18,443,171 | 20,147,369 | 41.3 | % | Baa | 12,036,591 | 10,801,336 | 10,801,336 | 37.9 | 37.9 | % | 14,228,490 | 12,434,302 | 12,434,302 | 35.7 | 35.7 | % | |||||||||||||||||||||||||||||||||||||||||||||||||||||||||||||||||||||||||||||||||||
| Total investment grade | Total investment grade | 38,690,949 | 34,157,584 | 98.2 | % | 43,386,403 | 47,643,875 | 97.7 | % | Total investment grade | 31,274,274 | 27,832,072 | 27,832,072 | 97.7 | 97.7 | % | 38,690,949 | 34,157,584 | 34,157,584 | 98.2 | 98.2 | % | |||||||||||||||||||||||||||||||||||||||||||||||||||||||||||||||||||||||||||||||||||
| Ba | Ba | 554,605 | 485,166 | 1.4 | % | 899,253 | 930,321 | 1.9 | % | Ba | 539,417 | 489,286 | 489,286 | 1.7 | 1.7 | % | 554,605 | 485,166 | 485,166 | 1.4 | 1.4 | % | |||||||||||||||||||||||||||||||||||||||||||||||||||||||||||||||||||||||||||||||||||
| B | B | 94,185 | 79,058 | 0.2 | % | 104,443 | 117,989 | 0.2 | % | B | 144,657 | 128,150 | 128,150 | 0.4 | 0.4 | % | 94,185 | 79,058 | 79,058 | 0.2 | 0.2 | % | |||||||||||||||||||||||||||||||||||||||||||||||||||||||||||||||||||||||||||||||||||
| Caa | Caa | 20,020 | 18,540 | 0.1 | % | 38,484 | 39,354 | 0.1 | % | Caa | 21,295 | 18,497 | 18,497 | 0.1 | 0.1 | % | 20,020 | 18,540 | 18,540 | 0.1 | 0.1 | % | |||||||||||||||||||||||||||||||||||||||||||||||||||||||||||||||||||||||||||||||||||
| Ca and lower | Ca and lower | 40,664 | 39,634 | 0.1 | % | 61,352 | 66,770 | 0.1 | % | Ca and lower | 30,504 | 31,383 | 31,383 | 0.1 | 0.1 | % | 40,664 | 39,634 | 39,634 | 0.1 | 0.1 | % | |||||||||||||||||||||||||||||||||||||||||||||||||||||||||||||||||||||||||||||||||||
| Total below investment grade | Total below investment grade | 709,474 | 622,398 | 1.8 | % | 1,103,532 | 1,154,434 | 2.3 | % | Total below investment grade | 735,873 | 667,316 | 667,316 | 2.3 | 2.3 | % | 709,474 | 622,398 | 622,398 | 1.8 | 1.8 | % | |||||||||||||||||||||||||||||||||||||||||||||||||||||||||||||||||||||||||||||||||||
| 39,400,423 | 34,779,982 | 100.0 | % | 44,489,935 | 48,798,309 | 100.0 | % | ||||||||||||||||||||||||||||||||||||||||||||||||||||||||||||||||||||||||||||||||||||||||||||||||||
| 32,010,147 | 32,010,147 | 28,499,388 | 100.0 | % | 39,400,423 | 34,779,982 | 100.0 | % | |||||||||||||||||||||||||||||||||||||||||||||||||||||||||||||||||||||||||||||||||||||||||||||||||
| Coinsurance investments (1) | Coinsurance investments (1) | 5,465,596 | 5,024,635 | 2,509,248 | 2,507,634 | ||||||||||||||||||||||||||||||||||||||||||||||||||||||||||||||||||||||||||||||||||||||||||||||||||||
| $ | 44,866,019 | $ | 39,804,617 | $ | 46,999,183 | $ | 51,305,943 | ||||||||||||||||||||||||||||||||||||||||||||||||||||||||||||||||||||||||||||||||||||||||||||||||||
| $ | |||||||||||||||||||||||||||||||||||||||||||||||||||||||||||||||||||||||||||||||||||||||||||||||||||||||||
| $ | |||||||||||||||||||||||||||||||||||||||||||||||||||||||||||||||||||||||||||||||||||||||||||||||||||||||||
| $ | |||||||||||||||||||||||||||||||||||||||||||||||||||||||||||||||||||||||||||||||||||||||||||||||||||||||||
| NAIC Designation | NRSRO Equivalent Rating | |||||||
| 1 | Aaa/Aa/A | |||||||
| 2 | Baa | |||||||
| 3 | Ba | |||||||
| 4 | B | |||||||
| 5 | Caa | |||||||
| 6 | Ca and lower | |||||||
| December 31, 2022 | December 31, 2021 | ||||||||||||||||||||||||||||||||||||||||||||||||||||||||||||||||||||||||||||||||||||||||||||||||||||||||||||||||||||||||||||||||||
| NAIC Designation | Amortized Cost | Fair Value | Carrying Amount | Percentage of Total Carrying Amount | Amortized Cost | Fair Value | Carrying Amount | Percentage of Total Carrying Amount | |||||||||||||||||||||||||||||||||||||||||||||||||||||||||||||||||||||||||||||||||||||||||||||||||||||||||||||||||||||||||||
| (Dollars in thousands) | (Dollars in thousands) | ||||||||||||||||||||||||||||||||||||||||||||||||||||||||||||||||||||||||||||||||||||||||||||||||||||||||||||||||||||||||||||||||||
| December 31, 2023 | December 31, 2023 | December 31, 2022 | |||||||||||||||||||||||||||||||||||||||||||||||||||||||||||||||||||||||||||||||||||||||||||||||||||||||||||||||||||||||||||||||||
NAIC Designation (2) | NAIC Designation (2) | Amortized Cost | Fair Value | Carrying Amount | Percentage of Total Carrying Amount | Amortized Cost | Fair Value | Carrying Amount | Percentage of Total Carrying Amount | ||||||||||||||||||||||||||||||||||||||||||||||||||||||||||||||||||||||||||||||||||||||||||||||||||||||||||||||||||||||||||
| (Dollars in thousands) | |||||||||||||||||||||||||||||||||||||||||||||||||||||||||||||||||||||||||||||||||||||||||||||||||||||||||||||||||||||||||||||||||||
| 1 | |||||||||||||||||||||||||||||||||||||||||||||||||||||||||||||||||||||||||||||||||||||||||||||||||||||||||||||||||||||||||||||||||||
| 1 | |||||||||||||||||||||||||||||||||||||||||||||||||||||||||||||||||||||||||||||||||||||||||||||||||||||||||||||||||||||||||||||||||||
| 1 | 1 | $ | 24,466,961 | $ | 21,752,775 | $ | 21,752,775 | 62.5 | % | $ | 25,378,938 | $ | 28,006,835 | $ | 28,006,835 | 57.4 | % | $ | 19,330,614 | $ | $ | 17,116,519 | $ | $ | 17,116,519 | 60.1 | 60.1 | % | $ | 24,466,961 | $ | $ | 21,752,775 | $ | $ | 21,752,775 | 62.5 | 62.5 | % | ||||||||||||||||||||||||||||||||||||||||||||||||||||||||||||||||||||||||||||||||||||||||||||
| 2 | 2 | 14,185,506 | 12,398,001 | 12,398,001 | 35.7 | % | 18,028,077 | 19,667,529 | 19,667,529 | 40.3 | % | 2 | 11,895,433 | 10,680,088 | 10,680,088 | 10,680,088 | 10,680,088 | 37.5 | 37.5 | % | 14,185,506 | 12,398,001 | 12,398,001 | 12,398,001 | 12,398,001 | 35.6 | 35.6 | % | |||||||||||||||||||||||||||||||||||||||||||||||||||||||||||||||||||||||||||||||||||||||||||||||||||||||
| 3 | 3 | 562,190 | 490,198 | 490,198 | 1.4 | % | 909,173 | 941,071 | 941,071 | 2.0 | % | 3 | 517,425 | 476,419 | 476,419 | 476,419 | 476,419 | 1.7 | 1.7 | % | 562,190 | 490,198 | 490,198 | 490,198 | 490,198 | 1.5 | 1.5 | % | |||||||||||||||||||||||||||||||||||||||||||||||||||||||||||||||||||||||||||||||||||||||||||||||||||||||
| 4 | 4 | 109,409 | 91,495 | 91,495 | 0.3 | % | 133,070 | 147,160 | 147,160 | 0.3 | % | 4 | 168,694 | 147,692 | 147,692 | 147,692 | 147,692 | 0.5 | 0.5 | % | 109,409 | 91,495 | 91,495 | 91,495 | 91,495 | 0.3 | 0.3 | % | |||||||||||||||||||||||||||||||||||||||||||||||||||||||||||||||||||||||||||||||||||||||||||||||||||||||
| 5 | 5 | 61,721 | 36,738 | 36,738 | 0.1 | % | 16,496 | 15,357 | 15,357 | — | % | 5 | 88,581 | 68,538 | 68,538 | 68,538 | 68,538 | 0.2 | 0.2 | % | 61,721 | 36,738 | 36,738 | 36,738 | 36,738 | 0.1 | 0.1 | % | |||||||||||||||||||||||||||||||||||||||||||||||||||||||||||||||||||||||||||||||||||||||||||||||||||||||
| 6 | 6 | 14,636 | 10,775 | 10,775 | — | % | 24,181 | 20,357 | 20,357 | — | % | 6 | 9,400 | 10,132 | 10,132 | 10,132 | 10,132 | — | — | % | 14,636 | 10,775 | 10,775 | 10,775 | 10,775 | — | — | % | |||||||||||||||||||||||||||||||||||||||||||||||||||||||||||||||||||||||||||||||||||||||||||||||||||||||
| 39,400,423 | 34,779,982 | 34,779,982 | 100.0 | % | 44,489,935 | 48,798,309 | 48,798,309 | 100.0 | % | ||||||||||||||||||||||||||||||||||||||||||||||||||||||||||||||||||||||||||||||||||||||||||||||||||||||||||||||||||||||||||
| 32,010,147 | 32,010,147 | 28,499,388 | 28,499,388 | 100.0 | % | 39,400,423 | 34,779,982 | 34,779,982 | 100.0 | % | |||||||||||||||||||||||||||||||||||||||||||||||||||||||||||||||||||||||||||||||||||||||||||||||||||||||||||||||||||||||||
| Coinsurance investments (1) | Coinsurance investments (1) | 5,465,596 | 5,024,635 | 5,024,635 | 2,509,248 | 2,507,634 | 2,507,634 | ||||||||||||||||||||||||||||||||||||||||||||||||||||||||||||||||||||||||||||||||||||||||||||||||||||||||||||||||||||||||||||
| $ | 44,866,019 | $ | 39,804,617 | $ | 39,804,617 | $ | 46,999,183 | $ | 51,305,943 | $ | 51,305,943 | ||||||||||||||||||||||||||||||||||||||||||||||||||||||||||||||||||||||||||||||||||||||||||||||||||||||||||||||||||||||||
| $ | |||||||||||||||||||||||||||||||||||||||||||||||||||||||||||||||||||||||||||||||||||||||||||||||||||||||||||||||||||||||||||||||||||
| $ | |||||||||||||||||||||||||||||||||||||||||||||||||||||||||||||||||||||||||||||||||||||||||||||||||||||||||||||||||||||||||||||||||||
| $ | |||||||||||||||||||||||||||||||||||||||||||||||||||||||||||||||||||||||||||||||||||||||||||||||||||||||||||||||||||||||||||||||||||
| Number of Securities | Amortized Cost | Unrealized Losses, Net of Allowance | Allowance for Credit Losses | Fair Value | |||||||||||||||||||||||||||||||||||||||||||||||||||||||||||||||||||||||||||||||||||
| (Dollars in thousands) | |||||||||||||||||||||||||||||||||||||||||||||||||||||||||||||||||||||||||||||||||||||||
| December 31, 2022 | |||||||||||||||||||||||||||||||||||||||||||||||||||||||||||||||||||||||||||||||||||||||
| Number of Securities | Number of Securities | Amortized Cost | Unrealized Losses, Net of Allowance | Allowance for Credit Losses | Fair Value | ||||||||||||||||||||||||||||||||||||||||||||||||||||||||||||||||||||||||||||||||||
| (Dollars in thousands) | (Dollars in thousands) | ||||||||||||||||||||||||||||||||||||||||||||||||||||||||||||||||||||||||||||||||||||||
| December 31, 2023 | |||||||||||||||||||||||||||||||||||||||||||||||||||||||||||||||||||||||||||||||||||||||
| Fixed maturity securities, available for sale: | Fixed maturity securities, available for sale: | ||||||||||||||||||||||||||||||||||||||||||||||||||||||||||||||||||||||||||||||||||||||
| Fixed maturity securities, available for sale: | |||||||||||||||||||||||||||||||||||||||||||||||||||||||||||||||||||||||||||||||||||||||
| Fixed maturity securities, available for sale: | |||||||||||||||||||||||||||||||||||||||||||||||||||||||||||||||||||||||||||||||||||||||
| U.S. Government and agencies | |||||||||||||||||||||||||||||||||||||||||||||||||||||||||||||||||||||||||||||||||||||||
| U.S. Government and agencies | |||||||||||||||||||||||||||||||||||||||||||||||||||||||||||||||||||||||||||||||||||||||
| U.S. Government and agencies | U.S. Government and agencies | 27 | $ | 165,746 | $ | (4,637) | $ | — | $ | 161,109 | |||||||||||||||||||||||||||||||||||||||||||||||||||||||||||||||||||||||||||||
| States, municipalities and territories | States, municipalities and territories | 514 | 3,265,080 | (574,814) | — | 2,690,266 | |||||||||||||||||||||||||||||||||||||||||||||||||||||||||||||||||||||||||||||||||
| Foreign corporate securities and foreign governments | Foreign corporate securities and foreign governments | 43 | 590,944 | (74,151) | — | 516,793 | |||||||||||||||||||||||||||||||||||||||||||||||||||||||||||||||||||||||||||||||||
| Corporate securities | Corporate securities | 2,103 | 21,393,656 | (3,224,609) | (3,214) | 18,165,833 | |||||||||||||||||||||||||||||||||||||||||||||||||||||||||||||||||||||||||||||||||
| Residential mortgage backed securities | Residential mortgage backed securities | 219 | 1,235,672 | (126,368) | (133) | 1,109,171 | |||||||||||||||||||||||||||||||||||||||||||||||||||||||||||||||||||||||||||||||||
| Commercial mortgage backed securities | Commercial mortgage backed securities | 339 | 3,750,331 | (391,966) | — | 3,358,365 | |||||||||||||||||||||||||||||||||||||||||||||||||||||||||||||||||||||||||||||||||
| Other asset backed securities | Other asset backed securities | 567 | 4,579,149 | (382,563) | — | 4,196,586 | |||||||||||||||||||||||||||||||||||||||||||||||||||||||||||||||||||||||||||||||||
| 3,049 | |||||||||||||||||||||||||||||||||||||||||||||||||||||||||||||||||||||||||||||||||||||||
| Coinsurance investments (1) | |||||||||||||||||||||||||||||||||||||||||||||||||||||||||||||||||||||||||||||||||||||||
| 3,639 | |||||||||||||||||||||||||||||||||||||||||||||||||||||||||||||||||||||||||||||||||||||||
| 3,812 | 34,980,578 | (4,779,108) | (3,347) | 30,198,123 | |||||||||||||||||||||||||||||||||||||||||||||||||||||||||||||||||||||||||||||||||||
| Coinsurance investments (1) | 698 | 3,085,834 | (504,739) | — | 2,581,095 | ||||||||||||||||||||||||||||||||||||||||||||||||||||||||||||||||||||||||||||||||||
| 4,510 | $ | 38,066,412 | $ | (5,283,847) | $ | (3,347) | $ | 32,779,218 | |||||||||||||||||||||||||||||||||||||||||||||||||||||||||||||||||||||||||||||||
| December 31, 2021 | |||||||||||||||||||||||||||||||||||||||||||||||||||||||||||||||||||||||||||||||||||||||
| December 31, 2022 | |||||||||||||||||||||||||||||||||||||||||||||||||||||||||||||||||||||||||||||||||||||||
| December 31, 2022 | |||||||||||||||||||||||||||||||||||||||||||||||||||||||||||||||||||||||||||||||||||||||
| December 31, 2022 | |||||||||||||||||||||||||||||||||||||||||||||||||||||||||||||||||||||||||||||||||||||||
| Fixed maturity securities, available for sale: | Fixed maturity securities, available for sale: | ||||||||||||||||||||||||||||||||||||||||||||||||||||||||||||||||||||||||||||||||||||||
| Fixed maturity securities, available for sale: | |||||||||||||||||||||||||||||||||||||||||||||||||||||||||||||||||||||||||||||||||||||||
| Fixed maturity securities, available for sale: | |||||||||||||||||||||||||||||||||||||||||||||||||||||||||||||||||||||||||||||||||||||||
| U.S. Government and agencies | |||||||||||||||||||||||||||||||||||||||||||||||||||||||||||||||||||||||||||||||||||||||
| U.S. Government and agencies | |||||||||||||||||||||||||||||||||||||||||||||||||||||||||||||||||||||||||||||||||||||||
| U.S. Government and agencies | U.S. Government and agencies | 8 | $ | 761,102 | $ | (124) | $ | — | $ | 760,978 | |||||||||||||||||||||||||||||||||||||||||||||||||||||||||||||||||||||||||||||
| States, municipalities and territories | States, municipalities and territories | 42 | 173,106 | (2,485) | (2,776) | 167,845 | |||||||||||||||||||||||||||||||||||||||||||||||||||||||||||||||||||||||||||||||||
| Foreign corporate securities and foreign governments | Foreign corporate securities and foreign governments | 3 | 34,673 | (801) | — | 33,872 | |||||||||||||||||||||||||||||||||||||||||||||||||||||||||||||||||||||||||||||||||
| Corporate securities | Corporate securities | 176 | 1,433,317 | (26,035) | — | 1,407,282 | |||||||||||||||||||||||||||||||||||||||||||||||||||||||||||||||||||||||||||||||||
| Residential mortgage backed securities | Residential mortgage backed securities | 74 | 280,044 | (2,093) | (70) | 277,881 | |||||||||||||||||||||||||||||||||||||||||||||||||||||||||||||||||||||||||||||||||
| Commercial mortgage backed securities | Commercial mortgage backed securities | 89 | 795,405 | (16,553) | — | 778,852 | |||||||||||||||||||||||||||||||||||||||||||||||||||||||||||||||||||||||||||||||||
| Other asset backed securities | Other asset backed securities | 577 | 3,118,385 | (50,018) | — | 3,068,367 | |||||||||||||||||||||||||||||||||||||||||||||||||||||||||||||||||||||||||||||||||
| 969 | 6,596,032 | (98,109) | (2,846) | 6,495,077 | |||||||||||||||||||||||||||||||||||||||||||||||||||||||||||||||||||||||||||||||||||
| 3,812 | |||||||||||||||||||||||||||||||||||||||||||||||||||||||||||||||||||||||||||||||||||||||
| Coinsurance investments (1) | Coinsurance investments (1) | 458 | 1,327,173 | (14,261) | — | 1,312,912 | |||||||||||||||||||||||||||||||||||||||||||||||||||||||||||||||||||||||||||||||||
| 1,427 | $ | 7,923,205 | $ | (112,370) | $ | (2,846) | $ | 7,807,989 | |||||||||||||||||||||||||||||||||||||||||||||||||||||||||||||||||||||||||||||||
| 4,510 | |||||||||||||||||||||||||||||||||||||||||||||||||||||||||||||||||||||||||||||||||||||||
| NAIC Designation | Carrying Value of Securities with Gross Unrealized Losses | Percent of Total | Gross Unrealized Losses (1) | Percent of Total | ||||||||||||||||||||||||||||||||||||||||||||||||||||||||||||||||||||||||||||
| (Dollars in thousands) | ||||||||||||||||||||||||||||||||||||||||||||||||||||||||||||||||||||||||||||||||
| December 31, 2022 | ||||||||||||||||||||||||||||||||||||||||||||||||||||||||||||||||||||||||||||||||
| NAIC Designation (2) | NAIC Designation (2) | Carrying Value of Securities with Gross Unrealized Losses | Percent of Total | Gross Unrealized Losses (1) | Percent of Total | |||||||||||||||||||||||||||||||||||||||||||||||||||||||||||||||||||||||||||
| (Dollars in thousands) | (Dollars in thousands) | |||||||||||||||||||||||||||||||||||||||||||||||||||||||||||||||||||||||||||||||
| December 31, 2023 | ||||||||||||||||||||||||||||||||||||||||||||||||||||||||||||||||||||||||||||||||
| 1 | ||||||||||||||||||||||||||||||||||||||||||||||||||||||||||||||||||||||||||||||||
| 1 | ||||||||||||||||||||||||||||||||||||||||||||||||||||||||||||||||||||||||||||||||
| 1 | 1 | $ | 18,396,691 | 60.9 | % | $ | (2,836,027) | 59.4 | % | $ | 15,299,508 | 59.8 | 59.8 | % | $ | (2,254,792) | 63.0 | 63.0 | % | |||||||||||||||||||||||||||||||||||||||||||||||||||||||||||||
| 2 | 2 | 11,207,008 | 37.1 | % | (1,825,520) | 38.2 | % | 2 | 9,631,686 | 37.7 | 37.7 | % | (1,240,985) | 34.7 | 34.7 | % | ||||||||||||||||||||||||||||||||||||||||||||||||||||||||||||||||
| 3 | 3 | 465,867 | 1.6 | % | (72,976) | 1.5 | % | 3 | 412,128 | 1.6 | 1.6 | % | (40,770) | 1.1 | 1.1 | % | ||||||||||||||||||||||||||||||||||||||||||||||||||||||||||||||||
| 4 | 4 | 89,686 | 0.3 | % | (17,922) | 0.4 | % | 4 | 145,172 | 0.6 | 0.6 | % | (21,005) | 0.6 | 0.6 | % | ||||||||||||||||||||||||||||||||||||||||||||||||||||||||||||||||
| 5 | 5 | 29,075 | 0.1 | % | (25,037) | 0.5 | % | 5 | 66,883 | 0.3 | 0.3 | % | (20,174) | 0.6 | 0.6 | % | ||||||||||||||||||||||||||||||||||||||||||||||||||||||||||||||||
| 6 | 6 | 9,796 | — | % | (1,626) | — | % | 6 | 1,838 | — | — | % | (148) | — | — | % | ||||||||||||||||||||||||||||||||||||||||||||||||||||||||||||||||
| 25,557,215 | 25,557,215 | 100.0 | % | (3,577,874) | 100.0 | % | ||||||||||||||||||||||||||||||||||||||||||||||||||||||||||||||||||||||||||
| Coinsurance investments (3) | ||||||||||||||||||||||||||||||||||||||||||||||||||||||||||||||||||||||||||||||||
| $ | ||||||||||||||||||||||||||||||||||||||||||||||||||||||||||||||||||||||||||||||||
| $ | ||||||||||||||||||||||||||||||||||||||||||||||||||||||||||||||||||||||||||||||||
| $ | ||||||||||||||||||||||||||||||||||||||||||||||||||||||||||||||||||||||||||||||||
| 30,198,123 | 100.0 | % | (4,779,108) | 100.0 | % | |||||||||||||||||||||||||||||||||||||||||||||||||||||||||||||||||||||||||||
| Coinsurance investments (2) | 2,581,095 | (504,739) | ||||||||||||||||||||||||||||||||||||||||||||||||||||||||||||||||||||||||||||||
| December 31, 2022 | ||||||||||||||||||||||||||||||||||||||||||||||||||||||||||||||||||||||||||||||||
| $ | 32,779,218 | $ | (5,283,847) | |||||||||||||||||||||||||||||||||||||||||||||||||||||||||||||||||||||||||||||
| December 31, 2022 | ||||||||||||||||||||||||||||||||||||||||||||||||||||||||||||||||||||||||||||||||
| December 31, 2021 | ||||||||||||||||||||||||||||||||||||||||||||||||||||||||||||||||||||||||||||||||
| December 31, 2022 | ||||||||||||||||||||||||||||||||||||||||||||||||||||||||||||||||||||||||||||||||
| 1 | ||||||||||||||||||||||||||||||||||||||||||||||||||||||||||||||||||||||||||||||||
| 1 | ||||||||||||||||||||||||||||||||||||||||||||||||||||||||||||||||||||||||||||||||
| 1 | 1 | $ | 3,825,403 | 58.9 | % | $ | (33,823) | 34.4 | % | $ | 18,396,691 | 60.9 | 60.9 | % | $ | (2,836,027) | 59.4 | 59.4 | % | |||||||||||||||||||||||||||||||||||||||||||||||||||||||||||||
| 2 | 2 | 2,233,761 | 34.4 | % | (47,154) | 48.1 | % | 2 | 11,207,008 | 37.1 | 37.1 | % | (1,825,520) | 38.2 | 38.2 | % | ||||||||||||||||||||||||||||||||||||||||||||||||||||||||||||||||
| 3 | 3 | 376,933 | 5.8 | % | (13,723) | 14.0 | % | 3 | 465,867 | 1.6 | 1.6 | % | (72,976) | 1.5 | 1.5 | % | ||||||||||||||||||||||||||||||||||||||||||||||||||||||||||||||||
| 4 | 4 | 33,229 | 0.5 | % | (1,083) | 1.1 | % | 4 | 89,686 | 0.3 | 0.3 | % | (17,922) | 0.4 | 0.4 | % | ||||||||||||||||||||||||||||||||||||||||||||||||||||||||||||||||
| 5 | 5 | 9,506 | 0.1 | % | (1,140) | 1.2 | % | 5 | 29,075 | 0.1 | 0.1 | % | (25,037) | 0.5 | 0.5 | % | ||||||||||||||||||||||||||||||||||||||||||||||||||||||||||||||||
| 6 | 6 | 16,244 | 0.3 | % | (1,186) | 1.2 | % | 6 | 9,796 | — | — | % | (1,626) | — | — | % | ||||||||||||||||||||||||||||||||||||||||||||||||||||||||||||||||
| 6,495,076 | 100.0 | % | (98,109) | 100.0 | % | |||||||||||||||||||||||||||||||||||||||||||||||||||||||||||||||||||||||||||
| Coinsurance investments (2) | 1,312,912 | (14,261) | ||||||||||||||||||||||||||||||||||||||||||||||||||||||||||||||||||||||||||||||
| $ | 7,807,988 | $ | (112,370) | |||||||||||||||||||||||||||||||||||||||||||||||||||||||||||||||||||||||||||||
| 30,198,123 | 30,198,123 | 100.0 | % | (4,779,108) | 100.0 | % | ||||||||||||||||||||||||||||||||||||||||||||||||||||||||||||||||||||||||||
| Coinsurance investments (3) | ||||||||||||||||||||||||||||||||||||||||||||||||||||||||||||||||||||||||||||||||
| $ | ||||||||||||||||||||||||||||||||||||||||||||||||||||||||||||||||||||||||||||||||
| $ | ||||||||||||||||||||||||||||||||||||||||||||||||||||||||||||||||||||||||||||||||
| $ | ||||||||||||||||||||||||||||||||||||||||||||||||||||||||||||||||||||||||||||||||
| Number of Securities | Amortized Cost, Net of Allowance (1) | Fair Value | Gross Unrealized Losses, Net of Allowance (1) | ||||||||||||||||||||||||||||||||||||||||||||||||||||||||||||||||||||||
| (Dollars in thousands) | |||||||||||||||||||||||||||||||||||||||||||||||||||||||||||||||||||||||||
| December 31, 2022 | |||||||||||||||||||||||||||||||||||||||||||||||||||||||||||||||||||||||||
| Number of Securities | Number of Securities | Amortized Cost, Net of Allowance (1) | Fair Value | Gross Unrealized Losses, Net of Allowance (1) | |||||||||||||||||||||||||||||||||||||||||||||||||||||||||||||||||||||
| (Dollars in thousands) | (Dollars in thousands) | ||||||||||||||||||||||||||||||||||||||||||||||||||||||||||||||||||||||||
| December 31, 2023 | |||||||||||||||||||||||||||||||||||||||||||||||||||||||||||||||||||||||||
| Fixed maturity securities, available for sale: | |||||||||||||||||||||||||||||||||||||||||||||||||||||||||||||||||||||||||
| Fixed maturity securities, available for sale: | |||||||||||||||||||||||||||||||||||||||||||||||||||||||||||||||||||||||||
| Fixed maturity securities, available for sale: | Fixed maturity securities, available for sale: | ||||||||||||||||||||||||||||||||||||||||||||||||||||||||||||||||||||||||
| Investment grade: | Investment grade: | ||||||||||||||||||||||||||||||||||||||||||||||||||||||||||||||||||||||||
| Investment grade: | |||||||||||||||||||||||||||||||||||||||||||||||||||||||||||||||||||||||||
| Investment grade: | |||||||||||||||||||||||||||||||||||||||||||||||||||||||||||||||||||||||||
| Less than six months | |||||||||||||||||||||||||||||||||||||||||||||||||||||||||||||||||||||||||
| Less than six months | |||||||||||||||||||||||||||||||||||||||||||||||||||||||||||||||||||||||||
| Less than six months | Less than six months | 984 | $ | 6,296,895 | $ | 5,968,793 | $ | (328,102) | |||||||||||||||||||||||||||||||||||||||||||||||||||||||||||||||||
| Six months or more and less than twelve months | Six months or more and less than twelve months | 2,308 | 24,207,057 | 20,481,666 | (3,725,391) | ||||||||||||||||||||||||||||||||||||||||||||||||||||||||||||||||||||
| Twelve months or greater | Twelve months or greater | 427 | 3,761,294 | 3,153,240 | (608,054) | ||||||||||||||||||||||||||||||||||||||||||||||||||||||||||||||||||||
| Total investment grade | Total investment grade | 3,719 | 34,265,246 | 29,603,699 | (4,661,547) | ||||||||||||||||||||||||||||||||||||||||||||||||||||||||||||||||||||
| Below investment grade: | Below investment grade: | ||||||||||||||||||||||||||||||||||||||||||||||||||||||||||||||||||||||||
| Less than six months | Less than six months | 12 | 51,711 | 47,494 | (4,217) | ||||||||||||||||||||||||||||||||||||||||||||||||||||||||||||||||||||
| Less than six months | |||||||||||||||||||||||||||||||||||||||||||||||||||||||||||||||||||||||||
| Less than six months | |||||||||||||||||||||||||||||||||||||||||||||||||||||||||||||||||||||||||
| Six months or more and less than twelve months | Six months or more and less than twelve months | 34 | 319,964 | 265,726 | (54,238) | ||||||||||||||||||||||||||||||||||||||||||||||||||||||||||||||||||||
| Twelve months or greater | Twelve months or greater | 47 | 340,310 | 281,204 | (59,106) | ||||||||||||||||||||||||||||||||||||||||||||||||||||||||||||||||||||
| Total below investment grade | 93 | 711,985 | 594,424 | (117,561) | |||||||||||||||||||||||||||||||||||||||||||||||||||||||||||||||||||||
| Total below investment grade (2) | |||||||||||||||||||||||||||||||||||||||||||||||||||||||||||||||||||||||||
| 3,047 | |||||||||||||||||||||||||||||||||||||||||||||||||||||||||||||||||||||||||
| Coinsurance investments (3) | |||||||||||||||||||||||||||||||||||||||||||||||||||||||||||||||||||||||||
| 3,637 | |||||||||||||||||||||||||||||||||||||||||||||||||||||||||||||||||||||||||
| 3,812 | 34,977,231 | 30,198,123 | (4,779,108) | ||||||||||||||||||||||||||||||||||||||||||||||||||||||||||||||||||||||
| Coinsurance investments (2) | 698 | 3,085,834 | 2,581,095 | (504,739) | |||||||||||||||||||||||||||||||||||||||||||||||||||||||||||||||||||||
| 4,510 | $ | 38,063,065 | $ | 32,779,218 | $ | (5,283,847) | |||||||||||||||||||||||||||||||||||||||||||||||||||||||||||||||||||
| December 31, 2021 | |||||||||||||||||||||||||||||||||||||||||||||||||||||||||||||||||||||||||
| December 31, 2022 | |||||||||||||||||||||||||||||||||||||||||||||||||||||||||||||||||||||||||
| December 31, 2022 | |||||||||||||||||||||||||||||||||||||||||||||||||||||||||||||||||||||||||
| December 31, 2022 | |||||||||||||||||||||||||||||||||||||||||||||||||||||||||||||||||||||||||
| Fixed maturity securities, available for sale: | |||||||||||||||||||||||||||||||||||||||||||||||||||||||||||||||||||||||||
| Fixed maturity securities, available for sale: | |||||||||||||||||||||||||||||||||||||||||||||||||||||||||||||||||||||||||
| Fixed maturity securities, available for sale: | Fixed maturity securities, available for sale: | ||||||||||||||||||||||||||||||||||||||||||||||||||||||||||||||||||||||||
| Investment grade: | Investment grade: | ||||||||||||||||||||||||||||||||||||||||||||||||||||||||||||||||||||||||
| Investment grade: | |||||||||||||||||||||||||||||||||||||||||||||||||||||||||||||||||||||||||
| Investment grade: | |||||||||||||||||||||||||||||||||||||||||||||||||||||||||||||||||||||||||
| Less than six months | |||||||||||||||||||||||||||||||||||||||||||||||||||||||||||||||||||||||||
| Less than six months | |||||||||||||||||||||||||||||||||||||||||||||||||||||||||||||||||||||||||
| Less than six months | Less than six months | 567 | $ | 4,255,321 | $ | 4,223,368 | $ | (31,953) | |||||||||||||||||||||||||||||||||||||||||||||||||||||||||||||||||
| Six months or more and less than twelve months | Six months or more and less than twelve months | 39 | 132,110 | 130,156 | (1,954) | ||||||||||||||||||||||||||||||||||||||||||||||||||||||||||||||||||||
| Twelve months or greater | Twelve months or greater | 281 | 1,752,779 | 1,705,640 | (47,139) | ||||||||||||||||||||||||||||||||||||||||||||||||||||||||||||||||||||
| Total investment grade | Total investment grade | 887 | 6,140,210 | 6,059,164 | (81,046) | ||||||||||||||||||||||||||||||||||||||||||||||||||||||||||||||||||||
| Below investment grade: | Below investment grade: | ||||||||||||||||||||||||||||||||||||||||||||||||||||||||||||||||||||||||
| Less than six months | Less than six months | 11 | 43,745 | 42,994 | (751) | ||||||||||||||||||||||||||||||||||||||||||||||||||||||||||||||||||||
| Less than six months | |||||||||||||||||||||||||||||||||||||||||||||||||||||||||||||||||||||||||
| Less than six months | |||||||||||||||||||||||||||||||||||||||||||||||||||||||||||||||||||||||||
| Six months or more and less than twelve months | Six months or more and less than twelve months | 7 | 28,544 | 25,706 | (2,838) | ||||||||||||||||||||||||||||||||||||||||||||||||||||||||||||||||||||
| Twelve months or greater | Twelve months or greater | 64 | 380,686 | 367,213 | (13,473) | ||||||||||||||||||||||||||||||||||||||||||||||||||||||||||||||||||||
| Total below investment grade | Total below investment grade | 82 | 452,975 | 435,913 | (17,062) | ||||||||||||||||||||||||||||||||||||||||||||||||||||||||||||||||||||
| 969 | 6,593,185 | 6,495,077 | (98,108) | ||||||||||||||||||||||||||||||||||||||||||||||||||||||||||||||||||||||
| Coinsurance investments (2) | 458 | 1,327,173 | 1,312,912 | (14,261) | |||||||||||||||||||||||||||||||||||||||||||||||||||||||||||||||||||||
| 1,427 | $ | 7,920,358 | $ | 7,807,989 | $ | (112,369) | |||||||||||||||||||||||||||||||||||||||||||||||||||||||||||||||||||
| 3,812 | |||||||||||||||||||||||||||||||||||||||||||||||||||||||||||||||||||||||||
| Coinsurance investments (3) | |||||||||||||||||||||||||||||||||||||||||||||||||||||||||||||||||||||||||
| 4,510 | |||||||||||||||||||||||||||||||||||||||||||||||||||||||||||||||||||||||||
| Number of Securities | Amortized Cost, Net of Allowance (1) | Fair Value | Gross Unrealized Losses, Net of Allowance (1) | ||||||||||||||||||||||||||||||||||||||||||||||||||||||||||||||||||||||
| (Dollars in thousands) | |||||||||||||||||||||||||||||||||||||||||||||||||||||||||||||||||||||||||
| December 31, 2022 | |||||||||||||||||||||||||||||||||||||||||||||||||||||||||||||||||||||||||
| Number of Securities | Number of Securities | Amortized Cost, Net of Allowance (1) | Fair Value | Gross Unrealized Losses, Net of Allowance (1) | |||||||||||||||||||||||||||||||||||||||||||||||||||||||||||||||||||||
| (Dollars in thousands) | (Dollars in thousands) | ||||||||||||||||||||||||||||||||||||||||||||||||||||||||||||||||||||||||
| December 31, 2023 | |||||||||||||||||||||||||||||||||||||||||||||||||||||||||||||||||||||||||
| Investment grade: | Investment grade: | ||||||||||||||||||||||||||||||||||||||||||||||||||||||||||||||||||||||||
| Investment grade: | |||||||||||||||||||||||||||||||||||||||||||||||||||||||||||||||||||||||||
| Investment grade: | |||||||||||||||||||||||||||||||||||||||||||||||||||||||||||||||||||||||||
| Less than six months | |||||||||||||||||||||||||||||||||||||||||||||||||||||||||||||||||||||||||
| Less than six months | |||||||||||||||||||||||||||||||||||||||||||||||||||||||||||||||||||||||||
| Less than six months | Less than six months | 333 | $ | 3,955,378 | $ | 3,062,075 | $ | (893,303) | |||||||||||||||||||||||||||||||||||||||||||||||||||||||||||||||||
| Six months or more and less than twelve months | Six months or more and less than twelve months | 299 | 4,496,559 | 3,146,868 | (1,349,691) | ||||||||||||||||||||||||||||||||||||||||||||||||||||||||||||||||||||
| Twelve months or greater | Twelve months or greater | 1 | 40,351 | 26,854 | (13,497) | ||||||||||||||||||||||||||||||||||||||||||||||||||||||||||||||||||||
| Total investment grade | Total investment grade | 633 | 8,492,288 | 6,235,797 | (2,256,491) | ||||||||||||||||||||||||||||||||||||||||||||||||||||||||||||||||||||
| Below investment grade: | Below investment grade: | ||||||||||||||||||||||||||||||||||||||||||||||||||||||||||||||||||||||||
| Less than six months | Less than six months | 8 | 61,481 | 47,057 | (14,424) | ||||||||||||||||||||||||||||||||||||||||||||||||||||||||||||||||||||
| Less than six months | |||||||||||||||||||||||||||||||||||||||||||||||||||||||||||||||||||||||||
| Less than six months | |||||||||||||||||||||||||||||||||||||||||||||||||||||||||||||||||||||||||
| Six months or more and less than twelve months | Six months or more and less than twelve months | 7 | 111,990 | 71,271 | (40,719) | ||||||||||||||||||||||||||||||||||||||||||||||||||||||||||||||||||||
| Twelve months or greater | Twelve months or greater | — | — | — | — | ||||||||||||||||||||||||||||||||||||||||||||||||||||||||||||||||||||
| Total below investment grade | Total below investment grade | 15 | 173,471 | 118,328 | (55,143) | ||||||||||||||||||||||||||||||||||||||||||||||||||||||||||||||||||||
| 648 | 8,665,759 | 6,354,125 | (2,311,634) | ||||||||||||||||||||||||||||||||||||||||||||||||||||||||||||||||||||||
| 455 | |||||||||||||||||||||||||||||||||||||||||||||||||||||||||||||||||||||||||
| Coinsurance investments (2) | Coinsurance investments (2) | 423 | 1,250,509 | 859,395 | (391,114) | ||||||||||||||||||||||||||||||||||||||||||||||||||||||||||||||||||||
| 1,071 | $ | 9,916,268 | $ | 7,213,520 | $ | (2,702,748) | |||||||||||||||||||||||||||||||||||||||||||||||||||||||||||||||||||
| December 31, 2021 | |||||||||||||||||||||||||||||||||||||||||||||||||||||||||||||||||||||||||
| 740 | |||||||||||||||||||||||||||||||||||||||||||||||||||||||||||||||||||||||||
| December 31, 2022 | |||||||||||||||||||||||||||||||||||||||||||||||||||||||||||||||||||||||||
| Investment grade: | Investment grade: | ||||||||||||||||||||||||||||||||||||||||||||||||||||||||||||||||||||||||
| Investment grade: | |||||||||||||||||||||||||||||||||||||||||||||||||||||||||||||||||||||||||
| Investment grade: | |||||||||||||||||||||||||||||||||||||||||||||||||||||||||||||||||||||||||
| Less than six months | |||||||||||||||||||||||||||||||||||||||||||||||||||||||||||||||||||||||||
| Less than six months | |||||||||||||||||||||||||||||||||||||||||||||||||||||||||||||||||||||||||
| Less than six months | Less than six months | — | $ | — | $ | — | $ | — | |||||||||||||||||||||||||||||||||||||||||||||||||||||||||||||||||
| Six months or more and less than twelve months | Six months or more and less than twelve months | — | — | — | — | ||||||||||||||||||||||||||||||||||||||||||||||||||||||||||||||||||||
| Twelve months or greater | Twelve months or greater | — | — | — | — | ||||||||||||||||||||||||||||||||||||||||||||||||||||||||||||||||||||
| Total investment grade | Total investment grade | — | — | — | — | ||||||||||||||||||||||||||||||||||||||||||||||||||||||||||||||||||||
| Below investment grade: | Below investment grade: | ||||||||||||||||||||||||||||||||||||||||||||||||||||||||||||||||||||||||
| Less than six months | Less than six months | — | — | — | — | ||||||||||||||||||||||||||||||||||||||||||||||||||||||||||||||||||||
| Less than six months | |||||||||||||||||||||||||||||||||||||||||||||||||||||||||||||||||||||||||
| Less than six months | |||||||||||||||||||||||||||||||||||||||||||||||||||||||||||||||||||||||||
| Six months or more and less than twelve months | Six months or more and less than twelve months | — | — | — | — | ||||||||||||||||||||||||||||||||||||||||||||||||||||||||||||||||||||
| Twelve months or greater | Twelve months or greater | — | — | — | — | ||||||||||||||||||||||||||||||||||||||||||||||||||||||||||||||||||||
| Total below investment grade | Total below investment grade | — | — | — | — | ||||||||||||||||||||||||||||||||||||||||||||||||||||||||||||||||||||
| — | — | — | — | ||||||||||||||||||||||||||||||||||||||||||||||||||||||||||||||||||||||
| 648 | |||||||||||||||||||||||||||||||||||||||||||||||||||||||||||||||||||||||||
| Coinsurance investments (2) | Coinsurance investments (2) | — | — | — | — | ||||||||||||||||||||||||||||||||||||||||||||||||||||||||||||||||||||
| — | $ | — | $ | — | $ | — | |||||||||||||||||||||||||||||||||||||||||||||||||||||||||||||||||||
| 1,071 | |||||||||||||||||||||||||||||||||||||||||||||||||||||||||||||||||||||||||
| Available for sale | |||||||||||||||||||||||||||||||||
| Amortized Cost | Fair Value | ||||||||||||||||||||||||||||||||
| (Dollars in thousands) | |||||||||||||||||||||||||||||||||
| December 31, 2022 | |||||||||||||||||||||||||||||||||
| Available for sale | Available for sale | ||||||||||||||||||||||||||||||||
| Amortized Cost | Amortized Cost | Fair Value | |||||||||||||||||||||||||||||||
| (Dollars in thousands) | (Dollars in thousands) | ||||||||||||||||||||||||||||||||
| December 31, 2023 | |||||||||||||||||||||||||||||||||
| Due in one year or less | |||||||||||||||||||||||||||||||||
| Due in one year or less | |||||||||||||||||||||||||||||||||
| Due in one year or less | Due in one year or less | $ | 567,599 | $ | 563,298 | ||||||||||||||||||||||||||||
| Due after one year through five years | Due after one year through five years | 3,591,040 | 3,377,197 | ||||||||||||||||||||||||||||||
| Due after five years through ten years | Due after five years through ten years | 4,844,271 | 4,280,762 | ||||||||||||||||||||||||||||||
| Due after ten years through twenty years | Due after ten years through twenty years | 7,443,657 | 6,377,081 | ||||||||||||||||||||||||||||||
| Due after twenty years | Due after twenty years | 8,968,858 | 6,935,663 | ||||||||||||||||||||||||||||||
| 25,415,425 | 21,534,001 | ||||||||||||||||||||||||||||||||
| 21,047,890 | |||||||||||||||||||||||||||||||||
| Residential mortgage backed securities | Residential mortgage backed securities | 1,235,672 | 1,109,171 | ||||||||||||||||||||||||||||||
| Commercial mortgage backed securities | Commercial mortgage backed securities | 3,750,331 | 3,358,365 | ||||||||||||||||||||||||||||||
| Other asset backed securities | Other asset backed securities | 4,579,149 | 4,196,586 | ||||||||||||||||||||||||||||||
| 29,159,718 | |||||||||||||||||||||||||||||||||
| Coinsurance investments (1) | |||||||||||||||||||||||||||||||||
| $ | |||||||||||||||||||||||||||||||||
| 34,980,577 | 30,198,123 | ||||||||||||||||||||||||||||||||
| Coinsurance investments (1) | 3,085,834 | 2,581,095 | |||||||||||||||||||||||||||||||
| $ | 38,066,411 | $ | 32,779,218 | ||||||||||||||||||||||||||||||
| December 31, 2021 | |||||||||||||||||||||||||||||||||
| December 31, 2022 | |||||||||||||||||||||||||||||||||
| December 31, 2022 | |||||||||||||||||||||||||||||||||
| December 31, 2022 | |||||||||||||||||||||||||||||||||
| Due in one year or less | |||||||||||||||||||||||||||||||||
| Due in one year or less | |||||||||||||||||||||||||||||||||
| Due in one year or less | Due in one year or less | $ | 762,035 | $ | 761,590 | ||||||||||||||||||||||||||||
| Due after one year through five years | Due after one year through five years | 49,668 | 46,687 | ||||||||||||||||||||||||||||||
| Due after five years through ten years | Due after five years through ten years | 476,811 | 467,284 | ||||||||||||||||||||||||||||||
| Due after ten years through twenty years | Due after ten years through twenty years | 443,909 | 435,589 | ||||||||||||||||||||||||||||||
| Due after twenty years | Due after twenty years | 669,775 | 658,827 | ||||||||||||||||||||||||||||||
| 2,402,198 | 2,369,977 | ||||||||||||||||||||||||||||||||
| 25,415,425 | |||||||||||||||||||||||||||||||||
| Residential mortgage backed securities | Residential mortgage backed securities | 280,044 | 277,881 | ||||||||||||||||||||||||||||||
| Commercial mortgage backed securities | Commercial mortgage backed securities | 795,405 | 778,852 | ||||||||||||||||||||||||||||||
| Other asset backed securities | Other asset backed securities | 3,118,385 | 3,068,367 | ||||||||||||||||||||||||||||||
| 6,596,032 | 6,495,077 | ||||||||||||||||||||||||||||||||
| 34,980,577 | |||||||||||||||||||||||||||||||||
| Coinsurance investments (1) | Coinsurance investments (1) | 1,327,173 | 1,312,912 | ||||||||||||||||||||||||||||||
| $ | 7,923,205 | $ | 7,807,989 | ||||||||||||||||||||||||||||||
| $ | |||||||||||||||||||||||||||||||||
| December 31, 2022 | |||||||||||||||||||||||||||||||||||||||||||||||||||
| Amortized Cost | Carrying Amount/ Fair Value | Percent of Total Carrying Amount | |||||||||||||||||||||||||||||||||||||||||||||||||
| (Dollars in thousands) | |||||||||||||||||||||||||||||||||||||||||||||||||||
| December 31, 2023 | December 31, 2023 | ||||||||||||||||||||||||||||||||||||||||||||||||||
| Amortized Cost | Amortized Cost | Carrying Amount/ Fair Value | Percent of Total Carrying Amount | ||||||||||||||||||||||||||||||||||||||||||||||||
| (Dollars in thousands) | |||||||||||||||||||||||||||||||||||||||||||||||||||
| Europe | |||||||||||||||||||||||||||||||||||||||||||||||||||
| Europe | |||||||||||||||||||||||||||||||||||||||||||||||||||
| Europe | Europe | $ | 2,285,608 | $ | 1,994,351 | 5.7 | % | $ | 1,717,322 | $ | $ | 1,522,081 | 5.3 | 5.3 | % | ||||||||||||||||||||||||||||||||||||
| Asia/Pacific | Asia/Pacific | 383,900 | 324,205 | 0.9 | % | Asia/Pacific | 360,431 | 312,647 | 312,647 | 1.1 | 1.1 | % | |||||||||||||||||||||||||||||||||||||||
| Latin America | Latin America | 313,097 | 272,291 | 0.8 | % | Latin America | 246,595 | 215,761 | 215,761 | 0.7 | 0.7 | % | |||||||||||||||||||||||||||||||||||||||
| Non-U.S. North America | Non-U.S. North America | 1,178,177 | 1,045,695 | 3.0 | % | Non-U.S. North America | 896,988 | 798,238 | 798,238 | 2.8 | 2.8 | % | |||||||||||||||||||||||||||||||||||||||
| Australia & New Zealand | Australia & New Zealand | 927,819 | 815,440 | 2.3 | % | Australia & New Zealand | 775,941 | 704,702 | 704,702 | 2.5 | 2.5 | % | |||||||||||||||||||||||||||||||||||||||
| Other | Other | 795,657 | 696,191 | 2.0 | % | Other | 558,352 | 478,771 | 478,771 | 1.7 | 1.7 | % | |||||||||||||||||||||||||||||||||||||||
| 5,884,258 | 5,148,173 | 14.7 | % | ||||||||||||||||||||||||||||||||||||||||||||||||
| 4,555,629 | 4,555,629 | 4,032,200 | 14.1 | % | |||||||||||||||||||||||||||||||||||||||||||||||
| Coinsurance investments (1) | Coinsurance investments (1) | 1,036,513 | 909,094 | ||||||||||||||||||||||||||||||||||||||||||||||||
| $ | 6,920,771 | $ | 6,057,267 | ||||||||||||||||||||||||||||||||||||||||||||||||
| $ | |||||||||||||||||||||||||||||||||||||||||||||||||||
| $ | |||||||||||||||||||||||||||||||||||||||||||||||||||
| $ | |||||||||||||||||||||||||||||||||||||||||||||||||||
| December 31, 2022 | |||||||||||||||||||||||||||||||||
| Amortized Cost | Carrying Amount/ Fair Value | ||||||||||||||||||||||||||||||||
| (Dollars in thousands) | |||||||||||||||||||||||||||||||||
| December 31, 2023 | December 31, 2023 | ||||||||||||||||||||||||||||||||
| Amortized Cost | Amortized Cost | Carrying Amount/ Fair Value | |||||||||||||||||||||||||||||||
| (Dollars in thousands) | (Dollars in thousands) | ||||||||||||||||||||||||||||||||
| Europe | Europe | $ | 96,525 | $ | 82,618 | ||||||||||||||||||||||||||||
| Asia/Pacific | Asia/Pacific | 62 | 52 | ||||||||||||||||||||||||||||||
| Latin America | Latin America | 45,570 | 37,194 | ||||||||||||||||||||||||||||||
| Non-U.S. North America | Non-U.S. North America | 23,209 | 19,911 | ||||||||||||||||||||||||||||||
| Australia & New Zealand | Australia & New Zealand | 219 | 182 | ||||||||||||||||||||||||||||||
| Other | Other | 91,588 | 62,509 | ||||||||||||||||||||||||||||||
| 257,173 | 202,466 | ||||||||||||||||||||||||||||||||
| 247,043 | |||||||||||||||||||||||||||||||||
| Coinsurance investments (1) | Coinsurance investments (1) | 32,889 | 20,123 | ||||||||||||||||||||||||||||||
| $ | 290,062 | $ | 222,589 | ||||||||||||||||||||||||||||||
| $ | |||||||||||||||||||||||||||||||||
| General Description | General Description | Number of Securities | Amortized Cost | Allowance for Credit Losses | Amortized Cost, Net of Allowance | Net Unrealized Losses, Net of Allowance | Fair Value | General Description | Number of Securities | Amortized Cost | Allowance for Credit Losses | Amortized Cost, Net of Allowance | Net Unrealized Gains (Losses), Net of Allowance | Fair Value | ||||||||||||||||||||||||||||||||||||||||||||||||||||||||||||||||||||||||||||||||||||||||||||||||||||||||||
| (Dollars in thousands) | ||||||||||||||||||||||||||||||||||||||||||||||||||||||||||||||||||||||||||||||||||||||||||||||||||||||||||||||||||||||||
| (Dollars in thousands) | (Dollars in thousands) | |||||||||||||||||||||||||||||||||||||||||||||||||||||||||||||||||||||||||||||||||||||||||||||||||||||||||||||||||||||||
| States, municipalities and territories | States, municipalities and territories | 1 | $ | 20,657 | $ | — | $ | 20,657 | $ | (3,344) | $ | 17,313 | ||||||||||||||||||||||||||||||||||||||||||||||||||||||||||||||||||||||||||||||||||||||||||||||||||||||||||||
| Corporate securities - Public securities | Corporate securities - Public securities | 6 | 20,860 | — | 20,860 | (1,050) | 19,810 | |||||||||||||||||||||||||||||||||||||||||||||||||||||||||||||||||||||||||||||||||||||||||||||||||||||||||||||||||
| Corporate securities - Private placement securities | Corporate securities - Private placement securities | 1 | 10,646 | (3,214) | 7,432 | — | 7,432 | |||||||||||||||||||||||||||||||||||||||||||||||||||||||||||||||||||||||||||||||||||||||||||||||||||||||||||||||||
| Residential mortgage backed securities | Residential mortgage backed securities | 22 | 25,095 | (133) | 24,962 | (2,954) | 22,008 | |||||||||||||||||||||||||||||||||||||||||||||||||||||||||||||||||||||||||||||||||||||||||||||||||||||||||||||||||
| Commercial mortgage backed securities | Commercial mortgage backed securities | 8 | 41,899 | — | 41,899 | (2,752) | 39,147 | |||||||||||||||||||||||||||||||||||||||||||||||||||||||||||||||||||||||||||||||||||||||||||||||||||||||||||||||||
| Other asset backed securities | Other asset backed securities | 1 | 2,314 | — | 2,314 | — | 2,314 | |||||||||||||||||||||||||||||||||||||||||||||||||||||||||||||||||||||||||||||||||||||||||||||||||||||||||||||||||
| Collateralized loan obligations | Collateralized loan obligations | 16 | 103,907 | — | 103,907 | (21,239) | 82,668 | |||||||||||||||||||||||||||||||||||||||||||||||||||||||||||||||||||||||||||||||||||||||||||||||||||||||||||||||||
| 55 | $ | 225,378 | $ | (3,347) | $ | 222,031 | $ | (31,339) | $ | 190,692 | ||||||||||||||||||||||||||||||||||||||||||||||||||||||||||||||||||||||||||||||||||||||||||||||||||||||||||||||
| 90 | ||||||||||||||||||||||||||||||||||||||||||||||||||||||||||||||||||||||||||||||||||||||||||||||||||||||||||||||||||||||||
| Current | 30-59 days past due | 60-89 days past due | Over 90 days past due | Total | |||||||||||||||||||||||||||||||||||||||||||||||||||||||||||||||||||||||
| As of December 31, 2022: | (Dollars in thousands) | ||||||||||||||||||||||||||||||||||||||||||||||||||||||||||||||||||||||||||
| Current | Current | 30-59 days past due | 60-89 days past due | Over 90 days past due | Total | ||||||||||||||||||||||||||||||||||||||||||||||||||||||||||||||||||||||
| As of December 31, 2023: | As of December 31, 2023: | (Dollars in thousands) | |||||||||||||||||||||||||||||||||||||||||||||||||||||||||||||||||||||||||
| Commercial mortgage loans | Commercial mortgage loans | $ | 3,554,558 | $ | — | $ | — | $ | — | $ | 3,554,558 | ||||||||||||||||||||||||||||||||||||||||||||||||||||||||||||||||
| Agricultural mortgage loans | Agricultural mortgage loans | 562,828 | — | — | 3,135 | 565,963 | |||||||||||||||||||||||||||||||||||||||||||||||||||||||||||||||||||||
| Residential mortgage loans | Residential mortgage loans | 2,751,261 | 62,450 | 16,924 | 34,843 | 2,865,478 | |||||||||||||||||||||||||||||||||||||||||||||||||||||||||||||||||||||
| Total mortgage loans | Total mortgage loans | $ | 6,868,647 | $ | 62,450 | $ | 16,924 | $ | 37,978 | $ | 6,985,999 | ||||||||||||||||||||||||||||||||||||||||||||||||||||||||||||||||
| As of December 31, 2021: | |||||||||||||||||||||||||||||||||||||||||||||||||||||||||||||||||||||||||||
| As of December 31, 2022: | |||||||||||||||||||||||||||||||||||||||||||||||||||||||||||||||||||||||||||
| As of December 31, 2022: | |||||||||||||||||||||||||||||||||||||||||||||||||||||||||||||||||||||||||||
| As of December 31, 2022: | |||||||||||||||||||||||||||||||||||||||||||||||||||||||||||||||||||||||||||
| Commercial mortgage loans | |||||||||||||||||||||||||||||||||||||||||||||||||||||||||||||||||||||||||||
| Commercial mortgage loans | |||||||||||||||||||||||||||||||||||||||||||||||||||||||||||||||||||||||||||
| Commercial mortgage loans | Commercial mortgage loans | $ | 3,628,502 | $ | — | $ | — | $ | — | $ | 3,628,502 | ||||||||||||||||||||||||||||||||||||||||||||||||||||||||||||||||
| Agricultural mortgage loans | Agricultural mortgage loans | 406,999 | — | — | — | 406,999 | |||||||||||||||||||||||||||||||||||||||||||||||||||||||||||||||||||||
| Residential mortgage loans | Residential mortgage loans | 1,631,999 | 34,447 | 3,030 | 7,045 | 1,676,521 | |||||||||||||||||||||||||||||||||||||||||||||||||||||||||||||||||||||
| Total mortgage loans | Total mortgage loans | $ | 5,667,500 | $ | 34,447 | $ | 3,030 | $ | 7,045 | $ | 5,712,022 | ||||||||||||||||||||||||||||||||||||||||||||||||||||||||||||||||
| December 31, 2022 | December 31, 2021 | |||||||||||||||||||||||||||||||||||||||||||||||||||||||||||||||||||||||||||||||
| December 31, 2023 | December 31, 2023 | December 31, 2022 | ||||||||||||||||||||||||||||||||||||||||||||||||||||||||||||||||||||||||||||||
| Private Asset Class | Private Asset Class | Amount | Percent | Amount | Percent | Private Asset Class | Amount | Percent | Amount | Percent | ||||||||||||||||||||||||||||||||||||||||||||||||||||||||||||||||||||||
| (Dollars in thousands) | ||||||||||||||||||||||||||||||||||||||||||||||||||||||||||||||||||||||||||||||||
| (Dollars in thousands) | (Dollars in thousands) | |||||||||||||||||||||||||||||||||||||||||||||||||||||||||||||||||||||||||||||||
| Real estate loans | Real estate loans | |||||||||||||||||||||||||||||||||||||||||||||||||||||||||||||||||||||||||||||||
| Commercial | ||||||||||||||||||||||||||||||||||||||||||||||||||||||||||||||||||||||||||||||||
| Commercial | ||||||||||||||||||||||||||||||||||||||||||||||||||||||||||||||||||||||||||||||||
| Commercial | Commercial | $ | 3,385 | 6.8 | % | $ | 3,591 | 6.6 | % | $ | 3,237,657 | 6.5 | 6.5 | % | $ | 3,384,240 | 6.8 | 6.8 | % | |||||||||||||||||||||||||||||||||||||||||||||||||||||||||||||
| Residential | Residential | 3,002 | 6.0 | % | 1,772 | 3.2 | % | Residential | 3,582,533 | 7.2 | 7.2 | % | 3,002,099 | 6.0 | 6.0 | % | ||||||||||||||||||||||||||||||||||||||||||||||||||||||||||||||||
| Agricultural | Agricultural | 566 | 1.2 | % | 407 | 0.8 | % | Agricultural | 579,633 | 1.2 | 1.2 | % | 565,963 | 1.2 | 1.2 | % | ||||||||||||||||||||||||||||||||||||||||||||||||||||||||||||||||
| Total real estate loans | Total real estate loans | 6,953 | 14.0 | % | 5,770 | 10.6 | % | Total real estate loans | 7,399,823 | 14.9 | 14.9 | % | 6,952,302 | 14.0 | 14.0 | % | ||||||||||||||||||||||||||||||||||||||||||||||||||||||||||||||||
| Private credit | Private credit | |||||||||||||||||||||||||||||||||||||||||||||||||||||||||||||||||||||||||||||||
| Private credit | ||||||||||||||||||||||||||||||||||||||||||||||||||||||||||||||||||||||||||||||||
| Private credit | ||||||||||||||||||||||||||||||||||||||||||||||||||||||||||||||||||||||||||||||||
| Middle market | ||||||||||||||||||||||||||||||||||||||||||||||||||||||||||||||||||||||||||||||||
| Middle market | ||||||||||||||||||||||||||||||||||||||||||||||||||||||||||||||||||||||||||||||||
| Middle market | Middle market | 1,493 | 3.0 | % | 1,062 | 2.0 | % | 2,141,365 | 4.3 | 4.3 | % | 1,492,727 | 3.0 | 3.0 | % | |||||||||||||||||||||||||||||||||||||||||||||||||||||||||||||||||
| Specialty finance | Specialty finance | 443 | 0.9 | % | — | — | % | Specialty finance | 661,800 | 1.3 | 1.3 | % | 442,555 | 0.9 | 0.9 | % | ||||||||||||||||||||||||||||||||||||||||||||||||||||||||||||||||
| Infrastructure debt | Infrastructure debt | 555 | 1.1 | % | 508 | 0.9 | % | Infrastructure debt | 757,631 | 1.5 | 1.5 | % | 554,812 | 1.1 | 1.1 | % | ||||||||||||||||||||||||||||||||||||||||||||||||||||||||||||||||
| Total private credit | Total private credit | 2,491 | 5.0 | % | 1,570 | 2.9 | % | |||||||||||||||||||||||||||||||||||||||||||||||||||||||||||||||||||||||||
| Total private credit | ||||||||||||||||||||||||||||||||||||||||||||||||||||||||||||||||||||||||||||||||
| Total private credit | 3,560,796 | 7.1 | % | 2,490,094 | 5.0 | % | ||||||||||||||||||||||||||||||||||||||||||||||||||||||||||||||||||||||||||
| Equity | Equity | |||||||||||||||||||||||||||||||||||||||||||||||||||||||||||||||||||||||||||||||
| Equity | ||||||||||||||||||||||||||||||||||||||||||||||||||||||||||||||||||||||||||||||||
| Equity | ||||||||||||||||||||||||||||||||||||||||||||||||||||||||||||||||||||||||||||||||
| Residential real estate | ||||||||||||||||||||||||||||||||||||||||||||||||||||||||||||||||||||||||||||||||
| Residential real estate | ||||||||||||||||||||||||||||||||||||||||||||||||||||||||||||||||||||||||||||||||
| Residential real estate | Residential real estate | 961 | 1.9 | % | 344 | 0.6 | % | 1,223,814 | 2.5 | 2.5 | % | 961,263 | 1.9 | 1.9 | % | |||||||||||||||||||||||||||||||||||||||||||||||||||||||||||||||||
| Commercial real estate | Commercial real estate | 117 | 0.2 | % | 5 | — | % | Commercial real estate | 97,233 | 0.2 | 0.2 | % | 116,779 | 0.2 | 0.2 | % | ||||||||||||||||||||||||||||||||||||||||||||||||||||||||||||||||
| Infrastructure | Infrastructure | 91 | 0.2 | % | 73 | 0.1 | % | Infrastructure | 193,700 | 0.4 | 0.4 | % | 91,485 | 0.2 | 0.2 | % | ||||||||||||||||||||||||||||||||||||||||||||||||||||||||||||||||
| Core private equity | Core private equity | 364 | 0.7 | % | 253 | 0.5 | % | Core private equity | 335,162 | 0.7 | 0.7 | % | 363,892 | 0.7 | 0.7 | % | ||||||||||||||||||||||||||||||||||||||||||||||||||||||||||||||||
| Total equity | Total equity | 1,533 | 3.0 | % | 675 | 1.2 | % | Total equity | 1,849,909 | 3.8 | 3.8 | % | 1,533,419 | 3.0 | 3.0 | % | ||||||||||||||||||||||||||||||||||||||||||||||||||||||||||||||||
| Total private assets | Total private assets | $ | 10,977 | 22.0 | % | $ | 8,015 | 14.7 | % | Total private assets | $ | 12,810,528 | 25.8 | 25.8 | % | $ | 10,975,815 | 22.0 | 22.0 | % | ||||||||||||||||||||||||||||||||||||||||||||||||||||||||||||
| Payments Due by Period | |||||||||||||||||||||||||||||||||||||||||||||||||||||||||||||||||||||||||||||||||||||||
| Total | Less Than 1 year | 1–3 Years | 4–5 Years | After 5 Years | |||||||||||||||||||||||||||||||||||||||||||||||||||||||||||||||||||||||||||||||||||
| (Dollars in thousands) | |||||||||||||||||||||||||||||||||||||||||||||||||||||||||||||||||||||||||||||||||||||||
| Payments Due by Period | Payments Due by Period | ||||||||||||||||||||||||||||||||||||||||||||||||||||||||||||||||||||||||||||||||||||||
| Total | Total | Less Than 1 year | 1–3 Years | 4–5 Years | After 5 Years | ||||||||||||||||||||||||||||||||||||||||||||||||||||||||||||||||||||||||||||||||||
| (Dollars in thousands) | (Dollars in thousands) | ||||||||||||||||||||||||||||||||||||||||||||||||||||||||||||||||||||||||||||||||||||||
| Annuity and single premium universal life products (1) | Annuity and single premium universal life products (1) | $ | 63,211,336 | $ | 4,022,156 | $ | 15,083,920 | $ | 7,398,151 | $ | 36,707,109 | ||||||||||||||||||||||||||||||||||||||||||||||||||||||||||||||||||||||||||||
| Notes and loan payable, including interest payments (2) | Notes and loan payable, including interest payments (2) | 1,028,981 | 50,714 | 154,288 | 823,979 | — | |||||||||||||||||||||||||||||||||||||||||||||||||||||||||||||||||||||||||||||||||
| Subordinated debentures, including interest payments (3) | Subordinated debentures, including interest payments (3) | 215,825 | 4,850 | 9,700 | 9,700 | 191,575 | |||||||||||||||||||||||||||||||||||||||||||||||||||||||||||||||||||||||||||||||||
| Operating leases | Operating leases | 28,503 | 3,792 | 8,097 | 5,601 | 11,013 | |||||||||||||||||||||||||||||||||||||||||||||||||||||||||||||||||||||||||||||||||
| Operating leases | |||||||||||||||||||||||||||||||||||||||||||||||||||||||||||||||||||||||||||||||||||||||
| Operating leases | |||||||||||||||||||||||||||||||||||||||||||||||||||||||||||||||||||||||||||||||||||||||
| Mortgage loan funding and other investments | Mortgage loan funding and other investments | 2,390,862 | 2,390,862 | — | — | — | |||||||||||||||||||||||||||||||||||||||||||||||||||||||||||||||||||||||||||||||||
| Total | Total | $ | 66,875,507 | $ | 6,472,374 | $ | 15,256,005 | $ | 8,237,431 | $ | 36,909,697 | ||||||||||||||||||||||||||||||||||||||||||||||||||||||||||||||||||||||||||||
| Quoted Prices in Active Markets for Identical Assets (Level 1) | Significant Observable Inputs (Level 2) | Significant Unobservable Inputs (Level 3) | Total | ||||||||||||||||||||||||||||||||||||||||||||||||||||||||||||||||||
| (Dollars in thousands) | |||||||||||||||||||||||||||||||||||||||||||||||||||||||||||||||||||||
| December 31, 2022 | |||||||||||||||||||||||||||||||||||||||||||||||||||||||||||||||||||||
| Quoted Prices in Active Markets for Identical Assets (Level 1) | Quoted Prices in Active Markets for Identical Assets (Level 1) | Significant Observable Inputs (Level 2) | Significant Unobservable Inputs (Level 3) | Total | |||||||||||||||||||||||||||||||||||||||||||||||||||||||||||||||||
| (Dollars in thousands) | (Dollars in thousands) | ||||||||||||||||||||||||||||||||||||||||||||||||||||||||||||||||||||
| December 31, 2023 | |||||||||||||||||||||||||||||||||||||||||||||||||||||||||||||||||||||
| Priced via third party pricing services | |||||||||||||||||||||||||||||||||||||||||||||||||||||||||||||||||||||
| Priced via third party pricing services | |||||||||||||||||||||||||||||||||||||||||||||||||||||||||||||||||||||
| Priced via third party pricing services | Priced via third party pricing services | $ | 26,184 | $ | 30,061,381 | $ | — | $ | 30,087,565 | ||||||||||||||||||||||||||||||||||||||||||||||||||||||||||||
| Priced via independent broker quotations | Priced via independent broker quotations | — | — | — | — | ||||||||||||||||||||||||||||||||||||||||||||||||||||||||||||||||
| Priced via other methods | Priced via other methods | — | 4,034,863 | 657,554 | 4,692,417 | ||||||||||||||||||||||||||||||||||||||||||||||||||||||||||||||||
| $ | 26,184 | $ | 34,096,244 | $ | 657,554 | $ | 34,779,982 | ||||||||||||||||||||||||||||||||||||||||||||||||||||||||||||||
| Priced via other methods | |||||||||||||||||||||||||||||||||||||||||||||||||||||||||||||||||||||
| Priced via other methods | |||||||||||||||||||||||||||||||||||||||||||||||||||||||||||||||||||||
| $ | |||||||||||||||||||||||||||||||||||||||||||||||||||||||||||||||||||||
| % of Total | % of Total | 0.1 | % | 98.0 | % | 1.9 | % | 100.0 | % | % of Total | 0.1 | % | 92.8 | % | 7.1 | % | 100.0 | % | |||||||||||||||||||||||||||||||||||||||||||||||||||
| Coinsurance investments (1) | Coinsurance investments (1) | — | 4,836,923 | 187,712 | 5,024,635 | ||||||||||||||||||||||||||||||||||||||||||||||||||||||||||||||||
| $ | |||||||||||||||||||||||||||||||||||||||||||||||||||||||||||||||||||||
| $ | 26,184 | $ | 38,933,167 | $ | 845,266 | $ | 39,804,617 | ||||||||||||||||||||||||||||||||||||||||||||||||||||||||||||||
| December 31, 2021 | |||||||||||||||||||||||||||||||||||||||||||||||||||||||||||||||||||||
| December 31, 2022 | |||||||||||||||||||||||||||||||||||||||||||||||||||||||||||||||||||||
| December 31, 2022 | |||||||||||||||||||||||||||||||||||||||||||||||||||||||||||||||||||||
| December 31, 2022 | |||||||||||||||||||||||||||||||||||||||||||||||||||||||||||||||||||||
| Priced via third party pricing services | |||||||||||||||||||||||||||||||||||||||||||||||||||||||||||||||||||||
| Priced via third party pricing services | |||||||||||||||||||||||||||||||||||||||||||||||||||||||||||||||||||||
| Priced via third party pricing services | Priced via third party pricing services | $ | 32,742 | $ | 46,930,830 | $ | — | $ | 46,963,572 | ||||||||||||||||||||||||||||||||||||||||||||||||||||||||||||
| Priced via independent broker quotations | Priced via independent broker quotations | — | — | — | — | ||||||||||||||||||||||||||||||||||||||||||||||||||||||||||||||||
| Priced via other methods | Priced via other methods | — | 2,005,747 | — | 2,005,747 | ||||||||||||||||||||||||||||||||||||||||||||||||||||||||||||||||
| $ | 32,742 | $ | 48,936,577 | $ | — | $ | 48,969,319 | ||||||||||||||||||||||||||||||||||||||||||||||||||||||||||||||
| Priced via other methods | |||||||||||||||||||||||||||||||||||||||||||||||||||||||||||||||||||||
| Priced via other methods | |||||||||||||||||||||||||||||||||||||||||||||||||||||||||||||||||||||
| $ | |||||||||||||||||||||||||||||||||||||||||||||||||||||||||||||||||||||
| % of Total | % of Total | 0.1 | % | 99.9 | % | — | % | 100.0 | % | % of Total | 0.1 | % | 98.0 | % | 1.9 | % | 100.0 | % | |||||||||||||||||||||||||||||||||||||||||||||||||||
| Coinsurance investments (1) | Coinsurance investments (1) | 32,695 | 2,303,929 | — | 2,336,624 | ||||||||||||||||||||||||||||||||||||||||||||||||||||||||||||||||
| $ | 65,437 | $ | 51,240,506 | $ | — | $ | 51,305,943 | ||||||||||||||||||||||||||||||||||||||||||||||||||||||||||||||
| $ | |||||||||||||||||||||||||||||||||||||||||||||||||||||||||||||||||||||
| Year Ended December 31, | |||||||||||||||||
| 2022 | 2021 | 2020 | |||||||||||||||
| (Dollars in thousands) | |||||||||||||||||
| Proceeds received at expiration of options related to such credits | $ | 312,133 | $ | 2,019,477 | $ | 758,604 | |||||||||||
| Annual index credits to policyholders on their anniversaries | 305,292 | 1,977,888 | 747,489 | ||||||||||||||
| Year Ended December 31, | |||||||||||||||||
| 2023 | 2022 | 2021 | |||||||||||||||
| (Dollars in thousands) | |||||||||||||||||
| Proceeds received at expiration of options related to such credits | $ | 344,876 | $ | 312,133 | $ | 2,019,477 | |||||||||||
| Annual index credits to policyholders on their anniversaries | 326,471 | 305,292 | 1,977,888 | ||||||||||||||
| Exhibit No. | Description | |||||||
| 3.1 | ||||||||
| 3.2 | ||||||||
| 3.3 | ||||||||
| 3.4 | ||||||||
| 3.5 | ||||||||
| 3.6 | ||||||||
| 3.7 | ||||||||
| 3.8 | ||||||||
| 3.9 | ||||||||
| 4.1 | ||||||||
| Exhibit No. | Description | |||||||
| 4.2 | ||||||||
| 4.3 | ||||||||
| 4.4 | ||||||||
| 4.5 | ||||||||
| 4.6 | ||||||||
| 4.7 | ||||||||
| 4.8 | ||||||||
| 4.9 | ||||||||
| 4.10 | ||||||||
| 4.11 | ||||||||
| 4.12 | ||||||||
| 4.13 | ||||||||
| 10.1 * | ||||||||
| 10.13 * | ||||||||||||
| Description | ||||||||
| 10.19 | ||||||||
| 10.35 * | ||||||||
| 10.36 * | ||||||||
| 10.37 * | ||||||||
| 10.38 | Agreement and Plan of Merger, dated July 4, 2023, by and among the Company, the Parent and Merger Sub and, solely for the purposes set forth therein, BAM*(Incorporated by reference to Exhibit 2.1 to Form 8-K filed July 5, 2023) (*Schedules omitted pursuant to Item 601(b)(2) of Regulation S-K. The Company agrees to furnish supplementally a copy of any omitted schedule to the SEC upon request; provided, however, that the Company may request confidential treatment pursuant to Rule 24b-2 of the Securities Exchange Act of 1934, as amended, for any schedules or exhibits so furnished.) | |||||||
| 10.39 * | ||||||||
| 10.40 | ||||||||
| 10.41 * | ||||||||
| 10.42 * | ||||||||
| 10.43 * | ||||||||
| 10.44 * | ||||||||
| 10.45 * | ||||||||
| 10.46 * | ||||||||
| 10.47 * | ||||||||
| Exhibit No. | Description | |||||||
| 10.48 * | ||||||||
| 10.49 * | ||||||||
| 10.50 * | ||||||||
| 21.2 | ||||||||
| 23.1 | ||||||||
| 31.1 | ||||||||
| 31.2 | ||||||||
| 32.1 | ||||||||
| 32.2 | ||||||||
| 101 | The following materials from American Equity Investment Life Holding Company's Annual Report on Form 10-K for the year ended December 31, | |||||||
| 104 | The cover page from American Equity Investment Life Holding Company's Annual Report on Form 10-K for the year ended December 31, | |||||||
| AMERICAN EQUITY INVESTMENT LIFE HOLDING COMPANY | |||||||||||
| By: | /s/ ANANT BHALLA | ||||||||||
Anant Bhalla, Chief Executive Officer & President | |||||||||||
| Signature | Title (Capacity) | Date | ||||||||||||
| /s/ ANANT BHALLA | Chief Executive Officer, President and Director (Principal Executive Officer) | February | ||||||||||||
| Anant Bhalla | ||||||||||||||
| /s/ AXEL ANDRE | Executive Vice President and Chief Financial Officer (Principal Financial Officer) | February | ||||||||||||
| Axel Andre | ||||||||||||||
| /s/ | Controller (Principal Accounting Officer) | February | ||||||||||||
| /s/ DAVID S. MULCAHY | Non-Executive Chairman and Director | February | ||||||||||||
| David S. Mulcahy | ||||||||||||||
| /s/ JOYCE A. CHAPMAN | Director | February | ||||||||||||
| Joyce A. Chapman | ||||||||||||||
| /s/ BRENDA J. CUSHING | Director | February | ||||||||||||
| Brenda J. Cushing | ||||||||||||||
| /s/ MICHAEL E. HAYES | Director | February 29, 2024 | ||||||||||||
| Michael E. Hayes | ||||||||||||||
| /s/ DOUGLAS T. HEALY | Director | February | ||||||||||||
| Douglas T. Healy | ||||||||||||||
| /s/ ROBERT L. HOWE | Director | February | ||||||||||||
| Robert L. Howe | ||||||||||||||
| /s/ WILLIAM R. KUNKEL | Director | February | ||||||||||||
| William R. Kunkel | ||||||||||||||
| /s/ ALAN D. MATULA | Director | February | ||||||||||||
| Alan D. Matula | ||||||||||||||
| /s/ GERARD D. NEUGENT | Director | February | ||||||||||||
| Gerard D. Neugent | ||||||||||||||
F-2 | |||||
(Ernst & Young LLP, Des Moines, Iowa, Auditor Firm ID: | F-3 | ||||
| Consolidated Financial Statements: | |||||
F- | |||||
F-7 | |||||
F-8 | |||||
F-9 | |||||
F-10 | |||||
| Notes to Consolidated Financial Statements | |||||
F-12 | |||||
F- | |||||
F- | |||||
F- | |||||
F- | |||||
F- | |||||
F- | |||||
F-44 | |||||
F- | |||||
F-54 | |||||
F- | |||||
F-56 | |||||
F- | |||||
F- | |||||
F- | |||||
F- | |||||
| Schedules: | |||||
F- | |||||
F- | |||||
F- | |||||
F- | |||||
| Fixed Index Annuity Embedded Derivative Liability and Market Risk Benefits | ||||||||
| Description of the Matter | At December 31, 2023, the fair value of the Company’s fixed index annuity embedded derivative liability totaled $5.2 billion, net of coinsurance ceded. The Company’s fixed index annuity contracts contain crediting features, where amounts credited to the contract’s account value are linked to the performance of certain market indices. The index crediting feature is accounted for as an embedded derivative liability and reported at fair value as discussed in Notes 1 and 2 to the consolidated financial statements. A subset of fixed index annuity and fixed rate annuity contracts include guaranteed minimum withdrawal benefits and guaranteed minimum death benefit features that are market risk benefits (MRB) measured at fair value as discussed in Notes 1, 2, and 8 to the consolidated financial statements. The Company’s MRB assets and MRB liabilities totaled $479.7 million and $3,146.6 million, respectively, as of December 31, 2023. Auditing the valuation of the Company’s fixed index annuity embedded derivative and MRBs was complex because of the highly judgmental nature of the determination of the assumptions required to determine the fair value of the embedded derivative and MRBs. In particular, the fair value was sensitive to the significant assumptions including the expected cost of annual call options, nonperformance risk, and those used to determine future policy growth including lapse, lifetime income benefit rider (LIBR) reset, and LIBR utilization. Mortality and partial withdrawal are additional significant assumptions used in the valuation of the MRBs. | |||||||
| How We Addressed the Matter in Our Audit | We obtained an understanding, evaluated the design, and tested the operating effectiveness of the Company’s controls over management’s process for the development of the significant assumptions used in measuring the fair value of the embedded derivative for fixed index annuities and MRBs. These controls included, among others, the review and approval process management has in place for the development of the significant assumptions. To evaluate the judgment used by management in determining the assumptions used in measuring the fair value of the fixed index annuity embedded derivative and MRBs, among other procedures, we involved actuarial specialists and evaluated the methodology applied by management in determining the fair value with those used in the prior period and in the industry. To evaluate the significant assumptions used by management in the methodology applied, we compared as applicable the significant assumptions noted above to historical experience, observable market data, and management’s estimates of prospective changes in these assumptions. We also performed an independent recalculation of the embedded derivative and MRB for a sample of policies for comparison with the actuarial models used by management. | |||||||
| December 31, | |||||||||||
| 2022 | 2021 | ||||||||||
| Assets | |||||||||||
| Investments: | |||||||||||
| Fixed maturity securities, available for sale, at fair value (amortized cost of $44,866,019 as of 2022 and $46,999,183 as of 2021; allowance for credit losses of $3,347 as of 2022 and $2,846 as of 2021) | $ | 39,804,617 | $ | 51,305,943 | |||||||
| Mortgage loans on real estate (net of allowance for credit losses of $36,972 as of 2022 and $24,024 as of 2021) | 6,949,027 | 5,687,998 | |||||||||
| Real estate investments related to consolidated variable interest entities | 1,056,063 | 337,939 | |||||||||
| Limited partnerships and limited liability companies (2022 and 2021 include $684,834 and $168,711 related to consolidated variable interest entities) | 1,266,779 | 520,120 | |||||||||
| Derivative instruments | 431,727 | 1,277,480 | |||||||||
| Other investments | 1,817,085 | 1,247,024 | |||||||||
| Total investments | 51,325,298 | 60,376,504 | |||||||||
| Cash and cash equivalents (2022 and 2021 include $27,235 and $23,763 related to consolidated variable interest entities) | 1,919,669 | 4,508,982 | |||||||||
| Coinsurance deposits (net of allowance for credit losses of $8,737 as of 2022 and $2,264 as of 2021) | 13,208,399 | 8,850,608 | |||||||||
| Accrued investment income (2022 and 2021 include $3,444 and $3 related to consolidated variable interest entities) | 497,851 | 445,097 | |||||||||
| Deferred policy acquisition costs | 3,562,075 | 2,222,769 | |||||||||
| Deferred sales inducements | 2,593,350 | 1,546,073 | |||||||||
| Deferred income taxes | 220,873 | — | |||||||||
| Income taxes recoverable | 55,498 | 166,586 | |||||||||
| Other assets (2022 and 2021 include $10,690 and $1,524 related to consolidated variable interest entities) | 543,128 | 232,490 | |||||||||
| Total assets | $ | 73,926,141 | $ | 78,349,109 | |||||||
| Liabilities and Stockholders' Equity | |||||||||||
| Liabilities: | |||||||||||
| Policy benefit reserves | $ | 61,118,134 | $ | 65,477,778 | |||||||
| Other policy funds and contract claims | 512,790 | 226,844 | |||||||||
| Notes and loan payable | 792,073 | 496,250 | |||||||||
| Subordinated debentures | 78,753 | 78,421 | |||||||||
| Deferred income taxes | — | 541,972 | |||||||||
| Funds withheld for reinsurance liabilities | 6,577,426 | 3,124,740 | |||||||||
| Other liabilities (2022 and 2021 include $78,644 and $20,168 related to consolidated variable interest entities) | 1,656,509 | 2,079,977 | |||||||||
| Total liabilities | 70,735,685 | 72,025,982 | |||||||||
| Stockholders' equity: | |||||||||||
| Preferred stock, Series A; par value $1 per share; $400,000 aggregate liquidation preference; 20,000 shares authorized; issued and outstanding: 2022 and 2021 - 16,000 shares | 16 | 16 | |||||||||
| Preferred stock, Series B; par value $1 per share; $300,000 aggregate liquidation preference; 12,000 shares authorized; issued and outstanding: 2022 and 2021 - 12,000 shares | 12 | 12 | |||||||||
Common stock; par value $1 per share; 200,000,000 shares authorized; issued and outstanding: 2022 - 84,810,255 shares (excluding 24,590,353 treasury shares); 2021 - 92,513,517 shares (excluding 9,936,715 treasury shares) | 84,810 | 92,514 | |||||||||
| Additional paid-in capital | 1,325,316 | 1,614,374 | |||||||||
| Accumulated other comprehensive income (loss) | (2,155,055) | 1,848,789 | |||||||||
| Retained earnings | 3,914,124 | 2,767,422 | |||||||||
| Total stockholders' equity attributable to American Equity Investment Life Holding Company | 3,169,223 | 6,323,127 | |||||||||
| Noncontrolling interests | 21,233 | — | |||||||||
| Total stockholders' equity | 3,190,456 | 6,323,127 | |||||||||
| Total liabilities and stockholders' equity | $ | 73,926,141 | $ | 78,349,109 | |||||||
| December 31, | |||||||||||
| 2023 | 2022 (a) | ||||||||||
| Assets | |||||||||||
| Investments: | |||||||||||
| Fixed maturity securities, available for sale, at fair value (amortized cost of $38,537,462 as of 2023 and $44,866,019 as of 2022; allowance for credit losses of $4,030 as of 2023 and $3,347 as of 2021) | $ | 34,780,482 | $ | 39,804,617 | |||||||
| Mortgage loans on real estate (net of allowance for credit losses of $38,135 as of 2023 and $36,972 as of 2022) | 7,537,594 | 6,949,027 | |||||||||
| Real estate investments (2023 and 2022 include $1,327,704 and $1,056,063 related to consolidated variable interest entities) | 1,334,247 | 1,056,063 | |||||||||
| Limited partnerships and limited liability companies (2023 and 2022 include $506,685 and $684,834 related to consolidated variable interest entities) | 1,089,591 | 1,266,779 | |||||||||
| Derivative instruments | 1,207,288 | 431,727 | |||||||||
| Other investments | 2,277,822 | 1,817,085 | |||||||||
| Total investments | 48,227,024 | 51,325,298 | |||||||||
| Cash and cash equivalents (2023 and 2022 include $35,745 and $27,235 related to consolidated variable interest entities) | 9,772,586 | 1,919,669 | |||||||||
| Coinsurance deposits (net of allowance for credit losses of $1,149 as of 2023 and $8,737 as of 2022) | 14,582,728 | 13,254,956 | |||||||||
| Market risk benefits | 479,694 | 229,871 | |||||||||
| Accrued investment income (2023 and 2022 include $2,862 and $3,444 related to consolidated variable interest entities) | 459,332 | 497,851 | |||||||||
| Deferred policy acquisition costs | 3,070,280 | 2,773,643 | |||||||||
| Deferred sales inducements | 2,367,224 | 2,045,683 | |||||||||
| Deferred income taxes | 152,652 | 438,434 | |||||||||
| Income taxes recoverable | 37,854 | 55,498 | |||||||||
| Other assets (2023 and 2022 include $18,681 and $10,690 related to consolidated variable interest entities) | 768,928 | 642,696 | |||||||||
| Total assets | $ | 79,918,302 | $ | 73,183,599 | |||||||
| December 31, | |||||||||||
| 2023 | 2022 (a) | ||||||||||
| Liabilities and Stockholders' Equity | |||||||||||
| Liabilities: | |||||||||||
| Policy benefit reserves | $ | 60,901,641 | $ | 58,781,836 | |||||||
| Market risk benefits | 3,146,554 | 2,455,492 | |||||||||
| Other policy funds and contract claims | 188,856 | 512,790 | |||||||||
| Notes and loan payable | 785,443 | 792,073 | |||||||||
| Subordinated debentures | 79,107 | 78,753 | |||||||||
| Funds withheld for reinsurance liabilities | 8,596,373 | 6,577,426 | |||||||||
| Other liabilities (2023 and 2022 include $93,520 and $78,644 related to consolidated variable interest entities) | 3,172,554 | 1,614,479 | |||||||||
| Total liabilities | 76,870,528 | 70,812,849 | |||||||||
| Stockholders' equity: | |||||||||||
| Preferred stock, Series A; par value $1 per share; $400,000 aggregate liquidation preference; 20,000 shares authorized; issued and outstanding: 2023 and 2022 - 16,000 shares | 16 | 16 | |||||||||
| Preferred stock, Series B; par value $1 per share; $300,000 aggregate liquidation preference; 12,000 shares authorized; issued and outstanding: 2023 and 2022 - 12,000 shares | 12 | 12 | |||||||||
Common stock; par value $1 per share; 200,000,000 shares authorized; issued and outstanding: 2023 - 79,337,818 shares (excluding 30,765,023 treasury shares); 2022 - 84,810,255 shares (excluding 24,590,353 treasury shares) | 79,338 | 84,810 | |||||||||
| Additional paid-in capital | 1,071,103 | 1,325,316 | |||||||||
| Accumulated other comprehensive loss | (2,979,657) | (3,746,230) | |||||||||
| Retained earnings | 4,852,448 | 4,685,593 | |||||||||
| Total stockholders' equity attributable to American Equity Investment Life Holding Company | 3,023,260 | 2,349,517 | |||||||||
| Noncontrolling interests | 24,514 | 21,233 | |||||||||
| Total stockholders' equity | 3,047,774 | 2,370,750 | |||||||||
| Total liabilities and stockholders' equity | $ | 79,918,302 | $ | 73,183,599 | |||||||
| Year Ended December 31, | |||||||||||||||||||||||||||||||||||||||||||||||||||
| 2022 | 2021 | 2020 | |||||||||||||||||||||||||||||||||||||||||||||||||
| Year Ended December 31, | Year Ended December 31, | ||||||||||||||||||||||||||||||||||||||||||||||||||
| 2023 | 2023 | 2022 (a) | 2021 (a) | ||||||||||||||||||||||||||||||||||||||||||||||||
| Revenues: | Revenues: | ||||||||||||||||||||||||||||||||||||||||||||||||||
| Premiums and other considerations | |||||||||||||||||||||||||||||||||||||||||||||||||||
| Premiums and other considerations | |||||||||||||||||||||||||||||||||||||||||||||||||||
| Premiums and other considerations | Premiums and other considerations | $ | 19,739 | $ | 58,202 | $ | 39,382 | ||||||||||||||||||||||||||||||||||||||||||||
| Annuity product charges | Annuity product charges | 230,354 | 242,631 | 251,227 | |||||||||||||||||||||||||||||||||||||||||||||||
| Net investment income | Net investment income | 2,307,463 | 2,037,475 | 2,182,078 | |||||||||||||||||||||||||||||||||||||||||||||||
| Change in fair value of derivatives | Change in fair value of derivatives | (1,138,128) | 1,348,735 | 34,666 | |||||||||||||||||||||||||||||||||||||||||||||||
| Net realized losses on investments | Net realized losses on investments | (47,848) | (13,242) | (80,680) | |||||||||||||||||||||||||||||||||||||||||||||||
| Other revenue | Other revenue | 43,921 | 15,670 | — | |||||||||||||||||||||||||||||||||||||||||||||||
| Loss on extinguishment of debt | — | — | (2,024) | ||||||||||||||||||||||||||||||||||||||||||||||||
| Total revenues | |||||||||||||||||||||||||||||||||||||||||||||||||||
| Total revenues | |||||||||||||||||||||||||||||||||||||||||||||||||||
| Total revenues | Total revenues | 1,415,501 | 3,689,471 | 2,424,649 | |||||||||||||||||||||||||||||||||||||||||||||||
| Benefits and expenses: | Benefits and expenses: | ||||||||||||||||||||||||||||||||||||||||||||||||||
| Insurance policy benefits and change in future policy benefits | 31,099 | 67,983 | 49,742 | ||||||||||||||||||||||||||||||||||||||||||||||||
| Benefits and expenses: | |||||||||||||||||||||||||||||||||||||||||||||||||||
| Benefits and expenses: | |||||||||||||||||||||||||||||||||||||||||||||||||||
| Insurance policy benefits and change in future policy benefits (remeasurement gains (losses) of future policy benefit reserves of $(2,013), $(1,959), and $(1,907) for years ended 2023, 2022, 2021, respectively) | |||||||||||||||||||||||||||||||||||||||||||||||||||
| Insurance policy benefits and change in future policy benefits (remeasurement gains (losses) of future policy benefit reserves of $(2,013), $(1,959), and $(1,907) for years ended 2023, 2022, 2021, respectively) | |||||||||||||||||||||||||||||||||||||||||||||||||||
| Insurance policy benefits and change in future policy benefits (remeasurement gains (losses) of future policy benefit reserves of $(2,013), $(1,959), and $(1,907) for years ended 2023, 2022, 2021, respectively) | |||||||||||||||||||||||||||||||||||||||||||||||||||
| Interest sensitive and index product benefits | Interest sensitive and index product benefits | 889,650 | 2,681,406 | 1,543,270 | |||||||||||||||||||||||||||||||||||||||||||||||
| Market risk benefits (gains) losses | |||||||||||||||||||||||||||||||||||||||||||||||||||
| Market risk benefits (gains) losses | |||||||||||||||||||||||||||||||||||||||||||||||||||
| Market risk benefits (gains) losses | |||||||||||||||||||||||||||||||||||||||||||||||||||
| Amortization of deferred sales inducements | |||||||||||||||||||||||||||||||||||||||||||||||||||
| Amortization of deferred sales inducements | |||||||||||||||||||||||||||||||||||||||||||||||||||
| Amortization of deferred sales inducements | Amortization of deferred sales inducements | 408,548 | 152,692 | 438,164 | |||||||||||||||||||||||||||||||||||||||||||||||
| Change in fair value of embedded derivatives | Change in fair value of embedded derivatives | (2,352,598) | (358,302) | (1,286,787) | |||||||||||||||||||||||||||||||||||||||||||||||
| Interest expense on notes and loan payable | Interest expense on notes and loan payable | 32,098 | 25,581 | 25,552 | |||||||||||||||||||||||||||||||||||||||||||||||
| Interest expense on subordinated debentures | Interest expense on subordinated debentures | 5,331 | 5,324 | 5,557 | |||||||||||||||||||||||||||||||||||||||||||||||
| Amortization of deferred policy acquisition costs | Amortization of deferred policy acquisition costs | 615,300 | 268,328 | 649,554 | |||||||||||||||||||||||||||||||||||||||||||||||
| Other operating costs and expenses | Other operating costs and expenses | 239,616 | 243,712 | 183,636 | |||||||||||||||||||||||||||||||||||||||||||||||
| Total benefits and expenses | Total benefits and expenses | (130,956) | 3,086,724 | 1,608,688 | |||||||||||||||||||||||||||||||||||||||||||||||
| Income before income taxes | Income before income taxes | 1,546,457 | 602,747 | 815,961 | |||||||||||||||||||||||||||||||||||||||||||||||
| Income tax expense | Income tax expense | 325,155 | 128,755 | 144,501 | |||||||||||||||||||||||||||||||||||||||||||||||
| Net income | Net income | 1,221,302 | 473,992 | 671,460 | |||||||||||||||||||||||||||||||||||||||||||||||
| Less: Net income available to noncontrolling interests | Less: Net income available to noncontrolling interests | 358 | — | — | |||||||||||||||||||||||||||||||||||||||||||||||
| Net income available to American Equity Investment Life Holding Company stockholders | Net income available to American Equity Investment Life Holding Company stockholders | 1,220,944 | 473,992 | 671,460 | |||||||||||||||||||||||||||||||||||||||||||||||
| Less: Preferred stock dividends | Less: Preferred stock dividends | 43,675 | 43,675 | 33,515 | |||||||||||||||||||||||||||||||||||||||||||||||
| Net income available to American Equity Investment Life Holding Company common stockholders | Net income available to American Equity Investment Life Holding Company common stockholders | $ | 1,177,269 | $ | 430,317 | $ | 637,945 | ||||||||||||||||||||||||||||||||||||||||||||
| Earnings per common share | Earnings per common share | $ | 13.00 | $ | 4.58 | $ | 6.93 | ||||||||||||||||||||||||||||||||||||||||||||
| Earnings per common share | |||||||||||||||||||||||||||||||||||||||||||||||||||
| Earnings per common share | |||||||||||||||||||||||||||||||||||||||||||||||||||
| Earnings per common share - assuming dilution | Earnings per common share - assuming dilution | $ | 12.86 | $ | 4.55 | $ | 6.90 | ||||||||||||||||||||||||||||||||||||||||||||
| Weighted average common shares outstanding (in thousands): | Weighted average common shares outstanding (in thousands): | ||||||||||||||||||||||||||||||||||||||||||||||||||
| Weighted average common shares outstanding (in thousands): | |||||||||||||||||||||||||||||||||||||||||||||||||||
| Weighted average common shares outstanding (in thousands): | |||||||||||||||||||||||||||||||||||||||||||||||||||
| Earnings per common share | |||||||||||||||||||||||||||||||||||||||||||||||||||
| Earnings per common share | |||||||||||||||||||||||||||||||||||||||||||||||||||
| Earnings per common share | Earnings per common share | 90,558 | 93,860 | 92,055 | |||||||||||||||||||||||||||||||||||||||||||||||
| Earnings per common share - assuming dilution | Earnings per common share - assuming dilution | 91,538 | 94,491 | 92,392 | |||||||||||||||||||||||||||||||||||||||||||||||
| Year Ended December 31, | |||||||||||||||||||||||||||||||||||||||||||||||||||
| 2022 | 2021 | 2020 | |||||||||||||||||||||||||||||||||||||||||||||||||
| Year Ended December 31, | Year Ended December 31, | ||||||||||||||||||||||||||||||||||||||||||||||||||
| 2023 | 2023 | 2022 (a) | 2021 (a) | ||||||||||||||||||||||||||||||||||||||||||||||||
| Net income | Net income | $ | 1,221,302 | $ | 473,992 | $ | 671,460 | ||||||||||||||||||||||||||||||||||||||||||||
| Other comprehensive income (loss): | Other comprehensive income (loss): | ||||||||||||||||||||||||||||||||||||||||||||||||||
| Change in net unrealized investment gains/losses (1) | (5,064,286) | (441,008) | 1,058,289 | ||||||||||||||||||||||||||||||||||||||||||||||||
| Reclassification of unrealized investment gains/losses to net income (1) | (7,516) | (4,044) | 16,690 | ||||||||||||||||||||||||||||||||||||||||||||||||
| Change in net unrealized investment gains/losses | |||||||||||||||||||||||||||||||||||||||||||||||||||
| Change in net unrealized investment gains/losses | |||||||||||||||||||||||||||||||||||||||||||||||||||
| Change in net unrealized investment gains/losses | |||||||||||||||||||||||||||||||||||||||||||||||||||
| Change in current discount rate for liability for future policy benefits | |||||||||||||||||||||||||||||||||||||||||||||||||||
| Changes in instrument-specific credit risk for market risk benefits | |||||||||||||||||||||||||||||||||||||||||||||||||||
| Reclassification of unrealized investment gains/losses to net income | |||||||||||||||||||||||||||||||||||||||||||||||||||
| Other comprehensive income (loss) before income tax | Other comprehensive income (loss) before income tax | (5,071,802) | (445,052) | 1,074,979 | |||||||||||||||||||||||||||||||||||||||||||||||
| Income tax effect related to other comprehensive income (loss) | Income tax effect related to other comprehensive income (loss) | 1,067,958 | 90,284 | (225,746) | |||||||||||||||||||||||||||||||||||||||||||||||
| Other comprehensive income (loss) | Other comprehensive income (loss) | (4,003,844) | (354,768) | 849,233 | |||||||||||||||||||||||||||||||||||||||||||||||
| Comprehensive income (loss) | Comprehensive income (loss) | $ | (2,782,542) | $ | 119,224 | $ | 1,520,693 | ||||||||||||||||||||||||||||||||||||||||||||
| Preferred Stock | Preferred Stock | Common Stock | Additional Paid-in Capital | Accumulated Other Comprehensive Income (Loss) | Retained Earnings | Noncontrolling Interest | Total Stockholders' Equity | ||||||||||||||||||||||||||||||||||||||||||||||||||||||||||||||||||||||||||||||||||||||||||||||||||
| Balance at December 31, 2020 (a) | |||||||||||||||||||||||||||||||||||||||||||||||||||||||||||||||||||||||||||||||||||||||||||||||||||||||||
| Cumulative effect of change in accounting principle | |||||||||||||||||||||||||||||||||||||||||||||||||||||||||||||||||||||||||||||||||||||||||||||||||||||||||
| Net income for the year | |||||||||||||||||||||||||||||||||||||||||||||||||||||||||||||||||||||||||||||||||||||||||||||||||||||||||
| Other comprehensive loss | |||||||||||||||||||||||||||||||||||||||||||||||||||||||||||||||||||||||||||||||||||||||||||||||||||||||||
| Preferred Stock | Common Stock | Additional Paid-in Capital | Accumulated Other Comprehensive Income (Loss) | Retained Earnings | Noncontrolling Interest | Total Stockholders' Equity | |||||||||||||||||||||||||||||||||||||||||||||||||||||||||||||||||||||||||||||||||||||||||||||||||||
| Balance at December 31, 2019 | $ | 16 | $ | 91,107 | $ | 1,212,311 | $ | 1,354,324 | $ | 1,768,764 | $ | — | $ | 4,426,522 | |||||||||||||||||||||||||||||||||||||||||||||||||||||||||||||||||||||||||||||||||||||||||||
| Net income for the year | — | — | — | — | 671,460 | — | 671,460 | ||||||||||||||||||||||||||||||||||||||||||||||||||||||||||||||||||||||||||||||||||||||||||||||||||
| Other comprehensive income | — | — | — | 849,233 | — | — | 849,233 | ||||||||||||||||||||||||||||||||||||||||||||||||||||||||||||||||||||||||||||||||||||||||||||||||||
| Issuance of preferred stock | 12 | — | 290,248 | — | — | — | 290,260 | ||||||||||||||||||||||||||||||||||||||||||||||||||||||||||||||||||||||||||||||||||||||||||||||||||
| Share-based compensation | |||||||||||||||||||||||||||||||||||||||||||||||||||||||||||||||||||||||||||||||||||||||||||||||||||||||||
| Share-based compensation | |||||||||||||||||||||||||||||||||||||||||||||||||||||||||||||||||||||||||||||||||||||||||||||||||||||||||
| Share-based compensation | Share-based compensation | — | — | 10,215 | — | — | — | 10,215 | |||||||||||||||||||||||||||||||||||||||||||||||||||||||||||||||||||||||||||||||||||||||||||||||||
| Issuance of common stock | Issuance of common stock | — | 10,053 | 328,008 | — | — | — | 338,061 | |||||||||||||||||||||||||||||||||||||||||||||||||||||||||||||||||||||||||||||||||||||||||||||||||
| Treasury stock acquired, common | Treasury stock acquired, common | — | (5,439) | (159,655) | — | — | — | (165,094) | |||||||||||||||||||||||||||||||||||||||||||||||||||||||||||||||||||||||||||||||||||||||||||||||||
| Cumulative effect of change in accounting principle | — | — | — | — | (9,295) | — | (9,295) | ||||||||||||||||||||||||||||||||||||||||||||||||||||||||||||||||||||||||||||||||||||||||||||||||||
| Dividends on preferred stock | Dividends on preferred stock | — | — | — | — | (33,515) | — | (33,515) | |||||||||||||||||||||||||||||||||||||||||||||||||||||||||||||||||||||||||||||||||||||||||||||||||
| Dividends on common stock ($0.32 per share) | — | — | — | — | (28,859) | — | (28,859) | ||||||||||||||||||||||||||||||||||||||||||||||||||||||||||||||||||||||||||||||||||||||||||||||||||
| Balance at December 31, 2020 | 28 | 95,721 | 1,681,127 | 2,203,557 | 2,368,555 | — | 6,348,988 | ||||||||||||||||||||||||||||||||||||||||||||||||||||||||||||||||||||||||||||||||||||||||||||||||||
| Dividends on common stock ($0.34 per share) | |||||||||||||||||||||||||||||||||||||||||||||||||||||||||||||||||||||||||||||||||||||||||||||||||||||||||
| Balance at December 31, 2021 (a) | |||||||||||||||||||||||||||||||||||||||||||||||||||||||||||||||||||||||||||||||||||||||||||||||||||||||||
| Net income for the year | Net income for the year | — | — | — | — | 473,992 | — | 473,992 | |||||||||||||||||||||||||||||||||||||||||||||||||||||||||||||||||||||||||||||||||||||||||||||||||
| Other comprehensive loss | Other comprehensive loss | — | — | — | (354,768) | — | — | (354,768) | |||||||||||||||||||||||||||||||||||||||||||||||||||||||||||||||||||||||||||||||||||||||||||||||||
| Share-based compensation | |||||||||||||||||||||||||||||||||||||||||||||||||||||||||||||||||||||||||||||||||||||||||||||||||||||||||
| Share-based compensation | |||||||||||||||||||||||||||||||||||||||||||||||||||||||||||||||||||||||||||||||||||||||||||||||||||||||||
| Share-based compensation | Share-based compensation | — | — | 24,601 | — | — | — | 24,601 | |||||||||||||||||||||||||||||||||||||||||||||||||||||||||||||||||||||||||||||||||||||||||||||||||
| Issuance of common stock | Issuance of common stock | — | 460 | 4,394 | — | — | — | 4,854 | |||||||||||||||||||||||||||||||||||||||||||||||||||||||||||||||||||||||||||||||||||||||||||||||||
| Treasury stock acquired, common | Treasury stock acquired, common | — | (3,667) | (95,748) | — | — | — | (99,415) | |||||||||||||||||||||||||||||||||||||||||||||||||||||||||||||||||||||||||||||||||||||||||||||||||
| Dividends on preferred stock | Dividends on preferred stock | — | — | — | — | (43,675) | — | (43,675) | |||||||||||||||||||||||||||||||||||||||||||||||||||||||||||||||||||||||||||||||||||||||||||||||||
| Dividends on common stock ($0.34 per share) | — | — | — | — | (31,450) | — | (31,450) | ||||||||||||||||||||||||||||||||||||||||||||||||||||||||||||||||||||||||||||||||||||||||||||||||||
| Balance at December 31, 2021 | 28 | 92,514 | 1,614,374 | 1,848,789 | 2,767,422 | — | 6,323,127 | ||||||||||||||||||||||||||||||||||||||||||||||||||||||||||||||||||||||||||||||||||||||||||||||||||
| Dividends on preferred stock | |||||||||||||||||||||||||||||||||||||||||||||||||||||||||||||||||||||||||||||||||||||||||||||||||||||||||
| Dividends on preferred stock | |||||||||||||||||||||||||||||||||||||||||||||||||||||||||||||||||||||||||||||||||||||||||||||||||||||||||
| Dividends on common stock ($0.36 per share) | |||||||||||||||||||||||||||||||||||||||||||||||||||||||||||||||||||||||||||||||||||||||||||||||||||||||||
| Contributions from noncontrolling interests | |||||||||||||||||||||||||||||||||||||||||||||||||||||||||||||||||||||||||||||||||||||||||||||||||||||||||
| Balance at December 31, 2022 (a) | |||||||||||||||||||||||||||||||||||||||||||||||||||||||||||||||||||||||||||||||||||||||||||||||||||||||||
| Net income for the year | Net income for the year | — | — | — | — | 1,220,944 | 358 | 1,221,302 | |||||||||||||||||||||||||||||||||||||||||||||||||||||||||||||||||||||||||||||||||||||||||||||||||
| Other comprehensive loss | — | — | — | (4,003,844) | — | — | (4,003,844) | ||||||||||||||||||||||||||||||||||||||||||||||||||||||||||||||||||||||||||||||||||||||||||||||||||
| Other comprehensive income | |||||||||||||||||||||||||||||||||||||||||||||||||||||||||||||||||||||||||||||||||||||||||||||||||||||||||
| Share-based compensation | |||||||||||||||||||||||||||||||||||||||||||||||||||||||||||||||||||||||||||||||||||||||||||||||||||||||||
| Share-based compensation | |||||||||||||||||||||||||||||||||||||||||||||||||||||||||||||||||||||||||||||||||||||||||||||||||||||||||
| Share-based compensation | Share-based compensation | — | — | 15,827 | — | — | — | 15,827 | |||||||||||||||||||||||||||||||||||||||||||||||||||||||||||||||||||||||||||||||||||||||||||||||||
| Issuance of common stock | Issuance of common stock | — | 7,112 | 246,866 | — | — | — | 253,978 | |||||||||||||||||||||||||||||||||||||||||||||||||||||||||||||||||||||||||||||||||||||||||||||||||
| Treasury stock acquired, common | Treasury stock acquired, common | — | (14,816) | (551,751) | — | — | — | (566,567) | |||||||||||||||||||||||||||||||||||||||||||||||||||||||||||||||||||||||||||||||||||||||||||||||||
| Dividends on preferred stock | Dividends on preferred stock | — | — | — | — | (43,675) | — | (43,675) | |||||||||||||||||||||||||||||||||||||||||||||||||||||||||||||||||||||||||||||||||||||||||||||||||
| Dividends on common stock ($0.36 per share) | — | — | — | — | (30,567) | — | (30,567) | ||||||||||||||||||||||||||||||||||||||||||||||||||||||||||||||||||||||||||||||||||||||||||||||||||
| Dividends on preferred stock | |||||||||||||||||||||||||||||||||||||||||||||||||||||||||||||||||||||||||||||||||||||||||||||||||||||||||
| Dividends on preferred stock | |||||||||||||||||||||||||||||||||||||||||||||||||||||||||||||||||||||||||||||||||||||||||||||||||||||||||
| Contributions from noncontrolling interests | Contributions from noncontrolling interests | — | — | — | — | — | 20,875 | 20,875 | |||||||||||||||||||||||||||||||||||||||||||||||||||||||||||||||||||||||||||||||||||||||||||||||||
| Balance at December 31, 2022 | $ | 28 | $ | 84,810 | $ | 1,325,316 | $ | (2,155,055) | $ | 3,914,124 | $ | 21,233 | $ | 3,190,456 | |||||||||||||||||||||||||||||||||||||||||||||||||||||||||||||||||||||||||||||||||||||||||||
| Contributions from noncontrolling interests | |||||||||||||||||||||||||||||||||||||||||||||||||||||||||||||||||||||||||||||||||||||||||||||||||||||||||
| Contributions from noncontrolling interests | |||||||||||||||||||||||||||||||||||||||||||||||||||||||||||||||||||||||||||||||||||||||||||||||||||||||||
| Balance at December 31, 2023 | |||||||||||||||||||||||||||||||||||||||||||||||||||||||||||||||||||||||||||||||||||||||||||||||||||||||||
| Year Ended December 31, | |||||||||||||||||||||||||||||||||||||||||||||||||||
| 2022 | 2021 | 2020 | |||||||||||||||||||||||||||||||||||||||||||||||||
| Year Ended December 31, | Year Ended December 31, | ||||||||||||||||||||||||||||||||||||||||||||||||||
| 2023 | 2023 | 2022 (a) | 2021 (a) | ||||||||||||||||||||||||||||||||||||||||||||||||
| Operating activities | Operating activities | ||||||||||||||||||||||||||||||||||||||||||||||||||
| Net income | Net income | $ | 1,221,302 | $ | 473,992 | $ | 671,460 | ||||||||||||||||||||||||||||||||||||||||||||
| Net income | |||||||||||||||||||||||||||||||||||||||||||||||||||
| Net income | |||||||||||||||||||||||||||||||||||||||||||||||||||
| Adjustments to reconcile net income to net cash provided by operating activities: | Adjustments to reconcile net income to net cash provided by operating activities: | ||||||||||||||||||||||||||||||||||||||||||||||||||
| Interest sensitive and index product benefits | |||||||||||||||||||||||||||||||||||||||||||||||||||
| Interest sensitive and index product benefits | |||||||||||||||||||||||||||||||||||||||||||||||||||
| Interest sensitive and index product benefits | Interest sensitive and index product benefits | 889,650 | 2,681,406 | 1,543,270 | |||||||||||||||||||||||||||||||||||||||||||||||
| Amortization of deferred sales inducements | Amortization of deferred sales inducements | 408,548 | 152,692 | 438,164 | |||||||||||||||||||||||||||||||||||||||||||||||
| Annuity product charges | Annuity product charges | (230,354) | (242,631) | (251,227) | |||||||||||||||||||||||||||||||||||||||||||||||
| Change in fair value of embedded derivatives | Change in fair value of embedded derivatives | (2,352,598) | (358,302) | (1,286,787) | |||||||||||||||||||||||||||||||||||||||||||||||
| Change in traditional life and accident and health insurance reserves | Change in traditional life and accident and health insurance reserves | (26,973) | 40,090 | 8,694 | |||||||||||||||||||||||||||||||||||||||||||||||
| Change in traditional life and accident and health insurance reserves | |||||||||||||||||||||||||||||||||||||||||||||||||||
| Change in traditional life and accident and health insurance reserves | |||||||||||||||||||||||||||||||||||||||||||||||||||
| Policy acquisition costs deferred | Policy acquisition costs deferred | (198,623) | (307,857) | (255,154) | |||||||||||||||||||||||||||||||||||||||||||||||
| Amortization of deferred policy acquisition costs | Amortization of deferred policy acquisition costs | 615,300 | 268,328 | 649,554 | |||||||||||||||||||||||||||||||||||||||||||||||
| Provision for depreciation and other amortization | Provision for depreciation and other amortization | 14,185 | 5,527 | 5,199 | |||||||||||||||||||||||||||||||||||||||||||||||
| Amortization of discounts and premiums on investments | Amortization of discounts and premiums on investments | 2,640 | 19,861 | 57,437 | |||||||||||||||||||||||||||||||||||||||||||||||
| Loss on extinguishment of debt | — | — | 2,024 | ||||||||||||||||||||||||||||||||||||||||||||||||
| Realized gains/losses on investments | |||||||||||||||||||||||||||||||||||||||||||||||||||
| Realized gains/losses on investments | |||||||||||||||||||||||||||||||||||||||||||||||||||
| Realized gains/losses on investments | Realized gains/losses on investments | 47,848 | 13,242 | 80,680 | |||||||||||||||||||||||||||||||||||||||||||||||
| Change in fair value of derivatives | Change in fair value of derivatives | 1,138,127 | (1,348,704) | (34,668) | |||||||||||||||||||||||||||||||||||||||||||||||
| Distributions from equity method investments | Distributions from equity method investments | 4,090 | 12,409 | 1,968 | |||||||||||||||||||||||||||||||||||||||||||||||
| Deferred income taxes | Deferred income taxes | 304,946 | 128,423 | 141,071 | |||||||||||||||||||||||||||||||||||||||||||||||
| Share-based compensation | Share-based compensation | 15,827 | 24,601 | 10,215 | |||||||||||||||||||||||||||||||||||||||||||||||
| Change in accrued investment income | Change in accrued investment income | (52,754) | (47,015) | 74,744 | |||||||||||||||||||||||||||||||||||||||||||||||
| Change in income taxes recoverable/payable | Change in income taxes recoverable/payable | 111,088 | (165,724) | (1,291) | |||||||||||||||||||||||||||||||||||||||||||||||
| Change in other assets | Change in other assets | (30,973) | (4,464) | (849) | |||||||||||||||||||||||||||||||||||||||||||||||
| Change in other policy funds and contract claims | Change in other policy funds and contract claims | 279,936 | (19,809) | (21,865) | |||||||||||||||||||||||||||||||||||||||||||||||
| Change in market risk benefits, net | |||||||||||||||||||||||||||||||||||||||||||||||||||
| Change in collateral held for derivatives | |||||||||||||||||||||||||||||||||||||||||||||||||||
| Change in collateral held for derivatives | (851,971) | 17,423 | (72,413) | ||||||||||||||||||||||||||||||||||||||||||||||||
| Change in collateral held for securities lending | — | — | (495,039) | ||||||||||||||||||||||||||||||||||||||||||||||||
| Change in funds withheld from reinsurers | |||||||||||||||||||||||||||||||||||||||||||||||||||
| Change in funds withheld from reinsurers | |||||||||||||||||||||||||||||||||||||||||||||||||||
| Change in funds withheld from reinsurers | Change in funds withheld from reinsurers | 931,600 | 3,124,740 | — | |||||||||||||||||||||||||||||||||||||||||||||||
| Change in other liabilities | Change in other liabilities | 24,987 | (221,726) | 38,995 | |||||||||||||||||||||||||||||||||||||||||||||||
| Other | Other | (221,647) | (13,338) | 804 | |||||||||||||||||||||||||||||||||||||||||||||||
| Net cash provided by operating activities | Net cash provided by operating activities | 2,044,181 | 4,233,164 | 1,304,986 | |||||||||||||||||||||||||||||||||||||||||||||||
| Investing activities | Investing activities | ||||||||||||||||||||||||||||||||||||||||||||||||||
| Investing activities | |||||||||||||||||||||||||||||||||||||||||||||||||||
| Investing activities | |||||||||||||||||||||||||||||||||||||||||||||||||||
| Sales, maturities, or repayments of investments: | Sales, maturities, or repayments of investments: | ||||||||||||||||||||||||||||||||||||||||||||||||||
| Sales, maturities, or repayments of investments: | |||||||||||||||||||||||||||||||||||||||||||||||||||
| Sales, maturities, or repayments of investments: | |||||||||||||||||||||||||||||||||||||||||||||||||||
| Fixed maturity securities, available for sale | |||||||||||||||||||||||||||||||||||||||||||||||||||
| Fixed maturity securities, available for sale | |||||||||||||||||||||||||||||||||||||||||||||||||||
| Fixed maturity securities, available for sale | Fixed maturity securities, available for sale | 9,691,210 | 4,490,736 | 8,291,316 | |||||||||||||||||||||||||||||||||||||||||||||||
| Mortgage loans on real estate | Mortgage loans on real estate | 1,916,328 | 862,666 | 378,812 | |||||||||||||||||||||||||||||||||||||||||||||||
| Mortgage loans on real estate | |||||||||||||||||||||||||||||||||||||||||||||||||||
| Mortgage loans on real estate | |||||||||||||||||||||||||||||||||||||||||||||||||||
| Real estate investments sold | |||||||||||||||||||||||||||||||||||||||||||||||||||
| Derivative instruments | Derivative instruments | 584,055 | 2,260,959 | 860,520 | |||||||||||||||||||||||||||||||||||||||||||||||
| Other investments | Other investments | 739,027 | 368,837 | 4,324 | |||||||||||||||||||||||||||||||||||||||||||||||
| Other investments | |||||||||||||||||||||||||||||||||||||||||||||||||||
| Other investments | |||||||||||||||||||||||||||||||||||||||||||||||||||
| Acquisitions of investments: | Acquisitions of investments: | ||||||||||||||||||||||||||||||||||||||||||||||||||
| Fixed maturity securities, available for sale | Fixed maturity securities, available for sale | (8,894,629) | (9,206,733) | (2,429,114) | |||||||||||||||||||||||||||||||||||||||||||||||
| Fixed maturity securities, available for sale | |||||||||||||||||||||||||||||||||||||||||||||||||||
| Fixed maturity securities, available for sale | |||||||||||||||||||||||||||||||||||||||||||||||||||
| Mortgage loans on real estate | |||||||||||||||||||||||||||||||||||||||||||||||||||
| Mortgage loans on real estate | |||||||||||||||||||||||||||||||||||||||||||||||||||
| Mortgage loans on real estate | Mortgage loans on real estate | (3,092,385) | (2,386,712) | (1,121,756) | |||||||||||||||||||||||||||||||||||||||||||||||
| Real estate investments acquired | Real estate investments acquired | (724,484) | (335,767) | — | |||||||||||||||||||||||||||||||||||||||||||||||
| Derivative instruments | Derivative instruments | (790,229) | (748,061) | (730,333) | |||||||||||||||||||||||||||||||||||||||||||||||
| Other investments | Other investments | (1,842,843) | (1,512,123) | (105,925) | |||||||||||||||||||||||||||||||||||||||||||||||
| Purchases of property, furniture and equipment | Purchases of property, furniture and equipment | (40,961) | (18,109) | (13,240) | |||||||||||||||||||||||||||||||||||||||||||||||
| Net cash provided by (used in) investing activities | Net cash provided by (used in) investing activities | (2,454,911) | (6,224,307) | 5,134,604 | |||||||||||||||||||||||||||||||||||||||||||||||
| Year Ended December 31, | |||||||||||||||||||||||||||||||||||||||||||||||||||
| 2022 | 2021 | 2020 | |||||||||||||||||||||||||||||||||||||||||||||||||
| Year Ended December 31, | Year Ended December 31, | ||||||||||||||||||||||||||||||||||||||||||||||||||
| 2023 | 2023 | 2022 (a) | 2021 (a) | ||||||||||||||||||||||||||||||||||||||||||||||||
| Financing activities | Financing activities | ||||||||||||||||||||||||||||||||||||||||||||||||||
| Receipts credited to annuity policyholder account balances | |||||||||||||||||||||||||||||||||||||||||||||||||||
| Receipts credited to annuity policyholder account balances | |||||||||||||||||||||||||||||||||||||||||||||||||||
| Receipts credited to annuity policyholder account balances | Receipts credited to annuity policyholder account balances | $ | 3,316,221 | $ | 5,910,024 | $ | 3,648,936 | ||||||||||||||||||||||||||||||||||||||||||||
| Coinsurance deposits | Coinsurance deposits | (186,637) | (3,187,332) | 430,644 | |||||||||||||||||||||||||||||||||||||||||||||||
| Return of annuity policyholder account balances | Return of annuity policyholder account balances | (5,257,487) | (5,145,193) | (4,040,054) | |||||||||||||||||||||||||||||||||||||||||||||||
| Repayment of loan payable | Repayment of loan payable | (3,750) | — | — | |||||||||||||||||||||||||||||||||||||||||||||||
| Repayment of loan payable | |||||||||||||||||||||||||||||||||||||||||||||||||||
| Repayment of loan payable | |||||||||||||||||||||||||||||||||||||||||||||||||||
| Proceeds from issuance of loan payable | Proceeds from issuance of loan payable | 300,000 | — | — | |||||||||||||||||||||||||||||||||||||||||||||||
| Repayment of subordinated debentures | — | — | (81,450) | ||||||||||||||||||||||||||||||||||||||||||||||||
| Proceeds from issuance of common stock, net | |||||||||||||||||||||||||||||||||||||||||||||||||||
| Proceeds from issuance of common stock, net | |||||||||||||||||||||||||||||||||||||||||||||||||||
| Proceeds from issuance of common stock, net | Proceeds from issuance of common stock, net | 253,978 | 4,854 | 338,061 | |||||||||||||||||||||||||||||||||||||||||||||||
| Acquisition of treasury stock | Acquisition of treasury stock | (566,567) | (99,415) | (165,094) | |||||||||||||||||||||||||||||||||||||||||||||||
| Proceeds from issuance of preferred stock, net | — | — | 290,260 | ||||||||||||||||||||||||||||||||||||||||||||||||
| Change in checks in excess of cash balance | |||||||||||||||||||||||||||||||||||||||||||||||||||
| Change in checks in excess of cash balance | |||||||||||||||||||||||||||||||||||||||||||||||||||
| Change in checks in excess of cash balance | Change in checks in excess of cash balance | 39,901 | (3,210) | 3,611 | |||||||||||||||||||||||||||||||||||||||||||||||
| Dividends paid on common stock | Dividends paid on common stock | (30,567) | (31,450) | (28,859) | |||||||||||||||||||||||||||||||||||||||||||||||
| Dividends paid on preferred stock | Dividends paid on preferred stock | (43,675) | (43,675) | (33,515) | |||||||||||||||||||||||||||||||||||||||||||||||
| Net cash provided by (used in) financing activities | (2,178,583) | (2,595,397) | 362,540 | ||||||||||||||||||||||||||||||||||||||||||||||||
| Net cash used in financing activities | |||||||||||||||||||||||||||||||||||||||||||||||||||
| Increase (decrease) in cash and cash equivalents | Increase (decrease) in cash and cash equivalents | (2,589,313) | (4,586,540) | 6,802,130 | |||||||||||||||||||||||||||||||||||||||||||||||
| Cash and cash equivalents at beginning of year | Cash and cash equivalents at beginning of year | 4,508,982 | 9,095,522 | 2,293,392 | |||||||||||||||||||||||||||||||||||||||||||||||
| Cash and cash equivalents at end of year | Cash and cash equivalents at end of year | $ | 1,919,669 | $ | 4,508,982 | $ | 9,095,522 | ||||||||||||||||||||||||||||||||||||||||||||
| Supplemental disclosures of cash flow information | Supplemental disclosures of cash flow information | ||||||||||||||||||||||||||||||||||||||||||||||||||
| Supplemental disclosures of cash flow information | |||||||||||||||||||||||||||||||||||||||||||||||||||
| Supplemental disclosures of cash flow information | |||||||||||||||||||||||||||||||||||||||||||||||||||
| Cash paid during the year for: | Cash paid during the year for: | ||||||||||||||||||||||||||||||||||||||||||||||||||
| Cash paid during the year for: | |||||||||||||||||||||||||||||||||||||||||||||||||||
| Cash paid during the year for: | |||||||||||||||||||||||||||||||||||||||||||||||||||
| Interest expense | |||||||||||||||||||||||||||||||||||||||||||||||||||
| Interest expense | |||||||||||||||||||||||||||||||||||||||||||||||||||
| Interest expense | Interest expense | $ | 36,289 | $ | 30,000 | $ | 31,427 | ||||||||||||||||||||||||||||||||||||||||||||
| Income taxes | Income taxes | 4,873 | 165,537 | 4,842 | |||||||||||||||||||||||||||||||||||||||||||||||
| Income tax refunds received | Income tax refunds received | 98,644 | — | — | |||||||||||||||||||||||||||||||||||||||||||||||
| Non-cash operating activity: | Non-cash operating activity: | ||||||||||||||||||||||||||||||||||||||||||||||||||
| Deferral of sales inducements | Deferral of sales inducements | 107,691 | 95,160 | 93,610 | |||||||||||||||||||||||||||||||||||||||||||||||
| Deferral of sales inducements | |||||||||||||||||||||||||||||||||||||||||||||||||||
| Deferral of sales inducements | |||||||||||||||||||||||||||||||||||||||||||||||||||
| Year Ended December 31, | ||||||||||||||||||||||||||||||||||||||||||||||||||||||||||||||
| Year Ended December 31, | Year Ended December 31, | |||||||||||||||||||||||||||||||||||||||||||||||||||||||||||||
| Product Type | Product Type | 2022 | 2021 | 2020 | Product Type | 2023 | 2022 | 2021 | ||||||||||||||||||||||||||||||||||||||||||||||||||||||
| (Dollars in thousands) | ||||||||||||||||||||||||||||||||||||||||||||||||||||||||||||||
| (Dollars in thousands) | (Dollars in thousands) | |||||||||||||||||||||||||||||||||||||||||||||||||||||||||||||
| Fixed index annuities | Fixed index annuities | $ | 2,202,688 | $ | 3,026,211 | $ | 2,309,580 | |||||||||||||||||||||||||||||||||||||||||||||||||||||||
| Annual reset fixed rate annuities | Annual reset fixed rate annuities | 5,535 | 6,000 | 7,846 | ||||||||||||||||||||||||||||||||||||||||||||||||||||||||||
| Multi-year fixed rate annuities | Multi-year fixed rate annuities | 139,092 | 2,452,994 | 1,295,843 | ||||||||||||||||||||||||||||||||||||||||||||||||||||||||||
| Single premium immediate annuities (SPIA) | Single premium immediate annuities (SPIA) | 18,935 | 59,816 | 33,461 | ||||||||||||||||||||||||||||||||||||||||||||||||||||||||||
| $ | 2,366,250 | $ | 5,545,021 | $ | 3,646,730 | |||||||||||||||||||||||||||||||||||||||||||||||||||||||||
| $ | ||||||||||||||||||||||||||||||||||||||||||||||||||||||||||||||
| Liability for Future Policy Benefits for Payout Annuity With Life Contingency | |||||
| (Dollars in thousands) | |||||
| Pre-adoption 1/1/2021 balance | $ | 337,467 | |||
| Adjustment to opening retained earnings for expected future policy benefits | 2,566 | ||||
| Adjustment for the effect of remeasurement of liability at current single A rate | 68,717 | ||||
| Post adoption 1/1/2021 balance | $ | 408,750 | |||
| Market Risk Benefit Liability | |||||
| (Dollars in thousands) | |||||
| Pre-adoption 1/1/2021 carrying amount for features now classified as MRBs | $ | 2,547,231 | |||
| Adjustment for the removal of shadow adjustments | (584,636) | ||||
| Adjustment for the cumulative effect of the changes in the instrument-specific credit risk between the original contract issuance date and the transition date | 229,108 | ||||
| Adjustment for the remaining difference between previous carrying amount and fair value measurement for the MRB, exclusive of the instrument specific credit risk | 33,781 | ||||
| Post adoption 1/1/2021 MRB balance | $ | 2,225,484 | |||
Ceded Market Risk Benefit (a) | |||||
| (Dollars in thousands) | |||||
| Pre-adoption 1/1/2021 carrying amount for features now classified as MRBs | $ | 62,108 | |||
| Adjustment for the difference between previous carrying amount and fair value measurement for the MRB, exclusive of the instrument specific credit risk | 27,230 | ||||
| Post adoption 1/1/2021 ceded MRB balance | $ | 89,338 | |||
| Deferred Policy Acquisition Costs | |||||
| Fixed Index Annuities and Fixed Rate Annuities | |||||
| (Dollars in thousands) | |||||
| Pre-adoption 1/1/2021 balance | $ | 2,225,199 | |||
| Adjustments for the removal of shadow adjustments | 1,183,306 | ||||
| Post adoption 1/1/2021 balance | $ | 3,408,505 | |||
| Deferred Sales Inducements | |||||
| Fixed Index Annuities and Fixed Rate Annuities | |||||
| (Dollars in thousands) | |||||
| Pre-adoption 1/1/2021 balance | $ | 1,448,375 | |||
| Adjustments for the removal of shadow adjustments | 768,310 | ||||
| Post adoption 1/1/2021 balance | $ | 2,216,685 | |||
| December 31, | |||||||||||||||||||||||||||||||||||||||||||||||||||||||||||||||||||||
| 2022 | 2021 | ||||||||||||||||||||||||||||||||||||||||||||||||||||||||||||||||||||
| Carrying Amount | Fair Value | Carrying Amount | Fair Value | ||||||||||||||||||||||||||||||||||||||||||||||||||||||||||||||||||
| (Dollars in thousands) | |||||||||||||||||||||||||||||||||||||||||||||||||||||||||||||||||||||
| December 31, | December 31, | ||||||||||||||||||||||||||||||||||||||||||||||||||||||||||||||||||||
| 2023 | 2023 | 2022 | |||||||||||||||||||||||||||||||||||||||||||||||||||||||||||||||||||
| Carrying Amount | Carrying Amount | Fair Value | Carrying Amount | Fair Value | |||||||||||||||||||||||||||||||||||||||||||||||||||||||||||||||||
| (Dollars in thousands) | (Dollars in thousands) | ||||||||||||||||||||||||||||||||||||||||||||||||||||||||||||||||||||
| Assets | Assets | ||||||||||||||||||||||||||||||||||||||||||||||||||||||||||||||||||||
| Fixed maturity securities, available for sale | |||||||||||||||||||||||||||||||||||||||||||||||||||||||||||||||||||||
| Fixed maturity securities, available for sale | |||||||||||||||||||||||||||||||||||||||||||||||||||||||||||||||||||||
| Fixed maturity securities, available for sale | Fixed maturity securities, available for sale | $ | 39,804,617 | $ | 39,804,617 | $ | 51,305,943 | $ | 51,305,943 | ||||||||||||||||||||||||||||||||||||||||||||||||||||||||||||
| Mortgage loans on real estate | Mortgage loans on real estate | 6,949,027 | 6,502,463 | 5,687,998 | 5,867,227 | ||||||||||||||||||||||||||||||||||||||||||||||||||||||||||||||||
| Real estate investments | Real estate investments | 1,056,063 | 1,056,063 | 337,939 | 337,939 | ||||||||||||||||||||||||||||||||||||||||||||||||||||||||||||||||
| Limited partnerships and limited liability companies | Limited partnerships and limited liability companies | 684,835 | 684,835 | 168,711 | 168,711 | ||||||||||||||||||||||||||||||||||||||||||||||||||||||||||||||||
| Derivative instruments | Derivative instruments | 431,727 | 431,727 | 1,277,480 | 1,277,480 | ||||||||||||||||||||||||||||||||||||||||||||||||||||||||||||||||
| Other investments | Other investments | 1,817,085 | 1,817,085 | 1,247,024 | 1,247,024 | ||||||||||||||||||||||||||||||||||||||||||||||||||||||||||||||||
| Cash and cash equivalents | Cash and cash equivalents | 1,919,669 | 1,919,669 | 4,508,982 | 4,508,982 | ||||||||||||||||||||||||||||||||||||||||||||||||||||||||||||||||
| Coinsurance deposits | Coinsurance deposits | 13,208,399 | 12,000,116 | 8,850,608 | 7,938,292 | ||||||||||||||||||||||||||||||||||||||||||||||||||||||||||||||||
| Market risk benefits | |||||||||||||||||||||||||||||||||||||||||||||||||||||||||||||||||||||
| Liabilities | Liabilities | ||||||||||||||||||||||||||||||||||||||||||||||||||||||||||||||||||||
| Liabilities | |||||||||||||||||||||||||||||||||||||||||||||||||||||||||||||||||||||
| Liabilities | |||||||||||||||||||||||||||||||||||||||||||||||||||||||||||||||||||||
| Policy benefit reserves | Policy benefit reserves | 60,743,370 | 55,572,896 | 65,076,041 | 56,375,076 | ||||||||||||||||||||||||||||||||||||||||||||||||||||||||||||||||
| Policy benefit reserves | |||||||||||||||||||||||||||||||||||||||||||||||||||||||||||||||||||||
| Policy benefit reserves | |||||||||||||||||||||||||||||||||||||||||||||||||||||||||||||||||||||
| Market risk benefits | |||||||||||||||||||||||||||||||||||||||||||||||||||||||||||||||||||||
| Single premium immediate annuity (SPIA) benefit reserves | Single premium immediate annuity (SPIA) benefit reserves | 212,119 | 221,130 | 226,207 | 235,891 | ||||||||||||||||||||||||||||||||||||||||||||||||||||||||||||||||
| Other policy funds - FHLB | Other policy funds - FHLB | 300,000 | 300,000 | — | — | ||||||||||||||||||||||||||||||||||||||||||||||||||||||||||||||||
| Notes and loan payable | Notes and loan payable | 792,073 | 774,220 | 496,250 | 569,485 | ||||||||||||||||||||||||||||||||||||||||||||||||||||||||||||||||
| Subordinated debentures | Subordinated debentures | 78,753 | 87,293 | 78,421 | 93,721 | ||||||||||||||||||||||||||||||||||||||||||||||||||||||||||||||||
| Total Fair Value | NAV | Quoted Prices in Active Markets (Level 1) | Significant Other Observable Inputs (Level 2) | Significant Unobservable Inputs (Level 3) | |||||||||||||||||||||||||||||||||||||||||||||||||||||||||||||||||||||||||||||||||||
| (Dollars in thousands) | |||||||||||||||||||||||||||||||||||||||||||||||||||||||||||||||||||||||||||||||||||||||
| December 31, 2022 | |||||||||||||||||||||||||||||||||||||||||||||||||||||||||||||||||||||||||||||||||||||||
| Total Fair Value | Total Fair Value | NAV | Quoted Prices in Active Markets (Level 1) | Significant Other Observable Inputs (Level 2) | Significant Unobservable Inputs (Level 3) | ||||||||||||||||||||||||||||||||||||||||||||||||||||||||||||||||||||||||||||||||||
| (Dollars in thousands) | (Dollars in thousands) | ||||||||||||||||||||||||||||||||||||||||||||||||||||||||||||||||||||||||||||||||||||||
| December 31, 2023 | |||||||||||||||||||||||||||||||||||||||||||||||||||||||||||||||||||||||||||||||||||||||
| Assets | |||||||||||||||||||||||||||||||||||||||||||||||||||||||||||||||||||||||||||||||||||||||
| Assets | |||||||||||||||||||||||||||||||||||||||||||||||||||||||||||||||||||||||||||||||||||||||
| Assets | Assets | ||||||||||||||||||||||||||||||||||||||||||||||||||||||||||||||||||||||||||||||||||||||
| Fixed maturity securities, available for sale: | Fixed maturity securities, available for sale: | ||||||||||||||||||||||||||||||||||||||||||||||||||||||||||||||||||||||||||||||||||||||
| Fixed maturity securities, available for sale: | |||||||||||||||||||||||||||||||||||||||||||||||||||||||||||||||||||||||||||||||||||||||
| Fixed maturity securities, available for sale: | |||||||||||||||||||||||||||||||||||||||||||||||||||||||||||||||||||||||||||||||||||||||
| U.S. Government and agencies | |||||||||||||||||||||||||||||||||||||||||||||||||||||||||||||||||||||||||||||||||||||||
| U.S. Government and agencies | |||||||||||||||||||||||||||||||||||||||||||||||||||||||||||||||||||||||||||||||||||||||
| U.S. Government and agencies | U.S. Government and agencies | $ | 169,071 | $ | — | $ | 26,184 | $ | 142,887 | $ | — | ||||||||||||||||||||||||||||||||||||||||||||||||||||||||||||||||||||||||||||
| States, municipalities and territories | States, municipalities and territories | 3,822,982 | — | — | 3,822,982 | — | |||||||||||||||||||||||||||||||||||||||||||||||||||||||||||||||||||||||||||||||||
| Foreign corporate securities and foreign governments | Foreign corporate securities and foreign governments | 676,852 | — | — | 676,852 | — | |||||||||||||||||||||||||||||||||||||||||||||||||||||||||||||||||||||||||||||||||
| Corporate securities | Corporate securities | 24,161,921 | — | — | 23,759,573 | 402,348 | |||||||||||||||||||||||||||||||||||||||||||||||||||||||||||||||||||||||||||||||||
| Residential mortgage backed securities | Residential mortgage backed securities | 1,377,611 | — | — | 1,377,611 | — | |||||||||||||||||||||||||||||||||||||||||||||||||||||||||||||||||||||||||||||||||
| Commercial mortgage backed securities | Commercial mortgage backed securities | 3,687,478 | — | — | 3,687,478 | — | |||||||||||||||||||||||||||||||||||||||||||||||||||||||||||||||||||||||||||||||||
| Other asset backed securities | Other asset backed securities | 5,908,702 | — | — | 5,465,784 | 442,918 | |||||||||||||||||||||||||||||||||||||||||||||||||||||||||||||||||||||||||||||||||
| Other investments | Other investments | 1,013,297 | — | 398,280 | 615,017 | — | |||||||||||||||||||||||||||||||||||||||||||||||||||||||||||||||||||||||||||||||||
| Real estate investments | Real estate investments | 940,559 | — | — | — | 940,559 | |||||||||||||||||||||||||||||||||||||||||||||||||||||||||||||||||||||||||||||||||
| Limited partnerships and limited liability companies | Limited partnerships and limited liability companies | 684,835 | 620,626 | — | — | 64,209 | |||||||||||||||||||||||||||||||||||||||||||||||||||||||||||||||||||||||||||||||||
| Derivative instruments | Derivative instruments | 431,727 | — | — | 431,727 | — | |||||||||||||||||||||||||||||||||||||||||||||||||||||||||||||||||||||||||||||||||
| Cash and cash equivalents | Cash and cash equivalents | 1,919,669 | — | 1,919,669 | — | — | |||||||||||||||||||||||||||||||||||||||||||||||||||||||||||||||||||||||||||||||||
| Market risk benefits (a) | |||||||||||||||||||||||||||||||||||||||||||||||||||||||||||||||||||||||||||||||||||||||
| $ | |||||||||||||||||||||||||||||||||||||||||||||||||||||||||||||||||||||||||||||||||||||||
| $ | 44,794,704 | $ | 620,626 | $ | 2,344,133 | $ | 39,979,911 | $ | 1,850,034 | ||||||||||||||||||||||||||||||||||||||||||||||||||||||||||||||||||||||||||||||
| $ | |||||||||||||||||||||||||||||||||||||||||||||||||||||||||||||||||||||||||||||||||||||||
| $ | |||||||||||||||||||||||||||||||||||||||||||||||||||||||||||||||||||||||||||||||||||||||
| Liabilities | Liabilities | ||||||||||||||||||||||||||||||||||||||||||||||||||||||||||||||||||||||||||||||||||||||
| Funds withheld liability - embedded derivative | Funds withheld liability - embedded derivative | $ | (441,864) | $ | — | $ | — | $ | — | $ | (441,864) | ||||||||||||||||||||||||||||||||||||||||||||||||||||||||||||||||||||||||||||
| Funds withheld liability - embedded derivative | |||||||||||||||||||||||||||||||||||||||||||||||||||||||||||||||||||||||||||||||||||||||
| Funds withheld liability - embedded derivative | |||||||||||||||||||||||||||||||||||||||||||||||||||||||||||||||||||||||||||||||||||||||
| Fixed index annuities - embedded derivatives | Fixed index annuities - embedded derivatives | 4,820,845 | — | — | — | 4,820,845 | |||||||||||||||||||||||||||||||||||||||||||||||||||||||||||||||||||||||||||||||||
| Market risk benefits (a) | |||||||||||||||||||||||||||||||||||||||||||||||||||||||||||||||||||||||||||||||||||||||
| $ | |||||||||||||||||||||||||||||||||||||||||||||||||||||||||||||||||||||||||||||||||||||||
| $ | 4,378,981 | $ | — | $ | — | $ | — | $ | 4,378,981 | ||||||||||||||||||||||||||||||||||||||||||||||||||||||||||||||||||||||||||||||
| December 31, 2021 | |||||||||||||||||||||||||||||||||||||||||||||||||||||||||||||||||||||||||||||||||||||||
| December 31, 2022 | |||||||||||||||||||||||||||||||||||||||||||||||||||||||||||||||||||||||||||||||||||||||
| December 31, 2022 | |||||||||||||||||||||||||||||||||||||||||||||||||||||||||||||||||||||||||||||||||||||||
| December 31, 2022 | |||||||||||||||||||||||||||||||||||||||||||||||||||||||||||||||||||||||||||||||||||||||
| Assets | |||||||||||||||||||||||||||||||||||||||||||||||||||||||||||||||||||||||||||||||||||||||
| Assets | |||||||||||||||||||||||||||||||||||||||||||||||||||||||||||||||||||||||||||||||||||||||
| Assets | Assets | ||||||||||||||||||||||||||||||||||||||||||||||||||||||||||||||||||||||||||||||||||||||
| Fixed maturity securities, available for sale: | Fixed maturity securities, available for sale: | ||||||||||||||||||||||||||||||||||||||||||||||||||||||||||||||||||||||||||||||||||||||
| Fixed maturity securities, available for sale: | |||||||||||||||||||||||||||||||||||||||||||||||||||||||||||||||||||||||||||||||||||||||
| Fixed maturity securities, available for sale: | |||||||||||||||||||||||||||||||||||||||||||||||||||||||||||||||||||||||||||||||||||||||
| U.S. Government and agencies | |||||||||||||||||||||||||||||||||||||||||||||||||||||||||||||||||||||||||||||||||||||||
| U.S. Government and agencies | |||||||||||||||||||||||||||||||||||||||||||||||||||||||||||||||||||||||||||||||||||||||
| U.S. Government and agencies | U.S. Government and agencies | $ | 1,078,746 | $ | — | $ | 32,737 | $ | 1,046,009 | $ | — | ||||||||||||||||||||||||||||||||||||||||||||||||||||||||||||||||||||||||||||
| States, municipalities and territories | States, municipalities and territories | 3,927,201 | — | — | 3,927,201 | — | |||||||||||||||||||||||||||||||||||||||||||||||||||||||||||||||||||||||||||||||||
| Foreign corporate securities and foreign governments | Foreign corporate securities and foreign governments | 402,545 | — | — | 402,545 | — | |||||||||||||||||||||||||||||||||||||||||||||||||||||||||||||||||||||||||||||||||
| Corporate securities | Corporate securities | 34,660,234 | — | 32,700 | 34,627,534 | — | |||||||||||||||||||||||||||||||||||||||||||||||||||||||||||||||||||||||||||||||||
| Residential mortgage backed securities | Residential mortgage backed securities | 1,125,049 | — | — | 1,125,049 | — | |||||||||||||||||||||||||||||||||||||||||||||||||||||||||||||||||||||||||||||||||
| Commercial mortgage backed securities | Commercial mortgage backed securities | 4,840,311 | — | — | 4,840,311 | — | |||||||||||||||||||||||||||||||||||||||||||||||||||||||||||||||||||||||||||||||||
| Other asset backed securities | Other asset backed securities | 5,271,857 | — | — | 5,271,857 | — | |||||||||||||||||||||||||||||||||||||||||||||||||||||||||||||||||||||||||||||||||
| Other investments | Other investments | 12,226 | — | — | 5,877 | 6,349 | |||||||||||||||||||||||||||||||||||||||||||||||||||||||||||||||||||||||||||||||||
| Real estate investments | Real estate investments | 337,939 | — | — | — | 337,939 | |||||||||||||||||||||||||||||||||||||||||||||||||||||||||||||||||||||||||||||||||
| Limited partnerships and limited liability companies | Limited partnerships and limited liability companies | 168,711 | 168,711 | — | — | — | |||||||||||||||||||||||||||||||||||||||||||||||||||||||||||||||||||||||||||||||||
| Derivative instruments | Derivative instruments | 1,277,480 | — | — | 1,277,480 | — | |||||||||||||||||||||||||||||||||||||||||||||||||||||||||||||||||||||||||||||||||
| Cash and cash equivalents | Cash and cash equivalents | 4,508,982 | — | 4,508,982 | — | — | |||||||||||||||||||||||||||||||||||||||||||||||||||||||||||||||||||||||||||||||||
| Market risk benefits (a) | |||||||||||||||||||||||||||||||||||||||||||||||||||||||||||||||||||||||||||||||||||||||
| $ | |||||||||||||||||||||||||||||||||||||||||||||||||||||||||||||||||||||||||||||||||||||||
| $ | 57,611,281 | $ | 168,711 | $ | 4,574,419 | $ | 52,523,863 | $ | 344,288 | ||||||||||||||||||||||||||||||||||||||||||||||||||||||||||||||||||||||||||||||
| $ | |||||||||||||||||||||||||||||||||||||||||||||||||||||||||||||||||||||||||||||||||||||||
| $ | |||||||||||||||||||||||||||||||||||||||||||||||||||||||||||||||||||||||||||||||||||||||
| Liabilities | Liabilities | ||||||||||||||||||||||||||||||||||||||||||||||||||||||||||||||||||||||||||||||||||||||
| Funds withheld liability - embedded derivative | Funds withheld liability - embedded derivative | $ | (2,362) | $ | — | $ | — | $ | (2,362) | $ | — | ||||||||||||||||||||||||||||||||||||||||||||||||||||||||||||||||||||||||||||
| Funds withheld liability - embedded derivative | |||||||||||||||||||||||||||||||||||||||||||||||||||||||||||||||||||||||||||||||||||||||
| Funds withheld liability - embedded derivative | |||||||||||||||||||||||||||||||||||||||||||||||||||||||||||||||||||||||||||||||||||||||
| Fixed index annuities - embedded derivatives | Fixed index annuities - embedded derivatives | 7,964,961 | — | — | — | 7,964,961 | |||||||||||||||||||||||||||||||||||||||||||||||||||||||||||||||||||||||||||||||||
| $ | 7,962,599 | $ | — | $ | — | $ | (2,362) | $ | 7,964,961 | ||||||||||||||||||||||||||||||||||||||||||||||||||||||||||||||||||||||||||||||
| Market risk benefits (a) | |||||||||||||||||||||||||||||||||||||||||||||||||||||||||||||||||||||||||||||||||||||||
| $ | |||||||||||||||||||||||||||||||||||||||||||||||||||||||||||||||||||||||||||||||||||||||
| Year Ended December 31, | |||||||||||
| 2023 | 2022 | ||||||||||
| (Dollars in thousands) | |||||||||||
| Fixed maturity securities, available for sale - States, municipalities and territories | |||||||||||
| Beginning balance | $ | — | $ | — | |||||||
| Purchases and sales, net | — | — | |||||||||
| Transfers in | 203,757 | — | |||||||||
| Transfers out | (2,001) | — | |||||||||
| Total realized/unrealized gains (losses) | |||||||||||
| Included in net income | — | — | |||||||||
| Included in other comprehensive income (loss) | 20,461 | — | |||||||||
| Ending balance | $ | 222,217 | $ | — | |||||||
| Fixed maturity securities, available for sale - Corporate securities | |||||||||||
| Beginning balance | $ | 402,348 | $ | — | |||||||
| Purchases and sales, net | (45,187) | 2,233 | |||||||||
| Transfers in | 82,866 | 391,702 | |||||||||
| Transfers out | (172,174) | — | |||||||||
| Total realized/unrealized gains (losses): | |||||||||||
| Included in net income | — | — | |||||||||
| Included in other comprehensive income (loss) | (12,416) | 8,413 | |||||||||
| Ending balance | $ | 255,437 | $ | 402,348 | |||||||
| Fixed maturity securities, available for sale - Other asset backed securities | |||||||||||
| Beginning balance | $ | 442,918 | $ | — | |||||||
| Purchases and sales, net | 1,071,824 | 296,800 | |||||||||
| Transfers in | 160,160 | 153,669 | |||||||||
| Transfers out | (20,817) | — | |||||||||
| Total realized/unrealized gains (losses): | |||||||||||
| Included in net income | — | — | |||||||||
| Included in other comprehensive income (loss) | (63,111) | (7,551) | |||||||||
| Ending balance | $ | 1,590,974 | $ | 442,918 | |||||||
| Other investments | |||||||||||
| Beginning balance | $ | — | $ | 6,349 | |||||||
| Transfers in | 9,821 | — | |||||||||
| Transfers out | (23,244) | (3,867) | |||||||||
| Total realized/unrealized gains (losses): | |||||||||||
| Included in net income | — | (2,482) | |||||||||
| Included in other comprehensive income (loss) | 13,423 | — | |||||||||
| Ending balance | $ | — | $ | — | |||||||
| Real estate investments | |||||||||||
| Beginning balance | $ | 940,559 | $ | 337,939 | |||||||
| Purchases and sales, net | 313,235 | 602,298 | |||||||||
| Change in fair value | (36,523) | 322 | |||||||||
| Ending balance | $ | 1,217,271 | $ | 940,559 | |||||||
| Year Ended December 31, | |||||||||||
| 2023 | 2022 | ||||||||||
| (Dollars in thousands) | |||||||||||
| Limited partnerships and limited liability companies | |||||||||||
| Beginning balance | $ | 64,209 | $ | — | |||||||
| Purchases and sales, net | 99,963 | 57,574 | |||||||||
| Change in fair value | (11,041) | 6,635 | |||||||||
| Ending balance | $ | 153,131 | $ | 64,209 | |||||||
| Funds withheld liability - embedded derivative | |||||||||||
| Beginning balance | $ | (441,864) | $ | — | |||||||
| Transfers in | — | (441,864) | |||||||||
| Change in fair value | 185,088 | — | |||||||||
| Ending balance | $ | (256,776) | $ | (441,864) | |||||||
| Fixed index annuities - embedded derivatives | |||||||||||
| Beginning balance | $ | 4,820,845 | $ | 7,964,961 | |||||||
| Premiums less benefits | (177,559) | (125,940) | |||||||||
| Change in fair value, net | 538,608 | (2,561,676) | |||||||||
| Reserve release related to in-force ceded reinsurance | — | (456,500) | |||||||||
| Ending balance | $ | 5,181,894 | $ | 4,820,845 | |||||||
| December 31, 2023 | |||||||||||||||||||||||||||||||||||
| Assets / (Liabilities) Measured at Fair Value | Valuation Techniques(s) | Unobservable Input Description | Input / Range of Inputs | Weighted Average | |||||||||||||||||||||||||||||||
| Assets: | (in thousands) | ||||||||||||||||||||||||||||||||||
| Fixed maturity securities: | |||||||||||||||||||||||||||||||||||
| Corporate securities | $ | 83,666 | Discounted cash flow | Liquidity premium | 20 basis points | ||||||||||||||||||||||||||||||
| Other asset backed securities | 591,992 | Discounted cash flow | Discount rate | 5.26% | 25.00% | 6.92% | |||||||||||||||||||||||||||||
| Weighted average lives | 1.14 years | 12.09 years | 5.69 years | ||||||||||||||||||||||||||||||||
| Real estate investments | 1,217,271 | Broker price opinion (a) | |||||||||||||||||||||||||||||||||
| Limited partnerships and limited | 46,705 | Discounted cash flow | Residual capitalization rate | 5.25% | 5.25% | 5.25% | |||||||||||||||||||||||||||||
| liability companies - real estate | Discount rate | 6.50% | 6.75% | 6.61% | |||||||||||||||||||||||||||||||
| Limited partnerships and limited | 106,426 | Discounted cash flow | Discount rate | 11.00% | 11.00% | 11.00% | |||||||||||||||||||||||||||||
| liability companies - infrastructure | |||||||||||||||||||||||||||||||||||
| December 31, 2022 | |||||||||||||||||||||||||||||||||||
| Assets / (Liabilities) Measured at Fair Value | Valuation Techniques(s) | Unobservable Input Description | Input / Range of Inputs | Weighted Average | |||||||||||||||||||||||||||||||
| Assets: | (in thousands) | ||||||||||||||||||||||||||||||||||
| Fixed maturity securities: | |||||||||||||||||||||||||||||||||||
| Corporate securities | $ | 84,674 | Discounted cash flow | Liquidity premium | 20 basis points | ||||||||||||||||||||||||||||||
| Other asset backed securities | 296,800 | Discounted cash flow | Discount rate | 4.04% | 28.58% | 4.36% | |||||||||||||||||||||||||||||
| Weighted average lives | 8.79 years | 12.48 years | 9.29 years | ||||||||||||||||||||||||||||||||
| Real estate investments | 940,559 | Discounted cash flow | Residual capitalization rate | 4.75% | 6.50% | 5.44% | |||||||||||||||||||||||||||||
| Discount rate | 6.00% | 8.00% | 6.91% | ||||||||||||||||||||||||||||||||
| Limited partnerships and limited | 64,209 | Discounted cash flow | Residual capitalization rate | 4.25% | 4.75% | 4.46% | |||||||||||||||||||||||||||||
| liability companies - real estate | Discount rate | 5.75% | 6.00% | 5.86% | |||||||||||||||||||||||||||||||
| December 31, | |||||||||||
| 2023 | 2022 | ||||||||||
| (Dollars in thousands) | |||||||||||
| FHLB common stock (1) | $ | 10,000 | $ | 22,000 | |||||||
| Short-term loans (2) | — | 316,417 | |||||||||
| Collateral loans (3) | 64,594 | 64,594 | |||||||||
| Company owned life insurance ("COLI") (4) | 404,598 | 397,683 | |||||||||
| Average Lapse Rates | Average Partial Withdrawal Rates | |||||||||||||||||||||||||||||||||||||||||||||||||||||||
| Average Lapse Rates | Average Lapse Rates | |||||||||||||||||||||||||||||||||||||||||||||||||||||||
| Contract Duration (Years) | Contract Duration (Years) | December 31, 2022 | December 31, 2021 | December 31, 2022 | December 31, 2021 | Contract Duration (Years) | December 31, 2023 | December 31, 2022 | ||||||||||||||||||||||||||||||||||||||||||||||||
| 1 - 5 | 1 - 5 | 2.17% | 3.04% | 1.86% | 2.19% | 1 - 5 | 1.96% | 2.17% | ||||||||||||||||||||||||||||||||||||||||||||||||
| 6 - 10 | 6 - 10 | 3.28% | 2.84% | 1.97% | 2.26% | 6 - 10 | 3.71% | 3.28% | ||||||||||||||||||||||||||||||||||||||||||||||||
| 11 - 15 | 11 - 15 | 3.63% | 4.47% | 1.86% | 2.14% | 11 - 15 | 3.71% | 3.63% | ||||||||||||||||||||||||||||||||||||||||||||||||
| 16 - 20 | 16 - 20 | 8.55% | 8.93% | 2.96% | 1.33% | 16 - 20 | 8.97% | 8.55% | ||||||||||||||||||||||||||||||||||||||||||||||||
| 20+ | 20+ | 4.90% | 4.93% | 1.81% | —% | 20+ | 4.91% | 4.90% | ||||||||||||||||||||||||||||||||||||||||||||||||
| Year Ended December 31, | |||||||||||
| 2022 | 2021 | ||||||||||
| Fixed maturity securities, available for sale - Corporate securities | |||||||||||
| Beginning balance | $ | — | $ | — | |||||||
| Purchases | 2,233 | — | |||||||||
| Transfers in | 391,702 | — | |||||||||
| Transfers out | — | — | |||||||||
| Total realized/unrealized gains (losses): | |||||||||||
| Included in net income | — | — | |||||||||
| Included in other comprehensive income (loss) | 8,413 | — | |||||||||
| Ending balance | $ | 402,348 | $ | — | |||||||
| Fixed maturity securities, available for sale - Other asset backed securities | |||||||||||
| Beginning balance | $ | — | $ | — | |||||||
| Purchases | 296,800 | — | |||||||||
| Transfers in | 153,669 | — | |||||||||
| Transfers out | — | — | |||||||||
| Total realized/unrealized gains (losses): | |||||||||||
| Included in net income | — | — | |||||||||
| Included in other comprehensive income (loss) | (7,551) | — | |||||||||
| Ending balance | $ | 442,918 | $ | — | |||||||
| Other investments | |||||||||||
| Beginning balance | $ | 6,349 | $ | — | |||||||
| Transfers in | — | 6,349 | |||||||||
| Transfers out | (3,867) | — | |||||||||
| Total realized/unrealized gains (losses): | |||||||||||
| Included in net income | (2,482) | — | |||||||||
| Included in other comprehensive income (loss) | — | — | |||||||||
| Ending balance | $ | — | $ | 6,349 | |||||||
| Year Ended December 31, | |||||||||||
| 2022 | 2021 | ||||||||||
| Real estate investments | |||||||||||
| Beginning balance | $ | 337,939 | $ | — | |||||||
| Purchases and sales, net | 602,298 | 335,767 | |||||||||
| Change in fair value | 322 | 2,172 | |||||||||
| Ending balance | $ | 940,559 | $ | 337,939 | |||||||
| Limited partnerships and limited liability companies | |||||||||||
| Beginning balance | $ | — | $ | — | |||||||
| Purchases and sales, net | 57,574 | — | |||||||||
| Change in fair value | 6,635 | — | |||||||||
| Ending balance | $ | 64,209 | $ | — | |||||||
| Funds withheld liability - embedded derivative | |||||||||||
| Beginning balance | $ | — | $ | — | |||||||
| Transfers in | (441,864) | — | |||||||||
| Change in fair value | — | — | |||||||||
| Ending balance | $ | (441,864) | $ | — | |||||||
| Fixed index annuities - embedded derivatives | |||||||||||
| Beginning balance | $ | 7,964,961 | $ | 7,938,281 | |||||||
| Premiums less benefits | (125,940) | 1,424,372 | |||||||||
| Change in fair value, net | (2,561,676) | (876,803) | |||||||||
| Reserve release related to in-force ceded reinsurance | (456,500) | (520,889) | |||||||||
| Ending balance | $ | 4,820,845 | $ | 7,964,961 | |||||||
| Amortized Cost (1) | Gross Unrealized Gains | Gross Unrealized Losses (2) | Allowance for Credit Losses | Fair Value | |||||||||||||||||||||||||
| (Dollars in thousands) | |||||||||||||||||||||||||||||
| December 31, 2022 | |||||||||||||||||||||||||||||
| Fixed maturity securities, available for sale: | |||||||||||||||||||||||||||||
| U.S. Government and agencies | $ | 173,638 | $ | 70 | $ | (4,637) | $ | — | $ | 169,071 | |||||||||||||||||||
| States, municipalities and territories | 4,356,251 | 41,565 | (574,834) | — | 3,822,982 | ||||||||||||||||||||||||
| Foreign corporate securities and foreign governments | 748,770 | 11,661 | (83,579) | — | 676,852 | ||||||||||||||||||||||||
| Corporate securities | 27,706,440 | 146,065 | (3,687,370) | (3,214) | 24,161,921 | ||||||||||||||||||||||||
| Residential mortgage backed securities | 1,492,242 | 11,870 | (126,368) | (133) | 1,377,611 | ||||||||||||||||||||||||
| Commercial mortgage backed securities | 4,098,755 | 493 | (411,770) | — | 3,687,478 | ||||||||||||||||||||||||
| Other asset backed securities | 6,289,923 | 14,068 | (395,289) | — | 5,908,702 | ||||||||||||||||||||||||
| $ | 44,866,019 | $ | 225,792 | $ | (5,283,847) | $ | (3,347) | $ | 39,804,617 | ||||||||||||||||||||
| December 31, 2021 | |||||||||||||||||||||||||||||
| Fixed maturity securities, available for sale: | |||||||||||||||||||||||||||||
| U.S. Government and agencies | $ | 1,046,029 | $ | 32,841 | $ | (124) | $ | — | $ | 1,078,746 | |||||||||||||||||||
| States, municipalities and territories | 3,495,563 | 437,456 | (3,042) | (2,776) | 3,927,201 | ||||||||||||||||||||||||
| Foreign corporate securities and foreign governments | 380,646 | 22,742 | (843) | — | 402,545 | ||||||||||||||||||||||||
| Corporate securities | 31,084,629 | 3,614,047 | (38,442) | — | 34,660,234 | ||||||||||||||||||||||||
| Residential mortgage backed securities | 1,056,778 | 70,434 | (2,093) | (70) | 1,125,049 | ||||||||||||||||||||||||
| Commercial mortgage backed securities | 4,708,878 | 149,152 | (17,719) | — | 4,840,311 | ||||||||||||||||||||||||
| Other asset backed securities | 5,226,660 | 95,304 | (50,107) | — | 5,271,857 | ||||||||||||||||||||||||
| $ | 46,999,183 | $ | 4,421,976 | $ | (112,370) | $ | (2,846) | $ | 51,305,943 | ||||||||||||||||||||
| Amortized Cost (1) | Gross Unrealized Gains | Gross Unrealized Losses (2) | Allowance for Credit Losses | Fair Value | |||||||||||||||||||||||||
| (Dollars in thousands) | |||||||||||||||||||||||||||||
| December 31, 2023 | |||||||||||||||||||||||||||||
| Fixed maturity securities, available for sale: | |||||||||||||||||||||||||||||
| U.S. Government and agencies | $ | 172,683 | $ | 606 | $ | (2,148) | $ | — | $ | 171,141 | |||||||||||||||||||
| States, municipalities and territories | 3,654,571 | 17,477 | (573,108) | — | 3,098,940 | ||||||||||||||||||||||||
| Foreign corporate securities and foreign governments | 563,890 | 1,669 | (71,820) | — | 493,739 | ||||||||||||||||||||||||
| Corporate securities | 23,036,862 | 175,014 | (2,605,048) | (3,412) | 20,603,416 | ||||||||||||||||||||||||
| Residential mortgage backed securities | 1,503,639 | 11,598 | (112,736) | — | 1,402,501 | ||||||||||||||||||||||||
| Commercial mortgage backed securities | 3,405,647 | 995 | (454,095) | — | 2,952,547 | ||||||||||||||||||||||||
| Other asset backed securities | 6,200,170 | 30,530 | (171,884) | (618) | 6,058,198 | ||||||||||||||||||||||||
| $ | 38,537,462 | $ | 237,889 | $ | (3,990,839) | $ | (4,030) | $ | 34,780,482 | ||||||||||||||||||||
| December 31, 2022 | |||||||||||||||||||||||||||||
| Fixed maturity securities, available for sale: | |||||||||||||||||||||||||||||
| U.S. Government and agencies | $ | 173,638 | $ | 70 | $ | (4,637) | $ | — | $ | 169,071 | |||||||||||||||||||
| States, municipalities and territories | 4,356,251 | 41,565 | (574,834) | — | 3,822,982 | ||||||||||||||||||||||||
| Foreign corporate securities and foreign governments | 748,770 | 11,661 | (83,579) | — | 676,852 | ||||||||||||||||||||||||
| Corporate securities | 27,706,440 | 146,065 | (3,687,370) | (3,214) | 24,161,921 | ||||||||||||||||||||||||
| Residential mortgage backed securities | 1,492,242 | 11,870 | (126,368) | (133) | 1,377,611 | ||||||||||||||||||||||||
| Commercial mortgage backed securities | 4,098,755 | 493 | (411,770) | — | 3,687,478 | ||||||||||||||||||||||||
| Other asset backed securities | 6,289,923 | 14,068 | (395,289) | — | 5,908,702 | ||||||||||||||||||||||||
| $ | 44,866,019 | $ | 225,792 | $ | (5,283,847) | $ | (3,347) | $ | 39,804,617 | ||||||||||||||||||||
| Available for sale | |||||||||||||||||||||||||||||||||
| Amortized Cost | Fair Value | ||||||||||||||||||||||||||||||||
| (Dollars in thousands) | |||||||||||||||||||||||||||||||||
| Available for sale | Available for sale | ||||||||||||||||||||||||||||||||
| Amortized Cost | Amortized Cost | Fair Value | |||||||||||||||||||||||||||||||
| (Dollars in thousands) | (Dollars in thousands) | ||||||||||||||||||||||||||||||||
| Due in one year or less | Due in one year or less | $ | 1,184,147 | $ | 1,180,124 | ||||||||||||||||||||||||||||
| Due after one year through five years | Due after one year through five years | 5,641,072 | 5,406,059 | ||||||||||||||||||||||||||||||
| Due after five years through ten years | Due after five years through ten years | 6,254,569 | 5,672,730 | ||||||||||||||||||||||||||||||
| Due after ten years through twenty years | Due after ten years through twenty years | 9,853,998 | 8,817,815 | ||||||||||||||||||||||||||||||
| Due after twenty years | Due after twenty years | 10,051,313 | 7,754,098 | ||||||||||||||||||||||||||||||
| 32,985,099 | 28,830,826 | ||||||||||||||||||||||||||||||||
| 27,428,006 | |||||||||||||||||||||||||||||||||
| Residential mortgage backed securities | Residential mortgage backed securities | 1,492,242 | 1,377,611 | ||||||||||||||||||||||||||||||
| Commercial mortgage backed securities | Commercial mortgage backed securities | 4,098,755 | 3,687,478 | ||||||||||||||||||||||||||||||
| Other asset backed securities | Other asset backed securities | 6,289,923 | 5,908,702 | ||||||||||||||||||||||||||||||
| $ | 44,866,019 | $ | 39,804,617 | ||||||||||||||||||||||||||||||
| $ | |||||||||||||||||||||||||||||||||
| December 31, | |||||||||||
| 2022 | 2021 | ||||||||||
| (Dollars in thousands) | |||||||||||
| Net unrealized gains (losses) on available for sale fixed maturity securities | $ | (5,065,422) | $ | 4,309,606 | |||||||
| Adjustments for assumed changes in amortization of deferred policy acquisition costs, deferred sales inducements and policy benefit reserves | 2,309,357 | (1,993,869) | |||||||||
| Deferred income tax valuation allowance reversal | 22,534 | 22,534 | |||||||||
| Deferred income tax expense | 578,476 | (489,482) | |||||||||
| Net unrealized gains (losses) reported as accumulated other comprehensive income (loss) | $ | (2,155,055) | $ | 1,848,789 | |||||||
| December 31, | |||||||||||
| 2023 | 2022 | ||||||||||
| (Dollars in thousands) | |||||||||||
| Net unrealized losses on investments | $ | (3,755,689) | $ | (5,065,422) | |||||||
| Deferred income tax valuation allowance reversal | 22,534 | 22,534 | |||||||||
| Deferred income tax expense | 788,236 | 1,063,441 | |||||||||
| Net unrealized losses reported as accumulated other comprehensive loss | $ | (2,944,919) | $ | (3,979,447) | |||||||
| December 31, | ||||||||||||||||||||||||||||||||||||||||||||||||||||||||||||||||||||||||||||||||
| 2022 | 2021 | |||||||||||||||||||||||||||||||||||||||||||||||||||||||||||||||||||||||||||||||
| NAIC Designation | Amortized Cost | Fair Value | Amortized Cost | Fair Value | ||||||||||||||||||||||||||||||||||||||||||||||||||||||||||||||||||||||||||||
| (Dollars in thousands) | ||||||||||||||||||||||||||||||||||||||||||||||||||||||||||||||||||||||||||||||||
| December 31, | December 31, | |||||||||||||||||||||||||||||||||||||||||||||||||||||||||||||||||||||||||||||||
| 2023 | 2023 | 2022 | ||||||||||||||||||||||||||||||||||||||||||||||||||||||||||||||||||||||||||||||
NAIC Designation (1) | NAIC Designation (1) | Amortized Cost | Fair Value | Amortized Cost | Fair Value | |||||||||||||||||||||||||||||||||||||||||||||||||||||||||||||||||||||||||||
| (Dollars in thousands) | (Dollars in thousands) | |||||||||||||||||||||||||||||||||||||||||||||||||||||||||||||||||||||||||||||||
| 1 | 1 | $ | 27,061,903 | $ | 24,211,086 | $ | 26,157,531 | $ | 28,785,839 | |||||||||||||||||||||||||||||||||||||||||||||||||||||||||||||||||||||||
| 2 | 2 | 17,023,157 | 14,944,131 | 19,758,594 | 21,396,020 | |||||||||||||||||||||||||||||||||||||||||||||||||||||||||||||||||||||||||||
| 3 | 3 | 595,193 | 510,392 | 909,311 | 941,210 | |||||||||||||||||||||||||||||||||||||||||||||||||||||||||||||||||||||||||||
| 4 | 4 | 109,409 | 91,495 | 133,070 | 147,160 | |||||||||||||||||||||||||||||||||||||||||||||||||||||||||||||||||||||||||||
| 5 | 5 | 61,721 | 36,738 | 16,496 | 15,357 | |||||||||||||||||||||||||||||||||||||||||||||||||||||||||||||||||||||||||||
| 6 | 6 | 14,636 | 10,775 | 24,181 | 20,357 | |||||||||||||||||||||||||||||||||||||||||||||||||||||||||||||||||||||||||||
| $ | 44,866,019 | $ | 39,804,617 | $ | 46,999,183 | $ | 51,305,943 | |||||||||||||||||||||||||||||||||||||||||||||||||||||||||||||||||||||||||
| $ | ||||||||||||||||||||||||||||||||||||||||||||||||||||||||||||||||||||||||||||||||
| Less than 12 months | 12 months or more | Total | |||||||||||||||||||||||||||||||||||||||||||||||||||||||||||||||||||||||||||||||||||||||||||||||||||||||
| Fair Value | Unrealized Losses (1) | Fair Value | Unrealized Losses (1) | Fair Value | Unrealized Losses (1) | ||||||||||||||||||||||||||||||||||||||||||||||||||||||||||||||||||||||||||||||||||||||||||||||||||||
| (Dollars in thousands) | |||||||||||||||||||||||||||||||||||||||||||||||||||||||||||||||||||||||||||||||||||||||||||||||||||||||||
| December 31, 2022 | |||||||||||||||||||||||||||||||||||||||||||||||||||||||||||||||||||||||||||||||||||||||||||||||||||||||||
| Less than 12 months | Less than 12 months | 12 months or more | Total | ||||||||||||||||||||||||||||||||||||||||||||||||||||||||||||||||||||||||||||||||||||||||||||||||||||||
| Fair Value | Fair Value | Unrealized Losses (1) | Fair Value | Unrealized Losses (1) | Fair Value | Unrealized Losses (1) | |||||||||||||||||||||||||||||||||||||||||||||||||||||||||||||||||||||||||||||||||||||||||||||||||||
| (Dollars in thousands) | (Dollars in thousands) | ||||||||||||||||||||||||||||||||||||||||||||||||||||||||||||||||||||||||||||||||||||||||||||||||||||||||
| December 31, 2023 | |||||||||||||||||||||||||||||||||||||||||||||||||||||||||||||||||||||||||||||||||||||||||||||||||||||||||
| Fixed maturity securities, available for sale: | Fixed maturity securities, available for sale: | ||||||||||||||||||||||||||||||||||||||||||||||||||||||||||||||||||||||||||||||||||||||||||||||||||||||||
| Fixed maturity securities, available for sale: | |||||||||||||||||||||||||||||||||||||||||||||||||||||||||||||||||||||||||||||||||||||||||||||||||||||||||
| Fixed maturity securities, available for sale: | |||||||||||||||||||||||||||||||||||||||||||||||||||||||||||||||||||||||||||||||||||||||||||||||||||||||||
| U.S. Government and agencies | |||||||||||||||||||||||||||||||||||||||||||||||||||||||||||||||||||||||||||||||||||||||||||||||||||||||||
| U.S. Government and agencies | |||||||||||||||||||||||||||||||||||||||||||||||||||||||||||||||||||||||||||||||||||||||||||||||||||||||||
| U.S. Government and agencies | U.S. Government and agencies | $ | 160,201 | $ | (4,512) | $ | 908 | $ | (125) | $ | 161,109 | $ | (4,637) | ||||||||||||||||||||||||||||||||||||||||||||||||||||||||||||||||||||||||||||||||||||||||||||
| States, municipalities and territories | States, municipalities and territories | 2,595,122 | (537,313) | 95,184 | (37,521) | 2,690,306 | (574,834) | ||||||||||||||||||||||||||||||||||||||||||||||||||||||||||||||||||||||||||||||||||||||||||||||||||
| Foreign corporate securities and foreign governments | Foreign corporate securities and foreign governments | 522,826 | (76,957) | 21,816 | (6,622) | 544,642 | (83,579) | ||||||||||||||||||||||||||||||||||||||||||||||||||||||||||||||||||||||||||||||||||||||||||||||||||
| Corporate securities | Corporate securities | 18,784,181 | (3,218,323) | 1,411,177 | (469,047) | 20,195,358 | (3,687,370) | ||||||||||||||||||||||||||||||||||||||||||||||||||||||||||||||||||||||||||||||||||||||||||||||||||
| Residential mortgage backed securities | Residential mortgage backed securities | 992,783 | (101,100) | 116,388 | (25,268) | 1,109,171 | (126,368) | ||||||||||||||||||||||||||||||||||||||||||||||||||||||||||||||||||||||||||||||||||||||||||||||||||
| Commercial mortgage backed securities | Commercial mortgage backed securities | 2,941,293 | (302,513) | 651,923 | (109,257) | 3,593,216 | (411,770) | ||||||||||||||||||||||||||||||||||||||||||||||||||||||||||||||||||||||||||||||||||||||||||||||||||
| Other asset backed securities | Other asset backed securities | 2,561,390 | (162,821) | 1,924,026 | (232,468) | 4,485,416 | (395,289) | ||||||||||||||||||||||||||||||||||||||||||||||||||||||||||||||||||||||||||||||||||||||||||||||||||
| $ | |||||||||||||||||||||||||||||||||||||||||||||||||||||||||||||||||||||||||||||||||||||||||||||||||||||||||
| $ | 28,557,796 | $ | (4,403,539) | $ | 4,221,422 | $ | (880,308) | $ | 32,779,218 | $ | (5,283,847) | ||||||||||||||||||||||||||||||||||||||||||||||||||||||||||||||||||||||||||||||||||||||||||||||
| December 31, 2021 | |||||||||||||||||||||||||||||||||||||||||||||||||||||||||||||||||||||||||||||||||||||||||||||||||||||||||
| December 31, 2022 | |||||||||||||||||||||||||||||||||||||||||||||||||||||||||||||||||||||||||||||||||||||||||||||||||||||||||
| December 31, 2022 | |||||||||||||||||||||||||||||||||||||||||||||||||||||||||||||||||||||||||||||||||||||||||||||||||||||||||
| December 31, 2022 | |||||||||||||||||||||||||||||||||||||||||||||||||||||||||||||||||||||||||||||||||||||||||||||||||||||||||
| Fixed maturity securities, available for sale: | Fixed maturity securities, available for sale: | ||||||||||||||||||||||||||||||||||||||||||||||||||||||||||||||||||||||||||||||||||||||||||||||||||||||||
| Fixed maturity securities, available for sale: | |||||||||||||||||||||||||||||||||||||||||||||||||||||||||||||||||||||||||||||||||||||||||||||||||||||||||
| Fixed maturity securities, available for sale: | |||||||||||||||||||||||||||||||||||||||||||||||||||||||||||||||||||||||||||||||||||||||||||||||||||||||||
| U.S. Government and agencies | |||||||||||||||||||||||||||||||||||||||||||||||||||||||||||||||||||||||||||||||||||||||||||||||||||||||||
| U.S. Government and agencies | |||||||||||||||||||||||||||||||||||||||||||||||||||||||||||||||||||||||||||||||||||||||||||||||||||||||||
| U.S. Government and agencies | U.S. Government and agencies | $ | 760,977 | $ | (124) | $ | — | $ | — | $ | 760,977 | $ | (124) | ||||||||||||||||||||||||||||||||||||||||||||||||||||||||||||||||||||||||||||||||||||||||||||
| States, municipalities and territories | States, municipalities and territories | 168,942 | (2,468) | 15,711 | (3,350) | 184,653 | (5,818) | ||||||||||||||||||||||||||||||||||||||||||||||||||||||||||||||||||||||||||||||||||||||||||||||||||
| Foreign corporate securities and foreign governments | Foreign corporate securities and foreign governments | 42,861 | (843) | — | — | 42,861 | (843) | ||||||||||||||||||||||||||||||||||||||||||||||||||||||||||||||||||||||||||||||||||||||||||||||||||
| Corporate securities | Corporate securities | 2,375,603 | (30,070) | 116,819 | (8,372) | 2,492,422 | (38,442) | ||||||||||||||||||||||||||||||||||||||||||||||||||||||||||||||||||||||||||||||||||||||||||||||||||
| Residential mortgage backed securities | Residential mortgage backed securities | 250,964 | (1,408) | 26,917 | (755) | 277,881 | (2,163) | ||||||||||||||||||||||||||||||||||||||||||||||||||||||||||||||||||||||||||||||||||||||||||||||||||
| Commercial mortgage backed securities | Commercial mortgage backed securities | 784,464 | (5,500) | 142,224 | (12,219) | 926,688 | (17,719) | ||||||||||||||||||||||||||||||||||||||||||||||||||||||||||||||||||||||||||||||||||||||||||||||||||
| Other asset backed securities | Other asset backed securities | 1,351,324 | (11,345) | 1,771,182 | (38,762) | 3,122,506 | (50,107) | ||||||||||||||||||||||||||||||||||||||||||||||||||||||||||||||||||||||||||||||||||||||||||||||||||
| $ | 5,735,135 | $ | (51,758) | $ | 2,072,853 | $ | (63,458) | $ | 7,807,988 | $ | (115,216) | ||||||||||||||||||||||||||||||||||||||||||||||||||||||||||||||||||||||||||||||||||||||||||||||
| $ | |||||||||||||||||||||||||||||||||||||||||||||||||||||||||||||||||||||||||||||||||||||||||||||||||||||||||
| Year Ended December 31, | |||||||||||||||||||||||||||||||||||||||||||||||||||
| 2022 | 2021 | 2020 | |||||||||||||||||||||||||||||||||||||||||||||||||
| (Dollars in thousands) | |||||||||||||||||||||||||||||||||||||||||||||||||||
| Year Ended December 31, | Year Ended December 31, | ||||||||||||||||||||||||||||||||||||||||||||||||||
| 2023 | 2023 | 2022 | 2021 | ||||||||||||||||||||||||||||||||||||||||||||||||
| (Dollars in thousands) | (Dollars in thousands) | ||||||||||||||||||||||||||||||||||||||||||||||||||
| Fixed maturity securities available for sale carried at fair value | Fixed maturity securities available for sale carried at fair value | $ | (9,375,028) | $ | (987,434) | $ | 1,955,496 | ||||||||||||||||||||||||||||||||||||||||||||
| Adjustment for effect on other balance sheet accounts: | Adjustment for effect on other balance sheet accounts: | ||||||||||||||||||||||||||||||||||||||||||||||||||
| Deferred policy acquisition costs, deferred sales inducements and policy benefit reserves | 4,303,226 | 542,382 | (880,517) | ||||||||||||||||||||||||||||||||||||||||||||||||
| Adjustment for effect on other balance sheet accounts: | |||||||||||||||||||||||||||||||||||||||||||||||||||
| Adjustment for effect on other balance sheet accounts: | |||||||||||||||||||||||||||||||||||||||||||||||||||
| Deferred income tax asset/liability | Deferred income tax asset/liability | 1,067,958 | 90,284 | (225,746) | |||||||||||||||||||||||||||||||||||||||||||||||
| 5,371,184 | 632,666 | (1,106,263) | |||||||||||||||||||||||||||||||||||||||||||||||||
| Deferred income tax asset/liability | |||||||||||||||||||||||||||||||||||||||||||||||||||
| Deferred income tax asset/liability | |||||||||||||||||||||||||||||||||||||||||||||||||||
| (275,205) | |||||||||||||||||||||||||||||||||||||||||||||||||||
| Change in net unrealized gains/losses on investments carried at fair value | Change in net unrealized gains/losses on investments carried at fair value | $ | (4,003,844) | $ | (354,768) | $ | 849,233 | ||||||||||||||||||||||||||||||||||||||||||||
| Year Ended December 31, | |||||||||||||||||||||||||||||||||||||||||||||||||||
| 2022 | 2021 | 2020 | |||||||||||||||||||||||||||||||||||||||||||||||||
| (Dollars in thousands) | |||||||||||||||||||||||||||||||||||||||||||||||||||
| Year Ended December 31, | Year Ended December 31, | ||||||||||||||||||||||||||||||||||||||||||||||||||
| 2023 | 2023 | 2022 | 2021 | ||||||||||||||||||||||||||||||||||||||||||||||||
| (Dollars in thousands) | (Dollars in thousands) | ||||||||||||||||||||||||||||||||||||||||||||||||||
| Fixed maturity securities | Fixed maturity securities | $ | 1,849,915 | $ | 1,772,675 | $ | 2,035,762 | ||||||||||||||||||||||||||||||||||||||||||||
| Real estate investments | |||||||||||||||||||||||||||||||||||||||||||||||||||
| Real estate investments | |||||||||||||||||||||||||||||||||||||||||||||||||||
| Real estate investments | Real estate investments | 40,243 | 14,138 | — | |||||||||||||||||||||||||||||||||||||||||||||||
| Mortgage loans on real estate | Mortgage loans on real estate | 301,118 | 215,138 | 170,749 | |||||||||||||||||||||||||||||||||||||||||||||||
| Cash and cash equivalents | Cash and cash equivalents | 24,985 | 3,385 | 4,871 | |||||||||||||||||||||||||||||||||||||||||||||||
| Limited partnerships and limited liability companies | Limited partnerships and limited liability companies | 188,131 | 67,157 | (12,204) | |||||||||||||||||||||||||||||||||||||||||||||||
| Other investments | Other investments | 49,537 | 29,399 | 15,372 | |||||||||||||||||||||||||||||||||||||||||||||||
| 2,453,929 | 2,101,892 | 2,214,550 | |||||||||||||||||||||||||||||||||||||||||||||||||
| 2,415,942 | |||||||||||||||||||||||||||||||||||||||||||||||||||
| Less: investment expenses | Less: investment expenses | (146,466) | (64,417) | (32,472) | |||||||||||||||||||||||||||||||||||||||||||||||
| Net investment income | Net investment income | $ | 2,307,463 | $ | 2,037,475 | $ | 2,182,078 | ||||||||||||||||||||||||||||||||||||||||||||
| Year Ended December 31, | |||||||||||||||||||||||||||||||||||||||||||||||||||
| 2022 | 2021 | 2020 | |||||||||||||||||||||||||||||||||||||||||||||||||
| (Dollars in thousands) | |||||||||||||||||||||||||||||||||||||||||||||||||||
| Fixed maturity securities, available for sale: | |||||||||||||||||||||||||||||||||||||||||||||||||||
| Year Ended December 31, | Year Ended December 31, | ||||||||||||||||||||||||||||||||||||||||||||||||||
| 2023 | 2023 | 2022 | 2021 | ||||||||||||||||||||||||||||||||||||||||||||||||
| (Dollars in thousands) | (Dollars in thousands) | ||||||||||||||||||||||||||||||||||||||||||||||||||
| Available for sale fixed maturity securities: | |||||||||||||||||||||||||||||||||||||||||||||||||||
| Gross realized gains | |||||||||||||||||||||||||||||||||||||||||||||||||||
| Gross realized gains | |||||||||||||||||||||||||||||||||||||||||||||||||||
| Gross realized gains | Gross realized gains | $ | 139,819 | $ | 10,167 | $ | 305,170 | ||||||||||||||||||||||||||||||||||||||||||||
| Gross realized losses | Gross realized losses | (153,712) | (19,140) | (276,847) | |||||||||||||||||||||||||||||||||||||||||||||||
| Net credit loss (provision) release | (15,536) | (6,241) | (94,560) | ||||||||||||||||||||||||||||||||||||||||||||||||
| Net credit loss (provision) | |||||||||||||||||||||||||||||||||||||||||||||||||||
| (89,049) | |||||||||||||||||||||||||||||||||||||||||||||||||||
| (29,429) | (15,214) | (66,237) | |||||||||||||||||||||||||||||||||||||||||||||||||
| Other investments: | |||||||||||||||||||||||||||||||||||||||||||||||||||
| Other investments: | |||||||||||||||||||||||||||||||||||||||||||||||||||
| Other investments: | |||||||||||||||||||||||||||||||||||||||||||||||||||
| Gross realized gains | |||||||||||||||||||||||||||||||||||||||||||||||||||
| Gross realized gains | |||||||||||||||||||||||||||||||||||||||||||||||||||
| Gross realized gains | |||||||||||||||||||||||||||||||||||||||||||||||||||
| Gross realized losses | |||||||||||||||||||||||||||||||||||||||||||||||||||
| (2,989) | |||||||||||||||||||||||||||||||||||||||||||||||||||
| Mortgage loans on real estate: | Mortgage loans on real estate: | ||||||||||||||||||||||||||||||||||||||||||||||||||
| Decrease (increase) in allowance for credit losses | Decrease (increase) in allowance for credit losses | (15,126) | 7,005 | (15,447) | |||||||||||||||||||||||||||||||||||||||||||||||
| Decrease (increase) in allowance for credit losses | |||||||||||||||||||||||||||||||||||||||||||||||||||
| Decrease (increase) in allowance for credit losses | |||||||||||||||||||||||||||||||||||||||||||||||||||
| Recovery of specific allowance | Recovery of specific allowance | 1,677 | — | 712 | |||||||||||||||||||||||||||||||||||||||||||||||
| Gain (loss) on sale of mortgage loans | (4,970) | (5,033) | 292 | ||||||||||||||||||||||||||||||||||||||||||||||||
| (18,419) | 1,972 | (14,443) | |||||||||||||||||||||||||||||||||||||||||||||||||
| Loss on sale of mortgage loans | |||||||||||||||||||||||||||||||||||||||||||||||||||
| (7,165) | |||||||||||||||||||||||||||||||||||||||||||||||||||
| Total net realized losses | Total net realized losses | $ | (47,848) | $ | (13,242) | $ | (80,680) | ||||||||||||||||||||||||||||||||||||||||||||
| December 31, | |||||||||||||||||||||||||||||||||
| 2022 | 2021 | ||||||||||||||||||||||||||||||||
| (Dollars in thousands) | |||||||||||||||||||||||||||||||||
| December 31, | December 31, | ||||||||||||||||||||||||||||||||
| 2023 | 2023 | 2022 | |||||||||||||||||||||||||||||||
| (Dollars in thousands) | (Dollars in thousands) | ||||||||||||||||||||||||||||||||
| Fixed maturity securities, available for sale | Fixed maturity securities, available for sale | $ | 10,708 | $ | 4,118 | ||||||||||||||||||||||||||||
| Mortgage loans on real estate | Mortgage loans on real estate | 1,483 | — | ||||||||||||||||||||||||||||||
| $ | 12,191 | $ | 4,118 | ||||||||||||||||||||||||||||||
| Real estate owned | |||||||||||||||||||||||||||||||||
| $ | |||||||||||||||||||||||||||||||||
| Year Ended December 31, 2022 | |||||||||||||||||||||||||||||||||||||||||||||||||||||||||||||||||||||||||||||||||||||||||||||
| States, Municipalities and Territories | Corporate Securities | Residential Mortgage Backed Securities | Total | ||||||||||||||||||||||||||||||||||||||||||||||||||||||||||||||||||||||||||||||||||||||||||
| (Dollars in thousands) | |||||||||||||||||||||||||||||||||||||||||||||||||||||||||||||||||||||||||||||||||||||||||||||
| Year Ended December 31, 2023 | |||||||||||||||||||||||||||||||||||||||||||||||||||||||||||||||||||||||||||||||||||||||||||||
| Year Ended December 31, 2023 | |||||||||||||||||||||||||||||||||||||||||||||||||||||||||||||||||||||||||||||||||||||||||||||
| Year Ended December 31, 2023 | |||||||||||||||||||||||||||||||||||||||||||||||||||||||||||||||||||||||||||||||||||||||||||||
| States, Municipalities and Territories | States, Municipalities and Territories | Corporate Securities | Residential Mortgage Backed Securities | Other Asset Backed Securities | Total | ||||||||||||||||||||||||||||||||||||||||||||||||||||||||||||||||||||||||||||||||||||||||
| (Dollars in thousands) | (Dollars in thousands) | ||||||||||||||||||||||||||||||||||||||||||||||||||||||||||||||||||||||||||||||||||||||||||||
| Beginning balance | Beginning balance | $ | 2,776 | $ | — | $ | 70 | $ | 2,846 | ||||||||||||||||||||||||||||||||||||||||||||||||||||||||||||||||||||||||||||||||||||
| Additions for credit losses not previously recorded | Additions for credit losses not previously recorded | — | 3,825 | 1,070 | 4,895 | ||||||||||||||||||||||||||||||||||||||||||||||||||||||||||||||||||||||||||||||||||||||||
| Change in allowance on securities with previous allowance | Change in allowance on securities with previous allowance | (2,776) | (611) | (579) | (3,966) | ||||||||||||||||||||||||||||||||||||||||||||||||||||||||||||||||||||||||||||||||||||||||
| Reduction for securities with credit losses due to intent to sell | — | — | — | — | |||||||||||||||||||||||||||||||||||||||||||||||||||||||||||||||||||||||||||||||||||||||||
| Reduction for securities sold during the period | Reduction for securities sold during the period | — | — | (428) | (428) | ||||||||||||||||||||||||||||||||||||||||||||||||||||||||||||||||||||||||||||||||||||||||
| Write-offs charged against the allowance | — | — | — | — | |||||||||||||||||||||||||||||||||||||||||||||||||||||||||||||||||||||||||||||||||||||||||
| Recoveries of amounts previously written off | — | — | — | — | |||||||||||||||||||||||||||||||||||||||||||||||||||||||||||||||||||||||||||||||||||||||||
| Reduction for securities sold during the period | |||||||||||||||||||||||||||||||||||||||||||||||||||||||||||||||||||||||||||||||||||||||||||||
| Reduction for securities sold during the period | |||||||||||||||||||||||||||||||||||||||||||||||||||||||||||||||||||||||||||||||||||||||||||||
| Ending balance | Ending balance | $ | — | $ | 3,214 | $ | 133 | $ | 3,347 | ||||||||||||||||||||||||||||||||||||||||||||||||||||||||||||||||||||||||||||||||||||
| Ending balance | |||||||||||||||||||||||||||||||||||||||||||||||||||||||||||||||||||||||||||||||||||||||||||||
| Year Ended December 31, 2021 | |||||||||||||||||||||||||||||||||||||||||||||||||||||||||||||||||||||||||||||||||||||||||||||
| Ending balance | |||||||||||||||||||||||||||||||||||||||||||||||||||||||||||||||||||||||||||||||||||||||||||||
| States, Municipalities and Territories | Corporate Securities | Residential Mortgage Backed Securities | Total | ||||||||||||||||||||||||||||||||||||||||||||||||||||||||||||||||||||||||||||||||||||||||||
| (Dollars in thousands) | |||||||||||||||||||||||||||||||||||||||||||||||||||||||||||||||||||||||||||||||||||||||||||||
| Year Ended December 31, 2022 | |||||||||||||||||||||||||||||||||||||||||||||||||||||||||||||||||||||||||||||||||||||||||||||
| Year Ended December 31, 2022 | |||||||||||||||||||||||||||||||||||||||||||||||||||||||||||||||||||||||||||||||||||||||||||||
| Year Ended December 31, 2022 | |||||||||||||||||||||||||||||||||||||||||||||||||||||||||||||||||||||||||||||||||||||||||||||
| States, Municipalities and Territories | States, Municipalities and Territories | Corporate Securities | Residential Mortgage Backed Securities | Other Asset Backed Securities | Total | ||||||||||||||||||||||||||||||||||||||||||||||||||||||||||||||||||||||||||||||||||||||||
| (Dollars in thousands) | (Dollars in thousands) | ||||||||||||||||||||||||||||||||||||||||||||||||||||||||||||||||||||||||||||||||||||||||||||
| Beginning balance | Beginning balance | $ | 2,844 | $ | 60,193 | $ | 1,734 | $ | 64,771 | ||||||||||||||||||||||||||||||||||||||||||||||||||||||||||||||||||||||||||||||||||||
| Additions for credit losses not previously recorded | Additions for credit losses not previously recorded | — | 705 | 407 | 1,112 | ||||||||||||||||||||||||||||||||||||||||||||||||||||||||||||||||||||||||||||||||||||||||
| Change in allowance on securities with previous allowance | Change in allowance on securities with previous allowance | (68) | 443 | (857) | (482) | ||||||||||||||||||||||||||||||||||||||||||||||||||||||||||||||||||||||||||||||||||||||||
| Reduction for securities with credit losses due to intent to sell | — | (209) | — | (209) | |||||||||||||||||||||||||||||||||||||||||||||||||||||||||||||||||||||||||||||||||||||||||
| Reduction for securities sold during the period | Reduction for securities sold during the period | — | (50,758) | — | (50,758) | ||||||||||||||||||||||||||||||||||||||||||||||||||||||||||||||||||||||||||||||||||||||||
| Write-offs charged against the allowance | — | (10,032) | — | (10,032) | |||||||||||||||||||||||||||||||||||||||||||||||||||||||||||||||||||||||||||||||||||||||||
| Recoveries of amounts previously written off | — | (342) | (1,214) | (1,556) | |||||||||||||||||||||||||||||||||||||||||||||||||||||||||||||||||||||||||||||||||||||||||
| Reduction for securities sold during the period | |||||||||||||||||||||||||||||||||||||||||||||||||||||||||||||||||||||||||||||||||||||||||||||
| Reduction for securities sold during the period | |||||||||||||||||||||||||||||||||||||||||||||||||||||||||||||||||||||||||||||||||||||||||||||
| Ending balance | Ending balance | $ | 2,776 | $ | — | $ | 70 | $ | 2,846 | ||||||||||||||||||||||||||||||||||||||||||||||||||||||||||||||||||||||||||||||||||||
| Ending balance | |||||||||||||||||||||||||||||||||||||||||||||||||||||||||||||||||||||||||||||||||||||||||||||
| Ending balance | |||||||||||||||||||||||||||||||||||||||||||||||||||||||||||||||||||||||||||||||||||||||||||||
| December 31, | |||||||||||||||||||||||||||||||||
| 2022 | 2021 | ||||||||||||||||||||||||||||||||
| (Dollars in thousands) | |||||||||||||||||||||||||||||||||
| December 31, | December 31, | ||||||||||||||||||||||||||||||||
| 2023 | 2023 | 2022 | |||||||||||||||||||||||||||||||
| (Dollars in thousands) | (Dollars in thousands) | ||||||||||||||||||||||||||||||||
| Commercial mortgage loans: | Commercial mortgage loans: | ||||||||||||||||||||||||||||||||
| Principal outstanding | Principal outstanding | $ | 3,560,903 | $ | 3,633,131 | ||||||||||||||||||||||||||||
| Principal outstanding | |||||||||||||||||||||||||||||||||
| Principal outstanding | |||||||||||||||||||||||||||||||||
| Deferred fees and costs, net | Deferred fees and costs, net | (6,345) | (4,629) | ||||||||||||||||||||||||||||||
| Unamortized discounts and premiums, net | |||||||||||||||||||||||||||||||||
| Amortized cost | Amortized cost | 3,554,558 | 3,628,502 | ||||||||||||||||||||||||||||||
| Valuation allowance | Valuation allowance | (22,428) | (17,926) | ||||||||||||||||||||||||||||||
| Commercial mortgage loans, carrying value | Commercial mortgage loans, carrying value | 3,532,130 | 3,610,576 | ||||||||||||||||||||||||||||||
| Agricultural mortgage loans: | Agricultural mortgage loans: | ||||||||||||||||||||||||||||||||
| Agricultural mortgage loans: | |||||||||||||||||||||||||||||||||
| Agricultural mortgage loans: | |||||||||||||||||||||||||||||||||
| Principal outstanding | |||||||||||||||||||||||||||||||||
| Principal outstanding | |||||||||||||||||||||||||||||||||
| Principal outstanding | Principal outstanding | 567,630 | 408,135 | ||||||||||||||||||||||||||||||
| Deferred fees and costs, net | Deferred fees and costs, net | (1,667) | (1,136) | ||||||||||||||||||||||||||||||
| Amortized cost | Amortized cost | 565,963 | 406,999 | ||||||||||||||||||||||||||||||
| Valuation allowance | Valuation allowance | (1,021) | (519) | ||||||||||||||||||||||||||||||
| Agricultural mortgage loans, carrying value | Agricultural mortgage loans, carrying value | 564,942 | 406,480 | ||||||||||||||||||||||||||||||
| Residential mortgage loans: | Residential mortgage loans: | ||||||||||||||||||||||||||||||||
| Residential mortgage loans: | |||||||||||||||||||||||||||||||||
| Residential mortgage loans: | |||||||||||||||||||||||||||||||||
| Principal outstanding | |||||||||||||||||||||||||||||||||
| Principal outstanding | |||||||||||||||||||||||||||||||||
| Principal outstanding | Principal outstanding | 2,807,652 | 1,652,910 | ||||||||||||||||||||||||||||||
| Deferred fees and costs, net | Deferred fees and costs, net | 1,909 | 1,468 | ||||||||||||||||||||||||||||||
| Unamortized discounts and premiums, net | Unamortized discounts and premiums, net | 55,917 | 22,143 | ||||||||||||||||||||||||||||||
| Amortized cost | Amortized cost | 2,865,478 | 1,676,521 | ||||||||||||||||||||||||||||||
| Valuation allowance | Valuation allowance | (13,523) | (5,579) | ||||||||||||||||||||||||||||||
| Residential mortgage loans, carrying value | Residential mortgage loans, carrying value | 2,851,955 | 1,670,942 | ||||||||||||||||||||||||||||||
| Mortgage loans, carrying value | Mortgage loans, carrying value | $ | 6,949,027 | $ | 5,687,998 | ||||||||||||||||||||||||||||
| December 31, | |||||||||||||||||||||||||||||||||||||||||||||||||||||||||||||||||||||
| 2022 | 2021 | ||||||||||||||||||||||||||||||||||||||||||||||||||||||||||||||||||||
| Principal | Percent | Principal | Percent | ||||||||||||||||||||||||||||||||||||||||||||||||||||||||||||||||||
| (Dollars in thousands) | |||||||||||||||||||||||||||||||||||||||||||||||||||||||||||||||||||||
| December 31, | December 31, | ||||||||||||||||||||||||||||||||||||||||||||||||||||||||||||||||||||
| 2023 | 2023 | 2022 | |||||||||||||||||||||||||||||||||||||||||||||||||||||||||||||||||||
| Principal | Principal | Percent | Principal | Percent | |||||||||||||||||||||||||||||||||||||||||||||||||||||||||||||||||
| (Dollars in thousands) | (Dollars in thousands) | ||||||||||||||||||||||||||||||||||||||||||||||||||||||||||||||||||||
| Geographic distribution | Geographic distribution | ||||||||||||||||||||||||||||||||||||||||||||||||||||||||||||||||||||
| East | |||||||||||||||||||||||||||||||||||||||||||||||||||||||||||||||||||||
| East | |||||||||||||||||||||||||||||||||||||||||||||||||||||||||||||||||||||
| East | East | $ | 502,659 | 14.1 | % | $ | 614,406 | 16.9 | % | $ | 471,707 | 13.3 | 13.3 | % | $ | 502,659 | 14.1 | 14.1 | % | ||||||||||||||||||||||||||||||||||||||||||||||||||
| Middle Atlantic | Middle Atlantic | 280,993 | 7.9 | % | 293,494 | 8.1 | % | Middle Atlantic | 274,017 | 7.7 | 7.7 | % | 280,993 | 7.9 | 7.9 | % | |||||||||||||||||||||||||||||||||||||||||||||||||||||
| Mountain | Mountain | 416,307 | 11.7 | % | 452,818 | 12.5 | % | Mountain | 404,143 | 11.4 | 11.4 | % | 416,307 | 11.7 | 11.7 | % | |||||||||||||||||||||||||||||||||||||||||||||||||||||
| New England | New England | 73,631 | 2.1 | % | 60,172 | 1.6 | % | New England | 87,041 | 2.4 | 2.4 | % | 73,631 | 2.1 | 2.1 | % | |||||||||||||||||||||||||||||||||||||||||||||||||||||
| Pacific | Pacific | 858,812 | 24.1 | % | 863,879 | 23.8 | % | Pacific | 835,085 | 23.5 | 23.5 | % | 858,812 | 24.1 | 24.1 | % | |||||||||||||||||||||||||||||||||||||||||||||||||||||
| South Atlantic | South Atlantic | 934,007 | 26.2 | % | 785,679 | 21.6 | % | South Atlantic | 927,547 | 26.1 | 26.1 | % | 934,007 | 26.2 | 26.2 | % | |||||||||||||||||||||||||||||||||||||||||||||||||||||
| West North Central | West North Central | 205,568 | 5.8 | % | 235,864 | 6.5 | % | West North Central | 183,856 | 5.2 | 5.2 | % | 205,568 | 5.8 | 5.8 | % | |||||||||||||||||||||||||||||||||||||||||||||||||||||
| West South Central | West South Central | 288,926 | 8.1 | % | 326,819 | 9.0 | % | West South Central | 328,918 | 9.3 | 9.3 | % | 288,926 | 8.1 | 8.1 | % | |||||||||||||||||||||||||||||||||||||||||||||||||||||
| $ | 3,560,903 | 100.0 | % | $ | 3,633,131 | 100.0 | % | ||||||||||||||||||||||||||||||||||||||||||||||||||||||||||||||
| International | International | 37,890 | 1.1 | % | — | — | % | ||||||||||||||||||||||||||||||||||||||||||||||||||||||||||||||
| $ | $ | 3,550,204 | 100.0 | % | $ | 3,560,903 | 100.0 | % | |||||||||||||||||||||||||||||||||||||||||||||||||||||||||||||
| Property type distribution | Property type distribution | ||||||||||||||||||||||||||||||||||||||||||||||||||||||||||||||||||||
| Office | Office | $ | 378,713 | 10.6 | % | $ | 315,374 | 8.7 | % | ||||||||||||||||||||||||||||||||||||||||||||||||||||||||||||
| Medical Office | 10,265 | 0.3 | % | 10,827 | 0.3 | % | |||||||||||||||||||||||||||||||||||||||||||||||||||||||||||||||
| Office | |||||||||||||||||||||||||||||||||||||||||||||||||||||||||||||||||||||
| Office | $ | 360,328 | 10.1 | % | $ | 388,978 | 10.9 | % | |||||||||||||||||||||||||||||||||||||||||||||||||||||||||||||
| Retail | |||||||||||||||||||||||||||||||||||||||||||||||||||||||||||||||||||||
| Retail | |||||||||||||||||||||||||||||||||||||||||||||||||||||||||||||||||||||
| Retail | Retail | 896,351 | 25.2 | % | 1,016,101 | 28.0 | % | 801,977 | 22.6 | 22.6 | % | 896,351 | 25.2 | 25.2 | % | ||||||||||||||||||||||||||||||||||||||||||||||||||||||
| Industrial/Warehouse | Industrial/Warehouse | 866,623 | 24.3 | % | 924,779 | 25.4 | % | Industrial/Warehouse | 940,546 | 26.5 | 26.5 | % | 866,623 | 24.3 | 24.3 | % | |||||||||||||||||||||||||||||||||||||||||||||||||||||
| Apartment | Apartment | 912,984 | 25.6 | % | 864,580 | 23.8 | % | Apartment | 1,047,740 | 29.5 | 29.5 | % | 912,984 | 25.6 | 25.6 | % | |||||||||||||||||||||||||||||||||||||||||||||||||||||
| Hotel | Hotel | 285,271 | 8.0 | % | 283,500 | 7.8 | % | Hotel | 319,733 | 9.0 | 9.0 | % | 285,271 | 8.0 | 8.0 | % | |||||||||||||||||||||||||||||||||||||||||||||||||||||
| Mixed Use/Other | Mixed Use/Other | 210,696 | 6.0 | % | 217,970 | 6.0 | % | Mixed Use/Other | 79,880 | 2.3 | 2.3 | % | 210,696 | 6.0 | 6.0 | % | |||||||||||||||||||||||||||||||||||||||||||||||||||||
| $ | 3,560,903 | 100.0 | % | $ | 3,633,131 | 100.0 | % | ||||||||||||||||||||||||||||||||||||||||||||||||||||||||||||||
| $ | $ | 3,550,204 | 100.0 | % | $ | 3,560,903 | 100.0 | % | |||||||||||||||||||||||||||||||||||||||||||||||||||||||||||||
| Year Ended December 31, 2022 | |||||||||||||||||||||||||||||||||||||||||||||||||||||||||||||||||||||
| Commercial | Agricultural | Residential | Total | ||||||||||||||||||||||||||||||||||||||||||||||||||||||||||||||||||
| (Dollars in thousands) | |||||||||||||||||||||||||||||||||||||||||||||||||||||||||||||||||||||
| Year Ended December 31, 2023 | Year Ended December 31, 2023 | ||||||||||||||||||||||||||||||||||||||||||||||||||||||||||||||||||||
| Commercial | Commercial | Agricultural | Residential | Total | |||||||||||||||||||||||||||||||||||||||||||||||||||||||||||||||||
| (Dollars in thousands) | (Dollars in thousands) | ||||||||||||||||||||||||||||||||||||||||||||||||||||||||||||||||||||
| Beginning allowance balance | Beginning allowance balance | $ | (17,926) | $ | (519) | $ | (5,579) | $ | (24,024) | ||||||||||||||||||||||||||||||||||||||||||||||||||||||||||||
| Charge-offs | Charge-offs | 501 | — | — | 501 | ||||||||||||||||||||||||||||||||||||||||||||||||||||||||||||||||
| Recoveries | Recoveries | 1,677 | — | — | 1,677 | ||||||||||||||||||||||||||||||||||||||||||||||||||||||||||||||||
| Change in provision for credit losses | Change in provision for credit losses | (6,680) | (502) | (7,944) | (15,126) | ||||||||||||||||||||||||||||||||||||||||||||||||||||||||||||||||
| Ending allowance balance | Ending allowance balance | $ | (22,428) | $ | (1,021) | $ | (13,523) | $ | (36,972) | ||||||||||||||||||||||||||||||||||||||||||||||||||||||||||||
| Year Ended December 31, 2021 | |||||||||||||||||||||||||||||||||||||||||||||||||||||||||||||||||||||
| Commercial | Agricultural | Residential | Total | ||||||||||||||||||||||||||||||||||||||||||||||||||||||||||||||||||
| (Dollars in thousands) | |||||||||||||||||||||||||||||||||||||||||||||||||||||||||||||||||||||
| Year Ended December 31, 2022 | |||||||||||||||||||||||||||||||||||||||||||||||||||||||||||||||||||||
| Year Ended December 31, 2022 | |||||||||||||||||||||||||||||||||||||||||||||||||||||||||||||||||||||
| Year Ended December 31, 2022 | |||||||||||||||||||||||||||||||||||||||||||||||||||||||||||||||||||||
| Commercial | Commercial | Agricultural | Residential | Total | |||||||||||||||||||||||||||||||||||||||||||||||||||||||||||||||||
| (Dollars in thousands) | (Dollars in thousands) | ||||||||||||||||||||||||||||||||||||||||||||||||||||||||||||||||||||
| Beginning allowance balance | Beginning allowance balance | $ | (25,529) | $ | (2,130) | $ | (3,370) | $ | (31,029) | ||||||||||||||||||||||||||||||||||||||||||||||||||||||||||||
| Charge-offs | Charge-offs | — | — | — | — | ||||||||||||||||||||||||||||||||||||||||||||||||||||||||||||||||
| Recoveries | Recoveries | — | — | — | — | ||||||||||||||||||||||||||||||||||||||||||||||||||||||||||||||||
| Change in provision for credit losses | Change in provision for credit losses | 7,603 | 1,611 | (2,209) | 7,005 | ||||||||||||||||||||||||||||||||||||||||||||||||||||||||||||||||
| Ending allowance balance | Ending allowance balance | $ | (17,926) | $ | (519) | $ | (5,579) | $ | (24,024) | ||||||||||||||||||||||||||||||||||||||||||||||||||||||||||||
| 2022 | 2021 | 2020 | 2019 | 2018 | Prior | Total | ||||||||||||||||||||||||||||||||||||||||||||||||||||||||||||||||||||||||||||||||||||||||||
| As of December 31, 2022: | Amortized Cost | Average LTV | Amortized Cost | Average LTV | Amortized Cost | Average LTV | Amortized Cost | Average LTV | Amortized Cost | Average LTV | Amortized Cost | Average LTV | Amortized Cost | Average LTV | ||||||||||||||||||||||||||||||||||||||||||||||||||||||||||||||||||||||||||||||||||
| 2023 | 2023 | 2022 | 2021 | 2020 | 2019 | Prior | Total | |||||||||||||||||||||||||||||||||||||||||||||||||||||||||||||||||||||||||||||||||||||||||
| As of December 31, 2023: | As of December 31, 2023: | Amortized Cost | Average LTV | Amortized Cost | Average LTV | Amortized Cost | Average LTV | Amortized Cost | Average LTV | Amortized Cost | Average LTV | Amortized Cost | Average LTV | Amortized Cost | Average LTV | |||||||||||||||||||||||||||||||||||||||||||||||||||||||||||||||||||||||||||||||||
| Debt Service Coverage Ratio: | Debt Service Coverage Ratio: | (Dollars in thousands) | Debt Service Coverage Ratio: | (Dollars in thousands) | ||||||||||||||||||||||||||||||||||||||||||||||||||||||||||||||||||||||||||||||||||||||||||||
| Greater than or equal to 1.5 | Greater than or equal to 1.5 | $ | 249,328 | 63 | % | $ | 257,746 | 61 | % | $ | 421,391 | 57 | % | $ | 429,596 | 58 | % | $ | 325,117 | 53 | % | $ | 813,319 | 44 | % | $ | 2,496,497 | 53 | % | Greater than or equal to 1.5 | $ | 3,444 | 46 | 46 | % | $ | 285,481 | 62 | 62 | % | $ | 272,661 | 57 | 57 | % | $ | 370,299 | 51 | 51 | % | $ | 449,973 | 55 | 55 | % | $ | 1,056,159 | 44 | 44 | % | $ | 2,438,017 | 50 | 50 | % | |||||||||||||||||||||||||||||||
| Greater than or equal to 1.2 and less than 1.5 | Greater than or equal to 1.2 and less than 1.5 | 6,488 | 70 | % | 123,038 | 55 | % | 46,804 | 58 | % | 115,977 | 66 | % | 67,642 | 67 | % | 145,703 | 60 | % | 505,652 | 62 | % | Greater than or equal to 1.2 and less than 1.5 | — | — | — | % | 76,122 | 49 | 49 | % | 4,500 | 55 | 55 | % | 36,534 | 57 | 57 | % | 108,232 | 64 | 64 | % | 177,489 | 57 | 57 | % | 402,877 | 58 | 58 | % | |||||||||||||||||||||||||||||||||||||||||||||
| Greater than or equal to 1.0 and less than 1.2 | Greater than or equal to 1.0 and less than 1.2 | 170,059 | 52 | % | 211,684 | 43 | % | 18,144 | 79 | % | 39,396 | 73 | % | 10,348 | 76 | % | 58,021 | 47 | % | 507,652 | 51 | % | Greater than or equal to 1.0 and less than 1.2 | 40,727 | 38 | 38 | % | 105,578 | 32 | 32 | % | 328,722 | 45 | 45 | % | 28,935 | 54 | 54 | % | — | — | — | % | 63,972 | 71 | 71 | % | 567,934 | 46 | 46 | % | |||||||||||||||||||||||||||||||||||||||||||||
| Less than 1.0 | Less than 1.0 | — | — | % | — | — | % | — | — | % | 6,107 | 64 | % | 13,025 | 70 | % | 25,625 | 65 | % | 44,757 | 66 | % | Less than 1.0 | — | — | — | % | 53,470 | 54 | 54 | % | 26,960 | 52 | 52 | % | — | — | — | % | 2,545 | 80 | 80 | % | 53,196 | 52 | 52 | % | 136,171 | 53 | 53 | % | |||||||||||||||||||||||||||||||||||||||||||||
| Total | Total | $ | 425,875 | 59 | % | $ | 592,468 | 53 | % | $ | 486,339 | 58 | % | $ | 591,076 | 61 | % | $ | 416,132 | 57 | % | $ | 1,042,668 | 47 | % | $ | 3,554,558 | 54 | % | Total | $ | 44,171 | 39 | 39 | % | $ | 520,651 | 53 | 53 | % | $ | 632,843 | 51 | 51 | % | $ | 435,768 | 52 | 52 | % | $ | 560,750 | 57 | 57 | % | $ | 1,350,816 | 47 | 47 | % | $ | 3,544,999 | 51 | 51 | % | |||||||||||||||||||||||||||||||
| 2022 | ||||||||||||||||||||||||||||||||||||||||||||||||||||||||||||||||||||||||||||||||||||||||||||||||
| 2021 | 2020 | 2019 | 2018 | 2017 | Prior | Total | ||||||||||||||||||||||||||||||||||||||||||||||||||||||||||||||||||||||||||||||||||||||||||
| As of December 31, 2021: | Amortized Cost | Average LTV | Amortized Cost | Average LTV | Amortized Cost | Average LTV | Amortized Cost | Average LTV | Amortized Cost | Average LTV | Amortized Cost | Average LTV | Amortized Cost | Average LTV | ||||||||||||||||||||||||||||||||||||||||||||||||||||||||||||||||||||||||||||||||||
| 2022 | ||||||||||||||||||||||||||||||||||||||||||||||||||||||||||||||||||||||||||||||||||||||||||||||||
| 2022 | 2021 | 2020 | 2019 | 2018 | Prior | Total | ||||||||||||||||||||||||||||||||||||||||||||||||||||||||||||||||||||||||||||||||||||||||||
| As of December 31, 2022: | As of December 31, 2022: | Amortized Cost | Average LTV | Amortized Cost | Average LTV | Amortized Cost | Average LTV | Amortized Cost | Average LTV | Amortized Cost | Average LTV | Amortized Cost | Average LTV | Amortized Cost | Average LTV | |||||||||||||||||||||||||||||||||||||||||||||||||||||||||||||||||||||||||||||||||
| Debt Service Coverage Ratio: | Debt Service Coverage Ratio: | (Dollars in thousands) | Debt Service Coverage Ratio: | (Dollars in thousands) | ||||||||||||||||||||||||||||||||||||||||||||||||||||||||||||||||||||||||||||||||||||||||||||
| Greater than or equal to 1.5 | Greater than or equal to 1.5 | $ | 260,623 | 64 | % | $ | 454,828 | 60 | % | $ | 464,059 | 61 | % | $ | 344,170 | 58 | % | $ | 246,854 | 52 | % | $ | 758,494 | 45 | % | $ | 2,529,028 | 55 | % | Greater than or equal to 1.5 | $ | 249,328 | 63 | 63 | % | $ | 257,746 | 61 | 61 | % | $ | 421,391 | 57 | 57 | % | $ | 429,596 | 58 | 58 | % | $ | 325,117 | 53 | 53 | % | $ | 813,319 | 44 | 44 | % | $ | 2,496,497 | 53 | 53 | % | |||||||||||||||||||||||||||||||
| Greater than or equal to 1.2 and less than 1.5 | Greater than or equal to 1.2 and less than 1.5 | 12,836 | 67 | % | 58,960 | 66 | % | 128,301 | 70 | % | 89,293 | 66 | % | 135,818 | 66 | % | 129,833 | 57 | % | 555,041 | 65 | % | Greater than or equal to 1.2 and less than 1.5 | 6,488 | 70 | 70 | % | 123,038 | 55 | 55 | % | 46,804 | 58 | 58 | % | 115,977 | 66 | 66 | % | 67,642 | 67 | 67 | % | 145,703 | 60 | 60 | % | 505,652 | 62 | 62 | % | |||||||||||||||||||||||||||||||||||||||||||||
| Greater than or equal to 1.0 and less than 1.2 | Greater than or equal to 1.0 and less than 1.2 | 318,636 | 45 | % | 17,762 | 82 | % | 69,684 | 72 | % | 11,937 | 75 | % | 6,343 | 60 | % | 42,125 | 58 | % | 466,487 | 53 | % | Greater than or equal to 1.0 and less than 1.2 | 170,059 | 52 | 52 | % | 211,684 | 43 | 43 | % | 18,144 | 79 | 79 | % | 39,396 | 73 | 73 | % | 10,348 | 76 | 76 | % | 58,021 | 47 | 47 | % | 507,652 | 51 | 51 | % | |||||||||||||||||||||||||||||||||||||||||||||
| Less than 1.0 | Less than 1.0 | — | — | % | 3,289 | 61 | % | 26,147 | 63 | % | 14,051 | 76 | % | 13,385 | 73 | % | 21,074 | 54 | % | 77,946 | 65 | % | Less than 1.0 | — | — | — | % | — | — | — | % | — | — | — | % | 6,107 | 64 | 64 | % | 13,025 | 70 | 70 | % | 25,625 | 65 | 65 | % | 44,757 | 66 | 66 | % | |||||||||||||||||||||||||||||||||||||||||||||
| Total | Total | $ | 592,095 | 54 | % | $ | 534,839 | 61 | % | $ | 688,191 | 64 | % | $ | 459,451 | 60 | % | $ | 402,400 | 58 | % | $ | 951,526 | 47 | % | $ | 3,628,502 | 56 | % | Total | $ | 425,875 | 59 | 59 | % | $ | 592,468 | 53 | 53 | % | $ | 486,339 | 58 | 58 | % | $ | 591,076 | 61 | 61 | % | $ | 416,132 | 57 | 57 | % | $ | 1,042,668 | 47 | 47 | % | $ | 3,554,558 | 54 | 54 | % | |||||||||||||||||||||||||||||||
| 2022 | 2021 | 2020 | 2019 | 2018 | Prior | Total | ||||||||||||||||||||||||||||||||||||||||||||||||||||||||||||||||||||||||||||||||||||||||||
| As of December 31, 2022: | Amortized Cost | Average LTV | Amortized Cost | Average LTV | Amortized Cost | Average LTV | Amortized Cost | Average LTV | Amortized Cost | Average LTV | Amortized Cost | Average LTV | Amortized Cost | Average LTV | ||||||||||||||||||||||||||||||||||||||||||||||||||||||||||||||||||||||||||||||||||
| 2023 | 2023 | 2022 | 2021 | 2020 | 2019 | Prior | Total | |||||||||||||||||||||||||||||||||||||||||||||||||||||||||||||||||||||||||||||||||||||||||
| As of December 31, 2023: | As of December 31, 2023: | Amortized Cost | Average LTV | Amortized Cost | Average LTV | Amortized Cost | Average LTV | Amortized Cost | Average LTV | Amortized Cost | Average LTV | Amortized Cost | Average LTV | Amortized Cost | Average LTV | |||||||||||||||||||||||||||||||||||||||||||||||||||||||||||||||||||||||||||||||||
| Debt Service Coverage Ratio: | Debt Service Coverage Ratio: | (Dollars in thousands) | Debt Service Coverage Ratio: | (Dollars in thousands) | ||||||||||||||||||||||||||||||||||||||||||||||||||||||||||||||||||||||||||||||||||||||||||||
| Greater than or equal to 1.5 | Greater than or equal to 1.5 | $ | 85,367 | 47 | % | $ | 84,186 | 46 | % | $ | 97,143 | 41 | % | $ | — | — | % | $ | — | — | % | $ | — | — | % | $ | 266,696 | 45 | % | Greater than or equal to 1.5 | $ | 26,890 | 59 | 59 | % | $ | 61,374 | 54 | 54 | % | $ | 46,060 | 57 | 57 | % | $ | 91,060 | 46 | 46 | % | $ | — | — | — | % | $ | 34,000 | 42 | 42 | % | $ | 259,384 | 50 | 50 | % | |||||||||||||||||||||||||||||||
| Greater than or equal to 1.2 and less than 1.5 | Greater than or equal to 1.2 and less than 1.5 | 107,856 | 54 | % | 67,630 | 52 | % | 61,103 | 32 | % | — | — | % | — | — | % | — | — | % | 236,589 | 48 | % | Greater than or equal to 1.2 and less than 1.5 | 17,798 | 59 | 59 | % | 89,548 | 54 | 54 | % | 51,819 | 52 | 52 | % | 27,433 | 32 | 32 | % | — | — | — | % | — | — | — | % | 186,598 | 51 | 51 | % | |||||||||||||||||||||||||||||||||||||||||||||
| Greater than or equal to 1.0 and less than 1.2 | Greater than or equal to 1.0 and less than 1.2 | 3,124 | 56 | % | 8,825 | 38 | % | 3,125 | 25 | % | — | — | % | — | — | % | — | — | % | 15,074 | 39 | % | Greater than or equal to 1.0 and less than 1.2 | 3,988 | 43 | 43 | % | 3,080 | 55 | 55 | % | 9,246 | 57 | 57 | % | 902 | 59 | 59 | % | — | — | — | % | — | — | — | % | 17,216 | 53 | 53 | % | |||||||||||||||||||||||||||||||||||||||||||||
| Less than 1.0 | Less than 1.0 | — | — | % | — | — | % | 7,975 | 35 | % | 5,629 | 41 | % | 34,000 | 31 | % | — | — | % | 47,604 | 33 | % | Less than 1.0 | — | — | — | % | 38,675 | 37 | 37 | % | 26,514 | 51 | 51 | % | 49,105 | 48 | 48 | % | 2,141 | 33 | 33 | % | — | — | — | % | 116,435 | 45 | 45 | % | |||||||||||||||||||||||||||||||||||||||||||||
| Total | Total | $ | 196,347 | 51 | % | $ | 160,641 | 48 | % | $ | 169,346 | 37 | % | $ | 5,629 | 41 | % | $ | 34,000 | 31 | % | $ | — | — | % | $ | 565,963 | 45 | % | Total | $ | 48,676 | 58 | 58 | % | $ | 192,677 | 51 | 51 | % | $ | 133,639 | 54 | 54 | % | $ | 168,500 | 44 | 44 | % | $ | 2,141 | 33 | 33 | % | $ | 34,000 | 42 | 42 | % | $ | 579,633 | 49 | 49 | % | |||||||||||||||||||||||||||||||
| 2022 | ||||||||||||||||||||||||||||||||||||||||||||||||||||||||||||||||||||||||||||||||||||||||||||||||
| 2021 | 2020 | 2019 | 2018 | 2017 | Prior | Total | ||||||||||||||||||||||||||||||||||||||||||||||||||||||||||||||||||||||||||||||||||||||||||
| As of December 31, 2021: | Amortized Cost | Average LTV | Amortized Cost | Average LTV | Amortized Cost | Average LTV | Amortized Cost | Average LTV | Amortized Cost | Average LTV | Amortized Cost | Average LTV | Amortized Cost | Average LTV | ||||||||||||||||||||||||||||||||||||||||||||||||||||||||||||||||||||||||||||||||||
| 2022 | ||||||||||||||||||||||||||||||||||||||||||||||||||||||||||||||||||||||||||||||||||||||||||||||||
| 2022 | 2021 | 2020 | 2019 | 2018 | Prior | Total | ||||||||||||||||||||||||||||||||||||||||||||||||||||||||||||||||||||||||||||||||||||||||||
| As of December 31, 2022: | As of December 31, 2022: | Amortized Cost | Average LTV | Amortized Cost | Average LTV | Amortized Cost | Average LTV | Amortized Cost | Average LTV | Amortized Cost | Average LTV | Amortized Cost | Average LTV | Amortized Cost | Average LTV | |||||||||||||||||||||||||||||||||||||||||||||||||||||||||||||||||||||||||||||||||
| Debt Service Coverage Ratio: | Debt Service Coverage Ratio: | (Dollars in thousands) | Debt Service Coverage Ratio: | (Dollars in thousands) | ||||||||||||||||||||||||||||||||||||||||||||||||||||||||||||||||||||||||||||||||||||||||||||
| Greater than or equal to 1.5 | Greater than or equal to 1.5 | $ | 62,548 | 54 | % | $ | 80,919 | 56 | % | $ | 11,645 | 49 | % | $ | 25,000 | 11 | % | $ | — | — | % | $ | — | — | % | $ | 180,112 | 49 | % | Greater than or equal to 1.5 | $ | 85,367 | 47 | 47 | % | $ | 84,186 | 46 | 46 | % | $ | 97,143 | 41 | 41 | % | $ | — | — | — | % | $ | — | — | — | % | $ | — | — | — | % | $ | 266,696 | 45 | 45 | % | |||||||||||||||||||||||||||||||
| Greater than or equal to 1.2 and less than 1.5 | Greater than or equal to 1.2 and less than 1.5 | 95,738 | 55 | % | 102,958 | 43 | % | 3,335 | 22 | % | — | — | % | — | — | % | — | — | % | 202,031 | 48 | % | Greater than or equal to 1.2 and less than 1.5 | 107,856 | 54 | 54 | % | 67,630 | 52 | 52 | % | 61,103 | 32 | 32 | % | — | — | — | % | — | — | — | % | — | — | — | % | 236,589 | 48 | 48 | % | |||||||||||||||||||||||||||||||||||||||||||||
| Greater than or equal to 1.0 and less than 1.2 | Greater than or equal to 1.0 and less than 1.2 | 7,478 | 44 | % | 4,092 | 36 | % | 4,734 | 50 | % | — | — | % | — | — | % | — | — | % | 16,304 | 44 | % | Greater than or equal to 1.0 and less than 1.2 | 3,124 | 56 | 56 | % | 8,825 | 38 | 38 | % | 3,125 | 25 | 25 | % | — | — | — | % | — | — | — | % | — | — | — | % | 15,074 | 39 | 39 | % | |||||||||||||||||||||||||||||||||||||||||||||
| Less than 1.0 | Less than 1.0 | — | — | % | 8,552 | 59 | % | — | — | % | — | — | % | — | — | % | — | — | % | 8,552 | 59 | % | Less than 1.0 | — | — | — | % | — | — | — | % | 7,975 | 35 | 35 | % | 5,629 | 41 | 41 | % | 34,000 | 31 | 31 | % | — | — | — | % | 47,604 | 33 | 33 | % | |||||||||||||||||||||||||||||||||||||||||||||
| Total | Total | $ | 165,764 | 54 | % | $ | 196,521 | 49 | % | $ | 19,714 | 45 | % | $ | 25,000 | 11 | % | $ | — | — | % | $ | — | — | % | $ | 406,999 | 48 | % | Total | $ | 196,347 | 51 | 51 | % | $ | 160,641 | 48 | 48 | % | $ | 169,346 | 37 | 37 | % | $ | 5,629 | 41 | 41 | % | $ | 34,000 | 31 | 31 | % | $ | — | — | — | % | $ | 565,963 | 45 | 45 | % | |||||||||||||||||||||||||||||||
| 2022 | 2021 | 2020 | 2019 | 2018 | Prior | Total | |||||||||||||||||||||||||||||||||||||||||||||||||||||||||||||||||||||||||||||||||||||||||||||||||||
| As of December 31, 2022: | (Dollars in thousands) | ||||||||||||||||||||||||||||||||||||||||||||||||||||||||||||||||||||||||||||||||||||||||||||||||||||||||
| 2023 | 2023 | 2022 | 2021 | 2020 | 2019 | Prior | Total | ||||||||||||||||||||||||||||||||||||||||||||||||||||||||||||||||||||||||||||||||||||||||||||||||||
| As of December 31, 2023: | As of December 31, 2023: | (Dollars in thousands) | |||||||||||||||||||||||||||||||||||||||||||||||||||||||||||||||||||||||||||||||||||||||||||||||||||||||
| Commercial mortgage loans | Commercial mortgage loans | ||||||||||||||||||||||||||||||||||||||||||||||||||||||||||||||||||||||||||||||||||||||||||||||||||||||||
| Current | |||||||||||||||||||||||||||||||||||||||||||||||||||||||||||||||||||||||||||||||||||||||||||||||||||||||||
| Current | |||||||||||||||||||||||||||||||||||||||||||||||||||||||||||||||||||||||||||||||||||||||||||||||||||||||||
| Current | Current | $ | 425,875 | $ | 592,468 | $ | 486,339 | $ | 591,076 | $ | 416,132 | $ | 1,042,668 | $ | 3,554,558 | ||||||||||||||||||||||||||||||||||||||||||||||||||||||||||||||||||||||||||||||||||||||||||
| 30 - 59 days past due | 30 - 59 days past due | — | — | — | — | — | — | — | |||||||||||||||||||||||||||||||||||||||||||||||||||||||||||||||||||||||||||||||||||||||||||||||||
| 60 - 89 days past due | 60 - 89 days past due | — | — | — | — | — | — | — | |||||||||||||||||||||||||||||||||||||||||||||||||||||||||||||||||||||||||||||||||||||||||||||||||
| Over 90 days past due | Over 90 days past due | — | — | — | — | — | — | — | |||||||||||||||||||||||||||||||||||||||||||||||||||||||||||||||||||||||||||||||||||||||||||||||||
| Total commercial mortgage loans | Total commercial mortgage loans | $ | 425,875 | $ | 592,468 | $ | 486,339 | $ | 591,076 | $ | 416,132 | $ | 1,042,668 | $ | 3,554,558 | ||||||||||||||||||||||||||||||||||||||||||||||||||||||||||||||||||||||||||||||||||||||||||
| Agricultural mortgage loans | Agricultural mortgage loans | ||||||||||||||||||||||||||||||||||||||||||||||||||||||||||||||||||||||||||||||||||||||||||||||||||||||||
| Agricultural mortgage loans | |||||||||||||||||||||||||||||||||||||||||||||||||||||||||||||||||||||||||||||||||||||||||||||||||||||||||
| Agricultural mortgage loans | |||||||||||||||||||||||||||||||||||||||||||||||||||||||||||||||||||||||||||||||||||||||||||||||||||||||||
| Current | |||||||||||||||||||||||||||||||||||||||||||||||||||||||||||||||||||||||||||||||||||||||||||||||||||||||||
| Current | |||||||||||||||||||||||||||||||||||||||||||||||||||||||||||||||||||||||||||||||||||||||||||||||||||||||||
| Current | Current | $ | 196,347 | $ | 160,641 | $ | 166,211 | $ | 5,629 | $ | 34,000 | $ | — | $ | 562,828 | ||||||||||||||||||||||||||||||||||||||||||||||||||||||||||||||||||||||||||||||||||||||||||
| 30 - 59 days past due | 30 - 59 days past due | — | — | — | — | — | — | — | |||||||||||||||||||||||||||||||||||||||||||||||||||||||||||||||||||||||||||||||||||||||||||||||||
| 60 - 89 days past due | 60 - 89 days past due | — | — | — | — | — | — | — | |||||||||||||||||||||||||||||||||||||||||||||||||||||||||||||||||||||||||||||||||||||||||||||||||
| Over 90 days past due | Over 90 days past due | — | — | 3,135 | — | — | — | 3,135 | |||||||||||||||||||||||||||||||||||||||||||||||||||||||||||||||||||||||||||||||||||||||||||||||||
| Total agricultural mortgage loans | Total agricultural mortgage loans | $ | 196,347 | $ | 160,641 | $ | 169,346 | $ | 5,629 | $ | 34,000 | $ | — | $ | 565,963 | ||||||||||||||||||||||||||||||||||||||||||||||||||||||||||||||||||||||||||||||||||||||||||
| Residential mortgage loans | Residential mortgage loans | ||||||||||||||||||||||||||||||||||||||||||||||||||||||||||||||||||||||||||||||||||||||||||||||||||||||||
| Residential mortgage loans | |||||||||||||||||||||||||||||||||||||||||||||||||||||||||||||||||||||||||||||||||||||||||||||||||||||||||
| Residential mortgage loans | |||||||||||||||||||||||||||||||||||||||||||||||||||||||||||||||||||||||||||||||||||||||||||||||||||||||||
| Current | |||||||||||||||||||||||||||||||||||||||||||||||||||||||||||||||||||||||||||||||||||||||||||||||||||||||||
| Current | |||||||||||||||||||||||||||||||||||||||||||||||||||||||||||||||||||||||||||||||||||||||||||||||||||||||||
| Current | Current | $ | 1,915,169 | $ | 595,363 | $ | 211,119 | $ | 27,483 | $ | 1,710 | $ | 417 | $ | 2,751,261 | ||||||||||||||||||||||||||||||||||||||||||||||||||||||||||||||||||||||||||||||||||||||||||
| 30 - 59 days past due | 30 - 59 days past due | 39,179 | 8,238 | 13,073 | 1,960 | — | — | 62,450 | |||||||||||||||||||||||||||||||||||||||||||||||||||||||||||||||||||||||||||||||||||||||||||||||||
| 60 - 89 days past due | 60 - 89 days past due | 6,668 | 7,165 | 3,034 | 57 | — | — | 16,924 | |||||||||||||||||||||||||||||||||||||||||||||||||||||||||||||||||||||||||||||||||||||||||||||||||
| Over 90 days past due | Over 90 days past due | 9,702 | 14,068 | 6,515 | 1,762 | 2,796 | — | 34,843 | |||||||||||||||||||||||||||||||||||||||||||||||||||||||||||||||||||||||||||||||||||||||||||||||||
| Total residential mortgage loans | Total residential mortgage loans | $ | 1,970,718 | $ | 624,834 | $ | 233,741 | $ | 31,262 | $ | 4,506 | $ | 417 | $ | 2,865,478 | ||||||||||||||||||||||||||||||||||||||||||||||||||||||||||||||||||||||||||||||||||||||||||
| 2022 | |||||||||||||||||||||||||||||||||||||||||||||||||||||||||||||||||||||||||||||||||||||||||||||||||||||||||
| 2021 | 2020 | 2019 | 2018 | 2017 | Prior | Total | |||||||||||||||||||||||||||||||||||||||||||||||||||||||||||||||||||||||||||||||||||||||||||||||||||
| As of December 31, 2021: | (Dollars in thousands) | ||||||||||||||||||||||||||||||||||||||||||||||||||||||||||||||||||||||||||||||||||||||||||||||||||||||||
| 2022 | |||||||||||||||||||||||||||||||||||||||||||||||||||||||||||||||||||||||||||||||||||||||||||||||||||||||||
| 2022 | 2021 | 2020 | 2019 | 2018 | Prior | Total | |||||||||||||||||||||||||||||||||||||||||||||||||||||||||||||||||||||||||||||||||||||||||||||||||||
| As of December 31, 2022: | As of December 31, 2022: | (Dollars in thousands) | |||||||||||||||||||||||||||||||||||||||||||||||||||||||||||||||||||||||||||||||||||||||||||||||||||||||
| Commercial mortgage loans | Commercial mortgage loans | ||||||||||||||||||||||||||||||||||||||||||||||||||||||||||||||||||||||||||||||||||||||||||||||||||||||||
| Current | |||||||||||||||||||||||||||||||||||||||||||||||||||||||||||||||||||||||||||||||||||||||||||||||||||||||||
| Current | |||||||||||||||||||||||||||||||||||||||||||||||||||||||||||||||||||||||||||||||||||||||||||||||||||||||||
| Current | Current | $ | 592,095 | $ | 534,839 | $ | 688,191 | $ | 459,451 | $ | 402,400 | $ | 951,526 | $ | 3,628,502 | ||||||||||||||||||||||||||||||||||||||||||||||||||||||||||||||||||||||||||||||||||||||||||
| 30 - 59 days past due | 30 - 59 days past due | — | — | — | — | — | — | — | |||||||||||||||||||||||||||||||||||||||||||||||||||||||||||||||||||||||||||||||||||||||||||||||||
| 60 - 89 days past due | 60 - 89 days past due | — | — | — | — | — | — | — | |||||||||||||||||||||||||||||||||||||||||||||||||||||||||||||||||||||||||||||||||||||||||||||||||
| Over 90 days past due | Over 90 days past due | — | — | — | — | — | — | — | |||||||||||||||||||||||||||||||||||||||||||||||||||||||||||||||||||||||||||||||||||||||||||||||||
| Total commercial mortgage loans | Total commercial mortgage loans | $ | 592,095 | $ | 534,839 | $ | 688,191 | $ | 459,451 | $ | 402,400 | $ | 951,526 | $ | 3,628,502 | ||||||||||||||||||||||||||||||||||||||||||||||||||||||||||||||||||||||||||||||||||||||||||
| Agricultural mortgage loans | Agricultural mortgage loans | ||||||||||||||||||||||||||||||||||||||||||||||||||||||||||||||||||||||||||||||||||||||||||||||||||||||||
| Agricultural mortgage loans | |||||||||||||||||||||||||||||||||||||||||||||||||||||||||||||||||||||||||||||||||||||||||||||||||||||||||
| Agricultural mortgage loans | |||||||||||||||||||||||||||||||||||||||||||||||||||||||||||||||||||||||||||||||||||||||||||||||||||||||||
| Current | |||||||||||||||||||||||||||||||||||||||||||||||||||||||||||||||||||||||||||||||||||||||||||||||||||||||||
| Current | |||||||||||||||||||||||||||||||||||||||||||||||||||||||||||||||||||||||||||||||||||||||||||||||||||||||||
| Current | Current | $ | 165,764 | $ | 196,521 | $ | 19,714 | $ | 25,000 | $ | — | $ | — | $ | 406,999 | ||||||||||||||||||||||||||||||||||||||||||||||||||||||||||||||||||||||||||||||||||||||||||
| 30 - 59 days past due | 30 - 59 days past due | — | — | — | — | — | — | — | |||||||||||||||||||||||||||||||||||||||||||||||||||||||||||||||||||||||||||||||||||||||||||||||||
| 60 - 89 days past due | 60 - 89 days past due | — | — | — | — | — | — | — | |||||||||||||||||||||||||||||||||||||||||||||||||||||||||||||||||||||||||||||||||||||||||||||||||
| Over 90 days past due | Over 90 days past due | — | — | — | — | — | — | — | |||||||||||||||||||||||||||||||||||||||||||||||||||||||||||||||||||||||||||||||||||||||||||||||||
| Total agricultural mortgage loans | Total agricultural mortgage loans | $ | 165,764 | $ | 196,521 | $ | 19,714 | $ | 25,000 | $ | — | $ | — | $ | 406,999 | ||||||||||||||||||||||||||||||||||||||||||||||||||||||||||||||||||||||||||||||||||||||||||
| Residential mortgage loans | Residential mortgage loans | ||||||||||||||||||||||||||||||||||||||||||||||||||||||||||||||||||||||||||||||||||||||||||||||||||||||||
| Residential mortgage loans | |||||||||||||||||||||||||||||||||||||||||||||||||||||||||||||||||||||||||||||||||||||||||||||||||||||||||
| Residential mortgage loans | |||||||||||||||||||||||||||||||||||||||||||||||||||||||||||||||||||||||||||||||||||||||||||||||||||||||||
| Current | |||||||||||||||||||||||||||||||||||||||||||||||||||||||||||||||||||||||||||||||||||||||||||||||||||||||||
| Current | |||||||||||||||||||||||||||||||||||||||||||||||||||||||||||||||||||||||||||||||||||||||||||||||||||||||||
| Current | Current | $ | 1,092,438 | $ | 454,532 | $ | 67,380 | $ | 16,898 | $ | 751 | $ | — | $ | 1,631,999 | ||||||||||||||||||||||||||||||||||||||||||||||||||||||||||||||||||||||||||||||||||||||||||
| 30 - 59 days past due | 30 - 59 days past due | 10,284 | 12,363 | 11,373 | 427 | — | — | 34,447 | |||||||||||||||||||||||||||||||||||||||||||||||||||||||||||||||||||||||||||||||||||||||||||||||||
| 60 - 89 days past due | 60 - 89 days past due | 1,838 | 1,090 | 102 | — | — | — | 3,030 | |||||||||||||||||||||||||||||||||||||||||||||||||||||||||||||||||||||||||||||||||||||||||||||||||
| Over 90 days past due | Over 90 days past due | 679 | 5,459 | 907 | — | — | — | 7,045 | |||||||||||||||||||||||||||||||||||||||||||||||||||||||||||||||||||||||||||||||||||||||||||||||||
| Total residential mortgage loans | Total residential mortgage loans | $ | 1,105,239 | $ | 473,444 | $ | 79,762 | $ | 17,325 | $ | 751 | $ | — | $ | 1,676,521 | ||||||||||||||||||||||||||||||||||||||||||||||||||||||||||||||||||||||||||||||||||||||||||
| December 31, | |||||||||||||||||||||||||||||||||||||||||||||||||||||||||||||||||||||
| 2022 | 2021 | ||||||||||||||||||||||||||||||||||||||||||||||||||||||||||||||||||||
| Total Assets | Total Liabilities | Total Assets | Total Liabilities | ||||||||||||||||||||||||||||||||||||||||||||||||||||||||||||||||||
| (Dollars in thousands) | |||||||||||||||||||||||||||||||||||||||||||||||||||||||||||||||||||||
| December 31, | December 31, | ||||||||||||||||||||||||||||||||||||||||||||||||||||||||||||||||||||
| 2023 | 2023 | 2022 | |||||||||||||||||||||||||||||||||||||||||||||||||||||||||||||||||||
| Total Assets | Total Assets | Total Liabilities | Total Assets | Total Liabilities | |||||||||||||||||||||||||||||||||||||||||||||||||||||||||||||||||
| (Dollars in thousands) | (Dollars in thousands) | ||||||||||||||||||||||||||||||||||||||||||||||||||||||||||||||||||||
| Real estate investments | Real estate investments | $ | 1,095,267 | $ | 78,244 | $ | 363,229 | $ | 20,168 | ||||||||||||||||||||||||||||||||||||||||||||||||||||||||||||
| Real estate limited liability companies | Real estate limited liability companies | 66,258 | 287 | — | — | ||||||||||||||||||||||||||||||||||||||||||||||||||||||||||||||||
| Limited partnership funds | Limited partnership funds | 620,741 | 113 | 168,711 | — | ||||||||||||||||||||||||||||||||||||||||||||||||||||||||||||||||
| $ | 1,782,266 | $ | 78,644 | $ | 531,940 | $ | 20,168 | ||||||||||||||||||||||||||||||||||||||||||||||||||||||||||||||
| Infrastructure limited liability companies | |||||||||||||||||||||||||||||||||||||||||||||||||||||||||||||||||||||
| $ | |||||||||||||||||||||||||||||||||||||||||||||||||||||||||||||||||||||
| December 31, | December 31, | ||||||||||||||||||||||||||||||||||||||||||||||||||||||||||||||||||||
| 2023 | 2023 | 2022 | |||||||||||||||||||||||||||||||||||||||||||||||||||||||||||||||||||
| Asset Carrying Value | Asset Carrying Value | Maximum Exposure to Loss | Asset Carrying Value | Maximum Exposure to Loss | |||||||||||||||||||||||||||||||||||||||||||||||||||||||||||||||||
| (Dollars in thousands) | (Dollars in thousands) | ||||||||||||||||||||||||||||||||||||||||||||||||||||||||||||||||||||
| Fixed maturity securities, available for sale | |||||||||||||||||||||||||||||||||||||||||||||||||||||||||||||||||||||
| December 31, | |||||||||||||||||||||||||||||||||||||||||||||||||||||||||||||||||||||
| 2022 | 2021 | ||||||||||||||||||||||||||||||||||||||||||||||||||||||||||||||||||||
| Asset Carrying Value | Maximum Exposure to Loss | Asset Carrying Value | Maximum Exposure to Loss | ||||||||||||||||||||||||||||||||||||||||||||||||||||||||||||||||||
| (Dollars in thousands) | |||||||||||||||||||||||||||||||||||||||||||||||||||||||||||||||||||||
| Fixed maturity securities, available for sale | $ | 1,178,110 | $ | 1,178,110 | $ | 459,681 | $ | 459,681 | |||||||||||||||||||||||||||||||||||||||||||||||||||||||||||||
| Other investments | — | — | 345,000 | 345,000 | |||||||||||||||||||||||||||||||||||||||||||||||||||||||||||||||||
| December 31, 2022 | December 31, 2021 | ||||||||||||||||||||||||||||||||||||||||||||||||||||||||||||||||||||
| Notional | Fair Value | Notional | Fair Value | ||||||||||||||||||||||||||||||||||||||||||||||||||||||||||||||||||
| (Dollars in thousands) | |||||||||||||||||||||||||||||||||||||||||||||||||||||||||||||||||||||
| December 31, 2023 | December 31, 2023 | December 31, 2022 | |||||||||||||||||||||||||||||||||||||||||||||||||||||||||||||||||||
| Notional | Notional | Fair Value | Notional | Fair Value | |||||||||||||||||||||||||||||||||||||||||||||||||||||||||||||||||
| (Dollars in thousands) | (Dollars in thousands) | ||||||||||||||||||||||||||||||||||||||||||||||||||||||||||||||||||||
| Derivatives designated as hedging instruments | Derivatives designated as hedging instruments | ||||||||||||||||||||||||||||||||||||||||||||||||||||||||||||||||||||
| Assets | Assets | ||||||||||||||||||||||||||||||||||||||||||||||||||||||||||||||||||||
| Assets | |||||||||||||||||||||||||||||||||||||||||||||||||||||||||||||||||||||
| Assets | |||||||||||||||||||||||||||||||||||||||||||||||||||||||||||||||||||||
| Derivative instruments | Derivative instruments | ||||||||||||||||||||||||||||||||||||||||||||||||||||||||||||||||||||
| Derivative instruments | |||||||||||||||||||||||||||||||||||||||||||||||||||||||||||||||||||||
| Derivative instruments | |||||||||||||||||||||||||||||||||||||||||||||||||||||||||||||||||||||
| Interest rate swaps | |||||||||||||||||||||||||||||||||||||||||||||||||||||||||||||||||||||
| Interest rate swaps | |||||||||||||||||||||||||||||||||||||||||||||||||||||||||||||||||||||
| Interest rate swaps | Interest rate swaps | $ | 408,369 | $ | 32,769 | $ | — | $ | — | ||||||||||||||||||||||||||||||||||||||||||||||||||||||||||||
| Derivatives not designated as hedging instruments | Derivatives not designated as hedging instruments | ||||||||||||||||||||||||||||||||||||||||||||||||||||||||||||||||||||
| Derivatives not designated as hedging instruments | |||||||||||||||||||||||||||||||||||||||||||||||||||||||||||||||||||||
| Derivatives not designated as hedging instruments | |||||||||||||||||||||||||||||||||||||||||||||||||||||||||||||||||||||
| Assets | |||||||||||||||||||||||||||||||||||||||||||||||||||||||||||||||||||||
| Assets | |||||||||||||||||||||||||||||||||||||||||||||||||||||||||||||||||||||
| Assets | Assets | ||||||||||||||||||||||||||||||||||||||||||||||||||||||||||||||||||||
| Derivative instruments | Derivative instruments | ||||||||||||||||||||||||||||||||||||||||||||||||||||||||||||||||||||
| Derivative instruments | |||||||||||||||||||||||||||||||||||||||||||||||||||||||||||||||||||||
| Derivative instruments | |||||||||||||||||||||||||||||||||||||||||||||||||||||||||||||||||||||
| Call options | |||||||||||||||||||||||||||||||||||||||||||||||||||||||||||||||||||||
| Call options | |||||||||||||||||||||||||||||||||||||||||||||||||||||||||||||||||||||
| Call options | Call options | $ | 38,927,534 | $ | 397,789 | $ | 40,091,353 | $ | 1,276,574 | ||||||||||||||||||||||||||||||||||||||||||||||||||||||||||||
| Warrants | Warrants | 2,020 | 1,169 | 2,020 | 906 | ||||||||||||||||||||||||||||||||||||||||||||||||||||||||||||||||
| $ | 38,929,554 | $ | 398,958 | $ | 40,093,373 | $ | 1,277,480 | ||||||||||||||||||||||||||||||||||||||||||||||||||||||||||||||
| $ | |||||||||||||||||||||||||||||||||||||||||||||||||||||||||||||||||||||
| $ | |||||||||||||||||||||||||||||||||||||||||||||||||||||||||||||||||||||
| $ | |||||||||||||||||||||||||||||||||||||||||||||||||||||||||||||||||||||
| Liabilities | Liabilities | ||||||||||||||||||||||||||||||||||||||||||||||||||||||||||||||||||||
| Policy benefit reserves - annuity products | Policy benefit reserves - annuity products | ||||||||||||||||||||||||||||||||||||||||||||||||||||||||||||||||||||
| Policy benefit reserves - annuity products | |||||||||||||||||||||||||||||||||||||||||||||||||||||||||||||||||||||
| Policy benefit reserves - annuity products | |||||||||||||||||||||||||||||||||||||||||||||||||||||||||||||||||||||
| Fixed index annuities - embedded derivatives, net | |||||||||||||||||||||||||||||||||||||||||||||||||||||||||||||||||||||
| Fixed index annuities - embedded derivatives, net | |||||||||||||||||||||||||||||||||||||||||||||||||||||||||||||||||||||
| Fixed index annuities - embedded derivatives, net | Fixed index annuities - embedded derivatives, net | $ | 4,820,845 | $ | 7,964,961 | ||||||||||||||||||||||||||||||||||||||||||||||||||||||||||||||||
| Funds withheld for reinsurance liabilities | Funds withheld for reinsurance liabilities | ||||||||||||||||||||||||||||||||||||||||||||||||||||||||||||||||||||
| Reinsurance related embedded derivative | Reinsurance related embedded derivative | (441,864) | (2,362) | ||||||||||||||||||||||||||||||||||||||||||||||||||||||||||||||||||
| $ | 4,378,981 | $ | 7,962,599 | ||||||||||||||||||||||||||||||||||||||||||||||||||||||||||||||||||
| Reinsurance related embedded derivative | |||||||||||||||||||||||||||||||||||||||||||||||||||||||||||||||||||||
| Reinsurance related embedded derivative | |||||||||||||||||||||||||||||||||||||||||||||||||||||||||||||||||||||
| $ | |||||||||||||||||||||||||||||||||||||||||||||||||||||||||||||||||||||
| Line Item in the Consolidated Balance Sheets in Which Hedged Item is Included | Line Item in the Consolidated Balance Sheets in Which Hedged Item is Included | Amortized Cost of Hedged Item | Cumulative Amount of Fair Value Basis Adjustment Gain (Loss) | Line Item in the Consolidated Balance Sheets in Which Hedged Item is Included | Amortized Cost of Hedged Item | Cumulative Amount of Fair Value Basis Adjustment Gain (Loss) | |||||||||||||||||||||||||||||||||||||||||||||||||||||||||||||||||
| December 31, 2022 | December 31, 2021 | December 31, 2022 | December 31, 2021 | ||||||||||||||||||||||||||||||||||||||||||||||||||||||||||||||||||||
| December 31, 2023 | December 31, 2023 | December 31, 2022 | December 31, 2023 | December 31, 2022 | |||||||||||||||||||||||||||||||||||||||||||||||||||||||||||||||||||
| (Dollars in thousands) | (Dollars in thousands) | (Dollars in thousands) | |||||||||||||||||||||||||||||||||||||||||||||||||||||||||||||||||||||
| Fixed maturities, available for sale: | Fixed maturities, available for sale: | ||||||||||||||||||||||||||||||||||||||||||||||||||||||||||||||||||||||
| Current hedging relationships | Current hedging relationships | $ | 389,060 | $ | — | $ | (39,128) | $ | — | ||||||||||||||||||||||||||||||||||||||||||||||||||||||||||||||
| Current hedging relationships | |||||||||||||||||||||||||||||||||||||||||||||||||||||||||||||||||||||||
| Current hedging relationships | |||||||||||||||||||||||||||||||||||||||||||||||||||||||||||||||||||||||
| Discontinued hedging relationships | Discontinued hedging relationships | 1,594,736 | — | (94,681) | — | ||||||||||||||||||||||||||||||||||||||||||||||||||||||||||||||||||
| Derivative | Derivative | Hedged Item | Net | Amount Excluded: Recognized in Income Immediately | ||||||||||||||||||||||||||||||||||||||||||||||||||||||||
| (Dollars in thousands) | (Dollars in thousands) | |||||||||||||||||||||||||||||||||||||||||||||||||||||||||||
| For the year ended December 31, 2023 | ||||||||||||||||||||||||||||||||||||||||||||||||||||||||||||
| Interest rate swaps | ||||||||||||||||||||||||||||||||||||||||||||||||||||||||||||
| Interest rate swaps | ||||||||||||||||||||||||||||||||||||||||||||||||||||||||||||
| Interest rate swaps | ||||||||||||||||||||||||||||||||||||||||||||||||||||||||||||
| Derivative | Hedged Item | Net | Amount Excluded: Recognized in Income Immediately | (Dollars in thousands) | ||||||||||||||||||||||||||||||||||||||||||||||||||||||||
| For the year ended December 31, 2022 | For the year ended December 31, 2022 | |||||||||||||||||||||||||||||||||||||||||||||||||||||||||||
| For the year ended December 31, 2022 | ||||||||||||||||||||||||||||||||||||||||||||||||||||||||||||
| For the year ended December 31, 2022 | ||||||||||||||||||||||||||||||||||||||||||||||||||||||||||||
| Interest rate swaps | ||||||||||||||||||||||||||||||||||||||||||||||||||||||||||||
| Interest rate swaps | ||||||||||||||||||||||||||||||||||||||||||||||||||||||||||||
| Interest rate swaps | Interest rate swaps | $ | 215,587 | $ | (249,168) | $ | (33,581) | $ | 13,957 | |||||||||||||||||||||||||||||||||||||||||||||||||||
| For the year ended December 31, 2021 | For the year ended December 31, 2021 | |||||||||||||||||||||||||||||||||||||||||||||||||||||||||||
| For the year ended December 31, 2021 | ||||||||||||||||||||||||||||||||||||||||||||||||||||||||||||
| For the year ended December 31, 2021 | ||||||||||||||||||||||||||||||||||||||||||||||||||||||||||||
| Interest rate swaps | Interest rate swaps | $ | — | $ | — | $ | — | $ | — | |||||||||||||||||||||||||||||||||||||||||||||||||||
| For the year ended December 31, 2020 | ||||||||||||||||||||||||||||||||||||||||||||||||||||||||||||
| Interest rate swaps | Interest rate swaps | $ | — | $ | — | $ | — | $ | — | |||||||||||||||||||||||||||||||||||||||||||||||||||
| Interest rate swaps | ||||||||||||||||||||||||||||||||||||||||||||||||||||||||||||
| Year Ended December 31, | |||||||||||||||||||||||||||||||||||||||||||||||||||
| 2022 | 2021 | 2020 | |||||||||||||||||||||||||||||||||||||||||||||||||
| (Dollars in thousands) | |||||||||||||||||||||||||||||||||||||||||||||||||||
| Year Ended December 31, | Year Ended December 31, | ||||||||||||||||||||||||||||||||||||||||||||||||||
| 2023 | 2023 | 2022 | 2020 | ||||||||||||||||||||||||||||||||||||||||||||||||
| (Dollars in thousands) | (Dollars in thousands) | ||||||||||||||||||||||||||||||||||||||||||||||||||
| Change in fair value of derivatives: | Change in fair value of derivatives: | ||||||||||||||||||||||||||||||||||||||||||||||||||
| Call options | |||||||||||||||||||||||||||||||||||||||||||||||||||
| Call options | |||||||||||||||||||||||||||||||||||||||||||||||||||
| Call options | Call options | $ | (1,118,768) | $ | 1,347,925 | $ | 34,604 | ||||||||||||||||||||||||||||||||||||||||||||
| Warrants | Warrants | 264 | 810 | — | |||||||||||||||||||||||||||||||||||||||||||||||
| Interest rate swaps | Interest rate swaps | 13,957 | — | — | |||||||||||||||||||||||||||||||||||||||||||||||
| Interest rate caps | — | — | 62 | ||||||||||||||||||||||||||||||||||||||||||||||||
| $ | (1,104,547) | $ | 1,348,735 | $ | 34,666 | ||||||||||||||||||||||||||||||||||||||||||||||
| $ | |||||||||||||||||||||||||||||||||||||||||||||||||||
| $ | |||||||||||||||||||||||||||||||||||||||||||||||||||
| $ | |||||||||||||||||||||||||||||||||||||||||||||||||||
| Change in fair value of embedded derivatives: | Change in fair value of embedded derivatives: | ||||||||||||||||||||||||||||||||||||||||||||||||||
| Fixed index annuities - embedded derivatives | Fixed index annuities - embedded derivatives | $ | (2,561,676) | $ | (876,803) | $ | (1,922,085) | ||||||||||||||||||||||||||||||||||||||||||||
| Other changes in difference between policy benefit reserves computed using derivative accounting vs. long-duration contracts accounting | 648,580 | 520,863 | 635,298 | ||||||||||||||||||||||||||||||||||||||||||||||||
| Fixed index annuities - embedded derivatives | |||||||||||||||||||||||||||||||||||||||||||||||||||
| Fixed index annuities - embedded derivatives | |||||||||||||||||||||||||||||||||||||||||||||||||||
| Reinsurance related embedded derivative | Reinsurance related embedded derivative | (439,502) | (2,362) | — | |||||||||||||||||||||||||||||||||||||||||||||||
| $ | (2,352,598) | $ | (358,302) | $ | (1,286,787) | ||||||||||||||||||||||||||||||||||||||||||||||
| Reinsurance related embedded derivative | |||||||||||||||||||||||||||||||||||||||||||||||||||
| Reinsurance related embedded derivative | |||||||||||||||||||||||||||||||||||||||||||||||||||
| $ | |||||||||||||||||||||||||||||||||||||||||||||||||||
| December 31, | ||||||||||||||||||||||||||||||||||||||||||||||||||||||||||||||||||||||||||||||||||||||||||||||||||||||||||||||||||||||||||||
| 2022 | 2021 | |||||||||||||||||||||||||||||||||||||||||||||||||||||||||||||||||||||||||||||||||||||||||||||||||||||||||||||||||||||||||||
| December 31, | December 31, | |||||||||||||||||||||||||||||||||||||||||||||||||||||||||||||||||||||||||||||||||||||||||||||||||||||||||||||||||||||||||||
| 2023 | 2023 | 2022 | ||||||||||||||||||||||||||||||||||||||||||||||||||||||||||||||||||||||||||||||||||||||||||||||||||||||||||||||||||||||||||
| Counterparty | Counterparty | Credit Rating (S&P) | Credit Rating (Moody's) | Notional Amount | Fair Value | Notional Amount | Fair Value | Counterparty | Credit Rating (S&P) | Credit Rating (Moody's) | Notional Amount | Fair Value | Notional Amount | Fair Value | ||||||||||||||||||||||||||||||||||||||||||||||||||||||||||||||||||||||||||||||||||||||||||||||||||||||||||||||
| (Dollars in thousands) | ||||||||||||||||||||||||||||||||||||||||||||||||||||||||||||||||||||||||||||||||||||||||||||||||||||||||||||||||||||||||||||
| (Dollars in thousands) | (Dollars in thousands) | |||||||||||||||||||||||||||||||||||||||||||||||||||||||||||||||||||||||||||||||||||||||||||||||||||||||||||||||||||||||||||
| Bank of America | Bank of America | A+ | Aa2 | $ | 3,574,125 | $ | 26,080 | $ | 3,556,256 | $ | 99,229 | |||||||||||||||||||||||||||||||||||||||||||||||||||||||||||||||||||||||||||||||||||||||||||||||||||||||||||||||||
| Barclays | Barclays | A | A1 | 3,686,896 | 39,657 | 4,213,658 | 157,865 | |||||||||||||||||||||||||||||||||||||||||||||||||||||||||||||||||||||||||||||||||||||||||||||||||||||||||||||||||||||
| Canadian Imperial Bank of Commerce | Canadian Imperial Bank of Commerce | A+ | Aa2 | 2,707,734 | 34,218 | 3,956,329 | 141,540 | |||||||||||||||||||||||||||||||||||||||||||||||||||||||||||||||||||||||||||||||||||||||||||||||||||||||||||||||||||||
| Citibank, N.A. | Citibank, N.A. | A+ | Aa3 | 3,748,162 | 29,873 | 3,190,833 | 115,860 | |||||||||||||||||||||||||||||||||||||||||||||||||||||||||||||||||||||||||||||||||||||||||||||||||||||||||||||||||||||
| Credit Suisse | Credit Suisse | A- | A3 | 2,086,470 | 20,691 | 3,716,868 | 113,295 | |||||||||||||||||||||||||||||||||||||||||||||||||||||||||||||||||||||||||||||||||||||||||||||||||||||||||||||||||||||
| Goldman Sachs | ||||||||||||||||||||||||||||||||||||||||||||||||||||||||||||||||||||||||||||||||||||||||||||||||||||||||||||||||||||||||||||
| J.P. Morgan | J.P. Morgan | A+ | Aa2 | 6,501,103 | 69,006 | 4,482,832 | 105,899 | |||||||||||||||||||||||||||||||||||||||||||||||||||||||||||||||||||||||||||||||||||||||||||||||||||||||||||||||||||||
| Mizuho | ||||||||||||||||||||||||||||||||||||||||||||||||||||||||||||||||||||||||||||||||||||||||||||||||||||||||||||||||||||||||||||
| Morgan Stanley | Morgan Stanley | A+ | Aa3 | 2,957,389 | 38,470 | 2,223,743 | 47,950 | |||||||||||||||||||||||||||||||||||||||||||||||||||||||||||||||||||||||||||||||||||||||||||||||||||||||||||||||||||||
| Royal Bank of Canada | Royal Bank of Canada | AA- | A2 | 4,378,132 | 58,026 | 3,567,972 | 100,472 | |||||||||||||||||||||||||||||||||||||||||||||||||||||||||||||||||||||||||||||||||||||||||||||||||||||||||||||||||||||
| Societe Generale | Societe Generale | A | A1 | 2,099,081 | 17,157 | 2,548,072 | 86,494 | |||||||||||||||||||||||||||||||||||||||||||||||||||||||||||||||||||||||||||||||||||||||||||||||||||||||||||||||||||||
| Truist | Truist | A | A2 | 1,960,787 | 32,885 | 2,547,808 | 94,924 | |||||||||||||||||||||||||||||||||||||||||||||||||||||||||||||||||||||||||||||||||||||||||||||||||||||||||||||||||||||
| UBS AG | ||||||||||||||||||||||||||||||||||||||||||||||||||||||||||||||||||||||||||||||||||||||||||||||||||||||||||||||||||||||||||||
| Wells Fargo | Wells Fargo | A+ | Aa2 | 5,436,824 | 61,840 | 5,820,381 | 206,403 | |||||||||||||||||||||||||||||||||||||||||||||||||||||||||||||||||||||||||||||||||||||||||||||||||||||||||||||||||||||
| Exchange traded | Exchange traded | 199,200 | 2,655 | 266,601 | 6,643 | |||||||||||||||||||||||||||||||||||||||||||||||||||||||||||||||||||||||||||||||||||||||||||||||||||||||||||||||||||||||
| $ | 39,335,903 | $ | 430,558 | $ | 40,091,353 | $ | 1,276,574 | |||||||||||||||||||||||||||||||||||||||||||||||||||||||||||||||||||||||||||||||||||||||||||||||||||||||||||||||||||||
| $ | ||||||||||||||||||||||||||||||||||||||||||||||||||||||||||||||||||||||||||||||||||||||||||||||||||||||||||||||||||||||||||||
| December 31, 2023 | |||||||||||||||||||||||
| Fixed Index Annuities | Fixed Rate Annuities | Single Premium Immediate Annuities | Total | ||||||||||||||||||||
| (Dollars in thousands) | |||||||||||||||||||||||
| Balance, beginning of year | $ | 2,649,322 | $ | 120,105 | $ | 4,216 | $ | 2,773,643 | |||||||||||||||
| Capitalizations | 557,749 | 18,536 | 52 | 576,337 | |||||||||||||||||||
| Amortization expense | (249,607) | (29,454) | (639) | (279,700) | |||||||||||||||||||
| Balance, end of year | $ | 2,957,464 | $ | 109,187 | $ | 3,629 | $ | 3,070,280 | |||||||||||||||
| December 31, 2022 | |||||||||||||||||||||||
| Fixed Index Annuities | Fixed Rate Annuities | Single Premium Immediate Annuities | Total | ||||||||||||||||||||
| (Dollars in thousands) | |||||||||||||||||||||||
| Balance, beginning of year | $ | 2,906,684 | $ | 151,322 | $ | 4,198 | $ | 3,062,204 | |||||||||||||||
| Write-off related to in-force ceded reinsurance | (196,417) | (7,209) | — | (203,626) | |||||||||||||||||||
| Capitalizations | 193,989 | 4,424 | 663 | 199,076 | |||||||||||||||||||
| Amortization expense | (254,934) | (28,432) | (645) | (284,011) | |||||||||||||||||||
| Balance, end of year | $ | 2,649,322 | $ | 120,105 | $ | 4,216 | $ | 2,773,643 | |||||||||||||||
| December 31, 2023 | |||||||||||||||||
| Fixed Index Annuities | Fixed Rate Annuities | Total | |||||||||||||||
| (Dollars in thousands) | |||||||||||||||||
| Balance, beginning of year | $ | 2,017,960 | $ | 27,723 | $ | 2,045,683 | |||||||||||
| Capitalizations | 513,726 | 67 | 513,793 | ||||||||||||||
| Amortization expense | (189,200) | (3,052) | (192,252) | ||||||||||||||
| Balance, end of year | $ | 2,342,486 | $ | 24,738 | $ | 2,367,224 | |||||||||||
| December 31, 2022 | |||||||||||||||||
| Fixed Index Annuities | Fixed Rate Annuities | Total | |||||||||||||||
| (Dollars in thousands) | |||||||||||||||||
| Balance, beginning of year | $ | 2,088,591 | $ | 31,371 | $ | 2,119,962 | |||||||||||
| Capitalizations | 107,684 | 7 | 107,691 | ||||||||||||||
| Amortization expense | (178,315) | (3,655) | (181,970) | ||||||||||||||
| Balance, end of year | $ | 2,017,960 | $ | 27,723 | $ | 2,045,683 | |||||||||||
| December 31, | |||||||||||||||||
| 2022 | 2021 | 2020 | |||||||||||||||
| (Dollars in thousands) | |||||||||||||||||
| Balance at beginning of year | $ | 2,222,769 | $ | 2,225,199 | $ | 3,033,649 | |||||||||||
| Costs deferred during the year: | |||||||||||||||||
| Commissions | 194,856 | 303,192 | 251,428 | ||||||||||||||
| Policy issue costs | 3,767 | 4,665 | 3,725 | ||||||||||||||
| Amortization: | |||||||||||||||||
| Amortization | (558,447) | (313,990) | (2,769) | ||||||||||||||
| Impact of unlocking | (56,853) | 45,662 | (646,785) | ||||||||||||||
| Effect of net unrealized gains/losses | 1,944,039 | 299,478 | (414,049) | ||||||||||||||
| Write-off related to in-force ceded reinsurance | (188,056) | (341,437) | — | ||||||||||||||
| Balance at end of year | $ | 3,562,075 | $ | 2,222,769 | $ | 2,225,199 | |||||||||||
| Present Value of Expected Future Policy Benefits | |||||||||||||||||
| December 31, | |||||||||||||||||
| 2023 | 2022 | ||||||||||||||||
| (Dollars in thousands) | |||||||||||||||||
| Balance, beginning of year | $ | 318,677 | $ | 402,305 | |||||||||||||
| Beginning balance at original discount rate | 342,453 | 352,708 | |||||||||||||||
| Effect of changes in cash flow assumptions | (4,607) | 1,277 | |||||||||||||||
| Effect of actual variances from expected experience | (1,887) | (1,941) | |||||||||||||||
| Adjusted beginning of year balance | 335,959 | 352,044 | |||||||||||||||
| Issuances | 6,945 | 16,072 | |||||||||||||||
| Interest accrual | 13,710 | 14,664 | |||||||||||||||
| Derecognition (lapses and benefit payments) | (38,980) | (40,327) | |||||||||||||||
| Ending balance at original discount rate | 317,634 | 342,453 | |||||||||||||||
| Effect of changes in discount rate assumptions | (14,434) | (23,776) | |||||||||||||||
| Balance, end of year | $ | 303,200 | $ | 318,677 | |||||||||||||
| December 31, | |||||||||||||||||
| 2022 | 2021 | 2020 | |||||||||||||||
| (Dollars in thousands) | |||||||||||||||||
| Balance at beginning of year | $ | 1,546,073 | $ | 1,448,375 | $ | 2,042,060 | |||||||||||
| Costs deferred during the year | 107,691 | 95,160 | 93,610 | ||||||||||||||
| Amortization: | |||||||||||||||||
| Amortization | (362,866) | (197,799) | (10,063) | ||||||||||||||
| Impact of unlocking | (45,682) | 45,107 | (428,101) | ||||||||||||||
| Effect of net unrealized gains/losses | 1,348,134 | 155,230 | (249,131) | ||||||||||||||
| Balance at end of year | $ | 2,593,350 | $ | 1,546,073 | $ | 1,448,375 | |||||||||||
| December 31, | |||||||||||
| 2023 | 2022 | ||||||||||
| (Dollars in thousands) | |||||||||||
| Liability for future policy benefits | $ | 303,200 | $ | 318,677 | |||||||
| Deferred profit liability | 22,455 | 19,223 | |||||||||
| Liability for future policy benefits included in policy benefit reserves | 325,655 | 337,900 | |||||||||
| Less: Reinsurance recoverable | (2,496) | (1,259) | |||||||||
| Net liability for future policy benefits, after reinsurance recoverable | $ | 323,159 | $ | 336,641 | |||||||
| December 31, | |||||||||||
| 2023 | 2022 | ||||||||||
| SPIA With Life Contingency: | |||||||||||
| Weighted-average liability duration of the liability for future policy benefits (years) | 6.56 | 6.78 | |||||||||
| December 31, | |||||||||||||||||
| 2022 | 2021 | 2020 | |||||||||||||||
| (Dollars in thousands) | |||||||||||||||||
| Balance at beginning of year | $ | 2,794,629 | $ | 2,485,123 | $ | 1,670,750 | |||||||||||
| Benefit expense accrual | 387,821 | 206,180 | 311,211 | ||||||||||||||
| Impact of unlocking | (53,042) | 243,658 | 285,825 | ||||||||||||||
| Effect of net unrealized gains/losses | (996,876) | (101,848) | 217,337 | ||||||||||||||
| Reduction related to in-force ceded reinsurance | (403,406) | (38,484) | — | ||||||||||||||
| Claim payments | — | — | — | ||||||||||||||
| Balance at end of year | $ | 1,729,126 | $ | 2,794,629 | $ | 2,485,123 | |||||||||||
| December 31, | |||||||||||
| 2023 | 2022 | ||||||||||
| (Dollars in thousands) | |||||||||||
| SPIA With Life Contingency: | |||||||||||
| Expected future benefit payments | $ | 447,669 | $ | 467,627 | |||||||
| Expected future gross premiums | — | — | |||||||||
| December 31, 2023 | December 31, 2022 | ||||||||||||||||||||||
| Gross Premiums or Assessments | Interest Expense | Gross Premiums or Assessments | Interest Expense | ||||||||||||||||||||
| (Dollars in thousands) | |||||||||||||||||||||||
| SPIA With Life Contingency | $ | 7,608 | $ | 13,626 | $ | 16,994 | $ | 14,613 | |||||||||||||||
| Total | $ | 7,608 | $ | 13,626 | $ | 16,994 | $ | 14,613 | |||||||||||||||
| December 31, | |||||||||||
| 2023 | 2022 | ||||||||||
| Interest accretion rate | 4.26 | % | 4.25 | % | |||||||
| Current discount rate | 5.00 | % | 5.37 | % | |||||||
| December 31, 2023 | December 31, 2022 | ||||||||||||||||||||||
| Fixed Rate Annuities | Fixed Index Annuities | Fixed Rate Annuities | Fixed Index Annuities | ||||||||||||||||||||
| (Dollars in thousands) | |||||||||||||||||||||||
| Balance, beginning of year | $ | 37,863 | $ | 2,187,758 | $ | 78,411 | $ | 2,557,378 | |||||||||||||||
| Balance, beginning of year, before effect of changes in the instrument-specific credit risk | 44,355 | 2,453,169 | 77,731 | 2,310,437 | |||||||||||||||||||
| Issuances | 32 | 289,939 | 376 | 59,452 | |||||||||||||||||||
| Interest accrual | 3,139 | 155,512 | 1,349 | 72,551 | |||||||||||||||||||
| Attributed fees collected | 1,216 | 128,437 | 1,270 | 125,168 | |||||||||||||||||||
| Benefits payments | — | — | — | — | |||||||||||||||||||
| Effect of changes in interest rates | (380) | (126,255) | (19,421) | (952,265) | |||||||||||||||||||
| Effect of changes in equity markets | — | (48,164) | — | 186,618 | |||||||||||||||||||
| Effect of changes in equity index volatility | — | (77,023) | — | 241,563 | |||||||||||||||||||
| Effect of changes in future expected policyholder behavior | (1,509) | (11,582) | 602 | 46,567 | |||||||||||||||||||
| Effect of changes in other future expected assumptions | 16,720 | (219,094) | (17,552) | 363,078 | |||||||||||||||||||
| Balance, end of year, before effect of changes in the instrument-specific credit | 63,573 | 2,544,939 | 44,355 | 2,453,169 | |||||||||||||||||||
| Effect of changes in the instrument-specific credit risk | (3,386) | 61,734 | (6,492) | (265,411) | |||||||||||||||||||
| Balance, end of year | 60,187 | 2,606,673 | 37,863 | 2,187,758 | |||||||||||||||||||
| Reinsured MRB, end of period | 18,391 | 640,826 | 10,656 | 593,959 | |||||||||||||||||||
| Balance, end of period, net of reinsurance | $ | 41,796 | $ | 1,965,847 | $ | 27,207 | $ | 1,593,799 | |||||||||||||||
| Net amount at risk (a) | $ | 266,438 | $ | 11,721,734 | $ | 258,826 | $ | 10,987,198 | |||||||||||||||
| Weighted average attained age of contract holders (years) | 70 | 71 | 69 | 71 | |||||||||||||||||||
| December 31, 2023 | |||||||||||||||||
| Asset | Liability | Net Liability | |||||||||||||||
| (Dollars in thousands) | |||||||||||||||||
| Fixed Index Annuities | $ | 477,306 | $ | 3,083,979 | $ | 2,606,673 | |||||||||||
| Fixed Rate Annuities | 2,388 | 62,575 | 60,187 | ||||||||||||||
| Total | $ | 479,694 | $ | 3,146,554 | $ | 2,666,860 | |||||||||||
| December 31, 2022 | |||||||||||||||||
| Asset | Liability | Net Liability | |||||||||||||||
| (Dollars in thousands) | |||||||||||||||||
| Fixed Index Annuities | $ | 226,294 | $ | 2,414,052 | $ | 2,187,758 | |||||||||||
| Fixed Rate Annuities | 3,577 | 41,440 | 37,863 | ||||||||||||||
| Total | $ | 229,871 | $ | 2,455,492 | $ | 2,225,621 | |||||||||||
| December 31, 2023 | December 31, 2022 | ||||||||||||||||||||||
| Fixed Rate Annuities | Fixed Index Annuities | Fixed Rate Annuities | Fixed Index Annuities | ||||||||||||||||||||
| (Dollars in thousands) | |||||||||||||||||||||||
| Balance, beginning of year | $ | 10,656 | $ | 593,959 | $ | — | $ | 156,931 | |||||||||||||||
| Write-off related to in-force ceded reinsurance | — | — | 10,091 | 334,835 | |||||||||||||||||||
| Issuances | — | 146,898 | — | 36,036 | |||||||||||||||||||
| Interest accrual | 775 | 33,503 | 104 | 7,598 | |||||||||||||||||||
| Attributed fees collected | 67 | 32,036 | 28 | 23,745 | |||||||||||||||||||
| Benefits payments | — | — | — | — | |||||||||||||||||||
| Effect of changes in interest rates | 1,407 | 14,700 | 135 | (171,948) | |||||||||||||||||||
| Effect of changes in equity markets | — | (22,775) | 118 | 43,799 | |||||||||||||||||||
| Effect of changes in equity index volatility | — | (18,656) | — | 34,278 | |||||||||||||||||||
| Effect of changes in future expected policyholder behavior | (128) | 5,855 | 180 | 12,598 | |||||||||||||||||||
| Effect of changes in other future expected assumptions | 5,614 | (144,694) | — | 116,087 | |||||||||||||||||||
| Balance, end of year | $ | 18,391 | $ | 640,826 | $ | 10,656 | $ | 593,959 | |||||||||||||||
| Net amount at risk (a) | $ | 75,281 | $ | 2,853,318 | $ | 72,350 | $ | 2,402,964 | |||||||||||||||
| Weighted average attained age of contract holders (years) | 70 | 70 | 70 | 71 | |||||||||||||||||||
| December 31, 2023 | |||||||||||||||||
| Asset | Liability | Net Asset | |||||||||||||||
| (Dollars in thousands) | |||||||||||||||||
| Fixed Index Annuities | $ | 820,006 | $ | 179,180 | $ | 640,826 | |||||||||||
| Fixed Rate Annuities | 18,628 | 237 | 18,391 | ||||||||||||||
| Total | $ | 838,634 | $ | 179,417 | $ | 659,217 | |||||||||||
| December 31, 2022 | |||||||||||||||||
| Asset | Liability | Net Asset | |||||||||||||||
| (Dollars in thousands) | |||||||||||||||||
| Fixed Index Annuities | $ | 629,611 | $ | 35,652 | $ | 593,959 | |||||||||||
| Fixed Rate Annuities | 11,070 | 414 | 10,656 | ||||||||||||||
| Total | $ | 640,681 | $ | 36,066 | $ | 604,615 | |||||||||||
| December 31, 2023 | |||||||||||||||||||||||||||||
| Fair Value | Valuation Technique | Significant Inputs and Assumptions | Range | Weighted Average | |||||||||||||||||||||||||
| (in thousands) | |||||||||||||||||||||||||||||
| Market risk benefits | $ | 2,666,860 | Discounted cash flow | Utilization (a) | 0.04% - 47.37% | 6.55% | |||||||||||||||||||||||
| Ceded market risk benefits | 659,217 | Option budget (b) | 1.85% - 2.75% | 2.29% | |||||||||||||||||||||||||
| Risk-free interest rate (c) | 2.98% - 4.76% | 3.35% | |||||||||||||||||||||||||||
| Nonperformance risk (d) | 0.53% - 2.66% | 1.98% | |||||||||||||||||||||||||||
| Mortality (e) | 0.01% - 46.00% | 3.97% | |||||||||||||||||||||||||||
| Lapse (f) | 0.25% - 40.00% | 3.70% | |||||||||||||||||||||||||||
| December 31, 2022 | |||||||||||||||||||||||||||||
| Fair Value | Valuation Technique | Significant Inputs and Assumptions | Range | Weighted Average | |||||||||||||||||||||||||
| (in thousands) | |||||||||||||||||||||||||||||
| Market risk benefits | $ | 2,225,621 | Discounted cash flow | Utilization (a) | 0.04% - 78.75% | 4.24% | |||||||||||||||||||||||
| Ceded market risk benefits | 604,615 | Option budget (b) | 1.65% - 2.50% | 2.31% | |||||||||||||||||||||||||
| Risk-free interest rate (c) | 2.51% - 4.90% | 3.31% | |||||||||||||||||||||||||||
| Nonperformance risk (d) | 0.06% - 3.27% | 2.59% | |||||||||||||||||||||||||||
| Mortality (e) | 0.01% - 44.00% | 3.44% | |||||||||||||||||||||||||||
| Lapse (f) | 0.25% - 40.00% | 3.65% | |||||||||||||||||||||||||||
| December 31, 2023 | December 31, 2022 | ||||||||||||||||||||||
| Fixed Rate Annuities | Fixed Index Annuities | Fixed Rate Annuities | Fixed Index Annuities | ||||||||||||||||||||
| (Dollars in thousands) | |||||||||||||||||||||||
| Balance, beginning of year | $ | 6,589,577 | $ | 53,826,234 | $ | 6,860,060 | $ | 55,003,305 | |||||||||||||||
| Issuances | 840,022 | 7,555,709 | 159,570 | 3,001,738 | |||||||||||||||||||
| Premiums received | 12,472 | 152,532 | 4,811 | 170,493 | |||||||||||||||||||
| Policy charges | (3,428) | (217,523) | (6,587) | (272,604) | |||||||||||||||||||
| Surrenders and withdrawals | (1,668,966) | (6,122,084) | (574,590) | (3,945,504) | |||||||||||||||||||
| Benefit payments | (13,085) | (836,507) | (11,328) | (727,847) | |||||||||||||||||||
| Interest credited | 163,918 | 1,096,493 | 151,762 | 599,259 | |||||||||||||||||||
| Other | (6,545) | (882) | 5,879 | (2,606) | |||||||||||||||||||
| Balance, end of year | $ | 5,913,965 | $ | 55,453,972 | $ | 6,589,577 | $ | 53,826,234 | |||||||||||||||
| Weighted-average crediting rate | 2.66 | % | 2.03 | % | 2.28 | % | 1.11 | % | |||||||||||||||
| Net amount at risk (a) | $ | 266,438 | $ | 11,721,734 | $ | 258,826 | $ | 10,987,198 | |||||||||||||||
| Cash surrender value | 5,571,171 | 50,983,033 | 6,208,597 | 49,551,657 | |||||||||||||||||||
| December 31, 2023 | December 31, 2022 | ||||||||||
| (Dollars in thousands) | |||||||||||
| Fixed index annuities policyholder account balances | $ | 55,453,972 | $ | 53,826,234 | |||||||
| Fixed rate annuities policyholder account balances | 5,913,965 | 6,589,577 | |||||||||
| Embedded derivative adjustment (b) | (818,754) | (1,996,640) | |||||||||
| Liability for future policy benefits | 303,200 | 318,677 | |||||||||
| Deferred profit liability | 22,455 | 19,223 | |||||||||
| Other | 26,803 | 24,765 | |||||||||
| Total | $ | 60,901,641 | $ | 58,781,836 | |||||||
| December 31, 2023 | |||||||||||||||||||||||||||||||||||
| Range of guaranteed minimum crediting rate | At guaranteed minimum | 1 to 50 | 51 to 150 | Greater than 150 basis points above | Total | ||||||||||||||||||||||||||||||
| (Dollars in thousands) | |||||||||||||||||||||||||||||||||||
| Fixed Index Annuities | 0.00% - 0.50% | $ | — | $ | 1,032,438 | $ | 466,789 | $ | 1,012,155 | $ | 2,511,382 | ||||||||||||||||||||||||
| 0.50% - 1.00% | 2,276,625 | 1,008,139 | 1,995,206 | 131,412 | 5,411,382 | ||||||||||||||||||||||||||||||
| 1.00% - 1.50% | 43,029 | 8,190 | — | — | 51,219 | ||||||||||||||||||||||||||||||
| 1.50% - 2.00% | 50 | — | — | — | 50 | ||||||||||||||||||||||||||||||
| 2.00% - 2.50% | 121,921 | 68,698 | 8 | — | 190,627 | ||||||||||||||||||||||||||||||
| 2.50% - 3.00% | 759,353 | — | — | — | 759,353 | ||||||||||||||||||||||||||||||
| Greater than 3.00% | — | — | — | — | — | ||||||||||||||||||||||||||||||
| Allocated to index strategies | 46,529,959 | ||||||||||||||||||||||||||||||||||
| Total | $ | 3,200,978 | $ | 2,117,465 | $ | 2,462,003 | $ | 1,143,567 | $ | 55,453,972 | |||||||||||||||||||||||||
| Fixed Rate Annuities | 0.00% - 0.50% | $ | 53 | $ | — | $ | — | $ | — | $ | 53 | ||||||||||||||||||||||||
| 0.50% - 1.00% | 51,581 | 172,470 | 2,813,380 | 1,417,915 | 4,455,346 | ||||||||||||||||||||||||||||||
| 1.00% - 1.50% | 430,052 | 237 | — | — | 430,289 | ||||||||||||||||||||||||||||||
| 1.50% - 2.00% | 352,184 | 29,378 | 224,846 | 217 | 606,625 | ||||||||||||||||||||||||||||||
| 2.00% - 2.50% | 18,714 | 23 | — | — | 18,737 | ||||||||||||||||||||||||||||||
| 2.50% - 3.00% | 349,890 | 6,783 | — | — | 356,673 | ||||||||||||||||||||||||||||||
| Greater than 3.00% | 46,242 | — | — | — | 46,242 | ||||||||||||||||||||||||||||||
| Total | $ | 1,248,716 | $ | 208,891 | $ | 3,038,226 | $ | 1,418,132 | $ | 5,913,965 | |||||||||||||||||||||||||
| December 31, 2022 | |||||||||||||||||||||||||||||||||||
| Range of guaranteed minimum crediting rate | At guaranteed minimum | 1 to 50 | 51 to 150 | Greater than 150 basis points above | Total | ||||||||||||||||||||||||||||||
| (Dollars in thousands) | |||||||||||||||||||||||||||||||||||
| Fixed Index Annuities | 0.00% - 0.50% | $ | — | $ | 462,356 | $ | 407,426 | $ | 314,929 | $ | 1,184,711 | ||||||||||||||||||||||||
| 0.50% - 1.00% | 2,421,795 | 1,098,332 | 2,258,992 | 77,901 | 5,857,020 | ||||||||||||||||||||||||||||||
| 1.00% - 1.50% | 51,586 | 9,391 | — | — | 60,977 | ||||||||||||||||||||||||||||||
| 1.50% - 2.00% | 57 | — | — | — | 57 | ||||||||||||||||||||||||||||||
| 2.00% - 2.50% | 133,059 | 100,205 | 8 | — | 233,272 | ||||||||||||||||||||||||||||||
| 2.50% - 3.00% | 939,684 | — | — | — | 939,684 | ||||||||||||||||||||||||||||||
| Greater than 3.00% | — | — | — | — | — | ||||||||||||||||||||||||||||||
| Allocated to index strategies | 45,550,513 | ||||||||||||||||||||||||||||||||||
| Total | $ | 3,546,181 | $ | 1,670,284 | $ | 2,666,426 | $ | 392,830 | $ | 53,826,234 | |||||||||||||||||||||||||
| Fixed Rate Annuities | 0.00% - 0.50% | $ | 61 | $ | — | $ | — | $ | — | $ | 61 | ||||||||||||||||||||||||
| 0.50% - 1.00% | 55,458 | 203,523 | 4,000,203 | 701,836 | 4,961,020 | ||||||||||||||||||||||||||||||
| 1.00% - 1.50% | 454,728 | 231 | — | — | 454,959 | ||||||||||||||||||||||||||||||
| 1.50% - 2.00% | 281,694 | 96,767 | 277,053 | 189 | 655,703 | ||||||||||||||||||||||||||||||
| 2.00% - 2.50% | 21,887 | 22 | — | — | 21,909 | ||||||||||||||||||||||||||||||
| 2.50% - 3.00% | 434,042 | 7,417 | — | — | 441,459 | ||||||||||||||||||||||||||||||
| Greater than 3.00% | 54,466 | — | — | — | 54,466 | ||||||||||||||||||||||||||||||
| Total | $ | 1,302,336 | $ | 307,960 | $ | 4,277,256 | $ | 702,025 | $ | 6,589,577 | |||||||||||||||||||||||||
| Year Ended December 31, | |||||||||||||||||||||||||||||||||||||||||||||||||||
| 2022 | 2021 | 2020 | |||||||||||||||||||||||||||||||||||||||||||||||||
| (Dollars in thousands) | |||||||||||||||||||||||||||||||||||||||||||||||||||
| Year Ended December 31, | Year Ended December 31, | ||||||||||||||||||||||||||||||||||||||||||||||||||
| 2023 | 2023 | 2022 | 2021 | ||||||||||||||||||||||||||||||||||||||||||||||||
| (Dollars in thousands) | (Dollars in thousands) | ||||||||||||||||||||||||||||||||||||||||||||||||||
| Consolidated Statements of Operations | Consolidated Statements of Operations | ||||||||||||||||||||||||||||||||||||||||||||||||||
| Annuity product charges | Annuity product charges | $ | 49,093 | $ | 20,351 | $ | 7,021 | ||||||||||||||||||||||||||||||||||||||||||||
| Annuity product charges | |||||||||||||||||||||||||||||||||||||||||||||||||||
| Annuity product charges | |||||||||||||||||||||||||||||||||||||||||||||||||||
| Change in fair value of derivatives | Change in fair value of derivatives | (184,388) | 140,641 | 43,080 | |||||||||||||||||||||||||||||||||||||||||||||||
| $ | (135,295) | $ | 160,992 | $ | 50,101 | ||||||||||||||||||||||||||||||||||||||||||||||
| $ | |||||||||||||||||||||||||||||||||||||||||||||||||||
| Interest sensitive and index product benefits | Interest sensitive and index product benefits | $ | 103,542 | $ | 303,035 | $ | 152,485 | ||||||||||||||||||||||||||||||||||||||||||||
| Interest sensitive and index product benefits | |||||||||||||||||||||||||||||||||||||||||||||||||||
| Interest sensitive and index product benefits | |||||||||||||||||||||||||||||||||||||||||||||||||||
| Market risk benefits (gains) losses | |||||||||||||||||||||||||||||||||||||||||||||||||||
| Change in fair value of embedded derivatives | Change in fair value of embedded derivatives | 81,907 | (76,915) | 4,352 | |||||||||||||||||||||||||||||||||||||||||||||||
| Other operating costs and expenses | Other operating costs and expenses | 18,318 | 16,440 | 17,663 | |||||||||||||||||||||||||||||||||||||||||||||||
| $ | 203,767 | $ | 242,560 | $ | 174,500 | ||||||||||||||||||||||||||||||||||||||||||||||
| $ | |||||||||||||||||||||||||||||||||||||||||||||||||||
| Consolidated Statements of Cash Flows | Consolidated Statements of Cash Flows | ||||||||||||||||||||||||||||||||||||||||||||||||||
| Annuity deposits | Annuity deposits | $ | (982,176) | $ | (424,819) | $ | (35,667) | ||||||||||||||||||||||||||||||||||||||||||||
| Annuity deposits | |||||||||||||||||||||||||||||||||||||||||||||||||||
| Annuity deposits | |||||||||||||||||||||||||||||||||||||||||||||||||||
| Cash payments to policyholders | Cash payments to policyholders | 1,029,667 | 984,260 | 466,311 | |||||||||||||||||||||||||||||||||||||||||||||||
| $ | 47,491 | $ | 559,441 | $ | 430,644 | ||||||||||||||||||||||||||||||||||||||||||||||
| $ | |||||||||||||||||||||||||||||||||||||||||||||||||||
| Year Ended December 31, | |||||||||||||||||||||||||||||||||||||||||||||||||||
| 2022 | 2021 | 2020 | |||||||||||||||||||||||||||||||||||||||||||||||||
| (Dollars in thousands) | |||||||||||||||||||||||||||||||||||||||||||||||||||
| Year Ended December 31, | Year Ended December 31, | ||||||||||||||||||||||||||||||||||||||||||||||||||
| 2023 | 2023 | 2022 | 2021 | ||||||||||||||||||||||||||||||||||||||||||||||||
| (Dollars in thousands) | (Dollars in thousands) | ||||||||||||||||||||||||||||||||||||||||||||||||||
| Consolidated statements of operations: | Consolidated statements of operations: | ||||||||||||||||||||||||||||||||||||||||||||||||||
| Current income taxes | |||||||||||||||||||||||||||||||||||||||||||||||||||
| Current income taxes | |||||||||||||||||||||||||||||||||||||||||||||||||||
| Current income taxes | Current income taxes | $ | 20,209 | $ | 332 | $ | 3,430 | ||||||||||||||||||||||||||||||||||||||||||||
| Deferred income taxes | Deferred income taxes | 304,946 | 128,423 | 141,071 | |||||||||||||||||||||||||||||||||||||||||||||||
| Total income tax expense included in consolidated statements of operations | Total income tax expense included in consolidated statements of operations | 325,155 | 128,755 | 144,501 | |||||||||||||||||||||||||||||||||||||||||||||||
| Stockholders' equity: | Stockholders' equity: | ||||||||||||||||||||||||||||||||||||||||||||||||||
| Expense (benefit) relating to: | Expense (benefit) relating to: | ||||||||||||||||||||||||||||||||||||||||||||||||||
| Adoption of expected credit loss model | — | — | (2,543) | ||||||||||||||||||||||||||||||||||||||||||||||||
| Change in net unrealized investment losses | (1,067,791) | (90,284) | 225,746 | ||||||||||||||||||||||||||||||||||||||||||||||||
| Expense (benefit) relating to: | |||||||||||||||||||||||||||||||||||||||||||||||||||
| Expense (benefit) relating to: | |||||||||||||||||||||||||||||||||||||||||||||||||||
| Changes in other comprehensive income | |||||||||||||||||||||||||||||||||||||||||||||||||||
| Changes in other comprehensive income | |||||||||||||||||||||||||||||||||||||||||||||||||||
| Changes in other comprehensive income | |||||||||||||||||||||||||||||||||||||||||||||||||||
| Total income tax expense included in consolidated financial statements | Total income tax expense included in consolidated financial statements | $ | (742,636) | $ | 38,471 | $ | 367,704 | ||||||||||||||||||||||||||||||||||||||||||||
| Total income tax expense included in consolidated financial statements | |||||||||||||||||||||||||||||||||||||||||||||||||||
| Total income tax expense included in consolidated financial statements | |||||||||||||||||||||||||||||||||||||||||||||||||||
| Year Ended December 31, | |||||||||||||||||
| 2022 | 2021 | 2020 | |||||||||||||||
| (Dollars in thousands) | |||||||||||||||||
| Income before income taxes | $ | 1,546,457 | $ | 602,747 | $ | 815,961 | |||||||||||
| Income tax expense on income before income taxes | $ | 324,756 | $ | 126,577 | $ | 171,352 | |||||||||||
| Tax effect of: | |||||||||||||||||
| State income taxes | 2,564 | 5,239 | 5,749 | ||||||||||||||
| Tax exempt net investment income | (4,065) | (4,715) | (4,602) | ||||||||||||||
| Tax rate differential on net operating loss carryback | — | — | (30,041) | ||||||||||||||
| Other | 1,900 | 1,654 | 2,043 | ||||||||||||||
| Income tax expense | $ | 325,155 | $ | 128,755 | $ | 144,501 | |||||||||||
| Effective tax rate | 21.0 | % | 21.4 | % | 17.7 | % | |||||||||||
| Year Ended December 31, | |||||||||||||||||
| 2023 | 2022 | 2021 | |||||||||||||||
| (Dollars in thousands) | |||||||||||||||||
| Income before income taxes | $ | 297,052 | $ | 2,431,712 | $ | 702,786 | |||||||||||
| Income tax expense on income before income taxes | $ | 62,381 | $ | 510,660 | $ | 147,585 | |||||||||||
| Tax effect of: | |||||||||||||||||
| State income taxes | 2,570 | 2,564 | 5,239 | ||||||||||||||
| Tax exempt net investment income | (632) | (4,065) | (4,715) | ||||||||||||||
| Non-deductible compensation | 20,393 | 1,182 | 1,062 | ||||||||||||||
| Other | 421 | 794 | 592 | ||||||||||||||
| Income tax expense | $ | 85,133 | $ | 511,135 | $ | 149,763 | |||||||||||
| Effective tax rate | 28.7 | % | 21.0 | % | 21.3 | % | |||||||||||
| December 31, | December 31, | ||||||||||||||||||||||||||||||||
| 2023 | 2023 | 2022 | |||||||||||||||||||||||||||||||
| (Dollars in thousands) | (Dollars in thousands) | ||||||||||||||||||||||||||||||||
| Deferred income tax assets: | |||||||||||||||||||||||||||||||||
| December 31, | |||||||||||||||||||||||||||||||||
| 2022 | 2021 | ||||||||||||||||||||||||||||||||
| (Dollars in thousands) | |||||||||||||||||||||||||||||||||
| Deferred income tax assets: | |||||||||||||||||||||||||||||||||
| Policy benefit reserves | $ | — | $ | 524,412 | |||||||||||||||||||||||||||||
| Credit losses/impairments | 10,531 | 15,275 | |||||||||||||||||||||||||||||||
| Net unrealized losses on available for sale fixed maturity securities | Net unrealized losses on available for sale fixed maturity securities | 578,476 | — | ||||||||||||||||||||||||||||||
| Net unrealized losses on available for sale fixed maturity securities | |||||||||||||||||||||||||||||||||
| Net unrealized losses on available for sale fixed maturity securities | |||||||||||||||||||||||||||||||||
| Investment income items | |||||||||||||||||||||||||||||||||
| Amounts due reinsurer | |||||||||||||||||||||||||||||||||
| Amounts due reinsurer | |||||||||||||||||||||||||||||||||
| Amounts due reinsurer | Amounts due reinsurer | 1,047,159 | 745,839 | ||||||||||||||||||||||||||||||
| Other policyholder funds | Other policyholder funds | 358 | 3,332 | ||||||||||||||||||||||||||||||
| Deferred compensation | Deferred compensation | 3,866 | 3,434 | ||||||||||||||||||||||||||||||
| Share-based compensation | Share-based compensation | 422 | 5,171 | ||||||||||||||||||||||||||||||
| Net operating loss carryforwards | Net operating loss carryforwards | 50,913 | 87,314 | ||||||||||||||||||||||||||||||
| Net operating loss carryforwards | |||||||||||||||||||||||||||||||||
| Net operating loss carryforwards | |||||||||||||||||||||||||||||||||
| Capital loss carryforwards | |||||||||||||||||||||||||||||||||
| Other | Other | 71,682 | 1,140 | ||||||||||||||||||||||||||||||
| Gross deferred tax assets | Gross deferred tax assets | 1,763,407 | 1,385,917 | ||||||||||||||||||||||||||||||
| Deferred income tax liabilities: | Deferred income tax liabilities: | ||||||||||||||||||||||||||||||||
| Deferred policy acquisition costs and deferred sales inducements | Deferred policy acquisition costs and deferred sales inducements | (655,164) | (1,170,859) | ||||||||||||||||||||||||||||||
| Net unrealized gains on available for sale fixed maturity securities | — | (489,290) | |||||||||||||||||||||||||||||||
| Deferred policy acquisition costs and deferred sales inducements | |||||||||||||||||||||||||||||||||
| Deferred policy acquisition costs and deferred sales inducements | |||||||||||||||||||||||||||||||||
| Derivative instruments | |||||||||||||||||||||||||||||||||
| Derivative instruments | |||||||||||||||||||||||||||||||||
| Derivative instruments | Derivative instruments | (145,785) | (107,717) | ||||||||||||||||||||||||||||||
| Policy benefit reserves | Policy benefit reserves | (566,100) | (98,616) | ||||||||||||||||||||||||||||||
| Investment income items | Investment income items | (155,864) | (56,285) | ||||||||||||||||||||||||||||||
| Other | Other | (19,621) | (5,124) | ||||||||||||||||||||||||||||||
| Other | |||||||||||||||||||||||||||||||||
| Other | |||||||||||||||||||||||||||||||||
| Gross deferred tax liabilities | Gross deferred tax liabilities | (1,542,534) | (1,927,891) | ||||||||||||||||||||||||||||||
| Net deferred income tax asset (liability) | $ | 220,873 | $ | (541,974) | |||||||||||||||||||||||||||||
| Net deferred income tax asset | |||||||||||||||||||||||||||||||||
| December 31, | |||||||||||||||||||||||||||||||||
| 2022 | 2021 | ||||||||||||||||||||||||||||||||
| (Dollars in thousands) | |||||||||||||||||||||||||||||||||
| December 31, | |||||||||||||||||||||||||||||||||
| December 31, | |||||||||||||||||||||||||||||||||
| December 31, | |||||||||||||||||||||||||||||||||
| 2023 | 2023 | 2022 | |||||||||||||||||||||||||||||||
| (Dollars in thousands) | (Dollars in thousands) | ||||||||||||||||||||||||||||||||
| Senior notes due 2027 | Senior notes due 2027 | ||||||||||||||||||||||||||||||||
| Principal | |||||||||||||||||||||||||||||||||
| Principal | |||||||||||||||||||||||||||||||||
| Principal | Principal | $ | 500,000 | $ | 500,000 | ||||||||||||||||||||||||||||
| Unamortized debt issue costs | Unamortized debt issue costs | (2,960) | (3,537) | ||||||||||||||||||||||||||||||
| Unamortized discount | Unamortized discount | (178) | (213) | ||||||||||||||||||||||||||||||
| Term loan due 2027 | Term loan due 2027 | ||||||||||||||||||||||||||||||||
| Principal | 300,000 | — | |||||||||||||||||||||||||||||||
| Original Principal | |||||||||||||||||||||||||||||||||
| Original Principal | |||||||||||||||||||||||||||||||||
| Original Principal | |||||||||||||||||||||||||||||||||
| Principal paydown | Principal paydown | (3,750) | — | ||||||||||||||||||||||||||||||
| Unamortized debt issue costs | Unamortized debt issue costs | (1,039) | — | ||||||||||||||||||||||||||||||
| $ | 792,073 | $ | 496,250 | ||||||||||||||||||||||||||||||
| $ | |||||||||||||||||||||||||||||||||
| December 31, | ||||||||||||||||||||||||||
| 2022 | 2021 | Interest Rate | Due Date | |||||||||||||||||||||||
| (Dollars in thousands) | ||||||||||||||||||||||||||
| American Equity Capital Trust II | $ | 78,753 | $ | 78,421 | 5% | June 1, 2047 | ||||||||||||||||||||
| December 31, | ||||||||||||||||||||||||||
| 2023 | 2022 | Interest Rate | Due Date | |||||||||||||||||||||||
| (Dollars in thousands) | ||||||||||||||||||||||||||
| American Equity Capital Trust II | $ | 79,107 | $ | 78,753 | 5% | June 1, 2047 | ||||||||||||||||||||
| Year Ended December 31, | |||||||||||||||||||||||||||||||||||||||||||||||||||
| 2022 | 2021 | 2020 | |||||||||||||||||||||||||||||||||||||||||||||||||
| (Dollars in thousands) | |||||||||||||||||||||||||||||||||||||||||||||||||||
| Year Ended December 31, | Year Ended December 31, | ||||||||||||||||||||||||||||||||||||||||||||||||||
| 2023 | 2023 | 2022 | 2021 | ||||||||||||||||||||||||||||||||||||||||||||||||
| (Dollars in thousands) | (Dollars in thousands) | ||||||||||||||||||||||||||||||||||||||||||||||||||
| ESOP | ESOP | $ | 4,152 | $ | 3,377 | $ | 2,908 | ||||||||||||||||||||||||||||||||||||||||||||
| Employee Incentive Plans | Employee Incentive Plans | 14,454 | 22,886 | 7,855 | |||||||||||||||||||||||||||||||||||||||||||||||
| Director Equity Plans | Director Equity Plans | 1,053 | 1,262 | 1,056 | |||||||||||||||||||||||||||||||||||||||||||||||
| $ | 19,659 | $ | 27,525 | $ | 11,819 | ||||||||||||||||||||||||||||||||||||||||||||||
| $ | |||||||||||||||||||||||||||||||||||||||||||||||||||
| Number of Shares | Weighted-Average Exercise Price per Share | Total Exercise Price | |||||||||||||||||||||||||||||||||||||||||||||||||
| (Dollars in thousands, except per share data) | |||||||||||||||||||||||||||||||||||||||||||||||||||
| Outstanding at January 1, 2020 | 828,913 | $ | 19.91 | $ | 16,506 | ||||||||||||||||||||||||||||||||||||||||||||||
| Granted | 815,767 | 26.70 | 21,778 | ||||||||||||||||||||||||||||||||||||||||||||||||
| Canceled | (31,200) | 21.50 | (670) | ||||||||||||||||||||||||||||||||||||||||||||||||
| Exercised | (355,563) | 16.98 | (6,038) | ||||||||||||||||||||||||||||||||||||||||||||||||
| Outstanding at December 31, 2020 | 1,257,917 | 25.10 | 31,576 | ||||||||||||||||||||||||||||||||||||||||||||||||
| Number of Shares | Number of Shares | Weighted-Average Exercise Price per Share | Total Exercise Price | ||||||||||||||||||||||||||||||||||||||||||||||||
| (Dollars in thousands, except per share data) | (Dollars in thousands, except per share data) | ||||||||||||||||||||||||||||||||||||||||||||||||||
| Outstanding at January 1, 2021 | |||||||||||||||||||||||||||||||||||||||||||||||||||
| Granted | Granted | 1,246,605 | 29.15 | 36,336 | |||||||||||||||||||||||||||||||||||||||||||||||
| Canceled | Canceled | (146,803) | 25.44 | (3,735) | |||||||||||||||||||||||||||||||||||||||||||||||
| Exercised | Exercised | (295,000) | 22.88 | (6,749) | |||||||||||||||||||||||||||||||||||||||||||||||
| Outstanding at December 31, 2021 | Outstanding at December 31, 2021 | 2,062,719 | 27.84 | 57,428 | |||||||||||||||||||||||||||||||||||||||||||||||
| Granted | Granted | — | — | — | |||||||||||||||||||||||||||||||||||||||||||||||
| Canceled | Canceled | (102,143) | 27.49 | (2,808) | |||||||||||||||||||||||||||||||||||||||||||||||
| Exercised | Exercised | (173,782) | 24.59 | (4,273) | |||||||||||||||||||||||||||||||||||||||||||||||
| Outstanding at December 31, 2022 | Outstanding at December 31, 2022 | 1,786,794 | 28.18 | $ | 50,347 | ||||||||||||||||||||||||||||||||||||||||||||||
| Granted | |||||||||||||||||||||||||||||||||||||||||||||||||||
| Canceled | |||||||||||||||||||||||||||||||||||||||||||||||||||
| Exercised | |||||||||||||||||||||||||||||||||||||||||||||||||||
| Outstanding at December 31, 2023 | |||||||||||||||||||||||||||||||||||||||||||||||||||
| Stock Options Outstanding | Stock Options Vested | |||||||||||||||||||||||||||||||||||||||||||||||||||||||||||||||||||||||||||||||||||||||||
| Stock Options Outstanding | Stock Options Outstanding | Stock Options Vested | ||||||||||||||||||||||||||||||||||||||||||||||||||||||||||||||||||||||||||||||||||||||||
| Range of Exercise Prices | Range of Exercise Prices | Number of Awards | Remaining Life (yrs) | Weighted-Average Exercise Price Per Share | Number of Awards | Remaining Life (yrs) | Weighted-Average Exercise Price Per Share | Range of Exercise Prices | Number of Awards | Remaining Life (yrs) | Weighted-Average Exercise Price Per Share | Number of Awards | Remaining Life (yrs) | Weighted-Average Exercise Price Per Share | ||||||||||||||||||||||||||||||||||||||||||||||||||||||||||||||||||||||||||||
| $21.89 - $26.72 | $21.89 - $26.72 | 375,820 | 7.83 | $ | 26.07 | 126,224 | 8.01 | $ | 26.72 | |||||||||||||||||||||||||||||||||||||||||||||||||||||||||||||||||||||||||||||||||
| $27.05 - $32.58 | 1,410,974 | 8.10 | 28.74 | 606,322 | 8.09 | 28.71 | ||||||||||||||||||||||||||||||||||||||||||||||||||||||||||||||||||||||||||||||||||||
| $21.89 - $32.58 | 1,786,794 | 8.05 | 28.18 | 732,546 | 8.08 | 28.37 | ||||||||||||||||||||||||||||||||||||||||||||||||||||||||||||||||||||||||||||||||||||
| $21.89 - $26.72 | ||||||||||||||||||||||||||||||||||||||||||||||||||||||||||||||||||||||||||||||||||||||||||
| $21.89 - $26.72 | ||||||||||||||||||||||||||||||||||||||||||||||||||||||||||||||||||||||||||||||||||||||||||
| $27.05 - $32.35 | ||||||||||||||||||||||||||||||||||||||||||||||||||||||||||||||||||||||||||||||||||||||||||
| $21.89 - $32.35 | ||||||||||||||||||||||||||||||||||||||||||||||||||||||||||||||||||||||||||||||||||||||||||
| Year Ended December 31, | |||||||||||||||||
| 2022 | 2021 | 2020 | |||||||||||||||
| (Dollars in thousands) | |||||||||||||||||
| American Equity Life | $ | 151,857 | $ | (863,818) | $ | (34,467) | |||||||||||
| Year Ended December 31, | |||||||||||||||||
| 2023 | 2022 | 2021 | |||||||||||||||
| (Dollars in thousands) | |||||||||||||||||
| American Equity Life | $ | (93,007) | $ | 151,857 | $ | (863,818) | |||||||||||
| December 31, | |||||||||||
| 2022 | 2021 | ||||||||||
| (Dollars in thousands) | |||||||||||
| American Equity Life | $ | 3,692,602 | $ | 4,078,532 | |||||||
| December 31, | |||||||||||
| 2023 | 2022 | ||||||||||
| (Dollars in thousands) | |||||||||||
| American Equity Life | $ | 3,730,940 | $ | 3,692,602 | |||||||
| Year Ending December 31: | Year Ending December 31: | ||||||
| 2023 | $ | 3,792 | |||||
| 2024 | |||||||
| 2024 | |||||||
| 2024 | 2024 | 4,112 | |||||
| 2025 | 2025 | 3,985 | |||||
| 2026 | 2026 | 3,587 | |||||
| 2027 | 2027 | 2,014 | |||||
| 2028 and thereafter | 11,013 | ||||||
| 2028 | |||||||
| 2029 and thereafter | |||||||
| Year Ended December 31, | |||||||||||||||||||||||||||||||||||||||||||||||||||
| 2022 | 2021 | 2020 | |||||||||||||||||||||||||||||||||||||||||||||||||
| (Dollars in thousands, except per share data) | |||||||||||||||||||||||||||||||||||||||||||||||||||
| Year Ended December 31, | Year Ended December 31, | ||||||||||||||||||||||||||||||||||||||||||||||||||
| 2023 | 2023 | 2022 | 2021 | ||||||||||||||||||||||||||||||||||||||||||||||||
| (Dollars in thousands, except per share data) | (Dollars in thousands, except per share data) | ||||||||||||||||||||||||||||||||||||||||||||||||||
| Numerator: | Numerator: | ||||||||||||||||||||||||||||||||||||||||||||||||||
| Net income available to common stockholders - numerator for earnings per common share | |||||||||||||||||||||||||||||||||||||||||||||||||||
| Net income available to common stockholders - numerator for earnings per common share | |||||||||||||||||||||||||||||||||||||||||||||||||||
| Net income available to common stockholders - numerator for earnings per common share | Net income available to common stockholders - numerator for earnings per common share | $ | 1,177,269 | $ | 430,317 | $ | 637,945 | ||||||||||||||||||||||||||||||||||||||||||||
Denominator: | Denominator: | ||||||||||||||||||||||||||||||||||||||||||||||||||
Denominator: | |||||||||||||||||||||||||||||||||||||||||||||||||||
Denominator: | |||||||||||||||||||||||||||||||||||||||||||||||||||
| Weighted average common shares outstanding | |||||||||||||||||||||||||||||||||||||||||||||||||||
| Weighted average common shares outstanding | |||||||||||||||||||||||||||||||||||||||||||||||||||
| Weighted average common shares outstanding | Weighted average common shares outstanding | 90,558,121 | 93,860,378 | 92,055,035 | |||||||||||||||||||||||||||||||||||||||||||||||
| Effect of dilutive securities: | Effect of dilutive securities: | ||||||||||||||||||||||||||||||||||||||||||||||||||
| Stock options and deferred compensation agreements | |||||||||||||||||||||||||||||||||||||||||||||||||||
| Stock options and deferred compensation agreements | |||||||||||||||||||||||||||||||||||||||||||||||||||
| Stock options and deferred compensation agreements | Stock options and deferred compensation agreements | 523,248 | 271,422 | 93,014 | |||||||||||||||||||||||||||||||||||||||||||||||
| Restricted stock and restricted stock units | Restricted stock and restricted stock units | 456,759 | 359,359 | 244,447 | |||||||||||||||||||||||||||||||||||||||||||||||
| Denominator for earnings per common share - assuming dilution | Denominator for earnings per common share - assuming dilution | 91,538,128 | 94,491,159 | 92,392,496 | |||||||||||||||||||||||||||||||||||||||||||||||
| Earnings per common share | Earnings per common share | $ | 13.00 | $ | 4.58 | $ | 6.93 | ||||||||||||||||||||||||||||||||||||||||||||
| Earnings per common share | |||||||||||||||||||||||||||||||||||||||||||||||||||
| Earnings per common share | |||||||||||||||||||||||||||||||||||||||||||||||||||
| Earnings per common share - assuming dilution | Earnings per common share - assuming dilution | $ | 12.86 | $ | 4.55 | $ | 6.90 | ||||||||||||||||||||||||||||||||||||||||||||
| Column A | Column A | Column B | Column C | Column D | Column A | Column B | Column C | Column D | ||||||||||||||||||||||||||||||||||||||||||||||||||||||
| Type of Investment | Type of Investment | Amortized Cost (1) | Fair Value | Amount at which shown in the balance sheet | Type of Investment | Amortized Cost (1) | Fair Value | Amount at which shown in the balance sheet | ||||||||||||||||||||||||||||||||||||||||||||||||||||||
| (Dollars in thousands) | ||||||||||||||||||||||||||||||||||||||||||||||||||||||||||||||
| (Dollars in thousands) | (Dollars in thousands) | |||||||||||||||||||||||||||||||||||||||||||||||||||||||||||||
| Fixed maturity securities: | Fixed maturity securities: | |||||||||||||||||||||||||||||||||||||||||||||||||||||||||||||
| Available for sale: | Available for sale: | |||||||||||||||||||||||||||||||||||||||||||||||||||||||||||||
| Available for sale: | ||||||||||||||||||||||||||||||||||||||||||||||||||||||||||||||
| Available for sale: | ||||||||||||||||||||||||||||||||||||||||||||||||||||||||||||||
| U.S. Government and agencies | ||||||||||||||||||||||||||||||||||||||||||||||||||||||||||||||
| U.S. Government and agencies | ||||||||||||||||||||||||||||||||||||||||||||||||||||||||||||||
| U.S. Government and agencies | U.S. Government and agencies | $ | 173,638 | $ | 169,071 | $ | 169,071 | |||||||||||||||||||||||||||||||||||||||||||||||||||||||
| States, municipalities and territories | States, municipalities and territories | 4,356,251 | 3,822,982 | 3,822,982 | ||||||||||||||||||||||||||||||||||||||||||||||||||||||||||
| Foreign corporate securities and foreign governments | Foreign corporate securities and foreign governments | 748,770 | 676,852 | 676,852 | ||||||||||||||||||||||||||||||||||||||||||||||||||||||||||
| Corporate securities | Corporate securities | 27,706,440 | 24,161,921 | 24,161,921 | ||||||||||||||||||||||||||||||||||||||||||||||||||||||||||
| Residential mortgage backed securities | Residential mortgage backed securities | 1,492,242 | 1,377,611 | 1,377,611 | ||||||||||||||||||||||||||||||||||||||||||||||||||||||||||
| Commercial mortgage backed securities | Commercial mortgage backed securities | 4,098,755 | 3,687,478 | 3,687,478 | ||||||||||||||||||||||||||||||||||||||||||||||||||||||||||
| Other asset backed securities | Other asset backed securities | 6,289,923 | 5,908,702 | 5,908,702 | ||||||||||||||||||||||||||||||||||||||||||||||||||||||||||
| Total fixed maturity securities | Total fixed maturity securities | 44,866,019 | 39,804,617 | 39,804,617 | ||||||||||||||||||||||||||||||||||||||||||||||||||||||||||
| Mortgage loans on real estate | Mortgage loans on real estate | 6,949,027 | 6,502,463 | 6,949,027 | ||||||||||||||||||||||||||||||||||||||||||||||||||||||||||
| Real estate investments | Real estate investments | 1,053,569 | 1,056,063 | 1,056,063 | ||||||||||||||||||||||||||||||||||||||||||||||||||||||||||
| Derivative instruments | Derivative instruments | 425,097 | 431,727 | 431,727 | ||||||||||||||||||||||||||||||||||||||||||||||||||||||||||
| Limited partnerships and limited liability companies | Limited partnerships and limited liability companies | 1,266,779 | 1,266,779 | |||||||||||||||||||||||||||||||||||||||||||||||||||||||||||
| Other investments | Other investments | 1,818,144 | 1,817,085 | |||||||||||||||||||||||||||||||||||||||||||||||||||||||||||
| Total investments | Total investments | $ | 56,378,635 | $ | 51,325,298 | |||||||||||||||||||||||||||||||||||||||||||||||||||||||||
| December 31, | |||||||||||||||||||||||||||||||||
| 2022 | 2021 | ||||||||||||||||||||||||||||||||
| December 31, | December 31, | ||||||||||||||||||||||||||||||||
| 2023 | 2023 | 2022 | |||||||||||||||||||||||||||||||
| Assets | Assets | ||||||||||||||||||||||||||||||||
| Cash and cash equivalents | |||||||||||||||||||||||||||||||||
| Cash and cash equivalents | |||||||||||||||||||||||||||||||||
| Cash and cash equivalents | Cash and cash equivalents | $ | 531,347 | $ | 362,245 | ||||||||||||||||||||||||||||
| Equity securities of subsidiary trusts | Equity securities of subsidiary trusts | 2,360 | 2,353 | ||||||||||||||||||||||||||||||
| Receivable from subsidiaries | Receivable from subsidiaries | 8,868 | 2,783 | ||||||||||||||||||||||||||||||
| Notes receivable from subsidiaries | Notes receivable from subsidiaries | 85,654 | 165,000 | ||||||||||||||||||||||||||||||
| Notes receivable from subsidiaries | |||||||||||||||||||||||||||||||||
| Notes receivable from subsidiaries | |||||||||||||||||||||||||||||||||
| Federal income tax recoverable, including amount from subsidiaries | Federal income tax recoverable, including amount from subsidiaries | 267,076 | 217,174 | ||||||||||||||||||||||||||||||
| Other assets | Other assets | 33,990 | 20,134 | ||||||||||||||||||||||||||||||
| 929,295 | 769,689 | ||||||||||||||||||||||||||||||||
| 745,019 | |||||||||||||||||||||||||||||||||
| Investment in and advances to subsidiaries | Investment in and advances to subsidiaries | 3,437,579 | 6,387,912 | ||||||||||||||||||||||||||||||
| Total assets | Total assets | $ | 4,366,874 | $ | 7,157,601 | ||||||||||||||||||||||||||||
| Liabilities and Stockholders' Equity | Liabilities and Stockholders' Equity | ||||||||||||||||||||||||||||||||
| Liabilities and Stockholders' Equity | |||||||||||||||||||||||||||||||||
| Liabilities and Stockholders' Equity | |||||||||||||||||||||||||||||||||
| Liabilities: | Liabilities: | ||||||||||||||||||||||||||||||||
| Liabilities: | |||||||||||||||||||||||||||||||||
| Liabilities: | |||||||||||||||||||||||||||||||||
| Notes and loan payable | |||||||||||||||||||||||||||||||||
| Notes and loan payable | |||||||||||||||||||||||||||||||||
| Notes and loan payable | Notes and loan payable | $ | 792,073 | $ | 496,250 | ||||||||||||||||||||||||||||
| Subordinated debentures payable to subsidiary trusts | Subordinated debentures payable to subsidiary trusts | 78,753 | 78,421 | ||||||||||||||||||||||||||||||
| Deferred income taxes | Deferred income taxes | 268,639 | 223,304 | ||||||||||||||||||||||||||||||
| Intercompany payable | |||||||||||||||||||||||||||||||||
| Intercompany payable | |||||||||||||||||||||||||||||||||
| Intercompany payable | |||||||||||||||||||||||||||||||||
| Other liabilities | Other liabilities | 58,186 | 36,499 | ||||||||||||||||||||||||||||||
| Total liabilities | Total liabilities | 1,197,651 | 834,474 | ||||||||||||||||||||||||||||||
| Stockholders' equity: | Stockholders' equity: | ||||||||||||||||||||||||||||||||
| Preferred stock, Series A | |||||||||||||||||||||||||||||||||
| Preferred stock, Series A | |||||||||||||||||||||||||||||||||
| Preferred stock, Series A | Preferred stock, Series A | 16 | 16 | ||||||||||||||||||||||||||||||
| Preferred stock, Series B | Preferred stock, Series B | 12 | 12 | ||||||||||||||||||||||||||||||
| Common stock | Common stock | 84,810 | 92,514 | ||||||||||||||||||||||||||||||
| Additional paid-in capital | Additional paid-in capital | 1,325,316 | 1,614,374 | ||||||||||||||||||||||||||||||
| Accumulated other comprehensive income (loss) | (2,155,055) | 1,848,789 | |||||||||||||||||||||||||||||||
| Accumulated other comprehensive loss | |||||||||||||||||||||||||||||||||
| Accumulated other comprehensive loss | |||||||||||||||||||||||||||||||||
| Accumulated other comprehensive loss | |||||||||||||||||||||||||||||||||
| Retained earnings | Retained earnings | 3,914,124 | 2,767,422 | ||||||||||||||||||||||||||||||
| Total stockholders' equity attributable to American Equity Investment Life Holding Company | Total stockholders' equity attributable to American Equity Investment Life Holding Company | 3,169,223 | 6,323,127 | ||||||||||||||||||||||||||||||
| Total liabilities and stockholders' equity | Total liabilities and stockholders' equity | $ | 4,366,874 | $ | 7,157,601 | ||||||||||||||||||||||||||||
| Year Ended December 31, | |||||||||||||||||||||||||||||||||||||||||||||||||||
| 2022 | 2021 | 2020 | |||||||||||||||||||||||||||||||||||||||||||||||||
| Year Ended December 31, | Year Ended December 31, | ||||||||||||||||||||||||||||||||||||||||||||||||||
| 2023 | 2023 | 2022 | 2021 | ||||||||||||||||||||||||||||||||||||||||||||||||
| Revenues: | Revenues: | ||||||||||||||||||||||||||||||||||||||||||||||||||
| Net investment income | |||||||||||||||||||||||||||||||||||||||||||||||||||
| Net investment income | |||||||||||||||||||||||||||||||||||||||||||||||||||
| Net investment income | Net investment income | $ | 6,733 | $ | 114 | $ | 1,115 | ||||||||||||||||||||||||||||||||||||||||||||
| Dividends from subsidiary trusts | Dividends from subsidiary trusts | 155 | 159 | 167 | |||||||||||||||||||||||||||||||||||||||||||||||
| Dividends from subsidiaries | Dividends from subsidiaries | 325,000 | 250,000 | — | |||||||||||||||||||||||||||||||||||||||||||||||
| Investment advisory fees | Investment advisory fees | 110,094 | 126,643 | 114,228 | |||||||||||||||||||||||||||||||||||||||||||||||
| Surplus note interest from subsidiary | Surplus note interest from subsidiary | 4,080 | 4,080 | 4,080 | |||||||||||||||||||||||||||||||||||||||||||||||
| Change in fair value of derivatives | — | — | 62 | ||||||||||||||||||||||||||||||||||||||||||||||||
| Loss on extinguishment of debt | — | — | (2,024) | ||||||||||||||||||||||||||||||||||||||||||||||||
| Other revenue | |||||||||||||||||||||||||||||||||||||||||||||||||||
| Other revenue | |||||||||||||||||||||||||||||||||||||||||||||||||||
| Other revenue | Other revenue | 19,153 | 8,511 | 346 | |||||||||||||||||||||||||||||||||||||||||||||||
| Total revenues | Total revenues | 465,215 | 389,507 | 117,974 | |||||||||||||||||||||||||||||||||||||||||||||||
| Expenses: | Expenses: | ||||||||||||||||||||||||||||||||||||||||||||||||||
| Expenses: | |||||||||||||||||||||||||||||||||||||||||||||||||||
| Expenses: | |||||||||||||||||||||||||||||||||||||||||||||||||||
| Interest expense on notes and loan payable | |||||||||||||||||||||||||||||||||||||||||||||||||||
| Interest expense on notes and loan payable | |||||||||||||||||||||||||||||||||||||||||||||||||||
| Interest expense on notes and loan payable | Interest expense on notes and loan payable | 32,098 | 25,581 | 25,552 | |||||||||||||||||||||||||||||||||||||||||||||||
| Interest expense on subordinated debentures issued to subsidiary trusts | Interest expense on subordinated debentures issued to subsidiary trusts | 5,331 | 5,324 | 5,557 | |||||||||||||||||||||||||||||||||||||||||||||||
| Other operating costs and expenses | Other operating costs and expenses | 114,792 | 72,435 | 46,686 | |||||||||||||||||||||||||||||||||||||||||||||||
| Total expenses | Total expenses | 152,221 | 103,340 | 77,795 | |||||||||||||||||||||||||||||||||||||||||||||||
| Income before income taxes and equity in undistributed income of subsidiaries | 312,994 | 286,167 | 40,179 | ||||||||||||||||||||||||||||||||||||||||||||||||
| Income (loss) before income taxes and equity in undistributed income of subsidiaries | |||||||||||||||||||||||||||||||||||||||||||||||||||
| Income tax expense (benefit) | Income tax expense (benefit) | (1,067) | 11,565 | 13,142 | |||||||||||||||||||||||||||||||||||||||||||||||
| Income before equity in undistributed income of subsidiaries | Income before equity in undistributed income of subsidiaries | 314,061 | 274,602 | 27,037 | |||||||||||||||||||||||||||||||||||||||||||||||
| Equity in undistributed income of subsidiaries | Equity in undistributed income of subsidiaries | 906,883 | 199,390 | 644,423 | |||||||||||||||||||||||||||||||||||||||||||||||
| Net income available to American Equity Investment Life Holding Company stockholders | Net income available to American Equity Investment Life Holding Company stockholders | 1,220,944 | 473,992 | 671,460 | |||||||||||||||||||||||||||||||||||||||||||||||
| Less: Preferred stock dividends | Less: Preferred stock dividends | 43,675 | 43,675 | 33,515 | |||||||||||||||||||||||||||||||||||||||||||||||
| Net income available to American Equity Investment Life Holding Company common stockholders | Net income available to American Equity Investment Life Holding Company common stockholders | $ | 1,177,269 | $ | 430,317 | $ | 637,945 | ||||||||||||||||||||||||||||||||||||||||||||
| Year Ended December 31, | |||||||||||||||||||||||||||||||||||||||||||||||||||
| 2022 | 2021 | 2020 | |||||||||||||||||||||||||||||||||||||||||||||||||
| Year Ended December 31, | Year Ended December 31, | ||||||||||||||||||||||||||||||||||||||||||||||||||
| 2023 | 2023 | 2022 | 2021 | ||||||||||||||||||||||||||||||||||||||||||||||||
| Operating activities | Operating activities | ||||||||||||||||||||||||||||||||||||||||||||||||||
| Net income available to American Equity Investment Life Holding Company stockholders | Net income available to American Equity Investment Life Holding Company stockholders | $ | 1,220,944 | $ | 473,992 | $ | 671,460 | ||||||||||||||||||||||||||||||||||||||||||||
| Net income available to American Equity Investment Life Holding Company stockholders | |||||||||||||||||||||||||||||||||||||||||||||||||||
| Net income available to American Equity Investment Life Holding Company stockholders | |||||||||||||||||||||||||||||||||||||||||||||||||||
| Adjustments to reconcile net income to net cash provided by operating activities: | Adjustments to reconcile net income to net cash provided by operating activities: | ||||||||||||||||||||||||||||||||||||||||||||||||||
| Provision for depreciation and amortization | |||||||||||||||||||||||||||||||||||||||||||||||||||
| Provision for depreciation and amortization | |||||||||||||||||||||||||||||||||||||||||||||||||||
| Provision for depreciation and amortization | Provision for depreciation and amortization | 4,925 | 1,232 | 1,138 | |||||||||||||||||||||||||||||||||||||||||||||||
| Accrual of discount on equity security | Accrual of discount on equity security | (7) | (10) | (3) | |||||||||||||||||||||||||||||||||||||||||||||||
| Equity in undistributed income of subsidiaries | Equity in undistributed income of subsidiaries | (906,883) | (199,390) | (644,423) | |||||||||||||||||||||||||||||||||||||||||||||||
| Non cash dividend from subsidiaries | Non cash dividend from subsidiaries | — | (80,000) | — | |||||||||||||||||||||||||||||||||||||||||||||||
| Change in fair value of derivatives | — | — | (62) | ||||||||||||||||||||||||||||||||||||||||||||||||
| Loss on extinguishment of debt | — | — | 2,024 | ||||||||||||||||||||||||||||||||||||||||||||||||
| Accrual of discount on debenture issued to subsidiary trust | |||||||||||||||||||||||||||||||||||||||||||||||||||
| Accrual of discount on debenture issued to subsidiary trust | |||||||||||||||||||||||||||||||||||||||||||||||||||
| Accrual of discount on debenture issued to subsidiary trust | Accrual of discount on debenture issued to subsidiary trust | 332 | 309 | 289 | |||||||||||||||||||||||||||||||||||||||||||||||
| Share-based compensation | Share-based compensation | 6,023 | 10,235 | 3,303 | |||||||||||||||||||||||||||||||||||||||||||||||
| Deferred income taxes | Deferred income taxes | 45,335 | 222,714 | 6,408 | |||||||||||||||||||||||||||||||||||||||||||||||
| Deferred income taxes | |||||||||||||||||||||||||||||||||||||||||||||||||||
| Deferred income taxes | |||||||||||||||||||||||||||||||||||||||||||||||||||
| Changes in operating assets and liabilities: | Changes in operating assets and liabilities: | ||||||||||||||||||||||||||||||||||||||||||||||||||
| Changes in operating assets and liabilities: | |||||||||||||||||||||||||||||||||||||||||||||||||||
| Changes in operating assets and liabilities: | |||||||||||||||||||||||||||||||||||||||||||||||||||
| Receivable from subsidiaries | |||||||||||||||||||||||||||||||||||||||||||||||||||
| Receivable from subsidiaries | |||||||||||||||||||||||||||||||||||||||||||||||||||
| Receivable from subsidiaries | Receivable from subsidiaries | (6,085) | (365) | (1,208) | |||||||||||||||||||||||||||||||||||||||||||||||
| Federal income tax recoverable/payable | Federal income tax recoverable/payable | (49,902) | (222,569) | (3,879) | |||||||||||||||||||||||||||||||||||||||||||||||
| Other assets | Other assets | (16,363) | (5,054) | (320) | |||||||||||||||||||||||||||||||||||||||||||||||
| Other liabilities | 21,687 | 21,819 | 7,617 | ||||||||||||||||||||||||||||||||||||||||||||||||
| Other liabilities and intercompany payable | |||||||||||||||||||||||||||||||||||||||||||||||||||
| Net cash provided by operating activities | Net cash provided by operating activities | 320,006 | 222,913 | 42,344 | |||||||||||||||||||||||||||||||||||||||||||||||
| Investing activities | |||||||||||||||||||||||||||||||||||||||||||||||||||
| Investing activities | |||||||||||||||||||||||||||||||||||||||||||||||||||
| Investing activities | Investing activities | ||||||||||||||||||||||||||||||||||||||||||||||||||
| Change in notes receivable from subsidiaries | Change in notes receivable from subsidiaries | 79,346 | (165,000) | — | |||||||||||||||||||||||||||||||||||||||||||||||
| Change in notes receivable from subsidiaries | |||||||||||||||||||||||||||||||||||||||||||||||||||
| Repayment of equity securities | — | — | 2,445 | ||||||||||||||||||||||||||||||||||||||||||||||||
| Change in notes receivable from subsidiaries | |||||||||||||||||||||||||||||||||||||||||||||||||||
| Contribution to subsidiaries | |||||||||||||||||||||||||||||||||||||||||||||||||||
| Contribution to subsidiaries | |||||||||||||||||||||||||||||||||||||||||||||||||||
| Contribution to subsidiaries | Contribution to subsidiaries | (137,002) | — | (210,000) | |||||||||||||||||||||||||||||||||||||||||||||||
| Purchases of property, plant and equipment | Purchases of property, plant and equipment | (1,432) | (12,642) | (48) | |||||||||||||||||||||||||||||||||||||||||||||||
| Net cash used in investing activities | (59,088) | (177,642) | (207,603) | ||||||||||||||||||||||||||||||||||||||||||||||||
| Net cash provided by (used in) investing activities | |||||||||||||||||||||||||||||||||||||||||||||||||||
| Financing activities | Financing activities | ||||||||||||||||||||||||||||||||||||||||||||||||||
| Financing activities | |||||||||||||||||||||||||||||||||||||||||||||||||||
| Financing activities | |||||||||||||||||||||||||||||||||||||||||||||||||||
| Financing fees incurred and deferred | |||||||||||||||||||||||||||||||||||||||||||||||||||
| Financing fees incurred and deferred | |||||||||||||||||||||||||||||||||||||||||||||||||||
| Financing fees incurred and deferred | Financing fees incurred and deferred | (1,235) | — | — | |||||||||||||||||||||||||||||||||||||||||||||||
| Repayment of loan payable | Repayment of loan payable | (3,750) | — | — | |||||||||||||||||||||||||||||||||||||||||||||||
| Repayment of loan payable | |||||||||||||||||||||||||||||||||||||||||||||||||||
| Repayment of loan payable | |||||||||||||||||||||||||||||||||||||||||||||||||||
| Proceeds from issuance of loan payable | Proceeds from issuance of loan payable | 300,000 | — | — | |||||||||||||||||||||||||||||||||||||||||||||||
| Repayment of subordinated debentures | — | — | (81,450) | ||||||||||||||||||||||||||||||||||||||||||||||||
| Proceeds from issuance of loan payable | |||||||||||||||||||||||||||||||||||||||||||||||||||
| Proceeds from issuance of loan payable | |||||||||||||||||||||||||||||||||||||||||||||||||||
| Proceeds from issuance of common stock | |||||||||||||||||||||||||||||||||||||||||||||||||||
| Proceeds from issuance of common stock | |||||||||||||||||||||||||||||||||||||||||||||||||||
| Proceeds from issuance of common stock | Proceeds from issuance of common stock | 253,978 | 4,844 | 338,061 | |||||||||||||||||||||||||||||||||||||||||||||||
| Acquisition of treasury stock | Acquisition of treasury stock | (566,567) | (99,415) | (165,094) | |||||||||||||||||||||||||||||||||||||||||||||||
| Proceeds from issuance of preferred stock, net | — | — | 290,260 | ||||||||||||||||||||||||||||||||||||||||||||||||
| Dividends paid on common stock | |||||||||||||||||||||||||||||||||||||||||||||||||||
| Dividends paid on common stock | |||||||||||||||||||||||||||||||||||||||||||||||||||
| Dividends paid on common stock | Dividends paid on common stock | (30,567) | (31,450) | (28,859) | |||||||||||||||||||||||||||||||||||||||||||||||
| Dividends paid on preferred stock | Dividends paid on preferred stock | (43,675) | (43,675) | (33,515) | |||||||||||||||||||||||||||||||||||||||||||||||
| Net cash provided by (used in) financing activities | (91,816) | (169,696) | 319,403 | ||||||||||||||||||||||||||||||||||||||||||||||||
| Net cash used in financing activities | |||||||||||||||||||||||||||||||||||||||||||||||||||
| Increase (decrease) in cash and cash equivalents | Increase (decrease) in cash and cash equivalents | 169,102 | (124,425) | 154,144 | |||||||||||||||||||||||||||||||||||||||||||||||
| Cash and cash equivalents at beginning of year | Cash and cash equivalents at beginning of year | 362,245 | 486,670 | 332,526 | |||||||||||||||||||||||||||||||||||||||||||||||
| Cash and cash equivalents at end of year | Cash and cash equivalents at end of year | $ | 531,347 | $ | 362,245 | $ | 486,670 | ||||||||||||||||||||||||||||||||||||||||||||
| Supplemental disclosures of cash flow information | Supplemental disclosures of cash flow information | ||||||||||||||||||||||||||||||||||||||||||||||||||
| Supplemental disclosures of cash flow information | |||||||||||||||||||||||||||||||||||||||||||||||||||
| Supplemental disclosures of cash flow information | |||||||||||||||||||||||||||||||||||||||||||||||||||
| Cash paid during the year for: | Cash paid during the year for: | ||||||||||||||||||||||||||||||||||||||||||||||||||
| Cash paid during the year for: | |||||||||||||||||||||||||||||||||||||||||||||||||||
| Cash paid during the year for: | |||||||||||||||||||||||||||||||||||||||||||||||||||
| Interest on notes and loan payable | |||||||||||||||||||||||||||||||||||||||||||||||||||
| Interest on notes and loan payable | |||||||||||||||||||||||||||||||||||||||||||||||||||
| Interest on notes and loan payable | Interest on notes and loan payable | $ | 31,288 | $ | 25,000 | $ | 25,000 | ||||||||||||||||||||||||||||||||||||||||||||
| Interest on subordinated debentures | Interest on subordinated debentures | 5,000 | 5,000 | 6,181 | |||||||||||||||||||||||||||||||||||||||||||||||
| Column A | Column A | Column B | Column C | Column D | Column E | Column A | Column B | Column C | Column D | Column E | ||||||||||||||||||||||||||||||||||||||||||||||||||||||||||||||||||||||
| Deferred policy acquisition costs | Future policy benefits, losses, claims and loss expenses | Unearned premiums | Other policy claims and benefits payable | |||||||||||||||||||||||||||||||||||||||||||||||||||||||||||||||||||||||||||||
| (Dollars in thousands) | ||||||||||||||||||||||||||||||||||||||||||||||||||||||||||||||||||||||||||||||||
| Deferred policy acquisition costs | Deferred policy acquisition costs | Future policy benefits, losses, claims and loss expenses | Unearned premiums | Other policy claims and benefits payable | ||||||||||||||||||||||||||||||||||||||||||||||||||||||||||||||||||||||||||||
| (Dollars in thousands) | (Dollars in thousands) | |||||||||||||||||||||||||||||||||||||||||||||||||||||||||||||||||||||||||||||||
As of December 31, 2023: Life insurance | ||||||||||||||||||||||||||||||||||||||||||||||||||||||||||||||||||||||||||||||||
As of December 31, 2022: Life insurance | As of December 31, 2022: Life insurance | $ | 3,562,075 | $ | 61,118,134 | $ | — | $ | 512,790 | |||||||||||||||||||||||||||||||||||||||||||||||||||||||||||||||||||||||
| As of December 31, 2021: Life insurance | As of December 31, 2021: Life insurance | $ | 2,222,769 | $ | 65,477,778 | $ | — | $ | 226,844 | |||||||||||||||||||||||||||||||||||||||||||||||||||||||||||||||||||||||
| As of December 31, 2020: Life insurance | $ | 2,225,199 | $ | 62,352,882 | $ | — | $ | 240,904 | ||||||||||||||||||||||||||||||||||||||||||||||||||||||||||||||||||||||||
| Column A | Column A | Column F | Column G | Column H | Column I | Column J | Column A | Column F | Column G | Column H | Column I | Column J | ||||||||||||||||||||||||||||||||||||||||||||||||||||||||||||||||||||||||||||||||||||||
| Premium revenue | Net investment income | Benefits, claims, losses and settlement expenses | Amortization of deferred policy acquisition costs | Other operating expenses | ||||||||||||||||||||||||||||||||||||||||||||||||||||||||||||||||||||||||||||||||||||||||||||||
| (Dollars in thousands) | ||||||||||||||||||||||||||||||||||||||||||||||||||||||||||||||||||||||||||||||||||||||||||||||||||
| Premium revenue | Premium revenue | Net investment income | Benefits, claims, losses and settlement expenses | Amortization of deferred policy acquisition costs | Other operating expenses | |||||||||||||||||||||||||||||||||||||||||||||||||||||||||||||||||||||||||||||||||||||||||||||
| (Dollars in thousands) | (Dollars in thousands) | |||||||||||||||||||||||||||||||||||||||||||||||||||||||||||||||||||||||||||||||||||||||||||||||||
For the year ended December 31, 2023: Life insurance | ||||||||||||||||||||||||||||||||||||||||||||||||||||||||||||||||||||||||||||||||||||||||||||||||||
For the year ended December 31, 2022: Life insurance | For the year ended December 31, 2022: Life insurance | $ | 250,093 | $ | 2,307,463 | $ | (1,023,301) | $ | 615,300 | $ | 277,045 | |||||||||||||||||||||||||||||||||||||||||||||||||||||||||||||||||||||||||||||||||||||||
| For the year ended December 31, 2021: Life insurance | For the year ended December 31, 2021: Life insurance | $ | 300,833 | $ | 2,037,475 | $ | 2,543,779 | $ | 268,328 | $ | 274,617 | |||||||||||||||||||||||||||||||||||||||||||||||||||||||||||||||||||||||||||||||||||||||
| For the year ended December 31, 2020: Life insurance | $ | 290,609 | $ | 2,182,078 | $ | 744,389 | $ | 649,554 | $ | 214,745 | ||||||||||||||||||||||||||||||||||||||||||||||||||||||||||||||||||||||||||||||||||||||||
| Column A | Column A | Column B | Column C | Column D | Column E | Column F | Column A | Column B | Column C | Column D | Column E | Column F | ||||||||||||||||||||||||||||||||||||||||||||||||||||||||||||||||||||||||||||||||||||||
| Gross amount | Ceded to other companies | Assumed from other companies | Net amount | Percent of amount assumed to net | ||||||||||||||||||||||||||||||||||||||||||||||||||||||||||||||||||||||||||||||||||||||||||||||
| (Dollars in thousands) | ||||||||||||||||||||||||||||||||||||||||||||||||||||||||||||||||||||||||||||||||||||||||||||||||||
| Year ended December 31, 2022 | ||||||||||||||||||||||||||||||||||||||||||||||||||||||||||||||||||||||||||||||||||||||||||||||||||
| Gross amount | Gross amount | Ceded to other companies | Assumed from other companies | Net amount | Percent of amount assumed to net | |||||||||||||||||||||||||||||||||||||||||||||||||||||||||||||||||||||||||||||||||||||||||||||
| (Dollars in thousands) | (Dollars in thousands) | |||||||||||||||||||||||||||||||||||||||||||||||||||||||||||||||||||||||||||||||||||||||||||||||||
| Year ended December 31, 2023 | ||||||||||||||||||||||||||||||||||||||||||||||||||||||||||||||||||||||||||||||||||||||||||||||||||
| Life insurance in force, at end of year | ||||||||||||||||||||||||||||||||||||||||||||||||||||||||||||||||||||||||||||||||||||||||||||||||||
| Life insurance in force, at end of year | ||||||||||||||||||||||||||||||||||||||||||||||||||||||||||||||||||||||||||||||||||||||||||||||||||
| Life insurance in force, at end of year | Life insurance in force, at end of year | $ | 44,003 | $ | 4,761 | $ | 43,607 | $ | 82,849 | 52.63 | % | $ | 40,943 | $ | $ | 4,462 | $ | $ | 40,848 | $ | $ | 77,329 | 52.82 | 52.82 | % | |||||||||||||||||||||||||||||||||||||||||||||||||||||||||||||||||||||||||
| Insurance premiums and other considerations: | Insurance premiums and other considerations: | |||||||||||||||||||||||||||||||||||||||||||||||||||||||||||||||||||||||||||||||||||||||||||||||||
| Annuity product charges | Annuity product charges | $ | 279,447 | $ | 49,093 | $ | — | $ | 230,354 | — | ||||||||||||||||||||||||||||||||||||||||||||||||||||||||||||||||||||||||||||||||||||||||
| Annuity product charges | ||||||||||||||||||||||||||||||||||||||||||||||||||||||||||||||||||||||||||||||||||||||||||||||||||
| Annuity product charges | ||||||||||||||||||||||||||||||||||||||||||||||||||||||||||||||||||||||||||||||||||||||||||||||||||
| Traditional life, accident and health insurance, and life contingent immediate annuity premiums | Traditional life, accident and health insurance, and life contingent immediate annuity premiums | 19,660 | 91 | 170 | 19,739 | 0.86 | % | Traditional life, accident and health insurance, and life contingent immediate annuity premiums | 11,868 | 44 | 44 | 143 | 143 | 11,967 | 11,967 | 1.19 | 1.19 | % | ||||||||||||||||||||||||||||||||||||||||||||||||||||||||||||||||||||||||||||||||
| $ | 299,107 | $ | 49,184 | $ | 170 | $ | 250,093 | 0.07 | % | |||||||||||||||||||||||||||||||||||||||||||||||||||||||||||||||||||||||||||||||||||||||||
| Year ended December 31, 2021 | ||||||||||||||||||||||||||||||||||||||||||||||||||||||||||||||||||||||||||||||||||||||||||||||||||
| $ | $ | 409,918 | $ | 82,598 | $ | 143 | $ | 327,463 | 0.04 | % | ||||||||||||||||||||||||||||||||||||||||||||||||||||||||||||||||||||||||||||||||||||||||
| Year ended December 31, 2022 | ||||||||||||||||||||||||||||||||||||||||||||||||||||||||||||||||||||||||||||||||||||||||||||||||||
| Life insurance in force, at end of year | ||||||||||||||||||||||||||||||||||||||||||||||||||||||||||||||||||||||||||||||||||||||||||||||||||
| Life insurance in force, at end of year | ||||||||||||||||||||||||||||||||||||||||||||||||||||||||||||||||||||||||||||||||||||||||||||||||||
| Life insurance in force, at end of year | Life insurance in force, at end of year | $ | 48,943 | $ | 5,131 | $ | 46,119 | $ | 89,931 | 51.28 | % | $ | 44,003 | $ | $ | 4,761 | $ | $ | 43,607 | $ | $ | 82,849 | 52.63 | 52.63 | % | |||||||||||||||||||||||||||||||||||||||||||||||||||||||||||||||||||||||||
| Insurance premiums and other considerations: | Insurance premiums and other considerations: | |||||||||||||||||||||||||||||||||||||||||||||||||||||||||||||||||||||||||||||||||||||||||||||||||
| Annuity product charges | Annuity product charges | $ | 262,982 | $ | 20,351 | $ | — | $ | 242,631 | — | ||||||||||||||||||||||||||||||||||||||||||||||||||||||||||||||||||||||||||||||||||||||||
| Annuity product charges | ||||||||||||||||||||||||||||||||||||||||||||||||||||||||||||||||||||||||||||||||||||||||||||||||||
| Annuity product charges | ||||||||||||||||||||||||||||||||||||||||||||||||||||||||||||||||||||||||||||||||||||||||||||||||||
| Traditional life, accident and health insurance, and life contingent immediate annuity premiums | Traditional life, accident and health insurance, and life contingent immediate annuity premiums | 58,150 | 117 | 169 | 58,202 | 0.29 | % | Traditional life, accident and health insurance, and life contingent immediate annuity premiums | 19,660 | 91 | 91 | 170 | 170 | 19,739 | 19,739 | 0.86 | 0.86 | % | ||||||||||||||||||||||||||||||||||||||||||||||||||||||||||||||||||||||||||||||||
| $ | 321,132 | $ | 20,468 | $ | 169 | $ | 300,833 | 0.06 | % | |||||||||||||||||||||||||||||||||||||||||||||||||||||||||||||||||||||||||||||||||||||||||
| Year ended December 31, 2020 | ||||||||||||||||||||||||||||||||||||||||||||||||||||||||||||||||||||||||||||||||||||||||||||||||||
| $ | $ | 299,107 | $ | 49,184 | $ | 170 | $ | 250,093 | 0.07 | % | ||||||||||||||||||||||||||||||||||||||||||||||||||||||||||||||||||||||||||||||||||||||||
| Year ended December 31, 2021 | ||||||||||||||||||||||||||||||||||||||||||||||||||||||||||||||||||||||||||||||||||||||||||||||||||
| Life insurance in force, at end of year | ||||||||||||||||||||||||||||||||||||||||||||||||||||||||||||||||||||||||||||||||||||||||||||||||||
| Life insurance in force, at end of year | ||||||||||||||||||||||||||||||||||||||||||||||||||||||||||||||||||||||||||||||||||||||||||||||||||
| Life insurance in force, at end of year | Life insurance in force, at end of year | $ | 52,234 | $ | 5,925 | $ | 49,577 | $ | 95,886 | 51.70 | % | $ | 48,943 | $ | $ | 5,131 | $ | $ | 46,119 | $ | $ | 89,931 | 51.28 | 51.28 | % | |||||||||||||||||||||||||||||||||||||||||||||||||||||||||||||||||||||||||
| Insurance premiums and other considerations: | Insurance premiums and other considerations: | |||||||||||||||||||||||||||||||||||||||||||||||||||||||||||||||||||||||||||||||||||||||||||||||||
| Annuity product charges | Annuity product charges | $ | 258,248 | $ | 7,021 | $ | — | $ | 251,227 | — | ||||||||||||||||||||||||||||||||||||||||||||||||||||||||||||||||||||||||||||||||||||||||
| Annuity product charges | ||||||||||||||||||||||||||||||||||||||||||||||||||||||||||||||||||||||||||||||||||||||||||||||||||
| Annuity product charges | ||||||||||||||||||||||||||||||||||||||||||||||||||||||||||||||||||||||||||||||||||||||||||||||||||
| Traditional life, accident and health insurance, and life contingent immediate annuity premiums | Traditional life, accident and health insurance, and life contingent immediate annuity premiums | 39,323 | 139 | 198 | 39,382 | 0.50 | % | Traditional life, accident and health insurance, and life contingent immediate annuity premiums | 58,150 | 117 | 117 | 169 | 169 | 58,202 | 58,202 | 0.29 | 0.29 | % | ||||||||||||||||||||||||||||||||||||||||||||||||||||||||||||||||||||||||||||||||
| $ | 297,571 | $ | 7,160 | $ | 198 | $ | 290,609 | 0.07 | % | |||||||||||||||||||||||||||||||||||||||||||||||||||||||||||||||||||||||||||||||||||||||||
| $ | $ | 321,132 | $ | 20,468 | $ | 169 | $ | 300,833 | 0.06 | % | ||||||||||||||||||||||||||||||||||||||||||||||||||||||||||||||||||||||||||||||||||||||||